UNITED STATES
SECURITIES AND EXCHANGE COMMISSION
Washington, D.C. 20549
FORM N-CSR
CERTIFIED SHAREHOLDER REPORT OF REGISTERED
MANAGEMENT INVESTMENT COMPANIES
Investment Company Act file number 811-05349
Goldman Sachs Trust
(Exact name of registrant as specified in charter)
71 South Wacker Drive, Chicago, Illinois 60606
(Address of principal executive offices) (Zip code)
| | |
| Caroline Kraus, Esq. | | Copies to: |
| Goldman, Sachs & Co. | | Geoffrey R.T. Kenyon, Esq. |
| 200 West Street | | Dechert LLP |
| New York, New York 10282 | | 100 Oliver Street |
| | 40th Floor |
| | Boston, MA 02110-2605 |
(Name and address of agents for service)
Registrant’s telephone number, including area code: (312) 655-4400
Date of fiscal year end: March 31
Date of reporting period: September 30, 2013
| ITEM 1. | REPORTS TO STOCKHOLDERS. |
| | The Semi-Annual Report to Stockholders is filed herewith. |
Goldman Sachs Funds

| | | | |
| | |
| Semi-Annual Report | | | | September 30, 2013 |
| | |
| | | | Multi Sector Fixed Income Funds |
| | | | Core Fixed Income |
| | | | Core Plus Fixed Income |
| | | | Global Income |
| | | | Strategic Income |
| | | | World Bond |

Goldman Sachs Multi Sector Fixed Income Funds
| | | | |
TABLE OF CONTENTS | | | | |
| |
Principal Investment Strategies and Risks | | | 1 | |
| |
Investment Process | | | 3 | |
| |
Market Review | | | 4 | |
| |
Portfolio Management Discussions and Performance Summaries | | | 7 | |
| |
Schedules of Investments | | | 32 | |
| |
Financial Statements | | | 116 | |
| |
Financial Highlights | | | 124 | |
| |
Notes to the Financial Statements | | | 134 | |
| |
Other Information | | | 164 | |
| | | | |
| | | |
| NOT FDIC-INSURED | | May Lose Value | | No Bank Guarantee |
GOLDMAN SACHS MULTI SECTOR FIXED INCOME FUNDS
Principal Investment Strategies and Risks
This is not a complete list of risks that affect the Funds. For additional information concerning the risks applicable to the Funds, please see the Funds’ prospectus.
The Goldman Sachs Core Fixed Income Fund invests primarily in fixed income securities, including U.S. government securities, corporate debt securities, privately issued mortgage-backed securities and asset-backed securities. The Fund’s investments in fixed income securities are subject to the risks associated with debt securities generally, including credit, liquidity and interest rate risk. Any guarantee on U.S. government securities applies only to the underlying securities of the Fund if held to maturity and not to the value of the Fund’s shares. Investments in mortgage-backed securities are also subject to prepayment risk (i.e., the risk that in a declining interest rate environment, issuers may pay principal more quickly than expected, causing the Fund to reinvest proceeds at lower prevailing interest rates). Foreign and emerging markets investments may be more volatile and less liquid than investments in U.S. securities and are subject to the risks of currency fluctuations and adverse economic and political developments. Derivative instruments may involve a high degree of financial risk. These risks include the risk that a small movement in the price of the underlying security or benchmark may result in a disproportionately large movement, unfavorable or favorable, in the price of the derivative instrument; risks of default by a counterparty; and liquidity risk (i.e., the risk that an investment may not be able to be sold without a substantial drop in price, if at all).
The Goldman Sachs Core Plus Fixed Income Fund invests primarily in fixed income securities, including U.S. government securities, corporate debt securities, privately issued mortgage-backed securities, asset-backed securities, high yield non-investment grade securities and fixed income securities of issuers located in emerging countries. The Fund’s investments in fixed income securities are subject to the risks associated with debt securities generally, including credit, liquidity and interest rate risk. Any guarantee on U.S. government securities applies only to the underlying securities of the Fund if held to maturity and not to the value of the Fund’s shares. Investments in mortgage-backed securities are also subject to prepayment risk (i.e., the risk that in a declining interest rate environment, issuers may pay principal more quickly than expected, causing the Fund to reinvest proceeds at lower prevailing interest rates). High yield, lower rated investments involve greater price volatility and present greater risks than higher rated fixed income securities. Foreign and emerging markets investments may be more volatile and less liquid than investments in U.S. securities and are subject to the risks of currency fluctuations and adverse economic and political developments. Derivative instruments may involve a high degree of financial risk. These risks include the risk that a small movement in the price of the underlying security or benchmark may result in a disproportionately large movement, unfavorable or favorable, in the price of the derivative instrument; risks of default by a counterparty; and liquidity risk (i.e., the risk that an investment may not be able to be sold without a substantial drop in price, if at all).
The Goldman Sachs Global Income Fund invests primarily in a portfolio of fixed income securities of U.S. and foreign issuers. The Fund’s investments in fixed income securities are subject to the risks associated with debt securities generally, including credit, liquidity and interest rate risk. Foreign and emerging markets investments may be more volatile and less liquid than investments in U.S. securities and are subject to the risks of currency fluctuations and adverse economic or political developments. Issuers of sovereign debt may be unable or unwilling to repay principal or interest when due. Any guarantee on U.S. government securities applies only to the underlying securities of the Fund if held to maturity and not to the value of the Fund’s shares. Investments in mortgage-backed securities are also subject to prepayment risk (i.e., the risk that in a declining interest rate environment, issuers may pay principal more quickly than expected, causing the Fund to reinvest proceeds at lower prevailing interest rates). Derivative instruments may involve a high degree of financial risk. These risks include the risk that a small movement in the price of the underlying security or benchmark may result in a disproportionately large movement, unfavorable or favorable, in the price of the derivative instrument; risks of default by a counterparty; and liquidity risk (i.e., the risk that an investment may not be able to be sold without a substantial drop in price, if at all). The Fund may invest heavily in investments in particular
1
GOLDMAN SACHS MULTI SECTOR FIXED INCOME FUNDS
countries or regions and may be subject to greater losses than if it were less concentrated in a particular country or region. The Fund is “non-diversified” and may invest more of its assets in fewer issuers than “diversified” funds. Accordingly, the Fund may be more susceptible to adverse developments affecting any single issuer held in its portfolio and to greater losses resulting from these developments.
The Goldman Sachs Strategic Income Fund invests in a broadly diversified portfolio of U.S. and foreign investment grade and non-investment grade fixed income investments including, but not limited to: U.S. government securities, non-U.S. sovereign debt, agency securities, corporate debt securities, agency and non-agency mortgage-backed securities, asset-backed securities, custodial receipts, municipal securities, loans and loan assignments and convertible securities. Investments in fixed income securities are subject to the risks associated with debt securities generally, including credit, liquidity and interest rate risk. Investments in mortgage-backed securities are also subject to, among other risks, prepayment risk (i.e., the risk that in a declining interest rate environment, issuers may pay principal more quickly than expected, causing the Fund to reinvest proceeds at lower prevailing interest rates). High yield, lower rated investments involve greater price volatility, are less liquid and present greater risks than higher rated fixed income securities. Foreign and emerging markets investments may be more volatile and less liquid than investments in U.S. securities and are subject to the risks of currency fluctuations and adverse economic or political developments. The Fund is also subject to the risk that the issuers of sovereign debt or the government authorities that control the payment of debt may be unable or unwilling to repay principal or interest when due. The Fund may be more sensitive to adverse economic, business or political developments if it invests a substantial portion of its assets in bonds of similar projects or in particular types of municipal securities. The Fund may invest in loans directly or indirectly, by purchasing participations or sub-participations from financial institutions. Indirect purchases may subject the Fund to greater delays, expenses and risks than direct obligations in the case that a borrower fails to pay scheduled principal and interest. Derivative instruments may involve a high degree of financial risk. These risks include the risk that a small movement in the price of the underlying security or benchmark may result in a disproportionately large movement, unfavorable or favorable, in the price of the derivative instrument; risks of default by a counterparty; and liquidity risk. At times, the Fund may be unable to sell certain of its illiquid investments without a substantial drop in price, if at all. The Fund is subject to the risks associated with implementing short positions. Taking short positions involves leverage of the Fund’s assets and presents various other risks. Losses on short positions are potentially unlimited as a loss occurs when the value of an asset with respect to which the Fund has a short position increases.
The Goldman Sachs World Bond Fund invests primarily in a portfolio of debt instruments, including bonds, derivatives and other instruments with similar economic exposures. Investments in fixed income securities are subject to the risks associated with debt securities generally, including credit, liquidity and interest rate risk. High yield, lower rated investments involve greater price volatility and present greater risks than higher rated fixed income securities. Foreign and emerging market investments may be more volatile and less liquid than investments in U.S. securities and will be subject to the risks of currency fluctuations and adverse economic or political developments. Issuers of sovereign debt may be unable or unwilling to repay principal or interest when due. Any guarantee on U.S. government securities applies only to the underlying securities of the Fund if held to maturity and not to the value of the Fund’s shares. Derivative instruments may involve a high degree of financial risk. These risks include the risk that a small movement in the price of the underlying security or benchmark may result in a disproportionately large movement, unfavorable or favorable, in the price of the derivative instrument; risks of default by a counterparty; and liquidity risk. The Fund is subject to the risks associated with implementing short positions. Taking short positions involves leverage of the Fund’s assets and presents various other risks. Losses on short positions are potentially unlimited as a loss occurs when the value of an asset with respect to which the Fund has a short position increases. The Fund is “non-diversified” and may invest more of its assets in fewer issuers than “diversified” funds. Accordingly, the Fund may be more susceptible to adverse developments affecting any single issuer held in its portfolio and to greater losses resulting from these developments.
2
GOLDMAN SACHS MULTI SECTOR FIXED INCOME FUNDS
What Differentiates the Goldman Sachs Asset Management Fixed Income Investment Process?
At Goldman Sachs Asset Management, L.P. (“GSAM”), the goal of our fixed income investment process is to provide consistent, strong performance by actively managing our portfolios within a research-intensive, risk-managed framework.
A key element of our fixed income investment philosophy is to evaluate the broadest global opportunity set to capture relative value across sectors and instruments. Our globally integrated investment process involves managing dynamically along the risk/return spectrum, as we continue to develop value-added strategies through:

| n | | Assess relative value among sectors (such as mortgage-backed and corporate debt securities) and sub-sectors |
| n | | Leverage the vast resources of GSAM in selecting securities for each portfolio |

| n | | Team approach to decision making |
| n | | Manage risk by avoiding significant sector and interest rate bets |
| n | | Careful management of yield curve strategies — while closely managing portfolio duration |

Fixed Income portfolios that:
| | n | | Include domestic and global investment options, income opportunities, and access to areas of specialization | |
| | n | | Capitalize on GSAM’s industry-renowned credit research capabilities | |
| | n | | Use a risk-managed framework to seek total return, recognizing the importance of investors’ capital accumulation goals as well as their need for income | |
3
MARKET REVIEW
Goldman Sachs Multi Sector Fixed Income Funds
Market Review
Expectations that the U.S. Federal Reserve (the “Fed”) might taper its asset purchases via its quantitative easing program primarily drove global fixed income market performance during the six months ended September 30, 2013 (the “Reporting Period”).
When the Reporting Period began in April 2013, spread, or non-government bond, sectors were performing well, as investors sought higher yielding assets in the artificially low interest rate environment created by accommodative monetary policies of central banks around the world. The Fed, for example, maintained its quantitative easing program, through which it purchased approximately $85 billion of U.S. Treasury and mortgage-backed securities every month. In early May 2013, the European Central Bank (“ECB”) cut its main policy interest rate by 25 basis points to a record low 0.50%, citing weak Eurozone economic growth and slowing inflation. (A basis point is 1/100th of a percentage point.)
Meanwhile, U.S. economic data strengthened in late April and through May 2013, led by robust housing data and an improved employment picture. The strengthening trend prompted the Fed in mid-May 2013 to signal a possible reduction, or tapering, of its asset purchases later in 2013. In response to Fed Chair Bernanke’s testimony, government bond yields rose substantially, while spread sectors grew more volatile, reflecting widespread uncertainty over how markets might function should the Fed indeed withdraw support.
In June 2013, bond investors focused on the U.S. economy and stronger than expected payrolls data, which reinforced expectations the Fed would start tapering its quantitative easing purchases during 2013. Government bond yields continued to rise, as the June Fed meeting and press conference were more hawkish than expected. Spread sectors remained volatile. Meanwhile, European economic data improved, with modest increases in the Eurozone Purchasing Managers indices (“PMI”) and accelerating expansion in the U.K. Japan’s economy continued to respond positively to the policies of its government and central bank. In contrast, China’s economic data raised concerns about the duration and extent of that nation’s slowdown.
During July 2013, the Fed’s tilt toward a reduction in asset purchases continued to drive volatility in the global fixed income markets broadly. Debate over the successor to Fed Chair Bernanke introduced new concerns about future Fed policy. Government bond yields rose during July and continued to climb in August 2013 on speculation that Lawrence Summers, not Fed Vice Chair Janet Yellen, might be the frontrunner. It was widely believed the Fed would become more hawkish under Summers. In the Eurozone, economic data suggested the region had pulled itself out of an extended recessionary period, with manufacturing activity pointing to an expansion for the first time in two years. Elsewhere, China showed signs of modest growth in its industrial and export sectors, suggesting to many that Chinese policymakers would likely be successful in engineering a soft landing for China’s economic slowdown. Meanwhile, in Japan, Prime Minister Abe’s Liberal Democratic Party won an expected but resounding victory in its upper house parliamentary election, allowing the Prime Minister to proceed with the structural reforms outlined in his economic policy.
In mid-September 2013, the Fed surprised the financial markets by announcing it would delay tapering of its quantitative easing program asset purchases, citing concerns about the strength of the U.S. economic recovery and the pressures of fiscal tightening, including tax increases that took effect at the beginning of 2013 and federal spending cuts known as sequestration. Volatility in the spread sectors subsided on the unexpected decision and on the implication the Fed’s commitment to an accommodative monetary policy would persist. Also in September
4
MARKET REVIEW
2013, Lawrence Summers withdrew himself from consideration as the next Fed Chair. (In October 2013, after the end of the Reporting Period, President Obama nominated Janet Yellen for the post.) However, such reduced volatility in the fixed income markets was short lived. Toward the end of the month, U.S. lawmakers did not reach agreement on a bill to keep the federal government funded after September 30, 2013, which led to the first U.S. government shutdown in 17 years. In the Eurozone, German Chancellor Angela Merkel secured a third term, though her Christian Democratic Union fell just short of an absolute majority, and she had to seek a coalition partner. The Italian government under Prime Minister Enrico Letta received a vote of confidence as former Prime Minister Silvio Berlusconi backed down on a threat to destabilize the ruling coalition in Italy due to a lack of support from his Freedom People party. More broadly, global PMI improved in September 2013, with Asia, Europe and the U.S. all demonstrating month-over-month expansion in manufacturing activity, suggesting to many that the worldwide economic recovery was ongoing.
For the Reporting Period overall, high yield corporate bonds posted the strongest performance within the fixed income market. Mortgage-backed securities, investment grade corporate bonds and commercial mortgage-backed securities also outperformed U.S. Treasury securities during the Reporting Period, but more modestly so. Sovereign emerging market debt was weakest within the fixed income market, as the combination of anticipation of the Fed tapering its quantitative easing program, U.S. economic growth outpacing emerging markets economic growth, and worries over an economic slowdown in China drove a sell-off in the sector during the Reporting Period. Agency securities and asset-backed securities also trailed U.S. Treasury returns, albeit more modestly. Meanwhile, U.S. Treasury yields rose during the Reporting Period across the yield curve, or spectrum of maturities. The yield on the bellwether 10-year U.S. Treasury rose approximately 75 basis points to 2.61%. Overall, the U.S. Treasury yield curve steepened during the Reporting Period, with rates on longer-term maturities increasing more than those on shorter-term maturities.
Looking Ahead
At the end of the Reporting Period, the U.S., in our view, was making good progress on the path to sustainable economic growth, and other major economies seemed to be joining the upswing. Leading economic indicators showed broad-based improvement in economic activity, especially in Europe. Going forward, we believe the combination of improving economic growth and ongoing monetary policy accommodation should be positive for spread sector performance. Further, credit fundamentals remained solid at the end of the Reporting Period, including a low number of defaults and strong balance sheets in the corporate sector. Though leverage has increased and merger and acquisition activity has risen, corporate behavior remains moderate, in our view, compared to that seen in the years before the financial crisis. On the other hand, strengthening economic growth, we believe, may well maintain upward pressure on core government yields, particularly in the U.S. (Remember, there is usually an inverse relationship between bond prices and yield movements, so that bond prices fall when yields rise and vice versa.)
The durability of economic growth outside the U.S. is still unclear. Whereas in the U.S., private sector strength has been offsetting temporary headwinds, such as weak capital expenditure and fiscal tightening, the same quality of growth is not yet evident elsewhere. Improvement in the economies of Eurozone peripheral nations has been coming from a low level, and demand remains weak across the region overall. In Japan, the initial benefits from the yen’s steep decline — the result of government and central bank policy — appeared to be
5
MARKET REVIEW
subsiding at the end of the Reporting Period, and the prospects for effective corporate reform remained in doubt. China’s economic rebound, in our opinion, has been mainly due to renewed investment, demonstrating policymakers’ determination to hit their 7% to 7.5% economic growth target. However, we are concerned about rising inventories and the softening of policies meant to restrain credit growth in China, which could increase the risk of crisis over the longer term, with possible spillover to the emerging markets broadly. That said, we think the emerging markets are better positioned than in the past to weather shocks, with greater economic growth, lower debt and tighter fiscal policy than many developed countries. At the same time, we expect emerging market debt returns to become more varied in the months ahead according to the strengths and weaknesses of individual economies. Such weaknesses include current account deficits, high foreign liabilities and excessive credit growth.
At the end of the Reporting Period, global liquidity remained quite strong, in our view. Eurozone and U.K. central banks were officially biased to keep interest rates low, and we think the ECB may offer more special loans going forward. The Bank of Japan could ramp up quantitative easing to offset tax hikes next year, and the Fed continues to buy $85 billion of securities per month. While the Fed’s actions and statements suggest the normalization process of monetary policy will likely be gradual, we consider that process to be underway and expect a reduction in its asset purchases by early 2014.
6
PORTFOLIO RESULTS
Goldman Sachs Core Fixed Income Fund
Investment Objective
The Fund seeks a total return consisting of capital appreciation and income that exceeds the total return of the Barclays U.S. Aggregate Bond Index.
Portfolio Management Discussion and Analysis
Below, the Goldman Sachs U.S. Fixed Income Investment Management Team discusses the Goldman Sachs Core Fixed Income Fund’s (the “Fund”) performance and positioning for the six-month period ended September 30, 2013 (the “Reporting Period”).
| Q | | How did the Fund perform during the Reporting Period? |
| A | | During the Reporting Period, the Fund’s Class A, B, C, Institutional, Service, IR and R Shares generated cumulative total returns, without sales charges, of -1.99%, -2.34%, -2.34%, -1.72%, -2.06%, -1.87% and -2.02%, respectively. These returns compare to the -1.77% cumulative total return of the Fund’s benchmark, the Barclays U.S. Aggregate Bond Index (the “Barclays Index”), during the same period. |
| Q | | What key factors were responsible for the Fund’s performance during the Reporting Period? |
| A | | Bottom-up individual issue selection within the U.S. government/agency and municipal bond sectors detracted from the Fund’s performance during the Reporting Period. The security selection strategies in these sectors were partially offset by selection within the collateralized, corporate bond and emerging market debt sectors, which added value. |
| | A primary contributor to Fund performance was our top-down cross-sector strategy. Our cross-sector strategy is one in which we invest Fund assets across a variety of fixed income sectors, including some that may not be included in the Fund’s benchmark. Tactical management of the Fund’s duration and yield curve positioning strategy also contributed positively, albeit more modestly, to Fund performance. Duration is a measure of the Fund’s sensitivity to changes in interest rates. Yield curve indicates the spectrum of maturities within a particular sector. |
| Q | | Which fixed income market sectors most significantly affected Fund performance? |
| A | | Selections of U.S. securities within the government/ agency sector detracted from the Fund’s relative results. So, too, did selection of municipal securities, especially in September 2013. |
| | Individual issue selection within the collateralized, corporate bond and emerging market debt sectors added value. Within the collateralized sector, selection of agency mortgage-backed security pass-throughs and collateralized mortgage obligations helped most. (Pass-through mortgages consist of a pool of residential mortgage loans, where homeowners’ monthly payments of principal, interest and prepayments pass from the original bank through a government agency or investment bank to investors.) Within the corporate bond sector, choices amongst investment grade financial and industrial securities proved particularly effective. Within the emerging market debt sector, selections of external Brazilian debt contributed most positively to the Fund’s performance. |
| | An overweighted allocation to corporate bonds, implemented via our cross-sector strategy, contributed positively to the Fund’s performance during the Reporting Period, despite an increase in volatility following comments by the Federal Reserve (the “Fed”) regarding the potential for tapering its asset purchases. |
| Q | | Did the Fund’s duration and yield curve positioning strategy help or hurt its results during the Reporting Period? |
| A | | Tactical management of the Fund’s duration and yield curve positioning had a positive impact on its results during the Reporting Period. Early in the second calendar quarter, a short duration position in the U.S. relative to the Barclays Index detracted, as interest rates declined on mixed economic data. Later in the Reporting Period, the Fund’s short U.S. duration position compared to that of the Barclays Index contributed positively to results, as U.S. Treasury yields began a rising trend after the fixed income market reacted to the Fed’s mid-May 2013 comments that it could begin tapering asset purchases earlier than the market had |
7
PORTFOLIO RESULTS
| | anticipated. The Fund’s long European duration position detracted in June 2013, but the same positioning contributed positively to performance in September 2013 when interest rates moved lower. |
| Q | | How did the Fund use derivatives and similar instruments during the Reporting Period? |
| A | | As market conditions warranted during the Reporting Period, currency transactions were carried out using primarily over-the-counter (“OTC”) spot and forward foreign exchange contracts as well as by purchasing OTC options. Currency transactions were used as we sought both to enhance returns and to hedge the Fund’s portfolio against currency exchange rate fluctuations. Also, Treasury futures were used as warranted to facilitate specific duration, yield curve and country strategies; swaptions (or options on interest rate swap contracts) to express an outright term structure view and manage volatility (term structure, most often depicted as a yield curve, refers to the term structure of interest rates, which is the relationship between the yield to maturity and the time to maturity for pure discount bonds); credit default swaps to manage exposure to fluctuations in credit spreads (or the differential in yields between Treasury securities and non-Treasury securities that are identical in all respects except for quality rating); and interest rate swaps to manage exposure to fluctuations in interest rates. The Fund also used forward sales contracts to help manage duration. Overall, we employ derivatives and similar instruments for the efficient management of the Fund’s portfolio. Derivatives and similar instruments allow us to manage interest rate, credit and currency risks more effectively by allowing us both to hedge and to apply active investment views with greater versatility and to afford greater risk management precision than we would otherwise be able to implement. |
| Q | | Were there any notable changes in the Fund’s weightings during the Reporting Period? |
| A | | During the Reporting Period, we adjusted the Fund’s duration positioning as market conditions shifted. We maintained the Fund’s short U.S. duration stance relative to that of the Barclays Index for most of the Reporting Period in the face of expected Fed tapering. However, we did move to a more neutral U.S. duration position toward the end of the Reporting Period as a result of the withdrawal of Lawrence Summers’ candidacy for Fed chair and in anticipation of the September 2013 Fed meeting. |
| | From a sector perspective, the Fund began the Reporting Period with an overweight position in corporate bonds, but we trimmed the position to an underweight relative to the Barclays Index during the summer months, as volatility increased and due to the weak seasonal period. We maintained a bias toward lower quality investment grade corporate bonds during these months. After the Fed announced in mid-September that it would keep pace with its asset purchase program, surprising the market that it would not yet begin to taper, we re-established the Fund’s overweight exposure to corporate bonds. |
| | Amongst agency mortgage-backed securities, the Fund maintained a modest overweight exposure to agency multi-family securities, while shifting between an underweight and neutral position relative to the Barclays Index in agency mortgage-backed security pass-throughs. |
| Q | | How was the Fund positioned relative to its benchmark index at the end of September 2013? |
| A | | At the end of September 2013, the Fund had overweighted allocations relative to the Barclays Index on a market-value weighted basis in asset-backed securities and investment grade corporate bonds, with an emphasis in the latter on the financials industry. The Fund also had modest exposure to municipal bonds, which is a sector not represented in the Barclays Index. The Fund had underweighted exposure relative to the Barclays Index in U.S. government securities and commercial mortgage-backed securities. The Fund had a rather neutral position compared to the Barclays Index in residential mortgage-backed securities overall. However, within the residential mortgage-backed securities sector, the fund had an overweighted allocation to agency collateralized mortgage obligations and non-U.S. mortgage-backed securities and an underweighted exposure to mortgage-backed security pass-throughs. The Fund also had a rather neutral position compared to the Barclays Index in quasi-government bonds, emerging market debt and covered bonds at the end of the Reporting Period. (Covered bonds are debt securities backed by cash flows from mortgage loans or public sector loans.) The Fund had a neutral overall duration compared to the Barclays Index at the end of the Reporting Period. |
8
FUND BASICS
Core Fixed Income Fund
as of September 30, 2013
| | | | | | | | | | | | | | | | | | |
| | | April 1, 2013– September 30, 2013 | | Fund Total Return
(based on NAV)1 | | | Barclays
U.S. Aggregate
Bond Index2 | | | 30-Day
Standardized
Subsidized Yield3 | | | 30-Day
Standardized
Unsubsidized Yield3 | |
| | Class A | | | -1.99 | % | | | -1.77 | % | | | 1.82 | % | | | 1.82 | % |
| | Class B | | | -2.34 | | | | -1.77 | | | | 1.16 | | | | 1.16 | |
| | Class C | | | -2.34 | | | | -1.77 | | | | 1.16 | | | | 1.16 | |
| | Institutional | | | -1.72 | | | | -1.77 | | | | 2.23 | | | | 2.23 | |
| | Service | | | -2.06 | | | | -1.77 | | | | 1.74 | | | | 1.74 | |
| | Class IR | | | -1.87 | | | | -1.77 | | | | 2.14 | | | | 2.14 | |
| | | Class R | | | -2.02 | | | | -1.77 | | | | 1.65 | | | | 1.65 | |
| | 1 | | The net asset value (“NAV”) represents the net assets of the class of the Fund (ex-dividend) divided by the total number of shares of the class outstanding. The Fund’s performance assumes the reinvestment of dividends and other distributions. The Fund’s performance does not reflect the deduction of any applicable sales charges. |
| | 2 | | The Barclays U.S. Aggregate Bond Index represents an unmanaged diversified portfolio of fixed income securities, including U.S. Treasuries, investment-grade corporate bonds and mortgage-backed and asset-backed securities. The Index figure does not reflect any deduction for fees, expenses or taxes. It is not possible to invest directly in an index. |
| | 3 | | The method of calculation of the 30-Day Standardized Subsidized Yield is mandated by the Securities and Exchange Commission and is determined by dividing the net investment income per share earned during the last 30 days of the period by the maximum public offering price (“POP”) per share on the last day of the period. This number is then annualized. The 30-Day Standardized Subsidized Yield reflects fee waivers and/or expense reimbursements recorded by the Fund during the period. Without waivers and/or reimbursements, yields would be reduced. This yield does not necessarily reflect income actually earned and distributed by the Fund and, therefore, may not be correlated with the dividends or other distributions paid to shareholders. |
| | | | The 30-Day Standardized Unsubsidized Yield does not adjust for any fee waivers and/or expense reimbursements in effect. If the Fund does not incur any fee waivers and/or expense reimbursements during the period, the 30-Day Standard Subsidized Yield and 30-Day Standardized Unsubsidized Yield will be identical. |
The returns set forth in the table above represent past performance. Past performance does not guarantee future results. The Fund’s investment return and principal value will fluctuate so that an investor’s shares, when redeemed, may be worth more or less than their original cost. Current performance may be lower or higher than the performance quoted above. Please visit our web site at www.GSAMFUNDS.com to obtain the most recent month-end returns. Performance reflects applicable fee waivers and/or expense limitations in effect during the periods shown. In their absence, performance would be reduced. Returns do not reflect the deduction of taxes that a shareholder would pay on Fund distributions or the redemption of Fund shares.
9
FUND BASICS
| | |
| STANDARDIZED TOTAL RETURNS4 | | |
| | | | | | | | | | | | | | |
| | | For the period ended 9/30/13 | | One Year | | | Five Years | | Ten Years | | Since Inception | | Inception Date |
| | Class A | | | -5.19 | % | | 5.13% | | 3.48% | | 4.94% | | 5/1/97 |
| | Class B | | | -7.06 | | | 4.80 | | 3.25 | | 4.80 | | 5/1/97 |
| | Class C | | | -3.15 | | | 5.19 | | 3.12 | | 4.26 | | 8/15/97 |
| | Institutional | | | -1.01 | | | 6.31 | | 4.25 | | 5.65 | | 1/5/94 |
| | Service | | | -1.59 | | | 5.78 | | 3.74 | | 5.10 | | 3/13/96 |
| | Class IR | | | -1.20 | | | 6.20 | | N/A | | 3.90 | | 11/30/07 |
| | | Class R | | | -1.60 | | | 5.72 | | N/A | | 3.43 | | 11/30/07 |
| | 4 | | The Standardized Total Returns are average annual total returns as of the most recent calendar quarter-end. They assume reinvestment of all distributions at NAV. These returns reflect a maximum initial sales charge of 3.75% for Class A Shares, the assumed contingent deferred sales charge for Class B Shares (5% maximum declining to 0% after six years) and the assumed contingent deferred sales charge for Class C Shares (1% if redeemed within 12 months of purchase). Class B Shares convert automatically to Class A Shares on or about the fifteenth day of the last month of the calendar quarter that is eight years after purchase. Returns for Class B Shares for the period after conversion reflect the performance of Class A Shares. Prior to July 29, 2009, the maximum initial sales charge applicable to Class A Shares was 4.5%, which is not reflected in the average annual total return figures shown. Because Institutional, Service, Class IR and Class R Shares do not involve a sales charge, such a charge is not applied to their Standardized Total Returns. The Fund’s Class B Shares are no longer available for purchase by new or existing shareholders (although current Class B shareholders may continue to reinvest income and capital gains distributions into Class B Shares, and Class B shareholders may continue to exchange their shares for Class B Shares of certain other Goldman Sachs Funds). |
The returns set forth in the table above represent past performance. Past performance does not guarantee future results. The Fund’s investment return and principal value will fluctuate so that an investor’s shares, when redeemed, may be worth more or less than their original cost. Current performance may be lower or higher than the performance quoted above. Please visit our web site at www.GSAMFUNDS.com to obtain the most recent month-end returns. Performance reflects applicable fee waivers and/or expense limitations in effect during the periods shown. In their absence, performance would be reduced. Returns do not reflect the deduction of taxes that a shareholder would pay on Fund distributions or the redemption of Fund shares.
| | | | | | | | | | |
| | | | | Net Expense Ratio (Current) | | | Gross Expense Ratio (Before Waivers) | |
| | Class A | | | 0.81 | % | | | 0.81 | % |
| | Class B | | | 1.56 | | | | 1.56 | |
| | Class C | | | 1.56 | | | | 1.56 | |
| | Institutional | | | 0.47 | | | | 0.47 | |
| | Service | | | 0.97 | | | | 0.97 | |
| | Class IR | | | 0.56 | | | | 0.56 | |
| | | Class R | | | 1.06 | | | | 1.06 | |
| | 5 | | The expense ratios of the Fund, both current (net of applicable fee waivers and/or expense limitations) and before waivers (gross of applicable fee waivers and/or expense limitations) are as set forth above according to the most recent publicly available Prospectus for the Fund and may differ from the expense ratios disclosed in the Financial Highlights in this report. |
10
FUND BASICS
| | |
| SECTOR ALLOCATIONS6 | | |
| Percentage of Net Assets | | |
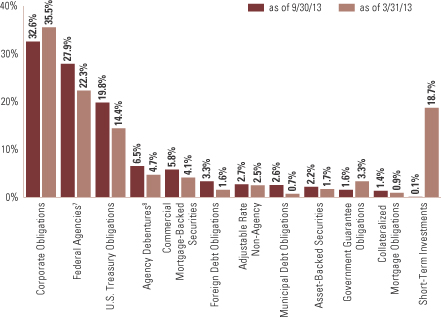
| | 6 | | The percentage shown for each investment category reflects the value of investments in that category as a percentage of net assets. Short-term investments represent repurchase agreements. Figures in the graph may not sum to 100% due to the exclusion of other assets and liabilities. The graph depicts the Fund’s investments but may not represent the Fund’s market exposure due to the exclusion of certain derivatives, if any, as listed in the Additional Investment Information section of the Schedule of Investments. |
| | 7 | | “Federal Agencies” are mortgage-backed securities guaranteed by the Government National Mortgage Association (“GNMA”), Federal National Mortgage Association (“FNMA”) and Federal Home Loan Mortgage Corp. (“FHLMC”). GNMA instruments are backed by the full faith and credit of the U.S. Government. |
| | 8 | | “Agency Debentures” include agency securities offered by companies such as FNMA and FHLMC, which operate under a government charter. While they are required to report to a government regulator, their assets are not explicitly guaranteed by the government and they otherwise operate like any other publicly traded company. |
11
PORTFOLIO RESULTS
Goldman Sachs Core Plus Fixed Income Fund
Investment Objective
The Fund seeks a total return consisting of capital appreciation and income that exceeds the total return of the Barclays U.S. Aggregate Bond Index.
Portfolio Management Discussion and Analysis
Below, the Goldman Sachs U.S. Fixed Income Investment Management Team discusses the Goldman Sachs Core Plus Fixed Income Fund’s (the “Fund”) performance and positioning for the six-month period ended September 30, 2013 (the “Reporting Period”).
| Q | | How did the Fund perform during the Reporting Period? |
| A | | During the Reporting Period, the Fund’s Class A, B, C, Institutional, Service, IR and R Shares generated cumulative total returns, without sales charges, of -1.36%, -1.83%, -1.83%, -1.19%, -1.44%, -1.24% and -1.58%, respectively. These returns compare to the -1.77% cumulative total return of the Fund’s benchmark, the Barclays U.S. Aggregate Bond Index (the “Barclays Index”), during the same time period. |
| Q | | What key factors were responsible for the Fund’s performance during the Reporting Period? |
| A | | A primary contributor to Fund performance was our top-down cross-sector strategy. Our cross-sector strategy is one in which we invest Fund assets across a variety of fixed income sectors, including some that may not be included in the Fund’s benchmark. Tactical management of the Fund’s duration and yield curve positioning strategy also contributed positively, albeit more modestly, to Fund performance. Duration is a measure of the Fund’s sensitivity to changes in interest rates. Yield curve indicates the spectrum of maturities within a particular sector. |
| | Bottom-up individual issue selection within the collateralized and corporate bond sectors also added value during the Reporting Period. The security selection strategies in these sectors more than offset selection within the emerging market debt and U.S. government/agency sectors, which detracted. |
| Q | | Which fixed income market sectors most significantly affected Fund performance? |
| A | | Positioning in non-agency mortgage-backed securities, implemented via our cross-sector strategy, contributed positively to the Fund’s performance during the Reporting Period, as continued improvement in the housing market provided support for the sector. April 2013, in particular, proved to be a strong month for non-agency mortgage-backed securities, as a strong technical, or supply/demand, environment carried over from the first calendar quarter. Exposure to corporate bonds also contributed positively to the Fund’s performance, despite an increase in volatility following comments by the Federal Reserve (the “Fed”) regarding the potential for tapering its asset purchases. |
| | Individual issue selection within the collateralized and corporate bond sectors added value. Within the collateralized sector, selection of non-agency collateralized mortgage obligations helped most. Within the corporate bond sector, choices amongst investment grade industrial securities, with a lower quality bias, proved particularly effective. |
| | On the other hand, choices made within the emerging market debt sector detracted from the Fund’s relative results, as the combination of Fed tapering, U.S. economic growth outpacing economic growth in emerging markets, and China worries created headwinds for the sector throughout the third calendar quarter. Selection of government/agency securities also detracted from the Fund’s performance during the Reporting Period. |
| Q | | Did the Fund’s duration and yield curve positioning strategy help or hurt its results during the Reporting Period? |
| A | | Tactical management of the Fund’s duration and yield curve positioning had a positive impact on its results during the Reporting Period. The Fund maintained a long duration position in both the U.S. and Germany, concentrated in the intermediate segment of the yield curve. This helped as yields generally moved lower. After a strong start to 2012, risk markets declined in the second quarter of the year on further evidence of slowing global economic growth and renewed tensions in Europe. As a result, core government |
12
PORTFOLIO RESULTS
| | bond markets rallied, driving U.S. and German government bond yields to multi-decade lows. Though risk assets recovered during the third calendar quarter, the Fed confirmed its commitment to keeping short-term interest rates near zero through at least mid-2015 and committed to a third round of quantitative easing in an open-ended program. Nearly simultaneously, the European Central Bank offered potentially unlimited government bond purchases on a formal request for aid. These central bank policies kept interest rates pinned low, and thus the Fund’s duration positioning contributed positively to its results. |
| Q | | How did the Fund use derivatives and similar instruments during the Reporting Period? |
| A | | As market conditions warranted during the Reporting Period, currency transactions were carried out using primarily over-the-counter (“OTC”) spot and forward foreign exchange contracts as well as by purchasing OTC options. Currency transactions were used as we sought both to enhance returns and to hedge the Fund’s portfolio against currency exchange rate fluctuations. Also, Treasury futures were used as warranted to facilitate specific duration, yield curve and country strategies; swaptions (or options on interest rate swap contracts) to express an outright term structure view and manage volatility (term structure, most often depicted as a yield curve, refers to the term structure of interest rates, which is the relationship between the yield to maturity and the time to maturity for pure discount bonds); credit default swaps to manage exposure to fluctuations in credit spreads (or the differential in yields between Treasury securities and non-Treasury securities that are identical in all respects except for quality rating); and interest rate swaps to manage exposure to fluctuations in interest rates. The Fund also used forward sales contracts to help manage duration. Overall, we employ derivatives and similar instruments for the efficient management of the Fund’s portfolio. Derivatives and similar instruments allow us to manage interest rate, credit and currency risks more effectively by allowing us both to hedge and to apply active investment views with greater versatility and to afford greater risk management precision than we would otherwise be able to implement. |
| Q | | Were there any notable changes in the Fund’s weightings during the Reporting Period? |
| A | | During the Reporting Period, as mentioned earlier, we adjusted the Fund’s duration positioning as market conditions shifted. We maintained the Fund’s short U.S. duration stance relative to that of the Barclays Index for most of the Reporting Period in the face of expected Fed tapering. However, we did move to a more neutral U.S. duration position toward the end of the Reporting Period as a result of the withdrawal of Lawrence Summers’ candidacy for Fed chair and in anticipation of the September 2013 Fed meeting. We also tactically managed duration positioning in Japan, moving from a short duration stance early in the second calendar quarter to a modestly long duration stance later in the Reporting Period when aggressive policy stimulus was announced by the Bank of Japan. The Fund ended the Reporting Period with a neutral duration position in Japanese rates. |
| | From a sector perspective, the Fund began the Reporting Period with an overweight position in corporate bonds, but we subsequently trimmed the position to a rather neutral allocation relative to the Barclays Index as unfavorable seasonal factors were expected during the summer months. We maintained a bias toward lower quality investment grade corporate bonds during these months. After the Fed announced in mid-September 2013 that it would keep pace with its asset purchase program, surprising the market that it would not yet begin to taper, we re-established the Fund’s overweight exposure to corporate bonds. |
| | Amongst agency mortgage-backed securities, the Fund maintained an overweight exposure to agency multi-family securities, while shifting between an underweight and neutral position relative to the Barclays Index in agency mortgage-backed security pass-throughs. (Pass-through mortgages consist of a pool of residential mortgage loans, where homeowners’ monthly payments of principal, interest and prepayments pass from the original bank through a government agency or investment bank to investors.) |
| | We maintained the Fund’s overweighted allocation to non-agency mortgage-backed securities throughout the Reporting Period given positive housing market fundamentals. Such positioning proved to be a positive contributor to the Fund’s results during the Reporting Period. |
13
PORTFOLIO RESULTS
| | We reduced the Fund’s exposure to emerging market debt during the Reporting Period in light of the sell-off experienced in the sector through the beginning of the third calendar quarter. |
| Q | | How was the Fund positioned relative to its benchmark index at the end of September 2013? |
| A | | At the end of September 2013, the Fund had overweighted allocations relative to the Barclays Index on a market-value weighted basis in asset-backed securities, high yield corporate bonds, emerging market debt, investment grade corporate bonds, residential mortgage-backed securities and covered bonds. (Covered bonds are debt securities backed by cash flows from mortgage loans or public sector loans.) The Fund also had exposure to municipal bonds, which is a sector not represented in the Barclays Index. The Fund had underweighted exposure relative to the Barclays Index in U.S. government securities, commercial mortgage-backed securities and quasi-government securities. The Fund had a neutral overall duration compared to the Barclays Index at the end of the Reporting Period. |
14
FUND BASICS
Core Plus Fixed Income Fund
as of September 30, 2013
| | | | | | | | | | | | | | | | | | |
| | | April 1, 2013– September 30, 2013 | | Fund Total Return
(based on NAV)1 | | | Barclays
U.S. Aggregate
Bond Index2 | | | 30-Day
Standardized
Subsidized Yield3 | | | 30-Day Standardized
Unsubsidized Yield3 | |
| | Class A | | | -1.36 | % | | | -1.77 | % | | | 2.40 | % | | | 2.10 | % |
| | Class B | | | -1.83 | | | | -1.77 | | | | 1.75 | | | | 1.45 | |
| | Class C | | | -1.83 | | | | -1.77 | | | | 1.76 | | | | 1.45 | |
| | Institutional | | | -1.19 | | | | -1.77 | | | | 2.84 | | | | 2.55 | |
| | Service | | | -1.44 | | | | -1.77 | | | | 2.33 | | | | 2.02 | |
| | Class IR | | | -1.24 | | | | -1.77 | | | | 2.74 | | | | 2.43 | |
| | | Class R | | | -1.58 | | | | -1.77 | | | | 2.25 | | | | 1.94 | |
| | 1 | | The net asset value (“NAV”) represents the net assets of the class of the Fund (ex-dividend) divided by the total number of shares of the class outstanding. The Fund’s performance assumes the reinvestment of dividends and other distributions. The Fund’s performance does not reflect the deduction of any applicable sales charges. |
| | 2 | | The Barclays U.S. Aggregate Bond Index represents an unmanaged diversified portfolio of fixed income securities, including U.S. Treasuries, investment-grade corporate bonds, and mortgage-backed and asset-backed securities. The Index figure does not reflect any deduction for fees, expenses or taxes. It is not possible to invest directly in an index. |
| | 3 | | The method of calculation of the 30-Day Standardized Subsidized Yield is mandated by the Securities and Exchange Commission and is determined by dividing the net investment income per share earned during the last 30 days of the period by the maximum public offering price (“POP”) per share on the last day of the period. This number is then annualized. The 30-Day Standardized Subsidized Yield reflects fee waivers and/or expense reimbursements recorded by the Fund during the period. Without waivers and/or reimbursements, yields would be reduced. This yield does not necessarily reflect income actually earned and distributed by the Fund and, therefore, may not be correlated with the dividends or other distributions paid to shareholders. |
| | | | The 30-Day Standardized Unsubsidized Yield does not adjust for any fee waivers and/or expense reimbursements in effect. If the Fund does not incur any fee waivers and/or expense reimbursements during the period, the 30-Day Standard Subsidized Yield and 30-Day Standardized Unsubsidized Yield will be identical. |
The returns set forth in the table above represent past performance. Past performance does not guarantee future results. The Fund’s investment return and principal value will fluctuate so that an investor’s shares, when redeemed, may be worth more or less than their original cost. Current performance may be lower or higher than the performance quoted above. Please visit our web site at www.GSAMFUNDS.com to obtain the most recent month-end returns. Performance reflects applicable fee waivers and/or expense limitations in effect during the periods shown. In their absence, performance would be reduced. Returns do not reflect the deduction of taxes that a shareholder would pay on Fund distributions or the redemption of Fund shares.
15
FUND BASICS
| | |
| STANDARDIZED TOTAL RETURNS4 | | |
| | | | | | | | | | | | |
| | | For the period ended 9/30/13 | | One Year | | | Five Years | | Since Inception | | Inception Date |
| | Class A | | | -3.19 | % | | 6.25% | | 4.62% | | 11/30/06 |
| | Class B | | | -5.16 | | | 5.89 | | 4.89 | | 6/20/07 |
| | Class C | | | -1.17 | | | 6.28 | | 4.41 | | 11/30/06 |
| | Institutional | | | 1.01 | | | 7.45 | | 5.57 | | 11/30/06 |
| | Service | | | 0.51 | | | 6.93 | | 5.53 | | 6/20/07 |
| | Class IR | | | 0.82 | | | 7.27 | | 5.34 | | 11/30/07 |
| | | Class R | | | 0.33 | | | 6.78 | | 4.86 | | 11/30/07 |
| | 4 | | The Standardized Total Returns are average annual total returns as of the most recent calendar quarter-end. They assume reinvestment of all distributions at NAV. These returns reflect a maximum initial sales charge of 3.75% for Class A Shares, the assumed contingent deferred sales charge for Class B Shares (5% maximum declining to 0% after six years) and the assumed contingent deferred sales charge for Class C Shares (1% if redeemed within 12 months of purchase). Class B Shares convert automatically to Class A Shares on or about the fifteenth day of the last month of the calendar quarter that is eight years after purchase. Prior to July 29, 2009, the maximum initial sales charge applicable to Class A Shares was 4.5%, which is not reflected in the average annual total return figures shown. Because Institutional, Service, Class IR and Class R Shares do not involve a sales charge, such a charge is not applied to their Standardized Total Returns. The Fund’s Class B Shares are no longer available for purchase by new or existing shareholders (although current Class B shareholders may continue to reinvest income and capital gains distributions into Class B Shares, and Class B shareholders may continue to exchange their shares for Class B Shares of certain other Goldman Sachs Funds). |
The returns set forth in the table above represent past performance. Past performance does not guarantee future results. The Fund’s investment return and principal value will fluctuate so that an investor’s shares, when redeemed, may be worth more or less than their original cost. Current performance may be lower or higher than the performance quoted above. Please visit our web site at www.GSAMFUNDS.com to obtain the most recent month-end returns. Performance reflects applicable fee waivers and/or expense limitations in effect during the periods shown. In their absence, performance would be reduced. Returns do not reflect the deduction of taxes that a shareholder would pay on Fund distributions or the redemption of Fund shares.
| | | | | | | | | | |
| | | | | Net Expense Ratio (Current) | | | Gross Expense Ratio (Before Waivers) | |
| | Class A | | | 0.83 | % | | | 0.98 | % |
| | Class B | | | 1.58 | | | | 1.73 | |
| | Class C | | | 1.58 | | | | 1.73 | |
| | Institutional | | | 0.49 | | | | 0.64 | |
| | Service | | | 0.99 | | | | 1.13 | |
| | Class IR | | | 0.58 | | | | 0.73 | |
| | | Class R | | | 1.08 | | | | 1.24 | |
| | 5 | | The expense ratios of the Fund, both current (net of applicable fee waivers and/or expense limitations) and before waivers (gross of applicable fee waivers and/or expense limitations) are as set forth above according to the most recent publicly available Prospectus for the Fund and may differ from the expense ratios disclosed in the Financial Highlights in this report. The Fund’s waivers and/or expense limitations will remain in place through at least July 29, 2014, and prior to such date the Investment Adviser may not terminate the arrangements without the approval of the Fund’s Board of Trustees. If these arrangements are discontinued in the future, the expense ratios may change without shareholder approval. |
16
FUND BASICS
| | |
| SECTOR ALLOCATIONS6 | | |
| Percentage of Net Assets | | |
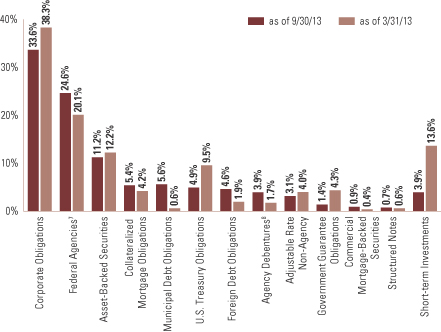
| | 6 | | The percentage shown for each investment category reflects the value of investments in that category as a percentage of net assets. Short-term investments represent repurchase agreements. Figures in the graph may not sum to 100% due to the exclusion of other assets and liabilities. The graph depicts the Fund’s investments but may not represent the Fund’s market exposure due to the exclusion of certain derivatives, if any, as listed in the Additional Investment Information section of the Schedule of Investments. |
| | 7 | | “Federal Agencies” are mortgage-backed securities guaranteed by the Government National Mortgage Association (“GNMA”), Federal National Mortgage Association (“FNMA”) and Federal Home Loan Mortgage Corp. (“FHLMC”). GNMA instruments are backed by the full faith and credit of the U.S. Government. |
| | 8 | | “Agency Debentures” include agency securities offered by companies such as FNMA and FHLMC, which operate under a government charter. While they are required to report to a government regulator, their assets are not explicitly guaranteed by the government and they otherwise operate like any other publicly traded company. |
17
PORTFOLIO RESULTS
Goldman Sachs Global Income Fund
Investment Objective
The Fund seeks a high total return, emphasizing current income, and, to a lesser extent, providing opportunities for capital appreciation.
Portfolio Management Discussion and Analysis
Below, the Goldman Sachs Global Fixed Income Investment Management Team discusses the Goldman Sachs Global Income Fund’s (the “Fund”) performance and positioning for the six-month period ended September 30, 2013 (the “Reporting Period”).
| Q | | How did the Fund perform during the Reporting Period? |
| A | | During the Reporting Period, the Fund’s Class A, B, C, Institutional, Service and IR Shares generated cumulative total returns, without sales charges, of -0.92%, -1.30%, -1.31%, -0.75%, -1.02% and -0.80%, respectively. These returns compare to the -0.92% cumulative total return of the Fund’s benchmark, the Barclays Global Aggregate Bond Index (Gross, USD, hedged) (the “Barclays Index”), during the same time period. |
| Q | | What key factors were responsible for the Fund’s performance during the Reporting Period? |
| A | | Primary contributors to the Fund’s performance were our country, cross-sector and duration strategies. Within our country strategy, our five-year versus five-year relative value trading proved most effective. (The strategy looks at various countries, both developed and emerging market, for relative value opportunities.) Our long U.S. versus short Japan trade also proved to be beneficial, particularly in April 2013. Overall, the Fund’s positioning in the U.S. and Australia contributed positively to results, while positioning in Germany and Spain detracted. Our cross-sector strategy is one in which we invest Fund assets across a variety of fixed income sectors, including some that may not be included in the Fund’s benchmark. Duration is a measure of the Fund’s sensitivity to changes in interest rates. |
| | Our currency strategy detracted from the Fund’s results. An overweight position in the Mexican peso and tactical positioning in the euro hurt most. |
| Q | | Which fixed income market sectors most significantly affected Fund performance? |
| A | | The Fund’s tactical overweights to corporate bonds and to non-agency mortgage-backed securities contributed positively to its performance as did our tactical positioning within the agency mortgage-backed securities sector. Bottom-up individual issue selection within the emerging market debt, government/agency and collateralized sectors also boosted the Fund’s relative results during the Reporting Period. |
| | Conversely, overweighted allocations to asset-backed securities and emerging market debt detracted from the Fund’s results during the Reporting Period. Within the corporate bond sector, our regional positioning hurt performance modestly. |
| Q | | Did the Fund’s duration and yield curve positioning strategy help or hurt its results during the Reporting Period? |
| A | | The combined effect of the Fund’s duration and yield curve positioning contributed positively to results during the Reporting Period. The Fund’s duration strategy is actively managed and constantly monitored in an effort to generate greater performance and reduced risk through volatile markets. We tactically adjusted the Fund’s duration position throughout the Reporting Period as market conditions shifted. Particularly benefiting the Fund’s results was our tactical short U.S. duration position relative to the Barclays Index maintained through most of the third calendar quarter, as U.S. yields rose through mid-September 2013 on expectations of a withdrawal of accommodative monetary policy by the U.S. Federal Reserve (the “Fed”). As it turns out, at its mid-September 2013 meeting, the Fed surprised markets by delaying the widely-anticipated reduction in asset |
18
PORTFOLIO RESULTS
| | purchases, with Fed Chair Ben Bernanke citing persistent concerns about the strength of the U.S. economic recovery and the pressure of fiscal tightening. |
| | The Fund’s short duration bias to the Japanese government bond yield curve also proved beneficial, particularly during the second quarter of 2013, when global government bond yields broadly increased. |
| Q | | How did the Fund use derivatives and similar instruments during the Reporting Period? |
| A | | We used derivatives and similar instruments for the efficient management of the Fund. These derivatives and similar instruments allowed us to manage interest rate, credit and currency risks more effectively by allowing us both to hedge and to apply active investment views with greater versatility and to afford greater risk management precision than we would otherwise be able to implement. |
| | During the Reporting Period, we used interest rate and bond exchange traded futures contracts to implement duration and country strategies within the Fund, especially in the U.S., Eurozone, U.K. and Japanese markets. Currency transactions were carried out using primarily over-the-counter (“OTC”) spot and forward foreign exchange contracts as well as by purchasing OTC options. Currency transactions were used as we sought both to enhance returns and to hedge the Fund’s portfolio against currency exchange rate fluctuations. Interest rate and credit default swaps were also used as cost-efficient instruments to help grant us greater precision and versatility in the management of active strategies. Forward sales contracts were used to implement currency transactions based on our active views and for hedging purposes. Written option contracts were used to implement active views within our top-down and bottom-up selection strategies and for hedging purposes. |
| Q | | Were there any notable changes in the Fund’s weightings during the Reporting Period? |
| A | | As mentioned earlier, we tactically adjusted the Fund’s duration position throughout the Reporting Period as market conditions shifted. We increased the Fund’s weightings in commercial mortgage-backed securities, established a position in municipal bonds and reduced the Fund’s relative exposure to quasi-government securities, asset-backed securities, residential mortgage-backed securities and investment grade corporate bonds. We increased the Fund’s position in cash. |
| | From a country perspective, we decreased the Fund’s exposure to Italy from an overweight position to an underweight position relative to the Barclays Index. |
| Q | | How was the Fund positioned relative to its benchmark index at the end of September 2013? |
| A | | At the end of September 2013, the Fund had overweighted allocations relative to the Barclays Index in collateralized securities, including asset-backed securities and commercial mortgage-backed securities, as well as in emerging market debt and municipal bonds. The Fund had underweighted exposure relative to the Barclays Index in government securities and quasi-government securities and was rather neutral to the Barclays Index in corporate bonds, both investment grade and high yield, residential mortgage-backed securities and covered bonds. (Covered bonds are debt securities backed by cash flows from mortgage loans or public sector loans.) The Fund also had a sizable position in cash at the end of the Reporting Period. |
| | From a country perspective, the Fund was neutral relative to the benchmark in the Eurozone overall, but within the region, was underweight Spain, Italy and Ireland and overweight Germany, France and Slovenia at the end of the Reporting Period. The Fund was underweight relative to the Barclays Index in the U.K., Japan and the U.S. The Fund had a shorter duration than the Barclays Index at the end of the Reporting Period. |
19
FUND BASICS
Global Income Fund
as of September 30, 2013
| | | | | | | | | | | | | | | | | | |
| | PERFORMANCE REVIEW | |
| | | April 1, 2013– September 30, 2013 | | Fund Total Return
(based on NAV)1 | | | Barclays Global
Aggregate Bond
Index (Gross,
USD, hedged)2 | | | 30-Day
Standardized
Subsidized Yield3 | | | 30-Day
Standardized
Unsubsidized Yield3 | |
| | Class A | | | -0.92 | % | | | -0.92 | % | | | 1.34 | % | | | 1.02 | % |
| | Class B | | | -1.30 | | | | -0.92 | | | | 0.66 | | | | 0.34 | |
| | Class C | | | -1.31 | | | | -0.92 | | | | 0.65 | | | | 0.33 | |
| | Institutional | | | -0.75 | | | | -0.92 | | | | 1.72 | | | | 1.40 | |
| | Service | | | -1.02 | | | | -0.92 | | | | 1.23 | | | | 0.91 | |
| | | Class IR | | | -0.80 | | | | -0.92 | | | | 1.64 | | | | 1.31 | |
| | 1 | | The net asset value (“NAV”) represents the net assets of the class of the Fund (ex-dividend) divided by the total number of shares of the class outstanding. The Fund’s performance reflects the reinvestment of dividends and other distributions. The Fund’s performance does not reflect the deduction of any applicable sales charges. |
| | 2 | | The Barclays Global Aggregate Bond Index (Gross, USD, hedged), an unmanaged index, provides a broad based measure of the global investment-grade fixed-rate debt markets and covers the most liquid portion of the global investment grade fixed-rate bond market, including government, credit and collateralized securities. The Index figures do not include any deduction for fees, expenses or taxes. It is not possible to invest directly in an index. |
| | 3 | | The method of calculation of the 30-Day Standardized Subsidized Yield is mandated by the Securities and Exchange Commission and is determined by dividing the net investment income per share earned during the last 30 days of the period by the maximum public offering price (“POP”) per share on the last day of the period. This number is then annualized. The 30-Day Standardized Subsidized Yield reflects fee waivers and/or expense reimbursements recorded by the Fund during the period. Without waivers and/or reimbursements, yields would be reduced. This yield does not necessarily reflect income actually earned and distributed by the Fund and, therefore, may not be correlated with the dividends or other distributions paid to shareholders. |
| | | | The 30-Day Standardized Unsubsidized Yield does not adjust for any fee waivers and/or expense reimbursements in effect. If the Fund does not incur any fee waivers and/or expense reimbursements during the period, the 30-Day Standard Subsidized Yield and 30-Day Standardized Unsubsidized Yield will be identical. |
The returns set forth in the table above represent past performance. Past performance does not guarantee future results. The Fund’s investment return and principal value will fluctuate so that an investor’s shares, when redeemed, may be worth more or less than their original cost. Current performance may be lower or higher than the performance quoted above. Please visit our web site at www.GSAMFUNDS.com to obtain the most recent month-end returns. Performance reflects applicable fee waivers and/or expense limitations in effect during the periods shown. In their absence, performance would be reduced. Returns do not reflect the deduction of taxes that a shareholder would pay on Fund distributions or the redemption of Fund shares.
20
FUND BASICS
| | | | | | | | | | | | | | | | | | | | |
| | STANDARDIZED TOTAL RETURNS4 | | | |
| | | For the period ended 9/30/13 | | One Year | | | Five Years | | | Ten Years | | | Since Inception | | | Inception Date |
| | Class A | | | -2.73 | % | | | 5.23 | % | | | 3.73 | % | | | 5.47 | % | | 8/2/91 |
| | Class B | | | -4.71 | | | | 4.83 | | | | 3.50 | | | | 4.90 | | | 5/1/96 |
| | Class C | | | -0.70 | | | | 5.22 | | | | 3.37 | | | | 4.10 | | | 8/15/97 |
| | Institutional | | | 1.40 | | | | 6.38 | | | | 4.52 | | | | 5.93 | | | 8/1/95 |
| | Service | | | 0.88 | | | | 5.84 | | | | 4.00 | | | | 4.81 | | | 3/12/97 |
| | | Class IR | | | 1.24 | | | | N/A | | | | N/A | | | | 3.52 | | | 7/30/10 |
| | 4 | | The Standardized Total Returns are average annual total returns as of the most recent calendar quarter-end. They assume reinvestment of all distributions at NAV. These returns reflect a maximum initial sales charge of 3.75% for Class A Shares, the assumed contingent deferred sales charge for Class B Shares (5% maximum declining to 0% after six years) and the assumed contingent deferred sales charge for Class C Shares (1% if redeemed within 12 months of purchase). Class B Shares convert automatically to Class A Shares on or about the fifteenth day of the last month of the calendar quarter that is eight years after purchase. Returns for Class B Shares for the period after conversion reflect the performance of Class A Shares. Prior to July 29, 2009, the maximum initial sales charge applicable to Class A Shares was 4.5%, which is not reflected in the average annual total return figures shown. Because Institutional, Service and Class IR Shares do not involve a sales charge, such a charge is not applied to their Standardized Total Returns. The Fund’s Class B Shares are no longer available for purchase by new or existing shareholders (although current Class B shareholders may continue to reinvest income and capital gains distributions into Class B Shares, and Class B shareholders may continue to exchange their shares for Class B Shares of certain other Goldman Sachs Funds). |
The returns set forth in the table above represent past performance. Past performance does not guarantee future results. The Fund’s investment return and principal value will fluctuate so that an investor’s shares, when redeemed, may be worth more or less than their original cost. Current performance may be lower or higher than the performance quoted above. Please visit our web site at www.GSAMFUNDS.com to obtain the most recent month-end returns. Performance reflects applicable fee waivers and/or expense limitations in effect during the periods shown. In their absence, performance would be reduced. Returns do not reflect the deduction of taxes that a shareholder would pay on Fund distributions or the redemption of Fund shares.
| | | | | | | | | | |
| | EXPENSE RATIOS5 | |
| | | | | Net Expense Ratio (Current) | | | Gross Expense Ratio (Before Waivers) | |
| | Class A | | | 1.04 | % | | | 1.15 | % |
| | Class B | | | 1.79 | | | | 1.90 | |
| | Class C | | | 1.79 | | | | 1.90 | |
| | Institutional | | | 0.69 | | | | 0.81 | |
| | Service | | | 1.19 | | | | 1.31 | |
| | | Class IR | | | 0.79 | | | | 0.90 | |
| | 5 | | The expense ratios of the Fund, both current (net of applicable fee waivers and/or expense limitations) and before waivers (gross of applicable fee waivers and/or expense limitations) are as set forth above according to the most recent publicly available Prospectus for the Fund and may differ from the expense ratios disclosed in the Financial Highlights in this report. The Fund’s waivers and/or expense limitations will remain in place through at least July 29, 2014, and prior to such date the Investment Adviser may not terminate the arrangements without the approval of the Fund’s Board of Trustees. If these arrangements are discontinued in the future, the expense ratios may change without shareholder approval. |
21
FUND BASICS
| | | | | | | | | | |
| | CURRENCY ALLOCATION6 | |
| | | | | Percentage of Net Assets | |
| | | | | as of 9/30/13 | | | as of 3/31/13 | |
| | U.S. Dollar7 | | | 48.6 | % | | | 56.7 | % |
| | Euro | | | 25.7 | | | | 28.2 | |
| | Japanese Yen | | | 8.1 | | | | 7.1 | |
| | British Pound | | | 3.6 | | | | 2.7 | |
| | Canadian Dollar | | | 2.0 | | | | 2.4 | |
| | Swedish Krona | | | 0.9 | | | | 1.1 | |
| | Mexican Peso | | | 0.9 | | | | 0.9 | |
| | South Korean Won | | | 0.7 | | | | 0.8 | |
| | Danish Krone | | | 0.6 | | | | 0.6 | |
| | Australian Dollar | | | 0.6 | | | | 0.7 | |
| | South African Rand | | | 0.5 | | | | 1.0 | |
| | Czech Koruna | | | 0.1 | | | | 0.0 | |
| | | Russian Ruble | | | 0.0 | | | | 0.3 | |
| | 6 | | The percentage shown for each currency reflects the value of investments in that category as a percentage of net assets. Figures in the table may not sum to 100% due to the exclusion of other assets and liabilities. The table depicts the Fund’s investments but may not represent the Fund’s market exposure due to the exclusion of certain derivatives, if any, as listed in the Additional Investment Information section of the Schedule of Investments. |
| | 7 | | These figures represent the value excluding short-term obligations. If short-term obligations had been included, the percentages for 9/30/13 and 3/31/13 would have been 51.3% and 56.7%, respectively. |
22
PORTFOLIO RESULTS
Goldman Sachs Strategic Income Fund
Investment Objective
The Fund seeks total return comprised of income and capital appreciation.
Portfolio Management Discussion and Analysis
Below, the Goldman Sachs U.S. Fixed Income Investment Management Team discusses the Goldman Sachs Strategic Income Fund’s (the “Fund”) performance and positioning for the six-month period ended September 30, 2013 (the “Reporting Period”).
| Q | | How did the Fund perform during the Reporting Period? |
| A | | During the Reporting Period, the Fund’s Class A, C, Institutional, IR and R Shares generated cumulative total returns, without sales charges, of 1.25%, 0.87%, 1.43%, 1.28% and 1.13%, respectively. These returns compare to the 0.14% cumulative total return of the Fund’s benchmark, the BofA Merrill Lynch U.S. Dollar 3-Month LIBOR Constant Maturity Index (the “LIBOR Index”), during the same period. |
| | We note that the Fund’s benchmark being the LIBOR Index is a means of emphasizing that the Fund has an unconstrained strategy. That said, this Fund employs a benchmark agnostic strategy and thus comparisons to a benchmark index are not particularly relevant. |
| Q | | What key factors were responsible for the Fund’s performance during the Reporting Period? |
| A | | Overall, the Fund’s performance was driven by a pro-global economic growth view, including a constructive view on the U.S. economy expressed via sizable positions in corporate bonds and mortgage-backed securities. Additionally, the ability to hedge duration risk around the possibility of rising U.S. interest rates modestly helped the Fund’s performance. |
| | Within our top-down strategies, our cross-sector, country selection and duration strategies contributed positively to Fund performance. Our cross-sector strategy is one in which we invest Fund assets based on a discipline of valuing each fixed income sector in the context of all investment opportunities within the Fund’s universe. Within our country strategy, relative value trades of favoring Europe over the U.K. and favoring the U.S. versus Japan added value, as did our five-year versus five-year country valuation strategy. (The strategy looks at various countries, both developed and emerging market, for relative value opportunities.) Duration is a measure of the Fund’s sensitivity to changes in interest rates. Bottom-up individual issue selection within the mortgage-backed securities sector also added value during the Reporting Period. |
| | Detracting from the Fund’s performance was our currency, emerging market debt and government/agency strategies. These strategies reflect any active views we take on these particular sectors. |
| Q | | Which fixed income market sectors most significantly affected Fund performance? |
| A | | The Fund’s sizable exposures to corporate bonds and to non-agency mortgage-backed securities contributed positively to its performance. Additionally, our individual issue selection within the mortgage-backed securities sector boosted results. |
| | Conversely, within our currency strategy, our long position in the Mexican peso weighed on results. Within emerging market debt, the Fund’s Brazilian yield curve positioning detracted from performance. Our forward positioning on the U.S. and U.K. yield curves within our government/agency strategy produced negative returns. |
| Q | | Did the Fund’s duration and yield curve positioning strategy help or hurt its results during the Reporting Period? |
| A | | The combined effect of the Fund’s tactical duration and yield curve positioning contributed positively, albeit modestly, to results during the Reporting Period. Early in the Reporting Period, the Fund was long the U.S. Treasury yield curve. We then moved to a short duration on the U.S. Treasury yield curve and maintained that stance from May through September 2013. Such positioning helped overall, as interest rates rose during the Reporting Period as a whole on speculation the Federal Reserve (the “Fed”) would taper its quantitative easing program at its mid-September 2013 meeting. U.S. economic data also continued to improve, |
23
PORTFOLIO RESULTS
| | particularly in the housing sector, causing rates to increase in anticipation of further recovery. The 10-year U.S. Treasury yield ended the Reporting Period 75 basis points higher at 2.61% . (A basis point is 1/100th of a percentage point.) |
| Q | | How did the Fund use derivatives and similar instruments during the Reporting Period? |
| A | | We used derivatives and similar instruments for the efficient management of the Fund. These derivatives and similar instruments allowed us to manage interest rate, credit and currency risks more effectively by allowing us both to hedge and to apply active investment views with greater versatility and to afford greater risk management precision than we would otherwise be able to implement. |
| | During the Reporting Period, we used interest rate and bond exchange traded futures contracts to implement duration and country strategies within the Fund, especially in the U.S., Eurozone and Japanese markets. Currency transactions were carried out using primarily over-the-counter (“OTC”) spot and forward foreign exchange contracts as well as by purchasing OTC options. Currency transactions were used as we sought both to enhance returns and to hedge the Fund’s portfolio against currency exchange rate fluctuations. Also, we used written options contracts and swaptions (or options on interest rate swap contracts) to express an outright term structure view and manage volatility (term structure, most often depicted as a yield curve, refers to the term structure of interest rates, which is the relationship between the yield to maturity and the time to maturity for pure discount bonds); credit default swaps to manage exposure to fluctuations in credit spreads (or the differential in yields between Treasury securities and non-Treasury securities that are identical in all respects except for quality rating); and interest rate swaps to manage exposure to fluctuations in interest rates. We used total return swaps to manage curve exposure across various strategies within the Fund. Our currency strategy used forward sales contracts to implement long and short views within the strategy. |
| Q | | Were there any notable changes in the Fund’s weightings during the Reporting Period? |
| A | | The Fund is a broadly diversified, multi-sector portfolio designed to provide total return opportunities from across the fixed income spectrum, including government, securitized, corporate credit and emerging market fixed income sectors. During the Reporting Period, we generally reduced risk heading into a time of uncertainty that included surprises around Fed monetary policy and leadership, Syrian tensions and U.S. lawmakers’ failure to sign a continuing resolution in time to prevent a partial U.S. government shutdown. |
| | We shifted the Fund’s duration positioning during the Reporting Period from a long U.S. duration position at the beginning of the Reporting Period to a short U.S. duration position in May 2013, which we maintained and even added to before ending the Reporting Period with a rather neutral U.S. duration stance, as the Fed delayed its tapering at its mid-September 2013 meeting and as Lawrence Summers surprisingly exited from the running for next Fed chair. |
| | We reduced the Fund’s exposure to corporate bonds and mortgage-backed securities, although we maintained the Fund’s sizable positions. We increased the Fund’s exposure to emerging market debt, as sell-offs in the sector created value, in our view, especially over the longer-term horizon. We established a position in high quality, long-dated municipal bonds, as prior underperformance of the sector drove valuations to what we considered to be attractive levels. |
| Q | | How was the Fund positioned at the end of September 2013? |
| A | | At the end of September 2013, the Fund had the majority of its total net assets invested in U.S. government securities, followed by agency and non-agency mortgage-backed securities and emerging market debt. The Fund also maintained exposure at the end of the Reporting Period to commercial mortgage-backed securities, municipal bonds, collateralized loan obligations, high yield corporate bonds, investment grade corporate bonds, quasi-government securities, corporate bank loans and covered bonds. (Covered bonds are debt securities backed by cash flows from mortgage loans or public sector loans.) |
| | The Fund’s largest duration position at the end of the Reporting Period was its long duration position in Europe. The Fund had a more modest long duration position in Canada. The Fund maintained short duration positions in the U.S., Japan and the U.K. The Fund had a short duration overall relative to the LIBOR Index at the end of the Reporting Period. |
| | From a currency perspective, the Fund maintained long currency positions in the U.S. dollar and, to a significantly more modest degree, in the euro, the Mexican peso, the Russian ruble and the Philippine peso. The Fund was short the Chinese renminbi, the Swiss franc, the Swedish krona and the Indonesian rupiah at the end of the Reporting Period. |
24
FUND BASICS
Strategic Income Fund
as of September 30, 2013
| | | | | | | | | | | | | | | | | | |
| | PERFORMANCE REVIEW | |
| | | April 1, 2013– September 30, 2013 | | Fund Total Return
(based on NAV)1 | | | BofA Merrill Lynch
U.S. Dollar 3-Month
LIBOR Constant
Maturity Index2 | | | 30-Day
Standardized
Subsidized Yield3 | | | 30-Day
Standardized
Unsubsidized Yield3 | |
| | Class A | | | 1.25 | % | | | 0.14 | % | | | 1.83 | % | | | 1.83 | % |
| | Class C | | | 0.87 | | | | 0.14 | | | | 1.14 | | | | 1.14 | |
| | Institutional | | | 1.43 | | | | 0.14 | | | | 2.24 | | | | 2.24 | |
| | Class IR | | | 1.28 | | | | 0.14 | | | | 2.15 | | | | 2.15 | |
| | | Class R | | | 1.13 | | | | 0.14 | | | | 1.65 | | | | 1.65 | |
| | 1 | | The net asset value (NAV) represents the net assets of the class of the Fund (ex-dividend) divided by the total number of shares of the class outstanding. The Fund’s performance reflects the reinvestment of dividends and other distributions. The Fund’s performance does not reflect the deduction of any applicable sales charges. |
| | 2 | | The BofA Merrill Lynch US Dollar 3-Month LIBOR Constant Maturity Index tracks the performance of a synthetic asset paying Libor to a stated maturity. The index is based on the assumed purchase at par of a synthetic instrument having exactly its stated maturity and with a coupon equal to that day’s fixing rate. That issue is assumed to be sold the following business day (priced at a yield equal to the current day fixing rate) and rolled into a new instrument. |
| | 3 | | The method of calculation of the 30-Day Standardized Subsidized Yield is mandated by the Securities and Exchange Commission and is determined by dividing the net investment income per share earned during the last 30 days of the period by the maximum public offering price (“POP”) per share on the last day of the period. This number is then annualized. The 30-Day Standardized Subsidized Yield reflects fee waivers and/or expense reimbursements recorded by the Fund during the period. Without waivers and/or reimbursements, yields would be reduced. This yield does not necessarily reflect income actually earned and distributed by the Fund and, therefore, may not be correlated with the dividends or other distributions paid to shareholders. |
| | | | The 30-Day Standardized Unsubsidized Yield does not adjust for any fee waivers and/or expense reimbursements in effect. If the Fund does not incur any fee waivers and/or expense reimbursements during the period, the 30-Day Standard Subsidized Yield and 30-Day Standardized Unsubsidized Yield will be identical. |
The returns set forth in the table above represent past performance. Past performance does not guarantee future results. The Fund’s investment return and principal value will fluctuate so that an investor’s shares, when redeemed, may be worth more or less than their original cost. Current performance may be lower or higher than the performance quoted above. Please visit our web site at www.GSAMFUNDS.com to obtain the most recent month-end returns. Performance reflects applicable fee waivers and/or expense limitations in effect during the periods shown. In their absence, performance would be reduced. Returns do not reflect the deduction of taxes that a shareholder would pay on Fund distributions or the redemption of Fund shares.
25
FUND BASICS
| | | | | | | | | | |
| | STANDARDIZED TOTAL RETURNS4 |
| | | For the period ended 9/30/13 | | One Year | | | Since Inception | | Inception Date |
| | Class A | | | 2.79 | % | | 3.63% | | 6/30/10 |
| | Class C | | | 4.99 | | | 4.07 | | 6/30/10 |
| | Institutional | | | 7.19 | | | 5.20 | | 6/30/10 |
| | Class IR | | | 6.99 | | | 5.08 | | 6/30/10 |
| | | Class R | | | 6.59 | | | 4.58 | | 6/30/10 |
| | 4 | | The Standardized Total Returns are average annual total returns as of the most recent calendar quarter-end. They assume reinvestment of all distributions at NAV. These returns reflect a maximum initial sales charge of 3.75% for Class A Shares and the assumed contingent deferred sales charge for Class C Shares (1% if redeemed within 12 months of purchase). Because Institutional, Class IR and Class R Shares do not involve a sales charge, such a charge is not applied to their Standardized Total Returns. |
The returns set forth in the table above represent past performance. Past performance does not guarantee future results. The Fund’s investment return and principal value will fluctuate so that an investor’s shares, when redeemed, may be worth more or less than their original cost. Current performance may be lower or higher than the performance quoted above. Please visit our web site at www.GSAMFUNDS.com to obtain the most recent month-end returns. Performance reflects applicable fee waivers and/or expense limitations in effect during the periods shown. In their absence, performance would be reduced. Returns do not reflect the deduction of taxes that a shareholder would pay on Fund distributions or the redemption of Fund shares.
| | | | | | | | | | |
| | EXPENSE RATIOS5 | |
| | | | | Net Expense Ratio (Current) | | | Gross Expense Ratio (Before Waivers) | |
| | Class A | | | 0.99 | % | | | 0.99 | % |
| | Class C | | | 1.74 | | | | 1.74 | |
| | Institutional | | | 0.65 | | | | 0.65 | |
| | Class IR | | | 0.74 | | | | 0.74 | |
| | | Class R | | | 1.23 | | | | 1.23 | |
| | 5 | | The expense ratios of the Fund, both current (net of applicable fee waivers and/or expense limitations) and before waivers (gross of applicable fee waivers and/or expense limitations) are as set forth above according to the most recent publicly available Prospectus for the Fund and may differ from the expense ratios disclosed in the Financial Highlights in this report. |
26
FUND BASICS
| | |
| SECTOR ALLOCATIONS6 |
| Percentage of Net Assets | | |
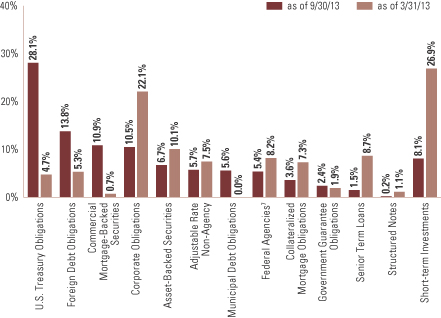
| | 6 | | The percentage shown for each investment category reflects the value of investments in that category as a percentage of net assets. Short-term investments represent repurchase agreements. Figures in the graph may not sum to 100% due to the exclusion of other assets and liabilities. The graph depicts the Fund’s investments but may not represent the Fund’s market exposure due to the exclusion of certain derivatives, if any, as listed in the Additional Investment Information section of the Schedule of Investments. |
| | 7 | | “Federal Agencies” are mortgage-backed securities guaranteed by the Government National Mortgage Association (“GNMA”), Federal National Mortgage Association (“FNMA”) and Federal Home Loan Mortgage Corp. (“FHLMC”). GNMA instruments are backed by the full faith and credit of the U.S. Government. |
27
PORTFOLIO RESULTS
Goldman Sachs World Bond Fund
Investment Objective
The Fund seeks total return, emphasizing current income, and, to a lesser extent, capital appreciation.
Portfolio Management Discussion and Analysis
Below, the Goldman Sachs Global Fixed Income Investment Management Team discusses the Goldman Sachs World Bond Fund’s (the “Fund”) performance and positioning for the six-month period ended September 30, 2013 (the “Reporting Period”).
| Q | | How did the Fund perform during the Reporting Period? |
| A | | During the Reporting Period, the Fund’s Class A, C, Institutional, IR and R Shares generated cumulative total returns, without sales charges, of -1.87%, -2.27%, -1.80%, -1.79% and -2.11%, respectively. These returns compare to the -1.72% cumulative total return of the Fund’s benchmark, the Barclays Global Sovereign Fiscal Strength Index (Gross, USD, Unhedged) (the “Barclays Index”), during the same time period. |
| Q | | What key factors were responsible for the Fund’s performance during the Reporting Period? |
| A | | Within our top-down strategies, our currency strategy detracted from the Fund’s results. To a more modest degree, our cross-sector strategy also hampered returns. Our cross-sector strategy is one in which we invest Fund assets across a variety of fixed income sectors, including some that may not be included in the Fund’s benchmark. Such detractors were partially offset by our country and duration strategies, which contributed most positively to the Fund’s performance during the Reporting Period. Duration is a measure of the Fund’s sensitivity to changes in interest rates. |
| | Bottom-up individual issue selection in emerging market debt and government/agency securities added value. There were no significant detractors from an individual issue selection perspective during the Reporting Period. |
| Q | | Which fixed income market sectors most significantly affected Fund performance? |
| A | | The Fund was invested primarily in fixed income instruments issued by U.S. and non-U.S. governments and in sovereign-related debt. Yields across local and external debt peaked during early September, as markets priced in the potential for Federal Reserve (“Fed”) tapering of its asset purchases via its quantitative easing program. Yields subsequently retraced these moves following the announcement in mid-September 2013 that such tapering would be delayed. |
| | Our individual issue selection within the emerging market debt and government/agency sectors contributed positively to the Fund’s performance. Within the emerging market debt sector, exposure to Indonesian and South African rates added to returns. Within the government/agency sector, exposure to the two-year to six-year segment of the U.S. Treasury yield curve proved most beneficial. Yield curve indicates the spectrum of maturities within a particular sector. |
| | Through most of the Reporting Period, the Fund had an underweighted exposure relative to the Barclays Index in government securities and an overweight relative to the Barclays Index in emerging market debt. The Fund’s positioning in government securities proved prudent, as tapering talk from the Fed prompted a rise in developed market government bond yields during the Reporting Period. The Fund’s positioning in emerging market debt detracted, as the combination of anticipation of Fed tapering its quantitative easing program, U.S. economic growth outpacing economic growth in emerging markets, and China worries created headwinds and drove a sell-off in the sector during the Reporting Period. |
| Q | | Did the Fund’s duration and yield curve positioning strategy help or hurt its results during the Reporting Period? |
| A | | The Fund’s duration positioning contributed positively to results during the Reporting Period, most especially in August and September 2013. Overall, the Fund maintained a shorter duration than the Barclays Index during the Reporting Period, although the Fund’s duration strategy is actively managed and constantly monitored in an effort to generate greater performance and reduce risk through volatile |
28
PORTFOLIO RESULTS
| | markets. We began the Reporting Period with the Fund having a longer duration than the Barclays Index. We then shifted to a comparatively shorter duration than the Barclays Index toward the end of June 2013 and maintained this stance through the remainder of the Reporting Period. |
| | Within the strategy, the Fund’s short duration positioning in the U.S. and Japan relative to the Barclays Index contributed most. More specifically, the Fund’s short position at the 10-year segment of the U.S. Treasury yield curve and a short position at the seven-year segment of the Japanese government bond curve were the primary contributors, as yields rose during the Reporting Period. |
| Q | | How did the Fund use derivatives and similar instruments during the Reporting Period? |
| A | | We used derivatives and similar instruments for the efficient management of the Fund. These derivatives and similar instruments allowed us to manage interest rate and currency risks more effectively by allowing us both to hedge and to apply active investment views with greater versatility and to afford greater risk management precision than we would otherwise be able to implement. |
| | During the Reporting Period, we used interest rate and bond exchange traded futures contracts to implement duration and country strategies within the Fund, especially in the U.S., Eurozone, U.K. and Japanese markets. Currency transactions were carried out using primarily over-the-counter (“OTC”) spot and forward foreign exchange contracts. Currency transactions were used as we sought both to enhance returns and to hedge the Fund’s portfolio against currency exchange rate fluctuations. Interest rate swaps were also used as cost-efficient instruments to help grant us greater precision and versatility in the management of active strategies, especially our country strategy. |
| Q | | Were there any notable changes in the Fund’s weightings during the Reporting Period? |
| A | | Given the Fund’s launch on November 30, 2012, it was not so much a matter of making changes during the Reporting Period but of continuing to build the portfolio in accordance with the Fund’s principal investment strategies. |
| | That said, as mentioned earlier, we adjusted the Fund’s duration positioning as market conditions shifted during the Reporting Period. We reduced the Fund’s duration, decreasing interest rate exposure given prospects of the Fed tapering. We also implemented a five-year versus five-year relative value trading strategy within our country strategy using interest rate swaps. The strategy looks at ten developed countries, i.e. those of the G10, versus six emerging market countries for relative value opportunities. (The G10 are actually eleven industrialized nations that meet on an annual basis to consult each other and to debate and cooperate on international financial matters. The emerging market countries we look at via this strategy are Brazil, South Korea, Malaysia, Mexico, Poland and South Africa.) |
| Q | | How was the Fund positioned relative to its benchmark index at the end of September 2013? |
| A | | At the end of September 2013, the Fund had an underweighted allocation relative to the Barclays Index in U.S. Treasuries. The Fund also had an underweighted exposure relative to the Barclays Index in emerging market debt. The Fund had a sizable position in cash at the end of the Reporting Period. The Fund had an underweight in foreign sovereign bonds in duration terms relative to the Barclays Index. |
| | From a country perspective, the Fund was overweight relative to the Barclays Index in Germany and the U.S. at the end of September 2013. The Fund was underweight relative to the Barclays Index in Japan, Spain and the emerging markets overall. The Fund was neutral to the Barclays Index in Australia, Canada, Denmark, France, Ireland, Italy, Norway, Sweden and the U.K. at the end of the Reporting Period. |
| | In terms of currencies, the Fund was underweight the U.S. dollar and the Swiss franc compared to the Barclays Index at the end of the Reporting Period and overweight relative to the Barclays Index in the euro. The Fund had a shorter duration than the Barclays Index at the end of the Reporting Period. |
29
FUND BASICS
World Bond Fund
as of September 30, 2013
| | | | | | | | | | | | | | | | | | |
| | PERFORMANCE REVIEW | |
| | | April 1, 2013– September 30, 2013 | | Fund Total
Return
(based on NAV)1 | | | Barclays Global
Sovereign Fiscal
Strength Weighted
Index (Gross, USD,
Unhedged)2 | | | 30-Day
Standardized
Subsidized Yield3 | | | 30-Day Standardized
Unsubsidized Yield3 | |
| | Class A | | | -1.87 | % | | | -1.72 | % | | | 1.22 | % | | | -5.86 | % |
| | Class C | | | -2.27 | | | | -1.72 | | | | 0.53 | | | | -6.80 | |
| | Institutional | | | -1.80 | | | | -1.72 | | | | 1.60 | | | | -5.77 | |
| | Class IR | | | -1.79 | | | | -1.72 | | | | 1.56 | | | | -5.81 | |
| | | Class R | | | -2.11 | | | | -1.72 | | | | 0.99 | | | | -6.35 | |
| | 1 | | The net asset value (“NAV”) represents the net assets of the Fund (ex-dividend) divided by the total number of shares outstanding. The Fund’s performance assumes the reinvestment of dividends and other distributions. The Fund’s performance does not reflect the deduction of any applicable sales charges. |
| | 2 | | The Barclays Global Sovereign Fiscal Strength Weighted Index (Gross, USD, Unhedged) family is a new rules-based alternative weight benchmark offering that uses fundamental measures of fiscal sustainability to depart from market capitalization country weights in existing bond indices. It is not possible to invest directly in an unmanaged index. |
| | 3 | | The method of calculation of the 30-Day Standardized Subsidized Yield is mandated by the Securities and Exchange Commission and is determined by dividing the net investment income per share earned during the last 30 days of the period by the maximum public offering price (“POP”) per share on the last day of the period. This number is then annualized. The 30-Day Standardized Subsidized Yield reflects fee waivers and/or expense reimbursements recorded by the Fund during the period. Without waivers and/or reimbursements, yields would be reduced. This yield does not necessarily reflect income actually earned and distributed by the Fund and, therefore, may not be correlated with the dividends or other distributions paid to shareholders. |
| | | | The 30-Day Standardized Unsubsidized Yield does not adjust for any fee waivers and/or expense reimbursements in effect. If the Fund does not incur any fee waivers and/or expense reimbursements during the period, the 30-Day Standard Subsidized Yield and 30-Day Standardized Unsubsidized Yield will be identical. |
| | | | | | | | |
| | STANDARDIZED TOTAL RETURNS4 |
| | | For the period ended 9/30/13 | | Since Inception | | | Inception Date |
| | Class A | | | -6.20 | % | | 11/30/12 |
| | Class C | | | -4.11 | | | 11/30/12 |
| | Institutional | | | -2.36 | | | 11/30/12 |
| | Class IR | | | -2.38 | | | 11/30/12 |
| | | Class R | | | -2.88 | | | 11/30/12 |
| | 4 | | The Standardized Total Returns are cumulative total returns as of the most recent calendar quarter-end. They assume reinvestment of all distributions at NAV. These returns reflect a maximum initial sales charge of 3.75% for Class A Shares and the assumed contingent deferred sales charge for Class C Shares (1% if redeemed within 12 months of purchase). Because Institutional, Class IR and Class R Shares do not involve a sales charge, such a charge is not applied to their Standardized Total Returns. |
The returns set forth in the tables above represent past performance. Past performance does not guarantee future results. The Fund’s investment return and principal value will fluctuate so that an investor’s shares, when redeemed, may be worth more or less than their original cost. Current performance may be lower or higher than the performance quoted above. Please visit our web site at www.GSAMFUNDS.com to obtain the most recent month-end returns. Performance reflects applicable fee waivers and/or expense limitations in effect during the periods shown. In their absence, performance would be reduced. Returns do not reflect the deduction of taxes that a shareholder would pay on Fund distributions or the redemption of Fund shares.
30
FUND BASICS
| | | | | | | | | | |
| | EXPENSE RATIOS5 | |
| | | | | Net Expense Ratio (Current) | | | Gross Expense Ratio (Before Waivers) | |
| | Class A | | | 1.04 | % | | | 4.14 | % |
| | Class C | | | 1.78 | | | | 5.46 | |
| | Institutional | | | 0.71 | | | | 4.37 | |
| | Class IR | | | 0.86 | | | | 4.53 | |
| | | Class R | | | 1.31 | | | | 4.96 | |
| | 5 | | The expense ratios of the Fund, both current (net of applicable fee waivers and/or expense limitations) and before waivers (gross of applicable fee waivers and/or expense limitations) are as set forth above according to the most recent publicly available Prospectus for the Fund and may differ from the expense ratios disclosed in the Financial Highlights in this report. The Fund’s waivers and/or expense limitations will remain in place through at least July 29, 2014, and prior to such date the Investment Adviser may not terminate the arrangements without the approval of the Fund’s Board of Trustees. If these arrangements are discontinued in the future, the expense ratios may change without shareholder approval. |
| | | | | | | | | | |
| | CURRENCY ALLOCATION6 | |
| | | | | Percentage of Net Assets | |
| | | | | as of 9/30/13 | | | as of 3/31/13 | |
| | Euro | | | 30.3 | % | | | 19.1 | % |
| | U.S. Dollar7 | | | 18.0 | | | | 37.0 | |
| | Japanese Yen | | | 5.6 | | | | 5.4 | |
| | British Pound | | | 4.3 | | | | 5.0 | |
| | Russian Ruble | | | 3.5 | | | | 5.2 | |
| | Colombian Peso | | | 3.2 | | | | 1.1 | |
| | Turkish Lira | | | 3.0 | | | | 1.9 | |
| | Mexican Peso | | | 2.7 | | | | 4.7 | |
| | Australian Dollar | | | 2.7 | | | | 2.6 | |
| | Polish Zloty | | | 2.7 | | | | 1.6 | |
| | | Other Currencies | | | 11.8 | | | | 12.8 | |
| | 6 | | The percentage shown for each currency reflects the value of investments in that category as a percentage of net assets. Figures in the table may not sum to 100% due to the exclusion of other assets and liabilities. The table depicts the Fund’s investments but may not represent the Fund’s market exposure due to the exclusion of certain derivatives, if any, as listed in the Additional Investment Information section of the Schedule of Investments. |
| | 7 | | These figures represent the value excluding short-term obligations. If short-term obligations had been included, the percentages for 9/30/13 and 3/31/13 would have been 27.4% and 37.8%, respectively. |
31
GOLDMAN SACHS CORE FIXED INCOME FUND
Schedule of Investments
September 30, 2013 (Unaudited)
| | | | | | | | | | | | | | |
Principal
Amount | | | Interest
Rate | | | Maturity
Date | | | Value | |
| | | | | | | | | | | | | | |
| | Corporate Obligations – 32.6% | |
| | Automotive – 0.6% | |
| Delphi Corp.(a) | |
| $ | 775,000 | | | | 5.000 | % | | | 02/15/23 | | | $ | 803,094 | |
| Ford Motor Credit Co. LLC | |
| | 3,575,000 | | | | 3.984 | | | | 06/15/16 | | | | 3,775,799 | |
| | 1,875,000 | | | | 8.000 | | | | 12/15/16 | | | | 2,216,418 | |
| | | | | | | | | | | | | | |
| | | | | | | | | | | | | 6,795,311 | |
| | |
| | Banks – 8.5% | |
| Abbey National Treasury Services PLC | |
| | 1,750,000 | | | | 2.875 | | | | 04/25/14 | | | | 1,770,752 | |
| GBP | 1,600,000 | | | | 2.113 | (b) | | | 02/16/15 | | | | 2,634,017 | |
| ANZ Capital Trust II(a)(c) | |
| $ | 4,525,000 | | | | 5.360 | | | | 12/15/49 | | | | 4,552,150 | |
| Bank of America Corp. | |
| | 1,650,000 | | | | 6.000 | | | | 09/01/17 | | | | 1,874,722 | |
| | 3,225,000 | | | | 5.750 | | | | 12/01/17 | | | | 3,645,367 | |
| | 825,000 | | | | 5.700 | | | | 01/24/22 | | | | 922,196 | |
| Bank of Scotland PLC(c) | |
| | 400,000 | | | | 5.250 | | | | 02/21/17 | | | | 446,822 | |
| Barclays Bank PLC(c) | |
| | 2,725,000 | | | | 6.050 | | | | 12/04/17 | | | | 3,026,914 | |
| BB&T Corp.(a) | |
| | 2,025,000 | | | | 1.600 | | | | 08/15/17 | | | | 2,006,905 | |
| Capital One Financial Corp. | |
| | 2,225,000 | | | | 1.000 | | | | 11/06/15 | | | | 2,210,021 | |
| Citigroup, Inc. | |
| | 4,650,000 | | | | 5.000 | | | | 09/15/14 | | | | 4,826,587 | |
| | 1,000,000 | | | | 3.375 | | | | 03/01/23 | | | | 948,462 | |
| Commonwealth Bank of Australia(a)(b)(c) | |
| | 3,740,000 | | | | 6.024 | | | | 03/15/49 | | | | 3,917,650 | |
| Compass Bank | |
| | 1,950,000 | | | | 5.500 | | | | 04/01/20 | | | | 1,973,618 | |
| Credit Suisse AG(c) | |
| | 1,475,000 | | | | 6.500 | | | | 08/08/23 | | | | 1,516,151 | |
| Discover Bank | |
| | 492,000 | | | | 8.700 | | | | 11/18/19 | | | | 623,788 | |
| Discover Financial Services | |
| | 1,583,000 | | | | 3.850 | | | | 11/21/22 | | | | 1,502,185 | |
| ING Bank NV(c) | |
| | 4,500,000 | | | | 2.000 | | | | 09/25/15 | | | | 4,561,245 | |
| Intesa Sanpaolo SPA | |
| | 1,475,000 | | | | 3.125 | | | | 01/15/16 | | | | 1,474,946 | |
| | 2,275,000 | | | | 3.875 | | | | 01/16/18 | | | | 2,238,239 | |
| JPMorgan Chase & Co. | |
| | 1,625,000 | | | | 3.250 | | | | 09/23/22 | | | | 1,531,694 | |
| Northern Rock Asset Management PLC(c) | |
| | 8,900,000 | | | | 5.625 | | | | 06/22/17 | | | | 10,105,539 | |
| Regions Bank | |
| | 1,575,000 | | | | 7.500 | | | | 05/15/18 | | | | 1,854,458 | |
| Regions Financial Corp. | |
| | 3,475,000 | | | | 5.750 | | | | 06/15/15 | | | | 3,732,150 | |
| Resona Preferred Global Securities Ltd.(a)(b)(c) | |
| | 3,650,000 | | | | 7.191 | | | | 07/30/49 | | | | 3,905,500 | |
| Royal Bank of Scotland PLC | |
| | 2,825,000 | | | | 2.550 | | | | 09/18/15 | | | | 2,880,727 | |
| | 1,025,000 | | | | 9.500 | (a)(b) | | | 03/16/22 | | | | 1,178,750 | |
| | |
| | | | | | | | | | | | | | |
| | Corporate Obligations – (continued) | |
| | Banks – (continued) | |
| Santander Holdings USA, Inc.(a) | |
| $ | 1,400,000 | | | | 3.000 | | | | 09/24/15 | | | | 1,437,116 | |
| Sovereign Bank | |
| | 975,000 | | | | 8.750 | | | | 05/30/18 | | | | 1,168,348 | |
| Sparebank 1 Boligkreditt AS(c) | |
| | 9,900,000 | | | | 2.625 | | | | 05/27/16 | | | | 10,295,185 | |
| | 600,000 | | | | 1.750 | | | | 11/15/19 | | | | 571,980 | |
| Standard Chartered PLC(c) | |
| | 1,700,000 | | | | 5.500 | | | | 11/18/14 | | | | 1,787,550 | |
| | 2,550,000 | | | | 3.950 | | | | 01/11/23 | | | | 2,398,655 | |
| SunTrust Banks, Inc.(a) | |
| | 2,450,000 | | | | 3.600 | | | | 04/15/16 | | | | 2,584,216 | |
| U.S. Bancorp | |
| | 3,750,000 | | | | 3.442 | | | | 02/01/16 | | | | 3,914,091 | |
| Union Bank NA | |
| | 4,800,000 | | | | 2.125 | | | | 06/16/17 | | | | 4,805,907 | |
| | | | | | | | | | | | | | |
| | | | | | | | | | | | | 100,824,603 | |
| | |
| | Brokerage – 0.8% | |
| Merrill Lynch & Co., Inc. | |
| | 2,950,000 | | | | 6.400 | | | | 08/28/17 | | | | 3,388,824 | |
| Morgan Stanley, Inc. | |
| | 5,625,000 | | | | 6.625 | | | | 04/01/18 | | | | 6,518,461 | |
| | | | | | | | | | | | | | |
| | | | | | | | | | | | | 9,907,285 | |
| | |
| | Chemicals – 0.6% | |
| Eastman Chemical Co. | |
| | 1,925,000 | | | | 2.400 | | | | 06/01/17 | | | | 1,947,295 | |
| Ecolab, Inc. | |
| | 4,650,000 | | | | 1.450 | | | | 12/08/17 | | | | 4,564,307 | |
| LYB International Finance BV | |
| | 1,050,000 | | | | 4.000 | | | | 07/15/23 | | | | 1,036,712 | |
| | | | | | | | | | | | | | |
| | | | | | | | | | | | | 7,548,314 | |
| | |
| | Construction Machinery – 0.2% | |
| Caterpillar, Inc. | |
| | 2,275,000 | | | | 3.803 | | | | 08/15/42 | | | | 1,947,576 | |
| | |
| | Consumer Products – 0.7% | |
| Avon Products, Inc. | |
| | 3,425,000 | | | | 4.600 | | | | 03/15/20 | | | | 3,541,293 | |
| Deere & Co.(a) | |
| | 1,525,000 | | | | 3.900 | | | | 06/09/42 | | | | 1,362,308 | |
| Kimberly-Clark Corp. | |
| | 3,125,000 | | | | 3.700 | | | | 06/01/43 | | | | 2,708,057 | |
| | | | | | | | | | | | | | |
| | | | | | | | | | | | | 7,611,658 | |
| | |
| | Distributor(c) – 0.2% | |
| Ras Laffan Liquefied Natural Gas Co. Ltd. III | |
| | 1,700,000 | | | | 5.500 | | | | 09/30/14 | | | | 1,763,750 | |
| | |
| | Electric – 1.0% | |
| Florida Power & Light Co.(a) | |
| | 2,132,000 | | | | 4.125 | | | | 02/01/42 | | | | 1,981,719 | |
| Ipalco Enterprises, Inc.(a) | |
| | 1,175,000 | | | | 5.000 | | | | 05/01/18 | | | | 1,219,063 | |
| NV Energy, Inc. | |
| | 2,075,000 | | | | 6.250 | | | | 11/15/20 | | | | 2,396,625 | |
| | |
| | |
| 32 | | The accompanying notes are an integral part of these financial statements. |
GOLDMAN SACHS CORE FIXED INCOME FUND
| | | | | | | | | | | | | | |
Principal
Amount | | | Interest
Rate | | | Maturity
Date | | | Value | |
| | | | | | | | | | | | | | |
| | Corporate Obligations – (continued) | |
| | Electric – (continued) | |
| PPL WEM Holdings PLC(a)(c) | |
| $ | 2,290,000 | | | | 5.375 | % | | | 05/01/21 | | | $ | 2,491,325 | |
| Puget Sound Energy, Inc.(a)(b) | |
| | 1,180,000 | | | | 6.974 | | | | 06/01/67 | | | | 1,227,200 | |
| Ruwais Power Co. PJSC(c) | |
| | 740,000 | | | | 6.000 | | | | 08/31/36 | | | | 764,050 | |
| Southern California Edison Co.(a) | |
| | 1,950,000 | | | | 4.050 | | | | 03/15/42 | | | | 1,774,720 | |
| | | | | | | | | | | | | | |
| | | | | | | | | | | | | 11,854,702 | |
| | |
| | Energy – 2.8% | |
| Anadarko Petroleum Corp. | |
| | 1,330,000 | | | | 6.375 | | | | 09/15/17 | | | | 1,548,020 | |
| BG Energy Capital PLC(a)(b) | |
| | 3,375,000 | | | | 6.500 | | | | 11/30/72 | | | | 3,595,292 | |
| CNOOC Curtis Funding No. 1 Pty Ltd.(c) | |
| | 700,000 | | | | 4.500 | | | | 10/03/23 | | | | 705,384 | |
| Dolphin Energy Ltd.(c) | |
| | 1,244,775 | | | | 5.888 | | | | 06/15/19 | | | | 1,359,917 | |
| | 1,760,000 | | | | 5.500 | | | | 12/15/21 | | | | 1,927,799 | |
| Ecopetrol SA | |
| | 490,000 | | | | 5.875 | | | | 09/18/23 | | | | 511,885 | |
| Gaz Capital SA for Gazprom(d) | |
| | 2,690,000 | | | | 9.250 | | | | 04/23/19 | | | | 3,295,250 | |
| Nexen, Inc. | |
| | 1,479,000 | | | | 6.400 | | | | 05/15/37 | | | | 1,606,128 | |
| PTTEP Canada International Finance Ltd.(c) | |
| | 1,990,000 | | | | 5.692 | | | | 04/05/21 | | | | 2,121,837 | |
| Rosneft Oil Co. via Rosneft International Finance Ltd.(c) | |
| | 1,850,000 | | | | 4.199 | | | | 03/06/22 | | | | 1,704,313 | |
| Rowan Cos., Inc.(a) | |
| | 3,400,000 | | | | 4.875 | | | | 06/01/22 | | | | 3,472,193 | |
| Shell International Finance BV | |
| | 1,775,000 | | | | 4.550 | | | | 08/12/43 | | | | 1,743,354 | |
| TNK-BP Finance SA | |
| | 1,570,000 | | | | 7.875 | | | | 03/13/18 | | | | 1,815,313 | |
| Transocean, Inc. | |
| | 3,620,000 | | | | 6.500 | | | | 11/15/20 | | | | 4,024,617 | |
| Transportadora de Gas Internacional SA(a) | |
| | 1,020,000 | | | | 5.700 | | | | 03/20/22 | | | | 1,028,638 | |
| Weatherford International Ltd. | |
| | 1,921,000 | | | | 9.625 | | | | 03/01/19 | | | | 2,424,727 | �� |
| | | | | | | | | | | | | | |
| | | | | | | | | | | | | 32,884,667 | |
| | |
| | Entertainment – 0.1% | |
| The Walt Disney Co. | |
| | 1,644,000 | | | | 3.700 | | | | 12/01/42 | | | | 1,402,741 | |
| | |
| | Food & Beverage – 1.8% | |
| Anadolu Efes Biracilik Ve Malt Sanayii AS(c) | |
| | 1,400,000 | | | | 3.375 | | | | 11/01/22 | | | | 1,134,000 | |
| Anheuser-Busch InBev Worldwide, Inc. | |
| | 3,100,000 | | | | 1.375 | | | | 07/15/17 | | | | 3,091,444 | |
| ConAgra Foods, Inc. | |
| | 3,475,000 | | | | 1.900 | | | | 01/25/18 | | | | 3,426,607 | |
| Diageo Capital PLC | |
| | 2,850,000 | | | | 1.500 | | | | 05/11/17 | | | | 2,846,000 | |
| | |
| | | | | | | | | | | | | | |
| | Corporate Obligations – (continued) | |
| | Food & Beverage – (continued) | |
| Kraft Foods Group, Inc. | |
| 2,350,000 | | | | 2.250 | | | | 06/05/17 | | | | 2,396,713 | |
| Mondelez International, Inc. | |
| | 655,000 | | | | 5.375 | | | | 02/10/20 | | | | 739,640 | |
| | 1,975,000 | | | | 6.500 | | | | 02/09/40 | | | | 2,318,496 | |
| Pernod-Ricard SA(c) | |
| | 5,425,000 | | | | 4.450 | | | | 01/15/22 | | | | 5,569,495 | |
| | | | | | | | | | | | | | |
| | | | | | | | | | | | | 21,522,395 | |
| | |
| | Health Care – Medical Products – 0.1% | |
| DENTSPLY International, Inc. | |
| | 1,550,000 | | | | 2.750 | | | | 08/15/16 | | | | 1,570,322 | |
| | |
| | Health Care – Services – 0.6% | |
| Coventry Health Care, Inc. | |
| | 1,606,000 | | | | 6.300 | | | | 08/15/14 | | | | 1,681,763 | |
| Express Scripts Holding Co. | |
| | 5,050,000 | | | | 3.125 | | | | 05/15/16 | | | | 5,290,088 | |
| | | | | | | | | | | | | | |
| | | | | | | | | | | | | 6,971,851 | |
| | |
| | Home Construction – 0.3% | |
| MDC Holdings, Inc. | |
| | 1,950,000 | | | | 5.625 | | | | 02/01/20 | | | | 2,019,839 | �� |
| | 1,575,000 | | | | 6.000 | | | | 01/15/43 | | | | 1,367,094 | |
| | | | | | | | | | | | | | |
| | | | | | | | | | | | | 3,386,933 | |
| | |
| | Life Insurance – 0.8% | |
| American International Group, Inc. | |
| | 1,200,000 | | | | 2.375 | | | | 08/24/15 | | | | 1,215,580 | |
| | 800,000 | | | | 5.850 | | | | 01/16/18 | | | | 910,484 | |
| Genworth Financial, Inc. | |
| | 875,000 | | | | 8.625 | | | | 12/15/16 | | | | 1,038,300 | |
| | 800,000 | | | | 7.200 | | | | 02/15/21 | | | | 925,026 | |
| Genworth Holdings, Inc. | |
| | 1,200,000 | | | | 7.625 | | | | 09/24/21 | | | | 1,419,166 | |
| The Northwestern Mutual Life Insurance Co.(c) | |
| | 3,600,000 | | | | 6.063 | | | | 03/30/40 | | | | 4,134,114 | |
| | | | | | | | | | | | | | |
| | | | | | | | | | | | | 9,642,670 | |
| | |
| | Media – Cable – 0.1% | |
| DIRECTV Holdings LLC/DIRECTV Financing Co., Inc. | |
| | 950,000 | | | | 2.400 | | | | 03/15/17 | | | | 950,309 | |
| Time Warner Cable, Inc. | |
| | 375,000 | | | | 5.000 | | | | 02/01/20 | | | | 378,661 | |
| | | | | | | | | | | | | | |
| | | | | | | | | | | | | 1,328,970 | |
| | |
| | Media – Non Cable – 1.0% | |
| NBCUniversal Media LLC | |
| | 3,850,000 | | | | 4.375 | | | | 04/01/21 | | | | 4,144,711 | |
| News America, Inc. | |
| | 1,050,000 | | | | 6.150 | | | | 02/15/41 | | | | 1,150,513 | |
| | 3,650,000 | | | | 5.400 | (c) | | | 10/01/43 | | | | 3,653,806 | |
| WPP Finance UK | |
| | 2,850,000 | | | | 8.000 | | | | 09/15/14 | | | | 3,035,641 | |
| | | | | | | | | | | | | | |
| | | | | | | | | | | | | 11,984,671 | |
| | |
| | |
| The accompanying notes are an integral part of these financial statements. | | 33 |
GOLDMAN SACHS CORE FIXED INCOME FUND
Schedule of Investments (continued)
September 30, 2013 (Unaudited)
| | | | | | | | | | | | | | |
Principal
Amount | | | Interest
Rate | | | Maturity
Date | | | Value | |
| | Corporate Obligations – (continued) | |
| | Metals & Mining(c) – 0.7% | |
| Glencore Funding LLC | |
| $ | 1,525,000 | | | | 1.700 | % | | | 05/27/16 | | | $ | 1,502,604 | |
| | 2,400,000 | | | | 2.500 | | | | 01/15/19 | | | | 2,249,697 | |
| Xstrata Finance Canada Ltd. | |
| | 5,025,000 | | | | 2.450 | | | | 10/25/17 | | | | 4,997,594 | |
| | | | | | | | | | | | | | |
| | | | | | | | | | | | | 8,749,895 | |
| | |
| | Noncaptive – Financial – 0.7% | |
| General Electric Capital Corp. | |
| | 1,050,000 | | | | 3.150 | | | | 09/07/22 | | | | 989,685 | |
| | 2,625,000 | | | | 5.875 | | | | 01/14/38 | | | | 2,867,230 | |
| International Lease Finance Corp. | |
| | 4,000,000 | | | | 5.750 | | | | 05/15/16 | | | | 4,220,000 | |
| | | | | | | | | | | | | | |
| | | | | | | | | | | | | 8,076,915 | |
| | |
| | Pharmaceuticals – 0.6% | |
| AbbVie, Inc. | |
| | 7,150,000 | | | | 1.750 | | | | 11/06/17 | | | | 7,096,705 | |
| | |
| | Pipelines – 1.2% | |
| El Paso Pipeline Partners Operating Co. LLC | |
| | 1,650,000 | | | | 6.500 | | | | 04/01/20 | | | | 1,892,283 | |
| Enterprise Products Operating LLC(a)(b) | |
| | 4,100,000 | | | | 8.375 | | | | 08/01/66 | | | | 4,510,000 | |
| | 1,350,000 | | | | 7.000 | | | | 06/01/67 | | | | 1,429,313 | |
| | 925,000 | | | | 7.034 | | | | 01/15/68 | | | | 1,026,750 | |
| Tennessee Gas Pipeline Co. | |
| | 1,450,000 | | | | 8.375 | | | | 06/15/32 | | | | 1,908,085 | |
| TransCanada PipeLines Ltd.(a)(b) | |
| | 3,200,000 | | | | 6.350 | | | | 05/15/67 | | | | 3,280,000 | |
| | | | | | | | | | | | | | |
| | | | | | | | | | | | | 14,046,431 | |
| | |
| | Property/Casualty Insurance – 0.1% | |
| Arch Capital Group Ltd. | |
| | 1,200,000 | | | | 7.350 | | | | 05/01/34 | | | | 1,493,577 | |
| | |
| | Real Estate Investment Trusts – 2.8% | |
| American Campus Communities Operating Partnership LP(a) | |
| | 3,175,000 | | | | 3.750 | | | | 04/15/23 | | | | 3,025,856 | |
| Camden Property Trust | |
| | 3,575,000 | | | | 5.700 | | | | 05/15/17 | | | | 3,971,476 | |
| Developers Diversified Realty Corp. | |
| | 250,000 | | | | 9.625 | | | | 03/15/16 | | | | 296,856 | |
| | 4,155,000 | | | | 7.500 | | | | 04/01/17 | | | | 4,868,629 | |
| | HCP, Inc. | | | | | | | | | | | | | |
| | 1,500,000 | | | | 6.300 | | | | 09/15/16 | | | | 1,693,176 | |
| | 2,950,000 | | | | 6.000 | | | | 01/30/17 | | | | 3,322,183 | |
| Health Care REIT, Inc. | |
| | 2,125,000 | | | | 2.250 | | | | 03/15/18 | | | | 2,099,185 | |
| | 1,557,000 | | | | 4.125 | | | | 04/01/19 | | | | 1,634,896 | |
| Healthcare Trust of America Holdings LP(a)(c) | |
| | 2,275,000 | | | | 3.700 | | | | 04/15/23 | | | | 2,132,019 | |
| Kilroy Realty LP | |
| | 1,125,000 | | | | 5.000 | | | | 11/03/15 | | | | 1,209,602 | |
| | 2,375,000 | | | | 6.625 | | | | 06/01/20 | | | | 2,693,593 | |
| | 1,500,000 | | | | 3.800 | | | | 01/15/23 | | | | 1,395,166 | |
| ProLogis LP | |
| | 1,050,000 | | | | 6.125 | | | | 12/01/16 | | | | 1,179,635 | |
| | |
| | Corporate Obligations – (continued) | |
| | Real Estate Investment Trusts – (continued) | |
| Ventas Realty LP/Ventas Capital Corp.(a) | |
| 3,250,000 | | | | 2.700 | | | | 04/01/20 | | | | 3,097,063 | |
| | | | | | | | | | | | | | |
| | | | | | | | | | | | | 32,619,335 | |
| | |
| | Retailers – 0.7% | |
| CVS Caremark Corp.(a) | |
| | 1,875,000 | | | | 4.125 | | | | 05/15/21 | | | | 1,989,075 | |
| LVMH Moet Hennessy Louis Vuitton SA(c) | |
| | 2,675,000 | | | | 1.625 | | | | 06/29/17 | | | | 2,668,064 | |
| Walgreen Co. | |
| | 1,750,000 | | | | 1.800 | | | | 09/15/17 | | | | 1,753,994 | |
| | 1,550,000 | | | | 3.100 | | | | 09/15/22 | | | | 1,454,980 | |
| | | | | | | | | | | | | | |
| | | | | | | | | | | | | 7,866,113 | |
| | |
| | Schools – 0.4% | |
| Rensselaer Polytechnic Institute | |
| | 4,200,000 | | | | 5.600 | | | | 09/01/20 | | | | 4,589,840 | |
| | |
| | Technology – Hardware – 0.6% | |
| Hewlett-Packard Co. | |
| | 2,775,000 | | | | 3.000 | | | | 09/15/16 | | | | 2,860,265 | |
| | 1,425,000 | | | | 2.600 | | | | 09/15/17 | | | | 1,441,608 | |
| NetApp, Inc. | |
| | 2,575,000 | | | | 2.000 | | | | 12/15/17 | | | | 2,524,881 | |
| | | | | | | | | | | | | | |
| | | | | | | | | | | | | 6,826,754 | |
| | |
| | Tobacco(c) – 0.4% | |
| Imperial Tobacco Finance PLC | |
| | 4,920,000 | | | | 2.050 | | | | 02/11/18 | | | | 4,797,541 | |
| | |
| | Transportation – 0.8% | |
| ERAC USA Finance LLC(c) | |
| | 1,950,000 | | | | 3.300 | | | | 10/15/22 | | | | 1,853,434 | |
| Penske Truck Leasing Co. LP/PTL Finance Corp.(c) | |
| | 3,000,000 | | | | 3.125 | | | | 05/11/15 | | | | 3,087,918 | |
| | 2,025,000 | | | | 2.500 | | | | 03/15/16 | | | | 2,062,537 | |
| United Parcel Service, Inc. | |
| | 3,050,000 | | | | 3.625 | | | | 10/01/42 | | | | 2,593,398 | |
| | | | | | | | | | | | | | |
| | | | | | | | | | | | | 9,597,287 | |
| | |
| | Wireless Telecommunications – 0.2% | |
| American Tower Corp. | |
| | 3,025,000 | | | | 3.500 | | | | 01/31/23 | | | | 2,665,301 | |
| | |
| | Wirelines Telecommunications – 3.2% | |
| AT&T, Inc. | |
| | 6,975,000 | | | | 2.950 | | | | 05/15/16 | | | | 7,288,125 | |
| | 400,000 | | | | 2.625 | | | | 12/01/22 | | | | 356,756 | |
| Telefonica Emisiones SAU | |
| | 2,300,000 | | | | 3.192 | | | | 04/27/18 | | | | 2,264,540 | |
| | 1,450,000 | | | | 5.462 | | | | 02/16/21 | | | | 1,480,222 | |
| Verizon Communications, Inc. | |
| | 4,525,000 | | | | 3.650 | | | | 09/14/18 | | | | 4,776,797 | |
| | 5,175,000 | | | | 4.500 | | | | 09/15/20 | | | | 5,522,894 | |
| | 11,875,000 | | | | 5.150 | | | | 09/15/23 | | | | 12,756,949 | |
| | 2,925,000 | | | | 6.550 | | | | 09/15/43 | | | | 3,307,290 | |
| | | | | | | | | | | | | | |
| | | | | | | | | | | | | 37,753,573 | |
| | |
| | TOTAL CORPORATE OBLIGATIONS | | | | | |
| | (Cost $377,052,406) | | | $ | 385,127,686 | |
| | |
| | |
| 34 | | The accompanying notes are an integral part of these financial statements. |
GOLDMAN SACHS CORE FIXED INCOME FUND
| | | | | | | | | | | | | | |
Principal
Amount | | | Interest
Rate | | | Maturity
Date | | | Value | |
| | Mortgage-Backed Obligations – 37.8% | |
| | Adjustable Rate Non-Agency(b) – 2.7% | |
| Aire Valley Mortgages PLC Series 2005-1X, Class 2A3 | |
| $ | 2,643,992 | | | | 0.592 | % | | | 09/20/66 | | | $ | 2,511,330 | |
| Aire Valley Mortgages PLC Series 2006-1A, Class 1A(c) | |
| | 1,108,429 | | | | 0.472 | | | | 09/20/66 | | | | 1,049,087 | |
| Aire Valley Mortgages PLC Series 2007-1A, Class 2A1(c) | |
| | 2,368,801 | | | | 0.492 | | | | 09/20/66 | | | | 2,244,546 | |
| Granite Master Issuer PLC Series 2006-1X, Class A7 | |
| GBP | 3,279,846 | | | | 0.731 | | | | 12/20/54 | | | | 5,235,529 | |
| Granite Master Issuer PLC Series 2006-2, Class A5 | |
| EUR | 3,696,776 | | | | 0.327 | | | | 12/20/54 | | | | 4,942,136 | |
| Granite Master Issuer PLC Series 2006-3, Class A4 | |
| $ | 5,725,834 | | | | 0.260 | | | | 12/20/54 | | | | 5,640,072 | |
| Granite Master Issuer PLC Series 2006-3, Class A5 | |
| EUR | 583,701 | | | | 0.347 | | | | 12/20/54 | | | | 780,337 | |
| Granite Master Issuer PLC Series 2007-1, Class 2A1 | |
| $ | 2,946,303 | | | | 0.320 | | | | 12/20/54 | | | | 2,902,173 | |
| Granite Mortgages PLC Series 2003-3, Class 3A | |
| GBP | 464,533 | | | | 0.890 | | | | 01/20/44 | | | | 744,827 | |
| Harborview Mortgage Loan Trust Series 2005-16, Class 2A1A | |
| $ | 949,109 | | | | 0.421 | | | | 01/19/36 | | | | 604,258 | |
| Leek Finance PLC Series 2017X, Class A2C | |
| EUR | 285,312 | | | | 0.501 | | | | 12/21/37 | | | | 397,233 | |
| Leek Finance PLC Series 2018X, Class A2B | |
| $ | 2,185,341 | | | | 0.510 | | | | 09/21/38 | | | | 2,222,219 | |
| Master Adjustable Rate Mortgages Trust Series 2006-OA2,
Class 4A1A |
|
| | 1,692,188 | | | | 1.003 | | | | 12/25/46 | | | | 972,589 | |
| Sequoia Mortgage Trust Series 2003-4, Class 1A2 | |
| | 1,352,364 | | | | 0.728 | | | | 07/20/33 | | | | 1,269,339 | |
| Washington Mutual Mortgage Pass-Through Certificates
Series 2002-AR19, Class A7 |
|
| | 74,785 | | | | 2.491 | | | | 02/25/33 | | | | 74,304 | |
| | | | | | | | | | | | | | |
| | | | | | | | | | | | | 31,589,979 | |
| | |
| | Collateralized Mortgage Obligations – 1.4% | |
| | Interest Only(b)(e) – 0.0% | |
| CS First Boston Mortgage Securities Corp. Series 2002-AR31,
Class 5X |
|
| | 257,696 | | | | 0.000 | | | | 11/25/32 | | | | — | |
| CS First Boston Mortgage Securities Corp. Series 2003-AR18,
Class 2X |
|
| | 818,118 | | | | 0.000 | | | | 07/25/33 | | | | 1 | |
| CS First Boston Mortgage Securities Corp. Series 2003-AR20,
Class 2X |
|
| | 1,047,206 | | | | 0.000 | | | | 08/25/33 | | | | 1 | |
| | | | | | | | | | | | | | |
| | | | | | | | | | | | | 2 | |
| | |
| | Inverse Floaters(b) – 0.1% | |
| GNMA Series 2001-48, Class SA | |
| | 60,425 | | | | 25.895 | | | | 10/16/31 | | | | 89,070 | |
| GNMA Series 2001-51, Class SA | |
| | 116,428 | | | | 31.710 | | | | 10/16/31 | | | | 183,765 | |
| GNMA Series 2001-51, Class SB | |
| | 120,322 | | | | 25.895 | | | | 10/16/31 | | | | 185,595 | |
| GNMA Series 2002-13, Class SB | |
| | 151,414 | | | | 36.716 | | | | 02/16/32 | | | | 245,633 | |
| | | | | | | | | | | | | | |
| | | | | | | | | | | | | 704,063 | |
| | |
| | Mortgage-Backed Obligations – (continued) | |
| | Planned Amortization Class – 0.0% | |
| FHLMC REMIC Series 2639, Class UL | |
| 17,009 | | | | 4.750 | | | | 03/15/22 | | | | 17,275 | |
| FNMA REMIC Series 2003-134, Class ME | |
| | 67,723 | | | | 4.500 | | | | 06/25/33 | | | | 70,980 | |
| FNMA REMIC Series 2004-64, Class BA | |
| | 47,063 | | | | 5.000 | | | | 03/25/34 | | | | 48,701 | |
| | | | | | | | | | | | | | |
| | | | | | | | | | | | | 136,956 | |
| | |
| | Sequential Fixed Rate – 1.3% | |
| FNMA REMIC Series 2011-52, Class GB | |
| | 2,400,000 | | | | 5.000 | | | | 06/25/41 | | | | 2,631,894 | |
| FNMA REMIC Series 2011-99, Class DB | |
| | 2,125,000 | | | | 5.000 | | | | 10/25/41 | | | | 2,334,429 | |
| NCUA Guaranteed Notes Series 2010-C1, Class APT | |
| | 6,675,261 | | | | 2.650 | | | | 10/29/20 | | | | 6,832,130 | |
| NCUA Guaranteed Notes Series 2010-R1, Class 2A | |
| | 503,966 | | | | 1.840 | | | | 10/07/20 | | | | 509,242 | |
| NCUA Guaranteed Notes Series A4 | |
| | 3,500,000 | | | | 3.000 | | | | 06/12/19 | | | | 3,689,490 | |
| | | | | | | | | | | | | | |
| | | | | | | | | | | | | 15,997,185 | |
| | |
| TOTAL COLLATERALIZED
MORTGAGE OBLIGATIONS |
| | $ | 16,838,206 | |
| | |
| | Commercial Mortgage-Backed Securities – 5.8% | |
| | Sequential Fixed Rate – 2.8% | |
| FHLMC Multifamily Structured Pass-Through Certificates
Series K020, Class A2 |
|
| $ | 800,000 | | | | 2.373 | % | | | 05/25/22 | | | $ | 755,181 | |
| FHLMC Multifamily Structured Pass-Through Certificates
Series K027, Class A2 |
|
| | 11,400,000 | | | | 2.637 | | | | 01/25/23 | | | | 10,848,775 | |
| FHLMC Multifamily Structured Pass-Through Certificates
Series K030, Class A1 |
|
| | 1,495,540 | | | | 2.779 | | | | 09/25/22 | | | | 1,535,785 | |
| FHLMC Multifamily Structured Pass-Through Certificates
Series KSMC, Class A2 |
|
| | 3,300,000 | | | | 2.615 | | | | 01/25/23 | | | | 3,105,893 | |
| LB-UBS Commercial Mortgage Trust Series 2006-C1, Class A4 | |
| | 6,000,000 | | | | 5.156 | | | | 02/15/31 | | | | 6,453,855 | |
| Wachovia Bank Commercial Mortgage Trust Series 2007-C31,
Class A4 |
|
| | 9,000,000 | | | | 5.509 | | | | 04/15/47 | | | | 9,907,451 | |
| | | | | | | | | | | | | | |
| | | | | | | | | | | | | 32,606,940 | |
| | |
| | Sequential Floating Rate(b) – 3.0% | |
| Citigroup Commercial Mortgage Trust Series 2008-C7,
Class A1A |
|
| | 11,559,004 | | | | 6.250 | | | | 12/10/49 | | | | 13,163,971 | |
| FHLMC Multifamily Structured Pass-Through Certificates
Series K030, Class A2 |
|
| | 10,000,000 | | | | 3.250 | | | | 04/25/23 | | | | 9,971,452 | |
| LB Commercial Mortgage Trust Series 2007-C3, Class A1A | |
| | 11,545,846 | | | | 6.036 | | | | 07/15/44 | | | | 12,907,644 | |
| | | | | | | | | | | | | | |
| | | | | | | | | | | | | 36,043,067 | |
| | |
| TOTAL COMMERCIAL
MORTGAGE-BACKED SECURITIES |
| | $ | 68,650,007 | |
| | |
| | |
| The accompanying notes are an integral part of these financial statements. | | 35 |
GOLDMAN SACHS CORE FIXED INCOME FUND
Schedule of Investments (continued)
September 30, 2013 (Unaudited)
| | | | | | | | | | | | | | |
Principal
Amount | | | Interest
Rate | | | Maturity
Date | | | Value | |
| | Mortgage-Backed Obligations – (continued) | |
| | Federal Agencies – 27.9% | |
| | Adjustable Rate FNMA(b) – 1.0% | |
| $ | 13,111 | | | | 2.341 | % | | | 06/01/33 | | | $ | 13,848 | |
| | 2,044,134 | | | | 2.476 | | | | 07/01/34 | | | | 2,171,686 | |
| | 4,792,525 | | | | 2.395 | | | | 09/01/34 | | | | 5,056,205 | |
| | 3,684,841 | | | | 2.613 | | | | 05/01/35 | | | | 3,890,282 | |
| | 1,061,154 | | | | 2.108 | | | | 06/01/35 | | | | 1,100,961 | |
| | | | | | | | | | | | | | |
| | | | | | | | | | | | | 12,232,982 | |
| | |
| | FHLMC – 3.5% | |
| | 5,104 | | | | 6.500 | | | | 12/01/13 | | | | 5,122 | |
| | 181 | | | | 7.000 | | | | 10/01/14 | | | | 185 | |
| | 8,252 | | | | 6.000 | | | | 12/01/14 | | | | 8,296 | |
| | 1,445 | | | | 7.000 | | | | 05/01/15 | | | | 1,478 | |
| | 7,202 | | | | 8.000 | | | | 07/01/15 | | | | 7,447 | |
| | 3,296 | | | | 7.000 | | | | 02/01/16 | | | | 3,445 | |
| | 5,105 | | | | 7.000 | | | | 03/01/16 | | | | 5,176 | |
| | 98,942 | | | | 7.500 | | | | 05/01/16 | | | | 104,206 | |
| | 1,071 | | | | 5.000 | | | | 01/01/17 | | | | 1,135 | |
| | 8,983 | | | | 5.000 | | | | 02/01/17 | | | | 9,515 | |
| | 6,908 | | | | 5.000 | | | | 03/01/17 | | | | 7,317 | |
| | 814 | | | | 5.000 | | | | 04/01/17 | | | | 863 | |
| | 52,609 | | | | 5.000 | | | | 09/01/17 | | | | 55,722 | |
| | 131,637 | | | | 5.000 | | | | 10/01/17 | | | | 139,432 | |
| | 462 | | | | 7.000 | | | | 10/01/17 | | | | 493 | |
| | 82,894 | | | | 5.000 | | | | 11/01/17 | | | | 87,800 | |
| | 35,195 | | | | 5.000 | | | | 12/01/17 | | | | 37,278 | |
| | 50,882 | | | | 5.000 | | | | 01/01/18 | | | | 53,847 | |
| | 127,619 | | | | 5.000 | | | | 02/01/18 | | | | 134,913 | |
| | 92,557 | | | | 5.000 | | | | 03/01/18 | | | | 97,969 | |
| | 59,877 | | | | 5.000 | | | | 04/01/18 | | | | 63,438 | |
| | 36,942 | | | | 5.000 | | | | 05/01/18 | | | | 39,162 | |
| | 27,321 | | | | 5.000 | | | | 06/01/18 | | | | 28,948 | |
| | 59,135 | | | | 5.000 | | | | 07/01/18 | | | | 62,773 | |
| | 19,615 | | | | 5.000 | | | | 08/01/18 | | | | 20,805 | |
| | 91,235 | | | | 4.500 | | | | 09/01/18 | | | | 96,659 | |
| | 7,251 | | | | 5.000 | | | | 10/01/18 | | | | 7,712 | |
| | 14,903 | | | | 5.000 | | | | 11/01/18 | | | | 15,849 | |
| | 152,406 | | | | 5.000 | | | | 06/01/19 | | | | 162,450 | |
| | 191,148 | | | | 5.000 | | | | 05/01/23 | | | | 206,467 | |
| | 559,150 | | | | 4.500 | | | | 10/01/23 | | | | 593,918 | |
| | 66,216 | | | | 5.500 | | | | 10/01/25 | | | | 72,506 | |
| | 85,206 | | | | 5.500 | | | | 11/01/25 | | | | 93,300 | |
| | 18,228 | | | | 7.000 | | | | 06/01/26 | | | | 20,367 | |
| | 22,390 | | | | 7.500 | | | | 12/01/30 | | | | 24,751 | |
| | 32,683 | | | | 7.500 | | | | 01/01/31 | | | | 37,724 | |
| | 190,924 | | | | 3.500 | | | | 01/01/33 | | | | 197,651 | |
| | 1,086,049 | | | | 3.500 | | | | 07/01/33 | | | | 1,124,315 | |
| | 49,454 | | | | 5.000 | | | | 10/01/33 | | | | 53,459 | |
| | 128,765 | | | | 6.500 | | | | 10/01/33 | | | | 145,329 | |
| | 7,318 | | | | 5.000 | | | | 04/01/35 | | | | 7,910 | |
| | 69,255 | | | | 5.000 | | | | 07/01/35 | | | | 74,772 | |
| | 800,636 | | | | 5.000 | | | | 08/01/35 | | | | 862,102 | |
| | 184,961 | | | | 5.500 | | | | 11/01/35 | | | | 200,366 | |
| | 345,293 | | | | 5.000 | | | | 12/01/35 | | | | 373,752 | |
| | 773 | | | | 5.500 | | | | 02/01/36 | | | | 836 | |
| | 704,510 | | | | 5.000 | | | | 03/01/36 | | | | 758,596 | |
| | 180,707 | | | | 5.500 | | | | 06/01/36 | | | | 195,758 | |
| | |
| | Mortgage-Backed Obligations – (continued) | |
| | FHLMC – (continued) | |
| 89,301 | | | | 4.000 | | | | 08/01/36 | | | | 93,397 | |
| | 228,528 | | | | 4.000 | | | | 09/01/36 | | | | 239,008 | |
| | 262,478 | | | | 4.000 | | | | 10/01/36 | | | | 274,514 | |
| | 414,256 | | | | 4.000 | | | | 12/01/36 | | | | 433,254 | |
| | 1,779,873 | | | | 5.000 | | | | 02/01/37 | | | | 1,914,930 | |
| | 178,125 | | | | 5.500 | | | | 07/01/37 | | | | 192,433 | |
| | 185,852 | | | | 5.500 | | | | 08/01/37 | | | | 200,781 | |
| | 227,705 | | | | 5.500 | | | | 10/01/37 | | | | 245,995 | |
| | 703,194 | | | | 5.000 | | | | 01/01/38 | | | | 756,553 | |
| | 688,782 | | | | 5.000 | | | | 02/01/38 | | | | 741,411 | |
| | 159,422 | | | | 5.500 | | | | 02/01/38 | | | | 172,267 | |
| | 1,958,759 | | | | 5.000 | | | | 03/01/38 | | | | 2,109,157 | |
| | 416,403 | | | | 5.000 | | | | 04/01/38 | | | | 448,219 | |
| | 2,871,381 | | | | 5.000 | | | | 06/01/38 | | | | 3,090,778 | |
| | 478,359 | | | | 5.500 | | | | 07/01/38 | | | | 516,903 | |
| | 202,629 | | | | 5.500 | | | | 08/01/38 | | | | 218,956 | |
| | 1,260,090 | | | | 5.000 | | | | 09/01/38 | | | | 1,356,371 | |
| | 35,594 | | | | 6.500 | | | | 09/01/38 | | | | 39,514 | |
| | 151,000 | | | | 5.500 | | | | 11/01/38 | | | | 163,167 | |
| | 2,011,010 | | | | 5.000 | | | | 12/01/38 | | | | 2,163,611 | |
| | 155,990 | | | | 5.500 | | | | 12/01/38 | | | | 168,558 | |
| | 1,923,833 | | | | 5.000 | | | | 01/01/39 | | | | 2,073,691 | |
| | 173,824 | | | | 5.500 | | | | 01/01/39 | | | | 187,830 | |
| | 23,558 | | | | 5.000 | | | | 02/01/39 | | | | 25,358 | |
| | 507,117 | | | | 5.000 | | | | 06/01/39 | | | | 546,619 | |
| | 354,659 | | | | 4.500 | | | | 09/01/39 | | | | 380,303 | |
| | 233,621 | | | | 5.000 | | | | 08/01/40 | | | | 252,335 | |
| | 9,987,181 | | | | 5.500 | | | | 08/01/40 | | | | 10,791,890 | |
| | 383,119 | | | | 5.000 | | | | 09/01/40 | | | | 412,392 | |
| | 11,787 | | | | 4.500 | | | | 11/01/40 | | | | 12,551 | |
| | 104,120 | | | | 4.500 | | | | 03/01/41 | | | | 110,883 | |
| | 43,979 | | | | 5.000 | | | | 04/01/41 | | | | 48,165 | |
| | 63,783 | | | | 5.000 | | | | 06/01/41 | | | | 69,854 | |
| | 1,513,433 | | | | 4.000 | | | | 11/01/41 | | | | 1,582,475 | |
| | 1,983,986 | | | | 4.000 | | | | 12/01/41 | | | | 2,079,620 | |
| | 944,347 | | | | 3.500 | | | | 07/01/42 | | | | 960,356 | |
| | | | | | | | | | | | | | |
| | | | | | | | | | | | | 41,377,413 | |
| | |
| | FNMA – 18.6% | |
| | 1,053,599 | | | | 7.040 | | | | 08/01/15 | | | | 1,132,572 | |
| | 50,733 | | | | 8.500 | | | | 10/01/15 | | | | 53,552 | |
| | 1,840 | | | | 7.000 | | | | 01/01/16 | | | | 1,920 | |
| | 4,756,066 | | | | 2.800 | | | | 03/01/18 | | | | 4,965,968 | |
| | 2,904,165 | | | | 3.740 | | | | 05/01/18 | | | | 3,146,337 | |
| | 3,480,000 | | | | 3.840 | | | | 05/01/18 | | | | 3,771,438 | |
| | 664,304 | | | | 4.500 | | | | 05/01/18 | | | | 706,160 | |
| | 1,316,790 | | | | 4.500 | | | | 06/01/18 | | | | 1,399,759 | |
| | 84,051 | | | | 5.000 | | | | 06/01/18 | | | | 89,234 | |
| | 861,712 | | | | 4.500 | | | | 07/01/18 | | | | 916,006 | |
| | 678,388 | | | | 4.500 | | | | 08/01/18 | | | | 721,131 | |
| | 8,823 | | | | 6.000 | | | | 08/01/18 | | | | 9,633 | |
| | 1,349 | | | | 6.500 | | | | 10/01/18 | | | | 1,491 | |
| | 9,000,000 | | | | 4.506 | | | | 06/01/19 | | | | 9,927,820 | |
| | 2,209,431 | | | | 3.416 | | | | 10/01/20 | | | | 2,314,808 | |
| | 1,635,070 | | | | 3.632 | | | | 12/01/20 | | | | 1,729,051 | |
| | 9,954,367 | | | | 3.763 | | | | 12/01/20 | | | | 10,615,228 | |
| | 4,149,262 | | | | 4.375 | | | | 06/01/21 | | | | 4,541,901 | |
| | |
| | |
| 36 | | The accompanying notes are an integral part of these financial statements. |
GOLDMAN SACHS CORE FIXED INCOME FUND
| | | | | | | | | | | | | | |
Principal
Amount | | | Interest
Rate | | | Maturity
Date | | | Value | |
| | Mortgage-Backed Obligations – (continued) | |
| | FNMA – (continued) | |
| $ | 4,135,484 | | | | 5.000 | % | | | 03/01/23 | | | $ | 4,482,695 | |
| | 311,967 | | | | 5.500 | | | | 09/01/23 | | | | 336,708 | |
| | 88,912 | | | | 5.500 | | | | 10/01/23 | | | | 96,170 | |
| | 921,652 | | | | 5.000 | | | | 02/01/24 | | | | 978,665 | |
| | 308,201 | | | | 5.000 | | | | 12/01/25 | | | | 333,944 | |
| | 112,661 | | | | 7.000 | | | | 08/01/27 | | | | 123,857 | |
| | 3,538 | | | | 6.500 | | | | 09/01/27 | | | | 3,917 | |
| | 522,420 | | | | 7.000 | | | | 03/01/28 | | | | 597,365 | |
| | 5,598 | | | | 6.500 | | | | 05/01/28 | | | | 6,199 | |
| | 1,288 | | | | 5.500 | | | | 01/01/29 | | | | 1,403 | |
| | 19,862 | | | | 8.000 | | | | 02/01/31 | | | | 24,273 | |
| | 178,672 | | | | 7.000 | | | | 03/01/31 | | | | 202,387 | |
| | 10,918 | | | | 5.500 | | | | 02/01/33 | | | | 11,946 | |
| | 235,533 | | | | 5.500 | | | | 03/01/33 | | | | 257,697 | |
| | 322,234 | | | | 5.500 | | | | 05/01/33 | | | | 353,763 | |
| | 443,823 | | | | 5.500 | | | | 06/01/33 | | | | 487,375 | |
| | 106,009 | | | | 5.000 | | | | 07/01/33 | | | | 115,539 | |
| | 655,521 | | | | 5.500 | | | | 07/01/33 | | | | 719,821 | |
| | 112,655 | | | | 5.000 | | | | 08/01/33 | | | | 122,680 | |
| | 83,675 | | | | 5.500 | | | | 08/01/33 | | | | 91,575 | |
| | 651,493 | | | | 5.000 | | | | 09/01/33 | | | | 711,658 | |
| | 209,629 | | | | 5.500 | | | | 09/01/33 | | | | 229,404 | |
| | 6,904 | | | | 6.500 | | | | 09/01/33 | | | | 7,751 | |
| | 2,806 | | | | 5.500 | | | | 10/01/33 | | | | 3,067 | |
| | 40,494 | | | | 5.500 | | | | 11/01/33 | | | | 44,269 | |
| | 40,186 | | | | 5.000 | | | | 12/01/33 | | | | 43,897 | |
| | 8,667 | | | | 5.500 | | | | 12/01/33 | | | | 9,483 | |
| | 14,924 | | | | 5.500 | | | | 01/01/34 | | | | 16,312 | |
| | 32,093 | | | | 5.500 | | | | 02/01/34 | | | | 35,053 | |
| | 3,219 | | | | 5.500 | | | | 03/01/34 | | | | 3,520 | |
| | 4,776 | | | | 5.500 | | | | 04/01/34 | | | | 5,217 | |
| | 642,959 | | | | 5.500 | | | | 05/01/34 | | | | 703,703 | |
| | 9,622 | | | | 5.000 | | | | 06/01/34 | | | | 10,442 | |
| | 25,056 | | | | 5.500 | | | | 07/01/34 | | | | 27,392 | |
| | 8,250 | | | | 5.000 | | | | 08/01/34 | | | | 8,954 | |
| | 13,107 | | | | 5.500 | | | | 08/01/34 | | | | 14,369 | |
| | 4,277 | | | | 5.000 | | | | 10/01/34 | | | | 4,642 | |
| | 19,741 | | | | 5.500 | | | | 10/01/34 | | | | 21,710 | |
| | 39,320 | | | | 5.500 | | | | 11/01/34 | | | | 43,247 | |
| | 190,923 | | | | 5.500 | | | | 12/01/34 | | | | 208,539 | |
| | 706 | | | | 6.000 | | | | 12/01/34 | | | | 778 | |
| | 329,004 | | | | 5.000 | | | | 04/01/35 | | | | 357,728 | |
| | 15,180 | | | | 5.500 | | | | 04/01/35 | | | | 16,581 | |
| | 15,087 | | | | 5.500 | | | | 07/01/35 | | | | 16,466 | |
| | 600 | | | | 5.500 | | | | 08/01/35 | | | | 655 | |
| | 41,511 | | | | 5.500 | | | | 09/01/35 | | | | 45,320 | |
| | 30,599 | | | | 5.500 | | | | 11/01/35 | | | | 33,442 | |
| | 2,865 | | | | 5.500 | | | | 12/01/35 | | | | 3,130 | |
| | 4,076 | | | | 5.500 | | | | 01/01/36 | | | | 4,455 | |
| | 28,957 | | | | 5.500 | | | | 02/01/36 | | | | 31,644 | |
| | 1,351,629 | | | | 5.500 | | | | 03/01/36 | | | | 1,476,414 | |
| | 49,140 | | | | 6.000 | | | | 03/01/36 | | | | 54,034 | |
| | 19,402 | | | | 5.500 | | | | 04/01/36 | | | | 21,194 | |
| | 11,760 | | | | 6.000 | | | | 04/01/36 | | | | 12,936 | |
| | 86,793 | | | | 4.000 | | | | 08/01/36 | | | | 91,082 | |
| | 264,944 | | | | 4.000 | | | | 09/01/36 | | | | 278,036 | |
| | |
| | Mortgage-Backed Obligations – (continued) | |
| | FNMA – (continued) | |
| 5,931 | | | | 5.500 | | | | 01/01/37 | | | | 6,457 | |
| | 11,225 | | | | 6.000 | | | | 01/01/37 | | | | 12,344 | |
| | 96,368 | | | | 4.000 | | | | 02/01/37 | | | | 101,205 | |
| | 2,310 | | | | 5.500 | | | | 02/01/37 | | | | 2,515 | |
| | 57,376 | | | | 4.000 | | | | 03/01/37 | | | | 60,221 | |
| | 4,401 | | | | 5.500 | | | | 04/01/37 | | | | 4,792 | |
| | 6,922 | | | | 5.500 | | | | 05/01/37 | | | | 7,531 | |
| | 2,152 | | | | 5.500 | | | | 06/01/37 | | | | 2,343 | |
| | 2,462 | | | | 5.500 | | | | 07/01/37 | | | | 2,676 | |
| | 14,831 | | | | 5.000 | | | | 08/01/37 | | | | 16,096 | |
| | 151 | | | | 5.500 | | | | 08/01/37 | | | | 164 | |
| | 825 | | | | 5.500 | | | | 12/01/37 | | | | 899 | |
| | 8,415 | | | | 5.500 | | | | 01/01/38 | | | | 9,240 | |
| | 30,328 | | | | 5.000 | | | | 02/01/38 | | | | 32,237 | |
| | 2,480 | | | | 5.500 | | | | 02/01/38 | | | | 2,701 | |
| | 13,814 | | | | 5.500 | | | | 03/01/38 | | | | 15,029 | |
| | 2,471 | | | | 5.500 | | | | 05/01/38 | | | | 2,692 | |
| | 18,665 | | | | 5.500 | | | | 06/01/38 | | | | 20,308 | |
| | 12,604 | | | | 5.500 | | | | 07/01/38 | | | | 13,722 | |
| | 6,301 | | | | 5.500 | | | | 08/01/38 | | | | 6,849 | |
| | 5,265 | | | | 5.500 | | | | 09/01/38 | | | | 5,723 | |
| | 8,812 | | | | 5.500 | | | | 12/01/38 | | | | 9,692 | |
| | 96,093 | | | | 4.500 | | | | 04/01/39 | | | | 103,273 | |
| | 24,637 | | | | 4.500 | | | | 05/01/39 | | | | 26,478 | |
| | 33,391 | | | | 5.500 | | | | 06/01/39 | | | | 36,288 | |
| | 22,434 | | | | 4.500 | | | | 07/01/39 | | | | 24,117 | |
| | 189,772 | | | | 4.500 | | | | 08/01/39 | | | | 204,011 | |
| | 110,164 | | | | 4.500 | | | | 10/01/39 | | | | 118,431 | |
| | 135,413 | | | | 4.500 | | | | 11/01/39 | | | | 145,575 | |
| | 29,858 | | | | 5.500 | | | | 11/01/39 | | | | 32,454 | |
| | 1,070,659 | | | | 4.500 | | | | 12/01/39 | | | | 1,151,004 | |
| | 177,639 | | | | 5.000 | | | | 08/01/40 | | | | 193,401 | |
| | 1,823,258 | | | | 4.000 | | | | 09/01/40 | | | | 1,912,895 | |
| | 1,070,142 | | | | 4.500 | | | | 04/01/41 | | | | 1,144,733 | |
| | 1,539,455 | | | | 4.500 | | | | 07/01/41 | | | | 1,646,447 | |
| | 362,707 | | | | 4.500 | | | | 08/01/41 | | | | 387,988 | |
| | 1,801,754 | | | | 4.500 | | | | 09/01/41 | | | | 1,927,083 | |
| | 478,544 | | | | 4.500 | | | | 10/01/41 | | | | 511,898 | |
| | 2,350,696 | | | | 3.000 | | | | 08/01/42 | | | | 2,300,286 | |
| | 2,070,856 | | | | 3.000 | | | | 09/01/42 | | | | 2,026,808 | |
| | 346,931 | | | | 3.000 | | | | 10/01/42 | | | | 339,558 | |
| | 1,454,968 | | | | 3.000 | | | | 11/01/42 | | | | 1,423,934 | |
| | 13,694,531 | | | | 3.000 | | | | 12/01/42 | | | | 13,401,088 | |
| | 10,095,429 | | | | 3.000 | | | | 01/01/43 | | | | 9,880,778 | |
| | 4,083,151 | | | | 3.000 | | | | 02/01/43 | | | | 3,996,025 | |
| | 9,924,350 | | | | 2.500 | | | | 03/01/43 | | | | 9,231,595 | |
| | 2,415,063 | | | | 3.000 | | | | 03/01/43 | | | | 2,363,556 | |
| | 994,109 | | | | 2.500 | | | | 04/01/43 | | | | 924,717 | |
| | 3,213,270 | | | | 3.000 | | | | 04/01/43 | | | | 3,144,798 | |
| | 1,932,593 | | | | 3.000 | | | | 05/01/43 | | | | 1,891,333 | |
| | 190,993 | | | | 3.000 | | | | 06/01/43 | | | | 186,935 | |
| | 1,641,285 | | | | 3.000 | | | | 07/01/43 | | | | 1,606,408 | |
| | 11,000,000 | | | | 2.500 | | | | TBA-15yr | (f) | | | 11,067,891 | |
| | 14,000,000 | | | | 3.000 | | | | TBA-30yr | (f) | | | 13,681,718 | |
| | 28,000,000 | | | | 4.000 | | | | TBA-30yr | (f) | | | 29,369,374 | |
| | |
| | |
| The accompanying notes are an integral part of these financial statements. | | 37 |
GOLDMAN SACHS CORE FIXED INCOME FUND
Schedule of Investments (continued)
September 30, 2013 (Unaudited)
| | | | | | | | | | | | | | |
Principal
Amount | | | Interest
Rate | | | Maturity
Date | | | Value | |
| | | | | | | | | | | | | | |
| | Mortgage-Backed Obligations – (continued) | |
| | FNMA – (continued) | |
| $ | 33,000,000 | | | | 6.000 | % | | | TBA-30yr | (f) | | $ | 36,104,062 | |
| | 6,000,000 | | | | 5.500 | | | | TBA-30yr | (f) | | | 6,542,813 | |
| | | | | | | | | | | | | | |
| | | | | | | | | | | | | 219,373,701 | |
| | |
| | GNMA – 4.8% | |
| | 1,513,521 | | | | 3.950 | | | | 07/15/25 | | | | 1,594,179 | |
| | 24,931 | | | | 6.000 | | | | 11/15/38 | | | | 27,663 | |
| | 11,787,897 | | | | 2.500 | | | | 12/15/42 | | | | 10,991,535 | |
| | 4,903,324 | | | | 2.500 | | | | 12/20/42 | | | | 4,569,894 | |
| | 289,144 | | | | 2.500 | | | | 01/15/43 | | | | 269,620 | |
| | 5,016,393 | | | | 2.500 | | | | 02/15/43 | | | | 4,679,330 | |
| | 4,094,674 | | | | 2.500 | | | | 03/15/43 | | | | 3,818,237 | |
| | 3,946,472 | | | | 2.500 | | | | 03/20/43 | | | | 3,677,918 | |
| | 296,951 | | | | 2.500 | | | | 04/15/43 | | | | 276,903 | |
| | 2,129,912 | | | | 2.500 | | | | 05/15/43 | | | | 1,986,119 | |
| | 1,261,147 | | | | 2.500 | | | | 08/15/43 | | | | 1,176,005 | |
| | 11,000,000 | | | | 4.000 | | | | TBA-30yr | (f) | | | 11,618,750 | |
| | 2,000,000 | | | | 4.500 | | | | TBA-30yr | (f) | | | 2,155,312 | |
| | 9,000,000 | | | | 5.000 | | | | TBA-30yr | (f) | | | 9,780,469 | |
| | | | | | | | | | | | | | |
| | | | | | | | | | | | | 56,621,934 | |
| | |
| | TOTAL FEDERAL AGENCIES | | | $ | 329,606,030 | |
| | |
| | TOTAL MORTGAGE-BACKED OBLIGATIONS | |
| | (Cost $440,852,736) | | | $ | 446,684,222 | |
| | |
| | | | | | | | | | | | | | |
| | Agency Debentures – 6.5% | |
| FHLB | |
| $ | 6,800,000 | | | | 2.125 | % | | | 06/09/23 | | | $ | 6,072,991 | |
| | 3,300,000 | | | | 3.250 | | | | 06/09/23 | | | | 3,338,089 | |
| | 2,400,000 | | | | 5.000 | | | | 09/28/29 | | | | 2,684,561 | |
| FHLMC | |
| EUR | 3,100,000 | | | | 4.375 | | | | 01/15/14 | | | | 4,240,763 | |
| $ | 9,100,000 | | | | 0.875 | | | | 03/07/18 | | | | 8,893,143 | |
| | 7,300,000 | | | | 1.250 | | | | 10/02/19 | | | | 6,979,329 | |
| | 9,500,000 | | | | 2.375 | | | | 01/13/22 | | | | 9,245,026 | |
| FNMA | |
| | 9,700,000 | | | | 1.875 | | | | 09/18/18 | | | | 9,817,256 | |
| | 4,200,000 | | | | 6.250 | | | | 05/15/29 | | | | 5,405,412 | |
| Kommunalbanken AS(c) | |
| | 3,000,000 | | | | 1.000 | | | | 09/26/17 | | | | 2,951,610 | |
| Private Export Funding Corp. | |
| | 7,000,000 | | | | 5.450 | | | | 09/15/17 | | | | 8,178,380 | |
| Small Business Administration | |
| | 92,863 | | | | 6.300 | | | | 06/01/18 | | | | 99,301 | |
| Tennessee Valley Authority | |
| | 7,200,000 | | | | 1.750 | | | | 10/15/18 | | | | 7,187,121 | |
| | 1,400,000 | | | | 4.625 | | | | 09/15/60 | | | | 1,325,365 | |
| | |
| | TOTAL AGENCY DEBENTURES | |
| | (Cost $77,937,774) | | | $ | 76,418,347 | |
| | |
| | | | | | | | | | | | | | |
| | Asset-Backed Securities(b) – 2.2% | |
| | Home Equity – 0.5% | |
| Countrywide Home Equity Loan Trust Series 2004-G, Class 2A | |
| $ | 301,900 | | | | 0.402 | % | | | 12/15/29 | | | $ | 257,301 | |
| | |
| | | | | | | | | | | | | | |
| | Asset-Backed Securities(b) – (continued) | |
| | Home Equity – (continued) | |
| Countrywide Home Equity Loan Trust Series 2006-HW,
Class 2A1B |
|
| 7,403,813 | | | | 0.332 | | | | 11/15/36 | | | | 6,137,668 | |
| Impac CMB Trust Series 2004-08, Class 1A | |
| | 455,184 | | | | 0.899 | | | | 10/25/34 | | | | 375,419 | |
| | | | | | | | | | | | | | |
| | | | | | | | | | | | | 6,770,388 | |
| | |
| | Student Loan – 1.7% | |
| Brazos Higher Education Authority, Inc. Series 2004-1, Class A2 | |
| | 3,814,733 | | | | 0.411 | | | | 06/27/22 | | | | 3,805,663 | |
| Brazos Higher Education Authority, Inc. Series 2005-1,
Class 1A2 |
|
| | 1,193,500 | | | | 0.331 | | | | 12/26/18 | | | | 1,192,032 | |
| Brazos Higher Education Authority, Inc. Series 2005-3,
Class A14 |
|
| | 242,210 | | | | 0.361 | | | | 09/25/23 | | | | 241,896 | |
| College Loan Corp. Trust Series 2004-1, Class A4 | |
| | 3,000,000 | | | | 0.456 | | | | 04/25/24 | | | | 2,847,097 | |
| Education Funding Capital Trust I Series 2004-1, Class A2 | |
| | 1,022,252 | | | | 0.414 | | | | 12/15/22 | | | | 1,020,013 | |
| Educational Funding of the South, Inc. Series 2011-1, Class A2 | |
| | 5,200,000 | | | | 0.916 | | | | 04/25/35 | | | | 5,168,897 | |
| EFS Volunteer No 3 LLC Series 2012-1, Class A2(c) | |
| | 4,750,000 | | | | 1.184 | | | | 02/25/25 | | | | 4,809,270 | |
| Northstar Education Finance, Inc. Series 2005-1, Class A1 | |
| | 281,305 | | | | 0.364 | | | | 10/28/26 | | | | 280,042 | |
| US Education Loan Trust LLC Series 2006-1, Class A2(c) | |
| | 511,376 | | | | 0.390 | | | | 03/01/25 | | | | 509,628 | |
| | | | | | | | | | | | | | |
| | | | | | | | | | | | | 19,874,538 | |
| | |
| | TOTAL ASSET-BACKED SECURITIES | |
| | (Cost $27,838,677) | | | $ | 26,644,926 | |
| | |
| | | | | | | | | | | | | | |
| | Foreign Debt Obligations – 3.3% | |
| | Sovereign – 2.2% | |
| Republic of Chile | |
| $ | 2,240,000 | | | | 3.625 | % | | | 10/30/42 | | | $ | 1,825,600 | |
| Republic of Colombia | |
| | 2,184,000 | | | | 4.375 | | | | 07/12/21 | | | | 2,254,980 | |
| | 2,900,000 | | | | 4.000 | | | | 02/26/24 | | | | 2,827,500 | |
| Republic of Indonesia | |
| | 470,000 | | | | 6.125 | (c) | | | 03/15/19 | | | | 485,862 | |
| | 980,000 | | | | 5.375 | (c) | | | 10/17/23 | | | | 975,100 | |
| | 1,960,000 | | | | 8.500 | | | | 10/12/35 | | | | 2,376,500 | |
| Republic of Panama | |
| | 120,000 | | | | 7.125 | | | | 01/29/26 | | | | 145,200 | |
| Republic of Slovenia | |
| | 1,300,000 | | | | 5.500 | (c) | | | 10/26/22 | | | | 1,212,250 | |
| | 1,480,000 | | | | 5.500 | | | | 10/26/22 | | | | 1,380,100 | |
| Republic of Turkey | |
| | 880,000 | | | | 5.625 | | | | 03/30/21 | | | | 919,600 | |
| | 2,540,000 | | | | 6.250 | | | | 09/26/22 | | | | 2,727,325 | |
| Russian Federation(c) | |
| | 4,800,000 | | | | 4.875 | | | | 09/16/23 | | | | 4,920,000 | |
| | |
| | |
| 38 | | The accompanying notes are an integral part of these financial statements. |
GOLDMAN SACHS CORE FIXED INCOME FUND
| | | | | | | | | | | | | | |
Principal
Amount | | | Interest
Rate | | | Maturity
Date | | | Value | |
| | | | | | | | | | | | | | |
| | Foreign Debt Obligations – (continued) | |
| | Sovereign – (continued) | |
| United Mexican States | |
| $ | 4,050,000 | | | | 4.750 | % | | | 03/08/44 | | | $ | 3,665,250 | |
| | | | | | | | | | | | | | |
| | | | | | | | | | | | | 25,715,267 | |
| | |
| | Supranational – 1.1% | |
| Inter-American Development Bank | |
| | 2,700,000 | | | | 1.000 | | | | 02/27/18 | | | | 2,623,976 | |
| International Finance Corp. | |
| | 10,800,000 | | | | 0.875 | | | | 06/15/18 | | | | 10,485,267 | |
| | | | | | | | | | | | | | |
| | | | | | | | | | | | | 13,109,243 | |
| | |
| | TOTAL FOREIGN DEBT OBLIGATIONS | |
| | (Cost $40,952,969) | | | $ | 38,824,510 | |
| | |
| | | | | | | | | | | | | | |
| | Municipal Debt Obligations – 2.6% | |
| | California – 0.9% | |
| California State GO Bonds (Refunding-Various Purposes)
Series 2013 |
|
| $ | 705,000 | | | | 5.000 | % | | | 09/01/28 | | | $ | 767,012 | |
| | 350,000 | | | | 5.000 | | | | 09/01/31 | | | | 372,498 | |
| | 670,000 | | | | 5.000 | | | | 09/01/32 | | | | 708,605 | |
| | 395,000 | | | | 5.000 | | | | 09/01/33 | | | | 417,436 | |
| California State GO Bonds (Various Purposes) Series 2013 | |
| | 415,000 | | | | 5.000 | | | | 09/01/27 | | | | 455,795 | |
| | 380,000 | | | | 5.000 | | | | 04/01/37 | | | | 393,064 | |
| | 1,140,000 | | | | 5.000 | | | | 04/01/43 | | | | 1,166,824 | |
| California State GO Bonds Build America Taxable Series 2009 | |
| | 950,000 | | | | 7.500 | | | | 04/01/34 | | | | 1,205,607 | |
| | 1,650,000 | | | | 7.550 | | | | 04/01/39 | | | | 2,147,475 | |
| California State GO Bonds Build America Taxable Series 2010 | |
| | 1,645,000 | | | | 7.950 | | | | 03/01/36 | | | | 1,904,680 | |
| California State University Systemwide RB Series 2012 A | |
| | 350,000 | | | | 5.000 | | | | 11/01/42 | | | | 361,067 | |
| City of Los Angeles CA Department of Water & Power RB
(Power System) Series 2012 B |
|
| | 300,000 | | | | 5.000 | | | | 07/01/43 | | | | 307,452 | |
| City of Los Angeles CA Department of Water & Power RB
Series 2012 B |
|
| | 595,000 | | | | 5.000 | | | | 07/01/43 | | | | 621,079 | |
| | | | | | | | | | | | | | |
| | | | | | | | | | | | | 10,828,594 | |
| | |
| | Florida – 0.1% | |
| Miami-Dade County FL Transit System Sales Surtax RB (Sales
Tax) Series 2012 |
|
| | 355,000 | | | | 5.000 | | | | 07/01/42 | | | | 360,502 | |
| Tampa Bay Water Regional Utility System Authority RB
Series 2013 |
|
| | 280,000 | | | | 5.000 | | | | 10/01/38 | | | | 293,006 | |
| | | | | | | | | | | | | | |
| | | | | | | | | | | | | 653,508 | |
| | |
| | Georgia – 0.1% | |
| DeKalb County GA Water & Sewerage RB Series 2011 A | |
| | 250,000 | | | | 5.250 | | | | 10/01/41 | | | | 257,563 | |
| | |
| | | | | | | | | | | | | | |
| | Municipal Debt Obligations – (continued) | |
| | Georgia – (continued) | |
| Private Colleges & Universities GA Authority RB (Emory
University) Series 2013 A |
|
| 1,035,000 | | | | 5.000 | | | | 10/01/43 | | | | 1,099,408 | |
| | | | | | | | | | | | | | |
| | | | | | | | | | | | | 1,356,971 | |
| | |
| | Illinois – 0.2% | |
| Illinois State GO Bonds Build America Series 2010 | |
| | 1,280,000 | | | | 7.350 | | | | 07/01/35 | | | | 1,361,024 | |
| Metropolitan Pier & Exposition Authority Dedicated State Tax
RB (Mccormick Place Expansion) Series 2010 A |
|
| | 490,000 | | | | 5.500 | | | | 06/15/50 | | | | 498,188 | |
| | | | | | | | | | | | | | |
| | | | | | | | | | | | | 1,859,212 | |
| | |
| | Louisiana – 0.0% | |
| Louisiana State Gas & Fuels Tax RB (Second Lien) Series 2010 B | |
| | 265,000 | | | | 5.000 | | | | 05/01/45 | | | | 272,767 | |
| | |
| | Massachusetts – 0.1% | |
| Massachusetts State Consolidated Loan GO Bonds Series 2013 E | |
| | 465,000 | | | | 5.000 | | | | 08/01/40 | | | | 488,306 | |
| Massachusetts State Development Finance Agency RB (Williams
College) Series 2013 P |
|
| | 285,000 | | | | 5.000 | | | | 07/01/43 | | | | 300,262 | |
| Massachusetts State School Building Authority Sales Tax RB
(Senior) Series 2011 B |
|
| | 280,000 | | | | 5.000 | | | | 10/15/41 | | | | 292,418 | |
| | | | | | | | | | | | | | |
| | | | | | | | | | | | | 1,080,986 | |
| | |
| | Missouri – 0.0% | |
| Metropolitan St. Louis MO Sewer District Wastewater System
RB Series 2012 A |
|
| | 310,000 | | | | 5.000 | | | | 05/01/42 | | | | 327,242 | |
| | |
| | New Jersey – 0.1% | |
| New Jersey State Economic Development Authority RB (Rutgers
University) Series 2013 |
|
| | 270,000 | | | | 5.000 | | | | 06/15/46 | | | | 276,445 | |
| New Jersey State Transportation Trust Fund Authority RB
(Transportation Program) Series 2013 AA |
|
| | 325,000 | | | | 5.000 | | | | 06/15/36 | | | | 333,522 | |
| | 325,000 | | | | 5.500 | | | | 06/15/39 | | | | 347,132 | |
| | 350,000 | | | | 5.000 | | | | 06/15/44 | | | | 354,539 | |
| | | | | | | | | | | | | | |
| | | | | | | | | | | | | 1,311,638 | |
| | |
| | New York – 0.7% | |
| New York City GO Bonds (Refunding) Series 2012 B | |
| | 305,000 | | | | 5.000 | | | | 08/01/24 | | | | 349,189 | |
| New York City GO Bonds (Refunding) Series 2012 F | |
| | 265,000 | | | | 5.000 | | | | 08/01/24 | | | | 301,485 | |
| New York City GO Bonds (Refunding) Series 2012 I | |
| | 265,000 | | | | 5.000 | | | | 08/01/24 | | | | 303,393 | |
| New York City GO Bonds (Refunding) Series 2013 I | |
| | 260,000 | | | | 5.000 | | | | 08/01/25 | | | | 296,361 | |
| New York City GO Bonds (Refunding) Series 2013 J | |
| | 300,000 | | | | 5.000 | | | | 08/01/24 | | | | 347,685 | |
| | 290,000 | | | | 5.000 | | | | 08/01/25 | | | | 331,864 | |
| New York City GO Bonds Series 2013 D | |
| | 260,000 | | | | 5.000 | | | | 08/01/24 | | | | 299,512 | |
| | |
| | |
| The accompanying notes are an integral part of these financial statements. | | 39 |
GOLDMAN SACHS CORE FIXED INCOME FUND
Schedule of Investments (continued)
September 30, 2013 (Unaudited)
| | | | | | | | | | | | | | |
Principal
Amount | | | Interest
Rate | | | Maturity
Date | | | Value | |
| | | | | | | | | | | | | | |
| | Municipal Debt Obligations – (continued) | |
| | New York – (continued) | |
| New York City Transitional Finance Authority RB (Future Tax
Secured) Series 2012 E-1 |
|
| $ | 270,000 | | | | 5.000 | % | | | 02/01/42 | | | $ | 279,844 | |
| New York City Water & Sewer System Finance Authority RB
(Refunding) Series 2012 CC |
|
| | 270,000 | | | | 5.000 | | | | 06/15/45 | | | | 278,594 | |
| New York City Water & Sewer System Finance Authority RB
(Second General) Series 2012 BB |
|
| | 880,000 | | | | 5.000 | | | | 06/15/47 | | | | 907,439 | |
| New York City Water & Sewer System Finance Authority RB
(Second General) Series 2013 CC |
|
| | 805,000 | | | | 5.000 | | | | 06/15/47 | | | | 831,187 | |
| New York City Water & Sewer System Finance Authority RB
Series 2013 EE |
|
| | 815,000 | | | | 5.000 | | | | 06/15/47 | | | | 841,512 | |
| New York State Dormitory Authority Personal Income Tax RB
(General Purpose) Series 2013 A |
|
| | 355,000 | | | | 5.000 | | | | 02/15/43 | | | | 368,976 | |
| New York State Urban Development Corp. RB (Personal Income
Tax) Series 2011 A |
|
| | 260,000 | | | | 5.000 | | | | 03/15/35 | | | | 273,351 | |
| | 280,000 | | | | 5.000 | | | | 03/15/36 | | | | 293,465 | |
| New York State Urban Development Corp. RB (Personal Income
Tax) Series 2013 C |
|
| | 550,000 | | | | 5.000 | | | | 03/15/30 | | | | 599,698 | |
| | 575,000 | | | | 5.000 | | | | 03/15/31 | | | | 623,162 | |
| | 630,000 | | | | 5.000 | | | | 03/15/32 | | | | 679,159 | |
| | | | | | | | | | | | | | |
| | | | | | | | | | | | | 8,205,876 | |
| | |
| | Ohio – 0.2% | |
| American Municipal Power-Ohio, Inc. RB Build America
Taxable Series 2010 |
|
| | 1,700,000 | | | | 6.270 | | | | 02/15/50 | | | | 1,750,218 | |
| Ohio State Turnpike Commission RB (Junior Lien-Infrastructure
Projects) Series 2013 A-1 |
|
| | 550,000 | | | | 5.000 | | | | 02/15/48 | | | | 555,296 | |
| Ohio State Turnpike Commission RB (Senior Lien) Series 2013 A | |
| | 265,000 | | | | 5.000 | | | | 02/15/48 | | | | 272,370 | |
| | | | | | | | | | | | | | |
| | | | | | | | | | | | | 2,577,884 | |
| | |
| | Pennsylvania – 0.0% | |
| Pennsylvania State Turnpike Commission RB Series 2013 C | |
| | 250,000 | | | | 5.000 | | | | 12/01/43 | | | | 253,365 | |
| | |
| | Texas – 0.0% | |
| Dallas-Fort Worth TX International Airport RB (Improvement)
Series 2013 B |
|
| | 265,000 | | | | 5.000 | | | | 11/01/44 | | | | 261,285 | |
| North Texas Tollway Authority RB (Special Projects System)
Series 2011 A |
|
| | 250,000 | | | | 5.500 | | | | 09/01/41 | | | | 269,580 | |
| | | | | | | | | | | | | | |
| | | | | | | | | | | | | 530,865 | |
| | |
| | Washington – 0.2% | |
| University of Washington RB (General) Series 2013 | |
| | 295,000 | | | | 5.000 | | | | 07/01/41 | | | | 308,647 | |
| | |
| | | | | | | | | | | | | | |
| | Municipal Debt Obligations – (continued) | |
| | Washington – (continued) | |
| Washington State GO Bonds (Motor Vehicle Fuel Tax)
Series 2013 B |
|
| 250,000 | | | | 5.000 | | | | 08/01/33 | | | | 268,455 | |
| | 250,000 | | | | 5.000 | | | | 08/01/34 | | | | 265,955 | |
| Washington State GO Bonds (Various Purpose) Series 2013 A | |
| | 250,000 | | | | 5.000 | | | | 08/01/33 | | | | 268,455 | |
| Washington State GO Bonds (Various Purposes) Series 2013 A | |
| | 250,000 | | | | 5.000 | | | | 08/01/34 | | | | 265,955 | |
| | 375,000 | | | | 5.000 | | | | 08/01/35 | | | | 397,072 | |
| | | | | | | | | | | | | | |
| | | | | | | | | | | | | 1,774,539 | |
| | |
| | TOTAL MUNICIPAL DEBT OBLIGATIONS | |
| | (Cost $29,495,936) | | | $ | 31,033,447 | |
| | |
| | | | | | | | | | | | | | |
| | Government Guarantee Obligations – 1.6% | |
| Achmea Hypotheekbank NV(c)(g) | |
| | $ 571,000 | | | | 3.200 | % | | | 11/03/14 | | | $ | 588,313 | |
| Israel Government AID Bond(h) | |
| | 7,827,000 | | | | 5.500 | | | | 09/18/23 | | | | 9,330,876 | |
| | 600,000 | | | | 5.500 | | | | 12/04/23 | | | | 717,264 | |
| | 2,400,000 | | | | 5.500 | | | | 04/26/24 | | | | 2,871,382 | |
| | 4,700,000 | | | | 5.500 | | | | 09/18/33 | | | | 5,570,296 | |
| | |
| TOTAL GOVERNMENT GUARANTEE
OBLIGATIONS |
|
| | (Cost $19,747,039) | | | $ | 19,078,131 | |
| | |
| | | | | | | | | | | | | | |
| | U.S. Treasury Obligations – 19.8% | |
| United States Treasury Bonds | |
| | $ 3,600,000 | | | | 3.125 | % | | | 11/15/41 | | | $ | 3,246,516 | |
| | 27,900,000 | | | | 3.125 | | | | 02/15/42 | | | | 25,119,206 | |
| | 10,500,000 | | | | 2.750 | | | | 08/15/42 | | | | 8,705,025 | |
| | 12,300,000 | | | | 3.625 | | | | 08/15/43 | | | | 12,158,796 | |
| United States Treasury Inflation Protected Securities | |
| | 7,964,523 | | | | 2.000 | | | | 01/15/14 | | | | 8,004,346 | |
| | 11,920,608 | | | | 1.250 | | | | 04/15/14 | | | | 12,024,913 | |
| | 4,756,400 | | | | 0.125 | | | | 01/15/23 | | | | 4,627,835 | |
| United States Treasury Notes | |
| | 85,900,000 | | | | 0.250 | (i) | | | 05/31/14 | | | | 85,987,615 | |
| | 5,600,000 | | | | 1.375 | | | | 09/30/18 | | | | 5,595,968 | |
| | 62,800,000 | | | | 1.750 | | | | 05/15/23 | | | | 58,190,482 | |
| | 10,300,000 | | | | 2.500 | | | | 08/15/23 | | | | 10,194,631 | |
| | |
| | TOTAL U.S. TREASURY OBLIGATIONS | |
| | (Cost $239,181,141) | | | $ | 233,855,333 | |
| | |
| | | | | | | | | | | | | | |
| Notional Amount | | | Exercise
Rate | | | Expiration
Date | | | Value | |
| | Options Purchased – 0.6% | |
| | Interest Rate Swaptions | |
| Bank of America NA Call - OTC - 10 year Interest Rate Swap
Strike Price 3.590% |
|
| $ | 9,300,000 | | | | 3.590 | % | | | 03/22/16 | | | $ | 571,525 | |
| | |
| | |
| 40 | | The accompanying notes are an integral part of these financial statements. |
GOLDMAN SACHS CORE FIXED INCOME FUND
| | | | | | | | | | | | | | |
| Notional Amount | | | Exercise
Rate | | | Expiration
Date | | | Value | |
| | Options Purchased – (continued) | |
| | Interest Rate Swaptions – (continued) | |
| Bank of America NA Call - OTC - 10 year Interest Rate Swap
Strike Price 4.070% |
|
| $ | 8,600,000 | | | | 4.070 | % | | | 03/29/16 | | | $ | 373,593 | |
| Citibank NA Put - OTC - 10 year Interest Rate Swap
Strike Price 3.017% |
|
| | 4,800,000 | | | | 3.017 | | | | 05/29/15 | | | | 117,589 | |
| Citibank NA Call - OTC - 10 year Interest Rate Swap
Strike Price 3.017% |
|
| | 4,800,000 | | | | 3.017 | | | | 05/29/15 | | | | 316,120 | |
| Citibank NA Call - OTC - 10 year Interest Rate Swap
Strike Price 3.570% |
|
| | 8,300,000 | | | | 3.570 | | | | 02/22/16 | | | | 501,180 | |
| Citibank NA Call - OTC - 10 year Interest Rate Swap
Strike Price 3.625% |
|
| | 7,800,000 | | | | 3.625 | | | | 02/22/16 | | | | 452,533 | |
| Citibank NA Call - OTC - 10 year Interest Rate Swap
Strike Price 3.633% |
|
| | 6,500,000 | | | | 3.633 | | | | 02/19/16 | | | | 374,474 | |
| Citibank NA Call - OTC - 10 year Interest Rate Swap
Strike Price 3.645% |
|
| | 8,300,000 | | | | 3.645 | | | | 02/16/16 | | | | 471,173 | |
| Deutsche Bank Securities, Inc. Call - OTC - 2 year Interest Rate
Swap Strike Price 1.950% |
|
| | 26,400,000 | | | | 1.950 | | | | 10/26/15 | | | | 276,545 | |
| Deutsche Bank Securities, Inc. Call - OTC - 2 year Interest Rate
Swap Strike Price 2.030% |
|
| | 26,300,000 | | | | 2.030 | | | | 10/26/15 | | | | 259,683 | |
| JPMorgan Chase Bank NA Call - OTC - 2 year Interest Rate
Swap Strike Price 1.855% |
|
| | 25,500,000 | | | | 1.855 | | | | 11/02/15 | | | | 292,495 | |
| JPMorgan Chase Bank NA Call - OTC - 10 year Interest Rate
Swap Strike Price 3.610% |
|
| | 7,700,000 | | | | 3.610 | | | | 02/16/16 | | | | 448,486 | |
| Morgan Stanley Capital Services, Inc. Call - OTC - 10 year
Interest Rate Swap Strike Price 3.620% |
|
| | 13,900,000 | | | | 3.620 | | | | 03/07/16 | | | | 821,828 | |
| Morgan Stanley Capital Services, Inc. Call - OTC - 10 year
Interest Rate Swap Strike Price 3.630% |
|
| | 22,600,000 | | | | 3.630 | | | | 02/16/16 | | | | 648,591 | |
| Morgan Stanley Capital Services, Inc. Call - OTC - 10 year
Interest Rate Swap Strike Price 3.652% |
|
| | 14,900,000 | | | | 3.652 | | | | 02/22/16 | | | | 847,533 | |
| | |
| | TOTAL OPTIONS PURCHASED – 0.6% | |
| | (Cost $4,421,945) | | | $ | 6,773,348 | |
| | |
| TOTAL INVESTMENTS BEFORE
SHORT-TERM INVESTMENT |
|
| | (Cost $1,257,480,623) | | | $ | 1,264,439,950 | |
| | |
| | Short-term Investment(j) – 0.1% | |
| | Repurchase Agreement – 0.1% | |
| Joint Repurchase Agreement Account II | |
| $ | 1,800,000 | | | | 0.083 | % | | | 10/01/13 | | | $ | 1,800,000 | |
| | (Cost $1,800,000) | |
| | |
| | TOTAL INVESTMENTS – 107.1% | |
| | (Cost $1,259,280,623) | | | $ | 1,266,239,950 | |
| | |
| LIABILITIES IN EXCESS OF
OTHER ASSETS – (7.1)% |
| | | (84,083,365 | ) |
| | |
| | NET ASSETS – 100.0% | | | $ | 1,182,156,585 | |
| | |
| | |
| The percentage shown for each investment category reflects the value of investments in that category as a percentage of net assets. |
(a) | | Security with “Call” features with resetting interest rates. Maturity dates disclosed are the final maturity dates. |
(b) | | Variable rate security. Interest rate disclosed is that which is in effect at September 30, 2013. |
(c) | | Exempt from registration under Rule 144A of the Securities Act of 1933. Under procedures approved by the Board of Trustees, such securities have been determined to be liquid by the investment adviser and may be resold, normally to qualified institutional buyers in transactions exempt from registration. Total market value of Rule 144A securities amounts to $119,512,205, which represents approximately 10.1% of net assets as of September 30, 2013. |
(d) | | Security with “Put” features and resetting interest rates. Maturity dates disclosed are the puttable dates. Interest rate disclosed is that which is in effect at September 30, 2013. |
(e) | | Security with a notional or nominal principal amount. The actual effective yield of this security is different than the stated interest rate. |
(f) | | TBA (To Be Announced) Securities are purchased on a forward commitment basis with an approximate principal amount and no defined maturity date. The actual principal and maturity date will be determined upon settlement when the specific mortgage pools are assigned. Total market value of TBA securities (excluding forward sales contracts, if any) amounts to $120,320,389 which represents approximately 10.2% of net assets as of September 30, 2013. |
(g) | | Guaranteed by a foreign government until maturity. Total market value of these securities amounts to $588,313, which represents approximately 0.0% of net assets as of September 30, 2013. |
(h) | | Guaranteed by United States Government until maturity. Total market value of these securities amounts to $18,489,818, which represents approximately 1.6% of net assets as of September 30, 2013. |
(i) | | All or a portion of security is segregated as collateral for initial margin requirement on futures transactions. |
(j) | | Joint repurchase agreement was entered into on September 30, 2013. Additional information appears on page 115. |
| | |
| The accompanying notes are an integral part of these financial statements. | | 41 |
GOLDMAN SACHS CORE FIXED INCOME FUND
Schedule of Investments (continued)
September 30, 2013 (Unaudited)
| | |
|
Currency Abbreviations: |
AUD | | —Australian Dollar |
CAD | | —Canadian Dollar |
CHF | | —Swiss Franc |
EUR | | —Euro |
GBP | | —British Pound |
JPY | | —Japanese Yen |
NOK | | —Norwegian Krone |
NZD | | —New Zealand Dollar |
SEK | | —Swedish Krona |
USD | | —U.S. Dollar |
| | |
Investment Abbreviations: |
FHLB | | —Federal Home Loan Bank |
FHLMC | | —Federal Home Loan Mortgage Corp. |
FNMA | | —Federal National Mortgage Association |
GNMA | | —Government National Mortgage Association |
GO | | —General Obligation |
LIBOR | | —London Interbank Offered Rate |
NCUA | | —National Credit Union Administration |
OTC | | —Over the Counter |
RB | | —Revenue Bond |
REIT | | —Real Estate Investment Trust |
REMIC | | —Real Estate Mortgage Investment Conduit |
SPA | | —Stand-by Purchase Agreement |
|
|
| ADDITIONAL INVESTMENT INFORMATION |
FORWARD FOREIGN CURRENCY EXCHANGE CONTRACTS — At September 30, 2013, the Fund had the following forward foreign currency exchange contracts:
FORWARD FOREIGN CURRENCY EXCHANGE CONTRACTS WITH UNREALIZED GAIN
| | | | | | | | | | | | | | |
| Counterparty | | Contracts to
Buy/Sell | | Settlement
Date | | | Current
Value | | | Unrealized
Gain | |
Bank of America Securities LLC | | EUR/USD | | | 12/18/13 | | | $ | 994,551 | | | $ | 22,844 | |
Barclays Bank PLC | | EUR/USD | | | 12/18/13 | | | | 985,079 | | | | 15,224 | |
| | GBP/EUR | | | 12/18/13 | | | | 3,943,022 | | | | 25,261 | |
| | NOK/USD | | | 12/18/13 | | | | 1,509,553 | | | | 18,423 | |
BNP Paribas SA | | GBP/USD | | | 12/18/13 | | | | 5,855,674 | | | | 208,732 | |
Citibank NA | | EUR/USD | | | 12/18/13 | | | | 3,903,781 | | | | 6,608 | |
| | GBP/EUR | | | 12/18/13 | | | | 1,963,392 | | | | 1,016 | |
| | NZD/USD | | | 12/18/13 | | | | 977,164 | | | | 12,487 | |
Credit Suisse International (London) | | JPY/USD | | | 12/18/13 | | | | 982,548 | | | | 6,548 | |
HSBC Bank PLC | | EUR/SEK | | | 12/18/13 | | | | 974,475 | | | | 1,132 | |
JPMorgan Securities, Inc. | | EUR/NOK | | | 12/18/13 | | | | 3,826,804 | | | | 68,858 | |
| | EUR/USD | | | 12/18/13 | | | | 3,929,491 | | | | 45,609 | |
| | JPY/USD | | | 12/18/13 | | | | 1,955,381 | | | | 6,381 | |
Royal Bank of Scotland PLC | | GBP/USD | | | 12/18/13 | | | | 993,429 | | | | 25,694 | |
Standard Chartered Bank | | USD/JPY | | | 12/18/13 | | | | 969,297 | | | | 4,703 | |
State Street Bank | | GBP/EUR | | | 12/18/13 | | | | 1,979,630 | | | | 1,651 | |
| | JPY/USD | | | 12/18/13 | | | | 3,903,116 | | | | 5,116 | |
Westpac Banking Corp. | | AUD/USD | | | 12/18/13 | | | | 2,926,733 | | | | 56,088 | |
| | NZD/AUD | | | 12/18/13 | | | | 972,650 | | | | 11,745 | |
| | | USD/AUD | | | 12/18/13 | | | | 3,846,980 | | | | 22,023 | |
| TOTAL | | | | | | | | | | | | $ | 566,143 | |
| | |
| 42 | | The accompanying notes are an integral part of these financial statements. |
GOLDMAN SACHS CORE FIXED INCOME FUND
|
| ADDITIONAL INVESTMENT INFORMATION (continued) |
FORWARD FOREIGN CURRENCY EXCHANGE CONTRACTS WITH UNREALIZED LOSS
| | | | | | | | | | | | | | |
| Counterparty | | Contracts to
Buy/Sell | | Settlement
Date | | | Current
Value | | | Unrealized
Loss | |
Bank of America Securities LLC | | USD/EUR | | | 12/18/13 | | | $ | 3,926,785 | | | $ | (52,629 | ) |
Barclays Bank PLC | | EUR/GBP | | | 12/18/13 | | | | 976,823 | | | | (1,216 | ) |
| | NOK/EUR | | | 12/18/13 | | | | 986,432 | | | | (30,896 | ) |
BNP Paribas SA | | EUR/GBP | | | 12/18/13 | | | | 6,054,539 | | | | (52,052 | ) |
| | USD/JPY | | | 12/18/13 | | | | 3,952,896 | | | | (35,229 | ) |
Citibank NA | | EUR/GBP | | | 12/18/13 | | | | 1,006,029 | | | | (7,419 | ) |
| | USD/CAD | | | 12/18/13 | | | | 4,885,167 | | | | (8,533 | ) |
| | USD/EUR | | | 12/18/13 | | | | 5,922,963 | | | | (95,141 | ) |
| | USD/JPY | | | 12/18/13 | | | | 969,154 | | | | (154 | ) |
Credit Suisse International (London) | | EUR/CHF | | | 12/18/13 | | | | 997,770 | | | | (11,338 | ) |
Deutsche Bank AG (London) | | AUD/USD | | | 12/18/13 | | | | 1,928,595 | | | | (724 | ) |
| | USD/EUR | | | 12/18/13 | | | | 1,952,567 | | | | (6,465 | ) |
HSBC Bank PLC | | USD/AUD | | | 12/18/13 | | | | 979,147 | | | | (13,031 | ) |
| | USD/SEK | | | 12/18/13 | | | | 3,375,574 | | | | (46,612 | ) |
JPMorgan Securities, Inc. | | NOK/EUR | | | 12/18/13 | | | | 2,986,359 | | | | (60,046 | ) |
| | USD/EUR | | | 10/25/13 | | | | 9,990,938 | | | | (209,480 | ) |
| | USD/EUR | | | 12/18/13 | | | | 5,845,524 | | | | (28,462 | ) |
Morgan Stanley Capital Services, Inc. | | NZD/USD | | | 12/18/13 | | | | 1,914,680 | | | | (24,362 | ) |
Royal Bank of Canada | | CAD/USD | | | 12/18/13 | | | | 4,835,387 | | | | (29,613 | ) |
| | USD/CAD | | | 12/18/13 | | | | 974,704 | | | | (704 | ) |
| | USD/GBP | | | 10/24/13 | | | | 8,478,995 | | | | (201,790 | ) |
| | USD/NZD | | | 12/18/13 | | | | 1,682,271 | | | | (61,649 | ) |
Royal Bank of Scotland PLC | | USD/GBP | | | 12/18/13 | | | | 1,951,263 | | | | (6,280 | ) |
State Street Bank | | NOK/EUR | | | 12/18/13 | | | | 2,040,247 | | | | (64,787 | ) |
| | USD/CHF | | | 12/18/13 | | | | 3,958,041 | | | | (110,563 | ) |
| | USD/EUR | | | 12/18/13 | | | | 974,254 | | | | (170 | ) |
| | USD/JPY | | | 12/18/13 | | | | 990,449 | | | | (18,449 | ) |
Westpac Banking Corp. | | AUD/USD | | | 12/18/13 | | | | 3,824,706 | | | | (43,631 | ) |
| | EUR/USD | | | 12/18/13 | | | | 1,947,155 | | | | (1,899 | ) |
| | | USD/AUD | | | 12/18/13 | | | | 974,936 | | | | (5,097 | ) |
| TOTAL | | | | | | | | | | | | $ | (1,228,421 | ) |
FORWARD SALES CONTRACTS — At September 30, 2013, the Fund had the following forward sales contracts:
| | | | | | | | | | | | | | | | | | |
| Description | | Interest
Rate | | | Maturity
Date(f) | | Settlement
Date | | | Principal
Amount | | | Value | |
FHLMC | | | 5.000 | % | | TBA-30yr | | | 10/10/2013 | | | $ | (7,000,000 | ) | | $ | (7,550,157 | ) |
FHLMC | | | 5.500 | | | TBA-30yr | | | 10/10/2013 | | | | (11,000,000 | ) | | | (11,919,532 | ) |
FNMA | | | 2.500 | | | TBA-30yr | | | 10/10/2013 | | | | (9,000,000 | ) | | | (8,368,594 | ) |
FNMA | | | 4.500 | | | TBA-30yr | | | 10/10/2013 | | | | (3,000,000 | ) | | | (3,204,375 | ) |
FNMA | | | 5.000 | | | TBA-30yr | | | 10/10/2013 | | | | (3,000,000 | ) | | | (3,253,594 | ) |
GNMA | | | 2.500 | | | TBA-30yr | | | 10/21/2013 | | | | (24,000,000 | ) | | | (22,346,251 | ) |
GNMA | | | 2.500 | | | TBA-30yr | | | 10/21/2013 | | | | (2,000,000 | ) | | | (1,863,438 | ) |
| TOTAL (Proceeds Receivable: $57,421,875) | | | | | | | $ | (58,505,941 | ) |
| | |
| The accompanying notes are an integral part of these financial statements. | | 43 |
GOLDMAN SACHS CORE FIXED INCOME FUND
Schedule of Investments (continued)
September 30, 2013 (Unaudited)
|
| ADDITIONAL INVESTMENT INFORMATION (continued) |
FUTURES CONTRACTS — At September 30, 2013, the Fund had the following futures contracts:
| | | | | | | | | | | | | | |
| Type | | Number of
Contracts
Long (Short) | | | Expiration
Date | | Current
Value | | | Unrealized
Gain (Loss) | |
Eurodollars | | | 205 | | | December 2014 | | $ | 68,997,318 | | | $ | 197,240 | |
Ultra Long U.S. Treasury Bonds | | | 56 | | | December 2013 | | | 7,957,250 | | | | 161,368 | |
10 Year German Euro-Bund | | | 80 | | | December 2013 | | | 15,206,039 | | | | 406,791 | |
2 Year U.S. Treasury Notes | | | 266 | | | December 2013 | | | 58,590,657 | | | | 146,100 | |
5 Year U.S. Treasury Notes | | | 995 | | | December 2013 | | | 120,441,641 | | | | 1,232,783 | |
10 Year U.S. Treasury Notes | | | 119 | | | December 2013 | | | 15,040,484 | | | | 272,232 | |
20 Year U.S. Treasury Bonds | | | 229 | | | December 2013 | | | 30,542,875 | | | | 495,199 | |
| TOTAL | | | | | | | | | | | | $ | 2,911,713 | |
SWAP CONTRACTS — At September 30, 2013, the Fund had the following swap contracts:
OVER THE COUNTER INTEREST RATE SWAP CONTRACTS
| | | | | | | | | | | | | | | | | | |
| | | | Rates Exchanged | | | |
| Counterparty | | Notional
Amount
(000s)(a) | | | Termination
Date | | | Payments
Received | | | Payments
Made | | Unrealized
Gain (Loss)* | |
Citibank NA | | $ | 3,100 | | | | 02/18/26 | | | | 3.145 | % | | 3 month LIBOR | | $ | (166,216 | ) |
| | | 2,400 | | | | 02/23/26 | | | | 3.133 | | | 3 month LIBOR | | | (132,197 | ) |
| | | 2,900 | | | | 02/24/26 | | | | 3.125 | | | 3 month LIBOR | | | (161,868 | ) |
| | | 3,100 | | | | 02/24/26 | | | | 3.070 | | | 3 month LIBOR | | | (187,516 | ) |
Deutsche Bank Securities, Inc. | | | 11,800 | | | | 10/30/17 | | | | 1.530 | | | 3 month LIBOR | | | (92,734 | ) |
| | | 11,900 | | | | 10/30/17 | | | | 1.450 | | | 3 month LIBOR | | | (112,186 | ) |
JPMorgan Securities, Inc. | | | 11,500 | | | | 11/06/17 | | | | 1.355 | | | 3 month LIBOR | | | (134,168 | ) |
| | | 2,900 | | | | 02/18/26 | | | | 3.110 | | | 3 month LIBOR | | | (164,120 | ) |
Morgan Stanley Capital Services, Inc. | | | 8,400 | | | | 02/18/26 | | | | 3.130 | | | 3 month LIBOR | | | (461,102 | ) |
| | | 5,600 | | | | 02/24/26 | | | | 3.152 | | | 3 month LIBOR | | | (299,728 | ) |
| | | | 5,000 | | | | 03/09/26 | | | | 3.120 | | | 3 month LIBOR | | | (286,227 | ) |
| TOTAL | | | | | | | | | | | | | | | | $ | (2,198,062 | ) |
| | (a) | | Represents forward starting interest rate swaps whose effective dates of commencement of accruals and cash flows occur subsequent to September 30, 2013. |
| | * | | There are no upfront payments on the swap contract(s), therefore the unrealized gain/loss of the swap contract(s) is equal to their market value. |
CENTRALLY CLEARED INTEREST RATE SWAP CONTRACTS
| | | | | | | | | | | | | | | | |
| | | | | | Rates Exchanged | | Market Value | |
Notional
Amount
(000s)(a) | | | Termination
Date | | Payments
Received | | Payments
Made | | Upfront
Payments
Made (Received) | | | Unrealized
Gain (Loss) | |
| $ | 65,000 | | | 12/18/16 | | 3 month LIBOR | | 0.500% | | $ | 791,446 | | | $ | (41,463 | ) |
| | 1,300 | | | 12/18/18 | | 3 month LIBOR | | 1.000 | | | 19,950 | | | | 22,998 | |
| | 17,600 | | | 05/07/19 | | 1.973% | | 3 month LIBOR | | | 53 | | | | (401,139 | ) |
| | 31,700 | | | 08/15/19 | | 3.250 | | 3 month LIBOR | | | (12,738 | ) | | | 263,546 | |
| | 3,900 | | | 08/29/19 | | 3.520 | | 3 month LIBOR | | | 9 | | | | 55,632 | |
| | 3,900 | | | 08/29/19 | | 3.560 | | 3 month LIBOR | | | 9 | | | | 59,998 | |
| | 65,600 | | | 12/18/20 | | 3 month LIBOR | | 1.500 | | | 1,410,108 | | | | 2,023,855 | |
| | 16,400 | | | 08/16/21 | | 3 month LIBOR | | 3.000 | | | (119,997 | ) | | | (256,403 | ) |
| | 2,000 | | | 08/27/21 | | 3 month LIBOR | | 3.095 | | | 11 | | | | (54,810 | ) |
| | 2,000 | | | 08/27/21 | | 3 month LIBOR | | 3.133 | | | 11 | | | | (59,669 | ) |
| | |
| 44 | | The accompanying notes are an integral part of these financial statements. |
GOLDMAN SACHS CORE FIXED INCOME FUND
|
| ADDITIONAL INVESTMENT INFORMATION (continued) |
CENTRALLY CLEARED INTEREST RATE SWAP CONTRACTS (continued)
| | | | | | | | | | | | | | | | |
| | | | | | Rates Exchanged | | Market Value | |
Notional
Amount
(000s)(a) | | | Termination
Date | | Payments
Received | | Payments
Made | | Upfront
Payments
Made (Received) | | | Unrealized
Gain (Loss) | |
| $ | 5,100 | | | 11/07/23 | | 3 month LIBOR | | 1.983 % | | $ | 41 | | | $ | 385,482 | |
| | 14,200 | | | 12/18/23 | | 3 month LIBOR | | 2.000 | | | 1,213,088 | | | | (102,755 | ) |
| | 4,800 | | | 06/11/24 | | 3 month LIBOR | | 2.733 | | | 39 | | | | 145,122 | |
| | 24,300 | | | 08/01/25 | | 5.000% | | 3 month LIBOR | | | 73 | | | | 115,269 | |
| | 3,500 | | | 03/24/26 | | 3.090 | | 3 month LIBOR | | | 28 | | | | (213,425 | ) |
| | 2,400 | | | 03/31/26 | | 3.070 | | 3 month LIBOR | | | 38 | | | | (151,571 | ) |
| | 48,200 | | | 12/18/28 | | 3 month LIBOR | | 2.500 | | | 2,007,155 | | | | 3,126,723 | |
| | 7,700 | | | 08/01/30 | | 3 month LIBOR | | 5.000 | | | (29,881 | ) | | | (101,205 | ) |
| | 22,700 | | | 12/18/43 | | 3 month LIBOR | | 3.000 | | | 588,946 | | | | 2,474,152 | |
| | TOTAL | | | | | | | | | $ | 5,868,389 | | | $ | 7,290,337 | |
| | (a) | | Represents forward starting interest rate swaps whose effective dates of commencement of accruals and cash flows occur subsequent to September 30, 2013. |
OVER THE COUNTER CREDIT DEFAULT SWAP CONTRACTS
| | | | | | | | | | | | | | | | | | | | | | | | | | |
| | | | | | | | | | | | | | | | | Market Value | |
| Counterparty | | Referenced
Obligation | | Notional
Amount
(000s) | | | Rates Received
(Paid) | | | Termination
Date | | | Credit
Spread at
September 30,
2013(b) | | | Upfront
Payments
Made (Received) | | | Unrealized
Gain (Loss) | |
Protection Purchased: | | | | | | | | | | | | | | | | | | | | | | | | |
Bank of America Securities LLC | | CDX North America Investment Grade Index 16 | | $ | 7,350 | | | | (1.000 | )% | | | 06/20/14 | | | | 0.114 | | | $ | (19,409 | ) | | $ | (30,294 | ) |
Deutsche Bank Securities, Inc. | | CDX North America Investment Grade Index 16 | | | 15,400 | | | | (1.000 | ) | | | 06/20/14 | | | | 0.114 | | | | (43,026 | ) | | | (61,113 | ) |
JPMorgan Securities, Inc. | | CDX North America Investment Grade Index 16 | | | 41,100 | | | | (1.000 | ) | | | 06/20/14 | | | | 0.114 | | | | (119,227 | ) | | | (158,702 | ) |
Morgan Stanley Capital Services, Inc. | | CDX North America Investment Grade Index 16 | | | 13,775 | | | | (1.000 | ) | | | 06/20/14 | | | | 0.114 | | | | (33,902 | ) | | | (59,248 | ) |
Protection Sold: | | | | | | | | | | | | | | | | | | | | | | | | |
Bank of America Securities LLC | | CDX North America Investment Grade Index 16 | | | 24,250 | | | | 1.000 | | | | 06/20/16 | | | | 0.354 | | | | 18,824 | | | | 414,266 | |
| | Tranches of Commercial Mortgage-Backed Index AAA Series 3 | | | 3,600 | | | | 0.080 | | | | 12/13/49 | | | | 1.135 | | | | (118,154 | ) | | | 827 | |
| | Tranches of Commercial Mortgage-Backed Index AAA Series 4 | | | 6,900 | | | | 0.350 | | | | 02/17/51 | | | | 1.241 | | | | (200,258 | ) | | | (14,094 | ) |
Citibank NA | | Tranches of Commercial Mortgage-Backed Index AAA Series 4 | | | 7,400 | | | | 0.350 | | | | 02/17/51 | | | | 1.241 | | | | (231,095 | ) | | | 1,177 | |
Credit Suisse First Boston Corp. | | Tranches of Commercial Mortgage-Backed Index AAA Series 4 | | | 6,900 | | | | 0.350 | | | | 02/17/51 | | | | 1.241 | | | | (228,536 | ) | | | 14,152 | |
Deutsche Bank Securities, Inc. | | Tranches of Commercial Mortgage-Backed Index AAA Series 4 | | | 2,400 | | | | 0.350 | | | | 02/17/51 | | | | 1.241 | | | | (79,943 | ) | | | 5,375 | |
| | |
| The accompanying notes are an integral part of these financial statements. | | 45 |
GOLDMAN SACHS CORE FIXED INCOME FUND
Schedule of Investments (continued)
September 30, 2013 (Unaudited)
|
| ADDITIONAL INVESTMENT INFORMATION (continued) |
OVER THE COUNTER CREDIT DEFAULT SWAP CONTRACTS (continued)
| | | | | | | | | | | | | | | | | | | | | | | | | | |
| | | | | | | | | | | | | | | | | Market Value | |
| Counterparty | | Referenced
Obligation | | Notional
Amount
(000s) | | | Rates Received
(Paid) | | | Termination
Date | | | Credit
Spread at
September 30,
2013(b) | | | Upfront
Payments
Made (Received) | | | Unrealized
Gain (Loss) | |
Protection Sold (continued): | | | | | | | | | | | | | | | | | | | | | | | | |
Morgan Stanley Capital Services, Inc. | | CDX North America Investment Grade Index 16 | | $ | 27,925 | | | | 1.000 | % | | | 06/20/16 | | | | 0.354 | | | $ | 20,721 | | | $ | 478,002 | |
| | | Tranches of Commercial Mortgage-Backed Index AAA Series 4 | | | 2,500 | | | | 0.350 | | | | 02/17/51 | | | | 1.241 | | | | (74,324 | ) | | | (3,351 | ) |
| TOTAL | | | | | | | | | | | | | | | | | | | | $ | (1,108,329 | ) | | $ | 586,997 | |
| | (b) | | Credit spread on the Referenced Obligation, together with the term of the swap contract, are indicators of payment/performance risk. The likelihood of a credit event occurring which would require a fund to make a payment or otherwise be required to perform under the swap contract is generally greater as the credit spread and the term of the swap contract increase. |
CENTRALLY CLEARED CREDIT DEFAULT SWAP CONTRACT
| | | | | | | | | | | | | | | | | | | | | | |
| | | | | | | | | | | | | | Market Value | |
| Referenced Obligation | | Notional
Amount
(000s) | | Rates Received
(Paid) | | | Termination
Date | | | Credit
Spread at
September 30,
2013(b) | | | Upfront
Payments
Made (Received) | | | Unrealized
Gain (Loss) | |
Protection Purchased: | | | | | | | | | | | | | | | | | | | | | | |
| | | | | | |
CDX North America Investment Grade Index 20 | | $3,325 | | | (1.000 | )% | | | 06/20/18 | | | | 0.728 | | | $ | 45,870 | | | $ | (3,644 | ) |
| | (b) | | Credit spread on the Referenced Obligation, together with the term of the swap contract, are indicators of payment/performance risk. The likelihood of a credit event occurring which would require a fund to make a payment or otherwise be required to perform under the swap contract is generally greater as the credit spread and the term of the swap contract increase. |
| | |
| 46 | | The accompanying notes are an integral part of these financial statements. |
GOLDMAN SACHS CORE PLUS FIXED INCOME FUND
Schedule of Investments
September 30, 2013 (Unaudited)
| | | | | | | | | | | | | | |
Principal
Amount | | | Interest
Rate | | | Maturity
Date | | | Value | |
| | Corporate Obligations – 33.6% | |
| | Automotive – 0.5% | |
| Ford Motor Credit Co. LLC | |
| $ | 750,000 | | | | 8.000 | % | | | 12/15/16 | | | $ | 886,567 | |
| | 375,000 | | | | 5.000 | | | | 05/15/18 | | | | 410,866 | |
| | | | | | | | | | | | | | |
| | | | | | | | | | | | | 1,297,433 | |
| | |
| | Banks – 7.8% | |
| Abbey National Treasury Services PLC | |
| GBP | 200,000 | | | | 2.113 | (a) | | | 02/16/15 | | | | 329,252 | |
| $ | 925,000 | | | | 4.000 | | | | 04/27/16 | | | | 981,311 | |
| ANZ Capital Trust II(b)(c) | |
| | 1,100,000 | | | | 5.360 | | | | 07/29/49 | | | | 1,106,600 | |
| Bank of America Corp. | |
| | 1,325,000 | | | | 6.100 | | | | 06/15/17 | | | | 1,488,258 | |
| | 475,000 | | | | 6.000 | | | | 09/01/17 | | | | 539,693 | |
| Bank of Scotland PLC(b) | |
| | 100,000 | | | | 5.250 | | | | 02/21/17 | | | | 111,706 | |
| Barclays Bank PLC(b) | |
| | 650,000 | | | | 6.050 | | | | 12/04/17 | | | | 722,016 | |
| Capital One Financial Corp. | |
| | 550,000 | | | | 1.000 | | | | 11/06/15 | | | | 546,297 | |
| Citigroup, Inc. | |
| | 305,000 | | | | 6.125 | | | | 11/21/17 | | | | 350,277 | |
| | 825,000 | | | | 3.375 | | | | 03/01/23 | | | | 782,481 | |
| Compass Bank | |
| | 475,000 | | | | 5.500 | | | | 04/01/20 | | | | 480,753 | |
| Credit Suisse AG(b) | |
| | 475,000 | | | | 6.500 | | | | 08/08/23 | | | | 488,252 | |
| Fifth Third Bancorp | |
| | 300,000 | | | | 3.625 | | | | 01/25/16 | | | | 315,685 | |
| ING Bank NV(b) | |
| | 900,000 | | | | 2.000 | | | | 09/25/15 | | | | 912,249 | |
| Intesa Sanpaolo SPA | |
| | 375,000 | | | | 3.125 | | | | 01/15/16 | | | | 374,986 | |
| | 375,000 | | | | 3.875 | | | | 01/16/18 | | | | 368,941 | |
| JPMorgan Chase & Co. | |
| | 850,000 | | | | 4.400 | | | | 07/22/20 | | | | 894,997 | |
| | 575,000 | | | | 4.350 | | | | 08/15/21 | | | | 595,605 | |
| Mizuho Corporate Bank Ltd.(b) | |
| | 675,000 | | | | 2.550 | | | | 03/17/17 | | | | 685,643 | |
| | 275,000 | | | | 2.950 | | | | 10/17/22 | | | | 253,633 | |
| MUFG Capital Finance 1 Ltd.(a)(c) | |
| | 450,000 | | | | 6.346 | | | | 07/29/49 | | | | 493,875 | |
| Northern Rock Asset Management PLC(b) | |
| | 2,200,000 | | | | 5.625 | | | | 06/22/17 | | | | 2,497,998 | |
| Regions Financial Corp. | |
| | 325,000 | | | | 5.750 | | | | 06/15/15 | | | | 349,050 | |
| Resona Preferred Global Securities Ltd.(a)(b)(c) | |
| | 550,000 | | | | 7.191 | | | | 07/30/49 | | | | 588,500 | |
| Royal Bank of Scotland PLC | |
| | 675,000 | | | | 2.550 | | | | 09/18/15 | | | | 688,315 | |
| | 300,000 | | | | 9.500 | (a)(c) | | | 03/16/22 | | | | 345,000 | |
| Santander Holdings USA, Inc. | |
| | 270,000 | | | | 4.625 | | | | 04/19/16 | | | | 283,230 | |
| Sovereign Bank | |
| | 400,000 | | | | 8.750 | | | | 05/30/18 | | | | 479,322 | |
| | |
| | Corporate Obligations – (continued) | |
| | Banks – (continued) | |
| Standard Chartered PLC(b) | |
| 425,000 | | | | 5.500 | | | | 11/18/14 | | | | 446,888 | |
| | 600,000 | | | | 3.950 | | | | 01/11/23 | | | | 564,389 | |
| Swedbank Hypotek AB(a)(b) | |
| | 400,000 | | | | 0.698 | | | | 03/28/14 | | | | 400,909 | |
| Union Bank NA | |
| | 800,000 | | | | 2.125 | | | | 06/16/17 | | | | 800,984 | |
| | | | | | | | | | | | | | |
| | | | | | | | | | | | | 20,267,095 | |
| | |
| | Brokerage – 0.6% | |
| Morgan Stanley, Inc. | |
| | 950,000 | | | | 6.250 | | | | 08/28/17 | | | | 1,078,425 | |
| | 525,000 | | | | 6.625 | | | | 04/01/18 | | | | 608,390 | |
| | | | | | | | | | | | | | |
| | | | | | | | | | | | | 1,686,815 | |
| | |
| | Chemicals – 0.7% | |
| Ashland, Inc.(c) | |
| | 500,000 | | | | 4.750 | | | | 08/15/22 | | | | 469,375 | |
| Eastman Chemical Co. | |
| | 850,000 | | | | 2.400 | | | | 06/01/17 | | | | 859,845 | |
| Ecolab, Inc. | |
| | 425,000 | | | | 3.000 | | | | 12/08/16 | | | | 445,768 | |
| | | | | | | | | | | | | | |
| | | | | | | | | | | | | 1,774,988 | |
| | |
| | Consumer Cyclical Services(c) – 0.2% | |
| Equinix, Inc. | |
| | 450,000 | | | | 7.000 | | | | 07/15/21 | | | | 480,375 | |
| | |
| | Consumer Products – 0.6% | |
| Avon Products, Inc. | |
| | 725,000 | | | | 4.600 | | | | 03/15/20 | | | | 749,617 | |
| Kimberly-Clark Corp. | |
| | 850,000 | | | | 3.700 | | | | 06/01/43 | | | | 736,591 | |
| | | | | | | | | | | | | | |
| | | | | | | | | | | | | 1,486,208 | |
| | |
| | Diversified Manufacturing – 0.2% | |
| Xylem, Inc. | |
| | 550,000 | | | | 3.550 | | | | 09/20/16 | | | | 577,294 | |
| | |
| | Electric – 0.9% | |
| Arizona Public Service Co. | |
| | 375,000 | | | | 8.750 | | | | 03/01/19 | | | | 483,350 | |
| Consumers Energy Co.(c) | |
| | 850,000 | | | | 3.950 | | | | 05/15/43 | | | | 760,973 | |
| Ipalco Enterprises, Inc.(c) | |
| | 300,000 | | | | 5.000 | | | | 05/01/18 | | | | 311,250 | |
| PPL WEM Holdings PLC(b)(c) | |
| | 505,000 | | | | 5.375 | | | | 05/01/21 | | | | 549,397 | |
| Puget Sound Energy, Inc.(a)(c) | |
| | 250,000 | | | | 6.974 | | | | 06/01/67 | | | | 260,000 | |
| | | | | | | | | | | | | | |
| | | | | | | | | | | | | 2,364,970 | |
| | |
| | Energy – 2.8% | |
| Continental Resources, Inc.(c) | |
| | 675,000 | | | | 5.000 | | | | 09/15/22 | | | | 678,375 | |
| Ecopetrol SA | |
| | 280,000 | | | | 5.875 | | | | 09/18/23 | | | | 292,506 | |
| | |
| | |
| The accompanying notes are an integral part of these financial statements. | | 47 |
GOLDMAN SACHS CORE PLUS FIXED INCOME FUND
Schedule of Investments (continued)
September 30, 2013 (Unaudited)
| | | | | | | | | | | | | | |
Principal
Amount | | | Interest
Rate | | | Maturity
Date | | | Value | |
| | Corporate Obligations – (continued) | |
| | Energy – (continued) | |
| Gaz Capital SA for Gazprom(d) | |
| $ | 870,000 | | | | 9.250 | % | | | 04/23/19 | | | $ | 1,065,750 | |
| Lukoil International Finance BV | |
| | 300,000 | | | | 6.656 | | | | 06/07/22 | | | | 324,000 | |
| Nexen, Inc. | |
| | 375,000 | | | | 6.400 | | | | 05/15/37 | | | | 407,233 | |
| Petrobras International Finance Co. | |
| | 60,000 | | | | 5.750 | | | | 01/20/20 | | | | 62,377 | |
| | 450,000 | | | | 5.375 | | | | 01/27/21 | | | | 451,351 | |
| Petroleos Mexicanos | |
| | 270,000 | | | | 5.500 | | | | 01/21/21 | | | | 289,575 | |
| | 80,000 | | | | 4.875 | | | | 01/18/24 | | | | 80,600 | |
| PTTEP Canada International Finance Ltd.(b) | |
| | 460,000 | | | | 5.692 | | | | 04/05/21 | | | | 490,475 | |
| Rosneft Oil Co. via Rosneft International Finance Ltd.(b) | |
| | 850,000 | | | | 4.199 | | | | 03/06/22 | | | | 783,062 | |
| Rowan Cos., Inc.(c) | |
| | 250,000 | | | | 4.875 | | | | 06/01/22 | | | | 255,308 | |
| TNK-BP Finance SA | |
| | 160,000 | | | | 7.500 | | | | 07/18/16 | | | | 179,200 | |
| | 120,000 | | | | 7.250 | | | | 02/02/20 | | | | 135,300 | |
| Transocean, Inc. | |
| | 775,000 | | | | 6.500 | | | | 11/15/20 | | | | 861,624 | |
| Transportadora de Gas Internacional SA(c) | |
| | 330,000 | | | | 5.700 | | | | 03/20/22 | | | | 332,795 | |
| Weatherford International Ltd. | |
| | 400,000 | | | | 9.625 | | | | 03/01/19 | | | | 504,889 | |
| | | | | | | | | | | | | | |
| | | | | | | | | | | | | 7,194,420 | |
| | |
| | Environmental(c) – 0.2% | |
| Clean Harbors, Inc. | |
| | 505,000 | | | | 5.250 | | | | 08/01/20 | | | | 496,163 | |
| | |
| | Food & Beverage – 1.3% | |
| ConAgra Foods, Inc. | |
| | 850,000 | | | | 1.900 | | | | 01/25/18 | | | | 838,163 | |
| Constellation Brands, Inc. | |
| | 50,000 | | | | 3.750 | | | | 05/01/21 | | | | 46,250 | |
| | 900,000 | | | | 6.000 | | | | 05/01/22 | | | | 954,000 | |
| Pernod-Ricard SA(b) | |
| | 550,000 | | | | 2.950 | | | | 01/15/17 | | | | 568,974 | |
| | 250,000 | | | | 4.450 | | | | 01/15/22 | | | | 256,659 | |
| SABMiller Holdings, Inc.(b) | |
| | 600,000 | | | | 2.450 | | | | 01/15/17 | | | | 616,444 | |
| | | | | | | | | | | | | | |
| | | | | | | | | | | | | 3,280,490 | |
| | |
| | Health Care – Services – 0.6% | |
| Express Scripts Holding Co. | |
| | 400,000 | | | | 2.650 | | | | 02/15/17 | | | | 412,532 | |
| HCA, Inc. | |
| | 250,000 | | | | 7.875 | (c) | | | 02/15/20 | | | | 270,000 | |
| | 750,000 | | | | 7.500 | | | | 02/15/22 | | | | 821,250 | |
| | | | | | | | | | | | | | |
| | | | | | | | | | | | | 1,503,782 | |
| | |
| | Home Construction – 0.5% | |
| D.R. Horton, Inc.(c) | |
| | 550,000 | | | | 4.375 | | | | 09/15/22 | | | | 500,500 | |
| | |
| | Corporate Obligations – (continued) | |
| | Home Construction – (continued) | |
| MDC Holdings, Inc. | |
| 500,000 | | | | 5.625 | | | | 02/01/20 | | | | 517,907 | |
| | 375,000 | | | | 6.000 | (c) | | | 01/15/43 | | | | 325,499 | |
| | | | | | | | | | | | | | |
| | | | | | | | | | | | | 1,343,906 | |
| | |
| | Life Insurance – 0.9% | |
| AIG Life Holdings, Inc. | |
| | 425,000 | | | | 8.500 | | | | 07/01/30 | | | | 535,500 | |
| American International Group, Inc. | |
| | 350,000 | | | | 5.850 | | | | 01/16/18 | | | | 398,337 | |
| Genworth Holdings, Inc. | |
| | 675,000 | | | | 7.625 | | | | 09/24/21 | | | | 798,281 | |
| The Northwestern Mutual Life Insurance Co.(b) | |
| | 650,000 | | | | 6.063 | | | | 03/30/40 | | | | 746,437 | |
| | | | | | | | | | | | | | |
| | | | | | | | | | | | | 2,478,555 | |
| | |
| | Media – Cable – 0.8% | |
| CCO Holdings LLC/CCO Holdings Capital Corp.(c) | |
| | 900,000 | | | | 5.250 | | | | 09/30/22 | | | | 830,250 | |
| DISH DBS Corp. | |
| | 475,000 | | | | 6.750 | | | | 06/01/21 | | | | 498,750 | |
| Videotron Ltd. | |
| | 825,000 | | | | 5.000 | | | | 07/15/22 | | | | 781,687 | |
| | | | | | | | | | | | | | |
| | | | | | | | | | | | | 2,110,687 | |
| | |
| | Media – Non Cable – 1.3% | |
| NBCUniversal Media LLC | |
| | 1,375,000 | | | | 4.375 | | | | 04/01/21 | | | | 1,480,254 | |
| News America, Inc.(b) | |
| | 800,000 | | | | 5.400 | | | | 10/01/43 | | | | 800,834 | |
| Nielsen Finance LLC/Nielsen Finance Co.(c) | |
| | 525,000 | | | | 4.500 | | | | 10/01/20 | | | | 503,344 | |
| WPP Finance UK | |
| | 551,000 | | | | 8.000 | | | | 09/15/14 | | | | 586,890 | |
| | | | | | | | | | | | | | |
| | | | | | | | | | | | | 3,371,322 | |
| | |
| | Metals & Mining(b) – 0.6% | |
| Glencore Funding LLC | |
| | 425,000 | | | | 1.700 | | | | 05/27/16 | | | | 418,759 | |
| Xstrata Finance Canada Ltd. | |
| | 1,180,000 | | | | 2.450 | | | | 10/25/17 | | | | 1,173,564 | |
| | | | | | | | | | | | | | |
| | | | | | | | | | | | | 1,592,323 | |
| | |
| | Noncaptive – Financial – 0.6% | |
| Discover Financial Services | |
| | 400,000 | | | | 3.850 | | | | 11/21/22 | | | | 379,579 | |
| GE Capital Trust I(a)(c) | |
| | 458,000 | | | | 6.375 | | | | 11/15/67 | | | | 485,480 | |
| General Electric Capital Corp. | |
| | 275,000 | | | | 5.875 | | | | 01/14/38 | | | | 300,377 | |
| International Lease Finance Corp. | |
| | 375,000 | | | | 8.250 | | | | 12/15/20 | | | | 427,500 | |
| | | | | | | | | | | | | | |
| | | | | | | | | | | | | 1,592,936 | |
| | |
| | Packaging – 0.7% | |
| Ball Corp. | |
| | 500,000 | | | | 5.000 | | | | 03/15/22 | | | | 486,875 | |
| | |
| | |
| 48 | | The accompanying notes are an integral part of these financial statements. |
GOLDMAN SACHS CORE PLUS FIXED INCOME FUND
| | | | | | | | | | | | | | |
Principal
Amount | | | Interest
Rate | | | Maturity
Date | | | Value | |
| | Corporate Obligations – (continued) | |
| | Packaging – (continued) | |
| Crown Americas LLC/Crown Americas Capital Corp. IV(b) | |
| $ | 550,000 | | | | 4.500 | % | | | 01/15/23 | | | $ | 501,875 | |
| Sealed Air Corp.(b)(c) | |
| | 775,000 | | | | 8.375 | | | | 09/15/21 | | | | 869,938 | |
| | | | | | | | | | | | | | |
| | | | | | | | | | | | | 1,858,688 | |
| | |
| | Pharmaceuticals – 0.9% | |
| AbbVie, Inc. | |
| | 1,125,000 | | | | 1.750 | | | | 11/06/17 | | | | 1,116,614 | |
| Actavis, Inc.(c) | |
| | 425,000 | | | | 3.250 | | | | 10/01/22 | | | | 397,487 | |
| Mylan, Inc.(b)(c) | |
| | 750,000 | | | | 7.875 | | | | 07/15/20 | | | | 855,938 | |
| | | | | | | | | | | | | | |
| | | | | | | | | | | | | 2,370,039 | |
| | |
| | Pipelines – 2.3% | |
| Access Midstream Partners LP/ACMP Finance Corp.(c) | |
| | 525,000 | | | | 4.875 | | | | 05/15/23 | | | | 493,500 | |
| Boardwalk Pipelines LP | |
| | 575,000 | | | | 5.875 | | | | 11/15/16 | | | | 643,579 | |
| El Paso LLC | |
| | 500 | | | | 7.750 | | | | 01/15/32 | | | | 510 | |
| El Paso Pipeline Partners Operating Co. LLC | |
| | 450,000 | | | | 6.500 | | | | 04/01/20 | | | | 516,077 | |
| Energy Transfer Partners LP(a)(b)(c) | |
| | 1,075,000 | | | | 3.283 | | | | 11/01/66 | | | | 967,500 | |
| Enterprise Products Operating LLC(a)(c) | |
| | 775,000 | | | | 8.375 | | | | 08/01/66 | | | | 852,500 | |
| | 775,000 | | | | 7.034 | | | | 01/15/68 | | | | 860,250 | |
| MarkWest Energy Partners LP/MarkWest Energy Finance Corp.(c) | |
| | 550,000 | | | | 4.500 | | | | 07/15/23 | | | | 518,375 | |
| Southern Star Central Gas Pipeline, Inc.(b) | |
| | 300,000 | | | | 6.000 | | | | 06/01/16 | | | | 327,963 | |
| TransCanada PipeLines Ltd.(a)(c) | |
| | 875,000 | | | | 6.350 | | | | 05/15/67 | | | | 896,875 | |
| | | | | | | | | | | | | | |
| | | | | | | | | | | | | 6,077,129 | |
| | |
| | Property/Casualty Insurance – 0.3% | |
| QBE Capital Funding III Ltd.(a)(b)(c) | |
| | 325,000 | | | | 7.250 | | | | 05/24/41 | | | | 342,550 | |
| Transatlantic Holdings, Inc. | |
| | 275,000 | | | | 8.000 | | | | 11/30/39 | | | | 339,857 | |
| | | | | | | | | | | | | | |
| | | | | | | | | | | | | 682,407 | |
| | |
| | Real Estate Investment Trust – 2.1% | |
| American Campus Communities Operating Partnership LP(c) | |
| | 800,000 | | | | 3.750 | | | | 04/15/23 | | | | 762,420 | |
| Developers Diversified Realty Corp. | |
| | 65,000 | | | | 9.625 | | | | 03/15/16 | | | | 77,183 | |
| | 755,000 | | | | 7.500 | | | | 04/01/17 | | | | 884,673 | |
| ERP Operating LP(c) | |
| | 450,000 | | | | 4.625 | | | | 12/15/21 | | | | 473,759 | |
| HCP, Inc. | |
| | 525,000 | | | | 6.000 | | | | 01/30/17 | | | | 591,236 | |
| | 350,000 | | | | 2.625 | (c) | | | 02/01/20 | | | | 332,228 | |
| Healthcare Realty Trust, Inc. | |
| | 550,000 | | | | 6.500 | | | | 01/17/17 | | | | 617,143 | |
| | |
| | Corporate Obligations – (continued) | |
| | Real Estate Investment Trust – (continued) | |
| ProLogis LP | |
| 275,000 | | | | 6.125 | | | | 12/01/16 | | | | 308,952 | |
| Simon Property Group LP(c) | |
| | 625,000 | | | | 10.350 | | | | 04/01/19 | | | | 854,798 | |
| WEA Finance LLC/WT Finance Australia Property Ltd.(b)(c) | |
| | 700,000 | | | | 3.375 | | | | 10/03/22 | | | | 659,740 | |
| | | | | | | | | | | | | | |
| | | | | | | | | | | | | 5,562,132 | |
| | |
| | Retailers(c) – 0.2% | |
| NIKE, Inc. | |
| | 625,000 | | | | 3.625 | | | | 05/01/43 | | | | 538,702 | |
| | |
| | Schools – 0.4% | |
| Rensselaer Polytechnic Institute | |
| | 850,000 | | | | 5.600 | | | | 09/01/20 | | | | 928,896 | |
| | |
| | Technology – 0.8% | |
| Hewlett-Packard Co. | |
| | 525,000 | | | | 3.000 | | | | 09/15/16 | | | | 541,131 | |
| | 375,000 | | | | 2.600 | | | | 09/15/17 | | | | 379,371 | |
| NetApp, Inc. | |
| | 625,000 | | | | 2.000 | | | | 12/15/17 | | | | 612,835 | |
| Tech Data Corp. | |
| | 650,000 | | | | 3.750 | | | | 09/21/17 | | | | 663,665 | |
| | | | | | | | | | | | | | |
| | | | | | | | | | | | | 2,197,002 | |
| | |
| | Transportation(b) – 0.4% | |
| Penske Truck Leasing Co. LP/PTL Finance Corp. | |
| | 1,000,000 | | | | 2.875 | | | | 07/17/18 | | | | 1,000,579 | |
| | |
| | Wireless Telecommunications – 1.0% | |
| American Tower Corp. | |
| | 625,000 | | | | 3.400 | | | | 02/15/19 | | | | 617,089 | |
| Crown Castle International Corp. | |
| | 700,000 | | | | 5.250 | | | | 01/15/23 | | | | 644,000 | |
| MetroPCS Wireless, Inc.(b)(c) | |
| | 250,000 | | | | 6.250 | | | | 04/01/21 | | | | 250,625 | |
| | 200,000 | | | | 6.625 | | | | 04/01/23 | | | | 200,000 | |
| Softbank Corp.(b) | |
| | 525,000 | | | | 4.500 | | | | 04/15/20 | | | | 501,156 | |
| VimpelCom Holdings BV(b) | |
| | 200,000 | | | | 7.504 | | | | 03/01/22 | | | | 210,000 | |
| VIP Finance Ireland Ltd. for OJSC Vimpel Communications(b) | |
| | 230,000 | | | | 6.493 | | | | 02/02/16 | | | | 243,225 | |
| | | | | | | | | | | | | | |
| | | | | | | | | | | | | 2,666,095 | |
| | |
| | Wirelines Telecommunications – 3.4% | |
| AT&T, Inc. | |
| | 725,000 | | | | 2.950 | | | | 05/15/16 | | | | 757,547 | |
| Frontier Communications Corp. | |
| | 750,000 | | | | 8.500 | | | | 04/15/20 | | | | 830,625 | |
| MTS International Funding Ltd. | |
| | 100,000 | | | | 8.625 | | | | 06/22/20 | | | | 116,375 | |
| | 200,000 | | | | 5.000 | (b) | | | 05/30/23 | | | | 185,938 | |
| Telefonica Emisiones SAU | |
| | 600,000 | | | | 3.192 | | | | 04/27/18 | | | | 590,749 | |
| | 350,000 | | | | 5.462 | | | | 02/16/21 | | | | 357,295 | |
| Verizon Communications, Inc. | |
| | 1,275,000 | | | | 3.650 | | | | 09/14/18 | | | | 1,345,948 | |
| | |
| | |
| The accompanying notes are an integral part of these financial statements. | | 49 |
GOLDMAN SACHS CORE PLUS FIXED INCOME FUND
Schedule of Investments (continued)
September 30, 2013 (Unaudited)
| | | | | | | | | | | | | | |
Principal
Amount | | | Interest
Rate | | | Maturity
Date | | | Value | |
| | Corporate Obligations – (continued) | |
| | Wirelines Telecommunications – (continued) | |
| $ | 1,500,000 | | | | 4.500 | % | | | 09/15/20 | | | $ | 1,600,839 | |
| | 1,925,000 | | | | 5.150 | | | | 09/15/23 | | | | 2,067,969 | |
| | 850,000 | | | | 6.550 | | | | 09/15/43 | | | | 961,093 | |
| | | | | | | | | | | | | | |
| | | | | | | | | | | | | 8,814,378 | |
| | |
| | TOTAL CORPORATE OBLIGATIONS | |
| | (Cost $86,555,147) | | | $ | 87,595,809 | |
| | |
| | | | | | | | | | | | | | |
| | Mortgage-Backed Obligations – 34.0% | |
| | Adjustable Rate Non-Agency(a) – 3.1% | |
| Aire Valley Mortgages PLC Series 2004-1X, Class 3A2 | |
| EUR | 1,114,435 | | | | 0.642 | % | | | 09/20/66 | | | $ | 1,443,030 | |
| Aire Valley Mortgages PLC Series 2006-1X, Class 2A1 | |
| | 241,947 | | | | 0.522 | | | | 09/20/66 | | | | 312,168 | |
| Banc of America Funding Corp. Series 2007-E, Class 4A1 | |
| $ | 732,584 | | | | 2.689 | | | | 07/20/47 | | | | 557,182 | |
| Countrywide Alternative Loan Trust Series 2005-38, Class A3 | |
| | 218,643 | | | | 0.529 | | | | 09/25/35 | | | | 179,354 | |
| Granite Master Issuer PLC Series 2005-1, Class A6 | |
| GBP | 83,386 | | | | 0.731 | | | | 12/20/54 | | | | 133,107 | |
| Granite Master Issuer PLC Series 2005-2, Class A7 | |
| | 111,181 | | | | 0.811 | | | | 12/20/54 | | | | 177,476 | |
| Granite Master Issuer PLC Series 2006-1X, Class A7 | |
| | 806,064 | | | | 0.731 | | | | 12/20/54 | | | | 1,286,698 | |
| Granite Master Issuer PLC Series 2006-3, Class A4 | |
| $ | 2,946,303 | | | | 0.260 | | | | 12/20/54 | | | | 2,902,173 | |
| Granite Master Issuer PLC Series 2007-1, Class 5A1 | |
| GBP | 194,567 | | | | 0.711 | | | | 12/20/54 | | | | 310,582 | |
| Granite Mortgages PLC Series 2003-3, Class 3A | |
| | 73,347 | | | | 0.890 | | | | 01/20/44 | | | | 117,604 | |
| Lehman XS Trust Series 2007-4N, Class 1A1 | |
| $ | 313,686 | | | | 0.309 | | | | 03/25/47 | | | | 275,493 | |
| Master Adjustable Rate Mortgages Trust Series 2006-OA2,
Class 4A1B |
|
| | 419,318 | | | | 1.353 | | | | 12/25/46 | | | | 242,949 | |
| Structured Adjustable Rate Mortgage Loan Trust Series 2005-22,
Class 1A4 |
|
| | 1,021 | | | | 2.486 | | | | 12/25/35 | | | | 737 | |
| | |
| TOTAL ADJUSTABLE RATE
NON-AGENCY |
| | $ | 7,938,553 | |
| | |
| | Collateralized Mortgage Obligations – 5.4% | |
| | Interest Only(e) – 0.0% | |
| FNMA REMIC Series 2010-130, Class HI | |
| $ | 322,356 | | | | 6.000 | % | | | 11/25/40 | | | $ | 42,735 | |
| | |
| | Inverse Floaters(a) – 0.1% | |
| FNMA REMIC Series 2005-92, Class SC | |
| | 336,191 | | | | 6.501 | | | | 10/25/35 | | | | 50,769 | |
| FNMA REMIC Series 2010-126, Class LS | |
| | 1,260,141 | | | | 4.817 | | | | 11/25/40 | | | | 153,166 | |
| FNMA REMIC Series 2010-129, Class SM | |
| | 682,969 | | | | 5.821 | | | | 11/25/40 | | | | 82,673 | |
| FNMA REMIC Series 2012-11, Class GS | |
| | 675,866 | | | | 5.821 | | | | 05/25/40 | | | | 90,615 | |
| | | | | | | | | | | | | | |
| | | | | | | | | | | | | 377,223 | |
| | |
| | Mortgage-Backed Obligations – (continued) | |
| | Planned Amortization Class – 0.1% | |
| FNMA REMIC Series 2005-70, Class PA | |
| 203,314 | | | | 5.500 | | | | 08/25/35 | | | | 225,024 | |
| | |
| | Sequential Fixed Rate – 3.0% | |
| FHLMC Multifamily Structured Pass-Through Certificates
Series K005, Class A2 |
|
| | 1,500,000 | | | | 4.317 | | | | 11/25/19 | | | | 1,650,809 | |
| FHLMC Multifamily Structured Pass-Through Certificates
Series K027, Class A2 |
|
| | 1,500,000 | | | | 2.637 | | | | 01/25/23 | | | | 1,427,470 | |
| FHLMC Multifamily Structured Pass-Through Certificates
Series KS01, Class A2 |
|
| | 1,800,000 | | | | 2.522 | | | | 01/25/23 | | | | 1,703,360 | |
| FNMA REMIC Series 2011-52, Class GB | |
| | 1,025,000 | | | | 5.000 | | | | 06/25/41 | | | | 1,124,038 | |
| NCUA Guaranteed Notes Series 2010-C1, Class APT | |
| | 1,157,045 | | | | 2.650 | | | | 10/29/20 | | | | 1,184,236 | |
| NCUA Guaranteed Notes Series A4 | |
| | 600,000 | | | | 3.000 | | | | 06/12/19 | | | | 632,484 | |
| | | | | | | | | | | | | | |
| | | | | | | | | | | | | 7,722,397 | |
| | |
| | Sequential Floating Rate(a) – 2.2% | |
| Countrywide Alternative Loan Trust Series 2006-0C8, Class 2A3 | |
| | 5,088,685 | | | | 0.429 | | | | 11/25/36 | | | | 2,199,161 | |
| Deutsche Alt-A Securities, Inc. Alternative Loan Trust
Series 2006-AR3, Class A6 |
|
| | 5,471,329 | | | | 0.464 | | | | 08/25/36 | | | | 3,085,378 | |
| FNMA REMIC Series 2011-63, Class FG | |
| | 509,654 | | | | 0.629 | | | | 07/25/41 | | | | 511,646 | |
| | | | | | | | | | | | | | |
| | | | | | | | | | | | | 5,796,185 | |
| | |
| TOTAL COLLATERALIZED
MORTGAGE OBLIGATIONS |
| | $ | 14,163,564 | |
| | |
| | Commercial Mortgage-Backed Securities(a) – 0.9% | |
| | Sequential Fixed Rate – 0.7% | |
| FHLMC Multifamily Structured Pass-Through Certificates
Series K030, Class A2 |
|
| $ | 1,800,000 | | | | 3.250 | % | | | 04/25/23 | | | $ | 1,794,861 | |
| | |
| | Sequential Floating Rate – 0.2% | |
| Banc of America Commercial Mortgage, Inc. Series 2007-2,
Class AM |
|
| | 225,000 | | | | 5.803 | | | | 04/10/49 | | | | 247,906 | |
| FREMF Mortgage Trust Series 2012-K707, Class C(b) | |
| | 200,000 | | | | 4.018 | | | | 01/25/47 | | | | 188,108 | |
| Morgan Stanley Capital I, Inc. Series 2007-HQ11, Class AM | |
| | 50,000 | | | | 5.478 | | | | 02/12/44 | | | | 55,423 | |
| Morgan Stanley Capital I, Inc. Series 2007-HQ13, Class AM | |
| | 50,000 | | | | 5.931 | | | | 12/15/44 | | | | 49,286 | |
| | | | | | | | | | | | | | |
| | | | | | | | | | | | | 540,723 | |
| | |
| TOTAL COMMERCIAL
MORTGAGE-BACKED SECURITIES |
| | $ | 2,335,584 | |
| | |
| | Federal Agencies – 24.6% | |
| | Adjustable Rate FHLMC(a) – 0.1% | |
| $ | 124,857 | | | | 2.853 | % | | | 09/01/35 | | | $ | 132,920 | |
| | |
| | |
| 50 | | The accompanying notes are an integral part of these financial statements. |
GOLDMAN SACHS CORE PLUS FIXED INCOME FUND
| | | | | | | | | | | | | | |
Principal
Amount | | | Interest
Rate | | | Maturity
Date | | | Value | |
| | Mortgage-Backed Obligations – (continued) | |
| | FHLMC – 5.1% | |
| $ | 37,903 | | | | 5.000 | % | | | 05/01/18 | | | $ | 40,155 | |
| | 55,332 | | | | 5.000 | | | | 08/01/33 | | | | 59,814 | |
| | 9,957 | | | | 5.000 | | | | 09/01/33 | | | | 10,763 | |
| | 15,001 | | | | 5.000 | | | | 10/01/33 | | | | 16,216 | |
| | 11,471 | | | | 5.000 | | | | 11/01/34 | | | | 12,384 | |
| | 775,447 | | | | 5.000 | | | | 12/01/34 | | | | 837,211 | |
| | 1,598,533 | | | | 5.000 | | | | 03/01/35 | | | | 1,721,254 | |
| | 13,034 | | | | 5.000 | | | | 05/01/35 | | | | 14,034 | |
| | 16,819 | | | | 5.000 | | | | 06/01/35 | | | | 18,112 | |
| | 34,865 | | | | 5.000 | | | | 07/01/35 | | | | 37,599 | |
| | 348,845 | | | | 5.000 | | | | 08/01/35 | | | | 375,626 | |
| | 75,518 | | | | 5.000 | | | | 09/01/35 | | | | 81,316 | |
| | 16,011 | | | | 5.000 | | | | 10/01/35 | | | | 17,241 | |
| | 58,331 | | | | 5.000 | | | | 11/01/35 | | | | 62,894 | |
| | 7,767 | | | | 5.000 | | | | 02/01/36 | | | | 8,363 | |
| | 34,754 | | | | 5.000 | | | | 05/01/36 | | | | 37,422 | |
| | 15,032 | | | | 5.000 | | | | 07/01/36 | | | | 16,186 | |
| | 2,003,895 | | | | 5.000 | | | | 12/01/36 | | | | 2,157,782 | |
| | 1,152,267 | | | | 5.000 | | | | 02/01/37 | | | | 1,240,614 | |
| | 597,519 | | | | 5.500 | | | | 08/01/37 | | | | 645,515 | |
| | 98,143 | | | | 6.500 | | | | 08/01/37 | | | | 109,035 | |
| | 275,459 | | | | 6.500 | | | | 10/01/37 | | | | 306,478 | |
| | 13,437 | | | | 5.000 | | | | 02/01/38 | | | | 14,469 | |
| | 60,091 | | | | 5.000 | | | | 03/01/38 | | | | 64,698 | |
| | 3,328 | | | | 5.000 | | | | 06/01/38 | | | | 3,582 | |
| | 73,100 | | | | 5.000 | | | | 09/01/38 | | | | 78,685 | |
| | 121,928 | | | | 6.500 | | | | 09/01/38 | | | | 135,357 | |
| | 127,641 | | | | 5.000 | | | | 10/01/38 | | | | 137,394 | |
| | 3,705 | | | | 5.000 | | | | 12/01/38 | | | | 3,988 | |
| | 7,928 | | | | 5.000 | | | | 02/01/39 | | | | 8,534 | |
| | 146,683 | | | | 5.000 | | | | 03/01/39 | | | | 158,109 | |
| | 60,615 | | | | 5.000 | | | | 05/01/39 | | | | 65,336 | |
| | 891,404 | | | | 5.000 | | | | 09/01/39 | | | | 959,514 | |
| | 76,954 | | | | 5.000 | | | | 04/01/40 | | | | 84,052 | |
| | 18,348 | | | | 5.000 | | | | 08/01/40 | | | | 20,040 | |
| | 2,653,537 | | | | 5.500 | | | | 08/01/40 | | | | 2,867,344 | |
| | 19,750 | | | | 4.500 | | | | 03/01/41 | | | | 21,033 | |
| | 14,801 | | | | 5.000 | | | | 04/01/41 | | | | 16,210 | |
| | 21,466 | | | | 5.000 | | | | 06/01/41 | | | | 23,510 | |
| | 756,716 | | | | 4.000 | | | | 11/01/41 | | | | 791,238 | |
| | | | | | | | | | | | | | |
| | | | | | | | | | | | | 13,279,107 | |
| | |
| | FNMA – 15.2% | |
| | 954,783 | | | | 3.070 | | | | 12/01/17 | | | | 1,003,244 | |
| | 760,971 | | | | 2.800 | | | | 03/01/18 | | | | 794,555 | |
| | 5,555 | | | | 6.000 | | | | 12/01/18 | | | | 6,062 | |
| | 1,600,000 | | | | 4.506 | | | | 06/01/19 | | | | 1,764,946 | |
| | 63,721 | | | | 6.000 | | | | 06/01/21 | | | | 69,412 | |
| | 92,070 | | | | 5.000 | | | | 08/01/23 | | | | 98,315 | |
| | 54,038 | | | | 5.500 | | | | 09/01/23 | | | | 58,310 | |
| | 29,637 | | | | 5.500 | | | | 10/01/23 | | | | 32,057 | |
| | 230,413 | | | | 5.000 | | | | 02/01/24 | | | | 244,666 | |
| | 1,330,292 | | | | 5.500 | | | | 05/01/25 | | | | 1,429,482 | |
| | 67 | | | | 6.000 | | | | 03/01/32 | | | | 74 | |
| | 132,724 | | | | 6.000 | | | | 12/01/32 | | | | 146,713 | |
| | 1,794 | | | | 5.000 | | | | 01/01/33 | | | | 1,960 | |
| | 2,581 | | | | 5.500 | | | | 03/01/33 | | | | 2,834 | |
| | |
| | Mortgage-Backed Obligations – (continued) | |
| | FNMA – (continued) | |
| 206,477 | | | | 5.500 | | | | 04/01/33 | | | | 226,739 | |
| | 279 | | | | 6.000 | | | | 05/01/33 | | | | 309 | |
| | 6,489 | | | | 5.000 | | | | 08/01/33 | | | | 7,065 | |
| | 14,219 | | | | 5.500 | | | | 09/01/33 | | | | 15,605 | |
| | 57,903 | | | | 5.500 | | | | 12/01/33 | | | | 63,585 | |
| | 478 | | | | 6.000 | | | | 12/01/33 | | | | 526 | |
| | 89,819 | | | | 5.500 | | | | 02/01/34 | | | | 98,619 | |
| | 25,648 | | | | 6.000 | | | | 02/01/34 | | | | 28,356 | |
| | 6,690 | | | | 5.500 | | | | 03/01/34 | | | | 7,359 | |
| | 8,758 | | | | 5.500 | | | | 04/01/34 | | | | 9,615 | |
| | 520,348 | | | | 5.500 | | | | 05/01/34 | | | | 571,410 | |
| | 9,804 | | | | 5.500 | | | | 09/01/34 | | | | 10,784 | |
| | 5,033 | | | | 5.500 | | | | 10/01/34 | | | | 5,536 | |
| | 43,661 | | | | 5.500 | | | | 11/01/34 | | | | 48,022 | |
| | 15,942 | | | | 5.500 | | | | 12/01/34 | | | | 17,413 | |
| | 19,080 | | | | 5.500 | �� | | | 02/01/35 | | | | 20,987 | |
| | 61,362 | | | | 5.000 | | | | 04/01/35 | | | | 66,719 | |
| | 173 | | | | 6.000 | | | | 04/01/35 | | | | 190 | |
| | 15,513 | | | | 5.500 | | | | 05/01/35 | | | | 16,923 | |
| | 640,457 | | | | 5.000 | | | | 07/01/35 | | | | 695,085 | |
| | 6,153 | | | | 5.500 | | | | 07/01/35 | | | | 6,712 | |
| | 2,822 | | | | 5.500 | | | | 09/01/35 | | | | 3,081 | |
| | 9,828 | | | | 6.000 | | | | 03/01/36 | | | | 10,807 | |
| | 12,380 | | | | 5.500 | | | | 04/01/36 | | | | 13,505 | |
| | 19,117 | | | | 6.000 | | | | 04/01/36 | | | | 21,030 | |
| | 88,407 | | | | 5.500 | | | | 09/01/36 | | | | 97,082 | |
| | 205 | | | | 5.500 | | | | 02/01/37 | | | | 223 | |
| | 331 | | | | 5.500 | | | | 04/01/37 | | | | 360 | |
| | 351 | | | | 5.500 | | | | 05/01/37 | | | | 382 | |
| | 34,424 | | | | 5.500 | | | | 02/01/38 | | | | 37,553 | |
| | 528 | | | | 5.500 | | | | 03/01/38 | | | | 575 | |
| | 482 | | | | 5.500 | | | | 06/01/38 | | | | 525 | |
| | 590 | | | | 5.500 | | | | 07/01/38 | | | | 643 | |
| | 479 | | | | 5.500 | | | | 08/01/38 | | | | 522 | |
| | 348 | | | | 5.500 | | | | 09/01/38 | | | | 379 | |
| | 448,075 | | | | 6.000 | | | | 11/01/38 | | | | 488,568 | |
| | 229 | | | | 5.500 | | | | 12/01/38 | | | | 249 | |
| | 36,235 | | | | 4.500 | | | | 04/01/39 | | | | 38,942 | |
| | 8,703 | | | | 5.500 | | | | 06/01/39 | | | | 9,458 | |
| | 46,057 | | | | 4.500 | | | | 08/01/39 | | | | 49,513 | |
| | 51,061 | | | | 4.500 | | | | 11/01/39 | | | | 54,893 | |
| | 7,772 | | | | 5.500 | | | | 11/01/39 | | | | 8,448 | |
| | 395,362 | | | | 4.500 | | | | 12/01/39 | | | | 425,029 | |
| | 455,815 | | | | 4.000 | | | | 09/01/40 | | | | 478,224 | |
| | 11,007 | | | | 4.000 | | | | 11/01/40 | | | | 11,544 | |
| | 1,071,241 | | | | 4.000 | | | | 12/01/40 | | | | 1,123,470 | |
| | 20,571 | | | | 4.000 | | | | 01/01/41 | | | | 21,574 | |
| | 21,690 | | | | 4.000 | | | | 02/01/41 | | | | 22,751 | |
| | 50,986 | | | | 4.000 | | | | 03/01/41 | | | | 53,479 | |
| | 171,808 | | | | 4.500 | | | | 08/01/41 | | | | 183,784 | |
| | 44,992 | | | | 4.500 | | | | 10/01/41 | | | | 48,128 | |
| | 30,848 | | | | 4.000 | | | | 01/01/42 | | | | 32,356 | |
| | 644,768 | | | | 3.000 | | | | 08/01/42 | | | | 630,942 | |
| | 572,941 | | | | 3.000 | | | | 09/01/42 | | | | 560,754 | |
| | 81,084 | | | | 3.000 | | | | 10/01/42 | | | | 79,361 | |
| | 304,453 | | | | 3.000 | | | | 11/01/42 | | | | 297,953 | |
| | |
| | |
| The accompanying notes are an integral part of these financial statements. | | 51 |
GOLDMAN SACHS CORE PLUS FIXED INCOME FUND
Schedule of Investments (continued)
September 30, 2013 (Unaudited)
| | | | | | | | | | | | | | |
Principal
Amount | | | Interest
Rate | | | Maturity
Date | | | Value | |
| | Mortgage-Backed Obligations – (continued) | |
| | FNMA – (continued) | |
| $ | 3,599,177 | | | | 3.000 | % | | | 12/01/42 | | | $ | 3,522,011 | |
| | 993,991 | | | | 2.500 | | | | 01/01/43 | | | | 924,607 | |
| | 2,852,919 | | | | 3.000 | | | | 01/01/43 | | | | 2,792,036 | |
| | 1,246,113 | | | | 3.000 | | | | 02/01/43 | | | | 1,219,531 | |
| | 989,698 | | | | 2.500 | | | | 03/01/43 | | | | 920,614 | |
| | 484,165 | | | | 3.000 | | | | 03/01/43 | | | | 473,840 | |
| | 994,109 | | | | 2.500 | | | | 04/01/43 | | | | 924,717 | |
| | 797,166 | | | | 3.000 | | | | 04/01/43 | | | | 780,186 | |
| | 345,819 | | | | 3.000 | | | | 05/01/43 | | | | 338,436 | |
| | 97,857 | | | | 3.000 | | | | 06/01/43 | | | | 95,778 | |
| | 840,916 | | | | 3.000 | | | | 07/01/43 | | | | 823,047 | |
| | 4,000,000 | | | | 3.000 | | | | TBA-30yr | (f) | | | 3,909,062 | |
| | 8,000,000 | | | | 4.000 | | | | TBA-30yr | (f) | | | 8,391,250 | |
| | 2,000,000 | | | | 4.500 | | | | TBA-30yr | (f) | | | 2,136,250 | |
| | | | | | | | | | | | | | |
| | | | | | | | | | | | | 39,627,641 | |
| | |
| | GNMA – 4.2% | |
| | 238,977 | | | | 3.950 | | | | 07/15/25 | | | | 251,713 | |
| | 159,160 | | | | 5.500 | | | | 11/15/32 | | | | 176,063 | |
| | 135,639 | | | | 5.500 | | | | 01/15/33 | | | | 149,975 | |
| | 134,477 | | | | 5.500 | | | | 02/15/33 | | | | 148,690 | |
| | 133,411 | | | | 5.500 | | | | 03/15/33 | | | | 147,511 | |
| | 144,037 | | | | 5.500 | | | | 07/15/33 | | | | 159,260 | |
| | 84,624 | | | | 5.500 | | | | 08/15/33 | | | | 93,568 | |
| | 70,298 | | | | 5.500 | | | | 09/15/33 | | | | 77,728 | |
| | 75,037 | | | | 5.500 | | | | 04/15/34 | | | | 82,661 | |
| | 85,266 | | | | 5.500 | | | | 05/15/34 | | | | 93,930 | |
| | 744,451 | | | | 5.500 | | | | 09/15/34 | | | | 820,095 | |
| | 579,009 | | | | 5.500 | | | | 12/15/34 | | | | 637,843 | |
| | 628,062 | | | | 5.500 | | | | 01/15/35 | | | | 689,973 | |
| | 3,836 | | | | 5.500 | | | | 05/15/36 | | | | 4,194 | |
| | 109,658 | | | | 5.000 | | | | 11/15/40 | | | | 120,624 | |
| | 460,185 | | | | 2.500 | | | | 12/15/42 | | | | 429,096 | |
| | 48,634 | | | | 2.500 | | | | 12/20/42 | | | | 45,327 | |
| | 995,928 | | | | 2.500 | | | | 05/20/43 | | | | 928,156 | |
| | 1,991,742 | | | | 2.500 | | | | 07/20/43 | | | | 1,856,206 | |
| | 3,000,000 | | | | 4.000 | | | | TBA-30yr | (f) | | | 3,167,500 | |
| | 1,000,000 | | | | 4.500 | | | | TBA-30yr | (f) | | | 1,077,656 | |
| | | | | | | | | | | | | | |
| | | | | | | | | | | | | 11,157,769 | |
| | |
| | TOTAL FEDERAL AGENCIES | | | $ | 64,197,437 | |
| | |
| | TOTAL MORTGAGE-BACKED OBLIGATIONS | |
| | (Cost $84,108,433) | | | $ | 88,635,138 | |
| | |
| | | | | | | | | | | | | | |
| | Agency Debentures – 3.9% | |
| FHLB | |
| $ | 2,400,000 | | | | 4.625 | % | | | 09/11/20 | | | $ | 2,777,769 | |
| FHLMC | |
| | 700,000 | | | | 0.500 | | | | 10/15/13 | | | | 700,114 | |
| EUR | 600,000 | | | | 4.375 | | | | 01/15/14 | | | | 820,793 | |
| $ | 400,000 | | | | 2.375 | | | | 01/13/22 | | | | 389,264 | |
| FNMA | |
| | 300,000 | | | | 4.125 | | | | 04/15/14 | | | | 306,505 | |
| | 2,600,000 | | | | 1.875 | | | | 09/18/18 | | | | 2,631,429 | |
| | 800,000 | | | | 6.250 | | | | 05/15/29 | | | | 1,029,602 | |
| | |
| | Agency Debentures – (continued) | |
| Tennessee Valley Authority | |
| 1,600,000 | | | | 1.750 | | | | 10/15/18 | | | | 1,597,138 | |
| | |
| | TOTAL AGENCY DEBENTURES | |
| | (Cost $9,859,490) | | | $ | 10,252,614 | |
| | |
| | | | | | | | | | | | | | |
| | Asset-Backed Securities – 11.2% | |
| | Collateralized Loan Obligations – 9.6% | |
| Aberdeen Loan Funding Ltd. Series 2008-1A, Class A(a)(b) | |
| $ | 3,717,397 | | | | 0.915 | % | | | 11/01/18 | | | $ | 3,616,927 | |
| ACIS CLO Ltd. Series 2013-1A, Class ACOM(b) | |
| | 2,600,000 | | | | 1.558 | | | | 04/18/24 | | | | 2,537,566 | |
| ACIS CLO Ltd. Series 2013-2A, Class A(a)(b) | |
| | 400,000 | | | | 0.761 | | | | 10/14/22 | | | | 386,800 | |
| ACIS CLO Ltd. Series 2013-2A, Class COM(a)(b) | |
| | 2,650,000 | | | | 1.176 | | | | 10/14/22 | | | | 2,559,905 | |
| Crown Point CLO Ltd. Series 2012-1A, Class ACOM(a)(b) | |
| | 1,250,000 | | | | 1.484 | | | | 11/21/22 | | | | 1,222,691 | |
| Golub Capital Management CLO Ltd. Series 2007-1A,
Class A(a)(b) |
|
| | 1,500,000 | | | | 0.506 | | | | 07/31/21 | | | | 1,473,906 | |
| OCP CLO Ltd. Series 2012-2A, Class ACOM(a)(b) | |
| | 2,200,000 | | | | 1.502 | | | | 11/22/23 | | | | 2,137,714 | |
| OFSI Fund V Ltd. Series 2013-5A, Class ACOM(b) | |
| | 1,650,000 | | | | 1.618 | | | | 04/17/25 | | | | 1,633,975 | |
| Red River CLO Ltd. Series 1A, Class A(a)(b) | |
| | 3,587,083 | | | | 0.535 | | | | 07/27/18 | | | | 3,512,368 | |
| Westchester CLO Ltd. Series 2007-1X, Class A1A(a) | |
| | 6,105,837 | | | | 0.490 | | | | 08/01/22 | | | | 5,904,986 | |
| | | | | | | | | | | | | | |
| | | | | | | | | | | | | 24,986,838 | |
| | |
| | Home Equity – 0.2% | |
| Bear Stearns Asset Backed Securities Trust Series 2001-3,
Class A2(a) |
|
| | 7,141 | | | | 0.979 | | | | 10/27/32 | | | | 6,953 | |
| Bear Stearns Asset Backed Securities Trust Series 2002-2,
Class A1(a) |
|
| | 5,561 | | | | 0.844 | | | | 10/25/32 | | | | 5,373 | |
| Bear Stearns Asset Backed Securities Trust Series 2005-SD4,
Class 2A1(a) |
|
| | 482,182 | | | | 0.579 | | | | 12/25/42 | | | | 470,311 | |
| CS First Boston Mortgage Securities Corp. Series 2001-HE17,
Class A1(a) |
|
| | 1,761 | | | | 0.799 | | | | 01/25/32 | | | | 1,484 | |
| First Alliance Mortgage Loan Trust Series 1999-4, Class A2(a) | |
| | 545 | | | | 0.940 | | | | 03/20/31 | | | | 444 | |
| GMAC Mortgage Corp. Loan Trust Series 2007-HE3, Class 1A1 | |
| | 157,988 | | | | 7.000 | | | | 09/25/37 | | | | 151,460 | |
| GMAC Mortgage Corp. Loan Trust Series 2007-HE3, Class 2A1 | |
| | 62,558 | | | | 7.000 | | | | 09/25/37 | | | | 60,542 | |
| Home Equity Asset Trust Series 2002-1, Class A4(a) | |
| | 257 | | | | 0.784 | | | | 11/25/32 | | | | 234 | |
| Renaissance Home Equity Loan Trust Series 2003-2, Class A(a) | |
| | 2,022 | | | | 0.624 | | | | 08/25/33 | | | | 1,893 | |
| Renaissance Home Equity Loan Trust Series 2003-3, Class A(a) | |
| | 4,975 | | | | 0.679 | | | | 12/25/33 | | | | 4,790 | |
| | | | | | | | | | | | | | |
| | | | | | | | | | | | | 703,484 | |
| | |
| | |
| 52 | | The accompanying notes are an integral part of these financial statements. |
GOLDMAN SACHS CORE PLUS FIXED INCOME FUND
| | | | | | | | | | | | | | |
Principal
Amount | | | Interest
Rate | | | Maturity
Date | | | Value | |
| | Asset-Backed Securities – (continued) | |
| | Student Loan(a) – 1.4% | |
| College Loan Corp. Trust Series 2004-1, Class A4 | |
| $ | 750,000 | | | | 0.456 | % | | | 04/25/24 | | | $ | 711,774 | |
| College Loan Corp. Trust Series 2006-1, Class A3 | |
| | 1,000,000 | | | | 0.356 | | | | 10/25/25 | | | | 991,761 | |
| Northstar Education Finance, Inc. Series 2005-1, Class A1 | |
| | 70,326 | | | | 0.364 | | | | 10/28/26 | | | | 70,011 | |
| Panhandle-Plains Higher Education Authority, Inc. Series 2010-2,
Class A1 |
|
| | 621,592 | | | | 1.378 | | | | 10/01/35 | | | | 631,807 | |
| South Carolina Student Loan Corp. Series 2005, Class A1 | |
| | 311,206 | | | | 0.361 | | | | 12/03/18 | | | | 310,443 | |
| South Carolina Student Loan Corp. Series 2006-1, Class A1 | |
| | 859,045 | | | | 0.350 | | | | 12/02/19 | | | | 852,642 | |
| US Education Loan Trust LLC Series 2006-1, Class A2(b) | |
| | 118,010 | | | | 0.390 | | | | 03/01/25 | | | | 117,607 | |
| | | | | | | | | | | | | | |
| | | | | | | | | | | | | 3,686,045 | |
| | |
| | TOTAL ASSET-BACKED SECURITIES | |
| | (Cost $28,470,660) | | | $ | 29,376,367 | |
| | |
| | | | | | | | | | | | | | |
| | Foreign Debt Obligations – 4.6% | |
| | Sovereign – 4.3% | |
| Dominican Republic | |
| DOP | 500,000 | | | | 14.500 | % | | | 02/10/23 | | | $ | 11,348 | |
| Republic of Chile | |
| $ | 910,000 | | | | 3.625 | | | | 10/30/42 | | | | 741,650 | |
| Republic of Indonesia | |
| | 430,000 | | | | 6.125 | (b) | | | 03/15/19 | | | | 444,513 | |
| | 230,000 | | | | 4.875 | | | | 05/05/21 | | | | 227,700 | |
| | 220,000 | | | | 3.375 | (b) | | | 04/15/23 | | | | 187,000 | |
| | 430,000 | | | | 8.500 | | | | 10/12/35 | | | | 521,375 | |
| Republic of Ivory Coast(h) | |
| | 1,168,000 | | | | 5.750 | | | | 12/31/32 | | | | 1,016,160 | |
| Republic of Slovenia | |
| | 750,000 | | | | 5.500 | (b) | | | 10/26/22 | | | | 699,375 | |
| | 200,000 | | | | 5.500 | | | | 10/26/22 | | | | 186,500 | |
| | 850,000 | | | | 5.850 | (b) | | | 05/10/23 | | | | 807,960 | |
| Republic of South Africa | |
| | 200,000 | | | | 5.875 | | | | 09/16/25 | | | | 211,250 | |
| Republic of Turkey | |
| | 820,000 | | | | 6.250 | | | | 09/26/22 | | | | 880,475 | |
| Republic of Venezuela | |
| | 90,000 | | | | 8.250 | | | | 10/13/24 | | | | 67,050 | |
| | 390,000 | | | | 9.250 | | | | 09/15/27 | | | | 315,900 | |
| Russian Federation(b) | |
| | 3,000,000 | | | | 4.875 | | | | 09/16/23 | | | | 3,075,000 | |
| United Mexican States | |
| MXN | 2,128,400 | | | | 6.500 | | | | 06/10/21 | | | | 170,496 | |
| | 425,600 | | | | 8.000 | | | | 12/07/23 | | | | 37,484 | |
| | 3,020,200 | | | | 7.500 | | | | 06/03/27 | | | | 253,867 | |
| | 1,424,600 | | | | 8.500 | | | | 05/31/29 | | | | 127,507 | |
| | 1,588,400 | | | | 7.750 | | | | 05/29/31 | | | | 131,040 | |
| | 7,700 | | | | 10.000 | | | | 11/20/36 | | | | 776 | |
| | 6,728,200 | | | | 7.750 | | | | 11/13/42 | | | | 545,702 | |
| | |
| | Foreign Debt Obligations – (continued) | |
| | Sovereign – (continued) | |
| $ | 660,000 | | | | 4.750 | | | | 03/08/44 | | | | 597,300 | |
| | | | | | | | | | | | | | |
| | | | | | | | | | | | | 11,257,428 | |
| | |
| | Supranational – 0.3% | |
| Inter-American Development Bank | |
| | 700,000 | | | | 1.000 | | | | 02/27/18 | | | | 680,290 | |
| | |
| | TOTAL FOREIGN DEBT OBLIGATIONS | | | | | |
| | (Cost $12,377,056) | | | | | | | $ | 11,937,718 | |
| | |
| | | | | | | | | | | | | | |
| | Structured Notes – 0.7% | |
| Notas do Tesouro Nacional Series B (Issuer HSBC Corp.) | |
| BRL $ | 3,790,640 | | | | 6.000 | % | | | 08/15/40 | | | $ | 1,740,957 | |
| | |
| | |
| | Municipal Debt Obligations – 5.6% | |
| | California – 1.8% | |
| California State GO Bonds (Refunding-Various Purposes)
Series 2013 |
|
| $ | 415,000 | | | | 5.000 | % | | | 09/01/28 | | | $ | 451,503 | |
| | 255,000 | | | | 5.000 | | | | 09/01/31 | | | | 271,391 | |
| | 365,000 | | | | 5.000 | | | | 09/01/32 | | | | 386,031 | |
| | 265,000 | | | | 5.000 | | | | 09/01/33 | | | | 280,052 | |
| California State GO Bonds (Various Purposes) Series 2013 | |
| | 255,000 | | | | 5.000 | | | | 09/01/27 | | | | 280,067 | |
| | 250,000 | | | | 5.000 | | | | 04/01/37 | | | | 258,595 | |
| | 660,000 | | | | 5.000 | | | | 04/01/43 | | | | 675,530 | |
| California State GO Bonds Build America Taxable Series 2009 | |
| | 210,000 | | | | 7.550 | | | | 04/01/39 | | | | 273,315 | |
| California State GO Bonds Build America Taxable Series 2010 | |
| | 625,000 | | | | 7.950 | | | | 03/01/36 | | | | 723,662 | |
| California State University Systemwide RB Series 2012 A | |
| | 395,000 | | | | 5.000 | | | | 11/01/37 | | | | 411,365 | |
| | 255,000 | | | | 5.000 | | | | 11/01/42 | | | | 263,063 | |
| City of Los Angeles CA Department of Water & Power RB
(Power System) Series 2012 B |
|
| | 250,000 | | | | 5.000 | | | | 07/01/43 | | | | 256,210 | |
| City of Los Angeles CA Department of Water & Power RB
Series 2012 B |
|
| | 250,000 | | | | 5.000 | | | | 07/01/43 | | | | 260,958 | |
| | | | | | | | | | | | | | |
| | | | | | | | | | | | | 4,791,742 | |
| | |
| | Florida – 0.1% | |
| Miami-Dade County FL Transit System Sales Surtax RB
(Sales Tax) Series 2012 |
|
| | 255,000 | | | | 5.000 | | | | 07/01/42 | | | | 258,953 | |
| | |
| | Georgia – 0.1% | |
| Private Colleges & Universities GA Authority RB
(Emory University) Series 2013 A |
|
| | 335,000 | | | | 5.000 | | | | 10/01/43 | | | | 355,847 | |
| | |
| | Illinois – 0.3% | |
| Illinois State GO Bonds Build America Series 2010 | |
| | 500,000 | | | | 7.350 | | | | 07/01/35 | | | | 531,650 | |
| | |
| | |
| The accompanying notes are an integral part of these financial statements. | | 53 |
GOLDMAN SACHS CORE PLUS FIXED INCOME FUND
Schedule of Investments (continued)
September 30, 2013 (Unaudited)
| | | | | | | | | | | | | | |
Principal
Amount | | | Interest
Rate | | | Maturity
Date | | | Value | |
| | Municipal Debt Obligations – (continued) | |
| | Illinois – (continued) | |
| Illinois State GO Bonds Taxable-Pension Series 2003 | |
| $ | 115,000 | | | | 5.100 | % | | | 06/01/33 | | | $ | 101,962 | |
| | | | | | | | | | | | | | |
| | | | | | | | | | | | | 633,612 | |
| | |
| | Louisiana – 0.1% | |
| Louisiana State Gas & Fuels Tax RB (Second Lien) Series 2010 B | |
| | 255,000 | | | | 5.000 | | | | 05/01/45 | | | | 262,474 | |
| | |
| | Massachusetts – 0.1% | |
| Massachusetts State Consolidated Loan GO Bonds Series 2013 E | |
| | 355,000 | | | | 5.000 | | | | 08/01/40 | | | | 372,793 | |
| | |
| | Missouri – 0.1% | |
| Metropolitan St. Louis MO Sewer District Wastewater System
RB Series 2012 A |
|
| | 250,000 | | | | 5.000 | | | | 05/01/42 | | | | 263,905 | |
| | |
| | New Jersey – 0.5% | |
| New Jersey State Economic Development Authority RB
(Rutgers University) Series 2013 |
|
| | 255,000 | | | | 5.000 | | | | 06/15/38 | | | | 266,959 | |
| New Jersey State Transportation Trust Fund Authority RB
(Transportation Program) Series 2013 AA |
|
| | 420,000 | | | | 5.000 | | | | 06/15/36 | | | | 431,012 | |
| | 290,000 | | | | 5.500 | | | | 06/15/39 | | | | 309,749 | |
| | 315,000 | | | | 5.000 | | | | 06/15/44 | | | | 319,086 | |
| | | | | | | | | | | | | | |
| | | | | | | | | | | | | 1,326,806 | |
| | |
| | New York – 1.6% | |
| New York City GO Bonds Series 2012 B | |
| | 250,000 | | | | 5.000 | | | | 08/01/24 | | | | 286,220 | |
| New York City GO Bonds (Refunding) Series 2012 F | |
| | 255,000 | | | | 5.000 | | | | 08/01/24 | | | | 290,108 | |
| New York City GO Bonds (Refunding) Series 2012 I | |
| | 250,000 | | | | 5.000 | | | | 08/01/24 | | | | 286,220 | |
| New York City GO Bonds (Refunding) Series 2013 I | |
| | 250,000 | | | | 5.000 | | | | 08/01/25 | | | | 284,963 | |
| New York City GO Bonds (Refunding) Series 2013 J | |
| | 250,000 | | | | 5.000 | | | | 08/01/24 | | | | 289,738 | |
| | 250,000 | | | | 5.000 | | | | 08/01/25 | | | | 286,090 | |
| New York City Transitional Finance Authority RB (Future Tax
Secured) Series 2012 E-1 |
|
| | 250,000 | | | | 5.000 | | | | 02/01/42 | | | | 259,115 | |
| New York City Water & Sewer System Finance Authority RB
(Refunding) Series 2011 AA |
|
| | 260,000 | | | | 5.000 | | | | 06/15/44 | | | | 267,852 | |
| New York City Water & Sewer System Finance Authority RB
(Second General) Series 2013 CC |
|
| | 505,000 | | | | 5.000 | | | | 06/15/47 | | | | 521,428 | |
| New York State Dormitory Authority Personal Income Tax RB
(General Purpose) Series 2013 A |
|
| | 255,000 | | | | 5.000 | | | | 02/15/43 | | | | 265,039 | |
| New York State Urban Development Corp. RB (Personal Income
Tax) Series 2013 C |
|
| | 320,000 | | | | 5.000 | | | | 03/15/30 | | | | 348,915 | |
| | 330,000 | | | | 5.000 | | | | 03/15/31 | | | | 357,641 | |
| | 340,000 | | | | 5.000 | | | | 03/15/32 | | | | 366,530 | |
| | | | | | | | | | | | | | |
| | | | | | | | | | | | | 4,109,859 | |
| | |
| | Municipal Debt Obligations – (continued) | |
| | Ohio – 0.4% | |
| American Municipal Power-Ohio, Inc. RB Build America
Taxable Series 2010 |
|
| $ | 250,000 | | | | 6.270 | % | | | 02/15/50 | | | $ | 257,385 | |
| Ohio State Turnpike Commission RB (Junior Lien-Infrastructure
Projects) Series 2013 A-1 |
|
| | 395,000 | | | | 5.000 | | | | 02/15/48 | | | | 398,804 | |
| Ohio State Turnpike Commission RB (Senior Lien) Series 2013 A | |
| | 250,000 | | | | 5.000 | | | | 02/15/48 | | | | 256,952 | |
| | | | | | | | | | | | | | |
| | | | | | | | | | | | | 913,141 | |
| | |
| | Pennsylvania – 0.1% | |
| Pennsylvania State Turnpike Commission RB Series 2013 C | |
| | 250,000 | | | | 5.000 | | | | 12/01/43 | | | | 253,365 | |
| | |
| | Texas – 0.1% | |
| North Texas Tollway Authority RB (Special Projects System)
Series 2011 A |
|
| | 255,000 | | | | 5.500 | | | | 09/01/41 | | | | 274,972 | |
| | |
| | Washington – 0.3% | |
| University of Washington RB (General) Series 2013 | |
| | 260,000 | | | | 5.000 | | | | 07/01/41 | | | | 272,028 | |
| Washington State GO Bonds (Various Purposes) Series 2013 A | |
| | 250,000 | | | | 5.000 | | | | 08/01/34 | | | | 265,955 | |
| | 300,000 | | | | 5.000 | | | | 08/01/35 | | | | 317,658 | |
| | | | | | | | | | | | | | |
| | | | | | | | | | | | | 855,641 | |
| | |
| | TOTAL MUNICIPAL DEBT OBLIGATIONS | |
| | (Cost $14,123,962) | | | $ | 14,673,110 | |
| | |
| | |
| | Government Guarantee Obligations – 1.4% | |
| Achmea Hypotheekbank NV(b)(i) | |
| $ | 145,000 | | | | 3.200 | % | | | 11/03/14 | | | $ | 149,396 | |
| Israel Government AID Bond(j) | |
| | 2,000,000 | | | | 5.500 | | | | 09/18/23 | | | | 2,384,279 | |
| | 200,000 | | | | 5.500 | | | | 12/04/23 | | | | 239,088 | |
| | 650,000 | | | | 5.500 | | | | 04/26/24 | | | | 777,666 | |
| | 40,000 | | | | 5.500 | | | | 09/18/33 | | | | 47,407 | |
| | |
| | TOTAL GOVERNMENT GUARANTEE OBLIGATIONS | |
| | (Cost $3,817,049) | | | $ | 3,597,836 | |
| | |
| | |
| | U.S. Treasury Obligations – 4.9% | |
| United States Treasury Bonds | |
| $ | 2,600,000 | | | | 3.125 | % | | | 11/15/41 | | | $ | 2,344,706 | |
| | 5,100,000 | | | | 3.125 | (g) | | | 02/15/42 | | | | 4,591,683 | |
| | 3,500,000 | | | | 3.625 | | | | 08/15/43 | | | | 3,459,820 | |
| United States Treasury Notes | |
| | 2,500,000 | | | | 1.375 | | | | 09/30/18 | | | | 2,498,200 | |
| | |
| | TOTAL U.S. TREASURY OBLIGATIONS | |
| | (Cost $13,793,554) | | | $ | 12,894,409 | |
| | |
| | |
| 54 | | The accompanying notes are an integral part of these financial statements. |
GOLDMAN SACHS CORE PLUS FIXED INCOME FUND
| | | | | | | | | | | | | | |
Notional
Amount | | | Exercise
Rate | | | Expiration
Date | | | Value | |
| | Options Purchased – 2.2% | |
| | Interest Rate Swaptions | |
| Bank of America NA Call - OTC - 10 year Interest Rate Swap
Strike Price 3.590% |
|
| $ | 8,700,000 | | | | 3.590 | % | | | 03/22/16 | | | $ | 534,652 | |
| Bank of America NA Call - OTC - 10 year Interest Rate Swap
Strike Price 4.070% |
|
| | 8,000,000 | | | | 4.070 | | | | 03/29/16 | | | | 347,528 | |
| Citibank NA Put - OTC - 10 year Interest Rate Swap Strike
Price 3.017% |
|
| | 4,500,000 | | | | 3.017 | | | | 05/29/15 | | | | 110,240 | |
| Citibank NA Call - OTC - 10 year Interest Rate Swap Strike
Price 3.017% |
|
| | 4,500,000 | | | | 3.017 | | | | 05/29/15 | | | | 296,362 | |
| Citibank NA Call - OTC - 10 year Interest Rate Swap Strike
Price 3.570% |
|
| | 7,300,000 | | | | 3.570 | | | | 02/22/16 | | | | 440,797 | |
| Citibank NA Call - OTC - 10 year Interest Rate Swap Strike
Price 3.625% |
|
| | 7,000,000 | | | | 3.625 | | | | 02/22/16 | | | | 406,119 | |
| Citibank NA Call - OTC - 10 year Interest Rate Swap Strike
Price 3.645% |
|
| | 7,600,000 | | | | 3.645 | | | | 02/16/16 | | | | 431,436 | |
| Deutsche Bank Securities, Inc. Call - OTC - 2 year Interest Rate
Swap Strike Price 1.950% |
|
| | 23,600,000 | | | | 1.950 | | | | 10/26/15 | | | | 247,215 | |
| Deutsche Bank Securities, Inc. Call - OTC - 2 year Interest Rate
Swap Strike Price 2.030% |
|
| | 23,500,000 | | | | 2.030 | | | | 10/26/15 | | | | 232,037 | |
| JPMorgan Chase Bank NA Call - OTC - 2 year Interest Rate
Swap Strike Price 1.855% |
|
| | 22,700,000 | | | | 1.855 | | | | 11/02/15 | | | | 260,378 | |
| JPMorgan Chase Bank NA Call - OTC - 10year Interest Rate
Swap Strike Price 3.610% |
|
| | 6,900,000 | | | | 3.610 | | | | 02/16/16 | | | | 401,890 | |
| Morgan Stanley Capital Services, Inc. Call - OTC - 10 year
Interest Rate Swap Strike Price 3.652% |
|
| | 19,700,000 | | | | 3.652 | | | | 02/22/16 | | | | 1,120,564 | |
| Morgan Stanley Capital Services, Inc. Call - OTC - 10 year
Interest Rate Swap Strike Price 3.620% |
|
| | 13,700,000 | | | | 3.620 | | | | 03/07/16 | | | | 810,003 | |
| | |
| | TOTAL OPTIONS PURCHASED – 2.2% | |
| | (Cost $3,697,796) | | | $ | 5,639,221 | |
| | |
| TOTAL INVESTMENTS BEFORE
SHORT-TERM INVESTMENT |
|
| | (Cost $259,049,030) | | | $ | 266,343,179 | |
| | |
Principal
Amount | | | Interest
Rate | | | Maturity
Date | | | Value | |
| | Short-term Investment(k) – 3.9% | |
| | Repurchase Agreement – 3.9% | |
| Joint Repurchase Agreement Account II | |
| $ | 10,200,000 | | | | 0.083 | % | | | 10/01/13 | | | $ | 10,200,000 | |
| | (Cost $10,200,000) | |
| | |
| | TOTAL INVESTMENTS – 106.0% | |
| | (Cost $269,249,030) | | | $ | 276,543,179 | |
| | |
| LIABILITIES IN EXCESS OF
OTHER ASSETS – (6.0)% |
| | | (15,640,018 | ) |
| | |
| | NET ASSETS – 100.0% | | | $ | 260,903,161 | |
| | |
| | |
| The percentage shown for each investment category reflects the value of investments in that category as a percentage of net assets. |
(a) | | Variable rate security. Interest rate disclosed is that which is in effect at September 30, 2013. |
(b) | | Exempt from registration under Rule 144A of the Securities Act of 1933. Under procedures approved by the Board of Trustees, such securities have been determined to be liquid by the investment adviser and may be resold, normally to qualified institutional buyers in transactions exempt from registration. Total market value of Rule 144A securities amounts to $47,051,226, which represents approximately 18.0% of net assets as of September 30, 2013. |
(c) | | Security with “Call” features with resetting interest rates. Maturity dates disclosed are the final maturity dates. |
(d) | | Security with “Put” features and resetting interest rates. Maturity dates disclosed are the puttable dates. Interest rate disclosed is that which is in effect at September 30, 2013. |
(e) | | Security with a notional or nominal principal amount. The actual effective yield of this security is different than the stated interest rate. |
(f) | | TBA (To Be Announced) Securities are purchased on a forward commitment basis with an approximate principal amount and no defined maturity date. The actual principal and maturity date will be determined upon settlement when the specific mortgage pools are assigned. Total market value of TBA securities (excluding forward sales contracts, if any) amounts to $16,572,343 which represents approximately 6.4% of net assets as of September 30, 2013. |
(g) | | A portion of this security is segregated as collateral for initial margin requirements on futures transactions. |
(h) | | Coupon increases periodically based upon a predetermined schedule. Stated interest rate in effect at September 30, 2013. |
(i) | | Guaranteed by a foreign government until maturity. Total market value of these securities amounts to $149,396, which represents approximately 0.1% of net assets as of September 30, 2013. |
(j) | | Guaranteed by United States Government until maturity. Total market value of these securities amounts to $3,448,440, which represents approximately 1.3% of net assets as of September 30, 2013. |
(k) | | Joint repurchase agreement was entered into on September 30, 2013. Additional information appears on page 115. |
| | |
| The accompanying notes are an integral part of these financial statements. | | 55 |
GOLDMAN SACHS CORE PLUS FIXED INCOME FUND
Schedule of Investments (continued)
September 30, 2013 (Unaudited)
| | |
|
Currency Abbreviations: |
AUD | | —Australian Dollar |
BRL | | —Brazilian Real |
CAD | | —Canadian Dollar |
CHF | | —Swiss Franc |
CLP | | —Chilean Peso |
CZK | | —Czech Koruna |
DOP | | —Dominican Peso |
EUR | | —Euro |
GBP | | —British Pound |
HUF | | —Hungarian Forint |
IDR | | —Indonesian Rupiah |
ILS | | —Israeli Shekel |
JPY | | —Japanese Yen |
KRW | | —South Korean Won |
MXN | | —Mexican Peso |
MYR | | —Malaysian Ringgit |
NOK | | —Norwegian Krone |
NZD | | —New Zealand Dollar |
PHP | | —Philippine Peso |
PLN | | —Polish Zloty |
RUB | | —Russian Ruble |
SEK | | —Swedish Krona |
SGD | | —Singapore Dollar |
TRY | | —Turkish Lira |
TWD | | —Taiwan Dollar |
USD | | —U.S. Dollar |
ZAR | | —South African Rand |
| | |
Investment Abbreviations: |
AUDOR | | —Australian Dollar Offered Rate |
BP | | —British Pound Offered Rate |
CDOR | | —Canadian Dollar Offered Rate |
CLO | | —Collateralized Loan Obligation |
EURO | | —Euro Offered Rate |
FHLB | | —Federal Home Loan Bank |
FHLMC | | —Federal Home Loan Mortgage Corp. |
FNMA | | —Federal National Mortgage Association |
FREMF | | —Freddie Mac Multi Family |
GNMA | | —Government National Mortgage Association |
GO | | —General Obligation |
JYOR | | —Japanese Yen Offered Rate |
KWCDC | | —South Korean Won Certificate of Deposit |
LIBOR | | —London Interbank Offered Rate |
MYROR | | —Malaysian Ringgit Offered Rate |
NCUA | | —National Credit Union Administration |
NIBOR | | —Norwegian Interbank Offered Rate |
NZDOR | | —New Zealand Dollar Offered Rate |
OTC | | —Over the Counter |
RB | | —Revenue Bond |
REMIC | | —Real Estate Mortgage Investment Conduit |
SPA | | —Stand-by Purchase Agreement |
STIBOR | | —Stockholm Interbank Offered Rate |
WIBOR | | —Warsaw Interbank Offered Rate |
|
| | |
| 56 | | The accompanying notes are an integral part of these financial statements. |
GOLDMAN SACHS CORE PLUS FIXED INCOME FUND
|
| ADDITIONAL INVESTMENT INFORMATION |
FORWARD FOREIGN CURRENCY EXCHANGE CONTRACTS — At September 30, 2013, the Fund had the following forward foreign currency exchange contracts:
FORWARD FOREIGN CURRENCY EXCHANGE CONTRACTS WITH UNREALIZED GAIN
| | | | | | | | | | | | | | |
| Counterparty | | Contracts to
Buy/Sell | | Settlement
Date | | | Current
Value | | | Unrealized
Gain | |
Bank of America Securities LLC | | CZK/EUR | | | 12/18/13 | | | $ | 109,604 | | | $ | 37 | |
| | EUR/USD | | | 12/18/13 | | | | 392,408 | | | | 6,789 | |
| | HUF/EUR | | | 12/18/13 | | | | 286,758 | | | | 286 | |
| | PLN/USD | | | 12/18/13 | | | | 439,301 | | | | 2,301 | |
Barclays Bank PLC | | EUR/USD | | | 10/25/13 | | | | 494,347 | | | | 9,020 | |
| | EUR/USD | | | 12/18/13 | | | | 280,098 | | | | 4,329 | |
| | GBP/EUR | | | 12/18/13 | | | | 503,364 | | | | 3,402 | |
| | HUF/EUR | | | 12/18/13 | | | | 110,957 | | | | 582 | |
| | NOK/USD | | | 12/18/13 | | | | 188,370 | | | | 2,299 | |
| | USD/IDR | | | 11/19/13 | | | | 132,405 | | | | 6,595 | |
| | USD/MYR | | | 10/11/13 | | | | 217,583 | | | | 1,417 | |
| | USD/PHP | | | 10/17/13 | | | | 179,296 | | | | 3,704 | |
BNP Paribas SA | | GBP/USD | | | 12/18/13 | | | | 868,614 | | | | 30,963 | |
Citibank NA | | EUR/USD | | | 12/18/13 | | | | 2,336,684 | | | | 31,254 | |
| | GBP/EUR | | | 12/18/13 | | | | 221,913 | | | | 115 | |
| | MXN/USD | | | 12/18/13 | | | | 174,851 | | | | 1,101 | |
| | NZD/USD | | | 12/18/13 | | | | 109,859 | | | | 1,404 | |
| | PHP/USD | | | 10/11/13 | | | | 140,055 | | | | 1,055 | |
| | RUB/USD | | | 10/07/13 | | | | 143,586 | | | | 4,586 | |
| | USD/IDR | | | 10/24/13 | | | | 135,003 | | | | 2,997 | |
| | USD/RUB | | | 10/10/13 | | | | 235,228 | | | | 772 | |
| | USD/RUB | | | 10/24/13 | | | | 106,996 | | | | 2,004 | |
Credit Suisse International (London) | | JPY/USD | | | 12/18/13 | | | | 109,731 | | | | 731 | |
| | RUB/USD | | | 10/07/13 | | | | 144,016 | | | | 5,016 | |
| | RUB/USD | | | 10/10/13 | | | | 571,024 | | | | 17,024 | |
| | USD/RUB | | | 10/17/13 | | | | 218,288 | | | | 712 | |
Deutsche Bank AG (London) | | ILS/USD | | | 12/18/13 | | | | 109,159 | | | | 159 | |
| | MYR/USD | | | 10/03/13 | | | | 281,861 | | | | 2,861 | |
| | TWD/USD | | | 10/15/13 | | | | 138,481 | | | | 481 | |
| | USD/MXN | | | 12/18/13 | | | | 107,811 | | | | 1,189 | |
HSBC Bank PLC | | EUR/SEK | | | 12/18/13 | | | | 109,476 | | | | 128 | |
| | KRW/USD | | | 10/23/13 | | | | 109,558 | | | | 558 | |
| | MYR/USD | | | 10/03/13 | | | | 282,622 | | | | 4,622 | |
| | MYR/USD | | | 10/11/13 | | | | 281,179 | | | | 4,179 | |
JPMorgan Securities, Inc. | | EUR/NOK | | | 12/18/13 | | | | 598,125 | | | | 10,784 | |
| | JPY/USD | | | 12/18/13 | | | | 328,071 | | | | 1,071 | |
| | USD/TRY | | | 12/18/13 | | | | 107,829 | | | | 138 | |
Morgan Stanley Capital Services, Inc. | | BRL/USD | | | 10/15/13 | | | | 302,363 | | | | 1,474 | |
| | HUF/EUR | | | 12/18/13 | | | | 110,957 | | | | 612 | |
| | RUB/USD | | | 10/15/13 | | | | 280,425 | | | | 4,425 | |
| | USD/MXN | | | 12/18/13 | | | | 214,429 | | | | 3,571 | |
Royal Bank of Canada | | BRL/USD | | | 10/07/13 | | | | 147,832 | | | | 8,832 | |
| | BRL/USD | | | 10/11/13 | | | | 143,454 | | | | 5,454 | |
| | BRL/USD | | | 10/18/13 | | | | 111,132 | | | | 2,132 | |
| | MXN/USD | | | 12/18/13 | | | | 138,897 | | | | 897 | |
Royal Bank of Scotland PLC | | CHF/USD | | | 12/18/13 | | | | 271,682 | | | | 6,728 | |
| | GBP/USD | | | 12/18/13 | | | | 142,381 | | | | 3,683 | |
| | JPY/USD | | | 12/18/13 | | | | 242,741 | | | | 1,397 | |
Standard Chartered Bank | | SGD/USD | | | 12/18/13 | | | | 109,562 | | | | 562 | |
| | |
| The accompanying notes are an integral part of these financial statements. | | 57 |
GOLDMAN SACHS CORE PLUS FIXED INCOME FUND
Schedule of Investments (continued)
September 30, 2013 (Unaudited)
|
| ADDITIONAL INVESTMENT INFORMATION (continued) |
FORWARD FOREIGN CURRENCY EXCHANGE CONTRACTS WITH UNREALIZED GAIN (continued)
| | | | | | | | | | | | | | |
| Counterparty | | Contracts to
Buy/Sell | | Settlement
Date | | | Current
Value | | | Unrealized
Gain | |
State Street Bank | | GBP/EUR | | | 12/18/13 | | | $ | 282,804 | | | $ | 236 | |
| | JPY/USD | | | 12/18/13 | | | | 437,574 | | | | 574 | |
| | MXN/USD | | | 12/18/13 | | | | 139,079 | | | | 1,079 | |
| | USD/MXN | | | 12/18/13 | | | | 217,291 | | | | 1,709 | |
UBS AG (London) | | BRL/USD | | | 10/18/13 | | | | 110,985 | | | | 1,985 | |
| | MYR/USD | | | 10/11/13 | | | | 138,503 | | | | 503 | |
| | PHP/USD | | | 10/07/13 | | | | 283,222 | | | | 5,222 | |
| | PHP/USD | | | 10/11/13 | | | | 138,596 | | | | 596 | |
| | TWD/USD | | | 10/11/13 | | | | 277,322 | | | | 322 | |
| | USD/IDR | | | 11/19/13 | | | | 260,570 | | | | 20,430 | |
| | USD/ZAR | | | 12/18/13 | | | | 214,507 | | | | 4,493 | |
Westpac Banking Corp. | | AUD/USD | | | 12/18/13 | | | | 844,112 | | | | 16,210 | |
| | NZD/AUD | | | 12/18/13 | | | | 138,287 | | | | 1,670 | |
| | USD/AUD | | | 12/18/13 | | | | 648,743 | | | | 2,691 | |
| | | USD/MYR | | | 10/23/13 | | | | 214,721 | | | | 2,623 | |
| TOTAL | | | | | | | | | | | | $ | 266,775 | |
FORWARD FOREIGN CURRENCY EXCHANGE CONTRACTS WITH UNREALIZED LOSS
| | | | | | | | | | | | | | |
| Counterparty | | Contracts to
Buy/Sell | | Settlement
Date | | | Current
Value | | | Unrealized
Loss | |
Bank of America Securities LLC | | CZK/EUR | | | 12/18/13 | | | $ | 109,604 | | | $ | (186 | ) |
| | EUR/PLN | | | 12/18/13 | | | | 288,866 | | | | (4,032 | ) |
| | HUF/EUR | | | 12/18/13 | | | | 108,250 | | | | (593 | ) |
| | TRY/USD | | | 12/18/13 | | | | 213,189 | | | | (5,811 | ) |
| | USD/EUR | | | 12/18/13 | | | | 443,827 | | | | (5,949 | ) |
| | USD/MYR | | | 10/03/13 | | | | 140,241 | | | | (1,241 | ) |
Barclays Bank PLC | | EUR/GBP | | | 12/18/13 | | | | 109,740 | | | | (136 | ) |
| | MXN/USD | | | 12/18/13 | | | | 105,727 | | | | (3,273 | ) |
| | NOK/EUR | | | 12/18/13 | | | | 140,726 | | | | (4,408 | ) |
| | USD/TRY | | | 12/18/13 | | | | 139,023 | | | | (1,023 | ) |
| | USD/ZAR | | | 12/18/13 | | | | 218,437 | | | | (437 | ) |
| | ZAR/USD | | | 12/18/13 | | | | 518,847 | | | | (4,153 | ) |
BNP Paribas SA | | EUR/GBP | | | 12/18/13 | | | | 862,596 | | | | (7,417 | ) |
| | RUB/USD | | | 10/15/13 | | | | 285,282 | | | | (5,024 | ) |
| | USD/JPY | | | 12/18/13 | | | | 562,898 | | | | (5,017 | ) |
Citibank NA | | EUR/GBP | | | 12/18/13 | | | | 143,134 | | | | (1,055 | ) |
| | MYR/USD | | | 10/23/13 | | | | 210,531 | | | | (6,469 | ) |
| | PHP/USD | | | 10/17/13 | | | | 218,576 | | | | (424 | ) |
| | RUB/USD | | | 10/17/13 | | | | 218,823 | | | | (177 | ) |
| | TRY/USD | | | 12/18/13 | | | | 106,365 | | | | (3,635 | ) |
| | USD/CAD | | | 12/18/13 | | | | 733,095 | | | | (1,281 | ) |
| | USD/GBP | | | 12/18/13 | | | | 1,098,597 | | | | (26,493 | ) |
| | USD/JPY | | | 12/18/13 | | | | 109,017 | | | | (17 | ) |
| | USD/MXN | | | 12/18/13 | | | | 139,503 | | | | (503 | ) |
| | USD/MYR | | | 10/03/13 | | | | 139,900 | | | | (900 | ) |
| | USD/MYR | | | 10/18/13 | | | | 218,434 | | | | (434 | ) |
| | USD/RUB | | | 10/10/13 | | | | 283,312 | | | | (6,312 | ) |
| | USD/RUB | | | 10/21/13 | | | | 109,029 | | | | (29 | ) |
| | USD/TRY | | | 12/18/13 | | | | 142,848 | | | | (3,848 | ) |
| | |
| 58 | | The accompanying notes are an integral part of these financial statements. |
GOLDMAN SACHS CORE PLUS FIXED INCOME FUND
|
| ADDITIONAL INVESTMENT INFORMATION (continued) |
FORWARD FOREIGN CURRENCY EXCHANGE CONTRACTS WITH UNREALIZED LOSS (continued)
| | | | | | | | | | | | | | |
| Counterparty | | Contracts to
Buy/Sell | | Settlement
Date | | | Current
Value | | | Unrealized
Loss | |
Credit Suisse International (London) | | CLP/USD | | | 10/16/13 | | | $ | 164,646 | | | $ | (337 | ) |
| | CLP/USD | | | 10/25/13 | | | | 107,178 | | | | (1,822 | ) |
| | EUR/CHF | | | 12/18/13 | | | | 142,343 | | | | (1,617 | ) |
| | RUB/USD | | | 10/21/13 | | | | 212,404 | | | | (5,596 | ) |
| | USD/JPY | | | 12/18/13 | | | | 278,466 | | | | (2,466 | ) |
| | USD/MXN | | | 10/30/13 | | | | 938,339 | | | | (1,406 | ) |
| | USD/RUB | | | 10/07/13 | | | | 285,246 | | | | (9,246 | ) |
| | USD/RUB | | | 10/15/13 | | | | 139,423 | | | | (1,423 | ) |
Deutsche Bank AG (London) | | AUD/USD | | | 12/18/13 | | | | 325,764 | | | | (122 | ) |
| | CNH/USD | | | 12/18/13 | | | | 312,045 | | | | (128 | ) |
| | ILS/USD | | | 12/18/13 | | | | 107,992 | | | | (1,008 | ) |
| | MYR/USD | | | 10/18/13 | | | | 104,168 | | | | (832 | ) |
| | MYR/USD | | | 10/23/13 | | | | 105,424 | | | | (3,576 | ) |
| | USD/CNH | | | 12/18/13 | | | | 598,190 | | | | (134 | ) |
| | USD/CNH | | | 01/08/14 | | | | 587,534 | | | | (7,534 | ) |
| | USD/CZK | | | 12/18/13 | | | | 334,756 | | | | (7,828 | ) |
| | USD/EUR | | | 12/18/13 | | | | 219,207 | | | | (726 | ) |
| | USD/MXN | | | 10/30/13 | | | | 302,841 | | | | (2,839 | ) |
| | USD/PHP | | | 10/17/13 | | | | 55,044 | | | | (44 | ) |
| | USD/PLN | | | 12/18/13 | | | | 353,396 | | | | (5,380 | ) |
| | USD/RUB | | | 10/15/13 | | | | 75,895 | | | | (754 | ) |
HSBC Bank PLC | | USD/AUD | | | 12/18/13 | | | | 139,215 | | | | (1,852 | ) |
| | USD/MYR | | | 10/03/13 | | | | 141,310 | | | | (2,310 | ) |
| | USD/SEK | | | 12/18/13 | | | | 462,484 | | | | (6,386 | ) |
JPMorgan Securities, Inc. | | MXN/USD | | | 12/18/13 | | | | 431,091 | | | | (5,909 | ) |
| | NOK/EUR | | | 12/18/13 | | | | 426,237 | | | | (8,575 | ) |
| | USD/BRL | | | 10/17/13 | | | | 1,760,431 | | | | (66,461 | ) |
| | USD/EUR | | | 10/25/13 | | | | 4,660,498 | | | | (97,717 | ) |
| | USD/EUR | | | 12/18/13 | | | | 765,872 | | | | (3,702 | ) |
| | USD/HUF | | | 12/18/13 | | | | 617,809 | | | | (17,843 | ) |
| | USD/IDR | | | 10/07/13 | | | | 21,205 | | | | (205 | ) |
| | USD/RUB | | | 10/15/13 | | | | 63,782 | | | | (782 | ) |
| | USD/TRY | | | 12/18/13 | | | | 396,409 | | | | (6,433 | ) |
Morgan Stanley Capital Services, Inc. | | MXN/JPY | | | 12/18/13 | | | | 109,632 | | | | (4,272 | ) |
| | NZD/USD | | | 12/18/13 | | | | 213,935 | | | | (2,722 | ) |
| | USD/BRL | | | 11/04/13 | | | | 109,863 | | | | (863 | ) |
| | USD/ILS | | | 12/18/13 | | | | 293,427 | | | | (3,374 | ) |
Royal Bank of Canada | | CAD/USD | | | 12/18/13 | | | | 542,686 | | | | (3,314 | ) |
| | USD/BRL | | | 10/15/13 | | | | 141,855 | | | | (3,855 | ) |
| | USD/BRL | | | 10/18/13 | | | | 240,267 | | | | (4,267 | ) |
| | USD/CAD | | | 12/18/13 | | | | 196,642 | | | | (142 | ) |
| | USD/GBP | | | 10/24/13 | | | | 2,625,339 | | | | (62,480 | ) |
| | USD/NZD | | | 12/18/13 | | | | 272,298 | | | | (9,979 | ) |
Royal Bank of Scotland PLC | | TRY/USD | | | 12/18/13 | | | | 923,190 | | | | (18,053 | ) |
| | USD/EUR | | | 12/18/13 | | | | 292,506 | | | | (3,943 | ) |
| | USD/GBP | | | 12/18/13 | | | | 218,425 | | | | (703 | ) |
| | USD/TRY | | | 12/18/13 | | | | 139,709 | | | | (1,709 | ) |
Standard Chartered Bank | | IDR/USD | | | 10/24/13 | | | | 207,841 | | | | (13,572 | ) |
| | USD/SGD | | | 12/18/13 | | | | 157,280 | | | | (2,708 | ) |
| | USD/TRY | | | 12/18/13 | | | | 427,101 | | | | (1,790 | ) |
State Street Bank | | MXN/USD | | | 12/18/13 | | | | 214,001 | | | | (4,999 | ) |
| | NOK/EUR | | | 12/18/13 | | | | 230,124 | | | | (7,307 | ) |
| | |
| The accompanying notes are an integral part of these financial statements. | | 59 |
GOLDMAN SACHS CORE PLUS FIXED INCOME FUND
Schedule of Investments (continued)
September 30, 2013 (Unaudited)
|
| ADDITIONAL INVESTMENT INFORMATION (continued) |
FORWARD FOREIGN CURRENCY EXCHANGE CONTRACTS WITH UNREALIZED LOSS (continued)
| | | | | | | | | | | | | | |
| Counterparty | | Contracts to
Buy/Sell | | Settlement
Date | | | Current
Value | | | Unrealized
Loss | |
State Street Bank (continued) | | USD/AUD | | | 12/18/13 | | | $ | 138,287 | | | $ | (1,097 | ) |
| | USD/CHF | | | 12/18/13 | | | | 702,959 | | | | (19,636 | ) |
| | USD/EUR | | | 12/18/13 | | | | 109,604 | | | | (19 | ) |
| | USD/JPY | | | 12/18/13 | | | | 282,257 | | | | (5,257 | ) |
UBS AG (London) | | RUB/USD | | | 10/24/13 | | | | 214,973 | | | | (3,027 | ) |
| | USD/BRL | | | 10/07/13 | | | | 146,906 | | | | (7,906 | ) |
| | USD/BRL | | | 10/11/13 | | | | 142,591 | | | | (4,591 | ) |
| | USD/IDR | | | 10/07/13 | | | | 99,737 | | | | (1,617 | ) |
| | USD/ZAR | | | 12/18/13 | | | | 328,876 | | | | (1,876 | ) |
| | ZAR/USD | | | 12/18/13 | | | | 351,219 | | | | (5,781 | ) |
Westpac Banking Corp. | | AUD/USD | | | 12/18/13 | | | | 428,783 | | | | (4,882 | ) |
| | EUR/USD | | | 12/18/13 | | | | 217,854 | | | | (212 | ) |
| | USD/AUD | | | 12/18/13 | | | | 276,574 | | | | (1,445 | ) |
| | | USD/EUR | | | 12/18/13 | | | | 217,854 | | | | (316 | ) |
| TOTAL | | | | | | | | | | | | $ | (580,984 | ) |
FORWARD SALES CONTRACTS — At September 30, 2013, the Fund had the following forward sales contracts:
| | | | | | | | | | | | | | | | | | |
| Description | | Interest
Rate | | | Maturity
Date(f) | | Settlement
Date | | | Principal
Amount | | | Value | |
FHLMC | | | 5.000 | % | | TBA-30yr | | | 10/10/2013 | | | $ | (2,000,000 | ) | | $ | (2,157,188 | ) |
FNMA | | | 2.500 | | | TBA-30yr | | | 10/10/2013 | | | | (2,000,000 | ) | | | (1,859,688 | ) |
GNMA | | | 2.500 | | | TBA-30yr | | | 10/21/2013 | | | | (3,000,000 | ) | | | (2,795,156 | ) |
| TOTAL (Proceeds Receivable: $6,680,625) | | | | | | | $ | (6,812,032 | ) |
FUTURES CONTRACTS — At September 30, 2013, the Fund had the following futures contracts:
| | | | | | | | | | | | | | |
| Type | | Number of
Contracts
Long (Short) | | | Expiration
Date | | Current
Value | | | Unrealized
Gain (Loss) | |
Eurodollars | | | 64 | | | September 2014 | | $ | 21,554,696 | | | $ | 38,850 | |
Eurodollars | | | 8 | | | December 2014 | | | 2,692,578 | | | | 5,651 | |
Eurodollars | | | 62 | | | March 2015 | | | 20,851,755 | | | | 30,178 | |
French 10 Year Government Bonds | | | 1 | | | December 2013 | | | 179,239 | | | | 2,934 | |
Italian 10 Year Government Bonds | | | (7 | ) | | December 2013 | | | (1,045,293 | ) | | | 515 | |
Ultra Long U.S. Treasury Bonds | | | 23 | | | December 2013 | | | 3,268,156 | | | | (5,231 | ) |
5 Year German Euro-Bobl | | | 1 | | | December 2013 | | | 168,349 | | | | 1,946 | |
10 Year German Euro-Bund | | | 6 | | | December 2013 | | | 1,140,453 | | | | 19,876 | |
2 Year U.S. Treasury Notes | | | 11 | | | December 2013 | | | 2,422,922 | | | | 3,591 | |
5 Year U.S. Treasury Notes | | | (215 | ) | | December 2013 | | | (26,025,078 | ) | | | (217,451 | ) |
10 Year U.S. Treasury Notes | | | 642 | | | December 2013 | | | 81,142,781 | | | | 1,099,424 | |
20 Year U.S. Treasury Bonds | | | 309 | | | December 2013 | | | 41,212,875 | | | | 886,431 | |
| TOTAL | | | | | | | | | | | | $ | 1,866,714 | |
| | |
| 60 | | The accompanying notes are an integral part of these financial statements. |
GOLDMAN SACHS CORE PLUS FIXED INCOME FUND
|
| ADDITIONAL INVESTMENT INFORMATION (continued) |
SWAP CONTRACTS — At September 30, 2013, the Fund had the following swap contracts:
OVER THE COUNTER INTEREST RATE SWAP CONTRACTS
| | | | | | | | | | | | | | | | | | | | | | | | |
| | | | | | | | | | | | Rates Exchanged | | Market Value | |
| Counterparty | | Notional
Amount
(000s) | | | Termination
Date | | | Payments
Received | | Payments
Made | | Upfront
Payments
Made (Received) | | | Unrealized
Gain (Loss) | |
Bank of America Securities LLC | | | BRL | | | | 6,090 | | | | 01/04/16 | | | 10.390% | | 1 month Brazilian
Interbank Deposit
Average | | $ | — | | | $ | (19,529 | ) |
| | | CAD | | | | 6,200 | (a) | | | 12/20/25 | | | 2.910 | | 6 month CDOR | | | — | | | | (408,809 | ) |
| | | | | | | 300 | | | | 06/27/33 | | | 6 month CDOR | | 3.475% | | | — | | | | 3,855 | |
| | | | | | | 3,600 | (a) | | | 12/20/35 | | | 6 month CDOR | | 3.000 | | | — | | | | 451,525 | |
Barclays Bank PLC | | | BRL | | | | 2,190 | | | | 01/04/16 | | | 10.300 | | 1 month Brazilian
Interbank Deposit
Average | | | — | | | | (8,778 | ) |
| | | MYR | | | | 380 | | | | 08/14/23 | | | 3 month MYROR | | 4.485 | | | — | | | | (3,348 | ) |
Citibank NA | | | BRL | | | | 2,480 | | | | 01/04/16 | | | 10.090 | | 1 month Brazilian
Interbank Deposit
Average | | | — | | | | (14,449 | ) |
| | | NZD | | | | 610 | (a) | | | 12/18/18 | | | 3 month NZDOR | | 3.500 | | | 10,634 | | | | 11,000 | |
| | | KRW | | | | 2,257,900 | | | | 08/08/23 | | | 3 month KWCDC | | 3.450 | | | — | | | | (23,262 | ) |
| | | | | | | 231,040 | | | | 08/16/23 | | | 3 month KWCDC | | 3.485 | | | — | | | | (2,979 | ) |
| | | $ | | | | 2,800 | (a) | | | 02/18/26 | | | 3.145 | | 3 month LIBOR | | | — | | | | (150,131 | ) |
| | | | | | | 2,600 | (a) | | | 02/24/26 | | | 3.125 | | 3 month LIBOR | | | — | | | | (145,123 | ) |
| | | | | | | 2,700 | (a) | | | 02/24/26 | | | 3.070 | | 3 month LIBOR | | | — | | | | (163,320 | ) |
Credit Suisse International (London) | | | NZD | | | | 1,710 | (a) | | | 12/18/18 | | | 3 month NZDOR | | 3.500 | | | 47,801 | | | | 12,846 | |
Deutsche Bank Securities, Inc. | | | $ | | | | 10,600 | (a) | | | 10/30/17 | | | 1.450 | | 3 month LIBOR | | | — | | | | (99,930 | ) |
| | | | | | | 10,600 | (a) | | | 10/30/17 | | | 1.530 | | 3 month LIBOR | | | — | | | | (83,303 | ) |
| | | MYR | | | | 330 | | | | 08/14/23 | | | 3 month MYROR | | 4.490 | | | — | | | | (2,952 | ) |
| | | NZD | | | | 1,340 | (a) | | | 12/18/23 | | | 3 month NZDOR | | 4.000 | | | 24,808 | | | | 56,784 | |
JPMorgan Securities, Inc. | | | BRL | | | | 5,220 | | | | 01/02/15 | | | 8.155 | | 1 month Brazilian
Interbank Deposit
Average | | | — | | | | (48,878 | ) |
| | | $ | | | | 10,200 | (a) | | | 11/06/17 | | | 1.355 | | 3 month LIBOR | | | — | | | | (119,001 | ) |
| | | KRW | | | | 291,170 | | | | 08/21/23 | | | 3 month KWCDC | | 3.563 | | | — | | | | (5,533 | ) |
| | | MYR | | | | 420 | | | | 09/26/23 | | | 3 month MYROR | | 4.330 | | | — | | | | (80 | ) |
| | | $ | | | | 2,600 | (a) | | | 02/18/26 | | | 3.110 | | 3 month LIBOR | | | — | | | | (147,142 | ) |
Morgan Stanley Capital Services, Inc. | | | KRW | | | | 225,810 | | | | 08/16/23 | | | 3 month KWCDC | | 3.485 | | | — | | | | (2,912 | ) |
| | | $ | | | | 7,800 | (a) | | | 02/18/26 | | | 3.130 | | 3 month LIBOR | | | — | | | | (428,166 | ) |
| | | | | | | 7,400 | (a) | | | 02/24/26 | | | 3.152 | | 3 month LIBOR | | | — | | | | (396,069 | ) |
| | | | | | | | 5,000 | (a) | | | 03/09/26 | | | 3.120 | | 3 month LIBOR | | | — | | | | (286,227 | ) |
| TOTAL | | | | | | | | | | | | | | | | | | $ | 83,243 | | | $ | (2,023,911 | ) |
| | (a) | | Represents forward starting interest rate swaps whose effective dates of commencement of accruals and cash flows occur subsequent to September 30, 2013. |
CENTRALLY CLEARED INTEREST RATE SWAP CONTRACTS
| | | | | | | | | | | | | | | | | | | | |
| | | | | | | Rates Exchanged | | | Market Value | |
Notional
Amount
(000s)(a) | | | Termination
Date | | | Payments
Received | | Payments
Made | | | Upfront
Payments
Made (Received) | | | Unrealized
Gain (Loss) | |
| | EUR 8,460 | | | | 06/05/15 | | | 0.600% | | | 6 month EURO | | | $ | (9,791 | ) | | $ | 10,611 | |
| | 10,780 | | | | 06/29/15 | | | 0.850 | | | 6 month EURO | | | | 5,343 | | | | 29,619 | |
| | |
| The accompanying notes are an integral part of these financial statements. | | 61 |
GOLDMAN SACHS CORE PLUS FIXED INCOME FUND
Schedule of Investments (continued)
September 30, 2013 (Unaudited)
|
| ADDITIONAL INVESTMENT INFORMATION (continued) |
CENTRALLY CLEARED INTEREST RATE SWAP CONTRACTS (continued)
| | | | | | | | | | | | | | | | | | |
| | | | | | | Rates Exchanged | | Market Value | |
Notional
Amount
(000s)(a) | | | Termination
Date | | | Payments
Received | | Payments
Made | | Upfront
Payments
Made (Received) | | | Unrealized
Gain (Loss) | |
| NOK | 10,710 | | | | 06/30/15 | | | 3 month NIBOR | | 2.000% | | $ | 127 | | | $ | 418 | |
| EUR | 10,620 | | | | 08/06/15 | | | 0.750% | | 6 month EURO | | | (41 | ) | | | 15,493 | |
| | 13,770 | | | | 08/18/15 | | | 0.800 | | 6 month EURO | | | 2,769 | | | | 24,740 | |
| JPY | 3,412,620 | | | | 08/18/15 | | | 6 month JYOR | | 0.280 | | | 2,714 | | | | (10,383 | ) |
| AUD | 6,520 | | | | 09/05/15 | | | 3.200 | | 6 month AUDOR | | | (469 | ) | | | 15,176 | |
| $ | 13,630 | | | | 09/26/15 | | | 3 month LIBOR | | 0.650 | | | (1,988 | ) | | | (4,538 | ) |
| | 51,100 | | | | 12/18/15 | | | 3 month LIBOR | | 0.500 | | | 202,560 | | | | (163,116 | ) |
| GBP | 6,930 | | | | 07/18/16 | | | 6 month BP | | 0.930 | | | 31,824 | | | | 37,494 | |
| $ | 31,300 | | | | 07/25/16 | | | 3 month LIBOR | | 0.965 | | | 4,975 | | | | (70,971 | ) |
| CAD | 40,600 | | | | 07/25/16 | | | 1.940 | | 6 month CDOR | | | (10,920 | ) | | | 78,514 | |
| EUR | 34,830 | | | | 07/27/16 | | | 6 month EURO | | 1.100 | | | 29,348 | | | | (58,359 | ) |
| $ | 58,900 | | | | 12/19/16 | | | 0.500 | | 3 month LIBOR | | | (516,464 | ) | | | (163,136 | ) |
| EUR | 29,150 | | | | 07/27/18 | | | 1.600 | | 6 month EURO | | | (100,610 | ) | | | 122,615 | |
| CAD | 1,610 | | | | 12/18/18 | | | 1.750 | | 6 month CDOR | | | (47,013 | ) | | | 3,417 | |
| $ | 2,590 | | | | 12/18/18 | | | 3 month LIBOR | | 1.000 | | | 104,278 | | | | (18,712 | ) |
| GBP | 3,690 | | | | 12/18/18 | | | 6 month BP | | 1.000 | | | 245,259 | | | | 1,103 | |
| EUR | 4,950 | | | | 12/18/18 | | | 1.000 | | 6 month EURO | | | (149,298 | ) | | | 48,906 | |
| SEK | 7,540 | | | | 12/18/18 | | | 3 month STIBOR | | 1.750 | | | 31,786 | | | | 883 | |
| $ | 31,800 | | | | 12/18/18 | | | 1.000 | | 3 month LIBOR | | | (964,972 | ) | | | (85,604 | ) |
| | 26,100 | | | | 08/15/19 | | | 3.250 | | 3 month LIBOR | | | (12,755 | ) | | | 219,256 | |
| JPY | 673,850 | | | | 04/24/20 | | | 0.610 | | 6 month JYOR | | | 4,298 | | | | (9,991 | ) |
| EUR | 11,690 | | | | 07/27/20 | | | 6 month EURO | | 1.950 | | | 78,477 | | | | (52,509 | ) |
| $ | 59,700 | | | | 12/18/20 | | | 3 month LIBOR | | 1.500 | | | 1,938,041 | | | | 1,187,075 | |
| GBP | 9,490 | | | | 07/18/21 | | | 2.240 | | 6 month BP | | | (235,903 | ) | | | (98,553 | ) |
| $ | 13,500 | | | | 08/15/21 | | | 3 month LIBOR | | 3.000 | | | (94,313 | ) | | | (215,528 | ) |
| PLN | 940 | | | | 08/09/23 | | | 3 month WIBOR | | 4.041 | | | 2 | | | | 3,826 | |
| | 480 | | | | 08/16/23 | | | 3 month WIBOR | | 4.200 | | | 1 | | | | (70 | ) |
| | 610 | | | | 08/20/23 | | | 3 month WIBOR | | 4.330 | | | 2 | | | | (2,198 | ) |
| | 620 | | | | 08/23/23 | | | 3 month WIBOR | | 4.385 | | | 2 | | | | (3,131 | ) |
| EUR | 10 | | | | 12/18/23 | | | 1.750 | | 6 month EURO | | | (35 | ) | | | (438 | ) |
| GBP | 410 | | | | 12/18/23 | | | 6 month BP | | 2.000 | | | 47,885 | | | | (1,382 | ) |
| JPY | 17,800 | | | | 12/18/23 | | | 0.750 | | 6 month JYOR | | | (5,852 | ) | | | 3,245 | |
| $ | 37,800 | | | | 12/18/23 | | | 3 month LIBOR | | 2.000 | | | 3,453,950 | | | | (498,274 | ) |
| | 4,600 | | | | 06/11/24 | | | 3 month LIBOR | | 2.733 | | | 37 | | | | 139,075 | |
| GBP | 6,090 | | | | 07/18/24 | | | 6 month BP | | 2.700 | | | 193,139 | | | | 49,844 | |
| $ | 6,900 | | | | 07/24/24 | | | 3.098 | | 3 month LIBOR | | | (65,033 | ) | | | 50,456 | |
| CAD | 9,300 | | | | 07/24/24 | | | 6 month CDOR | | 3.250 | | | 24,838 | | | | 11,873 | |
| JPY | 1,077,330 | | | | 04/24/25 | | | 6 month JYOR | | 1.030 | | | 10,001 | | | | 104,505 | |
| | 1,828,000 | | | | 05/09/25 | | | 6 month JYOR | | 1.650 | | | 23,488 | | | | 103,023 | |
| $ | 3,300 | | | | 03/24/26 | | | 3.090 | | 3 month LIBOR | | | 26 | | | | (201,230 | ) |
| | 2,200 | | | | 03/31/26 | | | 3.070 | | 3 month LIBOR | | | 35 | | | | (138,940 | ) |
| JPY | 1,121,000 | | | | 05/10/27 | | | 1.880 | | 6 month JYOR | | | (22,230 | ) | | | (84,892 | ) |
| $ | 2,300 | | | | 12/18/28 | | | 3 month LIBOR | | 2.500 | | | 115,596 | | | | 129,381 | |
| JPY | 553,730 | | | | 04/24/30 | | | 1.480 | | 6 month JYOR | | | (1,725 | ) | | | (72,344 | ) |
| $ | 16,500 | | | | 12/18/43 | | | 3 month LIBOR | | 3.000 | | | 682,385 | | | | 1,544,095 | |
| | TOTAL | | | | | | | | | | | $ | 4,993,774 | | | $ | 1,980,344 | |
| | (a) | | Represents forward starting interest rate swaps whose effective dates of commencement of accruals and cash flows occur subsequent to September 30, 2013. |
| | |
| 62 | | The accompanying notes are an integral part of these financial statements. |
GOLDMAN SACHS CORE PLUS FIXED INCOME FUND
|
| ADDITIONAL INVESTMENT INFORMATION (continued) |
OVER THE COUNTER CREDIT DEFAULT SWAP CONTRACTS
| | | | | | | | | | | | | | | | | | | | | | | | | | |
| | | | | | | | | | | | | | | | | Market Value | |
| Counterparty | | Referenced
Obligation | | Notional
Amount
(000s) | | | Rates Received
(Paid) | | | Termination
Date | | | Credit
Spread at
September 30,
2013(b) | | | Upfront
Payments Made (Received) | | | Unrealized
Gain (Loss) | |
Protection Purchased: | | | | | | | | | | | | | | | | | | | | | | | | | | |
Bank of America Securities LLC | | CDX North America Investment Grade Index 16 | | $ | 1,400 | | | | (1.000 | )% | | | 06/20/14 | | | | 0.114 | % | | $ | (3,697 | ) | | $ | (5,770 | ) |
Deutsche Bank Securities, Inc. | | CDX North America Investment Grade Index 16 | | | 3,000 | | | | (1.000 | ) | | | 06/20/14 | | | | 0.114 | | | | (8,382 | ) | | | (11,905 | ) |
JPMorgan Securities, Inc. | | CDX North America Investment Grade Index 16 | | | 7,800 | | | | (1.000 | ) | | | 06/20/14 | | | | 0.114 | | | | (22,624 | ) | | | (30,122 | ) |
Morgan Stanley Capital Services, Inc. | | CDX North America Investment Grade Index 16 | | | 2,675 | | | | (1.000 | ) | | | 06/20/14 | | | | 0.114 | | | | (6,584 | ) | | | (11,505 | ) |
Protection Sold: | | | | | | | | | | | | | | | | | | | | | | | | | | |
Bank of America Securities LLC | | CDX North America Investment Grade Index 16 | | | 4,625 | | | | 1.000 | | | | 06/20/16 | | | | 0.354 | | | | 3,590 | | | | 79,009 | |
| | Tranches of Commercial Mortgage-Backed Index AAA Series 3 | | | 500 | | | | 0.080 | | | | 12/13/49 | | | | 1.135 | | | | (16,410 | ) | | | 115 | |
| | Tranches of Commercial Mortgage-Backed Index AAA Series 4 | | | 2,100 | | | | 0.350 | | | | 02/17/51 | | | | 1.241 | | | | (74,950 | ) | | | 9,703 | |
Citibank NA
| | Tranches of Commercial Mortgage-Backed Index AAA Series 4 | | | 1,400 | | | | 0.350 | | | | 02/17/51 | | | | 1.241 | | | | (44,023 | ) | | | 525 | |
Credit Suisse International (London) | | Tranches of Commercial Mortgage-Backed Index AAA Series 4 | | | 1,400 | | | | 0.350 | | | | 02/17/51 | | | | 1.241 | | | | (48,254 | ) | | | 4,756 | |
Morgan Stanley Capital Services, Inc. | | CDX North America Investment Grade Index 16 | | | 5,425 | | | | 1.000 | | | | 06/20/16 | | | | 0.354 | | | | 4,025 | | | | 92,862 | |
| | | Tranches of Commercial Mortgage-Backed Index AAA Series 4 | | | 2,500 | | | | 0.350 | | | | 02/17/51 | | | | 1.241 | | | | (78,242 | ) | | | 566 | |
| TOTAL | | | | | | | | | | | | | | | | | | | | $ | (295,551 | ) | | $ | 128,234 | |
| | (b) | | Credit spread on the Referenced Obligation, together with the term of the swap contract, are indicators of payment/performance risk. The likelihood of a credit event occurring which would require a fund to make a payment or otherwise be required to perform under the swap contract is generally greater as the credit spread and the term of the swap contract increase. |
| | |
| The accompanying notes are an integral part of these financial statements. | | 63 |
GOLDMAN SACHS GLOBAL INCOME FUND
Schedule of Investments
September 30, 2013 (Unaudited)
| | | | | | | | | | | | | | |
Principal
Amount | | | Interest
Rate | | | Maturity
Date | | | Value | |
| | Foreign Sovereign Debt Obligations – 37.1% | |
| | British Pound – 2.6% | |
| United Kingdom Treasury | |
| GBP | 5,900,000 | | | | 1.750 | % | | | 09/07/22 | | | $ | 8,945,568 | |
| | 3,160,000 | | | | 3.750 | | | | 07/22/52 | | | | 5,376,936 | |
| | | | | | | | | | | | | | |
| | | | | | | | | | | | | 14,322,504 | |
| | |
| | Canadian Dollar – 2.0% | |
| British Columbia Province of Canada | |
| CAD | 800,000 | | | | 3.250 | | | | 12/18/21 | | | | 788,210 | |
| Government of Canada | |
| | 1,700,000 | | | | 4.000 | | | | 06/01/41 | | | | 1,931,799 | |
| Ontario Province of Canada | |
| | 1,800,000 | | | | 4.400 | | | | 06/02/19 | | | | 1,912,259 | |
| | 4,200,000 | | | | 4.000 | | | | 06/02/21 | | | | 4,330,683 | |
| Quebec Province of Canada | |
| | 1,800,000 | | | | 4.250 | | | | 12/01/21 | | | | 1,873,954 | |
| | | | | | | | | | | | | | |
| | | | | | | | | | | | | 10,836,905 | |
| | |
| | Czech Koruna – 0.1% | |
| Czech Republic Government Bond | |
| CZK | 11,190,000 | | | | 1.500 | | | | 10/29/19 | | | | 582,729 | |
| | |
| | Danish Krone – 0.6% | |
| Kingdom of Denmark | |
| DKK | 16,000,000 | | | | 4.000 | | | | 11/15/15 | | | | 3,131,009 | |
| | |
| | Euro – 17.9% | |
| Federal Republic of Germany | |
| EUR | 7,550,000 | | | | 3.000 | | | | 07/04/20 | | | | 11,487,709 | |
| | 2,360,000 | | | | 1.500 | | | | 09/04/22 | | | | 3,170,633 | |
| | 1,040,000 | | | | 4.000 | | | | 01/04/37 | | | | 1,751,108 | |
| Government of Finland(a) | |
| | 7,990,000 | | | | 3.125 | | | | 09/15/14 | | | | 11,117,448 | |
| | 390,000 | | | | 4.375 | | | | 07/04/19 | | | | 619,970 | |
| Government of France | |
| | 1,400,000 | | | | 3.750 | | | | 04/25/17 | | | | 2,092,670 | |
| | 4,140,000 | | | | 1.000 | | | | 05/25/18 | | | | 5,585,063 | |
| | 4,520,000 | | | | 2.250 | | | | 10/25/22 | | | | 6,133,339 | |
| | 1,480,000 | | | | 4.500 | | | | 04/25/41 | | | | 2,400,140 | |
| Kingdom of Belgium(a) | |
| | 4,515,000 | | | | 3.500 | | | | 06/28/17 | | | | 6,666,096 | |
| | 395,000 | | | | 3.750 | | | | 09/28/20 | | | | 598,084 | |
| Kingdom of The Netherlands(a) | |
| | 2,900,000 | | | | 4.000 | | | | 07/15/16 | | | | 4,305,126 | |
| | 2,470,000 | | | | 4.500 | | | | 07/15/17 | | | | 3,802,486 | |
| Republic of Austria(a) | |
| | 4,080,000 | | | | 4.350 | | | | 03/15/19 | | | | 6,427,013 | |
| Republic of Italy | |
| | 1,550,000 | | | | 4.500 | | | | 07/15/15 | | | | 2,191,686 | |
| | 11,320,000 | | | | 4.750 | | | | 06/01/17 | | | | 16,245,375 | |
| | 2,560,000 | | | | 3.500 | | | | 11/01/17 | | | | 3,517,027 | |
| | 1,910,000 | | | | 4.500 | | | | 05/01/23 | | | | 2,602,032 | |
| | 490,000 | | | | 5.000 | | | | 08/01/39 | | | | 660,112 | |
| Spain Government Bond | |
| | 1,730,000 | | | | 4.500 | | | | 01/31/18 | | | | 2,495,143 | |
| | 2,700,000 | | | | 4.400 | (a) | | | 10/31/23 | | | | 3,677,900 | |
| | | | | | | | | | | | | | |
| | | | | | | | | | | | | 97,546,160 | |
| | |
| | Foreign Sovereign Debt Obligations – (continued) | |
| | Japanese Yen – 8.2% | |
| Government of Japan | |
| JPY | 200,000 | | | | 0.100 | % | | | 12/15/14 | | | $ | 2,035 | |
| | 1,244,000,000 | | | | 0.300 | | | | 03/20/18 | | | | 12,706,252 | |
| | 12,700,000 | | | | 1.400 | | | | 03/20/20 | | | | 137,791 | |
| | 377,000,000 | | | | 0.800 | | | | 12/20/22 | | | | 3,890,178 | |
| | 667,000,000 | | | | 0.600 | | | | 03/20/23 | | | | 6,750,363 | |
| | 430,000,000 | | | | 2.100 | | | | 12/20/26 | | | | 4,994,151 | |
| | 29,000,000 | | | | 2.200 | | | | 03/20/31 | | | | 330,443 | |
| | 221,300,000 | | | | 1.700 | | | | 09/20/32 | | | | 2,312,986 | |
| | 485,000,000 | | | | 2.500 | | | | 09/20/34 | | | | 5,722,645 | |
| | 250,000,000 | | | | 2.500 | | | | 03/20/38 | | | | 2,975,874 | |
| | 100,000,000 | | | | 2.200 | | | | 09/20/39 | | | | 1,130,167 | |
| | 150,000,000 | | | | 2.200 | | | | 03/20/41 | | | | 1,696,566 | |
| | 59,500,000 | | | | 2.000 | | | | 09/20/41 | | | | 646,202 | |
| | 100,900,000 | | | | 2.000 | | | | 03/20/52 | | | | 1,088,404 | |
| | | | | | | | | | | | | | |
| | | | | | | | | | | | | 44,384,057 | |
| | |
| | Mexican Peso – 0.9% | |
| United Mexican States | |
| MXN | 1,405,400 | | | | 7.500 | | | | 06/03/27 | | | | 118,133 | |
| | 12,961,000 | | | | 7.750 | | | | 05/29/31 | | | | 1,069,259 | |
| | 148,000 | | | | 10.000 | | | | 11/20/36 | | | | 14,913 | |
| | 8,168,000 | | | | 8.500 | | | | 11/18/38 | | | | 717,186 | |
| | 36,673,600 | | | | 7.750 | | | | 11/13/42 | | | | 2,974,476 | |
| | | | | | | | | | | | | | |
| | | | | | | | | | | | | 4,893,967 | |
| | |
| | South African Rand – 0.5% | |
| Republic of South Africa | |
| ZAR | 18,820,000 | | | | 7.750 | | | | 02/28/23 | | | | 1,896,362 | |
| | 6,569,608 | | | | 10.500 | | | | 12/21/26 | | | | 790,237 | |
| | | | | | | | | | | | | | |
| | | | | | | | | | | | | 2,686,599 | |
| | |
| | South Korean Won – 0.7% | |
| Republic of Korea | |
| KRW | 3,819,000,000 | | | | 5.000 | | | | 06/10/20 | | | | 3,927,777 | |
| | |
| | Swedish Krona – 0.9% | |
| Kingdom of Sweden | |
| SEK | 11,000,000 | | | | 6.750 | | | | 05/05/14 | | | | 1,769,948 | |
| | 20,000,000 | | | | 4.500 | | | | 08/12/15 | | | | 3,302,995 | |
| | | | | | | | | | | | | | |
| | | | | | | | | | | | | 5,072,943 | |
| | |
| | United States Dollar – 2.7% | |
| Perusahaan Penerbit SBSN(a) | |
| $ | 340,000 | | | | 6.125 | | | | 03/15/19 | | | | 351,475 | |
| Republic of Chile | |
| | 1,540,000 | | | | 3.625 | | | | 10/30/42 | | | | 1,255,100 | |
| Republic of Colombia | |
| | 210,000 | | | | 2.625 | | | | 03/15/23 | | | | 185,325 | |
| | 1,120,000 | | | | 4.000 | | | | 02/26/24 | | | | 1,092,000 | |
| Republic of Indonesia | |
| | 530,000 | | | | 5.375 | (a) | | | 10/17/23 | | | | 527,350 | |
| | 1,050,000 | | | | 8.500 | | | | 10/12/35 | | | | 1,273,125 | |
| Republic of Korea | |
| | 660,000 | | | | 7.125 | | | | 04/16/19 | | | | 817,318 | |
| Republic of Slovenia | |
| | 1,640,000 | | | | 5.500 | | | | 10/26/22 | | | | 1,529,300 | |
| | 400,000 | | | | 5.850 | | | | 05/10/23 | | | | 380,000 | |
| | 2,190,000 | | | | 5.850 | (a) | | | 05/10/23 | | | | 2,081,685 | |
| | |
| | |
| 64 | | The accompanying notes are an integral part of these financial statements. |
GOLDMAN SACHS GLOBAL INCOME FUND
| | | | | | | | | | | | | | |
Principal
Amount | | | Interest
Rate | | | Maturity
Date | | | Value | |
| | Foreign Sovereign Debt Obligations – (continued) | |
| | United States Dollar – (continued) | |
| Republic of Turkey | |
| $ | 200,000 | | | | 6.250 | % | | | 09/26/22 | | | $ | 214,750 | |
| | 230,000 | | | | 6.000 | | | | 01/14/41 | | | | 221,375 | |
| Russian Federation(a) | |
| | 3,200,000 | | | | 4.875 | | | | 09/16/23 | | | | 3,280,000 | |
| State of Qatar | |
| | 1,189,000 | | | | 5.150 | | | | 04/09/14 | | | | 1,215,752 | |
| United Mexican States | |
| | 470,000 | | | | 5.750 | | | | 10/12/10 | | | | 438,275 | |
| | | | | | | | | | | | | | |
| | | | | | | | | | | | | 14,862,830 | |
| | |
| TOTAL FOREIGN SOVEREIGN DEBT
OBLIGATIONS |
| | | | |
| | (Cost $194,352,078) | | | $ | 202,247,480 | |
| | |
| | | | | | | | | | | | | | |
| | Corporate Obligations – 22.3% | |
| | Automotive – 0.5% | |
| Ford Motor Credit Co. LLC | |
| $ | 2,300,000 | | | | 3.984 | % | | | 06/15/16 | | | $ | 2,429,186 | |
| | 300,000 | | | | 4.250 | | | | 02/03/17 | | | | 320,386 | |
| | 200,000 | | | | 4.375 | | | | 08/06/23 | | | | 200,272 | |
| | | | | | | | | | | | | | |
| | | | | | | | | | | | | 2,949,844 | |
| | |
| | Banks – 8.4% | |
| Bank of America Corp. | |
| | 1,550,000 | | | | 5.750 | | | | 12/01/17 | | | | 1,752,037 | |
| | 1,000,000 | | | | 5.650 | | | | 05/01/18 | | | | 1,126,813 | |
| Bank of Scotland PLC | |
| | 1,200,000 | | | | 5.250 | | | | 02/21/17 | | | | 1,340,467 | |
| | 2,070,000 | | | | 5.250 | (a) | | | 02/21/17 | | | | 2,312,306 | |
| Barclays Bank PLC(b)(c) | |
| EUR | 850,000 | | | | 4.500 | | | | 03/04/19 | | | | 1,158,547 | |
| BNP Paribas SA(b) | |
| | 150,000 | | | | 4.730 | | | | 04/29/49 | | | | 205,464 | |
| Citigroup, Inc. | |
| $ | 105,000 | | | | 4.450 | | | | 01/10/17 | | | | 113,669 | |
| | 375,000 | | | | 6.125 | | | | 05/15/18 | | | | 432,386 | |
| Credit Agricole SA(a) | |
| | 1,500,000 | | | | 2.125 | | | | 04/17/18 | | | | 1,484,930 | |
| Credit Suisse AG(a) | |
| | 700,000 | | | | 6.500 | | | | 08/08/23 | | | | 719,529 | |
| DnB Boligkreditt AS | |
| | 800,000 | | | | 2.900 | | | | 03/29/16 | | | | 837,680 | |
| | 2,700,000 | | | | 2.900 | (a) | | | 03/29/16 | | | | 2,827,170 | |
| | 1,900,000 | | | | 1.450 | (a) | | | 03/21/18 | | | | 1,870,360 | |
| HSBC Holdings PLC | |
| | 1,150,000 | | | | 6.800 | | | | 06/01/38 | | | | 1,355,482 | |
| ING Bank NV | |
| | 1,600,000 | | | | 4.000 | (a) | | | 03/15/16 | | | | 1,689,520 | |
| EUR | 650,000 | | | | 6.125 | (b)(c) | | | 05/29/23 | | | | 964,537 | |
| Intesa Sanpaolo SPA | |
| | 500,000 | | | | 4.125 | | | | 01/14/16 | | | | 699,608 | |
| $ | 650,000 | | | | 3.875 | | | | 01/16/18 | | | | 639,497 | |
| JPMorgan Chase & Co. | |
| | 1,400,000 | | | | 4.250 | | | | 10/15/20 | | | | 1,458,944 | |
| | |
| | Corporate Obligations – (continued) | |
| | Banks – (continued) | |
| Lloyds TSB Bank PLC(b)(c) | |
| EUR | 1,150,000 | | | | 11.875 | % | | | 12/16/16 | | | $ | 1,905,828 | |
| Morgan Stanley, Inc. | |
| $ | 1,650,000 | | | | 4.000 | | | | 07/24/15 | | | | 1,721,202 | |
| | 225,000 | | | | 5.550 | | | | 04/27/17 | | | | 249,610 | |
| | 850,000 | | | | 6.250 | | | | 08/28/17 | | | | 964,907 | |
| | 250,000 | | | | 6.625 | | | | 04/01/18 | | | | 289,709 | |
| | 400,000 | | | | 2.125 | | | | 04/25/18 | | | | 389,841 | |
| Regions Financial Corp.(c) | |
| | 750,000 | | | | 2.000 | | | | 05/15/18 | | | | 729,210 | |
| Royal Bank of Scotland PLC | |
| | 1,100,000 | | | | 2.550 | | | | 09/18/15 | | | | 1,121,699 | |
| EUR | 550,000 | | | | 5.375 | | | | 09/30/19 | | | | 863,133 | |
| | 300,000 | | | | 10.500 | (b)(c) | | | 03/16/22 | | | | 484,743 | |
| Santander Holdings USA, Inc.(c) | |
| $ | 850,000 | | | | 3.000 | | | | 09/24/15 | | | | 872,535 | |
| Sparebank 1 Boligkreditt AS | |
| | 4,900,000 | | | | 2.625 | (a) | | | 05/27/16 | | | | 5,095,597 | |
| | 1,100,000 | | | | 2.300 | | | | 06/30/17 | | | | 1,128,380 | |
| | 3,300,000 | | | | 2.300 | (a) | | | 06/30/17 | | | | 3,385,140 | |
| | 3,200,000 | | | | 1.750 | (a) | | | 11/15/19 | | | | 3,050,560 | |
| Standard Chartered PLC(a) | |
| | 400,000 | | | | 5.500 | | | | 11/18/14 | | | | 420,600 | |
| | | | | | | | | | | | | | |
| | | | | | | | | | | | | 45,661,640 | |
| | |
| | Chemicals – 0.4% | |
| CF Industries, Inc. | |
| | 200,000 | | | | 3.450 | | | | 06/01/23 | | | | 185,488 | |
| Ecolab, Inc. | |
| | 1,550,000 | | | | 4.350 | | | | 12/08/21 | | | | 1,633,061 | |
| LYB International Finance BV | |
| | 350,000 | | | | 4.000 | | | | 07/15/23 | | | | 345,571 | |
| | 150,000 | | | | 5.250 | | | | 07/15/43 | | | | 147,090 | |
| | | | | | | | | | | | | | |
| | | | | | | | | | | | | 2,311,210 | |
| | |
| | Communications – 2.6% | |
| American Tower Corp. | |
| | 450,000 | | | | 3.400 | | | | 02/15/19 | | | | 444,304 | |
| British Telecommunications PLC | |
| GBP | 244,000 | | | | 6.625 | | | | 06/23/17 | | | | 457,037 | |
| Koninklijke KPN NV | |
| EUR | 100,000 | | | | 3.250 | | | | 02/01/21 | | | | 138,276 | |
| | 200,000 | | | | 4.500 | | | | 10/04/21 | | | | 297,698 | |
| | 550,000 | | | | 4.250 | | | | 03/01/22 | | | | 800,125 | |
| News America, Inc. | |
| $ | 50,000 | | | | 4.000 | (a) | | | 10/01/23 | | | | 50,254 | |
| | 700,000 | | | | 6.400 | | | | 12/15/35 | | | | 768,621 | |
| Telefonica Emisiones SAU | |
| | 750,000 | | | | 5.462 | | | | 02/16/21 | | | | 765,632 | |
| Verizon Communications, Inc. | |
| | 1,350,000 | | | | 3.650 | | | | 09/14/18 | | | | 1,425,122 | |
| | 350,000 | | | | 4.500 | | | | 09/15/20 | | | | 373,529 | |
| | 1,500,000 | | | | 5.150 | | | | 09/15/23 | | | | 1,611,404 | |
| | 1,000,000 | | | | 6.400 | | | | 09/15/33 | | | | 1,111,969 | |
| | 2,050,000 | | | | 6.550 | | | | 09/15/43 | | | | 2,317,929 | |
| Verizon Wireless Capital LLC | |
| EUR | 950,000 | | | | 8.750 | | | | 12/18/15 | | | | 1,501,201 | |
| | |
| | |
| The accompanying notes are an integral part of these financial statements. | | 65 |
GOLDMAN SACHS GLOBAL INCOME FUND
Schedule of Investments (continued)
September 30, 2013 (Unaudited)
| | | | | | | | | | | | | | |
Principal
Amount | | | Interest
Rate | | | Maturity
Date | | | Value | |
| | Corporate Obligations – (continued) | |
| | Communications – (continued) | |
| Vodafone Group PLC | |
| $ | 1,950,000 | | | | 2.875 | % | | | 03/16/16 | | | $ | 2,020,443 | |
| | | | | | | | | | | | | | |
| | | | | | | | | | | | | 14,083,544 | |
| | |
| | Consumer Noncyclical – 0.3% | |
| Avon Products, Inc. | |
| | 600,000 | | | | 4.600 | | | | 03/15/20 | | | | 620,372 | |
| | 400,000 | | | | 5.000 | | | | 03/15/23 | | | | 403,951 | |
| Imperial Tobacco Finance PLC | |
| EUR | 300,000 | | | | 4.375 | | | | 11/22/13 | | | | 407,909 | |
| $ | 300,000 | | | | 2.050 | (a) | | | 02/11/18 | | | | 292,533 | |
| | | | | | | | | | | | | | |
| | | | | | | | | | | | | 1,724,765 | |
| | |
| | Diversified Manufacturing – 0.1% | |
| Roper Industries, Inc. | |
| | 400,000 | | | | 2.050 | | | | 10/01/18 | | | | 391,775 | |
| | |
| | Electric – 0.6% | |
| Alliander NV(b) | |
| EUR | 350,000 | | | | 4.875 | | | | 11/11/49 | | | | 487,702 | |
| DONG Energy A/S | |
| | 1,000,000 | | | | 4.875 | | | | 12/16/21 | | | | 1,577,670 | |
| | 366,000 | | | | 6.250 | (b)(c) | | | 06/26/13 | | | | 506,903 | |
| MidAmerican Energy Holdings Co. | |
| $ | 350,000 | | | | 5.950 | | | | 05/15/37 | | | | 389,482 | |
| Ruwais Power Co. PJSC(a) | |
| | 520,000 | | | | 6.000 | | | | 08/31/36 | | | | 536,900 | |
| | | | | | | | | | | | | | |
| | | | | | | | | | | | | 3,498,657 | |
| | |
| | Energy – 3.0% | |
| BP Capital Markets PLC | |
| GBP | 850,000 | | | | 4.325 | | | | 12/10/18 | | | | 1,509,525 | |
| Buckeye Partners LP(c) | |
| $ | 550,000 | | | | 4.150 | | | | 07/01/23 | | | | 536,248 | |
| CNOOC Curtis Funding No. 1 Pty Ltd.(a) | |
| | 1,160,000 | | | | 4.500 | | | | 10/03/23 | | | | 1,168,923 | |
| Dolphin Energy Ltd. | |
| | 647,283 | | | | 5.888 | | | | 06/15/19 | | | | 707,157 | |
| | 1,002,933 | | | | 5.888 | (a) | | | 06/15/19 | | | | 1,095,704 | |
| Ecopetrol SA | |
| | 400,000 | | | | 5.875 | | | | 09/18/23 | | | | 417,865 | |
| Energy Transfer Partners LP(c) | |
| | 700,000 | | | | 3.600 | | | | 02/01/23 | | | | 650,456 | |
| | 400,000 | | | | 5.150 | | | | 02/01/43 | | | | 356,279 | |
| Gaz Capital SA for Gazprom | |
| | 1,770,000 | | | | 9.250 | | | | 04/23/19 | | | | 2,168,250 | |
| GPN Capital SA for Gazprom | |
| | 1,280,000 | | | | 4.375 | | | | 09/19/22 | | | | 1,177,600 | |
| Marathon Oil Corp.(c) | |
| | 50,000 | | | | 2.800 | | | | 11/01/22 | | | | 46,488 | |
| Petrobras International Finance Co. | |
| | 140,000 | | | | 5.750 | | | | 01/20/20 | | | | 145,545 | |
| | 560,000 | | | | 5.375 | | | | 01/27/21 | | | | 561,682 | |
| Petroleos Mexicanos | |
| | 920,000 | | | | 5.500 | | | | 01/21/21 | | | | 986,700 | |
| | |
| | Corporate Obligations – (continued) | |
| | Energy – (continued) | |
| Phillips 66 | |
| $ | 250,000 | | | | 4.300 | % | | | 04/01/22 | | | $ | 254,131 | |
| Rosneft Oil Co. via Rosneft International Finance Ltd.(a) | |
| | 560,000 | | | | 4.199 | | | | 03/06/22 | | | | 515,900 | |
| TNK-BP Finance SA | |
| | 168,000 | | | | 7.500 | | | | 07/18/16 | | | | 188,160 | |
| | 271,000 | | | | 6.625 | | | | 03/20/17 | | | | 298,439 | |
| | 190,000 | | | | 7.875 | | | | 03/13/18 | | | | 219,687 | |
| | 100,000 | | | | 7.250 | | | | 02/02/20 | | | | 112,750 | |
| Transocean, Inc. | |
| | 450,000 | | | | 6.375 | | | | 12/15/21 | | | | 497,948 | |
| | 850,000 | | | | 3.800 | (c) | | | 10/15/22 | | | | 799,073 | |
| Transportadora de Gas Internacional SA(c) | |
| | 340,000 | | | | 5.700 | | | | 03/20/22 | | | | 342,879 | |
| Weatherford International Ltd. | |
| | 500,000 | | | | 9.625 | | | | 03/01/19 | | | | 631,111 | |
| | 718,000 | | | | 5.125 | | | | 09/15/20 | | | | 753,795 | |
| | 50,000 | | | | 4.500 | (c) | | | 04/15/22 | | | | 49,344 | |
| | | | | | | | | | | | | | |
| | | | | | | | | | | | | 16,191,639 | |
| | |
| | Financial Companies – 0.8% | |
| American Express Credit Corp. | |
| GBP | 1,200,000 | | | | 5.375 | | | | 10/01/14 | | | | 2,023,309 | |
| $ | 700,000 | | | | 2.800 | | | | 09/19/16 | | | | 732,642 | |
| GE Capital European Funding | |
| EUR | 1,200,000 | | | | 2.875 | | | | 06/18/19 | | | �� | 1,699,640 | |
| | | | | | | | | | | | | | |
| | | | | | | | | | | | | 4,455,591 | |
| | |
| | Food & Beverage – 0.9% | |
| Anadolu Efes Biracilik ve Malt Sanayii AS(a) | |
| $ | 665,000 | | | | 3.375 | | | | 11/01/22 | | | | 538,650 | |
| Mondelez International, Inc.(c) | |
| | 715,000 | | | | 6.500 | | | | 02/09/40 | | | | 839,354 | |
| Pernod-Ricard SA(a) | |
| | 400,000 | | | | 4.450 | | | | 01/15/22 | | | | 410,654 | |
| | 1,050,000 | | | | 4.250 | | | | 07/15/22 | | | | 1,060,133 | |
| | 885,000 | | | | 5.500 | | | | 01/15/42 | | | | 901,310 | |
| SABMiller Holdings, Inc.(a) | |
| | 1,250,000 | | | | 3.750 | | | | 01/15/22 | | | | 1,259,952 | |
| | | | | | | | | | | | | | |
| | | | | | | | | | | | | 5,010,053 | |
| | |
| | Health Care – Services – 0.5% | |
| Express Scripts Holding Co. | |
| | 2,350,000 | | | | 3.500 | | | | 11/15/16 | | | | 2,487,243 | |
| | 350,000 | | | | 3.900 | | | | 02/15/22 | | | | 354,030 | |
| | | | | | | | | | | | | | |
| | | | | | | | | | | | | 2,841,273 | |
| | |
| | Insurance – 1.1% | |
| AIG Life Holdings, Inc. | |
| | 100,000 | | | | 8.500 | | | | 07/01/30 | | | | 126,000 | |
| Allianz Finance II BV(b)(c) | |
| EUR | 100,000 | | | | 5.750 | | | | 07/08/41 | | | | 150,153 | |
| American International Group, Inc. | |
| $ | 750,000 | | | | 4.875 | | | | 09/15/16 | | | | 822,327 | |
| | 1,450,000 | | | | 4.875 | | | | 06/01/22 | | | | 1,556,570 | |
| Genworth Holdings, Inc. | |
| | 150,000 | | | | 7.700 | | | | 06/15/20 | | | | 175,912 | |
| | |
| | |
| 66 | | The accompanying notes are an integral part of these financial statements. |
GOLDMAN SACHS GLOBAL INCOME FUND
| | | | | | | | | | | | | | |
Principal
Amount | | | Interest
Rate | | | Maturity
Date | | | Value | |
| | Corporate Obligations – (continued) | |
| | Insurance – (continued) | |
| $ | 250,000 | | | | 7.625 | % | | | 09/24/21 | | | $ | 295,659 | |
| | 300,000 | | | | 4.900 | | | | 08/15/23 | | | | 300,255 | |
| QBE Insurance Group Ltd.(a) | |
| | 400,000 | | | | 2.400 | | | | 05/01/18 | | | | 389,692 | |
| Standard Life PLC(b) | |
| EUR | 1,400,000 | | | | 5.314 | | | | 01/06/49 | | | | 1,908,196 | |
| | | | | | | | | | | | | | |
| | | | | | | | | | | | | 5,724,764 | |
| | |
| | Metals & Mining – 0.9% | |
| Anglo American Capital PLC(a) | |
| $ | 2,600,000 | | | | 9.375 | | | | 04/08/14 | | | | 2,708,654 | |
| Glencore Funding LLC(a) | |
| | 50,000 | | | | 4.125 | | | | 05/30/23 | | | | 46,253 | |
| Rio Tinto Finance USA Ltd. | |
| | 752,000 | | | | 9.000 | | | | 05/01/19 | | | | 973,805 | |
| Xstrata Finance Canada Ltd.(a) | |
| | 1,250,000 | | | | 4.250 | | | | 10/25/22 | | | | 1,167,834 | |
| | | | | | | | | | | | | | |
| | | | | | | | | | | | | 4,896,546 | |
| | |
| | Noncaptive – Financial – 0.1% | |
| General Electric Capital Corp. | |
| | 350,000 | | | | 5.550 | | | | 05/04/20 | | | | 395,898 | |
| | |
| | Pharmaceuticals – 0.3% | |
| AbbVie, Inc. | |
| | 1,500,000 | | | | 1.750 | | | | 11/06/17 | | | | 1,488,819 | |
| | |
| | Real Estate Investment Trusts – 0.9% | |
| Gecina SA | |
| EUR | 700,000 | | | | 4.250 | | | | 02/03/16 | | | | 1,013,238 | |
| HCP, Inc.(c) | |
| $ | 1,750,000 | | | | 5.375 | | | | 02/01/21 | | | | 1,895,209 | |
| Ventas Realty LP/Ventas Capital Corp. (c) | |
| | 200,000 | | | | 3.250 | | | | 08/15/22 | | | | 185,787 | |
| WEA Finance LLC(a)(c) | |
| | 1,600,000 | | | | 4.625 | | | | 05/10/21 | | | | 1,687,779 | |
| WEA Finance LLC/WT Finance Australia Property Ltd.(a)(c) | |
| | 250,000 | | | | 3.375 | | | | 10/03/22 | | | | 235,622 | |
| | | | | | | | | | | | | | |
| | | | | | | | | | | | | 5,017,635 | |
| | |
| | Retailers – 0.1% | |
| Wal-Mart Stores, Inc. | |
| | 550,000 | | | | 5.000 | | | | 10/25/40 | | | | 564,789 | |
| | |
| | Technology – 0.2% | |
| Apple, Inc. | |
| | 900,000 | | | | 3.850 | | | | 05/04/43 | | | | 756,749 | |
| Hewlett-Packard Co. | |
| | 250,000 | | | | 2.600 | | | | 09/15/17 | | | | 252,914 | |
| | | | | | | | | | | | | | |
| | | | | | | | | | | | | 1,009,663 | |
| | |
| | Transportation – 0.6% | |
| Abertis Infraestructuras SA | |
| EUR | 700,000 | | | | 4.750 | | | | 10/25/19 | | | | 1,036,079 | |
| | 300,000 | | | | 3.750 | | | | 06/20/23 | | | | 400,083 | |
| Burlington Northern Santa Fe LLC(c) | |
| $ | 450,000 | | | | 3.000 | | | | 03/15/23 | | | | 423,057 | |
| | 500,000 | | | | 4.375 | | | | 09/01/42 | | | | 447,494 | |
| | |
| | Corporate Obligations – (continued) | |
| | Transportation – (continued) | |
| Transnet Ltd. | |
| $ | 790,000 | | | | 4.500 | % | | | 02/10/16 | | | $ | 815,675 | |
| | | | | | | | | | | | | | |
| | | | | | | | | | | | | 3,122,388 | |
| | |
| | TOTAL CORPORATE OBLIGATIONS | |
| | (Cost $118,251,950) | | | | | | | | | | | $ | 121,340,493 | |
| | |
| | | | | | | | | | | | | | |
| | Foreign Debt Obligation – 2.0% | |
| | Supranational – 2.0% | |
| European Financial Stability Facility | |
| EUR | 7,700,000 | | | | 2.000 | % | | | 05/15/17 | | | $ | 10,821,126 | |
| | (Cost $9,738,016) | | | | | | | | | | | | | |
| | |
| | | | | | | | | | | | | | |
| | Asset-Backed Securities – 2.9% | |
| | Home Equity – 0.5% | |
| CIT Mortgage Loan Trust Series 2007-1, Class 2A3(a)(b) | |
| $ | 2,900,000 | | | | 1.629 | % | | | 10/25/37 | | | $ | 2,528,160 | |
| GMAC Mortgage Corp. Loan Trust Series 2007-HE3, Class 1A1 | |
| | 93,356 | | | | 7.000 | | | | 09/25/37 | | | | 89,499 | |
| GMAC Mortgage Corp. Loan Trust Series 2007-HE3, Class 2A1 | |
| | 135,542 | | | | 7.000 | | | | 09/25/37 | | | | 131,173 | |
| | | | | | | | | | | | | | |
| | | | | | | | | | | | | 2,748,832 | |
| | |
| | Student Loans(b) – 2.4% | |
| Access Group, Inc. Series 2004-2, Class A2 | |
| | 2,831,651 | | | | 0.416 | | | | 01/25/16 | | | | 2,639,051 | |
| Brazos Higher Education Authority, Inc. Series 2005-3,
Class A14 |
|
| | 106,858 | | | | 0.361 | | | | 09/25/23 | | | | 106,719 | |
| Educational Services of America, Inc. Series 2010-1, Class A1(a) | |
| | 2,004,565 | | | | 1.116 | | | | 07/25/23 | | | | 2,009,288 | |
| Knowledgeworks Foundation Student Loan Series 2010-1,
Class A |
|
| | 977,998 | | | | 1.212 | | | | 02/25/42 | | | | 985,302 | |
| Nelnet Student Loan Trust Series 2010-3A, Class A(a) | |
| | 1,035,781 | | | | 0.979 | | | | 07/27/48 | | | | 1,043,113 | |
| Nelnet Student Loan Trust Series 2011-1A, Class A(a) | |
| | 595,536 | | | | 1.029 | | | | 02/25/43 | | | | 601,349 | |
| SLC Student Loan Center Series 2011-1, Class A(a) | |
| | 1,316,338 | | | | 1.399 | | | | 10/25/27 | | | | 1,343,986 | |
| SLC Student Loan Trust Series 2006-1, Class A4 | |
| | 2,085,992 | | | | 0.334 | | | | 12/15/21 | | | | 2,076,948 | |
| US Education Loan Trust LLC Series 2006-1, Class A2(a) | |
| | 393,366 | | | | 0.390 | | | | 03/01/25 | | | | 392,021 | |
| Wachovia Student Loan Trust Series 2006-1, Class A4(a) | |
| | 1,865,583 | | | | 0.346 | | | | 04/25/23 | | | | 1,861,837 | |
| | | | | | | | | | | | | | |
| | | | | | | | | | | | | 13,059,614 | |
| | |
| | TOTAL ASSET-BACKED SECURITIES | |
| | (Cost $16,129,434) | | | $ | 15,808,446 | |
| | |
| | | | | | | | | | | | | | |
| | |
| The accompanying notes are an integral part of these financial statements. | | 67 |
GOLDMAN SACHS GLOBAL INCOME FUND
Schedule of Investments (continued)
September 30, 2013 (Unaudited)
| | | | | | | | | | | | | | |
Principal
Amount | | | Interest
Rate | | | Maturity
Date | | | Value | |
| | Mortgage-Backed Obligations – 17.7% | |
| | Adjustable Rate Non-Agency(b) – 0.6% | |
| American Home Mortgage Investment Trust Series 2004-3,
Class 1A |
|
| $ | 1,446 | | | | 0.919 | % | | | 10/25/34 | | | $ | 1,438 | |
| Countrywide Alternative Loan Trust Series 2005-38, Class A1 | |
| | 218,643 | | | | 1.653 | | | | 09/25/35 | | | | 184,490 | |
| Countrywide Alternative Loan Trust Series 2005-82, Class A1 | |
| | 2,929,286 | | | | 0.449 | | | | 02/25/36 | | | | 2,180,028 | |
| Countrywide Alternative Loan Trust Series 2006-OA1, Class 2A1 | |
| | 1,017,527 | | | | 0.390 | | | | 03/20/46 | | | | 702,546 | |
| | |
| TOTAL ADJUSTABLE RATE
NON-AGENCY |
| | $ | 3,068,502 | |
| | |
| | Collateralized Mortgage Obligations – 4.1% | |
| Aire Valley Mortgages PLC Series 2006-1X, Class 2A1(b) | |
| EUR | 1,693,628 | | | | 0.522 | % | | | 09/20/66 | | | $ | 2,185,174 | |
| Aire Valley Mortgages PLC Series 2007-1X, Class 2A2(b) | |
| | 731,844 | | | | 0.482 | | | | 09/20/66 | | | | 941,006 | |
| Countrywide Home Loan Mortgage Pass-Through Trust
Series 2004-HYB5, Class 2A1(b) |
|
| $ | 233,758 | | | | 2.551 | | | | 04/20/35 | | | | 232,880 | |
| FHLMC Multifamily Structured Pass-Through Certificates
Series K028, Class A2 |
|
| | 6,200,000 | | | | 3.111 | | | | 02/25/23 | | | | 6,136,760 | |
| FNMA REMIC Series 2010-126, Class LS(b) | |
| | 2,425,771 | | | | 4.817 | | | | 11/25/40 | | | | 294,845 | |
| FNMA REMIC Series 2011-52, Class GB | |
| | 1,000,000 | | | | 5.000 | | | | 06/25/41 | | | | 1,096,622 | |
| FNMA REMIC Series 2011-99, Class DB | |
| | 875,000 | | | | 5.000 | | | | 10/25/41 | | | | 961,236 | |
| Granite Mortgages PLC Series 2003-2, Class 1B(b) | |
| | 320,008 | | | | 1.246 | | | | 07/20/43 | | | | 312,502 | |
| Granite Mortgages PLC Series 2004-1, Class 2A2(b) | |
| EUR | 1,668,538 | | | | 0.542 | | | | 03/20/44 | | | | 2,228,480 | |
| Granite Mortgages PLC Series 2004-2, Class 3A(b) | |
| GBP | 289,581 | | | | 0.838 | | | | 06/20/44 | | | | 463,419 | |
| Granite Mortgages PLC Series 2004-3, Class 3A1(b) | |
| | 269,355 | | | | 0.878 | | | | 09/20/44 | | | | 431,297 | |
| Harborview Mortgage Loan Trust Series 2006-6, Class 3A1A(b) | |
| $ | 1,031,076 | | | | 2.712 | | | | 08/19/36 | | | | 723,161 | |
| Leek Finance PLC Series 2017X, Class A2C(b) | |
| EUR | 142,656 | | | | 0.501 | | | | 12/21/37 | | | | 198,616 | |
| Leek Finance PLC Series 2018X, Class A2B(b) | |
| $ | 906,117 | | | | 0.510 | | | | 09/21/38 | | | | 921,408 | |
| NCUA Guaranteed Notes Series 2010-C1, Class APT | |
| | 3,382,132 | | | | 2.650 | | | | 10/29/20 | | | | 3,461,613 | |
| NCUA Guaranteed Notes Series 2010-R1, Class 2A | |
| | 74,113 | | | | 1.840 | | | | 10/07/20 | | | | 74,889 | |
| Residential Accredit Loans, Inc. Series 2005-Q05, Class A1(b) | |
| | 1,373,473 | | | | 1.153 | | | | 01/25/46 | | | | 964,250 | |
| Sequoia Mortgage Trust Series 2004-10, Class A3A(b) | |
| | 290,429 | | | | 0.763 | | | | 11/20/34 | | | | 281,419 | |
| Structured Adjustable Rate Mortgage Loan Trust Series 2004-16,
Class 3A1(b) |
|
| | 700,943 | | | | 2.605 | | | | 11/25/34 | | | | 686,838 | |
| | |
| TOTAL COLLATERALIZED MORTGAGE
OBLIGATIONS |
| | $ | 22,596,415 | |
| | |
| | Mortgage-Backed Obligations – (continued) | |
| | Commercial Mortgage-Backed Securities – 5.5% | |
| Banc of America Commercial Mortgage, Inc. Series 2007-2,
Class AM(b) |
|
| $ | 600,000 | | | | 5.633 | % | | | 04/10/49 | | | $ | 661,083 | |
| Bear Stearns Commercial Mortgage Securities Trust
Series 2007-PW18, Class A1A |
|
| | 7,140,760 | | | | 5.602 | | | | 06/11/50 | | | | 8,005,946 | |
| Citigroup Commercial Mortgage Trust Series 2008-C7,
Class A1A(b) |
|
| | 4,273,917 | | | | 6.046 | | | | 12/10/49 | | | | 4,867,351 | |
| Commercial Mortgage Trust Series 2007-C9, Class A1A(b) | |
| | 4,523,729 | | | | 5.800 | | | | 12/10/49 | | | | 5,099,515 | |
| FNMA ACES Series 2012-M13, Class A2 | |
| | 1,500,000 | | | | 2.377 | | | | 05/25/22 | | | | 1,408,916 | |
| FNMA ACES Series 2012-M8, Class A2 | |
| | 300,000 | | | | 2.349 | | | | 05/25/22 | | | | 280,933 | |
| FNMA ACES Series 2012-M8, Class ASQ2 | |
| | 200,000 | | | | 1.520 | | | | 12/25/19 | | | | 199,092 | |
| FNMA ACES Series 2012-M8, Class ASQ3 | |
| | 300,000 | | | | 1.801 | | | | 12/25/19 | | | | 293,935 | |
| LB Commercial Mortgage Trust Series 2007-C3, Class A1A(b) | |
| | 3,902,821 | | | | 6.036 | | | | 07/15/44 | | | | 4,363,147 | |
| ML-CFC Commercial Mortgage Trust Series 2006-4,
Class A1A(b) |
|
| | 4,027,059 | | | | 5.166 | | | | 12/12/49 | | | | 4,415,147 | |
| Morgan Stanley Capital I, Inc. Series 2007-HQ11, Class AM(b) | |
| | 150,000 | | | | 5.478 | | | | 02/12/44 | | | | 166,268 | |
| Morgan Stanley Capital I, Inc. Series 2007-HQ13, Class AM(b) | |
| | 250,000 | | | | 5.931 | | | | 12/15/44 | | | | 246,429 | |
| | |
| TOTAL COMMERCIAL MORTGAGE-
BACKED SECURITIES |
| | $ | 30,007,762 | |
| | |
| | Federal Agencies – 7.5% | |
| | FHLMC – 1.1% | |
| $ | 775 | | | | 5.000 | % | | | 09/01/16 | | | $ | 809 | |
| | 8,704 | | | | 5.000 | | | | 11/01/16 | | | | 9,215 | |
| | 1,326 | | | | 5.000 | | | | 12/01/16 | | | | 1,404 | |
| | 28,538 | | | | 5.000 | | | | 01/01/17 | | | | 30,217 | |
| | 45,907 | | | | 5.000 | | | | 02/01/17 | | | | 48,628 | |
| | 36,130 | | | | 5.000 | | | | 03/01/17 | | | | 38,269 | |
| | 65,141 | | | | 5.000 | | | | 04/01/17 | | | | 68,993 | |
| | 3,000 | | | | 5.000 | | | | 05/01/17 | | | | 3,178 | |
| | 1,209 | | | | 5.000 | | | | 06/01/17 | | | | 1,280 | |
| | 1,681 | | | | 5.000 | | | | 08/01/17 | | | | 1,781 | |
| | 196,494 | | | | 5.000 | | | | 09/01/17 | | | | 208,122 | |
| | 226,103 | | | | 5.000 | | | | 10/01/17 | | | | 239,481 | |
| | 128,658 | | | | 5.000 | | | | 11/01/17 | | | | 136,275 | |
| | 138,812 | | | | 5.000 | | | | 12/01/17 | | | | 147,026 | |
| | 167,196 | | | | 5.000 | | | | 01/01/18 | | | | 177,055 | |
| | 383,889 | | | | 5.000 | | | | 02/01/18 | | | | 406,384 | |
| | 378,076 | | | | 5.000 | | | | 03/01/18 | | | | 400,444 | |
| | 327,468 | | | | 5.000 | | | | 04/01/18 | | | | 346,930 | |
| | 246,101 | | | | 5.000 | | | | 05/01/18 | | | | 260,752 | |
| | 60,809 | | | | 5.000 | | | | 06/01/18 | | | | 64,426 | |
| | 63,500 | | | | 5.000 | | | | 07/01/18 | | | | 67,406 | |
| | 32,797 | | | | 5.000 | | | | 08/01/18 | | | | 34,770 | |
| | 24,457 | | | | 5.000 | | | | 09/01/18 | | | | 25,911 | |
| | |
| | |
| 68 | | The accompanying notes are an integral part of these financial statements. |
GOLDMAN SACHS GLOBAL INCOME FUND
| | | | | | | | | | | | | | |
Principal
Amount | | | Interest
Rate | | | Maturity
Date | | | Value | |
| | Mortgage-Backed Obligations – (continued) | |
| | FHLMC – (continued) | |
| $ | 71,684 | | | | 5.000 | % | | | 10/01/18 | | | $ | 75,976 | |
| | 89,994 | | | | 5.000 | | | | 11/01/18 | | | | 95,406 | |
| | 60,090 | | | | 5.000 | | | | 12/01/18 | | | | 63,662 | |
| | 42,748 | | | | 5.000 | | | | 01/01/19 | | | | 45,303 | |
| | 5,158 | | | | 5.000 | | | | 02/01/19 | | | | 5,478 | |
| | 10,849 | | | | 5.000 | | | | 03/01/19 | | | | 11,523 | |
| | 2,151 | | | | 5.000 | | | | 10/01/35 | | | | 2,316 | |
| | 1,000,000 | | | | 5.000 | | | | 06/01/36 | | | | 1,076,771 | |
| | 16,639 | | | | 5.000 | | | | 02/01/37 | | | | 18,008 | |
| | 2,239 | | | | 5.000 | | | | 11/01/37 | | | | 2,409 | |
| | 953,697 | | | | 5.000 | | | | 03/01/38 | | | | 1,026,567 | |
| | 943,509 | | | | 5.000 | | | | 11/01/38 | | | | 1,015,102 | |
| | 44,995 | | | | 4.500 | | | | 09/01/39 | | | | 48,249 | |
| | 87,028 | | | | 5.000 | | | | 01/01/40 | | | | 94,459 | |
| | | | | | | | | | | | | | |
| | | | | | | | | | | | | 6,299,985 | |
| | |
| | FNMA – 5.9% | |
| | 2,084 | | | | 5.000 | | | | 04/01/18 | | | | 2,213 | |
| | 30,424 | | | | 5.000 | | | | 05/01/18 | | | | 32,248 | |
| | 3,804 | | | | 5.000 | | | | 06/01/18 | | | | 4,035 | |
| | 3,612 | | | | 5.000 | | | | 11/01/18 | | | | 3,838 | |
| | 3,704 | | | | 5.000 | | | | 03/01/19 | | | | 3,940 | |
| | 4,559 | | | | 5.000 | | | | 04/01/19 | | | | 4,868 | |
| | 4,000,000 | | | | 4.506 | | | | 06/01/19 | | | | 4,412,364 | |
| | 1,633,057 | | | | 3.416 | | | | 10/01/20 | | | | 1,710,945 | |
| | 1,250,348 | | | | 3.632 | | | | 12/01/20 | | | | 1,322,216 | |
| | 773,155 | | | | 3.762 | | | | 12/01/20 | | | | 824,484 | |
| | 2,074,631 | | | | 4.375 | | | | 06/01/21 | | | | 2,270,950 | |
| | 400,000 | | | | 3.830 | | | | 07/01/21 | | | | 422,719 | |
| | 312,959 | | | | 5.000 | | | | 05/01/26 | | | | 343,553 | |
| | 245,189 | | | | 6.000 | | | | 09/01/27 | | | | 269,905 | |
| | 6,489 | | | | 5.000 | | | | 08/01/33 | | | | 7,065 | |
| | 5,790 | | | | 5.500 | | | | 02/01/34 | | | | 6,324 | |
| | 7,144 | | | | 5.500 | | | | 05/01/34 | | | | 7,803 | |
| | 4,928 | | | | 5.500 | | | | 10/01/34 | | | | 5,383 | |
| | 32,728 | | | | 5.500 | | | | 12/01/34 | | | | 35,748 | |
| | 7,838 | | | | 5.500 | | | | 04/01/35 | | | | 8,562 | |
| | 7,603 | | | | 5.500 | | | | 07/01/35 | | | | 8,297 | |
| | 63,679 | | | | 4.500 | | | | 05/01/39 | | | | 68,438 | |
| | 38,007 | | | | 4.500 | | | | 06/01/39 | | | | 40,847 | |
| | 46,057 | | | | 4.500 | | | | 08/01/39 | | | | 49,513 | |
| | 740,722 | | | | 5.000 | | | | 12/01/39 | | | | 802,947 | |
| | 164,484 | | | | 6.000 | | | | 05/01/41 | | | | 180,578 | |
| | 117,640 | | | | 4.500 | | | | 07/01/41 | | | | 125,840 | |
| | 171,808 | | | | 4.500 | | | | 08/01/41 | | | | 183,784 | |
| | 44,992 | | | | 4.500 | | | | 10/01/41 | | | | 48,128 | |
| | 935,008 | | | | 3.000 | | | | 08/01/42 | | | | 914,952 | |
| | 824,186 | | | | 3.000 | | | | 09/01/42 | | | | 806,655 | |
| | 112,925 | | | | 3.000 | | | | 10/01/42 | | | | 110,526 | |
| | 511,188 | | | | 3.000 | | | | 11/01/42 | | | | 500,283 | |
| | 5,044,381 | | | | 3.000 | | | | 12/01/42 | | | | 4,936,342 | |
| | 3,436,226 | | | | 3.000 | | | | 01/01/43 | | | | 3,363,031 | |
| | 1,019,849 | | | | 3.000 | | | | 02/01/43 | | | | 998,038 | |
| | 990,014 | | | | 2.500 | | | | 03/01/43 | | | | 920,908 | |
| | 247,860 | | | | 3.000 | | | | 03/01/43 | | | | 242,593 | |
| | 717,554 | | | | 3.000 | | | | 04/01/43 | | | | 702,305 | |
| | |
| | Mortgage-Backed Obligations – (continued) | |
| | FNMA – (continued) | |
| $ | 994,615 | | | | 2.500 | % | | | 05/01/43 | | | $ | 925,188 | |
| | 1,000,000 | | | | 4.000 | | | | TBA-30yr | (d) | | | 1,048,906 | |
| | 1,000,000 | | | | 5.500 | | | | TBA-30yr | (d) | | | 1,090,469 | |
| | 2,000,000 | | | | 6.000 | | | | TBA-30yr | (d) | | | 2,188,125 | |
| | | | | | | | | | | | | | |
| | | | | | | | | | | | | 31,955,856 | |
| | |
| | GNMA – 0.5% | |
| | 716,931 | | | | 3.950 | | | | 07/15/25 | | | | 755,137 | |
| | 200,034 | | | | 2.500 | | | | 01/15/43 | | | | 186,530 | |
| | 786,936 | | | | 2.500 | | | | 02/15/43 | | | | 734,146 | |
| | 1,000,000 | | | | 4.000 | | | | TBA-30yr | (d) | | | 1,058,125 | |
| | | | | | | | | | | | | | |
| | | | | | | | | | | | | 2,733,938 | |
| | |
| | TOTAL FEDERAL AGENCIES | | | $ | 40,989,779 | |
| | |
| | TOTAL MORTGAGE-BACKED OBLIGATIONS | |
| | (Cost $97,732,901) | | | $ | 96,662,458 | |
| | |
| | |
| | Agency Debentures – 0.1% | |
| FHLMC | |
| $ | 800,000 | | | | 2.375 | % | | | 01/13/22 | | | $ | 778,528 | |
| | |
| | TOTAL AGENCY DEBENTURES | |
| | (Cost $795,851) | | | $ | 778,528 | |
| | |
| | |
| | Municipal Debt Obligations – 1.3% | |
| | California – 0.2% | |
| California State GO Bonds (Various Purpose) Series 2011 | |
| $ | 385,000 | | | | 5.000 | % | | | 09/01/41 | | | $ | 393,308 | |
| California State GO Bonds (Various Purpose) Series 2012 | |
| | 560,000 | | | | 5.000 | | | | 09/01/42 | | | | 572,914 | |
| | | | | | | | | | | | | | |
| | | | | | | | | | | | | 966,222 | |
| | |
| | Connecticut – 0.1% | |
| Connecticut State GO Bonds Series 2013 E | |
| | 715,000 | | | | 5.000 | | | | 08/15/24 | | | | 836,321 | |
| | |
| | Massachusetts – 0.1% | |
| Massachusetts State School Building Authority Sales Tax RB
(Refunding-Senior) Series 2012 B |
|
| | 530,000 | | | | 5.000 | | | | 08/15/30 | | | | 577,891 | |
| | |
| | New Jersey – 0.1% | |
| New Jersey State Transportation Trust Fund Authority RB
(Transportation Program) Series 2013 AA |
|
| | 270,000 | | | | 5.000 | | | | 06/15/44 | | | | 273,502 | |
| | |
| | New York – 0.5% | |
| New York City GO Bonds Series 2012 I | |
| | 535,000 | | | | 5.000 | | | | 08/01/25 | | | | 605,449 | |
| New York City Transitional Finance Authority RB (Future Tax
Secured) Series 2012 F-1 |
|
| | 340,000 | | | | 5.000 | | | | 05/01/34 | | | | 361,172 | |
| New York City Water & Sewer System Finance Authority RB
(Refunding) Series 2011 AA |
|
| | 410,000 | | | | 5.000 | | | | 06/15/44 | | | | 422,382 | |
| | |
| | |
| The accompanying notes are an integral part of these financial statements. | | 69 |
GOLDMAN SACHS GLOBAL INCOME FUND
Schedule of Investments (continued)
September 30, 2013 (Unaudited)
| | | | | | | | | | | | | | |
Principal
Amount | | | Interest
Rate | | | Maturity
Date | | | Value | |
| | Municipal Debt Obligations – (continued) | |
| | New York – (continued) | |
| New York State Dormitory Authority Personal Income Tax RB
(General Purpose) Series 2012 A |
|
| $ | 425,000 | | | | 5.000 | % | | | 02/15/30 | | | $ | 463,110 | |
| New York State Dormitory Authority Personal Income Tax RB
Series 2013 B |
|
| | 465,000 | | | | 5.000 | | | | 03/15/34 | | | | 493,602 | |
| New York State Urban Development Corp. RB (Personal Income
Tax) Series 2013 C |
|
| | 380,000 | | | | 5.000 | | | | 03/15/28 | | | | 421,967 | |
| | | | | | | | | | | | | | |
| | | | | | | | | | | | | 2,767,682 | |
| | |
| | North Carolina – 0.1% | |
| North Carolina State University at Raleigh RB Series 2013 A | |
| | 325,000 | | | | 5.000 | | | | 10/01/42 | | | | 342,784 | |
| | |
| | Texas – 0.2% | |
| Dallas-Fort Worth TX International Airport RB (Improvement)
Series 2013 F |
|
| | 415,000 | | | | 5.250 | | | | 11/01/33 | | | | 434,837 | |
| North Texas Tollway Authority RB (Special Projects System)
Series 2011 A |
|
| | 970,000 | | | | 5.500 | | | | 09/01/41 | | | | 1,045,970 | |
| | | | | | | | | | | | | | |
| | | | | | | | | | | | | 1,480,807 | |
| | |
| | TOTAL MUNICIPAL DEBT OBLIGATIONS | |
| | (Cost $7,144,377) | | | $ | 7,245,209 | |
| | |
| | |
| | Government Guarantee Obligations(e) – 2.2% | |
| Achmea Hypotheekbank NV(a) | |
| $ | 387,000 | | | | 3.200 | % | | | 11/03/14 | | | $ | 398,734 | |
| Kreditanstalt fuer Wiederaufbau | |
| EUR | 5,676,000 | | | | 3.125 | | | | 06/15/18 | | | | 8,437,504 | |
| AUD | 3,000,000 | | | | 6.000 | | | | 08/20/20 | | | | 3,062,120 | |
| | |
| | TOTAL GOVERNMENT GUARANTEE OBLIGATIONS | |
| | (Cost $11,251,695) | | | $ | 11,898,358 | |
| | |
| | |
| | U.S. Treasury Obligations – 5.7% | |
| United States Treasury Bonds | |
| $ | 2,300,000 | | | | 3.625 | % | | | 08/15/43 | | | $ | 2,273,596 | |
| | 1,400,000 | | | | 3.125 | | | | 02/15/42 | | | | 1,260,462 | |
| | 2,200,000 | | | | 3.000 | | | | 05/15/42 | | | | 1,927,926 | |
| United States Treasury Inflation Protected Securities | |
| | 1,996,861 | | | | 1.125 | | | | 01/15/21 | | | | 2,150,999 | |
| United States Treasury Notes | |
| | 7,400,000 | | | | 1.375 | | | | 09/30/18 | | | | 7,394,672 | |
| | 6,700,000 | | | | 1.750 | | | | 05/15/23 | | | | 6,208,220 | |
| | 4,400,000 | | | | 2.125 | (f) | | | 08/31/20 | | | | 4,438,984 | |
| | 5,300,000 | | | | 2.000 | | | | 09/30/20 | | | | 5,294,435 | |
| | |
| | TOTAL U.S. TREASURY OBLIGATIONS | |
| | (Cost $31,252,924) | | | $ | 30,949,294 | |
| | |
| | | | | | | | | | | | | | |
Notional
Amount | | | Exercise
Rate | | | Expiration
Date | | | Value | |
| | Options Purchased – 1.0% | |
| | Currency Option | |
| Put EUR | 2,094,000 | | | | | | | | | | | | | |
| Call USD | 2,749,422 | | | | 1.313 | % | | | 10/04/13 | | | $ | 79 | |
| | Interest Rate Swaptions | |
| Barclays Bank PLC Call - OTC - 10 year Interest Rate Swap
Strike Price 3.710% |
|
| | 16,000,000 | | | | 3.710 | | | | 03/08/16 | | | | 887,285 | |
| Citibank Securities, Inc. Put - OTC - 10 year Interest Rate Swap
Strike Price 3.017% |
|
| | 12,600,000 | | | | 3.017 | | | | 05/29/15 | | | | 308,671 | |
| Citibank Securities, Inc. Call - OTC - 10 year Interest Rate Swap
Strike Price 3.017% |
|
| | 12,600,000 | | | | 3.017 | | | | 05/29/15 | | | | 829,815 | |
| Citibank Securities, Inc. Put - OTC - 10 year Interest Rate Swap
Strike Price 3.500% |
|
| | 2,000,000 | | | | 3.500 | | | | 07/02/15 | | | | 87,197 | |
| Citibank Securities, Inc. Call - OTC - 10 year Interest Rate Swap
Strike Price 3.500% |
|
| | 2,000,000 | | | | 3.500 | | | | 07/02/15 | | | | 92,667 | |
| JPMorgan Chase Bank NA Put - OTC - 10 year Interest Rate
Swap Strike Price 3.498% |
|
| | 8,000,000 | | | | 3.498 | | | | 07/02/15 | | | | 347,856 | |
| JPMorgan Chase Bank NA Call - OTC - 10 year Interest Rate
Swap Strike Price 3.498% |
|
| | 8,000,000 | | | | 3.498 | | | | 07/02/15 | | | | 371,471 | |
| Royal Bank of Canada Call - OTC - 2 year Interest Rate Swap
Strike Price 1.916% |
|
| | 68,000,000 | | | | 1.916 | | | | 10/23/15 | | | | 724,567 | |
| Royal Bank of Canada Call - OTC - 10 year Interest Rate Swap
Strike Price 3.623% |
|
| | 31,000,000 | | | | 3.623 | | | | 02/22/16 | | | | 1,801,156 | |
| | |
| | TOTAL OPTIONS PURCHASED | |
| | (Cost $4,294,847) | | | $ | 5,450,764 | |
| | |
| | |
Principal
Amount | | | Interest
Rate | | | Maturity
Date | | | Value | |
| | Short-Term Obligation – 2.7% | |
| | Time Deposit – 2.7% | |
| Rabobank Nederland | |
| $ | 14,733,320 | | | | 0.050 | % | | | 10/01/13 | | | $ | 14,733,320 | |
| | (Cost $14,733,320) | |
| | |
| | TOTAL INVESTMENTS – 95.0% | |
| | (Cost $505,677,393) | | | $ | 517,935,476 | |
| | |
| OTHER ASSETS IN EXCESS OF
LIABILITIES – 5.0% |
| | | 27,222,949 | |
| | |
| | NET ASSETS – 100.0% | | | $ | 545,158,425 | |
| | |
| | |
| 70 | | The accompanying notes are an integral part of these financial statements. |
GOLDMAN SACHS GLOBAL INCOME FUND
| | |
| The percentage shown for each investment category reflects the value of investments in that category as a percentage of net assets. |
(a) | | Exempt from registration under Rule 144A of the Securities Act of 1933. Under procedures approved by the Board of Trustees, such securities have been determined to be liquid by the investment adviser and may be resold, normally to qualified institutional buyers in transactions exempt from registration. Total market value of Rule 144A securities amounts to $90,555,580, which represents approximately 16.6% of net assets as of September 30, 2013. |
(b) | | Variable rate security. Interest rate disclosed is that which is in effect at September 30, 2013. |
(c) | | Security with “Call” features with resetting interest rates. Maturity dates disclosed are the final maturity dates. |
(d) | | TBA (To Be Announced) Securities are purchased on a forward commitment basis with an approximate principal amount and no defined maturity date. The actual principal and maturity date will be determined upon settlement when the specific mortgage pools are assigned. Total market value of TBA securities (excluding forward sales contracts, if any) amounts to $5,385,625 which represents approximately 1.0% of net assets as of September 30, 2013. |
(e) | | Guaranteed by a foreign government until maturity. |
(f) | | All or a portion of security is segregated as collateral for initial margin requirement on futures transactions. |
| | |
|
Currency Abbreviations: |
AUD | | —Australian Dollar |
BRL | | —Brazilian Real |
CAD | | —Canadian Dollar |
CHF | | —Swiss Franc |
CLP | | —Chilean Peso |
CZK | | —Czech Koruna |
DKK | | —Danish Krone |
EUR | | —Euro |
GBP | | —British Pound |
HUF | | —Hungarian Forint |
IDR | | —Indonesian Rupiah |
ILS | | —Israeli Shekel |
JPY | | —Japanese Yen |
KRW | | —South Korean Won |
MXN | | —Mexican Peso |
MYR | | —Malaysian Ringgit |
NOK | | —Norwegian Krone |
NZD | | —New Zealand Dollar |
PHP | | —Philippine Peso |
PLN | | —Polish Zloty |
RUB | | —Russian Ruble |
SEK | | —Swedish Krona |
SGD | | —Singapore Dollar |
TRY | | —Turkish Lira |
TWD | | —Taiwan Dollar |
USD | | —U.S. Dollar |
ZAR | | —South African Rand |
| | |
Investment Abbreviations: |
ACES | | —Alternative Credit Enhancement Securities |
AUDOR | | —Australian Dollar Offered Rate |
BP | | —British Pound Offered Rate |
CDOR | | —Canadian Dollar Offered Rate |
CHFOR | | —Swiss Franc Offered Rate |
EURO | | —Euro Offered Rate |
FHLMC | | —Federal Home Loan Mortgage Corp. |
FNMA | | —Federal National Mortgage Association |
GNMA | | —Government National Mortgage Association |
GO | | —General Obligation |
JYOR | | —Japanese Yen Offered Rate |
LIBOR | | —London Interbank Offered Rate |
NCUA | | —National Credit Union Administration |
NIBOR | | —Norwegian Interbank Offered Rate |
NZDOR | | —New Zealand Dollar Offered Rate |
OTC | | —Over the Counter |
RB | | —Revenue Bond |
REMIC | | —Real Estate Mortgage Investment Conduit |
SPA | | —Stand-by Purchase Agreement |
STIBOR | | —Stockholm Interbank Offered Rate |
|
| | |
| The accompanying notes are an integral part of these financial statements. | | 71 |
GOLDMAN SACHS GLOBAL INCOME FUND
Schedule of Investments (continued)
September 30, 2013 (Unaudited)
|
| ADDITIONAL INVESTMENT INFORMATION |
FORWARD FOREIGN CURRENCY EXCHANGE CONTRACTS — At September 30, 2013, the Fund had the following forward foreign currency exchange contracts:
FORWARD FOREIGN CURRENCY EXCHANGE CONTRACTS WITH UNREALIZED GAIN
| | | | | | | | | | | | | | |
| Counterparty | | Contracts to
Buy/Sell | | Settlement
Date | | | Current
Value | | | Unrealized
Gain | |
Bank of America Securities LLC | | CZK/EUR | | | 12/18/13 | | | $ | 474,949 | | | $ | 160 | |
| | EUR/USD | | | 12/18/13 | | | | 1,357,190 | | | | 22,083 | |
| | HUF/EUR | | | 12/18/13 | | | | 724,968 | | | | 724 | |
| | PLN/USD | | | 12/18/13 | | | | 1,787,364 | | | | 9,364 | |
Barclays Bank PLC | | EUR/USD | | | 10/25/13 | | | | 3,435,461 | | | | 1,174 | |
| | EUR/USD | | | 12/18/13 | | | | 901,185 | | | | 13,927 | |
| | GBP/EUR | | | 12/18/13 | | | | 1,811,842 | | | | 11,617 | |
| | HUF/EUR | | | 12/18/13 | | | | 450,592 | | | | 2,366 | |
| | NOK/USD | | | 12/18/13 | | | | 596,767 | | | | 7,283 | |
| | USD/MYR | | | 10/11/13 | | | | 883,249 | | | | 5,751 | |
| | USD/PHP | | | 10/17/13 | | | | 218,487 | | | | 4,513 | |
BNP Paribas SA | | GBP/USD | | | 12/18/13 | | | | 2,848,921 | | | | 101,553 | |
Citibank NA | | CHF/USD | | | 10/11/13 | | | | 3,247,316 | | | | 24,726 | |
| | EUR/USD | | | 12/18/13 | | | | 1,792,898 | | | | 3,035 | |
| | GBP/EUR | | | 12/18/13 | | | | 901,185 | | | | 466 | |
| | MXN/USD | | | 12/18/13 | | | | 498,025 | | | | 3,136 | |
| | NZD/USD | | | 12/18/13 | | | | 447,695 | | | | 5,721 | |
| | PHP/USD | | | 10/11/13 | | | | 447,371 | | | | 3,371 | |
| | RUB/USD | | | 10/07/13 | | | | 463,812 | | | | 14,812 | |
| | USD/IDR | | | 10/24/13 | | | | 434,356 | | | | 9,644 | |
| | USD/RUB | | | 10/10/13 | | | | 443,545 | | | | 1,455 | |
| | USD/RUB | | | 10/24/13 | | | | 437,799 | | | | 8,201 | |
Credit Suisse International (London) | | JPY/USD | | | 12/18/13 | | | | 256,711 | | | | 1,711 | |
| | RUB/USD | | | 10/07/13 | | | | 465,203 | | | | 16,203 | |
| | RUB/USD | | | 10/10/13 | | | | 1,830,576 | | | | 54,576 | |
| | USD/RUB | | | 10/17/13 | | | | 886,108 | | | | 2,892 | |
Deutsche Bank AG (London) | | EUR/USD | | | 10/25/13 | | | | 12,732,444 | | | | 175,280 | |
| | GBP/USD | | | 10/24/13 | | | | 1,180,383 | | | | 20,416 | |
| | ILS/USD | | | 12/18/13 | | | | 444,648 | | | | 648 | |
| | MYR/USD | | | 10/03/13 | | | | 910,239 | | | | 9,239 | |
| | TWD/USD | | | 10/15/13 | | | | 444,545 | | | | 1,545 | |
| | USD/MXN | | | 10/30/13 | | | | 2,195,552 | | | | 19,866 | |
| | USD/MXN | | | 12/18/13 | | | | 442,123 | | | | 4,877 | |
| | USD/ZAR | | | 10/30/13 | | | | 1,792,124 | | | | 23,271 | |
HSBC Bank PLC | | EUR/SEK | | | 12/18/13 | | | | 447,366 | | | | 520 | |
| | GBP/USD | | | 10/24/13 | | | | 1,106,154 | | | | 14,958 | |
| | KRW/USD | | | 10/23/13 | | | | 446,273 | | | | 2,273 | |
| | MYR/USD | | | 10/03/13 | | | | 944,446 | | | | 15,446 | |
| | MYR/USD | | | 10/11/13 | | | | 901,398 | | | | 13,398 | |
JPMorgan Securities, Inc. | | EUR/NOK | | | 12/18/13 | | | | 1,753,255 | | | | 31,524 | |
| | EUR/USD | | | 12/18/13 | | | | 1,799,664 | | | | 20,889 | |
| | JPY/USD | | | 12/18/13 | | | | 1,425,652 | | | | 4,652 | |
| | USD/TRY | | | 12/18/13 | | | | 442,197 | | | | 566 | |
Morgan Stanley Capital Services, Inc. | | BRL/USD | | | 10/15/13 | | | | 977,126 | | | | 4,764 | |
| | HUF/EUR | | | 12/18/13 | | | | 450,592 | | | | 2,485 | |
| | RUB/USD | | | 10/15/13 | | | | 901,222 | | | | 14,222 | |
| | USD/MXN | | | 12/18/13 | | | | 878,370 | | | | 14,630 | |
| | |
| 72 | | The accompanying notes are an integral part of these financial statements. |
GOLDMAN SACHS GLOBAL INCOME FUND
|
| ADDITIONAL INVESTMENT INFORMATION (continued) |
FORWARD FOREIGN CURRENCY EXCHANGE CONTRACTS WITH UNREALIZED GAIN (continued)
| | | | | | | | | | | | | | |
| Counterparty | | Contracts to
Buy/Sell | | Settlement
Date | | | Current
Value | | | Unrealized
Gain | |
Royal Bank of Canada | | BRL/USD | | | 10/07/13 | | | $ | 477,529 | | | $ | 28,529 | |
| | BRL/USD | | | 10/11/13 | | | | 461,547 | | | | 17,547 | |
| | BRL/USD | | | 10/18/13 | | | | 452,686 | | | | 8,686 | |
| | MXN/USD | | | 12/18/13 | | | | 446,885 | | | | 2,885 | |
Royal Bank of Scotland PLC | | GBP/USD | | | 12/18/13 | | | | 454,648 | | | | 11,760 | |
Standard Chartered Bank | | SGD/USD | | | 12/18/13 | | | | 446,291 | | | | 2,291 | |
State Street Bank | | EUR/USD | | | 10/25/13 | | | | 1,828,858 | | | | 5,505 | |
| | GBP/EUR | | | 12/18/13 | | | | 906,597 | | | | 757 | |
| | JPY/USD | | | 12/18/13 | | | | 1,897,487 | | | | 2,487 | |
| | MXN/USD | | | 12/18/13 | | | | 447,471 | | | | 3,471 | |
| | USD/EUR | | | 10/25/13 | | | | 1,070,176 | | | | 2,122 | |
| | USD/MXN | | | 12/18/13 | | | | 882,061 | | | | 6,939 | |
UBS AG (London) | | BRL/USD | | | 10/18/13 | | | | 452,085 | | | | 8,085 | |
| | GBP/USD | | | 10/24/13 | | | | 502,913 | | | | 8,110 | |
| | MYR/USD | | | 10/11/13 | | | | 445,618 | | | | 1,618 | |
| | PHP/USD | | | 10/07/13 | | | | 913,849 | | | | 16,849 | |
| | PHP/USD | | | 10/11/13 | | | | 444,912 | | | | 1,912 | |
| | TWD/USD | | | 10/11/13 | | | | 889,034 | | | | 1,034 | |
| | USD/IDR | | | 11/19/13 | | | | 869,809 | | | | 68,191 | |
| | USD/ZAR | | | 12/18/13 | | | | 870,759 | | | | 18,241 | |
Westpac Banking Corp. | | AUD/USD | | | 12/18/13 | | | | 2,728,816 | | | | 52,465 | |
| | NZD/AUD | | | 12/18/13 | | | | 445,489 | | | | 5,379 | |
| | USD/AUD | | | 12/18/13 | | | | 2,703,559 | | | | 11,081 | |
| | | USD/MYR | | | 10/23/13 | | | | 882,594 | | | | 10,784 | |
| TOTAL | | | | | | | | | | | | $ | 1,022,661 | |
FORWARD FOREIGN CURRENCY EXCHANGE CONTRACTS WITH UNREALIZED LOSS
| | | | | | | | | | | | | | |
| Counterparty | | Contracts to
Buy/Sell | | Settlement
Date | | | Current
Value | | | Unrealized
Loss | |
Bank of America Securities LLC | | CZK/EUR | | | 12/18/13 | | | $ | 476,302 | | | $ | (807 | ) |
| | EUR/PLN | | | 12/18/13 | | | | 933,838 | | | | (13,033 | ) |
| | HUF/EUR | | | 12/18/13 | | | | 445,180 | | | | (2,441 | ) |
| | TRY/USD | | | 12/18/13 | | | | 865,412 | | | | (23,588 | ) |
| | USD/EUR | | | 12/18/13 | | | | 1,802,370 | | | | (24,157 | ) |
| | USD/MYR | | | 10/03/13 | | | | 455,026 | | | | (4,026 | ) |
Barclays Bank PLC | | EUR/GBP | | | 12/18/13 | | | | 474,864 | | | | (592 | ) |
| | MXN/USD | | | 12/18/13 | | | | 431,638 | | | | (13,362 | ) |
| | NOK/EUR | | | 12/18/13 | | | | 451,946 | | | | (14,156 | ) |
| | USD/AUD | | | 10/10/13 | | | | 2,834,921 | | | | (120,670 | ) |
| | USD/TRY | | | 12/18/13 | | | | 446,283 | | | | (3,283 | ) |
| | USD/ZAR | | | 12/18/13 | | | | 736,474 | | | | (1,474 | ) |
| | ZAR/USD | | | 12/18/13 | | | | 1,760,758 | | | | (15,242 | ) |
BNP Paribas SA | | EUR/GBP | | | 12/18/13 | | | | 2,788,419 | | | | (23,974 | ) |
| | RUB/USD | | | 10/15/13 | | | | 953,336 | | | | (16,787 | ) |
| | USD/JPY | | | 12/18/13 | | | | 1,861,740 | | | | (16,592 | ) |
Citibank NA | | EUR/GBP | | | 12/18/13 | | | | 463,482 | | | | (3,418 | ) |
| | MYR/USD | | | 10/23/13 | | | | 839,212 | | | | (25,788 | ) |
| | PHP/USD | �� | | 10/17/13 | | | | 887,281 | | | | (1,719 | ) |
| | RUB/USD | | | 10/17/13 | | | | 888,280 | | | | (720 | ) |
| | TRY/USD | | | 12/18/13 | | | | 429,329 | | | | (14,671 | ) |
| | |
| The accompanying notes are an integral part of these financial statements. | | 73 |
GOLDMAN SACHS GLOBAL INCOME FUND
Schedule of Investments (continued)
September 30, 2013 (Unaudited)
|
| ADDITIONAL INVESTMENT INFORMATION (continued) |
FORWARD FOREIGN CURRENCY EXCHANGE CONTRACTS WITH UNREALIZED LOSS (continued)
| | | | | | | | | | | | | | |
| Counterparty | | Contracts to
Buy/Sell | | Settlement
Date | | | Current
Value | | | Unrealized
Loss | |
Citibank NA (continued) | | USD/CAD | | | 12/18/13 | | | $ | 2,097,931 | | | $ | (3,665 | ) |
| | USD/EUR | | | 12/18/13 | | | | 2,402,672 | | | | (38,594 | ) |
| | USD/GBP | | | 12/18/13 | | | | 4,363,646 | | | | (105,231 | ) |
| | USD/JPY | | | 12/18/13 | | | | 445,071 | | | | (71 | ) |
| | USD/MXN | | | 12/18/13 | | | | 445,607 | | | | (1,607 | ) |
| | USD/MYR | | | 10/03/13 | | | | 453,919 | | | | (2,919 | ) |
| | USD/MYR | | | 10/18/13 | | | | 776,544 | | | | (1,544 | ) |
| | USD/RUB | | | 10/10/13 | | | | 908,240 | | | | (20,240 | ) |
| | USD/RUB | | | 10/21/13 | | | | 473,125 | | | | (125 | ) |
| | USD/TRY | | | 12/18/13 | | | | 460,402 | | | | (12,402 | ) |
Credit Suisse International (London) | | CLP/USD | | | 10/16/13 | | | | 521,667 | | | | (1,068 | ) |
| | CLP/USD | | | 10/25/13 | | | | 438,543 | | | | (7,457 | ) |
| | EUR/CHF | | | 12/18/13 | | | | 457,140 | | | | (5,194 | ) |
| | RUB/USD | | | 10/21/13 | | | | 795,055 | | | | (20,945 | ) |
| | USD/CZK | | | 10/17/13 | | | | 589,567 | | | | (8,064 | ) |
| | USD/JPY | | | 12/18/13 | | | | 900,978 | | | | (7,978 | ) |
| | USD/MXN | | | 10/30/13 | | | | 3,294,435 | | | | (4,937 | ) |
| | USD/RUB | | | 10/07/13 | | | | 922,917 | | | | (29,917 | ) |
| | USD/RUB | | | 10/15/13 | | | | 448,577 | | | | (4,577 | ) |
Deutsche Bank AG (London) | | AUD/USD | | | 12/18/13 | | | | 1,324,401 | | | | (497 | ) |
| | ILS/USD | | | 12/18/13 | | | | 441,874 | | | | (4,126 | ) |
| | MYR/USD | | | 10/18/13 | | | | 881,957 | | | | (7,043 | ) |
| | MYR/USD | | | 10/23/13 | | | | 430,399 | | | | (14,601 | ) |
| | USD/CNH | | | 12/18/13 | | | | 1,379,688 | | | | (310 | ) |
| | USD/CNH | | | 01/08/14 | | | | 2,218,598 | | | | (28,598 | ) |
| | USD/CZK | | | 12/18/13 | | | | 917,390 | | | | (21,452 | ) |
| | USD/DKK | | | 10/21/13 | | | | 3,434,748 | | | | (90,551 | ) |
| | USD/EUR | | | 12/18/13 | | | | 1,022,967 | | | | (3,388 | ) |
| | USD/PHP | | | 10/17/13 | | | | 237,192 | | | | (192 | ) |
| | USD/PLN | | | 12/18/13 | | | | 736,113 | | | | (11,207 | ) |
| | USD/RUB | | | 10/15/13 | | | | 243,634 | | | | (2,420 | ) |
| | USD/SEK | | | 10/04/13 | | | | 5,807,030 | | | | (90,839 | ) |
HSBC Bank PLC | | USD/AUD | | | 12/18/13 | | | | 451,057 | | | | (6,002 | ) |
| | USD/KRW | | | 10/24/13 | | | | 4,189,384 | | | | (237,022 | ) |
| | USD/MYR | | | 10/03/13 | | | | 455,444 | | | | (7,444 | ) |
| | USD/SEK | | | 12/18/13 | | | | 1,527,058 | | | | (21,087 | ) |
JPMorgan Securities, Inc. | | MXN/USD | | | 12/18/13 | | | | 1,753,959 | | | | (24,041 | ) |
| | NOK/EUR | | | 12/18/13 | | | | 1,368,015 | | | | (27,483 | ) |
| | USD/EUR | | | 12/18/13 | | | | 3,131,144 | | | | (15,132 | ) |
| | USD/HUF | | | 12/18/13 | | | | 2,074,466 | | | | (59,912 | ) |
| | USD/IDR | | | 10/07/13 | | | | 68,159 | | | | (659 | ) |
| | USD/RUB | | | 10/15/13 | | | | 205,521 | | | | (2,521 | ) |
| | USD/TRY | | | 12/18/13 | | | | 1,438,160 | | | | (22,146 | ) |
Morgan Stanley Capital Services, Inc. | | MXN/JPY | | | 12/18/13 | | | | 448,166 | | | | (17,463 | ) |
| | NZD/USD | | | 12/18/13 | | | | 875,566 | | | | (11,140 | ) |
| | USD/BRL | | | 11/04/13 | | | | 476,746 | | | | (3,746 | ) |
| | USD/ILS | | | 12/18/13 | | | | 943,750 | | | | (10,851 | ) |
Royal Bank of Canada | | CAD/USD | | | 12/18/13 | | | | 2,212,458 | | | | (13,542 | ) |
| | USD/BRL | | | 10/15/13 | | | | 456,402 | | | | (12,402 | ) |
| | USD/BRL | | | 10/18/13 | | | | 658,698 | | | | (11,698 | ) |
| | USD/CAD | | | 12/18/13 | | | | 494,357 | | | | (357 | ) |
| | USD/GBP | | | 10/24/13 | | | | 22,454,463 | | | | (534,391 | ) |
| | USD/NZD | | | 12/18/13 | | | | 998,390 | | | | (36,588 | ) |
| | |
| 74 | | The accompanying notes are an integral part of these financial statements. |
GOLDMAN SACHS GLOBAL INCOME FUND
|
| ADDITIONAL INVESTMENT INFORMATION (continued) |
FORWARD FOREIGN CURRENCY EXCHANGE CONTRACTS WITH UNREALIZED LOSS (continued)
| | | | | | | | | | | | | | |
| Counterparty | | Contracts to
Buy/Sell | | Settlement
Date | | | Current
Value | | | Unrealized
Loss | |
Royal Bank of Scotland PLC | | TRY/USD | | | 12/18/13 | | | $ | 2,952,822 | | | $ | (74,223 | ) |
| | USD/GBP | | | 12/18/13 | | | | 949,744 | | | | (3,057 | ) |
| | USD/TRY | | | 12/18/13 | | | | 449,499 | | | | (5,499 | ) |
Standard Chartered Bank | | USD/SGD | | | 12/18/13 | | | | 526,054 | | | | (9,056 | ) |
| | USD/TRY | | | 12/18/13 | | | | 1,489,119 | | | | (6,242 | ) |
| | ZAR/USD | | | 12/18/13 | | | | 427,820 | | | | (18,180 | ) |
State Street Bank | | MXN/USD | | | 12/18/13 | | | | 868,707 | | | | (20,293 | ) |
| | NOK/EUR | | | 12/18/13 | | | | 934,529 | | | | (29,676 | ) |
| | USD/AUD | | | 12/18/13 | | | | 444,561 | | | | (3,527 | ) |
| | USD/CHF | | | 12/18/13 | | | | 1,962,500 | | | | (54,820 | ) |
| | USD/EUR | | | 12/18/13 | | | | 473,596 | | | | (83 | ) |
| | USD/JPY | | | 12/18/13 | | | | 904,854 | | | | (16,854 | ) |
UBS AG (London) | | RUB/USD | | | 10/24/13 | | | | 879,613 | | | | (12,387 | ) |
| | USD/BRL | | | 10/07/13 | | | | 473,481 | | | | (25,481 | ) |
| | USD/BRL | | | 10/11/13 | | | | 458,770 | | | | (14,770 | ) |
| | USD/EUR | | | 10/25/13 | | | | 157,794,917 | | | | (3,226,368 | ) |
| | USD/IDR | | | 10/07/13 | | | | 321,455 | | | | (5,212 | ) |
| | USD/ZAR | | | 12/18/13 | | | | 1,429,158 | | | | (8,158 | ) |
| | ZAR/USD | | | 12/18/13 | | | | 1,310,524 | | | | (22,476 | ) |
Westpac Banking Corp. | | AUD/USD | | | 12/18/13 | | | | 1,750,399 | | | | (19,964 | ) |
| | EUR/USD | | | 12/18/13 | | | | 947,191 | | | | (924 | ) |
| | USD/AUD | | | 12/18/13 | | | | 889,121 | | | | (4,648 | ) |
| | USD/CAD | | | 10/23/13 | | | | 11,332,251 | | | | (263,077 | ) |
| | USD/EUR | | | 12/18/13 | | | | 893,066 | | | | (1,294 | ) |
| | | USD/JPY | | | 11/08/13 | | | | 44,911,010 | | | | (112,875 | ) |
| TOTAL | | | | | | | | | | | | $ | (5,927,030 | ) |
FORWARD SALES CONTRACTS — At September 30, 2013, the Fund had the following forward sales contracts:
| | | | | | | | | | | | | | | | | | |
| Description | | Interest
Rate | | | Maturity
Date(a) | | Settlement
Date | | | Principal
Amount | | | Value | |
FNMA (Proceeds Receivable $3,818,828) | | | 3.000 | % | | TBA-30yr | | | 10/10/13 | | | $ | (4,000,000 | ) | | $ | (3,909,062 | ) |
FUTURES CONTRACTS — At September 30, 2013, the Fund had the following futures contracts:
| | | | | | | | | | | | | | |
| Type | | Number of
Contracts
Long (Short) | | | Expiration
Date | | Current
Value | | | Unrealized
Gain (Loss) | |
Australian 10 Year Government Bonds | | | 11 | | | December 2013 | | $ | 1,206,952 | | | $ | 29,807 | |
Canada 10 Year Government Bonds | | | (6 | ) | | December 2013 | | | (755,148 | ) | | | (5,668 | ) |
Eurodollars | | | 158 | | | March 2015 | | | 53,138,343 | | | | 78,103 | |
Eurodollars | | | 3 | | | December 2014 | | | 1,009,717 | | | | 2,125 | |
French 10 Year Government Bonds | | | 28 | | | December 2013 | | | 5,018,696 | | | | 82,080 | |
Italian 10 Year Government Bonds | | | (19 | ) | | December 2013 | | | (2,837,225 | ) | | | 883 | |
Japan 10 Year Government Bonds | | | 6 | | | December 2013 | | | 8,797,192 | | | | 74,445 | |
U.K. Life Long Gilt | | | 53 | | | December 2013 | | | 9,465,649 | | | | 74,901 | |
Ultra Long U.S. Treasury Bonds | | | 94 | | | December 2013 | | | 13,356,813 | | | | 172,535 | |
10 Year German Euro-Bund | | | 99 | | | December 2013 | | | 18,817,473 | | | | 238,110 | |
10 Year U.S. Treasury Notes | | | (107 | ) | | December 2013 | | | (13,523,797 | ) | | | (1,810 | ) |
20 Year U.S. Treasury Bonds | | | (22 | ) | | December 2013 | | | (2,934,250 | ) | | | (2,378 | ) |
| TOTAL | | | | | | | | | | | | $ | 743,133 | |
| | |
| The accompanying notes are an integral part of these financial statements. | | 75 |
GOLDMAN SACHS GLOBAL INCOME FUND
Schedule of Investments (continued)
September 30, 2013 (Unaudited)
|
| ADDITIONAL INVESTMENT INFORMATION (continued) |
SWAP CONTRACTS — At September 30, 2013, the Fund had the following swap contracts:
OVER THE COUNTER INTEREST RATE SWAP CONTRACTS
| | | | | | | | | | | | | | | | | | | | | | | | |
| | | | | | | | | | | | Rates Exchanged | | Market Value | |
| Counterparty | | Notional
Amount
(000s) | | | Termination
Date | | | Payments Received | | Payments Made | | Upfront Payments
Made (Received) | | | Unrealized
Gain (Loss) | |
Bank of America Securities LLC | | | CAD | | | | 2,220 | (a) | | | 12/20/22 | | | 3.000% | | 6 month CDOR | | $ | (49,436 | ) | | $ | (21,080 | ) |
| | | | | | | 300 | | | | 06/27/33 | | | 6 month CDOR | | 3.475% | | | — | | | | 3,855 | |
Barclays Bank PLC | | | $ | | | | 6,080 | (a) | | | 03/10/26 | | | 3.210 | | 3 month LIBOR | | | — | | | | (302,162 | ) |
BNP Paribas SA | | | NOK | | | | 40,570 | (a) | | | 12/20/22 | | | 4.000 | | 6 month NIBOR | | | (51,130 | ) | | | 37,533 | |
Citibank NA | | | NZD | | | | 2,400 | (a) | | | 12/18/18 | | | 3 month NZDOR | | 3.500 | | | 41,743 | | | | 43,375 | |
| | | CAD | | | | 2,970 | (a) | | | 12/20/22 | | | 3.000 | | 6 month CDOR | | | (126,248 | ) | | | 31,910 | |
| | | NOK | | | | 23,560 | (a) | | | 12/20/22 | | | 6 month NIBOR | | 4.000 | | | 16,836 | | | | (8,940 | ) |
| | | NZD | | | | 1,150 | (a) | | | 12/18/23 | | | 3 month NZDOR | | 4.000 | | | 45,937 | | | | 24,085 | |
Credit Suisse International (London) | | | | | | | 6,350 | (a) | | | 12/18/18 | | | 3 month NZDOR | | 3.500 | | | 80,038 | | | | 145,169 | |
| | | | | | | 200 | (a) | | | 12/18/23 | | | 3 month NZDOR | | 4.000 | | | 4,520 | | | | 7,658 | |
Deutsche Bank Securities, Inc. | | | BRL | | | | 6,490 | | | | 01/02/15 | | | 9.942 | | 1 month Brazilian
Interbank Deposit
Average | | | — | | | | (3,453 | ) |
| | | CAD | | | | 12,960 | (a) | | | 12/20/22 | | | 3.000 | | 6 month CDOR | | | (342,453 | ) | | | (69,203 | ) |
| | | NOK | | | | 73,840 | (a) | | | 12/20/22 | | | 6 month NIBOR | | 4.000 | | | (9,189 | ) | | | 33,937 | |
| | | NZD | | | | 7,890 | (a) | | | 12/18/23 | | | 3 month NZDOR | | 4.000 | | | 146,068 | | | | 334,346 | |
JPMorgan Securities, Inc. | | | NOK | | | | 20,640 | (a) | | | 12/20/22 | | | 6 month NIBOR | | 4.000 | | | 23,560 | | | | (16,643 | ) |
| | | NZD | | | | 260 | (a) | | | 12/18/23 | | | 3 month NZDOR | | 4.000 | | | 5,678 | | | | 10,153 | |
Royal Bank of Canada | | | $ | | | | 30,710 | (a) | | | 10/27/17 | | | 1.416 | | 3 month LIBOR | | | — | | | | (306,176 | ) |
| | | CAD | | | | 12,810 | (a) | | | 12/20/22 | | | 3.000 | | 6 month CDOR | | | (391,197 | ) | | | (15,898 | ) |
| | | | | | | 8,810 | (a) | | | 12/20/22 | | | 6 month CDOR | | 3.000 | | | 329,146 | | | | (49,309 | ) |
| | | | | | | 4,300 | (a) | | | 10/06/25 | | | 2.780 | | 6 month CDOR | | | — | | | | (310,975 | ) |
| | | $ | | | | 11,560 | (a) | | | 02/24/26 | | | 3.123 | | 3 month LIBOR | | | — | | | | (647,203 | ) |
| | | CAD | | | | 2,500 | (a) | | | 10/04/35 | | | 6 month CDOR | | 2.860 | | | — | | | | 355,233 | |
UBS AG (London) | | | CHF | | | | 5,400 | | | | 01/06/17 | | | 2.105 | | 6 month CHFOR | | | — | | | | 434,523 | |
| TOTAL | | | | | | | | | | | | | | | | | | $ | (276,127 | ) | | $ | (289,265 | ) |
| | (a) | | Represents forward starting interest rate swaps whose effective dates of commencement of accruals and cash flows occur subsequent to September 30, 2013. |
CENTRALLY CLEARED INTEREST RATE SWAP CONTRACTS
| | | | | | | | | | | | | | | | |
| | | | | | Rates Exchanged | | Market Value | |
Notional
Amount
(000s)(a) | | | Termination
Date | | Payments Received | | Payments Made | | Upfront
Payments
Made (Received) | | | Unrealized
Gain (Loss) | |
| EUR | 6,720 | | | 06/05/15 | | 0.600% | | 6 month EURO | | $ | (18,111 | ) | | $ | 18,762 | |
| | 40,710 | | | 06/27/15 | | 0.850 | | 6 month EURO | | | 19,323 | | | | 112,707 | |
| NOK | 40,990 | | | 06/30/15 | | 3 month NIBOR | | 2.000% | | | 485 | | | | 1,602 | |
| EUR | 16,230 | | | 08/06/15 | | 0.750 | | 6 month EURO | | | 6,719 | | | | 16,895 | |
| | 63,830 | | | 08/18/15 | | 0.800 | | 6 month EURO | | | 12,836 | | | | 114,681 | |
| JPY | 15,188,130 | | | 08/18/15 | | 6 month JYOR | | 0.280 | | | 11,996 | | | | (46,129 | ) |
| AUD | 32,840 | | | 09/07/15 | | 3.200 | | 6 month AUDOR | | | (2,347 | ) | | | 76,426 | |
| $ | 74,450 | | | 09/26/15 | | 3 month LIBOR | | 0.650 | | | (10,855 | ) | | | (24,792 | ) |
| | 5,200 | | | 12/18/15 | | 0.500 | | 3 month LIBOR | | | 261 | | | | (4,275 | ) |
| GBP | 2,210 | | | 06/25/16 | | 1.650 | | 6 month BP | | | 4,730 | | | | — | |
| | 9,540 | | | 07/18/16 | | 6 month BP | | 0.930 | | | 43,295 | | | | 52,129 | |
| | |
| 76 | | The accompanying notes are an integral part of these financial statements. |
GOLDMAN SACHS GLOBAL INCOME FUND
|
| ADDITIONAL INVESTMENT INFORMATION (continued) |
CENTRALLY CLEARED INTEREST RATE SWAP CONTRACTS (continued)
| | | | | | | | | | | | | | | | |
| | | | | | Rates Exchanged | | Market Value | |
Notional
Amount
(000s)(a) | | | Termination
Date | | Payments Received | | Payments Made | | Upfront
Payments
Made (Received) | | | Unrealized
Gain (Loss) | |
| $ | 43,600 | | | 07/24/16 | | 3 month LIBOR | | 0.965% | | $ | 5,824 | | | $ | (97,754 | ) |
| CAD | 56,780 | | | 07/24/16 | | 1.940% | | 6 month CDOR | | | (10,010 | ) | | | 104,541 | |
| EUR | 49,700 | | | 07/27/16 | | 6 month EURO | | 1.100 | | | 31,958 | | | | (73,355 | ) |
| | 42,070 | | | 07/27/18 | | 1.600 | | 6 month EURO | | | (117,195 | ) | | | 148,953 | |
| $ | 2,580 | | | 12/18/18 | | 3 month LIBOR | | 1.000 | | | 92,475 | | | | (7,240 | ) |
| CAD | 10,020 | | | 12/18/18 | | 1.750 | | 6 month CDOR | | | (256,154 | ) | | | (15,170 | ) |
| GBP | 21,120 | | | 12/18/18 | | 6 month BP | | 1.000 | | | 1,357,946 | | | | 52,126 | |
| EUR | 29,760 | | | 12/18/18 | | 1.000 | | 6 month EURO | | | (630,944 | ) | | | 27,378 | |
| SEK | 31,860 | | | 12/18/18 | | 3 month STIBOR | | 1.750 | | | 130,917 | | | | 7,124 | |
| JPY | 641,900 | | | 12/18/18 | | 0.500 | | 6 month JYOR | | | (21,824 | ) | | | 45,708 | |
| $ | 32,690 | | | 08/15/19 | | 3.250 | | 3 month LIBOR | | | 26,163 | | | | 232,477 | |
| | 3,300 | | | 08/29/19 | | 3.520 | | 3 month LIBOR | | | 8 | | | | 47,073 | |
| | 3,300 | | | 08/29/19 | | 3.560 | | 3 month LIBOR | | | 8 | | | | 50,768 | |
| JPY | 877,900 | | | 04/24/20 | | 0.610 | | 6 month JYOR | | | (2,169 | ) | | | (5,248 | ) |
| EUR | 16,640 | | | 07/27/20 | | 6 month EURO | | 1.950 | | | 95,388 | | | | (58,424 | ) |
| $ | 10,730 | | | 12/18/20 | | 3 month LIBOR | | 1.500 | | | 153,175 | | | | 408,508 | |
| GBP | 13,140 | | | 07/18/21 | | 2.240 | | 6 month BP | | | (320,338 | ) | | | (142,755 | ) |
| $ | 16,920 | | | 08/15/21 | | 3 month LIBOR | | 3.000 | | | (114,780 | ) | | | (273,554 | ) |
| | 1,700 | | | 08/27/21 | | 3 month LIBOR | | 3.095 | | | 10 | | | | (46,588 | ) |
| | 1,700 | | | 08/27/21 | | 3 month LIBOR | | 3.132 | | | 10 | | | | (50,719 | ) |
| GBP | 8,895 | | | 12/20/22 | | 3.000 | | 6 month BP | | | (534,604 | ) | | | 152,650 | |
| JPY | 4,291,900 | | | 12/20/22 | | 6 month JYOR | | 1.250 | | | 27,099 | | | | (206,945 | ) |
| SEK | 1,840 | | | 12/18/23 | | 3 month STIBOR | | 2.250 | | | 12,475 | | | | 2,639 | |
| CAD | 2,620 | | | 12/18/23 | | 2.250 | | 6 month CDOR | | | (186,488 | ) | | | (5,124 | ) |
| AUD | 2,710 | | | 12/18/23 | | 4.000 | | 6 month AUDOR | | | (84,044 | ) | | | 2,171 | |
| GBP | 3,270 | | | 12/18/23 | | 2.000 | | 6 month BP | | | (364,496 | ) | | | (6,390 | ) |
| $ | 5,980 | | | 12/18/23 | | 2.000 | | 3 month LIBOR | | | (474,267 | ) | | | — | |
| GBP | 6,600 | | | 12/18/23 | | 6 month BP | | 2.000 | | | 416,458 | | | | 332,120 | |
| EUR | 7,930 | | | 12/18/23 | | 1.750 | | 6 month EURO | | | (345,148 | ) | | | (29,602 | ) |
| JPY | 509,510 | | | 12/18/23 | | 6 month JYOR | | 0.750 | | | 172,330 | | | | (97,707 | ) |
| EUR | 50 | | | 12/19/23 | | 3.250 | | 6 month EURO | | | (126 | ) | | | 728 | |
| NZD | 5,000 | | | 12/19/23 | | 5.750 | | 3 month NZDOR | | | (19,171 | ) | | | 49,195 | |
| CHF | 7,250 | | | 12/19/23 | | 2.500 | | 6 month CHFOR | | | (7,030 | ) | | | 44,981 | |
| $ | 7,500 | | | 06/12/24 | | 3 month LIBOR | | 2.807 | | | 60 | | | | 177,072 | |
| GBP | 8,420 | | | 07/18/24 | | 6 month BP | | 2.700 | | | 264,251 | | | | 71,696 | |
| $ | 9,800 | | | 07/24/24 | | 3.097 | | 3 month LIBOR | | | (76,778 | ) | | | 56,074 | |
| CAD | 13,190 | | | 07/24/24 | | 6 month CDOR | | 3.250 | | | 34,367 | | | | 17,701 | |
| JPY | 1,431,450 | | | 04/24/25 | | 6 month JYOR | | 1.030 | | | 48,906 | | | | 103,239 | |
| | 2,028,750 | | | 05/09/25 | | 6 month JYOR | | 1.650 | | | 41,028 | | | | 99,376 | |
| | 1,241,660 | | | 05/09/27 | | 1.880 | | 6 month JYOR | | | (36,883 | ) | | | (81,769 | ) |
| | 728,550 | | | 04/24/30 | | 1.480 | | 6 month JYOR | | | (28,528 | ) | | | (68,925 | ) |
| EUR | 2,270 | | | 12/18/43 | | 2.250 | | 6 month EURO | | | (79,082 | ) | | | (174,707 | ) |
| $ | 3,150 | | | 12/18/43 | | 3 month LIBOR | | 3.000 | | | 340,755 | | | | 84,300 | |
| | TOTAL | | | | | | | | | $ | (390,116 | ) | | $ | 1,194,628 | |
| | (a) | | Represents forward starting interest rate swaps whose effective dates of commencement of accruals and cash flows occur subsequent to September 30, 2013. |
| | |
| The accompanying notes are an integral part of these financial statements. | | 77 |
GOLDMAN SACHS GLOBAL INCOME FUND
Schedule of Investments (continued)
September 30, 2013 (Unaudited)
|
| ADDITIONAL INVESTMENT INFORMATION (continued) |
OVER THE COUNTER CREDIT DEFAULT SWAP CONTRACTS
| | | | | | | | | | | | | | | | | | | | | | | | | | |
| | | | | | | | | | | | | | | | | Market Value | |
| Counterparty | | Referenced Obligation | | Notional
Amount
(000s) | | | Rates Received
(Paid) | | | Termination
Date | | | Credit
Spread at
September 30,
2013(b) | | | Upfront
Payments
Made (Received) | | | Unrealized
Gain (Loss) | |
Protection Purchased: | | | | | | | | | | | | | | | | | | | | | | | | |
Bank of America Securities LLC | | CDX North America Investment Grade Index 16 | | $ | 16,650 | | | | (1.000 | )% | | | 06/20/14 | | | | 0.114 | % | | $ | (43,967 | ) | | $ | (68,625 | ) |
Morgan Stanley Capital Services, Inc. | | CDX North America Investment Grade Index 16 | | | 28,700 | | | | (1.000 | ) | | | 06/20/14 | | | | 0.114 | | | | (70,635 | ) | | | (123,441 | ) |
Protection Sold: | | | | | | | | | | | | | | | | | | | | | | | | | | |
Bank of America Securities LLC | | CDX North America Investment Grade Index 16 | | | 5,400 | | | | 1.000 | | | | 06/20/16 | | | | 0.354 | | | | 4,192 | | | | 92,249 | |
Morgan Stanley Capital Services, Inc. | | CDX North America Investment Grade Index 16 | | | 24,050 | | | | 1.000 | | | | 06/20/16 | | | | 0.354 | | | | 17,845 | | | | 411,672 | |
| TOTAL | | | | | | | | | | | | | | | | | | | | $ | (92,565 | ) | | $ | 311,855 | |
| | (b) | | Credit spread on the Referenced Obligation, together with the term of the swap contract, are indicators of payment/performance risk. The likelihood of a credit event occurring which would require a fund to make a payment or otherwise be required to perform under the swap contract is generally greater as the credit spread and the term of the swap contract increase. |
CENTRALLY CLEARED CREDIT DEFAULT SWAP CONTRACTS
| | | | | | | | | | | | | | | | | | | | | | |
| | | | | | | | | | | | | | Market Value | |
| Referenced Obligation | | Notional
Amount (000s) | | Rates Received
(Paid) | | | Termination
Date | | | Credit
Spread at
September 30,
2013(b) | | | Upfront
Payments
Made (Received) | | | Unrealized
Gain (Loss) | |
Protection Purchased: | | | | | | | | | | | | | | | | | | | | | | |
| | | | | | |
iTraxx Europe Index Series 19 | | EUR 14,500 | | | (1.000 | )% | | | 06/20/18 | | | | 0.942 | % | | $ | 104,049 | | | $ | (47,109 | ) |
| | (b) | | Credit spread on the Referenced Obligation, together with the term of the swap contract, are indicators of payment/performance risk. The likelihood of a credit event occurring which would require a fund to make a payment or otherwise be required to perform under the swap contract is generally greater as the credit spread and the term of the swap contract increase. |
WRITTEN OPTIONS CONTRACTS — For the six months ended September 30, 2013, the Fund had the following written swaptions activity:
| | | | | | | | |
| | | Notional
Amount
(000s) | | | Premiums
Received | |
Contracts Outstanding March 31, 2013 | | $ | — | | | $ | — | |
Contracts written | | | 10,458 | | | | 33,590 | |
Contracts bought to close | | | — | | | | — | |
Contracts expired | | | (10,458 | ) | | | (33,590 | ) |
Contracts Outstanding September 30, 2013 | | $ | — | | | $ | — | |
| | |
| 78 | | The accompanying notes are an integral part of these financial statements. |
GOLDMAN SACHS STRATEGIC INCOME FUND
Schedule of Investments
September 30, 2013 (Unaudited)
| | | | | | | | | | | | | | |
Principal
Amount | | | Interest
Rate | | | Maturity
Date | | | Value | |
| | Corporate Obligations – 10.5% | |
| | Banks – 2.3% | |
| Abbey National Treasury Services PLC(a) | |
| GBP | 1,800,000 | | | | 2.113 | % | | | 02/16/15 | | | $ | 2,963,269 | |
| ABN AMRO Bank NV(a)(b) | |
| EUR | 15,000 | | | | 4.310 | | | | 03/10/49 | | | | 19,329 | |
| ANZ Capital Trust II(b)(c) | |
| $ | 6,600,000 | | | | 5.360 | | | | 12/15/49 | | | | 6,639,600 | |
| Bank of America Corp.(a)(b) | |
| EUR | 6,500,000 | | | | 1.061 | | | | 03/28/18 | | | | 8,334,066 | |
| Bank of Scotland PLC(c) | |
| $ | 590,000 | | | | 5.250 | | | | 02/21/17 | | | | 659,063 | |
| Barclays Bank PLC | |
| | 6,150,000 | | | | 6.050 | (c) | | | 12/04/17 | | | | 6,831,383 | |
| | 14,675,000 | | | | 7.750 | (a)(b) | | | 04/10/23 | | | | 15,041,875 | |
| BNP Paribas SA(a)(b) | |
| EUR | 1,850,000 | | | | 4.730 | | | | 04/29/49 | | | | 2,534,058 | |
| Brazil Loan Trust 1 | |
| $ | 8,580,000 | | | | 5.477 | | | | 07/24/23 | | | | 8,708,700 | |
| Credit Suisse AG(c) | |
| | 26,675,000 | | | | 6.500 | | | | 08/08/23 | | | | 27,419,212 | |
| HBOS PLC(a)(b) | |
| EUR | 5,175,000 | | | | 4.375 | | | | 10/30/19 | | | | 6,937,992 | |
| HSBC Capital Funding LP(a)(b) | |
| | 4,975,000 | | | | 5.369 | | | | 03/24/49 | | | | 6,780,909 | |
| Northern Rock Asset Management PLC(c) | |
| $ | 10,354,000 | | | | 5.625 | | | | 06/22/17 | | | | 11,756,489 | |
| Sparebank 1 Boligkreditt AS(c) | |
| | 100,000,000 | | | | 1.250 | | | | 10/25/13 | | | | 100,060,000 | |
| | 13,400,000 | | | | 1.750 | | | | 11/15/19 | | | | 12,774,220 | |
| Stadshypotek AB(c) | |
| | 8,100,000 | | | | 1.875 | | | | 10/02/19 | | | | 7,831,080 | |
| | | | | | | | | | | | | | |
| | | | | | | | | | | | | 225,291,245 | |
| | |
| | Chemicals(b) – 0.1% | |
| Hexion US Finance Corp./Hexion Nova Scotia Finance ULC | |
| | 7,050,000 | | | | 9.000 | | | | 11/15/20 | | | | 6,909,000 | |
| | |
| | Consumer Cyclical Services(b) – 0.1% | |
| Equinix, Inc. | |
| | 1,050,000 | | | | 4.875 | | | | 04/01/20 | | | | 1,023,750 | |
| | 8,525,000 | | | | 7.000 | | | | 07/15/21 | | | | 9,100,438 | |
| | 1,350,000 | | | | 5.375 | | | | 04/01/23 | | | | 1,275,750 | |
| | | | | | | | | | | | | | |
| | | | | | | | | | | | | 11,399,938 | |
| | |
| | Consumer Products – Household & Leisure – 0.4% | |
| Alphabet Holding Co., Inc.(b)(d) | |
| | 11,450,000 | | | | 7.750 | | | | 11/01/17 | | | | 11,736,250 | |
| Avon Products, Inc. | |
| | 10,025,000 | | | | 4.600 | | | | 03/15/20 | | | | 10,365,390 | |
| | 13,150,000 | | | | 5.000 | | | | 03/15/23 | | | | 13,279,893 | |
| Spectrum Brands Escrow Corp.(b)(c) | |
| | 2,750,000 | | | | 6.375 | | | | 11/15/20 | | | | 2,873,750 | |
| | | | | | | | | | | | | | |
| | | | | | | | | | | | | 38,255,283 | |
| | |
| | Energy – 1.6% | |
| Ecopetrol SA | |
| | 11,300,000 | | | | 5.875 | | | | 09/18/23 | | | | 11,804,692 | |
| | |
| | Corporate Obligations – (continued) | |
| | Energy – (continued) | |
| Gaz Capital SA for Gazprom | |
| $ | 2,660,000 | | | | 8.625 | %(e) | | | 04/28/14 | | | $ | 3,168,725 | |
| | 7,090,000 | | | | 9.250 | (e) | | | 04/23/19 | | | | 8,685,250 | |
| | 3,680,000 | | | | 5.999 | | | | 01/23/21 | | | | 3,854,800 | |
| | 3,090,000 | | | | 6.510 | | | | 03/07/22 | | | | 3,306,300 | |
| | 2,219,000 | | | | 4.950 | | | | 07/19/22 | | | | 2,138,561 | |
| | 2,350,000 | | | | 7.288 | (c) | | | 08/16/37 | | | | 2,532,125 | |
| GPN Capital SA for Gazprom | |
| | 14,389,000 | | | | 4.375 | | | | 09/19/22 | | | | 13,237,880 | |
| Halcon Resources Corp.(b) | |
| | 29,950,000 | | | | 8.875 | | | | 05/15/21 | | | | 30,773,625 | |
| KazMunayGas National Co.(c) | |
| | 6,220,000 | | | | 5.750 | | | | 04/30/43 | | | | 5,473,600 | |
| Offshore Drilling Holding SA(b)(c) | |
| | 10,010,000 | | | | 8.375 | | | | 09/20/20 | | | | 10,126,229 | |
| Offshore Group Investment Ltd.(b) | |
| | 11,925,000 | | | | 7.500 | | | | 11/01/19 | | | | 12,533,761 | |
| | 2,900,000 | | | | 7.125 | | | | 04/01/23 | | | | 2,844,440 | |
| Petrobras Global Finance BV | |
| | 6,500,000 | | | | 4.375 | | | | 05/20/23 | | | | 5,923,085 | |
| | 7,880,000 | | | | 5.625 | | | | 05/20/43 | | | | 6,570,215 | |
| Raizen Fuels Finance Ltd. | |
| | 1,400,000 | | | | 9.500 | | | | 08/15/14 | | | | 1,480,461 | |
| Rosneft Oil Co. via Rosneft International Finance Ltd.(c) | |
| | 28,350,000 | | | | 4.199 | | | | 03/06/22 | | | | 26,117,437 | |
| TNK-BP Finance SA | |
| | 4,750,000 | | | | 7.250 | | | | 02/02/20 | | | | 5,355,625 | |
| | | | | | | | | | | | | | |
| | | | | | | | | | | | | 155,926,811 | |
| | |
| | Energy – Exploration & Production – 1.0% | |
| Continental Resources, Inc.(b) | |
| | 16,800,000 | | | | 5.000 | | | | 09/15/22 | | | | 16,884,000 | |
| | 50,850,000 | | | | 4.500 | | | | 04/15/23 | | | | 49,833,000 | |
| Lukoil International Finance BV | |
| | 770,000 | | | | 7.250 | | | | 11/05/19 | | | | 873,950 | |
| | 14,600,000 | | | | 6.125 | | | | 11/09/20 | | | | 15,567,250 | |
| | 1,480,000 | | | | 6.656 | | | | 06/07/22 | | | | 1,598,400 | |
| | 3,530,000 | | | | 4.563 | (c) | | | 04/24/23 | | | | 3,282,900 | |
| MEG Energy Corp.(b)(c) | |
| | 10,075,000 | | | | 6.375 | | | | 01/30/23 | | | | 9,823,125 | |
| | | | | | | | | | | | | | |
| | | | | | | | | | | | | 97,862,625 | |
| | |
| | Food & Beverage – 0.4% | |
| Constellation Brands, Inc. | |
| | 20,900,000 | | | | 3.750 | | | | 05/01/21 | | | | 19,332,500 | |
| | 4,350,000 | | | | 4.250 | | | | 05/01/23 | | | | 3,980,250 | |
| US Foods, Inc.(b) | |
| | 13,000,000 | | | | 8.500 | | | | 06/30/19 | | | | 13,715,000 | |
| | | | | | | | | | | | | | |
| | | | | | | | | | | | | 37,027,750 | |
| | |
| | Gaming – 0.3% | |
| MGM Resorts International | |
| | 25,200,000 | | | | 6.750 | | | | 10/01/20 | | | | 26,460,000 | |
| Studio City Finance Ltd.(b)(c) | |
| | 6,850,000 | | | | 8.500 | | | | 12/01/20 | | | | 7,500,750 | |
| | | | | | | | | | | | | | |
| | | | | | | | | | | | | 33,960,750 | |
| | |
| | |
| The accompanying notes are an integral part of these financial statements. | | 79 |
GOLDMAN SACHS STRATEGIC INCOME FUND
Schedule of Investments (continued)
September 30, 2013 (Unaudited)
| | | | | | | | | | | | | | |
Principal
Amount | | | Interest
Rate | | | Maturity
Date | | | Value | |
| | Corporate Obligations – (continued) | |
| | Health Care – Medical Products(b) – 0.1% | |
| DJO Finance LLC/DJO Finance Corp. | |
| $ | 8,650,000 | | | | 9.875 | % | | | 04/15/18 | | | $ | 9,169,000 | |
| | |
| | Life Insurance – 0.3% | |
| Genworth Financial, Inc. | |
| | 5,203,000 | | | | 6.515 | | | | 05/22/18 | | | | 5,871,802 | |
| | 1,861,000 | | | | 7.200 | | | | 02/15/21 | | | | 2,151,841 | |
| Genworth Holdings, Inc. | |
| | 19,875,000 | | | | 7.625 | | | | 09/24/21 | | | | 23,504,931 | |
| | | | | | | | | | | | | | |
| | | | | | | | | | | | | 31,528,574 | |
| | |
| | Media – Cable(b) – 0.2% | |
| UPC Holding BV | |
| EUR | 12,300,000 | | | | 6.375 | | | | 09/15/22 | | | | 16,372,488 | |
| | |
| | Noncaptive – Financial(b)(c) – 0.0% | |
| GEO Maquinaria | |
| | 1,571,931 | | | | 9.625 | | | | 05/02/21 | | | | 550,176 | |
| | |
| | Packaging(b) – 0.4% | |
| Ardagh Packaging Finance PLC(c) | |
| | 12,300,000 | | | | 4.875 | | | | 11/15/22 | | | | 11,746,500 | |
| Reynolds Group Issuer, Inc. | |
| | 6,625,000 | | | | 9.875 | | | | 08/15/19 | | | | 7,155,000 | |
| | 16,100,000 | | | | 5.750 | | | | 10/15/20 | | | | 16,100,000 | |
| | 6,725,000 | | | | 8.250 | | | | 02/15/21 | | | | 6,758,625 | |
| | | | | | | | | | | | | | |
| | | | | | | | | | | | | 41,760,125 | |
| | |
| | Pipelines(b) – 0.5% | |
| Energy Transfer Partners LP(a)(c) | |
| | 8,775,000 | | | | 3.283 | | | | 11/01/66 | | | | 7,897,500 | |
| Enterprise Products Operating LLC(a) | |
| | 6,850,000 | | | | 8.375 | | | | 08/01/66 | | | | 7,535,000 | |
| | 1,850,000 | | | | 7.000 | | | | 06/01/67 | | | | 1,958,687 | |
| | 3,600,000 | | | | 7.034 | | | | 01/15/68 | | | | 3,996,000 | |
| Regency Energy Partners LP | |
| | 10,000,000 | | | | 5.750 | | | | 09/01/20 | | | | 10,050,000 | |
| | 5,000,000 | | | | 6.500 | | | | 07/15/21 | | | | 5,237,500 | |
| | 12,600,000 | | | | 5.500 | | | | 04/15/23 | | | | 12,064,500 | |
| | | | | | | | | | | | | | |
| | | | | | | | | | | | | 48,739,187 | |
| | |
| | Real Estate Investment Trust(b) – 0.1% | |
| Entertainment Properties Trust | |
| | 5,500,000 | | | | 5.750 | | | | 08/15/22 | | | | 5,586,514 | |
| | |
| | Retailers(b) – 0.2% | |
| Burlington Coat Factory Warehouse Corp. | |
| | 13,325,000 | | | | 10.000 | | | | 02/15/19 | | | | 14,757,438 | |
| | |
| | Services Cyclical – Rental Equipment(b)(c) – 0.3% | |
| Algeco Scotsman Global Finance PLC | |
| | 13,075,000 | | | | 8.500 | | | | 10/15/18 | | | | 13,826,813 | |
| | 10,950,000 | | | | 10.750 | | | | 10/15/19 | | | | 11,004,750 | |
| | | | | | | | | | | | | | |
| | | | | | | | | | | | | 24,831,563 | |
| | |
| | Technology – Hardware(b)(c)(d) – 0.1% | |
| CommScope Holding Co., Inc. | |
| | 7,150,000 | | | | 6.625 | | | | 06/01/20 | | | | 7,132,125 | |
| | |
| | Corporate Obligations – (continued) | |
| | Technology – Software(b)(c) – 0.1% | |
| BMC Software Finance, Inc. | |
| $ | 8,800,000 | | | | 8.125 | % | | | 07/15/21 | | | $ | 9,130,000 | |
| | |
| | Transportation Services(b)(c) – 0.1% | |
| Aguila 3 SA | |
| | 12,800,000 | | | | 7.875 | | | | 01/31/18 | | | | 13,376,000 | |
| | |
| | Wireless Telecommunications – 1.2% | |
| Crown Castle International Corp. | |
| | 9,275,000 | | | | 5.250 | | | | 01/15/23 | | | | 8,533,000 | |
| Intelsat Jackson Holdings SA(b)(c) | |
| | 4,350,000 | | | | 5.500 | | | | 08/01/23 | | | | 4,067,250 | |
| Intelsat Luxembourg SA(b)(c) | |
| | 11,225,000 | | | | 7.750 | | | | 06/01/21 | | | | 11,617,875 | |
| | 4,950,000 | | | | 8.125 | | | | 06/01/23 | | | | 5,209,875 | |
| MTS International Funding Ltd.(c) | |
| | 7,040,000 | | | | 5.000 | | | | 05/30/23 | | | | 6,545,008 | |
| Softbank Corp.(c) | |
| | 14,800,000 | | | | 4.500 | | | | 04/15/20 | | | | 14,127,834 | |
| Sprint Corp.(c) | |
| | 15,450,000 | | | | 7.250 | | | | 09/15/21 | | | | 15,565,875 | |
| | 19,300,000 | | | | 7.875 | | | | 09/15/23 | | | | 19,637,750 | |
| Sprint Nextel Corp. | |
| | 12,400,000 | | | | 7.000 | | | | 08/15/20 | | | | 12,586,000 | |
| | 2,750,000 | | | | 11.500 | | | | 11/15/21 | | | | 3,520,000 | |
| VimpelCom Holdings BV | |
| | 4,100,000 | | | | 5.200 | (c) | | | 02/13/19 | | | | 4,066,669 | |
| | 4,790,000 | | | | 7.504 | | | | 03/01/22 | | | | 5,029,500 | |
| | 11,550,000 | | | | 5.950 | (c) | | | 02/13/23 | | | | 10,857,000 | |
| | | | | | | | | | | | | | |
| | | | | | | | | | | | | 121,363,636 | |
| | |
| | Wirelines Telecommunications – 0.7% | |
| Level 3 Financing, Inc.(b) | |
| | 14,125,000 | | | | 9.375 | | | | 04/01/19 | | | | 15,608,125 | |
| Verizon Communications, Inc. | |
| | 14,300,000 | | | | 3.650 | | | | 09/14/18 | | | | 15,095,735 | |
| | 28,600,000 | | | | 5.150 | | | | 09/15/23 | | | | 30,724,105 | |
| | 7,650,000 | | | | 6.550 | | | | 09/15/43 | | | | 8,649,834 | |
| | | | | | | | | | | | | | |
| | | | | | | | | | | | | 70,077,799 | |
| | |
| | TOTAL CORPORATE OBLIGATIONS | |
| | (Cost $1,024,584,038) | | | $ | 1,021,008,027 | |
| | |
| | | | | | | | | | | | | | |
| | Mortgage-Backed Obligations – 25.6% | |
| | Adjustable Rate Non-Agency(a) – 5.7% | |
| Aire Valley Mortgages PLC Series 2005-1X, Class 2A1 | |
| GBP | 2,087,362 | | | | 0.878 | % | | | 09/20/66 | | | $ | 3,215,663 | |
| Aire Valley Mortgages PLC Series 2005-1X, Class 2A2 | |
| EUR | 5,681,507 | | | | 0.582 | | | | 09/20/66 | | | | 7,331,300 | |
| Aire Valley Mortgages PLC Series 2006-1A, Class 1A(c) | |
| $ | 9,646,327 | | | | 0.472 | | | | 09/20/66 | | | | 9,129,892 | |
| Aire Valley Mortgages PLC Series 2007-1A, Class 2A1(c) | |
| | 7,528,538 | | | | 0.492 | | | | 09/20/66 | | | | 7,133,630 | |
| American Home Mortgage Assets Trust Series 2006-6, Class A1A | |
| | 14,021,581 | | | | 0.369 | | | | 12/25/46 | | | | 9,237,101 | |
| | |
| | |
| 80 | | The accompanying notes are an integral part of these financial statements. |
GOLDMAN SACHS STRATEGIC INCOME FUND
| | | | | | | | | | | | | | |
Principal
Amount | | | Interest
Rate | | | Maturity
Date | | | Value | |
| | Mortgage-Backed Obligations – (continued) | |
| | Adjustable Rate Non-Agency(a) – (continued) | |
| American Home Mortgage Assets Trust Series 2007-1, Class A1 | |
| $ | 32,459,619 | | | | 0.853 | % | | | 02/25/47 | | | $ | 18,282,611 | |
| American Home Mortgage Assets Trust Series 2007-2, Class A1 | |
| | 2,193,360 | | | | 0.309 | | | | 03/25/47 | | | | 1,639,126 | |
| American Home Mortgage Investment Trust Series 2005-3,
Class 2A4 |
|
| | 6,100,000 | | | | 2.022 | | | | 09/25/35 | | | | 3,705,615 | |
| American Home Mortgage Investment Trust Series 2006-3,
Class 11A1 |
|
| | 241,560 | | | | 0.359 | | | | 12/25/46 | | | | 183,592 | |
| American Home Mortgage Investment Trust Series 2007-2,
Class 11A1 |
|
| | 6,272,262 | | | | 0.414 | | | | 03/25/47 | | | | 3,806,195 | |
| Banc of America Funding Corp. Series 2006-G, Class 2A1 | |
| | 12,021,397 | | | | 0.404 | | | | 07/20/36 | | | | 10,782,212 | |
| Banc of America Funding Corp. Series 2006-H, Class 6A1 | |
| | 10,743,763 | | | | 0.374 | | | | 10/20/36 | | | | 6,891,380 | |
| Bear Stearns Mortgage Funding Trust Series 2006-AR1,
Class 2A1 |
|
| | 1,194,762 | | | | 0.404 | | | | 08/25/36 | | | | 836,466 | |
| Bear Stearns Mortgage Funding Trust Series 2007-AR4,
Class 1A1 |
|
| | 5,292,657 | | | | 0.384 | | | | 09/25/47 | | | | 4,103,191 | |
| Chevy Chase Funding LLC Mortgage-Backed Certificates
Series 2005-4A, Class A1(c) |
|
| | 8,395,222 | | | | 0.379 | | | | 10/25/36 | | | | 6,612,761 | |
| Citigroup Mortgage Loan Trust, Inc. Series 2006-AR7,
Class 2A2A |
|
| | 6,957,613 | | | | 2.719 | | | | 11/25/36 | | | | 5,041,415 | |
| Countrywide Alternative Loan Trust Series 2006-0C8,
Class 2A2B |
|
| | 5,984,368 | | | | 0.354 | | | | 11/25/36 | | | | 4,847,765 | |
| Countrywide Alternative Loan Trust Series 2005-59, Class 1A1 | |
| | 12,704,690 | | | | 0.510 | | | | 11/20/35 | | | | 9,171,176 | |
| Countrywide Alternative Loan Trust Series 2005-61, Class 1A1 | |
| | 854,616 | | | | 0.444 | | | | 12/25/35 | | | | 747,182 | |
| Countrywide Alternative Loan Trust Series 2005-76, Class 1A1 | |
| | 2,745,935 | | | | 1.638 | | | | 01/25/36 | | | | 2,441,646 | |
| Countrywide Alternative Loan Trust Series 2005-81, Class A1 | |
| | 10,199,301 | | | | 0.459 | | | | 02/25/37 | | | | 7,307,648 | |
| Countrywide Alternative Loan Trust Series 2005-82, Class A1 | |
| | 800,361 | | | | 0.454 | | | | 02/25/36 | | | | 595,643 | |
| Countrywide Alternative Loan Trust Series 2005-9CB, Class 1A5 | |
| | 1,688,654 | | | | 0.684 | | | | 05/25/35 | | | | 1,349,731 | |
| Countrywide Alternative Loan Trust Series 2006-OA1, Class 2A1 | |
| | 366,769 | | | | 0.394 | | | | 03/20/46 | | | | 253,234 | |
| Countrywide Alternative Loan Trust Series 2007-OA11,
Class A1A |
|
| | 38,374,550 | | | | 1.533 | | | | 11/25/47 | | | | 26,123,847 | |
| Countrywide Alternative Loan Trust Series 2007-OA2, Class 2A1 | |
| | 13,614,185 | | | | 0.314 | | | | 03/25/47 | | | | 8,882,714 | |
| Countrywide Home Loans Mortgage Pass-Through Trust
Series 2006-OA5, Class 2A1 |
|
| | 17,155,483 | | | | 0.384 | | | | 04/25/46 | | | | 12,859,680 | |
| | |
| | Mortgage-Backed Obligations – (continued) | |
| | Adjustable Rate Non-Agency(a) – (continued) | |
| Deutsche Alt-A Securities Mortgage Loan Trust
Series 2007-OA1, Class A1 |
|
| $ | 11,700,654 | | | | 0.334 | % | | | 02/25/47 | | | $ | 7,877,621 | |
| GreenPoint Mortgage Funding Trust Series 2006-OH1, Class A1 | |
| | 2,156,802 | | | | 0.364 | | | | 01/25/37 | | | | 1,487,081 | |
| HarborView Mortgage Loan Trust Series 2005-09, Class 2A1A | |
| | 2,851,986 | | | | 0.520 | | | | 06/20/35 | | | | 2,579,778 | |
| HarborView Mortgage Loan Trust Series 2005-5, Class 1A1A | |
| | 15,683,202 | | | | 0.491 | | | | 07/19/45 | | | | 13,110,075 | |
| HarborView Mortgage Loan Trust Series 2006-11, Class A1A | |
| | 8,891,795 | | | | 0.354 | | | | 12/19/36 | | | | 5,687,281 | |
| HarborView Mortgage Loan Trust Series 2006-7, Class 2A1A | |
| | 2,615,817 | | | | 0.384 | | | | 09/19/46 | | | | 1,896,790 | |
| HarborView Mortgage Loan Trust Series 2007-7, Class 2A1A | |
| | 15,063,054 | | | | 1.179 | | | | 11/25/47 | | | | 13,108,147 | |
| Indymac Index Mortgage Loan Trust Series 2005-AR10,
Class A1 |
|
| | 7,345,141 | | | | 0.439 | | | | 06/25/35 | | | | 6,209,805 | |
| Indymac Index Mortgage Loan Trust Series 2005-AR13,
Class 4A1 |
|
| | 1,405,329 | | | | 2.431 | | | | 08/25/35 | | | | 1,155,512 | |
| Indymac Index Mortgage Loan Trust Series 2005-AR23,
Class 6A1 |
|
| | 6,123,526 | | | | 4.706 | | | | 11/25/35 | | | | 5,071,692 | |
| Indymac Index Mortgage Loan Trust Series 2006-AR2,
Class 1A1A |
|
| | 11,793,815 | | | | 0.404 | | | | 04/25/46 | | | | 9,099,437 | |
| Indymac Index Mortgage Loan Trust Series 2006-AR41,
Class A3 |
|
| | 9,730,881 | | | | 0.364 | | | | 02/25/37 | | | | 6,750,326 | |
| Indymac Index Mortgage Loan Trust Series 2007-AR1,
Class 1A1 |
|
| | 10,505,193 | | | | 3.065 | | | | 03/25/37 | | | | 8,976,689 | |
| Indymac Index Mortgage Loan Trust Series 2007-FLX3,
Class A1 |
|
| | 746,094 | | | | 0.419 | | | | 06/25/37 | | | | 620,900 | |
| Indymac Index Mortgage Loan Trust Series 2007-FLX4,
Class 2A1 |
|
| | 10,221,048 | | | | 0.359 | | | | 07/25/37 | | | | 8,649,687 | |
| JPMorgan Alternative Loan Trust Series 2006-A2, Class 2A2 | |
| | 10,488,694 | | | | 2.770 | | | | 05/25/36 | | | | 7,408,120 | |
| JPMorgan Alternative Loan Trust Series 2006-A5, Class 1A1 | |
| | 8,832,312 | | | | 0.344 | | | | 10/25/36 | | | | 6,460,439 | |
| Leek Finance Number Eighteen PLC Series 18X, Class A2C | |
| EUR | 11,459,715 | | | | 0.481 | | | | 09/21/38 | | | | 15,768,867 | |
| Lehman XS Trust Series 2007-12N, Class 2A1 | |
| $ | 5,811,911 | | | | 0.359 | | | | 07/25/37 | | | | 3,909,564 | |
| Lehman XS Trust Series 2007-15N, Class 4A1 | |
| | 11,912,930 | | | | 1.079 | | | | 08/25/47 | | | | 7,933,912 | |
| Lehman XS Trust Series 2007-16N, Class 2A2 | |
| | 568,141 | | | | 1.029 | | | | 09/25/47 | | | | 434,605 | |
| Lehman XS Trust Series 2007-4N, Class 3A2A | |
| | 7,382,682 | | | | 0.903 | | | | 03/25/47 | | | | 5,771,587 | |
| Lehman XS Trust Series 2007-5H, Class 3A4 | |
| | 11,978,738 | | | | 6.450 | | | | 05/25/37 | | | | 6,879,767 | |
| | |
| | |
| The accompanying notes are an integral part of these financial statements. | | 81 |
GOLDMAN SACHS STRATEGIC INCOME FUND
Schedule of Investments (continued)
September 30, 2013 (Unaudited)
| | | | | | | | | | | | | | |
Principal
Amount | | | Interest
Rate | | | Maturity
Date | | | Value | |
| | Mortgage-Backed Obligations – (continued) | |
| | Adjustable Rate Non-Agency(a) – (continued) | |
| Lehman XS Trust Series 2007-7N, Class 1A1A | |
| $ | 26,179,221 | | | | 0.399 | % | | | 06/25/47 | �� | | $ | 18,200,795 | |
| Luminent Mortgage Trust Series 2006-5, Class A1A | |
| | 4,184,374 | | | | 0.369 | | | | 07/25/36 | | | | 2,747,621 | |
| Luminent Mortgage Trust Series 2006-7, Class 2A1 | |
| | 12,171,627 | | | | 0.349 | | | | 12/25/36 | | | | 9,180,568 | |
| Luminent Mortgage Trust Series 2007-2, Class 2A1 | |
| | 2,543,469 | | | | 0.414 | | | | 05/25/37 | | | | 1,554,611 | |
| Master Adjustable Rate Mortgages Trust Series 2006-OA2,
Class 1A1 |
|
| | 13,162,297 | | | | 0.953 | | | | 12/25/46 | | | | 7,571,040 | |
| Master Adjustable Rate Mortgages Trust Series 2006-OA2,
Class 4A1A |
|
| | 5,241,469 | | | | 1.003 | | | | 12/25/46 | | | | 3,012,548 | |
| Master Adjustable Rate Mortgages Trust Series 2007-2, Class A1 | |
| | 5,994,909 | | | | 0.334 | | | | 03/25/47 | | | | 5,124,325 | |
| Master Adjustable Rate Mortgages Trust Series 2007-3,
Class 12A1 |
|
| | 2,166,990 | | | | 0.379 | | | | 05/25/47 | | | | 1,411,374 | |
| Residential Accredit Loans, Inc. Series 2005-Q05, Class A1 | |
| | 7,674,280 | | | | 1.153 | | | | 01/25/46 | | | | 5,387,749 | |
| Residential Accredit Loans, Inc. Series 2006-QA10, Class A1 | |
| | 7,696,399 | | | | 0.369 | | | | 12/25/36 | | | | 5,640,380 | |
| Residential Accredit Loans, Inc. Series 2006-QO1, Class 3A1 | |
| | 3,960,201 | | | | 0.449 | | | | 02/25/46 | | | | 2,647,794 | |
| Residential Accredit Loans, Inc. Series 2007-QA4, Class A1A | |
| | 7,776,905 | | | | 0.334 | | | | 06/25/37 | | | | 5,402,384 | |
| Residential Accredit Loans, Inc. Series 2007-QH9, Class A1 | |
| | 19,402,698 | | | | 3.256 | | | | 11/25/37 | | | | 10,407,058 | |
| Residential Accredit Loans, Inc. Series 2007-QO3, Class A1 | |
| | 18,535,950 | | | | 0.344 | | | | 03/25/47 | | | | 13,813,342 | |
| Residential Accredit Loans, Inc. Series 2007-QS8, Class A3 | |
| | 3,820,385 | | | | 0.784 | | | | 06/25/37 | | | | 2,284,142 | |
| Residential Accredit Loans, Inc. Trust Series 2007-QO2, Class A1 | |
| | 7,310,473 | | | | 0.334 | | | | 02/25/47 | | | | 4,162,032 | |
| Residential Accredit Loans, Inc. Trust Series 2007-QO4,
Class A1A |
|
| | 2,130,819 | | | | 0.374 | | | | 05/25/47 | | | | 1,635,525 | |
| Residential Funding Mortgage Securities I Series 2005-SA4,
Class 2A1 |
|
| | 8,599,649 | | | | 2.956 | | | | 09/25/35 | | | | 7,383,117 | |
| Structured Adjustable Rate Mortgage Loan Trust Series 2007-11,
Class 1A1 |
|
| | 10,384,846 | | | | 1.329 | | | | 12/25/37 | | | | 6,659,282 | |
| Structured Asset Mortgage Investments II Trust Series 2006-AR5,
Class 1A1 |
|
| | 8,434,446 | | | | 0.389 | | | | 05/25/46 | | | | 5,888,221 | |
| Structured Asset Mortgage Investments II Trust Series 2006-AR6,
Class 2A1 |
|
| | 6,576,983 | | | | 0.374 | | | | 07/25/46 | | | | 4,935,556 | |
| Structured Asset Mortgage Investments, Inc. Series 2005-AR7,
Class 5A1 |
|
| | 1,903,411 | | | | 1.613 | | | | 03/25/46 | | | | 1,440,261 | |
| Structured Asset Mortgage Investments, Inc. Series 2006-AR6,
Class 1A3 |
|
| | 627,153 | | | | 0.374 | | | | 07/25/46 | | | | 356,450 | |
| | |
| | Mortgage-Backed Obligations – (continued) | |
| | Adjustable Rate Non-Agency(a) – (continued) | |
| Structured Asset Mortgage Investments, Inc. Series 2006-AR7,
Class A1A |
|
| $ | 690,045 | | | | 0.389 | % | | | 08/25/36 | | | $ | 491,017 | |
| Structured Asset Mortgage Investments, Inc. Series 2006-AR8,
Class A1A |
|
| | 5,564,506 | | | | 0.384 | | | | 10/25/36 | | | | 4,006,283 | |
| Structured Asset Mortgage Investments, Inc. Series 2007-AR7,
Class 1A1 |
|
| | 2,112,518 | | | | 1.029 | | | | 05/25/47 | | | | 1,352,389 | |
| Washington Mutual Alternative Mortgage Pass-Through
Certificates Series 2005-4, Class CB1 |
|
| | 143,424 | | | | 0.634 | | | | 06/25/35 | | | | 107,135 | |
| Washington Mutual Alternative Mortgage Pass-Through
Certificates Series 2006-AR4, Class DA |
|
| | 3,743,299 | | | | 1.123 | | | | 06/25/46 | | | | 1,963,512 | |
| Washington Mutual Mortgage Pass-Through Certificates
Series 2005-AR1, Class A2A1 |
|
| | 9,377,830 | | | | 0.524 | | | | 01/25/45 | | | | 8,599,161 | |
| Washington Mutual Mortgage Pass-Through Certificates
Series 2005-AR11, Class A1A |
|
| | 5,812,057 | | | | 0.504 | | | | 08/25/45 | | | | 5,427,525 | |
| Washington Mutual Mortgage Pass-Through Certificates
Series 2005-AR12, Class 1A6 |
|
| | 8,175,000 | | | | 2.373 | | | | 10/25/35 | | | | 7,596,306 | |
| Washington Mutual Mortgage Pass-Through Certificates
Series 2005-AR19, Class A1A1 |
|
| | 742,442 | | | | 0.454 | | | | 12/25/45 | | | | 680,970 | |
| Washington Mutual Mortgage Pass-Through Certificates
Series 2005-AR6, Class 2A1A |
|
| | 672,596 | | | | 0.409 | | | | 04/25/45 | | | | 623,002 | |
| Washington Mutual Mortgage Pass-Through Certificates
Series 2005-AR7, Class A3 |
|
| | 8,860,000 | | | | 2.418 | | | | 08/25/35 | | | | 8,367,200 | |
| Washington Mutual Mortgage Pass-Through Certificates
Series 2005-AR8, Class 1A1A |
|
| | 460,488 | | | | 0.449 | | | | 07/25/45 | | | | 421,742 | |
| Washington Mutual Mortgage Pass-Through Certificates
Series 2005-AR8, Class 2A1A |
|
| | 1,697,732 | | | | 0.469 | | | | 07/25/45 | | | | 1,571,066 | |
| Washington Mutual Mortgage Pass-Through Certificates
Series 2005-AR9, Class A1A |
|
| | 6,398,492 | | | | 0.499 | | | | 07/25/45 | | | | 5,948,463 | |
| Washington Mutual Mortgage Pass-Through Certificates
Series 2006-AR11, Class 1A |
|
| | 5,552,303 | | | | 1.113 | | | | 09/25/46 | | | | 4,583,866 | |
| Washington Mutual Mortgage Pass-Through Certificates
Series 2006-AR11, Class 3A1A |
|
| | 4,806,642 | | | | 1.079 | | | | 09/25/46 | | | | 3,459,133 | |
| Washington Mutual Mortgage Pass-Through Certificates
Series 2006-AR15, Class 1A |
|
| | 14,610,030 | | | | 0.999 | | | | 11/25/46 | | | | 11,676,589 | |
| Washington Mutual Mortgage Pass-Through Certificates
Series 2006-AR5, Class 4A |
|
| | 1,960,332 | | | | 1.143 | | | | 06/25/46 | | | | 1,218,577 | |
| | |
| | |
| 82 | | The accompanying notes are an integral part of these financial statements. |
GOLDMAN SACHS STRATEGIC INCOME FUND
| | | | | | | | | | | | | | |
Principal
Amount | | | Interest
Rate | | | Maturity
Date | | | Value | |
| | Mortgage-Backed Obligations – (continued) | |
| | Adjustable Rate Non-Agency(a) – (continued) | |
| Washington Mutual Mortgage Pass-Through Certificates
Series 2007-0A1, Class A1A |
|
| $ | 7,030,105 | | | | 0.853 | % | | | 02/25/47 | | | $ | 5,511,618 | |
| Washington Mutual Mortgage Pass-Through Certificates
Series 2007-OA2, Class 2A |
|
| | 9,974,154 | | | | 0.853 | | | | 01/25/47 | | | | 6,242,003 | |
| Washington Mutual Mortgage Pass-Through Certificates
Series 2007-OA3, Class 2A |
|
| | 4,456,730 | | | | 0.903 | | | | 02/25/47 | | | | 2,692,195 | |
| Washington Mutual Mortgage Pass-Through Certificates
Series 2007-OA4, Class 1A |
|
| | 7,410,149 | | | | 0.923 | | | | 05/25/47 | | | | 6,418,253 | |
| Washington Mutual Mortgage Pass-Through Certificates
Series 2007-OA5, Class 1A |
|
| | 19,149,476 | | | | 0.909 | | | | 06/25/47 | | | | 15,839,345 | |
| Wells Fargo Alternative Loan Trust Series 2007-PA2, Class 2A1 | |
| | 9,416,085 | | | | 0.614 | | | | 06/25/37 | | | | 6,456,474 | |
| | |
| TOTAL ADJUSTABLE RATE
NON-AGENCY |
| | $ | 557,460,097 | |
| | |
| | Collateralized Mortgage Obligations – 3.6% | |
| | Interest Only – 0.1% | |
| FHLMC STRIPS Series 247, Class 22 | |
| $ | 6,085,346 | | | | 5.000 | % | | | 10/15/35 | | | $ | 1,045,919 | |
| FHLMC STRIPS Series 247, Class 23 | |
| | 8,914,602 | | | | 5.000 | | | | 01/15/36 | | | | 1,532,197 | |
| FHLMC STRIPS Series 247, Class 24 | |
| | 22,546,099 | | | | 5.000 | | | | 09/15/36 | | | | 3,875,111 | |
| FHLMC STRIPS Series 258, Class 83 | |
| | 10,373,230 | | | | 5.000 | | | | 01/15/36 | | | | 1,782,899 | |
| | | | | | | | | | | | | | |
| | | | | | | | | | | | | 8,236,126 | |
| | |
| | Inverse Floaters(a) – 0.1% | |
| FHLMC REMIC Series 2011-3862, Class SA | |
| | 10,326,532 | | | | 6.358 | | | | 05/15/41 | | | | 1,370,720 | |
| FNMA REMIC Series 2010-126, Class LS | |
| | 7,469,076 | | | | 4.817 | | | | 11/25/40 | | | | 907,842 | |
| FNMA REMIC Series 2013-75, Class SA | |
| | 21,745,848 | | | | 5.971 | | | | 07/25/43 | | | | 4,328,307 | |
| | | | | | | | | | | | | | |
| | | | | | | | | | | | | 6,606,869 | |
| | |
| | Regular Floater(a) – 2.0% | |
| CitiMortgage Alternative Loan Trust Series 2007-A2 , Class 1A9 | |
| | 10,016,779 | | | | 6.000 | | | | 02/25/37 | | | | 8,360,236 | |
| Countrywide Alternative Loan Trust Series 2005-64CB,
Class 1A12 |
|
| | 1,889,563 | | | | 0.984 | | | | 12/25/35 | | | | 1,471,383 | |
| FHLMC REMIC Series 3084 Class FN | |
| | 3,571,342 | | | | 0.682 | | | | 12/15/34 | | | | 3,601,424 | |
| FHLMC REMIC Series 3231 Class FB | |
| | 1,662,350 | | | | 0.532 | | | | 10/15/36 | | | | 1,663,325 | |
| FHLMC REMIC Series 3314 Class FC | |
| | 1,330,479 | | | | 0.582 | | | | 12/15/36 | | | | 1,332,822 | |
| FHLMC REMIC Series 3371, Class FA | |
| | 1,353,046 | | | | 0.782 | | | | 09/15/37 | | | | 1,360,982 | |
| | |
| | Mortgage-Backed Obligations – (continued) | |
| | Regular Floater(a) – (continued) | |
| FHLMC REMIC Series 3545, Class FA | |
| $ | 2,759,567 | | | | 1.032 | % | | | 06/15/39 | | | $ | 2,800,787 | |
| FHLMC REMIC Series 3827 Class KF | |
| | 1,857,764 | | | | 0.552 | | | | 03/15/41 | | | | 1,862,336 | |
| FHLMC REMIC Series 3830 Class FD | |
| | 13,133,873 | | | | 0.542 | | | | 03/15/41 | | | | 13,162,038 | |
| FNMA REMIC Series 2005-102, Class DF | |
| | 3,968,954 | | | | 0.479 | | | | 11/25/35 | | | | 3,977,895 | |
| FNMA REMIC Series 2006-45, Class TF | |
| | 2,689,924 | | | | 0.579 | | | | 06/25/36 | | | | 2,695,524 | |
| FNMA REMIC Series 2006-76, Class QF | |
| | 2,762,257 | | | | 0.579 | | | | 08/25/36 | | | | 2,771,245 | |
| FNMA REMIC Series 2006-79, Class PF | |
| | 3,238,852 | | | | 0.579 | | | | 08/25/36 | | | | 3,249,044 | |
| FNMA REMIC Series 2007-33, Class HF | |
| | 3,792,329 | | | | 0.529 | | | | 04/25/37 | | | | 3,803,824 | |
| FNMA REMIC Series 2007-75, Class VF | |
| | 1,017,390 | | | | 0.629 | | | | 08/25/37 | | | | 1,020,573 | |
| FNMA REMIC Series 2007-91, Class FB | |
| | 3,132,232 | | | | 0.779 | | | | 10/25/37 | | | | 3,164,173 | |
| FNMA REMIC Series 2009-84, Class WF | |
| | 1,024,192 | | | | 1.279 | | | | 10/25/39 | | | | 1,047,476 | |
| FNMA REMIC Series 2010-100, Class FD | |
| | 23,878,927 | | | | 0.599 | | | | 09/25/40 | | | | 24,005,199 | |
| FNMA REMIC Series 2010-89, Class CF | |
| | 13,647,042 | | | | 0.629 | | | | 02/25/38 | | | | 13,717,252 | |
| FNMA REMIC Series 2011-55, Class FJ | |
| | 13,307,324 | | | | 0.619 | | | | 06/25/41 | | | | 13,302,567 | |
| FNMA REMIC Series 2011-59, Class FW | |
| | 4,019,295 | | | | 0.539 | | | | 07/25/41 | | | | 4,021,865 | |
| FNMA REMIC Series 2011-86, Class DF | |
| | 2,335,370 | | | | 0.679 | | | | 09/25/41 | | | | 2,362,904 | |
| FNMA REMIC Series 2013-96, Class FW | |
| | 29,376,320 | | | | 0.579 | | | | 09/25/43 | | | | 29,409,151 | |
| GNMA Series 2013-113, Class FD | |
| | 27,490,330 | | | | 0.482 | | | | 08/16/43 | | | | 27,472,535 | |
| Granite Mortgages PLC Series 2003-2, Class 1B | |
| | 3,776,089 | | | | 1.246 | | | | 07/20/43 | | | | 3,687,522 | |
| Granite Mortgages PLC Series 2003-2, Class 3A | |
| GBP | 2,492,485 | | | | 0.990 | | | | 07/20/43 | | | | 4,000,755 | |
| Granite Mortgages PLC Series 2003-3, Class 2A | |
| EUR | 181,202 | | | | 0.600 | | | | 01/20/44 | | | | 242,750 | |
| Granite Mortgages PLC Series 2004-2, Class 3A | |
| GBP | 2,695,967 | | | | 0.838 | | | | 06/20/44 | | | | 4,314,386 | |
| Granite Mortgages PLC Series 2004-3, Class 2A2 | |
| EUR | 67,498 | | | | 0.502 | | | | 09/20/44 | | | | 90,221 | |
| Granite Mortgages PLC Series 2004-3, Class 3A1 | |
| GBP | 2,603,394 | | | | 0.878 | | | | 09/20/44 | | | | 4,168,610 | |
| Sequoia Mortgage Trust Series 2007-3, Class 2AA1 | |
| $ | 6,760,726 | | | | 2.463 | | | | 07/20/37 | | | | 5,302,995 | |
| | | | | | | | | | | | | | |
| | | | | | | | | | | | | 193,443,799 | |
| | |
| | Sequential Fixed Rate – 1.3% | |
| Banc of America Funding Corp. Series 2007-8, Class 2A1 | |
| | 3,078,323 | | | | 7.000 | | | | 10/25/37 | | | | 1,896,295 | |
| | |
| | |
| The accompanying notes are an integral part of these financial statements. | | 83 |
GOLDMAN SACHS STRATEGIC INCOME FUND
Schedule of Investments (continued)
September 30, 2013 (Unaudited)
| | | | | | | | | | | | | | |
Principal
Amount | | | Interest
Rate | | | Maturity
Date | | | Value | |
| | Mortgage-Backed Obligations – (continued) | |
| | Sequential Fixed Rate – (continued) | |
| BCAP LLC Trust Series 2007-AA2, Class 2A7 | |
| $ | 2,946,340 | | | | 6.000 | % | | | 04/25/37 | | | $ | 2,495,453 | |
| Citicorp Mortgage Securities, Inc. Series 2007-4, Class 2A1 | |
| | 304,184 | | | | 5.500 | | | | 05/25/22 | | | | 307,533 | |
| Citimortgage Alternative Loan Trust Series 2006-A3, Class 1A13 | |
| | 5,542,820 | | | | 6.000 | | | | 07/25/36 | | | | 4,938,319 | |
| Citimortgage Alternative Loan Trust Series 2007-A1, Class 1A7 | |
| | 2,023,763 | | | | 6.000 | | | | 01/25/37 | | | | 1,656,833 | |
| Citimortgage Alternative Loan Trust Series 2007-A4, Class 1A5 | |
| | 7,595,285 | | | | 5.750 | | | | 04/25/37 | | | | 6,443,509 | |
| Countrywide Alternative Loan Trust Series 2005-77T1,
Class 1A2 |
|
| | 4,208,084 | | | | 6.000 | | | | 02/25/36 | | | | 3,419,077 | |
| Countrywide Alternative Loan Trust Series 2007-06, Class A4 | |
| | 4,468,632 | | | | 5.750 | | | | 04/25/47 | | | | 3,563,730 | |
| Countrywide Alternative Loan Trust Series 2007-15CB, Class A5 | |
| | 1,849,726 | | | | 5.750 | | | | 07/25/37 | | | | 1,585,503 | |
| Countrywide Alternative Loan Trust Series 2007-18CB,
Class 2A25 |
|
| | 808,435 | | | | 6.000 | | | | 08/25/37 | | | | 680,542 | |
| Countrywide Home Loans Mortgage Pass-Through Trust
Series 2007-1, Class A4 |
|
| | 2,612,683 | | | | 6.000 | | | | 03/25/37 | | | | 2,303,743 | |
| Countrywide Home Loans Mortgage Pass-Through Trust
Series 2007-7, Class A3 |
|
| | 5,444,171 | | | | 5.750 | | | | 06/25/37 | | | | 4,975,170 | |
| JPMorgan Alternative Loan Trust Series 2008-R2, Class A1(c) | |
| | 13,559,869 | | | | 6.000 | | | | 11/25/36 | | | | 10,813,311 | |
| JPMorgan Mortgage Trust Series 2006-S4, Class A3 | |
| | 18,262,156 | | | | 6.000 | | | | 01/25/37 | | | | 15,374,108 | |
| Morgan Stanley Mortgage Loan Trust Series 2005-4, Class 1A | |
| | 1,843,474 | | | | 5.000 | | | | 08/25/35 | | | | 1,833,004 | |
| Morgan Stanley Mortgage Loan Trust Series 2006-2, Class 1A | |
| | 6,211,024 | | | | 5.250 | | | | 02/25/21 | | | | 6,019,609 | |
| Morgan Stanley Mortgage Loan Trust Series 2006-2, Class 2A3 | |
| | 7,223,166 | | | | 5.750 | | | | 02/25/36 | | | | 6,883,622 | |
| Residential Accredit Loans, Inc. Series 2006-QS12, Class 1A1 | |
| | 7,658,184 | | | | 6.500 | | | | 09/25/36 | | | | 5,621,367 | |
| Residential Accredit Loans, Inc. Series 2006-QS2, Class 1A9 | |
| | 1,122,598 | | | | 5.500 | | | | 02/25/36 | | | | 910,555 | |
| Residential Accredit Loans, Inc. Series 2006-QS4, Class A9 | |
| | 5,859,880 | | | | 6.000 | | | | 04/25/36 | | | | 4,665,523 | |
| Residential Accredit Loans, Inc. Series 2006-QS6, Class 1A13 | |
| | 1,907,932 | | | | 6.000 | | | | 06/25/36 | | | | 1,450,541 | |
| Residential Accredit Loans, Inc. Series 2006-QS7, Class A1 | |
| | 1,147,986 | | | | 6.000 | | | | 06/25/36 | | | | 912,078 | |
| Residential Accredit Loans, Inc. Series 2006-QS8, Class A3 | |
| | 3,438,603 | | | | 6.000 | | | | 08/25/36 | | | | 2,637,856 | |
| Residential Accredit Loans, Inc. Series 2006-QS9, Class 1A11 | |
| | 3,424,941 | | | | 6.500 | | | | 07/25/36 | | | | 2,763,286 | |
| Residential Asset Securitization Trust Series 2005-A11CB,
Class 2A1 |
|
| | 13,478,544 | | | | 4.850 | | | | 10/25/35 | | | | 9,528,654 | |
| Residential Asset Securitization Trust Series 2006-A8, Class 1A1 | |
| | 2,489,182 | | | | 6.000 | | | | 08/25/36 | | | | 2,223,822 | |
| | |
| | Mortgage-Backed Obligations – (continued) | |
| | Sequential Fixed Rate – (continued) | |
| Residential Asset Securitization Trust Series 2006-A8, Class 2A3 | |
| $ | 8,645,221 | | | | 6.000 | % | | | 08/25/36 | | | $ | 5,398,834 | |
| Residential Funding Mortgage Securities I Series 2007-S9,
Class 1A1 |
|
| | 9,781,338 | | | | 6.000 | | | | 10/25/37 | | | | 8,392,176 | |
| Wells Fargo Mortgage Backed Securities Trust Series 2007-11,
Class A85 |
|
| | 2,568,307 | | | | 6.000 | | | | 08/25/37 | | | | 2,518,933 | |
| | | | | | | | | | | | | | |
| | | | | | | | | | | | | 122,212,986 | |
| | |
| | Sequential Floating Rate(a) – 0.1% | |
| Banc of America Funding Corp. Series 2006-7, Class T2A1 | |
| | 11,635,386 | | | | 5.878 | | | | 10/25/36 | | | | 9,057,118 | |
| Banc of America Funding Corp. Series 2007-2, Class 2A1 | |
| | 228,251 | | | | 5.554 | | | | 03/25/37 | | | | 230,671 | |
| Chaseflex Trust Series 2007-3, Class 1A2 | |
| | 4,673,363 | | | | 0.644 | | | | 07/25/37 | | | | 2,770,943 | |
| Washington Mutual Alternative Mortgage Pass-Through
Certificates Series 2006-AR10, Class A1 |
|
| | 1,400,900 | | | | 0.279 | | | | 12/25/36 | | | | 900,259 | |
| | | | | | | | | | | | | | |
| | | | | | | | | | | | | 12,958,991 | |
| | |
| | Support – 0.0% | |
| Countrywide Alternative Loan Trust Series 2006-4CB, Class 2A4 | |
| | 921,356 | | | | 5.500 | | | | 04/25/36 | | | | 820,568 | |
| | |
| TOTAL COLLATERALIZED
MORTGAGE OBLIGATIONS |
| | $ | 344,279,339 | |
| | |
| | Commercial Mortgage-Backed Securities – 10.9% | |
| | Sequential Fixed Rate – 3.2% | |
| Credit Suisse Commercial Mortgage Trust Series 2007-C1,
Class A1A |
|
| $ | 145,976,580 | | | | 5.361 | % | | | 02/15/40 | | | $ | 154,597,271 | |
| FHLMC Multifamily Structured Pass-Through Certificates
Series K030, Class A1 |
|
| | 24,181,886 | | | | 2.779 | | | | 09/25/22 | | | | 24,832,625 | |
| Morgan Stanley Bank of America Merrill Lynch Trust
Series 2013-C9, Class A4 |
|
| | 4,500,000 | | | | 3.102 | | | | 05/15/46 | | | | 4,279,248 | |
| Wachovia Bank Commercial Mortgage Trust Series 2006-C28,
ClassA1A |
|
| | 112,130,347 | | | | 5.559 | | | | 10/15/48 | | | | 123,709,577 | |
| WF-RBS Commercial Mortgage Trust Series 2012-C6 Class B | |
| | 2,500,000 | | | | 4.697 | | | | 04/15/45 | | | | 2,600,590 | |
| | | | | | | | | | | | | | |
| | | | | | | | | | | | | 310,019,311 | |
| | |
| | Sequential Floating Rate(a) – 7.7% | |
| Credit Suisse Commercial Mortgage Trust Series 2007-C2,
Class A1A |
|
| | 173,996,395 | | | | 5.526 | | | | 01/15/49 | | | | 187,451,292 | |
| Credit Suisse Commercial Mortgage Trust Series 2007-C3,
Class A1A1 |
|
| | 99,013,503 | | | | 5.872 | | | | 06/15/39 | | | | 108,628,209 | |
| FHLMC Multifamily Structured Pass-Through Certificates
Series K029, Class A2 |
|
| | 83,200,000 | | | | 3.320 | | | | 02/25/23 | | | | 83,494,536 | |
| | |
| | |
| 84 | | The accompanying notes are an integral part of these financial statements. |
GOLDMAN SACHS STRATEGIC INCOME FUND
| | | | | | | | | | | | | | |
Principal
Amount | | | Interest
Rate | | | Maturity
Date | | | Value | |
| | Mortgage-Backed Obligations – (continued) | |
| | Sequential Floating Rate(a) – (continued) | |
| FHLMC Multifamily Structured Pass-Through Certificates
Series K030, Class A2 |
|
| $ | 160,500,000 | | | | 3.250 | % | | | 04/25/23 | | | $ | 160,041,805 | |
| FHLMC Multifamily Structured Pass-Through Certificates
Series K031, Class A2 |
|
| | 144,500,000 | | | | 3.300 | | | | 04/25/23 | | | | 144,073,508 | |
| FREMF Mortgage Trust Series 2012-K706, Class B(c) | |
| | 2,200,000 | | | | 4.162 | | | | 11/25/44 | | | | 2,188,740 | |
| FREMF Mortgage Trust Series 2012-K706, Class C(c) | |
| | 1,350,000 | | | | 4.162 | | | | 11/25/44 | | | | 1,286,677 | |
| FREMF Mortgage Trust Series 2012-K707, Class C(c) | |
| | 2,350,000 | | | | 4.018 | | | | 01/25/47 | | | | 2,210,273 | |
| FREMF Mortgage Trust Series 2012-K710, Class B(c) | |
| | 5,700,000 | | | | 3.949 | | | | 06/25/47 | | | | 5,537,829 | |
| FREMF Mortgage Trust Series 2012-K710, Class C(c) | |
| | 1,600,000 | | | | 3.949 | | | | 06/25/47 | | | | 1,486,696 | |
| GS Mortgage Securities Trust Series 2007-GG10, Class A1A | |
| | 38,942,058 | | | | 5.993 | | | | 08/10/45 | | | | 43,021,250 | |
| Morgan Stanley Capital I Trust Series 2007-HQ11, Class AM | |
| | 1,450,000 | | | | 5.478 | | | | 02/12/44 | | | | 1,607,258 | |
| Morgan Stanley Capital I Trust Series 2007-HQ13, Class AM | |
| | 1,200,000 | | | | 5.931 | | | | 12/15/44 | | | | 1,182,858 | |
| | | | | | | | | | | | | | |
| | | | | | | | | | | | | 742,210,931 | |
| | |
| TOTAL COMMERCIAL
MORTGAGE-BACKED SECURITIES |
| | $ | 1,052,230,242 | |
| | |
| | Federal Agencies – 5.4% | |
| | Adjustable Rate FNMA(a) – 0.1% | |
| $ | 2,750,184 | | | | 2.550 | % | | | 05/01/33 | | | $ | 2,920,733 | |
| | 1,285,236 | | | | 1.996 | | | | 10/01/34 | | | | 1,341,398 | |
| | 2,827,054 | | | | 1.944 | | | | 01/01/35 | | | | 2,945,886 | |
| | 2,219,377 | | | | 2.606 | | | | 09/01/35 | | | | 2,369,807 | |
| | 1,043,526 | | | | 2.442 | | | | 10/01/36 | | | | 1,111,222 | |
| | | | | | | | | | | | | | |
| | | | | | | | | | | | | 10,689,046 | |
| | |
| | FHLMC – 0.4% | |
| | 37,239,076 | | | | 4.000 | | | | 06/01/25 | | | | 39,442,672 | |
| | |
| | FNMA – 4.9% | |
| | 6,800,896 | | | | 3.104 | | | | 01/01/18 | | | | 7,165,503 | |
| | 6,701,485 | | | | 3.462 | | | | 01/01/18 | | | | 7,145,626 | |
| | 4,358,668 | | | | 3.660 | | | | 01/01/18 | | | | 4,710,784 | |
| | 663,879 | | | | 5.000 | | | | 01/01/18 | | | | 705,146 | |
| | 3,280,389 | | | | 5.000 | | | | 02/01/18 | | | | 3,484,518 | |
| | 5,387,507 | | | | 3.750 | | | | 03/01/18 | | | | 5,839,642 | |
| | 2,147,552 | | | | 5.000 | | | | 03/01/18 | | | | 2,281,188 | |
| | 3,144,195 | | | | 5.000 | | | | 04/01/18 | | | | 3,339,849 | |
| | 3,550,000 | | | | 3.840 | | | | 05/01/18 | | | | 3,847,301 | |
| | 269,923 | | | | 5.000 | | | | 05/01/18 | | | | 286,719 | |
| | 268,104 | | | | 5.000 | | | | 06/01/18 | | | | 284,787 | |
| | 6,328 | | | | 5.500 | | | | 01/01/19 | | | | 6,863 | |
| | 107,236 | | | | 5.500 | | | | 02/01/19 | | | | 115,981 | |
| | 103,602 | | | | 5.500 | | | | 03/01/19 | | | | 112,359 | |
| | 84,422 | | | | 5.500 | | | | 04/01/19 | | | | 91,557 | |
| | 45,094 | | | | 5.500 | | | | 05/01/19 | | | | 48,906 | |
| | 188,637 | | | | 5.500 | | | | 06/01/19 | | | | 204,581 | |
| | 622,456 | | | | 5.500 | | | | 07/01/19 | | | | 674,871 | |
| | |
| | Mortgage-Backed Obligations – (continued) | |
| | FNMA – (continued) | |
| $ | 546,074 | | | | 5.500 | % | | | 08/01/19 | | | $ | 591,890 | |
| | 503,038 | | | | 5.500 | | | | 09/01/19 | | | | 545,114 | |
| | 152,675 | | | | 5.500 | | | | 10/01/19 | | | | 165,526 | |
| | 154,584 | | | | 5.500 | | | | 11/01/19 | | | | 167,651 | |
| | 262,807 | | | | 5.500 | | | | 12/01/19 | | | | 285,020 | |
| | 21,575 | | | | 5.500 | | | | 01/01/20 | | | | 23,398 | |
| | 11,443 | | | | 5.500 | | | | 06/01/20 | | | | 12,297 | |
| | 2,977,293 | | | | 5.500 | | | | 07/01/20 | | | | 3,176,438 | |
| | 2,113,368 | | | | 3.416 | | | | 10/01/20 | | | | 2,214,164 | |
| | 1,538,889 | | | | 3.632 | | | | 12/01/20 | | | | 1,627,343 | |
| | 5,927,517 | | | | 4.375 | | | | 06/01/21 | | | | 6,488,430 | |
| | 7,649,177 | | | | 5.500 | | | | 05/01/25 | | | | 8,219,520 | |
| | 12,296,453 | | | | 4.000 | | | | 09/01/26 | | | | 13,070,265 | |
| | 9,431 | | | | 4.500 | | | | 09/01/29 | | | | 10,062 | |
| | 273,183 | | | | 5.000 | | | | 04/01/33 | | | | 298,417 | |
| | 1,398 | | | | 5.000 | | | | 05/01/33 | | | | 1,527 | |
| | 474,232 | | | | 5.000 | | | | 08/01/33 | | | | 518,037 | |
| | 614,234 | | | | 5.000 | | | | 09/01/33 | | | | 670,972 | |
| | 30,188 | | | | 4.000 | | | | 02/01/35 | | | | 31,660 | |
| | 12,587,517 | | | | 5.000 | | | | 07/01/35 | | | | 13,686,467 | |
| | 107,584 | | | | 6.000 | | | | 08/01/36 | | | | 117,343 | |
| | 208,043 | | | | 5.000 | | | | 03/01/38 | | | | 225,044 | |
| | 44,747 | | | | 4.000 | | | | 08/01/39 | | | | 46,919 | |
| | 20,566 | | | | 4.000 | | | | 09/01/39 | | | | 21,564 | |
| | 86,742 | | | | 5.000 | | | | 12/01/39 | | | | 94,028 | |
| | 25,352 | | | | 5.000 | | | | 07/01/40 | | | | 27,602 | |
| | 34,031 | | | | 4.000 | | | | 08/01/40 | | | | 35,691 | |
| | 152,711 | | | | 5.000 | | | | 08/01/40 | | | | 166,260 | |
| | 196,306 | | | | 4.000 | | | | 11/01/40 | | | | 205,878 | |
| | 156,624 | | | | 4.000 | | | | 12/01/40 | | | | 164,261 | |
| | 135,078 | | | | 4.000 | | | | 01/01/41 | | | | 141,664 | |
| | 1,115,829 | | | | 4.000 | | | | 02/01/41 | | | | 1,172,958 | |
| | 254,443 | | | | 4.000 | | | | 03/01/41 | | | | 266,881 | |
| | 52,725 | | | | 4.000 | | | | 05/01/41 | | | | 55,302 | |
| | 4,786 | | | | 5.000 | | | | 05/01/41 | | | | 5,223 | |
| | 4,076,240 | | | | 6.000 | | | | 05/01/41 | | | | 4,475,090 | |
| | 86,623 | | | | 4.000 | | | | 08/01/41 | | | | 90,858 | |
| | 2,796,664 | | | | 4.500 | | | | 08/01/41 | | | | 2,991,595 | |
| | 732,372 | | | | 4.500 | | | | 10/01/41 | | | | 783,419 | |
| | 1,188,933 | | | | 5.000 | | | | 11/01/41 | | | | 1,297,627 | |
| | 157,876 | | | | 4.000 | | | | 01/01/42 | | | | 165,594 | |
| | 33,592 | | | | 4.000 | | | | 02/01/42 | | | | 35,239 | |
| | 11,159,839 | | | | 3.000 | | | | 08/01/42 | | | | 10,920,520 | |
| | 9,843,770 | | | | 3.000 | | | | 09/01/42 | | | | 9,634,390 | |
| | 1,649,368 | | | | 3.000 | | | | 10/01/42 | | | | 1,614,318 | |
| | 6,629,335 | | | | 3.000 | | | | 11/01/42 | | | | 6,487,896 | |
| | 61,145,866 | | | | 3.000 | | | | 12/01/42 | | | | 59,836,228 | |
| | 42,229,542 | | | | 3.000 | | | | 01/01/43 | | | | 41,331,576 | |
| | 12,782,651 | | | | 3.000 | | | | 02/01/43 | | | | 12,509,407 | |
| | 3,089,104 | | | | 3.000 | | | | 03/01/43 | | | | 3,023,460 | |
| | 8,354,590 | | | | 3.000 | | | | 04/01/43 | | | | 8,177,055 | |
| | 208,000,000 | | | | 3.500 | | | | TBA-30yr | (f) | | | 211,835,000 | |
| | 4,000,000 | | | | 4.000 | | | | TBA-30yr | (f) | | | 4,195,625 | |
| | | | | | | | | | | | | | |
| | | | | | | | | | | | | 474,301,894 | |
| | |
| | TOTAL FEDERAL AGENCIES | | | $ | 524,433,612 | |
| | |
| | TOTAL MORTGAGE-BACKED OBLIGATIONS | |
| | (Cost $2,423,893,419) | | | $ | 2,478,403,290 | |
| | |
| | |
| The accompanying notes are an integral part of these financial statements. | | 85 |
GOLDMAN SACHS STRATEGIC INCOME FUND
Schedule of Investments (continued)
September 30, 2013 (Unaudited)
| | | | | | | | | | | | | | |
Principal
Amount | | | Interest
Rate | | | Maturity
Date | | | Value | |
| | Asset-Backed Securities – 6.7% | |
| | Collateralized Loan Obligations – 5.1% | |
| Aberdeen Loan Funding Ltd. Series 2008-1A, Class A(a)(c) | |
| $ | 37,994,697 | | | | 0.915 | % | | | 11/01/18 | | | $ | 36,967,814 | |
| ACIS CLO Ltd. Series 2013-1A, Class ACOM(c) | |
| | 22,700,000 | | | | 1.493 | | | | 04/18/24 | | | | 22,154,905 | |
| ACIS CLO Ltd. Series 2013-2A, Class A(a) | |
| | 11,950,000 | | | | 0.761 | | | | 10/14/22 | | | | 11,555,650 | |
| ACIS CLO Ltd. Series 2013-2A, Class COM(a) | |
| | 67,633,962 | | | | 1.176 | | | | 10/14/22 | | | | 65,334,540 | |
| Atrium CDO Corp. Series 4A Class A2(a)(c) | |
| | 1,998,986 | | | | 0.508 | | | | 06/08/19 | | | | 1,984,458 | |
| Black Diamond CLO Ltd. Series 2005-1A, Class A1(a)(c) | |
| | 1,856,348 | | | | 0.522 | | | | 06/20/17 | | | | 1,846,201 | |
| Black Diamond CLO Ltd. Series 2005-1A, Class A1A(a)(c) | |
| | 365,846 | | | | 0.502 | | | | 06/20/17 | | | | 364,937 | |
| Black Diamond CLO Ltd. Series 2006-1A, Class AD(a)(c) | |
| | 22,691,192 | | | | 0.514 | | | | 04/29/19 | | | | 22,059,265 | |
| Brentwood CLO Corp. Series 2006-1A, Class A1A(a)(c) | |
| | 58,251,658 | | | | 0.535 | | | | 02/01/22 | | | | 56,562,418 | |
| Brentwood CLO Corp. Series 2006-1A, Class A1B(a)(c) | |
| | 23,011,886 | | | | 0.535 | | | | 02/01/22 | | | | 22,344,565 | |
| Callidus Debt Partners CLO Fund Ltd. Series 7A, Class A(a)(c) | |
| | 6,305,038 | | | | 1.016 | | | | 01/21/21 | | | | 6,281,810 | |
| Callidus Debt Partners CLO Fund VI Ltd. Series 6X, Class A1D(a) | |
| | 10,480,408 | | | | 0.525 | | | | 10/23/21 | | | | 10,101,562 | |
| Crown Point CLO Ltd. Series 2012-1A, Class ACOM(a)(c) | |
| | 7,650,000 | | | | 1.484 | | | | 11/21/22 | | | | 7,482,870 | |
| ECP CLO Ltd. Series 2008-1A, Class A1(a)(c) | |
| | 11,400,000 | | | | 1.104 | | | | 03/17/22 | | | | 11,191,220 | |
| Gleneagles CLO Ltd. Series 2005-1A, Class A1(a)(c) | |
| | 13,377,611 | | | | 0.540 | | | | 11/01/17 | | | | 13,220,585 | |
| Golub Capital Management CLO Ltd. Series 2007-1A,
Class A(a)(c) |
|
| | 10,950,000 | | | | 0.506 | | | | 07/31/21 | | | | 10,759,514 | |
| Greywolf CLO Ltd. Series 2007-1A, Class A(a)(c) | |
| | 9,327,400 | | | | 0.508 | | | | 02/18/21 | | | | 9,097,489 | |
| Greywolf CLO Ltd. Series 2007-1A, Class B(a)(c) | |
| | 600,000 | | | | 0.693 | | | | 02/18/21 | | | | 564,800 | |
| Jasper CLO Ltd. Series 2005-1A, Class A(a)(c) | |
| | 7,020,331 | | | | 0.535 | | | | 08/01/17 | | | | 6,990,642 | |
| KKR Financial CLO Ltd. Series 2006-1A, Class A1(a)(c) | |
| | 12,374,542 | | | | 0.542 | | | | 08/25/18 | | | | 12,274,605 | |
| KKR Financial CLO Ltd. Series 2007-1A, Class A(a)(c) | |
| | 22,125,596 | | | | 0.614 | | | | 05/15/21 | | | | 21,611,507 | |
| KKR Financial CLO Ltd. Series 2007-AA, Class A(a)(c) | |
| | 360,254 | | | | 1.018 | | | | 10/15/17 | | | | 358,588 | |
| Liberty CLO Ltd. Series 2005-1A, Class A1C(a)(c) | |
| | 20,670,635 | | | | 0.515 | | | | 11/01/17 | | | | 20,530,943 | |
| Mountain View Funding CLO Series 2007-3A, Class A1(a)(c) | |
| | 2,725,691 | | | | 0.483 | | | | 04/16/21 | | | | 2,677,586 | |
| Ocean Trails CLO Ltd. Series 2006-1X, Class A1(a) | |
| | 5,209,319 | | | | 0.519 | | | | 10/12/20 | | | | 5,097,605 | |
| OCP CLO Ltd. Series 2012-2A, Class ACOM(a)(c) | |
| | 15,650,000 | | | | 1.502 | | | | 11/22/23 | | | | 15,206,917 | |
| OFSI Fund V Ltd. Series 2013-5A, Class ACOM(c) | |
| | 11,950,000 | | | | 1.618 | | | | 04/17/25 | | | | 11,833,942 | |
| | |
| | Asset-Backed Securities – (continued) | |
| | Collateralized Loan Obligations – (continued) | |
| Red River CLO Ltd. Series 1A, Class A(a)(c) | |
| $ | 38,507,125 | | | | 0.535 | % | | | 07/27/18 | | | $ | 37,705,060 | |
| Westbrook CLO Ltd. Series 2006-1X, Class A1(a) | |
| | 21,800,000 | | | | 0.492 | | | | 12/20/20 | | | | 21,163,920 | |
| Westchester CLO Ltd. Series 2007-1X, Class A1A(a) | |
| | 26,051,572 | | | | 0.490 | | | | 08/01/22 | | | | 25,194,605 | |
| | | | | | | | | | | | | | |
| | | | | | | | | | | | | 490,520,523 | |
| | |
| | Home Equity – 1.4% | |
| Ameriquest Mortgage Securities Trust Series 2006-M3,
Class A2B(a) |
|
| | 21,858,017 | | | | 0.284 | | | | 10/25/36 | | | | 9,318,772 | |
| Centex Home Equity Loan Trust Series 2006-A, Class AV4(a) | |
| | 16,300,000 | | | | 0.429 | | | | 06/25/36 | | | | 13,766,938 | |
| Citigroup Mortgage Loan Trust Series 2007-WFH2, Class A4(a) | |
| | 300,000 | | | | 0.534 | | | | 03/25/37 | | | | 257,729 | |
| Countrywide Asset-Backed Certificates Series 2004-3, Class 1A(a) | |
| | 19,374,284 | | | | 0.604 | | | | 08/25/34 | | | | 17,115,373 | |
| Countrywide Asset-Backed Certificates Series 2005-4,
Class MV1(a) |
|
| | 1,842,395 | | | | 0.639 | | | | 10/25/35 | | | | 1,852,105 | |
| Countrywide Asset-Backed Certificates Series 2007-2,
Class 2A4(a) |
|
| | 20,000,000 | | | | 0.404 | | | | 08/25/37 | | | | 7,661,506 | |
| First Franklin Mortgage Loan Asset-Backed Certificates
Series 2006-FF18, Class A2B(a) |
|
| | 3,731,795 | | | | 0.294 | | | | 12/25/37 | | | | 2,037,181 | |
| HLSS Servicer Advance Receivables Backed Notes
Series 2013-T1, Class A2(c) |
|
| | 7,200,000 | | | | 1.495 | | | | 01/16/46 | | | | 7,227,343 | |
| HSI Asset Securitization Corp. Trust Series 2006-OPT1,
Class 2A4(a) |
|
| | 8,600,000 | | | | 0.484 | | | | 12/25/35 | | | | 7,064,091 | |
| JPMorgan Mortgage Acquisition Trust Series 2006-CH1,
Class A5(a) |
|
| | 3,850,000 | | | | 0.414 | | | | 07/25/36 | | | | 3,265,495 | |
| Lehman XS Trust Series 2005-5N, Class 3A1A(a) | |
| | 1,642,883 | | | | 0.484 | | | | 11/25/35 | | | | 1,397,774 | |
| Lehman XS Trust Series 2005-7N, Class 1A1A(a) | |
| | 9,078,144 | | | | 0.454 | | | | 12/25/35 | | | | 7,899,447 | |
| Lehman XS Trust Series 2006-14N, Class 1A1B(a) | |
| | 868,751 | | | | 0.394 | | | | 09/25/46 | | | | 600,465 | |
| Lehman XS Trust Series 2006-16N, Class A321(a) | |
| | 9,767,778 | | | | 0.384 | | | | 11/25/46 | | | | 5,984,182 | |
| Lehman XS Trust Series 2006-GP1, Class A2A(a) | |
| | 2,736,521 | | | | 0.354 | | | | 05/25/46 | | | | 2,595,565 | |
| Morgan Stanley ABS Capital I, Inc. Trust Series 2005-WMC2,
Class M3(a) |
|
| | 5,399,000 | | | | 0.889 | | | | 02/25/35 | | | | 4,710,644 | |
| Residential Asset Mortgage Products Trust Series 2006-RZ3,
Class A3(a) |
|
| | 5,700,000 | | | | 0.474 | | | | 08/25/36 | | | | 4,669,672 | |
| Residential Asset Mortgage Products Trust Series 2006-RZ4,
Class A3(a) |
|
| | 13,400,000 | | | | 0.454 | | | | 10/25/36 | | | | 10,057,051 | |
| | |
| | |
| 86 | | The accompanying notes are an integral part of these financial statements. |
GOLDMAN SACHS STRATEGIC INCOME FUND
| | | | | | | | | | | | | | |
Principal
Amount | | | Interest
Rate | | | Maturity
Date | | | Value | |
| | Asset-Backed Securities – (continued) | |
| | Home Equity – (continued) | |
| Residential Asset Securities Corp. Trust Series 2006-KS7,
Class A4(a) |
|
| $ | 30,832,000 | | | | 0.424 | % | | | 09/25/36 | | | $ | 23,671,783 | |
| Soundview Home Equity Loan Trust Series 2006-EQ1,
Class A4(a) |
|
| | 11,762,000 | | | | 0.434 | | | | 10/25/36 | | | | 6,929,765 | |
| Structured Asset Securities Corp. Mortgage Loan Trust
Series 2006-BC3, Class A3(a) |
|
| | 4,423,972 | | | | 0.344 | | | | 10/25/36 | | | | 2,973,085 | |
| | | | | | | | | | | | | | |
| | | | | | | | | | | | | 141,055,966 | |
| | |
| | Student Loan(a) – 0.2% | |
| GCO Education Loan Funding Trust Series 2006-1, Class A8L | |
| | 5,707,017 | | | | 0.392 | | | | 05/25/25 | | | | 5,572,491 | |
| Panhandle-Plains Higher Education Authority, Inc. Series 2011-1,
Class A2 |
|
| | 10,000,000 | | | | 1.198 | | | | 07/01/24 | | | | 10,084,292 | |
| US Education Loan Trust LLC Series 2006-1, Class A2(c) | |
| | 472,040 | | | | 0.390 | | | | 03/01/25 | | | | 470,426 | |
| | | | | | | | | | | | | | |
| | | | | | | | | | | | | 16,127,209 | |
| | |
| | TOTAL ASSET-BACKED SECURITIES | | | | | |
| | (Cost $633,756,804) | | | $ | 647,703,698 | |
| | |
| | | | | | | | | | | | | | |
| | Foreign Debt Obligations – 13.8% | |
| | Sovereign – 13.8% | |
| Brazil Minas SPE via State of Minas Gerais | |
| $ | 10,840,000 | | | | 5.333 | % | | | 02/15/28 | | | | 10,406,400 | |
| | 1,400,000 | | | | 5.333 | (c) | | | 02/15/28 | | | | 1,344,000 | |
| Dominican Republic | |
| DOP | 201,600,000 | | | | 14.500 | | | | 02/10/23 | | | | 4,575,454 | |
| $ | 4,430,000 | | | | 5.875 | (c) | | | 04/18/24 | | | | 4,091,199 | |
| Federal Republic of Brazil | |
| BRL | 41,807,981 | | | | 6.000 | | | | 08/15/40 | | | | 19,201,481 | |
| | 249,820,189 | | | | 6.000 | | | | 08/15/50 | | | | 113,480,879 | |
| Nigeria Government Bond | |
| $ | 17,030,000 | | | | 6.375 | (c) | | | 07/12/23 | | | | 17,328,025 | |
| Republic of Colombia | |
| | 109,940,000 | | | | 4.000 | | | | 02/26/24 | | | | 107,191,500 | |
| Republic of Costa Rica | |
| | 900,000 | | | | 4.375 | | | | 04/30/25 | | | | 783,000 | |
| | 10,280,000 | | | | 5.625 | | | | 04/30/43 | | | | 8,738,000 | |
| Republic of Indonesia | |
| | 31,680,000 | | | | 6.125 | (c) | | | 03/15/19 | | | | 32,749,200 | |
| | 530,000 | | | | 3.750 | | | | 04/25/22 | | | | 475,675 | |
| | 25,770,000 | | | | 3.375 | (c) | | | 04/15/23 | | | | 21,904,500 | |
| | 60,440,000 | | | | 5.375 | (c) | | | 10/17/23 | | | | 60,137,800 | |
| Republic of Ivory Coast(g) | |
| | 58,399,000 | | | | 5.750 | | | | 12/31/32 | | | | 50,807,130 | |
| Republic of Nigeria | |
| | 11,181,000 | | | | 5.125 | | | | 07/12/18 | | | | 11,306,786 | |
| | 13,270,000 | | | | 5.125 | (c) | | | 07/12/18 | | | | 13,419,287 | |
| | 4,080,000 | | | | 6.375 | | | | 07/12/23 | | | | 4,151,400 | |
| Republic of Slovenia | |
| | 15,750,000 | | | | 5.500 | (c) | | | 10/26/22 | | | | 14,686,875 | |
| | |
| | Foreign Debt Obligations – (continued) | |
| Republic of Slovenia – (continued) | |
| $ | 36,520,000 | | | | 5.500 | % | | | 10/26/22 | | | $ | 34,054,900 | |
| | 36,930,000 | | | | 5.850 | | | | 05/10/23 | | | | 35,083,500 | |
| | 31,660,000 | | | | 5.850 | (c) | | | 05/10/23 | | | | 30,094,138 | |
| Republic of Venezuela | |
| | 13,230,000 | | | | 12.750 | | | | 08/23/22 | | | | 13,130,775 | |
| | 3,050,000 | | | | 8.250 | | | | 10/13/24 | | | | 2,272,250 | |
| | 36,250,000 | | | | 9.250 | | | | 09/15/27 | | | | 29,362,500 | |
| Russian Federation | |
| | 236,600,000 | | | | 4.875 | (c) | | | 09/16/23 | | | | 242,515,000 | |
| Russian Federation Bond | |
| | 9,202,050 | | | | 7.500 | (g) | | | 03/31/30 | | | | 10,858,419 | |
| United Kingdom Gilt | |
| GBP | 150,000,000 | | | | 1.250 | | | | 07/22/18 | | | | 239,641,381 | |
| United Mexican States | |
| MXN | 241,369,600 | | | | 6.500 | | | | 06/10/21 | | | | 19,334,997 | |
| $ | 31,510,000 | | | | 4.000 | | | | 10/02/23 | | | | 31,603,046 | |
| MXN | 930,877,100 | | | | 8.000 | | | | 12/07/23 | | | | 81,984,432 | |
| | 397,443,300 | | | | 7.500 | | | | 06/03/27 | | | | 33,407,651 | |
| | 54,272,100 | | | | 8.500 | | | | 05/31/29 | | | | 4,857,570 | |
| | 304,430,900 | | | | 7.750 | | | | 05/29/31 | | | | 25,114,988 | |
| | 4,092,700 | | | | 10.000 | | | | 11/20/36 | | | | 412,387 | |
| | 129,315,200 | | | | 7.750 | | | | 11/13/42 | | | | 10,488,336 | |
| | |
| | TOTAL FOREIGN DEBT OBLIGATIONS | | | | | |
| | (Cost $1,314,881,185) | | | $ | 1,340,994,861 | |
| | |
| | | | | | | | | | | | | | |
| | Structured Notes – 0.2% | |
| Notas do Tesouro Nacional (Issuer Deutsche Bank AG (London) | |
| BRL$ | 5,523,000 | | | | 6.000 | % | | | 04/12/14 | | | $ | 5,860,832 | |
| | 3,722,000 | | | | 6.000 | | | | 05/15/14 | | | | 3,949,667 | |
| Notas do Tesouro Nacional Series B (Issuer HSBC Corp.) | |
| | 17,219,674 | | | | 6.000 | | | | 08/15/40 | | | | 7,908,615 | |
| | |
| | TOTAL STRUCTURED NOTES | | | | | |
| | (Cost $24,210,199) | | | $ | 17,719,114 | |
| | |
| | | | | | | | | | | | | | |
| | Municipal Debt Obligations – 5.6% | |
| | California – 1.5% | |
| California State GO Bonds (Refunding-Various Purposes)
Series 2013 |
|
| $ | 15,085,000 | | | | 5.000 | % | | | 09/01/28 | | | $ | 16,411,877 | |
| | 6,030,000 | | | | 5.000 | | | | 09/01/31 | | | | 6,417,609 | |
| | 14,365,000 | | | | 5.000 | | | | 09/01/32 | | | | 15,192,711 | |
| | 8,620,000 | | | | 5.000 | | | | 09/01/33 | | | | 9,109,616 | |
| California State GO Bonds (Various Purposes) Series 2011 | |
| | 6,935,000 | | | | 5.000 | | | | 09/01/41 | | | | 7,084,657 | |
| California State GO Bonds (Various Purposes) Series 2012 | |
| | 5,050,000 | | | | 5.000 | | | | 09/01/42 | | | | 5,166,453 | |
| California State GO Bonds (Various Purposes) Series 2013 | |
| | 7,940,000 | | | | 5.000 | | | | 09/01/27 | | | | 8,720,502 | |
| | 7,065,000 | | | | 5.000 | | | | 04/01/37 | | | | 7,307,895 | |
| | 23,920,000 | | | | 5.000 | | | | 04/01/43 | | | | 24,482,838 | |
| California State University Systemwide RB Series 2012 A | |
| | 17,910,000 | | | | 5.000 | | | | 11/01/37 | | | | 18,652,011 | |
| | 4,970,000 | | | | 5.000 | | | | 11/01/42 | | | | 5,127,151 | |
| | |
| | |
| The accompanying notes are an integral part of these financial statements. | | 87 |
GOLDMAN SACHS STRATEGIC INCOME FUND
Schedule of Investments (continued)
September 30, 2013 (Unaudited)
| | | | | | | | | | | | | | |
Principal
Amount | | | Interest
Rate | | | Maturity
Date | | | Value | |
| | Municipal Debt Obligations – (continued) | |
| | California – (continued) | |
| City of Los Angeles CA Department of Water & Power RB
(Power System) Series 2012 B |
|
| $ | 5,100,000 | | | | 5.000 | % | | | 07/01/43 | | | $ | 5,226,684 | |
| City of Los Angeles CA Department of Water & Power RB
Series 2012 B |
|
| | 7,945,000 | | | | 5.000 | | | | 07/01/43 | | | | 8,293,229 | |
| Contra Costa Community College District GO Bonds Series 2013 | |
| | 1,710,000 | | | | 5.000 | | | | 08/01/38 | | | | 1,788,267 | |
| Sacramento CA Municipal Utility District RB Series 2013 A | |
| | 1,890,000 | | | | 5.000 | | | | 08/15/41 | | | | 1,938,762 | |
| University of California RB (Limited Project) Series 2012 G | |
| | 2,445,000 | | | | 5.000 | | | | 05/15/37 | | | | 2,572,433 | |
| | | | | | | | | | | | | | |
| | | | | | | | | | | | | 143,492,695 | |
| | |
| | Connecticut – 0.1% | |
| Connecticut State GO Bonds Series 2013 E | |
| | 9,375,000 | | | | 5.000 | | | | 08/15/24 | | | | 10,965,750 | |
| | |
| | Florida – 0.1% | |
| Miami-Dade County FL Transit System Sales Surtax RB
(Sales Tax) Series 2012 |
|
| | 7,095,000 | | | | 5.000 | | | | 07/01/42 | | | | 7,204,972 | |
| Tampa Bay Water Regional Utility System Authority RB
Series 2013 |
|
| | 4,290,000 | | | | 5.000 | | | | 10/01/38 | | | | 4,489,271 | |
| | | | | | | | | | | | | | |
| | | | | | | | | | | | | 11,694,243 | |
| | |
| | Georgia – 0.2% | |
| DeKalb County GA Water & Sewerage RB Series 2011 A | |
| | 3,260,000 | | | | 5.250 | | | | 10/01/41 | | | | 3,358,615 | |
| Private Colleges & Universities GA Authority RB
(Emory University) Series 2013 A |
|
| | 16,755,000 | | | | 5.000 | | | | 10/01/43 | | | | 17,797,664 | |
| | | | | | | | | | | | | | |
| | | | | | | | | | | | | 21,156,279 | |
| | |
| | Illinois – 0.1% | |
| Metropolitan Pier & Exposition Authority Dedicated
State Tax RB (Mccormick Place Expansion) Series 2010 A |
|
| | 7,255,000 | | | | 5.500 | | | | 06/15/50 | | | | 7,376,231 | |
| | |
| | Louisiana – 0.1% | |
| Louisiana State Gas & Fuels Tax RB (Second Lien)
Series 2010 B |
|
| | 5,055,000 | | | | 5.000 | | | | 05/01/45 | | | | 5,203,162 | |
| | |
| | Massachusetts – 0.3% | |
| Massachusetts State Consolidated Loan GO Bonds Series 2013 E | |
| | 7,385,000 | | | | 5.000 | | | | 08/01/40 | | | | 7,755,136 | |
| Massachusetts State Development Finance Agency RB
(Williams College) Series 2013 P |
|
| | 3,895,000 | | | | 5.000 | | | | 07/01/43 | | | | 4,103,577 | |
| Massachusetts State School Building Authority Sales Tax RB
(Refunding-Senior) Series 2012 B |
|
| | 7,035,000 | | | | 5.000 | | | | 08/15/30 | | | | 7,670,683 | |
| Massachusetts State School Building Authority Sales Tax RB
(Senior) Series 2011 B |
|
| | 4,275,000 | | | | 5.000 | | | | 10/15/41 | | | | 4,464,596 | |
| | | | | | | | | | | | | | |
| | | | | | | | | | | | | 23,993,992 | |
| | |
| | Municipal Debt Obligations – (continued) | |
| | Missouri – 0.1% | |
| Metropolitan St. Louis MO Sewer District Wastewater
System RB Series 2012 A |
|
| $ | 5,240,000 | | | | 5.000 | % | | | 05/01/42 | | | $ | 5,531,449 | |
| | |
| | New Jersey – 0.5% | |
| New Jersey State Economic Development Authority RB
(Rutgers University) Series 2013 |
|
| | 2,435,000 | | | | 5.000 | | | | 06/15/38 | | | | 2,549,202 | |
| | 3,615,000 | | | | 5.000 | | | | 06/15/46 | | | | 3,701,290 | |
| New Jersey State Transportation Trust Fund Authority RB
(Transportation Program) Series 2013 AA |
|
| | 17,070,000 | | | | 5.000 | | | | 06/15/36 | | | | 17,517,575 | |
| | 9,195,000 | | | | 5.500 | | | | 06/15/39 | | | | 9,821,179 | |
| | 14,035,000 | | | | 5.000 | | | | 06/15/44 | | | | 14,217,034 | |
| | | | | | | | | | | | | | |
| | | | | | | | | | | | | 47,806,280 | |
| | |
| | New York – 1.8% | |
| New York City GO Bonds (Refunding) Series 2012 B | |
| | 4,475,000 | | | | 5.000 | | | | 08/01/24 | | | | 5,123,338 | |
| New York City GO Bonds (Refunding) Series 2012 F | |
| | 3,435,000 | | | | 5.000 | | | | 08/01/24 | | | | 3,907,931 | |
| New York City GO Bonds (Refunding) Series 2012 I | |
| | 4,770,000 | | | | 5.000 | | | | 08/01/24 | | | | 5,461,078 | |
| New York City GO Bonds (Refunding) Series 2013 I | |
| | 3,355,000 | | | | 5.000 | | | | 08/01/25 | | | | 3,824,197 | |
| New York City GO Bonds (Refunding) Series 2013 J | |
| | 3,655,000 | | | | 5.000 | | | | 08/01/24 | | | | 4,235,962 | |
| | 3,715,000 | | | | 5.000 | | | | 08/01/25 | | | | 4,251,297 | |
| New York City GO Bonds Series 2012 I | |
| | 8,875,000 | | | | 5.000 | | | | 08/01/25 | | | | 10,043,660 | |
| New York City GO Bonds Series 2013 D | |
| | 2,925,000 | | | | 5.000 | | | | 08/01/24 | | | | 3,369,512 | |
| | 2,060,000 | | | | 5.000 | | | | 08/01/25 | | | | 2,335,566 | |
| New York City GO Bonds Series 2013 E | |
| | 2,200,000 | | | | 5.000 | | | | 08/01/25 | | | | 2,494,294 | |
| New York City GO Bonds Series 2013 I | |
| | 1,925,000 | | | | 5.000 | | | | 08/01/24 | | | | 2,230,979 | |
| New York City Transitional Finance Authority RB
(Future Tax Secured) Series 2012 E-1 |
|
| | 3,630,000 | | | | 5.000 | | | | 02/01/42 | | | | 3,762,350 | |
| New York City Transitional Finance Authority RB
(Future Tax Secured) Series 2012 F-1 |
|
| | 4,475,000 | | | | 5.000 | | | | 05/01/34 | | | | 4,753,658 | |
| New York City Transitional Finance Authority RB (Future Tax
Secured) Series 2013 I |
|
| | 2,975,000 | | | | 5.000 | | | | 05/01/38 | | | | 3,115,539 | |
| New York City Water & Sewer System Finance Authority RB
(Refunding) Series 2011 AA |
|
| | 7,530,000 | | | | 5.000 | | | | 06/15/44 | | | | 7,757,406 | |
| New York City Water & Sewer System Finance Authority RB
(Refunding) Series 2012 CC |
|
| | 2,665,000 | | | | 5.000 | | | | 06/15/45 | | | | 2,749,827 | |
| New York City Water & Sewer System Finance Authority RB
(Second General) Series 2012 BB |
|
| | 10,460,000 | | | | 5.000 | | | | 06/15/47 | | | | 10,786,143 | |
| New York City Water & Sewer System Finance Authority RB
(Second General) Series 2013 CC |
|
| | 11,795,000 | | | | 5.000 | | | | 06/15/47 | | | | 12,178,691 | |
| | |
| | |
| 88 | | The accompanying notes are an integral part of these financial statements. |
GOLDMAN SACHS STRATEGIC INCOME FUND
| | | | | | | | | | | | | | |
Principal
Amount | | | Interest
Rate | | | Maturity
Date | | | Value | |
| | Municipal Debt Obligations – (continued) | |
| | New York – (continued) | |
| New York City Water & Sewer System Finance Authority RB
Series 2013 EE |
|
| $ | 7,650,000 | | | | 5.000 | % | | | 06/15/47 | | | $ | 7,898,854 | |
| New York State Dormitory Authority Personal Income Tax RB
(General Purpose) Series 2012 A |
|
| | 6,895,000 | | | | 5.000 | | | | 02/15/30 | | | | 7,513,275 | |
| New York State Dormitory Authority Personal Income Tax RB
(General Purpose) Series 2013 A |
|
| | 7,245,000 | | | | 5.000 | | | | 02/15/43 | | | | 7,530,236 | |
| New York State Dormitory Authority Personal Income Tax RB
Series 2013 B |
|
| | 7,585,000 | | | | 5.000 | | | | 03/15/34 | | | | 8,051,553 | |
| New York State Urban Development Corp. RB (Personal Income
Tax) Series 2011 A |
|
| | 2,330,000 | | | | 5.000 | | | | 03/15/35 | | | | 2,449,646 | |
| | 2,550,000 | | | | 5.000 | | | | 03/15/36 | | | | 2,672,630 | |
| New York State Urban Development Corp. RB (Personal Income
Tax) Series 2013 C |
|
| | 7,805,000 | | | | 5.000 | | | | 03/15/28 | | | | 8,666,984 | |
| | 12,160,000 | | | | 5.000 | | | | 03/15/30 | | | | 13,258,778 | |
| | 12,695,000 | | | | 5.000 | | | | 03/15/31 | | | | 13,758,333 | |
| | 13,380,000 | | | | 5.000 | | | | 03/15/32 | | | | 14,424,041 | |
| | | | | | | | | | | | | | |
| | | | | | | | | | | | | 178,605,758 | |
| | |
| | North Carolina – 0.0% | |
| North Carolina State University at Raleigh RB Series 2013 A | |
| | 4,305,000 | | | | 5.000 | | | | 10/01/42 | | | | 4,540,570 | |
| | |
| | Ohio – 0.2% | |
| Ohio State Turnpike Commission RB (Junior Lien-Infrastructure
Projects) Series 2013 A-1 |
|
| | 1,910,000 | | | | 5.250 | | | | 02/15/39 | | | | 1,996,103 | |
| | 9,215,000 | | | | 5.000 | | | | 02/15/48 | | | | 9,303,740 | |
| Ohio State Turnpike Commission RB (Senior Lien) Series 2013 A | |
| | 3,180,000 | | | | 5.000 | | | | 02/15/48 | | | | 3,268,436 | |
| | | | | | | | | | | | | | |
| | | | | | | | | | | | | 14,568,279 | |
| | |
| | Pennsylvania – 0.0% | |
| Pennsylvania State Turnpike Commission RB Series 2013 C | |
| | 2,875,000 | | | | 5.000 | | | | 12/01/43 | | | | 2,913,697 | |
| | |
| | Texas – 0.3% | | | | | | | | | | | | | |
| Dallas-Fort Worth TX International Airport RB (Improvement)
Series 2013 B |
|
| | 7,790,000 | | | | 5.000 | | | | 11/01/44 | | | | 7,680,784 | |
| Dallas-Fort Worth TX International Airport RB (Improvement)
Series 2013 F |
|
| | 5,755,000 | | | | 5.250 | | | | 11/01/33 | | | | 6,030,089 | |
| North Texas Tollway Authority RB (Special Projects System)
Series 2011 A |
|
| | 16,365,000 | | | | 5.500 | | | | 09/01/41 | | | | 17,646,707 | |
| | | | | | | | | | | | | | |
| | | | | | | | | | | | | 31,357,580 | |
| | |
| | Washington – 0.3% | |
| University of Washington RB (General) Series 2013 | |
| | 5,560,000 | | | | 5.000 | | | | 07/01/41 | | | | 5,817,206 | |
| | |
| | Municipal Debt Obligations – (continued) | |
| | Washington – (continued) | |
| Washington State GO Bonds (Motor Vehicle Fuel Tax)
Series 2013 B |
|
| $ | 2,745,000 | | | | 5.000 | % | | | 08/01/33 | | | $ | 2,947,636 | |
| | 2,830,000 | | | | 5.000 | | | | 08/01/34 | | | | 3,010,611 | |
| | 1,000,000 | | | | 5.000 | | | | 08/01/37 | | | | 1,050,660 | |
| | 435,000 | | | | 5.000 | | | | 08/01/38 | | | | 455,262 | |
| Washington State GO Bonds (Various Purpose) Series 2013 A | |
| | 2,375,000 | | | | 5.000 | | | | 08/01/33 | | | | 2,550,323 | |
| | 955,000 | | | | 5.000 | | | | 08/01/36 | | | | 1,007,286 | |
| Washington State GO Bonds (Various Purposes) Series 2013 A | |
| | 6,575,000 | | | | 5.000 | | | | 08/01/34 | | | | 6,994,616 | |
| | 6,570,000 | | | | 5.000 | | | | 08/01/35 | | | | 6,956,710 | |
| | | | | | | | | | | | | | |
| | | | | | | | | | | | | 30,790,310 | |
| | |
| | TOTAL MUNICIPAL DEBT OBLIGATIONS | |
| | (Cost $525,905,527) | | | $ | 539,996,275 | |
| | |
| | | | | | | | | | | | | | |
| | Government Guarantee Obligations(h) – 2.4% | |
| Kreditanstalt fuer Wiederaufbau | |
| EUR | 112,100,000 | | | | 3.125 | % | | | 07/04/16 | | | $ | 162,758,074 | |
| | 56,100,000 | | | | 0.500 | | | | 07/25/16 | | | | 76,028,486 | |
| | |
| | TOTAL GOVERNMENT GUARANTEE OBLIGATIONS | |
| | (Cost $230,554,241) | | | $ | 238,786,560 | |
| | |
| | | | | | | | | | | | | | |
| | U.S. Treasury Obligations – 28.1% | |
| United States Treasury Bill(i) | |
| $ | 550,000,000 | | | | 0.000 | % | | | 02/20/14 | | | $ | 549,978,308 | |
| United States Treasury Bonds | |
| | 1,500,000 | | | | 3.125 | | | | 02/15/42 | | | | 1,350,495 | |
| | 3,700,000 | | | | 3.000 | | | | 05/15/42 | | | | 3,242,421 | |
| | 96,500,000 | | | | 3.125 | | | | 02/15/43 | | | | 86,476,544 | |
| | 169,400,000 | | | | 3.625 | | | | 08/15/43 | | | | 167,455,283 | |
| United States Treasury Inflation Protected Securities | |
| | 40,960,404 | | | | 2.000 | | | | 01/15/14 | | | | 41,165,206 | |
| | 96,358,248 | | | | 1.250 | | | | 04/15/14 | | | | 97,201,383 | |
| | 17,811,200 | | | | 0.125 | | | | 01/15/23 | | | | 17,329,763 | |
| | 8,833,088 | | | | 0.375 | | | | 07/15/23 | | | | 8,791,661 | |
| United States Treasury Notes | |
| | 130,300,000 | | | | 0.250 | | | | 06/30/14 | | | | 130,447,238 | |
| | 10,800,000 | | | | 0.250 | | | | 09/30/14 | | | | 10,813,932 | |
| | 89,500,000 | | | | 0.250 | | | | 01/15/15 | | | | 89,585,026 | |
| | 89,000,000 | | | | 0.250 | | | | 02/15/15 | | | | 89,067,636 | |
| | 51,100,000 | | | | 0.125 | | | | 04/30/15 | | | | 51,006,487 | |
| | 44,300,000 | | | | 1.000 | | | | 05/31/18 | | | | 43,733,403 | |
| | 124,200,000 | | | | 1.375 | | | | 06/30/18 | | | | 124,520,188 | |
| | 89,000,000 | | | | 1.375 | | | | 07/31/18 | | | | 89,161,979 | |
| | 106,900,000 | | | | 1.500 | | | | 08/31/18 | | | | 107,624,783 | |
| | 251,500,000 | | | | 1.375 | | | | 09/30/18 | | | | 251,318,922 | |
| | 60,100,000 | | | | 1.125 | (j) | | | 04/30/20 | | | | 57,138,872 | |
| | 78,300,000 | | | | 1.375 | | | | 05/31/20 | | | | 75,555,587 | |
| | 76,700,000 | | | | 1.875 | | | | 06/30/20 | | | | 76,351,013 | |
| | 16,900,000 | | | | 2.000 | | | | 07/31/20 | | | | 16,942,418 | |
| | 182,100,000 | | | | 2.125 | | | | 08/31/20 | | | | 183,713,410 | |
| | |
| | |
| The accompanying notes are an integral part of these financial statements. | | 89 |
GOLDMAN SACHS STRATEGIC INCOME FUND
Schedule of Investments (continued)
September 30, 2013 (Unaudited)
| | | | | | | | | | | | | | |
Principal
Amount | | | Interest
Rate | | | Maturity
Date | | | Value | |
| | U.S. Treasury Obligations – (continued) | |
| United States Treasury Notes (continued) | |
| $ | 181,000,000 | | | | 2.000 | % | | | 09/30/20 | | | $ | 180,809,945 | |
| | 181,000,000 | | | | 1.750 | (j) | | | 05/15/23 | | | | 167,714,607 | |
| | 6,900,000 | | | | 2.500 | | | | 08/15/23 | | | | 6,829,413 | |
| | |
| | TOTAL U.S. TREASURY OBLIGATIONS | |
| | (Cost $2,719,800,132) | | | $ | 2,725,325,923 | |
| | |
| | | | | | | | | | | | | | |
| | Senior Term Loans(k) – 1.5% | |
| | Airlines – 0.1% | |
| Delta Air Lines, Inc. | |
| $ | 6,451,250 | | | | 4.000 | % | | | 10/18/18 | | | $ | 6,461,701 | |
| | |
| | Consumer Products – Household & Leisure – 0.1% | |
| Visant Holding Corp. | |
| | 8,418,523 | | | | 5.250 | | | | 12/22/16 | | | | 8,149,467 | |
| | |
| | Energy – 0.1% | |
| Vantage Drilling Co. | |
| | 4,389,740 | | | | 6.250 | | | | 10/25/17 | | | | 4,389,740 | |
| | |
| | Food & Beverage – 0.2% | |
| Arysta Lifescience Corp. | |
| | 7,082,250 | | | | 4.500 | | | | 05/29/20 | | | | 7,061,570 | |
| Pinnacle Foods Finance LLC | |
| | 15,323,000 | | | | 3.250 | | | | 04/29/20 | | | | 15,173,601 | |
| | | | | | | | | | | | | | |
| | | | | | | | | | | | | 22,235,171 | |
| | |
| | Food & Drug Retailers – 0.1% | |
| Rite Aid Corp. | |
| | 9,950,000 | | | | 4.000 | | | | 02/21/20 | | | | 9,927,613 | |
| | |
| | Gaming – 0.2% | |
| Scientific Games International, Inc. | |
| | 23,000,000 | | | | 0.000 | | | | 05/22/20 | | | | 22,798,750 | |
| | |
| | Health Care – Services – 0.3% | |
| American Renal Holdings, Inc. | |
| | 13,930,000 | | | | 4.500 | | | | 08/20/19 | | | | 13,773,288 | |
| | 18,775,000 | | | | 8.500 | | | | 03/20/20 | | | | 18,493,375 | |
| | | | | | | | | | | | | | |
| | | | | | | | | | | | | 32,266,663 | |
| | |
| | Media – Cable – 0.1% | |
| UPC Financing Partnership | |
| | 6,500,000 | | | | 4.000 | | | | 01/31/21 | | | | 6,500,000 | |
| | |
| | Retailers – 0.2% | |
| BJ’s Wholesale Club, Inc. | |
| | 9,925,125 | | | | 4.250 | | | | 09/26/19 | | | | 9,881,057 | |
| True Religion Apparel, Inc. | |
| | 10,000,000 | | | | 5.880 | | | | 07/30/19 | | | | 9,408,300 | |
| | | | | | | | | | | | | | |
| | | | | | | | | | | | | 19,289,357 | |
| | |
| | Services Cyclical – Consumer Services – 0.0% | |
| Lonestar Intermediate Super Holdings LLC | |
| | 1,250,000 | | | | 11.000 | | | | 09/02/19 | | | | 1,303,125 | |
| | |
| | Utilities – Electric – 0.1% | |
| Calpine Corp. | |
| | 12,095,794 | | | | 4.000 | | | | 10/09/19 | | | | 12,086,722 | |
| | |
| | TOTAL SENIOR TERM LOANS | | | | | |
| | (Cost $145,463,784) | | | $ | 145,408,309 | |
| | |
| | Options Purchased – 3.6% | |
| | Interest Rate Swaptions | |
| Bank of America NA Put - OTC - 5 year Interest Rate Swap
Strike Price 2.650% |
|
| $ | 256,000,000 | | | | 2.650 | % | | | 08/26/14 | | | $ | 8,673,818 | |
| Bank of America NA Call - OTC - 5 year Interest Rate Swap
Strike Price 2.650% |
|
| | 256,000,000 | | | | 2.650 | | | | 08/26/14 | | | | 2,415,360 | |
| Bank of America NA Put - OTC - 5 year Interest Rate Swap
Strike Price 2.463% |
|
| | 258,500,000 | | | | 2.463 | | | | 08/28/14 | | | | 6,959,880 | |
| Bank of America NA Call - OTC - 5 year Interest Rate Swap
Strike Price 2.463% |
|
| | 258,500,000 | | | | 2.463 | | | | 08/28/14 | | | | 3,102,931 | |
| Bank of America NA Call - OTC - 10 year Interest Rate Swap
Strike Price 3.590% |
|
| | 197,100,000 | | | | 3.590 | | | | 03/22/16 | | | | 12,112,643 | |
| Bank of America NA Call - OTC - 10 year Interest Rate Swap
Strike Price 4.070% |
|
| | 197,600,000 | | | | 4.070 | | | | 03/29/16 | | | | 8,583,942 | |
| Citibank NA Put - OTC - 5 year Interest Rate Swap Strike
Price 2.465% |
|
| | 321,000,000 | | | | 2.465 | | | | 08/20/14 | | | | 8,820,279 | |
| Citibank NA Call - OTC - 5 year Interest Rate Swap Strike
Price 2.465% |
|
| | 321,000,000 | | | | 2.465 | | | | 08/20/14 | | | | 3,662,482 | |
| Citibank NA Put - OTC - 5 year Interest Rate Swap Strike
Price 2.510% |
|
| | 321,000,000 | | | | 2.510 | | | | 08/21/14 | | | | 9,249,005 | |
| Citibank NA Call - OTC - 5 year Interest Rate Swap Strike
Price 2.510% |
|
| | 321,000,000 | | | | 2.510 | | | | 08/21/14 | | | | 3,528,721 | |
| Citibank NA Put - OTC - 5 year Interest Rate Swap Strike
Price 2.635% |
|
| | 486,000,000 | | | | 2.635 | | | | 08/22/14 | | | | 16,192,402 | |
| Citibank NA Call - OTC - 5 year Interest Rate Swap Strike
Price 2.635% |
|
| | 486,000,000 | | | | 2.635 | | | | 08/22/14 | | | | 4,627,789 | |
| Citibank NA Put - OTC - 5 year Interest Rate Swap Strike
Price 2.463% |
|
| | 248,100,000 | | | | 2.463 | | | | 08/28/14 | | | | 6,679,869 | |
| Citibank NA Call - OTC - 5 year Interest Rate Swap Strike
Price 2.463% |
|
| | 248,100,000 | | | | 2.463 | | | | 08/28/14 | | | | 2,978,093 | |
| Citibank NA Put - OTC - 10 year Interest Rate Swap Strike
Price 3.010% |
|
| | 164,700,000 | | | | 3.010 | | | | 05/29/15 | | | | 3,995,902 | |
| Citibank NA Call - OTC - 10 year Interest Rate Swap Strike
Price 3.010% |
|
| | 164,700,000 | | | | 3.010 | | | | 05/29/15 | | | | 10,908,394 | |
| Citibank NA Put - OTC - 10 year Interest Rate Swap Strike
Price 3.017% |
|
| | 97,100,000 | | | | 3.017 | | | | 05/29/15 | | | | 2,378,727 | |
| Citibank NA Call - OTC - 10 year Interest Rate Swap Strike
Price 3.017% |
|
| | 97,100,000 | | | | 3.017 | | | | 05/29/15 | | | | 6,394,841 | |
| | |
| | |
| 90 | | The accompanying notes are an integral part of these financial statements. |
GOLDMAN SACHS STRATEGIC INCOME FUND
| | | | | | | | | | | | | | |
Notional
Amount | | | Exercise
Rate | | | Expiration
Date | | | Value | |
| | Options Purchased – (continued) | |
| | Interest Rate Swaptions – (continued) | |
| Citibank NA Put - OTC - 10 year Interest Rate Swap Strike
Price 3.040% |
|
| $ | 153,900,000 | | | | 3.040 | % | | | 06/03/15 | | | $ | 3,895,271 | |
| Citibank NA Call - OTC - 10 year Interest Rate Swap Strike
Price 3.040% |
|
| | 153,900,000 | | | | 3.040 | | | | 06/03/15 | | | | 9,997,498 | |
| Citibank NA Put - OTC - 10 year Interest Rate Swap Strike
Price 3.098% |
|
| | 65,000,000 | | | | 3.098 | | | | 06/08/15 | | | | 1,773,285 | |
| Citibank NA Call - OTC - 10 year Interest Rate Swap Strike
Price 3.098% |
|
| | 65,000,000 | | | | 3.098 | | | | 06/08/15 | | | | 4,056,936 | |
| Citibank NA Put - OTC - 10 year Interest Rate Swap Strike
Price 3.500% |
|
| | 149,900,000 | | | | 3.500 | | | | 07/02/15 | | | | 6,535,430 | |
| Citibank NA Call - OTC - 10 year Interest Rate Swap Strike
Price 3.500% |
|
| | 149,900,000 | | | | 3.500 | | | | 07/02/15 | | | | 6,945,377 | |
| Citibank NA Call - OTC - 10 year Interest Rate Swap Strike
Price 3.645% |
|
| | 109,700,000 | | | | 3.645 | | | | 02/16/16 | | | | 6,227,439 | |
| Citibank NA Call - OTC - 10 year Interest Rate Swap Strike
Price 3.633% |
|
| | 86,400,000 | | | | 3.633 | | | | 02/19/16 | | | | 4,977,625 | |
| Citibank NA Call - OTC - 10 year Interest Rate Swap Strike
Price 3.570% |
|
| | 81,900,000 | | | | 3.570 | | | | 02/22/16 | | | | 4,945,384 | |
| Citibank NA Call - OTC - 10 year Interest Rate Swap Strike
Price 3.625% |
|
| | 79,000,000 | | | | 3.625 | | | | 02/22/16 | | | | 4,583,343 | |
| Citibank NA Call - OTC - 10 year Interest Rate Swap Strike
Price 3.650% |
|
| | 415,000,000 | | | | 3.650 | | | | 05/20/16 | | | | 26,079,969 | |
| Deutsche Bank Securities, Inc. Call - OTC - 2 year Interest Rate
Swap Strike Price 1.950% |
|
| | 269,900,000 | | | | 1.950 | | | | 10/26/15 | | | | 2,827,256 | |
| Deutsche Bank Securities, Inc. Call - OTC - 2 year Interest Rate
Swap Strike Price 2.030% |
|
| | 249,500,000 | | | | 2.030 | | | | 10/26/15 | | | | 2,463,538 | |
| Deutsche Bank Securities, Inc. Call - OTC - 5 year Interest Rate
Swap Strike Price 1.700% |
|
| | 267,200,000 | | | | 1.700 | | | | 11/04/13 | | | | 917,057 | |
| Deutsche Bank Securities, Inc. Put - OTC - 10 year Interest Rate
Swap Strike Price 3.503% |
|
| | 301,100,000 | | | | 3.503 | | | | 07/02/15 | | | | 13,162,707 | |
| Deutsche Bank Securities, Inc. Call - OTC - 10 year Interest Rate
Swap Strike Price 3.503% |
|
| | 301,100,000 | | | | 3.503 | | | | 07/02/15 | | | | 13,920,786 | |
| JPMorgan Chase Bank NA Put - OTC - 10 year Interest Rate
Swap Strike Price 3.080% |
|
| | 147,700,000 | | | | 3.080 | | | | 06/04/15 | | | | 3,934,964 | |
| JPMorgan Chase Bank NA Call - OTC - 10 year Interest Rate
Swap Strike Price 3.080% |
|
| | 147,700,000 | | | | 3.080 | | | | 06/04/15 | | | | 9,323,134 | |
| | |
| | Options Purchased – (continued) | |
| | Interest Rate Swaptions – (continued) | |
| JPMorgan Chase Bank NA Put - OTC - 10 year Interest Rate
Swap Strike Price 3.498% |
|
| $ | 186,000,000 | | | | 3.498 | % | | | 07/02/15 | | | $ | 8,087,652 | |
| JPMorgan Chase Bank NA Call - OTC - 10 year Interest Rate
Swap Strike Price 3.498% |
|
| | 186,000,000 | | | | 3.498 | | | | 07/02/15 | | | | 8,636,705 | |
| JPMorgan Chase Bank NA Put - OTC - 10 year Interest Rate
Swap Strike Price 3.948% |
|
| | 192,700,000 | | | | 3.948 | | | | 08/21/15 | | | | 12,576,700 | |
| JPMorgan Chase Bank NA Call - OTC - 10 year Interest Rate
Swap Strike Price 3.948% |
|
| | 192,700,000 | | | | 3.948 | | | | 08/21/15 | | | | 6,595,273 | |
| JPMorgan Chase Bank NA Call - OTC - 2 year Interest Rate
Swap Strike Price 1.855% |
|
| | 262,500,000 | | | | 1.855 | | | | 11/02/15 | | | | 3,010,980 | |
| JPMorgan Chase Bank NA Call - OTC - 5 year Interest Rate
Swap Strike Price 3.610% |
|
| | 76,300,000 | | | | 3.610 | | | | 02/16/16 | | | | 4,444,086 | |
| Morgan Stanley Capital Services, Inc. Put - OTC - 5 year Interest
Rate Swap Strike Price 2.675% |
|
| | 344,400,000 | | | | 2.675 | | | | 09/08/14 | | | | 11,775,759 | |
| Morgan Stanley Capital Services, Inc. Call - OTC - 5 year Interest
Rate Swap Strike Price 2.675% |
|
| | 344,400,000 | | | | 2.675 | | | | 09/08/14 | | | | 3,349,634 | |
| Morgan Stanley Capital Services, Inc. Call - OTC - 10 year
Interest Rate Swap Strike Price 3.620% |
|
| | 297,700,000 | | | | 3.620 | | | | 03/07/16 | | | | 17,601,304 | |
| Morgan Stanley Capital Services, Inc. Call - OTC - 10 year
Interest Rate Swap Strike Price 3.630% |
|
| | 300,200,000 | | | | 3.630 | | | | 02/16/16 | | | | 17,230,699 | |
| Morgan Stanley Capital Services, Inc. Call - OTC - 10 year
Interest Rate Swap Strike Price 3.652% |
|
| | 125,800,000 | | | | 3.652 | | | | 02/22/16 | | | | 7,155,680 | |
| | |
| | TOTAL OPTIONS PURCHASED – 3.6% | |
| | (Cost $307,203,188) | | | $ | 348,296,549 | |
| | |
| | | | | | | | |
Shares | | | Description | | Value | |
| | Investment Company – 8.1% | |
| SSgA U.S. Government Money Market Fund | |
| | 782,129,734 | | | | | $ | 782,129,734 | |
| | (Cost $782,129,734) | | | | |
| | |
| | TOTAL INVESTMENTS – 106.1% | |
| | (Cost $10,132,382,250) | | $ | 10,285,772,340 | |
| | |
| LIABILITIES IN EXCESS OF
OTHER ASSETS – (6.1)% | | | (591,876,391 | ) |
| | |
| | NET ASSETS – 100.0% | | $ | 9,693,895,949 | |
| | |
| | |
| The accompanying notes are an integral part of these financial statements. | | 91 |
GOLDMAN SACHS STRATEGIC INCOME FUND
Schedule of Investments (continued)
September 30, 2013 (Unaudited)
| | |
| The percentage shown for each investment category reflects the value of investments in that category as a percentage of net assets. |
(a) | | Variable rate security. Interest rate disclosed is that which is in effect at September 30, 2013. |
(b) | | Security with “Call” features with resetting interest rates. Maturity dates disclosed are the final maturity dates. |
(c) | | Exempt from registration under Rule 144A of the Securities Act of 1933. Under procedures approved by the Board of Trustees, such securities have been determined to be liquid by the investment adviser and may be resold, normally to qualified institutional buyers in transactions exempt from registration. Total market value of Rule 144A securities amounts to $1,252,500,206, which represents approximately 12.9% of net assets as of September 30, 2013. |
(d) | | Pay-in-kind securities. |
(e) | | Security with “Put” features and resetting interest rates. Maturity dates disclosed are the puttable dates. Interest rate disclosed is that which is in effect at September 30, 2013. |
(f) | | TBA (To Be Announced) Securities are purchased on a forward commitment basis with an approximate principal amount and no defined maturity date. The actual principal and maturity date will be determined upon settlement when the specific mortgage pools are assigned. Total market value of TBA securities (excluding forward sales contracts, if any) amounts to $216,030,625 which represents approximately 2.2% of net assets as of September 30, 2013. |
(g) | | Coupon increases periodically based upon a predetermined schedule. Stated interest rate in effect at September 30, 2013. |
(h) | | Guaranteed by a foreign government until maturity. |
(i) | | Issued with a zero coupon. Income is recognized through the accretion of discount. |
(j) | | A portion of this security is segregated as collateral for initial margin requirements on futures transactions. |
(k) | | Senior Term Loans often require prepayments from excess cash flows or permit the borrower to repay at its election. The degree to which borrowers repay, whether as a contractual requirement or at their election, cannot be predicted with accuracy. As a result, the actual remaining maturity may be substantially less than the stated maturities shown. The stated interest rate represents the weighted average interest rate of all contracts within the senior loan facility at September 30, 2013. Senior Term Loans typically have rates of interest which are predetermined either daily, monthly, quarterly or semi-annually by reference to a base lending rate, plus a premium. These base lending rates are primarily the London-Interbank Offered Rate (“LIBOR”), and secondarily the prime rate offered by one or more major United States banks (the “Prime Rate”) and the certificate of deposit (“CD”) rate or other base lending rates used by commercial lenders. |
| | |
|
Currency Abbreviations: |
AUD | | —Australian Dollar |
BRL | | —Brazilian Real |
CAD | | —Canadian Dollar |
CHF | | —Swiss Franc |
CLP | | —Chilean Peso |
CZK | | —Czech Koruna |
DOP | | —Dominican Peso |
EUR | | —Euro |
GBP | | —British Pound |
HUF | | —Hungarian Forint |
IDR | | —Indonesian Rupiah |
ILS | | —Israeli Shekel |
JPY | | —Japanese Yen |
KRW | | —South Korean Won |
MXN | | —Mexican Peso |
MYR | | —Malaysian Ringgit |
NOK | | —Norwegian Krone |
NZD | | —New Zealand Dollar |
PHP | | —Philippine Peso |
PLN | | —Polish Zloty |
RUB | | —Russian Ruble |
SEK | | —Swedish Krona |
SGD | | —Singapore Dollar |
TRY | | —Turkish Lira |
TWD | | —Taiwan Dollar |
USD | | —U.S. Dollar |
ZAR | | —South African Rand |
| | |
Investment Abbreviations: |
AUDOR | | —Australian Dollar Offered Rate |
BP | | —British Pound Offered Rate |
CDO | | —Collateralized Debt Obligation |
CDOR | | —Canadian Dollar Offered Rate |
CHFOR | | —Swiss Franc Offered Rate |
CLO | | —Collateralized Loan Obligation |
EURO | | —Euro Offered Rate |
FHLMC | | —Federal Home Loan Mortgage Corp. |
FNMA | | —Federal National Mortgage Association |
FREMF | | —Freddie Mac Multi Family |
GNMA | | —Government National Mortgage Association |
GO | | —General Obligation |
JYOR | | —Japanese Yen Offered Rate |
KLIBOR | | —Kuala Lumpur Interbank Offered Rate |
KWCDC | | —South Korean Won Certificate of Deposit |
LIBOR | | —London Interbank Offered Rate |
NIBOR | | —Norwegian Interbank Offered Rate |
NZDOR | | —New Zealand Dollar Offered Rate |
OTC | | —Over the Counter |
RB | | —Revenue Bond |
REMIC | | —Real Estate Mortgage Investment Conduit |
STIBOR | | —Stockholm Interbank Offered Rate |
STRIPS | | —Separate Trading of Registered Interest and Principal of Securities |
TIIE | | —La Tasa de Interbank Equilibrium Interest Rate |
|
| | |
| 92 | | The accompanying notes are an integral part of these financial statements. |
GOLDMAN SACHS STRATEGIC INCOME FUND
|
| ADDITIONAL INVESTMENT INFORMATION |
UNFUNDED LOAN COMMITMENTS — At September 30, 2013, the Fund had unfunded loan commitments which could be extended at the option of the borrowers, pursuant to the following loan agreements:
| | | | | | | | | | |
| Borrower | | Principal Amount | | Current Value | | | Unrealized Gain (Loss) | |
| | | |
Tenet Healthcare Corp., due 06/24/14 | | $22,500,000 | | $ | 22,500,000 | | | $ | — | |
FORWARD FOREIGN CURRENCY EXCHANGE CONTRACTS — At September 30, 2013, the Fund had the following forward foreign currency exchange contracts:
FORWARD FOREIGN CURRENCY EXCHANGE CONTRACTS WITH UNREALIZED GAIN
| | | | | | | | | | | | | | |
| Counterparty | | Contracts to
Buy/Sell | | Settlement
Date | | | Current
Value | | | Unrealized
Gain | |
Bank of America Securities LLC | | CZK/EUR | | | 12/18/13 | | | $ | 26,241,259 | | | $ | 8,867 | |
| | EUR/USD | | | 12/18/13 | | | | 71,330,272 | | | | 1,115,775 | |
| | HUF/EUR | | | 12/18/13 | | | | 26,254,132 | | | | 26,216 | |
| | PLN/USD | | | 12/18/13 | | | | 96,336,703 | | | | 504,703 | |
Barclays Bank PLC | | EUR/USD | | | 12/18/13 | | | | 46,547,688 | | | | 719,354 | |
| | GBP/EUR | | | 12/18/13 | | | | 94,785,435 | | | | 587,536 | |
| | HUF/EUR | | | 12/18/13 | | | | 24,276,513 | | | | 127,467 | |
| | NOK/USD | | | 12/18/13 | | | | 31,415,248 | | | | 383,408 | |
| | USD/BRL | | | 10/17/13 | | | | 6,822,479 | | | | 15,850 | |
| | USD/MYR | | | 10/11/13 | | | | 45,292,097 | | | | 294,903 | |
| | USD/PHP | | | 10/17/13 | | | | 8,630,726 | | | | 178,274 | |
Citibank NA | | EUR/USD | | | 12/18/13 | | | | 395,988,215 | | | | 4,857,909 | |
| | GBP/EUR | | | 12/18/13 | | | | 50,496,122 | | | | 26,125 | |
| | MXN/USD | | | 12/18/13 | | | | 24,377,667 | | | | 153,504 | |
| | NZD/USD | | | 12/18/13 | | | | 24,120,181 | | | | 308,226 | |
| | PHP/USD | | | 10/11/13 | | | | 22,380,649 | | | | 168,649 | |
| | RUB/USD | | | 10/07/13 | | | | 22,397,278 | | | | 715,278 | |
| | USD/IDR | | | 10/24/13 | | | | 22,646,193 | | | | 502,807 | |
| | USD/RUB | | | 10/10/13 | | | | 23,105,189 | | | | 75,811 | |
| | USD/RUB | | | 10/24/13 | | | | 25,195,051 | | | | 471,949 | |
Credit Suisse International (London) | | RUB/USD | | | 10/07/13 | | | | 22,464,440 | | | | 782,440 | |
| | RUB/USD | | | 10/10/13 | | | | 91,777,203 | | | | 2,736,203 | |
| | USD/RUB | | | 10/17/13 | | | | 47,760,144 | | | | 155,856 | |
Deutsche Bank AG (London) | | GBP/USD | | | 10/24/13 | | | | 10,174,006 | | | | 89,856 | |
| | ILS/USD | | | 12/18/13 | | | | 24,493,691 | | | | 35,691 | |
| | MYR/USD | | | 10/03/13 | | | | 42,552,921 | | | | 431,921 | |
| | TWD/USD | | | 10/15/13 | | | | 22,977,882 | | | | 79,882 | |
| | USD/MXN | | | 12/18/13 | | | | 24,834,084 | | | | 273,916 | |
HSBC Bank PLC | | EUR/SEK | | | 12/18/13 | | | | 26,110,783 | | | | 30,344 | |
| | GBP/USD | | | 10/24/13 | | | | 216,025,604 | | | | 2,630,905 | |
| | KRW/USD | | | 10/23/13 | | | | 24,080,642 | | | | 122,642 | |
| | MYR/USD | | | 10/03/13 | | | | 37,299,009 | | | | 610,009 | |
| | MYR/USD | | | 10/11/13 | | | | 45,192,739 | | | | 671,739 | |
| | USD/MXN | | | 10/30/13 | | | | 78,104,611 | | | | 877,323 | |
JPMorgan Securities, Inc. | | EUR/NOK | | | 12/18/13 | | | | 88,531,158 | | | | 1,663,106 | |
| | EUR/USD | | | 10/25/13 | | | | 12,466,881 | | | | 261,393 | |
| | EUR/USD | | | 12/18/13 | | | | 96,992,391 | | | | 1,125,767 | |
| | JPY/USD | | | 12/18/13 | | | | 72,068,172 | | | | 235,172 | |
| | USD/TRY | | | 12/18/13 | | | | 25,382,320 | | | | 32,448 | |
Morgan Stanley Capital Services, Inc. | | HUF/EUR | | | 12/18/13 | | | | 24,276,513 | | | | 133,878 | |
| | RUB/USD | | | 10/15/13 | | | | 46,531,297 | | | | 734,297 | |
| | |
| The accompanying notes are an integral part of these financial statements. | | 93 |
GOLDMAN SACHS STRATEGIC INCOME FUND
Schedule of Investments (continued)
September 30, 2013 (Unaudited)
|
| ADDITIONAL INVESTMENT INFORMATION (continued) |
FORWARD FOREIGN CURRENCY EXCHANGE CONTRACTS WITH UNREALIZED GAIN (continued)
| | | | | | | | | | | | | | |
| Counterparty | | Contracts to
Buy/Sell | | Settlement
Date | | | Current
Value | | | Unrealized
Gain | |
Morgan Stanley Capital Services, Inc. (continued) | | USD/MXN | | | 12/18/13 | | | $ | 43,396,221 | | | $ | 722,779 | |
Royal Bank of Canada | | BRL/USD | | | 10/07/13 | | | | 23,059,658 | | | | 1,377,658 | |
| | BRL/USD | | | 10/11/13 | | | | 23,139,712 | | | | 879,712 | |
| | BRL/USD | | | 10/18/13 | | | | 24,426,672 | | | | 468,672 | |
| | EUR/USD | | | 10/25/13 | | | | 12,693,435 | | | | 21,411 | |
| | MXN/USD | | | 12/18/13 | | | | 22,404,656 | | | | 144,656 | |
Royal Bank of Scotland PLC | | GBP/USD | | | 12/18/13 | | | | 28,362,891 | | | | 733,595 | |
Standard Chartered Bank | | GBP/USD | | | 12/18/13 | | | | 131,603,793 | | | | 4,601,519 | |
| | SGD/USD | | | 12/18/13 | | | | 24,081,607 | | | | 123,607 | |
| | USD/IDR | | | 10/24/13 | | | | 15,220,877 | | | | 993,937 | |
State Street Bank | | AUD/USD | | | 12/18/13 | | | | 87,694,783 | | | | 1,894,147 | |
| | BRL/USD | | | 10/15/13 | | | | 55,567,281 | | | | 241,197 | |
| | GBP/EUR | | | 12/18/13 | | | | 47,226,959 | | | | 39,398 | |
| | JPY/USD | | | 12/18/13 | | | | 104,854,428 | | | | 137,428 | |
| | MXN/USD | | | 12/18/13 | | | | 22,434,007 | | | | 174,007 | |
| | USD/MXN | | | 12/18/13 | | | | 43,421,435 | | | | 341,565 | |
UBS AG (London) | | BRL/USD | | | 10/18/13 | | | | 24,394,287 | | | | 436,287 | |
| | MYR/USD | | | 10/11/13 | | | | 22,341,138 | | | | 81,138 | |
| | PHP/USD | | | 10/07/13 | | | | 44,177,513 | | | | 814,513 | |
| | PHP/USD | | | 10/11/13 | | | | 22,996,844 | | | | 98,844 | |
| | TWD/USD | | | 10/11/13 | | | | 44,572,816 | | | | 51,816 | |
| | USD/IDR | | | 11/19/13 | | | | 36,060,751 | | | | 2,825,249 | |
| | USD/ZAR | | | 12/18/13 | | | | 40,186,177 | | | | 841,823 | |
Westpac Banking Corp. | | AUD/USD | | | 12/18/13 | | | | 44,815,230 | | | | 568,403 | |
| | NZD/AUD | | | 12/18/13 | | | | 23,213,671 | | | | 280,312 | |
| | USD/AUD | | | 12/18/13 | | | | 132,964,440 | | | | 505,087 | |
| | | USD/MYR | | | 10/23/13 | | | | 46,988,925 | | | | 574,120 | |
| TOTAL | | | $ | 44,930,279 | |
FORWARD FOREIGN CURRENCY EXCHANGE CONTRACTS WITH UNREALIZED LOSS
| | | | | | | | | | | | | | |
| Counterparty | | Contracts to
Buy/Sell | | Settlement
Date | | | Current
Value | | | Unrealized
Loss | |
Bank of America Securities LLC | | CZK/EUR | | | 12/18/13 | | | $ | 19,221,218 | | | $ | (32,575 | ) |
| | EUR/PLN | | | 12/18/13 | | | | 45,473,331 | | | | (634,647 | ) |
| | HUF/EUR | | | 12/18/13 | | | | 25,238,589 | | | | (138,387 | ) |
| | TRY/USD | | | 12/18/13 | | | | 48,519,530 | | | | (1,322,470 | ) |
| | USD/EUR | | | 12/18/13 | | | | 101,003,070 | | | | (1,353,703 | ) |
| | USD/ILS | | | 12/18/13 | | | | 46,868,924 | | | | (516,825 | ) |
| | USD/MYR | | | 10/03/13 | | | | 21,569,831 | | | | (190,831 | ) |
Barclays Bank PLC | | EUR/GBP | | | 12/18/13 | | | | 26,549,681 | | | | (33,060 | ) |
| | EUR/HUF | | | 12/18/13 | | | | 7,520,183 | | | | (36,018 | ) |
| | MXN/USD | | | 12/18/13 | | | | 24,172,717 | | | | (748,283 | ) |
| | NOK/EUR | | | 12/18/13 | | | | 23,545,823 | | | | (737,472 | ) |
| | USD/BRL | | | 10/17/13 | | | | 7,760,898 | | | | (640,179 | ) |
| | USD/BRL | | | 10/18/13 | | | | 14,184,832 | | | | (44,832 | ) |
| | USD/TRY | | | 12/18/13 | | | | 23,067,698 | | | | (169,698 | ) |
| | USD/ZAR | | | 12/18/13 | | | | 33,589,211 | | | | (67,211 | ) |
| | ZAR/USD | | | 12/18/13 | | | | 96,258,421 | | | | (907,579 | ) |
BNP Paribas SA | | EUR/GBP | | | 12/18/13 | | | | 136,171,473 | | | | (1,171,001 | ) |
| | USD/JPY | | | 12/18/13 | | | | 90,471,374 | | | | (806,309 | ) |
| | |
| 94 | | The accompanying notes are an integral part of these financial statements. |
GOLDMAN SACHS STRATEGIC INCOME FUND
|
| ADDITIONAL INVESTMENT INFORMATION (continued) |
FORWARD FOREIGN CURRENCY EXCHANGE CONTRACTS WITH UNREALIZED LOSS (continued)
| | | | | | | | | | | | | | |
| Counterparty | | Contracts to
Buy/Sell | | Settlement
Date | | | Current
Value | | | Unrealized
Loss | |
Citibank NA | | EUR/GBP | | | 12/18/13 | | | $ | 22,666,996 | | | $ | (167,143 | ) |
| | MYR/USD | | | 10/23/13 | | | | 49,564,954 | | | | (1,523,046 | ) |
| | PHP/USD | | | 10/17/13 | | | | 47,823,338 | | | | (92,662 | ) |
| | RUB/USD | | | 10/15/13 | | | | 47,846,370 | | | | (789,544 | ) |
| | RUB/USD | | | 10/17/13 | | | | 47,877,183 | | | | (38,817 | ) |
| | TRY/USD | | | 12/18/13 | | | | 24,096,548 | | | | (823,452 | ) |
| | USD/GBP | | | 12/18/13 | | | | 118,847,470 | | | | (2,866,065 | ) |
| | USD/JPY | | | 12/18/13 | | | | 24,924,965 | | | | (3,965 | ) |
| | USD/MXN | | | 12/18/13 | | | | 19,695,025 | | | | (71,025 | ) |
| | USD/MYR | | | 10/03/13 | | | | 21,517,369 | | | | (138,369 | ) |
| | USD/MYR | | | 10/18/13 | | | | 39,757,037 | | | | (79,037 | ) |
| | USD/RUB | | | 10/10/13 | | | | 37,892,723 | | | | (848,723 | ) |
| | USD/RUB | | | 10/21/13 | | | | 26,458,993 | | | | (6,993 | ) |
| | USD/TRY | | | 12/18/13 | | | | 22,307,938 | | | | (600,938 | ) |
Credit Suisse International (London) | | CLP/USD | | | 10/16/13 | | | | 15,791,607 | | | | (32,340 | ) |
| | CLP/USD | | | 10/25/13 | | | | 24,930,099 | | | | (423,901 | ) |
| | EUR/CHF | | | 12/18/13 | | | | 23,816,455 | | | | (270,632 | ) |
| | RUB/USD | | | 10/21/13 | | | | 49,244,697 | | | | (1,297,303 | ) |
| | USD/JPY | | | 12/18/13 | | | | 44,048,015 | | | | (390,015 | ) |
| | USD/RUB | | | 10/07/13 | | | | 45,120,593 | | | | (1,462,593 | ) |
| | USD/RUB | | | 10/15/13 | | | | 23,373,512 | | | | (238,512 | ) |
Deutsche Bank AG (London) | | AUD/USD | | | 12/18/13 | | | | 71,393,269 | | | | (26,819 | ) |
| | ILS/USD | | | 12/18/13 | | | | 21,983,718 | | | | (205,282 | ) |
| | MXN/USD | | | 10/30/13 | | | | 8,172,327 | | | | (199,052 | ) |
| | MYR/USD | | | 10/18/13 | | | | 47,536,414 | | | | (379,586 | ) |
| | MYR/USD | | | 10/23/13 | | | | 24,101,370 | | | | (817,630 | ) |
| | USD/CNH | | | 12/18/13 | | | | 113,517,650 | | | | (35,701 | ) |
| | USD/CNH | | | 01/08/14 | | | | 69,772,866 | | | | (898,866 | ) |
| | USD/EUR | | | 10/25/13 | | | | 10,683,613 | | | | (36,815 | ) |
| | USD/EUR | | | 12/18/13 | | | | 45,465,183 | | | | (150,543 | ) |
| | USD/MXN | | | 10/30/13 | | | | 34,345,224 | | | | (321,938 | ) |
| | USD/PHP | | | 10/17/13 | | | | 10,653,611 | | | | (8,611 | ) |
| | USD/PLN | | | 12/18/13 | | | | 39,993,198 | | | | (608,852 | ) |
| | USD/RUB | | | 10/15/13 | | | | 12,590,104 | | | | (125,057 | ) |
| | USD/RUB | | | 10/17/13 | | | | 4,193,821 | | | | (95,832 | ) |
HSBC Bank PLC | | USD/AUD | | | 12/18/13 | | | | 22,052,616 | | | | (293,480 | ) |
| | USD/BRL | | | 10/17/13 | | | | 16,614,709 | | | | (299,314 | ) |
| | USD/MYR | | | 10/03/13 | | | | 13,794,463 | | | | (225,463 | ) |
| | USD/SEK | | | 12/18/13 | | | | 66,984,054 | | | | (924,947 | ) |
JPMorgan Securities, Inc. | | MXN/USD | | | 12/18/13 | | | | 94,536,206 | | | | (1,295,794 | ) |
| | NOK/EUR | | | 12/18/13 | | | | 67,983,980 | | | | (1,367,895 | ) |
| | USD/BRL | | | 10/17/13 | | | | 52,712,057 | | | | (2,333,857 | ) |
| | USD/EUR | | | 10/25/13 | | | | 364,021,063 | | | | (7,632,426 | ) |
| | USD/EUR | | | 12/18/13 | | | | 170,723,116 | | | | (826,075 | ) |
| | USD/HUF | | | 12/18/13 | | | | 100,194,920 | | | | (2,893,705 | ) |
| | USD/IDR | | | 10/07/13 | | | | 3,237,908 | | | | (31,283 | ) |
| | USD/MXN | | | 10/30/13 | | | | 70,938,714 | | | | (32,953 | ) |
| | USD/RUB | | | 10/15/13 | | | | 10,687,081 | | | | (131,081 | ) |
| | USD/TRY | | | 12/18/13 | | | | 79,250,562 | | | | (1,456,489 | ) |
Morgan Stanley Capital Services, Inc. | | MXN/JPY | | | 12/18/13 | | | | 25,404,146 | | | | (989,891 | ) |
| | NZD/USD | | | 12/18/13 | | | | 49,635,485 | | | | (631,538 | ) |
| | USD/BRL | | | 10/17/13 | | | | 9,088,075 | | | | (284,878 | ) |
| | USD/BRL | | | 11/04/13 | | | | 22,434,297 | | | | (176,297 | ) |
| | |
| The accompanying notes are an integral part of these financial statements. | | 95 |
GOLDMAN SACHS STRATEGIC INCOME FUND
Schedule of Investments (continued)
September 30, 2013 (Unaudited)
|
| ADDITIONAL INVESTMENT INFORMATION (continued) |
FORWARD FOREIGN CURRENCY EXCHANGE CONTRACTS WITH UNREALIZED LOSS (continued)
| | | | | | | | | | | | | | |
| Counterparty | | Contracts to
Buy/Sell | | Settlement
Date | | | Current
Value | | | Unrealized
Loss | |
Morgan Stanley Capital Services, Inc. (continued) | | USD/NZD | | | 12/18/13 | | | $ | 36,112,126 | | | $ | (1,328,416 | ) |
Royal Bank of Canada | | CAD/USD | | | 12/18/13 | | | | 122,964,909 | | | | (765,091 | ) |
| | USD/BRL | | | 10/15/13 | | | | 22,621,712 | | | | (614,712 | ) |
| | USD/BRL | | | 10/17/13 | | | | 14,178,226 | | | | (681,113 | ) |
| | USD/BRL | | | 10/18/13 | | | | 18,564,693 | | | | (329,693 | ) |
| | USD/CAD | | | 12/18/13 | | | | 141,227,377 | | | | (242,863 | ) |
| | USD/GBP | | | 10/24/13 | | | | 458,857,139 | | | | (8,057,776 | ) |
Royal Bank of Scotland PLC | | TRY/USD | | | 12/18/13 | | | | 132,493,137 | | | | (2,928,723 | ) |
| | USD/GBP | | | 12/18/13 | | | | 53,033,590 | | | | (170,707 | ) |
| | USD/TRY | | | 12/18/13 | | | | 23,435,717 | | | | (286,717 | ) |
Standard Chartered Bank | | USD/GBP | | | 12/18/13 | | | | 52,253,732 | | | | (647,631 | ) |
| | USD/SGD | | | 12/18/13 | | | | 21,774,068 | | | | (374,820 | ) |
| | ZAR/USD | | | 12/18/13 | | | | 24,240,881 | | | | (1,030,119 | ) |
State Street Bank | | MXN/USD | | | 12/18/13 | | | | 48,704,290 | | | | (1,137,710 | ) |
| | NOK/EUR | | | 12/18/13 | | | | 50,346,683 | | | | (1,598,734 | ) |
| | USD/AUD | | | 12/18/13 | | | | 22,381,164 | | | | (177,519 | ) |
| | USD/CZK | | | 12/18/13 | | | | 48,039,593 | | | | (1,026,831 | ) |
| | USD/EUR | | | 12/18/13 | | | | 26,461,819 | | | | (4,604 | ) |
| | USD/JPY | | | 12/18/13 | | | | 45,548,410 | | | | (848,410 | ) |
| | USD/TRY | | | 12/18/13 | | | | 58,402,081 | | | | (193,859 | ) |
UBS AG (London) | | RUB/USD | | | 10/21/13 | | | | 4,497,801 | | | | (125,199 | ) |
| | RUB/USD | | | 10/24/13 | | | | 50,620,162 | | | | (712,838 | ) |
| | USD/AUD | | | 12/18/13 | | | | 23,220,168 | | | | (172,165 | ) |
| | USD/BRL | | | 10/07/13 | | | | 23,057,911 | | | | (1,240,911 | ) |
| | USD/BRL | | | 10/11/13 | | | | 23,000,504 | | | | (740,504 | ) |
| | USD/BRL | | | 10/17/13 | | | | 7,897,912 | | | | (794,067 | ) |
| | USD/CHF | | | 12/18/13 | | | | 98,413,243 | | | | (2,858,511 | ) |
| | USD/IDR | | | 10/07/13 | | | | 15,575,496 | | | | (252,525 | ) |
| | USD/JPY | | | 11/08/13 | | | | 12,559,675 | | | | (23,932 | ) |
| | USD/ZAR | | | 12/18/13 | | | | 89,852,143 | | | | (579,143 | ) |
| | ZAR/USD | | | 12/18/13 | | | | 69,860,210 | | | | (1,204,790 | ) |
Westpac Banking Corp. | | AUD/USD | | | 12/18/13 | | | | 96,761,991 | | | | (1,123,229 | ) |
| | EUR/USD | | | 12/18/13 | | | | 47,838,574 | | | | (46,651 | ) |
| | USD/AUD | | | 12/18/13 | | | | 22,322,694 | | | | (115,242 | ) |
| | | USD/EUR | | | 12/18/13 | | | | 28,077,457 | | | | (40,679 | ) |
| TOTAL | | | $ | (79,930,539 | ) |
FORWARD SALES CONTRACTS — At September 30, 2013, the Fund had the following forward sales contracts:
| | | | | | | | | | | | | | | | |
| Description | | Interest
Rate | | | Maturity
Date(f) | | Settlement
Date | | Principal
Amount | | | Value | |
FNMA | | | 4.500 | % | | TBA-30yr | | 10/10/2013 | | $ | (3,000,000 | ) | | $ | (3,204,375 | ) |
FNMA | | | 5.000 | | | TBA-30yr | | 10/10/2013 | | | (16,000,000 | ) | | | (17,352,499 | ) |
| TOTAL (Proceeds Receivable: $20,296,875) | | | $ | (20,556,874 | ) |
FUTURES CONTRACTS — At September 30, 2013, the Fund had the following futures contracts:
| | | | | | | | | | | | | | |
| Type | | Number of
Contracts
Long (Short) | | | Expiration
Date | | Current
Value | | | Unrealized
Gain (Loss) | |
French 10 Year Government Bonds | | | 228 | | | December 2013 | | $ | 40,866,528 | | | $ | 668,325 | |
Italian 10 Year Government Bonds | | | (220 | ) | | December 2013 | | | (32,852,079 | ) | | | 19,702 | |
Ultra Long U.S. Treasury Bonds | | | (4,249 | ) | | December 2013 | | | (603,756,344 | ) | | | (11,481,280 | ) |
10 Year German Euro-Bund | | | (85 | ) | | December 2013 | | | (16,156,417 | ) | | | (147,508 | ) |
| | |
| 96 | | The accompanying notes are an integral part of these financial statements. |
GOLDMAN SACHS STRATEGIC INCOME FUND
|
| ADDITIONAL INVESTMENT INFORMATION (continued) |
FUTURES CONTRACTS (continued)
| | | | | | | | | | | | | | |
| Type | | Number of
Contracts
Long (Short) | | | Expiration
Date | | Current
Value | | | Unrealized
Gain (Loss) | |
2 Year U.S. Treasury Notes | | | (2,873 | ) | | December 2013 | | $ | (632,823,143 | ) | | $ | (2,623,049 | ) |
5 Year U.S. Treasury Notes | | | (18,477 | ) | | December 2013 | | | (2,236,583,109 | ) | | | (6,922,412 | ) |
10 Year U.S. Treasury Notes | | | (3,361 | ) | | December 2013 | | | (424,798,891 | ) | | | (481,247 | ) |
20 Year U.S. Treasury Bonds | | | 1,039 | | | December 2013 | | | 138,576,625 | | | | 329,979 | |
| TOTAL | | | $ | (20,637,490 | ) |
SWAP CONTRACTS — At September 30, 2013, the Fund had the following swap contracts:
OVER THE COUNTER INTEREST RATE SWAP CONTRACTS
| | | | | | | | | | | | | | | | | | | | | | | | |
| | | | | | | | | | | | Rates Exchanged | | Market Value | |
| Counterparty | | Notional
Amount
(000s) | | | Termination
Date | | | Payments
Received | | Payments
Made | | Upfront
Payments
Made (Received) | | | Unrealized
Gain (Loss) | |
Bank of America Securities LLC | | | BRL | | | | 179,170 | | | | 01/02/15 | | | 9.950% | | 1 month Brazilian
Interbank Deposit
Average | | $ | — | | | $ | (87,742 | ) |
| | | | | | | 224,170 | | | | 01/04/16 | | | 10.390 | | 1 month Brazilian
Interbank Deposit
Average | | | — | | | | (718,835 | ) |
| | | CAD | | | | 178,180 | (a) | | | 12/20/22 | | | 3.000 | | 6 month CDOR | | | (6,707,873 | ) | | | 1,048,234 | |
| | | KRW | | | | 62,976,210 | | | | 07/25/23 | | | 3 month KWCDC | | 3.352% | | | — | | | | (174,729 | ) |
| | | | | | | 52,907,090 | (a) | | | 09/12/23 | | | 3 month KWCDC | | 3.805 | | | — | | | | (243,394 | ) |
| | | MYR | | | | 106,220 | (a) | | | 09/18/23 | | | 3 month KLIBOR | | 4.945 | | | — | | | | 53,519 | |
| | | | | | | 204,060 | (a) | | | 09/19/23 | | | 3 month KLIBOR | | 4.680 | | | — | | | | 708,823 | |
| | | CAD | | | | 34,200 | (a) | | | 10/03/25 | | | 2.740 | | 6 month CDOR | | | — | | | | (2,580,912 | ) |
| | | | | | | 12,300 | (a) | | | 10/06/25 | | | 2.790 | | 6 month CDOR | | | — | | | | (879,543 | ) |
| | | | | | | 29,900 | (a) | | | 11/26/25 | | | 2.820 | | 6 month CDOR | | | — | | | | (2,148,182 | ) |
| | | | | | | 24,400 | (a) | | | 12/22/25 | | | 2.910 | | 6 month CDOR | | | — | | | | (1,608,860 | ) |
| | | | | | | 19,600 | (a) | | | 01/02/26 | | | 2.960 | | 6 month CDOR | | | — | | | | (1,225,934 | ) |
| | | | | | | 17,100 | (a) | | | 02/09/26 | | | 3.100 | | 6 month CDOR | | | — | | | | (909,852 | ) |
| | | | | | | 13,600 | (a) | | | 05/04/26 | | | 2.810 | | 6 month CDOR | | | — | | | | (1,094,484 | ) |
| | | | | | | 38,200 | (a) | | | 06/29/26 | | | 3.725 | | 6 month CDOR | | | — | | | | (403,146 | ) |
| | | | | | | 35,300 | (a) | | | 07/13/26 | | | 3.790 | | 6 month CDOR | | | — | | | | (217,276 | ) |
| | | | | | | 39,300 | (a) | | | 07/23/26 | | | 3.670 | | 6 month CDOR | | | — | | | | (637,362 | ) |
| | | | | | | 2,700 | | | | 06/27/33 | | | 6 month CDOR | | 3.475 | | | — | | | | 34,699 | |
| | | | | | | 19,500 | (a) | | | 10/03/35 | | | 6 month CDOR | | 2.825 | | | — | | | | 2,863,241 | |
| | | | | | | 7,000 | (a) | | | 10/04/35 | | | 6 month CDOR | | 2.875 | | | — | | | | 980,416 | |
| | | | | | | 17,300 | (a) | | | 11/26/35 | | | 6 month CDOR | | 2.910 | | | — | | | | 2,367,461 | |
| | | | | | | 14,300 | (a) | | | 12/20/35 | | | 6 month CDOR | | 3.000 | | | — | | | | 1,793,556 | |
| | | | | | | 11,400 | (a) | | | 01/02/36 | | | 6 month CDOR | | 3.045 | | | — | | | | 1,365,213 | |
| | | | | | | 10,000 | (a) | | | 02/07/36 | | | 6 month CDOR | | 3.212 | | | — | | | | 983,409 | |
| | | | | | | 7,900 | (a) | | | 05/02/36 | | | 6 month CDOR | | 2.965 | | | — | | | | 1,053,129 | |
| | | | | | | 22,500 | (a) | | | 06/27/36 | | | 6 month CDOR | | 3.780 | | | — | | | | 602,750 | |
| | | | | | | 21,300 | (a) | | | 07/14/36 | | | 6 month CDOR | | 3.820 | | | — | | | | 467,212 | |
| | | | | | | 23,400 | (a) | | | 07/23/36 | | | 6 month CDOR | | 3.740 | | | — | | | | 768,741 | |
| | | | | | | 4,700 | | | | 06/22/43 | | | 6 month CDOR | | 3.230 | | | — | | | | 252,123 | |
Barclays Bank PLC | | | BRL | | | | 32,120 | | | | 01/04/16 | | | 10.300 | | 1 month Brazilian
Interbank Deposit
Average | | | — | | | | (128,739 | ) |
| | | | | | | 261,850 | (a) | | | 01/04/16 | | | 11.160 | | 1 month Brazilian
Interbank Deposit
Average | | | — | | | | 377,938 | |
| | |
| The accompanying notes are an integral part of these financial statements. | | 97 |
GOLDMAN SACHS STRATEGIC INCOME FUND
Schedule of Investments (continued)
September 30, 2013 (Unaudited)
|
| ADDITIONAL INVESTMENT INFORMATION (continued) |
OVER THE COUNTER INTEREST RATE SWAP CONTRACTS (continued)
| | | | | | | | | | | | | | | | | | | | | | |
| | | | | | | | | | | Rates Exchanged | | Market Value | |
| Counterparty | | Notional
Amount
(000s) | | | Termination
Date | | | Payments
Received | | Payments
Made | | Upfront
Payments
Made (Received) | | | Unrealized
Gain (Loss) | |
Barclays Bank PLC (continued) | | NOK | | | 575,130 | (a) | | | 12/20/22 | | | 4.000% | | 6 month NIBOR | | $ | (719,412 | ) | | $ | 526,661 | |
| | | | | 773,070 | (a) | | | 12/20/22 | | | 6 month NIBOR | | 4.000% | | | (378,682 | ) | | | 481,167 | |
| | KRW | | | 16,826,730 | | | | 05/10/23 | | | 3 month KWCDC | | 2.735 | | | — | | | | 760,641 | |
| | | | | 19,262,500 | | | | 05/22/23 | | | 3 month KWCDC | | 2.830 | | | — | | | | 732,271 | |
| | | | | 19,262,500 | | | | 05/22/23 | | | 3 month KWCDC | | 2.840 | | | — | | | | 717,203 | |
| | | | | 6,800,000 | | | | 08/09/23 | | | 3 month KWCDC | | 3.440 | | | — | | | | (64,449 | ) |
| | MYR | | | 31,310 | | | | 08/14/23 | | | 3 month KLIBOR | | 4.485 | | | — | | | | (275,865 | ) |
| | MXN | | | 193,210 | | | | 11/05/32 | | | 6.747 | | Mexico Interbank
TIIE 28 Days | | | (2,261 | ) | | | (1,613,396 | ) |
BNP Paribas SA | | NOK | | | 422,030 | (a) | | �� | 12/20/22 | | | 6 month NIBOR | | 4.000 | | | (11,037 | ) | | | 152,478 | |
Citibank NA | | BRL | | | 114,810 | | | | 01/04/16 | | | 10.09 | | 1 month Brazilian
Interbank Deposit
Average | | | — | | | | (668,918 | ) |
| | MYR | | | 112,250 | (a) | | | 09/18/18 | | | 3 month KLIBOR | | 3.830 | | | — | | | | (202,832 | ) |
| | | | | 42,800 | (a) | | | 09/24/18 | | | 3 month KLIBOR | | 3.785 | | | — | | | | (1,744 | ) |
| | NZD | | | 160,970 | (a) | | | 12/18/18 | | | 3 month NZDOR | | 3.500 | | | 2,451,153 | | | | 3,257,780 | |
| | CAD | | | 29,800 | (a) | | | 12/20/22 | | | 3.000 | | 6 month CDOR | | | (1,266,729 | ) | | | 320,173 | |
| | KRW | | | 98,915,810 | | | | 08/08/23 | | | 3 month KWCDC | | 3.450 | | | — | | | | (1,019,064 | ) |
| | | | | 8,854,260 | | | | 08/16/23 | | | 3 month KWCDC | | 3.485 | | | — | | | | (114,176 | ) |
| | NZD | | | 17,730 | (a) | | | 12/18/23 | | | 3 month NZDOR | | 4.000 | | | 616,032 | | | | 463,529 | |
| | $ | | | 40,900 | (a) | | | 02/18/26 | | | 3.145 | | 3 month LIBOR | | | — | | | | (2,192,980 | ) |
| | | | | 32,400 | (a) | | | 02/23/26 | | | 3.133 | | 3 month LIBOR | | | — | | | | (1,784,663 | ) |
| | | | | 29,500 | (a) | | | 02/24/26 | | | 3.125 | | 3 month LIBOR | | | — | | | | (1,646,587 | ) |
| | | | | 30,600 | (a) | | | 02/24/26 | | | 3.070 | | 3 month LIBOR | | | — | | | | (1,850,957 | ) |
Credit Suisse International (London) | | NZD | | | 81,300 | (a) | | | 12/18/18 | | | 3 month NZDOR | | 3.500 | | | 1,856,893 | | | | 1,026,478 | |
| | CAD | | | 91,100 | (a) | | | 12/20/22 | | | 3.000 | | 6 month CDOR | | | (3,914,207 | ) | | | 1,020,543 | |
| | NZD | | | 92,010 | (a) | | | 12/18/23 | | | 3 month NZDOR | | 4.000 | | | 2,230,185 | | | | 3,372,209 | |
Deutsche Bank Securities, Inc. | | BRL | | | 110,210 | | | | 01/02/15 | | | 8.150 | | 1 month Brazilian
Interbank Deposit
Average | | | — | | | | (1,035,509 | ) |
| | $ | | | 5,100 | | | | 02/27/15 | | | 3 month LIBOR | | 1.414 | | | — | | | | (80,701 | ) |
| | BRL | | | 31,760 | | | | 01/04/16 | | | 10.300 | | 1 month Brazilian
Interbank Deposit
Average | | | — | | | | (127,296 | ) |
| | | | | 76,700 | | | | 01/04/16 | | | 10.347 | | 1 month Brazilian
Interbank Deposit
Average | | | — | | | | (319,443 | ) |
| | $ | | | 112,200 | (a) | | | 10/30/17 | | | 1.530 | | 3 month LIBOR | | | — | | | | (881,757 | ) |
| | | | | 121,500 | (a) | | | 10/30/17 | | | 1.450 | | 3 month LIBOR | | | — | | | | (1,145,429 | ) |
| | MYR | | | 112,770 | (a) | | | 09/13/18 | | | 3 month KLIBOR | | 3.920 | | | — | | | | (353,602 | ) |
| | NOK | | | 641,050 | (a) | | | 12/20/22 | | | 6 month NIBOR | | 4.000 | | | 218,432 | | | | (3,587 | ) |
| | KRW | | | 19,262,510 | | | | 05/15/23 | | | 3 month KWCDC | | 2.815 | | | — | | | | 752,497 | |
| | MYR | | | 26,840 | | | | 08/14/23 | | | 3 month KLIBOR | | 4.490 | | | — | | | | (240,062 | ) |
| | KRW | | | 52,965,990 | | | | 08/28/23 | | | 3 month KWCDC | | 3.588 | | | — | | | | (1,102,666 | ) |
| | | | | 26,410,690 | (a) | | | 09/06/23 | | | 3 month KWCDC | | 3.570 | | | — | | | | (505,535 | ) |
| | MXN | | | 399,250 | (a) | | | 09/18/23 | | | 8.295 | | Mexico Interbank
TIIE 28 Days | | | — | | | | 27,857 | |
| | NZD | | | 74,970 | (a) | | | 12/18/23 | | | 3 month NZDOR | | 4.000 | | | 1,387,927 | | | | 3,176,919 | |
JPMorgan Securities, Inc. | | BRL | | | 83,100 | | | | 01/02/15 | | | 8.155 | | 1 month Brazilian
Interbank Deposit
Average | | | — | | | | (778,111 | ) |
| | |
| 98 | | The accompanying notes are an integral part of these financial statements. |
GOLDMAN SACHS STRATEGIC INCOME FUND
|
| ADDITIONAL INVESTMENT INFORMATION (continued) |
OVER THE COUNTER INTEREST RATE SWAP CONTRACTS (continued)
| | | | | | | | | | | | | | | | | | | | | | |
| | | | | | | | | | | Rates Exchanged | | Market Value | |
| Counterparty | | Notional
Amount
(000s) | | | Termination
Date | | | Payments
Received | | Payments
Made | | Upfront
Payments
Made (Received) | | | Unrealized
Gain (Loss) | |
JPMorgan Securities, Inc. (continued) | | BRL | | | 152,040 | | | | 01/02/15 | | | 8.220% | | 1 month Brazilian
Interbank Deposit
Average | | $ | — | | | $ | (1,355,432 | ) |
| | $ | | | 117,900 | (a) | | | 11/06/17 | | | 1.355 | | 3 month LIBOR | | | — | | | | (1,375,516 | ) |
| | BRL | | | 171,040 | | | | 01/04/21 | | | 10.527 | | 1 month Brazilian
Interbank Deposit
Average | | | — | | | | (2,565,404 | ) |
| | CAD | | | 77,760 | (a) | | | 12/20/22 | | | 3.000 | | 6 month CDOR | | | (3,144,738 | ) | | | 674,800 | |
| | NOK | | | 321,480 | (a) | | | 12/20/22 | | | 6 month NIBOR | | 4.000% | | | 420,364 | | | | (312,622 | ) |
| | NOK | | | 397,530 | (a) | | | 12/20/22 | | | 4.000 | | 3 month NIBOR | | | (568,800 | ) | | | 435,571 | |
| | KRW | | | 26,509,370 | | | | 08/14/23 | | | 3 month KWCDC | | 3.415 | | | — | | | | (195,411 | ) |
| | MYR | | | 34,420 | | | | 08/15/23 | | | 3 month KLIBOR | | 4.520 | | | — | | | | (334,945 | ) |
| | KRW | | | 11,159,200 | | | | 08/21/23 | | | 3 month KWCDC | | 3.563 | | | — | | | | (212,056 | ) |
| | | | | 80,085,470 | (a) | | | 09/13/23 | | | 3 month KWCDC | | 3.783 | | | — | | | | (314,239 | ) |
| | MYR | | | 64,380 | (a) | | | 09/26/23 | | | 3 month KLIBOR | | 4.330 | | | — | | | | (12,356 | ) |
| | NZD | | | 8,330 | (a) | | | 12/18/23 | | | 3 month NZDOR | | 4.000 | | | 181,903 | | | | 325,302 | |
| | $ | | | 28,400 | (a) | | | 02/18/26 | | | 3.110 | | 3 month LIBOR | | | — | | | | (1,607,247 | ) |
Morgan Stanley Capital Services, Inc. | | BRL | | | 86,640 | (a) | | | 01/04/16 | | | 11.215 | | 1 month Brazilian
Interbank Deposit
Average | | | — | | | | 149,573 | |
| | | | | 153,890 | | | | 01/04/16 | | | 10.190 | | 1 month Brazilian
Interbank Deposit
Average | | | — | | | | (761,121 | ) |
| | | | | 256,130 | (a) | | | 01/04/16 | | | 11.180 | | 1 month Brazilian
Interbank Deposit
Average | | | — | | | | 408,284 | |
| | NZD | | | 57,500 | (a) | | | 12/18/18 | | | 3 month NZDOR | | 3.500 | | | 1,829,765 | | | | 209,521 | |
| | NOK | | | 279,700 | (a) | | | 12/20/22 | | | 6 month NIBOR | | 4.000 | | | 404,657 | | | | (310,918 | ) |
| | KRW | | | 36,546,310 | | | | 06/27/23 | | | 6 month KWCDC | | 3.413 | | | — | | | | (241,611 | ) |
| | | | | 8,653,900 | | | | 08/16/23 | | | 6 month KWCDC | | 3.485 | | | — | | | | (111,593 | ) |
| | MYR | | | 198,250 | (a) | | | 09/19/23 | | | 3 month KLIBOR | | 4.699 | | | — | | | | 647,021 | |
| | | | | 116,840 | (a) | | | 09/20/23 | | | 3 month KLIBOR | | 4.802 | | | — | | | | 246,706 | |
| | NZD | | | 49,500 | (a) | | | 12/18/23 | | | 3 month NZDOR | | 4.000 | | | 2,625,343 | | | | 388,661 | |
| | $ | | | 112,300 | (a) | | | 02/18/26 | | | 3.130 | | 3 month LIBOR | | | — | | | | (6,164,495 | ) |
| | | | | 46,900 | (a) | | | 02/24/26 | | | 3.152 | | 3 month LIBOR | | | — | | | | (2,510,219 | ) |
| | | | | 113,900 | (a) | | | 03/09/26 | | | 3.120 | | 3 month LIBOR | | | — | | | | (6,520,251 | ) |
Royal Bank of Canada | | CAD | | | 198,170 | (a) | | | 12/20/22 | | | 3.000 | | 6 month CDOR | | | (4,008,697 | ) | | | (2,289,390 | ) |
| | | | | 5,500 | (a) | | | 10/06/25 | | | 2.780 | | 6 month CDOR | | | — | | | | (397,759 | ) |
| | | | | 76,100 | (a) | | | 05/11/26 | | | 3.000 | | 6 month CDOR | | | — | | | | (5,000,333 | ) |
| | | | | 35,600 | (a) | | | 06/25/26 | | | 3.780 | | 6 month CDOR | | | — | | | | (218,802 | ) |
| | | | | 37,900 | (a) | | | 07/13/26 | | | 3.761 | | 6 month CDOR | | | — | | | | (318,028 | ) |
| | | | | 42,800 | (a) | | | 07/24/26 | | | 3.750 | | 6 month CDOR | | | — | | | | (424,730 | ) |
| | | | | 43,100 | (a) | | | 07/27/26 | | | 3.810 | | 6 month CDOR | | | — | | | | (226,042 | ) |
| | | | | 42,900 | (a) | | | 07/30/26 | | | 3.820 | | 6 month CDOR | | | — | | | | (204,161 | ) |
| | | | | 3,200 | (a) | | | 10/04/35 | | | 6 month CDOR | | 2.860 | | | — | | | | 454,698 | |
| | | | | 44,400 | (a) | | | 05/12/36 | | | 6 month CDOR | | 3.130 | | | — | | | | 4,957,748 | |
| | | | | 21,400 | (a) | | | 06/25/36 | | | 6 month CDOR | | 3.820 | | | — | | | | 460,873 | |
| | | | | 22,900 | (a) | | | 07/11/36 | | | 6 month CDOR | | 3.800 | | | — | | | | 562,185 | |
| | | | | 25,700 | (a) | | | 07/24/36 | | | 6 month CDOR | | 3.808 | | | — | | | | 615,755 | |
| | | | | 26,000 | (a) | | | 07/25/36 | | | 6 month CDOR | | 3.862 | | | — | | | | 436,337 | |
| | | | | | 25,900 | (a) | | | 07/30/36 | | | 6 month CDOR | | 3.875 | | | — | | | | 396,399 | |
| TOTAL | | | | | | | | | | | | | | | | $ | (6,499,782 | ) | | $ | (21,174,696 | ) |
| | (a) | | Represents forward starting interest rate swaps whose effective dates of commencement of accruals and cash flows occur subsequent to September 30, 2013. |
| | |
| The accompanying notes are an integral part of these financial statements. | | 99 |
GOLDMAN SACHS STRATEGIC INCOME FUND
Schedule of Investments (continued)
September 30, 2013 (Unaudited)
|
| ADDITIONAL INVESTMENT INFORMATION (continued) |
CENTRALLY CLEARED INTEREST RATE SWAP CONTRACTS
| | | | | | | | | | | | | | | | |
| | | | | | Rates Exchanged | | Market Value | |
Notional Amount (000s) | | | Termination
Date | | Payments
Received | | Payments Made | | Upfront
Payments
Made (Received) | | | Unrealized
Gain (Loss) | |
| EUR | 5,100,000 | (a) | | 12/17/14 | | 0.600% | | 6 month EURO | | $ | 20,071 | | | $ | 3,021,935 | |
| | 4,485,000 | (a) | | 06/17/15 | | 0.750 | | 6 month EURO | | | 194,990 | | | | 2,606,390 | |
| | 1,811,130 | (a) | | 06/29/15 | | 0.850 | | 6 month EURO | | | 1,660,646 | | | | 4,213,190 | |
| NOK | 1,924,160 | (a) | | 06/30/15 | | 6 month NIBOR | | 2.000% | | | 196,781 | | | | (98,833 | ) |
| EUR | 2,021,050 | (a) | | 08/06/15 | | 0.750 | | 6 month EURO | | | 1,761,026 | | | | 1,179,582 | |
| | 2,343,000 | (a) | | 08/18/15 | | 0.800 | | 6 month EURO | | | 135,939 | | | | 4,544,799 | |
| JPY | 559,257,120 | (a) | | 08/18/15 | | 6 month JYOR | | 0.280 | | | 497,725 | | | | (1,754,553 | ) |
| AUD | 1,238,690 | (a) | | 09/07/15 | | 3.200 | | 6 month AUDOR | | | (88,334 | ) | | | 2,882,513 | |
| $ | 3,417,780 | (a) | | 09/28/15 | | 3 month LIBOR | | 0.650 | | | (498,342 | ) | | | (1,138,091 | ) |
| | 2,287,700 | (a) | | 12/18/15 | | 3 month LIBOR | | 0.500 | | | 8,254,863 | | | | (6,488,987 | ) |
| GBP | 150,190 | (a) | | 06/27/16 | | 1.650 | | 6 month BP | | | 203,452 | | | | 117,959 | |
| | 664,140 | (a) | | 07/18/16 | | 6 month BP | | 0.930 | | | 5,702,011 | | | | 941,077 | |
| CAD | 2,687,000 | (a) | | 07/25/16 | | 1.940 | | 6 month CDOR | | | (2,579,231 | ) | | | 7,052,738 | |
| $ | 1,883,700 | (a) | | 07/25/16 | | 3 month LIBOR | | 0.965 | | | 614,265 | | | | (4,586,047 | ) |
| | 261,400 | (a) | | 07/25/16 | | 3 month LIBOR | | 0.968 | | | 784 | | | | (571,237 | ) |
| EUR | 2,890,580 | (a) | | 07/27/16 | | 6 month EURO | | 1.100 | | | 1,588,110 | | | | (3,995,819 | ) |
| $ | 466,100 | (a) | | 12/19/16 | | 0.500 | | 3 month LIBOR | | | (6,347,204 | ) | | | 969,249 | |
| GBP | 503,680 | (a) | | 08/24/17 | | 6 month BP | | 2.120 | | | (217,209 | ) | | | (1,545,540 | ) |
| | 150,900 | | | 07/23/18 | | 6 month BP | | 1.100 | | | 4,579,361 | | | | 1,917,879 | |
| EUR | 2,430,720 | (a) | | 07/27/18 | | 1.600 | | 6 month EURO | | | (6,683,273 | ) | | | 8,518,201 | |
| $ | 245,820 | (a) | | 12/18/18 | | 1.000 | | 3 month LIBOR | | | (9,253,115 | ) | | | 1,131,959 | |
| EUR | 1,271,860 | (a) | | 12/18/18 | | 1.000 | | 6 month EURO | | | (37,032,388 | ) | | | 11,237,639 | |
| CAD | 262,770 | (a) | | 12/18/18 | | 1.750 | | 6 month CDOR | | | (7,081,740 | ) | | | (33,624 | ) |
| SEK | 1,347,620 | (a) | | 12/18/18 | | 3 month STIBOR | | 1.750 | | | 5,648,524 | | | | 190,379 | |
| GBP | 908,180 | (a) | | 12/18/18 | | 6 month BP | | 1.000 | | | 60,523,304 | | | | 111,127 | |
| $ | 74,100 | (a) | | 05/07/19 | | 1.973 | | 3 month LIBOR | | | 222 | | | | (1,688,887 | ) |
| | 1,594,400 | (a) | | 08/15/19 | | 3.250 | | 3 month LIBOR | | | (404,230 | ) | | | 13,018,963 | |
| | 81,200 | (a) | | 08/29/19 | | 3.520 | | 3 month LIBOR | | | 193 | | | | 1,158,279 | |
| | 81,200 | (a) | | 08/29/19 | | 3.560 | | 3 month LIBOR | | | 193 | | | | 1,249,191 | |
| JPY | 30,892,200 | (a) | | 04/24/20 | | 0.610 | | 6 month JYOR | | | (608,545 | ) | | | 347,566 | |
| $ | 73,500 | | | 06/19/20 | | 1.250 | | 3 month LIBOR | | | (970,574 | ) | | | (2,759,892 | ) |
| EUR | 977,380 | (a) | | 07/27/20 | | 6 month EURO | | 1.950 | | | 5,948,960 | | | | (3,777,827 | ) |
| GBP | 481,760 | (a) | | 08/24/20 | | 2.960 | | 6 month BP | | | 2,083,448 | | | | 5,815,054 | |
| $ | 1,410,800 | (a) | | 12/18/20 | | 3 month LIBOR | | 1.500 | | | 59,928,946 | | | | 13,922,202 | |
| GBP | 921,290 | (a) | | 07/19/21 | | 2.240 | | 6 month BP | | | (34,540,215 | ) | | | 2,071,202 | |
| $ | 807,300 | (a) | | 08/16/21 | | 3 month LIBOR | | 3.000 | | | (6,221,911 | ) | | | (12,306,592 | ) |
| | 41,300 | (a) | | 08/27/21 | | 3 month LIBOR | | 3.095 | | | 235 | | | | (1,131,818 | ) |
| | 41,300 | (a) | | 08/27/21 | | 3 month LIBOR | | 3.133 | | | 235 | | | | (1,232,173 | ) |
| GBP | 122,575 | (a) | | 12/20/22 | | 3.000 | | 6 month BP | | | (7,073,381 | ) | | | 1,809,984 | |
| JPY | 104,449,195 | (a) | | 12/20/22 | | 6 month JYOR | | 1.250 | | | 1,934,432 | | | | (6,311,214 | ) |
| $ | 21,500 | (a) | | 11/07/23 | | 3 month LIBOR | | 1.983 | | | 172 | | | | 1,625,073 | |
| EUR | 281,450 | (a) | | 12/18/23 | | 1.750 | | 6 month EURO | | | (16,458,827 | ) | | | 3,158,279 | |
| SEK | 93,390 | (a) | | 12/18/23 | | 2.250 | | 3 month STIBOR | | | (530,659 | ) | | | (236,454 | ) |
| CAD | 69,270 | (a) | | 12/18/23 | | 2.250 | | 6 month CDOR | | | (4,930,548 | ) | | | (135,472 | ) |
| $ | 194,360 | (a) | | 12/18/23 | | 3 month LIBOR | | 2.000 | | | 18,429,396 | | | | (3,231,901 | ) |
| AUD | 3,340 | (a) | | 12/18/23 | | 4.000 | | 6 month AUDOR | | | (125,097 | ) | | | 24,191 | |
| GBP | 142,640 | (a) | | 12/18/23 | | 6 month BP | | 2.000 | | | 16,597,281 | | | | (418,930 | ) |
| JPY | 17,361,360 | (a) | | 12/18/23 | | 6 month JYOR | | 0.750 | | | 5,465,647 | | | | (2,922,900 | ) |
| CHF | 165,210 | (a) | | 12/19/23 | | 2.500 | | 6 month CHFOR | | | (154,657 | ) | | | 1,019,474 | |
| $ | 22,190 | (a) | | 12/19/23 | | 3 month LIBOR | | 4.500 | | | 36,516 | | | | (285,430 | ) |
| | |
| 100 | | The accompanying notes are an integral part of these financial statements. |
GOLDMAN SACHS STRATEGIC INCOME FUND
|
| ADDITIONAL INVESTMENT INFORMATION (continued) |
CENTRALLY CLEARED INTEREST RATE SWAP CONTRACTS (continued)
| | | | | | | | | | | | | | | | |
| | | | | | Rates Exchanged | | Market Value | |
Notional Amount (000s) | | | Termination
Date | | Payments
Received | | Payments Made | | Upfront
Payments
Made (Received) | | | Unrealized
Gain (Loss) | |
| EUR | 300 | (a) | | 12/19/23 | | 3.250% | | 6 month EURO | | $ | (757 | ) | | $ | 4,366 | |
| $ | 97,800 | (a) | | 06/11/24 | | 3 month LIBOR | | 2.733% | | | 782 | | | | 2,956,856 | |
| | 25,000 | (a) | | 06/12/24 | | 3 month LIBOR | | 2.808 | | | 200 | | | | 590,240 | |
| GBP | 597,030 | (a) | | 07/18/24 | | 6 month BP | | 2.700 | | | 27,498,065 | | | | (3,677,390 | ) |
| $ | 58,300 | (a) | | 07/23/24 | | 3.126 | | 3 month LIBOR | | | 466 | | | | 32,415 | |
| | 442,700 | (a) | | 07/24/24 | | 3.098 | | 3 month LIBOR | | | (3,393,197 | ) | | | 2,457,949 | |
| CAD | 603,200 | (a) | | 07/24/24 | | 6 month CDOR | | 3.250 | | | 3,215,445 | | | | (834,326 | ) |
| JPY | 49,217,810 | (a) | | 04/24/25 | | 6 month JYOR | | 1.030 | | | 4,886,678 | | | | 344,545 | |
| | 90,548,900 | (a) | | 05/09/25 | | 6 month JYOR | | 1.650 | | | 5,148,934 | | | | 1,117,682 | |
| $ | 1,639,600 | (a) | | 08/01/25 | | 5.000 | | 3 month LIBOR | | | 5,707 | | | | 7,776,818 | |
| GBP | 168,180 | (a) | | 08/26/25 | | 6 month BP | | 3.550 | | | (1,708,877 | ) | | | (3,056,962 | ) |
| $ | 74,300 | (a) | | 03/24/26 | | 3.090 | | 3 month LIBOR | | | 594 | | | | (4,530,717 | ) |
| | 54,700 | (a) | | 03/31/26 | | 3.070 | | 3 month LIBOR | | | 875 | | | | (3,454,562 | ) |
| | 153,000 | (a) | | 05/26/26 | | 3.150 | | 3 month LIBOR | | | 1,224 | | | | (9,263,951 | ) |
| CAD | 41,000 | (a) | | 08/17/26 | | 4.010 | | 6 month CDOR | | | 317 | | | | 385,677 | |
| | 35,800 | (a) | | 08/17/26 | | 4.030 | | 6 month CDOR | | | 278 | | | | 394,511 | |
| | 41,700 | (a) | | 08/24/26 | | 4.100 | | 6 month CDOR | | | 317 | | | | 628,885 | |
| | 39,900 | (a) | | 08/31/26 | | 3.930 | | 6 month CDOR | | | 305 | | | | 66,306 | |
| | 53,900 | (a) | | 09/08/26 | | 4.160 | | 6 month CDOR | | | 410 | | | | 1,021,170 | |
| JPY | 55,177,500 | (a) | | 05/10/27 | | 1.880 | | 6 month JYOR | | | (4,521,866 | ) | | | (750,856 | ) |
| $ | 278,200 | (a) | | 12/18/28 | | 3 month LIBOR | | 2.500 | | | 12,078,335 | | | | 17,553,303 | |
| JPY | 24,816,240 | (a) | | 04/24/30 | | 1.480 | | 6 month JYOR | | | (2,979,349 | ) | | | (340,137 | ) |
| $ | 524,000 | (a) | | 08/01/30 | | 3 month LIBOR | | 5.000 | | | (2,067,566 | ) | | | (6,853,115 | ) |
| CAD | 21,800 | (a) | | 08/15/36 | | 6 month CDOR | | 4.065 | | | 381 | | | | (202,679 | ) |
| | 24,900 | (a) | | 08/18/36 | | 6 month CDOR | | 4.055 | | | 434 | | | | (198,410 | ) |
| | 25,300 | (a) | | 08/22/36 | | 6 month CDOR | | 4.138 | | | 433 | | | | (419,562 | ) |
| | 24,100 | (a) | | 08/29/36 | | 6 month CDOR | | 3.985 | | | 414 | | | | 71,611 | |
| | 32,900 | (a) | | 09/08/36 | | 6 month CDOR | | 4.198 | | | 564 | | | | (781,786 | ) |
| $ | 141,300 | (a) | | 12/18/43 | | 3 month LIBOR | | 3.000 | | | 13,390,924 | | | | 5,675,844 | |
| | TOTAL | | | | | | | | | $ | 111,768,718 | | | $ | 45,917,578 | |
| | (a) | | Represents forward starting interest rate swaps whose effective dates of commencement of accruals and cash flows occur subsequent to September 30, 2013. |
OVER THE COUNTER CREDIT DEFAULT SWAP CONTRACTS
| | | | | | | | | | | | | | | | | | | | | | | | | | |
| | | | | | | | | | | | | | | | | Market Value | |
| Counterparty | | Referenced
Obligation | | Notional
Amount
(000s) | | | Rates
Received
(Paid) | | | Termination
Date | | | Credit
Spread at
September 30,
2013(b) | | | Upfront
Payments
Made (Received) | | | Unrealized
Gain (Loss) | |
Protection Purchased: | | | | | | | | | | | | | | | | | | | | | | | | | | |
Bank of America Securities LLC | | CDX North America Investment Grade Index 16 | | $ | 9,650 | | | | (1.000 | )% | | | 06/20/14 | | | | 0.114 | % | | $ | (25,482 | ) | | $ | (39,773 | ) |
Deutsche Bank Securities, Inc. | | CDX North America Investment Grade Index 16 | | | 20,200 | | | | (1.000 | ) | | | 06/20/14 | | | | 0.114 | | | | (56,437 | ) | | | (80,161 | ) |
JPMorgan Securities, Inc. | | CDX North America Investment Grade Index 16 | | | 54,000 | | | | (1.000 | ) | | | 06/20/14 | | | | 0.114 | | | | (156,643 | ) | | | (208,520 | ) |
Morgan Stanley Capital Services, Inc. | | CDX North America Investment Grade Index 16 | | | 18,100 | | | | (1.000 | ) | | | 06/20/14 | | | | 0.114 | | | | (44,547 | ) | | | (77,850 | ) |
| | |
| The accompanying notes are an integral part of these financial statements. | | 101 |
GOLDMAN SACHS STRATEGIC INCOME FUND
Schedule of Investments (continued)
September 30, 2013 (Unaudited)
|
| ADDITIONAL INVESTMENT INFORMATION (continued) |
OVER THE COUNTER CREDIT DEFAULT SWAP CONTRACTS (continued)
| | | | | | | | | | | | | | | | | | | | | | | | | | |
| | | | | | | | | | | | | | | | | Market Value | |
| Counterparty | | Referenced
Obligation | | Notional
Amount
(000s) | | | Rates
Received
(Paid) | | | Termination
Date | | | Credit
Spread at
September 30,
2013(b) | | | Upfront
Payments
Made (Received) | | | Unrealized
Gain (Loss) | |
Protection Sold: | | | | | | | | | | | | | | | | | | | | | | | | | | |
Bank of America Securities LLC | | CDX North America Investment Grade Index 16 | | $ | 31,800 | | | | 1.000 | % | | | 06/20/16 | | | | 0.354 | % | | $ | 24,684 | | | $ | 543,243 | |
| | Tranches of Commercial Mortgage-Backed Index AAA Series 3 | | | 5,600 | | | | 0.080 | | | | 12/13/49 | | | | 1.135 | | | | (183,795 | ) | | | 1,286 | |
| | Tranches of Commercial Mortgage-Backed Index AAA Series 4 | | | 56,800 | | | | 0.350 | | | | 02/17/51 | | | | 1.241 | | | | (1,727,050 | ) | | | (37,496 | ) |
Barclays Bank PLC | | Federative Republic of Brazil 12.250% 03/06/30 | | | 31,000 | | | | 1.000 | | | | 09/20/23 | | | | 2.183 | | | | (3,042,349 | ) | | | 62,838 | |
Citibank NA | | Tranches of Commercial Mortgage-Backed Index AAA Series 4 | | | 43,100 | | | | 0.350 | | | | 02/17/51 | | | | 1.241 | | | | (1,255,070 | ) | | | (83,886 | ) |
Credit Suisse International (London) | | Tranches of Commercial Mortgage-Backed Index AAA Series 4 | | | 32,700 | | | | 0.350 | | | | 02/17/51 | | | | 1.241 | | | | (1,093,966 | ) | | | 77,972 | |
Deutsche Bank Securities, Inc. | | Tranches of Commercial Mortgage-Backed Index AAA Series 4 | | | 15,300 | | | | 0.350 | | | | 02/17/51 | | | | 1.241 | | | | (512,024 | ) | | | 36,650 | |
Morgan Stanley Capital Services, Inc. | | CDX North America Investment Grade Index 16 | | | 25,625 | | | | 1.000 | | | | 06/20/16 | | | | 0.354 | | | | 19,014 | | | | 438,632 | |
| | | Tranches of Commercial Mortgage-Backed Index AAA Series 4 | | | 23,100 | | | | 0.350 | | | | 02/17/51 | | | | 1.241 | | | | (710,002 | ) | | | (7,719 | ) |
| TOTAL | | | | | | | | | | | | | | | | | | | | $ | (8,763,667 | ) | | $ | 625,216 | |
| | (b) | | Credit spread on the Referenced Obligation, together with the term of the swap contract, are indicators of payment/performance risk. The likelihood of a credit event occurring which would require a fund to make a payment or otherwise be required to perform under the swap contract is generally greater as the credit spread and the term of the swap contract increase. |
CENTRALLY CLEARED CREDIT DEFAULT SWAP CONTRACTS
| | | | | | | | | | | | | | | | | | | | | | |
| | | | | | | | | | | | | | Market Value | |
| Referenced Obligation | | Notional
Amount (000s) | | Rates Received
(Paid) | | | Termination
Date | | | Credit
Spread at
September 30,
2013(b) | | | Upfront
Payments
Made (Received) | | | Unrealized
Gain (Loss) | |
Protection Sold: | | | | | | | | | | | | | | | | | | | | | | |
CDX North America High Yield Index 20 | | $ 300,000 | | | 5.000 | % | | | 06/20/18 | | | | 3.607 | % | | $ | 17,915,709 | | | $ | (102,150 | ) |
CDX North America Investment Grade Index 20 | | 2,061,900 | | | 1.000 | | | | 06/20/18 | | | | 0.728 | | | | 28,518,042 | | | | (2,339,388 | ) |
| TOTAL | | | | | | | | | | | | | | | | $ | 46,433,751 | | | $ | (2,441,538 | ) |
| | (b) | | Credit spread on the Referenced Obligation, together with the term of the swap contract, are indicators of payment/performance risk. The likelihood of a credit event occurring which would require a fund to make a payment or otherwise be required to perform under the swap contract is generally greater as the credit spread and the term of the swap contract increase. |
| | |
| 102 | | The accompanying notes are an integral part of these financial statements. |
GOLDMAN SACHS STRATEGIC INCOME FUND
|
| ADDITIONAL INVESTMENT INFORMATION (continued) |
TOTAL RETURN SWAP CONTRACTS
| | | | | | | | | | | | | | | | | | |
| | | | | | | | | | | | Market Value | |
| Counterparty | | Notional
Amount
(000s) | | | Reference
Security | | Termination
Date | | Financing
Fee# | | Upfront
Payments
made (received) | | | Unrealized
Gain (Loss) | |
Bank of America Securities LLC | | $ | 8,196 | | | Markit IOS Fannie-Mae Index,
30 yr Fixed Rate, 5.000%, Series 10 | | 01/12/41 | | One month LIBOR | | $ | (122,844 | ) | | $ | (93,236 | ) |
| | | 165,305 | | | Markit IOS Fannie-Mae Index, 30 yr Fixed Rate, 6.000%, Series 8 | | 01/12/39 | | One month LIBOR | | | 798,700 | | | | (2,796,462 | ) |
Barclays Bank PLC | | | 46,956 | | | Markit MBX Fannie-Mae Index, 30 yr Fixed Rate, 6.500%, Series 67 | | 01/12/38 | | One month LIBOR | | | 107,242 | | | | 262,120 | |
Citibank NA | | | 21,857 | | | Markit IOS Fannie-Mae Index,
30 yr Fixed Rate, 5.000%, Series 10 | | 01/12/41 | | One month LIBOR | | | 344,782 | | | | (920,994 | ) |
| | | 66,228 | | | Markit IOS Fannie-Mae Index, 30 yr Fixed Rate, 6.500%, Series 67 | | 01/12/38 | | One month LIBOR | | | 140,622 | | | | (437,166 | ) |
Credit Suisse International (London) | | | 70,519 | | | Markit IOS Fannie-Mae Index,
30 yr Fixed Rate, 5.000%, Series 10 | | 01/12/41 | | One month LIBOR | | | (746,864 | ) | | | (1,114,589 | ) |
| | | 47,962 | | | Markit IOS Fannie-Mae Index, 30 yr Fixed Rate, 6.000%, Series 8 | | 01/12/39 | | One month LIBOR | | | 466,292 | | | | (1,045,926 | ) |
| | | 98,170 | | | Markit MBX Fannie-Mae Index, 30 yr Fixed Rate, 6.500%, Series 67 | | 01/12/38 | | One month LIBOR | | | 147,460 | | | | 624,752 | |
Deutsche Bank Securities, Inc. | | | 608,880 | | | Markit MBX Fannie-Mae Index,
30 yr Fixed Rate, 6.500%, Series 67 | | 01/12/38 | | One month LIBOR | | | (751,448 | ) | | | 5,540,940 | |
JPMorgan Securities, Inc. | | | 16,547 | | | Markit IOS Fannie-Mae Index,
30 yr Fixed Rate, 5.000%, Series 10 | | 01/12/41 | | One month LIBOR | | | 142,465 | | | | (578,733 | ) |
| | | 46,001 | | | Markit IOS Fannie-Mae Index, 30 yr Fixed Rate, 6.000%, Series 8 | | 01/12/39 | | One month LIBOR | | | 220,293 | | | | (776,237 | ) |
| | | 35,938 | | | Markit IOS Fannie-Mae Index, 30 yr Fixed Rate, 6.500%, Series 67 | | 01/12/38 | | One month LIBOR | | | 31,067 | | | | (191,983 | ) |
| | | | 45,704 | | | Markit MBX Fannie-Mae Index, 30 yr Fixed Rate, 6.500%, Series 67 | | 01/12/38 | | One month LIBOR | | | 191,674 | | | | 167,840 | |
| TOTAL | | | | | | | | | | | | $ | 969,441 | | | $ | (1,359,674 | ) |
| | # | | The Fund receives annual coupon payments in accordance with the swap contract(s). On the termination date of the swap contract(s), the Fund will either receive from or pay to the counterparty an amount equal to the net of the accrued financing fees and the value of the reference security subtracted from the original notional cost (notional multiplied by the price change of the reference security, converted to U.S. Dollars). |
WRITTEN OPTIONS CONTRACTS — At September 30, 2013, the Fund had the following written swaptions:
INTEREST RATE SWAPTION CONTRACTS
| | | | | | | | | | | | | | | | | | | | | | |
| Counterparty | | Description | | Notional
Amount
(000s) | | | Expiration
Date | | | Strike
Price | | | Market Value | | | Premiums
Received | |
Deutsche Bank Securities, Inc. | | Call - OTC - 10 year Interest Rate Swap for the obligation to pay a fixed rate of 2.885% versus the 3 month LIBOR maturing on November 6, 2023 | | $ | 140,600 | | | | 11/04/2013 | | | | 2.885 | % | | $ | (1,048,187 | ) | | $ | (1,298,207 | ) |
| | |
| The accompanying notes are an integral part of these financial statements. | | 103 |
GOLDMAN SACHS STRATEGIC INCOME FUND
Schedule of Investments (continued)
September 30, 2013 (Unaudited)
|
| ADDITIONAL INVESTMENT INFORMATION (continued) |
WRITTEN OPTIONS CONTRACTS — For the six months ended September 30, 2013, the Fund had the following written swaptions activity:
| | | | | | | | |
| | | Notional
Amount
(000s) | | | Premiums
Received | |
Contracts Outstanding March 31, 2013 | | $ | 281,200 | | | $ | 1,579,407 | |
Contracts Written | | | 2 | | | | 1,081,907 | |
Contracts Bought to Close | | | — | | | | — | |
Contracts Expired | | | (140,602 | ) | | | (1,363,107 | ) |
Contracts Outstanding September 30, 2013 | | $ | 140,600 | | | $ | 1,298,207 | |
| | |
| 104 | | The accompanying notes are an integral part of these financial statements. |
GOLDMAN SACHS WORLD BOND FUND
Schedule of Investments
September 30, 2013 (Unaudited)
| | | | | | | | | | | | | | |
Principal
Amount | | | Interest
Rate | | | Maturity
Date | | | Value | |
| | | | | | | | | | | | | | |
| | Foreign Sovereign Debt Obligations – 68.8% | |
| | Australian Dollar – 2.7% | | | | | | | | | |
| Australia Government Bond | |
| AUD | 110,000 | | | | 4.750 | % | | | 10/21/15 | | | $ | 107,025 | |
| | 100,000 | | | | 5.250 | | | | 03/15/19 | | | | 102,515 | |
| | 100,000 | | | | 5.500 | | | | 04/21/23 | | | | 105,741 | |
| | | | | | | | | | | | | | |
| | | | | | | | | | | | | 315,281 | |
| | |
| | Brazilian Real – 0.4% | | | | | | | | | |
| Brazil Notas do Tesouro Nacional | |
| BRL | 108,634 | | | | 6.000 | | | | 08/15/50 | | | | 49,347 | |
| | |
| | British Pound – 4.3% | | | | | | | | | |
| United Kingdom Treasury | |
| GBP | 170,000 | | | | 2.000 | | | | 01/22/16 | | | | 283,780 | |
| | 40,000 | | | | 4.750 | | | | 03/07/20 | | | | 75,859 | |
| | 70,000 | | | | 4.250 | | | | 12/07/40 | | | | 128,903 | |
| | 10,000 | | | | 3.750 | | | | 07/22/52 | | | | 17,016 | |
| | | | | | | | | | | | | | |
| | | | | | | | | | | | | 505,558 | |
| | |
| | Canadian Dollar – 1.9% | | | | | | | | | |
| Government of Canada | |
| CAD | 100,000 | | | | 1.500 | | | | 09/01/17 | | | | 96,448 | |
| | 50,000 | | | | 3.750 | | | | 06/01/19 | | | | 53,043 | |
| | 40,000 | | | | 5.750 | | | | 06/01/33 | | | | 54,452 | |
| | 20,000 | | | | 4.000 | | | | 06/01/41 | | | | 22,727 | |
| | | | | | | | | | | | | | |
| | | | | | | | | | | | | 226,670 | |
| | |
| | Colombian Peso – 3.2% | | | | | | | | | |
| Republic of Colombia | |
| COP | 196,300,000 | | | | 8.000 | | | | 10/28/15 | | | | 109,042 | |
| | 309,100,000 | | | | 7.000 | | | | 05/04/22 | | | | 163,086 | |
| | 17,900,000 | | | | 7.500 | | | | 08/26/26 | | | | 9,376 | |
| | 216,300,000 | | | | 6.000 | | | | 04/28/28 | | | | 99,796 | |
| | | | | | | | | | | | | | |
| | | | | | | | | | | | | 381,300 | |
| | |
| | Czech Koruna – 0.1% | | | | | | | | | |
| Czech Republic Government Bond | |
| CZK | 300,000 | | | | 3.850 | | | | 09/29/21 | | | | 17,781 | |
| | |
| | Danish Krone – 0.7% | | | | | | | | | |
| Kingdom of Denmark | |
| DKK | 300,000 | | | | 3.000 | | | | 11/15/21 | | | | 60,240 | |
| | 80,000 | | | | 4.500 | | | | 11/15/39 | | | | 19,690 | |
| | | | | | | | | | | | | | |
| | | | | | | | | | | | | 79,930 | |
| | |
| | Euro – 30.3% | | | | | | | | | |
| Federal Republic of Germany | |
| EUR | 330,000 | | | | 1.750 | | | | 10/09/15 | | | | 460,637 | |
| | 710,000 | | | | 4.000 | | | | 01/04/18 | | | | 1,100,904 | |
| | 90,000 | | | | 3.000 | | | | 07/04/20 | | | | 136,940 | |
| | 40,000 | | | | 1.500 | | | | 09/04/22 | | | | 53,740 | |
| | 50,000 | | | | 4.000 | | | | 01/04/37 | | | | 84,188 | |
| | 60,000 | | | | 2.500 | | | | 07/04/44 | | | | 79,434 | |
| Government of Finland(a) | |
| | 20,000 | | | | 1.625 | | | | 09/15/22 | | | | 26,437 | |
| Government of France | |
| EUR | 110,000 | | | | 1.000 | | | | 05/25/18 | | | | 148,395 | |
| | 180,000 | | | | 2.250 | | | | 10/25/22 | | | | 244,248 | |
| | 40,000 | | | | 4.500 | | | | 04/25/41 | | | | 64,869 | |
| | |
| | | | | | | | | | | | | | |
| | Foreign Sovereign Debt Obligations – (continued) | |
| | Euro – (continued) | | | | | | | | | |
| Kingdom of Belgium | |
| EUR | 20,000 | | | | 3.500 | %(a) | | | 06/28/17 | | | $ | 29,529 | |
| | 30,000 | | | | 3.000 | | | | 09/28/19 | | | | 43,624 | |
| | 6,000 | | | | 4.000 | | | | 03/28/32 | | | | 8,793 | |
| Kingdom of The Netherlands(a) | |
| | 100,000 | | | | 3.750 | | | | 07/15/14 | | | | 139,114 | |
| | 50,000 | | | | 4.500 | | | | 07/15/17 | | | | 76,973 | |
| | 120,000 | | | | 2.250 | | | | 07/15/22 | | | | 165,966 | |
| | 20,000 | | | | 3.750 | | | | 01/15/42 | | | | 32,164 | |
| Republic of Austria(a) | |
| | 30,000 | | | | 4.300 | | | | 09/15/17 | | | | 46,041 | |
| | 20,000 | | | | 3.400 | | | | 11/22/22 | | | | 30,137 | |
| | 5,000 | | | | 3.150 | | | | 06/20/44 | | | | 7,082 | |
| Republic of Italy | |
| | 100,000 | | | | 3.750 | | | | 08/01/15 | | | | 139,682 | |
| | 70,000 | | | | 4.750 | | | | 06/01/17 | | | | 100,457 | |
| | 80,000 | | | | 5.250 | | | | 08/01/17 | | | | 116,973 | |
| | 70,000 | | | | 4.500 | | | | 05/01/23 | | | | 95,362 | |
| | 12,000 | | | | 5.750 | | | | 02/01/33 | | | | 17,708 | |
| Republic of Slovenia | |
| | 38,000 | | | | 4.625 | | | | 09/09/24 | | | | 43,119 | |
| Spain Government Bond | |
| | 20,000 | | | | 4.500 | | | | 01/31/18 | | | | 28,846 | |
| | 50,000 | | | | 4.400 | (a) | | | 10/31/23 | | | | 68,109 | |
| | | | | | | | | | | | | | |
| | | | | | | | | | | | | 3,589,471 | |
| | |
| | Japanese Yen – 5.6% | | | | | | | | | |
| Government of Japan | |
| JPY | 16,000,000 | | | | 0.400 | | | | 06/20/16 | | | | 163,968 | |
| | 14,000,000 | | | | 0.200 | | | | 09/20/17 | | | | 142,524 | |
| | 13,250,000 | | | | 0.800 | | | | 09/20/22 | | | | 136,877 | |
| | 16,000,000 | | | | 1.700 | | | | 09/20/32 | | | | 167,229 | |
| | 4,500,000 | | | | 1.900 | | | | 09/20/42 | | | | 47,836 | |
| | | | | | | | | | | | | | |
| | | | | | | | | | | | | 658,434 | |
| | |
| | Malaysian Ringgit – 0.1% | | | | | | | | | |
| Malaysia Government Bond | |
| MYR | 30,000 | | | | 3.492 | | | | 03/31/20 | | | | 9,073 | |
| | |
| | Mexican Peso – 2.7% | | | | | | | | | |
| United Mexican States | |
| MXN | 119,400 | | | | 6.250 | | | | 06/16/16 | | | | 9,611 | |
| | 11,400 | | | | 7.250 | | | | 12/15/16 | | | | 946 | |
| | 481,200 | | | | 6.500 | | | | 06/10/21 | | | | 38,547 | |
| | 96,200 | | | | 8.000 | | | | 12/07/23 | | | | 8,472 | |
| | 1,048,400 | | | | 7.500 | | | | 06/03/27 | | | | 88,125 | |
| | 256,600 | | | | 8.500 | | | | 05/31/29 | | | | 22,967 | |
| | 859,900 | | | | 7.750 | | | | 05/29/31 | | | | 70,940 | |
| | 56,000 | | | | 10.000 | | | | 11/20/36 | | | | 5,643 | |
| | 865,500 | | | | 7.750 | | | | 11/13/42 | | | | 70,198 | |
| | | | | | | | | | | | | | |
| | | | | | | | | | | | | 315,449 | |
| | |
| | Norwegian Krone – 1.8% | | | | | | | | | |
| Kingdom of Norway | |
| NOK | 400,000 | | | | 5.000 | | | | 05/15/15 | | | | 70,031 | |
| | 200,000 | | | | 4.250 | | | | 05/19/17 | | | | 35,908 | |
| | 400,000 | | | | 4.500 | | | | 05/22/19 | | | | 73,917 | |
| | 220,000 | | | | 2.000 | | | | 05/24/23 | | | | 34,065 | |
| | | | | | | | | | | | | | |
| | | | | | | | | | | | | 213,921 | |
| | |
| | |
| The accompanying notes are an integral part of these financial statements. | | 105 |
GOLDMAN SACHS WORLD BOND FUND
Schedule of Investments (continued)
September 30, 2013 (Unaudited)
| | | | | | | | | | | | | | |
Principal
Amount | | | Interest
Rate | | | Maturity
Date | | | Value | |
| | | | | | | | | | | | | | |
| | Foreign Sovereign Debt Obligations – (continued) | |
| | Peruvian Nuevo Sol – 0.4% | |
| | Republic of Peru | | | | | | | | | | | | | |
| PEN | 8,000 | | | | 8.200 | % | | | 08/12/26 | | | $ | 3,539 | |
| | 93,000 | | | | 6.950 | | | | 08/12/31 | | | | 35,492 | |
| | 9,000 | | | | 6.900 | | | | 08/12/37 | | | | 3,371 | |
| | | | | | | | | | | | | | |
| | | | | | | | | | | | | 42,402 | |
| | |
| | Polish Zloty – 2.7% | |
| Poland Government Bond | |
| PLN | 80,000 | | | | 2.500 | | | | 07/25/18 | | | | 24,082 | |
| | 280,000 | | | | 5.500 | | | | 10/25/19 | | | | 96,242 | |
| | 554,000 | | | | 5.750 | | | | 10/25/21 | | | | 193,835 | |
| | | | | | | | | | | | | | |
| | | | | | | | | | | | | 314,159 | |
| | |
| | Russian Ruble – 3.5% | |
| Russian Federation Bond | |
| RUB | 30,000 | | | | 7.500 | | | | 02/27/19 | | | | 955 | |
| | 13,100,000 | | | | 7.600 | | | | 07/20/22 | | | | 415,657 | |
| | 30,000 | | | | 7.050 | | | | 01/19/28 | | | | 878 | |
| | | | | | | | | | | | | | |
| | | | | | | | | | | | | 417,490 | |
| | |
| | Singapore Dollar – 0.5% | |
| Republic of Singapore | |
| SGD | 75,000 | | | | 3.125 | | | | 09/01/22 | | | | 64,794 | |
| | |
| | South African Rand – 1.4% | |
| Republic of South Africa | |
| ZAR | 800,000 | | | | 8.000 | | | | 12/21/18 | | | | 83,234 | |
| | 500,000 | | | | 7.250 | | | | 01/15/20 | | | | 49,842 | |
| | 370,000 | | | | 7.750 | | | | 02/28/23 | | | | 37,282 | |
| | | | | | | | | | | | | | |
| | | | | | | | | | | | | 170,358 | |
| | |
| | Swedish Krona – 1.6% | |
| Kingdom of Sweden | |
| SEK | 700,000 | | | | 3.000 | | | | 07/12/16 | | | | 113,790 | |
| | 350,000 | | | | 3.500 | | | | 06/01/22 | | | | 59,493 | |
| | 100,000 | | | | 3.500 | | | | 03/30/39 | | | | 16,678 | |
| | | | | | | | | | | | | | |
| | | | | | | | | | | | | 189,961 | |
| | |
| | Swiss Franc – 1.7% | |
| Swiss Confederation | |
| CHF | 60,000 | | | | 3.000 | | | | 01/08/18 | | | | 74,228 | |
| | 70,000 | | | | 2.000 | | | | 05/25/22 | | | | 84,192 | |
| | 30,000 | | | | 3.500 | | | | 04/08/33 | | | | 43,861 | |
| | | | | | | | | | | | | | |
| | | | | | | | | | | | | 202,281 | |
| | |
| | Thai Baht – 0.2% | |
| Kingdom of Thailand | |
| THB | 300,000 | | | | 3.875 | | | | 06/13/19 | | | | 9,730 | |
| Thailand Government Bond | |
| | 250,000 | | | | 3.650 | | | | 12/17/21 | | | | 7,864 | |
| | 300,000 | | | | 3.775 | | | | 06/25/32 | | | | 8,648 | |
| | | | | | | | | | | | | | |
| | | | | | | | | | | | | 26,242 | |
| | |
| | Turkish Lira – 3.0% | |
| Republic of Turkey | |
| TRY | 400,000 | | | | 10.000 | | | | 12/04/13 | | | | 198,817 | |
| | 100,000 | | | | 9.500 | | | | 01/12/22 | | | | 50,365 | |
| | 33,185 | | | | 3.000 | | | | 02/23/22 | | | | 16,366 | |
| | |
| | | | | | | | | | | | | | |
| | Foreign Sovereign Debt Obligations – (continued) | |
| | Turkish Lira – (continued) | |
| TRY | 120,000 | | | | 8.500 | % | | | 09/14/22 | | | $ | 57,661 | |
| | 60,000 | | | | 7.100 | | | | 03/08/23 | | | | 26,166 | |
| | | | | | | | | | | | | | |
| | | | | | | | | | | | | 349,375 | |
| | |
| | TOTAL FOREIGN SOVEREIGN DEBT OBLIGATIONS | |
| | (Cost $8,366,262) | | | | | | | $ | 8,139,277 | |
| | |
| | | | | | | | | | | | | | |
| | Structured Notes – 1.0% | |
| Notas do Tesouro Nacional (Issuer Deutsche Bank AG (London)) | |
| BRL | 106,000 | | | | 6.000 | % | | | 08/15/50 | | | $ | 112,484 | |
| | |
| | | | | | | | | | | | | | |
| | U.S. Treasury Obligations – 18.0% | |
| United States Treasury Bill(b)(c) | |
| $ | 540,000 | | | | 0.000 | % | | | 01/09/14 | | | $ | 539,993 | |
| United States Treasury Bonds | |
| | 640,000 | | | | 5.500 | | | | 08/15/28 | | | | 818,931 | |
| | 480,000 | | | | 2.750 | | | | 11/15/42 | | | | 397,325 | |
| United States Treasury Inflation Protected Securities | |
| | 53,392 | | | | 1.125 | | | | 01/15/21 | | | | 57,513 | |
| United States Treasury Notes | |
| | 160,000 | | | | 0.250 | | | | 01/31/15 | | | | 160,152 | |
| | 170,000 | | | | 1.625 | | | | 11/15/22 | | | | 157,389 | |
| | |
| | TOTAL U.S. TREASURY OBLIGATIONS | |
| | (Cost $2,203,637) | | | | | | | $ | 2,131,303 | |
| | |
| | | | | | | | |
| Shares | | | Description | | Value | |
| | | | | | | | |
| | Investment Company – 9.4% | |
| SSgA Government Money Market Fund | |
| | 1,112,747 | | | | | $ | 1,112,747 | |
| | (Cost $1,112,747) | | | | |
| | |
| | TOTAL INVESTMENTS – 97.2% | |
| | (Cost $11,846,447) | | $ | 11,495,811 | |
| | |
| OTHER ASSETS IN EXCESS OF
LIABILITIES – 2.8% | | | 335,539 | |
| | |
| | NET ASSETS – 100.0% | | $ | 11,831,350 | |
| | |
| | |
| The percentage shown for each investment category reflects the value of investments in that category as a percentage of net assets. |
(a) | | Exempt from registration under Rule 144A of the Securities Act of 1933. Under procedures approved by the Board of Trustees, such securities have been determined to be liquid by the investment adviser and may be resold, normally to qualified institutional buyers in transactions exempt from registration. Total market value of Rule 144A securities amounts to $621,552, which represents approximately 5.3% of net assets as of September 30, 2013. |
(b) | | Issued with a zero coupon. Income is recognized through the accretion of discount. |
(c) | | All or a portion of security is segregated as collateral for initial margin requirement on futures transactions. |
| | |
| 106 | | The accompanying notes are an integral part of these financial statements. |
GOLDMAN SACHS WORLD BOND FUND
| | |
|
Currency Abbreviations: |
AUD | | —Australian Dollar |
BRL | | —Brazilian Real |
CAD | | —Canadian Dollar |
CHF | | —Swiss Franc |
CLP | | —Chilean Peso |
COP | | —Colombian Peso |
CZK | | —Czech Koruna |
DKK | | —Danish Krone |
EUR | | —Euro |
GBP | | —British Pound |
HKD | | —Hong Kong Dollar |
HUF | | —Hungarian Forint |
IDR | | —Indonesian Rupiah |
ILS | | —Israeli Shekel |
JPY | | —Japanese Yen |
KRW | | —South Korean Won |
MXN | | —Mexican Peso |
MYR | | —Malaysian Ringgit |
NOK | | —Norwegian Krone |
NZD | | —New Zealand Dollar |
PEN | | —Peruvian Nuevo Sol |
PHP | | —Philippine Peso |
PLN | | —Polish Zloty |
RUB | | —Russian Ruble |
SEK | | —Swedish Krona |
SGD | | —Singapore Dollar |
THB | | —Thai Baht |
TRY | | —Turkish Lira |
TWD | | —Taiwan Dollar |
USD | | —U.S. Dollar |
ZAR | | —South African Rand |
| | |
Investment Abbreviations |
AUDOR | | —Australian Dollar Offered Rate |
BP | | —British Pound Offered Rate |
CDOR | | —Canadian Dollar Offered Rate |
CLICP | | —Sinacofi Chile Interbank Rate |
EURO | | —Euro Offered Rate |
JIBAR | | —Johannesburg Interbank Agreed Rate |
JYOR | | —Japanese Yen Offered Rate |
KWCDC | | —South Korean Won Certificate of Deposit |
LIBOR | | —London Interbank Offered Rate |
NZDOR | | —New Zealand Dollar Offered Rate |
STIBOR | | —Stockholm Interbank Offered Rate |
TIIE | | —La Tasa de Interbank Equilibrium Interest Rate |
WIBOR | | —Warsaw Interbank Offered Rate |
|
| | |
| The accompanying notes are an integral part of these financial statements. | | 107 |
GOLDMAN SACHS WORLD BOND FUND
Schedule of Investments (continued)
September 30, 2013 (Unaudited)
|
| ADDITIONAL INVESTMENT INFORMATION |
FORWARD FOREIGN CURRENCY EXCHANGE CONTRACTS — At September 30, 2013, the Fund had the following forward foreign currency exchange contracts:
FORWARD FOREIGN CURRENCY EXCHANGE CONTRACTS WITH UNREALIZED GAIN
| | | | | | | | | | | | | | |
| Counterparty | | Contracts to
Buy/Sell | | Settlement
Date | | | Current
Value | | | Unrealized
Gain | |
Bank of America Securities LLC | | CZK/EUR | | | 12/18/13 | | | $ | 24,356 | | | $ | 8 | |
| | EUR/USD | | | 12/18/13 | | | | 73,069 | | | | 1,184 | |
| | HUF/EUR | | | 12/18/13 | | | | 56,494 | | | | 56 | |
| | HUF/USD | | | 11/13/13 | | | | 31,740 | | | | 550 | |
| | PLN/USD | | | 12/18/13 | | | | 97,511 | | | | 511 | |
Barclays Bank PLC | | EUR/USD | | | 12/18/13 | | | | 48,713 | | | | 753 | |
| | GBP/EUR | | | 12/18/13 | | | | 97,426 | | | | 620 | |
| | HUF/EUR | | | 12/18/13 | | | | 24,356 | | | | 128 | |
| | NOK/USD | | | 12/18/13 | | | | 26,229 | | | | 320 | |
| | USD/IDR | | | 11/19/13 | | | | 22,861 | | | | 1,139 | |
| | USD/MYR | | | 10/11/13 | | | | 48,683 | | | | 317 | |
| | USD/PHP | | | 10/17/13 | | | | 12,247 | | | | 253 | |
BNP Paribas SA | | USD/PLN | | | 10/30/13 | | | | 28,757 | | | | 34 | |
Citibank NA | | EUR/USD | | | 12/18/13 | | | | 397,096 | | | | 4,959 | |
| | GBP/EUR | | | 12/18/13 | | | | 50,066 | | | | 26 | |
| | MXN/USD | | | 12/18/13 | | | | 24,782 | | | | 156 | |
| | NZD/USD | | | 12/18/13 | | | | 24,780 | | | | 316 | |
| | PHP/USD | | | 10/11/13 | | | | 24,182 | | | | 182 | |
| | RUB/USD | | | 10/07/13 | | | | 24,792 | | | | 792 | |
| | USD/IDR | | | 10/24/13 | | | | 23,479 | | | | 521 | |
| | USD/RUB | | | 10/10/13 | | | | 23,922 | | | | 78 | |
| | USD/RUB | | | 10/24/13 | | | | 24,540 | | | | 460 | |
Credit Suisse International (London) | | CLP/USD | | | 10/17/13 | | | | 46,134 | | | | 540 | |
| | JPY/USD | | | 12/18/13 | | | | 25,168 | | | | 168 | |
| | PEN/USD | | | 10/17/13 | | | | 52,516 | | | | 516 | |
| | RUB/USD | | | 10/07/13 | | | | 24,866 | | | | 866 | |
| | RUB/USD | | | 10/10/13 | | | | 98,950 | | | | 2,950 | |
| | RUB/USD | | | 10/17/13 | | | | 80,184 | | | | 2,260 | |
| | USD/PEN | | | 10/17/13 | | | | 8,688 | | | | 12 | |
| | USD/RUB | | | 10/17/13 | | | | 48,841 | | | | 159 | |
Deutsche Bank AG (London) | | DKK/USD | | | 10/21/13 | | | | 24,907 | | | | 657 | |
| | GBP/USD | | | 10/24/13 | | | | 116,879 | | | | 1,445 | |
| | GBP/USD | | | 12/18/13 | | | | 24,269 | | | | 622 | |
| | ILS/USD | | | 12/18/13 | | | | 24,035 | | | | 35 | |
| | MYR/USD | | | 10/03/13 | | | | 48,492 | | | | 492 | |
| | RUB/USD | | | 10/17/13 | | | | 1,324 | | | | 28 | |
| | SEK/USD | | | 10/04/13 | | | | 30,098 | | | | 471 | |
| | TWD/USD | | | 10/15/13 | | | | 24,084 | | | | 84 | |
| | USD/MXN | | | 12/18/13 | | | | 18,793 | | | | 207 | |
| | USD/ZAR | | | 10/30/13 | | | | 82,963 | | | | 1,077 | |
HSBC Bank PLC | | BRL/USD | | | 10/17/13 | | | | 350,379 | | | | 13,111 | |
| | CHF/USD | | | 10/11/13 | | | | 55,793 | | | | 983 | |
| | EUR/SEK | | | 12/18/13 | | | | 24,328 | | | | 28 | |
| | KRW/USD | | | 10/23/13 | | | | 24,123 | | | | 123 | |
| | KRW/USD | | | 10/24/13 | | | | 427,403 | | | | 24,181 | |
| | MYR/USD | | | 10/03/13 | | | | 48,798 | | | | 798 | |
| | MYR/USD | | | 10/11/13 | | | | 48,724 | | | | 724 | |
| | PHP/USD | | | 10/24/13 | | | | 81,247 | | | | 191 | |
| | TWD/USD | | | 10/24/13 | | | | 288,706 | | | | 4,706 | |
| | |
| 108 | | The accompanying notes are an integral part of these financial statements. |
GOLDMAN SACHS WORLD BOND FUND
|
| ADDITIONAL INVESTMENT INFORMATION (continued) |
FORWARD FOREIGN CURRENCY EXCHANGE CONTRACTS WITH UNREALIZED GAIN (continued)
| | | | | | | | | | | | | | |
| Counterparty | | Contracts to
Buy/Sell | | Settlement
Date | | | Current
Value | | | Unrealized
Gain | |
HSBC Bank PLC (continued) | | USD/TRY | | | 10/21/13 | | | $ | 28,857 | | | $ | 313 | |
| | USD/ZAR | | | 10/30/13 | | | | 55,822 | | | | 1,388 | |
JPMorgan Securities, Inc. | | EUR/NOK | | | 12/18/13 | | | | 97,031 | | | | 1,747 | |
| | EUR/USD | | | 12/18/13 | | | | 98,779 | | | | 1,147 | |
| | JPY/USD | | | 12/18/13 | | | | 74,242 | | | | 242 | |
| | USD/TRY | | | 10/21/13 | | | | 16,608 | | | | 474 | |
| | USD/TRY | | | 12/18/13 | | | | 24,721 | | | | 31 | |
Morgan Stanley Capital Services, Inc. | | BRL/USD | | | 10/15/13 | | | | 53,720 | | | | 261 | |
| | BRL/USD | | | 10/17/13 | | | | 66,994 | | | | 4,603 | |
| | HUF/EUR | | | 12/18/13 | | | | 24,356 | | | | 135 | |
| | RUB/USD | | | 10/15/13 | | | | 48,770 | | | | 770 | |
| | RUB/USD | | | 10/17/13 | | | | 19,200 | | | | 486 | |
| | USD/BRL | | | 10/17/13 | | | | 47,052 | | | | 86 | |
| | USD/MXN | | | 12/18/13 | | | | 48,197 | | | | 803 | |
Royal Bank of Canada | | BRL/USD | | | 10/07/13 | | | | 25,525 | | | | 1,525 | |
| | BRL/USD | | | 10/11/13 | | | | 24,948 | | | | 948 | |
| | BRL/USD | | | 10/18/13 | | | | 24,469 | | | | 469 | |
| | MXN/USD | | | 12/18/13 | | | | 24,156 | | | | 156 | |
Standard Chartered Bank | | GBP/USD | | | 12/18/13 | | | | 152,582 | | | | 5,335 | |
| | SGD/USD | | | 12/18/13 | | | | 24,124 | | | | 124 | |
State Street Bank | | GBP/EUR | | | 12/18/13 | | | | 50,066 | | | | 42 | |
| | JPY/USD | | | 12/18/13 | | | | 99,130 | | | | 130 | |
| | MXN/USD | | | 12/18/13 | | | | 24,188 | | | | 188 | |
| | SGD/USD | | | 10/31/13 | | | | 108,897 | | | | 1,515 | |
| | USD/MXN | | | 12/18/13 | | | | 48,618 | | | | 382 | |
UBS AG (London) | | BRL/USD | | | 10/18/13 | | | | 24,437 | | | | 437 | |
| | MYR/USD | | | 10/11/13 | | | | 24,087 | | | | 87 | |
| | PHP/USD | | | 10/07/13 | | | | 48,902 | | | | 902 | |
| | PHP/USD | | | 10/11/13 | | | | 24,104 | | | | 104 | |
| | TWD/USD | | | 10/11/13 | | | | 48,056 | | | | 56 | |
| | USD/IDR | | | 11/19/13 | | | | 44,511 | | | | 3,489 | |
| | USD/ZAR | | | 12/18/13 | | | | 47,995 | | | | 1,005 | |
Westpac Banking Corp. | | AUD/USD | | | 12/18/13 | | | | 145,976 | | | | 2,802 | |
| | CAD/USD | | | 10/23/13 | | | | 62,422 | | | | 1,450 | |
| | JPY/USD | | | 11/08/13 | | | | 417,924 | | | | 1,050 | |
| | NZD/AUD | | | 12/18/13 | | | | 24,131 | | | | 291 | |
| | USD/AUD | | | 12/18/13 | | | | 145,712 | | | | 605 | |
| | | USD/MYR | | | 10/23/13 | | | | 48,740 | | | | 596 | |
| TOTAL | | | | | | | | | | | | $ | 106,971 | |
FORWARD FOREIGN CURRENCY EXCHANGE CONTRACTS WITH UNREALIZED LOSS
| | | | | | | | | | | | | | |
| Counterparty | | Contracts to
Buy/Sell | | Settlement
Date | | | Current
Value | | | Unrealized
Loss | |
Bank of America Securities LLC | | CZK/EUR | | | 12/18/13 | | | $ | 24,356 | | | $ | (41 | ) |
| | EUR/PLN | | | 12/18/13 | | | | 50,088 | | | | (699 | ) |
| | HUF/EUR | | | 12/18/13 | | | | 24,356 | | | | (134 | ) |
| | MYR/USD | | | 10/24/13 | | | | 81,087 | | | | (2,032 | ) |
| | TRY/USD | | | 12/18/13 | | | | 47,700 | | | | (1,300 | ) |
| | USD/EUR | | | 12/18/13 | | | | 98,779 | | | | (1,324 | ) |
| | USD/ILS | | | 12/18/13 | | | | 48,910 | | | | (539 | ) |
| | |
| The accompanying notes are an integral part of these financial statements. | | 109 |
GOLDMAN SACHS WORLD BOND FUND
Schedule of Investments (continued)
September 30, 2013 (Unaudited)
|
| ADDITIONAL INVESTMENT INFORMATION (continued) |
FORWARD FOREIGN CURRENCY EXCHANGE CONTRACTS WITH UNREALIZED LOSS (continued)
| | | | | | | | | | | | | | |
| Counterparty | | Contracts to
Buy/Sell | | Settlement
Date | | | Current
Value | | | Unrealized
Loss | |
Bank of America Securities LLC (continued) | | USD/MYR | | | 10/03/13 | | | $ | 24,214 | | | $ | (214 | ) |
| | USD/ZAR | | | 10/30/13 | | | | 40,544 | | | | (443 | ) |
Barclays Bank PLC | | EUR/GBP | | | 12/18/13 | | | | 25,064 | | | | (31 | ) |
| | EUR/HUF | | | 12/18/13 | | | | 35,351 | | | | (170 | ) |
| | MXN/USD | | | 12/18/13 | | | | 23,279 | | | | (721 | ) |
| | NOK/EUR | | | 12/18/13 | | | | 24,356 | | | | (763 | ) |
| | USD/AUD | | | 10/10/13 | | | | 41,878 | | | | (1,783 | ) |
| | USD/TRY | | | 12/18/13 | | | | 24,178 | | | | (178 | ) |
| | USD/ZAR | | | 12/18/13 | | | | 45,090 | | | | (90 | ) |
| | ZAR/USD | | | 12/18/13 | | | | 96,158 | | | | (842 | ) |
BNP Paribas SA | | EUR/GBP | | | 12/18/13 | | | | 150,135 | | | | (1,290 | ) |
| | RUB/USD | | | 10/15/13 | | | | 49,257 | | | | (868 | ) |
| | USD/JPY | | | 12/18/13 | | | | 97,916 | | | | (873 | ) |
Citibank NA | | EUR/GBP | | | 12/18/13 | | | | 24,537 | | | | (181 | ) |
| | MYR/USD | | | 10/23/13 | | | | 48,509 | | | | (1,491 | ) |
| | MYR/USD | | | 10/24/13 | | | | 40,538 | | | | (1,099 | ) |
| | PHP/USD | | | 10/17/13 | | | | 48,905 | | | | (95 | ) |
| | RUB/USD | | | 10/17/13 | | | | 48,960 | | | | (40 | ) |
| | TRY/USD | | | 12/18/13 | | | | 23,207 | | | | (793 | ) |
| | USD/CAD | | | 12/18/13 | | | | 120,403 | | | | (210 | ) |
| | USD/GBP | | | 12/18/13 | | | | 160,178 | | | | (3,862 | ) |
| | USD/JPY | | | 12/18/13 | | | | 24,004 | | | | (4 | ) |
| | USD/MXN | | | 12/18/13 | | | | 24,087 | | | | (87 | ) |
| | USD/MYR | | | 10/03/13 | | | | 24,155 | | | | (155 | ) |
| | USD/MYR | | | 10/18/13 | | | | 49,098 | | | | (98 | ) |
| | USD/RUB | | | 10/10/13 | | | | 49,094 | | | | (1,094 | ) |
| | USD/RUB | | | 10/21/13 | | | | 25,007 | | | | (7 | ) |
| | USD/TRY | | | 12/18/13 | | | | 24,664 | | | | (664 | ) |
Credit Suisse International (London) | | CLP/USD | | | 10/16/13 | | | | 24,232 | | | | (50 | ) |
| | CLP/USD | | | 10/25/13 | | | | 24,582 | | | | (418 | ) |
| | EUR/CHF | | | 12/18/13 | | | | 24,636 | | | | (280 | ) |
| | RUB/USD | | | 10/10/13 | | | | 7,054 | | | | (48 | ) |
| | RUB/USD | | | 10/21/13 | | | | 47,742 | | | | (1,258 | ) |
| | USD/COP | | | 10/17/13 | | | | 166,900 | | | | (3,900 | ) |
| | USD/JPY | | | 12/18/13 | | | | 48,429 | | | | (429 | ) |
| | USD/PEN | | | 10/17/13 | | | | 29,735 | | | | (92 | ) |
| | USD/PLN | | | 10/30/13 | | | | 24,318 | | | | (163 | ) |
| | USD/RUB | | | 10/07/13 | | | | 49,608 | | | | (1,608 | ) |
| | USD/RUB | | | 10/15/13 | | | | 24,247 | | | | (247 | ) |
Deutsche Bank AG (London) | | AUD/USD | | | 12/18/13 | | | | 72,392 | | | | (27 | ) |
| | ILS/USD | | | 12/18/13 | | | | 24,769 | | | | (231 | ) |
| | MYR/USD | | | 10/18/13 | | | | 48,612 | | | | (388 | ) |
| | MYR/USD | | | 10/23/13 | | | | 23,213 | | | | (787 | ) |
| | MYR/USD | | | 10/24/13 | | | | 60,803 | | | | (1,193 | ) |
| | THB/USD | | | 10/31/13 | | | | 43,551 | | | | (510 | ) |
| | TRY/USD | | | 10/21/13 | | | | 12,009 | | | | (80 | ) |
| | TRY/USD | | | 12/18/13 | | | | 69,192 | | | | (2,533 | ) |
| | USD/CNH | | | 12/18/13 | | | | 98,858 | | | | (22 | ) |
| | USD/CNH | | | 01/08/14 | | | | 97,247 | | | | (1,247 | ) |
| | USD/CZK | | | 12/18/13 | | | | 51,577 | | | | (1,206 | ) |
| | USD/EUR | | | 12/18/13 | | | | 50,066 | | | | (166 | ) |
| | USD/JPY | | | 11/08/13 | | | | 41,643 | | | | (143 | ) |
| | USD/MXN | | | 10/30/13 | | | | 66,240 | | | | (621 | ) |
| | USD/PHP | | | 10/17/13 | | | | 12,010 | | | | (10 | ) |
| | |
| 110 | | The accompanying notes are an integral part of these financial statements. |
GOLDMAN SACHS WORLD BOND FUND
|
| ADDITIONAL INVESTMENT INFORMATION (continued) |
FORWARD FOREIGN CURRENCY EXCHANGE CONTRACTS WITH UNREALIZED LOSS (continued)
| | | | | | | | | | | | | | |
| Counterparty | | Contracts to
Buy/Sell | | Settlement
Date | | | Current
Value | | | Unrealized
Loss | |
Deutsche Bank AG (London) (continued) | | USD/PLN | | | 12/18/13 | | | $ | 62,880 | | | $ | (957 | ) |
| | USD/RUB | | | 10/15/13 | | | | 13,199 | | | | (131 | ) |
| | USD/TRY | | | 10/21/13 | | | | 191,716 | | | | (937 | ) |
HSBC Bank PLC | | HKD/USD | | | 11/07/13 | | | | 196,856 | | | | (48 | ) |
| | USD/AUD | | | 12/18/13 | | | | 24,131 | | | | (321 | ) |
| | USD/HUF | | | 12/18/13 | | | | 30,237 | | | | (586 | ) |
| | USD/KRW | | | 10/24/13 | | | | 28,336 | | | | (1,336 | ) |
| | USD/MYR | | | 10/03/13 | | | | 24,399 | | | | (399 | ) |
| | USD/PLN | | | 10/30/13 | | | | 80,560 | | | | (2,630 | ) |
| | USD/SEK | | | 12/18/13 | | | | 74,815 | | | | (1,033 | ) |
| | ZAR/USD | | | 10/30/13 | | | | 21,264 | | | | (62 | ) |
JPMorgan Securities, Inc. | | MXN/USD | | | 12/18/13 | | | | 95,688 | | | | (1,312 | ) |
| | NOK/EUR | | | 12/18/13 | | | | 73,068 | | | | (1,469 | ) |
| | TRY/USD | | | 12/18/13 | | | | 73,258 | | | | (742 | ) |
| | USD/EUR | | | 10/25/13 | | | | 1,156,675 | | | | (24,252 | ) |
| | USD/EUR | | | 12/18/13 | | | | 171,848 | | | | (831 | ) |
| | USD/HUF | | | 12/18/13 | | | | 99,510 | | | | (2,874 | ) |
| | USD/IDR | | | 10/07/13 | | | | 3,787 | | | | (37 | ) |
| | USD/PLN | | | 10/30/13 | | | | 170,437 | | | | (5,590 | ) |
| | USD/RUB | | | 10/15/13 | | | | 11,137 | | | | (137 | ) |
| | USD/TRY | | | 12/18/13 | | | | 97,077 | | | | (1,477 | ) |
Morgan Stanley Capital Services, Inc. | | MXN/JPY | | | 12/18/13 | | | | 24,644 | | | | (961 | ) |
| | NZD/USD | | | 12/18/13 | | | | 47,908 | | | | (610 | ) |
| | USD/BRL | | | 11/04/13 | | | | 25,198 | | | | (198 | ) |
| | USD/COP | | | 10/17/13 | | | | 79,126 | | | | (1,351 | ) |
| | USD/TRY | | | 10/21/13 | | | | 21,274 | | | | (27 | ) |
Royal Bank of Canada | | CAD/USD | | | 12/18/13 | | | | 122,251 | | | | (749 | ) |
| | USD/BRL | | | 10/15/13 | | | | 24,670 | | | | (670 | ) |
| | USD/BRL | | | 10/18/13 | | | | 24,434 | | | | (434 | ) |
| | USD/CAD | | | 12/18/13 | | | | 25,018 | | | | (18 | ) |
| | USD/GBP | | | 10/24/13 | | | | 143,126 | | | | (1,811 | ) |
| | USD/GBP | | | 12/18/13 | | | | 50,157 | | | | (152 | ) |
| | USD/NZD | | | 12/18/13 | | | | 51,858 | | | | (1,900 | ) |
Standard Chartered Bank | | IDR/USD | | | 10/24/13 | | | | 20,310 | | | | (1,326 | ) |
| | USD/SGD | | | 12/18/13 | | | | 25,846 | | | | (445 | ) |
| | USD/TRY | | | 12/18/13 | | | | 67,986 | | | | (285 | ) |
| | ZAR/USD | | | 12/18/13 | | | | 23,981 | | | | (1,019 | ) |
State Street Bank | | MXN/USD | | | 12/18/13 | | | | 47,882 | | | | (1,118 | ) |
| | NOK/EUR | | | 12/18/13 | | | | 50,515 | | | | (1,604 | ) |
| | USD/AUD | | | 12/18/13 | | | | 24,131 | | | | (192 | ) |
| | USD/CHF | | | 12/18/13 | | | | 107,746 | | | | (3,010 | ) |
| | USD/COP | | | 10/17/13 | | | | 79,873 | | | | (839 | ) |
| | USD/EUR | | | 12/18/13 | | | | 24,356 | | | | (4 | ) |
| | USD/JPY | | | 12/18/13 | | | | 48,911 | | | | (911 | ) |
UBS AG (London) | | IDR/USD | | | 11/29/13 | | | | 179,695 | | | | (32,305 | ) |
| | RUB/USD | | | 10/24/13 | | | | 48,320 | | | | (680 | ) |
| | USD/BRL | | | 10/07/13 | | | | 25,365 | | | | (1,365 | ) |
| | USD/BRL | | | 10/11/13 | | | | 24,798 | | | | (798 | ) |
| | USD/IDR | | | 10/07/13 | | | | 17,221 | | | | (279 | ) |
| | USD/ZAR | | | 12/18/13 | | | | 74,422 | | | | (422 | ) |
| | ZAR/USD | | | 12/18/13 | | | | 71,765 | | | | (1,235 | ) |
Westpac Banking Corp. | | AUD/USD | | | 12/18/13 | | | | 95,594 | | | | (1,088 | ) |
| | EUR/USD | | | 12/18/13 | | | | 48,713 | | | | (47 | ) |
| | USD/AUD | | | 12/18/13 | | | | 48,261 | | | | (252 | ) |
| | | USD/EUR | | | 12/18/13 | | | | 50,066 | | | | (73 | ) |
| TOTAL | | | | | | | | | | | | $ | (147,211 | ) |
| | |
| The accompanying notes are an integral part of these financial statements. | | 111 |
GOLDMAN SACHS WORLD BOND FUND
Schedule of Investments (continued)
September 30, 2013 (Unaudited)
|
| ADDITIONAL INVESTMENT INFORMATION (continued) |
FUTURES CONTRACTS — At September 30, 2013, the Fund had the following futures contracts:
| | | | | | | | | | | | | | | | |
| Type | | Number of
Contracts
Long (Short) | | | Expiration
Date | | | Current
Value | | | Unrealized
Gain (Loss) | |
2 Year German Euro-Schatz | | | 2 | | | | December 2013 | | | $ | 298,710 | | | $ | 294 | |
5 Year German Euro-Bobl | | | 2 | | | | December 2013 | | | | 336,698 | | | | 3,730 | |
2 Year U.S. Treasury Notes | | | 5 | | | | December 2013 | | | | 1,101,328 | | | | 601 | |
5 Year U.S. Treasury Notes | | | (19 | ) | | | December 2013 | | | | (2,299,891 | ) | | | (26,766 | ) |
10 Year U.S. Treasury Notes | | | (1 | ) | | | December 2013 | | | | (126,391 | ) | | | (158 | ) |
30 Year U.S. Treasury Bonds | | | 2 | | | | December 2013 | | | | 266,750 | | | | 6,062 | |
| TOTAL | | | | | | | | | | | | | | $ | (16,237 | ) |
SWAP CONTRACTS — At September 30, 2013, the Fund had the following swap contracts:
OVER THE COUNTER INTEREST RATE SWAP CONTRACTS
| | | | | | | | | | | | | | | | | | | | |
| | | | | | | | | | Rates Exchanged | | Market Value | |
| Counterparty | | Notional Amount (000s) | | | Termination
Date | | Payments Received | | Payments Made | | Upfront
Payments
Made (Received) | | | Unrealized
Gain (Loss) | |
Bank of America Securities LLC | | BRL | | | 300 | | | 01/04/16 | | 10.010% | | 1 month Brazilian Interbank Deposit Average | | $ | — | | | $ | (1,947 | ) |
| | EUR | | | 170 | (a) | | 12/18/23 | | 1.750 | | 6 month EURO | | | — | | | | (8,034 | ) |
Barclays Bank PLC | | BRL | | | 1,000 | | | 01/04/16 | | 8.980 | | 1 month Brazilian Interbank Deposit Average | | | — | | | | (13,406 | ) |
| | | | | 1,020 | | | 01/04/16 | | 8.200 | | 1 month Brazilian Interbank Deposit Average | | | — | | | | (20,636 | ) |
| | $ | | | 710 | | | 06/19/18 | | 1.000 | | 3 month LIBOR | | | (596 | ) | | | (11,702 | ) |
| | NZD | | | 100 | (a) | | 12/18/18 | | 3 month NZDOR | | 3.500% | | | 2,321 | | | | 1,226 | |
| | JPY | | | 48,720 | (a) | | 12/18/20 | | 0.500 | | 6 month JYOR | | | (12,710 | ) | | | 9,110 | |
| | KRW | | | 211,330 | | | 05/30/23 | | 3 month KWCDC | | 2.995 | | | — | | | | 5,344 | |
| | | | | 59,680 | | | 06/19/23 | | 3 month KWCDC | | 3.185 | | | — | | | | 655 | |
Citibank NA | | BRL | | | 610 | | | 01/04/16 | | 8.890 | | 1 month Brazilian Interbank Deposit Average | | | — | | | | (9,408 | ) |
| | $ | | | 1,500 | | | 06/20/16 | | 0.500 | | 3 month LIBOR | | | (5,529 | ) | | | 884 | |
| | PLN | | | 1,300 | | | 01/22/18 | | 6 month WIBOR | | 3.590 | | | — | | | | (5,265 | ) |
| | ZAR | | | 820 | | | 05/09/23 | | 3 month JIBAR | | 6.380 | | | — | | | | 8,758 | |
| | MXN | | | 230 | | | 06/01/23 | | 6.230 | | Mexico Interbank TIIE 28 Days | | | — | | | | (435 | ) |
| | PLN | | | 340 | | | 07/31/23 | | 6 month WIBOR | | 3.840 | | | — | | | | 3,211 | |
| | KRW | | | 81,640 | | | 09/11/23 | | 3 month KWCDC | | 3.520 | | | — | | | | (1,229 | ) |
| | EUR | | | 170 | (a) | | 12/18/23 | | 1.750 | | 6 month EURO | | | (2,572 | ) | | | (5,461 | ) |
Credit Suisse International (London) | | $ | | | 1,740 | | | 06/19/18 | | 1.000 | | 3 month LIBOR | | | (1,962 | ) | | | (28,175 | ) |
| | NZD | | | 180 | (a) | | 12/18/18 | | 3 month NZDOR | | 3.500 | | | 5,925 | | | | 459 | |
Deutsche Bank Securities, Inc. | | BRL | | | 310 | | | 01/04/16 | | 10.347 | | 1 month Brazilian Interbank Deposit Average | | | — | | | | (1,291 | ) |
| | | | | 380 | | | 01/04/16 | | 10.370 | | 1 month Brazilian Interbank Deposit Average | | | — | | | | (1,501 | ) |
| | |
| 112 | | The accompanying notes are an integral part of these financial statements. |
GOLDMAN SACHS WORLD BOND FUND
|
| ADDITIONAL INVESTMENT INFORMATION (continued) |
OVER THE COUNTER INTEREST RATE SWAP CONTRACTS (continued)
| | | | | | | | | | | | | | | | | | | | |
| | | | | | | | | | Rates Exchanged | | Market Value | |
| Counterparty | | Notional Amount (000s) | | | Termination
Date | | Payments Received | | Payments Made | | Upfront
Payments
Made (Received) | | | Unrealized
Gain (Loss) | |
Deutsche Bank Securities, Inc. (continued) | | CLP | | | 7,070 | | | 09/25/18 | | 6 month CLICP | | 4.950% | | $ | — | | | $ | 30 | |
| | | | | 48,470 | (a) | | 10/01/18 | | 6 month CLICP | | 4.990 | | | — | | | | 41 | |
| | NZD | | | 90 | (a) | | 12/18/18 | | 3 month NZDOR | | 3.500 | | | 1,101 | | | | 2,091 | |
| | MXN | | | 470 | | | 06/01/23 | | 6.255% | | Mexico Interbank TIIE 28 Days | | | — | | | | (816 | ) |
| | KRW | | | 117,160 | | | 08/28/23 | | 3 month KWCDC | | 3.588 | | | — | | | | (2,438 | ) |
| | NZD | | | 250 | (a) | | 12/18/23 | | 3 month NZDOR | | 4.000 | | | 4,628 | | | | 10,594 | |
| | EUR | | | 370 | (a) | | 12/18/23 | | 1.750 | | 6 month EURO | | | (2,581 | ) | | | (14,904 | ) |
JPMorgan Securities, Inc. | | MXN | | | 380 | | | 05/12/23 | | 5.630 | | Mexico Interbank TIIE 28 Days | | | — | | | | (2,105 | ) |
Morgan Stanley Capital Services, Inc. | | KRW | | | 55,850 | | | 07/11/23 | | 3 month KWCDC | | 3.405 | | | — | | | | (410 | ) |
| TOTAL | | | | | | | | | | | | | | $ | (11,975 | ) | | $ | (86,760 | ) |
| | (a) | | Represents forward starting interest rate swaps whose effective dates of commencement of accruals and cash flows occur subsequent to September 30, 2013. |
CENTRALLY CLEARED INTEREST RATE SWAP CONTRACTS
| | | | | | | | | | | | | | | | |
| | | | | | Rates Exchanged | | Market Value | |
Notional Amount (000s) | | | Termination
Date | | Payments Received | | Payments Made | | Upfront Payments
Made (Received) | | | Unrealized
Gain (Loss) | |
| EUR | 150 | (a) | | 06/05/15 | | 0.600% | | 6 month EURO | | $ | (279 | ) | | $ | 293 | |
| | 1,770 | (a) | | 06/27/15 | | 0.850 | | 6 month EURO | | | 3,822 | | | | 1,918 | |
| | 490 | (a) | | 08/06/15 | | 0.750 | | 6 month EURO | | | (1 | ) | | | 714 | |
| | 2,300 | (a) | | 08/18/15 | | 0.800 | | 6 month EURO | | | 315 | | | | 4,280 | |
| JPY | 564,040 | (a) | | 08/18/15 | | 6 month JYOR | | 0.280% | | | 379 | | | | (1,646 | ) |
| PLN | 1,100 | (a) | | 09/01/15 | | 3.690 | | 6 month WIBOR | | | 1 | | | | 751 | |
| | 740 | (a) | | 09/03/15 | | 3.630 | | 6 month WIBOR | | | 1 | | | | 395 | |
| AUD | 1,510 | (a) | | 09/05/15 | | 3.200 | | 6 month AUDOR | | | (132 | ) | | | 3,538 | |
| $ | 2,950 | (a) | | 09/26/15 | | 3 month LIBOR | | 0.650 | | | (430 | ) | | | (982 | ) |
| | 1,500 | | | 06/20/16 | | 3 month LIBOR | | 0.500 | | | 10,343 | | | | (5,697 | ) |
| GBP | 370 | (a) | | 07/18/16 | | 6 month BP | | 0.930 | | | 6,447 | | | | (2,747 | ) |
| EUR | 1,560 | (a) | | 07/27/16 | | 6 month EURO | | 1.100 | | | 135 | | | | (1,435 | ) |
| $ | 1,310 | (a) | | 12/19/16 | | 0.500 | | 3 month LIBOR | | | (19,500 | ) | | | 4,385 | |
| | 2,450 | | | 06/19/18 | | 3 month LIBOR | | 1.000 | | | 41,242 | | | | 1,193 | |
| EUR | 1,320 | (a) | | 07/27/18 | | 1.600 | | 6 month EURO | | | (1,442 | ) | | | 2,439 | |
| $ | 2,400 | (a) | | 12/18/18 | | 1.000 | | 3 month LIBOR | | | (75,384 | ) | | | (3,905 | ) |
| EUR | 910 | (a) | | 12/18/18 | | 1.000 | | 6 month EURO | | | (28,713 | ) | | | 10,257 | |
| CAD | 320 | (a) | | 12/18/18 | | 1.750 | | 6 month CDOR | | | (10,275 | ) | | | 1,610 | |
| SEK | 1,240 | (a) | | 12/18/18 | | 3 month STIBOR | | 1.750 | | | 5,709 | | | | (337 | ) |
| GBP | 820 | (a) | | 12/18/18 | | 6 month BP | | 1.000 | | | 56,025 | | | | (1,278 | ) |
| JPY | 28,000 | (a) | | 04/24/20 | | 0.610 | | 6 month JYOR | | | (3,706 | ) | | | 3,470 | |
| EUR | 530 | (a) | | 07/27/20 | | 6 month EURO | | 1.950 | | | 1,543 | | | | (366 | ) |
| GBP | 530 | (a) | | 07/18/21 | | 2.240 | | 6 month BP | | | (34,849 | ) | | | 16,169 | |
| ZAR | 310 | (a) | | 08/20/23 | | 8.510 | | 3 month JIBAR | | | — | | | | 1,367 | |
| $ | 220 | (a) | | 12/18/23 | | 3 month LIBOR | | 2.000 | | | 19,334 | | | | (2,131 | ) |
| GBP | 20 | (a) | | 12/18/23 | | 6 month BP | | 2.000 | | | 2,336 | | | | (67 | ) |
| EUR | 730 | (a) | | 12/18/23 | | 6 month EURO | | 1.750 | | | 41,801 | | | | (7,304 | ) |
| JPY | 17,420 | (a) | | 12/18/23 | | 6 month JYOR | | 0.750 | | | 5,740 | | | | (3,188 | ) |
| | |
| The accompanying notes are an integral part of these financial statements. | | 113 |
GOLDMAN SACHS WORLD BOND FUND
Schedule of Investments (continued)
September 30, 2013 (Unaudited)
|
| ADDITIONAL INVESTMENT INFORMATION (continued) |
CENTRALLY CLEARED INTEREST RATE SWAP CONTRACTS (continued)
| | | | | | | | | | | | | | | | |
| | | | | | Rates Exchanged | | Market Value | |
Notional Amount (000s) | | | Termination
Date | | Payments Received | | Payments Made | | Upfront Payments
Made (Received) | | | Unrealized
Gain (Loss) | |
| GBP | 340 | (a) | | 07/18/24 | | 6 month BP | | 2.700% | | $ | 26,317 | | | $ | (12,751) | |
| JPY | 45,000 | (a) | | 04/24/25 | | 6 month JYOR | | 1.030 | | | 15,782 | | | | (10,999 | ) |
| | 70,000 | (a) | | 05/09/25 | | 6 month JYOR | | 1.650 | | | 9,529 | | | | (4,684 | ) |
| | 43,000 | (a) | | 05/09/27 | | 1.880% | | 6 month JYOR | | | (8,578 | ) | | | 4,468 | |
| $ | 960 | (a) | | 12/18/28 | | 3 month LIBOR | | 2.500 | | | 52,034 | | | | 50,218 | |
| JPY | 23,000 | (a) | | 04/24/30 | | 1.480 | | 6 month JYOR | | | (10,309 | ) | | | 7,233 | |
| | TOTAL | | | | | | | | | $ | 105,237 | | | $ | 55,181 | |
| | (a) | | Represents forward starting interest rate swaps whose effective dates of commencement of accruals and cash flows occur subsequent to September 30, 2013. |
| | |
| 114 | | The accompanying notes are an integral part of these financial statements. |
GOLDMAN SACHS MULTI SECTOR FIXED INCOME FUNDS
|
| ADDITIONAL INVESTMENT INFORMATION |
JOINT REPURCHASE AGREEMENT ACCOUNT II — At September 30, 2013, certain Funds had undivided interests in the Joint Repurchase Agreement Account II, with a maturity date of October 1, 2013, as follows:
| | | | | | | | | | | | |
| Fund | | Principal Amount | | | Maturity Value | | | Collateral
Allocation Value | |
Core Fixed Income | | $ | 1,800,000 | | | $ | 1,800,004 | | | $ | 1,841,001 | |
Core Plus Fixed Income | | | 10,200,000 | | | | 10,200,024 | | | | 10,432,340 | |
REPURCHASE AGREEMENTS — At September 30, 2013, the Principal Amounts of certain Funds’ interest in the Joint Repurchase Agreement Account II were as follows:
| | | | | | | | | | | | |
| Counterparty | | Interest
Rate | | | Core Fixed
Income | | | Core Plus
Fixed Income | |
BNP Paribas Securities Co. | | | 0.070 | % | | $ | 617,358 | | | $ | 3,498,360 | |
Merrill Lynch & Co., Inc. | | | 0.080 | | | | 108,977 | | | | 617,537 | |
TD Securities (USA) LLC | | | 0.090 | | | | 1,073,665 | | | | 6,084,103 | |
| TOTAL | | | | | | $ | 1,800,000 | | | $ | 10,200,000 | |
At September 30, 2013, the Joint Repurchase Agreement Account II was fully collateralized by:
| | | | | | | | |
| Issuer | | Interest Rates | | | Maturity Dates | |
Federal Farm Credit Bank | | | 0.189% to 4.250 | % | | | 08/27/14 to 06/17/20 | |
Federal Home Loan Bank | | | 1.750 to 2.875 | | | | 09/11/15 to 09/11/20 | |
Federal Home Loan Mortgage Corp. | | | 3.500 to 4.000 | | | | 06/01/42 to 08/01/42 | |
Federal National Mortgage Association | | | 0.000 to 4.000 | | | | 11/15/13 to 12/01/42 | |
U.S. Treasury Bill | | | 0.000 | | | | 08/21/14 | |
U.S. Treasury Notes | | | 0.750 to 2.125 | | | | 03/31/18 to 02/15/22 | |
| | |
| The accompanying notes are an integral part of these financial statements. | | 115 |
GOLDMAN SACHS MULTI SECTOR FIXED INCOME FUNDS
Statements of Assets and Liabilities
September 30, 2013 (Unaudited)
| | | | | | |
| | | | | Core Fixed
Income Fund | |
| | Assets: | | | | |
| | Investments, at value (cost $1,259,280,623, $269,249,030, $505,677,393, $10,132,382,250 and $11,846,447) | | $ | 1,266,239,950 | |
| | Cash | | | — | |
| | Foreign currencies, at value (cost $155, $78,208, $489,790, $1,388,057 and $34,328) | | | 156 | |
| | Receivables: | | | | |
| | Investments sold on an extended settlement basis | | | 145,182,550 | |
| | Investment sold | | | 15,289,555 | |
| | Fund shares sold | | | 21,524,838 | |
| | Collateral on certain derivative contracts(a)(b) | | | 7,018,300 | |
| | Interest | | | 7,022,665 | |
| | Unrealized gain on swap contracts | | | 913,799 | |
| | Unrealized gain on forward foreign currency exchange contracts | | | 566,143 | |
| | Variation margin on certain derivative contracts | | | 55,450 | |
| | Upfront payments made on swap contracts | | | 39,545 | |
| | Reimbursement from investment adviser | | | — | |
| | Due from broker — upfront payment | | | — | |
| | Deferred offering costs | | | — | |
| | Other assets | | | 38,309 | |
| | Total assets | | | 1,463,891,260 | |
| | | | | | |
| | Liabilities: | | | | |
| | Due to custodian | | | 546,150 | |
| | Payables: | | | | |
| | Investments purchased on an extended settlement basis | | | 201,616,006 | |
| | Investments purchased | | | — | |
| | Forward sale contracts, at value (proceeds receivable $57,421,875, $6,680,625, $3,818,828, $20,296,875 and $0) | | | 58,505,941 | |
| | Collateral on certain derivative contracts | | | 6,680,610 | |
| | Fund shares redeemed | | | 7,901,978 | |
| | Unrealized loss on swap contracts | | | 2,524,864 | |
| | Upfront payments received on swap contracts | | | 1,147,874 | |
| | Unrealized loss on forward foreign currency exchange contracts | | | 1,228,421 | |
| | Variation margin on certain derivative contracts | | | 587,297 | |
| | Amounts owed to affiliates | | | 479,470 | |
| | Due to broker — upfront payment | | | 216,895 | |
| | Income distribution | | | 137,233 | |
| | Due to broker | | | — | |
| | Written option contracts, at value (premium received $1,298,207 for Strategic Income Fund) | | | — | |
| | Accrued expenses | | | 161,936 | |
| | Total liabilities | | | 281,734,675 | |
| | | | | | |
| | Net Assets: | | | | |
| | Paid-in capital | | | 1,206,833,270 | |
| | Undistributed net investment income | | | 12,239,815 | |
| | Accumulated net realized gain (loss) | | | (50,720,523 | ) |
| | Net unrealized gain (loss) | | | 13,804,023 | |
| | | NET ASSETS | | $ | 1,182,156,585 | |
| | | Net Assets: | | | | |
| | | Class A | | $ | 138,608,429 | |
| | | Class B | | | 4,778,752 | |
| | | Class C | | | 22,383,210 | |
| | | Institutional | | | 1,012,065,807 | |
| | | Service | | | 2,562,124 | |
| | | Class IR | | | 1,212,949 | |
| | | Class R | | | 545,314 | |
| | | Total Net Assets | | $ | 1,182,156,585 | |
| | | Shares Outstanding $0.001 par value (unlimited shares authorized): | | | | |
| | | Class A | | | 13,438,339 | |
| | | Class B | | | 461,193 | |
| | | Class C | | | 2,158,657 | |
| | | Institutional | | | 97,728,276 | |
| | | Service | | | 247,257 | |
| | | Class IR | | | 117,504 | |
| | | Class R | | | 52,801 | |
| | | Net asset value, offering and redemption price per share:(c) | | | | |
| | | Class A | | | $10.31 | |
| | | Class B | | | 10.36 | |
| | | Class C | | | 10.37 | |
| | | Institutional | | | 10.36 | |
| | | Service | | | 10.36 | |
| | | Class IR | | | 10.32 | |
| | | Class R | | | 10.33 | |
| | (a) | | Segregated for initial margin on swap transactions of $7,018,300, $3,458,821, $1,799,923, $127,066,159 and $85,652 for the Core Fixed Income, Core Plus Fixed Income, Global Income, Strategic Income and World Bond Funds, respectively. |
| | (b) | | Includes restricted cash of $566,985 on deposit with counterparty for the Core Plus Fixed Income Fund relating to initial margin requirements and collateral on futures transactions. |
| | (c) | | Maximum public offering price per share for Class A Shares of the Core Fixed Income, Core Plus Fixed Income, Global Income, Strategic Income and World Bond Funds is $10.71, $10.72, $13.46, $10.88 and $10.07, respectively. At redemption, Class B and Class C Shares may be subject to a contingent deferred sales charge, assessed on the amount equal to the lesser of the current net asset value or the original purchase price of the shares. |
| | |
| 116 | | The accompanying notes are an integral part of these financial statements. |
GOLDMAN SACHS MULTI SECTOR FIXED INCOME FUNDS
| | | | | | | | | | | | | | | | | | | | | | |
| | | Core Plus Fixed
Income Fund | | | | | Global Income
Fund | | | | | Strategic Income
Fund | | | | | World Bond Fund | |
| | | | | | | | | | | | | | | | | | | | | | |
| | $ | 276,543,179 | | | | | $ | 517,935,476 | | | | | $ | 10,285,772,340 | | | | | $ | 11,495,811 | |
| | | 517,609 | | | | | | 1,923,136 | | | | | | 34,159,496 | | | | | | — | |
| | | 77,244 | | | | | | 464,077 | | | | | | 1,283,953 | | | | | | 34,031 | |
| | | | | | | | | | | | | | | | | | | | | | |
| | | 52,210,513 | | | | | | 5,875,234 | | | | | | 44,541,658 | | | | | | — | |
| | | 5,584,338 | | | | | | 1,686,835 | | | | | | 27,091,697 | | | | | | 489,654 | |
| | | 32,529 | | | | | | 36,906,179 | | | | | | 76,655,813 | | | | | | — | |
| | | 4,035,849 | | | | | | 1,799,925 | | | | | | 134,258,368 | | | | | | 87,823 | |
| | | 1,702,720 | | | | | | 4,308,451 | | | | | | 48,071,134 | | | | | | 141,297 | |
| | | 723,546 | | | | | | 1,965,698 | | | | | | 51,634,577 | | | | | | 42,403 | |
| | | 266,775 | | | | | | 1,022,661 | | | | | | 44,930,279 | | | | | | 106,971 | |
| | | 3,594 | | | | | | — | | | | | | 1,830,493 | | | | | | 165 | |
| | | 90,858 | | | | | | 715,563 | | | | | | 16,856,949 | | | | | | 13,975 | |
| | | 71,850 | | | | | | 131,207 | | | | | | — | | | | | | 73,204 | |
| | | — | | | | | | 2,341,712 | | | | | | 384,779 | | | | | | — | |
| | | — | | | | | | — | | | | | | — | | | | | | 28,026 | |
| | | 17,160 | | | | | | 22,127 | | | | | | 230,147 | | | | | | 5,410 | |
| | | 341,877,764 | | | | | | 577,098,281 | | | | | | 10,767,701,683 | | | | | | 12,518,770 | |
| | | | | | | | | | | | | | | | | | | | | | |
| | | | | | | | | | | | | | | | | | | | | | |
| | | — | | | | | | — | | | | | | — | | | | | | 8,342 | |
| | | | | | | | | | | | | | | | | | | | | | |
| | | 62,953,139 | | | | | | 7,400,672 | | | | | | 365,780,564 | | | | | | — | |
| | | 351,886 | | | | | | 2,074,708 | | | | | | 142,962,041 | | | | | | 229,869 | |
| | | 6,812,032 | | | | | | 3,909,062 | | | | | | 20,556,874 | | | | | | — | |
| | | 6,481,731 | | | | | | 5,701,416 | | | | | | 332,357,446 | | | | | | — | |
| | | 528,153 | | | | | | 1,327,838 | | | | | | 15,243,976 | | | | | | — | |
| | | 2,619,223 | | | | | | 1,943,108 | | | | | | 73,543,731 | | | | | | 129,163 | |
| | | 303,166 | | | | | | 1,084,255 | | | | | | 31,150,957 | | | | | | 25,950 | |
| | | 580,984 | | | | | | 5,927,030 | | | | | | 79,930,539 | | | | | | 147,211 | |
| | | 12,782 | | | | | | 1,990,388 | | | | | | 1,205,433 | | | | | | 1,098 | |
| | | 139,654 | | | | | | 298,259 | | | | | | 5,052,997 | | | | | | 6,653 | |
| | | 737 | | | | | | — | | | | | | — | | | | | | 5 | |
| | | 17,486 | | | | | | 5,695 | | | | | | 3,275,817 | | | | | | — | |
| | | — | | | | | | — | | | | | | 1,344,528 | | | | | | — | |
| | | — | | | | | | — | | | | | | 1,048,187 | | | | | | — | |
| | | 173,630 | | | | | | 277,425 | | | | | | 352,644 | | | | | | 139,129 | |
| | | | 80,974,603 | | | | | | 31,939,856 | | | | | | 1,073,805,734 | | | | | | 687,420 | |
| | | | | | | | | | | | | | | | | | | | | | |
| | | | | | | | | | | | | | | | | | | | | | |
| | | 255,832,470 | | | | | | 514,857,033 | | | | | | 9,652,873,134 | | | | | | 12,217,730 | |
| | | 1,135,704 | | | | | | 11,774,358 | | | | | | 11,443,276 | | | | | | 167,528 | |
| | | (4,866,582 | ) | | | | | 9,314,003 | | | | | | (89,700,460 | ) | | | | | (115,718 | ) |
| | | 8,801,569 | | | | | | 9,213,031 | | | | | | 119,279,999 | | | | | | (438,190 | ) |
| | | $ | 260,903,161 | | | | | $ | 545,158,425 | | | | | $ | 9,693,895,949 | | | | | $ | 11,831,350 | |
| | | | | | | | | | | | | | | | | | | | | | | |
| | | | $ 34,770,545 | | | | | $ | 63,463,920 | | | | | $ | 2,054,069,301 | | | | | $ | 98,546 | |
| | | | 2,845,427 | | | | | | 1,332,195 | | | | | | — | | | | | | — | |
| | | | 8,485,665 | | | | | | 5,075,051 | | | | | | 569,222,325 | | | | | | 9,683 | |
| | | | 211,919,740 | | | | | | 474,484,090 | | | | | | 6,728,919,736 | | | | | | 11,703,644 | |
| | | | 14,022 | | | | | | 214,597 | | | | | | — | | | | | | — | |
| | | | 2,741,591 | | | | | | 588,572 | | | | | | 341,216,910 | | | | | | 9,763 | |
| | | | 126,171 | | | | | | — | | | | | | 467,677 | | | | | | 9,714 | |
| | | | $260,903,161 | | | | | $ | 545,158,425 | | | | | $ | 9,693,895,949 | | | | | $ | 11,831,350 | |
| | | | | | | | | | | | | | | | | | | | | | | |
| | | | 3,369,917 | | | | | | 4,897,010 | | | | | | 196,102,618 | | | | | | 10,175 | |
| | | | 275,965 | | | | | | 103,178 | | | | | | — | | | | | | — | |
| | | | 822,934 | | | | | | 394,311 | | | | | | 54,332,283 | | | | | | 1,001 | |
| | | | 20,544,806 | | | | | | 36,669,237 | | | | | | 642,183,922 | | | | | | 1,208,846 | |
| | | | 1,359 | | | | | | 16,610 | | | | | | — | | | | | | — | |
| | | | 266,492 | | | | | | 45,514 | | | | | | 32,583,696 | | | | | | 1,008 | |
| | | | 12,236 | | | | | | — | | | | | | 44,706 | | | | | | 1,003 | |
| | | | | | | | | | | | | | | | | | | | | | | |
| | | | $10.32 | | | | | | $12.96 | | | | | | $10.47 | | | | | | $9.69 | |
| | | | 10.31 | | | | | | 12.91 | | | | | | — | | | | | | — | |
| | | | 10.31 | | | | | | 12.87 | | | | | | 10.48 | | | | | | 9.68 | |
| | | | 10.32 | | | | | | 12.94 | | | | | | 10.48 | | | | | | 9.68 | |
| | | | 10.31 | | | | | | 12.92 | | | | | | — | | | | | | — | |
| | | | 10.29 | | | | | | 12.93 | | | | | | 10.47 | | | | | | 9.68 | |
| | | | 10.31 | | | | | | — | | | | | | 10.46 | | | | | | 9.68 | |
| | |
| The accompanying notes are an integral part of these financial statements. | | 117 |
GOLDMAN SACHS MULTI SECTOR FIXED INCOME FUNDS
Statements of Operations
For the Six Months Ended September 30, 2013 (Unaudited)
| | | | | | |
| | | | | Core Fixed
Income Fund | |
| | Investment income: | | | | |
| | Interest | | $ | 15,677,990 | |
| | | | | | |
| | Expenses: | | | | |
| | Management fees | | | 2,530,756 | |
| | Transfer Agent fees(a) | | | 340,104 | |
| | Distribution and Service fees(a) | | | 335,410 | |
| | Custody, accounting and administrative services | | | 152,372 | |
| | Professional fees | | | 51,963 | |
| | Printing and mailing costs | | | 46,662 | |
| | Registration fees | | | 44,469 | |
| | Service Share fees — Shareholder Administration Plan | | | 13,869 | |
| | Service Share fees — Service Plan | | | 13,869 | |
| | Trustee fees | | | 10,562 | |
| | Shareholder meeting expense | | | 1,922 | |
| | Amortization of offering costs | | | — | |
| | Other | | | 11,752 | |
| | Total expenses | | | 3,553,710 | |
| | Less — expense reductions | | | — | |
| | Net expenses | | | 3,553,710 | |
| | NET INVESTMENT INCOME | | | 12,124,280 | |
| | | | | | |
| | Realized and unrealized gain (loss): | | | | |
| | Net realized gain (loss) from: | | | | |
| | Investments | | | (4,782,562 | ) |
| | Futures contracts | | | (9,393,282 | ) |
| | Written options | | | — | |
| | Swap contracts | | | 4,518,574 | |
| | Forward foreign currency exchange contracts | | | (677,801 | ) |
| | Foreign currency transactions | | | (20,177 | ) |
| | Net change in unrealized gain (loss) on: | | | | |
| | Investments (net of deferred taxes of $542 for World Bond Fund) | | | (31,655,298 | ) |
| | Futures contracts | | | 2,128,100 | |
| | Written options | | | — | |
| | Swap contracts | | | 2,249,440 | |
| | Forward foreign currency exchange contracts | | | (418,761 | ) |
| | Foreign currency transactions | | | 4,781 | |
| | Net realized and unrealized loss | | | (38,046,986 | ) |
| | NET INCREASE (DECREASE) IN NET ASSETS RESULTING FROM OPERATIONS | | $ | (25,922,706 | ) |
| | (a) | | Class specific Distribution and Service, and Transfer Agent fees were as follows: |
| | | | | | | | | | | | | | | | | | | | | | | | | | | | | | | | | | | | | | | | | | | | |
| | | Distribution and Service Fees | | | Transfer Agent Fees | |
Fund | | Class A | | | Class B | | | Class C | | | Class R | | | Class A | | | Class B | | | Class C | | | Institutional | | | Service | | | Class IR | | | Class R | |
Core Fixed Income | | $ | 185,715 | | | $ | 28,563 | | | $ | 119,571 | | | $ | 1,561 | | | $ | 96,572 | | | $ | 3,713 | | | $ | 15,544 | | | $ | 220,607 | | | $ | 2,219 | | | $ | 1,043 | | | $ | 406 | |
Core Plus Fixed Income | | | 47,859 | | | | 16,921 | | | | 46,891 | | | | 568 | | | | 24,886 | | | | 2,200 | | | | 6,096 | | | | 58,141 | | | | 4 | | | | 1,817 | | | | 148 | |
Global Income | | | 84,823 | | | | 7,745 | | | | 27,208 | | | | — | | | | 44,108 | | | | 1,007 | | | | 3,537 | | | | 81,636 | | | | 30 | | | | 391 | | | | — | |
Strategic Income | | | 1,595,555 | | | | — | | | | 1,909,112 | | | | 705 | | | | 829,689 | | | | — | | | | 248,185 | | | | 787,346 | | | | — | | | | 131,926 | | | | 183 | |
World Bond | | | 95 | | | | — | | | | 49 | | | | 24 | | | | 50 | | | | — | | | | 6 | | | | 2,348 | | | | — | | | | 6 | | | | 6 | |
| | |
| 118 | | The accompanying notes are an integral part of these financial statements. |
GOLDMAN SACHS MULTI SECTOR FIXED INCOME FUNDS
| | | | | | | | | | | | | | | | | | | | | | |
| | | Core Plus Fixed
Income Fund | | | | | Global Income
Fund | | | | | Strategic Income
Fund | | | | | World Bond Fund | |
| | | | | | | | | | | | | | | | | | | | | | |
| | $ | 4,818,194 | | | | | $ | 6,560,579 | | | | | $ | 82,027,197 | | | | | $ | 108,927 | |
| | | | | | | | | | | | | | | | | | | | | | |
| | | | | | | | | | | | | | | | | | | | | | |
| | | 775,780 | | | | | | 1,572,300 | | | | | | 15,322,802 | | | | | | 38,503 | |
| | | 93,292 | | | | | | 130,709 | | | | | | 1,997,329 | | | | | | 2,416 | |
| | | 112,239 | | | | | | 119,776 | | | | | | 3,505,372 | | | | | | 168 | |
| | | 191,257 | | | | | | 339,806 | | | | | | 425,248 | | | | | | 132,254 | |
| | | 52,996 | | | | | | 57,325 | | | | | | 53,623 | | | | | | 63,853 | |
| | | 21,522 | | | | | | 28,831 | | | | | | 91,451 | | | | | | 23,510 | |
| | | 40,804 | | | | | | 34,242 | | | | | | 65,370 | | | | | | 29,596 | |
| | | 18 | | | | | | 191 | | | | | | — | | | | | | — | |
| | | 18 | | | | | | 191 | | | | | | — | | | | | | — | |
| | | 9,072 | | | | | | 9,776 | | | | | | 16,074 | | | | | | 4,851 | |
| | | 1,116 | | | | | | 1,264 | | | | | | 17,072 | | | | | | 4,388 | |
| | | — | | | | | | — | | | | | | — | | | | | | 81,406 | |
| | | 4,518 | | | | | | 7,120 | | | | | | 106,701 | | | | | | 7,148 | |
| | | 1,302,632 | | | | | | 2,301,531 | | | | | | 21,601,042 | | | | | | 388,093 | |
| | | (310,026 | ) | | | | | (467,384 | ) | | | | | — | | | | | | (344,664 | ) |
| | | 992,606 | | | | | | 1,834,147 | | | | | | 21,601,042 | | | | | | 43,429 | |
| | | 3,825,588 | | | | | | 4,726,432 | | | | | | 60,426,155 | | | | | | 65,498 | |
| | | | | | | | | | | | | | | | | | | | | | |
| | | | | | | | | | | | | | | | | | | | | | |
| | | | | | | | | | | | | | | | | | | | | | |
| | | (319,624 | ) | | | | | 3,280,234 | | | | | | (40,840,223 | ) | | | | | 3,428 | |
| | | (3,196,607 | ) | | | | | 349,724 | | | | | | 201,320 | | | | | | (36,425 | ) |
| | | — | | | | | | 33,590 | | | | | | 1,363,107 | | | | | | — | |
| | | 741,197 | | | | | | 2,057,902 | | | | | | 64,010,654 | | | | | | 87,076 | |
| | | (282,149 | ) | | | | | (2,123,487 | ) | | | | | (46,062,931 | ) | | | | | (129,509 | ) |
| | | 123,758 | | | | | | 3,059,583 | | | | | | 1,927,838 | | | | | | (17,576 | ) |
| | | | | | | | | | | | | | | | | | | | | | |
| | | (7,351,829 | ) | | | | | (6,289,838 | ) | | | | | 63,374,381 | | | | | | (181,680 | ) |
| | | 2,359,952 | | | | | | 348,828 | | | | | | (17,413,216 | ) | | | | | (8,956 | ) |
| | | — | | | | | | — | | | | | | (577,402 | ) | | | | | — | |
| | | (1,285,184 | ) | | | | | (229,589 | ) | | | | | (10,759,969 | ) | | | | | (34,047 | ) |
| | | (404,651 | ) | | | | | (8,505,941 | ) | | | | | (28,050,750 | ) | | | | | 30,455 | |
| | | 5,659 | | | | | | 103,535 | | | | | | 24,092 | | | | | | 2,313 | |
| | | (9,609,478 | ) | | | | | (7,915,459 | ) | | | | | (12,803,099 | ) | | | | | (284,921 | ) |
| | $ | (5,783,890 | ) | | | | $ | (3,189,027 | ) | | | | $ | 47,623,056 | �� | | | | $ | (219,423 | ) |
| | |
| The accompanying notes are an integral part of these financial statements. | | 119 |
GOLDMAN SACHS MULTI SECTOR FIXED INCOME FUNDS
Statements of Changes in Net Assets
| | | | | | | | | | |
| | | | | Core Fixed Income Fund | |
| | | | | For the
Six Months Ended
September 30, 2013
(Unaudited) | | | For the Fiscal
Year Ended
March 31, 2013 | |
| | From operations: | | | | | | | | |
| | Net investment income | | $ | 12,124,280 | | | $ | 26,980,404 | |
| | Net realized gain (loss) | | | (10,355,248 | ) | | | 27,192,978 | |
| | Net change in unrealized gain (loss) | | | (27,691,738 | ) | | | 24,848,735 | |
| | Net increase (decrease) in net assets resulting from operations | | | (25,922,706 | ) | | | 79,022,117 | |
| | | | | | | | | | |
| | Distributions to shareholders: | | | | | | | | |
| | From net investment income | | | | | | | | |
| | Class A Shares | | | (1,266,562 | ) | | | (3,666,379 | ) |
| | Class B Shares | | | (27,228 | ) | | | (103,723 | ) |
| | Class C Shares | | | (114,224 | ) | | | (372,511 | ) |
| | Institutional Shares | | | (11,257,510 | ) | | | (30,859,051 | ) |
| | Service Shares | | | (80,199 | ) | | | (264,291 | ) |
| | Class IR Shares | | | (15,654 | ) | | | (28,570 | ) |
| | Class R Shares | | | (4,502 | ) | | | (9,184 | ) |
| | From net realized gains | | | | | | | | |
| | Class A Shares | | | — | | | | — | |
| | Class B Shares | | | — | | | | — | |
| | Class C Shares | | | — | | | | — | |
| | Institutional Shares | | | — | | | | — | |
| | Service Shares | | | — | | | | — | |
| | Class IR Shares | | | — | | | | — | |
| | Class R Shares | | | — | | | | — | |
| | Total distributions to shareholders | | | (12,765,879 | ) | | | (35,303,709 | ) |
| | | | | | | | | | |
| | From share transactions: | | | | | | | | |
| | Proceeds from sales of shares | | | 110,642,435 | | | | 314,245,826 | |
| | Reinvestment of distributions | | | 11,907,281 | | | | 32,803,710 | |
| | Cost of shares redeemed | | | (311,811,257 | ) | | | (596,890,879 | ) |
| | Net increase (decrease) in net assets resulting from share transactions | | | (189,261,541 | ) | | | (249,841,343 | ) |
| | TOTAL INCREASE (DECREASE) | | | (227,950,126 | ) | | | (206,122,935 | ) |
| | | | | | | | | | |
| | Net assets: | | | | | | | | |
| | Beginning of period | | | 1,410,106,711 | | | | 1,616,229,646 | |
| | End of period | | $ | 1,182,156,585 | | | $ | 1,410,106,711 | |
| | Undistributed (distributions in excess of) net investment income | | $ | 12,239,815 | | | $ | 12,881,414 | |
| | |
| 120 | | The accompanying notes are an integral part of these financial statements. |
GOLDMAN SACHS MULTI SECTOR FIXED INCOME FUNDS
| | | | | | | | | | | | | | | | | | | | | | |
| | Core Plus Fixed Income Fund | | | | | Global Income Fund | |
| | | For the
Six Months Ended
September 30, 2013
(Unaudited) | | | | | For the Fiscal
Year Ended
March 31, 2013 | | | | | For the
Six Months Ended
September 30, 2013
(Unaudited) | | | | | For the Fiscal
Year Ended
March 31, 2013 | |
| | | | | | | | | | | | | | | | | | | | | | |
| | $ | 3,825,588 | | | | | $ | 7,320,346 | | | | | $ | 4,726,432 | | | | | $ | 12,021,067 | |
| | | (2,933,425 | ) | | | | | 9,842,885 | | | | | | 6,657,546 | | | | | | 26,750,451 | |
| | | (6,676,053 | ) | | | | | 9,203,897 | | | | | | (14,573,005 | ) | | | | | 3,753,823 | |
| | | (5,783,890 | ) | | | | | 26,367,128 | | | | | | (3,189,027 | ) | | | | | 42,525,341 | |
| | | | | | | | | | | | | | | | | | | | | | |
| | | | | | | | | | | | | | | | | | | | | | |
| | | | | | | | | | | | | | | | | | | | | | |
| | | (389,803 | ) | | | | | (2,097,695 | ) | | | | | (615,096 | ) | | | | | (3,422,155 | ) |
| | | (21,735 | ) | | | | | (70,430 | ) | | | | | (8,202 | ) | | | | | (37,699 | ) |
| | | (60,337 | ) | | | | | (157,821 | ) | | | | | (28,700 | ) | | | | | (107,946 | ) |
| | | (3,439,365 | ) | | | | | (6,435,495 | ) | | | | | (4,395,215 | ) | | | | | (13,168,429 | ) |
| | | (133 | ) | | | | | (295 | ) | | | | | (1,264 | ) | | | | | (3,870 | ) |
| | | (32,013 | ) | | | | | (70,721 | ) | | | | | (6,204 | ) | | | | | (15,418 | ) |
| | | (1,968 | ) | | | | | (1,435 | ) | | | | | — | | | | | | — | |
| | | | | | | | | | | | | | | | | | | | | | |
| | | — | | | | | | (2,789,937 | ) | | | | | — | | | | | | (4,030,873 | ) |
| | | — | | | | | | (137,263 | ) | | | | | — | | | | | | (66,778 | ) |
| | | — | | | | | | (312,717 | ) | | | | | — | | | | | | (188,244 | ) |
| | | — | | | | | | (7,381,950 | ) | | | | | — | | | | | | (13,890,223 | ) |
| | | — | | | | | | (422 | ) | | | | | — | | | | | | (6,107 | ) |
| | | — | | | | | | (85,190 | ) | | | | | — | | | | | | (18,908 | ) |
| | | — | | | | | | (667 | ) | | | | | — | | | | | | — | |
| | | (3,945,354 | ) | | | | | (19,542,038 | ) | | | | | (5,054,681 | ) | | | | | (34,956,650 | ) |
| | | | | | | | | | | | | | | | | | | | | | |
| | | | | | | | | | | | | | | | | | | | | | |
| | | 16,580,651 | | | | | | 105,132,375 | | | | | | 174,098,676 | | | | | | 172,511,841 | |
| | | 3,849,015 | | | | | | 19,029,155 | | | | | | 4,964,789 | | | | | | 34,482,719 | |
| | | (108,736,974 | ) | | | | | (114,465,116 | ) | | | | | (101,618,529 | ) | | | | | (520,702,491 | ) |
| | | (88,307,308 | ) | | | | | 9,696,414 | | | | | | 77,444,936 | | | | | | (313,707,931 | ) |
| | | (98,036,552 | ) | | | | | 16,521,504 | | | | | | 69,201,228 | | | | | | (306,139,240 | ) |
| | | | | | | | | | | | | | | | | | | | | | |
| | | | | | | | | | | | | | | | | | | | | | |
| | | 358,939,713 | | | | | | 342,418,209 | | | | | | 475,957,197 | | | | | | 782,096,437 | |
| | $ | 260,903,161 | | | | | $ | 358,939,713 | | | | | $ | 545,158,425 | | | | | $ | 475,957,197 | |
| | $ | 1,135,704 | | | | | $ | 1,255,470 | | | | | $ | 11,774,358 | | | | | $ | 12,102,607 | |
| | |
| The accompanying notes are an integral part of these financial statements. | | 121 |
GOLDMAN SACHS MULTI SECTOR FIXED INCOME FUNDS
Statements of Changes in Net Assets
| | | | | | | | | | |
| | | | | Strategic Income Fund | |
| | | | | For the
Six Months Ended
September 30, 2013
(Unaudited) | | | For the Fiscal
Year Ended
March 31, 2013 | |
| | From operations: | | | | | | | | |
| | Net investment income | | $ | 60,426,155 | | | $ | 76,010,101 | |
| | Net realized gain (loss) | | | (19,400,235 | ) | | | 42,820,581 | |
| | Net change in unrealized gain | | | 6,597,136 | | | | 119,197,608 | |
| | Net increase in net assets resulting from operations | | | 47,623,056 | | | | 238,028,290 | |
| | | | | | | | | | |
| | Distributions to shareholders: | | | | | | | | |
| | From net investment income | | | | | | | | |
| | Class A Shares | | | (13,497,715 | ) | | | (25,443,789 | ) |
| | Class C Shares | | | (2,568,913 | ) | | | (6,249,357 | ) |
| | Institutional Shares | | | (48,766,638 | ) | | | (75,727,358 | ) |
| | Class IR Shares | | | (2,385,790 | ) | | | (2,803,135 | ) |
| | Class R Shares | | | (2,638 | ) | | | (564 | ) |
| | Total distributions to shareholders | | | (67,221,694 | ) | | | (110,224,203 | ) |
| | | | | | | | | | |
| | From share transactions: | | | | | | | | |
| | Proceeds from sales of shares | | | 6,844,218,934 | | | | 2,293,607,272 | |
| | Reinvestment of distributions | | | 58,093,212 | | | | 100,590,900 | |
| | Cost of shares redeemed | | | (674,250,717 | ) | | | (957,532,280 | ) |
| | Net increase in net assets resulting from share transactions | | | 6,228,061,429 | | | | 1,436,665,892 | |
| | TOTAL INCREASE | | | 6,208,462,791 | | | | 1,564,469,979 | |
| | | | | | | | | | |
| | Net assets: | | | | | | | | |
| | Beginning of period | | | 3,485,433,158 | | | | 1,920,963,179 | |
| | End of period | | $ | 9,693,895,949 | | | $ | 3,485,433,158 | |
| | Undistributed net investment income | | $ | 11,443,276 | | | $ | 18,238,815 | |
| | |
| 122 | | The accompanying notes are an integral part of these financial statements. |
GOLDMAN SACHS MULTI SECTOR FIXED INCOME FUNDS
Statements of Changes in Net Assets
| | | | | | | | | | |
| | | | | World Bond Fund | |
| | | | | For the
Six Months Ended
September 30, 2013
(Unaudited) | | | For the Fiscal
Year Ended
March 31, 2013(a) | |
| | From operations: | | | | | | | | |
| | Net investment income | | $ | 65,498 | | | $ | 40,101 | |
| | Net realized gain (loss) | | | (93,006 | ) | | | 140,822 | |
| | Net change in unrealized loss | | | (191,915 | ) | | | (246,275 | ) |
| | Net decrease in net assets resulting from operations | | | (219,423 | ) | | | (65,352 | ) |
| | | | | | | | | | |
| | Distributions to shareholders: | | | | | | | | |
| | From net investment income | | | | | | | | |
| | Class A Shares | | | (286 | ) | | | (28 | ) |
| | Class C Shares | | | (5 | ) | | | (1 | ) |
| | Institutional Shares | | | (62,430 | ) | | | (38,949 | ) |
| | Class IR Shares | | | (53 | ) | | | (30 | ) |
| | Class R Shares | | | (21 | ) | | | (11 | ) |
| | Total distributions to shareholders | | | (62,795 | ) | | | (39,019 | ) |
| | | | | | | | | | |
| | From share transactions: | | | | | | | | |
| | Proceeds from sales of shares | | | 80,629 | | | | 12,036,004 | |
| | Reinvestment of distributions | | | 62,795 | | | | 39,019 | |
| | Cost of shares redeemed | | | (387 | ) | | | (121 | ) |
| | Net increase in net assets resulting from share transactions | | | 143,037 | | | | 12,074,902 | |
| | TOTAL INCREASE (DECREASE) | | | (139,181 | ) | | | 11,970,531 | |
| | | | | | | | | | |
| | Net assets: | | | | | | | | |
| | Beginning of period | | | 11,970,531 | | | | — | |
| | End of period | | $ | 11,831,350 | | | $ | 11,970,531 | |
| | Undistributed net investment income | | $ | 167,528 | | | $ | 164,825 | |
| | (a) | | Commenced operations on November 30, 2012. |
| | |
| The accompanying notes are an integral part of these financial statements. | | 123 |
GOLDMAN SACHS CORE FIXED INCOME FUND
Financial Highlights
Selected Data for a Share Outstanding Throughout Each Period
| | | | | | | | | | | | | | | | | | | | | | | | | | | | | | |
| | | | | | | | Income (loss) from
investment operations | | | Distributions
to shareholders | |
| | | Year - Share Class | |
Net asset
value,
beginning
of period | | | Net
investment
income(a) | | | Net realized
and unrealized
gain (loss) | | | Total from
investment
operations | | | From net
investment
income | | | From net
realized
gains | | | Total
distributions | |
| | FOR THE SIX MONTHS ENDED SEPTEMBER 30, (UNAUDITED) | |
| | 2013 - A | | $ | 10.61 | | | $ | 0.08 | | | $ | (0.29 | ) | | $ | (0.21 | ) | | $ | (0.09 | ) | | $ | — | | | $ | (0.09 | ) |
| | 2013 - B | | | 10.66 | | | | 0.04 | | | | (0.29 | ) | | | (0.25 | ) | | | (0.05 | ) | | | — | | | | (0.05 | ) |
| | 2013 - C | | | 10.67 | | | | 0.05 | | | | (0.30 | ) | | | (0.25 | ) | | | (0.05 | ) | | | — | | | | (0.05 | ) |
| | 2013 - Institutional | | | 10.65 | | | | 0.10 | | | | (0.28 | ) | | | (0.18 | ) | | | (0.11 | ) | | | — | | | | (0.11 | ) |
| | 2013 - Service | | | 10.66 | | | | 0.07 | | | | (0.29 | ) | | | (0.22 | ) | | | (0.08 | ) | | | — | | | | (0.08 | ) |
| | 2013 - IR | | | 10.62 | | | | 0.10 | | | | (0.30 | ) | | | (0.20 | ) | | | (0.10 | ) | | | — | | | | (0.10 | ) |
| | 2013 - R | | | 10.62 | | | | 0.07 | | | | (0.28 | ) | | | (0.21 | ) | | | (0.08 | ) | | | — | | | | (0.08 | ) |
| | | | | | | | | | | | | | | | | | | | | | | | | | | | | | |
| | FOR THE FISCAL YEARS ENDED MARCH 31, | |
| | 2013 - A | | | 10.31 | | | | 0.16 | | | | 0.36 | | | | 0.52 | | | | (0.22 | ) | | | — | | | | (0.22 | ) |
| | 2013 - B | | | 10.36 | | | | 0.08 | | | | 0.36 | | | | 0.44 | | | | (0.14 | ) | | | — | | | | (0.14 | ) |
| | 2013 - C | | | 10.37 | | | | 0.08 | | | | 0.36 | | | | 0.44 | | | | (0.14 | ) | | | — | | | | (0.14 | ) |
| | 2013 - Institutional | | | 10.36 | | | | 0.20 | | | | 0.35 | | | | 0.55 | | | | (0.26 | ) | | | — | | | | (0.26 | ) |
| | 2013 - Service | | | 10.36 | | | | 0.14 | | | | 0.37 | | | | 0.51 | | | | (0.21 | ) | | | — | | | | (0.21 | ) |
| | 2013 - IR | | | 10.32 | | | | 0.19 | | | | 0.36 | | | | 0.55 | | | | (0.25 | ) | | | — | | | | (0.25 | ) |
| | 2013 - R | | | 10.33 | | | | 0.13 | | | | 0.36 | | | | 0.49 | | | | (0.20 | ) | | | — | | | | (0.20 | ) |
| | 2012 - A | | | 9.79 | | | | 0.19 | | | | 0.53 | | | | 0.72 | | | | (0.20 | ) | | | — | | | | (0.20 | ) |
| | 2012 - B | | | 9.84 | | | | 0.12 | | | | 0.52 | | | | 0.64 | | | | (0.12 | ) | | | — | | | | (0.12 | ) |
| | 2012 - C | | | 9.84 | | | | 0.12 | | | | 0.53 | | | | 0.65 | | | | (0.12 | ) | | | — | | | | (0.12 | ) |
| | 2012 - Institutional | | | 9.83 | | | | 0.23 | | | | 0.53 | | | | 0.76 | | | | (0.23 | ) | | | — | | | | (0.23 | ) |
| | 2012 - Service | | | 9.84 | | | | 0.17 | | | | 0.53 | | | | 0.70 | | | | (0.18 | ) | | | — | | | | (0.18 | ) |
| | 2012 - IR | | | 9.79 | | | | 0.22 | | | | 0.53 | | | | 0.75 | | | | (0.22 | ) | | | — | | | | (0.22 | ) |
| | 2012 - R | | | 9.80 | | | | 0.17 | | | | 0.53 | | | | 0.70 | | | | (0.17 | ) | | | — | | | | (0.17 | ) |
| | 2011 - A | | | 9.53 | | | | 0.21 | | | | 0.29 | | | | 0.50 | | | | (0.24 | ) | | | — | | | | (0.24 | ) |
| | 2011 - B | | | 9.57 | | | | 0.14 | | | | 0.29 | | | | 0.43 | | | | (0.16 | ) | | | — | | | | (0.16 | ) |
| | 2011 - C | | | 9.58 | | | | 0.14 | | | | 0.28 | | | | 0.42 | | | | (0.16 | ) | | | — | | | | (0.16 | ) |
| | 2011 - Institutional | | | 9.57 | | | | 0.24 | | | | 0.29 | | | | 0.53 | | | | (0.27 | ) | | | — | | | | (0.27 | ) |
| | 2011 - Service | | | 9.58 | | | | 0.20 | | | | 0.28 | | | | 0.48 | | | | (0.22 | ) | | | — | | | | (0.22 | ) |
| | 2011 - IR | | | 9.54 | | | | 0.23 | | | | 0.28 | | | | 0.51 | | | | (0.26 | ) | | | — | | | | (0.26 | ) |
| | 2011 - R | | | 9.54 | | | | 0.18 | | | | 0.29 | | | | 0.47 | | | | (0.21 | ) | | | — | | | | (0.21 | ) |
| | 2010 - A | | | 8.27 | | | | 0.31 | | | | 1.27 | | | | 1.58 | | | | (0.32 | ) | | | — | | | | (0.32 | ) |
| | 2010 - B | | | 8.31 | | | | 0.24 | | | | 1.27 | | | | 1.51 | | | | (0.25 | ) | | | — | | | | (0.25 | ) |
| | 2010 - C | | | 8.31 | | | | 0.24 | | | | 1.28 | | | | 1.52 | | | | (0.25 | ) | | | — | | | | (0.25 | ) |
| | 2010 - Institutional | | | 8.30 | | | | 0.34 | | | | 1.28 | | | | 1.62 | | | | (0.35 | ) | | | — | | | | (0.35 | ) |
| | 2010 - Service | | | 8.31 | | | | 0.30 | | | | 1.27 | | | | 1.57 | | | | (0.30 | ) | | | — | | | | (0.30 | ) |
| | 2010 - IR | | | 8.28 | | | | 0.31 | | | | 1.29 | | | | 1.60 | | | | (0.34 | ) | | | — | | | | (0.34 | ) |
| | 2010 - R | | | 8.28 | | | | 0.28 | | | | 1.28 | | | | 1.56 | | | | (0.30 | ) | | | — | | | | (0.30 | ) |
| | 2009 - A | | | 9.57 | | | | 0.42 | | | | (1.23 | ) | | | (0.81 | ) | | | (0.44 | ) | | | (0.05 | ) | | | (0.49 | ) |
| | 2009 - B | | | 9.61 | | | | 0.35 | | | | (1.23 | ) | | | (0.88 | ) | | | (0.37 | ) | | | (0.05 | ) | | | (0.42 | ) |
| | 2009 - C | | | 9.61 | | | | 0.35 | | | | (1.23 | ) | | | (0.88 | ) | | | (0.37 | ) | | | (0.05 | ) | | | (0.42 | ) |
| | 2009 - Institutional | | | 9.60 | | | | 0.45 | | | | (1.23 | ) | | | (0.78 | ) | | | (0.47 | ) | | | (0.05 | ) | | | (0.52 | ) |
| | 2009 - Service | | | 9.61 | | | | 0.41 | | | | (1.24 | ) | | | (0.83 | ) | | | (0.42 | ) | | | (0.05 | ) | | | (0.47 | ) |
| | 2009 - IR | | | 9.58 | | | | 0.44 | | | | (1.23 | ) | | | (0.79 | ) | | | (0.46 | ) | | | (0.05 | ) | | | (0.51 | ) |
| | 2009 - R | | | 9.57 | | | | 0.40 | | | | (1.22 | ) | | | (0.82 | ) | | | (0.42 | ) | | | (0.05 | ) | | | (0.47 | ) |
| | (a) | | Calculated based on the average shares outstanding methodology. |
| | (b) | | Assumes investment at the net asset value at the beginning of the period, reinvestment of all dividends and distributions, a complete redemption of the investment at the net asset value at the end of the period and no sales or redemption charges. Total returns would be reduced if a sales or redemption charge was taken into account. Returns do not reflect the deduction of taxes that a shareholder would pay on Fund distributions or the redemption of Fund shares. Total returns for periods less than one full year are not annualized. |
| | (c) | | The Fund’s portfolio turnover rate is calculated in accordance with regulatory requirements, without regard to transactions involving short term investments and certain derivatives. If such transactions were included, the Fund’s portfolio turnover rate may be higher. |
| | |
| 124 | | The accompanying notes are an integral part of these financial statements. |
GOLDMAN SACHS CORE FIXED INCOME FUND
| | | | | | | | | | | | | | | | | | | | | | | | | | | | | | | | | | | | | | | | |
| | | | | | | | | | | | | | | | | | | | | | | | | | | | | | | | | | |
| | | Net asset
value, end
of period | | | | | Total
return(b) | | | | | Net assets,
end of
period
(in 000s) | | | | | Ratio of
net expenses
to average
net assets | | | | | Ratio of
total expenses
to average
net assets | | | | | Ratio of
net investment
income
to average
net assets | | | | | Portfolio
turnover
rate(c) | |
| | | | | | | | | | | | | | | | | | | | | | | | | | | | | | | | | | | | | | | | |
| | $ | 10.31 | | | | | | (1.99 | )% | | | | $ | 138,608 | | | | | | 0.82 | %(d) | | | | | 0.82 | %(d) | | | | | 1.61 | %(d) | | | | | 332 | % |
| | | 10.36 | | | | | | (2.34 | ) | | | | | 4,779 | | | | | | 1.57 | (d) | | | | | 1.57 | (d) | | | | | 0.85 | (d) | | | | | 332 | |
| | | 10.37 | | | | | | (2.34 | ) | | | | | 22,383 | | | | | | 1.57 | (d) | | | | | 1.57 | (d) | | | | | 0.86 | (d) | | | | | 332 | |
| | | 10.36 | | | | | | (1.72 | ) | | | | | 1,012,066 | | | | | | 0.48 | (d) | | | | | 0.48 | (d) | | | | | 1.94 | (d) | | | | | 332 | |
| | | 10.36 | | | | | | (2.06 | ) | | | | | 2,562 | | | | | | 0.98 | (d) | | | | | 0.98 | (d) | | | | | 1.30 | (d) | | | | | 332 | |
| | | 10.32 | | | | | | (1.87 | ) | | | | | 1,213 | | | | | | 0.57 | (d) | | | | | 0.57 | (d) | | | | | 1.86 | (d) | | | | | 332 | |
| | | 10.33 | | | | | | (2.02 | ) | | | | | 545 | | | | | | 1.07 | (d) | | | | | 1.07 | (d) | | | | | 1.35 | (d) | | | | | 332 | |
| | | | | | | | | | | | | | | | | | | | | | | | | | | | | | | | | | | | | | | | |
| | | | | | | | | | | | | | | | | | | | | | | | | | | | | | | | | | | | | | | | |
| | | 10.61 | | | | | | 5.08 | | | | | | 159,470 | | | | | | 0.81 | | | | | | 0.81 | | | | | | 1.54 | | | | | | 782 | |
| | | 10.66 | | | | | | 4.28 | | | | | | 6,531 | | | | | | 1.56 | | | | | | 1.56 | | | | | | 0.79 | | | | | | 782 | |
| | | 10.67 | | | | | | 4.28 | | | | | | 25,723 | | | | | | 1.56 | | | | | | 1.56 | | | | | | 0.79 | | | | | | 782 | |
| | | 10.65 | | | | | | 5.32 | | | | | | 1,198,584 | | | | | | 0.47 | | | | | | 0.47 | | | | | | 1.88 | | | | | | 782 | |
| | | 10.66 | | | | | | 4.90 | | | | | | 17,528 | | | | | | 0.97 | | | | | | 0.97 | | | | | | 1.35 | | | | | | 782 | |
| | | 10.62 | | | | | | 5.34 | | | | | | 1,622 | | | | | | 0.56 | | | | | | 0.56 | | | | | | 1.78 | | | | | | 782 | |
| | | 10.62 | | | | | | 4.72 | | | | | | 648 | | | | | | 1.06 | | | | | | 1.06 | | | | | | 1.24 | | | | | | 782 | |
| | | 10.31 | | | | | | 7.37 | | | | | | 204,327 | | | | | | 0.81 | | | | | | 0.81 | | | | | | 1.90 | | | | | | 687 | |
| | | 10.36 | | | | | | 6.55 | | | | | | 8,065 | | | | | | 1.56 | | | | | | 1.56 | | | | | | 1.14 | | | | | | 687 | |
| | | 10.37 | | | | | | 6.65 | | | | | | 28,539 | | | | | | 1.56 | | | | | | 1.56 | | | | | | 1.13 | | | | | | 687 | |
| | | 10.36 | | | | | | 7.81 | | | | | | 1,363,229 | | | | | | 0.47 | | | | | | 0.47 | | | | | | 2.23 | | | | | | 687 | |
| | | 10.36 | | | | | | 7.17 | | | | | | 10,969 | | | | | | 0.97 | | | | | | 0.97 | | | | | | 1.70 | | | | | | 687 | |
| | | 10.32 | | | | | | 7.74 | | | | | | 1,081 | | | | | | 0.56 | | | | | | 0.56 | | | | | | 2.14 | | | | | | 687 | |
| | | 10.33 | | | | | | 7.21 | | | | | | 19 | | | | | | 1.06 | | | | | | 1.06 | | | | | | 1.64 | | | | | | 687 | |
| | | 9.79 | | | | | | 5.24 | | | | | | 694,255 | | | | | | 0.81 | | | | | | 0.81 | | | | | | 2.13 | | | | | | 554 | |
| | | 9.84 | | | | | | 4.55 | | | | | | 11,234 | | | | | | 1.56 | | | | | | 1.56 | | | | | | 1.39 | | | | | | 554 | |
| | | 9.84 | | | | | | 4.44 | | | | | | 27,993 | | | | | | 1.56 | | | | | | 1.56 | | | | | | 1.38 | | | | | | 554 | |
| | | 9.83 | | | | | | 5.58 | | | | | | 1,041,837 | | | | | | 0.47 | | | | | | 0.47 | | | | | | 2.45 | | | | | | 554 | |
| | | 9.84 | | | | | | 5.17 | | | | | | 3,966 | | | | | | 0.97 | | | | | | 0.97 | | | | | | 1.98 | | | | | | 554 | |
| | | 9.79 | | | | | | 5.39 | | | | | | 1,538 | | | | | | 0.56 | | | | | | 0.56 | | | | | | 2.30 | | | | | | 554 | |
| | | 9.80 | | | | | | 4.98 | | | | | | 17 | | | | | | 1.06 | | | | | | 1.06 | | | | | | 1.88 | | | | | | 554 | |
| | | 9.53 | | | | | | 19.32 | | | | | | 804,834 | | | | | | 0.82 | | | | | | 0.82 | | | | | | 3.37 | | | | | | 418 | |
| | | 9.57 | | | | | | 18.36 | | | | | | 16,680 | | | | | | 1.57 | | | | | | 1.57 | | | | | | 2.68 | | | | | | 418 | |
| | | 9.58 | | | | | | 18.48 | | | | | | 33,260 | | | | | | 1.57 | | | | | | 1.57 | | | | | | 2.62 | | | | | | 418 | |
| | | 9.57 | | | | | | 19.79 | | | | | | 705,704 | | | | | | 0.48 | | | | | | 0.48 | | | | | | 3.78 | | | | | | 418 | |
| | | 9.58 | | | | | | 19.05 | | | | | | 5,580 | | | | | | 0.98 | | | | | | 0.98 | | | | | | 3.30 | | | | | | 418 | |
| | | 9.54 | | | | | | 19.58 | | | | | | 69 | | | | | | 0.57 | | | | | | 0.57 | | | | | | 3.30 | | | | | | 418 | |
| | | 9.54 | | | | | | 19.03 | | | | | | 14 | | | | | | 1.07 | | | | | | 1.07 | | | | | | 3.10 | | | | | | 418 | |
| | | 8.27 | | | | | | (8.63 | ) | | | | | 600,963 | | | | | | 0.80 | | | | | | 0.81 | | | | | | 4.70 | | | | | | 413 | |
| | | 8.31 | | | | | | (9.26 | ) | | | | | 17,694 | | | | | | 1.55 | | | | | | 1.56 | | | | | | 3.95 | | | | | | 413 | |
| | | 8.31 | | | | | | (9.26 | ) | | | | | 24,655 | | | | | | 1.55 | | | | | | 1.56 | | | | | | 3.95 | | | | | | 413 | |
| | | 8.30 | | | | | | (8.27 | ) | | | | | 851,372 | | | | | | 0.46 | | | | | | 0.47 | | | | | | 5.04 | | | | | | 413 | |
| | | 8.31 | | | | | | (8.72 | ) | | | | | 7,333 | | | | | | 0.96 | | | | | | 0.97 | | | | | | 4.55 | | | | | | 413 | |
| | | 8.28 | | | | | | (8.39 | ) | | | | | 9 | | | | | | 0.55 | | | | | | 0.56 | | | | | | 4.97 | | | | | | 413 | |
| | | 8.28 | | | | | | (8.81 | ) | | | | | 9 | | | | | | 1.05 | | | | | | 1.06 | | | | | | 4.51 | | | | | | 413 | |
| | |
| The accompanying notes are an integral part of these financial statements. | | 125 |
GOLDMAN SACHS CORE PLUS FIXED INCOME FUND
Financial Highlights
Selected Data for a Share Outstanding Throughout Each Period
| | | | | | | | | | | | | | | | | | | | | | | | | | | | | | |
| | | | | | | | Income (loss) from
investment operations | | | Distributions
to shareholders | |
| | | Year - Share Class | |
Net asset
value,
beginning
of period | | | Net
investment
income(a) | | | Net realized
and unrealized
gain (loss) | | | Total from
investment
operations | | | From net
investment
income | | | From net
realized
gains | | | Total
distributions | |
| | FOR THE SIX MONTHS ENDED SEPTEMBER 30, (UNAUDITED) | |
| | 2013 - A | | $ | 10.57 | | | $ | 0.10 | | | $ | (0.24 | ) | | $ | (0.14 | ) | | $ | (0.11 | ) | | $ | — | | | $ | (0.11 | ) |
| | 2013 - B | | | 10.57 | | | | 0.06 | | | | (0.25 | ) | | | (0.19 | ) | | | (0.07 | ) | | | — | | | | (0.07 | ) |
| | 2013 - C | | | 10.57 | | | | 0.06 | | | | (0.25 | ) | | | (0.19 | ) | | | (0.07 | ) | | | — | | | | (0.07 | ) |
| | 2013 - Institutional | | | 10.57 | | | | 0.12 | | | | (0.25 | ) | | | (0.13 | ) | | | (0.12 | ) | | | — | | | | (0.12 | ) |
| | 2013 - Service | | | 10.57 | | | | 0.09 | | | | (0.25 | ) | | | (0.16 | ) | | | (0.10 | ) | | | — | | | | (0.10 | ) |
| | 2013 - IR | | | 10.54 | | | | 0.12 | | | | (0.25 | ) | | | (0.13 | ) | | | (0.12 | ) | | | — | | | | (0.12 | ) |
| | 2013 - R | | | 10.57 | | | | 0.09 | | | | (0.26 | ) | | | (0.17 | ) | | | (0.09 | ) | | | — | | | | (0.09 | ) |
| | | | | | | | | | | | | | | | | | | | | | | | | | | | | | |
| | FOR THE FISCAL YEARS ENDED MARCH 31, | |
| | 2013 - A | | | 10.37 | | | | 0.20 | | | | 0.57 | | | | 0.77 | | | | (0.25 | ) | | | (0.32 | ) | | | (0.57 | ) |
| | 2013 - B | | | 10.36 | | | | 0.12 | | | | 0.58 | | | | 0.70 | | | | (0.17 | ) | | | (0.32 | ) | | | (0.49 | ) |
| | 2013 - C | | | 10.37 | | | | 0.12 | | | | 0.57 | | | | 0.69 | | | | (0.17 | ) | | | (0.32 | ) | | | (0.49 | ) |
| | 2013 - Institutional | | | 10.37 | | | | 0.23 | | | | 0.57 | | | | 0.80 | | | | (0.28 | ) | | | (0.32 | ) | | | (0.60 | ) |
| | 2013 - Service | | | 10.37 | | | | 0.18 | | | | 0.57 | | | | 0.75 | | | | (0.23 | ) | | | (0.32 | ) | | | (0.55 | ) |
| | 2013 - IR | | | 10.34 | | | | 0.22 | | | | 0.57 | | | | 0.79 | | | | (0.27 | ) | | | (0.32 | ) | | | (0.59 | ) |
| | 2013 - R | | | 10.37 | | | | 0.18 | | | | 0.56 | | | | 0.74 | | | | (0.22 | ) | | | (0.32 | ) | | | (0.54 | ) |
| | 2012 - A | | | 10.17 | | | | 0.27 | | | | 0.42 | | | | 0.69 | | | | (0.27 | ) | | | (0.22 | ) | | | (0.49 | ) |
| | 2012 - B | | | 10.16 | | | | 0.19 | | | | 0.42 | | | | 0.61 | | | | (0.19 | ) | | | (0.22 | ) | | | (0.41 | ) |
| | 2012 - C | | | 10.16 | | | | 0.19 | | | | 0.43 | | | | 0.62 | | | | (0.19 | ) | | | (0.22 | ) | | | (0.41 | ) |
| | 2012 - Institutional | | | 10.17 | | | | 0.30 | | | | 0.43 | | | | 0.73 | | | | (0.31 | ) | | | (0.22 | ) | | | (0.53 | ) |
| | 2012 - Service | | | 10.17 | | | | 0.25 | | | | 0.43 | | | | 0.68 | | | | (0.26 | ) | | | (0.22 | ) | | | (0.48 | ) |
| | 2012 - IR | | | 10.18 | | | | 0.29 | | | | 0.38 | | | | 0.67 | | | | (0.29 | ) | | | (0.22 | ) | | | (0.51 | ) |
| | 2012 - R | | | 10.17 | | | | 0.25 | | | | 0.41 | | | | 0.66 | | | | (0.24 | ) | | | (0.22 | ) | | | (0.46 | ) |
| | 2011 - A | | | 10.20 | | | | 0.28 | | | | 0.33 | | | | 0.61 | | | | (0.31 | )(e) | | | (0.33 | ) | | | (0.64 | ) |
| | 2011 - B | | | 10.20 | | | | 0.21 | | | | 0.31 | | | | 0.52 | | | | (0.23 | )(e) | | | (0.33 | ) | | | (0.56 | ) |
| | 2011 - C | | | 10.20 | | | | 0.21 | | | | 0.31 | | | | 0.52 | | | | (0.23 | )(e) | | | (0.33 | ) | | | (0.56 | ) |
| | 2011 - Institutional | | | 10.20 | | | | 0.32 | | | | 0.32 | | | | 0.64 | | | | (0.34 | )(e) | | | (0.33 | ) | | | (0.67 | ) |
| | 2011 - Service | | | 10.20 | | | | 0.27 | | | | 0.32 | | | | 0.59 | | | | (0.29 | )(e) | | | (0.33 | ) | | | (0.62 | ) |
| | 2011 - IR | | | 10.21 | | | | 0.31 | | | | 0.32 | | | | 0.63 | | | | (0.33 | )(e) | | | (0.33 | ) | | | (0.66 | ) |
| | 2011 - R | | | 10.20 | | | | 0.26 | | | | 0.32 | | | | 0.58 | | | | (0.28 | )(e) | | | (0.33 | ) | | | (0.61 | ) |
| | 2010 - A | | | 9.16 | | | | 0.34 | | | | 1.07 | | | | 1.41 | | | | (0.37 | ) | | | — | | | | (0.37 | ) |
| | 2010 - B | | | 9.15 | | | | 0.28 | | | | 1.07 | | | | 1.35 | | | | (0.30 | ) | | | — | | | | (0.30 | ) |
| | 2010 - C | | | 9.15 | | | | 0.28 | | | | 1.07 | | | | 1.35 | | | | (0.30 | ) | | | — | | | | (0.30 | ) |
| | 2010 - Institutional | | | 9.16 | | | | 0.37 | | | | 1.07 | | | | 1.44 | | | | (0.40 | ) | | | — | | | | (0.40 | ) |
| | 2010 - Service | | | 9.16 | | | | 0.34 | | | | 1.05 | | | | 1.39 | | | | (0.35 | ) | | | — | | | | (0.35 | ) |
| | 2010 - IR | | | 9.16 | | | | 0.32 | | | | 1.12 | | | | 1.44 | | | | (0.39 | ) | | | — | | | | (0.39 | ) |
| | 2010 - R | | | 9.16 | | | | 0.31 | | | | 1.07 | | | | 1.38 | | | | (0.34 | ) | | | — | | | | (0.34 | ) |
| | 2009 - A | | | 9.90 | | | | 0.43 | | | | (0.75 | ) | | | (0.32 | ) | | | (0.42 | ) | | | — | | | | (0.42 | ) |
| | 2009 - B | | | 9.90 | | | | 0.36 | | | | (0.76 | ) | | | (0.40 | ) | | | (0.35 | ) | | | — | | | | (0.35 | ) |
| | 2009 - C | | | 9.90 | | | | 0.36 | | | | (0.76 | ) | | | (0.40 | ) | | | (0.35 | ) | | | — | | | | (0.35 | ) |
| | 2009 - Institutional | | | 9.90 | | | | 0.46 | | | | (0.74 | ) | | | (0.28 | ) | | | (0.46 | ) | | | — | | | | (0.46 | ) |
| | 2009 - Service | | | 9.90 | | | | 0.41 | | | | (0.74 | ) | | | (0.33 | ) | | | (0.41 | ) | | | — | | | | (0.41 | ) |
| | 2009 - IR | | | 9.91 | | | | 0.45 | | | | (0.75 | ) | | | (0.30 | ) | | | (0.45 | ) | | | — | | | | (0.45 | ) |
| | 2009 - R | | | 9.91 | | | | 0.40 | | | | (0.75 | ) | | | (0.35 | ) | | | (0.40 | ) | | | — | | | | (0.40 | ) |
| | (a) | | Calculated based on the average shares outstanding methodology. |
| | (b) | | Assumes investment at the net asset value at the beginning of the period, reinvestment of all dividends and distributions, a complete redemption of the investment at the net asset value at the end of the period and no sales or redemption charges. Total returns would be reduced if a sales or redemption charge was taken into account. Returns do not reflect the deduction of taxes that a shareholder would pay on Fund distributions or the redemption of Fund shares. Total returns for periods less than one full year are not annualized. |
| | (c) | | The Fund’s portfolio turnover rate is calculated in accordance with regulatory requirements, without regard to transactions involving short term investments and certain derivatives. If such transactions were included, the Fund’s portfolio turnover rate may be higher. |
| | (e) | | Includes a tax return of capital amounting to less than $0.01 per share. |
| | (f) | | Includes a non-recurring reduction of expenses of a merged fund which amounted to 0.06% of average net assets. |
| | |
| 126 | | The accompanying notes are an integral part of these financial statements. |
GOLDMAN SACHS CORE PLUS FIXED INCOME FUND
| | | | | | | | | | | | | | | | | | | | | | | | | | | | | | | | | | | | | | | | |
| | | | | | | | | | | | | | | | | | | | | | | | | | | | | | | | | | |
| | | Net asset
value, end
of period | | | | | Total
return(b) | | | | | Net assets,
end of
period
(in 000s) | | | | | Ratio of
net expenses
to average
net assets | | | | | Ratio of
total expenses
to average
net assets | | | | | Ratio of
net investment
income
to average
net assets | | | | | Portfolio
turnover
rate(c) | |
| | | | | | | | | | | | | | | | | | | | | | | | | | | | | | | | | | | | | | | | |
| | $ | 10.32 | | | | | | (1.36 | )% | | | | $ | 34,771 | | | | | | 0.84 | %(d) | | | | | 1.02 | %(d) | | | | | 1.97 | %(d) | | | | | 370 | % |
| | | 10.31 | | | | | | (1.83 | ) | | | | | 2,845 | | | | | | 1.59 | (d) | | | | | 1.77 | (d) | | | | | 1.21 | (d) | | | | | 370 | |
| | | 10.31 | | | | | | (1.83 | ) | | | | | 8,486 | | | | | | 1.59 | (d) | | | | | 1.77 | (d) | | | | | 1.22 | (d) | | | | | 370 | |
| | | 10.32 | | | | | | (1.19 | ) | | | | | 211,920 | | | | | | 0.50 | (d) | | | | | 0.68 | (d) | | | | | 2.30 | (d) | | | | | 370 | |
| | | 10.31 | | | | | | (1.44 | ) | | | | | 14 | | | | | | 1.00 | (d) | | | | | 1.18 | (d) | | | | | 1.81 | (d) | | | | | 370 | |
| | | 10.29 | | | | | | (1.24 | ) | | | | | 2,742 | | | | | | 0.59 | (d) | | | | | 0.77 | (d) | | | | | 2.22 | (d) | | | | | 370 | |
| | | 10.31 | | | | | | (1.58 | ) | | | | | 126 | | | | | | 1.09 | (d) | | | | | 1.26 | (d) | | | | | 1.68 | (d) | | | | | 370 | |
| | | | | | | | | | | | | | | | | | | | | | | | | | | | | | | | | | | | | | | | |
| | | | | | | | | | | | | | | | | | | | | | | | | | | | | | | | | | | | | | | | |
| | | 10.57 | | | | | | 7.48 | | | | | | 40,783 | | | | | | 0.83 | | | | | | 0.98 | | | | | | 1.86 | | | | | | 1,025 | |
| | | 10.57 | | | | | | 6.79 | | | | | | 3,907 | | | | | | 1.58 | | | | | | 1.73 | | | | | | 1.11 | | | | | | 1,025 | |
| | | 10.57 | | | | | | 6.68 | | | | | | 9,993 | | | | | | 1.58 | | | | | | 1.73 | | | | | | 1.11 | | | | | | 1,025 | |
| | | 10.57 | | | | | | 7.84 | | | | | | 301,201 | | | | | | 0.49 | | | | | | 0.64 | | | | | | 2.20 | | | | | | 1,025 | |
| | | 10.57 | | | | | | 7.31 | | | | | | 14 | | | | | | 0.99 | | | | | | 1.13 | | | | | | 1.70 | | | | | | 1,025 | |
| | | 10.54 | | | | | | 7.76 | | | | | | 2,847 | | | | | | 0.58 | | | | | | 0.73 | | | | | | 2.11 | | | | | | 1,025 | |
| | | 10.57 | | | | | | 7.22 | | | | | | 195 | | | | | | 1.08 | | | | | | 1.24 | | | | | | 1.68 | | | | | | 1,025 | |
| | | 10.37 | | | | | | 6.89 | | | | | | 91,437 | | | | | | 0.83 | | | | | | 0.99 | | | | | | 2.60 | | | | | | 767 | |
| | | 10.36 | | | | | | 6.10 | | | | | | 4,924 | | | | | | 1.58 | | | | | | 1.74 | | | | | | 1.85 | | | | | | 767 | |
| | | 10.37 | | | | | | 6.20 | | | | | | 10,592 | | | | | | 1.58 | | | | | | 1.74 | | | | | | 1.85 | | | | | | 767 | |
| | | 10.37 | | | | | | 7.25 | | | | | | 232,692 | | | | | | 0.49 | | | | | | 0.65 | | | | | | 2.94 | | | | | | 767 | |
| | | 10.37 | | | | | | 6.75 | | | | | | 13 | | | | | | 0.99 | | | | | | 1.15 | | | | | | 2.44 | | | | | | 767 | |
| | | 10.34 | | | | | | 6.74 | | | | | | 2,739 | | | | | | 0.58 | | | | | | 0.74 | | | | | | 2.82 | | | | | | 767 | |
| | | 10.37 | | | | | | 6.63 | | | | | | 21 | | | | | | 1.08 | | | | | | 1.24 | | | | | | 2.37 | | | | | | 767 | |
| | | 10.17 | | | | | | 6.06 | | | | | | 93,196 | | | | | | 0.83 | | | | | | 1.00 | | | | | | 2.72 | | | | | | 673 | |
| | | 10.16 | | | | | | 5.27 | | | | | | 6,349 | | | | | | 1.58 | | | | | | 1.75 | | | | | | 2.01 | | | | | | 673 | |
| | | 10.16 | | | | | | 5.27 | | | | | | 10,824 | | | | | | 1.58 | | | | | | 1.75 | | | | | | 1.99 | | | | | | 673 | |
| | | 10.17 | | | | | | 6.42 | | | | | | 198,465 | | | | | | 0.49 | | | | | | 0.66 | | | | | | 3.07 | | | | | | 673 | |
| | | 10.17 | | | | | | 5.91 | | | | | | 12 | | | | | | 0.99 | | | | | | 1.16 | | | | | | 2.58 | | | | | | 673 | |
| | | 10.18 | | | | | | 6.32 | | | | | | 364 | | | | | | 0.58 | | | | | | 0.75 | | | | | | 2.96 | | | | | | 673 | |
| | | 10.17 | | | | | | 5.80 | | | | | | 36 | | | | | | 1.08 | | | | | | 1.25 | | | | | | 2.49 | | | | | | 673 | |
| | | 10.20 | | | | | | 15.60 | | | | | | 94,351 | | | | | | 0.83 | | | | | | 1.14 | | | | | | 3.48 | | | | | | 419 | |
| | | 10.20 | | | | | | 14.75 | | | | | | 9,193 | | | | | | 1.58 | | | | | | 1.89 | | | | | | 2.87 | | | | | | 419 | |
| | | 10.20 | | | | | | 14.75 | | | | | | 12,661 | | | | | | 1.58 | | | | | | 1.89 | | | | | | 2.83 | | | | | | 419 | |
| | | 10.20 | | | | | | 15.99 | | | | | | 191,051 | | | | | | 0.49 | | | | | | 0.80 | | | | | | 3.72 | | | | | | 419 | |
| | | 10.20 | | | | | | 15.42 | | | | | | 12 | | | | | | 0.99 | | | | | | 1.30 | | | | | | 3.44 | | | | | | 419 | |
| | | 10.21 | | | | | | 16.00 | | | | | | 294 | | | | | | 0.58 | | | | | | 0.89 | | | | | | 3.23 | | | | | | 419 | |
| | | 10.20 | | | | | | 15.30 | | | | | | 37 | | | | | | 1.08 | | | | | | 1.39 | | | | | | 3.15 | | | | | | 419 | |
| | | 9.16 | | | | | | (3.17 | ) | | | | | 45,686 | | | | | | 0.75 | (f) | | | | | 1.33 | (f) | | | | | 4.57 | (f) | | | | | 365 | |
| | | 9.15 | | | | | | (4.00 | ) | | | | | 10,626 | | | | | | 1.50 | (f) | | | | | 2.08 | (f) | | | | | 3.82 | (f) | | | | | 365 | |
| | | 9.15 | | | | | | (4.00 | ) | | | | | 11,040 | | | | | | 1.50 | (f) | | | | | 2.08 | (f) | | | | | 3.82 | (f) | | | | | 365 | |
| | | 9.16 | | | | | | (2.84 | ) | | | | | 43,681 | | | | | | 0.41 | (f) | | | | | 0.99 | (f) | | | | | 4.91 | (f) | | | | | 365 | |
| | | 9.16 | | | | | | (3.34 | ) | | | | | 10 | | | | | | 0.91 | (f) | | | | | 1.49 | (f) | | | | | 4.38 | (f) | | | | | 365 | |
| | | 9.16 | | | | | | (3.02 | ) | | | | | 10 | | | | | | 0.50 | (f) | | | | | 1.08 | (f) | | | | | 4.82 | (f) | | | | | 365 | |
| | | 9.16 | | | | | | (3.49 | ) | | | | | 10 | | | | | | 1.00 | (f) | | | | | 1.58 | (f) | | | | | 4.32 | (f) | | | | | 365 | |
| | |
| The accompanying notes are an integral part of these financial statements. | | 127 |
GOLDMAN SACHS GLOBAL INCOME FUND
Financial Highlights
Selected Data for a Share Outstanding Throughout Each Period
| | | | | | | | | | | | | | | | | | | | | | | | | | | | | | |
| | | | | | | | Income (loss) from
investment operations | | | Distributions
to shareholders | |
| | | Year - Share Class | |
Net asset
value,
beginning
of period | | | Net
investment
income(a) | | | Net realized
and unrealized
gain (loss) | | | Total from
investment
operations | | | From net
investment
income | | | From net
realized
gains | | | Total
distributions | |
| | FOR THE SIX MONTHS ENDED SEPTEMBER 30, (UNAUDITED) | |
| | 2013 - A | | $ | 13.20 | | | $ | 0.11 | | | $ | (0.23 | ) | | $ | (0.12 | ) | | $ | (0.12 | ) | | $ | — | | | $ | (0.12 | ) |
| | 2013 - B | | | 13.15 | | | | 0.06 | | | | (0.23 | ) | | | (0.17 | ) | | | (0.07 | ) | | | — | | | | (0.07 | ) |
| | 2013 - C | | | 13.11 | | | | 0.06 | | | | (0.23 | ) | | | (0.17 | ) | | | (0.07 | ) | | | — | | | | (0.07 | ) |
| | 2013 - Institutional | | | 13.18 | | | | 0.13 | | | | (0.23 | ) | | | (0.10 | ) | | | (0.14 | ) | | | — | | | | (0.14 | ) |
| | 2013 - Service | | | 13.16 | | | | 0.10 | | | | (0.23 | ) | | | (0.13 | ) | | | (0.11 | ) | | | — | | | | (0.11 | ) |
| | 2013 - IR | | | 13.17 | | | | 0.13 | | | | (0.24 | ) | | | (0.11 | ) | | | (0.13 | ) | | | — | | | | (0.13 | ) |
| | | | | | | | | | | | | | | | | | | | | | | | | | | | | | |
| | FOR THE FISCAL YEARS ENDED MARCH 31, | |
| | 2013 - A | | | 13.17 | | | | 0.22 | | | | 0.60 | | | | 0.82 | | | | (0.34 | ) | | | (0.45 | ) | | | (0.79 | ) |
| | 2013 - B | | | 13.12 | | | | 0.12 | | | | 0.60 | | | | 0.72 | | | | (0.24 | ) | | | (0.45 | ) | | | (0.69 | ) |
| | 2013 - C | | | 13.09 | | | | 0.12 | | | | 0.59 | | | | 0.71 | | | | (0.24 | ) | | | (0.45 | ) | | | (0.69 | ) |
| | 2013 - Institutional | | | 13.15 | | | | 0.27 | | | | 0.60 | | | | 0.87 | | | | (0.39 | ) | | | (0.45 | ) | | | (0.84 | ) |
| | 2013 - Service | | | 13.13 | | | | 0.20 | | | | 0.60 | | | | 0.80 | | | | (0.32 | ) | | | (0.45 | ) | | | (0.77 | ) |
| | 2013 - IR | | | 13.15 | | | | 0.26 | | | | 0.59 | | | | 0.85 | | | | (0.38 | ) | | | (0.45 | ) | | | (0.83 | ) |
| | 2012 - A | | | 12.63 | | | | 0.23 | | | | 0.54 | | | | 0.77 | | | | (0.23 | ) | | | — | | | | (0.23 | ) |
| | 2012 - B | | | 12.58 | | | | 0.14 | | | | 0.54 | | | | 0.68 | | | | (0.14 | ) | | | — | | | | (0.14 | ) |
| | 2012 - C | | | 12.55 | | | | 0.14 | | | | 0.54 | | | | 0.68 | | | | (0.14 | ) | | | — | | | | (0.14 | ) |
| | 2012 - Institutional | | | 12.61 | | | | 0.27 | | | | 0.55 | | | | 0.82 | | | | (0.28 | ) | | | — | | | | (0.28 | ) |
| | 2012 - Service | | | 12.59 | | | | 0.21 | | | | 0.54 | | | | 0.75 | | | | (0.21 | ) | | | — | | | | (0.21 | ) |
| | 2012 - IR | | | 12.61 | | | | 0.24 | | | | 0.57 | | | | 0.81 | | | | (0.27 | ) | | | — | | | | (0.27 | ) |
| | 2011 - A | | | 12.74 | | | | 0.26 | | | | (0.10 | ) | | | 0.16 | | | | (0.27 | ) | | | — | | | | (0.27 | ) |
| | 2011 - B | | | 12.69 | | | | 0.17 | | | | (0.11 | ) | | | 0.06 | | | | (0.17 | ) | | | — | | | | (0.17 | ) |
| | 2011 - C | | | 12.66 | | | | 0.16 | | | | (0.09 | ) | | | 0.07 | | | | (0.18 | ) | | | — | | | | (0.18 | ) |
| | 2011 - Institutional | | | 12.72 | | | | 0.30 | | | | (0.09 | ) | | | 0.21 | | | | (0.32 | ) | | | — | | | | (0.32 | ) |
| | 2011 - Service | | | 12.70 | | | | 0.24 | | | | (0.10 | ) | | | 0.14 | | | | (0.25 | ) | | | — | | | | (0.25 | ) |
| | 2011 - IR (Commenced July 30, 2010) | | | 12.91 | | | | 0.19 | | | | (0.29 | ) | | | (0.10 | ) | | | (0.20 | ) | | | — | | | | (0.20 | ) |
| | 2010 - A | | | 12.30 | | | | 0.38 | | | | 1.35 | | | | 1.73 | | | | (1.29 | ) | | | — | | | | (1.29 | ) |
| | 2010 - B | | | 12.25 | | | | 0.29 | | | | 1.34 | | | | 1.63 | | | | (1.19 | ) | | | — | | | | (1.19 | ) |
| | 2010 - C | | | 12.23 | | | | 0.28 | | | | 1.34 | | | | 1.62 | | | | (1.19 | ) | | | — | | | | (1.19 | ) |
| | 2010 - Institutional | | | 12.28 | | | | 0.42 | | | | 1.35 | | | | 1.77 | | | | (1.33 | ) | | | — | | | | (1.33 | ) |
| | 2010 - Service | | | 12.27 | | | | 0.36 | | | | 1.34 | | | | 1.70 | | | | (1.27 | ) | | | — | | | | (1.27 | ) |
| | 2009 - A | | | 12.91 | | | | 0.45 | | | | (0.60 | ) | | | (0.15 | ) | | | (0.46 | ) | | | — | | | | (0.46 | ) |
| | 2009 - B | | | 12.87 | | | | 0.35 | | | | (0.60 | ) | | | (0.25 | ) | | | (0.37 | ) | | | — | | | | (0.37 | ) |
| | 2009 - C | | | 12.84 | | | | 0.35 | | | | (0.59 | ) | | | (0.24 | ) | | | (0.37 | ) | | | — | | | | (0.37 | ) |
| | 2009 - Institutional | | | 12.89 | | | | 0.49 | | | | (0.59 | ) | | | (0.10 | ) | | | (0.51 | ) | | | — | | | | (0.51 | ) |
| | 2009 - Service | | | 12.88 | | | | 0.43 | | | | (0.60 | ) | | | (0.17 | ) | | | (0.44 | ) | | | — | | | | (0.44 | ) |
| | (a) | | Calculated based on the average shares outstanding methodology. |
| | (b) | | Assumes investment at the net asset value at the beginning of the period, reinvestment of all dividends and distributions, a complete redemption of the investment at the net asset value at the end of the period and no sales or redemption charges. Total returns would be reduced if a sales or redemption charge was taken into account. Returns do not reflect the deduction of taxes that a shareholder would pay on Fund distributions or the redemption of Fund shares. Total returns for periods less than one full year are not annualized. |
| | (c) | | The Fund’s portfolio turnover rate is calculated in accordance with regulatory requirements, without regard to transactions involving short term investments and certain derivatives. If such transactions were included, the Fund’s portfolio turnover rate may be higher. |
| | |
| 128 | | The accompanying notes are an integral part of these financial statements. |
GOLDMAN SACHS GLOBAL INCOME FUND
| | | | | | | | | | | | | | | | | | | | | | | | | | | | | | | | | | | | | | | | |
| | | | | | | | | | | | | | | | | | | | | | | | | | | | | | | | | | |
| | | Net asset
value, end
of period | | | | | Total
return(b) | | | | | Net assets,
end of
period
(in 000s) | | | | | Ratio of
net expenses
to average
net assets | | | | | Ratio of
total expenses
to average
net assets | | | | | Ratio of
net investment
income
to average
net assets | | | | | Portfolio
turnover
rate(c) | |
| | | | | | | | | | | | | | | | | | | | | | | | | | | | | | | | | | | | | | | | |
| | $ | 12.96 | | | | | | (0.92 | )% | | | | $ | 63,464 | | | | | | 1.04 | %(d) | | | | | 1.23 | %(d) | | | | | 1.68 | %(d) | | | | | 199 | % |
| | | 12.91 | | | | | | (1.30 | ) | | | | | 1,332 | | | | | | 1.79 | (d) | | | | | 1.98 | (d) | | | | | 0.93 | (d) | | | | | 199 | |
| | | 12.87 | | | | | | (1.31 | ) | | | | | 5,075 | | | | | | 1.79 | (d) | | | | | 1.98 | (d) | | | | | 0.93 | (d) | | | | | 199 | |
| | | 12.94 | | | | | | (0.75 | ) | | | | | 474,484 | | | | | | 0.69 | (d) | | | | | 0.89 | (d) | | | | | 2.02 | (d) | | | | | 199 | |
| | | 12.92 | | | | | | (1.01 | ) | | | | | 215 | | | | | | 1.19 | (d) | | | | | 1.39 | (d) | | | | | 1.52 | (d) | | | | | 199 | |
| | | 12.93 | | | | | | (0.80 | ) | | | | | 589 | | | | | | 0.78 | (d) | | | | | 0.98 | (d) | | | | | 1.93 | (d) | | | | | 199 | |
| | | | | | | | | | | | | | | | | | | | | | | | | | | | | | | | | | | | | | | | |
| | | | | | | | | | | | | | | | | | | | | | | | | | | | | | | | | | | | | | | | |
| | | 13.20 | | | | | | 6.32 | | | | | | 79,838 | | | | | | 1.04 | | | | | | 1.15 | | | | | | 1.64 | | | | | | 444 | |
| | | 13.15 | | | | | | 5.55 | | | | | | 1,784 | | | | | | 1.79 | | | | | | 1.90 | | | | | | 0.92 | | | | | | 444 | |
| | | 13.11 | | | | | | 5.57 | | | | | | 5,757 | | | | | | 1.79 | | | | | | 1.90 | | | | | | 0.92 | | | | | | 444 | |
| | | 13.18 | | | | | | 6.69 | | | | | | 387,889 | | | | | | 0.69 | | | | | | 0.81 | | | | | | 1.99 | | | | | | 444 | |
| | | 13.16 | | | | | | 6.16 | | | | | | 145 | | | | | | 1.19 | | | | | | 1.31 | | | | | | 1.49 | | | | | | 444 | |
| | | 13.17 | | | | | | 6.51 | | | | | | 545 | | | | | | 0.79 | | | | | | 0.90 | | | | | | 1.94 | | | | | | 444 | |
| | | 13.17 | | | | | | 6.16 | | | | | | 198,463 | | | | | | 1.03 | | | | | | 1.14 | | | | | | 1.78 | | | | | | 333 | |
| | | 13.12 | | | | | | 5.38 | | | | | | 2,310 | | | | | | 1.78 | | | | | | 1.89 | | | | | | 1.07 | | | | | | 333 | |
| | | 13.09 | | | | | | 5.32 | | | | | | 6,359 | | | | | | 1.78 | | | | | | 1.89 | | | | | | 1.06 | | | | | | 333 | |
| | | 13.15 | | | | | | 6.53 | | | | | | 574,373 | | | | | | 0.69 | | | | | | 0.80 | | | | | | 2.10 | | | | | | 333 | |
| | | 13.13 | | | | | | 6.01 | | | | | | 189 | | | | | | 1.19 | | | | | | 1.30 | | | | | | 1.61 | | | | | | 333 | |
| | | 13.15 | | | | | | 6.43 | | | | | | 402 | | | | | | 0.78 | | | | | | 0.89 | | | | | | 1.87 | | | | | | 333 | |
| | | 12.63 | | | | | | 1.27 | | | | | | 204,116 | | | | | | 1.03 | | | | | | 1.13 | | | | | | 2.03 | | | | | | 272 | |
| | | 12.58 | | | | | | 0.50 | | | | | | 2,979 | | | | | | 1.78 | | | | | | 1.88 | | | | | | 1.29 | | | | | | 272 | |
| | | 12.55 | | | | | | 0.60 | | | | | | 7,676 | | | | | | 1.78 | | | | | | 1.88 | | | | | | 1.29 | | | | | | 272 | |
| | | 12.61 | | | | | | 1.62 | | | | | | 469,982 | | | | | | 0.69 | | | | | | 0.79 | | | | | | 2.36 | | | | | | 272 | |
| | | 12.59 | | | | | | 1.12 | | | | | | 151 | | | | | | 1.19 | | | | | | 1.29 | | | | | | 1.89 | | | | | | 272 | |
| | | 12.61 | | | | | | (0.78 | ) | | | | | 23 | | | | | | 0.78 | (d) | | | | | 0.88 | (d) | | | | | 2.28 | (d) | | | | | 272 | |
| | | 12.74 | | | | | | 14.73 | | | | | | 218,572 | | | | | | 1.03 | | | | | | 1.11 | | | | | | 3.02 | | | | | | 237 | |
| | | 12.69 | | | | | | 13.92 | | | | | | 5,143 | | | | | | 1.78 | | | | | | 1.86 | | | | | | 2.30 | | | | | | 237 | |
| | | 12.66 | | | | | | 13.80 | | | | | | 7,606 | | | | | | 1.78 | | | | | | 1.86 | | | | | | 2.22 | | | | | | 237 | |
| | | 12.72 | | | | | | 15.14 | | | | | | 685,787 | | | | | | 0.69 | | | | | | 0.77 | | | | | | 3.36 | | | | | | 237 | |
| | | 12.70 | | | | | | 14.50 | | | | | | 95 | | | | | | 1.19 | | | | | | 1.27 | | | | | | 2.87 | | | | | | 237 | |
| | | 12.30 | | | | | | (1.10 | ) | | | | | 202,926 | | | | | | 1.02 | | | | | | 1.11 | | | | | | 3.61 | | | | | | 168 | |
| | | 12.25 | | | | | | (1.93 | ) | | | | | 6,572 | | | | | | 1.77 | | | | | | 1.86 | | | | | | 2.85 | | | | | | 168 | |
| | | 12.23 | | | | | | (1.85 | ) | | | | | 4,863 | | | | | | 1.77 | | | | | | 1.86 | | | | | | 2.85 | | | | | | 168 | |
| | | 12.28 | | | | | | (0.76 | ) | | | | | 664,853 | | | | | | 0.68 | | | | | | 0.77 | | | | | | 3.94 | | | | | | 168 | |
| | | 12.27 | | | | | | (1.26 | ) | | | | | 214 | | | | | | 1.18 | | | | | | 1.27 | | | | | | 3.44 | | | | | | 168 | |
| | |
| The accompanying notes are an integral part of these financial statements. | | 129 |
GOLDMAN SACHS STRATEGIC INCOME FUND
Financial Highlights
Selected Data for a Share Outstanding Throughout Each Period
| | | | | | | | | | | | | | | | | | | | | | | | | | | | | | | | | | |
| | | | | | | | Income (loss) from
investment operations | | | Distributions
to shareholders | |
| | | Year - Share Class | |
Net asset
value,
beginning
of period | | | Net
investment
income | | | Net realized
and unrealized
gain (loss) | | | Total from
investment
operations | | | From net
investment
income | | | From net
realized
gains | | | From
capital | | | Total
distributions | |
| | FOR THE SIX MONTHS ENDED SEPTEMBER 30, (UNAUDITED) | |
| | 2013 - A | | $ | 10.46 | | | $ | 0.10 | (c) | | $ | 0.02 | | | $ | 0.12 | | | $ | (0.11 | ) | | $ | — | | | $ | — | | | $ | (0.11 | ) |
| | 2013 - C | | | 10.46 | | | | 0.06 | (c) | | | 0.03 | | | | 0.09 | | | | (0.07 | ) | | | — | | | | — | | | | (0.07 | ) |
| | 2013 - Institutional | | | 10.46 | | | | 0.12 | (c) | | | 0.03 | | | | 0.15 | | | | (0.13 | ) | | | — | | | | — | | | | (0.13 | ) |
| | 2013 - IR | | | 10.46 | | | | 0.11 | (c) | | | 0.02 | | | | 0.13 | | | | (0.12 | ) | | | — | | | | — | | | | (0.12 | ) |
| | 2013 - R | | | 10.45 | | | | 0.08 | (c) | | | 0.03 | | | | 0.11 | | | | (0.10 | ) | | | — | | | | — | | | | (0.10 | ) |
| | | | | | | | | | | | | | | | | | | | | | | | | | | | | | | | | | |
| | FOR THE FISCAL YEARS ENDED MARCH 31, | |
| | 2013 - A | | | 9.87 | | | | 0.32 | (c) | | | 0.73 | | | | 1.05 | | | | (0.46 | ) | | | — | | | | — | | | | (0.46 | ) |
| | 2013 - C | | | 9.88 | | | | 0.24 | (c) | | | 0.72 | | | | 0.96 | | | | (0.38 | ) | | | — | | | | — | | | | (0.38 | ) |
| | 2013 - Institutional | | | 9.87 | | | | 0.35 | (c) | | | 0.73 | | | | 1.08 | | | | (0.49 | ) | | | — | | | | — | | | | (0.49 | ) |
| | 2013 - IR | | | 9.87 | | | | 0.34 | (c) | | | 0.73 | | | | 1.07 | | | | (0.48 | ) | | | — | | | | — | | | | (0.48 | ) |
| | 2013 - R | | | 9.87 | | | | 0.30 | (c) | | | 0.71 | | | | 1.01 | | | | (0.43 | ) | | | — | | | | — | | | | (0.43 | ) |
| | 2012 - A | | | 10.03 | | | | 0.32 | (c) | | | (0.16 | ) | | | 0.16 | | | | (0.32 | ) | | | — | | | | — | | | | (0.32 | ) |
| | 2012 - C | | | 10.04 | | | | 0.24 | (c) | | | (0.15 | ) | | | 0.09 | | | | (0.25 | ) | | | — | | | | — | | | | (0.25 | ) |
| | 2012 - Institutional | | | 10.03 | | | | 0.35 | (c) | | | (0.15 | ) | | | 0.20 | | | | (0.36 | ) | | | — | | | | — | | | | (0.36 | ) |
| | 2012 - IR | | | 10.03 | | | | 0.34 | (c) | | | (0.15 | ) | | | 0.19 | | | | (0.35 | ) | | | — | | | | — | | | | (0.35 | ) |
| | 2012 - R | | | 10.03 | | | | 0.29 | (c) | | | (0.15 | ) | | | 0.14 | | | | (0.30 | ) | | | — | | | | — | | | | (0.30 | ) |
| | | | | | | | | | | | | | | | | | | | | | | | | | | | | | | | | | |
| | FOR THE PERIOD ENDED MARCH 31, | |
| | 2011 - A (Commenced June 30,2010) | | | 10.00 | | | | 0.17 | | | | 0.06 | | | | 0.23 | | | | (0.16 | ) | | | (0.02 | ) | | | (0.02 | ) | | | (0.20 | ) |
| | 2011 - C (Commenced June 30,2010) | | | 10.00 | | | | 0.12 | | | | 0.06 | | | | 0.18 | | | | (0.10 | ) | | | (0.02 | ) | | | (0.02 | ) | | | (0.14 | ) |
| | 2011 - Institutional
(Commenced June 30,2010) | | | 10.00 | | | | 0.20 | | | | 0.05 | | | | 0.25 | | | | (0.18 | ) | | | (0.02 | ) | | | (0.02 | ) | | | (0.22 | ) |
| | 2011 - IR (Commenced June 30,2010) | | | 10.00 | | | | 0.19 | | | | 0.05 | | | | 0.24 | | | | (0.17 | ) | | | (0.02 | ) | | | (0.02 | ) | | | (0.21 | ) |
| | 2011 - R (Commenced June 30,2010) | | | 10.00 | | | | 0.16 | | | | 0.05 | | | | 0.21 | | | | (0.14 | ) | | | (0.02 | ) | | | (0.02 | ) | | | (0.18 | ) |
| | (a) | | Assumes investment at the net asset value at the beginning of the period, reinvestment of all dividends and distributions, a complete redemption of the investment at the net asset value at the end of the period and no sales or redemption charges. Total returns would be reduced if a sales or redemption charge was taken into account. Returns do not reflect the deduction of taxes that a shareholder would pay on Fund distributions or the redemption of Fund shares. Total returns for periods less than one full year are not annualized. |
| | (b) | | The Fund’s portfolio turnover rate is calculated in accordance with regulatory requirements, without regard to transactions involving short term investments and certain derivatives. If such transactions were included, the Fund’s portfolio turnover rate may be higher. |
| | (c) | | Calculated based on the average shares outstanding methodology. |
| | |
| 130 | | The accompanying notes are an integral part of these financial statements. |
GOLDMAN SACHS STRATEGIC INCOME FUND
| | | | | | | | | | | | | | | | | | | | | | | | | | | | | | | | | | | | | | | | |
| | | | | | | | | | | | | | | | | | | | | | | | | | | | | | | | | | |
| | | Net asset
value, end
of period | | | | | Total
return(a) | | | | | Net assets,
end of
period
(in 000s) | | | | | Ratio of
net expenses
to average
net assets | | | | | Ratio of
total expenses
to average
net assets | | | | | Ratio of
net investment
income to
average net
assets | | | | | Portfolio
turnover
rate(b) | |
| | | | | | | | | | | | | | | | | | | | | | | | | | | | | | | | | | | | | | | | |
| | $ | 10.47 | | | | | | 1.25 | % | | $ | | | 2,054,069 | | | | | | 0.93 | %(d) | | | | | 0.93 | %(d) | | | | | 1.88 | %(d) | | | | | 198 | % |
| | | 10.48 | | | | | | 0.87 | | | | | | 569,222 | | | | | | 1.68 | (d) | | | | | 1.68 | (d) | | | | | 1.13 | (d) | | | | | 198 | |
| | | 10.48 | | | | | | 1.43 | | | | | | 6,728,920 | | | | | | 0.60 | (d) | | | | | 0.60 | (d) | | | | | 2.24 | (d) | | | | | 198 | |
| | | 10.47 | | | | | | 1.28 | | | | | | 341,217 | | | | | | 0.68 | (d) | | | | | 0.68 | (d) | | | | | 2.11 | (d) | | | | | 198 | |
| | | 10.46 | | | | | | 1.13 | | | | | | 468 | | | | | | 1.19 | (d) | | | | | 1.19 | (d) | | | | | 1.55 | (d) | | | | | 198 | |
| | | | | | | | | | | | | | | | | | | | | | | | | | | | | | | | | | | | | | | | |
| | | | | | | | | | | | | | | | | | | | | | | | | | | | | | | | | | | | | | | | |
| | | 10.46 | | | | | | 10.80 | | | | | | 709,730 | | | | | | 0.99 | | | | | | 0.99 | | | | | | 3.17 | | | | | | 727 | |
| | | 10.46 | | | | | | 9.86 | | | | | | 239,501 | | | | | | 1.74 | | | | | | 1.74 | | | | | | 2.36 | | | | | | 727 | |
| | | 10.46 | | | | | | 11.18 | | | | | | 2,428,689 | | | | | | 0.65 | | | | | | 0.65 | | | | | | 3.42 | | | | | | 727 | |
| | | 10.46 | | | | | | 11.07 | | | | | | 107,502 | | | | | | 0.74 | | | | | | 0.74 | | | | | | 3.33 | | | | | | 727 | |
| | | 10.45 | | | | | | 10.45 | | | | | | 12 | | | | | | 1.23 | | | | | | 1.23 | | | | | | 2.98 | | | | | | 727 | |
| | | 9.87 | | | | | | 1.60 | | | | | | 728,059 | | | | | | 1.00 | | | | | | 1.00 | | | | | | 3.23 | | | | | | 636 | |
| | | 9.88 | | | | | | 0.94 | | | | | | 148,590 | | | | | | 1.75 | | | | | | 1.75 | | | | | | 2.51 | | | | | | 636 | |
| | | 9.87 | | | | | | 2.04 | | | | | | 993,936 | | | | | | 0.66 | | | | | | 0.66 | | | | | | 3.59 | | | | | | 636 | |
| | | 9.87 | | | | | | 1.95 | | | | | | 50,350 | | | | | | 0.75 | | | | | | 0.75 | | | | | | 3.54 | | | | | | 636 | |
| | | 9.87 | | | | | | 1.46 | | | | | | 29 | | | | | | 1.25 | | | | | | 1.25 | | | | | | 3.00 | | | | | | 636 | |
| | | | | | | | | | | | | | | | | | | | | | | | | | | | | | | | | | | | | | | | |
| | | | | | | | | | | | | | | | | | | | | | | | | | | | | | | | | | | | | | | | |
| | | 10.03 | | | | | | 2.37 | | | | | | 820,664 | | | | | | 1.02 | (d) | | | | | 1.08 | (d) | | | | | 2.63 | (d) | | | | | 342 | |
| | | 10.04 | | | | | | 1.81 | | | | | | 82,982 | | | | | | 1.77 | (d) | | | | | 1.83 | (d) | | | | | 1.81 | (d) | | | | | 342 | |
| | | | | | | | | | | | | |
| | | 10.03 | | | | | | 2.51 | | | | | | 804,517 | | | | | | 0.68 | (d) | | | | | 0.74 | (d) | | | | | 2.96 | (d) | | | | | 342 | |
| | | 10.03 | | | | | | 2.44 | | | | | | 25,158 | | | | | | 0.77 | (d) | | | | | 0.83 | (d) | | | | | 2.82 | (d) | | | | | 342 | |
| | | 10.03 | | | | | | 2.09 | | | | | | 25 | | | | | | 1.27 | (d) | | | | | 1.33 | (d) | | | | | 2.07 | (d) | | | | | 342 | |
| | |
| The accompanying notes are an integral part of these financial statements. | | 131 |
GOLDMAN SACHS WORLD BOND FUND
Financial Highlights
Selected Data for a Share Outstanding Throughout Each Period
| | | | | | | | | | | | | | | | | | | | | | |
| | | | | | | | Income (loss) from
investment operations | | | | |
| | | Year - Share Class | | Net asset
value,
beginning
of period | | | Net
investment
income(a) | | | Net realized
and unrealized
gain (loss) | | | Total from
investment
operations | | | Distributions
to shareholders
from net
investment
income | |
| | FOR THE SIX MONTHS ENDED SEPTEMBER 30, (UNAUDITED) | |
| | 2013 - A | | $ | 9.92 | | | $ | 0.04 | | | $ | (0.23 | ) | | $ | (0.19 | ) | | $ | (0.04 | ) |
| | 2013 - C | | | 9.91 | | | | 0.01 | | | | (0.23 | ) | | | (0.22 | ) | | | (0.01 | ) |
| | 2013 - Institutional | | | 9.91 | | | | 0.05 | | | | (0.23 | ) | | | (0.18 | ) | | | (0.05 | ) |
| | 2013 - IR | | | 9.91 | | | | 0.06 | | | | (0.24 | ) | | | (0.18 | ) | | | (0.05 | ) |
| | 2013 - R | | | 9.91 | | | | 0.02 | | | | (0.23 | ) | | | (0.21 | ) | | | (0.02 | ) |
| | | | | | | | | | | | | | | | | | | | | | |
| | FOR THE PERIOD ENDED MARCH 31, | |
| | 2013 - A (Commenced November 30, 2012) | | | 10.00 | | | | 0.02 | | | | (0.08 | ) | | | (0.06 | ) | | | (0.02 | ) |
| | 2013 - C (Commenced November 30, 2012) | | | 10.00 | | | | — | (e) | | | (0.09 | ) | | | (0.09 | ) | | | — | (e) |
| | 2013 - Institutional (Commenced November 30, 2012) | | | 10.00 | | | | 0.03 | | | | (0.09 | ) | | | (0.06 | ) | | | (0.03 | ) |
| | 2013 - IR (Commenced November 30, 2012) | | | 10.00 | | | | 0.03 | | | | (0.09 | ) | | | (0.06 | ) | | | (0.03 | ) |
| | 2013 - R (Commenced November 30, 2012) | | | 10.00 | | | | 0.01 | | | | (0.09 | ) | | | (0.08 | ) | | | (0.01 | ) |
| | (a) | | Calculated based on the average shares outstanding methodology. |
| | (b) | | Assumes investment at the net asset value at the beginning of the period, reinvestment of all dividends and distributions, a complete redemption of the investment at the net asset value at the end of the period and no sales or redemption charges. Total returns would be reduced if a sales or redemption charge was taken into account. Returns do not reflect the deduction of taxes that a shareholder would pay on Fund distributions or the redemption of Fund shares. Total returns for periods less than one full year are not annualized. |
| | (d) | | The Fund’s portfolio turnover rate is calculated in accordance with regulatory requirements, without regard to transactions involving short term investments and certain derivatives. If such transactions were included, the Fund’s portfolio turnover rate may be higher. |
| | (e) | | Amount is less than $0.005 per share. |
| | |
| 132 | | The accompanying notes are an integral part of these financial statements. |
GOLDMAN SACHS WORLD BOND FUND
| | | | | | | | | | | | | | | | | | | | | | | | | | | | | | | | | | | | | | | | |
| | | | | | | | | | | | | | | | | | | | | | | | | | | | | | | | | | |
| | | Net asset
value, end
of period | | | | | Total
return(b) | | | | | Net assets,
end of
period
(in 000s) | | | | | Ratio of
net expenses
to average
net assets(c) | | | | | Ratio of
total expenses
to average
net assets(c) | | | | | Ratio of
net investment
income (loss)
to average
net assets(c) | | | | | Portfolio
turnover
rate(d) | |
| | | | | | | | | | | | | | | | | | | | | | | | | | | | | | | | | | | | | | | | |
| | $ | 9.69 | | | | | | (1.87 | )% | | | | $ | 99 | | | | | | 1.06 | % | | | | | 6.14 | % | | | | | 0.80 | % | | | | | 179 | % |
| | | 9.68 | | | | | | (2.27 | ) | | | | | 10 | | | | | | 1.65 | | | | | | 6.89 | | | | | | 0.14 | | | | | | 179 | |
| | | 9.68 | | | | | | (1.80 | ) | | | | | 11,704 | | | | | | 0.73 | | | | | | 5.80 | | | | | | 1.11 | | | | | | 179 | |
| | | 9.68 | | | | | | (1.79 | ) | | | | | 10 | | | | | | 0.79 | | | | | | 5.89 | | | | | | 1.18 | | | | | | 179 | |
| | | 9.68 | | | | | | (2.11 | ) | | | | | 10 | | | | | | 1.33 | | | | | | 6.39 | | | | | | 0.48 | | | | | | 179 | |
| | | | | | | | | | | | | | | | | | | | | | | | | | | | | | | | | | | | | | | | |
| | | | | | | | | | | | | | | | | | | | | | | | | | | | | | | | | | | | | | | | |
| | | 9.92 | | | | | | (0.69 | ) | | | | | 21 | | | | | | 1.04 | | | | | | 4.59 | | | | | | 0.69 | | | | | | 192 | |
| | | 9.91 | | | | | | (0.89 | ) | | | | | 10 | | | | | | 1.78 | | | | | | 5.92 | | | | | | (0.10 | ) | | | | | 192 | |
| | | 9.91 | | | | | | (0.58 | ) | | | | | 11,920 | | | | | | 0.71 | | | | | | 4.83 | | | | | | 1.02 | | | | | | 192 | |
| | | 9.91 | | | | | | (0.60 | ) | | | | | 10 | | | | | | 0.86 | | | | | | 4.99 | | | | | | 0.97 | | | | | | 192 | |
| | | 9.91 | | | | | | (0.78 | ) | | | | | 10 | | | | | | 1.31 | | | | | | 5.42 | | | | | | 0.38 | | | | | | 192 | |
| | |
| The accompanying notes are an integral part of these financial statements. | | 133 |
GOLDMAN SACHS MULTI SECTOR FIXED INCOME FUNDS
Notes to Financial Statements
September 30, 2013 (Unaudited)
Goldman Sachs Trust (the “Trust”) is a Delaware statutory trust registered under the Investment Company Act of 1940, as amended (the “Act”), as an open-end management investment company. The following table lists those series of the Trust that are included in this report (collectively, the “Funds” or individually a “Fund”), along with their corresponding share classes and respective diversification status under the Act:
| | | | |
| Fund | | Share Classes Offered* | | Diversified/
Non-diversified |
Core Fixed Income and Core Plus Fixed Income | | A, B, C, Institutional, Service, IR and R | | Diversified |
Global Income | | A, B, C, Institutional, Service and IR | | Non-diversified |
Strategic Income | | A, C, Institutional, IR and R | | Diversified |
World Bond (Commenced November 30, 2012) | | A, C, Institutional, IR and R | | Non-diversified |
| * | | Class B Shares are generally no longer available for purchase by current or prospective investors. |
Class A Shares are sold with a front-end sales charge of up to 3.75%. Class B Shares were sold with a contingent deferred sales charge (“CDSC”) that declines from 5.00% to zero, depending upon the period of time the shares are held. Class C Shares are sold with a CDSC of 1.00%, which is imposed on redemptions made within 12 months of purchase. Institutional, Service, Class IR and Class R Shares are not subject to a sales charge.
Goldman Sachs Asset Management, L.P. (“GSAM”), an affiliate of Goldman, Sachs & Co. (“Goldman Sachs”), serves as investment adviser to each of the Core Fixed Income, Core Plus Fixed Income and Strategic Income Funds pursuant to management agreements with the Trust. Goldman Sachs Asset Management International (“GSAMI”), an affiliate of GSAM and Goldman Sachs, serves as investment adviser pursuant to a management agreement with the Trust on behalf of the Global Income and World Bond Funds (the management agreements with GSAM and GSAMI are collectively referred to herein as the “Agreements”).
|
| 2. SIGNIFICANT ACCOUNTING POLICIES |
The financial statements have been prepared in accordance with accounting principles generally accepted in the United States of America (“GAAP”) and require management to make estimates and assumptions that may affect the reported amounts and disclosures. Actual results may differ from those estimates and assumptions.
A. Investment Valuation — The Funds’ valuation policy is to value investments at fair value.
B. Investment Income and Investments — Investment income includes interest income and dividend income, net of any foreign withholding taxes, less any amounts reclaimable. Interest income is accrued daily and adjusted for amortization of premiums and accretion of discounts. Dividend income is recognized on ex-dividend date or, for certain foreign securities, as soon as such information is obtained subsequent to the ex-dividend date. Investment transactions are reflected on trade date. Realized gains and losses are calculated using identified cost. Investment transactions are recorded on the following business day for daily net asset value (“NAV”) calculations. Any foreign capital gains tax is accrued daily based upon net unrealized gains, and is payable upon sale of such investments.
For derivative contracts, realized gains and losses are recorded upon settlement of the contract. Upfront payments are made or received upon entering into a swap agreement and are reflected as such in the Statement of Assets and Liabilities. Upfront payments are recognized over the contract’s term/event as realized gains or losses, with the exception of forward starting interest rate swaps whose realized gains or losses are recognized from the effective start date. For securities with paydown provisions, principal payments received are treated as a proportionate reduction to the cost basis of the securities and excess or shortfall amounts are recorded as gains or losses. For treasury inflation protected securities (“TIPS”), adjustments to principal due to inflation/deflation are reflected as increases/decreases to interest income with a corresponding adjustment to cost.
134
GOLDMAN SACHS MULTI SECTOR FIXED INCOME FUNDS
|
| 2. SIGNIFICANT ACCOUNTING POLICIES (continued) |
C. Class Allocations and Expenses — Investment income, realized and unrealized gain (loss), and non-class specific expenses of each Fund are allocated daily based upon the proportion of net assets of each class. Class specific expenses, where applicable, are borne by the respective share classes and include Distribution and Service, Transfer Agent and Service and Shareholder Administration fees. Non-class specific expenses directly incurred by a Fund are charged to that Fund, while such expenses incurred by the Trust are allocated across the respective Funds on a straight-line and/or pro-rata basis depending upon the nature of the expenses.
D. Offering Costs — Offering costs paid in connection with the offering of shares of the World Bond Fund are being amortized on a straight-line basis over 12 months from the date of commencement of operations.
E. Federal Taxes and Distributions to Shareholders — It is each Fund’s policy to comply with the requirements of the Internal Revenue Code of 1986, as amended (the “Code”), applicable to regulated investment companies (mutual funds) and to distribute each year substantially all of its investment company taxable income and capital gains to its shareholders. Accordingly, the Funds are not required to make any provisions for the payment of federal income tax.
Distributions to shareholders are recorded on the ex-dividend date. Income distributions, if any, are declared daily and paid monthly, and capital gains distributions, if any, are declared and paid annually.
Net capital losses are carried forward to future fiscal years and may be used to the extent allowed by the Code to offset any future capital gains. Utilization of capital loss carryforwards will reduce the requirement of future capital gains distributions.
Under the Regulated Investment Company Modernization Act of 2010, the Funds are permitted to carry forward capital losses incurred in taxable years beginning after December 22, 2010 for an unlimited period. However, any losses incurred during those future taxable years will be required to be utilized prior to the losses incurred in pre-enactment taxable years. As a result of this ordering rule, pre-enactment capital loss carryforwards may be more likely to expire unused. Additionally, post-enactment capital losses that are carried forward will retain their character as either short-term or long-term capital losses rather than being considered all short-term as under previous law.
The characterization of distributions to shareholders for financial reporting purposes is determined in accordance with federal income tax rules, which may differ from GAAP. The source of each Fund’s distributions may be shown in the accompanying financial statements as either from net investment income, net realized gain or capital. Certain components of the Funds’ net assets on the Statements of Assets and Liabilities reflect permanent GAAP/tax differences based on the appropriate tax character.
F. Foreign Currency Translation — The accounting records and reporting currency of the Funds are maintained in U.S. dollars. Assets and liabilities denominated in foreign currencies are translated into U.S. dollars using the current exchange rates at the close of each business day. The effect of changes in foreign currency exchange rates on investments is included within net realized and unrealized gain (loss) on investments. Changes in the value of other assets and liabilities as a result of fluctuations in foreign exchange rates are included in the Statements of Operations within net change in unrealized gain (loss) on foreign currency transactions. Transactions denominated in foreign currencies are translated into U.S. dollars on the date the transaction occurred, the effects of which are included within net realized gain (loss) on foreign currency transactions.
|
| 3. INVESTMENTS AND FAIR VALUE MEASUREMENTS |
The fair value of a financial instrument is the amount that would be received to sell an asset or paid to transfer a liability in an orderly transaction between market participants at the measurement date (i.e., the exit price). GAAP establishes a fair value hierarchy that prioritizes the inputs to valuation techniques used to measure fair value. The hierarchy gives the highest priority to unadjusted quoted prices in active markets for identical assets or liabilities (Level 1 measurements) and the lowest priority to unobservable inputs (Level 3 measurements). The levels used for classifying investments are not necessarily an indication of the risk associated with investing in these investments. The three levels of the fair value hierarchy are described below:
Level 1 — Unadjusted quoted prices in active markets that are accessible at the measurement date for identical, unrestricted assets or liabilities;
135
GOLDMAN SACHS MULTI SECTOR FIXED INCOME FUNDS
Notes to Financial Statements (continued)
September 30, 2013 (Unaudited)
|
| 3. INVESTMENTS AND FAIR VALUE MEASUREMENTS (continued) |
Level 2 — Quoted prices in markets that are not active or financial instruments for which significant inputs are observable (including, but not limited to, quoted prices for similar investments, interest rates, foreign exchange rates, volatility and credit spreads), either directly or indirectly;
Level 3 — Prices or valuations that require significant unobservable inputs (including GSAM’s and GSAMI’s assumptions in determining fair value measurement).
The Trustees have adopted Valuation Procedures that govern the valuation of the portfolio investments held by the Funds including investments for which market quotations are not readily available. The Trustees have delegated to GSAM and GSAMI day-to-day responsibility for implementing and maintaining internal controls and procedures related to the valuation of the Funds’ portfolio investments. To assess the continuing appropriateness of pricing sources and methodologies, GSAM and GSAMI regularly performs price verification procedures and issues challenges as necessary to third party pricing vendors or brokers, and any differences are reviewed in accordance with the Valuation Procedures.
A. Level 1 and Level 2 Fair Value Investments — The valuation techniques and significant inputs used in determining the fair values for investments classified as Level 1 and Level 2 are as follows:
Debt Securities — Debt securities for which market quotations are readily available are valued daily on the basis of quotations supplied by dealers or an independent pricing service approved by the Trustees. The pricing services may use valuation models or matrix pricing, which consider: (i) yield or price with respect to bonds that are considered comparable in characteristics such as rating, interest rate and maturity date or (ii) quotations from securities dealers to determine current value. Short-term debt obligations that mature in sixty days or less and that do not exhibit signs of credit deterioration are valued at amortized cost, which approximates fair value. With the exception of treasury securities, which are generally classified as Level 1, these investments are generally classified as Level 2 of the fair value hierarchy.
i. Mortgage-Backed and Asset-Backed Securities — Mortgage-backed securities represent direct or indirect participations in, or are collateralized by and payable from, mortgage loans secured by residential and/or commercial real estate property. Asset-backed securities include securities whose principal and interest payments are collateralized by pools of other assets or receivables. The value of certain mortgage-backed and asset-backed securities (including adjustable rate mortgage loans) may be particularly sensitive to changes in prevailing interest rates. The value of these securities may also fluctuate in response to the market’s perception of the creditworthiness of the issuers.
Asset-backed securities may present credit risks that are not presented by mortgage-backed securities because they generally do not have the benefit of a security interest in collateral that is comparable to mortgage assets. Some asset-backed securities may only have a subordinated claim on collateral.
Stripped mortgage-backed securities are usually structured with two different classes: one that receives substantially all interest payments (interest-only, or “IO” and/or high coupon rate with relatively low principal amount, or “IOette”), and the other that receives substantially all principal payments (principal-only, or “PO”) from a pool of mortgage loans. Little to no principal will be received at the maturity of an IO; as a result, periodic adjustments are recorded to reduce the cost of the security until maturity. These adjustments are included in interest income.
ii. Mortgage Dollar Rolls — Mortgage dollar rolls are transactions whereby a Fund sells mortgage-backed securities and simultaneously contracts with the same counterparty to repurchase similar securities on a specified future date. During the settlement period, a Fund will not be entitled to accrue interest and receive principal payments on the securities sold.
iii. Senior Term Loans — Senior term loans (“Loans”) are interests in amounts owed by corporate, governmental, or other borrowers to lenders or lending syndicates. Loans are arranged through private negotiations between the borrower and one or more financial institutions (“Lenders”). A Fund’s investments in Loans are in the form of either participations in Loans (“Participations”) or assignments of all or a portion of Loans from third parties (“Assignments”). With respect to Participations, a Fund has the right to receive payments of principal, interest and any fees to which it is entitled from the Lender selling the Participations and only upon receipt by the Lender of the payments from the borrower. A Fund generally has no right to enforce compliance by the borrower with the terms of the loan agreement. As a result, a Fund will be exposed
136
GOLDMAN SACHS MULTI SECTOR FIXED INCOME FUNDS
|
| 3. INVESTMENTS AND FAIR VALUE MEASUREMENTS (continued) |
to the credit risk of both the borrower and the Lender. Conversely, Assignments result in a Fund having a direct contractual relationship with the borrower, and a Fund may enforce compliance by the borrower with the terms of the loan agreement.
iv. Structured Notes — The values of structured notes are based on the price movements of a reference security or index. Upon termination, a Fund will receive a payment from the issuer based on the value of the referenced security (notional amount multiplied by price of the referenced security) and record a realized gain or loss.
v. Treasury Inflation Protected Securities — TIPS are treasury securities in which the principal amount is adjusted daily to keep pace with inflation, as measured by the U.S. Consumer Pricing Index for Urban Consumers. The repayment of the original bond principal upon maturity is guaranteed by the full faith and credit of the U.S. Government.
vi. When-Issued Securities and Forward Commitments — When-issued securities, including TBA (“To Be Announced”) securities are securities that are authorized but not yet issued in the market and purchased in order to secure what is considered to be an advantageous price or yield to a Fund. A forward commitment involves entering into a contract to purchase or sell securities, typically on an extended settlement basis, for a fixed price at a future date. The purchase of securities on a when-issued or forward commitment basis involves a risk of loss if the value of the security to be purchased declines before the settlement date. Conversely, the sale of securities on a forward commitment basis involves the risk that the value of the securities sold may increase before the settlement date. Although a Fund will generally purchase securities on a when-issued or forward commitment basis with the intention of acquiring the securities for its portfolio, the Fund may dispose of when-issued securities or forward commitments prior to settlement which may result in a realized gain or loss.
Equity Securities — Equity securities and investment companies traded on a United States (“U.S.”) securities exchange or the NASDAQ system, or those located on certain foreign exchanges, including but not limited to the Americas, are valued daily at their last sale price or official closing price on the principal exchange or system on which they are traded. If no sale occurs, equity securities and exchange traded investment companies are valued at the last bid price for long positions and at the last ask price for short positions. Investments in investment companies (other than those that are exchange traded) are valued at the NAV on the valuation date. To the extent these investments are actively traded, they are classified as Level 1 of the fair value hierarchy.
Unlisted equity securities for which market quotations are available are valued at the last sale price on the valuation date, or if no sale occurs, at the last bid price. Securities traded on certain foreign securities exchanges are valued daily at fair value determined by an independent fair value service (if available) under Valuation Procedures approved by the Trustees and consistent with applicable regulatory guidance. The independent fair value service takes into account multiple factors including, but not limited to, movements in the securities markets, certain depositary receipts, futures contracts and foreign currency exchange rates that have occurred subsequent to the close of the foreign securities exchange. These investments are generally classified as Level 2 of the fair value hierarchy.
Derivative Contracts — A derivative is an instrument whose value is derived from underlying assets, indices, reference rates or a combination of these factors.
Exchange-traded derivatives, including futures contracts, typically fall within Level 1 of the fair value hierarchy. Over-the-counter (“OTC”) derivatives are valued using market transactions and other market evidence, including market-based inputs to models, calibration to market-clearing transactions, broker or dealer quotations, or other alternative pricing sources. Where models are used, the selection of a particular model to value an OTC derivative depends upon the contractual terms of, and specific risks inherent in, the instrument, as well as the availability of pricing information in the market. Valuation models require a variety of inputs, including contractual terms, market prices, yield curves, credit curves, measures of volatility, voluntary and involuntary prepayment rates, loss severity rates and correlations of such inputs. For OTC derivatives that trade in liquid markets, model inputs can generally be verified and model selection does not involve significant management judgment. OTC derivatives are classified within Level 2 of the fair value hierarchy when significant inputs are corroborated by market evidence.
i. Forward Foreign Currency Exchange Contracts — In a forward foreign currency contract, a Fund agrees to receive or deliver a fixed quantity of one currency for another, at a pre-determined price at a future date. All forward foreign currency exchange contracts are marked-to-market daily at the applicable forward rate.
137
GOLDMAN SACHS MULTI SECTOR FIXED INCOME FUNDS
Notes to Financial Statements (continued)
September 30, 2013 (Unaudited)
|
| 3. INVESTMENTS AND FAIR VALUE MEASUREMENTS (continued) |
ii. Futures Contracts — Futures contracts are contracts to buy or sell a standardized quantity of a specified commodity or security and are valued based on exchanged settlement prices or independent market quotes. Futures contracts are valued at the last settlement price, or in the absence of a sale, the last bid price for long positions and at the last ask price for short positions, at the end of each day on the board of trade or exchange upon which they are traded. Upon entering into a futures contract, a Fund deposits cash or securities in an account on behalf of the broker in an amount sufficient to meet the initial margin requirement. Subsequent payments are made or received by a Fund equal to the daily change in the contract value and are recorded as variation margin receivable or payable with a corresponding offset to unrealized gains or losses.
iii. Options — When a Fund writes call or put options, an amount equal to the premium received is recorded as a liability and is subsequently marked-to-market to reflect the current value of the option written. Swaptions are options on interest rate swap contracts. Options on a futures contract may be written with premiums to be determined on a future date. The premiums for these options are based upon implied volatility parameters at specified terms.
Upon the purchase of a call option or a put option by a Fund, the premium paid is recorded as an investment and subsequently marked-to-market to reflect the current value of the option. Certain options may be purchased with premiums to be determined on a future date. The premiums for these options are based upon implied volatility parameters at specified terms.
iv. Swap Contracts — Bilateral swap contracts are agreements in which a Fund and a counterparty agree to exchange periodic payments on a specified notional amount or make a net payment upon termination. Bilateral swap transactions are privately negotiated in the OTC market and payments are settled through direct payments between a Fund and the counterparty. By contrast, certain swap transactions are subject to mandatory central clearing. These swaps are executed through a derivatives clearing member (“DCM”), acting in an agency capacity, and submitted to a central counterparty (“CCP”) (“centrally cleared swaps”), in which case all payments are settled with the CCP through the DCM. Swaps are marked-to-market daily using pricing vendor quotations, counterparty or clearinghouse prices or model prices, and the change in value, if any, is recorded as an unrealized gain or loss. Upon entering into a swap contract, a Fund is required to satisfy an initial margin requirement by delivering cash or securities to the counterparty (or in some cases, segregated in a triparty account on behalf of the counterparty), which can be adjusted by any mark-to-market gains or losses pursuant to bilateral or centrally cleared arrangements. For centrally cleared swaps the daily change in valuation, if any, is recorded as a receivable or payable for variation margin.
An interest rate swap is an agreement that obligates two parties to exchange a series of cash flows at specified intervals, based upon or calculated by reference to changes in interest rates on a specified notional principal amount. The payment flows are usually netted against each other, with the difference being paid by one party to the other.
A credit default swap is an agreement that involves one party (the buyer of protection) making a stream of payments to another party (the seller of protection) in exchange for the right to receive protection on a reference security or obligation. A Fund’s investment in credit default swaps may involve greater risks than if a Fund had invested in the referenced obligation directly. Credit events are contract specific but may include bankruptcy, failure to pay, restructuring and obligation acceleration. If a Fund buys protection through a credit default swap and no credit event occurs, its payments are limited to the periodic payments previously made to the counterparty. Upon the occurrence of a specified credit event, a Fund, as a buyer of credit protection, is entitled to receive an amount equal to the notional amount of the swap and deliver to the seller the defaulted reference obligation in a physically settled trade. A Fund may also receive a net settlement amount in the form of cash or securities equal to the notional amount of the swap reduced by the recovery value of the reference obligation in cash settled trade.
138
GOLDMAN SACHS MULTI SECTOR FIXED INCOME FUNDS
|
| 3. INVESTMENTS AND FAIR VALUE MEASUREMENTS (continued) |
As a seller of protection, a Fund generally receives a payment stream throughout the term of the swap, provided that there is no credit event. In addition, if a Fund sells protection through a credit default swap, a Fund could suffer a loss because the value of the referenced obligation may be less than the premium payments received. Upon the occurrence of a specified credit event, a Fund, as a seller of credit protection, may be required to take possession of the defaulted reference obligation and pay the buyer an amount equal to the notional amount of the swap in a physically settled trade. A Fund may also pay a net settlement amount in the form of cash or securities equal to the notional amount of the swap reduced by the recovery value of the reference obligation in cash settled trade. Recovery values are at times established through the credit event auction process in which market participants are ensured that a transparent price has been set for the defaulted security or obligation. In addition, a Fund is entitled to a return of any assets, which have been pledged as collateral to the counterparty.
The maximum potential amount of future payments (undiscounted) that a Fund as seller of protection could be required to make under a credit default swap would be an amount equal to the notional amount of the agreement. These potential amounts would be partially offset by any recovery values of the respective referenced obligations or net amounts received from a settlement of a credit default swap for the same reference security or obligation where a Fund bought credit protection.
A total return swap is an agreement that gives a Fund the right to receive the appreciation in the value of a specified security, index or other instrument in return for a fee paid to the counterparty, which will typically be an agreed upon interest rate. If the underlying asset declines in value over the term of the swap, a Fund may also be required to pay the dollar value of that decline to the counterparty.
Short Term Investments — Short-term investments having a maturity of 60 days or less are generally valued at amortized cost which approximates fair market value. These investments are classified as Level 2 of the fair value hierarchy.
i. Repurchase Agreements — Repurchase agreements involve the purchase of securities subject to the seller’s agreement to repurchase the securities at a mutually agreed upon date and price, under the terms of a Master Repurchase Agreement (“MRA”). During the term of a repurchase agreement, the value of the underlying securities held as collateral on behalf of a Fund, including accrued interest, is required to exceed the value of the repurchase agreement, including accrued interest. The underlying securities for all repurchase agreements are held at the Funds’ custodian or designated sub-custodians under triparty repurchase agreements.
In December 2011, the Financial Accounting Standards Board (“FASB”) issued an Accounting Standards Update (“ASU”) No. 2011-11: Disclosures about Offsetting Assets and Liabilities (“netting”) on the Statements of Assets and Liabilities that are subject to master netting arrangements or similar agreements. ASU 2011-11 was amended by ASU No. 2013-01, clarifying which investments and transactions are subject to the netting disclosure. The scope of the disclosure requirements is limited to derivative instruments, repurchase agreements and reverse repurchase agreements, and securities borrowing and securities lending transactions. This information is intended to enable users of the Funds’ financial statements to evaluate the effect or potential effect of netting arrangements on the Funds’ financial position. The ASU is effective for financial statements with fiscal years beginning on or after January 1, 2013, and interim periods within those fiscal years. The Funds adopted the disclosure requirement of netting for the current reporting period. Since these amended principles only require additional disclosures concerning offsetting and related arrangements, adoption did not affect the Funds’ financial condition or result of operations.
For financial reporting purposes, the Funds do not offset financial assets and financial liabilities that are subject to master netting arrangements or similar agreements on the Statements of Assets and Liabilities.
A MRA governs transactions between a Fund and select counterparties. A MRA contains provisions for, among other things, initiation, income payments, events of default and maintenance of securities for repurchase agreements. A MRA also permits offsetting with collateral to create one single net payment in the event of default or similar events, including the bankruptcy or insolvency of a counterparty.
139
GOLDMAN SACHS MULTI SECTOR FIXED INCOME FUNDS
Notes to Financial Statements (continued)
September 30, 2013 (Unaudited)
|
| 3. INVESTMENTS AND FAIR VALUE MEASUREMENTS (continued) |
If the seller defaults, a Fund could suffer a loss to the extent that the proceeds from the sale of the underlying securities and other collateral held by the Fund are less than the repurchase price and the Fund’s costs associated with delay and enforcement of the repurchase agreement. In addition, in the event of default or insolvency of the seller, a court could determine that a Fund’s interest in the collateral is not enforceable resulting in additional losses to the Fund.
At September 30, 2013, the Funds’ investment in a repurchase agreement was subject to enforceable MRAs. The repurchase agreement on a net basis was as follows:
| | | | | | | | |
| Repurchase Agreements | | Core Fixed Income | | | Core Plus Fixed Income | |
Total gross amount presented in Statements of Assets and Liabilities | | $ | 1,800,000 | | | $ | 10,200,000 | |
Non-cash Collateral offsetting(1) | | | (1,800,000 | ) | | | (10,200,000 | ) |
Net Amount(2) | | $ | — | | | $ | — | |
| | (1) | | At September 30, 2013, the value of the collateral received from each seller exceeded the value of the related repurchase agreements. |
| | (2) | | Net amount represents the net amount due from the counterparty in the event of a default based on the contractual set-off rights under the agreement. |
Pursuant to exemptive relief granted by the Securities and Exchange Commission (“SEC”) and terms and conditions contained therein, the Funds, together with other funds of the Trust and registered investment companies having management agreements with GSAM or its affiliates, may transfer uninvested cash into joint accounts, the daily aggregate balance of which is invested in one or more repurchase agreements. Under these joint accounts, the Funds maintain pro-rata credit exposure to the underlying repurchase agreements’ counterparties. With the exception of certain transaction fees, the Funds are not subject to any expenses in relation to these investments.
B. Level 3 Fair Value Investments — To the extent that the aforementioned significant inputs are unobservable, or if quotations are not readily available, or if GSAM and GSAMI believe that such quotations do not accurately reflect fair value, the fair value of the Funds’ investments may be determined under Valuation Procedures approved by the Trustees. GSAM and GSAMI, consistent with its procedures and applicable regulatory guidance, may make an adjustment to the most recent valuation prices of either domestic or foreign securities in light of significant events to reflect what it believes to be the fair value of the securities at the time of determining a Fund’s NAV. Significant events which could affect a large number of securities in a particular market may include, but are not limited to: significant fluctuations in U.S. or foreign markets; market dislocations; market disruptions; or unscheduled market closings. Significant events which could also affect a single issuer may include, but are not limited to: corporate actions such as reorganizations, mergers and buy-outs; ratings downgrades; and bankruptcies.
To the extent investments are valued using single source broker quotations or third party pricing vendors, such investments are classified as Level 3 investments.
140
GOLDMAN SACHS MULTI SECTOR FIXED INCOME FUNDS
|
| 3. INVESTMENTS AND FAIR VALUE MEASUREMENTS (continued) |
C. Fair Value Hierarchy — The following is a summary of the Funds’ investments and derivatives classified in the fair value hierarchy as of September 30, 2013:
| | | | | | | | | | | | |
| | | |
| CORE FIXED INCOME | | | | | | | | | | | | |
| | | |
| Investment Type | | Level 1 | | | Level 2 | | | Level 3 | |
| Assets | | | | | | | | | | | | |
Fixed Income | | | | | | | | | | | | |
Corporate Obligations | | $ | — | | | $ | 385,127,684 | | | $ | — | |
Mortgage-Backed Obligations | | | — | | | | 446,684,222 | | | | — | |
U.S. Treasury Obligations and/or Other U.S. Government Agencies | | | 233,855,333 | | | | 76,418,347 | | | | — | |
Asset-Backed Securities | | | — | | | | 26,644,926 | | | | — | |
Foreign Debt Obligations | | | — | | | | 38,824,510 | | | | — | |
Municipal Debt Obligations | | | — | | | | 31,033,447 | | | | — | |
Government Guarantee Obligations | | | — | | | | 19,078,131 | | | | — | |
Short-term Investments | | | — | | | | 1,800,000 | | | | — | |
| Total | | $ | 233,855,333 | | | $ | 1,025,611,267 | | | $ | — | |
| Liabilities | | | | | | | | | | | | |
Fixed Income | | | | | | | | | | | | |
Mortgage-Backed Obligations — Forward Sales Contracts | | $ | — | | | $ | (58,505,941 | ) | | $ | — | |
| | | |
| Derivative Type | | | | | | | | | |
| Assets | | | | | | | | | | | | |
Options Purchased | | $ | — | | | $ | 6,773,348 | | | $ | — | |
Forward Foreign Currency Exchange Contracts(a) | | | — | | | | 566,143 | | | | — | |
Futures Contracts(a) | | | 2,911,713 | | | | — | | | | — | |
Interest Rate Swap Contracts(a) | | | — | | | | 8,672,777 | | | | — | |
Credit Default Swap Contracts(a) | | | — | | | | 913,799 | | | | — | |
| Total | | $ | 2,911,713 | | | $ | 16,926,067 | | | $ | — | |
| Liabilities(a) | | | | | | | | | | | | |
Forward Foreign Currency Exchange Contracts | | $ | — | | | $ | (1,228,421 | ) | | $ | — | |
Interest Rate Swap Contracts | | | — | | | | (3,580,502 | ) | | | — | |
Credit Default Swap Contracts | | | — | | | | (330,446 | ) | | | — | |
| Total | | $ | — | | | $ | (5,139,369 | ) | | $ | — | |
141
GOLDMAN SACHS MULTI SECTOR FIXED INCOME FUNDS
Notes to Financial Statements (continued)
September 30, 2013 (Unaudited)
|
| 3. INVESTMENTS AND FAIR VALUE MEASUREMENTS (continued) |
| | | | | | | | | | | | |
| | | |
| CORE PLUS FIXED INCOME | | | | | | | | | | | | |
| | | |
| Investment Type | | Level 1 | | | Level 2 | | | Level 3 | |
| Assets | | | | | | | | | | | | |
Fixed Income | | | | | | | | | | | | |
Corporate Obligations | | $ | — | | | $ | 87,595,809 | | | $ | — | |
Mortgage-Backed Obligations | | | — | | | | 88,635,138 | | | | — | |
U.S. Treasury Obligations and/or Other U.S. Government Agencies | | | 12,894,409 | | | | 10,252,614 | | | | — | |
Asset-Backed Securities | | | — | | | | 26,429,662 | | | | 2,946,705 | |
Foreign Debt Obligations | | | — | | | | 11,926,370 | | | | 11,348 | |
Structured Notes | | | — | | | | 1,740,957 | | | | — | |
Municipal Debt Obligations | | | — | | | | 14,673,110 | | | | — | |
Government Guarantee Obligations | | | — | | | | 3,597,836 | | | | — | |
Short-term Investments | | | — | | | | 10,200,000 | | | | — | |
| Total | | $ | 12,894,409 | | | $ | 255,051,496 | | | $ | 2,958,053 | |
| Liabilities | | | | | | | | | | | | |
Fixed Income | | | | | | | | | | | | |
Mortgage-Backed Obligations — Forward Sales Contracts | | $ | — | | | $ | (6,812,032 | ) | | $ | — | |
| | | |
| Derivative Type | | | | | | | | | |
| Assets | | | | | | | | | | | | |
Options Purchased | | $ | — | | | $ | 5,639,221 | | | $ | — | |
Forward Foreign Currency Exchange Contracts(a) | | | — | | | | 266,775 | | | | — | |
Futures Contracts(a) | | | 2,089,396 | | | | — | | | | — | |
Interest Rate Swap Contracts(a) | | | — | | | | 4,470,653 | | | | — | |
Credit Default Swap Contracts(a) | | | — | | | | 187,536 | | | | — | |
| Total | | $ | 2,089,396 | | | $ | 10,564,185 | | | $ | — | |
| Liabilities(a) | | | | | | | | | | | | |
Forward Foreign Currency Exchange Contracts | | $ | — | | | $ | (580,984 | ) | | $ | — | |
Futures Contracts | | | (222,682 | ) | | | — | | | | — | |
Interest Rate Swap Contracts | | | — | | | | (4,514,220 | ) | | | — | |
Credit Default Swap Contracts | | | — | | | | (59,302 | ) | | | — | |
| Total | | $ | (222,682 | ) | | $ | (5,154,506 | ) | | $ | — | |
The following is a reconciliation of Level 3 investments for the period ended September 30, 2013:
| | | | | | | | |
| | | Fixed Income
Asset-Backed
Securities | | | Fixed Income
Foreign Debt
Obligations | |
Beginning Balance as of April 1, 2013 | | $ | — | | | $ | — | |
Realized gain (loss) | | | — | | | | — | |
Net change in Unrealized gain (loss) relating to instruments still held at reporting date | | | — | | | | 89 | |
Purchases | | | 2,946,705 | | | | 11,259 | |
Sales | | | — | | | | — | |
Transfers into Level 3 | | | — | | | | — | |
Transfers out of Level 3(b) | | | — | | | | — | |
Ending Balance as of September 30, 2013 | | $ | 2,946,705 | | | $ | 11,348 | |
142
GOLDMAN SACHS MULTI SECTOR FIXED INCOME FUNDS
|
| 3. INVESTMENTS AND FAIR VALUE MEASUREMENTS (continued) |
| | | | | | | | | | | | |
| | | |
| GLOBAL INCOME | | | | | | | | | | | | |
| | | |
| Investment Type | | Level 1 | | | Level 2 | | | Level 3 | |
| Assets | | | | | | | | | | | | |
Fixed Income | | | | | | | | | | | | |
Foreign Sovereign Debt Obligations | | $ | 127,380,360 | | | $ | 74,867,120 | | | $ | — | |
Corporate Obligations | | | — | | | | 121,340,493 | | | | — | |
Foreign Debt Obligations | | | — | | | | 10,821,126 | | | | — | |
Asset-Backed Securities | | | — | | | | 15,808,446 | | | | — | |
Mortgage-Backed Obligations | | | — | | | | 96,662,458 | | | | — | |
U.S. Treasury Obligations and/or Other U.S. Government Agencies | | | 30,949,294 | | | | 778,528 | | | | — | |
Municipal Debt Obligations | | | — | | | | 7,245,209 | | | | — | |
Government Guarantee Obligations | | | — | | | | 11,898,358 | | | | — | |
Short-term Investments | | | — | | | | 14,733,320 | | | | — | |
| Total | | $ | 158,329,654 | | | $ | 354,155,058 | | | $ | — | |
| Liabilities | | | | | | | | | | | | |
Fixed Income | | | | | | | | | | | | |
Mortgage-Backed Obligations — Forward Sales Contracts | | $ | — | | | $ | (3,909,062 | ) | | $ | — | |
| | | |
| Derivative Type | | | | | | | | | |
| Assets | | | | | | | | | | | | |
Options Purchased | | $ | — | | | $ | 5,450,764 | | | $ | — | |
Forward Foreign Currency Exchange Contracts(a) | | | — | | | | 1,022,661 | | | | — | |
Futures Contracts(a) | | | 752,989 | | | | — | | | | — | |
Interest Rate Swap Contracts(a) | | | — | | | | 4,173,577 | | | | — | |
Credit Default Swap Contracts(a) | | | — | | | | 503,921 | | | | — | |
| Total | | $ | 752,989 | | | $ | 11,150,923 | | | $ | — | |
| Liabilities(a) | | | | | | | | | | | | |
Forward Foreign Currency Exchange Contracts | | $ | — | | | $ | (5,927,030 | ) | | $ | — | |
Futures Contracts | | | (9,856 | ) | | | — | | | | — | |
Interest Rate Swap Contracts | | | — | | | | (3,268,214 | ) | | | — | |
Credit Default Swap Contracts | | | — | | | | (239,175 | ) | | | — | |
| Total | | $ | (9,856 | ) | | $ | (9,434,419 | ) | | $ | — | |
143
GOLDMAN SACHS MULTI SECTOR FIXED INCOME FUNDS
Notes to Financial Statements (continued)
September 30, 2013 (Unaudited)
|
| 3. INVESTMENTS AND FAIR VALUE MEASUREMENTS (continued) |
| | | | | | | | | | | | |
| | | |
| STRATEGIC INCOME | | | | | | | | | | | | |
| | | |
| Investment Type | | Level 1 | | | Level 2 | | | Level 3 | |
| Assets | | | | | | | | | | | | |
Fixed Income | | | | | | | | | | | | |
Corporate Obligations | | $ | — | | | $ | 1,021,008,027 | | | $ | — | |
Mortgage-Backed Obligations | | | — | | | | 2,478,403,290 | | | | — | |
Asset-Backed Securities | | | — | | | | 570,813,508 | | | | 76,890,190 | |
Foreign Debt Obligations | | | 239,641,381 | | | | 1,096,778,026 | | | | 4,575,454 | |
Structured Notes | | | — | | | | 17,719,114 | | | | — | |
Municipal Debt Obligations | | | — | | | | 539,996,275 | | | | — | |
Government Guarantee Obligations | | | — | | | | 238,786,560 | | | | — | |
U.S. Treasury Obligations and/or Other U.S. Government Agencies | | | 2,725,325,923 | | | | — | | | | — | |
Senior Term Loans | | | — | | | | 145,408,309 | | | | — | |
Investment Company | | | 782,129,734 | | | | — | | | | — | |
| Total | | $ | 3,747,097,038 | | | $ | 6,108,913,109 | | | $ | 81,465,644 | |
| Liabilities(a) | | | | | | | | | | | | |
Fixed Income | | | | | | | | | | | | |
Mortgage-Backed Obligations — Forward Sales Contracts | | $ | — | | | $ | (20,556,874 | ) | | $ | — | |
| | | |
| Derivative Type | | | | | | | | | |
| Assets | | | | | | | | | | | | |
Options Purchased | | $ | — | | | $ | 348,296,549 | | | $ | — | |
Forward Foreign Currency Exchange Contracts(a) | | | — | | | | 44,930,279 | | | | — | |
Futures Contracts(a) | | | 1,018,006 | | | | — | | | | — | |
Interest Rate Swap Contracts(a) | | | — | | | | 180,812,556 | | | | — | |
Credit Default Swap Contracts(a) | | | — | | | | 1,160,621 | | | | — | |
Total Return Swap Contracts(a) | | | — | | | | 6,595,652 | | | | — | |
Written Options Contracts(a) | | | — | | | | 1,298,207 | | | | — | |
| Total | | $ | 1,018,006 | | | $ | 583,093,864 | | | $ | — | |
| Liabilities | | | | | | | | | | | | |
Forward Foreign Currency Exchange Contracts(a) | | $ | — | | | $ | (79,930,539 | ) | | $ | — | |
Futures Contracts(a) | | | (21,655,496 | ) | | | — | | | | — | |
Interest Rate Swap Contracts(a) | | | — | | | | (156,069,674 | ) | | | — | |
Credit Default Swap Contracts(a) | | | — | | | | (2,976,943 | ) | | | — | |
Total Return Swap Contracts(a) | | | — | | | | (7,955,326 | ) | | | — | |
Interest Rate Swaption Contracts(a) | | | — | | | | (1,298,207 | ) | | | — | |
| Total | | $ | (21,655,496 | ) | | $ | (248,230,689 | ) | | $ | — | |
144
GOLDMAN SACHS MULTI SECTOR FIXED INCOME FUNDS
|
| 3. INVESTMENTS AND FAIR VALUE MEASUREMENTS (continued) |
| | | | | | | | | | | | |
| | | |
| WORLD BOND | | | | | | | | | | | | |
| | | |
| Investment Type | | Level 1 | | | Level 2 | | | Level 3 | |
| Assets | | | | | | | | | | | | |
Fixed Income | | | | | | | | | | | | |
Foreign Sovereign Debt Obligations | | $ | 4,234,199 | | | $ | 3,905,078 | | | $ | — | |
Structured Notes | | | — | | | | 112,484 | | | | — | |
U.S. Treasury Obligations and/or Other U.S. Government Agencies | | | 2,131,303 | | | | — | | | | — | |
Investment Company | | | 1,112,747 | | | | — | | | | — | |
| Total | | $ | 7,478,249 | | | $ | 4,017,562 | | | $ | — | |
| | | |
| Derivative Type | | | | | | | | | |
| Assets(a) | | | | | | | | | | | | |
Forward Foreign Currency Exchange Contracts | | $ | — | | | $ | 106,971 | | | $ | — | |
Futures Contracts | | | 10,687 | | | | — | | | | — | |
Interest Rate Swap Contracts | | | — | | | | 157,101 | | | | — | |
| Total | | $ | 10,687 | | | $ | 264,072 | | | $ | — | |
| Liabilities(a) | | | | | | | | | | | | |
Forward Foreign Currency Exchange Contracts | | $ | — | | | $ | (147,211 | ) | | $ | — | |
Futures Contracts | | | (26,924 | ) | | | — | | | | — | |
Interest Rate Swap Contracts | | | — | | | | (188,680 | ) | | | — | |
| Total | | $ | (26,924 | ) | | $ | (335,891 | ) | | $ | — | |
| (a) | | Amount shown represents unrealized gain (loss) at period end. |
| (b) | | Represents an investment that was previously valued using a single source broker quotation for which multiple sources are currently available. |
For further information regarding security characteristics, see the Schedules of Investments.
|
| 4. INVESTMENTS IN DERIVATIVES |
The following tables set forth, by certain risk types, the gross value of derivative contracts as of September 30, 2013. These instruments were used to meet the Funds’ investment objectives and to obtain and/or manage exposure related to the risks below. The values in the tables below exclude the effects of cash collateral received or posted pursuant to these derivative contracts, and therefore are not representative of the Funds’ net exposure.
| | | | | | | | | | | | |
| | | |
| Core Fixed Income | | | | | | | | | | |
| Risk | | Statements of Assets
and Liabilities | | Assets | | | Statements of Assets
and Liabilities | | Liabilities | |
Interest rate | | Receivable for unrealized gain on swap contracts; Unrealized gain on futures variation margin; Investments, at value | | $ | 18,357,838 | (a) | | Payable for unrealized loss on swap contracts; Unrealized loss on futures variation margin | | $ | (3,580,502) | (a)(b) |
Credit | | Receivable for unrealized gain on swap contracts | | | 913,799 | | | Payable for unrealized loss on swap contracts | | | (330,446) | (b) |
Currency | | Receivable for unrealized gain on forward foreign currency exchange contracts | | | 566,143 | | | Payable for unrealized loss on forward foreign currency exchange contracts | | | (1,228,421) | |
| Total | | | | $ | 19,837,780 | | | | | $ | (5,139,369) | |
145
GOLDMAN SACHS MULTI SECTOR FIXED INCOME FUNDS
Notes to Financial Statements (continued)
September 30, 2013 (Unaudited)
|
| 4. INVESTMENTS IN DERIVATIVES (continued) |
| | | | | | | | | | | | |
| | | |
| Core Plus Fixed Income | | | | | | | | | | |
| Risk | | Statements of Assets
and Liabilities | | Assets | | | Statements of Assets
and Liabilities | | Liabilities | |
Interest rate | | Receivable for unrealized gain on swap contracts; Unrealized gain on futures variation margin; Investments, at value | | $ | 12,199,270 | (a) | | Payable for unrealized loss on swap contracts; Unrealized loss on futures variation margin | | $ | (4,736,902) | (a)(b) |
Credit | | Receivable for unrealized gain on swap contracts | | | 187,536 | | | Payable for unrealized loss on swap contracts | | | (59,302) | (b) |
Currency | | Receivable for unrealized gain on forward foreign currency exchange contracts | | | 266,775 | | | Payable for unrealized loss on forward foreign currency exchange contracts | | | (580,984) | |
| Total | | | | $ | 12,653,581 | | | | | $ | (5,377,188) | |
| | | |
| Global Income | | | | | | | | | | |
| Risk | | Statements of Assets
and Liabilities | | Assets | | | Statements of Assets
and Liabilities | | Liabilities | |
Interest rate | | Receivable for unrealized gain on swap contracts; Unrealized gain on futures variation margin; Investments, at value | | $ | 10,377,251 | (a) | | Payable for unrealized loss on swap contracts; Unrealized loss on futures variation margin | | $ | (3,278,070) | (a)(b) |
Credit | | Receivable for unrealized gain on swap contracts | | | 503,921 | | | Payable for unrealized loss on swap contracts | | | (239,175) | (b) |
Currency | | Receivable for unrealized gain on forward foreign currency exchange contracts | | | 1,022,740 | | | Payable for unrealized loss on forward foreign currency exchange contracts | | | (5,927,030) | |
| Total | | | | $ | 11,903,912 | | | | | $ | (9,444,275) | |
| | | |
| Strategic Income | | | | | | | | | | |
| Risk | | Statements of Assets
and Liabilities | | Assets | | | Statements of Assets
and Liabilities | | Liabilities | |
Interest rate | | Receivable for unrealized gain on swap contracts; Unrealized gain on futures variation margin; investments at value | | $ | 538,020,970 | (a) | | Payable for unrealized loss on swap contracts; Unrealized loss on futures variation margin; Options written, at value | | $ | (186,978,703) | (a)(b) |
Credit | | Receivable for unrealized gain on swap contracts | | | 1,160,621 | | | Payable for unrealized loss on swap contracts | | | (2,976,943) | (b) |
Currency | | Receivable for unrealized gain on forward foreign currency exchange contracts | | | 44,930,279 | | | Payable for unrealized loss on forward foreign currency exchange contracts | | | (79,930,539) | |
| Total | | | | $ | 584,111,870 | | | | | $ | (269,886,185) | |
146
GOLDMAN SACHS MULTI SECTOR FIXED INCOME FUNDS
|
| 4. INVESTMENTS IN DERIVATIVES (continued) |
| | | | | | | | | | | | |
| | | |
| World Bond | | | | | | | | | | |
| Risk | | Statements of Assets
and Liabilities | | Assets | | | Statements of Assets
and Liabilities | | Liabilities | |
Interest rate | | Receivable for unrealized gain on swap contracts; Unrealized gain on futures variation margin | | $ | 167,788 | (a) | | Payable for unrealized loss on swap contracts; Unrealized loss on futures variation margin | | $ | (215,604) | (a)(b) |
Currency | | Receivable for unrealized gain on forward foreign currency exchange contracts; Investments, at value | | | 106,971 | | | Payable for unrealized loss on forward foreign currency exchange contracts | | | (147,211) | |
| Total | | | | $ | 274,759 | | | | | $ | (362,815) | |
| (a) | | Includes unrealized gain (loss) on futures contracts and centrally cleared swaps described in the Additional Investment Information sections of the Schedules of Investments. Only current day’s variation margin is reported within the Statements of Assets and Liabilities. |
| (b) | | Aggregate of amounts includes $3,910,948, $4,573,522, $3,507,389, $167,001,943 and $188,680 for Core Fixed Income, Core Plus Fixed Income, Global Income, Strategic Income and World Bond Funds, respectively, which represent the payments to be made pursuant to bilateral agreements should counterparties exercise their “right to terminate” provisions based on, among others, the Funds’ performance, their failure to pay on their obligations or failure to pledge collateral. Such amounts do not include incremental charges directly associated with the close-out of the agreements. They also do not reflect the fair value of any assets pledged as collateral which, through the daily margining process, substantially offsets the aforementioned amounts and for which the Funds are entitled to a full return. |
The following tables set forth, by certain risk types, the Funds’ gains (losses) related to these derivatives and their indicative volumes for the six months ended September 30, 2013. These gains (losses) should be considered in the context that these derivative contracts may have been executed to economically hedge certain investments, and accordingly, certain gains (losses) on such derivative contracts may offset certain (losses) gains attributable to investments. These gains (losses) are included in “Net realized gain (loss)” or “Net change in unrealized gain (loss)” on the Statements of Operations:
| | | | | | | | | | | | | | |
| | | |
| Core Fixed Income | | | | | | | | | | | | |
| Risk | | Statements of Operations | | Net Realized
Gain (Loss) | | | Net Change in
Unrealized
Gain (Loss) | | | Average
Number of
Contracts(a) | |
| Interest rate | | Net realized gain (loss) from investments, futures contracts and swap contracts/Net change in unrealized gain (loss) on investments, futures contracts and swap contracts | | $ | (4,311,177 | ) | | $ | 7,249,676 | | | | 3,015 | |
| Credit | | Net realized gain (loss) from swap contracts/Net change in unrealized gain (loss) on swap contracts | | | (403,650 | ) | | | (19,385 | ) | | | 27 | |
| Currency | | Net realized gain (loss) from forward foreign currency exchange contracts/Net change in unrealized gain (loss) on forward foreign currency exchange contracts | | | (677,801 | ) | | | (418,761 | ) | | | 239 | |
| Total | | | | $ | (5,392,628 | ) | | $ | 6,811,530 | | | | 3,281 | |
| | | |
| Core Plus Fixed Income | | | | | | | | | | | | |
| Risk | | Statements of Operations | | Net Realized
Gain (Loss) | | | Net Change in
Unrealized
Gain (Loss) | | | Average
Number of
Contracts(a) | |
| Interest rate | | Net realized gain (loss) from investments, futures contracts and swap contracts/Net change in unrealized gain (loss) on investments, futures contracts and swap contracts | | $ | (1,578,449 | ) | | $ | 3,484,205 | | | | 1,134 | |
| Credit | | Net realized gain (loss) from swap contracts/Net change in unrealized gain (loss) on swap contracts | | | (380,915 | ) | | | (4,123 | ) | | | 25 | |
| Currency | | Net realized gain (loss) from forward foreign currency exchange contracts/Net change in unrealized gain (loss) on forward foreign currency exchange contracts | | | (282,149 | ) | | | (404,651 | ) | | | 438 | |
| Total | | | | $ | (2,241,513 | ) | | $ | 3,075,431 | | | | 1,597 | |
147
GOLDMAN SACHS MULTI SECTOR FIXED INCOME FUNDS
Notes to Financial Statements (continued)
September 30, 2013 (Unaudited)
|
| 4. INVESTMENTS IN DERIVATIVES (continued) |
| | | | | | | | | | | | | | |
| | | |
| Global Income | | | | | | | | | | | | |
| Risk | | Statements of Operations | | Net Realized
Gain (Loss) | | | Net Change in
Unrealized
Gain (Loss) | | | Average
Number of
Contracts(a) | |
| Interest rate | | Net realized gain (loss) from investments, futures contracts, swap contracts and written options/Net change in unrealized gain (loss) on futures contracts, swap contracts and written options | | $ | 2,634,420 | | | $ | (3,137 | ) | | | 1,244 | |
| Credit | | Net realized gain (loss) from swap contracts/Net change in unrealized gain (loss) on swap contracts | | | (193,204 | ) | | | 122,376 | | | | 8 | |
| Currency | | Net realized gain (loss) from investments, written options and forward foreign currency exchange contracts/Net change in unrealized gain (loss) on investments, written options and forward foreign currency exchange contracts | | | (2,123,487 | ) | | | (8,505,941 | ) | | | 453 | |
| Total | | | | $ | 317,729 | | | $ | (8,386,702 | ) | | | 1,705 | |
| | | |
| Strategic Income | | | | | | | | | | | | |
| Risk | | Statements of Operations | | Net Realized
Gain (Loss) | | | Net Change in
Unrealized
Gain (Loss) | | | Average
Number of
Contracts(a) | |
| Interest rate | | Net realized gain (loss) from investments, futures contracts, swap contracts and written options/Net change in unrealized gain (loss) on investments, futures contracts, swap contracts and written options | | $ | 57,870,962 | | | $ | 29,514,702 | | | | 15,490 | |
| Credit | | Net realized gain (loss) from swap contracts/Net change in unrealized gain (loss) on swap contracts | | | (1,732,523 | ) | | | (9,730,678 | ) | | | 28 | |
| Currency | | Net realized gain (loss) from forward foreign currency exchange contracts/Net change in unrealized gain (loss) on forward foreign currency exchange contracts | | | (46,062,931 | ) | | | (28,050,750 | ) | | | 456 | |
| Total | | | | $ | 10,075,508 | | | $ | (8,266,726 | ) | | | 15,974 | |
| | | |
| World Bond | | | | | | | | | | | | |
| Risk | | Statements of Operations | | Net Realized
Gain (Loss) | | | Net Change in
Unrealized
Gain (Loss) | | | Average
Number of
Contracts(a) | |
| Interest rate | | Net realized gain (loss) from futures contracts and swap contracts/Net change in unrealized gain (loss) on futures contracts and swap contracts | | $ | 50,651 | | | $ | (43,003 | ) | | | 88 | |
| Currency | | Net realized gain (loss) from forward foreign currency exchange contracts/Net change in unrealized gain (loss) on forward foreign currency exchange contracts | | | (129,509 | ) | | | 30,455 | | | | 477 | |
| Total | | | | $ | (78,858 | ) | | $ | (12,548 | ) | | | 565 | |
| (a) | | Average number of contracts is based on the average of month end balances for the six months ended September 30, 2013. |
In order to better define its contractual rights and to secure rights that will help a Fund mitigate its counterparty risk, a Fund may enter into an International Swaps and Derivatives Association, Inc. Master Agreement (“ISDA Master Agreement”) or similar agreement with its derivatives counterparties. An ISDA Master Agreement is a bilateral agreement between a Fund and a counterparty that governs OTC derivatives, including foreign exchange contracts, and typically contains, among other things, collateral posting terms and netting provisions in the event of a default and/or termination event. The provisions of the ISDA Master Agreement typically permit a single net payment in the event of a default (close-out netting) or similar event, including the bankruptcy or insolvency of the counterparty.
148
GOLDMAN SACHS MULTI SECTOR FIXED INCOME FUNDS
|
| 4. INVESTMENTS IN DERIVATIVES (continued) |
Collateral and margin requirements differ between exchange traded derivatives and OTC derivatives. Margin requirements are established by the broker or clearing house for exchange-traded and centrally cleared derivatives (financial futures contracts, options and centrally cleared swaps) pursuant to governing agreements for those instrument types. Brokers can ask for margin in excess of the minimum in certain circumstances. Collateral terms are contract-specific for OTC derivatives (foreign currency exchange contracts, options and certain swaps). For derivatives traded under an ISDA Master Agreement, the collateral requirements are typically calculated by netting the marked to market amount for each transaction under such agreement and comparing that amount to the value of any collateral currently pledged by a Fund and the counterparty. Additionally, a Fund may be required to post additional collateral to the counterparty in the form of initial margin, the terms of which would be outlined in the confirmation of the OTC transaction.
For financial reporting purposes, cash collateral that has been pledged to cover obligations of a Fund and cash collateral received from the counterparty, if any, is reported separately on the Statements of Assets and Liabilities as receivables/payables for collateral on certain derivative contracts. Non-cash collateral pledged by a Fund, if any, is noted in the Schedules of Investments. Generally, the amount of collateral due from or to a counterparty must exceed a minimum transfer amount threshold (e.g. $250,000) before a transfer is required to be made. To the extent amounts due to a Fund from its counterparties are not fully collateralized, contractually or otherwise, the Fund bears the risk of loss from counterparty nonperformance. A Fund attempts to mitigate counterparty risk by only entering into agreements with counterparties that it believes to be of good standing and by monitoring the financial stability of those counterparties.
Additionally, the netting of assets and liabilities and the offsetting of collateral pledged or received are based on contractual netting/set-off provisions in the ISDA Master Agreement or similar agreements. However, in the event of a default or insolvency of a counterparty, a court could determine that such rights are not enforceable due the restrictions or prohibitions against the right of setoff that may be imposed due to a particular jurisdiction’s bankruptcy or insolvency laws.
The following tables set forth the Funds’ net exposure for derivative instruments that are subject to enforceable master netting arrangements or similar agreements as of September 30, 2013:
| | | | | | | | | | | | | | | | | | | | | | | | | | | | | | | | | | | | | | | | | | | | |
|
| Core Fixed Income Fund | |
| | | Derivative Assets(1) | | | Derivative Liabilities(1) | | | Net Derivative
Assets
(Liabilities) | | | Collateral
(Received)
Pledged(1) | | | Net
Amount(2) | |
| Counterparty | | Options
Purchased | | | Swaps | | | Forward
Currency
Contracts | | | Futures | | | Total | | | Swaps | | | Forward
Currency
Contracts | | | Total | | | | |
Bank of America Securities LLC | | $ | 945,118 | | | $ | 415,093 | | | $ | 22,844 | | | $ | — | | | $ | 1,383,055 | | | $ | (44,388 | ) | | $ | (52,629 | ) | | $ | (97,017 | ) | | $ | 1,286,038 | | | $ | (1,286,038 | ) | | $ | — | |
Barclays Bank PLC | | | — | | | | — | | | | 58,908 | | | | — | | | | 58,908 | | | | — | | | | (32,112 | ) | | | (32,112 | ) | | | 26,796 | | | | — | | | | 26,796 | |
BNP Paribas SA | | | — | | | | — | | | | 208,732 | | | | — | | | | 208,732 | | | | — | | | | (87,281 | ) | | | (87,281 | ) | | | 121,451 | | | | — | | | | 121,451 | |
Centrally Cleared | | | — | | | | — | | | | — | | | | — | | | | — | | | | (587,297 | ) | | | — | | | | (587,297 | ) | | | (587,297 | ) | | | 587,297 | | | | — | |
Citibank NA | | | 2,233,069 | | | | 1,177 | | | | 20,111 | | | | — | | | | 2,254,357 | | | | (647,797 | ) | | | (111,247 | ) | | | (759,044 | ) | | | 1,495,313 | | | | (1,495,313 | ) | | | — | |
Credit Suisse First Boston Corp. | | | — | | | | 14,152 | | | | — | | | | — | | | | 14,152 | | | | — | | | | — | | | | — | | | | 14,152 | | | | (14,152 | ) | | | — | |
Credit Suisse International (London) | | | — | | | | — | | | | 6,548 | | | | — | | | | 6,548 | | | | — | | | | (11,338 | ) | | | (11,338 | ) | | | (4,790 | ) | | | — | | | | (4,790 | ) |
Deutsche Bank Securities, Inc. | | | 536,228 | | | | 5,375 | | | | — | | | | — | | | | 541,603 | | | | (266,033 | ) | | | — | | | | (266,033 | ) | | | 275,570 | | | | (150,000 | ) | | | 125,570 | |
Deutsche Bank AG (London) | | | — | | | | — | | | | — | | | | — | | | | — | | | | — | | | | (7,189 | ) | | | (7,189 | ) | | | (7,189 | ) | | | — | | | | (7,189 | ) |
Exchange Traded | | | — | | | | — | | | | — | | | | 55,450 | | | | 55,450 | | | | — | | | | — | | | | — | | | | 55,450 | | | | — | | | | 55,450 | |
HSBC Bank PLC | | | — | | | | — | | | | 1,132 | | | | — | | | | 1,132 | | | | — | | | | (59,643 | ) | | | (59,643 | ) | | | (58,511 | ) | | | — | | | | (58,511 | ) |
JPMorgan Securities, Inc. | | | 740,981 | | | | — | | | | 120,848 | | | | — | | | | 861,829 | | | | (456,990 | ) | | | (297,988 | ) | | | (754,978 | ) | | | 106,851 | | | | (106,851 | ) | | | — | |
Morgan Stanley Capital Services, Inc. | | | 2,317,952 | | | | 478,002 | | | | — | | | | — | | | | 2,795,954 | | | | (1,109,656 | ) | | | (24,362 | ) | | | (1,134,018 | ) | | | 1,661,936 | | | | (1,661,936 | ) | | | — | |
Royal Bank of Canada | | | — | | | | — | | | | — | | | | — | | | | — | | | | — | | | | (293,756 | ) | | | (293,756 | ) | | | (293,756 | ) | | | — | | | | (293,756 | ) |
149
GOLDMAN SACHS MULTI SECTOR FIXED INCOME FUNDS
Notes to Financial Statements (continued)
September 30, 2013 (Unaudited)
|
| 4. INVESTMENTS IN DERIVATIVES (continued) |
| | | | | | | | | | | | | | | | | | | | | | | | | | | | | | | | | | | | | | | | | | | | |
|
| Core Fixed Income Fund (continued) | |
| | | Derivative Assets(1) | | | Derivative Liabilities(1) | | | Net Derivative
Assets
(Liabilities) | | | Collateral
(Received)
Pledged(1) | | | Net
Amount(2) | |
| Counterparty | | Options
Purchased | | | Swaps | | | Forward
Currency
Contracts | | | Futures | | | Total | | | Swaps | | | Forward
Currency
Contracts | | | Total | | | | |
Royal Bank of Scotland
PLC | | $ | — | | | $ | — | | | $ | 25,694 | | | $ | — | | | $ | 25,694 | | | $ | — | | | $ | (6,280 | ) | | $ | (6,280 | ) | | $ | 19,414 | | | $ | — | | | $ | 19,414 | |
Standard Chartered Bank | | | — | | | | — | | | | 4,703 | | | | — | | | | 4,703 | | | | — | | | | — | | | | — | | | | 4,703 | | | | — | | | | 4,703 | |
State Street Bank | | | — | | | | — | | | | 6,767 | | | | — | | | | 6,767 | | | | — | | | | (193,969 | ) | | | (193,969 | ) | | | (187,202 | ) | | | — | | | | (187,202 | ) |
Westpac Banking Corp. | | | — | | | | — | | | | 89,856 | | | | — | | | | 89,856 | | | | — | | | | (50,627 | ) | | | (50,627 | ) | | | 39,229 | | | | — | | | | 39,229 | |
Total | | $ | 6,773,348 | | | $ | 913,799 | | | $ | 566,143 | | | $ | 55,450 | | | $ | 8,308,740 | | | $ | (3,112,161 | ) | | $ | (1,228,421 | ) | | $ | (4,340,582 | ) | | $ | 3,968,158 | | | $ | (4,126,993 | ) | | $ | (158,835 | ) |
| | | | | | | | | | | | | | | | | | | | | | | | | | | | | | | | | | | | | | | | | | | | |
|
| Core Plus Fixed Income Fund | |
| | | Derivative Assets(1) | | | Derivative Liabilities(1) | | | Net
Derivative
Assets
(Liabilities) | | | Collateral
(Received)
Pledged(1) | | | Net
Amount(2) | |
| Counterparty | | Options Purchased | | | Swaps | | | Forward
Currency
Contracts | | | Total | | | Swaps | | | Forward
Currency
Contracts | | | Futures | | | Total | | | | |
Bank of America Securities LLC | | $ | 882,180 | | | $ | 544,207 | | | $ | 9,413 | | | $ | 1,435,800 | | | $ | (434,108 | ) | | $ | (17,812 | ) | | $ | — | | | $ | (451,920 | ) | | $ | 983,880 | | | $ | (983,880 | ) | | $ | — | |
Barclays Bank PLC | | | — | | | | — | | | | 31,348 | | | | 31,348 | | | | (12,126 | ) | | | (13,430 | ) | | | — | | | | (25,556 | ) | | | 5,792 | | | | — | | | | 5,792 | |
BNP Paribas SA | | | — | | | | — | | | | 30,963 | | | | 30,963 | | | | — | | | | (17,458 | ) | | | — | | | | (17,458 | ) | | | 13,505 | | | | — | | | | 13,505 | |
Centrally Cleared | | | — | | | | 3,594 | | | | — | | | | 3,594 | | | | — | | | | — | | | | — | | | | — | | | | 3,594 | | | | — | | | | 3,594 | |
Citibank NA | | | 1,684,954 | | | | 11,525 | | | | 45,288 | | | | 1,741,767 | | | | (499,264 | ) | | | (51,577 | ) | | | — | | | | (550,841 | ) | | | 1,190,926 | | | | (1,190,926 | ) | | | — | |
Credit Suisse International (London) | | | — | | | | 17,602 | | | | 23,483 | | | | 41,085 | | | | — | | | | (23,913 | ) | | | — | | | | (23,913 | ) | | | 17,172 | | | | — | | | | 17,172 | |
Deutsche Bank Securities, Inc. | | | 479,252 | | | | 56,784 | | | | — | | | | 536,036 | | | | (198,090 | ) | | | — | | | | — | | | | (198,090 | ) | | | 337,946 | | | | (300,000 | ) | | | 37,946 | |
Deutsche Bank AG (London) | | | — | | | | — | | | | 4,690 | | | | 4,690 | | | | — | | | | (30,905 | ) | | | — | | | | (30,905 | ) | | | (26,215 | ) | | | — | | | | (26,215 | ) |
Exchange Traded | | | — | | | | — | | | | — | | | | — | | | | — | | | | — | | | | (12,782 | ) | | | (12,782 | ) | | | (12,782 | ) | | | 12,782 | | | | — | |
HSBC Bank PLC | | | — | | | | — | | | | 9,487 | | | | 9,487 | | | | — | | | | (10,548 | ) | | | — | | | | (10,548 | ) | | | (1,061 | ) | | | — | | | | (1,061 | ) |
JPMorgan Securities, Inc. | | | 662,268 | | | | — | | | | 11,993 | | | | 674,261 | | | | (350,756 | ) | | | (207,627 | ) | | | — | | | | (558,383 | ) | | | 115,878 | | | | (115,878 | ) | | | — | |
Morgan Stanley Capital Services, Inc. | | | 1,930,567 | | | | 93,428 | | | | 10,082 | | | | 2,034,077 | | | | (1,124,879 | ) | | | (11,231 | ) | | | — | | | | (1,136,110 | ) | | | 897,967 | | | | (897,967 | ) | | | — | |
Royal Bank of Canada | | | — | | | | — | | | | 17,315 | | | | 17,315 | | | | — | | | | (84,037 | ) | | | — | | | | (84,037 | ) | | | (66,722 | ) | | | — | | | | (66,722 | ) |
Royal Bank of Scotland PLC | | | — | | | | — | | | | 11,808 | | | | 11,808 | | | | — | | | | (24,408 | ) | | | — | | | | (24,408 | ) | | | (12,600 | ) | | | — | | | | (12,600 | ) |
Standard Chartered Bank | | | — | | | | — | | | | 562 | | | | 562 | | | | — | | | | (18,070 | ) | | | — | | | | (18,070 | ) | | | (17,508 | ) | | | — | | | | (17,508 | ) |
State Street Bank | | | — | | | | — | | | | 3,598 | | | | 3,598 | | | | — | | | | (38,315 | ) | | | — | | | | (38,315 | ) | | | (34,717 | ) | | | — | | | | (34,717 | ) |
UBS AG (London) | | | — | | | | — | | | | 33,551 | | | | 33,551 | | | | — | | | | (24,798 | ) | | | — | | | | (24,798 | ) | | | 8,753 | | | | — | | | | 8,753 | |
Westpac Banking Corp. | | | — | | | | — | | | | 23,194 | | | | 23,194 | | | | — | | | | (6,855 | ) | | | — | | | | (6,855 | ) | | | 16,339 | | | | — | | | | 16,339 | |
Total | | $ | 5,639,221 | | | $ | 727,140 | | | $ | 266,775 | | | $ | 6,633,136 | | | $ | (2,619,223 | ) | | $ | (580,984 | ) | | $ | (12,782 | ) | | $ | (3,212,989 | ) | | $ | 3,420,147 | | | $ | (3,475,869 | ) | | $ | (55,722 | ) |
150
GOLDMAN SACHS MULTI SECTOR FIXED INCOME FUNDS
|
| 4. INVESTMENTS IN DERIVATIVES (continued) |
| | | | | | | | | | | | | | | | | | | | | | | | | | | | | | | | | | | | | | | | | | | | |
|
| Global Income Fund | |
| | | Derivative Assets(1) | | | Derivative Liabilities(1) | | | Net
Derivative
Assets
(Liabilities) | | | Collateral
(Received)
Pledged(1) | | | Net
Amount(2) | |
| Counterparty | | Options Purchased | | | Swaps | | | Forward
Currency
Contracts | | | Total | | | Swaps | | | Forward
Currency
Contracts | | | Futures | | | Total | | | | |
Bank of America Securities LLC | | $ | — | | | $ | 96,104 | | | $ | 32,331 | | | $ | 128,435 | | | $ | (89,705 | ) | | $ | (68,052 | ) | | $ | — | | | $ | (157,757 | ) | | $ | (29,322 | ) | | $ | — | | | $ | (29,322 | ) |
Barclays Bank PLC | | | 887,285 | | | | — | | | | 46,631 | | | | 933,916 | | | | (302,162 | ) | | | (168,779 | ) | | | — | | | | (470,941 | ) | | | 462,975 | | | | (462,975 | ) | | | — | |
BNP Paribas SA | | | — | | | | 37,533 | | | | 101,553 | | | | 139,086 | | | | — | | | | (57,353 | ) | | | — | | | | (57,353 | ) | | | 81,733 | | | | — | | | | 81,733 | |
Centrally Cleared | | | — | | | | — | | | | — | | | | — | | | | (1,956,315 | ) | | | — | | | | — | | | | (1,956,315 | ) | | | (1,956,315 | ) | | | 1,799,923 | | | | (156,392 | ) |
Citibank NA | | | 1,318,350 | | | | 99,370 | | | | 74,567 | | | | 1,492,287 | | | | (8,940 | ) | | | (232,714 | ) | | | — | | | | (241,654 | ) | | | 1,250,633 | | | | (1,250,633 | ) | | | — | |
Credit Suisse International (London) | | | — | | | | 152,827 | | | | 75,382 | | | | 228,209 | | | | — | | | | (90,137 | ) | | | — | | | | (90,137 | ) | | | 138,072 | | | | (138,072 | ) | | | — | |
Deutsche Bank Securities, Inc. | | | — | | | | 368,283 | | | | — | | | | 368,283 | | | | (72,656 | ) | | | — | | | | — | | | | (72,656 | ) | | | 295,627 | | | | — | | | | 295,627 | |
Deutsche Bank AG (London) | | | — | | | | — | | | | 255,142 | | | | 255,142 | | | | — | | | | (275,224 | ) | | | — | | | | (275,224 | ) | | | (20,082 | ) | | | — | | | | (20,082 | ) |
Exchange Traded | | | — | | | | — | | | | — | | | | — | | | | — | | | | — | | | | (34,073 | ) | | | (34,073 | ) | | | (34,073 | ) | | | 34,073 | (3) | | | — | |
HSBC Bank PLC | | | — | | | | — | | | | 46,595 | | | | 46,595 | | | | — | | | | (271,555 | ) | | | — | | | | (271,555 | ) | | | (224,960 | ) | | | — | | | | (224,960 | ) |
JPMorgan Securities, Inc. | | | 719,327 | | | | 10,153 | | | | 57,631 | | | | 787,111 | | | | (16,643 | ) | | | (151,894 | ) | | | — | | | | (168,537 | ) | | | 618,574 | | | | (618,574 | ) | | | — | |
Morgan Stanley Capital Services, Inc. | | | — | | | | 411,672 | | | | 36,101 | | | | 447,773 | | | | (123,441 | ) | | | (43,200 | ) | | | — | | | | (166,641 | ) | | | 281,132 | | | | (189,600 | ) | | | 91,532 | |
Royal Bank of Canada | | | 2,525,723 | | | | 355,233 | | | | 57,647 | | | | 2,938,603 | | | | (1,329,561 | ) | | | (608,978 | ) | | | — | | | | (1,938,539 | ) | | | 1,000,064 | | | | (1,000,064 | ) | | | — | |
Royal Bank of Scotland PLC | | | — | | | | — | | | | 11,760 | | | | 11,760 | | | | — | | | | (82,779 | ) | | | — | | | | (82,779 | ) | | | (71,019 | ) | | | — | | | | (71,019 | ) |
Standard Chartered Bank | | | — | | | | — | | | | 2,291 | | | | 2,291 | | | | — | | | | (33,478 | ) | | | — | | | | (33,478 | ) | | | (31,187 | ) | | | — | | | | (31,187 | ) |
State Street Bank | | | — | | | | — | | | | 21,281 | | | | 21,281 | | | | — | | | | (125,253 | ) | | | — | | | | (125,253 | ) | | | (103,972 | ) | | | — | | | | (103,972 | ) |
UBS AG (London) | | | — | | | | 434,523 | | | | 124,040 | | | | 558,563 | | | | — | | | | (3,314,852 | ) | | | — | | | | (3,314,852 | ) | | | (2,756,289 | ) | | | — | | | | (2,756,289 | ) |
Westpac Banking Corp. | | | — | | | | — | | | | 79,709 | | | | 79,709 | | | | — | | | | (402,782 | ) | | | — | | | | (402,782 | ) | | | (323,073 | ) | | | — | | | | (323,073 | ) |
Total | | $ | 5,450,685 | | | $ | 1,965,698 | | | $ | 1,022,661 | | | $ | 8,439,044 | | | $ | (3,899,423 | ) | | $ | (5,927,030 | ) | | $ | (34,073 | ) | | $ | (9,860,526 | ) | | $ | (1,421,482 | ) | | $ | (1,825,922 | ) | | $ | (3,247,404 | ) |
151
GOLDMAN SACHS MULTI SECTOR FIXED INCOME FUNDS
Notes to Financial Statements (continued)
September 30, 2013 (Unaudited)
|
| 4. INVESTMENTS IN DERIVATIVES (continued) |
| | | | | | | | | | | | | | | | | | | | | | | | | | | | | | | | | | | | | | | | | | | | | | | | |
|
| Strategic Income Fund | |
| | | Derivative Assets(1) | | | Derivative Liabilities(1) | | | Net
Derivative
Assets
(Liabilities) | | | Collateral
(Received)
Pledged(1) | | | Net
Amount(2) | |
| Counterparty | | Options Purchased | | | Swaps | | | Forward
Currency
Contracts | | | Total | | | Swaps | | | Forward
Currency
Contracts | | | Futures | | | Options | | | Total | | | | |
Bank of America Securities LLC | | $ | 41,848,574 | | | $ | 15,887,055 | | | $ | 1,655,561 | | | $ | 59,391,190 | | | $ | (15,897,218 | ) | | $ | (4,189,438 | ) | | $ | — | | | $ | — | | | $ | (20,086,656 | ) | | $ | 39,304,534 | | | $ | (33,850,000 | ) | | $ | 5,454,534 | |
Barclays Bank PLC | | | — | | | | 3,920,839 | | | | 2,306,792 | | | | 6,227,631 | | | | (2,082,449 | ) | | | (3,384,332 | ) | | | — | | | | — | | | | (5,466,781 | ) | | | 760,850 | | | | — | | | | 760,850 | |
BNP Paribas SA | | | — | | | | 152,478 | | | | — | | | | 152,478 | | | | — | | | | (1,977,310 | ) | | | — | | | | — | | | | (1,977,310 | ) | | | (1,824,832 | ) | | | — | | | | (1,824,832 | ) |
Centrally Cleared | | | — | | | | 1,830,493 | | | | — | | | | 1,830,493 | | | | — | | | | — | | | | — | | | | — | | | | — | | | | 1,830,493 | | | | — | | | | 1,830,493 | |
Citibank NA | | | 159,434,061 | | | | 4,041,482 | | | | 7,280,258 | | | | 170,755,801 | | | | (10,923,967 | ) | | | (8,049,779 | ) | | | — | | | | — | | | | (18,973,746 | ) | | | 151,782,055 | | | | (151,782,055 | ) | | | — | |
Credit Suisse International (London) | | | — | | | | 6,121,954 | | | | 3,674,499 | | | | 9,796,453 | | | | (2,160,515 | ) | | | (4,115,296 | ) | | | — | | | | — | | | | (6,275,811 | ) | | | 3,520,642 | | | | (3,520,642 | ) | | | — | |
Deutsche Bank Securities, Inc. | | | 33,291,344 | | | | 9,534,863 | | | | — | | | | 42,826,207 | | | | (5,875,748 | ) | | | — | | | | — | | | | (1,048,187 | ) | | | (6,923,935 | ) | | | 35,902,272 | | | | (35,902,272 | ) | | | — | |
Deutsche Bank AG (London) | | | — | | | | — | | | | 911,266 | | | | 911,266 | | | | — | | | | (3,910,584 | ) | | | — | | | | — | | | | (3,910,584 | ) | | | (2,999,318 | ) | | | — | | | | (2,999,318 | ) |
Exchange Traded | | | — | | | | — | | | | — | | | | — | | | | — | | | | — | | | | (1,205,433 | ) | | | — | | | | (1,205,433 | ) | | | (1,205,433 | ) | | | 1,205,433 | | | | — | |
HSBC Bank PLC | | | — | | | | — | | | | 4,942,962 | | | | 4,942,962 | | | | — | | | | (1,743,204 | ) | | | — | | | | — | | | | (1,743,204 | ) | | | 3,199,758 | | | | (45 | ) | | | 3,199,713 | |
JPMorgan Securities, Inc. | | | 56,609,494 | | | | 1,603,513 | | | | 3,317,886 | | | | 61,530,893 | | | | (10,818,812 | ) | | | (18,001,558 | ) | | | — | | | | — | | | | (28,820,370 | ) | | | 32,710,523 | | | | (32,710,523 | ) | | | — | |
Morgan Stanley Capital Services, Inc. | | | 57,113,076 | | | | 2,488,398 | | | | 1,590,954 | | | | 61,192,428 | | | | (16,705,777 | ) | | | (3,411,020 | ) | | | — | | | | — | | | | (20,116,797 | ) | | | 41,075,631 | | | | (41,075,631 | ) | | | — | |
Royal Bank of Canada | | | — | | | | 7,883,995 | | | | 2,892,109 | | | | 10,776,104 | | | | (9,079,245 | ) | | | (10,691,248 | ) | | | — | | | | — | | | | (19,770,493 | ) | | | (8,994,389 | ) | | | 5,450,401 | | | | (3,543,988 | ) |
Royal Bank of Scotland PLC | | | — | | | | — | | | | 733,595 | | | | 733,595 | | | | — | | | | (3,386,147 | ) | | | — | | | | — | | | | (3,386,147 | ) | | | (2,652,552 | ) | | | — | | | | (2,652,552 | ) |
Standard Chartered Bank | | | — | | | | — | | | | 5,719,063 | | | | 5,719,063 | | | | — | | | | (2,052,570 | ) | | | — | | | | — | | | | (2,052,570 | ) | | | 3,666,493 | | | | — | | | | 3,666,493 | |
State Street Bank | | | — | | | | — | | | | 2,827,742 | | | | 2,827,742 | | | | — | | | | (4,987,667 | ) | | | — | | | | — | | | | (4,987,667 | ) | | | (2,159,925 | ) | | | — | | | | (2,159,925 | ) |
UBS AG (London) | | | — | | | | — | | | | 5,149,670 | | | | 5,149,670 | | | | — | | | | (8,704,585 | ) | | | — | | | | — | | | | (8,704,585 | ) | | | (3,554,915 | ) | | | — | | | | (3,554,915 | ) |
Westpac Banking Corp. | | | — | | | | — | | | | 1,927,922 | | | | 1,927,922 | | | | — | | | | (1,325,801 | ) | | | — | | | | — | | | | (1,325,801 | ) | | | 602,121 | | | | — | | | | 602,121 | |
Total | | $ | 348,296,549 | | | $ | 53,465,070 | | | $ | 44,930,279 | | | $ | 446,691,898 | | | $ | (73,543,731 | ) | | $ | (79,930,539 | ) | | $ | (1,205,433 | ) | | $ | (1,048,187 | ) | | $ | (155,727,890 | ) | | $ | 290,964,008 | | | $ | (292,185,334 | ) | | $ | (1,221,326 | ) |
152
GOLDMAN SACHS MULTI SECTOR FIXED INCOME FUNDS
|
| 4. INVESTMENTS IN DERIVATIVES (continued) |
| | | | | | | | | | | | | | | | | | | | | | | | | | | | | | | | | | | | | | | | |
|
| World Bond Fund | |
| | | Derivative Assets(1) | | | Derivative Liabilities(1) | | | Net Derivative
Assets
(Liabilities) | | | Collateral
(Received)
Pledged(1) | | | Net
Amount(2) | |
| Counterparty | | Swaps | | | Forward
Currency
Contracts | | | Total | | | Swaps | | | Forward
Currency
Contracts | | | Futures | | | Total | | | | |
Bank of America Securities LLC | | $ | — | | | $ | 2,309 | | | $ | 2,309 | | | $ | (9,981 | ) | | $ | (6,726 | ) | | $ | — | | | $ | (16,707 | ) | | $ | (14,398 | ) | | $ | — | | | $ | (14,398 | ) |
Barclays Bank PLC | | | 16,335 | | | | 3,530 | | | | 19,865 | | | | (45,744 | ) | | | (4,578 | ) | | | — | | | | (50,322 | ) | | | (30,457 | ) | | | — | | | | (30,457 | ) |
BNP Paribas SA | | | — | | | | 34 | | | | 34 | | | | — | | | | (3,031 | ) | | | — | | | | (3,031 | ) | | | (2,997 | ) | | | — | | | | (2,997 | ) |
Centrally Cleared | | | 165 | | | | — | | | | 165 | | | | — | | | | — | | | | — | | | | — | | | | 165 | | | | — | | | | 165 | |
Citibank NA | | | 12,853 | | | | 7,490 | | | | 20,343 | | | | (21,798 | ) | | | (9,880 | ) | | | — | | | | (31,678 | ) | | | (11,335 | ) | | | — | | | | (11,335 | ) |
Credit Suisse International (London) | | | 459 | | | | 7,471 | | | | 7,930 | | | | (28,175 | ) | | | (8,493 | ) | | | — | | | | (36,668 | ) | | | (28,738 | ) | | | — | | | | (28,738 | ) |
Deutsche Bank Securities, Inc. | | | 12,756 | | | | — | | | | 12,756 | | | | (20,950 | ) | | | — | | | | — | | | | (20,950 | ) | | | (8,194 | ) | | | — | | | | (8,194 | ) |
Deutsche Bank AG (London) | | | — | | | | 5,118 | | | | 5,118 | | | | — | | | | (11,189 | ) | | | — | | | | (11,189 | ) | | | (6,071 | ) | | | — | | | | (6,071 | ) |
Exchange Traded | | | — | | | | — | | | | — | | | | — | | | | — | | | | (1,098 | ) | | | (1,098 | ) | | | (1,098 | ) | | | 1,098 | | | | — | |
HSBC Bank PLC | | | — | | | | 46,546 | | | | 46,546 | | | | — | | | | (6,415 | ) | | | — | | | | (6,415 | ) | | | 40,131 | | | | — | | | | 40,131 | |
JPMorgan Securities, Inc. | | | — | | | | 3,641 | | | | 3,641 | | | | (2,105 | ) | | | (38,721 | ) | | | — | | | | (40,826 | ) | | | (37,185 | ) | | | — | | | | (37,185 | ) |
Morgan Stanley Capital Services, Inc. | | | — | | | | 7,144 | | | | 7,144 | | | | (410 | ) | | | (3,147 | ) | | | — | | | | (3,557 | ) | | | 3,587 | | | | — | | | | 3,587 | |
Royal Bank of Canada | | | — | | | | 3,098 | | | | 3,098 | | | | — | | | | (5,734 | ) | | | — | | | | (5,734 | ) | | | (2,636 | ) | | | — | | | | (2,636 | ) |
Standard Chartered Bank | | | — | | | | 5,459 | | | | 5,459 | | | | — | | | | (3,075 | ) | | | — | | | | (3,075 | ) | | | 2,384 | | | | — | | | | 2,384 | |
State Street Bank | | | — | | | | 2,257 | | | | 2,257 | | | | — | | | | (7,678 | ) | | | — | | | | (7,678 | ) | | | (5,421 | ) | | | — | | | | (5,421 | ) |
UBS AG (London) | | | — | | | | 6,080 | | | | 6,080 | | | | — | | | | (37,084 | ) | | | — | | | | (37,084 | ) | | | (31,004 | ) | | | — | | | | (31,004 | ) |
Westpac Banking Corp. | | | — | | | | 6,794 | | | | 6,794 | | | | — | | | | (1,460 | ) | | | — | | | | (1,460 | ) | | | 5,334 | | | | — | | | | 5,334 | |
Total | | $ | 42,568 | | | $ | 106,971 | | | $ | 149,539 | | | $ | (129,163 | ) | | $ | (147,211 | ) | | $ | (1,098 | ) | | $ | (277,472 | ) | | $ | (127,933 | ) | | $ | 1,098 | | | $ | (126,835 | ) |
| (1) | | Gross amounts available for offset but not netted in the Statement of Assets and Liabilities. |
| (2) | | Net amount represents the net amount due (to) from counterparty in the event of a default based on the contractual set-off rights under the agreement. Net amount excludes any over-collateralized amounts. |
| (3) | | Represents non-cash collateral. |
153
GOLDMAN SACHS MULTI SECTOR FIXED INCOME FUNDS
Notes to Financial Statements (continued)
September 30, 2013 (Unaudited)
|
| 5. AGREEMENTS AND AFFILIATED TRANSACTIONS |
A. Management Agreements — Under the Agreements, GSAM and GSAMI manage the Funds, subject to the general supervision of the Trustees.
As compensation for the services rendered pursuant to the Agreements, the assumption of the expenses related thereto and administration of the Funds’ business affairs, including providing facilities, GSAM and GSAMI are entitled to a management fee, accrued daily and paid monthly, equal to an annual percentage rate of each Fund’s average daily net assets.
For the six months ended September 30, 2013, contractual and effective net management fees with GSAM and GSAMI were at the following rates:
| | | | | | | | | | | | | | | | | | | | | | | | | | |
| | | | | Contractual Management Rate | |
| Fund | | | | First
$1 billion | | | Next
$1 billion | | | Next
$3 billion | | | Next
$3 billion | | | Over
$8 billion | | | Effective
Rate | |
Core Fixed Income | | | | | 0.40 | % | | | 0.36 | % | | | 0.34 | % | | | 0.33 | % | | | 0.32 | % | | | 0.39 | % |
Core Plus Fixed Income | | | | | 0.45 | | | | 0.41 | | | | 0.39 | | | | 0.38 | | | | 0.37 | | | | 0.45 | |
Global Income | | | | | 0.65 | | | | 0.59 | | | | 0.56 | | | | 0.55 | | | | 0.54 | | | | 0.65 | |
Strategic Income | | | | | 0.60 | | | | 0.54 | | | | 0.51 | | | | 0.50 | | | | 0.49 | | | | 0.53 | |
World Bond | | | | | 0.65 | | | | 0.59 | | | | 0.56 | | | | 0.54 | | | | 0.53 | | | | 0.65 | |
B. Distribution and Service Plans — The Trust, on behalf of each Fund, has adopted Distribution and Service Plans (the “Plans”). Under the Plans, Goldman Sachs, which serves as distributor (the “Distributor”), is entitled to a fee, accrued daily and paid monthly for distribution services and personal and account maintenance services, which may then be paid by Goldman Sachs to authorized dealers, at the following annual rates calculated on a Fund’s average daily net assets of each respective share class:
| | | | | | | | | | | | | | | | |
| | | Distribution and Service Plan Rates | |
| | | Class A* | | | Class B | | | Class C | | | Class R* | |
Distribution Plan | | | 0.25 | % | | | 0.75 | % | | | 0.75 | % | | | 0.50 | % |
Service Plan | | | — | | | | 0.25 | | | | 0.25 | | | | — | |
| * | | With respect to Class A and Class R Shares, the Distributor at its discretion may use compensation for distribution services paid under the Distribution Plan to compensate service organizations for personal and account maintenance services and expenses as long as such total compensation does not exceed the maximum cap on “service fees” imposed by the Financial Industry Regulatory Authority. |
For the six months ended September 30, 2013, Goldman Sachs waived a portion of the distribution and service fees equal to 0.17% and 0.01% of the average daily net assets attributable to Class C shares and Class R shares of the World Bond Fund, respectively.
C. Distribution Agreement — Goldman Sachs, as Distributor of the shares of the Funds pursuant to a Distribution Agreement, may retain a portion of the Class A front end sales charge and Class B and Class C Shares’ CDSC. During the six months ended September 30, 2013, Goldman Sachs advised that it retained the following amounts:
| | | | | | | | | | | | | | |
| | | | | Front End
Sales Charge | | | Contingent Deferred
Sales Charge | |
| Fund | | | | Class A | | | Class B | | | Class C | |
Core Fixed Income | | | | $ | 2,147 | | | $ | — | | | $ | 381 | |
Core Plus Fixed Income | | | | | 1,914 | | | | — | | | | 3 | |
Global Income | | | | | 2,294 | | | | — | | | | — | |
Strategic Income | | | | | 315,269 | | | | N/A | | | | 1 | |
World Bond | | | | | 292 | | | | N/A | | | | — | |
154
GOLDMAN SACHS MULTI SECTOR FIXED INCOME FUNDS
|
| 5. AGREEMENTS AND AFFILIATED TRANSACTIONS (continued) |
D. Service Plan and Shareholder Administration Plan — The Trust, on behalf of each Fund that offers Service Shares, has adopted a Service Plan and a Shareholder Administration Plan. These plans allow for service organizations to provide varying levels of personal and account maintenance and shareholder administration services to their customers who are beneficial owners of such shares. The Service Plan and Shareholder Administration Plan each provide for compensation to the service organizations which is accrued daily and paid monthly at an annual rate of 0.25% (0.50% in aggregate) of the average daily net assets of the Service Shares.
E. Transfer Agency Agreement — Goldman Sachs also serves as the transfer agent of the Funds for a fee pursuant to Transfer Agency Agreement. The fees charged for such transfer agency services are accrued daily and paid monthly at annual rates as follows: 0.13% of the average daily net assets of Class A, Class B, Class C, Class IR and Class R Shares; and 0.04% of the average daily net assets of Institutional and Service Shares.
F. Other Expense Agreements and Affiliated Transactions — GSAM and GSAMI have agreed to limit certain “Other Expense” of the Funds (excluding transfer agent fees and expenses, service fees and shareholder administration fees (as applicable), taxes, interest, brokerage fees, litigation, indemnification, shareholder meetings and other extraordinary expenses) to the extent such expenses exceed, on an annual basis, a percentage rate of the average daily net assets of each Fund. Such Other Expense reimbursements, if any, are accrued daily and paid monthly. In addition, the Funds are not obligated to reimburse GSAM and GSAMI for prior fiscal year expense reimbursements, if any. The Other Expense limitations as an annual percentage rate of average daily net assets for the Core Fixed Income, Core Plus Fixed Income, Global Income, Strategic Income and World Bond Funds are 0.104%, 0.004%, 0.004%, 0.054% and 0.014%, respectively. These Other Expense limitations will remain in place through at least July 29, 2014, and prior to such date GSAM and GSAMI may not terminate the arrangements without the approval of the Trustees. In addition, the Funds have entered into certain offset arrangements with the custodian and the transfer agent, which may result in a reduction of the Funds’ expenses and are received irrespective of the application of the “Other Expense” limitations described above.
For the six months ended September 30, 2013, these expense reductions, including any fee waivers and Other Expense reimbursements, were as follows:
| | | | | | | | | | | | | | |
| Fund | | | | Distribution Fee Waivers | | | Other Expense
Reimbursements | | | Total Expense
Reductions | |
Core Plus Fixed Income | | | | $ | — | | | $ | 310,026 | | | $ | 310,026 | |
Global Income | | | | | — | | | | 467,384 | | | | 467,384 | |
World Bond | | | | | 9 | | | | 344,655 | | | | 344,664 | |
As of September 30, 2013, the amounts owed to affiliates of the Funds were as follows:
| | | | | | | | | | | | | | | | | | |
| Fund | | | | Management
Fees | | | Distribution
and Service
Fees | | | Transfer
Agent
Fees | | | Total | |
Core Fixed Income | | | | $ | 377,598 | | | $ | 51,154 | | | $ | 50,718 | | | $ | 479,470 | |
Core Plus Fixed Income | | | | | 109,648 | | | | 16,618 | | | | 13,388 | | | | 139,654 | |
Global Income | | | | | 258,813 | | | | 18,309 | | | | 21,137 | | | | 298,259 | |
Strategic Income | | | | | 3,731,038 | | | | 829,906 | | | | 492,053 | | | | 5,052,997 | |
World Bond | | | | | 6,230 | | | | 31 | | | | 392 | | | | 6,653 | |
G. Line of Credit Facility — As of September 30, 2013, the Funds participated in a $780,000,000 committed, unsecured revolving line of credit facility (the “facility”) together with other funds of the Trust and registered investment companies having management agreements with GSAM or its affiliates (“Other Borrowers”). Pursuant to the terms of the facility, the Funds and
155
GOLDMAN SACHS MULTI SECTOR FIXED INCOME FUNDS
Notes to Financial Statements (continued)
September 30, 2013 (Unaudited)
|
| 5. AGREEMENTS AND AFFILIATED TRANSACTIONS (continued) |
Other Borrowers could increase the credit amount by an additional $220,000,000, for a total of up to $1,000,000,000. This facility is to be used solely for temporary or emergency purposes, which may include the funding of redemptions. The interest rate on borrowings is based on the federal funds rate. The facility also requires a fee to be paid by the Funds based on the amount of the commitment that has not been utilized. For the six months ended September 30, 2013, the Funds did not have any borrowings under the facility. Prior to May 8, 2013, the committed amount available through the facility was $630,000,000.
H. Other Transactions with Affiliates — For the six months ended September 30, 2013, Goldman Sachs earned approximately $3,244, $2,227, $3,810, $54,646 and $50 in brokerage commissions from portfolio transactions, including futures transactions executed with Goldman Sachs as the Futures Commission Merchant, on behalf of the Core Fixed Income, Core Plus Fixed Income, Global Income, Strategic Income and World Bond Funds, respectively.
As of September 30, 2013, the following Fund of Funds Portfolios were the beneficial owners of 5% or more of total outstanding shares of the following Fund:
| | | | | | | | | | |
| Fund | | | | Goldman Sachs
Balanced Strategy
Portfolio | | | Goldman Sachs
Growth and Income
Strategy Portfolio | |
Global Income | | | | | 35 | % | | | 31 | % |
As of September 30, 2013, Goldman Sachs Group, Inc. was the beneficial owner of 5% or more of outstanding Class A, Class C, Institutional, Service, Class IR and Class R Shares of the following Funds:
| | | | | | | | | | | | | | | | | | | | | | | | | | |
| Fund | | | | Class A | | | Class C | | | Institutional | | | Service | | | Class IR | | | Class R | |
Core Plus Fixed Income | | | | | — | % | | | — | % | | | — | % | | | 100 | % | | | — | % | | | 10 | % |
World Bond | | | | | 10 | | | | 100 | | | | 100 | | | | — | | | | 100 | | | | 100 | |
|
| 6. PORTFOLIO SECURITIES TRANSACTIONS |
The cost of purchases and proceeds from sales and maturities of long-term securities for the six months ended September 30, 2013, were as follows:
| | | | | | | | | | | | | | | | | | |
| Fund | | | | Purchases of
U.S. Government and
Agency Obligations | | | Purchases (Excluding
U.S. Government and
Agency Obligations) | | | Sales and
Maturities of
U.S. Government and
Agency Obligations | | | Sales and
Maturities (Excluding
U.S. Government and
Agency Obligations) | |
Core Fixed Income | | | | $ | 4,415,782,321 | | | $ | 196,242,610 | | | $ | 4,343,669,917 | | | $ | 276,387,144 | |
Core Plus Fixed Income | | | | | 1,241,645,043 | | | | 51,844,165 | | | | 1,495,387,591 | | | | 117,517,840 | |
Global Income | | | | | 671,217,938 | | | | 308,368,428 | | | | 668,037,688 | | | | 297,145,399 | |
Strategic Income | | | | | 12,688,730,755 | | | | 4,869,447,790 | | | | 9,858,207,554 | | | | 1,291,402,325 | |
World Bond | | | | | 10,645,228 | | | | 8,225,618 | | | | 12,845,697 | | | | 6,935,633 | |
156
GOLDMAN SACHS MULTI SECTOR FIXED INCOME FUNDS
As of the Funds’ most recent fiscal year end, March 31, 2013, the Funds’ capital loss carryforwards and certain timing differences on a tax basis were as follows:
| | | | | | | | | | | | | | | | | | | | |
| | | Core Fixed
Income | | | Core Plus
Fixed Income | | | Global
Income | | | Strategic
Income | | | World
Bond | |
Capital loss carryovers:(1) | | | | | | | | | | | | | | | | | | | | |
Expiring 2018 | | $ | (35,295,100 | ) | | $ | — | | | $ | — | | | $ | — | | | $ | — | |
Perpetual Short-term | | | — | | | | — | | | | — | | | | (20,516,486 | ) | | | — | |
Perpetual Long-term | | | — | | | | — | | | | — | | | | (39,216,952 | ) | | | — | |
Total capital loss carryovers | | $ | (35,295,100 | ) | | $ | — | | | $ | — | | | $ | (59,733,438 | ) | | $ | — | |
Timing differences (Qualified Late Year Loss Deferral, Income Distribution Payable and Straddle Loss Deferrals) | | $ | (3,941,992 | ) | | $ | (2,271,320 | ) | | $ | (4,176,447 | ) | | $ | (18,822,298 | ) | | $ | (51,770 | ) |
| (1) | | With the exception of perpetual capital loss carryforwards, expiration occurs on March 31 of the year indicated. |
As of September 30, 2013, the Funds’ aggregate security unrealized gains and losses based on cost for U.S. federal income tax purposes were as follows:
| | | | | | | | | | | | | | | | | | | | |
| | | Core Fixed Income | | | Core Plus Fixed
Income | | | Global Income | | | Strategic Income | | | World Bond | |
Tax Cost | | $ | 1,259,785,132 | | | $ | 269,348,838 | | | $ | 506,869,894 | | | $ | 10,132,510,153 | | | $ | 11,878,966 | |
Gross unrealized gain | | | 28,688,054 | | | | 12,421,299 | | | | 19,947,954 | | | | 253,188,345 | | | | 122,008 | |
Gross unrealized loss | | | (22,233,236 | ) | | | (5,226,958 | ) | | | (8,882,372 | ) | | | (99,926,158 | ) | | | (505,163 | ) |
Net unrealized security gain (loss) | | $ | 6,454,818 | | | $ | 7,194,341 | | | $ | 11,065,582 | | | $ | 153,262,187 | | | $ | (383,155 | ) |
The difference between GAAP-basis and tax-basis unrealized gains (losses), as of the most recent fiscal year end, is attributable primarily to wash sales.
GSAM and GSAMI have reviewed the Funds’ tax positions for all open tax years (the current and prior three years, as applicable) and have concluded that no provision for income tax is required in the Funds’ financial statements. Such open tax years remain subject to examination and adjustment by tax authorities.
The Funds’ risks include, but are not limited to, the following:
Foreign Custody Risk — A Fund that invests in foreign securities may hold such securities and foreign currency with foreign banks, agents, and securities depositories appointed by the Fund’s custodian (each a “Foreign Custodian”). In some countries, Foreign Custodians may be subject to little or no regulatory oversight or independent evaluation of their operations. Further, the laws of certain countries may place limitations on a Fund’s ability to recover its assets if a Foreign Custodian enters into bankruptcy. Investments in emerging markets may be subject to greater custody risks than investments in more developed markets. Custody services in emerging market countries are often undeveloped and may be less regulated than in more developed countries, and thus may not afford the same level of investor protection as would apply in developed countries.
Liquidity Risk — The Funds may make investments that are illiquid or that may become less liquid in response to market developments or adverse investor perceptions. Illiquid investments may be more difficult to value. Liquidity risk may also refer to
157
GOLDMAN SACHS MULTI SECTOR FIXED INCOME FUNDS
Notes to Financial Statements (continued)
September 30, 2013 (Unaudited)
|
| 8. OTHER RISKS (continued) |
the risk that a Fund will not be able to pay redemption proceeds within the allowable time period because of unusual market conditions, an unusually high volume of redemption requests, or other reasons. To meet redemption requests, a Fund may be forced to sell investments at an unfavorable time and/or under unfavorable conditions.
Market and Credit Risks — In the normal course of business, the Funds trade financial instruments and enter into financial transactions where risk of potential loss exists due to changes in the market (market risk). Additionally, the Funds may also be exposed to credit risk in the event that an issuer fails to perform or that an institution or entity with which the Funds have unsettled or open transactions defaults.
Investing in foreign markets may involve special risks and considerations not typically associated with investing in the U.S. These risks include revaluation of currencies, high rates of inflation, repatriation restrictions on income and capital, and adverse political and economic developments. Moreover, securities issued in these markets may be less liquid, be subject to government ownership controls, have delayed settlements and their prices may be more volatile than those of comparable securities in the U.S.
Non-Diversification Risk — The Global Income and World Bond Funds are non-diversified, meaning that they are permitted to invest a larger percentage of their assets in fewer issuers than diversified mutual funds. Thus, each Fund may be more susceptible to adverse developments affecting any single issuer held in its portfolio, and may be more susceptible to greater losses because of these developments.
Portfolio Concentration Risk — As a result of certain of the Funds’ ability to invest a large percentage of their assets in obligations of issuers within the same country, state, region, currency or economic sector, an adverse economic, business or political development may affect the value of the Funds’ investments more than if their investments were not so concentrated.
Shareholder Concentration Risk — Certain funds, accounts, individuals or Goldman Sachs affiliates may from time to time own (beneficially or of record) or control a significant percentage of the Funds’ shares. Redemptions by these entities of their holdings in the Funds may impact the Funds’ liquidity and NAV. These redemptions may also force the Funds to sell securities.
Under the Trust’s organizational documents, its Trustees, officers, employees and agents are indemnified, to the extent permitted by the Act and state law, against certain liabilities that may arise out of performance of their duties to the Funds. Additionally, in the course of business, the Funds enter into contracts that contain a variety of indemnification clauses. The Funds’ maximum exposure under these arrangements is unknown, as this would involve future claims that may be made against the Funds that have not yet occurred. However, GSAM and GSAMI believe the risk of loss under these arrangements to be remote.
On August 15, 2013, a definitive proxy statement (“proxy”) was filed with the SEC to, among other things, elect certain Trustees to the Trust. The Funds will amortize their respective share of the proxy, shareholder meeting and other related costs and GSAM has agreed to reimburse each Funds to the extent such expenses exceed a specified percentage of the Fund’s net assets.
Subsequent events after the Statement of Assets and Liabilities date have been evaluated through the date the financial statements were issued. GSAM and GSAMI have concluded that there is no impact requiring adjustment or disclosure in the financial statements.
158
GOLDMAN SACHS MULTI SECTOR FIXED INCOME FUNDS
|
| 12. SUMMARY OF SHARE TRANSACTIONS |
Share activity is as follows:
| | | | | | | | | | | | | | | | |
| | | Core Fixed Income Fund | |
| | | | |
| | | For the Six Months Ended
September 30, 2013
(Unaudited) | | | For the Fiscal Year Ended
March 31, 2013 | |
| | | | |
| | | Shares | | | Dollars | | | Shares | | | Dollars | |
| | | | |
| Class A Shares | | | | | | | | | | | | | | | | |
Shares sold | | | 1,114,417 | | | $ | 11,602,175 | | | | 4,582,696 | | | $ | 49,675,321 | |
Reinvestment of distributions | | | 116,912 | | | | 1,215,862 | | | | 330,702 | | | | 3,504,528 | |
Shares converted from Class B(a) | | | 4,920 | | | | 51,006 | | | | 109,462 | | | | 109,462 | |
Shares redeemed | | | (2,827,101 | ) | | | (29,454,115 | ) | | | (9,804,238 | ) | | | (103,481,361 | ) |
| | | | (1,590,852 | ) | | | (16,585,072 | ) | | | (4,781,378 | ) | | | (50,192,050 | ) |
| Class B Shares | | | | | | | | | | | | | | | | |
Shares sold | | | 12,884 | | | | 136,376 | | | | 90,138 | | | | 960,888 | |
Reinvestment of distributions | | | 2,327 | | | | 24,316 | | | | 8,812 | | | | 93,844 | |
Shares converted to Class A(a) | | | (4,897 | ) | | | (51,006 | ) | | | (10,340 | ) | | | (10,291 | ) |
Shares redeemed | | | (161,816 | ) | | | (1,692,631 | ) | | | (254,270 | ) | | | (2,803,610 | ) |
| | | | (151,502 | ) | | | (1,582,945 | ) | | | (165,660 | ) | | | (1,759,169 | ) |
| Class C Shares | | | | | | | | | | | | | | | | |
Shares sold | | | 143,636 | | | | 1,502,600 | | | | 562,325 | | | | 5,982,989 | |
Reinvestment of distributions | | | 10,023 | | | | 104,715 | | | | 31,819 | | | | 339,053 | |
Shares redeemed | | | (406,469 | ) | | | (4,256,385 | ) | | | (935,045 | ) | | | (9,950,689 | ) |
| | | | (252,810 | ) | | | (2,649,070 | ) | | | (340,901 | ) | | | (3,628,647 | ) |
| Institutional Shares | | | | | | | | | | | | | | | | |
Shares sold | | | 9,159,486 | | | | 95,767,956 | | | | 23,183,527 | | | | 246,745,779 | |
Reinvestment of distributions | | | 1,002,869 | | | | 10,474,386 | | | | 2,688,015 | | | | 28,596,094 | |
Shares redeemed | | | (24,941,463 | ) | | | (259,879,808 | ) | | | (45,005,433 | ) | | | (477,018,455 | ) |
| | | | (14,779,108 | ) | | | (153,637,466 | ) | | | (19,133,891 | ) | | | (201,676,582 | ) |
| Service Shares | | | | | | | | | | | | | | | | |
Shares sold | | | 112,946 | | | | 1,202,601 | | | | 869,006 | | | | 9,304,302 | |
Reinvestment of distributions | | | 6,435 | | | | 67,828 | | | | 21,804 | | | | 232,444 | |
Shares redeemed | | | (1,516,112 | ) | | | (15,634,485 | ) | | | (305,245 | ) | | | (3,250,831 | ) |
| | | | (1,396,731 | ) | | | (14,364,056 | ) | | | 585,565 | | | | 6,285,915 | |
| Class IR Shares | | | | | | | | | | | | | | | | |
Shares sold | | | 34,347 | | | | 362,977 | | | | 73,170 | | | | 775,636 | |
Reinvestment of distributions | | | 1,508 | | | | 15,672 | | | | 2,692 | | | | 28,563 | |
Shares redeemed | | | (71,154 | ) | | | (739,409 | ) | | | (27,771 | ) | | | (293,735 | ) |
| | | | (35,299 | ) | | | (360,760 | ) | | | 48,091 | | | | 510,464 | |
| Class R Shares | | | | | | | | | | | | | | | | |
Shares sold | | | 6,447 | | | | 67,750 | | | | 76,174 | | | | 800,911 | |
Reinvestment of distributions | | | 432 | | | | 4,502 | | | | 863 | | | | 9,184 | |
Shares redeemed | | | (15,056 | ) | | | (154,424 | ) | | | (17,929 | ) | | | (191,369 | ) |
| | | | (8,177 | ) | | | (82,172 | ) | | | 59,108 | | | | 618,726 | |
NET DECREASE | | | (18,214,479 | ) | | $ | (189,261,541 | ) | | | (23,729,066 | ) | | $ | (249,841,343 | ) |
| (a) | | Class B Shares automatically convert into Class A Shares on or about the fifteenth day of the last month of the calendar quarter that is eight years after the initial purchase date of either the Fund or another Goldman Sachs Fund. |
159
GOLDMAN SACHS MULTI SECTOR FIXED INCOME FUNDS
Notes to Financial Statements (continued)
September 30, 2013 (Unaudited)
|
| 12. SUMMARY OF SHARE TRANSACTIONS (continued) |
Share activity is as follows:
| | | | | | | | | | | | | | | | |
| | | Core Plus Fixed Income Fund | |
| | | | |
| | | For the Six Months Ended
September 30, 2013
(Unaudited) | | | For the Fiscal Year Ended
March 31, 2013 | |
| | | | |
| | | Shares | | | Dollars | | | Shares | | | Dollars | |
| | | | |
| Class A Shares | | | | | | | | | | | | | | | | |
Shares sold | | | 278,330 | | | $ | 2,913,221 | | | | 1,637,233 | | | $ | 17,397,113 | |
Reinvestment of distributions | | | 35,989 | | | | 374,723 | | | | 446,199 | | | | 4,730,655 | |
Shares converted from Class B(a) | | | 17,565 | | | | 181,634 | | | | 47,896 | | | | 507,090 | |
Shares redeemed | | | (818,693 | ) | | | (8,493,834 | ) | | | (7,088,827 | ) | | | (75,154,818 | ) |
| | | | (486,809 | ) | | | (5,024,256 | ) | | | (4,957,499 | ) | | | (52,519,960 | ) |
| Class B Shares | | | | | | | | | | | | | | | | |
Shares sold | | | 5,340 | | | | 55,883 | | | | 59,794 | | | | 636,704 | |
Reinvestment of distributions | | | 1,820 | | | | 18,959 | | | | 17,549 | | | | 185,708 | |
Shares converted to Class A(a) | | | (17,572 | ) | | | (181,634 | ) | | | (47,941 | ) | | | (507,090 | ) |
Shares redeemed | | | (83,303 | ) | | | (864,552 | ) | | | (134,780 | ) | | | (1,426,019 | ) |
| | | | (93,715 | ) | | | (971,344 | ) | | | (105,378 | ) | | | (1,110,697 | ) |
| Class C Shares | | | | | | | | | | | | | | | | |
Shares sold | | | 53,244 | | | | 559,241 | | | | 146,123 | | | | 1,556,360 | |
Reinvestment of distributions | | | 4,634 | | | | 48,234 | | | | 35,822 | | | | 379,102 | |
Shares redeemed | | | (180,555 | ) | | | (1,872,349 | ) | | | (258,208 | ) | | | (2,729,977 | ) |
| | | | (122,677 | ) | | | (1,264,874 | ) | | | (76,263 | ) | | | (794,515 | ) |
| Institutional Shares | | | | | | | | | | | | | | | | |
Shares sold | | | 1,228,119 | | | | 12,967,506 | | | | 8,048,909 | | | | 85,285,400 | |
Reinvestment of distributions | | | 324,166 | | | | 3,373,528 | | | | 1,280,624 | | | | 13,574,960 | |
Shares redeemed | | | (9,501,614 | ) | | | (97,290,745 | ) | | | (3,278,395 | ) | | | (34,969,634 | ) |
| | | | (7,949,329 | ) | | | (80,949,711 | ) | | | 6,051,138 | | | | 63,890,726 | |
| Service Shares | | | | | | | | | | | | | | | | |
Reinvestment of distributions | | | 12 | | | | 133 | | | | 68 | | | | 717 | |
Shares redeemed | | | (1 | ) | | | (11 | ) | | | — | | | | — | |
| | | | 11 | | | | 122 | | | | 68 | | | | 717 | |
| Class IR Shares | | | | | | | | | | | | | | | | |
Shares sold | | | 756 | | | | 8,018 | | | | 7,670 | | | | 82,168 | |
Reinvestment of distributions | | | 3,084 | | | | 32,013 | | | | 14,749 | | | | 155,912 | |
Shares redeemed | | | (7,405 | ) | | | (76,580 | ) | | | (17,256 | ) | | | (181,588 | ) |
| | | | (3,565 | ) | | | (36,549 | ) | | | 5,163 | | | | 56,492 | |
| Class R Shares | | | | | | | | | | | | | | | | |
Shares sold | | | 7,252 | | | | 76,782 | | | | 16,521 | | | | 174,630 | |
Reinvestment of distributions | | | 137 | | | | 1,425 | | | | 198 | | | | 2,101 | |
Shares redeemed | | | (13,569 | ) | | | (138,903 | ) | | | (291 | ) | | | (3,080 | ) |
| | | | (6,180 | ) | | | (60,696 | ) | | | 16,428 | | | | 173,651 | |
NET INCREASE (DECREASE) | | | (8,662,264 | ) | | $ | (88,307,308 | ) | | | 933,657 | | | $ | 9,696,414 | |
| (a) | | Class B Shares automatically convert into Class A Shares on or about the fifteenth day of the last month of the calendar quarter that is eight years after the initial purchase date of either the Fund or another Goldman Sachs Fund. |
160
GOLDMAN SACHS MULTI SECTOR FIXED INCOME FUNDS
|
| 12. SUMMARY OF SHARE TRANSACTIONS (continued) |
Share activity is as follows:
| | | | | | | | | | | | | | | | |
| | | Global Income Fund | |
| | | | |
| | | For the Six Months Ended
September 30, 2013
(Unaudited) | | | For the Fiscal Year Ended
March 31, 2013 | |
| | | | |
| | | Shares | | | Dollars | | | Shares | | | Dollars | |
| | | | |
| Class A Shares | | | | | | | | | | | | | | | | |
Shares sold | | | 501,736 | | | $ | 6,549,134 | | | | 1,910,820 | | | $ | 25,697,467 | |
Reinvestment of distributions | | | 45,442 | | | | 593,088 | | | | 545,155 | | | | 7,249,918 | |
Shares converted from Class B(a) | | | 1,233 | | | | 15,996 | | | | 6,962 | | | | 93,337 | |
Shares redeemed | | | (1,699,832 | ) | | | (22,347,903 | ) | | | (11,481,258 | ) | | | (153,755,347 | ) |
| | | | (1,151,421 | ) | | | (15,189,685 | ) | | | (9,018,321 | ) | | | (120,714,625 | ) |
| Class B Shares | | | | | | | | | | | | | | | | |
Shares sold | | | 3,567 | | | | 45,691 | | | | 14,828 | | | | 197,423 | |
Reinvestment of distributions | | | 560 | | | | 7,285 | | | | 7,041 | | | | 93,122 | |
Shares converted to Class A(a) | | | (1,238 | ) | | | (15,996 | ) | | | (6,989 | ) | | | (93,337 | ) |
Shares redeemed | | | (35,351 | ) | | | (459,659 | ) | | | (55,252 | ) | | | (733,591 | ) |
| | | | (32,462 | ) | | | (422,679 | ) | | | (40,372 | ) | | | (536,383 | ) |
| Class C Shares | | | | | | | | | | | | | | | | |
Shares sold | | | 41,320 | | | | 533,613 | | | | 50,879 | | | | 673,410 | |
Reinvestment of distributions | | | 2,012 | | | | 26,067 | | | | 19,740 | | | | 260,226 | |
Shares redeemed | | | (88,186 | ) | | | (1,139,673 | ) | | | (117,424 | ) | | | (1,558,609 | ) |
| | | | (44,854 | ) | | | (579,993 | ) | | | (46,805 | ) | | | (624,973 | ) |
| Institutional Shares | | | | | | | | | | | | | | | | |
Shares sold | | | 12,870,844 | | | | 166,703,372 | | | | 10,923,074 | | | | 145,381,905 | |
Reinvestment of distributions | | | 332,879 | | | | 4,331,819 | | | | 2,021,543 | | | | 26,842,881 | |
Shares redeemed | | | (5,968,169 | ) | | | (77,526,302 | ) | | | (27,183,640 | ) | | | (364,157,994 | ) |
| | | | 7,235,554 | | | | 93,508,889 | | | | (14,239,023 | ) | | | (191,933,208 | ) |
| Service Shares | | | | | | | | | | | | | | | | |
Shares sold | | | 5,908 | | | | 76,421 | | | | 3,449 | | | | 45,879 | |
Reinvestment of distributions | | | 25 | | | | 326 | | | | 170 | | | | 2,246 | |
Shares redeemed | | | (313 | ) | | | (4,085 | ) | | | (7,021 | ) | | | (93,515 | ) |
| | | | 5,620 | | | | 72,662 | | | | (3,402 | ) | | | (45,390 | ) |
| Class IR Shares | | | | | | | | | | | | | | | | |
Shares sold | | | 14,388 | | | | 190,445 | | | | 38,818 | | | | 515,757 | |
Reinvestment of distributions | | | 477 | | | | 6,204 | | | | 2,587 | | | | 34,326 | |
Shares redeemed | | | (10,728 | ) | | | (140,907 | ) | | | (30,597 | ) | | | (403,435 | ) |
| | | | 4,137 | | | | 55,742 | | | | 10,808 | | | | 146,648 | |
NET INCREASE (DECREASE) | | | 6,016,574 | | | $ | 77,444,936 | | | | (23,337,115 | ) | | $ | (313,707,931 | ) |
| (a) | | Class B Shares automatically convert into Class A Shares on or about the fifteenth day of the last month of the calendar quarter that is eight years after the initial purchase date of either the Fund or another Goldman Sachs Fund. |
161
GOLDMAN SACHS MULTI SECTOR FIXED INCOME FUNDS
Notes to Financial Statements (continued)
September 30, 2013 (Unaudited)
|
| 12. SUMMARY OF SHARE TRANSACTIONS (continued) |
Share activity is as follows:
| | | | | | | | | | | | | | | | |
| | | Strategic Income Fund | |
| | | | |
| | | For the Six Months Ended
September 30, 2013
(Unaudited) | | | For the Fiscal Year Ended
March 31, 2013 | |
| | | | |
| | | Shares | | | Dollars | | | Shares | | | Dollars | |
| | | | |
| Class A Shares | | | | | | | | | | | | | | | | |
Shares sold | | | 142,368,562 | | | $ | 1,499,391,111 | | | | 40,551,970 | | | $ | 417,088,326 | |
Reinvestment of distributions | | | 1,230,668 | | | | 12,958,469 | | | | 2,375,483 | | | | 24,142,768 | |
Shares redeemed | | | (15,350,287 | ) | | | (161,491,763 | ) | | | (48,802,201 | ) | | | (487,706,383 | ) |
| | | | 128,248,943 | | | | 1,350,857,817 | | | | (5,874,748 | ) | | | (46,475,289 | ) |
| Class C Shares | | | | | | | | | | | | | | | | |
Shares sold | | | 33,663,597 | | | | 354,752,125 | | | | 11,404,892 | | | | 117,837,288 | |
Reinvestment of distributions | | | 190,990 | | | | 2,012,851 | | | | 509,758 | | | | 5,208,789 | |
Shares redeemed | | | (2,412,576 | ) | | | (25,419,012 | ) | | | (4,066,992 | ) | | | (41,003,910 | ) |
| | | | 31,442,011 | | | | 331,345,964 | | | | 7,847,658 | | | | 82,042,167 | |
| Institutional Shares | | | | | | | | | | | | | | | | |
Shares sold | | | 450,041,060 | | | | 4,732,563,011 | | | | 164,944,585 | | | | 1,686,890,601 | |
Reinvestment of distributions | | | 3,868,047 | | | | 40,741,402 | | | | 6,687,871 | | | | 68,452,667 | |
Shares redeemed | | | (43,940,709 | ) | | | (462,468,536 | ) | | | (40,080,385 | ) | | | (408,289,110 | ) |
| | | | 409,968,398 | | | | 4,310,835,877 | | | | 131,552,071 | | | | 1,347,054,158 | |
| Class IR Shares | | | | | | | | | | | | | | | | |
Shares sold | | | 24,441,933 | | | | 257,038,185 | | | | 6,931,385 | | | | 71,790,777 | |
Reinvestment of distributions | | | 226,119 | | | | 2,378,440 | | | | 272,756 | | | | 2,786,136 | |
Shares redeemed | | | (2,365,116 | ) | | | (24,857,783 | ) | | | (2,023,847 | ) | | | (20,514,381 | ) |
| | | | 22,302,936 | | | | 234,558,842 | | | | 5,180,294 | | | | 54,062,532 | |
| Class R Shares | | | | | | | | | | | | | | | | |
Shares sold | | | 44,682 | | | | 474,502 | | | | 27 | | | | 280 | |
Reinvestment of distributions | | | 195 | | | | 2,050 | | | | 54 | | | | 540 | |
Shares redeemed | | | (1,303 | ) | | | (13,623 | ) | | | (1,890 | ) | | | (18,496 | ) |
| | | | 43,574 | | | | 462,929 | | | | (1,809 | ) | | | (17,676 | ) |
NET INCREASE | | | 592,005,862 | | | $ | 6,228,061,429 | | | | 138,703,466 | | | $ | 1,436,665,892 | |
162
GOLDMAN SACHS MULTI SECTOR FIXED INCOME FUNDS
|
| 12. SUMMARY OF SHARE TRANSACTIONS (continued) |
Share activity is as follows:
| | | | | | | | | | | | | | | | |
| | | World Bond Fund(a) | |
| | | | |
| | | For the Six Months Ended
September 30, 2013
(Unaudited) | | | For the Fiscal Year Ended
March 31, 2013 | |
| | | | |
| | | Shares | | | Dollars | | | Shares | | | Dollars | |
| | | | |
| Class A Shares | | | | | | | | | | | | | | | | |
Shares sold | | | 8,088 | | | $ | 80,629 | | | | 2,100 | | | $ | 20,949 | |
Reinvestment of distributions | | | 30 | | | | 286 | | | | 3 | | | | 28 | |
Shares redeemed | | | (39 | ) | | | (373 | ) | | | (7 | ) | | | (71 | ) |
| | | | 8,079 | | | | 80,542 | | | | 2,096 | | | | 20,906 | |
| Class C Shares | | | | | | | | | | | | | | | | |
Shares sold | | | — | | | | — | | | | 1,000 | | | | 10,010 | |
Reinvestment of distributions | | | 1 | | | | 5 | | | | 1 | | | | 1 | |
Shares redeemed | | | — | | | | — | | | | (1 | ) | | | (10 | ) |
| | | | 1 | | | | 5 | | | | 1,000 | | | | 10,001 | |
| Institutional Shares | | | | | | | | | | | | | | | | |
Shares sold | | | — | | | | — | | | | 1,198,497 | | | | 11,985,025 | |
Reinvestment of distributions | | | 6,457 | | | | 62,430 | | | | 3,895 | | | | 38,949 | |
Shares redeemed | | | (1 | ) | | | (14 | ) | | | (2 | ) | | | (20 | ) |
| | | | 6,456 | | | | 62,416 | | | | 1,202,390 | | | | 12,023,954 | |
| Class IR Shares | | | | | | | | | | | | | | | | |
Shares sold | | | — | | | | — | | | | 1,001 | | | | 10,010 | |
Reinvestment of distributions | | | 5 | | | | 53 | | | | 3 | | | | 30 | |
Shares redeemed | | | — | | | | — | | | | (1 | ) | | | (10 | ) |
| | | | 5 | | | | 53 | | | | 1,003 | | | | 10,030 | |
| Class R Shares | | | | | | | | | | | | | | | | |
Shares sold | | | — | | | | — | | | | 1,001 | | | | 10,010 | |
Reinvestment of distributions | | | 1 | | | | 21 | | | | 2 | | | | 11 | |
Shares redeemed | | | — | | | | — | | | | (1 | ) | | | (10 | ) |
| | | | 1 | | | | 21 | | | | 1,002 | | | | 10,011 | |
NET INCREASE | | | 14,542 | | | $ | 143,037 | | | | 1,207,491 | | | $ | 12,074,902 | |
| (a) | | Commenced operations on November 30, 2012. |
163
GOLDMAN SACHS MULTI SECTOR FIXED INCOME FUNDS
Fund Expenses — Six Month Period Ended September 30, 2013 (Unaudited)
As a shareholder of Class A, Class B, Class C, Institutional, Service, Class IR or Class R Shares of a Fund, you incur two types of costs: (1) transaction costs, including sales charges on purchase payments (with respect to Class A Shares), contingent deferred sales charges on redemptions (with respect to Class B and Class C Shares), and (2) ongoing costs, including management fees; distribution and service (12b-1) fees (with respect to Class A, Class B, Class C and Class R Shares); and other Fund expenses. This Example is intended to help you understand your ongoing costs (in dollars) of investing in Class A, Class B, Class C, Institutional, Service, Class IR or Class R Shares of the Funds and to compare these costs with the ongoing costs of investing in other mutual funds.
The Example is based on an investment of $1,000 invested at the beginning of the period and held for the entire period from April 1, 2013 through September 30, 2013.
Actual Expenses — The first line under each share class in the table below provides information about actual account values and actual expenses. You may use the information in this line, together with the amount you invested, to estimate the expenses that you paid over the period. Simply divide your account value by $1,000 (for example, an $8,600 account value divided by $1,000=8.6), then multiply the result by the number in the first line under the heading entitled “Expenses Paid” to estimate the expenses you paid on your account during this period.
Hypothetical Example for Comparison Purposes — The second line under each share class in the table below provides information about hypothetical account values and hypothetical expenses based on the Funds’ actual net expense ratios and an assumed rate of return of 5% per year before expenses, which is not the Funds’ actual return. The hypothetical account values and expenses may not be used to estimate the actual ending account balance or expenses you paid for the period. You may use this information to compare the ongoing costs of investing in the Funds and other funds. To do so, compare this 5% hypothetical example with the 5% hypothetical examples that appear in the shareholder reports of the other funds.
Please note that the expenses shown in the table are meant to highlight your ongoing costs only and do not reflect any transactional costs, such as sales charges, redemption fees, or exchange fees. Therefore, the second line of the table is useful in comparing ongoing costs only, and will not help you determine the relative total costs of owning different funds. In addition, if these transactional costs were included, your costs would have been higher.
| | | | | | | | | | | | | | | | | | | | | | | | | | | | | | | | | | | | | | | | | | | | | | | | | | | | | | | | | | | | |
| | | Core Fixed Income Fund | | | Core Plus Fixed Income Fund | | | Global Income Fund | | | Strategic Income Fund | | | World Bond Fund | |
| Share Class | | Beginning
Account
Value
4/1/13 | | | Ending
Account
Value
9/30/13 | | | Expenses
Paid for the
6 months ended
9/30/13* | | | Beginning
Account
Value
4/1/13 | | | Ending
Account
Value
9/30/13 | | | Expenses
Paid for the
6 months ended
9/30/13* | | | Beginning
Account
Value
4/1/13 | | | Ending
Account
Value
9/30/13 | | | Expenses
Paid for the
6 months ended
9/30/13* | | | Beginning
Account
Value
4/1/13 | | | Ending
Account
Value
9/30/13 | | | Expenses
Paid for the
6 months ended
9/30/13* | | | Beginning
Account
Value
4/1/13 | | | Ending
Account
Value
9/30/13 | | | Expenses
Paid for the
6 months ended
9/30/13* | |
| Class A | | | | | | | | | | | | | | | | | | | | | | | | | | | | | | | | | | | | | | | | | | | | | | | | | | | | | | | | | | | | |
Actual | | $ | 1,000.00 | | | $ | 980.10 | | | $ | 4.07 | | | $ | 1,000.00 | | | $ | 986.40 | | | $ | 4.18 | | | $ | 1,000.00 | | | $ | 990.80 | | | $ | 5.19 | | | $ | 1,000.00 | | | $ | 1,012.50 | | | $ | 4.69 | | | $ | 1,000.00 | | | $ | 981.30 | | | $ | 5.26 | |
Hypothetical 5% return | | | 1,000.00 | | | | 1,020.96 | + | | | 4.15 | | | | 1,000.00 | | | | 1,020.86 | + | | | 4.26 | | | | 1,000.00 | | | | 1,019.85 | + | | | 5.27 | | | | 1,000.00 | | | | 1,020.41 | + | | | 4.71 | | | | 1,000.00 | | | | 1,019.75 | + | | | 5.37 | |
| Class B | | | | | | | | | | | | | | | | | | | | | | | | | | | | | | | | | | | | | | | | | | | | | | | | | | | | | | | | | | | | |
Actual | | | 1,000.00 | | | | 976.60 | | | | 7.78 | | | | 1,000.00 | | | | 981.70 | | | | 7.90 | | | | 1,000.00 | | | | 987.00 | | | | 8.92 | | | | N/A | | | | N/A | | | | N/A | | | | N/A | | | | N/A | | | | N/A | |
Hypothetical 5% return | | | 1,000.00 | | | | 1,017.20 | + | | | 7.94 | | | | 1,000.00 | | | | 1,017.10 | + | | | 8.04 | | | | 1,000.00 | | | | 1,016.09 | + | | | 9.05 | | | | N/A | | | | N/A | | | | N/A | | | | N/A | | | | N/A | | | | N/A | |
| Class C | | | | | | | | | | | | | | | | | | | | | | | | | | | | | | | | | | | | | | | | | | | | | | | | | | | | | | | | | | | | |
Actual | | | 1,000.00 | | | | 976.60 | | | | 7.78 | | | | 1,000.00 | | | | 981.70 | | | | 7.90 | | | | 1,000.00 | | | | 986.90 | | | | 8.92 | | | | 1,000.00 | | | | 1,008.70 | | | | 8.46 | | | | 1,000.00 | | | | 977.30 | | | | 8.18 | |
Hypothetical 5% return | | | 1,000.00 | | | | 1,017.20 | + | | | 7.94 | | | | 1,000.00 | | | | 1,017.10 | + | | | 8.04 | | | | 1,000.00 | | | | 1,016.09 | + | | | 9.05 | | | | 1,000.00 | | | | 1,016.64 | + | | | 8.49 | | | | 1,000.00 | | | | 1,016.80 | + | | | 8.34 | |
| Institutional | | | | | | | | | | | | | | | | | | | | | | | | | | | | | | | | | | | | | | | | | | | | | | | | | | | | | | | | | | | | |
Actual | | | 1,000.00 | | | | 982.80 | | | | 2.39 | | | | 1,000.00 | | | | 988.10 | | | | 2.49 | | | | 1,000.00 | | | | 992.50 | | | | 3.45 | | | | 1,000.00 | | | | 1,014.30 | | | | 3.03 | | | | 1,000.00 | | | | 982.00 | | | | 3.63 | |
Hypothetical 5% return | | | 1,000.00 | | | | 1,022.66 | + | | | 2.43 | | | | 1,000.00 | | | | 1,022.56 | + | | | 2.54 | | | | 1,000.00 | | | | 1,021.61 | + | | | 3.50 | | | | 1,000.00 | | | | 1,022.06 | + | | | 3.04 | | | | 1,000.00 | | | | 1,021.41 | + | | | 3.70 | |
| Service | | | | | | | | | | | | | | | | | | | | | | | | | | | | | | | | | | | | | | | | | | | | | | | | | | | | | | | | | | | | |
Actual | | | 1,000.00 | | | | 979.40 | | | | 4.86 | | | | 1,000.00 | | | | 985.60 | | | | 4.98 | | | | 1,000.00 | | | | 989.90 | | | | 5.94 | | | | N/A | | | | N/A | | | | N/A | | | | N/A | | | | N/A | | | | N/A | |
Hypothetical 5% return | | | 1,000.00 | | | | 1,020.15 | + | | | 4.96 | | | | 1,000.00 | | | | 1,020.05 | + | | | 5.06 | | | | 1,000.00 | | | | 1,019.10 | + | | | 6.02 | | | | N/A | | | | N/A | | | | N/A | | | | N/A | | | | N/A | | | | N/A | |
| Class IR | | | | | | | | | | | | | | | | | | | | | | | | | | | | | | | | | | | | | | | | | | | | | | | | | | | | | | | | | | | | |
Actual | | | 1,000.00 | | | | 981.30 | | | | 2.83 | | | | 1,000.00 | | | | 987.60 | | | | 2.94 | | | | 1,000.00 | | | | 992.00 | | | | 3.90 | | | | 1,000.00 | | | | 1,012.80 | | | | 3.43 | | | | 1,000.00 | | | | 982.10 | | | | 3.93 | |
Hypothetical 5% return | | | 1,000.00 | | | | 1,022.21 | + | | | 2.89 | | | | 1,000.00 | | | | 1,022.11 | + | | | 2.99 | | | | 1,000.00 | | | | 1,021.16 | + | | | 3.95 | | | | 1,000.00 | | | | 1,021.66 | + | | | 3.45 | | | | 1,000.00 | | | | 1,021.11 | + | | | 3.70 | |
| Class R | | | | | | | | | | | | | | | | | | | | | | | | | | | | | | | | | | | | | | | | | | | | | | | | | | | | | | | | | | | | |
Actual | | | 1,000.00 | | | | 979.80 | | | | 5.31 | | | | 1,000.00 | | | | 984.20 | | | | 5.42 | | | | N/A | | | | N/A | | | | N/A | | | | 1,000.00 | | | | 1,011.30 | | | | 6.00 | | | | 1,000.00 | | | | 978.90 | | | | 6.60 | |
Hypothetical 5% return | | | 1,000.00 | | | | 1,019.70 | + | | | 5.42 | | | | 1,000.00 | | | | 1,019.60 | + | | | 5.52 | | | | N/A | | | | N/A | | | | N/A | | | | 1,000.00 | | | | 1,019.10 | + | | | 6.02 | | | | 1,000.00 | | | | 1,018.40 | + | | | 6.73 | |
| * | | Expenses for each share class are calculated using each Fund's annualized net expense ratio for each class, which represents the ongoing expenses as a percentage of net assets for the six months ended September 30, 2013. Expenses are calculated by multiplying the annualized net expense ratio by the average account value for the period; then multiplying the result by the number of days in the most recent fiscal half year; and then dividing that result by the number of days in the fiscal year. The annualized net expense ratios for the period were as follows: |
| | | | | | | | | | | | | | | | | | | | | | | | | | | | |
| Fund | | Class A | | | Class B | | | Class C | | | Institutional | | | Service | | | Class IR | | | Class R | |
Core Fixed Income | | | 0.82 | % | | | 1.57 | % | | | 1.57 | % | | | 0.48 | % | | | 0.98 | % | | | 0.57 | % | | | 1.07 | % |
Core Plus Fixed Income | | | 0.84 | | | | 1.59 | | | | 1.59 | | | | 0.50 | | | | 1.00 | | | | 0.59 | | | | 1.09 | |
Global Income | | | 1.04 | | | | 1.79 | | | | 1.79 | | | | 0.69 | | | | 1.19 | | | | 0.78 | | | | N/A | |
Strategic Income | | | 0.93 | | | | N/A | | | | 1.68 | | | | 0.60 | | | | N/A | | | | 0.68 | | | | 1.19 | |
World Bond | | | 1.06 | | | | N/A | | | | 1.65 | | | | 0.73 | | | | N/A | | | | 0.79 | | | | 1.33 | |
| + | | Hypothetical expenses are based on each Fund’s actual annualized net expense ratios and an assumed rate of return of 5% per year before expenses. |
164
GOLDMAN SACHS MULTI SECTOR FIXED INCOME FUNDS
Statement Regarding Basis for Approval of Management Agreements (Unaudited)
Background
The Goldman Sachs Core Fixed Income, Goldman Sachs Core Plus Fixed Income, Goldman Sachs Global Income, Goldman Sachs Strategic Income and Goldman Sachs World Bond Funds (the “Funds”) are investment portfolios of Goldman Sachs Trust (the “Trust”). The Board of Trustees oversees the management of the Trust and reviews the investment performance and expenses of the Funds at regularly scheduled meetings held during the year. In addition, the Board of Trustees determines annually whether to approve the continuance of the Trust’s investment management agreements (the “Management Agreements”) on behalf of the Core Fixed Income, Core Plus Fixed Income and Strategic Income Funds with Goldman Sachs Asset Management, L.P. (“GSAM”) and on behalf of the Global Income and World Bond Funds with Goldman Sachs Asset Management International (together with GSAM, the “Investment Advisers”).
The Management Agreements were most recently approved for continuation until June 30, 2014 by the Board of Trustees, including those Trustees who are not parties to the Management Agreements or “interested persons” (as defined in the Investment Company Act of 1940, as amended) of any party thereto (the “Independent Trustees”), at a meeting held on June 12-13, 2013 (the “Annual Meeting”).
The review process undertaken by the Trustees spans the course of the year and culminates with the Annual Meeting. To assist the Trustees in their deliberations, the Trustees have established a Contract Review Committee (the “Committee”), comprised of the Independent Trustees. The Committee held four meetings over the course of the year since the Management Agreements were last approved. At those Committee meetings, regularly scheduled Board or other committee meetings and/or the Annual Meeting, the Board, or the Independent Trustees, as applicable, considered matters relating to the Management Agreements, including:
| | (a) | | the nature and quality of the advisory, administrative and other services provided to the Funds by the Investment Advisers and their affiliates, including information about: |
| | (i) | | the structure, staff and capabilities of the Investment Advisers and their portfolio management teams; |
| | (ii) | | the groups within the Investment Advisers and their affiliates that support the portfolio management teams or provide other types of necessary services, including fund services groups (e.g., accounting and financial reporting, tax, shareholder services and operations), controls and risk management groups (e.g., legal, compliance, valuation oversight, credit risk management, internal audit, compliance testing, market risk analysis, finance and strategy and central funding), sales and distribution support groups and others (e.g., information technology and training); |
| | (iii) | | trends in headcount; |
165
GOLDMAN SACHS MULTI SECTOR FIXED INCOME FUNDS
Statement Regarding Basis for Approval of Management Agreements (Unaudited) (continued)
| | (iv) | | the Investment Advisers’ financial resources and ability to hire and retain talented personnel and strengthen their operations; and |
| | (v) | | the parent company’s support of the Investment Advisers and their mutual fund business, as expressed by the firm’s senior management; |
| | (b) | | information on the investment performance of the Funds, including comparisons to the performance of similar mutual funds (with the exception of the World Bond Fund, which commenced operations in 2012), as provided by a third party mutual fund data provider engaged as part of the contract review process (the “Outside Data Provider”), benchmark performance indices, and comparable institutional composites managed by the Investment Advisers (in the case of the Core Fixed Income, Core Plus Fixed Income and Global Income Funds), and general investment outlooks in the markets in which the Funds invest; |
| | (c) | | the terms of the Management Agreements and agreements with affiliated service providers entered into by the Trust on behalf of the Funds; |
| | (d) | | expense information for the Funds, including: |
| | (i) | | the relative management fee and expense levels of the Funds as compared to those of comparable funds managed by other advisers, as provided by the Outside Data Provider; |
| | (ii) | | each Fund’s (except for the World Bond Fund) expense trends over time; and |
| | (iii) | | to the extent the Investment Advisers manage institutional accounts or collective investment vehicles having investment objectives and policies similar to those of the Funds, comparative information on the advisory fees charged and services provided to those accounts by the Investment Advisers; |
| | (e) | | with respect to the extensive investment performance and expense comparison data provided by the Outside Data Provider, its processes in producing that data for the Funds; |
| | (f) | | the undertakings of the Investment Advisers to limit certain expenses of the Funds that exceed specified levels, and a summary of contractual fee reductions made by the Investment Advisers and/or their affiliates over the past several years with respect to the Funds; |
| | (g) | | information relating to the profitability of the Management Agreements and the transfer agency and distribution and service arrangements of each of the Funds (except for the World Bond Fund) and the Trust as a whole to the Investment Advisers and their affiliates; |
| | (h) | | whether each Fund’s existing management fee schedule adequately addressed any economies of scale; |
166
GOLDMAN SACHS MULTI SECTOR FIXED INCOME FUNDS
Statement Regarding Basis for Approval of Management Agreements (Unaudited) (continued)
| | (i) | | a summary of the “fall-out” benefits derived by the Investment Advisers and their affiliates from their relationships with the Funds, including the fees received by the Investment Advisers’ affiliates from the Funds for transfer agency, portfolio trading, distribution and other services; |
| | (j) | | a summary of potential benefits derived by the Funds as a result of their relationship with the Investment Advisers; |
| | (k) | | information regarding portfolio trading and how the Investment Advisers carry out their duty to seek best execution; |
| | (l) | | portfolio manager ownership of Fund shares; the manner in which portfolio manager compensation is determined; and the number and types of accounts managed by the portfolio managers; |
| | (m) | | the nature and quality of the services provided to the Funds by their unaffiliated service providers, and the Investment Advisers’ general oversight and evaluation (including reports on due diligence) of those service providers as part of the administration services provided under the Management Agreements; and |
| | (n) | | the Investment Advisers’ processes and policies addressing various types of potential conflicts of interest; their approach to risk management; the annual review of the effectiveness of the Funds’ compliance program; and periodic compliance reports. |
The Trustees also received an overview of the Funds’ distribution arrangements. They received information regarding the Funds’ assets, share purchase and redemption activity and the payment of Rule 12b-1 distribution and service fees by the Funds and the payment of non-Rule 12b-1 shareholder service and/or administration fees by the Core Fixed Income, Core Plus Fixed Income and Global Income Funds’ Service Shares. Information was also provided to the Trustees relating to revenue sharing payments made by and services provided by the Investment Advisers and their affiliates to intermediaries that promote the sale, distribution and/or servicing of Fund shares.
The presentations made at the Board and Committee meetings and at the Annual Meeting encompassed the Funds and other mutual fund portfolios for which the Board of Trustees has responsibility. In evaluating the Management Agreements at the Annual Meeting, the Trustees relied upon their knowledge, resulting from their meetings and other interactions throughout the year, of the Investment Advisers, their affiliates, their services and the Funds. In conjunction with these meetings, the Trustees received written materials and oral presentations on the topics covered, and were advised by their independent legal counsel regarding their responsibilities and other regulatory requirements related to the approval and continuation of mutual fund investment management agreements under applicable law. In addition, the Investment Advisers and their affiliates provided the Independent Trustees with a written response to a formal request for information sent on behalf of the Independent Trustees by their independent legal counsel. During the course of their deliberations, the Independent Trustees met in executive sessions with
167
GOLDMAN SACHS MULTI SECTOR FIXED INCOME FUNDS
Statement Regarding Basis for Approval of Management Agreements (Unaudited) (continued)
their independent legal counsel, without representatives of the Investment Advisers or their affiliates present. The Independent Trustees also discussed the broad range of other investment choices that are available to Fund investors, including the availability of comparable funds managed by other advisers.
Nature, Extent and Quality of the Services Provided Under the Management Agreements
As part of their review, the Trustees considered the nature, extent and quality of the services provided by the Investment Advisers. In this regard, the Trustees considered both the investment advisory services and non-advisory services that are provided to the Funds by the Investment Advisers and their affiliates. The Trustees noted the transition in the leadership and changes in personnel of various of the Investment Advisers’ portfolio management teams that had occurred in recent periods, and the ongoing recruitment efforts aimed at bringing high quality investment talent to the Investment Advisers. The Trustees concluded that the Investment Advisers continued to commit substantial financial and operational resources to the Funds and expressed confidence that the Investment Advisers would continue to do so in the future. The Trustees also recognized that the Investment Advisers had made significant commitments to address regulatory compliance requirements applicable to the Funds and the Investment Advisers.
Investment Performance
The Trustees also considered the investment performance of the Funds. In this regard, they compared the investment performance of each Fund (with the exception of the World Bond Fund, which commenced operations in 2012) to its peers using rankings and ratings (rankings only for the Strategic Income Fund) compiled by the Outside Data Provider as of December 31, 2012, and updated performance information prepared by the Investment Advisers using the peer groups identified by the Outside Data Provider as of March 31, 2013. The information on each Fund’s investment performance was provided for the one-, three-, five- and ten-year periods ending on the applicable dates, to the extent that each Fund had been in existence for those periods. The Trustees also reviewed each Fund’s investment performance (except for the World Bond Fund) over time (including on a year-by-year basis) relative to its performance benchmark. As part of this review, they considered the investment performance trends of the Funds (except for the World Bond Fund) over time, and reviewed the investment performance of each Fund in light of its investment objective and policies and market conditions. The Trustees also received information comparing the Core Fixed Income, Core Plus Fixed Income and Global Income Funds’ performance to that of comparable institutional composites managed by the Investment Advisers.
168
GOLDMAN SACHS MULTI SECTOR FIXED INCOME FUNDS
Statement Regarding Basis for Approval of Management Agreements (Unaudited) (continued)
In addition, the Trustees considered materials prepared and presentations made by the Investment Advisers’ senior management and portfolio management personnel, in which Fund performance was assessed. The Trustees also considered the Investment Advisers’ periodic reports with respect to the Funds’ risk profiles, and how the Investment Advisers’ approach to risk monitoring and management influences portfolio management.
The Trustees observed that the Core Fixed Income Fund’s Class A Shares had placed in the third quartile of the Fund’s peer group for the one-, three-, five-, and ten-year periods, and had outperformed the Fund’s benchmark index for the one- and three-year periods and underperformed for the five- and ten-year periods ended March 31, 2013. They noted that the Core Plus Fixed Income Fund’s Class A Shares had placed in the top half of the Fund’s peer group for the one-, three-, and five-year periods, and had outperformed the Fund’s benchmark index for the one-, three-, and five-year periods ended March 31, 2013. The Trustees also noted that the Global Income Fund’s Class A Shares had placed in the top half of the Fund’s peer group for the one- and five-year periods, in the third quartile for the three-year period, and in the fourth quartile of the ten-year period, and had outperformed the Fund’s benchmark index for the one- and five-year periods and underperformed for the three- and ten-year periods ended March 31, 2013. They noted that the Strategic Income Fund’s Class A Shares had placed in the first quartile of the Fund’s peer group and had outperformed the Fund’s benchmark index for the one-year period ended March 31, 2013. The Trustees also noted that the Global Income and Strategic Income Funds had certain significant differences from their peer group and/or benchmark index that caused the peer group and/or benchmark index to be an imperfect basis for performance comparison. The Trustees noted that World Bond Fund had launched on November 30, 2012 and did not yet have a meaningful performance history. The Trustees also noted the addition of a key hire to the Investment Advisers’ staff in 2012.
Costs of Services Provided and Competitive Information
The Trustees considered the contractual terms of the Management Agreements and the fee rates payable by each Fund thereunder. In this regard, the Trustees considered information on the services rendered by the Investment Advisers to the Funds, which included both advisory and administrative services that were directed to the needs and operations of the Funds as registered mutual funds.
In particular, the Trustees reviewed analyses prepared by the Outside Data Provider regarding the expense rankings of the Funds. The analyses provided a comparison of the Funds’ management fees and breakpoints to those of relevant peer groups and category universes; an expense analysis which compared each Fund’s overall net and gross expenses to a peer group and a category universe; and a five-year history (or, in the case of Funds that commenced investment operations within a shorter period, since the
169
GOLDMAN SACHS MULTI SECTOR FIXED INCOME FUNDS
Statement Regarding Basis for Approval of Management Agreements (Unaudited) (continued)
year in which it commenced operations), comparing each Fund’s net expenses to the peer and category medians. The analyses also compared each Fund’s transfer agency, custody, and distribution fees, other expenses and fee waivers/reimbursements to those of the peer group and category medians. The Trustees concluded that the comparisons provided by the Outside Data Provider were useful in evaluating the reasonableness of the management fees and total expenses paid by the Funds.
In addition, the Trustees considered the Investment Advisers’ undertakings to limit certain expenses of the Funds that exceed specified levels. They also considered, to the extent that the Investment Advisers manage institutional accounts or collective investment vehicles having investment objectives and policies similar to those of the Funds, comparative fee information for services provided by the Investment Advisers to those accounts, and information that indicated that services provided to the Funds differed in various significant respects from the services provided to institutional accounts, which generally operated under less stringent legal and regulatory structures, required fewer services from the Investment Advisers to a smaller number of client contact points, were less time-intensive and paid lower fees.
In addition, the Trustees noted that shareholders are able to redeem their Fund shares at any time if they believe that the Fund fees and expenses are too high or if they are dissatisfied with the performance of the Fund.
Profitability
The Trustees reviewed the Investment Advisers’ revenues and pre-tax profit margins with respect to the Trust and each of the Funds (except for the World Bond Fund). In this regard the Trustees noted that they had received, among other things, profitability analyses and summaries, revenue and expense schedules by Fund and by function (i.e., investment management, transfer agency and distribution and service) and the Investment Advisers’ expense allocation methodology. They observed that the profitability and expense figures are substantially similar to those used by the Investment Advisers for many internal purposes, including compensation decisions among various business groups, and are thus subject to a vigorous internal debate about how certain revenue and expenses should be allocated. The Trustees also reviewed the report of the internal audit group within the Goldman Sachs organization, which included an assessment of the reasonableness and consistency of the Investment Advisers’ expense allocation methodology and an evaluation of the accuracy of the Investment Advisers’ profitability analysis calculations. Profitability data for the Trust and each Fund (except for the World Bond Fund) were provided for 2012 and 2011, and the Trustees considered this information in relation to the Investment Advisers’ overall profitability. The Trustees considered the Investment Advisers’ revenues and pre-tax profit margins both in absolute terms and in comparison to information on the reported pre-tax profit margins earned by certain other asset management firms.
170
GOLDMAN SACHS MULTI SECTOR FIXED INCOME FUNDS
Statement Regarding Basis for Approval of Management Agreements (Unaudited) (continued)
Economies of Scale
The Trustees considered the information that had been provided regarding the Investment Advisers’ profitability. The Trustees also considered the breakpoints in the fee rate payable under the Management Agreements for each of the Funds at the following annual percentage rates of the average daily net assets of the Funds:
| | | | | | | | | | | | | | | | | | | | |
Average Daily Net Assets | | Core Fixed
Income Fund | | | Core Plus Fixed
Income Fund | | | Global Income Fund | | | Strategic Income Fund | | | World Bond Fund | |
| First $1 billion | | | 0.40 | % | | | 0.45 | % | | | 0.65 | % | | | 0.60 | % | | | 0.65 | % |
| Next $1 billion | | | 0.36 | | | | 0.41 | | | | 0.59 | | | | 0.54 | | | | 0.59 | |
| Next $3 billion | | | 0.34 | | | | 0.39 | | | | 0.56 | | | | 0.51 | | | | 0.56 | |
| Next $3 billion | | | 0.33 | | | | 0.38 | | | | 0.55 | | | | 0.50 | | | | 0.54 | |
| Over $8 billion | | | 0.32 | | | | 0.37 | | | | 0.54 | | | | 0.49 | | | | 0.53 | |
The Trustees noted that the breakpoints were meant to share potential economies of scale, if any, with the Funds and their shareholders as assets under management reach those asset levels. The Trustees considered the amounts of assets in the Funds; the Funds’ recent share purchase and redemption activity; the information provided by the Investment Advisers relating to the costs of the services provided by the Investment Advisers and their affiliates and their realized profits; information comparing fee rates charged by the Investment Advisers with fee rates charged to other funds in the peer groups; and the Investment Advisers’ undertakings to limit certain expenses of the Funds that exceed specified levels. Upon reviewing these matters at the Annual Meeting, the Trustees concluded that the fee breakpoints represented a means of assuring that benefits of scalability, if any, would be passed along to shareholders at the specified asset levels. They also noted that GSAM had passed along savings to shareholders of the Core Fixed Income and Strategic Income Funds, which had asset levels above at least the first breakpoint during the prior fiscal year.
Other Benefits to the Investment Advisers and Their Affiliates
The Trustees also considered the other benefits derived by the Investment Advisers and their affiliates from their relationship with the Funds as stated above, including: (a) transfer agency fees received by Goldman, Sachs & Co. (“Goldman Sachs”); (b) futures commissions earned by Goldman Sachs for executing futures transactions on behalf of the Funds; (c) trading efficiencies resulting from aggregation of orders of the Funds with those for other funds or accounts managed by the Investment Advisers; (d) the Investment Advisers’ ability to leverage the infrastructure designed to service the Funds on behalf of their other clients; (e) the Investment Advisers’ ability to cross-market other products and services to Fund shareholders; (f) Goldman Sachs’
171
GOLDMAN SACHS MULTI SECTOR FIXED INCOME FUNDS
Statement Regarding Basis for Approval of Management Agreements (Unaudited) (continued)
retention of certain fees as Fund Distributor; (g) the Investment Advisers’ ability to negotiate better pricing with custodians on behalf of their other clients, as a result of the relationship with the Funds; and (h) the possibility that the working relationship between the Investment Advisers and the Funds’ third party service providers may cause those service providers to be open to doing business with other areas of Goldman Sachs. In the course of considering the foregoing, the Independent Trustees requested and received further information quantifying certain of these fall-out benefits.
Other Benefits to the Funds and Their Shareholders
The Trustees also noted that the Funds receive certain potential benefits as a result of their relationship with the Investment Advisers, including: (a) trading efficiencies resulting from aggregation of orders of the Funds with those of other funds or accounts managed by the Investment Advisers; (b) improved servicing from vendors because of the volume of business generated by the Investment Advisers and their affiliates; (c) improved servicing from broker-dealers because of the volume of business generated by the Investment Advisers and their affiliates; (d) the Investment Advisers’ ability to negotiate favorable terms with derivatives counterparties as a result of the size and reputation of the Goldman Sachs organization; (e) the Investment Advisers’ knowledge and experience gained from managing other accounts and products; (f) the Investment Advisers’ ability to hire and retain qualified personnel to provide services to the Funds because of the reputation of the Goldman Sachs organization; (g) the Funds’ access, through the Investment Advisers, to certain firmwide resources (e.g., proprietary risk management systems and databases), subject to certain restrictions; and (h) the Funds’ access to certain affiliated distribution channels. The Trustees noted the competitive nature of the mutual fund marketplace, and noted further that many of the Funds’ shareholders invested in the Funds in part because of the Funds’ relationship with the Investment Advisers and that those shareholders have a general expectation that the relationship will continue.
Conclusion
In connection with their consideration of the Management Agreements, the Trustees gave weight to each of the factors described above, but did not identify any particular factor as controlling their decision. After deliberation and consideration of all of the information provided, including the factors described above, the Trustees concluded, in the exercise of their business judgment, that the management fees paid by each of the Funds were reasonable in light of the services provided to it by its respective Investment Adviser, the Investment Advisers’ costs and each Fund’s current and reasonably foreseeable asset levels. The Trustees unanimously concluded that the Investment Advisers’ continued management likely would benefit each applicable Fund and its shareholders and that the Management Agreements should be approved and continued with respect to each applicable Fund until June 30, 2014.
172
FUNDS PROFILE
Goldman Sachs Funds

Goldman Sachs is a premier financial services firm, known since 1869 for creating thoughtful and customized investment solutions in complex global markets.
Today, the Investment Management Division of Goldman Sachs serves a diverse set of clients worldwide, including private institutions, public entities and individuals. With approximately $767.4 billion in assets under management as of September 30, 2013, Goldman Sachs Asset Management (“GSAM”) has portfolio management teams located around the world and our investment professionals bring firsthand knowledge of local markets to every investment decision. GSAM’s assets under management includes assets managed by Goldman Sachs Asset Management, L.P. and its Investment Advisory Affiliates.
|
| OVERVIEW OF GOLDMAN SACHS FUNDS |

Money Market1
Financial Square FundsSM
| n | | Financial Square Tax-Exempt Funds |
| n | | Financial Square Federal Fund |
| n | | Financial Square Government Fund |
| n | | Financial Square Money Market Fund |
| n | | Financial Square Prime Obligations Fund |
| n | | Financial Square Treasury Instruments Fund |
| n | | Financial Square Treasury Obligations Fund |
Fixed Income
Short Duration and Government
| n | | High Quality Floating Rate Fund |
| n | | Short Duration Government Fund |
| n | | Short Duration Income Fund |
| n | | Inflation Protected Securities Fund |
Multi-Sector
| n | | Core Plus Fixed Income Fund |
Municipal and Tax-Free
| n | | High Yield Municipal Fund |
| n | | Short Duration Tax-Free Fund |
Single Sector
| n | | Investment Grade Credit Fund |
| n | | High Yield Floating Rate Fund |
| n | | Emerging Markets Debt Fund |
| n | | Local Emerging Markets Debt Fund |
| n | | Dynamic Emerging Markets Debt Fund |
Corporate Credit
Fundamental Equity
| n | | Small/Mid Cap Growth Fund |
| n | | Flexible Cap Growth Fund |
| n | | Concentrated Growth Fund |
| n | | Technology Tollkeeper Fund |
| n | | Growth Opportunities Fund |
| n | | Rising Dividend Growth Fund |
Structured Equity
| n | | Structured Tax-Managed Equity Fund |
| n | | Structured International Tax-Managed Equity Fund |
| n | | U.S. Equity Dividend and Premium Fund |
| n | | International Equity Dividend and Premium Fund |
Equity Insights2
| n | | Small Cap Equity Insights Fund |
| n | | U.S. Equity Insights Fund |
| n | | Small Cap Growth Insights Fund |
| n | | Large Cap Growth Insights Fund |
| n | | Large Cap Value Insights Fund |
| n | | Small Cap Value Insights Fund |
| n | | International Small Cap Insights Fund |
| n | | International Equity Insights Fund |
| n | | Emerging Markets Equity Insights Fund |
Fundamental Equity International
| n | | Strategic International Equity Fund |
| n | | Concentrated International Equity Fund |
| n | | International Small Cap Fund |
| n | | Emerging Markets Equity Fund |
| n | | BRIC Fund (Brazil, Russia, India, China) |
Select Satellite3
| n | | Real Estate Securities Fund |
| n | | International Real Estate Securities Fund |
| n | | Commodity Strategy Fund |
| n | | Dynamic Allocation Fund |
| n | | Absolute Return Tracker Fund |
| n | | Managed Futures Strategy Fund |
| n | | MLP Energy Infrastructure Fund |
| n | | Multi-Manager Alternatives Fund |
| n | | Multi-Asset Real Return Fund |
| n | | Retirement Portfolio Completion Fund |
| n | | Income Strategies Portfolio |
Total Portfolio Solutions3
| n | | Balanced Strategy Portfolio |
| n | | Growth and Income Strategy Portfolio |
| n | | Growth Strategy Portfolio |
| n | | Equity Growth Strategy Portfolio |
| n | | Satellite Strategies Portfolio |
| n | | Enhanced Dividend Global Equity Portfolio |
| n | | Tax Advantaged Global Equity Portfolio |
| 1 | | An investment in a money market fund is neither insured nor guaranteed by the Federal Deposit Insurance Corporation (“FDIC”) or any other government agency. Although the Funds seek to preserve the value of your investment at $1.00 per share, it is possible to lose money by investing in the Funds. |
| 2 | | Effective at the close of business May 3, 2013, the Goldman Sachs Structured Large Cap Growth, Structured Large Cap Value, Structured Small Cap Equity, Structured Small Cap Growth, Structured Small Cap Value, Structured U.S. Equity, Structured Emerging Markets Equity, Structured International Equity and Structured International Small Cap Funds were renamed the Goldman Sachs Large Cap Growth Insights, Large Cap Value Insights, Small Cap Equity Insights, Small Cap Growth Insights, Small Cap Value Insights, U.S. Equity Insights, Emerging Markets Equity Insights, International Equity Insights and International Small Cap Insights Funds, respectively. |
| 3 | | Individual Funds within the Total Portfolio Solutions and Select Satellite categories will have various placement on the risk/return spectrum and may have greater or lesser risk than that indicated by the placement of the general Total Portfolio Solutions or Select Satellite category. |
Financial Square FundsSM is a registered service mark of Goldman, Sachs & Co.
| | |
TRUSTEES Ashok N. Bakhru, Chairman Donald C. Burke John P. Coblentz, Jr. Diana M. Daniels Joseph P. LoRusso Herbert J. Markley* James A. McNamara Jessica Palmer Alan A. Shuch Richard P. Strubel Roy W. Templin* * Effective as of October 15, 2013 ** Effective as of November 14, 2013, Mr. McHugh was appointed Principal Financial Officer. | | OFFICERS James A. McNamara, President Scott M. McHugh, Principal Financial Officer** and Treasurer Caroline L. Kraus, Secretary GOLDMAN SACHS ASSET MANAGEMENT, L.P. Investment Adviser |
| | GOLDMAN SACHS ASSET MANAGEMENT INTERNATIONAL Investment Adviser Christchurch Court, 10-15 Newgate Street London, England EC1 A7HD |
GOLDMAN, SACHS & CO. Distributor and Transfer Agent | |
Visit our Website at www.GSAMFUNDS.com to obtain the most recent month-end returns.
Goldman Sachs Asset Management, L.P. 200 West Street, New York, New York 10282
The reports concerning the Funds included in this shareholder report may contain certain forward-looking statements about the factors that may affect the performance of the Funds in the future. These statements are based on Fund management’s predictions and expectations concerning certain future events and their expected impact on the Funds, such as performance of the economy as a whole and of specific industry sectors, changes in the levels of interest rates, the impact of developing world events, and other factors that may influence the future performance of the Funds. Management believes these forward-looking statements to be reasonable, although they are inherently uncertain and difficult to predict. Actual events may cause adjustments in portfolio management strategies from those currently expected to be employed.
A description of the policies and procedures that the Funds use to determine how to vote proxies relating to portfolio securities and information regarding how a Fund voted proxies relating to portfolio securities during the most recent 12-month period ended June 30 is available (i) without charge, upon request by calling 1-800-526-7384 (for Retail Shareholders) or 1-800-621-2550 (for Institutional Shareholders); and (ii) on the Securities and Exchange Commission web site at http://www.sec.gov.
The Funds file their complete schedule of portfolio holdings with the Securities and Exchange Commission (“SEC”) for the first and third quarters of each fiscal year on Form N-Q. The Funds’ Forms N-Q are available on the SEC’s web site at http://www.sec.gov within 60 days after the Funds’ first and third fiscal quarters. The Funds’ Forms N-Q may be reviewed and copied at the SEC’s Public Reference Room in Washington, D.C., and information on the operation of the Public Reference Room may also be obtained by calling 1-800-SEC-0330. Forms N-Q may be obtained upon request and without charge by calling 1-800-526-7384 (for Retail Shareholders) or 1-800-621-2550 (for Institutional Shareholders).
Holdings and allocations shown are as of September 30, 2013 and may not be representative of future investments. Fund holdings should not be relied on in making investment decisions and should not be construed as research or investment advice regarding particular securities. Current and future holdings are subject to risk.
Economic and market forecasts presented herein reflect our judgment as of the date of this presentation and are subject to change without notice. These forecasts do not take into account the specific investment objectives, restrictions, tax and financial situation or other needs of any specific client. Actual data will vary and may not be reflected here. These forecasts are subject to high levels of uncertainty that may affect actual performance. Accordingly, these forecasts should be viewed as merely representative of a broad range of possible outcomes. These forecasts are estimated, based on assumptions, and are subject to significant revision and may change materially as economic and market conditions change. Goldman Sachs has no obligation to provide updates or changes to these forecasts. Case studies and examples are for illustrative purposes only.
This material is not authorized for distribution to prospective investors unless preceded or accompanied by a current Prospectus or summary prospectus, if applicable. Investors should consider a Fund’s objective, risks, and charges and expenses, and read the summary prospectus, if available, and/or the Prospectus carefully before investing or sending money. The summary prospectus, if available, and the Prospectus contain this and other information about a Fund and may be obtained from your authorized dealer or from Goldman, Sachs & Co. by calling (retail – 1-800-526-7384) (institutional – 1-800-621-2550).
© 2013 Goldman Sachs. All rights reserved. 115432.MF.MED.TMPL/11/2013 / MSFISAR13 / 117K
The information required by this Item is only required in an annual report on this Form N-CSR.
| ITEM 3. | AUDIT COMMITTEE FINANCIAL EXPERT. |
The information required by this Item is only required in an annual report on this Form N-CSR.
| ITEM 4. | PRINCIPAL ACCOUNTANT FEES AND SERVICES. |
The information required by this Item is only required in an annual report on this Form N-CSR.
Item 4(e)(1) — Audit Committee Pre-Approval Policies and Procedures
Pre-Approval of Audit and Non-Audit Services Provided to the Funds of the Goldman Sachs Trust. The Audit and Non-Audit Services Pre-Approval Policy (the “Policy”) adopted by the Audit Committee of Goldman Sachs Trust (“GST”) sets forth the procedures and the conditions pursuant to which services performed by an independent auditor for GST may be pre-approved. Services may be pre-approved specifically by the Audit Committee as a whole or, in certain circumstances, by the Audit Committee Chairman or the person designated as the Audit Committee Financial Expert. In addition, subject to specified cost limitations, certain services may be pre-approved under the provisions of the Policy. The Policy provides that the Audit Committee will consider whether the services provided by an independent auditor are consistent with the Securities and Exchange Commission’s rules on auditor independence. The Policy provides for periodic review and pre-approval by the Audit Committee of the services that may be provided by the independent auditor.
De Minimis Waiver. The pre-approval requirements of the Policy may be waived with respect to the provision of non-audit services that are permissible for an independent auditor to perform, provided (1) the aggregate amount of all such services provided constitutes no more than five percent of the total amount of revenues subject to pre-approval that was paid to the independent auditors during the fiscal year in which the services are provided; (2) such services were not recognized by GST at the time of the engagement to be non-audit services; and (3) such services are promptly brought to the attention of the Audit Committee and approved prior to the completion of the audit by the Audit Committee or by one or more members of the Audit Committee to whom authority to grant such approvals has been delegated by the Audit Committee, pursuant to the pre-approval provisions of the Policy.
Pre-Approval of Non-Audit Services Provided to GST’s Investment Advisers. The Policy provides that, in addition to requiring pre-approval of audit and non-audit services provided to GST, the Audit Committee will pre-approve those non-audit services provided to GST’s investment advisers (and entities controlling, controlled by or under common control with the investment advisers that provide ongoing services to GST) where the engagement relates directly to the operations or financial reporting of GST.
Item 4(e)(2) – 0% of the audit-related fees, tax fees and other fees listed in Table 1 were approved by GST’s Audit Committee pursuant to the “de minimis” exception of Rule 2-01(c)(7)(i)(C) of Regulation S-X. In addition, 0% of the non-audit services to the GST’s service affiliates listed in Table 2 were approved by GST’s Audit Committee pursuant to the “de minimis” exception of Rule 2-01(c)(7)(i)(C) of Regulation S-X.
Item 4(f) – Not applicable.
Item 4(g) Aggregate Non-Audit Fees Disclosure
The aggregate non-audit fees billed to GST by PwC for the twelve months ended August 31, 2013 and August 31, 2012 were approximately $819,198 and $661,025 respectively. The aggregate non-audit fees billed to GST’s adviser and service affiliates by PwC for non-audit services for the twelve months ended December 31, 2012 and December 31, 2011 were approximately $10.0 million and $11.6 million respectively. With regard to the aggregate non-audit fees billed to GST’s adviser and service affiliates, the 2012 and 2011 amounts include fees for non-audit services required to be pre-approved [see Table 2] and fees for non-audit services that did not require pre-approval since they did not directly relate to GST’s operations or financial reporting.
Item 4(h) — GST’s Audit Committee has considered whether the provision of non-audit services to GST’s investment adviser and service affiliates that did not require pre-approval pursuant to paragraph (c)(7)(ii) of Rule 2-01 of Regulation S-X is compatible with maintaining the auditors’ independence.
| ITEM 5. | AUDIT COMMITTEE OF LISTED REGISTRANTS. |
| ITEM 6. | SCHEDULE OF INVESTMENTS. |
| | Schedule of Investments is included as part of the Report to Stockholders filed under Item 1. |
| ITEM 7. | DISCLOSURE OF PROXY VOTING POLICIES AND PROCEDURES FOR CLOSED-END MANAGEMENT INVESTMENT COMPANIES. |
| ITEM 8. | PORTFOLIO MANAGERS OF CLOSED-END MANAGEMENT INVESTMENT COMPANIES. |
| ITEM 9. | PURCHASES OF EQUITY SECURITIES BY CLOSED-END MANAGEMENT INVESTMENT COMPANY AND AFFILIATED PURCHASERS. |
| ITEM 10. | SUBMISSION OF MATTERS TO A VOTE OF SECURITY HOLDERS. |
| | There have been no material changes to the procedures by which shareholders may recommend nominees to the registrant’s board of trustees. |
| ITEM 11. | CONTROLS AND PROCEDURES. |
| | (a) | The registrant’s principal executive and principal financial officers, or persons performing similar functions have concluded that the registrant’s disclosure controls and procedures (as defined in Rule 30a-3(c) under the Investment Company Act of 1940, as amended (the “1940 Act”)) are effective as of a date within 90 days of the filing of this report that includes the disclosure required by this paragraph, based on the evaluation of these controls and procedures required by Rule 30a-3(b) under the 1940 Act and 15d-15(b) under the Securities Exchange Act of 1934, as amended. |
| | (b) | There were no changes in the registrant’s internal control over financial reporting (as defined in Rule 30a-3(d) under the 1940 Act) that occurred during the registrant’s second fiscal quarter of the period covered by this report that have materially affected, or are reasonably likely to materially affect, the registrant’s internal control over financial reporting. |
| | | | |
| (a)(1) | | The information required by this Item is only required in connection with an annual report on this Form N-CSR. |
| | |
| (a)(2) | | Exhibit 99.CERT | | Certifications pursuant to Section 302 of the Sarbanes-Oxley Act of 2002 filed herewith. |
| | |
| (b) | | Exhibit 99.906CERT | | Certifications pursuant to Section 906 of the Sarbanes-Oxley Act of 2002 filed herewith. |
SIGNATURES
Pursuant to the requirements of the Securities Exchange Act of 1934 and the Investment Company Act of 1940, the registrant has duly caused this report to be signed on its behalf by the undersigned, thereunto duly authorized.
| | |
| | | Goldman Sachs Trust |
| |
| By: | | /s/ James A. McNamara |
| |
| | |
| | James A. McNamara |
| | President/Principal Executive Officer |
| | Goldman Sachs Trust |
| |
| Date: | | December 3, 2013 |
Pursuant to the requirements of the Securities Exchange Act of 1934 and the Investment Company Act of 1940, this report has been signed below by the following persons on behalf of the registrant and in the capacities and on the dates indicated.
| | |
| By: | | /s/ James A. McNamara |
| |
| | |
| | James A. McNamara |
| | President/Principal Executive Officer |
| | Goldman Sachs Trust |
| |
| Date: | | December 3, 2013 |
| |
| By: | | /s/ Scott McHugh |
| |
| | |
| | Scott McHugh |
| | Principal Financial Officer |
| | Goldman Sachs Trust |
| |
| Date: | | December 3, 2013 |