UNITED STATES
SECURITIES AND EXCHANGE COMMISSION
Washington, D.C. 20549
FORM N-CSR
CERTIFIED SHAREHOLDER REPORT OF REGISTERED
MANAGEMENT INVESTMENT COMPANIES
Investment Company Act file number 811-05349
Goldman Sachs Trust
(Exact name of registrant as specified in charter)
71 South Wacker Drive, Chicago, Illinois 60606
(Address of principal executive offices) (Zip code)
| | |
| Caroline Kraus, Esq. | | Copies to: |
| Goldman, Sachs & Co. | | Geoffrey R.T. Kenyon, Esq. |
| 200 West Street | | Dechert LLP |
| New York, New York 10282 | | 100 Oliver Street |
| | 40th Floor |
| | Boston, MA 02110-2605 |
(Name and address of agents for service)
Registrant’s telephone number, including area code: (312) 655-4400
Date of fiscal year end: October 31
Date of reporting period: April 30, 2014
| ITEM 1. | REPORTS TO STOCKHOLDERS. |
| | The Semi-Annual Report to Stockholders is filed herewith. |
Goldman Sachs Funds

| | | | |
| | |
| Semi-Annual Report | | | | April 30, 2014 |
| | |
| | | | Retirement Portfolio Completion Fund |

Goldman Sachs Retirement Portfolio Completion Fund
| | | | |
TABLE OF CONTENTS | | | | |
| |
Principal Investment Strategies and Risks | | | 1 | |
| |
Investment Process | | | 2 | |
| |
Portfolio Management Discussions and Performance Summaries | | | 3 | |
| |
Schedule of Investments | | | 9 | |
| |
Financial Statements | | | 13 | |
| |
Financial Highlights | | | 16 | |
| |
Notes to the Financial Statements | | | 18 | |
| |
Other Information | | | 32 | |
| | | | |
| | | |
| NOT FDIC-INSURED | | May Lose Value | | No Bank Guarantee |
GOLDMAN SACHS RETIREMENT PORTFOLIO COMPLETION FUND
Principal Investment Strategies and Risks
This is not a complete list of risks that may affect the Fund. For additional information concerning the risks applicable to the Fund, please see the Fund’s Prospectus.
The Goldman Sachs Retirement Portfolio Completion Fund is designed to provide retirement investors of all ages with access to the following asset classes that are typically underrepresented in retirement savings portfolios (the “Underlying Asset Classes”): U.S. inflation linked government bonds, global real estate investment trusts (“global REITs”), commodities, emerging markets equity, emerging markets sovereign credit, North American high yield corporate credit and Hedge Fund Industry Beta (i.e., the component of hedge fund returns that is attributable to market risk exposure, rather than manager skill). Derivative instruments may involve a high degree of financial risk. These risks include the risk that a small movement in the price of the underlying security or benchmark may result in a disproportionately large movement, unfavorable or favorable, in the price of the derivative instrument; risk of default by a counterparty; and liquidity risk. Over-the-counter transactions are subject to less government regulation and supervision. The Fund’s equity investments are subject to market risk, which means that the value of its investments may go up or down in response to the prospects of individual companies, particular sectors and/or general economic conditions. The securities of mid- and small-capitalization companies involve greater risks than those associated with larger, more established companies and may be subject to more abrupt or erratic price movements. Investments in fixed income securities are subject to the risks associated with debt securities generally, including credit, liquidity and interest rate risk. The market value of inflation protected securities is not guaranteed, and will fluctuate in response to changes in real interest rates. Investing in REITs involves certain unique risks in addition to those risks associated with investing in the real estate industry in general. REITs whose underlying properties are concentrated in a particular industry or geographic region are also subject to risks affecting such industries and regions. The securities of REITs involve greater risks than those associated with larger, more established companies and may be subject to more abrupt or erratic price movements because of interest rate changes, economic conditions and other factors. Exposure to the commodities markets may subject the Fund to greater volatility than investments in traditional securities. The Fund’s investments in other investment companies (including exchange-traded funds and money market funds) and publicly-traded partnerships (“PTPs”) subject it to additional expenses. Risks of PTPs may include potential lack of liquidity and limitations on voting and distribution rights. Foreign and emerging market securities may be more volatile and less liquid than investments in U.S. securities and are subject to the risks of currency fluctuations and adverse economic or political developments. At times, the Fund may be unable to sell certain of its illiquid portfolio investments without a substantial drop in price, if at all. The Fund is “non-diversified” and may be more susceptible than “diversified” funds to adverse developments affecting any single issuer held in its portfolio and to greater losses because of these developments.
1
GOLDMAN SACHS RETIREMENT PORTFOLIO COMPLETION FUND
What Differentiates Goldman Sachs Retirement Portfolio Completion Fund’s Investment Process?
The Fund is designed to provide retirement investors of all ages with access to certain asset classes that are typically underrepresented in retirement savings portfolios (the “Underlying Asset Classes”). Our investment process is driven by three main objectives: broad diversification in a single fund, lower expected volatility and inflation protection and cost efficiency through passive implementation of most asset classes.
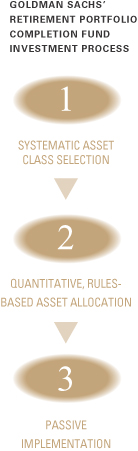

| n | | Comprehensive evaluation of a range of asset classes based on the following investment criteria — under-representation in a typical retirement investor’s portfolio, liquidity of the asset class, tax suitability, correlation with inflation, correlation with core asset classes, strong historical performance and efficient implementation. |

| n | | The Fund uses a risk parity approach for portfolio construction, targeting roughly equal contribution to overall risk from each Underlying Asset Class, and adjusting over time as market conditions evolve. |
| n | | To ensure diversification, we place minimum and maximum allocation constraints on all asset classes within the portfolio. |

| n | | Passive exposure to most of the Underlying Asset Classes means lower transaction costs, reduced manager selection risk and access to Goldman Sachs Asset Management, L.P.’s (“GSAM”) expertise in replicating index exposure for alternative asset classes. |
| n | | GSAM has created a proprietary performance benchmark, the Retirement Portfolio Completion Benchmark (the “RPC Benchmark”)2, that is externally calculated by a third party and seeks to provide a means of measuring the performance of the Underlying Asset Classes, collectively, and the Fund. |
| | | Diversification does not protect an investor from market risk and does not ensure a profit. |
| 1 | | With the exception of the Hedge Fund Industry Beta asset class, the Fund employs a passive investment approach with respect to achieving exposure to its Underlying Asset Classes. GSAM determines the allocations to each asset class. It then employs a passive investment approach with respect to achieving exposure to those asset classes (other than Hedge Fund Industry Beta). That is, GSAM utilizes an index as a reference for making investments in the asset classes (other than Hedge Fund Industry Beta) and does not attempt to exceed the performance of these indices. |
| 2 | | The Retirement Portfolio Completion Benchmark (the “RPC Benchmark”) is proprietary to GSAM and employs a rules-based methodology that is similar to that used to manage the Fund. Its methodology, construction, component indices and/or weightings assigned to component indices may change from time to time at the discretion of GSAM. One of the component indices of the RPC Benchmark is the Goldman Sachs Absolute Return Tracker Index (“GS-ART Index”). An affiliate of GSAM is the sponsor of the GS-ART Index, and the Quantitative Investment Strategies (“QIS”) team, which manages the Fund, also manages the algorithm used by the GS-ART Index. |
2
PORTFOLIO RESULTS
Goldman Sachs Retirement Portfolio Completion Fund
Investment Objective and Principal Strategy
The Fund seeks long-term capital appreciation. It is designed to provide retirement investors of all ages (i.e., both those who are approaching or planning for retirement and those who are currently retired) with access to certain asset classes that are typically underrepresented in retirement savings portfolios (the “Underlying Asset Classes”). The Fund may also be used by non-retirement investors seeking exposure to the Underlying Asset Classes. The Underlying Asset Classes are U.S. inflation linked government bonds, global real estate investment trusts (“global REITs”), commodities, emerging markets equities, emerging markets sovereign credit, North American high yield corporate credit and hedge fund industry beta (i.e., the component of hedge fund returns that is attributable to market risk exposure, rather than manager skill). The Fund’s Investment Adviser believes that the Underlying Asset Classes may provide return, risk and correlation characteristics complementary to a portfolio of more traditional investments, such as large-cap equities or investment grade fixed income. The Fund currently intends to gain exposure to the Underlying Asset Classes through the use of certain securities and derivatives, and its assets will be allocated among the Underlying Asset Classes according to a proprietary rules-based, quantitative methodology.
Portfolio Management Discussion and Analysis
Below, the Goldman Sachs Quantitative Investment Strategies Team discusses the Goldman Sachs Retirement Portfolio Completion Fund’s (the “Fund”) performance and positioning for the six-month period ended April 30, 2014 (the “Reporting Period”).
| Q | | How did the Fund perform during the Reporting Period? |
| A | | During the Reporting Period, the Fund’s Class A, C, Institutional, IR and R Shares generated cumulative total returns, without sales charges, of 1.65%, 1.26%, 1.75%, 1.74% and 1.45%, respectively. These returns compare to the 5.74% cumulative total return of the Fund’s blended benchmark, which is comprised 60% of the S&P 500® Index (with dividends reinvested) and 40% of the Barclays U.S. Aggregate Bond Index (with all income reinvested), during the same period. The S&P 500® Index and the Barclays U.S. Aggregate Bond Index generated cumulative total returns of 8.36% and 1.74%, respectively, during the Reporting Period. |
| | | The Fund also uses a proprietary benchmark, the Goldman Sachs Retirement Portfolio Completion Benchmark (“RPC Benchmark”), which generated a cumulative total return of 2.41% during the Reporting Period. At the end of the Reporting Period, the RPC Benchmark was comprised of the following indexes: Dow Jones Global Select Real Estate Securities Index (7.0%), Barclays U.S. Government Inflation-Linked Bond Index (20.0%), Dow Jones Emerging Markets Total Stock Market Index (6.4%), Dow Jones-UBS Roll Select Commodity Index (11.4%), Markit CDX North American High Yield 5-Year (15.5%), Markit CDX Emerging Markets 5-Year (20.0%) and Goldman Sachs Absolute Return Tracker Index (19.7%). |
| Q | | What economic and market factors most influenced the Underlying Asset Classes during the Reporting Period? |
| A | | During November and December 2013, the first two months of the Reporting Period, global developed markets equities, as represented by the MSCI World Index,1 posted robust gains, with the markets enjoying a strong finish to a second straight calendar year of positive returns. In the U.S., the S&P 500® Index made record highs during December 2013, as the Federal Reserve (the “Fed”) confirmed it would begin tapering asset purchases beginning in January 2014 — a signal of confidence in the U.S. economy. The U.S. Gross Domestic Product (“GDP”) grew at an annualized rate of 4.1% during the third calendar quarter, up from previous estimates and at the fastest pace in two years. In Japan, the Nikkei 225 Stock Average2 closed 2013 at a six-year high, reflecting optimism about Prime Minister Shinzo Abe’s bold reforms and stimulus. Also, Japan’s consumer price index |
| 1 | | The MSCI World Index is an index of large-cap and mid-cap stocks across 23 developed markets countries. These countries are Australia, Austria, Belgium, Canada, Denmark, Finland, France, Germany, Hong Kong, Ireland, Israel, Italy, Japan, the Netherlands, New Zealand, Norway, Portugal, Singapore, Spain, Sweden, Switzerland, the U.K. and the U.S. |
| 2 | | The Nikkei 225 Stock Average is the leading and most respected index of Japanese stocks. It is a price-weighted index comprised of Japan’s top 225 blue chip companies on the Tokyo Stock Exchange. |
3
PORTFOLIO RESULTS
| | steadily increased in the fourth calendar quarter, boosting confidence that the country’s economy was on a path to achieve an inflation target of 2%. Meanwhile, European equities markets, particularly those in Eurozone peripheral countries, continued to benefit from the European Central Bank’s commitment to easy monetary policy. |
| | | In the first quarter of 2014, global developed markets equities edged higher. The S&P 500® Index ended March 2014 near a record high, as positive factory activity data suggested U.S. economic growth was gaining traction after a harsh winter. Europe’s economic recovery continued, as evidenced by a positive purchasing managers’ index (“PMI”) and positive factory output data. At the same time, Europe’s unemployment appeared to have bottomed, though disinflation remained a potential threat. |
| | | After declining sharply at the beginning of April 2014, global developed markets equities rallied to finish the month marginally higher. In the U.S., the S&P 500® Index made fresh highs in early April but subsequently declined, with the information technology and health care sectors underperforming during April overall. However, the appetite for mergers and acquisitions and initial public offerings in both these sectors remained strong. In Europe, economic data and bond market performance suggested its economic recovery was broadening. The Euro-area Flash Services Composite PMI recorded its highest level since 2011, while the bond markets of European peripheral countries continued to normalize. (Flash Services Composite PMI is an early estimate of the Services PMI for a region, designed to provide an accurate advance indication of the final Services PMI data. As flash PMIs are among the first economic indicators for each month, providing evidence of changing economic conditions ahead of comparable government statistics, they can have a significant effect on currency markets.) Meanwhile, Japanese equities declined during April, the first month of a much-anticipated consumption tax increase that was widely expected to obscure certain economic data in the near term. Other Japanese macroeconomic data, including wage growth as well as business and consumer sentiment, also disappointed expectations. |
| | | Bonds were weak overall during the Reporting Period, with the Barclays U.S. Aggregate Index posting a return of 1.74% and the Barclays Global Aggregate Bond Index a return of 2.05% (U.S. dollar hedged). |
| | | Overall, among the asset classes in which the Fund invests, commodities and global real estate investment trusts (“REITs”) were leading performers, largely because investors favored riskier securities during the Reporting Period. North American high yield corporate credit and hedge funds, as well as emerging markets sovereign credit and Treasury inflation-protected securities (“TIPS”), also generated positive returns, though to a lesser extent. Conversely, emerging markets equities performed poorly during the Reporting Period, as concerns over slowing economic growth, high inflation and election uncertainty, weighed on many emerging markets. |
| Q | | What key factors were responsible for the Fund’s performance during the Reporting Period? |
| A | | The Fund underperformed its blended benchmark during the Reporting Period largely as a result of its allocations to emerging markets equities. It was also hampered by its lack of exposure to U.S. equities in which it does not invest as part of its investment process. The S&P 500® Index gained 8.36% during the Reporting Period as a whole. |
| | | On the positive side, the Fund benefited from its strategic allocation to commodities (accomplished through investments in publicly traded partnerships) and global REITs. |
| Q | | How did the Fund use derivatives and similar instruments during the Reporting Period? |
| A | | The Fund may use derivatives and similar instruments, in addition to buying securities directly, to gain exposure to the Underlying Asset Classes. During the Reporting Period, the Fund used indexed credit default swaps to gain exposure to emerging markets sovereign credit and North American high yield corporate credit. In addition, during the Reporting Period, the Goldman Sachs Absolute Tracker Fund (through which the Fund gains exposure to hedge fund industry beta) used exchange-traded index futures contracts, commodity index-linked structured notes, currency forward contracts and swap contracts to attempt to enhance portfolio return and for hedging purposes. |
| Q | | Were there any notable changes in the Fund’s weightings during the Reporting Period? |
| A | | We allocate the Fund’s assets among the Underlying Asset Classes according to a proprietary rules-based, quantitative methodology and then employ a passive investment approach with respect to achieving exposure to those Underlying Asset Classes (other than hedge fund industry beta). The Fund’s Underlying Asset Class allocations are rebalanced semi- annually in September and March. During the March 2014 |
4
PORTFOLIO RESULTS
| | rebalance, the Fund’s assets were allocated 19.8% to emerging markets sovereign credit, 20.0% to hedge fund industry beta and 20.0% to TIPS. In addition, the rebalance resulted in allocations of 15.6% to North American high yield corporate credit, 11.3% to commodities (accomplished through investments in publicly traded partnerships), 6.9% to global REITs and 6.4% to emerging markets equities. |
| Q | | How was the Fund positioned at the end of the Reporting Period? |
| A | | At the end of the Reporting Period, the Fund had 19.6% of its net assets in emerging markets debt and 20.2% in TIPS. It had 19.9% of its net assets in hedge fund industry beta and 15.5% in North American high yield corporate credit. The Fund also had 11.4% of its net assets invested in commodities, accomplished through investments in publicly traded partnerships. In addition, the Fund had 7.0% of its net assets invested in global REITs and 6.4% in emerging markets equities. |
| | | Going forward, we continue to have confidence in our systematic investment process. We believe non-traditional asset classes can provide return, risk and correlation characteristics that are complementary to a portfolio of more traditional investments, such as large-cap equities and investment grade fixed income. |
5
FUND BASICS
Retirement Portfolio Completion Fund
as of April 30, 2014
| | | | | | | | | | | | | | | | | | | | | | |
| | PERFORMANCE REVIEW | |
| | | November 1, 2013–
April 30, 2014 | | Fund Total
Return
(based on
NAV)1 | | | Retirement
Portfolio
Completion
Composite
Index2,4,5 | | | RPC
Benchmark3 | | | S&P 500
Index4 | | | Barclays U.S.
Aggregate
Bond Index5 | |
| | Class A | | | 1.65 | % | | | 5.74 | % | | | 2.41 | % | | | 8.36 | % | | | 1.74 | % |
| | Class C | | | 1.26 | | | | 5.74 | | | | 2.41 | | | | 8.36 | | | | 1.74 | |
| | Institutional | | | 1.75 | | | | 5.74 | | | | 2.41 | | | | 8.36 | | | | 1.74 | |
| | Class IR | | | 1.74 | | | | 5.74 | | | | 2.41 | | | | 8.36 | | | | 1.74 | |
| | | Class R | | | 1.45 | | | | 5.74 | | | | 2.41 | | | | 8.36 | | | | 1.74 | |
| | 1 | | The net asset value (“NAV”) represents the net assets of the class of the Fund (ex-dividend) divided by the total number of shares of the class outstanding. The Fund’s performance assumes the reinvestment of dividends and other distributions. The Fund’s performance does not reflect the deduction of any applicable sales charges. |
| | 2 | | The Retirement Portfolio Completion Composite Index is comprised of the S&P® 500 Index (60%) and the Barclays U.S. Aggregate Bond Index (40%). The Index figures do not reflect any deduction for fees, expenses or taxes. It is not possible to invest directly in an index. |
| | 3 | | The RPC Benchmark is proprietary to GSAM and employs a rules-based methodology that is similar to that used to manage the Fund. Its methodology, construction, component indices and/or weightings assigned to component indices may change from time to time at the discretion of GSAM. As of 4/30/2014, the RPC Benchmark is comprised of the following indices: Dow Jones Global Select Real Estate Securities Index (7.0%), Barclays U.S. Government Inflation-Linked Bond Index (20.0%), Dow Jones Emerging Markets Index (6.4%), Dow Jones-UBS Roll Select Commodity Index (11.4%), Markit CDX North American High Yield (15.5%), Markit CDX Emerging Markets (20.0%) and Goldman Sachs Absolute Return Tracker Index (“GS-ART Index”) (19.7%). An affiliate of GSAM is the sponsor of the GS-ART Index and the Quantitative Investment Strategies team, which manages the Fund, also manages the algorithm used by the GS-ART Index. See the Fund’s Prospectus for additional details. |
The RPC Benchmark is the property of Goldman Sachs Asset Management, which has contracted with S&P Dow Jones Indices LLC or its affiliates (“S&P Dow Jones”) to independently maintain and calculate the RPC Benchmark based on objective pre-agreed methodology. S&P Dow Jones shall have no liability for any errors or omissions in calculating the RPC Benchmark. The Fund is not sponsored, endorsed, sold or promoted by S&P Dow Jones Indices LLC, its affiliates or their third party licensors and neither S&P Dow Jones Indices LLC, its affiliates nor their its third party licensors make any representation regarding the advisability of investing in the Fund.
| | 4 | | The S&P 500 Index is the Standard & Poor’s 500 Composite Index of 500 stocks, an unmanaged index of common stock prices. |
| | 5 | | The Barclays U.S. Aggregate Bond Index represents an unmanaged diversified portfolio of fixed income securities, including U.S. Treasuries, investment-grade corporate bonds, and mortgage-backed and asset-backed securities. |
The returns set forth in the table above represent past performance. Past performance does not guarantee future results. The Fund’s investment return and principal value will fluctuate so that an investor’s shares, when redeemed, may be worth more or less than their original cost. Current performance may be lower or higher than the performance quoted above. Please visit our web site at www.GSAMFUNDS.com to obtain the most recent month-end returns. Performance reflects applicable fee waivers and/or expense limitations in effect during the periods shown. In their absence, performance would be reduced. Returns do not reflect the deduction of taxes that a shareholder would pay on Fund distributions or the redemption of Fund shares.
6
FUND BASICS
| | | | | | | | | | | | |
| | STANDARDIZED TOTAL RETURNS4 |
| | | For the period ended 3/31/14 | | 1 Year | | | Since Inception | | | Inception Date |
| | Class A | | | -2.88 | % | | | -0.83 | % | | 9/28/12 |
| | Class C | | | -0.75 | | | | 0.97 | | | 9/28/12 |
| | Institutional | | | 1.45 | | | | 2.12 | | | 9/28/12 |
| | Class IR | | | 1.24 | | | | 1.96 | | | 9/28/12 |
| | | Class R | | | 0.75 | | | | 1.50 | | | 9/28/12 |
| | 4 | | The Standardized Total Returns are average annual total returns as of the most recent calendar quarter-end. They assume reinvestment of all distributions at NAV. These returns reflect a maximum initial sales charge of 3.75% for Class A Shares and the assumed contingent deferred sales charge for Class C Shares (1% if redeemed within 12 months of purchase). Because Institutional, Class IR and Class R Shares do not involve a sales charge, such a charge is not applied to their Standardized Total Returns. |
The returns set forth in the table above represent past performance. Past performance does not guarantee future results. The Fund’s investment return and principal value will fluctuate so that an investor’s shares, when redeemed, may be worth more or less than their original cost. Current performance may be lower or higher than the performance quoted above. Please visit our web site at www.GSAMFUNDS.com to obtain the most recent month-end returns. Performance reflects applicable fee waivers and/or expense limitations in effect during the periods shown. In their absence, performance would be reduced. Returns do not reflect the deduction of taxes that a shareholder would pay on Fund distributions or the redemption of Fund shares.
| | | | | | | | | | |
| | EXPENSE RATIOS5 | |
| | | | | Net Expense Ratio (Current) | | | Gross Expense Ratio (Before Waivers) | |
| | Class A | | | 0.91 | % | | | 13.55 | % |
| | Class C | | | 1.65 | | | | 11.94 | |
| | Institutional | | | 0.51 | | | | 11.04 | |
| | Class IR | | | 0.65 | | | | 13.39 | |
| | | Class R | | | 1.16 | | | | 11.46 | |
| | 5 | | The expense ratios of the Fund, both current (net of applicable fee waivers and/or expense limitations) and before waivers (gross of applicable fee waivers and/or expense limitations) are as set forth above according to the most recent publicly available Prospectus for the Fund and may differ from the expense ratios disclosed in the Financial Highlights in this report. The Fund’s waivers and/or expense limitations will remain in place through at least February 28, 2015, and prior to such date the Investment Adviser may not terminate the arrangements without the approval of the Fund’s Board of Trustees. If these arrangements are discontinued in the future, the expense ratios may change without shareholder approval. |
7
FUND BASICS
| | | | | | | | | | |
| | TOP TEN EQUITY HOLDINGS AS OF 4/30/14‡ |
| | | Holding | | % of
Net Assets | | | Line of Business | | Country |
| | Goldman Sachs Absolute Return Tracker Fund – Institutional Shares | | | 20.0 | % | | Investment Company | | United States |
| | PowerShares DB Commodity Index Tracking Fund | | | 11.4 | | | Exchange Traded Fund | | United States |
| | Vanguard MSCI Emerging Markets ETF | | | 4.3 | | | Exchange Traded Fund | | United States |
| | Simon Property Group, Inc. | | | 0.4 | | | Real Estate Investment Trusts | | Spain |
| | Brookfield Asset Management, Inc. Class A | | | 0.2 | | | Real Estate Management &
Development | | Switzerland |
| | Mitsui Fudosan Co. Ltd. | | | 0.2 | | | Real Estate Management &
Development | | United Kingdom |
| | Unibail-Rodamco SE | | | 0.2 | | | Real Estate Investment Trusts | | Belgium |
| | Public Storage | | | 0.2 | | | Real Estate Investment Trusts | | France |
| | ProLogis, Inc. | | | 0.2 | | | Real Estate Investment Trusts | | Switzerland |
| | | Equity Residential | | | 0.2 | | | Real Estate Investment Trusts | | Luxembourg |
| | ‡ | | The top 10 holdings may not be representative of the Fund’s future investments. |
|
| PORTFOLIO COMPOSITION6 |
| As of April 30, 2014 |
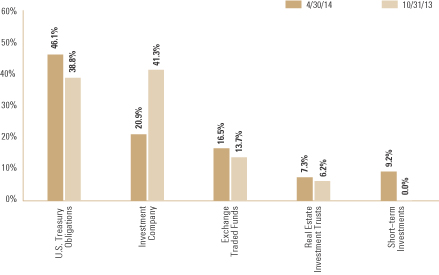
| | 6 | | The percentage shown for each investment category reflects the value of investments in that category as a percentage of the Fund’s market value investments. Short-term investments represent repurchase agreements. The graph depicts the Fund’s investments but may not represent the Fund’s market exposure due to the exclusion of certain derivatives, if any, as listed in the Additional Investment Information section of the Schedule of Investments. |
8
GOLDMAN SACHS RETIREMENT PORTFOLIO COMPLETION FUND
Schedule of Investments
April 30, 2014 (Unaudited)
| | | | | | | | |
Shares | | | Description | | Value | |
| | | | | | | | |
| | Common Stocks – 7.0% | |
| | Real Estate Investment Trusts – 5.8% | |
| | 34 | | | Acadia Realty Trust | | $ | 922 | |
| | 35 | | | Alexandria Real Estate Equities, Inc. | | | 2,584 | |
| | 53 | | | American Campus Communities, Inc. | | | 2,025 | |
| | 83 | | | Apartment Investment & Management Co. Class A | | | 2,559 | |
| | 9 | | | Artis Real Estate Investment Trust | | | 131 | |
| | 1,655 | | | Ascendas Real Estate Investment Trust | | | 3,029 | |
| | 6 | | | Ashford Hospitality Prime, Inc. | | | 92 | |
| | 30 | | | Ashford Hospitality Trust, Inc. | | | 308 | |
| | 45 | | | Associated Estates Realty Corp. | | | 755 | |
| | 67 | | | AvalonBay Communities, Inc. | | | 9,149 | |
| | 8 | | | Befimmo SCA Sicafi | | | 583 | |
| | 164 | | | Beni Stabili SpA | | | 147 | |
| | 64 | | | Big Yellow Group PLC | | | 556 | |
| | 96 | | | BioMed Realty Trust, Inc. | | | 2,006 | |
| | 6 | | | Boardwalk Real Estate Investment Trust | | | 338 | |
| | 84 | | | Boston Properties, Inc. | | | 9,840 | |
| | 76 | | | Brandywine Realty Trust | | | 1,106 | |
| | 562 | | | British Land Co. PLC | | | 6,566 | |
| | 153 | | | BWP Trust | | | 356 | |
| | 9 | | | Calloway Real Estate Investment Trust | | | 220 | |
| | 41 | | | Camden Property Trust | | | 2,808 | |
| | 8 | | | Canadian Apartment Properties REIT | | | 154 | |
| | 6 | | | Canadian Real Estate Investment Trust | | | 247 | |
| | 751 | | | CapitaCommercial Trust | | | 961 | |
| | 1,161 | | | Capital Property Fund | | | 1,171 | |
| | 1,803 | | | CapitaMall Trust | | | 2,874 | |
| | 97 | | | CBL & Associates Properties, Inc. | | | 1,762 | |
| | 1,379 | | | CFS Retail Property Trust Group | | | 2,582 | |
| | 1,000 | | | Champion | | | 471 | |
| | 60 | | | Charter Hall Retail | | | 216 | |
| | 9 | | | Cofinimmo | | | 1,103 | |
| | 49 | | | Columbia Property Trust, Inc. | | | 1,389 | |
| | 55 | | | CommonWealth | | | 1,398 | |
| | 48 | | | Corio NV | | | 2,249 | |
| | 33 | | | Corporate Office Properties Trust | | | 883 | |
| | 127 | | | Cousins Properties, Inc. | | | 1,477 | |
| | 85 | | | CubeSmart | | | 1,581 | |
| | 206 | | | DCT Industrial Trust, Inc. | | | 1,611 | |
| | 140 | | | DDR Corp. | | | 2,404 | |
| | 41 | | | Derwent London PLC | | | 1,886 | |
| | 2,759 | | | Dexus Property Group | | | 2,919 | |
| | 78 | | | DiamondRock Hospitality Co. | | | 957 | |
| | 64 | | | Digital Realty Trust, Inc. | | | 3,418 | |
| | 70 | | | Douglas Emmett, Inc. | | | 1,932 | |
| | 155 | | | Duke Realty Corp. | | | 2,716 | |
| | 23 | | | DuPont Fabros Technology, Inc. | | | 557 | |
| | 12 | | | EastGroup Properties, Inc. | | | 759 | |
| | 51 | | | Education Realty Trust, Inc. | | | 520 | |
| | 34 | | | Equity Lifestyle Properties, Inc. | | | 1,424 | |
| | 29 | | | Equity One, Inc. | | | 653 | |
| | 183 | | | Equity Residential | | | 10,878 | |
| | 29 | | | Essex Property Trust, Inc. | | | 5,025 | |
| | 19 | | | Eurocommercial Properties NV | | | 872 | |
| | 51 | | | Extra Space Storage, Inc. | | | 2,669 | |
| | 34 | | | Federal Realty Investment Trust | | | 3,996 | |
| | |
| | | | | | | | |
| | Common Stocks – (continued) | |
| | Real Estate Investment Trusts – (continued) | |
| | 98 | | | FelCor Lodging Trust, Inc. | | $ | 905 | |
| | 40 | | | First Industrial Realty Trust, Inc. | | | 735 | |
| | 26 | | | Fonciere Des Regions | | | 2,641 | |
| | 389 | | | Fountainhead Property Trust | | | 294 | |
| | 38 | | | Franklin Street Properties Corp. | | | 463 | |
| | 1 | | | Fukuoka REIT Co. | | | 1,609 | |
| | 14 | | | Gecina SA | | | 1,884 | |
| | 293 | | | General Growth Properties, Inc. | | | 6,730 | |
| | 47 | | | Glimcher Realty Trust | | | 479 | |
| | 898 | | | Goodman Group | | | 4,171 | |
| | 592 | | | Goodman Property Trust | | | 508 | |
| | 769 | | | GPT Group | | | 2,806 | |
| | 192 | | | Great Portland Estates PLC | | | 2,036 | |
| | 648 | | | Growthpoint Properties Ltd. | | | 1,498 | |
| | 140 | | | H&R Real Estate Investment Trust | | | 2,948 | |
| | 380 | | | Hammerson PLC | | | 3,667 | |
| | 251 | | | HCP, Inc. | | | 10,507 | |
| | 159 | | | Health Care REIT, Inc. | | | 10,031 | |
| | 62 | | | Healthcare Realty Trust, Inc. | | | 1,559 | |
| | 57 | | | Hersha Hospitality Trust | | | 331 | |
| | 40 | | | Highwoods Properties, Inc. | | | 1,614 | |
| | 30 | | | Home Properties, Inc. | | | 1,848 | |
| | 73 | | | Hospitality Properties Trust | | | 2,194 | |
| | 415 | | | Host Hotels & Resorts, Inc. | | | 8,902 | |
| | 41 | | | Inland Real Estate Corp. | | | 428 | |
| | 365 | | | Intu Properties PLC | | | 1,803 | |
| | 417 | | | Investa Office Fund | | | 1,298 | |
| | 77 | | | Is Gayrimenkul Yatirim Ortakligi AS | | | 50 | |
| | 1 | | | Japan Excellent, Inc. | | | 1,328 | |
| | 1 | | | Japan Prime Realty Investment Corp. | | | 3,519 | |
| | 1 | | | Japan Real Estate Investment Corp. | | | 5,302 | |
| | 1 | | | Japan Retail Fund Investment Corp. | | | 2,011 | |
| | 46 | | | Kilroy Realty Corp. | | | 2,740 | |
| | 234 | | | Kimco Realty Corp. | | | 5,363 | |
| | 569 | | | Kiwi Income Property Trust | | | 564 | |
| | 300 | | | KLCC Property Holdings Bhd | | | 611 | |
| | 47 | | | Klepierre | | | 2,156 | |
| | 392 | | | Land Securities Group PLC | | | 7,042 | |
| | 54 | | | LaSalle Hotel Properties | | | 1,786 | |
| | 69 | | | Liberty Property Trust | | | 2,588 | |
| | 9 | | | LTC Properties, Inc. | | | 348 | |
| | 36 | | | Mack-Cali Realty Corp. | | | 733 | |
| | 660 | | | Mapletree Logistics Trust | | | 580 | |
| | 14 | | | Mercialys SA | | | 322 | |
| | 41 | | | Mid-America Apartment Communities, Inc. | | | 2,856 | |
| | 1 | | | Mori Hills REIT Investment Corp. | | | 1,334 | |
| | 1 | | | Nippon Building Fund, Inc. | | | 5,544 | |
| | 1 | | | Orix JREIT, Inc. | | | 1,272 | |
| | 51 | | | Parkway Properties, Inc. | | | 962 | |
| | 43 | | | Pebblebrook Hotel Trust | | | 1,481 | |
| | 26 | | | Pennsylvania Real Estate Investment Trust | | | 430 | |
| | 61 | | | Piedmont Office Realty Trust, Inc. Class A | | | 1,074 | |
| | 24 | | | Post Properties, Inc. | | | 1,205 | |
| | 272 | | | ProLogis, Inc. | | | 11,051 | |
| | 9 | | | PS Business Parks, Inc. | | | 772 | |
| | 78 | | | Public Storage | | | 13,690 | |
| | |
| | |
| The accompanying notes are an integral part of these financial statements. | | 9 |
GOLDMAN SACHS RETIREMENT PORTFOLIO COMPLETION FUND
Schedule of Investments (continued)
April 30, 2014 (Unaudited)
| | | | | | | | |
Shares | | | Description | | Value | |
| | | | | | | | |
| | Common Stocks – (continued) | |
| | Real Estate Investment Trusts – (continued) | |
| | 19 | | | Ramco-Gershenson Properties Trust | | $ | 313 | |
| | 53 | | | Regency Centers Corp. | | | 2,779 | |
| | 143 | | | RioCan Real Estate Investment Trust | | | 3,553 | |
| | 342 | | | Segro PLC | | | 2,024 | |
| | 105 | | | Senior Housing Properties Trust | | | 2,464 | |
| | 137 | | | Shaftesbury PLC | | | 1,532 | |
| | 167 | | | Simon Property Group, Inc. | | | 28,924 | |
| | 50 | | | SL Green Realty Corp. | | | 5,235 | |
| | 18 | | | Sovran Self Storage, Inc. | | | 1,366 | |
| | 1,074 | | | Starhill Global REIT | | | 695 | |
| | 17 | | | Sun Communities, Inc. | | | 775 | |
| | 84 | | | Sunstone Hotel Investors, Inc. | | | 1,202 | |
| | 1,753 | | | Suntec Real Estate Investment Trust | | | 2,403 | |
| | 56 | | | Tanger Factory Outlet Centers, Inc. | | | 1,998 | |
| | 30 | | | Taubman Centers, Inc. | | | 2,185 | |
| | 1,085 | | | The Link REIT | | | 5,402 | |
| | 81 | | | The Macerich Co. | | | 5,258 | |
| | 1 | | | Tokyu REIT, Inc. | | | 1,278 | |
| | 136 | | | UDR, Inc. | | | 3,517 | |
| | 52 | | | Unibail-Rodamco SE | | | 14,053 | |
| | 1 | | | United Urban Investment Corp. | | | 1,509 | |
| | 4 | | | Vastned Retail NV | | | 206 | |
| | 161 | | | Ventas, Inc. | | | 10,639 | |
| | 95 | | | Vornado Realty Trust | | | 9,747 | |
| | 28 | | | Washington Real Estate Investment Trust | | | 685 | |
| | 64 | | | Weingarten Realty Investors | | | 1,997 | |
| | 17 | | | Wereldhave NV | | | 1,430 | |
| | 1,061 | | | Westfield Group | | | 10,827 | |
| | 1,723 | | | Westfield Retail Trust | | | 5,119 | |
| | 49 | | | Workspace Group PLC | | | 475 | |
| | | | | | | | |
| | | | | | | 393,987 | |
| | |
| | Real Estate Management & Development – 1.2% | |
| | 71 | | | Aeon Mall Co. Ltd. | | | 1,693 | |
| | 37 | | | Atrium European Real Estate Ltd.* | | | 213 | |
| | 2,900 | | | Ayala Land, Inc. | | | 1,965 | |
| | 300 | | | BR Malls Participacoes SA | | | 2,582 | |
| | 340 | | | Brookfield Asset Management, Inc. Class A | | | 14,272 | |
| | 90 | | | Brookfield Property Partners LP | | | 1,737 | |
| | 28 | | | BUWOG AG* | | | 514 | |
| | 28 | | | CA Immobilien Anlagen AG* | | | 534 | |
| | 352 | | | Capital & Counties Properties PLC | | | 1,986 | |
| | 1,782 | | | Capitaland Ltd. | | | 4,561 | |
| | 105 | | | Castellum AB | | | 1,790 | |
| | 700 | | | Central Pattana PCL | | | 983 | |
| | 58 | | | Fabege AB | | | 815 | |
| | 22 | | | First Capital Realty, Inc. | | | 360 | |
| | 71 | | | Forest City Enterprises, Inc. Class A* | | | 1,343 | |
| | 1,797 | | | Global Logistic Properties Ltd. | | | 4,095 | |
| | 81 | | | Globe Trade Centre SA* | | | 203 | |
| | 131 | | | Grainger PLC | | | 473 | |
| | 194 | | | Hang Lung Group Ltd. | | | 1,054 | |
| | 1,593 | | | Hang Lung Properties Ltd. | | | 4,751 | |
| | 287 | | | Hongkong Land Holdings Ltd. | | | 2,011 | |
| | 199 | | | Hulic Co. Ltd. | | | 2,400 | |
| | 172 | | | Hysan Development Co. Ltd. | | | 738 | |
| | |
| | | | | | | | |
| | Common Stocks – (continued) | |
| | Real Estate Management & Development – (continued) | |
| | 576 | | | Immofinanz Immobilien Anlagen AG* | | $ | 2,135 | |
| | 259 | | | Kerry Properties Ltd. | | | 853 | |
| | 56 | | | Kungsleden AB | | | 457 | |
| | 475 | | | Mitsui Fudosan Co. Ltd. | | | 14,061 | |
| | 52 | | | NTT Urban Development Corp. | | | 457 | |
| | 151 | | | Precinct Properties New Zealand Ltd. | | | 133 | |
| | 22 | | | PSP Swiss Property AG* | | | 2,114 | |
| | 500 | | | Robinsons Land Corp. | | | 251 | |
| | 3,900 | | | SM Prime Holdings, Inc. | | | 1,432 | |
| | 29 | | | Swiss Prime Site AG* | | | 2,438 | |
| | 218 | | | Tokyu Fudosan Holdings Corp.* | | | 1,585 | |
| | 221 | | | Wheelock & Co. Ltd. | | | 912 | |
| | | | | | | | |
| | | | | | | 77,901 | |
| | |
| | TOTAL COMMON STOCKS | | | | |
| | (Cost $435,162) | | $ | 471,888 | |
| | |
| | | | | | | | | | |
Principal
Amount | | Interest Rate | | Maturity
Date | | | Value | |
| U.S. Treasury Obligations – 44.1% | |
United States Treasury Bill(a) | |
| $1,627,000 | | 0.000% | | | 07/24/14 | | | $ | 1,626,943 | |
United States Treasury Inflation Protected Securities | |
| 31,414 | | 0.500 | | | 04/15/15 | | | | 32,018 | |
| 27,758 | | 1.875 | | | 07/15/15 | | | | 29,064 | |
| 27,204 | | 2.000 | | | 01/15/16 | | | | 28,857 | |
| 56,367 | | 0.125 | | | 04/15/16 | | | | 57,997 | |
| 32,548 | | 2.500 | | | 07/15/16 | | | | 35,513 | |
| 27,938 | | 2.375 | | | 01/15/17 | | | | 30,631 | |
| 64,081 | | 0.125 | | | 04/15/17 | | | | 66,113 | |
| 21,521 | | 2.625 | | | 07/15/17 | | | | 24,140 | |
| 25,773 | | 1.625 | | | 01/15/18 | | | | 28,064 | |
| 70,072 | | 0.125 | | | 04/15/18 | | | | 72,010 | |
| 22,861 | | 1.375 | | | 07/15/18 | | | | 24,908 | |
| 21,868 | | 2.125 | | | 01/15/19 | | | | 24,543 | |
| 23,088 | | 1.875 | | | 07/15/19 | | | | 25,863 | |
| 28,225 | | 1.375 | | | 01/15/20 | | | | 30,708 | |
| 48,439 | | 1.250 | | | 07/15/20 | | | | 52,609 | |
| 54,730 | | 1.125 | | | 01/15/21 | | | | 58,570 | |
| 52,079 | | 0.625 | | | 07/15/21 | | | | 54,072 | |
| 59,120 | | 0.125 | | | 01/15/22 | | | | 58,519 | |
| 58,187 | | 0.125 | | | 07/15/22 | | | | 57,587 | |
| 57,971 | | 0.125 | | | 01/15/23 | | | | 56,730 | |
| 57,498 | | 0.375 | | | 07/15/23 | | | | 57,534 | |
| 21,128 | | 0.625 | | | 01/15/24 | | | | 21,455 | |
| 48,570 | | 2.375 | | | 01/15/25 | | | | 57,897 | |
| 33,118 | | 2.000 | | | 01/15/26 | | | | 38,282 | |
| 26,774 | | 2.375 | | | 01/15/27 | | | | 32,308 | |
| 24,652 | | 1.750 | | | 01/15/28 | | | | 27,814 | |
| 33,383 | | 3.625 | | | 04/15/28 | | | | 46,120 | |
| 21,868 | | 2.500 | | | 01/15/29 | | | | 27,041 | |
| 38,556 | | 3.875 | | | 04/15/29 | | | | 55,346 | |
| 9,258 | | 3.375 | | | 04/15/32 | | | | 13,058 | |
| 22,808 | | 2.125 | | | 02/15/40 | | | | 28,108 | |
| |
| | |
| 10 | | The accompanying notes are an integral part of these financial statements. |
GOLDMAN SACHS RETIREMENT PORTFOLIO COMPLETION FUND
| | | | | | | | | | |
Principal
Amount | | Interest Rate | | Maturity
Date | | | Value | |
| | | | | | | | | | |
| U.S. Treasury Obligations – (continued) | |
United States Treasury Inflation Protected Securities – (continued) | |
| $35,375 | | 2.125% | | | 02/15/41 | | | $ | 43,788 | |
| 33,245 | | 0.750 | | | 02/15/42 | | | | 30,035 | |
| 32,674 | | 0.625 | | | 02/15/43 | | | | 28,421 | |
| 12,087 | | 1.375 | | | 02/15/44 | | | | 12,775 | |
| |
| TOTAL U.S. TREASURY OBLIGATIONS | |
| (Cost $3,026,716) | | | | | | $ | 2,995,441 | |
| |
| | | | | | | | |
Shares | | | Description | | Value | |
| | Exchange Traded Funds – 15.8% | |
| | 71 | | | iShares Dow Jones US Real Estate Index Fund | | $ | 4,947 | |
| | 29,290 | | | PowerShares DB Commodity Index Tracking Fund – PTP* | | | 773,549 | |
| | 116 | | | SPDR Dow Jones International Real Estate ETF | | | 4,954 | |
| | 7,138 | | | Vanguard MSCI Emerging Markets ETF | | | 292,230 | |
| | |
| | TOTAL EXCHANGE TRADED FUNDS | |
| | (Cost $1,077,807) | | $ | 1,075,680 | |
| | |
| | | | | | | | |
| | Investment Company(b) – 20.0% | |
| | 145,877 | | | Goldman Sachs Absolute Return Tracker Fund – Institutional Shares | | | | |
| | (Cost $1,357,649) | | $ | 1,356,653 | |
| | |
| | | | | | | | | | |
Principal Amount | | | Interest Rate | | Maturity Date | | Value | |
| | Short-term Investment(c) – 8.8% | |
| | Repurchase Agreement – 8.8% | | | | |
| Joint Repurchase Agreement Account II | |
| $ | 600,000 | | | 0.056% | | 05/01/14 | | $ | 600,000 | |
| | (Cost $600,000) | | | | | | |
| | |
| | TOTAL INVESTMENTS – 95.7% | | | | |
| | (Cost $6,497,334) | | | | $ | 6,499,662 | |
| | |
| OTHER ASSETS IN EXCESS OF
LIABILITIES – 4.3% | | | 289,004 | |
| | |
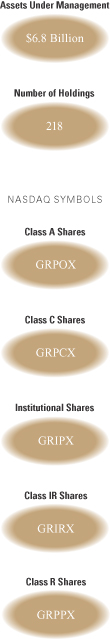
| | NET ASSETS – 100.0% | | $ | 6,788,666 | |
| | |
| | |
| The percentage shown for each investment category reflects the value of investments in that category as a percentage of net assets. |
* | | Non-income producing security. |
(a) | | Issued with a zero coupon. Income is recognized through the accretion of discount. |
(b) | | Represents an Affiliated Fund. |
(c) | | Joint repurchase agreement was entered into on April 30, 2014. Additional information appears on page 12. |
| | |
|
Investment Abbreviations: |
ETF | | —Exchange Traded Fund |
REIT | | —Real Estate Investment Trust |
PTP | | —Publicly Traded Partnership |
|
|
| ADDITIONAL INVESTMENT INFORMATION |
SWAP CONTRACTS — At April 30, 2014, the Fund had outstanding swap contracts with the following terms:
CENTRALLY CLEARED CREDIT DEFAULT SWAP CONTRACTS
| | | | | | | | | | | | | | | | | | | | | | | | |
| | | | Market Value | |
| Referenced Obligation | | Notional
Amount
(000s) | | | Rates Received
(Paid) | | | Termination
Date | | | Credit
Spread at
April 30,
2014(a) | | | Upfront
Payments
Made (Received) | | | Unrealized
Gain (Loss) | |
Protection Sold: | | | | | | | | | | | | | | | | | | | | | | | | |
CDX Emerging Markets Index 20 | | $ | 1,340 | | | | 5.000 | % | | | 06/20/19 | | | | 2.943 | % | | $ | 114,325 | | | $ | 29,468 | |
CDX North America High Yield Index 21 | | | 1,060 | | | | 5.000 | | | | 06/20/19 | | | | 3.358 | | | | 75,416 | | | | 4,732 | |
| | |
| TOTAL | | | $ | 189,741 | | | $ | 34,200 | |
| | (a) | | Credit spread on the Referenced Obligation, together with the term of the swap contract, are indicators of payment/performance risk. The likelihood of a credit event occurring which would require a fund to make a payment or otherwise be required to perform under the swap contract is generally greater as the credit spread and the term of the swap contract increase. |
| | |
| The accompanying notes are an integral part of these financial statements. | | 11 |
GOLDMAN SACHS RETIREMENT PORTFOLIO COMPLETION FUND
Schedule of Investments (continued)
April 30, 2014 (Unaudited)
|
| ADDITIONAL INVESTMENT INFORMATION (continued) |
TOTAL RETURN SWAP CONTRACTS ON EQUITY INDICES(b)
| | | | | | | | | | | | | | | | | | |
| Counterparty | |
Referenced Obligation | | Notional
Amount
(000s) | | | Rate Received
(Paid) | | | Termination
Date | | | Unrealized
Gain (Loss)* | |
Bank of America Securities LLC | | MSCI Emerging Markets Net TR Index | | $ | 147 | | | | 0.580 | % | | | 07/03/14 | | | $ | 422 | |
| | (b) | | The Fund receives quarterly payments based on any positive quarterly return of the Referenced Obligation. The Fund makes payments on any negative quarterly return of such Referenced Obligation. |
| | * | | There are no upfront payments on the swap contract(s), therefore the unrealized gain (loss) on the swap contracts is equal to their market value. |
JOINT REPURCHASE AGREEMENT ACCOUNT II — At April 30, 2014, the Fund had undivided interests in the Joint Repurchase Agreement Account II, with a maturity date of May 1, 2014, as follows:
| | | | | | | | |
| Principal Amount | | Maturity Value | | | Collateral Allocation Value | |
$600,000 | | $ | 600,001 | | | $ | 614,802 | |
REPURCHASE AGREEMENTS — At April 30, 2014, the Principal Amount of the Fund’s interest in the Joint Repurchase Agreement Account II was as follows:
| | | | | | | | |
| Counterparty | | Interest
Rate | | | Principal
Amounts | |
BNP Paribas Securities Co. | | | 0.060 | % | | $ | 123,644 | |
Citigroup Global Capital Markets, Inc. | | | 0.060 | | | | 92,191 | |
Merrill Lynch & Co., Inc. | | | 0.050 | | | | 149,176 | |
TD Securities USA LLC | | | 0.050 | | | | 75,922 | |
TD Securities USA LLC | | | 0.060 | | | | 75,922 | |
Wells Fargo Securities LLC | | | 0.060 | | | | 83,145 | |
| TOTAL | | | | | | $ | 600,000 | |
At April 30, 2014, the Joint Repurchase Agreement Account II was fully collateralized by:
| | | | | | | | |
| Issuer | | Interest Rates | | | Maturity Dates | |
Federal Farm Credit Banks | | | 0.155 to 0.181 | % | | | 10/01/15 to 06/03/16 | |
Federal Home Loan Bank | | | 5.375 | | | | 05/18/16 | |
Federal Home Loan Bank Discount Notes | | | 0.000 | | | | 10/24/14 | |
Federal Home Loan Mortgage Corp. | | | 0.500 to 6.000 | | | | 04/17/15 to 05/01/44 | |
Federal National Mortgage Association | | | 1.375 to 7.000 | | | | 03/01/15 to 05/01/44 | |
Government National Mortgage Association | | | 3.000 to 9.000 | | | | 06/15/20 to 03/20/44 | |
U.S. Treasury Coupon-Only Stripped Security | | | 0.000 | | | | 05/15/23 | |
U.S. Treasury Notes | | | 0.250 to 7.500 | | | | 02/28/15 to 11/15/16 | |
| | |
| 12 | | The accompanying notes are an integral part of these financial statements. |
GOLDMAN SACHS RETIREMENT PORTFOLIO COMPLETION FUND
Statement of Assets and Liabilities
April 30, 2014 (Unaudited)
| | | | | | |
| | | | | | |
| | Assets: | |
| | Investments of unaffiliated issuers, at value (cost $5,139,685) | | $ | 5,143,009 | |
| | Investments of affiliated issuers, at value (cost $1,357,649) | | | 1,356,653 | |
| | Cash | | | 34,120 | |
| | Foreign currencies, at value (cost $2,363) | | | 2,381 | |
| | Receivables: | | | | |
| | Collateral on certain derivative contracts(a) | | | 302,520 | |
| | Reimbursement from investment adviser | | | 36,815 | |
| | Fund shares sold | | | 23,850 | |
| | Dividends and interest | | | 4,540 | |
| | Unrealized gain on swap contracts | | | 422 | |
| | Variation margin on certain derivative contracts | | | 1,505 | |
| | Other assets | | | 6,188 | |
| | Total assets | | | 6,912,003 | |
| | | | | | |
| | Liabilities: | |
| | Payables: | | | | |
| | Amounts owed to affiliates | | | 2,008 | |
| | Accrued expenses | | | 121,329 | |
| | Total liabilities | | | 123,337 | |
| | | | | | |
| | Net Assets: | |
| | Paid-in capital | | | 6,662,718 | |
| | Distributions in excess of net investment income | | | (3,208 | ) |
| | Accumulated net realized gain | | | 92,215 | |
| | Net unrealized gain | | | 36,941 | |
| | | NET ASSETS | | $ | 6,788,666 | |
| | | Net Assets: | | | | |
| | | Class A | | $ | 139,213 | |
| | | Class C | | | 10,287 | |
| | | Institutional | | | 6,596,917 | |
| | | Class IR | | | 31,945 | |
| | | Class R | | | 10,304 | |
| | | Total Net Assets | | $ | 6,788,666 | |
| | | Shares Outstanding $0.001 par value (unlimited shares authorized): | | | | |
| | | Class A | | | 13,653 | |
| | | Class C | | | 1,021 | |
| | | Institutional | | | 643,812 | |
| | | Class IR | | | 3,123 | |
| | | Class R | | | 1,015 | |
| | | Net asset value, offering and redemption price per share:(b) | | | | |
| | | Class A | | | $10.20 | |
| | | Class C | | | 10.08 | |
| | | Institutional | | | 10.25 | |
| | | Class IR | | | 10.23 | |
| | | Class R | | | 10.16 | |
| | (a) | | Represents initial margin on swaps transactions. |
| | (b) | | Maximum public offering price per share for Class A Shares is $10.60. At redemption, Class C shares may be subject to a contingent deferred sales charge, assessed on the amount equal to the lesser of the current net asset value or the original purchase price of the shares. |
| | |
| The accompanying notes are an integral part of these financial statements. | | 13 |
GOLDMAN SACHS RETIREMENT PORTFOLIO COMPLETION FUND
Statement of Operations
For the Six Months Ended April 30, 2014 (Unaudited)
| | | | | | |
| | | | | | |
| | Investment income: | |
| | Dividends (net of foreign withholding taxes of $586) | | $ | 9,169 | |
| | Interest | | | 5,820 | |
| | Total investment income | | | 14,989 | |
| | | | | | |
| | Expenses: | |
| | Printing and mailing costs | | | 50,542 | |
| | Professional fees | | | 46,254 | |
| | Custody, accounting and administrative services | | | 36,211 | |
| | Management fees | | | 13,436 | |
| | Trustee fees | | | 11,686 | |
| | Registration fees | | | 11,067 | |
| | Transfer Agent fees(a) | | | 1,320 | |
| | Distribution and Service fees(a) | | | 223 | |
| | Other | | | 4,533 | |
| | Total expenses | | | 175,272 | |
| | Less — expense reductions | | | (163,294 | ) |
| | Net expenses | | | 11,978 | |
| | NET INVESTMENT INCOME | | | 3,011 | |
| | | | | | |
| | Realized and unrealized gain (loss): | |
| | Capital gain distributions from Affiliated Underlying Funds | | | 62,275 | |
| | Net realized gain (loss) from: | | | | |
| | Investments — unaffiliated issuers | | | (2,945 | ) |
| | Investments — affiliated issuers | | | (2,388 | ) |
| | Swap contracts | | | 38,793 | |
| | Net change in unrealized gain on: | | | | |
| | Investments — unaffiliated issuers | | | 65,805 | |
| | Investments — affiliated issuers | | | (42,107 | ) |
| | Swap contracts | | | 7,692 | |
| | Net realized and unrealized gain | | | 127,125 | |
| | NET INCREASE IN NET ASSETS RESULTING FROM OPERATIONS | | $ | 130,136 | |
| | (a) | | Class specific Distribution and Service and Transfer Agent fees were as follows: |
| | | | | | | | | | | | | | | | | | | | | | | | | | | | | | |
Distribution and Service Fees | | | Transfer Agent Fees | |
Class A | | | Class C | | | Class R | | | Class A | | | Class C | | | Institutional | | | Class IR | | | Class R | |
| | 147 | | | | 50 | | | | 26 | | | | 112 | | | | 9 | | | | 1,161 | | | | 29 | | | | 9 | |
| | |
| 14 | | The accompanying notes are an integral part of these financial statements. |
GOLDMAN SACHS RETIREMENT PORTFOLIO COMPLETION FUND
Statements of Changes in Net Assets
| | | | | | | | | | |
| | | | | For the
Six Months Ended
April 30, 2014
(Unaudited) | | | For the
Fiscal Year Ended
October 31, 2013 | |
| | From operations: | |
| | Net investment income | | $ | 3,011 | | | $ | 5,460 | |
| | Net realized gain and capital gain distributions | | | 95,735 | | | | 68,492 | |
| | Net change in unrealized gain | | | 31,390 | | | | 17,468 | |
| | Net increase in net assets resulting from operations | | | 130,136 | | | | 91,420 | |
| | | | | | | | | | |
| | Distributions to shareholders: | |
| | From net investment income | | | | | | | | |
| | Institutional Shares | | | (507 | ) | | | (3,954 | ) |
| | Class IR Shares | | | — | | | | (10 | ) |
| | From net realized gains | | | | | | | | |
| | Class A Shares | | | (1,583 | ) | | | — | |
| | Class C Shares | | | (144 | ) | | | — | |
| | Institutional Shares | | | (77,239 | ) | | | — | |
| | Class IR Shares | | | (439 | ) | | | — | |
| | Class R Shares | | | (144 | ) | | | — | |
| | Total distributions to shareholders | | | (80,056 | ) | | | (3,964 | ) |
| | | | | | | | | | |
| | From share transactions: | |
| | Proceeds from sales of shares | | | 2,912,479 | | | | 1,068,619 | |
| | Reinvestment of distributions | | | 80,056 | | | | 3,964 | |
| | Cost of shares redeemed | | | (322,062 | ) | | | (79,242 | ) |
| | Net increase in net assets resulting from share transactions | | | 2,670,473 | | | | 993,341 | |
| | TOTAL INCREASE | | | 2,720,553 | | | | 1,080,797 | |
| | | | | | | | | | |
| | Net assets: | |
| | Beginning of period | | | 4,068,113 | | | | 2,987,316 | |
| | End of period | | $ | 6,788,666 | | | $ | 4,068,113 | |
| | Distributions in excess of net investment income | | $ | (3,208 | ) | | $ | (5,712 | ) |
| | |
| The accompanying notes are an integral part of these financial statements. | | 15 |
GOLDMAN SACHS RETIREMENT COMPLETION PORTFOLIO
Financial Highlights
Selected Data for a Share Outstanding Throughout Each Period
| | | | | | | | | | | | | | | | | | | | | | | | | | | | | | |
| | | | | | | | Income (loss) from
investment operations | | | Distributions
to shareholders | |
| | | Year - Share Class | | Net asset
value,
beginning
of period | | | Net
investment
income (loss)(a) | | | Net realized
and unrealized
gain (loss) | | | Total from
investment
operations | | | From net
investment
income | | | From net
realized
gains | | | Total
distributions | |
| | FOR THE SIX MONTHS ENDED APRIL 30, (UNAUDITED) | |
| | 2014 - A | | $ | 10.18 | | | $ | (0.01 | ) | | $ | 0.17 | | | $ | 0.16 | | | $ | — | | | $ | (0.14 | ) | | $ | (0.14 | ) |
| | 2014 - C | | | 10.10 | | | | (0.05 | ) | | | 0.17 | | | | 0.12 | | | | — | | | | (0.14 | ) | | | (0.14 | ) |
| | 2014 - Institutional | | | 10.21 | | | | 0.01 | | | | 0.17 | | | | 0.18 | | | | — | (f) | | | (0.14 | ) | | | (0.14 | ) |
| | 2014 - IR | | | 10.20 | | | | — | (f) | | | 0.17 | | | | 0.17 | | | | — | | | | (0.14 | ) | | | (0.14 | ) |
| | 2014 - R | | | 10.16 | | | | (0.03 | ) | | | 0.17 | | | | 0.14 | | | | — | | | | (0.14 | ) | | | (0.14 | ) |
| | | | | | | | | | | | | | | | | | | | | | | | | | | | | | |
| | FOR THE FISCAL YEARS ENDED OCTOBER 31, | |
| | 2013 - A | | | 9.95 | | | | (0.02 | ) | | | 0.25 | | | | 0.23 | | | | — | | | | — | | | | — | |
| | 2013 - C | | | 9.95 | | | | (0.10 | ) | | | 0.25 | | | | 0.15 | | | | — | | | | — | | | | — | |
| | 2013 - Institutional | | | 9.96 | | | | 0.02 | | | | 0.24 | | | | 0.26 | | | | (0.01 | ) | | | — | | | | (0.01 | ) |
| | 2013 - IR | | | 9.96 | | | | — | (f) | | | 0.25 | | | | 0.25 | | | | (0.01 | ) | | | — | | | | (0.01 | ) |
| | 2013 - R | | | 9.95 | | | | (0.05 | ) | | | 0.26 | | | | 0.21 | | | | — | | | | — | | | | — | |
| | | | | | | | | | | | | | | | | | | | | | | | | | | | | | |
| | FOR THE PERIOED ENDED OCTOBER 31, | |
| | 2012 - A (Commenced September 28, 2012) | | | 10.00 | | | | — | (f) | | | (0.05 | ) | | | (0.05 | ) | | | — | | | | — | | | | — | |
| | 2012 - C (Commenced September 28, 2012) | | | 10.00 | | | | — | (f) | | | (0.05 | ) | | | (0.05 | ) | | | — | | | | — | | | | — | |
| | 2012 - Institutional (Commenced September 28, 2012) | | | 10.00 | | | | 0.01 | | | | (0.05 | ) | | | (0.04 | ) | | | — | | | | — | | | | — | |
| | 2012 - IR (Commenced September 28, 2012) | | | 10.00 | | | | 0.01 | | | | (0.05 | ) | | | (0.04 | ) | | | — | | | | — | | | | — | |
| | 2012 - R (Commenced September 28, 2012) | | | 10.00 | | | | — | (f) | | | (0.05 | ) | | | (0.05 | ) | | | — | | | | — | | | | — | |
| | (a) | | Calculated based on the average shares outstanding methodology. |
| | (b) | | Assumes investment at the net asset value at the beginning of the period, reinvestment of all dividends and distributions, a complete redemption of the investment at the net asset value at the end of the period and no sales or redemption charges. Total returns would be reduced if a sales or redemption charge was taken into account. Returns do not reflect the deduction of taxes that a shareholder would pay on Fund distributions or the redemption of Fund shares. Total returns for periods less than one full year are not annualized. |
| | (c) | | Expense ratios exclude the expenses of the Underlying Funds in which the Portfolio invests. |
| | (d) | | The Fund’s portfolio turnover rate is calculated in accordance with regulatory requirements, without regard to transactions involving short term investments and certain derivatives. If such transactions were included, the Fund’s portfolio turnover rate may be higher. |
| | (f) | | Amount is less than $0.005 per share. |
| | |
| 16 | | The accompanying notes are an integral part of these financial statements. |
GOLDMAN SACHS RETIREMENT COMPLETION PORTFOLIO
| | | | | | | | | | | | | | | | | | | | | | | | | | | | | | | | | | | | | | | | |
| | | | | | | | | | | | | | | | | | | | | | | | | | | | | | | | | | |
| | | Net asset
value, end
of period | | | | | Total
return(b) | | | | | Net assets,
end of
period
(in 000s) | | | | | Ratio of
net expenses
to average
net assets(c) | | | | | Ratio of
total expenses
to average
net assets(c) | | | | | Ratio of
net investment
income (loss)
to average
net assets | | | | | Portfolio
turnover
rate(d) | |
| | | | | | | | | | | | | | | | | | | | | | | | | | | | | | | | | | | | | | | | |
| | $ | 10.20 | | | | | | 1.65 | % | | | | $ | 139 | | | | | | 0.79 | %(e) | | | | | 6.28 | %(e) | | | | | (0.26 | )%(e) | | | | | 7 | % |
| | | 10.08 | | | | | | 1.26 | | | | | | 10 | | | | | | 1.53 | (e) | | | | | 7.13 | (e) | | | | | (1.05 | )(e) | | | | | 7 | |
| | | 10.25 | | | | | | 1.75 | | | | | | 6,597 | | | | | | 0.39 | (e) | | | | | 5.86 | (e) | | | | | 0.11 | (e) | | | | | 7 | |
| | | 10.23 | | | | | | 1.74 | | | | | | 32 | | | | | | 0.54 | (e) | | | | | 6.13 | (e) | | | | | (0.07 | )(e) | | | | | 7 | |
| | | 10.16 | | | | | | 1.45 | | | | | | 10 | | | | | | 1.03 | (e) | | | | | 6.63 | (e) | | | | | (0.55 | )(e) | | | | | 7 | |
| | | | | | | | | | | | | | | | | | | | | | | | | | | | | | | | | | | | | | | | |
| | | | | | | | | | | | | | | | | | | | | | | | | | | | | | | | | | | | | | | | |
| | | 10.18 | | | | | | 2.35 | | | | | | 100 | | | | | | 0.75 | | | | | | 24.14 | | | | | | (0.20 | ) | | | | | 16 | |
| | | 10.10 | | | | | | 1.51 | | | | | | 10 | | | | | | 1.49 | | | | | | 22.53 | | | | | | (0.96 | ) | | | | | 16 | |
| | | 10.21 | | | | | | 2.75 | | | | | | 3,917 | | | | | | 0.35 | | | | | | 21.63 | | | | | | 0.17 | | | | | | 16 | |
| | | 10.20 | | | | | | 2.51 | | | | | | 31 | | | | | | 0.49 | | | | | | 23.98 | | | | | | 0.01 | | | | | | 16 | |
| | | 10.16 | | | | | | 2.11 | | | | | | 10 | | | | | | 1.00 | | | | | | 22.05 | | | | | | (0.47 | ) | | | | | 16 | |
| | | | | | | | | | | | | | | | | | | | | | | | | | | | | | | | | | | | | | | | |
| | | | | | | | | | | | | | | | | | | | | | | | | | | | | | | | | | | | | | | | |
| | | 9.95 | | | | | | (0.50 | ) | | | | | 10 | | | | | | 0.73 | (e) | | | | | 22.73 | (e) | | | | | 0.37 | (e) | | | | | 1 | |
| | | 9.95 | | | | | | (0.50 | ) | | | | | 10 | | | | | | 1.47 | (e) | | | | | 23.46 | (e) | | | | | (0.37 | )(e) | | | | | 1 | |
| | | 9.96 | | | | | | (0.40 | ) | | | | | 2,948 | | | | | | 0.34 | (e) | | | | | 22.33 | (e) | | | | | 0.77 | (e) | | | | | 1 | |
| | | 9.96 | | | | | | (0.40 | ) | | | | | 10 | | | | | | 0.52 | (e) | | | | | 22.49 | (e) | | | | | 0.60 | (e) | | | | | 1 | |
| | | 9.95 | | | | | | (0.50 | ) | | | | | 10 | | | | | | 0.99 | (e) | | | | | 22.98 | (e) | | | | | 0.12 | (e) | | | | | 1 | |
| | |
| The accompanying notes are an integral part of these financial statements. | | 17 |
GOLDMAN SACHS RETIREMENT PORTFOLIO COMPLETION FUND
Notes to Financial Statements
April 30, 2014 (Unaudited)
Goldman Sachs Trust (the “Trust”) is a Delaware statutory trust registered under the Investment Company Act of 1940, as amended (the “Act”), as an open-end management investment company. Goldman Sachs Retirement Portfolio Completion Fund (the “Fund”) is a non-diversified fund and currently offers five classes of shares: Class A, Class C, Institutional, Class IR and Class R.
Class A shares are sold with a front-end sales charge of up to 3.75%. Class C Shares are sold with a contingent deferred sales charge (“CDSC”) of 1.00% which is imposed on redemptions made within 12 months of purchase.
Goldman Sachs Asset Management, L.P. (“GSAM”), an affiliate of Goldman, Sachs & Co. (“Goldman Sachs”), serves as investment adviser to the Fund pursuant to a management agreement (the “Agreement”) with the Trust.
|
| 2. SIGNIFICANT ACCOUNTING POLICIES |
The financial statements have been prepared in accordance with accounting principles generally accepted in the United States of America (“GAAP”) and require management to make estimates and assumptions that may affect the reported amounts and disclosures. Actual results may differ from those estimates and assumptions.
A. Investment Valuation — The Fund’s valuation policy is to value investments at fair value.
B. Investment Income and Investments — Investment income includes interest income and dividend income, net of any foreign withholding taxes, less any amounts reclaimable. Interest income is accrued daily and adjusted for amortization of premiums and accretion of discounts. Dividend income is recognized on ex-dividend date or, for certain foreign securities, as soon as such information is obtained subsequent to the ex-dividend date. Investment transactions are reflected on trade date. Realized gains and losses are calculated using identified cost. Investment transactions are recorded on the following business day for daily net asset value (“NAV”) calculations. Any foreign capital gains tax is accrued daily based upon net unrealized gains, and is payable upon sale of such investments. Distributions received from the Fund’s investments in United States (“U.S.”) real estate investment trusts (“REITs”) may be characterized as ordinary income, net capital gain or a return of capital. A return of capital is recorded by the Fund as a reduction to the cost basis of the REIT.
For derivative contracts, realized gains and losses are recorded upon settlement of the contract. Upfront payments are made or received upon entering into a swap agreement and are reflected in the Statement of Assets and Liabilities. Upfront payments are recognized over the contract’s term/event as realized gains or losses, with the exception of forward starting interest rate swaps whose realized gains or losses are recognized from the effective start date. For securities with paydown provisions, principal payments received are treated as a proportionate reduction to the cost basis of the securities, and excess or shortfall amounts are recorded as gains or losses. For treasury inflation protected securities (“TIPS”), adjustments to principal due to inflation/deflation are reflected as increases/decreases to interest income with a corresponding adjustment to cost.
C. Class Allocations and Expenses — Investment income, realized and unrealized gain (loss), and non-class specific expenses of the Fund are allocated daily based upon the proportion of net assets of each class. Class specific expenses, where applicable, are borne by the respective share classes and include Distribution and Service, Transfer Agent and Service and Shareholder Administration fees. Non-class specific expenses directly incurred by the Fund are charged to the Fund, while such expenses incurred by the Trust are allocated across the Fund on a straight-line and/or pro-rata basis depending upon the nature of the expenses.
18
GOLDMAN SACHS RETIREMENT PORTFOLIO COMPLETION FUND
|
| 2. SIGNIFICANT ACCOUNTING POLICIES (continued) |
D. Federal Taxes and Distributions to Shareholders — It is the Fund’s policy to comply with the requirements of the Internal Revenue Code of 1986, as amended (the “Code”), applicable to regulated investment companies (mutual funds) and to distribute each year substantially all of its investment company taxable income and capital gains to its shareholders. Accordingly, the Fund is not required to make any provisions for the payment of federal income tax. Distributions to shareholders are recorded on the ex-dividend date. Income and capital gains distributions, if any, are declared and paid annually.
Net capital losses are carried forward to future fiscal years and may be used to the extent allowed by the Code to offset any future capital gains. Losses that are carried forward will retain their character as either short-term or long-term capital losses. Utilization of capital loss carryforwards will reduce the requirement of future capital gains distributions.
The characterization of distributions to shareholders for financial reporting purposes is determined in accordance with federal income tax rules, which may differ from GAAP. The source of the Fund’s distributions may be shown in the accompanying financial statements as either from net investment income, net realized gain or capital. Certain components of the Fund’s net assets on the Statement of Assets and Liabilities reflect permanent GAAP/tax differences based on the appropriate tax character.
E. Foreign Currency Translation — The accounting records and reporting currency of the Fund is maintained in U.S. dollars. Assets and liabilities denominated in foreign currencies are translated into U.S. dollars using the current exchange rates at the close of each business day. The effect of changes in foreign currency exchange rates on investments is included within net realized and unrealized gain (loss) on investments. Changes in the value of other assets and liabilities as a result of fluctuations in foreign exchange rates are included in the Statements of Operations within net change in unrealized gain (loss) on foreign currency transactions. Transactions denominated in foreign currencies are translated into U.S. dollars on the date the transaction occurred, the effects of which are included within net realized gain (loss) on foreign currency transactions.
| | |
| 3. INVESTMENTS AND FAIR VALUE MEASUREMENTS | | |
The fair value of a financial instrument is the amount that would be received to sell an asset or paid to transfer a liability in an orderly transaction between market participants at the measurement date (i.e., the exit price). GAAP establishes a fair value hierarchy that prioritizes the inputs to valuation techniques used to measure fair value. The hierarchy gives the highest priority to unadjusted quoted prices in active markets for identical assets or liabilities (Level 1 measurements) and the lowest priority to unobservable inputs (Level 3 measurements). The levels used for classifying investments are not necessarily an indication of the risk associated with investing in these investments. The three levels of the fair value hierarchy are described below:
Level 1 — Unadjusted quoted prices in active markets that are accessible at the measurement date for identical, unrestricted assets or liabilities;
Level 2 — Quoted prices in markets that are not active or financial instruments for which significant inputs are observable (including, but not limited to, quoted prices for similar investments, interest rates, foreign exchange rates, volatility and credit spreads), either directly or indirectly;
Level 3 — Prices or valuations that require significant unobservable inputs (including GSAM’s assumptions in determining fair value measurement).
19
GOLDMAN SACHS RETIREMENT PORTFOLIO COMPLETION FUND
Notes to Financial Statements (continued)
April 30, 2014 (Unaudited)
|
| 3. INVESTMENTS AND FAIR VALUE MEASUREMENTS (continued) |
The Trustees have adopted Valuation Procedures that govern the valuation of the portfolio investments held by the Fund, including investments for which market quotations are not readily available. The Trustees have delegated to GSAM day-to-day responsibility for implementing and maintaining internal controls and procedures related to the valuation of the Fund’s portfolio investments. To assess the continuing appropriateness of pricing sources and methodologies, GSAM regularly performs price verification procedures and issues challenges as necessary to third party pricing vendors or brokers, and any differences are reviewed in accordance with the Valuation Procedures.
A. Level 1 and Level 2 Fair Value Investments — The valuation techniques and significant inputs used in determining the fair values for investments classified as Level 1 and Level 2 are as follows:
Equity Securities — Equity securities and investment companies traded on a U.S. securities exchange or the NASDAQ system, or those located on certain foreign exchanges, including but not limited to the Americas, are valued daily at their last sale price or official closing price on the principal exchange or system on which they are traded. If no sale occurs, equity securities and exchange traded investment companies are valued at the last bid price for long positions and at the last ask price for short positions. Investments in investment companies (other than those that are exchange traded) are valued at the NAV on the valuation date. To the extent these investments are actively traded, they are classified as Level 1 of the fair value hierarchy, otherwise they are generally classified as Level 2.
Unlisted equity securities for which market quotations are available are valued at the last sale price on the valuation date, or if no sale occurs, at the last bid price. Securities traded on certain foreign securities exchanges are valued daily at fair value determined by an independent fair value service (if available) under Valuation Procedures approved by the Trustees and consistent with applicable regulatory guidance. The independent fair value service takes into account multiple factors including, but not limited to, movements in the securities markets, certain depositary receipts, futures contracts and foreign currency exchange rates that have occurred subsequent to the close of the foreign securities exchange. These investments are generally classified as Level 2 of the fair value hierarchy.
Debt Securities — Debt securities for which market quotations are readily available are valued daily on the basis of quotations supplied by dealers or an independent pricing service approved by the Trustees. The pricing services may use valuation models or matrix pricing, which consider: (i) yield or price with respect to bonds that are considered comparable in characteristics such as rating, interest rate and maturity date or (ii) quotations from securities dealers to determine current value. Short-term debt obligations that mature in sixty days or less and that do not exhibit signs of credit deterioration are valued at amortized cost, which approximates fair value. With the exception of treasury securities of G8 countries (not held in money market funds), which are generally classified as Level 1, these investments are generally classified as Level 2 of the fair value hierarchy.
i. Treasury Inflation Protected Securities — TIPS are treasury securities in which the principal amount is adjusted daily to keep pace with inflation, as measured by the U.S. Consumer Pricing Index for Urban Consumers. The repayment of the original bond principal upon maturity is guaranteed by the full faith and credit of the U.S. Government.
20
GOLDMAN SACHS RETIREMENT PORTFOLIO COMPLETION FUND
|
| 3. INVESTMENTS AND FAIR VALUE MEASUREMENTS (continued) |
Derivative Contracts — A derivative is an instrument whose value is derived from underlying assets, indices, reference rates or a combination of these factors.
Exchange-traded derivatives, including futures contracts, typically fall within Level 1 of the fair value hierarchy. Over-the-counter (“OTC”) and centrally cleared derivatives are valued using market transactions and other market evidence, including market-based inputs to models, calibration to market-clearing transactions, broker or dealer quotations, or other alternative pricing sources. Where models are used, the selection of a particular model to value OTC and centrally cleared derivatives depends upon the contractual terms of, and specific risks inherent in, the instrument, as well as the availability of pricing information in the market. Valuation models require a variety of inputs, including contractual terms, market prices, yield curves, credit curves, measures of volatility, voluntary and involuntary prepayment rates, loss severity rates and correlations of such inputs. For OTC and centrally cleared derivatives that trade in liquid markets, model inputs can generally be verified and model selection does not involve significant management judgment. OTC and centrally cleared derivatives are classified within Level 2 of the fair value hierarchy when significant inputs are corroborated by market evidence.
i. Swap Contracts — Bilateral swap contracts are agreements in which a Fund and a counterparty agree to exchange periodic payments on a specified notional amount or make a net payment upon termination. Bilateral swap transactions are privately negotiated in the OTC market and payments are settled through direct payments between a Fund and the counterparty. By contrast, certain swap transactions are subject to mandatory central clearing. These swaps are executed through a derivatives clearing member (“DCM”), acting in an agency capacity, and submitted to a central counterparty (“CCP”) (“centrally cleared swaps”), in which case all payments are settled with the CCP through the DCM. Swaps are marked-to-market daily using pricing vendor quotations, counterparty or clearinghouse prices or model prices, and the change in value, if any, is recorded as an unrealized gain or loss. Upon entering into a swap contract, a Fund is required to satisfy an initial margin requirement by delivering cash or securities to the counterparty (or in some cases, segregated in a triparty account on behalf of the counterparty), which can be adjusted by any mark-to-market gains or losses pursuant to bilateral or centrally cleared arrangements. For centrally cleared swaps the daily change in valuation, if any, is recorded as a receivable or payable for variation margin.
A credit default swap is an agreement that involves one party (the buyer of protection) making a stream of payments to another party (the seller of protection) in exchange for the right to receive protection on a reference security or obligation, including a group of assets or exposure to the performance of an index. A Fund’s investment in credit default swaps may involve greater risks than if the Fund had invested in the referenced obligation directly. Credit events are contract specific but may include bankruptcy, failure to pay, restructuring and obligation acceleration. If a Fund buys protection through a credit default swap and no credit event occurs, its payments are limited to the periodic payments previously made to the counterparty. Upon the occurrence of a specified credit event, a Fund, as a buyer of credit protection, is entitled to receive an amount equal to the notional amount of the swap and deliver to the seller the defaulted reference obligation in a physically settled trade. A Fund may also receive a net settlement amount in the form of cash or securities equal to the notional amount of the swap reduced by the recovery value of the reference obligation in cash settled trade.
21
GOLDMAN SACHS RETIREMENT PORTFOLIO COMPLETION FUND
Notes to Financial Statements (continued)
April 30, 2014 (Unaudited)
|
| 3. INVESTMENTS AND FAIR VALUE MEASUREMENTS (continued) |
As a seller of protection, a Fund generally receives a payment stream throughout the term of the swap, provided that there is no credit event. In addition, if a Fund sells protection through a credit default swap, a Fund could suffer a loss because the value of the referenced obligation and the premium payments received may be less than the notional amount of the swap paid to the buyer of protection. Upon the occurrence of a specified credit event, a Fund, as a seller of credit protection, may be required to take possession of the defaulted reference obligation and pay the buyer an amount equal to the notional amount of the swap in a physically settled trade. A Fund may also pay a net settlement amount in the form of cash or securities equal to the notional amount of the swap reduced by the recovery value of the reference obligation in cash settled trade. Recovery values are at times established through the credit event auction process in which market participants are ensured that a transparent price has been set for the defaulted security or obligation. In addition, a Fund is entitled to a return of any assets, which have been pledged as collateral to the counterparty.
The maximum potential amount of future payments (undiscounted) that a Fund as seller of protection could be required to make under a credit default swap would be an amount equal to the notional amount of the agreement. These potential amounts would be partially offset by any recovery values of the respective referenced obligations or net amounts received from a settlement of a credit default swap for the same reference security or obligation where a Fund bought credit protection.
A total return swap is an agreement that gives a Fund the right to receive the appreciation in the value of a specified security, index or other instrument in return for a fee paid to the counterparty, which will typically be an agreed upon interest rate. If the underlying asset declines in value over the term of the swap, a Fund may also be required to pay the dollar value of that decline to the counterparty.
Short Term Investments — Short-term investments having a maturity of 60 days or less are generally valued at amortized cost which approximates fair market value. These investments are classified as Level 2 of the fair value hierarchy.
Repurchase Agreements — Repurchase agreements involve the purchase of securities subject to the seller’s agreement to repurchase the securities at a mutually agreed upon date and price, under the terms of a Master Repurchase Agreement (“MRA”). During the term of a repurchase agreement, the value of the underlying securities held as collateral on behalf of a Fund, including accrued interest is required to exceed the value of the repurchase agreement, including accrued interest. The underlying securities for all repurchase agreements are held at the Fund’s custodian or designated sub-custodians under tri-party repurchase agreements.
In December 2011, the Financial Accounting Standards Board (“FASB”) issued an Accounting Standards Update (“ASU”) No. 2011-11: Disclosures about Offsetting Assets and Liabilities (“netting”) on the Statements of Assets and Liabilities that are subject to master netting arrangements or similar agreements. ASU 2011-11 was amended by ASU No. 2013-01, clarifying which investments and transactions are subject to the netting disclosure. The scope of the disclosure requirements is limited to derivative instruments, repurchase agreements and reverse repurchase agreements, and securities borrowing and securities lending transactions. This information is intended to enable users of the Fund’s financial statements to evaluate the effect or potential effect of netting arrangements on the Fund’s financial position. The Fund adopted the disclosure requirement of netting for the current reporting period. Since these amended principles only require additional disclosures concerning offsetting and related arrangements, adoption did not affect the Fund’s financial condition or result of operations.
22
GOLDMAN SACHS RETIREMENT PORTFOLIO COMPLETION FUND
|
| 3. INVESTMENTS AND FAIR VALUE MEASUREMENTS (continued) |
For financial reporting purposes, the Fund does not offset financial assets and financial liabilities that are subject to master netting arrangements or similar agreements on the Statement of Assets and Liabilities.
A MRA governs transactions between a Fund and select counterparties. A MRA contains provisions for, among other things, initiation, income payments, events of default and maintenance of securities for repurchase agreements. A MRA also permits offsetting with collateral to create one single net payment in the event of default or similar events, including the bankruptcy or insolvency of a counterparty.
If the seller defaults, a Fund could suffer a loss to the extent that the proceeds from the sale of the underlying securities and other collateral held by the Fund are less than the repurchase price and the Fund’s costs associated with delay and enforcement of the repurchase agreement. In addition, in the event of default or insolvency of the seller, a court could determine that a Fund’s interest in the collateral is not enforceable, resulting in additional losses to the Fund.
At April 30, 2014, the Fund’s investment in a repurchase agreement was subject to enforceable MRAs. The repurchase agreement on a net basis was as follows:
| | | | |
| Repurchase Agreements | | | |
Total gross amount presented in Statements of Assets and Liabilities | | $ | 600,000 | |
Non-cash Collateral offsetting(1) | | | (600,000 | ) |
Net Amount(2) | | $ | — | |
| (1) | | At April 30, 2014, the value of the collateral received from each seller exceeded the value of the related repurchase agreements. |
| (2) | | Net amount represents the net amount due from the counterparty in the event of a default based on the contractual set-off rights under the agreement. |
Pursuant to exemptive relief granted by the Securities and Exchange Commission (“SEC”) and terms and conditions contained therein, the Fund, together with other funds of the Trust and registered investment companies having management agreements with GSAM or its affiliates, may transfer uninvested cash into joint accounts, the daily aggregate balance of which is invested in one or more repurchase agreements. Under these joint accounts, the Fund maintains pro-rata credit exposure to the underlying repurchase agreements’ counterparties. With the exception of certain transaction fees, the Fund is not subject to any expenses in relation to these investments.
B. Level 3 Fair Value Investments — To the extent that the aforementioned significant inputs are unobservable, or if quotations are not readily available, or if GSAM believes that such quotations do not accurately reflect fair value, the fair value of the Fund’s investments may be determined under Valuation Procedures approved by the Trustees. GSAM, consistent with its procedures and applicable regulatory guidance, may make an adjustment to the most recent valuation prices of either domestic or foreign securities in light of significant events to reflect what it believes to be the fair value of the securities at the time of determining a Fund’s NAV. Significant events which could affect a large number of securities in a particular market may include, but are not limited to: significant fluctuations in U.S. or foreign markets; market dislocations; market disruptions; or unscheduled market closings. Significant events which could also affect a single issuer may include, but are not limited to: corporate actions such as reorganizations, mergers and buy-outs; ratings downgrades; and bankruptcies.
23
GOLDMAN SACHS RETIREMENT PORTFOLIO COMPLETION FUND
Notes to Financial Statements (continued)
April 30, 2014 (Unaudited)
|
| 3. INVESTMENTS AND FAIR VALUE MEASUREMENTS (continued) |
C. Fair Value Hierarchy — The following is a summary of the Fund’s investments and derivatives classified in the fair value hierarchy as of April 30, 2014:
| | | | | | | | | | | | |
| | |
| RETIREMENT PORTFOLIO COMPLETION | | | | | | | | | |
| | | |
| Investment Type | | Level 1 | | | Level 2 | | | Level 3 | |
| Assets | | | | | | | | | |
Common Stock and/or Other Equity Investments | | | | | | | | | | | | |
North and South America | | $ | 1,358,615 | | | $ | — | | | $ | — | |
Other | | | 4,939 | | | | 184,014 | (a) | | | — | |
Fixed Income | | | | | | | | | | | | |
U.S. Treasury Obligations | | | 2,995,441 | | | | — | | | | — | |
Investment Company | | | 1,356,653 | | | | — | | | | — | |
Short-term Investments | | | — | | | | 600,000 | | | | — | |
| Total | | $ | 5,715,648 | | | $ | 784,014 | | | $ | — | |
| | | |
| Derivative Type | | | | | | | | | |
| Assets(b) | | | | | | | | | | | | |
Credit Default Swap Contracts | | $ | — | | | $ | 34,200 | | | $ | — | |
Total Return Swap Contracts | | | — | | | | 422 | | | | — | |
| Total | | $ | — | | | $ | 34,622 | | | $ | — | |
| (a) | | To adjust for the time difference between local market close and the calculation of net asset value. The Fund utilizes fair value model prices for international equities provided by an independent fair value service resulting in a Level 2 classification. |
| (b) | | Amount shown represents unrealized gain (loss) at period end. |
For further information regarding security characteristics, see the Schedule of Investments.
| | |
| 4. INVESTMENTS IN DERIVATIVES | | |
The following table sets forth, by certain risk types, the gross value of derivative contracts as of April 30, 2014. These instruments were used to meet the Fund’s investment objectives and to obtain and/or manage exposure related to the risk below. The values in the table below exclude the effects of cash collateral received or posted pursuant to these derivative contracts, and therefore is not representative of the Fund’s net exposure.
| | | | | | |
| Risk | | Statement of Assets and Liabilities | | Assets | |
Credit | | Variation margin on certain derivative contracts(a) | | $ | 34,200 | |
Equity | | Receivable for unrealized gain on swap contracts | | | 422 | |
| (a) | | Includes unrealized gain (loss) on swap contracts described in the Additional Investment Information sections of the Schedule of Investments. Only current day’s variation margin is reported within the Statement of Assets and Liabilities. |
24
GOLDMAN SACHS RETIREMENT PORTFOLIO COMPLETION FUND
|
| 4. INVESTMENTS IN DERIVATIVES (continued) |
The following table sets forth, by certain risk types, the Fund’s gains (losses) related to these derivatives and their indicative volumes for the six months ended April 30, 2014. These gains (losses) should be considered in the context that these derivative contracts may have been executed to create investment opportunities and/or economically hedge certain investments, and accordingly, certain gains (losses) on such derivative contracts may offset certain (losses) gains attributable to investments. These gains (losses) are included in “Net realized gain (loss)” or “Net change in unrealized gain (loss)” on the Statement of Operations:
| | | | | | | | | | | | | | |
| Risk | | Statements of Operations | | Net
Realized
Gain (Loss) | | | Net Change in
Unrealized
Gain (Loss) | | | Average
Number of
Contracts(a) | |
| Credit | | Net realized gain (loss) from swap contracts/Net change in unrealized gain (loss) on swap contracts | | $ | 37,216 | | | $ | 14,231 | | | | 2 | |
| Equity | | Net realized gain (loss) from swap contracts/Net change in unrealized gain (loss) on swap contracts | | | 1,577 | | | | (6,539 | ) | | | 1 | |
| Total | | | | $ | 38,793 | | | $ | 7,692 | | | | 3 | |
| (a) | | Average number of contracts is based on the average of month end balances for the period ended April 30, 2014. |
In order to better define its contractual rights and to secure rights that will help a Fund mitigate its counterparty risk, a Fund may enter into an International Swaps and Derivatives Association, Inc. Master Agreement (“ISDA Master Agreement”) or similar agreement with its derivatives counterparties. An ISDA Master Agreement is a bilateral agreement between a Fund and a counterparty that governs OTC derivatives, including foreign exchange contracts, and typically contains, among other things, collateral posting terms and netting provisions in the event of a default and/or termination event. The provisions of the ISDA Master Agreement typically permit a single net payment in the event of a default (close-out netting) or similar event, including the bankruptcy or insolvency of the counterparty.
Collateral and margin requirements differ between exchange traded derivatives and OTC derivatives. Margin requirements are established by the broker or clearing house for exchange-traded and centrally cleared derivatives (financial futures contracts, options and centrally cleared swaps) pursuant to governing agreements for those instrument types. Brokers can ask for margin in excess of the minimum in certain circumstances. Collateral terms are contract-specific for OTC derivatives (foreign currency exchange contracts, and certain options and swaps). For derivatives traded under an ISDA Master Agreement, the collateral requirements are typically calculated by netting the marked to market amount for each transaction under such agreement and comparing that amount to the value of any collateral currently pledged by a Fund and the counterparty. Additionally, a Fund may be required to post initial margin to the counterparty, the terms of which would be outlined in the confirmation of the OTC transaction.
25
GOLDMAN SACHS RETIREMENT PORTFOLIO COMPLETION FUND
Notes to Financial Statements (continued)
April 30, 2014 (Unaudited)
|
| 4. INVESTMENTS IN DERIVATIVES (continued) |
For financial reporting purposes, cash collateral that has been pledged to cover obligations of a Fund and cash collateral received from the counterparty, if any, is reported separately on the Statements of Assets and Liabilities as receivables/payables for collateral on certain derivative contracts. Non-cash collateral pledged by a Fund, if any, is noted in the Schedules of Investments. Generally, the amount of collateral due from or to a counterparty must exceed a minimum transfer amount threshold before a transfer is required to be made. To the extent amounts due to a Fund from its counterparties are not fully collateralized, contractually or otherwise, the Fund bears the risk of loss from counterparty nonperformance. A Fund attempts to mitigate counterparty risk by only entering into agreements with counterparties that it believes to be of good standing and by monitoring the financial stability of those counterparties.
Additionally, the netting of assets and liabilities and the offsetting of collateral pledged or received are based on contractual netting/set-off provisions in the ISDA Master Agreement or similar agreements. However, in the event of a default or insolvency of a counterparty, a court could determine that such rights are not enforceable due the restrictions or prohibitions against the right of setoff that may be imposed due to a particular jurisdiction’s bankruptcy or insolvency laws.
The following tables set forth the Fund’s net exposure for derivative instruments that are subject to enforceable master netting arrangements or similar agreements as of April 30, 2014:
| | | | | | | | | | | | | | | | | | | | |
| Counterparty | | | | Swaps | | Total | | | Net Derivative
Asset
(Liabilities) | | | Collateral
(Received)
Pledged(1) | | | Net
Amount(2) | |
Bank of America | | | | | | | | | | | | | | | | | | | | |
| | | | | | |
Securities LLC | | | | $422 | | $ | 422 | | | $ | 422 | | | $ | — | | | $ | 422 | |
| (1) | | Gross amounts available for offset but not netted in the Statement of Assets and Liabilities. |
| (2) | | Net amount represents the net amount due (to) from counterparty in the event of a default based on the contractual set-off rights under the agreement. Net amount excludes any over-collateralized amounts. |
|
| 5. AGREEMENTS AND AFFILIATED TRANSACTIONS |
A. Management Agreement — Under the Agreement, GSAM manages the Fund, subject to the general supervision of the Trustees.
As compensation for the services rendered pursuant to the Agreement, the assumption of the expenses related thereto and administration of the Fund’s business affairs, including providing facilities, GSAM is entitled to a management fee, accrued daily and paid monthly, equal to an annual percentage rate of the Fund’s average daily net assets.
26
GOLDMAN SACHS RETIREMENT PORTFOLIO COMPLETION FUND
|
| 5. AGREEMENTS AND AFFILIATED TRANSACTIONS (continued) |
For the six months ended April 30, 2014, contractual and effective net management fee with GSAM was at the following rates:
| | | | | | | | | | | | | | | | | | | | | | | | | | |
| Contractual Management Fee Rate | | | | |
First $1 billion | | | Next $1 billion | | | Next $3 billion | | | Next $3 billion | | | Over $8 billion | | | Effective
Management
Fee Rate | | | Effective Net
Management
Fee Rate* | |
| | 0.45% | | | | 0.41% | | | | 0.38% | | | | 0.37% | | | | 0.36% | | | | 0.45% | | | | 0.29% | |
| * | | GSAM has agreed to waive a portion of its management fee payable by the Fund in an amount equal to any management fees it earns as an investment adviser to any of the affiliated funds in which the Fund invests through at least February 28, 2015. Prior to such date GSAM may not terminate the arrangements without the approval of the Trustees. |
B. Distribution and Service Plans — The Trust, on behalf of the Fund, has adopted Distribution and Service Plans (the “Plans”). Under the Plans, Goldman Sachs, which serves as distributor (the “Distributor”), is entitled to a fee accrued daily and paid monthly, for distribution services and personal and account maintenance services, which may then be paid by Goldman Sachs to authorized dealers, at the following annual rates calculated on a Fund’s average daily net assets of each respective share class:
| | | | | | | | | | | | |
| | | Distribution and Service Plan Rates | |
| | | Class A* | | | Class C | | | Class R* | |
Distribution Plan | | | 0.25 | % | | | 0.75 | % | | | 0.50 | % |
Service Plan | | | — | | | | 0.25 | | | | — | |
| * | | With respect to Class A and Class R Shares, the Distributor at its discretion may use compensation for distribution services paid under the Distribution Plan to compensate service organizations for personal and account maintenance services and expenses as long as such total compensation does not exceed the maximum cap on “service fees” imposed by the Financial Industry Regulatory Authority. |
C. Distribution Agreement — Goldman Sachs, as Distributor of the shares of the Fund pursuant to a Distribution Agreement, may retain a portion of the Class A front end sales charge and Class C Shares’ CDSC. During the six months ended April 30, 2014, Goldman Sachs did not retain any portion of the sales charges nor CDSC for this fund.
D. Transfer Agency Agreement — Goldman Sachs also serves as the transfer agent of the Fund for a fee pursuant to Transfer Agency Agreement. The fees charged for such transfer agency services are accrued daily and paid monthly at annual rates as follows: 0.19% of the average daily net assets of Class A, Class C, Class IR and Class R Shares and 0.04% of the average daily net assets of Institutional Shares.
27
GOLDMAN SACHS RETIREMENT PORTFOLIO COMPLETION FUND
Notes to Financial Statements (continued)
April 30, 2014 (Unaudited)
|
| 5. AGREEMENTS AND AFFILIATED TRANSACTIONS (continued) |
E. Other Expense Agreements and Affiliated Transactions — GSAM has agreed to limit certain “Other Expense” of the Fund (excluding transfer agent fees and expenses, service fees and shareholder administration fees (as applicable), taxes, interest, brokerage fees, shareholder meetings, litigation, indemnification, and other extraordinary expenses) to the extent such expenses exceed, on an annual basis, a percentage rate of the average daily net assets of the Fund. Such Other Expense reimbursements, if any, are accrued daily and paid monthly. In addition, the Fund is not obligated to reimburse GSAM for prior fiscal year expense reimbursements, if any. The Other Expense limitations as an annual percentage rate of average daily net assets for the Fund are 0.064%. These Other Expense limitations will remain in place through at least February 28, 2015, and prior to such date GSAM may not terminate the arrangements without the approval of the Trustees. In addition, the Fund has entered into certain offset arrangements with the custodian and the transfer agent, which may result in a reduction of the Fund’s expenses and are received irrespective of the application of the “Other Expense” limitations described above.
For the six months ended April 30, 2014, these expense reductions, including any fee waivers and Other Expense reimbursements, were as follows:
| | | | | | | | | | |
Management
Fee Waivers | | | Other Expense
Reimbursements | | | Total Expense
Reductions | |
| $ | 4,911 | | | $ | 158,383 | | | $ | 163,294 | |
As of April 30, 2014, the amounts owed to affiliates were as follows:
| | | | | | | | | | | | | | | | | | |
| Fund | | | | Management Fee | | | Distribution And Service Fees | | | Transfer Agent Fees | | | Total | |
Retirement Portfolio Completion | | | | $ | 1,721 | | | $ | 41 | | | $ | 246 | | | $ | 2,008 | |
F. Line of Credit Facility — As of April 30, 2014, the Fund participated in a $780,000,000 committed, unsecured revolving line of credit facility (the “facility”) together with other funds of the Trust and registered investment companies having management agreements with GSAM or its affiliates (“Other Borrowers”). Pursuant to the terms of the facility, the Fund and Other Borrowers could increase the credit amount by an additional $220,000,000, for a total of up to $1,000,000,000. This facility is to be used solely for temporary or emergency purposes, which may include the funding of redemptions. The interest rate on borrowings is based on the federal funds rate. The facility also requires a fee to be paid by the Fund based on the amount of the commitment that has not been utilized. For the six months ended April 30, 2014, the Fund did not have any borrowings under the facility. The facility was increased to $1,080,000,000 effective May 6, 2014.
G. Other Transactions with Affiliates — For the six months ended April 30, 2014, Goldman Sachs did not earn any brokerage commissions from portfolio transactions, including futures transactions executed with Goldman Sachs as Futures Commission Merchant, on behalf of the Fund.
As of April 30, 2014, the Goldman Sachs Group, Inc. (“GSG”) was the beneficial owner of 5% or more of the following outstanding shares of the Fund:
| | | | | | | | | | | | | | | | | | |
| Class A | | | Class C | | | Institutional | | | Class IR | | | Class R | |
| | 7% | | | | 99% | | | | 47% | | | | 33% | | | | 100% | |
28
GOLDMAN SACHS RETIREMENT PORTFOLIO COMPLETION FUND
|
| 5. AGREEMENTS AND AFFILIATED TRANSACTIONS (continued) |
The Fund invests in the Institutional Shares of the Goldman Sachs Absolute Return Tracker Fund. This Underlying Fund is considered to be affiliated with the Fund. The table below shows the transaction and earnings from investments in this affiliated Fund for the six months ended April 30, 2014:
| | | | | | | | | | | | | | | | | | | | | | | | | | | | |
| Underlying Fund | | Market Value
10/31/2013 | | | Purchases
at Cost | | | Proceeds
from Sales | | | Net
Realized
Gain (Loss) | | | Net
Change in
Unrealized
Gain (Loss) | | | Market
Value
04/30/2014 | | | Capital Gains
Distributions | |
| Absolute Return Tracker Fund | | $ | 791,226 | | | $ | 648,114 | | | $ | (38,192 | ) | | $ | (2,388 | ) | | $ | (42,107 | ) | | $ | 1,356,653 | | | $ | 62,275 | |
|
| 6. PORTFOLIO SECURITIES TRANSACTIONS |
The cost of purchases and proceeds from sales and maturities of long-term securities for the six months ended April 30, 2014, were $2,156,768 and $238,943, respectively. Included in these amounts are the cost of purchases and proceeds from sales and maturities of U.S. Government and agency obligations in the amount of $612,755 and $40,829, respectively.
As of the Fund’s most recent fiscal year end, October 31, 2013, the Fund had timing differences (Qualified Late Year Loss Deferral) of $5,612.
As of April 30, 2014, the Fund’s aggregate security unrealized gains and losses based on cost for U.S. federal income tax purposes was as follows:
| | | | |
Tax Cost | | $ | 6,492,724 | |
Gross unrealized gain | | | 52,286 | |
Gross unrealized loss | | | (45,348 | ) |
Net unrealized gain | | $ | 6,938 | |
The difference between GAAP-basis and tax-basis unrealized gains (losses) is attributable primarily to wash sales, and differences related to the tax treatment of partnership investments, swap transactions and passive foreign investment company investments.
GSAM has reviewed the Fund’s tax positions for all open tax years (the current and prior year, as applicable), and has concluded that no provision for income tax is required in the Fund’s financial statements. Such open tax years remain subject to examination and adjustment by tax authorities.
The Fund’s risks include, but are not limited to, the following:
Foreign Custody Risk — A Fund that invests in foreign securities may hold such securities and foreign currency with foreign banks, agents, and securities depositories appointed by the Fund’s custodian (each a “Foreign Custodian”). In some countries, Foreign Custodians may be subject to little or no regulatory oversight or independent evaluation of their operations. Further, the laws of certain countries may place limitations on a Fund’s ability to recover its assets if a Foreign Custodian enters into bankruptcy. Investments in emerging markets may be subject to greater custody risks than investments in more developed markets. Custody services in emerging market countries are often undeveloped and may be less regulated than in more developed countries, and thus may not afford the same level of investor protection as would apply in developed countries.
29
GOLDMAN SACHS RETIREMENT PORTFOLIO COMPLETION FUND
Notes to Financial Statements (continued)
April 30, 2014 (Unaudited)
|
| 8. OTHER RISKS (continued) |
Shareholder Concentration Risk — Certain funds, accounts, individuals or Goldman Sachs affiliates may from time to time own (beneficially or of record) or control a significant percentage of the Fund’s shares. Redemptions by these entities of their holdings in the Fund may impact the Fund’s liquidity and NAV. These redemptions may also force the Fund to sell securities.
Investments in Other Investment Companies — As a shareholder of another investment company, including an exchange traded fund (“ETF”), a Fund will directly bear its proportionate share of any management fees and other expenses paid by such other investment companies, in addition to the fees and expenses regularly borne by the Fund. ETFs are subject to risks that do not apply to conventional mutual funds, including but not limited to the following: (i) the market price of the ETF’s shares may trade at a premium or a discount to their NAV; and (ii) an active trading market for an ETF’s shares may not develop or be maintained.
Publicly Traded Partnership Risk — In addition to the risks associated with the underlying assets and exposures within a PTP, risks of investments in PTPs may include, among others, dependence upon specialized skills of the PTP’s manager, potential lack of liquidity, and limitations on voting and distribution rights.
Liquidity Risk — The Fund may make investments that are illiquid or that may become less liquid in response to market developments or adverse investor perceptions. Illiquid investments may be more difficult to value. Liquidity risk may also refer to the risk that the Fund will not be able to pay redemption proceeds within the allowable time period because of unusual market conditions, an unusually high volume of redemption requests, or other reasons. To meet redemption requests, the Fund may be forced to sell investments at an unfavorable time and/or under unfavorable conditions.
Market and Credit Risks — In the normal course of business, the Fund trades financial instruments and enters into financial transactions where risk of potential loss exists due to changes in the market (market risk). Additionally, the Fund may also be exposed to credit risk in the event that an issuer or guarantor fails to perform or that an institution or entity with which the Fund has unsettled or open transactions defaults.
Investing in foreign markets may involve special risks and considerations not typically associated with investing in the U.S. Foreign securities may be subject to risk of loss because of more or less foreign government regulation, less public information and less economic, political and social stability in the countries in which the Fund invests. Loss may also result from the imposition of exchange controls, confiscations and other government restrictions by the United States or other governments, or from problems in registration, settlement or custody. Foreign risk also involves the risk of negative foreign currency rate fluctuations, which may cause the value of securities denominated in such foreign currency (or other instruments through which the Fund has exposure to foreign currencies) to decline in value. Currency exchange rates may fluctuate significantly over short periods of time. To the extent that the Fund also invests in securities of issuers located in emerging markets, these risks may be more pronounced.
Non-Diversification Risk — The Fund is non-diversified, meaning that it is permitted to invest a larger percentage of its assets in fewer issuers than diversified mutual funds. Thus, a Fund may be more susceptible to adverse developments affecting any single issuer held in its portfolio, and may be more susceptible to greater losses because of these developments.
Under the Trust’s organizational documents, its Trustees, officers, employees and agents are indemnified, to the extent permitted by the Act and state law, against certain liabilities that may arise out of performance of their duties to the Fund. Additionally, in the course of business, the Fund enters into contracts that contain a variety of indemnification clauses. The Fund’s maximum exposure under these arrangements is unknown, as this would involve future claims that may be made against the Fund that have not yet occurred. However, GSAM believes the risk of loss under these arrangements to be remote.
30
GOLDMAN SACHS RETIREMENT PORTFOLIO COMPLETION FUND
Subsequent events after the Statement of Assets and Liabilities date have been evaluated through the date the financial statements were issued. GSAM has concluded that there is no impact requiring adjustment or disclosure in the financial statements.
|
| 11. SUMMARY OF SHARE TRANSACTIONS |
Share transactions are as follows:
| | | | | | | | | | | | | | | | |
| | | For the Six Months Ended
April 30, 2014
(Unaudited) | | | For the Fiscal Year Ended
October 31, 2013 | |
| | | Shares | | | Dollars | | | Shares | | | Dollars | |
| | | | |
| Class A Shares | |
Shares sold | | | 5,728 | | | $ | 57,541 | | | | 13,954 | | | $ | 141,042 | |
Reinvestment of distributions | | | 160 | | | | 1,583 | | | | — | | | | — | |
Shares redeemed | | | (2,032 | ) | | | (20,274 | ) | | | (5,157 | ) | | | (51,721 | ) |
| | | | 3,856 | | | | 38,850 | | | | 8,797 | | | | 89,321 | |
| Class C Shares | | | | | | | | | | | | | | | | |
Shares sold | | | 6 | | | | 64 | | | | 1 | | | | 5 | |
Reinvestment of distributions | | | 15 | | | | 144 | | | | — | | | | — | |
Shares redeemed | | | — | | | | — | | | | (1 | ) | | | (5 | ) |
| | | | 21 | | | | 208 | | | | — | | | | — | |
| Institutional Shares | | | | | | | | | | | | | | | | |
Shares sold | | | 282,251 | | | | 2,851,874 | | | | 89,870 | | | | 906,772 | |
Reinvestment of distributions | | | 7,805 | | | | 77,746 | | | | 393 | | | | 3,954 | |
Shares redeemed | | | (29,739 | ) | | | (298,939 | ) | | | (2,768 | ) | | | (27,516 | ) |
| | | | 260,317 | | | | 2,630,681 | | | | 87,495 | | | | 883,210 | |
| Class IR Shares | | | | | | | | | | | | | | | | |
Shares sold | | | 300 | | | | 3,000 | | | | 2,062 | | | | 20,800 | |
Reinvestment of distributions | | | 44 | | | | 439 | | | | 1 | | | | 10 | |
Shares redeemed | | | (284 | ) | | | (2,849 | ) | | | — | | | | — | |
| | | | 60 | | | | 590 | | | | 2,063 | | | | 20,810 | |
| Class R Shares | | | | | | | | | | | | | | | | |
Reinvestment of distributions | | | 15 | | | | 144 | | | | — | | | | — | |
| | | | 15 | | | | 144 | | | | — | | | | — | |
NET INCREASE | | | 264,269 | | | $ | 2,670,473 | | | | 98,355 | | | $ | 993,341 | |
31
GOLDMAN SACHS RETIREMENT PORTFOLIO COMPLETION FUND
| | |
Fund Expenses — Six Month Period Ended April 30, 2014 (Unaudited) | | |
As a shareholder of Class A, Class C, Institutional, Class IR or Class R Shares of the Fund, you incur two types of costs: (1) transaction costs, including sales charges on purchase payments (with respect to Class A Shares), contingent deferred sales charges on redemptions (with respect to Class C Shares), and (2) ongoing costs, including management fees; distribution and service (12b-1) fees (with respect to Class A, Class C and Class R Shares); and other Fund expenses. This Example is intended to help you understand your ongoing costs (in dollars) of investing in Class A, Class C, Institutional, Class IR or Class R Shares of the Fund and to compare these costs with the ongoing costs of investing in other mutual funds.
The Example is based on an investment of $1,000 invested at the beginning of the period and held for the entire period from November 1, 2013 through April 30, 2014.
Actual Expenses — The first line under each share class in the table below provides information about actual account values and actual expenses. You may use the information in this line, together with the amount you invested, to estimate the expenses that you paid over the period. Simply divide your account value by $1,000 (for example, an $8,600 account value divided by $1,000=8.6), then multiply the result by the number in the first line under the heading entitled “Expenses Paid” to estimate the expenses you paid on your account during this period.
Hypothetical Example for Comparison Purposes — The second line under each share class in the table below provides information about hypothetical account values and hypothetical expenses based on the Fund’s actual net expense ratios and an assumed rate of return of 5% per year before expenses, which is not the Fund’s actual return. The hypothetical account values and expenses may not be used to estimate the actual ending account balance or expenses you paid for the period. You may use this information to compare the ongoing costs of investing in the Fund and other funds. To do so, compare this 5% hypothetical example with the 5% hypothetical examples that appear in the shareholder reports of the other funds.
Please note that the expenses shown in the table are meant to highlight your ongoing costs only and do not reflect any transactional costs, such as sales charges, redemption fees, or exchange fees. Therefore, the second line of the table is useful in comparing ongoing costs only, and will not help you determine the relative total costs of owning different funds. In addition, if these transactional costs were included, your costs would have been higher.
| | | | | | | | | | | | |
| | | Retirement Completion Portfolio | |
| Share Class | | Beginning
Account Value
11/1/13 | | | Ending
Account Value
4/30/14 | | | Expenses Paid for the
6 Months Ended
4/30/14* | |
| Class A | | | | | | | | | | | | |
Actual | | $ | 1,000.00 | | | $ | 1,016.50 | | | $ | 3.95 | |
Hypothetical 5% return | | | 1,000.00 | | | | 1,020.88 | + | | | 3.96 | |
| Class C | | | | | | | | | | | | |
Actual | | | 1,000.00 | | | | 1,012.60 | | | | 7.63 | |
Hypothetical 5% return | | | 1,000.00 | | | | 1,017.21 | + | | | 7.65 | |
| Institutional | | | | | | | | | | | | |
Actual | | | 1,000.00 | | | | 1,017.50 | | | | 1.95 | |
Hypothetical 5% return | | | 1,000.00 | | | | 1,022.86 | + | | | 1.96 | |
| Class IR | | | | | | | | | | | | |
Actual | | | 1,000.00 | | | | 1,017.40 | | | | 2.70 | |
Hypothetical 5% return | | | 1,000.00 | | | | 1,022.12 | + | | | 2.71 | |
| Class R | | | | | | | | | | | | |
Actual | | | 1,000.00 | | | | 1,014.50 | | | | 5.14 | |
Hypothetical 5% return | | | 1,000.00 | | | | 1,019.69 | + | | | 5.16 | |
| | * | | Expenses for each share class are calculated using each Fund’s annualized net expense ratio for each class, which represents the ongoing expenses as a percentage of net assets for the six months ended April 30, 2014. Expenses are calculated by multiplying the annualized net expense ratio by the average account value for the period; then multiplying the result by the number of days in the most recent fiscal half year; and then dividing that result by the number of days in the fiscal year. The annualized net expense ratios for the period were as follows: | |
| | | | | | | | | | | | | | | | | | | | |
| Fund | | Class A | | | Class C | | | Institutional | | | Class IR | | | Class R | |
Retirement Portfolio Completion | | | 0.79 | % | | | 1.53 | % | | | 0.39 | % | | | 0.54 | % | | | 1.03 | % |
| | + | | Hypothetical expenses are based on the Fund’s actual annualized net expense ratios and an assumed rate of return of 5% per year before expenses. | |
32
FUNDS PROFILE
Goldman Sachs Funds

Goldman Sachs is a premier financial services firm, known since 1869 for creating thoughtful and customized investment solutions in complex global markets.
Today, the Investment Management Division of Goldman Sachs serves a diverse set of clients worldwide, including private institutions, public entities and individuals. With approximately $935.2 billion in assets under supervision as of March 31, 2014, Goldman Sachs Asset Management (“GSAM”) has portfolio management teams located around the world and our investment professionals bring firsthand knowledge of local markets to every investment decision. Assets under supervision includes assets under management and other client assets for which Goldman Sachs does not have full discretion. GSAM leverages the resources of Goldman, Sachs & Co. subject to legal, internal and regulatory restrictions.
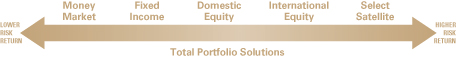
Money Market1
Financial Square FundsSM
| n | | Financial Square Tax-Exempt Funds |
| n | | Financial Square Federal Fund |
| n | | Financial Square Government Fund |
| n | | Financial Square Money Market Fund |
| n | | Financial Square Prime Obligations Fund |
| n | | Financial Square Treasury Instruments Fund |
| n | | Financial Square Treasury Obligations Fund |
Fixed Income
Short Duration and Government
| n | | High Quality Floating Rate Fund |
| n | | Limited Maturity Obligations Fund |
| n | | Short Duration Government Fund |
| n | | Short Duration Income Fund |
| n | | Inflation Protected Securities Fund |
Multi-Sector
| n | | Core Plus Fixed Income Fund |
Municipal and Tax-Free
| n | | High Yield Municipal Fund |
| n | | Short Duration Tax-Free Fund |
Single Sector
| n | | Investment Grade Credit Fund |
| n | | High Yield Floating Rate Fund |
| n | | Emerging Markets Debt Fund |
| n | | Local Emerging Markets Debt Fund |
| n | | Dynamic Emerging Markets Debt Fund |
Corporate Credit
| n | | Long Short Credit Strategies Fund2 |
Fundamental Equity
| n | | Small/Mid Cap Value Fund |
| n | | Small/Mid Cap Growth Fund |
| n | | Flexible Cap Growth Fund |
| n | | Concentrated Growth Fund |
| n | | Technology Tollkeeper Fund |
| n | | Growth Opportunities Fund |
| n | | Rising Dividend Growth Fund |
Tax-Advantaged Equity
| n | | U.S. Tax-Managed Equity Fund3 |
| n | | International Tax-Managed Equity Fund3 |
| n | | U.S. Equity Dividend and Premium Fund |
| n | | International Equity Dividend and Premium Fund |
Equity Insights
| n | | Small Cap Equity Insights Fund |
| n | | U.S. Equity Insights Fund |
| n | | Small Cap Growth Insights Fund |
| n | | Large Cap Growth Insights Fund |
| n | | Large Cap Value Insights Fund |
| n | | Small Cap Value Insights Fund |
| n | | International Small Cap Insights Fund |
| n | | International Equity Insights Fund |
| n | | Emerging Markets Equity Insights Fund |
Fundamental Equity International
| n | | Strategic International Equity Fund |
| n | | Focused International Equity Fund4 |
| n | | International Small Cap Fund |
| n | | Emerging Markets Equity Fund |
| n | | BRIC Fund (Brazil, Russia, India, China) |
Select Satellite5
| n | | Real Estate Securities Fund |
| n | | International Real Estate Securities Fund |
| n | | Commodity Strategy Fund |
| n | | Dynamic Commodity Strategy Fund |
| n | | Dynamic Allocation Fund |
| n | | Absolute Return Tracker Fund |
| n | | Managed Futures Strategy Fund |
| n | | MLP Energy Infrastructure Fund |
| n | | Multi-Manager Alternatives Fund |
| n | | Multi-Asset Real Return Fund |
| n | | Retirement Portfolio Completion Fund |
| n | | Fixed Income Macro Strategies Fund |
Total Portfolio Solutions5
| n | | Balanced Strategy Portfolio |
| n | | Growth and Income Strategy Portfolio |
| n | | Growth Strategy Portfolio |
| n | | Equity Growth Strategy Portfolio |
| n | | Satellite Strategies Portfolio |
| n | | Enhanced Dividend Global Equity Portfolio |
| n | | Tax Advantaged Global Equity Portfolio |
| 1 | | An investment in a money market fund is neither insured nor guaranteed by the Federal Deposit Insurance Corporation (“FDIC”) or any other government agency. Although the Funds seek to preserve the value of your investment at $1.00 per share, it is possible to lose money by investing in the Funds. |
| 2 | | Effective at the close of business on March 21, 2014, the Goldman Sachs Credit Strategies Fund was reorganized with and into the Goldman Sachs Long Short Credit Strategies Fund. |
| 3 | | Effective at the close of business on April 30, 2014, the Goldman Sachs Structured Tax-Managed Equity and Structured International Tax-Managed Equity Funds were renamed the Goldman Sachs U.S. Tax-Managed Equity and International Tax-Managed Equity Funds respectively. |
| 4 | | Effective at the close of business on February 28, 2014, the Goldman Sachs Concentrated International Equity Fund was renamed the Goldman Sachs Focused International Equity Fund. |
| 5 | | Individual Funds within the Total Portfolio Solutions and Select Satellite categories will have various placement on the risk/return spectrum and may have greater or lesser risk than that indicated by the placement of the general Total Portfolio Solutions or Select Satellite category. |
Financial Square FundsSM is a registered service mark of Goldman, Sachs & Co.
| *This | | list covers open-end funds only. Please visit our website at www.GSAMFUNDS.com to learn about our closed-end fund. |
| | |
TRUSTEES Ashok N. Bakhru, Chairman Donald C. Burke John P. Coblentz, Jr. Diana M. Daniels Joseph P. LoRusso Herbert J. Markley James A. McNamara Jessica Palmer Alan A. Shuch Richard P. Strubel Roy W. Templin | | OFFICERS James A. McNamara, President Scott M. McHugh, Principal Financial Officer and Treasurer Caroline L. Kraus, Secretary |
| |
GOLDMAN, SACHS & CO. Distributor and Transfer Agent | | GOLDMAN SACHS ASSET MANAGEMENT, L.P. Investment Adviser |
Visit our Web site at www.GSAMFUNDS.com to obtain the most recent month-end returns.
Goldman Sachs Asset Management, L.P., 200 West Street, New York, New York 10282
The reports concerning the Fund included in this shareholder report may contain certain forward-looking statements about the factors that may affect the performance of the Fund in the future. These statements are based on Fund management’s predictions and expectations concerning certain future events and their expected impact on the Fund, such as performance of the economy as a whole and of specific industry sectors, changes in the levels of interest rates, the impact of developing world events, and other factors that may influence the future performance of the Fund. Management believes these forward-looking statements to be reasonable, although they are inherently uncertain and difficult to predict. Actual events may cause adjustments in portfolio management strategies from those currently expected to be employed.
A description of the policies and procedures that the Fund uses to determine how to vote proxies relating to portfolio securities and information regarding how the Fund voted proxies relating to portfolio securities for the most recent 12-month period ended June 30, are available (I) without charge, upon request by calling 1-800-526-7384; and (II) on the Securities and Exchange Commission (“SEC’’) web site at http://www.sec.gov.
The Fund files its complete schedule of portfolio holdings with the SEC for the first and third quarters of each fiscal year on Form N-Q. The Fund’s Forms N-Q are available on the SEC’s web site at http://www.sec.gov within 60 days after the Fund’s first and third fiscal quarters. The Fund’s Forms N-Q may be reviewed and copied at the SEC’s Public Reference Room in Washington, D.C., and information on the operation of the Public Reference Room may also be obtained by calling 1-800-SEC-0330. Form N-Q may be obtained upon request and without charge by calling 1-800-526-7384 (for Retail Shareholders) or 1-800-621-2550 (for Institutional Shareholders).
The website links provided are for your convenience only and are not an endorsement or recommendation by GSAM of any of these websites or the products or services offered. GSAM is not responsible for the accuracy and validity of the content of these websites.
Holdings and allocations shown are as of April 30, 2014 and may not be representative of future investments. Fund holdings should not be relied on in making investment decisions and should not be construed as research or investment advice regarding particular securities. Current and future holdings are subject to risk.
The Global Industry Classification Standard (GICS) was developed by and is the exclusive property and a service mark of Morgan Stanley Capital International Inc. (MSCI) and Standard & Poor’s, a division of The McGraw-Hill Companies, Inc. (S&P) and is licensed for use by Goldman Sachs. Neither MSCI, S&P nor any other party involved in making or compiling the GICS or any GICS classifications makes any express or implied warranties or representations with respect to such standard or classification (or the results to be obtained by the use thereof), and all such parties hereby expressly disclaim all warranties of originality, accuracy, completeness, merchantability or fitness for a particular purpose with respect to any of such standard or classification. Without limiting any of the foregoing, in no event shall MSCI, S&P, any of their affiliates or any third party involved in making or compiling the GICS or any GICS classifications have any liability for any direct, indirect, special, punitive, consequential or any other damages (including lost profits) even if notified of the possibility of such damages.
The portfolio risk management process includes an effort to monitor and manage risk, but does not imply low risk.
This material is not authorized for distribution to prospective investors unless preceded or accompanied by a current Prospectus or summary prospectus, if applicable. Investors should consider a Fund’s objective, risks, and charges and expenses, and read the summary prospectus, if available, and/or the Prospectus carefully before investing or sending money. The summary prospectus, if available, and the Prospectus contain this and other information about a Fund and may be obtained from your authorized dealer or from Goldman, Sachs & Co. by calling (retail – 1-800-526-7384) (institutional – 1-800-621-2550).
© 2014 Goldman Sachs. All rights reserved. 131640.MF.MED.TMPL/6/2014 RETCOMSAR14/150
The information required by this Item is only required in an annual report on this Form N-CSR.
| ITEM 3. | AUDIT COMMITTEE FINANCIAL EXPERT. |
The information required by this Item is only required in an annual report on this Form N-CSR.
| ITEM 4. | PRINCIPAL ACCOUNTANT FEES AND SERVICES. |
The information required by this Item is only required in an annual report on this Form N-CSR.
| ITEM 5. | AUDIT COMMITTEE OF LISTED REGISTRANTS. |
| ITEM 6. | SCHEDULE OF INVESTMENTS. |
| | Schedule of Investments is included as part of the Report to Stockholders filed under Item 1. |
| ITEM 7. | DISCLOSURE OF PROXY VOTING POLICIES AND PROCEDURES FOR CLOSED-END MANAGEMENT INVESTMENT COMPANIES. |
| ITEM 8. | PORTFOLIO MANAGERS OF CLOSED-END MANAGEMENT INVESTMENT COMPANIES. |
| ITEM 9. | PURCHASES OF EQUITY SECURITIES BY CLOSED-END MANAGEMENT INVESTMENT COMPANY AND AFFILIATED PURCHASERS. |
| ITEM 10. | SUBMISSION OF MATTERS TO A VOTE OF SECURITY HOLDERS. |
| | There have been no material changes to the procedures by which shareholders may recommend nominees to the registrant’s board of trustees. |
| ITEM 11. | CONTROLS AND PROCEDURES. |
| | (a) | The registrant’s principal executive and principal financial officers, or persons performing similar functions have concluded that the registrant’s disclosure controls and procedures (as defined in Rule 30a-3(c) under the Investment Company Act of 1940, as amended (the “1940 Act”)) are effective as of a date within 90 days of the filing of this report that includes the disclosure required by this paragraph, based on the evaluation of these controls and procedures required by Rule 30a-3(b) under the 1940 Act and 15d-15(b) under the Securities Exchange Act of 1934, as amended. |
| | (b) | There were no changes in the registrant’s internal control over financial reporting (as defined in Rule 30a-3(d) under the 1940 Act) that occurred during the registrant’s second fiscal quarter of the period covered by this report that have materially affected, or are reasonably likely to materially affect, the registrant’s internal control over financial reporting. |
| | | | |
| (a)(1) | | The information required by this Item is only required in connection with an annual report on this Form N-CSR. |
| | |
| (a)(2) | | Exhibit 99.CERT | | Certifications pursuant to Section 302 of the Sarbanes-Oxley Act of 2002 filed herewith. |
| | |
| (b) | | Exhibit 99.906CERT | | Certifications pursuant to Section 906 of the Sarbanes-Oxley Act of 2002 filed herewith. |
SIGNATURES
Pursuant to the requirements of the Securities Exchange Act of 1934 and the Investment Company Act of 1940, the registrant has duly caused this report to be signed on its behalf by the undersigned, thereunto duly authorized.
| | |
| | | Goldman Sachs Trust |
| |
| By: | | /s/ James A. McNamara |
| |
| | |
| | James A. McNamara |
| | President/Principal Executive Officer |
| | Goldman Sachs Trust |
| |
| Date: | | June 30, 2014 |
Pursuant to the requirements of the Securities Exchange Act of 1934 and the Investment Company Act of 1940, this report has been signed below by the following persons on behalf of the registrant and in the capacities and on the dates indicated.
| | |
| By: | | /s/ James A. McNamara |
| |
| | |
| | James A. McNamara |
| | President/Principal Executive Officer |
| | Goldman Sachs Trust |
| |
| Date: | | June 30, 2014 |
| |
| By: | | /s/ Scott McHugh |
| |
| | |
| | Scott McHugh |
| | Principal Financial Officer |
| | Goldman Sachs Trust |
| |
| Date: | | June 30, 2014 |