UNITED STATES
SECURITIES AND EXCHANGE COMMISSION
Washington, D.C. 20549
FORM N-CSR
CERTIFIED SHAREHOLDER REPORT OF REGISTERED
MANAGEMENT INVESTMENT COMPANIES
Investment Company Act file number 811-05349
Goldman Sachs Trust
(Exact name of registrant as specified in charter)
71 South Wacker Drive, Chicago, Illinois 60606
(Address of principal executive offices) (Zip code)
| | |
| Caroline Kraus, Esq. | | Copies to: |
| Goldman, Sachs & Co. | | Geoffrey R.T. Kenyon, Esq. |
| 200 West Street | | Dechert LLP |
| New York, New York 10282 | | 100 Oliver Street |
| | 40th Floor |
| | Boston, MA 02110-2605 |
(Name and address of agents for service)
Registrant’s telephone number, including area code: (312) 655-4400
Date of fiscal year end: August 31
Date of reporting period: February 28, 2014
| ITEM 1. | REPORTS TO STOCKHOLDERS. |
| | The Semi-Annual Report to Stockholders is filed herewith. |
Goldman Sachs Funds

| | | | |
| | |
| Semi-Annual Report | | | | February 28, 2014 |
| | |
| | | | Global Tax-Aware Equity Portfolios |
| | | | Enhanced Dividend Global Equity Portfolio |
| | | | Tax-Advantaged Global Equity Portfolio |

Goldman Sachs Global Tax-Aware Equity Portfolios
| n | | ENHANCED DIVIDEND GLOBAL EQUITY PORTFOLIO |
| n | | TAX-ADVANTAGED GLOBAL EQUITY PORTFOLIO |
| | | | |
TABLE OF CONTENTS | | | | |
| |
Principal Investment Strategies and Risks | | | 1 | |
| |
Market Review | | | 2 | |
| |
Portfolio Management Discussion and Performance Summaries | | | 5 | |
| |
Schedules of Investments | | | 17 | |
| |
Financial Statements | | | 21 | |
| |
Financial Highlights | | | 24 | |
| |
Notes to Financial Statements | | | 28 | |
| |
Other Information | | | 43 | |
| | | | |
| | | |
| NOT FDIC-INSURED | | May Lose Value | | No Bank Guarantee |
GOLDMAN SACHS GLOBAL TAX-AWARE EQUITY PORTFOLIOS
Principal Investment Strategies and Risks
This is not a complete list of risks that may affect the Portfolios. For additional information concerning the risks applicable to the Portfolios, please see the Portfolios’ Prospectus.
The Goldman Sachs Enhanced Dividend Global Equity Portfolio invests primarily in affiliated domestic and international equity and fixed income funds (“underlying funds”). The Portfolio will also invest directly in other securities, including exchange-traded funds, which may be denominated in currencies other than the U.S. dollar. The Portfolio is intended for investors who want current income. The Portfolio expects to invest primarily in underlying equity funds and equity securities with a blend of domestic large cap, small cap and international exposure, and expects to invest a relatively significant percentage of this equity allocation in the Goldman Sachs U.S. Equity Dividend and Premium and Goldman Sachs International Equity Dividend and Premium Funds, which have an emphasis on dividend paying stocks. In addition, the Portfolio will have a small strategic allocation in U.S. investment grade bonds, which may consist of an investment in the Goldman Sachs Core Fixed Income Fund or other fixed income securities. The Portfolio may also buy and sell among various underlying funds as part of a tactical allocation. The Portfolio may also engage in short selling. A short sale transaction involves the sale of a borrowed security to a third party, with the understanding that the security must later be returned to the lender. Short sales involve the risk of an unlimited increase in the market value of the security sold short, which could result in a theoretically unlimited loss.
The Portfolio is subject to the risk factors of each underlying fund and the securities that it holds directly, which include prepayment, credit, liquidity and interest rate risk; the price fluctuations of U.S. government securities in response to changes in interest rates and inflation; the volatility of investments in the markets; and political, economic and currency risks of non-U.S. investments. Derivative instruments may involve a high degree of financial risk. These risks include the risk that a small movement in the price of the underlying security or benchmark may result in a disproportionately large movement, unfavorable or favorable, in the price of the derivative instrument; the risk of default by a counterparty; and liquidity risk. From time to time, the underlying funds in which the Portfolio invests may change. Because the Portfolio is subject to the underlying fund expenses as well as its own expenses, the cost of investing in the Portfolio may be higher than investing in a mutual fund that only invests in stocks and bonds.
The Goldman Sachs Tax-Advantaged Global Equity Portfolio invests primarily in affiliated domestic and international equity and fixed income funds (“underlying funds”). The Portfolio will also invest directly in other securities, including exchange-traded funds, which may be denominated in currencies other than the U.S. dollar. The Portfolio is intended for investors who wish to minimize short-term gains and defer long-term gains. The Portfolio expects to invest primarily in underlying equity funds and equity securities with a blend of domestic large cap, small cap and international exposure, and expects to invest a relatively significant percentage of this equity allocation in the Goldman Sachs Structured Tax-Managed Equity and Goldman Sachs Structured International Tax-Managed Equity Funds. In addition, the Portfolio will have a small strategic allocation in U.S. investment grade bonds, which may consist of an investment in the Goldman Sachs Core Fixed Income Fund or other fixed income securities. The Portfolio may also buy and sell among various underlying funds as part of a tactical allocation. The Portfolio may also engage in short selling. A short sale transaction involves the sale of a borrowed security to a third party, with the understanding that the security must later be returned to the lender. Short sales involve the risk of an unlimited increase in the market value of the security sold short, which could result in a theoretically unlimited loss. The Portfolio strives to achieve returns primarily in the form of price appreciation and may use different strategies in seeking tax efficiency. No assurance can be offered that the Portfolio’s tax-managed strategies will reduce the amount of taxable income and capital gains distributed by the Portfolio to shareholders.
The Portfolio is subject to the risk factors of each underlying fund and the securities that it holds directly, which include prepayment, credit, liquidity and interest rate risk; the price fluctuations of U.S. government securities in response to changes in interest rates and inflation; the volatility of investments in the markets; and political, economic and currency risks of non-U.S. investments. Derivative instruments may involve a high degree of financial risk. These risks include the risk that a small movement in the price of the underlying security or benchmark may result in a disproportionately large movement, unfavorable or favorable, in the price of the derivative instrument; the risk of default by a counterparty; and liquidity risk. From time to time, the underlying funds in which the Portfolio invests may change. Because the Portfolio is subject to the underlying fund expenses as well as its own expenses, the cost of investing in the Portfolio may be higher than investing in a mutual fund that only invests directly in stocks and bonds.
1
MARKET REVIEW
Goldman Sachs Global Tax-Aware Equity Portfolios
|
| |
| Investment Strategy |
| |
| The Portfolios invest in a strategic mix of Underlying Funds and other securities with the goal of achieving long-term growth of capital (both Portfolios) and current income (Enhanced Dividend Global Equity Portfolio only). Under normal conditions, at least 80% of the Portfolios’ total assets measured at the time of purchase will be allocated among the Underlying Funds that currently exist or that may become available for investment in the future for which Goldman Sachs Asset Management (“GSAM”) or an affiliate, now or in the future, acts as investment adviser or principal underwriter. Some of the Underlying Funds invest primarily in fixed income or money market instruments and other Underlying Funds invest primarily in equity securities. The Portfolios may also invest directly in other securities or instruments, including unaffiliated exchange-traded funds, and can use these investments for implementing tactical tilts. Under normal circumstances, each of the Portfolios also has a small strategic allocation to U.S. investment grade bonds. |
Market Review
Economic conditions and monetary policies of global central banks drove the performance of the global equity and fixed income markets during the six months ended February 28, 2014 (“the Reporting Period”).
Equity Markets
The U.S. and international equity markets enjoyed four consecutive months of gains from September through December 2013. The S&P 500 Index made record highs in December 2013, as the U.S. Federal Reserve (the “Fed”) ended seven months of speculation and announced it would finally begin tapering its asset purchases, signaling confidence in the U.S. economy. Days later, the U.S. revised upward its Gross Domestic Product (“GDP”) growth estimate for the third quarter of 2013 to an annualized pace of 4.1%, the fastest rate in two years. Importantly, stronger consumption accounted for most of the upward revision. Stock markets in Japan and Europe reached new highs in December 2013 as well. Japan’s Nikkei 225 closed 2013 at a six-year high, as the market reflected optimism about Prime Minister Shinzo Abe’s bold reforms and big stimulus. Encouragingly, Japan’s consumer price index (“CPI”) steadily increased through the fourth quarter of 2013, boosting confidence that the Japanese economy is on a path to achieve its government’s inflation target of 2%. Germany’s Xetra Dax also reached a new high in December, as European markets continued to benefit from the European Central Bank’s (“ECB”) commitment to easy monetary policy and as economic growth returned to the region.
U.S. equities, along with global developed market equities broadly, stumbled in January 2014 on renewed concerns about a variety of issues in the growth and emerging markets, including lower manufacturing activity in China. Such concerns weighed even more heavily on Asian markets, excluding Japan. In February 2014, developed market equities, including those of the
2
MARKET REVIEW
U.S., snapped back. Indeed, the S&P 500 Index reached a new high in February 2014, as merger and acquisition activity picked up and corporate earnings announcements reflected top-line growth, even though overall management guidance for 2014 was less optimistic than the consensus view. Underlying U.S. economic activity during February 2014 was not as strong as it had been at the end of 2013, with disappointing payroll and retail sales reports, though it was unclear how much severe winter weather across most of the U.S. was to blame. Furthermore, a downward revision of fourth quarter 2013 U.S. GDP to an annualized rate of 2.4% from 3.2% indicated the American consumer was resilient but not quite as strong as previously thought.
In other developed markets, economic data was mixed. The Eurozone economy appeared to improve, growing at a stronger than expected annualized rate of 0.5% in the fourth quarter of 2013, and the European Commission raised its estimates for GDP growth to 1.2% in 2014 and 1.8% in 2015. However, other data releases in February 2014, including the Eurozone flash purchasing managers’ indices (“PMIs”), retail sales and industrial production, were not particularly strong. Disinflation also remained an immediate concern. In addition, many corporate earnings reports as well as conservative guidance from company management prompted downward revisions to earnings estimates. In Japan, inflation climbed higher, but the country’s fourth quarter 2013 GDP growth, at an annualized rate of 1.0%, was well below expectations, and the Bank of Japan did not provide additional stimulus ahead of the consumption tax hike scheduled for April 2014.
Fixed Income Markets
Market volatility drove global bond yields higher early in the Reporting Period on continued uncertainty over Fed policy, including speculation about who would replace Fed Chair Bernanke, and the risk of a military intervention in Syria. Interest rates rose and spread (or non-U.S. Treasury) sectors rallied on the Fed’s surprise decision at its September 2013 meeting to not yet start reducing asset purchases. The central bank cited insufficient economic conditions and concerns about fiscal tightening. Global economic growth momentum showed improvement, the Eurozone emerged from recession, and China’s economy stabilized on increased investment.
At the beginning of October 2013, a political stalemate over U.S. federal government funding led to a 16-day partial federal government shutdown. On October 16th, lawmakers reached a last-minute deal to extend the government’s borrowing authority and the U.S. narrowly avoided a default. Also in October, Janet Yellen, a relatively dovish choice, was nominated to succeed Bernanke as Fed Chair in 2014. Global bond yields increased in the fourth calendar quarter overall on improving economic data and, in December 2013, on the Fed’s decision to begin trimming its asset purchases. The Fed announced that starting in January 2014, it would reduce its monthly purchases of U.S. Treasury securities and mortgage-backed securities by $5 billion each, cutting its total monthly asset purchases from $85 billion to $75 billion.
3
MARKET REVIEW
In January 2014, spread sectors grew volatile on concerns about economic growth in the emerging markets and the condition of China’s banking system as well as on unusually cold weather and disappointing economic data in the U.S. Meanwhile, U.S. Treasury yields declined following softer U.S. economic news, including a sharp drop in the national PMI and weaker than expected payrolls data. In line with market expectations, the Fed announced in January that it would reduce its monthly asset purchases by an additional $10 billion in February 2014.
Benchmark yields in core government markets remained in a tight range during February 2014. In the U.S., economic data showed improvement, suggesting that previous weakness may have been influenced by temporary factors such as poor winter weather and a reduction in inventories. In the Eurozone, data continued to paint a picture of gently improving economic growth alongside subdued inflation, easing pressure on the ECB to offer more stimulus. Russia’s military presence in the Ukraine and tensions over Crimea’s possible secession weighed heavily on that region’s markets. Russian assets took the brunt of the selloff, and the Russian central bank hiked interest rates to curb further currency depreciation.
Looking Ahead
In our opinion, U.S. economic growth is likely to rebound near term, and we believe housing construction can be a key source of strength during 2014. The economy should also benefit, in our view, from strong private sector balance sheets, including both household wealth and a corporate cash surplus. We believe improving economic growth should put pressure on the Fed to raise interest rates sooner than the market was anticipating at the end of the Reporting Period.
Outside the U.S., we expect China’s unsustainable credit growth and rising schedule of maturing trust products to create tighter financial conditions, but the Chinese government may offset this with more fiscal spending, thereby keeping the country’s economic growth near 7.5% . Meanwhile, Europe is mired in a low economic growth, low inflation environment. Recent improvements have been driven by disinflationary factors (e.g., falling labor costs and improved competitiveness as well as lower imports in peripheral nations) rather than inflationary factors (e.g., consumer spending in Germany remains stagnant). We expect additional ECB easing in support of Eurozone economies. In Japan, we believe economic growth is likely to slow in the second half of 2014. Government reforms have benefited corporations, but wage growth is modest. As a result, we believe that the upcoming consumption tax hike is likely to weigh on Japan’s economic growth, and the markets may be overestimating the Bank of Japan’s willingness to respond. In the emerging markets, recent volatility may provide attractive opportunities given the divergence in country-specific fundamentals and policy.
The economic and market forecasts presented herein are for informational purposes as of the date of this report. There can be no assurance that the forecasts will be achieved. Please see additional disclosures at the end of this report.
4
PORTFOLIO RESULTS
Goldman Sachs Enhanced Dividend Global Equity Portfolio
Effective May 1, 2013, the components of the Goldman Sachs Enhanced Dividend Global Equity Portfolio’s (the “Portfolio”) performance benchmark, the Enhanced Dividend Global Equity Composite Index (“EDGE Composite Index”), changed from the Russell 3000® Index (60%), the MSCI All Country World Index (ACWI), ex North America® (30%) and the Barclays U.S. Aggregate Bond Index (10%) to the MSCI All Country World Index Investable Market Index® (“MSCI ACWI IMI”) (90%) and the Barclays U.S. Aggregate Bond Index (10%). Goldman Sachs Asset Management believes these changes better reflect the strategic and tactical underlying allocations of the Portfolio and therefore provide more appropriate benchmarks against which to measure the Portfolio’s performance.
Portfolio Management Discussion and Analysis
Below, the Goldman Sachs Quantitative Investment Strategies Team discusses the Portfolio’s performance and positioning for the six-month period ended February 28, 2014 (the “Reporting Period”).
| Q | | How did the Portfolio perform during the Reporting Period? |
| A | | During the Reporting Period, the Portfolio’s Class A and Institutional Shares generated cumulative total returns, without sales charges, of 11.22% and 11.38%, respectively. These returns compare to the 12.99% cumulative total return of the Portfolio’s new blended benchmark, the EDGE Composite Index, over the same time period. The Portfolio’s former blended benchmark generated a 13.76% cumulative total return for the same period. |
| | | The components of the Portfolio’s new blended benchmark generated cumulative total returns of 2.84% and 13.24% for the Barclays U.S. Aggregate Bond Index and the MSCI All Country World Index (ACWI) Investable Market Index® (“MSCI ACWI IMI”), respectively, during the Reporting Period. The components of the Portfolio’s former blended benchmark generated cumulative total returns of 2.84%, 13.57% and 15.83% for the Barclays U.S. Aggregate Bond Index, the MSCI ACWI, ex North America® and the Russell 3000® Index, respectively, during the same period. |
| Q | | What key factors affected the Portfolio’s performance during the Reporting Period? |
| A | | Though the Portfolio benefited from its tactical asset allocation decisions, it underperformed the EDGE Composite Index during the Reporting Period largely because of the performance of its Underlying Funds. The impact of the Portfolio’s strategic weightings was relatively neutral. |
| Q | | How did Global Tactical Asset Allocation decisions affect the Portfolio’s performance during the Reporting Period? |
| A | | The implementation of our tactical views contributed positively to performance. The Portfolio was overweight U.S. large-cap bank stocks through an exchange traded fund (“ETF”), which appreciated in value during the Reporting Period. In our opinion, the valuations of U.S. large-cap bank stocks were attractive relative to their historical performance and to the broad U.S. equity market. More specifically, the price-to-book ratio of large-cap bank stocks was particularly attractive. (The price-to-book ratio is used to compare a stock’s market value to its book value.) In addition, banks have a strong connection to the ongoing housing recovery because the majority of their balance sheets are backed by U.S. real estate. |
| | | The Portfolio was overweight U.S. technology stocks through an ETF, which appreciated in value. During the Reporting Period, the technology sector offered a free cash flow yield that was 200 basis points higher than the overall equity market. (A basis point is 1/100th of a percentage point.) In our view, this gave the sector an attractive risk/return profile. We also believe information technology companies have the potential for superior earnings growth and could increase their dividends and stock buybacks compared to other companies in the broad stock market. |
| | | The Portfolio was overweight European equities during the Reporting Period. Despite the rally in the European stock market since we initiated this tactical tilt in December 2011, European stock valuations, as represented by the Euro Stoxx 50® Index (covering 50 blue chip stocks from 12 Eurozone |
5
PORTFOLIO RESULTS
| | | countries), have remained depressed. If their price multiples revert to their 10-year average during the next five years, European equities could, in our view, post higher annual gains. Combined with moderate earnings growth and an attractive dividend yield, we believe European stocks could potentially generate higher annual total returns during the same timeframe. In addition, during the Reporting Period, the Portfolio was overweight Spanish equities. We believe Spain has made much-needed progress in reforming its economy and expect progress to continue. At the end of the Reporting Period, the Spanish government was committed to reform and had a stable majority in parliament. Also, the Portfolio was overweight Japanese equities. The Tokyo Stock Exchange’s Tokyo Stock Price Index (“TOPIX”) gained ground during the Reporting Period, breaking out of a narrow trading range and, in our opinion, is poised to continue its upward trend. We believe the Bank of Japan is increasingly likely to announce additional quantitative easing in April 2014, which may serve as a catalyst for Japanese equities to move higher. In addition, we believe Japan’s Government Pension Investment Fund is likely to increase its allocation to equities. Such a move could motivate other domestic Japanese institutions to do the same. The Portfolio’s weightings in the European and Spanish equity markets were implemented through investments in stock futures. (A stock future, which is traded on an exchange, is a contract that obligates a buyer to purchase stock at a predetermined future date and price.) The Portfolio’s overweight position in the Japanese equity market was implemented through an index call option. |
| | | The Portfolio was underweight U.S. investment grade bonds. It was overweight U.S. high yield corporate bonds through an investment in the Goldman Sachs High Yield Fund. During the Reporting Period, high yield corporate spreads (or yield differentials to U.S. Treasuries) remained more than 100 basis points higher than their previous lows and were consistent with spread levels during other periods of low defaults. In addition, we believe high yield corporate bonds could be a better interest rate hedge than many investors expect. Historically, when interest rates rise quickly, high yield corporate bonds generate positive returns approximately 73% of the time. |
| | | The Portfolio was overweight high yield bank loans — through an investment in the Goldman Sachs High Yield Floating Rate Fund — because they offered what we |
| | | The economic and market forecasts presented herein are for informational purposes as of the date of this report. There can be no assurance that the forecasts will be achieved. Please see additional disclosures at the end of this report. |
| | believed to be an attractive yield. Furthermore, we think high yield bank loans are well-suited to the rising rate environment. Because of their rather short duration, high yield bank loans allow investors to act quickly — and potentially benefit — when interest rates rise. |
| Q | | How did the Portfolio’s Underlying Funds perform relative to their respective benchmark indices during the Reporting Period? |
| A | | We use seven Underlying Funds to implement our strategic asset allocation. Because of our tactical trading, the Portfolio was invested in six of these Underlying Funds during the Reporting Period. Four of those six Underlying Funds underperformed their respective benchmark indices and two outperformed their respective benchmark indices during the Reporting Period. (The Portfolio did not have an allocation to the Goldman Sachs Core Fixed Income Fund during the Reporting Period.) |
| | | Two of the Underlying Funds that underperformed in relative terms — the Goldman Sachs U.S. Equity Dividend and Premium Fund and the Goldman Sachs International Equity Dividend Fund — were those in which the Portfolio invested a significant percentage of its equity allocation. The Goldman Sachs U.S. Equity Dividend and Premium Fund underperformed its benchmark, the S&P 500® Index (with dividends reinvested), during the Reporting Period. The Goldman Sachs International Equity Dividend and Premium Fund also underperformed its benchmark, the MSCI Europe, Australasia, Far East (“EAFE”) Index. The Goldman Sachs Small Cap Equity Insights Fund and the Goldman Sachs Emerging Equity Insights Fund also underperformed their respective benchmark indices during the Reporting Period.1 |
| | | On the positive side, the Goldman Sachs International Small Cap Insights Fund2 and the Goldman Sachs MLP Energy Infrastructure Fund3 outperformed their respective benchmark indices during the Reporting Period. |
| 1 | | Effective after the close of business on May 3, 2013, the Goldman Sachs Structured Small Cap Equity Fund was renamed the Goldman Sachs Small Cap Equity Insights Fund and the Goldman Sachs Structured Emerging Markets Equity Fund was renamed the Goldman Sachs Emerging Markets Equity Insights Fund. |
| 2 | | Effective after the close of business on May 3, 2013, the Goldman Sachs Structured International Small Cap Equity Fund was renamed the Goldman Sachs International Small Cap Insights Fund. |
| 3 | | The Goldman Sachs MLP Energy Infrastructure Fund, which provides exposure to energy infrastructure master limited partnership (“MLP”) investments, was introduced as an Underlying Fund after the close of business on March 26, 2013. |
6
PORTFOLIO RESULTS
| Q | | How did call writing affect performance? |
| A | | As mentioned above, the Portfolio’s two largest allocations were to the Goldman Sachs U.S. Equity Dividend and Premium Fund and the Goldman Sachs International Equity Dividend and Premium Fund, which earn premiums through an equity index call writing strategy. When equity markets are down, flat or only modestly positive, these Underlying Funds tend to outperform their respective benchmark indices because of the premiums they earn from call writing. When equity markets rally strongly, these two Underlying Funds are likely to trail their respective benchmark indices. Although the Underlying Funds keep the premiums they earn from call writing, they can underperform when the call options are exercised. |
| | | The U.S. and international equity markets appreciated during the Reporting Period, and the call writing strategy of both Underlying Funds detracted from performance as call options were exercised. |
| Q | | How did the Portfolio use derivatives and similar instruments during the Reporting Period? |
| A | | The Portfolio used equity index futures and equity index options during the Reporting Period to implement our views on the European, Spanish and Japanese stock markets. In addition, some of the Portfolio’s Underlying Funds used derivatives during the Reporting Period to apply their active investment views with greater versatility and to afford greater risk management precision. As market conditions warranted during the Reporting Period, some of these Underlying Funds engaged in forward foreign currency exchange contracts, financial futures contracts, options and swap contracts to enhance portfolio return and for hedging purposes. |
| Q | | What changes did you make during the Reporting Period within both the equity and fixed income portions of the Portfolio? |
| A | | During September 2013, we hedged the Portfolio’s weight in U.S. equities by purchasing December 2013 S&P® 500 Index put options at a strike price of 1700. (For put options, the strike price is the price at which shares can be sold.) We funded the position by reducing the Portfolio’s allocation to investment grade fixed income. On September 30, 2013, the Portfolio’s position in September 2013 S&P® 500 Index put options, which had been purchased in May 2013 at a strike price of 1625, expired. |
| | | During November 2013, we increased the Portfolio’s overweight in high yield bank loans through an investment in the Goldman Sachs High Yield Floating Rate Fund. Also in November, we hedged the Fund’s weight in U.S. equities by purchasing December 2013 S&P® 500 Index put options at a strike price of 1750. In addition, we added to the Portfolio’s overweight in Japanese equities by purchasing TOPIX Index call options at a strike price of 1300. (For call options, the strike price is the price at which shares can be purchased.) These three positions were funded by reducing the Portfolio’s allocation to investment grade fixed income. |
| | | In January 2014, we decreased the Portfolio’s overweight in high yield corporate bonds and its overweight in large-cap U.S. bank stocks. We reallocated the proceeds to high yield bank loans through an investment in the Goldman Sachs High Yield Floating Rate Fund. |
| | | During February 2014, we increased the Portfolio’s overweight in large-cap U.S. bank stocks by adding to its investment in a SPDR® S&P® Bank ETF. We funded the position by reducing the Portfolio’s exposure to U.S. large-cap equities. |
| Q | | What was the Portfolio’s tactical view and strategy at the end of the Reporting Period? |
| A | | As of February 28, 2014, the Portfolio — through its holdings in equity index futures and equity index options — was overweight the European, Spanish and Japanese stock markets. It was overweight large-cap U.S. bank stocks and U.S. technology stocks through investments in ETFs, which were both funded out of investment grade fixed income and, in the case of large-cap U.S. bank stocks, out of U.S. equities. In fixed income, through allocations to the Underlying Funds, the Portfolio held overweighted positions in high yield corporate bonds and high yield bank loans and an underweighted position in investment grade securities. |
7
FUND BASICS
Enhanced Dividend Global Equity Portfolio
as of February 28, 2014
| | | | | | | | | | | | | | | | | | | | | | | | | | | | | | |
| | PERFORMANCE REVIEW | |
| | | September 1, 2013–
February 28, 2014 | | Portfolio
Total Return
(based on NAV)1 | | | EDGE
Composite
Index2 | | | EDGE
Composite
Index
(prior to
5/1/13) | | | Barclays
U.S.
Aggregate
Bond
Index | | | MSCI
ACWI
IMI
Index | | | Russell
3000
Index | | | MSCI
ACWI Ex
NA | |
| | Class A | | | 11.22 | % | | | 12.99 | % | | | 13.76 | % | | | 2.84 | % | | | 13.24 | % | | | 15.83 | % | | | 13.57 | % |
| | | Institutional | | | 11.38 | | | | 12.99 | | | | 13.76 | | | | 2.84 | | | | 13.24 | | | | 15.83 | | | | 13.57 | |
| | 1 | | The net asset value (“NAV”) represents the net assets of the class of the Portfolio (ex-dividend) divided by the total number of shares of the class outstanding. The Portfolio’s performance reflects the reinvestment of dividends and other distributions. The Portfolio’s performance does not reflect the deduction of any applicable sales charges. |
| | 2 | | The EDGE Composite Index (“EDGE Composite”) is a composite representation prepared by the investment adviser of the performance of the Portfolio’s asset classes weighted according to their respective weightings in the Portfolio’s target range. Prior to May 1, 2013, the EDGE Composite was comprised of the Russell 3000® Index (60%), the MSCI All Country World Index (ACWI), ex-North America® (30%) and the Barclays U.S. Aggregate Box Index (10%). The EDGE Composite figures do not reflect any deduction for fees, expenses or taxes. |
Effective as of May 1, 2013, the EDGE Composite Index (Current) (“Current EDGE Composite”) is comprised of the Morgan Stanley Capital International All Country World Index IM I (Investable Market Index) (“MSCI ACWI IMI”) (90%) and the Barclays U.S. Aggregate Bond Index (10%). The MSCI is a broad and investable global equity benchmark. MSCI ACWI IMI covers over 9,000 securities across large, mid and small cap size segments and across style and sector segments in developed and emerging markets. The Current EDGE Composite figures do not reflect any deduction for fees, expenses or taxes.
The Russell 3000® Index is an unmanaged index that measures the performance of the 3,000 largest U.S. companies based on total market capitalization which represents approximately 98% of the investable U.S. equity market. The MSCI All Country World Index, Investable Market Indices, ex- North America represents an unmanaged, diversified portfolio of developed and emerging countries with the exception of the United States and Canada. The Barclay’s U.S. Aggregate Bond Index represents an unmanaged diversified portfolio of fixed income securities, including U.S. Treasuries, investment grade corporate bonds, and mortgage-backed and asset-backed securities. The Index figures do not include any deduction for fees, expenses or taxes. It is not possible to invest directly in an unmanaged index.
| | | | | | | | | | | | |
| | STANDARDIZED TOTAL RETURNS3 |
| | | For the period ended 12/31/13 | | One Year | | | Five Years | | Since Inception | | Inception Date |
| | Class A | | | 13.87 | % | | 13.08% | | 4.61% | | 4/30/08 |
| | | Institutional | | | 20.93 | | | 14.81 | | 6.09 | | 4/30/08 |
| | 3 | | The Standardized Total Returns are average annual total returns as of the most recent calendar quarter-end. They assume reinvestment of all distributions at NAV. These returns reflect a maximum initial sales charge of 5.5% for Class A Shares. Because Institutional Shares do not involve a sales charge, such a charge is not applied to their Standardized Total Returns. |
The returns represent past performance. Past performance does not guarantee future results. The Portfolio’s investment return and principal value will fluctuate so that an investor’s shares, when redeemed, may be worth more or less than their original cost. Current performance may be lower or higher than the performance quoted above. Please visit our web site at www.GSAMFUNDS.com to obtain the most recent month-end returns. Performance reflects applicable fee waivers and/or expense limitations in effect during the periods shown. In their absence, performance would be reduced. Returns do not reflect the deduction of taxes that a shareholder would pay on Portfolio distributions or the redemption of Portfolio shares.
8
FUND BASICS
| | | | | | | | | | |
| | EXPENSE RATIOS4 | |
| | | | | Net Expense Ratio (Current) | | | Gross Expense Ratio (Before Waivers) | |
| | Class A | | | 1.36 | % | | | 1.44 | % |
| | | Institutional | | | 0.96 | | | | 1.05 | |
| | 4 | | The expense ratios of the Portfolio, both current (net of applicable fee waivers and/or expense limitations) and before waivers (gross of applicable fee waivers and/or expense limitations), are as set forth above according to the most recent publicly available Prospectus for the Portfolio and may differ from the expense ratios disclosed in the Financial Highlights in this report. The Portfolio’s waivers and/or expense limitations, if any, will remain in place through at least December 29, 2014, and prior to such date the Investment Adviser may not terminate the arrangements without the approval of the Portfolio’s Board of Trustees. If these arrangements are discontinued in the future, the expense ratios may change without shareholder approval. |
| | | | | | | | | | |
| | STANDARDIZED AFTER-TAX PERFORMANCE AS OF 12/31/135 |
| | | Class A Shares | | One Year | | | Five Years | | Since Inception
(4/30/08) |
| | Returns before taxes6 | | | 13.87 | % | | 13.08% | | 4.61% |
| | Returns after taxes on distributions7 | | | 12.32 | | | 12.33 | | 3.94 |
| | | Returns after taxes on distributions8
and sale of Portfolio shares | | | 9.15 | | | 10.52 | | 3.63 |
| | 5 | | The after-tax returns are calculated using the historically highest individual federal marginal income tax rates at the time of distributions (currently 15% for qualifying ordinary income dividends and long-term capital gain distributions and 35% for non-qualifying ordinary income dividends) and do not reflect state and local taxes. Actual after-tax returns will be calculated at calendar year-end and depend on an investor’s tax situation and may differ from those shown. In addition, the after-tax returns shown are not relevant to investors who hold Portfolio shares through tax-deferred arrangements such as 401(k) plans or individual retirement accounts. Under certain circumstances, the addition of the tax benefits from capital losses resulting from redemptions may cause the Returns After Taxes on Distributions and Sale of Portfolio Shares to be greater than the Returns After Taxes on Distributions or even Returns Before Taxes. Standardized after-tax returns assume reinvestment of all distributions at NAV and reflect a maximum initial sales charge of 5.5% for Class A Shares. |
| | 6 | | Returns Before Taxes do not reflect taxes on distributions on the Portfolio’s Class A Shares nor do they show how performance can be impacted by taxes when shares are redeemed. |
| | 7 | | Returns After Taxes on Distributions assume that taxes are paid on distributions on the Portfolio’s Class A Shares (i.e., dividends and capital gains) but do not reflect taxes that may be incurred upon redemption of the Class A Shares at the end of the performance period. |
| | 8 | | Returns After Taxes on Distributions and Sale of Portfolio Shares reflect taxes paid on distributions on the Portfolio’s Class A Shares and taxes applicable when the shares are redeemed. |
9
FUND BASICS
|
| OVERALL UNDERLYING FUND WEIGHTINGS9 |
| Percentage of Net Assets |
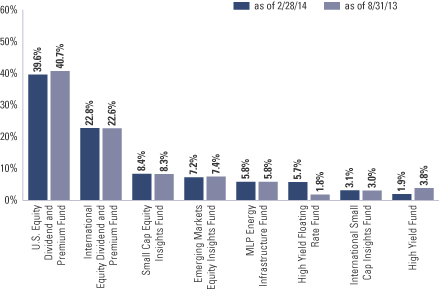
| | 9 | | The Portfolio is actively managed and, as such, its composition may differ over time. The percentage shown for each Underlying Fund reflects the value of that underlying fund as a percentage of net assets of the Portfolio. Figures in the graph above may not sum to 100% due to rounding and/or the exclusion of other assets and liabilities. Underlying sector allocations of ETFs held by the Portfolio are not reflected in the graph above. The above graph depicts the Portfolio’s investments but may not represent the Portfolio’s market exposure due to the exclusion of certain derivatives, if any, as listed in the Additional Investment Information section of the Schedule of Investments. |
10
PORTFOLIO RESULTS
Goldman Sachs Tax-Advantaged
Global Equity Portfolio
Effective May 1, 2013, the components of the Goldman Sachs Tax-Advantaged Global Equity Portfolio’s (the “Portfolio”) performance benchmark, the Tax-Advantaged Global Equity Composite Index (“TAG Composite Index”), changed from the Russell 3000® Index (60%), the MSCI All Country World Index (ACWI), ex North America® (30%) and the Barclays U.S. Aggregate Bond Index (10%) to the MSCI All Country World Index Investable Market Index® (“MSCI ACWI IMI”) (90%) and the Barclays U.S. Aggregate Bond Index (10%). Goldman Sachs Asset Management believes these changes better reflect the strategic and tactical underlying allocations of the Portfolio and therefore provide more appropriate benchmarks against which to measure the Portfolio’s performance.
Portfolio Management Discussion and Analysis
Below, the Goldman Sachs Quantitative Investment Strategies Team discusses the Portfolio’s performance and positioning for the six-month period ended February 28, 2014 (the “Reporting Period”).
| Q | | How did the Portfolio perform during the Reporting Period? |
| A | | During the Reporting Period, the Portfolio’s Class A and Institutional Shares generated cumulative total returns, without sales charges, of 15.75% and 16.02%, respectively. These returns compare to the 12.99% cumulative total return of the Portfolio’s new blended benchmark, the TAG Composite Index, over the same time period. The Portfolio’s former blended benchmark generated a 13.76% cumulative total return during the same period. |
| | The components of the Portfolio’s new blended benchmark generated cumulative total returns of 2.84% and 13.24% for the Barclays U.S. Aggregate Bond Index and the MSCI All Country World Index (ACWI) Investable Market Index® (“MSCI ACWI IMI”), respectively, during the Reporting Period. The components of the Portfolio’s former blended benchmark generated cumulative total returns of 2.84%, 13.57% and 15.83% for the Barclays U.S. Aggregate Bond Index, the MSCI ACWI, ex North America® and the Russell 3000® Index, respectively, during the same period. |
| Q | | What key factors affected the Portfolio’s performance during the Reporting Period? |
| A | | The Portfolio outperformed the TAG Composite Index during the Reporting Period, benefiting from our tactical asset allocation decisions. Security selection within the Underlying Funds overall also added to relative returns. The impact of the Portfolio’s strategic weightings was relatively neutral during the Reporting Period. |
| Q | | How did Global Tactical Asset Allocation decisions affect the Portfolio’s performance during the Reporting Period? |
| A | | The implementation of our tactical views contributed positively to performance. The Portfolio was overweight U.S. large-cap bank stocks through an exchange traded fund (“ETF”), which appreciated in value during the Reporting Period. In our opinion, the valuations of U.S. large-cap bank stocks were attractive relative to their historical performance and to the broad U.S. equity market. More specifically, the price-to-book ratio of large-cap bank stocks was particularly attractive. (The price-to-book ratio is used to compare a stock’s market value to its book value.) In addition, banks have a strong connection to the ongoing housing recovery because the majority of their balance sheets are backed by U.S. real estate. |
| | The Portfolio was overweight U.S. technology stocks through an ETF, which appreciated in value. During the Reporting Period, the technology sector offered a free cash flow yield that was 200 basis points higher than the overall equity market. (A basis point is 1/100th of a percentage point.) In our view, this gives the sector an attractive risk/return profile. We also believe information technology companies have the potential for superior earnings growth and could increase their dividends and stock buybacks compared to other companies in the broad stock market. |
| | | The economic and market forecasts presented herein are for informational purposes as of the date of this report. There can be no assurance that the forecasts will be achieved. Please see additional disclosures at the end of this report. |
11
PORTFOLIO RESULTS
| | The Portfolio was overweight European equities during the Reporting Period. Despite the rally in the European stock market since we initiated this tactical tilt in December 2011, European stock valuations, as represented by the Euro Stoxx 50® Index (covering 50 blue chip stocks from 12 Eurozone countries), have remained depressed. If their price multiples revert to their 10-year average during the next five years, European equities could, in our view, post higher annual gains. Combined with moderate earnings growth and an attractive dividend yield, we believe European stocks could potentially generate higher annual total returns during the same timeframe. In addition, during the Reporting Period, the Portfolio was overweight Spanish equities. We believe Spain has made much-needed progress in reforming its economy and expect progress to continue. At the end of the Reporting Period, the Spanish government was committed to reform and had a stable majority in parliament. Also, the Portfolio was overweight Japanese equities. The Tokyo Stock Exchange’s Tokyo Stock Price Index (“TOPIX”) gained ground during the Reporting Period, breaking out of a narrow trading range and, in our opinion, is poised to continue its upward trend. We believe the Bank of Japan is increasingly likely to announce additional quantitative easing in April 2014, which may serve as a catalyst for Japanese equities to move higher. In addition, we believe Japan’s Government Pension Investment Fund is likely to increase its allocation to equities. Such a move could motivate other domestic Japanese institutions to do the same. The Portfolio’s weightings in the European and Spanish equity markets were implemented through investments in stock futures. (A stock future, which is traded on an exchange, is a contract that obligates a buyer to purchase stock at a predetermined future date and price.) The Portfolio’s overweight position in the Japanese equity market was implemented through an index call option. |
| | The Portfolio was underweight U.S. investment grade bonds. It was overweight U.S. high yield corporate bonds through an investment in the Goldman Sachs High Yield Fund. During the Reporting Period, high yield corporate spreads (or yield differentials to U.S. Treasuries) remained more than 100 basis points higher than their previous lows and were consistent with spread levels during other periods of low defaults. In addition, we believe high yield corporate bonds could be a better interest rate hedge than many investors expect. Historically, when interest rates rise quickly, high yield corporate bonds generate positive returns approximately 73% of the time. |
| | The Portfolio was overweight high yield bank loans —through an investment in the Goldman Sachs High Yield Floating Rate Fund — because they offered what we believed to be an attractive yield. Furthermore, we think high yield bank loans are well-suited to the rising rate environment. Because of their rather short duration, high yield bank loans allow investors to act quickly — and potentially benefit — when interest rates rise. |
| Q | | How did the Portfolio’s Underlying Funds perform relative to their respective benchmark indices during the Reporting Period? |
| A | | We use six Underlying Funds to implement our strategic allocation decisions within the Portfolio. Because of our tactical trading, the Portfolio was invested in five of these Underlying Funds during the Reporting Period. Four of those five Underlying Funds outperformed their respective benchmark indices and one underperformed its benchmark index. (The Portfolio did not have an allocation to the Goldman Sachs Core Fixed Income Fund during the Reporting Period.) The Underlying Funds that outperformed their respective benchmark indices were the Goldman Sachs Structured Tax-Managed Equity Fund, the Goldman Sachs Structured International Tax-Managed Equity Fund, the Goldman Sachs International Small Cap Insights Fund1 and the Goldman Sachs MLP Energy Infrastructure Fund.2 The Goldman Sachs Emerging Markets Equity Insights Fund3 underperformed its benchmark index. |
| | Of the Underlying Funds in which the Portfolio held its greatest weightings, the Goldman Sachs Structured Tax-Managed Equity Fund outperformed its benchmark, the Russell 3000® Index, and the Goldman Sachs Structured International Tax-Managed Equity Fund also outperformed its benchmark, the MSCI Europe, Australasia, Far East (“EAFE”) Index during the Reporting Period. |
| 1 | | Effective after the close of business on May 3, 2013, the Goldman Sachs International Small Cap Equity Fund was renamed the Goldman Sachs International Small Cap Insights Fund. |
| 2 | | The Goldman Sachs MLP Energy Infrastructure Fund, which provides exposure to energy infrastructure master limited partnership (“MLP”) investments, was introduced as an Underlying Fund after the close of business on March 26, 2013. |
| 3 | | Effective after the close of business on May 3, 2013, the Goldman Sachs Structured Emerging Markets Equity Fund was renamed the Goldman Sachs Emerging Markets Equity Insights Fund. |
12
PORTFOLIO RESULTS
| Q | | How did the Portfolio use derivatives and similar instruments during the Reporting Period? |
| A | | The Portfolio used equity index futures and equity index options during the Reporting Period to implement our views on the European, Spanish and Japanese stock markets. In addition, some of the Portfolio’s Underlying Funds used derivatives during the Reporting Period to apply their active investment views with greater versatility and to afford greater risk management precision. As market conditions warranted during the Reporting Period, some of these Underlying Funds engaged in forward foreign currency exchange contracts, financial futures contracts, options and swap contracts to enhance portfolio return and for hedging purposes. |
| Q | | What changes did you make during the Reporting Period within both the equity and fixed income portions of the Portfolio? |
| A | | During September 2013, we hedged the Portfolio’s weight in U.S. equities by purchasing December 2013 S&P® 500 Index put options at a strike price of 1700. (For put options, the strike price is the price at which shares can be sold.) We funded the position by reducing the Portfolio’s allocation to investment grade fixed income. On September 30, 2013, the Portfolio’s position in September 2013 S&P® 500 Index put options, which had been purchased in May 2013 at a strike price of 1625, expired. |
| | During November 2013, we hedged the Portfolio’s weight in high yield corporate bonds through an investment in the Goldman Sachs High Yield Floating Rate Fund. Also in November, we increased the Fund’s overweight in U.S. equities by purchasing December 2013 S&P® 500 Index put options at a strike price of 1750. In addition, we added to the Portfolio’s overweight in Japanese equities by purchasing TOPIX Index call options at a strike price of 1300. (For call options, the strike price is the price at which shares can be purchased.) These three positions were funded by reducing the Portfolio’s allocation to investment grade fixed income. |
| | In January 2014, we decreased the Portfolio’s overweight in high yield corporate bonds and its overweight in large-cap U.S. bank stocks. We reallocated the proceeds to high yield bank loans through an investment in the Goldman Sachs High Yield Floating Rate Fund. |
| | During February 2014, we increased the Portfolio’s overweight in large-cap U.S. bank stocks by adding to its investment in a SPDR® S&P® Bank ETF. We funded the position by reducing the Portfolio’s exposure to U.S. large-cap equities. |
| Q | | What was the Portfolio’s tactical view and strategy at the end of the Reporting Period? |
| A | | As of February 28, 2014, the Portfolio — through its holdings in equity index futures and equity index options —was overweight the European, Spanish and Japanese stock markets. It was overweight large-cap U.S. bank stocks and U.S. technology stocks through investments in ETFs, which were both funded out of investment grade fixed income and, in the case of large-cap U.S. bank stocks, out of U.S. equities. In fixed income, through allocations to the Underlying Funds, the Portfolio held overweighted positions in high yield corporate bonds and high yield bank loans and an underweighted position in investment grade securities. |
13
FUND BASICS
Tax-Advantaged Global Equity Portfolio
as of February 28, 2014
| | | | | | | | | | | | | | | | | | | | | | | | | | | | | | |
| | PERFORMANCE REVIEW | |
| | | September 1, 2013–
February 28, 2014 | | Portfolio
Total Return
(based on NAV)1 | | | TAG
Composite
Index2 | | | TAG
Composite
Index
(prior to
5/1/13) | | | Barclays
U.S.
Aggregate
Bond
Index | | | MSCI
ACWI
IMI
Index | | | Russell
3000
Index | | | MSCI
ACWI Ex
NA | |
| | Class A | | | 15.75 | % | | | 12.99 | % | | | 13.76 | % | | | 2.84 | % | | | 13.24 | % | | | 15.83 | % | | | 13.57 | % |
| | | Institutional | | | 16.02 | | | | 12.99 | | | | 13.76 | | | | 2.84 | | | | 13.24 | | | | 15.83 | | | | 13.57 | |
| | 1 | | The net asset value (“NAV”) represents the net assets of the class of the Portfolio (ex-dividend) divided by the total number of shares of the class outstanding. The Portfolio’s performance reflects the reinvestment of dividends and other distributions. The Portfolio’s performance does not reflect the deduction of any applicable sales charges. |
| | 2 | | The TAG Composite Index (“TAG Composite”) is a composite representation prepared by the investment adviser of the performance of the Portfolio’s asset classes weighted according to their respective weightings in the Portfolio’s target range. Prior to May 1, 2013, the TAG Composite was comprised of the Russell 3000® Index (60%), the MSCI All Country World Index (ACWI), ex-North America® (30%) and the Barclays U.S. Aggregate Box Index (10%). The TAG Composite figures do not reflect any deduction for fees, expenses or taxes. |
Effective as of May 1, 2013, the TAG Composite Index (Current) (“Current TAG Composite”) is comprised of the Morgan Stanley Capital International All Country World Index IM I (Investable Market Index) (“MSCI ACWI IMI”) (90%) and the Barclays U.S. Aggregate Bond Index (10%). The MSCI is a broad and investable global equity benchmark. MSCI ACWI IMI covers over 9,000 securities across large, mid and small cap size segments and across style and sector segments in developed and emerging markets. The Current TAG Composite figures do not reflect any deduction for fees, expenses or taxes.
The Russell 3000® Index is an unmanaged index that measures the performance of the 3,000 largest U.S. companies based on total market capitalization which represents approximately 98% of the investable U.S. equity market. The MSCI All Country World Index, Investable Market Indices, ex- North America represents an unmanaged, diversified portfolio of developed and emerging countries with the exception of the United States and Canada. The Barclay’s U.S. Aggregate Bond Index represents an unmanaged diversified portfolio of fixed income securities, including U.S. Treasuries, investment grade corporate bonds, and mortgage-backed and asset-backed securities. The Index figures do not include any deduction for fees, expenses or taxes. It is not possible to invest directly in an unmanaged index.
| | | | | | | | | | | | |
| | STANDARDIZED TOTAL RETURNS3 |
| | | For the period ended 12/31/13 | | One Year | | | Five Years | | Since Inception | | Inception Date |
| | Class A | | | 20.54 | % | | 14.27% | | 5.12% | | 4/30/08 |
| | | Institutional | | | 28.06 | | | 16.04 | | 6.60 | | 4/30/08 |
| | 3 | | The Standardized Total Returns are average annual total returns as of the most recent calendar quarter-end. They assume reinvestment of all distributions at NAV. These returns reflect a maximum initial sales charge of 5.5% for Class A Shares. Because Institutional Shares do not involve a sales charge, such a charge is not applied to their Standardized Total Returns. |
The returns represent past performance. Past performance does not guarantee future results. The Portfolio’s investment return and principal value will fluctuate so that an investor’s shares, when redeemed, may be worth more or less than their original cost. Current performance may be lower or higher than the performance quoted above. Please visit our web site at www.GSAMFUNDS.com to obtain the most recent month-end returns. Performance reflects applicable fee waivers and/or expense limitations in effect during the periods shown. In their absence, performance would be reduced. Returns do not reflect the deduction of taxes that a shareholder would pay on Portfolio distributions or the redemption of Portfolio shares.
14
FUND BASICS
| | | | | | | | | | |
| | EXPENSE RATIOS4 | |
| | | | | Net Expense Ratio (Current) | | | Gross Expense Ratio (Before Waivers) | |
| | Class A | | | 1.42 | % | | | 1.46 | % |
| | | Institutional | | | 1.02 | | | | 1.06 | |
| | 4 | | The expense ratios of the Portfolio, both current (net of applicable fee waivers and/or expense limitations) and before waivers (gross of applicable fee waivers and/or expense limitations) are as set forth above according to the most recent publicly available Prospectus for the Portfolio and may differ from the expense ratios disclosed in the Financial Highlights in this report. The Portfolio’s waivers and/or expense limitations will remain in place through at least December 29, 2014, and prior to such date the Investment Adviser may not terminate the arrangements without the approval of the Portfolio’s Board of Trustees. If these arrangements are discontinued in the future, the expense ratios may change without shareholder approval. |
| | | | | | | | | | |
| | STANDARDIZED AFTER-TAX PERFORMANCE AS OF 12/31/135 |
| | | Class A Shares | | One Year | | | Five Years | | Since Inception
(4/30/08) |
| | Returns before taxes6 | | | 20.54 | % | | 14.27% | | 5.12% |
| | Returns after taxes on distributions7 | | | 19.75 | | | 13.84 | | 4.72 |
| | | Returns after taxes on distributions8
and sale of Portfolio shares | | | 12.13 | | | 11.45 | | 3.96 |
| | 5 | | The after-tax returns are calculated using the historically highest individual federal marginal income tax rates at the time of distributions (currently 15% for qualifying ordinary income dividends and long-term capital gain distributions and 35% for non-qualifying ordinary income dividends) and do not reflect state and local taxes. Actual after-tax returns will be calculated at calendar year-end and depend on an investor’s tax situation and may differ from those shown. In addition, the after-tax returns shown are not relevant to investors who hold Portfolio shares through tax-deferred arrangements such as 401(k) plans or individual retirement accounts. Under certain circumstances, the addition of the tax benefits from capital losses resulting from redemptions may cause the Returns After Taxes on Distributions and Sale of Portfolio Shares to be greater than the Returns After Taxes on Distributions or even Returns Before Taxes. Standardized after-tax returns assume reinvestment of all distributions at NAV and reflect a maximum initial sales charge of 5.5% for Class A Shares. |
| | 6 | | Returns Before Taxes do not reflect taxes on distributions on the Portfolio’s Class A Shares nor do they show how performance can be impacted by taxes when shares are redeemed. |
| | 7 | | Returns After Taxes on Distributions assume that taxes are paid on distributions on the Portfolio’s Class A Shares (i.e., dividends and capital gains) but do not reflect taxes that may be incurred upon redemption of the Class A Shares at the end of the performance period. |
| | 8 | | Returns After Taxes on Distributions and Sale of Portfolio Shares reflect taxes paid on distributions on the Portfolio’s Class A Shares and taxes applicable when the shares are redeemed. |
15
FUND BASICS
|
| OVERALL UNDERLYING FUND WEIGHTINGS9 |
| Percentage of Net Assets |
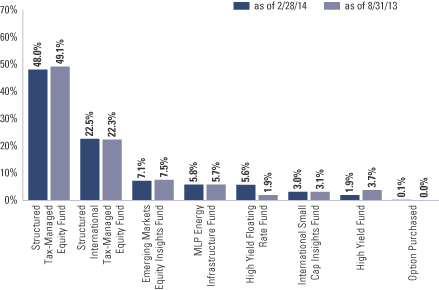
| | 9 | | The Portfolio is actively managed and, as such, its composition may differ over time. The percentage shown for each Underlying Fund reflects the value of that underlying fund as a percentage of net assets of the Portfolio. Figures in the graph above may not sum to 100% due to rounding and/or the exclusion of other assets and liabilities. Underlying sector allocations of ETFs held by the Portfolio are not reflected in the graph above. The above graph depicts the Portfolio’s investments but may not represent the Portfolio’s market exposure due to the exclusion of certain derivatives, if any, as listed in the Additional Investment Information section of the Schedule of Investments. |
16
GOLDMAN SACHS ENHANCED DIVIDEND GLOBAL EQUITY PORTFOLIO
Schedule of Investments
February 28, 2014 (Unaudited)
| | | | | | | | |
Shares | | | Description | | Value | |
| | Underlying Funds (Institutional Shares)(a) – 94.5% | |
| | Equity – 86.9% | |
| | 11,885,586 | | | Goldman Sachs U.S. Equity Dividend and Premium Fund | | $ | 133,593,982 | |
| | 9,520,962 | | | Goldman Sachs International Equity Dividend and Premium Fund | | | 76,834,165 | |
| | 1,548,449 | | | Goldman Sachs Small Cap Equity Insights Fund | | | 28,522,426 | |
| | 2,927,994 | | | Goldman Sachs Emerging Markets Equity Insights Fund | | | 24,185,232 | |
| | 1,696,089 | | | Goldman Sachs MLP Energy Infrastructure Fund | | | 19,521,984 | |
| | 961,377 | | | Goldman Sachs International Small Cap Insights Fund | | | 10,450,166 | |
| | | | | | | | |
| | | | | | | 293,107,955 | |
| | |
| | Fixed Income – 7.6% | |
| | 1,889,793 | | | Goldman Sachs High Yield Floating Rate Fund | | | 19,086,910 | |
| | 902,371 | | | Goldman Sachs High Yield Fund | | | 6,560,239 | |
| | 552 | | | Goldman Sachs Core Fixed Income Fund | | | 5,763 | |
| | | | | | | | |
| | | | | | | 25,652,912 | |
| | |
| TOTAL UNDERLYING FUNDS
(INSTITUTIONAL SHARES) – 94.5% | | | | |
| | (Cost $264,754,630) | | $ | 318,760,867 | |
| | |
| | | | | | | | |
Shares | | | Description | | Value | |
| | Exchange Traded Funds – 3.8% | |
| | 197,509 | | | SPDR S&P Bank Fund | | $ | 6,517,797 | |
| | 168,941 | | | Technology Select Sector SPDR Fund | | | 6,141,005 | |
| | |
| | TOTAL EXCHANGE TRADED FUNDS | | | | |
| | (Cost $10,777,908) | | $ | 12,658,802 | |
| | |
| | | | | | | | | | | | |
| Contracts | | | Strike
Price | | Expiration
Date | | | Value | |
| | Option Purchased – 0.0% | |
| TSE TOPIX Index Call Option | |
| | 49 | | | $1,300 | | | 06/13/14 | | | $ | 135,777 | |
| | (Cost $281,514) | |
| | |
| | TOTAL INVESTMENTS – 98.3% | |
| | (Cost $275,814,052) | | | $ | 331,555,446 | |
| | |
| OTHER ASSETS IN EXCESS OF
LIABILITIES – 1.7% |
| | | 5,707,291 | |
| | |
| | NET ASSETS – 100.0% | | | $ | 337,262,737 | |
| | |
| | |
| The percentage shown for each investment and investment category reflects the value of the respective investment or category as a percentage of net assets. |
(a) | | Represents Affiliated Funds. |
| | |
|
Investment Abbreviation: |
SPDR | | —Standard and Poor’s Depositary Receipts |
|
| | |
| The accompanying notes are an integral part of these financial statements. | | 17 |
GOLDMAN SACHS ENHANCED DIVIDEND GLOBAL EQUITY PORTFOLIO
Schedule of Investments (continued)
February 28, 2014 (Unaudited)
|
| ADDITIONAL INVESTMENT INFORMATION |
FUTURES CONTRACTS — At February 28, 2014, the Portfolio had the following futures contracts:
| | | | | | | | | | | | | | |
| Type | | Number of
Contracts
Long (Short) | | | Expiration
Date | | Current
Value | | | Unrealized
Gain (Loss) | |
EURO STOXX 50 Index | | | 145 | | | March 2014 | | $ | 6,284,506 | | | $ | 396,440 | |
IBEX 35 Index | | | 24 | | | March 2014 | | | 3,338,659 | | | | 9,933 | |
| TOTAL | | | | | | | | | | | | $ | 406,373 | |
| | |
| 18 | | The accompanying notes are an integral part of these financial statements. |
GOLDMAN SACHS TAX-ADVANTAGED GLOBAL EQUITY PORTFOLIO
Schedule of Investments
February 28, 2014 (Unaudited)
| | | | | | | | |
Shares | | | Description | | Value | |
| | | | | | | | |
| | Underlying Funds (Institutional Shares)(a) – 93.9% | |
| | Equity – 86.4% | |
| | 29,853,688 | | | Goldman Sachs Structured Tax-Managed Equity Fund | | $ | 478,256,076 | |
| | 24,059,679 | | | Goldman Sachs Structured International Tax-Managed Equity Fund | | | 224,236,207 | |
| | 8,541,767 | | | Goldman Sachs Emerging Markets Equity Insights Fund | | | 70,554,993 | |
| | 4,999,378 | | | Goldman Sachs MLP Energy Infrastructure Fund | | | 57,542,839 | |
| | 2,788,159 | | | Goldman Sachs International Small Cap Insights Fund | | | 30,307,289 | |
| | | | | | | | |
| | | | | | | 860,897,404 | |
| | |
| | Fixed Income – 7.5% | |
| | 5,504,571 | | | Goldman Sachs High Yield Floating Rate Fund | | | 55,596,165 | |
| | 2,630,165 | | | Goldman Sachs High Yield Fund | | | 19,121,297 | |
| | 2,215 | | | Goldman Sachs Core Fixed Income Fund | | | 23,127 | |
| | | | | | | | |
| | | | | | | 74,740,589 | |
| | |
| TOTAL UNDERLYING FUNDS
(INSTITUTIONAL SHARES) – 93.9% |
|
| | (Cost $699,454,841) | | $ | 935,637,993 | |
| | |
| | | | | | | | |
| | Exchange Traded Funds – 3.7% | |
| | 580,061 | | | SPDR S&P Bank Fund | | $ | 19,142,013 | |
| | 489,927 | | | Technology Select Sector SPDR Fund | | | 17,808,846 | |
| | |
| | TOTAL EXCHANGE TRADED FUNDS | | | | |
| | (Cost $31,936,533) | | $ | 36,950,859 | |
| | |
| | | | | | | | | | | | |
| Contracts | | Strike
Price | | | Expiration
Date | | | Value | |
| Option Purchased – 0.1% | |
TSE TOPIX Index Call Option | |
| 132 | | $ | 1,300 | | | | 06/13/14 | | | $ | 365,766 | |
| (Cost $758,365) | |
| |
| TOTAL INVESTMENTS – 97.7% | |
| (Cost $732,149,739) | | | $ | 972,954,618 | |
| |
| OTHER ASSETS IN EXCESS OF LIABILITIES – 2.3% | | | | 23,383,402 | |
| |
| NET ASSETS – 100.0% | | | $ | 996,338,020 | |
| |
| | |
| The percentage shown for each investment and investment category reflects the value of the respective investment or category as a percentage of net assets. |
(a) | | Represents Affiliated Funds. |
| | |
|
Investment Abbreviation: |
SPDR | | —Standard and Poor’s Depositary Receipts |
|
| | |
| The accompanying notes are an integral part of these financial statements. | | 19 |
GOLDMAN SACHS TAX-ADVANTAGED GLOBAL EQUITY PORTFOLIO
Schedule of Investments (continued)
February 28, 2014 (Unaudited)
|
| ADDITIONAL INVESTMENT INFORMATION |
FUTURES CONTRACTS — At February 28, 2014, the Portfolio had the following futures contracts:
| | | | | | | | | | | | | | |
| Type | | Number of
Contracts
Long (Short) | | | Expiration
Date | | Current
Value | | | Unrealized
Gain (Loss) | |
EURO STOXX 50 Index | | | 410 | | | March 2014 | | $ | 17,769,982 | | | $ | 1,062,869 | |
IBEX 35 Index | | | 63 | | | March 2014 | | | 8,763,979 | | | | 25,460 | |
| TOTAL | | | | | | | | | | | | $ | 1,088,329 | |
| | |
| 20 | | The accompanying notes are an integral part of these financial statements. |
GOLDMAN SACHS GLOBAL TAX-AWARE EQUITY PORTFOLIOS
Statements of Assets and Liabilities
February 28, 2014 (Unaudited)
| | | | | | | | | | |
| | | | | Enhanced Dividend
Global Equity
Portfolio | | | Tax-Advantaged
Global Equity
Portfolio | |
| | Assets: | |
| | Investments in Affiliated Underlying Funds, at value (cost $264,754,630 and $699,454,841) | | $ | 318,760,867 | | | $ | 935,637,993 | |
| | Investments, at value (cost $11,059,422 and $32,694,898) | | | 12,794,579 | | | | 37,316,625 | |
| | Cash | | | 3,378,869 | | | | 18,029,039 | |
| | Foreign currencies, at value (cost $2,034 and $5,762) | | | 2,020 | | | | 5,724 | |
| | Receivables: | | | | | | | | |
| | Portfolio shares sold | | | 1,197,803 | | | | 5,951,433 | |
| | Collateral on certain derivative contracts(a) | | | 1,080,000 | | | | 2,585,000 | |
| | Investments sold | | | 272,074 | | | | — | |
| | Reimbursement from investment adviser | | | 7,787 | | | | 11,103 | |
| | Other assets | | | 4,138 | | | | 5,349 | |
| | Total assets | | | 337,498,137 | | | | 999,542,266 | |
| | | | | | | | | | |
| | Liabilities: | |
| | Payables: | | | | | | | | |
| | Portfolio shares redeemed | | | 94,600 | | | | 1,177,000 | |
| | Amounts owed to affiliates | | | 47,804 | | | | 139,503 | |
| | Variation margin on certain derivative contracts | | | 21,670 | | | | 55,914 | |
| | Investments purchased | | | — | | | | 1,740,206 | |
| | Accrued expenses | | | 71,326 | | | | 91,623 | |
| | Total liabilities | | | 235,400 | | | | 3,204,246 | |
| | | | | | | | | | |
| | Net Assets: | |
| | Paid-in capital | | | 283,667,520 | | | | 749,845,334 | |
| | Undistributed (distributions in excess of) net investment income | | | (980,438 | ) | | | 2,007,259 | |
| | Accumulated net realized gain (loss) | | | (1,585,502 | ) | | | 2,553,111 | |
| | Net unrealized gain | | | 56,161,157 | | | | 241,932,316 | |
| | | NET ASSETS | | $ | 337,262,737 | | | $ | 996,338,020 | |
| | | Net Assets: | | | | | | | | |
| | | Class A | | $ | 212,171 | | | $ | 602,571 | |
| | | Institutional | | | 337,050,566 | | | | 995,735,449 | |
| | | Total Net Assets | | $ | 337,262,737 | | | $ | 996,338,020 | |
| | | Shares outstanding $0.001 par value (unlimited shares authorized): | | | | | | | | |
| | | Class A | | | 18,875 | | | | 47,223 | |
| | | Institutional | | | 29,845,916 | | | | 78,352,840 | |
| | | Net asset value, offering and redemption price per share:(b) | | | | | | | | |
| | | Class A | | | $11.24 | | | | $12.76 | |
| | | Institutional | | | 11.29 | | | | 12.71 | |
| | (a) | | Represents segregated cash relating to collateral on futures transactions. |
| | (b) | | Maximum public offering price per share for Class A shares of the Enhanced Dividend Global Equity and Tax-Advantaged Global Equity Portfolios is $11.89 and $13.50, respectively. |
| | |
| The accompanying notes are an integral part of these financial statements. | | 21 |
GOLDMAN SACHS GLOBAL TAX-AWARE EQUITY PORTFOLIOS
Statements of Operations
For the Six Months Ended February 28, 2014 (Unaudited)
| | | | | | | | | | |
| | | | | Enhanced Dividend
Global Equity
Portfolio | | | Tax-Advantaged
Global Equity
Portfolio | |
| | Investment income: | |
| | Dividends from Affiliated Underlying Funds | | $ | 3,792,733 | | | $ | 12,582,252 | |
| | Dividends from Unaffiliated Funds | | | 98,564 | | | | 249,334 | |
| | Total investment income | | | 3,891,297 | | | | 12,831,586 | |
| | | | | | | | | | |
| | Expenses: | |
| | Management fees | | | 233,804 | | | | 646,560 | |
| | Transfer Agent fees(a) | | | 62,468 | | | | 172,931 | |
| | Professional fees | | | 35,725 | | | | 36,020 | |
| | Custody, accounting and administrative services | | | 26,078 | | | | 33,969 | |
| | Printing and mailing costs | | | 25,650 | | | | 40,962 | |
| | Registration fees | | | 14,986 | | | | 16,387 | |
| | Trustee fees | | | 10,832 | | | | 14,119 | |
| | Distribution and Service fees — Class A Shares | | | 200 | | | | 857 | |
| | Other | | | 9,799 | | | | 11,850 | |
| | Total expenses | | | 419,542 | | | | 973,655 | |
| | Less — expense reductions | | | (99,518 | ) | | | (95,074 | ) |
| | Net expenses | | | 320,024 | | | | 878,581 | |
| | NET INVESTMENT INCOME | | | 3,571,273 | | | | 11,953,005 | |
| | | | | | | | | | |
| | Realized and unrealized gain: | |
| | Net realized gain from: | | | | | | | | |
| | Investments in Affiliated Underlying Funds | | | 2,710,343 | | | | 15,885,607 | |
| | Investments | | | 605,498 | | | | 1,068,076 | |
| | Futures contracts | | | 1,203,913 | | | | 3,123,289 | |
| | Foreign currency transactions | | | 26,033 | | | | 64,408 | |
| | Capital gain distributions from Affiliated Underlying Funds | | | 7,910,646 | | | | 6,459,002 | |
| | Net change in unrealized gain on: | | | | | | | | |
| | Investments in Affiliated Underlying Funds | | | 16,456,149 | | | | 84,080,340 | |
| | Investments | | | 436,142 | | | | 1,623,495 | |
| | Futures contracts | | | 257,406 | | | | 714,175 | |
| | Foreign currency translation | | | 1,946 | | | | 10,474 | |
| | Net realized and unrealized gain | | | 29,608,076 | | | | 113,028,866 | |
| | NET INCREASE IN NET ASSETS RESULTING FROM OPERATIONS | | $ | 33,179,349 | | | $ | 124,981,871 | |
| | (a) | | Class specific Transfer Agent fees were as follows: |
| | | | | | | | |
| | | Transfer Agent Fees | |
Portfolio | | Class A | | | Institutional | |
Enhanced Dividend Global Equity | | $ | 152 | | | $ | 62,316 | |
Tax-Advantaged Global Equity | | | 651 | | | | 172,280 | |
| | |
| 22 | | The accompanying notes are an integral part of these financial statements. |
GOLDMAN SACHS GLOBAL TAX-AWARE EQUITY PORTFOLIOS
Statements of Changes in Net Assets
| | | | | | | | | | | | | | | | | | | | |
| | | | | Enhanced Dividend Global Equity
Portfolio | | | | | Tax-Advantaged Global Equity
Portfolio | |
| | | | | For the
Six Months Ended
February 28, 2014
(Unaudited) | | | For the
Fiscal Year Ended
August 31, 2013
| | | | | For the
Six Months Ended
February 28, 2014
(Unaudited) | | | For the
Fiscal Year Ended
August 31, 2013
| |
| | From operations: | |
| | Net investment income | | $ | 3,571,273 | | | $ | 5,787,590 | | | | | $ | 11,953,005 | | | $ | 10,381,242 | |
| | Net realized gain | | | 12,456,433 | | | | 11,892,680 | | | | | | 26,600,382 | | | | 18,768,814 | |
| | Net change in unrealized gain | | | 17,151,643 | | | | 12,269,346 | | | | | | 86,428,484 | | | | 63,456,041 | |
| | Net increase in net assets resulting from operations | | | 33,179,349 | | | | 29,949,616 | | | | | | 124,981,871 | | | | 92,606,097 | |
| | | | | | | | | | | | | | | | | | | | |
| | Distributions to shareholders: | |
| | From net investment income | | | | | | | | | | | | | | | | | | |
| | Class A Shares | | | (2,162 | ) | | | (2,275,656 | ) | | | | | — | | | | (4,171,091 | ) |
| | Institutional Shares | | | (4,881,333 | ) | | | (4,471,259 | ) | | | | | (11,583,396 | ) | | | (5,177,323 | ) |
| | From net realized gains | | | | | | | | | | | | | | | | | | |
| | Class A Shares | | | (5,994 | ) | | | (1,476,537 | ) | | | | | (17,701 | ) | | | (793,567 | ) |
| | Institutional Shares | | | (11,673,301 | ) | | | (941,687 | ) | | | | | (21,947,805 | ) | | | (745,537 | ) |
| | Total distributions to shareholders | | | (16,562,790 | ) | | | (9,165,139 | ) | | | | | (33,548,902 | ) | | | (10,887,518 | ) |
| | | | | | | | | | | | | | | | | | | | |
| | From share transactions: | |
| | Proceeds from sales of shares | | | 39,347,023 | | | | 218,439,663 | | | | | | 179,088,861 | | | | 536,957,240 | |
| | Reinvestment of distributions | | | 16,205,596 | | | | 8,601,324 | | | | | | 32,487,429 | | | | 9,635,536 | |
| | Cost of shares redeemed | | | (19,578,059 | ) | | | (166,179,709 | ) | | | | | (47,166,178 | ) | | | (338,811,455 | ) |
| | Net increase in net assets resulting from share transactions | | | 35,974,560 | | | | 60,861,278 | | | | | | 164,410,112 | | | | 207,781,321 | |
| | TOTAL INCREASE | | | 52,591,119 | | | | 81,645,755 | | | | | | 255,843,081 | | | | 289,499,900 | |
| | | | | | | | | | | | | | | | | | | | |
| | Net assets: | |
| | Beginning of period | | | 284,671,618 | | | | 203,025,863 | | | | | | 740,494,939 | | | | 450,995,039 | |
| | End of period | | $ | 337,262,737 | | | $ | 284,671,618 | | | | | $ | 996,338,020 | | | $ | 740,494,939 | |
| | Undistributed (distributions in excess of) net
investment income | | $ | (980,438 | ) | | $ | 331,784 | | | | | $ | 2,007,259 | | | $ | 1,637,650 | |
| | |
| The accompanying notes are an integral part of these financial statements. | | 23 |
GOLDMAN SACHS ENHANCED DIVIDEND GLOBAL EQUITY PORTFOLIO
Financial Highlights
Selected Data for a Share Outstanding Throughout Each Period
��
| | | | | | | | | | | | | | | | | | | | | | | | | | | | | | |
| | | | | | | | Income (loss) from
investment operations | | | Distributions
to shareholders | |
| | | Year - Share Class | | Net asset
value,
beginning
of period | | | Net
investment
income(a)(b) | | | Net realized
and unrealized
gain (loss) | | | Total from
investment
operations | | | From net
investment
income | | | From net
realized
gains | | | Total
distributions | |
| | FOR THE SIX MONTHS ENDED FEBRUARY 28, (UNAUDITED) | |
| | 2014 - A | | $ | 10.64 | | | $ | 0.10 | | | $ | 1.07 | | | $ | 1.17 | | | $ | (0.15 | ) | | $ | (0.42 | ) | | $ | (0.57 | ) |
| | 2014 - Institutional | | | 10.69 | | | | 0.13 | | | | 1.06 | | | | 1.19 | | | | (0.17 | ) | | | (0.42 | ) | | | (0.59 | ) |
| | | | | | | | | | | | | | | | | | | | | | | | | | | | | | |
| | FOR THE FISCAL YEARS ENDED AUGUST 31, | |
| | 2013 - A | | | 9.73 | | | | 0.21 | | | | 1.08 | | | | 1.29 | | | | (0.27 | ) | | | (0.11 | ) | | | (0.38 | ) |
| | 2013 - Institutional | | | 9.76 | | | | 0.26 | | | | 1.09 | | | | 1.35 | | | | (0.31 | ) | | | (0.11 | ) | | | (0.42 | ) |
| | 2012 - A | | | 9.23 | | | | 0.19 | | | | 0.58 | | | | 0.77 | | | | (0.26 | ) | | | (0.01 | ) | | | (0.27 | ) |
| | 2012 - Institutional | | | 9.27 | | | | 0.23 | | | | 0.57 | | | | 0.80 | | | | (0.30 | ) | | | (0.01 | ) | | | (0.31 | ) |
| | 2011 - A | | | 8.27 | | | | 0.18 | | | | 1.03 | | | | 1.21 | | | | (0.20 | ) | | | (0.05 | ) | | | (0.25 | ) |
| | 2011 - Institutional | | | 8.30 | | | | 0.22 | | | | 1.04 | | | | 1.26 | | | | (0.24 | ) | | | (0.05 | ) | | | (0.29 | ) |
| | 2010 - A | | | 7.98 | | | | 0.15 | | | | 0.32 | | | | 0.47 | | | | (0.16 | ) | | | (0.02 | ) | | | (0.18 | ) |
| | 2010 - Institutional | | | 8.00 | | | | 0.19 | | | | 0.32 | | | | 0.51 | | | | (0.19 | ) | | | (0.02 | ) | | | (0.21 | ) |
| | 2009 - A | | | 9.12 | | | | 0.11 | | | | (1.09 | ) | | | (0.98 | ) | | | (0.16 | ) | | | — | | | | (0.16 | ) |
| | 2009 - Institutional | | | 9.13 | | | | 0.17 | | | | (1.12 | ) | | | (0.95 | ) | | | (0.18 | ) | | | — | | | | (0.18 | ) |
| | (a) | | Calculated based on the average shares outstanding methodology. |
| | (b) | | Recognition of net investment income by the Portfolio is affected by the timing of declaration of dividends by the Underlying Funds in which the Portfolio invests. |
| | (c) | | Assumes investment at the net asset value at the beginning of the period, reinvestment of all distributions, a complete redemption of the investment at the net asset value at the end of the period and no sales or redemption charges. Total returns would be reduced if a sales or redemption charge was taken into account. Returns do not reflect the deduction of taxes that a shareholder would pay on Portfolio distributions or the redemption of Portfolio shares. Total returns for periods less than one full year are not annualized. |
| | (d) | | Expense ratios exclude the expenses of the Underlying Funds in which the Portfolio invests. |
| | (e) | | The portfolio turnover rate is calculated in accordance with regulatory requirements, without regard to transactions involving short term investments and certain derivatives. If such transactions were included, the portfolio turnover rate may be higher. |
| | |
| 24 | | The accompanying notes are an integral part of these financial statements. |
GOLDMAN SACHS ENHANCED DIVIDEND GLOBAL EQUITY PORTFOLIO
| | | | | | | | | | | | | | | | | | | | | | | | | | | | | | | | | | | | | | | | |
| | | | | | | | | | | | | | | | | | | | | | | | | | | | | | | | | | |
| | | Net asset
value, end
of period | | | | | Total
return(c) | | | | | Net assets,
end of
period
(in 000s) | | | | | Ratio of net expenses to average net assets(d) | | | | | Ratio of
total expenses
to average
net assets(d) | | | | | Ratio of net investment income to average net assets(b) | | | | | Portfolio
turnover
rate(e) | |
| | | | |
| | $ | 11.24 | | | | | | 11.22 | % | | | | $ | 212 | | | | | | 0.60 | %(f) | | | | | 0.67 | %(f) | | | | | 1.84 | %(f) | | | | | 9 | % |
| | | 11.29 | | | | | | 11.38 | | | | | | 337,051 | | | | | | 0.21 | (f) | | | | | 0.27 | (f) | | | | | 2.29 | (f) | | | | | 9 | |
| | | | | | | | | | | | | | | | | | | | | | | | | | | | | | | | | | | | | | | | |
| | | | |
| | | 10.64 | | | | | | 13.61 | | | | | | 133 | | | | | | 0.60 | | | | | | 0.68 | | | | | | 2.13 | | | | | | 40 | |
| | | 10.69 | | | | | | 14.21 | | | | | | 284,539 | | | | | | 0.20 | | | | | | 0.29 | | | | | | 2.49 | | | | | | 40 | |
| | | 9.73 | | | | | | 8.51 | | | | | | 127,290 | | | | | | 0.60 | | | | | | 0.70 | | | | | | 2.02 | | | | | | 32 | |
| | | 9.76 | | | | | | 8.79 | | | | | | 75,735 | | | | | | 0.20 | | | | | | 0.30 | | | | | | 2.42 | | | | | | 32 | |
| | | 9.23 | | | | | | 14.52 | | | | | | 102,498 | | | | | | 0.60 | | | | | | 0.73 | | | | | | 1.91 | | | | | | 25 | |
| | | 9.27 | | | | | | 15.01 | | | | | | 65,856 | | | | | | 0.20 | | | | | | 0.33 | | | | | | 2.28 | | | | | | 25 | |
| | | 8.27 | | | | | | 5.80 | | | | | | 54,481 | | | | | | 0.60 | | | | | | 0.78 | | | | | | 1.74 | | | | | | 42 | |
| | | 8.30 | | | | | | 6.31 | | | | | | 30,802 | | | | | | 0.20 | | | | | | 0.38 | | | | | | 2.18 | | | | | | 42 | |
| | | 7.98 | | | | | | (10.53 | ) | | | | | 32,912 | | | | | | 0.60 | | | | | | 1.56 | | | | | | 1.67 | | | | | | 75 | |
| | | 8.00 | | | | | | (10.11 | ) | | | | | 22,764 | | | | | | 0.20 | | | | | | 1.16 | | | | | | 2.45 | | | | | | 75 | |
| | |
| The accompanying notes are an integral part of these financial statements. | | 25 |
GOLDMAN SACHS TAX-ADVANTAGED GLOBAL EQUITY PORTFOLIO
Financial Highlights
Selected Data for a Share Outstanding Throughout Each Period
| | | | | | | | | | | | | | | | | | | | | | | | | | | | | | |
| | | | | | | | Income (loss) from
investment operations | | | Distributions
to shareholders | |
| | | Year - Share Class | | Net asset
value,
beginning
of period | | | Net
investment
income(a)(b) | | | Net realized
and unrealized
gain (loss) | | | Total from
investment
operations | | | From net
investment
income | | | From net
realized
gains | | | Total
distributions | |
| | FOR THE SIX MONTHS ENDED FEBRUARY 28, (UNAUDITED) | |
| | 2014 - A | | $ | 11.31 | | | $ | 0.15 | | | $ | 1.61 | | | $ | 1.76 | | | $ | — | | | $ | (0.31 | ) | | $ | (0.31 | ) |
| | 2014 - Institutional | | | 11.38 | | | | 0.17 | | | | 1.63 | | | | 1.80 | | | | (0.16 | ) | | | (0.31 | ) | | | (0.47 | ) |
| | | | | | | | | | | | | | | | | | | | | | | | | | | | | | |
| | FOR THE FISCAL YEARS ENDED AUGUST 31, | |
| | 2013 - A | | | 9.78 | | | | 0.32 | | | | 1.41 | | | | 1.73 | | | | (0.17 | ) | | | (0.03 | ) | | | (0.20 | ) |
| | 2013 - Institutional | | | 9.84 | | | | 0.15 | | | | 1.63 | | | | 1.78 | | | | (0.21 | ) | | | (0.03 | ) | | | (0.24 | ) |
| | 2012 - A | | | 8.98 | | | | 0.15 | | | | 0.79 | | | | 0.94 | | | | (0.13 | ) | | | (0.01 | ) | | | (0.14 | ) |
| | 2012 - Institutional | | | 9.04 | | | | 0.17 | | | | 0.81 | | | | 0.98 | | | | (0.17 | ) | | | (0.01 | ) | | | (0.18 | ) |
| | 2011 - A | | | 7.84 | | | | 0.10 | | | | 1.19 | | | | 1.29 | | | | (0.12 | ) | | | (0.03 | ) | | | (0.15 | ) |
| | 2011 - Institutional | | | 7.89 | | | | 0.14 | | | | 1.19 | | | | 1.33 | | | | (0.15 | ) | | | (0.03 | ) | | | (0.18 | ) |
| | 2010 - A | | | 7.78 | | | | 0.11 | | | | 0.10 | | | | 0.21 | | | | (0.13 | ) | | | (0.02 | ) | | | (0.15 | ) |
| | 2010 - Institutional | | | 7.82 | | | | 0.14 | | | | 0.10 | | | | 0.24 | | | | (0.15 | ) | | | (0.02 | ) | | | (0.17 | ) |
| | 2009 - A | | | 9.25 | | | | 0.08 | | | | (1.44 | ) | | | (1.36 | ) | | | (0.11 | ) | | | — | | | | (0.11 | ) |
| | 2009 - Institutional | | | 9.27 | | | | 0.13 | | | | (1.47 | ) | | | (1.34 | ) | | | (0.11 | ) | | | — | | | | (0.11 | ) |
| | (a) | | Calculated based on the average shares outstanding methodology. |
| | (b) | | Recognition of net investment income by the Portfolio is affected by the timing of declaration of dividends by the Underlying Funds in which the Portfolio invests. |
| | (c) | | Assumes investment at the net asset value at the beginning of the period, reinvestment of all distributions, a complete redemption of the investment at the net asset value at the end of the period and no sales or redemption charges. Total returns would be reduced if a sales or redemption charge was taken into account. Returns do not reflect the deduction of taxes that a shareholder would pay on Portfolio distributions or the redemption of Portfolio shares. Total returns for periods less than one full year are not annualized. |
| | (d) | | Expense ratios exclude the expenses of the Underlying Funds in which the Portfolio invests. |
| | (e) | | The portfolio turnover rate is calculated in accordance with regulatory requirements, without regard to transactions involving short term investments and certain derivatives. If such transactions were included, the portfolio turnover rate may be higher. |
| | |
| 26 | | The accompanying notes are an integral part of these financial statements. |
GOLDMAN SACHS TAX-ADVANTAGED GLOBAL EQUITY PORTFOLIO
| | | | | | | | | | | | | | | | | | | | | | | | | | | | | | | | | | | | | | | | |
| | | | | | | | | | | | | | | | | | | | | | | | | | | | | | | | | | |
| | | Net asset
value, end
of period | | | | | Total
return(c) | | | | | Net assets,
end of period
(in 000s) | | | | | Ratio of
net expenses
to average
net assets(d) | | | | | Ratio of
total expenses
to average
net assets(d) | | | | | Ratio of
net investment
income
to average
net assets(b) | | | | | Portfolio
turnover
rate(e) | |
| | | | |
| | $ | 12.76 | | | | | | 15.75 | % | | | | $ | 603 | | | | | | 0.60 | %(f) | | | | | 0.62 | %(f) | | | | | 2.40 | %(f) | | | | | 9 | % |
| | | 12.71 | | | | | | 16.02 | | | | | | 995,735 | | | | | | 0.20 | (f) | | | | | 0.23 | (f) | | | | | 2.77 | (f) | | | | | 9 | |
| | | | | | | | | | | | | | | | | | | | | | | | | | | | | | | | | | | | | | | | |
| | | | |
| | | 11.31 | | | | | | 18.12 | | | | | | 636 | | | | | | 0.60 | | | | | | 0.64 | | | | | | 3.16 | | | | | | 36 | |
| | | 11.38 | | | | | | 18.45 | | | | | | 739,859 | | | | | | 0.20 | | | | | | 0.24 | | | | | | 1.34 | | | | | | 36 | |
| | | 9.78 | | | | | | 10.52 | | | | | | 243,892 | | | | | | 0.60 | | | | | | 0.65 | | | | | | 1.62 | | | | | | 24 | |
| | | 9.84 | | | | | | 11.02 | | | | | | 207,103 | | | | | | 0.20 | | | | | | 0.25 | | | | | | 1.88 | | | | | | 24 | |
| | | 8.98 | | | | | | 16.41 | | | | | | 222,002 | | | | | | 0.60 | | | | | | 0.66 | | | | | | 1.05 | | | | | | 23 | |
| | | 9.04 | | | | | | 16.89 | | | | | | 147,848 | | | | | | 0.20 | | | | | | 0.26 | | | | | | 1.46 | | | | | | 23 | |
| | | 7.84 | | | | | | 2.56 | | | | | | 191,008 | | | | | | 0.60 | | | | | | 0.69 | | | | | | 1.30 | | | | | | 23 | |
| | | 7.89 | | | | | | 2.94 | | | | | | 57,539 | | | | | | 0.20 | | | | | | 0.29 | | | | | | 1.73 | | | | | | 23 | |
| | | 7.78 | | | | | | (14.61 | ) | | | | | 120,898 | | | | | | 0.60 | | | | | | 1.11 | | | | | | 1.12 | | | | | | 52 | |
| | | 7.82 | | | | | | (14.16 | ) | | | | | 28,022 | | | | | | 0.20 | | | | | | 0.71 | | | | | | 1.85 | | | | | | 52 | |
| | |
| The accompanying notes are an integral part of these financial statements. | | 27 |
GOLDMAN SACHS GLOBAL TAX-AWARE EQUITY PORTFOLIOS
Notes to Financial Statements
February 28, 2014 (Unaudited)
Goldman Sachs Trust (the “Trust”) is a Delaware statutory trust registered under the Investment Company Act of 1940, as amended (the “Act”), as an open-end management investment company. The following table lists those series of the Trust that are included in this report (collectively, the “Portfolios” or individually a “Portfolio”), along with their corresponding share classes and respective diversification status under the Act:
| | | | | | | | |
| Portfolio | | | | Share Classes Offered | | | | Diversified/ Non-diversified |
Enhanced Dividend Global Equity and Tax-Advantaged Global Equity | | | | A and Institutional | | | | Diversified |
Class A Shares are sold with a front-end sales charge of up to 5.50%. Institutional Shares are not subject to a sales charge.
Goldman Sachs Asset Management, L.P. (“GSAM”), an affiliate of Goldman, Sachs & Co. (“Goldman Sachs”), serves as investment adviser to the Portfolios pursuant to a management agreement (the “Agreement”) with the Trust.
The Portfolios are expected to invest primarily in a combination of domestic and international equity and fixed income underlying funds (“Underlying Funds”) which are registered under the Act, for which GSAM or Goldman Sachs Asset Management International (“GSAMI”), also an affiliate of Goldman Sachs, act as investment advisers. Additionally, these Portfolios may invest a portion of their assets directly in other securities and instruments, including unaffiliated exchange traded funds (“Unaffiliated Funds”).
| | |
| 2. SIGNIFICANT ACCOUNTING POLICIES | | |
The financial statements have been prepared in accordance with accounting principles generally accepted in the United States of America (“GAAP”) and require management to make estimates and assumptions that may affect the reported amounts and disclosures. Actual results may differ from those estimates and assumptions.
A. Investment Valuation — The Portfolios’ valuation policy, as well as the Underlying Funds’ is to value investments at fair value.
B. Investment Income and Investments — Investment income includes interest income and dividend income, net of any foreign withholding taxes, less any amounts reclaimable. Interest income is accrued daily and adjusted for amortization of premiums and accretion of discounts. Dividend income is recognized on ex-dividend date or, for certain foreign securities, as soon as such information is obtained subsequent to the ex-dividend date. Capital gain distributions received from Underlying Funds are recognized on ex-dividend date. Investment transactions are reflected on trade date. Realized gains and losses are calculated using identified cost. Investment transactions are recorded on the following business day for daily net asset value (“NAV”) calculations. Any foreign capital gains tax is accrued daily based upon net unrealized gains, and is payable upon sale of such investments.
For derivative contracts, realized gains and losses are recorded upon settlement of the contract.
28
GOLDMAN SACHS GLOBAL TAX-AWARE EQUITY PORTFOLIOS
|
| 2. SIGNIFICANT ACCOUNTING POLICIES (continued) |
C. Class Allocations and Expenses — Investment income, realized and unrealized gain (loss), and non-class specific expenses of each Portfolio are allocated daily based upon the proportion of net assets of each class. Class specific expenses, where applicable, are borne by the respective share classes and include Distribution and Service, Transfer Agent and Service and Shareholder Administration fees. Non-class specific expenses directly incurred by a Portfolio are charged to that Portfolio, while such expenses incurred by the Trust are allocated across the respective Portfolios on a straight-line and/or pro-rata basis depending upon the nature of the expenses.
Expenses included in the accompanying financial statements reflect the expenses of each Portfolio and do not include any expenses associated with the Underlying Funds. Because the Underlying Funds have varied expense and fee levels and the Portfolios may own different proportions of the Underlying Funds at different times, the amount of fees and expenses incurred indirectly by each Portfolio will vary.
D. Federal Taxes and Distributions to Shareholders — It is each Portfolio’s policy to comply with the requirements of the Internal Revenue Code of 1986, as amended (the “Code”), applicable to regulated investment companies (mutual funds) and to distribute each year substantially all of its investment company taxable income and capital gains to its shareholders. Accordingly, the Portfolios are not required to make any provisions for the payment of federal income tax. Distributions to shareholders are recorded on the ex-dividend date. Income and capital gains distributions, if any, are declared and paid according to the following schedule:
| | | | | | | | |
| Portfolio | | | | Income Distributions Declared/Paid | | | | Capital Gains Distributions
Declared/Paid |
Enhanced Dividend Global Equity | | | | Quarterly | | | | Annually |
Tax-Advantaged Global Equity | | | | Annually | | | | Annually |
Net capital losses are carried forward to future fiscal years and may be used to the extent allowed by the Code to offset any future capital gains. Losses that are carried forward will retain their character as either short-term or long-term capital losses. Utilization of capital loss carryforwards will reduce the requirement of future capital gains distributions.
The characterization of distributions to shareholders for financial reporting purposes is determined in accordance with federal income tax rules, which may differ from GAAP. The source of each Portfolio’s distributions may be shown in the accompanying financial statements as either from net investment income, net realized gain or capital. Certain components of the Portfolios’ net assets on the Statements of Assets and Liabilities reflect permanent GAAP/tax differences based on the appropriate tax character.
29
GOLDMAN SACHS GLOBAL TAX-AWARE EQUITY PORTFOLIOS
Notes to Financial Statements (continued)
February 28, 2014 (Unaudited)
| | |
| 2. SIGNIFICANT ACCOUNTING POLICIES (continued) |
E. Foreign Currency Translation — The accounting records and reporting currency of the Portfolios are maintained in United States (“U.S.”) dollars. Assets and liabilities denominated in foreign currencies are translated into U.S. dollars using the current exchange rates at the close of each business day. The effect of changes in foreign currency exchange rates on investments is included within net realized and unrealized gain (loss) on investments. Changes in the value of other assets and liabilities as a result of fluctuations in foreign exchange rates are included in the Statements of Operations within net change in unrealized gain (loss) on foreign currency transactions. Transactions denominated in foreign currencies are translated into U.S. dollars on the date the transaction occurred, the effects of which are included within net realized gain (loss) on foreign currency transactions.
| | |
| 3. INVESTMENTS AND FAIR VALUE MEASUREMENTS | | |
The fair value of a financial instrument is the amount that would be received to sell an asset or paid to transfer a liability in an orderly transaction between market participants at the measurement date (i.e., the exit price). GAAP establishes a fair value hierarchy that prioritizes the inputs to valuation techniques used to measure fair value. The hierarchy gives the highest priority to unadjusted quoted prices in active markets for identical assets or liabilities (Level 1 measurements) and the lowest priority to unobservable inputs (Level 3 measurements). The levels used for classifying investments are not necessarily an indication of the risk associated with investing in these investments. The three levels of the fair value hierarchy are described below:
Level 1 — Unadjusted quoted prices in active markets that are accessible at the measurement date for identical, unrestricted assets or liabilities;
Level 2 — Quoted prices in markets that are not active or financial instruments for which significant inputs are observable (including, but not limited to, quoted prices for similar investments, interest rates, foreign exchange rates, volatility and credit spreads), either directly or indirectly;
Level 3 — Prices or valuations that require significant unobservable inputs (including GSAM’s assumptions in determining fair value measurement).
The Trustees have adopted Valuation Procedures that govern the valuation of the portfolio investments held by the Portfolios including investments for which market quotations are not readily available. The Trustees have delegated to GSAM day-to-day responsibility for implementing and maintaining internal controls and procedures related to the valuation of the Portfolio’s portfolio investments. To assess the continuing appropriateness of pricing sources and methodologies, GSAM regularly performs price verification procedures and issues challenges as necessary to third party pricing vendors or brokers, and any differences are reviewed in accordance with the Valuation Procedures.
A. Level 1 and Level 2 Fair Value Investments — The valuation techniques and significant inputs used in determining the fair values for investments classified as Level 1 and Level 2 are as follows:
Underlying Funds — Investments in the Underlying Funds are valued at the NAV per share of the Institutional Share class of each Underlying Fund on the day of valuation. Because each Portfolio invests primarily in other mutual funds that fluctuate in value, the Portfolios’ shares will correspondingly fluctuate in value. These investments are generally classified as Level 1 of the fair value hierarchy.
30
GOLDMAN SACHS GLOBAL TAX-AWARE EQUITY PORTFOLIOS
|
| 3. INVESTMENTS AND FAIR VALUE MEASUREMENT (continued) |
The Underlying Funds may invest in debt securities which, if market quotations are readily available are valued daily on the basis of quotations supplied by dealers or an independent pricing service approved by the Trustees. The pricing services may use valuation models or matrix pricing, which consider: (i) yield or price with respect to bonds that are considered comparable in characteristics such as rating, interest rate and maturity date or (ii) quotations from securities dealers to determine current value. Short-term debt obligations that mature in sixty days or less and that do not exhibit signs of credit deterioration are valued at amortized cost, which approximates fair value. With the exception of treasury securities, which are generally classified as Level 1, these investments are generally classified as Level 2 of the fair value hierarchy.
The Portfolios and the Underlying Funds may invest in equity securities and investment companies. Investments in equity securities and investment companies traded on a U.S. securities exchange or the NASDAQ system, or those located on certain foreign exchanges, including but not limited to the Americas, are valued daily at their last sale price or official closing price on the principal exchange or system on which they are traded. If no sale occurs, equity securities and exchange traded investment companies are valued at the last bid price for long positions and at the last ask price for short positions. Investments in investment companies (other than those that are exchange traded) are valued at the NAV on the valuation date. To the extent these investments are actively traded, they are classified as Level 1 of the fair value hierarchy.
Unlisted equity securities for which market quotations are available are valued at the last sale price on the valuation date, or if no sale occurs, at the last bid price. Securities traded on certain foreign securities exchanges are valued daily at fair value determined by an independent fair value service (if available) under Valuation Procedures approved by the Trustees and consistent with applicable regulatory guidance. The independent fair value service takes into account multiple factors including, but not limited to, movements in the securities markets, certain depositary receipts, futures contracts and foreign currency exchange rates that have occurred subsequent to the close of the foreign securities exchange. These investments are generally classified as Level 2 of the fair value hierarchy.
Derivative Contracts — A derivative is an instrument whose value is derived from underlying assets, indices, reference rates or a combination of these factors.
Exchange-traded derivatives, including futures contracts, typically fall within Level 1 of the fair value hierarchy. Over-the-counter (“OTC”) derivatives are valued using market transactions and other market evidence, including market-based inputs to models, calibration to market-clearing transactions, broker or dealer quotations, or other alternative pricing sources. Where models are used, the selection of a particular model to value an OTC derivative depends upon the contractual terms of, and specific risks inherent in, the instrument, as well as the availability of pricing information in the market. Valuation models require a variety of inputs, including contractual terms, market prices, yield curves, credit curves, measures of volatility, voluntary and involuntary prepayment rates, loss severity rates and correlations of such inputs. For OTC derivatives that trade in liquid markets, model inputs
31
GOLDMAN SACHS GLOBAL TAX-AWARE EQUITY PORTFOLIOS
Notes to Financial Statements (continued)
February 28, 2014 (Unaudited)
|
| 3. INVESTMENTS AND FAIR VALUE MEASUREMENT (continued) |
can generally be verified and model selection does not involve significant management judgment. OTC derivatives are classified within Level 2 of the fair value hierarchy when significant inputs are corroborated by market evidence.
i. Futures Contracts — Futures contracts are contracts to buy or sell a standardized quantity of a specified commodity or security and are valued based on exchanged settlement prices or independent market quotes. Futures contracts are valued at the last settlement price, or in the absence of a sale, the last bid price for long positions and at the last ask price for short positions, at the end of each day on the board of trade or exchange upon which they are traded. Upon entering into a futures contract, a Portfolio deposits cash or securities in an account on behalf of the broker in an amount sufficient to meet the initial margin requirement. Subsequent payments are made or received by a Portfolio equal to the daily change in the contract value and are recorded as variation margin receivable or payable with a corresponding offset to unrealized gains or losses.
ii. Options — When a Portfolio writes call or put options, an amount equal to the premium received is recorded as a liability and is subsequently marked-to-market to reflect the current value of the option written. Swaptions are options on interest rate swap contracts. Options on a futures contract may be written with premiums to be determined on a future date. The premiums for these options are based upon implied volatility parameters at specified terms.
Upon the purchase of a call option or a put option by a Portfolio, the premium paid is recorded as an investment and subsequently marked-to-market to reflect the current value of the option. Certain options may be purchased with premiums to be determined on a future date. The premiums for these options are based upon implied volatility parameters at specified terms.
B. Level 3 Fair Value Investments — To the extent that the aforementioned significant inputs are unobservable, or if quotations are not readily available, or if GSAM believes that such quotations do not accurately reflect fair value, the fair value of the Portfolios’ investments may be determined under Valuation Procedures approved by the Trustees. GSAM, consistent with its procedures and applicable regulatory guidance, may make an adjustment to the most recent valuation prices of either domestic or foreign securities in light of significant events to reflect what it believes to be the fair value of the securities at the time of determining a Portfolio’s NAV. Significant events which could affect a large number of securities in a particular market may include, but are not limited to: significant fluctuations in U.S. or foreign markets; market dislocations; market disruptions; or unscheduled market closings. Significant events which could also affect a single issuer may include, but are not limited to: corporate actions such as reorganizations, mergers and buy-outs; ratings downgrades; and bankruptcies.
32
GOLDMAN SACHS GLOBAL TAX-AWARE EQUITY PORTFOLIOS
|
| 3. INVESTMENTS AND FAIR VALUE MEASUREMENT (continued) |
C. Fair Value Hierarchy — The following is a summary of the Portfolios’ investments and derivatives classified in the fair value hierarchy as of February 28, 2014:
| | | | | | | | | | | | |
| | | |
| ENHANCED DIVIDEND GLOBAL EQUITY | | | | | | | | | | | | |
| | | |
| Investment Type | | Level 1 | | | Level 2 | | | Level 3 | |
| Assets | | | | | | | | | | | | |
Equity Underlying Funds | | $ | 293,107,955 | | | $ | — | | | $ | — | |
Fixed Income Underlying Funds | | | 25,652,912 | | | | — | | | | — | |
Exchange Traded Funds | | | 12,658,802 | | | | — | | | | — | |
| Total | | $ | 331,419,669 | | | $ | — | | | $ | — | |
| | | |
| Derivative Type | | | | | | | | | |
| Assets | | | | | | | | | | | | |
Futures Contracts(a) | | $ | 406,373 | | | $ | — | | | $ | — | |
Option Purchased | | | 135,777 | | | | — | | | | — | |
| Total | | $ | 542,150 | | | $ | — | | | $ | — | |
| | | | | | | | | | | | |
| | | |
| TAX-ADVANTAGED GLOBAL EQUITY | | | | | | | | | | | | |
| | | |
| Investment Type | | Level 1 | | | Level 2 | | | Level 3 | |
| Assets | | | | | | | | | | | | |
Equity Underlying Funds | | $ | 860,897,404 | | | $ | — | | | $ | — | |
Fixed Income Underlying Funds | | | 74,740,589 | | | | — | | | | — | |
Exchange Traded Funds | | | 36,950,859 | | | | — | | | | — | |
| Total | | $ | 972,588,852 | | | $ | — | | | $ | — | |
| | | |
| Derivative Type | | | | | | | | | |
| Assets | | | | | | | | | | | | |
Futures Contracts(a) | | $ | 1,088,329 | | | $ | — | | | $ | — | |
Option Purchased | | | 365,766 | | | | — | | | | — | |
| Total | | $ | 1,454,095 | | | $ | — | | | $ | — | |
| (a) | | Amount shown represents unrealized gain (loss) at period end. |
For further information regarding security characteristics, see the Schedules of Investments.
33
GOLDMAN SACHS GLOBAL TAX-AWARE EQUITY PORTFOLIOS
Notes to Financial Statements (continued)
February 28, 2014 (Unaudited)
|
| 4. INVESTMENTS IN DERIVATIVES |
The following tables set forth, by certain risk types, the gross value of derivative contracts as of February 28, 2014. These instruments were used to meet the Portfolios’ investment objectives and to obtain and/or manage exposure related to the risks below. The values in the tables below exclude the effects of cash collateral received or posted pursuant to these derivative contracts, and therefore are not representative of the Portfolios’ net exposure:
| | | | | | |
| |
| Enhanced Dividend Global Equity | | | | |
| | |
| Risk | | Statements of Assets and Liabilities | | Assets(a) | |
Equity | | Variation margin on certain derivative contracts; Investments, at value | | $ | 542,150 | |
| |
| Tax-Advantaged Global Equity | | | | |
| | |
| Risk | | Statements of Assets and Liabilities | | Assets(a) | |
Equity | | Variation margin on certain derivative contracts; Investments, at value | | $ | 1,454,095 | |
| (a) | | Includes unrealized gain on futures contracts described in the Additional Investment Information sections of the Schedules of Investments. Only current day’s variation margin is reported within the Statements of Assets and Liabilities. |
The following tables set forth, by certain risk types, the Portfolios’ gains (losses) related to these derivatives and their indicative volumes for the six months ended February 28, 2014. These gains (losses) should be considered in the context that these derivative contracts may have been executed to economically hedge certain investments, and accordingly, certain gains (losses) on such derivative contracts may offset certain (losses) gains attributable to investments. These gains (losses) are included in “Net realized gain (loss)” or “Net change in unrealized gain (loss)” on the Statements of Operations:
| | | | | | | | | | | | | | |
| | |
| Enhanced Dividend Global Equity | | | | | | | | | |
| Risk | | Statements of Operations | | Net Realized
Gain (Loss) | | | Net Change in
Unrealized
Gain (Loss) | | | Average
Number of
Contracts(a) | |
| Equity | | Net realized gain (loss) from investments and futures contracts/Net change in unrealized gain (loss) on investments and futures contracts | | $ | 826,279 | | | $ | 174,041 | | | | 224 | |
| | |
| Tax-Advantaged Global Equity | | | | | | | | | |
| Risk | | Statements of Operations | | Net Realized
Gain (Loss) | | | Net Change in
Unrealized
Gain (Loss) | | | Average
Number of
Contracts(a) | |
| Equity | | Net realized gain (loss) from investments and futures contracts/Net change in unrealized gain (loss) on investments and futures contracts | | $ | 2,135,609 | | | $ | 478,512 | | | | 596 | |
| (a) | | Average number of contracts is based on the average month end balances for the period ended February 28, 2014. |
34
GOLDMAN SACHS GLOBAL TAX-AWARE EQUITY PORTFOLIOS
|
| 5. AGREEMENTS AND AFFILIATED TRANSACTIONS |
A. Management Agreement — Under the Agreement, GSAM manages the Portfolios, subject to the general supervision of the Trustees.
As compensation for the services rendered pursuant to the Agreement, the assumption of the expenses related thereto and administration of the Portfolios’ business affairs, including providing facilities, GSAM is entitled to a management fee, accrued daily and paid monthly, equal to an annual percentage rate of 0.15% of each Portfolio’s average daily net assets.
B. Distribution and Service Plans — The Trust, on behalf of each Portfolio’s Class A Shares, has adopted Distribution and Service Plans (the “Plans”). Under the Plans, Goldman Sachs, which serves as distributor (the “Distributor”), is entitled to a fee accrued daily and paid monthly, for distribution services and personal and account maintenance services, which may then be paid by Goldman Sachs to authorized dealers, equal to, on an annual basis, 0.25% of each Portfolio’s average daily net assets attributable to Class A Shares.
C. Distribution Agreement — Goldman Sachs, as Distributor of the shares of the Portfolios pursuant to a Distribution Agreement, may retain a portion of the Class A front end sales charge. During the six months ended February 28, 2014, Goldman Sachs advised that it did not retain any Class A front-end sales charges.
D. Transfer Agency Agreement — Goldman Sachs also serves as the transfer agent of the Portfolios for a fee pursuant to a Transfer Agency Agreement. The fees charged for such transfer agency services are accrued daily and paid monthly at annual rates as follows: 0.19% of the average daily net assets of Class A and 0.04% of the average daily net assets of Institutional Shares.
E. Other Expense Agreements and Affiliated Transactions — GSAM has agreed to limit certain “Other Expense” of the Portfolios (excluding transfer agent fees and expenses, service fees and shareholder administration fees (as applicable), taxes, interest, brokerage fees, shareholder meeting, litigation, indemnification, and extraordinary expenses) to the extent such expenses exceed, on an annual basis, a percentage rate of the average daily net assets of each Portfolio. Such Other Expense reimbursements, if any, are accrued daily and paid monthly. In addition, the Portfolios are not obligated to reimburse GSAM for prior fiscal year expense reimbursements, if any. The Other Expense limitation as an annual percentage rate of average daily net assets for the Portfolios is 0.014%. These Other Expense limitations will remain in place through at least December 29, 2014, and prior to such date GSAM may not terminate the arrangements without the approval of the Trustees. The Portfolios bear their respective share of costs related to proxy and shareholder meetings, and GSAM has agreed to reimburse each Portfolio to the extent such expenses exceed a specified percentage of the Portfolio’s net assets. In addition, the Portfolios have entered into certain offset arrangements with the custodian and the transfer agent, which may result in a reduction of the Portfolios’ expenses and are received irrespective of the application of the “Other Expense” limitations described above.
35
GOLDMAN SACHS GLOBAL TAX-AWARE EQUITY PORTFOLIOS
Notes to Financial Statements (continued)
February 28, 2014 (Unaudited)
|
| 5. AGREEMENTS AND AFFILIATED TRANSACTIONS (continued) |
For the six months ended February 28, 2014, these expense reductions, including any fee waivers and Other Expense reimbursements, were $99,518 and $95,074 for the Enhanced Dividend Global Equity and Tax-Advantaged Global Equity Portfolios, respectively.
As of February 28, 2014, the amounts owed to affiliates of the Portfolios were as follows:
| | | | | | | | | | | | | | | | | | |
| Portfolio | | | | Management
Fees | | | Distribution
and Service
Fees | | | Transfer
Agent
Fees | | | Total | |
Enhanced Dividend Global Equity | | | | $ | 37,690 | | | $ | 40 | | | $ | 10,074 | | | $ | 47,804 | |
Tax-Advantaged Global Equity | | | | | 109,965 | | | | 134 | | | | 29,404 | | | | 139,503 | |
F. Line of Credit Facility — As of February 28, 2014, the Portfolios participated in a $780,000,000 committed, unsecured revolving line of credit facility (the “facility”) together with other funds of the Trust and registered investment companies having management agreements with GSAM or its affiliates (“Other Borrowers”). Pursuant to the terms of the facility, the Portfolios and Other Borrowers could increase the credit amount by an additional $220,000,000, for a total of up to $1,000,000,000. This facility is to be used solely for temporary or emergency purposes, which may include the funding of redemptions. The interest rate on borrowings is based on the federal funds rate. The facility also requires a fee to be paid by the Portfolios based on the amount of the commitment that has not been utilized. For the six months ended February 28, 2014, the Portfolios did not have any borrowings under the facility.
G. Other Transactions with Affiliates — For the six months ended February 28, 2014, Goldman Sachs earned $2,226 and $5,790 in brokerage commissions from portfolio transactions, including futures transactions executed with Goldman Sachs as the Futures Commission Merchant, on behalf of the Enhanced Dividend Global Equity and Tax-Advantaged Global Equity Portfolios, respectively.
36
GOLDMAN SACHS GLOBAL TAX-AWARE EQUITY PORTFOLIOS
|
| 5. AGREEMENTS AND AFFILIATED TRANSACTIONS (continued) |
The Portfolios invest primarily in the Institutional Shares of the Underlying Funds. These Underlying Funds are considered to be affiliated with the Portfolios. The tables below show the transactions in and earnings from investments in these affiliated Funds for the six months ended February 28, 2014:
| | | | | | | | | | | | | | | | | | | | | | | | | | | | | | | | |
| | | | |
| Enhanced Dividend Global Equity | | | | | | | | | | | | | | | | | |
| Underlying Funds | | Market Value
08/31/2013 | | | Purchases at Cost* | | | Proceeds from Sales | | | Net Realized
Gain (Loss) | | | Change in
Unrealized
Appreciation
(Depreciation) | | | Market
Value
02/28/2014 | | | Dividend
Income | | | Capital Gain
Distributions | |
Goldman Sachs Core Fixed Income Fund | | $ | 5,585 | | | $ | 91 | | | $ | — | | | $ | — | | | $ | 87 | | | $ | 5,763 | | | $ | 301,041 | | | $ | — | |
Goldman Sachs Emerging Markets Equity Insights Fund | | | 21,130,561 | | | | 3,936,584 | | | | (1,512,976 | ) | | | (45,259 | ) | | | 676,322 | | | | 24,185,232 | | | | 90 | | | | — | |
Goldman Sachs High Yield Floating Rate Fund | | | 5,273,367 | | | | 14,269,715 | | | | (483,442 | ) | | | (1,566 | ) | | | 28,836 | | | | 19,086,910 | | | | 304,425 | | | | 11,504 | |
Goldman Sachs High Yield Fund | | | 10,728,995 | | | | 1,616,687 | | | | (5,788,628 | ) | | | 317,488 | | | | (314,303 | ) | | | 6,560,239 | | | | 1,415,321 | | | | 404,221 | |
Goldman Sachs International Equity Dividend and Premium Fund | | | 64,346,479 | | | | 10,826,133 | | | | (5,113,635 | ) | | | 335,240 | | | | 6,439,948 | | | | 76,834,165 | | | | 516,305 | | | | 2,159,324 | |
Goldman Sachs International Small Cap Insights Fund | | | 8,476,945 | | | | 1,342,075 | | | | (857,359 | ) | | | 184,984 | | | | 1,303,521 | | | | 10,450,166 | | | | 327,968 | | | | 66,441 | |
Goldman Sachs Local Emerging Markets Debt Fund | | | 3,533 | | | | — | | | | (3,673 | ) | | | 139 | | | | 1 | | | | — | | | | 326,588 | | | | — | |
Goldman Sachs MLP Energy Infrastructure Fund | | | 16,493,236 | | | | 2,156,995 | | | | (1,194,130 | ) | | | 28,157 | | | | 2,037,726 | | | | 19,521,984 | | | | 389,589 | | | | — | |
Goldman Sachs Small Cap Equity Insights Fund | | | 23,645,983 | | | | 2,958,646 | | | | (1,507,399 | ) | | | 535,369 | | | | 2,889,827 | | | | 28,522,426 | | | | 211,392 | | | | — | |
Goldman Sachs U.S. Equity Dividend and Premium Fund | | | 115,855,502 | | | | 22,154,846 | | | | (9,166,341 | ) | | | 1,355,791 | | | | 3,394,184 | | | | 133,593,982 | | | | 14 | | | | 5,269,156 | |
Total | | $ | 265,960,186 | | | $ | 59,261,772 | | | $ | (25,627,583 | ) | | $ | 2,710,343 | | | $ | 16,456,149 | | | $ | 318,760,867 | | | $ | 3,792,733 | | | $ | 7,910,646 | |
37
GOLDMAN SACHS GLOBAL TAX-AWARE EQUITY PORTFOLIOS
Notes to Financial Statements (continued)
February 28, 2014 (Unaudited)
|
| 5. AGREEMENTS AND AFFILIATED TRANSACTIONS (continued) |
| | | | | | | | | | | | | | | | | | | | | | | | | | | | | | | | |
| | | | |
| Tax-Advantaged Global Equity | | | | | | | | | | | | | | | | | |
| Underlying Funds | | Market
Value
08/31/2013 | | | Purchases
at Cost* | | | Proceeds
from Sales | | | Net
Realized
Gain (Loss) | | | Change in
Unrealized
Appreciation
(Depreciation) | | | Market
Value
02/28/2014 | | | Dividend
Income | | | Capital Gain
Distributions | |
Goldman Sachs Core Fixed Income Fund | | $ | 22,411 | | | $ | 365 | | | $ | — | | | $ | — | | | $ | 351 | | | $ | 23,127 | | | $ | 834,319 | | | $ | — | |
Goldman Sachs Emerging Markets Equity Insights Fund | | | 55,440,804 | | | | 15,291,044 | | | | (1,649,995 | ) | | | 23,160 | | | | 1,449,980 | | | | 70,554,993 | | | | 363 | | | | — | |
Goldman Sachs High Yield Floating Rate Fund | | | 13,729,890 | | | | 42,618,098 | | | | (825,773 | ) | | | (3,590 | ) | | | 77,540 | | | | 55,596,165 | | | | 3,968,531 | | | | 31,317 | |
Goldman Sachs High Yield Fund | | | 27,514,915 | | | | 8,428,768 | | | | (16,834,146 | ) | | | 1,620,573 | | | | (1,608,813 | ) | | | 19,121,297 | | | | 4,351,085 | | | | 1,130,711 | |
Goldman Sachs International Small Cap Insights Fund | | | 22,819,532 | | | | 5,568,252 | | | | (2,163,916 | ) | | | 484,384 | | | | 3,599,037 | | | | 30,307,289 | | | | 901,378 | | | | 172,012 | |
Goldman Sachs Local Emerging Markets Debt Fund | | | 9,020 | | | | — | | | | (9,377 | ) | | | 354 | | | | 3 | | | | — | | | | 845,518 | | | | — | |
Goldman Sachs MLP Energy Infrastructure Fund | | | 42,042,665 | | | | 11,067,198 | | | | (1,236,408 | ) | | | 317 | | | | 5,669,067 | | | | 57,542,839 | | | | 1,092,408 | | | | — | |
Goldman Sachs Structured International Tax-Managed Equity Fund | | | 165,433,343 | | | | 41,896,756 | | | | (8,104,274 | ) | | | 1,355,959 | | | | 23,654,423 | | | | 224,236,207 | | | | 588,615 | | | | — | |
Goldman Sachs Structured Tax-Managed Equity Fund | | | 363,681,601 | | | | 86,041,008 | | | | (35,109,735 | ) | | | 12,404,450 | | | | 51,238,752 | | | | 478,256,076 | | | | 35 | | | | 5,124,962 | |
Total | | $ | 690,694,181 | | | $ | 210,911,489 | | | $ | (65,933,624 | ) | | $ | 15,885,607 | | | $ | 84,080,340 | | | $ | 935,637,993 | | | $ | 12,582,252 | | | $ | 6,459,002 | |
| * | | Includes reinvestment of distributions. |
38
GOLDMAN SACHS GLOBAL TAX-AWARE EQUITY PORTFOLIOS
|
| 5. AGREEMENTS AND AFFILIATED TRANSACTIONS (continued) |
As of February 28, 2014, the following Goldman Sachs Fund of Funds Portfolios were the beneficial owners of 5% or more of total outstanding shares of the following Funds:
| | | | | | | | | | |
| Underlying Funds | | | | Enhanced Dividend
Global Equity | | | Tax Advantaged
Global Equity | |
Goldman Sachs Emerging Markets Equity Insights | | | | | — | % | | | 12 | % |
Goldman Sachs International Equity Dividend and Premium | | | | | 17 | | | | — | |
Goldman Sachs MLP Energy Infrastructure | | | | | — | | | | 9 | |
Goldman Sachs Small Cap Equity Insights | | | | | 14 | | | | — | |
Goldman Sachs Structured International Tax-Managed Equity | | | | | — | | | | 88 | |
Goldman Sachs Structured Tax-Managed Equity | | | | | — | | | | 86 | |
Goldman Sachs U.S. Equity Dividend and Premium | | | | | 10 | | | | — | |
| | |
| 6. PORTFOLIO SECURITIES TRANSACTIONS | | |
The cost of purchases and proceeds from sales and maturities of long-term securities for the six months ended February 28, 2014 were as follows:
| | | | | | | | | | |
| Portfolio | | | | Purchases | | | Sales | |
Enhanced Dividend Global Equity | | | | $ | 62,663,589 | | | $ | 28,783,376 | |
Tax-Advantaged Global Equity | | | | | 223,165,754 | | | | 72,724,602 | |
39
GOLDMAN SACHS GLOBAL TAX-AWARE EQUITY PORTFOLIOS
Notes to Financial Statements (continued)
February 28, 2014 (Unaudited)
As of February 28, 2014, the Portfolios’ aggregate security unrealized gains and losses based on cost for U.S. federal income tax purposes were as follows:
| | | | | | | | |
| | | Enhanced Dividend
Global Equity | | | Tax-Advantaged
Global Equity | |
Tax cost | | $ | 288,530,333 | | | $ | 750,592,945 | |
Gross unrealized gain | | | 57,018,641 | | | | 244,416,549 | |
Gross unrealized loss | | | (13,993,528 | ) | | | (22,054,876 | ) |
Net unrealized security gain | | $ | 43,025,113 | | | $ | 222,361,673 | |
The difference between GAAP-basis and tax-basis unrealized gains (losses) is attributable primarily to wash sales and net mark to market gains (losses) on regulated futures and options contracts.
GSAM has reviewed the Portfolios’ tax positions for all open tax years (the current and prior three years, as applicable) and has concluded that no provision for income tax is required in the Portfolios’ financial statements. Such open tax years remain subject to examination and adjustment by tax authorities.
The Portfolios’ risks include, but are not limited to, the following:
Investments in the Underlying Funds — The Portfolios invest primarily in a combination of Underlying Funds, and are subject to the risk factors associated with the investments of those Underlying Funds in direct proportion to the amount of assets allocated to each. As of February 28, 2014, the Enhanced Dividend Global Equity Portfolio invested 39.6% and 22.8% of its net assets in the Goldman Sachs U.S. Equity Dividend and Premium Fund (the “U.S. Equity Dividend and Premium Fund”) and the Goldman Sachs International Equity Dividend and Premium Fund (the “International Equity Dividend and Premium Fund”), respectively. Because of the high concentration of its assets in these Underlying Funds, the Enhanced Dividend Global Equity Portfolio has greater exposure to the risks associated with these Underlying Funds than it does to the risks associated with the other Underlying Funds in which it invests. The U.S. Equity Dividend and Premium Fund invests primarily in dividend paying equity investments in large-capitalization U.S. equity issuers, with public stock market capitalizations within the range of the market capitalization of the S&P 500 at the time of investment. This Underlying Fund expects that, under normal circumstances, it will write call options on the S&P 500 Index or related exchange-traded funds in an amount that is between 25% and 75% of the value of its portfolio. The International Equity Dividend and Premium Fund invests primarily in dividend-paying equity investments in companies that are organized outside the United States or whose securities are principally traded outside the United States with public stock market capitalizations within the range of capitalization of the Morgan Stanley Capital International (MSCI) Europe, Australia, Far East (EAFE) Index (“MSCI EAFE Index”) at the time of investment. This Underlying Fund expects that, under normal circumstances, it will write call options on the MSCI EAFE Index, other national or regional stock market indices or related exchange-traded funds in an amount that is between 25% and 75% of the value of its portfolio.
40
GOLDMAN SACHS GLOBAL TAX-AWARE EQUITY PORTFOLIOS
|
| 8. OTHER RISKS (continued) |
As of February 28, 2014, the Tax-Advantaged Global Equity Portfolio invested 48.0% and 22.5% of its net assets in the Goldman Sachs Structured Tax-Managed Equity Fund (the “Structured Tax-Managed Equity Fund”) and the Goldman Sachs Structured International Tax-Managed Equity Fund (the “Structured International Tax-Managed Equity Fund”), respectively. Because of the high concentration of its assets in these Underlying Funds, the Tax-Advantaged Global Equity Portfolio has greater exposure to the risks associated with these Underlying Funds than it does to the risks associated with the other Underlying Funds in which it invests. The Structured Tax-Managed Equity Fund invests in a broadly diversified portfolio of equity investments in U.S. issuers, including foreign issuers that are traded in the United States. This Underlying Fund will seek to maintain risk, style, capitalization and industry characteristics similar to the Russell 3000 Index. The Structured International Tax-Managed Equity Fund invests primarily in international equity securities. This Underlying Fund will seek to maintain risk, style, capitalization and industry characteristics similar to the MSCI EAFE Index. The investment adviser may seek tax-efficiency by offsetting gains and losses, limiting portfolio turnover or selling high tax basis securities for both Underlying Funds.
The Portfolios do not invest in the Underlying Funds for the purpose of exercising management or control; however, investments by the Portfolios within their principal investment strategies may represent a significant portion of an Underlying Fund’s net assets.
Liquidity Risk — The Underlying Funds may make investments that are illiquid or that may become less liquid in response to market developments or adverse investor perceptions. Illiquid investments may be more difficult to value. Liquidity risk may also refer to the risk that a Portfolio will not be able to pay redemption proceeds within the allowable time period because of unusual market conditions, an unusually high volume of redemption requests, or other reasons. To meet redemption requests, a Portfolio may be forced to sell investments at an unfavorable time and/or under unfavorable conditions.
Market and Credit Risks — In the normal course of business, the Portfolios and the Underlying Funds trade financial instruments and enter into financial transactions where risk of potential loss exists due to changes in the market (market risk). Additionally, the Portfolios and the Underlying Funds may also be exposed to credit risk in the event that an issuer fails to perform or that an institution or entity with which the Portfolios and the Underlying Funds have unsettled or open transactions defaults.
Investing in foreign markets may involve special risks and considerations not typically associated with investing in the U.S. These risks include revaluation of currencies, high rates of inflation, repatriation restrictions on income and capital, and adverse political and economic developments. Moreover, securities issued in these markets may be less liquid, be subject to government ownership controls, have delayed settlements and their prices may be more volatile than those of comparable securities in the U.S.
Under the Trust’s organizational documents, its Trustees, officers, employees and agents are indemnified, to the extent permitted by the Act and state law, against certain liabilities that may arise out of performance of their duties to the Portfolios. Additionally, in the course of business, the Portfolios enter into contracts that contain a variety of indemnification clauses. The Portfolios’ maximum exposure under these arrangements is unknown, as this would involve future claims that may be made against the Portfolios that have not yet occurred. However, GSAM believes the risk of loss under these arrangements to be remote.
Subsequent events after the Statement of Assets and Liabilities date have been evaluated through the date the financial statements were issued. GSAM has concluded that there is no impact requiring adjustment or disclosure in the financial statements.
41
GOLDMAN SACHS GLOBAL TAX-AWARE EQUITY PORTFOLIOS
Notes to Financial Statements (continued)
February 28, 2014 (Unaudited)
|
| 11. SUMMARY OF SHARE TRANSACTIONS |
Share activity is as follows:
| | | | | | | | | | | | | | | | |
| | | Enhanced Dividend Global Equity Portfolio | |
| | | | |
| | | For the Six Months Ended
February 28, 2014
(Unaudited) | | | For the Fiscal Year Ended
August 31, 2013
| |
| | | | |
| | | Shares | | | Dollars | | | Shares | | | Dollars | |
| | | | |
| Class A Shares | | | | | | | | | | | | | | | | |
Shares sold | | | 6,086 | | | $ | 67,389 | | | | 562,321 | | | $ | 5,573,889 | |
Reinvestment of distributions | | | 742 | | | | 8,156 | | | | 382,300 | | | | 3,752,192 | |
Shares redeemed | | | (452 | ) | | | (5,179 | ) | | | (14,020,410 | ) | | | (145,593,815 | ) |
| | | | 6,376 | | | | 70,366 | | | | (13,075,789 | ) | | | (136,267,734 | ) |
| Institutional Shares | | | | | | | | | | | | | | | | |
Shares sold | | | 3,521,001 | | | | 39,279,634 | | | | 20,334,658 | | | | 212,865,774 | |
Reinvestment of distributions | | | 1,466,409 | | | | 16,197,440 | | | | 477,280 | | | | 4,849,132 | |
Shares redeemed | | | (1,756,775 | ) | | | (19,572,880 | ) | | | (1,953,672 | ) | | | (20,585,894 | ) |
| | | | 3,230,635 | | | | 35,904,194 | | | | 18,858,266 | | | | 197,129,012 | |
NET INCREASE | | | 3,237,011 | | | $ | 35,974,560 | | | | 5,782,477 | | | $ | 60,861,278 | |
Share activity is as follows:
| | | | | | | | | | | | | | | | |
| | | Tax-Advantaged Global Equity Portfolio | |
| | | | |
| | | For the Six Months Ended
February 28, 2014
(Unaudited) | | | For the Fiscal Year Ended
August 31, 2013
| |
| | | | |
| | | Shares | | | Dollars | | | Shares | | | Dollars | |
| | | | |
| Class A Shares | | | | | | | | | | | | | | | | |
Shares sold | | | — | (a) | | $ | 5 | | | | 1,315,763 | | | $ | 13,291,684 | |
Reinvestment of distributions | | | 1,458 | | | | 17,701 | | | | 497,466 | | | | 4,964,658 | |
Shares redeemed | | | (10,482 | ) | | | (132,370 | ) | | | (26,703,974 | ) | | | (290,291,877 | ) |
| | | | (9,024 | ) | | | (114,664 | ) | | | (24,890,745 | ) | | | (272,035,535 | ) |
| Institutional Shares | | | | | | | | | | | | | | | | |
Shares sold | | | 14,509,111 | | | | 179,088,856 | | | | 47,953,388 | | | | 523,665,556 | |
Reinvestment of distributions | | | 2,639,043 | | | | 32,469,728 | | | | 465,876 | | | | 4,670,878 | |
Shares redeemed | | | (3,787,442 | ) | | | (47,033,808 | ) | | | (4,471,035 | ) | | | (48,519,578 | ) |
| | | | 13,360,712 | | | | 164,524,776 | | | | 43,948,229 | | | | 479,816,856 | |
NET INCREASE | | | 13,351,688 | | | $ | 164,410,112 | | | | 19,057,484 | | | $ | 207,781,321 | |
| (a) | | Amount is less than 0.5 shares. |
42
GOLDMAN SACHS GLOBAL TAX-AWARE EQUITY PORTFOLIOS
| | |
Portfolio Expenses — Six Month Period Ended February 28, 2014 (Unaudited) | | |
As a shareholder of Class A or Institutional Shares of a Portfolio, you incur two types of costs: (1) transaction costs, including sales charges on purchase payments (with respect to Class A Shares), and (2) ongoing costs, including management fees; distribution and service (12b-1) fees (with respect to Class A Shares); and other Portfolio expenses. This example is intended to help you understand your ongoing costs (in dollars) of investing in Class A and Institutional Shares of the Portfolios and to compare these costs with the ongoing costs of investing in other mutual funds.
The example is based on an investment of $1,000 invested at the beginning of the period and held for the entire period from September 1, 2013 through February 28, 2014.
Actual Expenses — The first line under each share class in the table below provides information about actual account values and actual expenses. You may use the information in this line, together with the amount you invested, to estimate the expenses that you paid over the period. Simply divide your account value by $1,000 (for example, an $8,600 account value divided by $1,000=8.6), then multiply the result by the number in the first line under the heading entitled “Expenses Paid” to estimate the expenses you paid on your account during this period.
Hypothetical Example for Comparison Purposes — The second line under each share class in the table below provides information about hypothetical account values and hypothetical expenses based on the Portfolios' actual net expense ratios and an assumed rate of return of 5% per year before expenses, which is not the Portfolios' actual return. The hypothetical account values and expenses may not be used to estimate the actual ending account balance or expenses you paid for the period. You may use this information to compare the ongoing costs of investing in the Portfolios and other funds. To do so, compare this 5% hypothetical example with the 5% hypothetical examples that appear in the shareholder reports of the other funds.
Please note that the expenses shown in the table are meant to highlight your ongoing costs only and do not reflect any transactional costs, such as sales charges, redemption fees, or exchange fees and do not include expenses of Underlying Funds in which the Portfolios invest. Therefore, the second line of the table is useful in comparing ongoing costs only, and will not help you determine the relative total costs of owning different funds. In addition, if these transactional costs were included, your costs would have been higher.
| | | | | | | | | | | | | | | | | | | | | | | | |
| | | Enhanced Dividend Global Equity Portfolio | | | Tax-Advantaged Global Equity Portfolio | |
| Share Class | | Beginning
Account Value
9/01/13 | | | Ending
Account Value
2/28/14 | | | Expenses
Paid for the
6 Months
Ended
2/28/14* | | | Beginning
Account Value
9/01/13 | | | Ending
Account Value
2/28/14 | | | Expenses
Paid for the
6 Months
Ended
2/28/14* | |
| Class A | | | | | | | | | | | | | | | | | | | | | | | | |
Actual | | $ | 1,000 | | | $ | 1,112.20 | | | $ | 3.14 | | | $ | 1,000 | | | $ | 1,157.50 | | | $ | 3.21 | |
Hypothetical 5% return | | | 1,000 | | | | 1,021.82 | + | | | 3.01 | | | | 1,000 | | | | 1,021.82 | + | | | 3.01 | |
| Institutional | | | | | | | | | | | | | | | | | | | | | | | | |
Actual | | | 1,000 | | | | 1,113.80 | | | | 1.10 | | | | 1,000 | | | | 1,160.20 | | | | 1.07 | |
Hypothetical 5% return | | | 1,000 | | | | 1,023.75 | + | | | 1.05 | | | | 1,000 | | | | 1,023.80 | + | | | 1.00 | |
| | * | | Expenses are calculated using each Portfolio’s annualized net expense ratio for each class, which represents the ongoing expenses as a percentage of net assets for the six months ended February 28, 2014. Expenses are calculated by multiplying the annualized net expense ratio by the average account value for the period; then multiplying the result by the number of days in the most recent fiscal half year; and then dividing that result by the number of days in the fiscal year. The annualized net expense ratios for the period were as follows: | |
| | | | | | | | |
| Portfolio | | Class A | | | Institutional | |
Enhanced Dividend Global Equity | | | 0.60 | % | | | 0.21 | % |
Tax-Advantaged Global Equity | | | 0.60 | | | | 0.20 | |
| | + | | Hypothetical expenses are based on each Portfolio's actual annualized net expense ratios and an assumed rate of return of 5% per year before expenses. | |
43
GOLDMAN SACHS GLOBAL TAX-AWARE EQUITY PORTFOLIOS
Voting Results of Special Meeting of Shareholders (Unaudited)
A Special Meeting (the “Meeting”) of the Goldman Sachs Trust (“GST”) was held on October 15, 2013 to consider and act upon the proposals below.
At the Meeting, Donald C. Burke, Joseph P. LoRusso, Herbert J. Markley, James A. McNamara, and Roy W. Templin were elected to the Trust’s Board of Trustees. In electing trustees, the Trust’s shareholders voted as follows:
| | | | | | | | | | | | | | | | |
Proposal 1. Election of Trustees | | For | | | Against | | | Withheld | | | Broker Non-Votes | |
Donald C. Burke | | | 53,388,642,395.715 | | | | 0 | | | | 1,150,861,851.7004 | | | | 0 | |
Joseph P. LoRusso | | | 53,405,131,628.159 | | | | 0 | | | | 1,134,372,619.260 | | | | 0 | |
Herbert J. Markley | | | 53,435,916,168.391 | | | | 0 | | | | 1,103,588,079.028 | | | | 0 | |
James A. McNamara | | | 53,432,564,581.647 | | | | 0 | | | | 1,106,939,665.772 | | | | 0 | |
Roy W. Templin | | | 53,435,142,748.551 | | | | 0 | | | | 1,104,361,498.868 | | | | 0 | |
| | | | | | | | | | | | | | | | |
In addition to the individuals named above, Ashok N. Bakhru, John P. Coblentz, Jr., Diana M. Daniels, Jessica Palmer, Richard P. Strubel and Alan A. Shuch continue to serve on the Trust’s Board of Trustees.
44
FUNDS PROFILE
Goldman Sachs Funds

Goldman Sachs is a premier financial services firm, known since 1869 for creating thoughtful and customized investment solutions in complex global markets.
Today, the Investment Management Division of Goldman Sachs serves a diverse set of clients worldwide, including private institutions, public entities and individuals. With approximately $807.6 billion in assets under management as of December 31, 2013, Goldman Sachs Asset Management (“GSAM”) has portfolio management teams located around the world and our investment professionals bring firsthand knowledge of local markets to every investment decision. GSAM’s assets under management includes assets managed by Goldman Sachs Asset Management, L.P. and its Investment Advisory Affiliates.

Money Market1
Financial Square FundsSM
| n | | Financial Square Tax-Exempt Funds |
| n | | Financial Square Federal Fund |
| n | | Financial Square Government Fund |
| n | | Financial Square Money Market Fund |
| n | | Financial Square Prime Obligations Fund |
| n | | Financial Square Treasury Instruments Fund |
| n | | Financial Square Treasury Obligations Fund |
Fixed Income
Short Duration and Government
| n | | High Quality Floating Rate Fund |
| n | | Limited Maturity Obligations Fund |
| n | | Short Duration Government Fund |
| n | | Short Duration Income Fund |
| n | | Inflation Protected Securities Fund |
Multi-Sector
| n | | Core Plus Fixed Income Fund |
Municipal and Tax-Free
| n | | High Yield Municipal Fund |
| n | | Short Duration Tax-Free Fund |
Single Sector
| n | | Investment Grade Credit Fund |
| n | | High Yield Floating Rate Fund |
| n | | Emerging Markets Debt Fund |
| n | | Local Emerging Markets Debt Fund |
| n | | Dynamic Emerging Markets Debt Fund |
Corporate Credit
| n | | Long Short Credit Strategies Fund2 |
Fundamental Equity
| n | | Small/Mid Cap Value Fund |
| n | | Small/Mid Cap Growth Fund |
| n | | Flexible Cap Growth Fund |
| n | | Concentrated Growth Fund |
| n | | Technology Tollkeeper Fund |
| n | | Growth Opportunities Fund |
| n | | Rising Dividend Growth Fund |
Structured Equity
| n | | Structured Tax-Managed Equity Fund |
| n | | Structured International Tax-Managed Equity Fund |
| n | | U.S. Equity Dividend and Premium Fund |
| n | | International Equity Dividend and Premium Fund |
Equity Insights3
| n | | Small Cap Equity Insights Fund |
| n | | U.S. Equity Insights Fund |
| n | | Small Cap Growth Insights Fund |
| n | | Large Cap Growth Insights Fund |
| n | | Large Cap Value Insights Fund |
| n | | Small Cap Value Insights Fund |
| n | | International Small Cap Insights Fund |
| n | | International Equity Insights Fund |
| n | | Emerging Markets Equity Insights Fund |
Fundamental Equity International
| n | | Strategic International Equity Fund |
| n | | Focused International Equity Fund4 |
| n | | International Small Cap Fund |
| n | | Emerging Markets Equity Fund |
| n | | BRIC Fund (Brazil, Russia, India, China) |
Select Satellite5
| n | | Real Estate Securities Fund |
| n | | International Real Estate Securities Fund |
| n | | Commodity Strategy Fund |
| n | | Dynamic Allocation Fund |
| n | | Absolute Return Tracker Fund |
| n | | Managed Futures Strategy Fund |
| n | | MLP Energy Infrastructure Fund |
| n | | Multi-Manager Alternatives Fund |
| n | | Multi-Asset Real Return Fund |
| n | | Retirement Portfolio Completion Fund |
| n | | Income Strategies Portfolio |
| n | | Fixed Income Macro Strategies Fund |
Total Portfolio Solutions5
| n | | Balanced Strategy Portfolio |
| n | | Growth and Income Strategy Portfolio |
| n | | Growth Strategy Portfolio |
| n | | Equity Growth Strategy Portfolio |
| n | | Satellite Strategies Portfolio |
| n | | Enhanced Dividend Global Equity Portfolio |
| n | | Tax Advantaged Global Equity Portfolio |
| 1 | | An investment in a money market fund is neither insured nor guaranteed by the Federal Deposit Insurance Corporation (“FDIC”) or any other government agency. Although the Funds seek to preserve the value of your investment at $1.00 per share, it is possible to lose money by investing in the Funds. |
| 2 | | Effective at the close of business March 21, 2014, the Credit Strategies Fund was reorganized into the Long Short Credit Strategies Fund. |
| 3 | | Effective at the close of business May 3, 2013, the Goldman Sachs Structured Large Cap Growth, Structured Large Cap Value, Structured Small Cap Equity, Structured Small Cap Growth, Structured Small Cap Value, Structured U.S. Equity, Structured Emerging Markets Equity, Structured International Equity and Structured International Small Cap Funds were renamed the Goldman Sachs Large Cap Growth Insights, Large Cap Value Insights, Small Cap Equity Insights, Small Cap Growth Insights, Small Cap Value Insights, U.S. Equity Insights, Emerging Markets Equity Insights, International Equity Insights and International Small Cap Insights Funds, respectively. |
| 4 | | Effective at the close of business February 28, 2014, the Goldman Sachs Concentrated International Equity Fund was renamed the Goldman Sachs Focused International Equity Fund. |
| 5 | | Individual Funds within the Total Portfolio Solutions and Select Satellite categories will have various placement on the risk/return spectrum and may have greater or lesser risk than that indicated by the placement of the general Total Portfolio Solutions or Select Satellite category. |
Financial Square FundsSM is a registered service mark of Goldman, Sachs & Co.
| * | | This list covers open-end funds only. Please visit our web site at GSAMFUNDS.com to learn about our closed-end funds. |
| | |
TRUSTEES Ashok N. Bakhru, Chairman Donald C. Burke John P. Coblentz, Jr. Diana M. Daniels Joseph P. LoRusso Herbert J. Markley James A. McNamara Jessica Palmer Alan A. Shuch Richard P. Strubel Roy W. Templin | | OFFICERS James A. McNamara, President Scott M. McHugh, Principal Financial Officer and Treasurer Caroline L. Kraus, Secretary |
| |
GOLDMAN, SACHS & CO. Distributor and Transfer Agent | | GOLDMAN SACHS ASSET MANAGEMENT, L.P. Investment Adviser |
Visit our Web site at www.GSAMFUNDS.com to obtain the most recent month-end returns.
Goldman Sachs Asset Management, L.P., 200 West Street, New York, New York 10282
The reports concerning the Portfolios included in this shareholder report may contain certain forward-looking statements about the factors that may affect the performance of the Portfolios in the future. These statements are based on Portfolio management’s predictions and expectations concerning certain future events and their expected impact on the Portfolios, such as performance of the economy as a whole and of specific industry sectors, changes in the levels of interest rates, the impact of developing world events, and other factors that may influence the future performance of the Portfolios. Management believes these forward-looking statements to be reasonable, although they are inherently uncertain and difficult to predict. Actual events may cause adjustments in portfolio management strategies from those currently expected to be employed.
A description of the policies and procedures that the Portfolios use to determine how to vote proxies relating to portfolio securities and information regarding how a Portfolio voted proxies relating to portfolio securities during the most recent 12-month period ended June 30 is available (i) without charge, upon request by calling 1-800-526-7384 (for Retail Shareholders) or 1-800-621-2550 (for Institutional Shareholders); and (ii) on the Securities and Exchange Commission (“SEC”) web site at http://www.sec.gov.
The Portfolios file their complete schedule of portfolio holdings with the SEC for the first and third quarters of each fiscal year on Form N-Q. The Portfolios’ Forms N-Q are available on the SEC’s web site at http://www.sec.gov within 60 days after the Portfolios’ first and third fiscal quarters. The Portfolios’ Forms N-Q may be reviewed and copied at the SEC’s Public Reference Room in Washington, D.C. and information on the operation of the Public Reference Room may also be obtained by calling 1-800-SEC-0330. Form N-Q may be obtained upon request and without charge by calling 1-800-526-7384 (for Retail Shareholders) or 1-800-621-2550 (for Institutional Shareholders).
The website links provided are for your convenience only and are not an endorsement or recommendation by GSAM of any of these websites or the products or services offered. GSAM is not responsible for the accuracy and validity of the content of these websites.
Economic and market forecasts presented herein reflect our judgment as of the date of this report and are subject to change without notice. These forecasts do not take into account the specific investment objectives, restrictions, tax and financial situation or other needs of any specific client. Actual data will vary and may not be reflected here. These forecasts are subject to high levels of uncertainty that may affect actual performance. Accordingly, these forecasts should be viewed as merely representative of a broad range of possible outcomes. These forecasts are estimated, based on assumptions, and are subject to significant revision and may change materially as economic and market conditions change. Goldman Sachs has no obligation to provide updates or changes to these forecasts. Case studies and examples are for illustrative purposes only.
Goldman, Sachs & Co. (“Goldman Sachs”) does not provide legal, tax or accounting advice. Any statement contained in this communication (including any attachments) concerning U.S. tax matters was not intended or written to be used, and cannot be used, for the purpose of avoiding penalties under the Internal Revenue Code, and was written to support the promotion or marketing of the transaction(s) or matter(s) addressed. Clients of Goldman Sachs should obtain their own independent tax advice based on their particular circumstances.
Holdings and allocations shown are as of February 28, 2014 and may not be representative of future investments. Portfolio holdings should not be relied on in making investment decisions and should not be construed as research or investment advice regarding particular securities. Current and future holdings are subject to risk.
This material is not authorized for distribution to prospective investors unless preceded or accompanied by a current Prospectus or summary prospectus, if applicable. Investors should consider a Fund’s objective, risks, and charges and expenses, and read the summary prospectus, if available, and/or the Prospectus carefully before investing or sending money. The summary prospectus, if available, and the Prospectus contain this and other information about a Fund and may be obtained from your authorized dealer or from Goldman, Sachs & Co. by calling (retail – 1-800-526-7384) (institutional – 1-800-621-2550).
Goldman, Sachs & Co. is the distributor of the Goldman Sachs Funds.
© 2014 Goldman Sachs. All rights reserved. 126947.MF.MED.TMPL/4/2014 TAGEDSAR14/1.6K
The information required by this Item is only required in an annual report on this Form N-CSR.
| ITEM 3. | AUDIT COMMITTEE FINANCIAL EXPERT. |
The information required by this Item is only required in an annual report on this Form N-CSR.
| ITEM 4. | PRINCIPAL ACCOUNTANT FEES AND SERVICES. |
The information required by this Item is only required in an annual report on this Form N-CSR.
| ITEM 5. | AUDIT COMMITTEE OF LISTED REGISTRANTS. |
| ITEM 6. | SCHEDULE OF INVESTMENTS. |
| | Schedule of Investments is included as part of the Report to Stockholders filed under Item 1. |
| ITEM 7. | DISCLOSURE OF PROXY VOTING POLICIES AND PROCEDURES FOR CLOSED-END MANAGEMENT INVESTMENT COMPANIES. |
| ITEM 8. | PORTFOLIO MANAGERS OF CLOSED-END MANAGEMENT INVESTMENT COMPANIES. |
| ITEM 9. | PURCHASES OF EQUITY SECURITIES BY CLOSED-END MANAGEMENT INVESTMENT COMPANY AND AFFILIATED PURCHASERS. |
| ITEM 10. | SUBMISSION OF MATTERS TO A VOTE OF SECURITY HOLDERS. |
| | There have been no material changes to the procedures by which shareholders may recommend nominees to the registrant’s board of trustees. |
| ITEM 11. | CONTROLS AND PROCEDURES. |
| | (a) | The registrant’s principal executive and principal financial officers, or persons performing similar functions have concluded that the registrant’s disclosure controls and procedures (as defined in Rule 30a-3(c) under the Investment Company Act of 1940, as amended (the “1940 Act”)) are effective as of a date within 90 days of the filing of this report that includes the disclosure required by this paragraph, based on the evaluation of these controls and procedures required by Rule 30a-3(b) under the 1940 Act and 15d-15(b) under the Securities Exchange Act of 1934, as amended. |
| | (b) | There were no changes in the registrant’s internal control over financial reporting (as defined in Rule 30a-3(d) under the 1940 Act) that occurred during the registrant’s second fiscal quarter of the period covered by this report that have materially affected, or are reasonably likely to materially affect, the registrant’s internal control over financial reporting. |
| | | | |
(a)(1) | | The information required by this Item is only required in an annual report on this Form N-CSR. |
| | |
| (a)(2) | | Exhibit 99.CERT | | Certifications pursuant to Section 302 of the Sarbanes-Oxley Act of 2002 filed herewith. |
| | |
| (b) | | Exhibit 99.906CERT | | Certifications pursuant to Section 906 of the Sarbanes-Oxley Act of 2002 filed herewith. |
SIGNATURES
Pursuant to the requirements of the Securities Exchange Act of 1934 and the Investment Company Act of 1940, the registrant has duly caused this report to be signed on its behalf by the undersigned, thereunto duly authorized.
| | |
| | | Goldman Sachs Trust |
| |
| By: | | /s/ James A. McNamara |
| |
| | |
| | James A. McNamara |
| | President/Principal Executive Officer |
| | Goldman Sachs Trust |
| |
| Date: | | May 7, 2014 |
Pursuant to the requirements of the Securities Exchange Act of 1934 and the Investment Company Act of 1940, this report has been signed below by the following persons on behalf of the registrant and in the capacities and on the dates indicated.
| | |
| By: | | /s/ James A. McNamara |
| |
| | |
| | James A. McNamara |
| | President/Principal Executive Officer |
| | Goldman Sachs Trust |
| |
| Date: | | May 7, 2014 |
| |
| By: | | /s/ Scott McHugh |
| |
| | |
| | Scott McHugh |
| | Principal Financial Officer |
| | Goldman Sachs Trust |
| |
| Date: | | May 7, 2014 |