UNITED STATES
SECURITIES AND EXCHANGE COMMISSION
Washington, D.C. 20549
FORM N-CSR
CERTIFIED SHAREHOLDER REPORT OF REGISTERED
MANAGEMENT INVESTMENT COMPANIES
Investment Company Act file number 811-05349
Goldman Sachs Trust
(Exact name of registrant as specified in charter)
71 South Wacker Drive, Chicago, Illinois 60606
(Address of principal executive offices) (Zip code)
| | |
| Caroline Kraus, Esq. | | Copies to: |
| Goldman, Sachs & Co. | | Geoffrey R.T. Kenyon, Esq. |
| 200 West Street | | Dechert LLP |
| New York, New York 10282 | | 100 Oliver Street |
| | 40th Floor |
| | Boston, MA 02110-2605 |
(Name and address of agents for service)
Registrant’s telephone number, including area code: (312) 655-4400
Date of fiscal year end: November 30
Date of reporting period: May 31, 2014
| ITEM 1. | REPORTS TO STOCKHOLDERS. |
| | The Semi-Annual Report to Stockholders is filed herewith. |
Goldman Sachs Funds

| | | | |
| | |
| Semi-Annual Report | | | | May 31, 2014 |
| | |
| | | | MLP Energy Infrastructure Fund |

Goldman Sachs MLP Energy Infrastructure Fund
| | | | |
TABLE OF CONTENTS | | | | |
| |
Principal Investment Strategies and Risks | | | 1 | |
| |
Investment Process | | | 2 | |
| |
Portfolio Management Discussion and Performance Summaries | | | 3 | |
| |
Schedules of Investments | | | 9 | |
| |
Financial Statements | | | 11 | |
| |
Financial Highlights | | | 14 | |
| |
Notes to Financial Statements | | | 16 | |
| |
Other Information | | | 28 | |
| | | | |
| | | |
| NOT FDIC-INSURED | | May Lose Value | | No Bank Guarantee |
GOLDMAN SACHS MLP ENERGY INFRASTRUCTURE FUND
Principal Investment Strategies and Risks
This is not a complete list of risks that may affect the Fund. For additional information concerning the risks applicable to the Fund, please see the Fund’s Prospectus.
The Goldman Sachs MLP Energy Infrastructure Fund invests primarily in a portfolio of master limited partnership (“MLP”) investments in the energy sector. The Fund’s equity investments are subject to market risk, which means that the value of the securities in which it invests may go up or down in response to the prospects of individual companies, particular sectors and/or general economic conditions. Investments in MLPs are subject to certain risks, including risks related to limited control and limited rights to vote, potential conflicts of interest, cash flow risks, dilution risks, limited liquidity, risks related to the general partner’s right to force sales at undesirable times or prices, interest rate sensitivity and for MLPs with smaller capitalizations, lower trading volume and abrupt or erratic price movements. MLPs are also subject to risks relating to their complex tax structure, including the risk that an MLP could lose its tax status as a partnership, resulting in a reduction in the value of the Fund’s investment in the MLP and lower income to the Fund. MLPs are also subject to the risk that to the extent that a distribution received from an MLP is treated as a return of capital, the Fund’s adjusted tax basis in the MLP interests may be reduced, which may increase the Fund’s tax liability upon the sale of the MLP interests or upon subsequent distributions in respect of such interests. The Fund’s strategy of investing primarily in MLPs, resulting in its being taxed as a regular corporation, or “C” corporation, involves complicated accounting, tax and valuation issues. Many MLPs in which the Fund invests operate facilities within the energy sector and are also subject to risks affecting that sector. Because the Fund concentrates its investments in the energy sector, the Fund is subject to greater risk of loss as a result of adverse economic, business or other developments affecting industries within that sector than if its investments were more diversified across different industries. The Fund may invest in private investment in public equities (“PIPEs”) which may be deemed illiquid. The securities of mid- and small-capitalization companies involve greater risks than those associated with larger, more established companies and may be subject to more abrupt or erratic price movements. The Fund is “non-diversified” and may invest a larger percentage of its assets in fewer issuers than “diversified” funds. Accordingly, the Fund may be more susceptible to adverse developments affecting any single issuer held in its portfolio and to greater losses resulting from these developments.
1
GOLDMAN SACHS MLP ENERGY INFRASTRUCTURE FUND
What Differentiates Goldman Sachs’ MLP
Energy Infrastructure Fund Investment Process?
With a quality-oriented approach, the MLP Energy Infrastructure Fund seeks total return through current income and capital appreciation. We have an experienced investment team integrated within Goldman Sachs Asset Management, L.P. (“GSAM”), allowing us to leverage franchise expertise and risk framework across multiple asset classes. We invest primarily in Master Limited Partnerships (“MLPs”), or similar structures, that own energy infrastructure assets.

| n | | To capture the full energy chain, we analyze energy production and user trends that ultimately impact energy infrastructure. |
| n | | We rigorously assess companies on both the asset and equity level. |

First, we analyze overall energy trends through capital spending shifts and drilling trends, in addition to regional supply and demand imbalances.
| n | | Top-Down Sector Selection |
Secondly, we establish the impact of macro and regional trends on energy infrastructure.
| n | | Bottom-Up Security Selection |
Finally, we select names by evaluating a company’s management, assets, expected returns and technicals.

| n | | Our team of MLP dedicated investment professionals includes lead portfolio managers averaging 10 years of investment experience. |
| n | | Ability to leverage energy related resources across GSAM Equity, Fixed Income and Commodity groups, as well as utilize risk management resources. |
| n | | Unique investment approach stemming from a more holistic view across the extremes of the energy value chain, corporate access, broader valuation understanding, and resource advantages. |
2
PORTFOLIO RESULTS
Goldman Sachs MLP Energy Infrastructure Fund
Investment Objective And Principal Strategy
The Fund seeks total return through current income and capital appreciation. Under normal circumstances, the Fund invests at least 80% of its net assets plus any borrowings for investment purposes (measured at the time of purchase) in energy infrastructure master limited partnership (“MLP”) investments. Energy infrastructure MLPs own and operate assets that are used in the energy sector, including assets used in exploring, developing, producing, generating, transporting (including marine), transmitting, terminal operation, storing, gathering, processing, refining, distributing, mining or marketing of natural gas, natural gas liquids, crude oil, refined products, coal or electricity, or that provide energy-related equipment or services. The Fund’s MLP investments may include, but are not limited to: MLPs structured as limited partnerships or limited liability companies; MLPs that are taxed as “C” corporations; institutional units issued by MLP affiliates; “C” corporations that hold significant interests in MLPs; private investments in public equities (“PIPEs”) issued by MLPs; and other equity and fixed income securities and derivative instruments, including pooled investment vehicles and exchange-traded notes that provide exposure to MLPs. The Fund’s MLP investments may be of any capitalization size.
Portfolio Management Discussion and Analysis
Below, the Goldman Sachs Energy and Infrastructure Team discusses the Goldman Sachs MLP Energy Infrastructure Fund’s (the “Fund”) performance and positioning for the six-month period ended May 31, 2014 (the “Reporting Period”).
| Q | | How did the Fund perform during the Reporting Period? |
| A | | During the Reporting Period, the Fund’s Class A, Class C, Institutional, Class IR and Class R Shares generated cumulative total returns, without sales charges, of 16.49%, 15.99%, 16.61%, 16.53% and 16.31%, respectively. These returns compare to the 11.62% cumulative total return of the Alerian MLP Total Return Index (the “Alerian Index”). The Alerian Index1 is a composite of the 50 most prominent energy MLPs. |
| Q | | How did energy master limited partnerships (“MLPs”) overall perform during the Reporting Period? |
| A | | During the Reporting Period, the Alerian Index generated a positive return of 11.62%, supported by solid fundamentals, strong investment flows and a decline in interest rates. |
| | | From a fundamentals perspective, domestic hydrocarbon production increased on a year-over-year basis (“y-o-y”) during the Reporting Period.2 Domestic crude oil production increased 13.6% on a y-o-y basis. This production increase was largely driven by acceleration in fast growing plays, such as the Bakken, Eagle Ford and Permian Basins, from which the Energy Information Administration (“EIA”) believes the majority of domestic production growth to be driven over the next several years. U.S. natural gas production increased 3.9% y-o-y, as below-average temperatures throughout the U.S. during the winter months improved natural gas demand and pushed natural gas prices up to an average of $5.06/MMbtu (one million British thermal unit, “MMbtu”) in the first quarter of 2014. Natural gas liquid (“NGL”) production also increased y-o-y and was up 0.5%. A driver for increased NGL production was strong domestic demand for propane during the first calendar quarter due to colder than average winter weather, as propane, like natural gas, is widely used for home heating in the U.S. Additionally, the increased demand for propane during the winter months followed increased demand for its use for crop drying in the Midwest resulting from wetter than normal weather, which, in turn, contributed to the propane price spike in January 2014. The increase in domestic production and the requisite energy infrastructure investment necessary to support these production levels continued to be supportive of energy MLPs. |
| 2 | | Based upon the most recent available data from the U.S. Energy Information Administration (April 2014); Y-o-Y EIA figures reflect November 2013-April 2014 versus November 2012-April 2013. |
3
PORTFOLIO RESULTS
| | | The sector saw strong flows into the asset class, as evidenced by $9.4 billion of inflows into the sector from exchange traded funds (“ETFs”), exchange traded notes (“ETNs”) and mutual funds during the Reporting Period. This compares with $8.2 billion of inflows for the same period one year prior. The growing inflows into the sector continued to be supportive of MLPs during the Reporting Period. |
| | | Declining interest rates during the Reporting Period served as a tailwind for MLPs as well. During the Reporting Period, the yield on the 10-year U.S. Treasury note declined 59 basis points from 2.75% to 2.16%. (A basis point is 1/100th of a percentage point.) This move in the 10-year U.S. Treasury note yield was somewhat counterintuitive, since the Federal Reserve (the “Fed”) announced on December 18, 2013 it would begin tapering its asset purchase program in January 2014. The Fed gradually reduced its purchases of mortgage-backed securities and U.S. Treasury securities during the Reporting Period. |
| | | During the Reporting Period, the 11.62% return of the Alerian Index outperformed the S&P 500® Index (+7.6%) and the AMEX Energy Select (+11.4%).3 The Alerian Index underperformed the utilities (+13.1%) and real estate investment trust (“REIT”) (+15.7%) sectors, as represented by the Philadelphia Stock Exchange (PHLX) Utility Sector Index and the FTSE NAREIT (National Association of Real Estate Investment Trusts) U.S. Real Estate Index, respectively.4 The Alerian Index had outperformed these sectors by 21.1% and 24.8%, respectively, in 2013. |
| Q | | What key factors were responsible for the Fund’s performance during the Reporting Period? |
| A | | Security selection drove the Fund’s relative outperformance during the Reporting Period. The Fund benefited from its ownership of what we considered to be quality companies with strong management teams, healthy balance sheets and favorable commodity and geographical exposures. |
| Q | | What individual holdings added to the Fund’s performance during the Reporting Period? |
| A | | During the Reporting Period, the Fund benefited from its investments in Emerge Energy Services LP and Targa Resources. |
| | | Emerge Energy Services LP (EMES) is engaged in two business segments. The first is the mining, processing, and distributing of silica sand, used for the hydraulic fracturing of oil and gas wells. The second is the processing of transmix and the distribution of refined products. On a total return basis, EMES was up 147.1% during the Reporting Period. EMES reported strong earnings for the fourth quarter of 2013 and the first quarter of 2014, driven by record production levels hit in both quarters due to strong demand for Northern White silica sand. Additionally, EMES announced two new major dry plant facilities during the Reporting Period, both of which it expects to be operational later this year. As of May 31, 2014, EMES had a yield of 4.8%. |
| | | Targa Resources, (TRGP) through its interests in the MLP, Targa Resources Partners LP (NGLS), provides midstream natural gas and natural gas liquid services. The midstream component of the energy industry is usually defined as those companies providing products or services that help link the supply side (i.e. energy producers) and the demand side (i.e. energy end-users) for any type of energy commodity. Such midstream business can include, but are not limited to, those that process, store, market and transport various energy commodities. TRGP provided guidance for a strong 25%+ dividend growth during 2014 (over 2013), and during the first and second quarters of 2014, TRGP saw distribution growth of 32.8% and 30.8% respectively on a y-o-y basis. During the Reporting Period, TRGP was up 43.6% on a total return basis. As of May 31, 2014, TRGP had a yield of 2.3%. |
| 3 | | The S&P 500 Index is a diverse index that includes 500 American companies that represent over 70% of the total market capitalization of the U.S. stock market. The Energy Select Sector Index (IXE) is a modified market capitalization-based index intended to track the movements of companies that are components of the S&P 500 and are involved in the development or production of energy products. |
| 4 | | The PHLX Utility Sector Index is composed of geographically diverse public U.S. utility stocks. The FTSE NAREIT U.S. Real Estate Index series is a family of REIT performance indexes that span the commercial real estate space across the U.S. economy, offering exposure to all investment and property sectors. |
4
PORTFOLIO RESULTS
| Q | | What individual holdings detracted from the Fund’s performance during the Reporting Period? |
| A | | During the Reporting Period, the largest detractors from the Fund’s results were Markwest Energy Partners LP and OCI Partners LP. |
| | | Markwest Energy Partners LP (MWE) is engaged in the gathering, processing and transportation of natural gas; the gathering, transportation, fractionation, storage and marketing of NGLs; and the gathering and transportation of crude oil. A primary driver of MWE’s poor performance during the Reporting Period was its guidance during its fourth quarter 2013 earnings announcement on February 26, 2014 of muted distribution growth for the next few quarters due to higher than anticipated 2015 capital expenditure estimates (and its resulting equity needs). Additionally, MWE announced a tight coverage ratio of 0.94x for the fourth quarter of 2013 due to operational issues on some assets despite overall volume growth. While we believe distribution growth may be muted for the next few quarters, we continue to believe MWE may offer attractive distribution growth in the longer term due to its attractive exposure to the high growth Marcellus and Utica shale areas. MWE had a total return of -7.9% during the Reporting Period. As of May 31, 2014, MWE had a yield of 5.6%. |
| | | OCI Partners LP (OCIP) owns and operates methanol and ammonia production facilities. A driver of OCIP’s weak performance during the Reporting Period was its guidance during its fourth quarter 2013 earnings announcement on March 19, 2014 that the completion of its “debottlenecking” expansion plan, which was anticipated to increase methanol annual production capacity by approximately 25% and annual ammonia production capacity by approximately 15% per year, had been delayed from the third quarter of 2014 to the fourth quarter of 2014. Debottlenecking is an increase in the production capacity of existing facilities through the modification of existing equipment. OCIP had a total return of -16.7% during the Reporting Period. As of May 31, 2014, OCIP had a yield of 8.3%. |
| Q | | Were there any notable purchases or sales during the Reporting Period? |
| A | | There were no notable sales as a percentage of net assets during the Reporting Period. The Fund made large, notable purchases in Inter Pipeline Ltd (IPL) and Sunoco Logistics Partners LP (SXL). IPL is a Canada-domiciled corporation engaged in three major businesses: owning and operating crude oil and condensate pipeline systems; natural gas liquids extraction; and bulk liquid storage. As of May 31, 2014, IPL had an indicated yield of 4.1%. SXL primarily acquires, owns, and operates refined products and crude oil pipelines. As of May 31, 2014, SXL had an indicated yield of 3.0%. |
| Q | | How did the Fund use derivatives and similar instruments during the Reporting Period? |
| A | | During the Reporting Period, the Fund did not use derivatives or similar instruments. |
| Q | | What is the Fund’s tactical view and strategy for the months ahead? |
| A | | After 11.62% appreciation in the MLP sector during the Reporting Period, we acknowledge that the returns of the Alerian Index through the remainder of the year could be limited to distributions with little to no price appreciation. That said, the MLP sector continues to benefit from strong fundamentals and supportive fund flows, in our view. Additionally, we continue to believe there may be potential distribution growth for 2014 that may be approximately in line with 2013 levels, with visibility for similar rates of growth for the foreseeable future. However, we note that the Fed’s ongoing tapering of its asset purchase program may push interest rates higher, which we believe could act as a headwind for the sector. |
| | | From a thematic standpoint, we seek to own energy infrastructure MLPs that we consider to be quality companies with strong management teams, healthy balance sheets, adequate distribution coverage and favorable commodity and geographical exposures. |
5
FUND BASICS
Goldman Sachs MLP Energy Infrastructure Fund
as of May 31, 2014
| | | | | | | | | | |
| | PERFORMANCE REVIEW | |
| | | December 1, 2013– May 31, 2014 | | Fund Total Return
(based on NAV)1 | | | Alerian MLP
Total Return Index2 | |
| | Class A | | | 16.49 | % | | | 11.62 | % |
| | Class C | | | 15.99 | | | | 11.62 | |
| | Institutional | | | 16.61 | | | | 11.62 | |
| | Class IR | | | 16.53 | | | | 11.62 | |
| | | Class R | | | 16.31 | | | | 11.62 | |
| | 1 | | The net asset value (“NAV”) represents the net assets of the class of the Fund (ex-dividend) divided by the total number of shares of the class outstanding. The Fund’s performance assumes the reinvestment of dividends and other distributions. The Fund’s performance does not reflect the deduction of any applicable sales charges. |
| | 2 | | The Alerian MLP Index is a composite of the 50 most prominent energy master limited partnerships calculated by Standard & Poor’s using a float-adjusted market capitalization methodology. The index is disseminated by the New York Stock Exchange real-time on a price return basis (NYSE: AMZ). The corresponding total return index is calculated and disseminated daily through ticker AMZX. |
| | | | | | | | | | |
| | STANDARDIZED TOTAL RETURNS3 |
| | | For the period ended 3/31/14 | | One Year | | | Since Inception | | Inception Date |
| | Class A | | | 16.13 | % | | 15.94% | | 3/28/13 |
| | Class C | | | 21.00 | | | 21.79 | | 3/28/13 |
| | Institutional | | | 23.38 | | | 23.10 | | 3/28/13 |
| | Class IR | | | 23.18 | | | 22.90 | | 3/28/13 |
| | | Class R | | | 22.56 | | | 22.29 | | 3/28/13 |
| | 3 | | The Standardized Total Returns are average annual total returns as of the most recent calendar quarter-end. They assume reinvestment of all distributions at net asset value. These returns reflect a maximum initial sales charge of 5.5% for Class A Shares and the contingent deferred sales charge for Class C Shares (1% if shares are redeemed within 12 months of purchase). Because Institutional, Service, Class IR and Class R Shares do not involve a sales charge, such a charge is not applied to their Standardized Total Returns. |
The returns set forth in the tables above represent past performance. Past performance does not guarantee future results. The Fund’s investment return and principal value will fluctuate so that an investor’s shares, when redeemed, may be worth more or less than their original cost. Current performance may be lower or higher than the performance quoted above. Please visit our web site at www.GSAMFUNDS.com to obtain the most recent month-end returns. Performance reflects applicable fee waivers and/or expense limitations in effect during the periods shown. In their absence, performance would be reduced. Returns do not reflect the deduction of taxes that a shareholder would pay on Fund distributions or the redemption of Fund shares.
6
FUND BASICS
| | | | | | | | | | | | | | | | | | |
| | EXPENSE RATIOS | |
| | | | | Net Operating Expenses Ratio (After Waivers
Excluding Tax
Benefit/Expense)5 | | | Gross Operating Expense Ratio (Before Waivers
Excluding Tax Benefit/Expense) | | | Net Expense Ratio (After Waivers Including
Tax Benefit/
Expense)4,5 | | | Gross Expense Ratio (Before Waivers Including
Tax Benefit/
Expense)4 | |
| | Class A | | | 1.50 | % | | | 1.93 | % | | | 9.35 | % | | | 9.78 | % |
| | Class C | | | 2.25 | | | | 2.68 | | | | 10.10 | | | | 10.53 | |
| | Institutional | | | 1.10 | | | | 1.53 | | | | 8.95 | | | | 9.38 | |
| | Class IR | | | 1.25 | | | | 1.68 | | | | 9.10 | | | | 9.53 | |
| | | Class R | | | 1.75 | | | | 2.18 | | | | 9.60 | | | | 10.03 | |
| | 4 | | These expense ratios of the Fund are as set forth above according to the most recent publicly available Prospectus for the Fund and may differ from the expense ratios disclosed in the Financial Highlights in this report. |
| | 5 | | The Fund’s waivers and/or expense limitations will remain in place through at least March 28, 2015, and prior to such date the Investment Adviser may not terminate the arrangements without the approval of the Fund’s Board of Trustees. If these arrangements are discontinued in the future, the expense ratios may change without shareholder approval. |
| | | | | | | | |
| | TOP TEN HOLDINGS AS OF 5/31/145 |
| | | Holding | | % of Net Assets | | | Line of Business |
| | Summit Midstream Partners, LP | | | 4.9 | % | | Natural Gas and NGL
Infrastructure |
| | Access Midstream Partners, LP | | | 4.8 | | | Natural Gas and NGL
Infrastructure |
| | Sunoco Logistics Partners, LP | | | 4.6 | | | Liquids, Pipelines &
Terminalling |
| | Magellan Midstream Partners, LP | | | 4.6 | | | Liquids, Pipelines &
Terminalling |
| | Targa Resources Corp. | | | 4.5 | | | General Partner |
| | SemGroup Corp. Class A | | | 4.2 | | | General Partner |
| | EQT Midstream Partners, LP | | | 3.9 | | | Natural Gas and NGL
Infrastructure |
| | Inter Pipeline, Ltd. | | | 3.8 | | | Diversified Midstream |
| | Enterprise Products Partners, LP | | | 3.7 | | | Diversified Midstream |
| | | Emerge Energy Services, LP | | | 3.0 | | | Other |
| | 5 | | The top 10 holdings may not be representative of the Fund’s future investments. |
7
FUND BASICS
| | |
| FUND SECTOR ALLOCATIONS6 | | |
| As of May 31, 2014 | | |
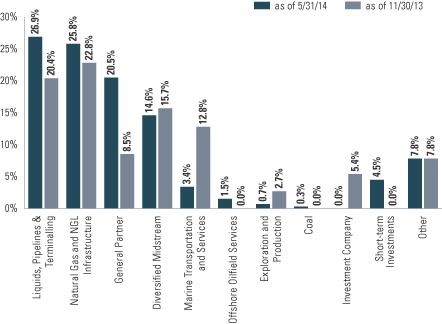
| | 6 | | The Fund is actively managed and, as such, its composition may differ over time. Consequently, the Fund’s overall sector allocations may differ from the percentages contained in the graph above. The percentage shown for each investment category reflects the value of investments in that category as a percentage of total net assets. Short-term investments represent repurchase agreements. The graph depicts the Fund’s investments but may not represent the Fund’s market exposure due to the exclusion of certain derivatives, if any, as listed in the Additional Investment Information section of the Schedule of Investments. |
8
GOLDMAN SACHS MLP ENERGY INFRASTRUCTURE FUND
Schedule of Investments
May 31, 2014 (Unaudited)
| | | | | | | | |
Shares | | | Description | | Value | |
| | | | | | | | |
| | Common Stocks – 101.5% | |
| | Coal – 0.3% | |
| | 37,072 | | | Alliance Resource Partners LP | | $ | 3,371,698 | |
| | |
| | Diversified Midstream – 14.6% | |
| | 284,490 | | | Enable Midstream Partners LP* | | | 7,226,046 | |
| | 291,700 | | | Energy Transfer Partners LP | | | 16,428,544 | |
| | 702,200 | | | Enterprise Products Partners LP | | | 52,538,604 | |
| | 1,834,700 | | | Inter Pipeline Ltd. | | | 53,756,727 | |
| | 963,578 | | | NGL Energy Partners LP | | | 38,543,120 | |
| | 295,900 | | | Targa Resources Partners LP | | | 20,109,364 | |
| | 320,000 | | | Williams Partners LP | | | 16,995,200 | |
| | | | | | | | |
| | | | | | | 205,597,605 | |
| | |
| | Exploration and Production – 0.7% | |
| | 445,000 | | | Memorial Production Partners LP | | | 9,954,650 | |
| | |
| | General Partner – 20.5% | |
| | 96,106 | | | Alliance Holdings GP LP | | | 6,179,616 | |
| | 78,000 | | | Crestwood Equity Partners LP | | | 1,095,900 | |
| | 563,700 | | | Energy Transfer Equity LP | | | 28,726,152 | |
| | 15,000 | | | EnLink Midstream LLC | | | 619,050 | |
| | 567,800 | | | ONEOK, Inc. | | | 36,617,422 | |
| | 870,000 | | | Plains GP Holdings LP Class A | | | 24,012,000 | |
| | 878,500 | | | SemGroup Corp. Class A | | | 59,685,290 | |
| | 230,800 | | | Spectra Energy Corp. | | | 9,365,864 | |
| | 544,800 | | | Targa Resources Corp. | | | 62,630,208 | |
| | 230,000 | | | Teekay Corp. | | | 13,305,500 | |
| | 615,400 | | | The Williams Cos., Inc. | | | 28,899,184 | |
| | 330,300 | | | Western Gas Equity Partners LP | | | 17,162,388 | |
| | | | | | | | |
| | | | | | | 288,298,574 | |
| | |
| | Liquids, Pipelines & Terminalling – 26.9% | |
| | 432,700 | | | Buckeye Partners LP | | | 33,949,642 | |
| | 26,005 | | | Delek Logistics Partners LP | | | 907,054 | |
| | 222,700 | | | Genesis Energy LP | | | 12,693,900 | |
| | 785,450 | | | Magellan Midstream Partners LP | | | 64,312,646 | |
| | 48,500 | | | NuStar Energy LP | | | 2,813,970 | |
| | 402,531 | | | Oiltanking Partners LP | | | 35,865,512 | |
| | 1,510,000 | | | PBF Logistics LP*(a) | | | 40,392,500 | |
| | 299,200 | | | Phillips 66 Partners LP | | | 18,116,560 | |
| | 714,000 | | | Plains All American Pipeline LP | | | 40,319,580 | |
| | 325,964 | | | Rose Rock Midstream LP | | | 14,156,617 | |
| | 115,500 | | | Sprague Resources LP | | | 2,856,315 | |
| | 705,500 | | | Sunoco Logistics Partners LP | | | 64,906,000 | |
| | 427,920 | | | Tesoro Logistics LP | | | 29,826,024 | |
| | 487,700 | | | Western Refining Logistics LP | | | 16,030,699 | |
| | | | | | | | |
| | | | | | | 377,147,019 | |
| | |
| | Marine Transportation and Services – 3.4% | |
| | 1,327,500 | | | Dynagas LNG Partners LP(a) | | | 31,899,825 | |
| | 355,600 | | | KNOT Offshore Partners LP | | | 9,757,664 | |
| | 300,200 | | | Navios Maritime Partners LP | | | 5,538,690 | |
| | | | | | | | |
| | | | | | | 47,196,179 | |
| | |
| | Natural Gas and NGL Infrastructure – 25.8% | |
| | 1,071,000 | | | Access Midstream Partners LP | | | 67,462,290 | |
| | 28,360 | | | American Midstream Partners LP | | | 838,605 | |
| | |
| | | | | | | | |
| | Common Stocks – (continued) | |
| | Natural Gas and NGL Infrastructure – (continued) | |
| | 202,200 | | | Crestwood Midstream Partners LP | | $ | 4,407,960 | |
| | 743,300 | | | DCP Midstream Partners LP | | | 39,922,643 | |
| | 1,000,000 | | | EnLink Midstream Partners LP | | | 30,470,000 | |
| | 669,800 | | | EQT Midstream Partners LP | | | 55,017,372 | |
| | 209,617 | | | MarkWest Energy Partners LP | | | 12,985,773 | |
| | 242,200 | | | ONEOK Partners LP | | | 13,345,220 | |
| | 878,656 | | | QEP Midstream Partners LP | | | 21,245,902 | |
| | 173,400 | | | Regency Energy Partners LP | | | 4,820,520 | |
| | 1,531,394 | | | Summit Midstream Partners LP | | | 68,928,044 | |
| | 17,400 | | | USA Compression Partners LP | | | 435,000 | |
| | 593,200 | | | Western Gas Partners LP | | | 42,704,468 | |
| | | | | | | | |
| | | | | | | 362,583,797 | |
| | |
| | Offshore Oilfield Services – 1.5% | |
| | 260,000 | | | North Atlantic Drilling Ltd. | | | 2,727,400 | |
| | 563,450 | | | Seadrill Partners LLC | | | 18,503,698 | |
| | | | | | | | |
| | | | | | | 21,231,098 | |
| | |
| | Other – 7.8% | |
| | 370,100 | | | CVR Refining LP | | | 9,907,577 | |
| | 450,308 | | | Emerge Energy Services LP | | | 42,815,285 | |
| | 300,000 | | | Hi-Crush Partners LP | | | 15,021,000 | |
| | 841,100 | | | Northern Tier Energy LP | | | 23,458,279 | |
| | 935,544 | | | OCI Partners LP | | | 18,411,506 | |
| | | | | | | | |
| | | | | | | 109,613,647 | |
| | |
| | TOTAL COMMON STOCKS | | | | |
| | (Cost $1,210,488,291) | | $ | 1,424,994,267 | |
| | |
| | | | | | | | | | | | | | |
Principal Amount | | | Interest
Rate | | | Maturity
Date | | | Value | |
| | Short-term Investment(b) – 4.5% | |
| | Repurchase Agreement – 4.5% | |
| Joint Repurchase Agreement Account II | |
| $ | 63,400,000 | | | | 0.083 | % | | | 06/02/14 | | | $ | 63,400,000 | |
| | (Cost $63,400,000) | |
| | |
| | TOTAL INVESTMENTS – 106.0% | |
| | (Cost $1,273,888,291) | | | $ | 1,488,394,267 | |
| | |
| LIABILITIES IN EXCESS OF
OTHER ASSETS – (6.0)% |
| | | (83,777,040 | ) |
| | |
| | NET ASSETS – 100.0% | | | $ | 1,404,617,227 | |
| | |
| | |
| The percentage shown for each investment category reflects the value of investments in that category as a percentage of net assets. |
* | | Non-income producing security. |
(a) | | Represents an affiliated issuer. |
(b) | | Joint repurchase agreement was entered into on May 30, 2014. Additional information appears on page 10. |
| | |
| The accompanying notes are an integral part of these financial statements. | | 9 |
GOLDMAN SACHS MLP ENERGY INFRASTRUCTURE FUND
Schedule of Investments (continued)
May 31, 2014 (Unaudited)
|
| ADDITIONAL INVESTMENT INFORMATION |
JOINT REPURCHASE AGREEMENT ACCOUNT II — At May 31, 2014, the Fund had undivided interests in the Joint Repurchase Agreement Account II, with a maturity date of June 2, 2014, as follows:
| | | | | | | | |
Principal Amount | | Maturity Value | | | Collateral Allocation Value | |
| $63,400,000 | | $ | 63,400,440 | | | $ | 64,892,226 | |
REPURCHASE AGREEMENTS — At May 31, 2014, the Principal Amount of the Fund’s interest in the Joint Repurchase Agreement Account II was as follows:
| | | | | | | | |
| Counterparty | | Interest Rate | | | Principal Amounts | |
BNP Paribas Securities Co. | | | 0.090 | % | | $ | 16,665,415 | |
Citigroup Global Markets, Inc. | | | 0.070 | | | | 5,290,608 | |
Merrill Lynch & Co., Inc. | | | 0.080 | | | | 16,406,175 | |
TD Securities (USA) LLC | | | 0.080 | | | | 13,226,520 | |
TD Securities (USA) LLC | | | 0.090 | | | | 9,258,564 | |
Wells Fargo Securities LLC | | | 0.080 | | | | 2,552,718 | |
| TOTAL | | | | | | $ | 63,400,000 | |
At May 31, 2014, the Joint Repurchase Agreement Account II was fully collateralized by:
| | | | | | | | |
| Issuer | | Interest Rates | | | Maturity Dates | |
Federal Farm Credit Bank | | | 0.161% to 1.460 | % | | | 02/16/16 to 11/21/18 | |
Federal Home Loan Bank | | | 2.875 | | | | 06/14/24 | |
Federal Home Loan Mortgage Corp. | | | 0.500 to 6.000 | | | | 04/17/15 to 05/01/44 | |
Federal National Mortgage Association | | | 1.375 to 7.125 | | | | 03/01/15 to 06/01/44 | |
Government National Mortgage Association | | | 3.000 to 5.000 | | | | 09/15/42 to 06/20/43 | |
United States Treasury Bill | | | 0.000 | | | | 10/16/14 | |
United States Treasury Inflation Protected Securities | | | 0.500 to 2.500 | | | | 07/15/14 to 07/15/16 | |
United States Treasury Coupon-Only Stripped Security | | | 0.000 | | | | 11/15/15 | |
United States Treasury Notes | | | 0.250 to 2.125 | | | | 03/31/15 to 08/15/21 | |
| | |
| 10 | | The accompanying notes are an integral part of these financial statements. |
GOLDMAN SACHS MLP ENERGY INFRASTRUCTURE FUND
Statement of Assets and Liabilities
May 31, 2014 (Unaudited)
| | | | | | |
| | | | | | |
| | Assets: | | | | |
| | Investments of unaffiliated issuers, at value (cost $1,210,828,314) | | $ | 1,416,101,942 | |
| | Investments of affiliated issuers, at value (cost $63,059,977) | | | 72,292,325 | |
| | Cash | | | 71,603 | |
| | Receivables: | | | | |
| | Fund shares sold | | | 30,971,241 | |
| | Dividends and interest | | | 161,377 | |
| | Reimbursement from investment adviser | | | 73,092 | |
| | Foreign tax reclaims | | | 42,687 | |
| | Other assets | | | 3,576 | |
| | Total assets | | | 1,519,717,843 | |
| | | | | | |
| | Liabilities: | | | | |
| | Deferred tax, net | | | 77,347,821 | |
| | Payables: | | | | |
| | Investments purchased | | | 33,148,677 | |
| | Amounts owed to affiliates | | | 2,185,430 | |
| | Fund shares redeemed | | | 2,161,849 | |
| | Accrued expenses | | | 256,839 | |
| | Total liabilities | | | 115,100,616 | |
| | | | | | |
| | Net Assets: | | | | |
| | Paid-in capital | | | 1,295,177,081 | |
| | Distributions in excess of net investment income (loss), net of taxes | | | (22,697,886 | ) |
| | Accumulated net realized gain, net of taxes | | | 3,584,069 | |
| | Net unrealized gain, net of taxes | | | 128,553,963 | |
| | | NET ASSETS | | $ | 1,404,617,227 | |
| | | Net Assets: | | | | |
| | | Class A | | $ | 336,136,818 | |
| | | Class C | | | 100,356,831 | |
| | | Institutional | | | 888,685,902 | |
| | | Class IR | | | 79,378,806 | |
| | | Class R | | | 58,870 | |
| | | Total Net Assets | | $ | 1,404,617,227 | |
| | | Shares Outstanding $0.001 par value (unlimited shares authorized): | | | | |
| | | Class A | | | 27,267,698 | |
| | | Class C | | | 8,208,228 | |
| | | Institutional | | | 71,740,360 | |
| | | Class IR | | | 6,416,808 | |
| | | Class R | | | 4,787 | |
| | | Net asset value, offering and redemption price per share:(a) | | | | |
| | | Class A | | | $12.33 | |
| | | Class C | | | 12.23 | |
| | | Institutional | | | 12.39 | |
| | | Class IR | | | 12.37 | |
| | | Class R | | | 12.30 | |
| | (a) | | Maximum public offering price per share for Class A Shares is $13.05. At redemption, Class C Shares may be subject to a contingent deferred sales charge, assessed on the amount equal to the lesser of the current net asset value or the original purchase price of the shares. |
| | |
| The accompanying notes are an integral part of these financial statements. | | 11 |
GOLDMAN SACHS MLP ENERGY INFRASTRUCTURE FUND
Statement of Operations
For the Six Months Ended May 31, 2014 (Unaudited)
| | | | | | |
| | | | | | |
| | Investment income: | | | | |
| | Dividends (net of tax withholding $62,934) | | $ | 17,471,223 | |
| | Dividends — affiliated issuers | | | 716,232 | |
| | Less: Return of Capital on Dividends | | | (14,536,355 | ) |
| | Interest | | | 8,917 | |
| | Total investment income | | | 3,660,017 | |
| | | | | | |
| | Expenses: | | | | |
| | Management fees | | | 3,524,701 | |
| | Distribution and Service fees(a) | | | 422,756 | |
| | Transfer Agent fees(a) | | | 312,867 | |
| | Professional fees | | | 168,671 | |
| | Registration fees | | | 96,913 | |
| | Amortization of offering costs | | | 89,194 | |
| | Printing and mailing costs | | | 55,788 | |
| | Custody, accounting and administrative services | | | 40,165 | |
| | Trustee fees | | | 6,303 | |
| | Other | | | 25,841 | |
| | Total operating expenses | | | 4,743,199 | |
| | Less — expense reimbursements | | | (251,361 | ) |
| | Net operating expenses, before taxes | | | 4,491,838 | |
| | NET INVESTMENT LOSS, BEFORE TAXES | | | (831,821 | ) |
| | Deferred tax benefit | | | 2,336,659 | |
| | NET INVESTMENT INCOME, NET OF TAXES | | | 1,504,838 | |
| | | | | | |
| | Realized and unrealized gain (loss): | | | | |
| | Net realized gain (loss) from: | | | | |
| | Investments | | | 4,004,498 | |
| | Current tax expense | | | (770,064 | ) |
| | Net change in unrealized gain (loss) on: | | | | |
| | Investments | | | 180,147,084 | |
| | Deferred tax expense | | | (69,097,122 | ) |
| | Net realized and unrealized gain, net of taxes | | | 114,284,396 | |
| | NET INCREASE IN NET ASSETS RESULTING FROM OPERATIONS | | $ | 115,789,234 | |
| | (a) | | Class specific Distribution and Service, and Transfer Agent fees were as follows: |
| | | | | | | | | | | | | | | | | | | | | | | | | | | | | | |
| Distribution and Service Fees | | | Transfer Agent Fees | |
Class A | | | Class C | | | Class R | | | Class A | | | Class C | | | Institutional | | | Class IR | | | Class R | |
| $ | 187,536 | | | $ | 235,126 | | | $ | 94 | | | $ | 142,527 | | | $ | 44,674 | | | $ | 96,181 | | | $ | 29,449 | | | $ | 36 | |
| | |
| 12 | | The accompanying notes are an integral part of these financial statements. |
GOLDMAN SACHS MLP ENERGY INFRASTRUCTURE FUND
Statements of Changes in Net Assets
| | | | | | | | | | |
| | | | | For the Six Months Ended
May 31, 2014
(Unaudited) | | | For the Period Ended
November 30, 2013(a) | |
| | From operations: | | | | | | | | |
| | Net investment income (loss), net of taxes | | $ | 1,504,838 | | | $ | (260,366 | ) |
| | Net realized gain, net of taxes | | | 3,234,434 | | | | 349,635 | |
| | Net change in unrealized gain, net of taxes | | | 111,049,962 | | | | 17,504,001 | |
| | Net increase in net assets resulting from operations | | | 115,789,234 | | | | 17,593,270 | |
| | | | | | | | | | |
| | Distributions to shareholders: | | | | | | | | |
| | From return of capital | | | | | | | | |
| | Class A Shares | | | (4,055,658 | ) | | | (653,079 | ) |
| | Class C Shares | | | (1,233,615 | ) | | | (266,762 | ) |
| | Institutional Shares | | | (12,095,913 | ) | | | (4,565,434 | ) |
| | Class IR Shares | | | (889,102 | ) | | | (181,235 | ) |
| | Class R Shares | | | (930 | ) | | | (630 | ) |
| | Total distributions to shareholders | | | (18,275,218 | ) | | | (5,667,140 | ) |
| | | | | | | | | | |
| | From share transactions: | | | | | | | | |
| | Proceeds from sales of shares | | | 1,059,724,853 | | | | 284,356,577 | |
| | Reinvestment of distributions | | | 18,172,495 | | | | 5,643,703 | |
| | Cost of shares redeemed | | | (61,415,851 | ) | | | (11,304,696 | ) |
| | Net increase in net assets resulting from share transactions | | | 1,016,481,497 | | | | 278,695,584 | |
| | TOTAL INCREASE | | | 1,113,995,513 | | | | 290,621,714 | |
| | | | | | | | | | |
| | Net assets: | | | | | | | | |
| | Beginning of period | | | 290,621,714 | | | | — | |
| | End of period | | $ | 1,404,617,227 | | | $ | 290,621,714 | |
| | Distributions in excess of net investment income (loss), net of taxes | | $ | (22,697,886 | ) | | $ | (6,017,645 | ) |
| | (a) | | Commenced operations on March 28, 2013. |
| | |
| The accompanying notes are an integral part of these financial statements. | | 13 |
GOLDMAN SACHS MLP ENERGY INFRASTRUCTURE FUND
Financial Highlights
Selected Data for a Share Outstanding Throughout Each Period
| | | | | | | | | | | | | | | | | | | | | | |
| | | | | | | |
Income (loss) from investment operations | | | | |
| | | Year - Share Class | |
Net asset
value,
beginning
of period | | | Net
investment
income (loss)(a) | | | Net realized
and unrealized
gain | | | Total from
investment
operations | | | Distributions
to shareholders
from capital | |
| | FOR THE SIX MONTHS ENDED MAY 31, (UNAUDITED) | |
| | 2014 - A | | $ | 10.81 | | | $ | 0.02 | | | $ | 1.74 | | | $ | 1.76 | | | $ | (0.24 | ) |
| | 2014 - C | | | 10.76 | | | | (0.03 | ) | | | 1.74 | | | | 1.71 | | | | (0.24 | ) |
| | 2014 - Institutional | | | 10.84 | | | | 0.03 | | | | 1.76 | | | | 1.79 | | | | (0.24 | ) |
| | 2014 - IR | | | 10.83 | | | | 0.03 | | | | 1.75 | | | | 1.78 | | | | (0.24 | ) |
| | 2014 - R | | | 10.79 | | | | (0.03 | ) | | | 1.78 | | | | 1.75 | | | | (0.24 | ) |
| | | | | | | | | | | | | | | | | | | | | | |
| | FOR THE PERIOD ENDED NOVEMBER 30, | |
| | 2013 - A(g) | | | 10.00 | | | | (0.07 | ) | | | 1.27 | | | | 1.20 | | | | (0.39 | ) |
| | 2013 - C(g) | | | 10.00 | | | | (0.06 | ) | | | 1.21 | | | | 1.15 | | | | (0.39 | ) |
| | 2013 - Institutional(g) | | | 10.00 | | | | (0.01 | ) | | | 1.24 | | | | 1.23 | | | | (0.39 | ) |
| | 2013 - IR(g) | | | 10.00 | | | | (0.05 | ) | | | 1.27 | | | | 1.22 | | | | (0.39 | ) |
| | 2013 - R(g) | | | 10.00 | | | | (0.06 | ) | | | 1.24 | | | | 1.18 | | | | (0.39 | ) |
| | (a) | | Calculated based on the average shares outstanding methodology. |
| | (b) | | Assumes investment at the net asset value at the beginning of the period, reinvestment of all dividends and distributions, a complete redemption of the investment at the net asset value at the end of the period and no sales or redemption charges. Total returns would be reduced if a sales or redemption charge was taken into account. Returns do not reflect the deduction of taxes that a shareholder would pay on Fund distributions or the redemption of Fund shares. Total returns for periods less than one full year are not annualized. |
| | (d) | | Deferred tax estimate for the ratio calculation is derived from the net investment income (loss), and realized and unrealized gains (losses). |
| | (e) | | Deferred tax estimate for the ratio calculation is derived from net investment income (loss) only. |
| | (f) | | The Fund’s portfolio turnover rate is calculated in accordance with regulatory requirements, without regard to transactions involving short term investments and certain derivatives. If such transactions were included, the Fund’s portfolio turnover rate may be higher. |
| | (g) | | Commenced operations on March 28, 2013. |
| | |
| 14 | | The accompanying notes are an integral part of these financial statements. |
GOLDMAN SACHS MLP ENERGY INFRASTRUCTURE FUND
| | | | | | | | | | | | | | | | | | | | | | | | | | | | | | | | | | | | | | | | | | | | | | | | | | | | | | | | | | | | | | | | |
| | | | | | | | | | | | | | | | | | Ratio of Expenses to Average Net Assets(c) | | | | | Ratio of Investment income (loss)
to Average Net Assets(c) | | | | | | |
| | | Net asset
value, end
of period | | | | | Total
return(b) | | | | | Net
assets,
end of
period (in 000s) | | | | | Operating expenses
before expense
reimbursements
and tax benefit/
(expense) | | | | | Operating expenses
Net of expense
reimbursements
and before tax benefit/
(expense) | | | | | Before expense
reimbursements
and after tax benefit/
(expense)(d) | | | | | After expense
reimbursements
and tax benefit/
(expense)(d) | | | | | Before expense
reimbursements
and tax benefit/
(expense) | | | | | Net of expense
reimbursements
and before tax
benefit/
(expense) | | | | | After expense
reimbursements
and tax benefit/
(expense)(e) | | | | | Portfolio
turnover
rate(f) | |
| | | | | | | | | | | | | | | | | | | | | | | | | | | | | | | | | | | | | | | | | | | | | | | | | | | | | | | | | | | | | | | | |
| | $ | 12.33 | | | | | | 16.49 | % | | | | $ | 336,137 | | | | | | 1.56 | % | | | | | 1.50 | % | | | | | 11.05 | % | | | | | 10.99 | % | | | | | (0.45 | )% | | | | | (0.38 | )% | | | | | 0.28 | % | | | | | 7 | % |
| | | 12.23 | | | | | | 15.99 | | | | | | 100,357 | | | | | | 2.31 | | | | | | 2.25 | | | | | | 11.80 | | | | | | 11.74 | | | | | | (1.28 | ) | | | | | (1.21 | ) | | | | | (0.55 | ) | | | | | 7 | |
| | | 12.39 | | | | | | 16.61 | | | | | | 888,686 | | | | | | 1.16 | | | | | | 1.10 | | | | | | 10.65 | | | | | | 10.59 | | | | | | (0.17 | ) | | | | | (0.10 | ) | | | | | 0.56 | | | | | | 7 | |
| | | 12.37 | | | | | | 16.53 | | | | | | 79,379 | | | | | | 1.31 | | | | | | 1.25 | | | | | | 10.80 | | | | | | 10.74 | | | | | | (0.17 | ) | | | | | (0.10 | ) | | | | | 0.56 | | | | | | 7 | |
| | | 12.30 | | | | | | 16.31 | | | | | | 59 | | | | | | 1.82 | | | | | | 1.75 | | | | | | 11.31 | | | | | | 11.24 | | | | | | (1.22 | ) | | | | | (1.14 | ) | | | | | (0.48 | ) | | | | | 7 | |
| | | | | | | | | | | | | | | | | | | | | | | | | | | | | | | | | | | | | | | | | | | | | | | | | | | | | | | | | | | | | | | | |
| | | | | | | | | | | | | | | | | | | | | | | | | | | | | | | | | | | | | | | | | | | | | | | | | | | | | | | | | | | | | | | | |
| | | 10.81 | | | | | | 12.12 | | | | | | 51,363 | | | | | | 1.86 | | | | | | 1.51 | | | | | | 9.71 | | | | | | 9.36 | | | | | | (1.63 | ) | | | | | (1.23 | ) | | | | | (1.00 | ) | | | | | 96 | |
| | | 10.76 | | | | | | 11.71 | | | | | | 20,112 | | | | | | 2.60 | | | | | | 2.26 | | | | | | 10.45 | | | | | | 10.11 | | | | | | (1.54 | ) | | | | | (1.14 | ) | | | | | (0.90 | ) | | | | | 96 | |
| | | 10.84 | | | | | | 12.53 | | | | | | 206,886 | | | | | | 1.66 | | | | | | 1.11 | | | | | | 9.50 | | | | | | 8.95 | | | | | | (1.03 | ) | | | | | (0.40 | ) | | | | | (0.17 | ) | | | | | 96 | |
| | | 10.83 | | | | | | 12.42 | | | | | | 12,229 | | | | | | 1.64 | | | | | | 1.26 | | | | | | 9.49 | | | | | | 9.11 | | | | | | (1.39 | ) | | | | | (0.96 | ) | | | | | (0.72 | ) | | | | | 96 | |
| | | 10.79 | | | | | | 12.02 | | | | | | 32 | | | | | | 2.29 | | | | | | 1.75 | | | | | | 10.13 | | | | | | 9.59 | | | | | | (1.71 | ) | | | | | (1.09 | ) | | | | | (0.86 | ) | | | | | 96 | |
| | |
| The accompanying notes are an integral part of these financial statements. | | 15 |
GOLDMAN SACHS MLP ENERGY INFRASTRUCTURE FUND
Notes to Financial Statements
May 31, 2014 (Unaudited)
Goldman Sachs Trust (the “Trust”) is a Delaware statutory trust registered under the Investment Company Act of 1940, as amended (the “Act”), as an open-end management investment company. The Trust includes the Goldman Sachs MLP Energy Infrastructure Fund (the “Fund”). The Fund is a non-diversified portfolio under the Act offering five classes of shares — Class A, Class C, Class IR, Class R and Institutional Shares. Class A Shares are sold with a front-end sales charge of up to 5.50%. Class C Shares are sold with contingent deferred sales charge of 1.00%, which is imposed on redemptions made within 12 months of purchase. Institutional, Class IR and Class R are not subject to a sales charge.
Goldman Sachs Asset Management, L.P. (“GSAM”), an affiliate of Goldman, Sachs & Co. (“Goldman Sachs”), serves as investment adviser to the Fund pursuant to a management agreement (“Agreement”) with the Trust.
| | |
| 2. SIGNIFICANT ACCOUNTING POLICIES | | |
The financial statements have been prepared in accordance with accounting principles generally accepted in the United States of America (“GAAP”) and require management to make estimates and assumptions that may affect the reported amounts and disclosures. Actual results may differ from those estimates and assumptions.
A. Investment Valuation — The Fund’s valuation policy is to value investments at fair value.
B. Investment Income and Investments — Investment income includes interest income and dividend income, net of any foreign withholding taxes, less any amounts reclaimable. Interest income is accrued daily and adjusted for amortization of premiums and accretion of discounts. Dividend income is recognized on ex-dividend date or, for certain foreign securities, as soon as such information is obtained subsequent to the ex-dividend date. Investment transactions are reflected on trade date. Realized gains and losses are calculated using the average cost method for partnership investments and the First In First Out method for all other investments. Investment transactions are recorded on the following business day for daily net asset value (“NAV”) calculations. Distributions from Master Limited Partnerships (“MLPs”) are generally recorded based on the characterization reported on the Fund’s schedule K-1 received from the MLPs. The Fund records its pro-rata share of the income/loss and capital gains/losses, allocated from the underlying partnerships and adjusts the cost basis of the underlying partnerships accordingly.
C. Class Allocations and Expenses — Investment income, realized and unrealized gain (loss), and non-class specific expenses of the Fund are allocated daily based upon the proportion of net assets of each class. Class specific expenses, where applicable, are borne by the respective share classes and include Distribution and Service, Transfer Agent and Service and Shareholder Administration fees. Non-class specific expenses directly incurred by the Fund are charged to the Fund, while such expenses incurred by the Trust are allocated to the Fund and other Funds of the trust on a straight-line and/or pro-rata basis depending upon the nature of the expenses.
D. Offering and Organization Costs — Offering costs paid in connection with the offering of shares of the Fund were amortized on a straight-line basis over 12 months from the date of commencement of operations. Organization costs paid in connection with the organization of the Fund are expensed on the first day of operations.
16
GOLDMAN SACHS MLP ENERGY INFRASTRUCTURE FUND
|
| 2. SIGNIFICANT ACCOUNTING POLICIES (continued) |
E. Distributions to Shareholders — The Fund makes distributions to its shareholders each fiscal quarter at a rate that is approximately equal to the distributions the Fund receives from the MLPs and other securities in which it invests. The Fund estimates that only a portion of the distributions paid to shareholders will be treated as income. The remaining portion of the Fund’s distribution, which may be significant, is expected to be a return of capital. These estimates are based on the Fund’s operating results during the period, and their final federal income tax characterization may differ.
The characterization of distributions to shareholders for financial reporting purposes is determined in accordance with federal income tax rules, which may differ from GAAP. Certain components of the Fund’s net assets on the Statement of Assets and Liabilities reflect permanent GAAP/Tax differences based on the appropriate tax character.
F. Income Taxes — The Fund does not intend to qualify as a regulated investment company pursuant to Subchapter M of the Internal Revenue Code, but will rather be taxed as a corporation. As a result, the Fund is obligated to pay federal, state and local income tax on its taxable income.
The Fund invests primarily in MLPs, which generally are treated as partnerships for federal income tax purposes. As a limited partner in the MLPs, the Fund must report its allocable share of the MLPs’ taxable income or loss in computing its own taxable income or loss. The Fund’s tax expense or benefit is included in the Statement of Operations based on the component of income or gains/losses to which such expense or benefit relates. Deferred income taxes reflect the net tax effects of temporary differences between the carrying amounts of assets and liabilities for financial reporting purposes and the amounts used for income tax purposes. Such temporary differences are principally: (i) taxes on unrealized gains/losses, which are attributable to the temporary difference between fair value and tax basis, (ii) the net tax effects of temporary differences between the carrying amounts of assets and liabilities for financial reporting and income tax purposes, and (iii) the net tax benefit of accumulated net operating losses and capital loss carryforwards. The Fund will accrue a deferred income tax liability balance, at the currently effective statutory United States (“U.S.”) federal income tax rate (currently 35%) plus an estimated state and local income tax rate, for its future tax liability associated with the capital appreciation of its investments and the distributions received by the Fund on interests of MLPs considered to be return of capital and for any net operating gains. The Fund may also record a deferred tax asset balance, which reflects an estimate of the Fund’s future tax benefit associated with net operating losses and/or unrealized losses.
To the extent the Fund has a deferred tax asset, consideration is given to whether or not a valuation allowance, which would offset the value of some or all of the deferred tax asset balance, is required. A valuation allowance is required if based on the evaluation criterion provided by Accounting Standards Codification (“ASC”) 740, Income Taxes (ASC 740) it is more likely than not that some portion, or all, of the deferred tax asset will not be realized. The factors considered in assessing the Fund’s valuation allowance include: the nature, frequency and severity of current and cumulative losses, the duration of the statutory carryforward periods and the associated risks that operating and capital loss carryforwards may expire unutilized. From time to time, as new information becomes available, the Fund will modify its estimates or assumptions regarding the deferred tax liability or asset.
Unexpected significant decreases in cash distributions from the Fund’s MLP investments or significant declines in the fair value of its investments may change the Fund’s assessment regarding the recoverability of their deferred tax assets and may result in a valuation allowance. If a valuation allowance is required to reduce any deferred tax asset in the future, it could have a material impact on the Fund’s NAV and results of operations in the period it is recorded. The Fund will rely to some extent on information provided by MLPs, which may not be provided to the Fund on a timely basis, to estimate operating income/loss and gains/losses and current taxes and deferred tax liabilities and/or asset balances for purposes of daily reporting of net asset values and financial statement reporting.
17
GOLDMAN SACHS MLP ENERGY INFRASTRUCTURE FUND
Notes to Financial Statements (continued)
May 31, 2014 (Unaudited)
|
| 2. SIGNIFICANT ACCOUNTING POLICIES (continued) |
It is the Fund’s policy to classify interest and penalties associated with underpayment of federal and state income taxes, if any, as income tax expense on its Statement of Operations. The Fund anticipates filing income tax returns in the U.S. federal jurisdiction and various states, and such returns are subject to examination by the tax jurisdictions. The Fund has reviewed all major jurisdictions and concluded that there is no significant impact on its net assets and no tax liability resulting from unrecognized tax benefits or expenses relating to uncertain tax positions expected to be taken on its tax returns.
Return of Capital Estimates — Distributions received from the Fund’s investments in MLPs generally are comprised of income and return of capital. The Fund records investment income and return of capital based on estimates made at the time such distributions are received. Such estimates are based on historical information available from each MLP and other industry sources. These estimates may subsequently be revised based on information received from MLPs after their tax reporting periods are concluded.
| | |
| 3. INVESTMENTS AND FAIR VALUE MEASUREMENTS | | |
The fair value of a financial instrument is the amount that would be received to sell an asset or paid to transfer a liability in an orderly transaction between market participants at the measurement date (i.e., the exit price). GAAP establishes a fair value hierarchy that prioritizes the inputs to valuation techniques used to measure fair value. The hierarchy gives the highest priority to unadjusted quoted prices in active markets for identical assets or liabilities (Level 1 measurements) and the lowest priority to unobservable inputs (Level 3 measurements). The levels used for classifying investments are not necessarily an indication of the risk associated with investing in these investments. The three levels of the fair value hierarchy are described below:
Level 1 — Unadjusted quoted prices in active markets that are accessible at the measurement date for identical, unrestricted assets or liabilities;
Level 2 — Quoted prices in markets that are not active or financial instruments for which significant inputs are observable (including, but not limited to, quoted prices for similar investments, interest rates, foreign exchange rates, volatility and credit spreads), either directly or indirectly;
Level 3 — Prices or valuations that require significant unobservable inputs (including GSAM’s assumptions in determining fair value measurement).
The Trustees have adopted Valuation Procedures that govern the valuation of the portfolio investments held by the Fund, including investments for which market quotations are not readily available. The Trustees have delegated to GSAM day-to-day responsibility for implementing and maintaining internal controls and procedures related to the valuation of the Fund’s portfolio investments. To assess the continuing appropriateness of pricing sources and methodologies, GSAM regularly performs price verification procedures and issues challenges as necessary to third party pricing vendors or brokers, and any differences are reviewed in accordance with the Valuation Procedures.
18
GOLDMAN SACHS MLP ENERGY INFRASTRUCTURE FUND
|
| 3. INVESTMENTS AND FAIR VALUE MEASUREMENTS (continued) |
A. Level 1 and Level 2 Fair Value Investments — The valuation techniques and significant inputs used in determining the fair values for investments classified as Level 1 and Level 2 are as follows:
Equity Securities — Equity securities and investment companies traded on a U.S. securities exchange or the NASDAQ system, or those located on certain foreign exchanges, including but not limited to the Americas, are valued daily at their last sale price or official closing price on the principal exchange or system on which they are traded. If no sale occurs, equity securities and exchange traded investment companies are valued at the last bid price for long positions and at the last ask price for short positions. Investments in investment companies (other than those that are exchange traded) are valued at the NAV on the valuation date. To the extent these investments are actively traded, they are classified as Level 1 of the fair value hierarchy, otherwise they are generally classified as Level 2.
Unlisted equity securities for which market quotations are available are valued at the last sale price on the valuation date, or if no sale occurs, at the last bid price. Securities traded on certain foreign securities exchanges are valued daily at fair value determined by an independent fair value service (if available) under Valuation Procedures approved by the Trustees and consistent with applicable regulatory guidance. The independent fair value service takes into account multiple factors including, but not limited to, movements in the securities markets, certain depositary receipts, futures contracts and foreign currency exchange rates that have occurred subsequent to the close of the foreign securities exchange. These investments are generally classified as Level 2 of the fair value hierarchy.
Private Investment — Private investment in public equity (“PIPE”) securities are valued the same as other equity securities as noted above. A Liquidity Value Adjustment (LVA) may be applied to PIPE securities which are subject to transfer restrictions or which convert into publicly traded securities in the future when certain conditions are met. To the extent these investments are actively traded and there is no Liquidity Value Adjustment, they are classified as Level 1 of the fair value hierarchy, otherwise they are classified as Level 2.
Short Term Investments — Short-term investments having a maturity of 60 days or less are generally valued at amortized cost which approximates fair value. These investments are classified as Level 2 of the fair value hierarchy.
i. Repurchase Agreements — Repurchase agreements involve the purchase of securities subject to the seller’s agreement to repurchase the securities at a mutually agreed upon date and price, under the terms of a Master Repurchase Agreement (“MRA”). During the term of a repurchase agreement, the value of the underlying securities held as collateral on behalf of the Fund, including accrued interest is required to exceed the value of the repurchase agreement, including accrued interest. The underlying securities for all repurchase agreements are held at the Fund’s custodian or designated sub-custodians under tri-party repurchase agreements.
An MRA governs transactions between the Fund and select counterparties. An MRA contains provisions for, among other things, initiation, income payments, events of default and maintenance of securities for repurchase agreements. An MRA also permits offsetting with collateral to create one single net payment in the event of default or similar events, including the bankruptcy or insolvency of a counterparty.
19
GOLDMAN SACHS MLP ENERGY INFRASTRUCTURE FUND
Notes to Financial Statements (continued)
May 31, 2014 (Unaudited)
|
| 3. INVESTMENTS AND FAIR VALUE MEASUREMENTS (continued) |
If the seller defaults, the Fund could suffer a loss to the extent that the proceeds from the sale of the underlying securities and other collateral held by the Fund are less than the repurchase price and the Fund’s costs associated with delay and enforcement of the repurchase agreement. In addition, in the event of default or insolvency of the seller, a court could determine that the Fund’s interest in the collateral is not enforceable, resulting in additional losses to the Fund.
Pursuant to exemptive relief granted by the Securities and Exchange Commission (“SEC”) and terms and conditions contained therein, the Fund, together with other funds of the Trust and registered investment companies having management agreements with GSAM or its affiliates, may transfer uninvested cash into joint accounts, the daily aggregate balance of which is invested in one or more repurchase agreements. Under these joint accounts, the Fund maintains pro-rata credit exposure to the underlying repurchase agreements’ counterparties. With the exception of certain transaction fees, the Fund is not subject to any expenses in relation to these investments.
B. Level 3 Fair Value Investments — To the extent that the aforementioned significant inputs are unobservable, or if quotations are not readily available, or if GSAM believes that such quotations do not accurately reflect fair value, the fair value of the Fund’s investments may be determined under Valuation Procedures approved by the Trustees. GSAM, consistent with its procedures and applicable regulatory guidance, may make an adjustment to the most recent valuation prices of either domestic or foreign securities in light of significant events to reflect what it believes to be the fair value of the securities at the time of determining the Fund’s NAV. Significant events which could affect a large number of securities in a particular market may include, but are not limited to: significant fluctuations in U.S. or foreign markets; market dislocations; market disruptions; or unscheduled market closings. Significant events which could also affect a single issuer may include, but are not limited to: corporate actions such as reorganizations, mergers and buy-outs; ratings downgrades; and bankruptcies.
C. Fair Value Hierarchy — The following is a summary of the Fund’s investments classified in the fair value hierarchy as of May 31, 2014:
| | | | | | | | | | | | |
| Investment Type | | Level 1 | | | Level 2 | | | Level 3 | |
| Assets | | | | | | | | | | | | |
Common Stocks | | $ | 1,424,994,267 | | | $ | — | | | $ | — | |
Short-term Investment | | | — | | | | 63,400,000 | | | | — | |
| Total | | $ | 1,424,994,267 | | | $ | 63,400,000 | | | $ | — | |
For further information regarding security characteristics, see the Schedule of Investments.
20
GOLDMAN SACHS MLP ENERGY INFRASTRUCTURE FUND
Currently, the highest marginal federal income tax rate for a corporation is 35%. The Fund may also be subject to a 20% alternative minimum tax to the extent that its alternative minimum tax exceeds its regular federal income tax. State taxes are estimated at a combined rate of 2.01%, net of federal tax benefit. Total income taxes are computed by applying the federal statutory rate plus a blended state income tax rate. During the year, the Fund re-evaluated its blended state income tax rate, decreasing the overall rate from 37.18% to 37.01% due to anticipated state apportionment of income and gains.
The Fund’s income tax provision consists of deferred tax expense/(benefit) for Federal and State taxes of $63,907,762 and $3,622,765, respectively.
The reconciliation between the federal statutory income tax rate of 35% and the effective tax rate on net investment income/loss and realized and unrealized gain/loss is as follows:
| | | | |
| | | $ | 64,161,916 | |
Application of statutory income tax rate | | | 3,671,306 | |
State income taxes, net of federal benefit | | | (47,366 | ) |
Effect of change in estimated state tax rate, net of federal tax benefit (expense) | | | (233,700 | ) |
Effect of permanent differences | | | (21,629 | ) |
Total deferred income tax expense | | $ | 67,530,527 | |
As of May 31, 2014, components of the fund’s deferred tax assets and liabilities are as follows:
| | | | |
Deferred tax assets: | | | | |
Net operating loss carryforward (tax basis) | | $ | 2,336,659 | |
Deferred tax liabilities: | | | | |
Net realized gains on investment securities (tax basis) | | $ | (770,064 | ) |
Net unrealized gains on investment securities (tax basis) | | | (69,097,122 | ) |
| | | | |
Deferred tax expense: | | | | |
Federal | | $ | 63,907,762 | |
State | | | 3,622,765 | |
As of May 31, 2014, the Fund determined that a valuation allowance to reduce any deferred tax assets was not required. For the six months ended May 31, 2014, the Fund does not have any interest or penalties associated with the underpayment of any income taxes.
21
GOLDMAN SACHS MLP ENERGY INFRASTRUCTURE FUND
Notes to Financial Statements (continued)
May 31, 2014 (Unaudited)
As of May 31, 2014, gross unrealized appreciation and depreciation of investments, based on cost, for federal income tax purposes was as follows:
| | | | |
Tax Cost | | $ | 1,273,888,291 | |
Gross unrealized gain | | | 223,849,724 | |
Gross unrealized loss | | | (9,343,748 | ) |
Net unrealized security gain | | $ | 214,505,976 | |
Any difference between cost amounts for financial statement and federal income tax purposes is due primarily to timing differences related to the tax treatment of partnership investments. For the six months ended May 31, 2014, GSAM estimates that 100% of the MLP distributions received will be treated as a return of capital.
For the six months ended May 31, 2014, the Fund distributions are estimated to be comprised of 100% return of capital. Shareholders will be informed of the final tax characterization of the distributions in February 2015. The Fund’s initial tax year is March 28, 2013 to November 30, 2013. Its initial tax year, for which it has not yet filed any tax returns, is open for examination by U.S. and state tax authorities. Management of the Fund is not aware of any tax positions for which it is reasonably possible that the total amounts of unrecognized tax benefits or expenses will significantly change in the next 12 months.
| | |
| 5. AGREEMENTS AND AFFILIATED TRANSACTIONS | | |
A. Management Agreement — Under the Agreement, GSAM manages the Fund, subject to the general supervision of the Trustees.
As compensation for the services rendered pursuant to the Agreement, the assumption of the expenses related thereto and administration of the Fund’s business affairs, including providing facilities, GSAM is entitled to a management fee, accrued daily and paid monthly, equal to an annual percentage rate of the Fund’s average daily net assets.
For the six months ended May 31, 2014, contractual and effective net management fees with GSAM were at the following rates:
| | | | | | | | | | | | | | | | | | | | | | |
| Contractual Management Fee Rate | |
First
$1 billion | | | Next
$1 billion | | | Next
$3 billion | | | Next
$3 billion | | | Over
$8 billion | | | Effective
Rate | |
| | 1.00% | | | | 0.90% | | | | 0.86% | | | | 0.84% | | | | 0.82% | | | | 0.99% | |
B. Distribution and Service Plans — The Trust, on behalf of the Fund, has adopted Distribution and Service Plans (the “Plans”). Under the Plans, Goldman Sachs, which serves as distributor (the “Distributor”), is entitled to a fee accrued daily and paid monthly, for distribution services and personal and account maintenance services, which may then be paid by Goldman Sachs to authorized dealers, at the following annual rates calculated on the Fund’s average daily net assets of each respective share class:
| | | | | | | | | | | | |
| | | Distribution and Service Plan Rates | |
| | | Class A* | | | Class C | | | Class R* | |
Distribution Plan | | | 0.25 | % | | | 0.75 | % | | | 0.50 | % |
Service Plan | | | — | | | | 0.25 | | | | — | |
| * | | With respect to Class A and Class R Shares, the Distributor, at its discretion may use compensation for distribution services paid under the Distribution Plan to compensate service organizations for personal and account maintenance services and expenses as long as such total compensation does not exceed the maximum cap on “service fees” imposed by the Financial Industry Regulatory Authority. |
22
GOLDMAN SACHS MLP ENERGY INFRASTRUCTURE FUND
|
| 5. AGREEMENTS AND AFFILIATED TRANSACTIONS (continued) |
C. Distribution Agreement — Goldman Sachs, as Distributor of the shares of the Fund pursuant to a Distribution Agreement, may retain a portion of the Class A front end sales charge and Class C Shares’ CDSC. For the six months ended May 31, 2014, Goldman Sachs advised that it retained $172,399 and $0, respectively.
D. Transfer Agency Agreement — Goldman Sachs also serves as the transfer agent of the Fund for a fee pursuant to the Transfer Agency Agreement. The fees charged for such transfer agency services are accrued daily and paid monthly at annual rates as follows: 0.19% of the average daily net assets of Class A, Class C, Class IR and Class R Shares; and 0.04% of the average daily net assets of Institutional Shares.
E. Other Expense Agreements and Affiliated Transactions — GSAM has agreed to limit certain “Other Expense” of the Fund (excluding transfer agent fees and expenses, service fees and shareholder administration fees (as applicable), taxes, interest, brokerage fees, shareholder meeting, litigation, indemnification and extraordinary expenses) to the extent such expenses exceed, on an annual basis, a percentage rate of the average daily net assets of the Fund. Such Other Expense reimbursements, if any, are accrued daily and paid monthly. In addition, the Fund is not obligated to reimburse GSAM for prior fiscal year expense reimbursements, if any. The Other Expense limitations as an annual percentage rate of average daily net assets for the Fund is 0.064%. These Other Expense limitations will remain in place through at least March 28, 2015, and prior to such date GSAM may not terminate the arrangements without the approval of the Trustees. In addition, the Fund has entered into certain offset arrangements with the custodian and the transfer agent, which may result in a reduction of the Fund’s expenses and are received irrespective of the application of the “Other Expense” limitations described above.
Such Other Expense reimbursements, if any, are accrued daily and paid monthly and are disclosed in the Statement of Operations for the six months ended May 31, 2014.
As of May 31, 2014, the amounts owed to affiliates of the Fund were as follows:
| | | | | | | | | | | | | | |
Management
Fees | | | Distribution and
Service Fees | | | Transfer
Agent Fees | | | Total | |
| $ | 1,797,300 | | | $ | 223,164 | | | $ | 164,966 | | | $ | 2,185,430 | |
F. Other Transactions with Affiliates — For the six months ended May 31, 2014, Goldman Sachs did not earn any brokerage commissions from portfolio transactions on behalf of the Fund.
An investment by the Fund representing greater than 5% of the voting securities of an issuer makes that issuer an affiliated person (as defined by the Act) of such Fund. The following table provides information about the investment in shares of issuers of which the Fund is an affiliate for the six months ended May 31, 2014:
| | | | | | | | | | | | | | | | | | | | | | | | |
| Name of Affiliated Issuer | | Number of
Shares Held
Beginning of
Period | | | Shares
Bought | | | Shares
Sold | | | Number of
Shares Held
End of
Period | | | Value at End of Period | | | Dividend
Income | |
Dynagas LNG Partners LP | | | 1,316,000 | | | | 11,500 | | | | — | | | | 1,327,500 | | | $ | 31,899,825 | | | $ | 716,232 | |
PBF Logistics LP | | | — | | | | 1,510,000 | | | | — | | | | 1,510,000 | | | | 40,392,500 | | | | — | |
As of May 31, 2014, the Goldman Sachs Tax Advantaged Global Equity Portfolio was the beneficial owners of 5% of total outstanding shares of the Fund.
As of May 31, 2014, the Goldman Sachs Group (“GSG”), Inc. was the beneficial owner of approximately 22% of Class R Shares of the Fund.
23
GOLDMAN SACHS MLP ENERGY INFRASTRUCTURE FUND
Notes to Financial Statements (continued)
May 31, 2014 (Unaudited)
|
| 5. AGREEMENTS AND AFFILIATED TRANSACTIONS (continued) |
G. Line of Credit Facility — As of May 31, 2014, the Fund participated in a $1,080,000,000 committed, unsecured revolving line of credit facility (the “facility”) together with other funds of the Trust and registered investment companies having management agreements with GSAM or its affiliates (“Other Borrowers”). The Fund was added as a participant in the facility on May 6, 2014. Pursuant to the terms of the facility, the Fund and Other Borrowers could increase the credit amount by an additional $120,000,000, for a total of up to $1,200,000,000. This facility is to be used solely for temporary or emergency purposes, which may include the funding of redemptions. The interest rate on borrowings is based on the federal funds rate. The facility also requires a fee to be paid by the Fund based on the amount of the commitment that has not been utilized. For the six months ended May 31, 2014, the Fund did not have any borrowings under the facility.
| | |
| 6. PORTFOLIO SECURITIES TRANSACTIONS | | |
The cost of purchases and proceeds from sales and maturities of long-term securities for the six months ended May 31, 2014, were $1,032,010,428 and $54,767,107, respectively.
The Fund’s risks include, but are not limited to, the following:
Foreign Custody Risk — A Fund that invests in foreign securities may hold such securities and foreign currency with foreign banks, agents, and securities depositories appointed by the Fund’s custodian (each a “Foreign Custodian”). In some countries, Foreign Custodians may be subject to little or no regulatory oversight or independent evaluation of their operations. Further, the laws of certain countries may place limitations on a Fund’s ability to recover its assets if a Foreign Custodian enters into bankruptcy. Investments in emerging markets may be subject to greater custody risks than investments in more developed markets. Custody services in emerging market countries are often undeveloped and may be less regulated than in more developed countries, and thus may not afford the same level of investor protection as would apply in developed countries.
Liquidity Risk — The Fund may make investments that are illiquid or that may become less liquid in response to market developments or adverse investor perceptions. Illiquid investments may be more difficult to value. Liquidity risk may also refer to the risk that the Fund will not be able to pay redemption proceeds within the allowable time period because of unusual market conditions, an unusually high volume of redemption requests, or other reasons. To meet redemption requests, the Fund may be forced to sell investments at an unfavorable time and/or under unfavorable conditions.
Market and Credit Risks — In the normal course of business, the Fund trades financial instruments and enters into financial transactions where risk of potential loss exists due to changes in the market (market risk). Additionally, the Fund may also be exposed to credit risk in the event that an issuer or guarantor fails to perform or that an institution or entity with which the Fund has unsettled or open transactions defaults.
24
GOLDMAN SACHS MLP ENERGY INFRASTRUCTURE FUND
|
| 7. OTHER RISKS (continued) |
Master Limited Partnership Risk — Investments in securities of MLPs involve risks that differ from investments in common stock, including risks related to limited control and limited rights to vote on matters affecting the MLP, risks related to potential conflicts of interest between the MLP and the MLP’s general partner, cash flow risks, dilution risks, limited liquidity and risks related to the general partner’s right to require unit-holders to sell their common units at an undesirable time or price.
Non-Diversification Risk — The Fund is non-diversified, meaning that it is permitted to invest a larger percentage of its assets in fewer issuers than diversified mutual funds. Thus, the Fund may be more susceptible to adverse developments affecting any single issuer held in its portfolio, and may be more susceptible to greater losses because of these developments.
Private Investment Risk — The Fund may invest in PIPE securities. PIPE investors may purchase securities directly from a publicly traded company in a private placement transaction, typically at a discount to the market price of the company’s common stock. In a PIPE transaction, the Fund may bear the price risk from the time of pricing until the time of closing. In addition, the Fund may have to commit to purchase a specified number of shares at a fixed price, with the closing conditioned upon, among other things, the SEC’s preparedness to declare effective a resale registration statement covering the resale, from time to time, of the shares sold in the private financing. Because the sale of the securities is not registered under the 1933 Act, the securities are “restricted” and cannot be immediately resold by the investors into the public markets. Accordingly, PIPE securities may be deemed illiquid.
Portfolio Concentration Risk — The Fund concentrates its investments in the energy sector, and will therefore be susceptible to adverse economic, environmental, business, regulatory or other occurrences affecting that sector. The energy sector has historically experienced substantial price volatility. MLPs and other companies operating in the energy sector are subject to specific risks, including, among others, fluctuations in commodity prices; reduced consumer demand for commodities such as oil, natural gas or petroleum products; reduced availability of natural gas or other commodities for transporting, processing, storing or delivering; slowdowns in new construction; extreme weather or other natural disasters; and threats of attack by terrorists on energy assets.
Additionally, changes in the regulatory environment for energy companies may adversely impact their profitability. Over time, depletion of natural gas reserves and other energy reserves may also affect the profitability of energy companies.
Shareholder Concentration Risk — Certain funds, accounts, individuals or Goldman Sachs affiliates may from time to time own (beneficially or of record) or control a significant percentage of the Fund’s shares. Redemptions by these entities of their holdings in the Fund may impact the Fund’s liquidity and NAV. These redemptions may also force the Fund to sell securities.
Strategy Risk — The Fund’s strategy of investing primarily in MLPs, resulting in its being taxed as a corporation, or a “C” corporation, rather than as a regulated investment company for U.S. federal income tax purposes, is a relatively new investment strategy for funds. This strategy involves complicated accounting, tax and valuation issues. Volatility in the NAV may be experienced because of the use of estimates at various times during a given year that may result in unexpected and potentially significant consequences for the Fund and its shareholders.
25
GOLDMAN SACHS MLP ENERGY INFRASTRUCTURE FUND
Notes to Financial Statements (continued)
May 31, 2014 (Unaudited)
|
| 7. OTHER RISKS (continued) |
Tax Risks — Tax risks associated with investments in the Fund include but are not limited to the following:
Fund Structure Risk. Unlike traditional mutual funds that are structured as regulated investment companies for U.S. federal income tax purposes, the Fund will be taxable as a regular corporation, or “C” corporation, for U.S. federal income tax purposes. This means the Fund generally will be subject to U.S. federal income tax on its taxable income at the rates applicable to corporations (currently a maximum rate of 35%), and will also be subject to state and local income taxes.
MLP Tax Risk. MLPs are generally treated as partnerships for U.S. federal income tax purposes. Partnerships do not pay U.S. federal income tax at the partnership level. Rather, each partner is allocated a share of the partnership’s income, gains, losses, deductions and expenses. A change in current tax law or a change in the underlying business mix of a given MLP could result in an MLP being treated as a corporation for U.S. federal income tax purposes, which would result in the MLP being required to pay U.S. federal income tax (as well as state and local income taxes) on its taxable income. This would have the effect of reducing the amount of cash available for distribution by the MLP and could result in a reduction in the value of the Fund’s investment in the MLP and lower income to the Fund.
To the extent a distribution received by the Fund from an MLP is treated as a return of capital, the Fund’s adjusted tax basis in the interests of the MLP will be reduced, which may increase the Fund’s tax liability upon the sale of the interests in the MLP or upon subsequent distributions in respect of such interests.
Tax Estimation/NAV Risk. In calculating the Fund’s daily net asset value (“NAV”), the Fund will, among other things, include its current taxes and deferred tax liability and/or asset balances and related valuation balances, if any. The Fund may accrue a deferred income tax liability balance, at the currently effective statutory U.S. federal income tax rate (currently 35%) plus an estimated state and local income tax rate, for its future tax liability associated with the capital appreciation of its investments and the distributions received by the Fund on interests of MLPs considered to be return of capital and for any net operating gains. Any deferred tax liability balance will reduce the Fund’s NAV. The Fund may also record a deferred tax asset balance, which reflects an estimate of the Fund’s future tax benefit associated with net operating losses and/or unrealized losses. Any deferred tax asset balance will increase the Fund’s NAV to the extent it exceeds any valuation allowance. The Fund will rely to some extent on information provided by MLPs, which may not be provided to the Fund on a timely basis, to estimate current taxes and deferred tax liability and/or asset balances for purposes of financial statement reporting and determining its NAV to the extent it exceeds any valuation allowance. The daily estimate of the Fund’s current taxes and deferred tax liability and/or asset balances used to calculate the Fund’s NAV could vary significantly from the Fund’s actual tax liability or benefit, and, as a result, the determination of the Fund’s actual tax liability or benefit may have a material impact on the Fund’s NAV. From time to time, the Fund may modify its estimates or assumptions regarding its current taxes and deferred tax liability and/or asset balances as new information becomes available, which modifications in estimates or assumptions may have a material impact on the Fund’s NAV. Shareholders who redeem their shares at a NAV that is based on estimates of the Fund’s current taxes and deferred tax liability and/or asset balances may benefit at the expense of remaining shareholders (or remaining shareholders may benefit at the expense of redeeming shareholders) if the estimates are later revised or ultimately differ from the Fund’s actual tax liability and/or asset balances.
Under the Trust’s organizational documents, its Trustees, officers, employees and agents are indemnified, to the extent permitted by the Act and state law, against certain liabilities that may arise out of performance of their duties to the Fund. Additionally, in the course of business, the Fund enters into contracts that contain a variety of indemnification clauses. The Fund’s maximum exposure under these arrangements is unknown, as this would involve future claims that may be made against the Fund that have not yet occurred. However, GSAM believes the risk of loss under these arrangements to be remote.
26
GOLDMAN SACHS MLP ENERGY INFRASTRUCTURE FUND
Subsequent events after the Statement of Assets and Liabilities date have been evaluated through the date the financial statements were issued. GSAM has concluded that there is no impact requiring adjustment or disclosure in the financial statements.
| | |
| 10. SUMMARY OF SHARE TRANSACTIONS | | |
Share activity is as follows:
| | | | | | | | | | | | | | | | |
| | | For the Six Months Ended
May 31, 2014
(Unaudited) | | | For the Period Ended
November 30, 2013(a) | |
| | | Shares | | | Dollars | | | Shares | | | Dollars | |
| | | | |
| Class A Shares | | | | | | | | | | | | | | | | |
Shares sold | | | 23,781,514 | | | $ | 278,917,311 | | | | 4,848,980 | | | $ | 51,157,436 | |
Reinvestment of distributions | | | 339,650 | | | | 4,048,474 | | | | 60,723 | | | | 644,099 | |
Shares redeemed | | | (1,607,002 | ) | | | (18,861,173 | ) | | | (156,167 | ) | | | (1,657,402 | ) |
| | | | 22,514,162 | | | | 264,104,612 | | | | 4,753,536 | | | | 50,144,133 | |
| Class C Shares | | | | | | | | | | | | | | | | |
Shares sold | | | 6,709,933 | | | | 78,168,658 | | | | 2,069,279 | | | | 21,687,185 | |
Reinvestment of distributions | | | 103,903 | | | | 1,229,164 | | | | 25,246 | | | | 266,155 | |
Shares redeemed | | | (474,939 | ) | | | (5,431,833 | ) | | | (225,194 | ) | | | (2,399,789 | ) |
| | | | 6,338,897 | | | | 73,965,989 | | | | 1,869,331 | | | | 19,553,551 | |
| Institutional Shares | | | | | | | | | | | | | | | | |
Shares sold | | | 54,690,874 | | | | 639,057,854 | | | | 19,315,936 | | | | 199,534,584 | |
Reinvestment of distributions | | | 1,004,891 | | | | 12,006,710 | | | | 435,102 | | | | 4,551,584 | |
Shares redeemed | | | (3,046,396 | ) | | | (35,516,758 | ) | | | (660,047 | ) | | | (6,907,084 | ) |
| | | | 52,649,369 | | | | 615,547,806 | | | | 19,090,991 | | | | 197,179,084 | |
| Class IR Shares | | | | | | | | | | | | | | | | |
Shares sold | | | 5,349,677 | | | | 63,560,252 | | | | 1,144,586 | | | | 11,947,357 | |
Reinvestment of distributions | | | 74,033 | | | | 887,217 | | | | 17,082 | | | | 181,235 | |
Shares redeemed | | | (136,056 | ) | | | (1,605,918 | ) | | | (32,514 | ) | | | (340,411 | ) |
| | | | 5,287,654 | | | | 62,841,551 | | | | 1,129,154 | | | | 11,788,181 | |
| Class R Shares | | | | | | | | | | | | | | | | |
Shares sold | | | 1,726 | | | | 20,778 | | | | 2,938 | | | | 30,015 | |
Reinvestment of distributions | | | 78 | | | | 930 | | | | 60 | | | | 630 | |
Shares redeemed | | | (14 | ) | | | (169 | ) | | | (1 | ) | | | (10 | ) |
| | | | 1,790 | | | | 21,539 | | | | 2,997 | | | | 30,635 | |
NET INCREASE | | | 86,791,872 | | | $ | 1,016,481,497 | | | | 26,846,009 | | | $ | 278,695,584 | |
| (a) | | Commenced operations on March 28, 2013. |
27
GOLDMAN SACHS MLP ENERGY INFRASTRUCTURE FUND
| | |
| Fund Expenses — Six Month Period Ended May 31, 2014 (Unaudited) | | |
As a shareholder of Class A, Class C, Institutional, Class IR or Class R Shares of the Fund, you incur two types of costs: (1) transaction costs, including sales charges on purchase payments (with respect to Class A Shares), contingent deferred sales charges on redemptions (with respect to Class C Shares), and (2) ongoing costs, including management fees; distribution and service (12b-1) fees (with respect to Class A, Class C and Class R Shares); and other Fund expenses. This Example is intended to help you understand your ongoing costs (in dollars) of investing in Class A, Class C, Institutional, Class IR or Class R Shares of the Fund and to compare these costs with the ongoing costs of investing in other mutual funds.
The Example is based on an investment of $1,000 invested at the beginning of the period and held for the entire period from December 1, 2013 through May 31, 2014.
Actual Expenses — The first line under each share class in the table below provides information about actual account values and actual expenses. You may use the information in this line, together with the amount you invested, to estimate the expenses that you paid over the period. Simply divide your account value by $1,000 (for example, an $8,600 account value divided by $1,000=8.6), then multiply the result by the number in the first line under the heading entitled “Expenses Paid” to estimate the expenses you paid on your account during this period.
Hypothetical Example for Comparison Purposes — The second line under each share class in the table below provides information about hypothetical account values and hypothetical expenses based on the Fund’s actual net expense ratios and an assumed rate of return of 5% per year before expenses, which is not the Fund’s actual return. The hypothetical account values and expenses may not be used to estimate the actual ending account balance or expenses you paid for the period. You may use this information to compare the ongoing costs of investing in the Fund and other funds. To do so, compare this 5% hypothetical example with the 5% hypothetical examples that appear in the shareholder reports of the other funds.
Please note that the expenses shown in the table are meant to highlight your ongoing costs only and do not reflect any transactional costs, such as sales charges, redemption fees, or exchange fees. Therefore, the second line of the table is useful in comparing ongoing costs only, and will not help you determine the relative total costs of owning different funds. In addition, if these transactional costs were included, your costs would have been higher.
| | | | | | | | | | | | |
| | | MLP Energy Infrastructure Fund | |
| Share Class | | Beginning
Account
Value
12/01/13 | | | Ending
Account
Value
5/31/14 | | | Expenses
Paid for the
6 Months
Ended
5/31/14* | |
| Class A | | | | | | | | | | | | |
Actual | | $ | 1,000.00 | | | $ | 1,164.90 | | | $ | 8.10 | |
Hypothetical 5% return | | | 1,000.00 | | | | 1,017.45 | + | | | 7.54 | |
| Class C | | | | | | | | | | | | |
Actual | | | 1,000.00 | | | | 1,159.90 | | | | 12.12 | |
Hypothetical 5% return | | | 1,000.00 | | | | 1,024.93 | + | | | 11.30 | |
| Institutional | | | | | | | | | | | | |
Actual | | | 1,000.00 | | | | 1,166.10 | | | | 5.94 | |
Hypothetical 5% return | | | 1,000.00 | | | | 1,019.45 | + | | | 5.54 | |
| Class IR | | | | | | | | | | | | |
Actual | | | 1,000.00 | | | | 1,165.30 | | | | 6.75 | |
Hypothetical 5% return | | | 1,000.00 | | | | 1,018.70 | + | | | 6.29 | |
| Class R | | | | | | | | | | | | |
Actual | | | 1,000.00 | | | | 1,163.10 | | | | 9.44 | |
Hypothetical 5% return | | | 1,000.00 | | | | 1,016.21 | + | | | 8.80 | |
| | * | | Expenses for each share class are calculated using the Fund’s annualized net expense ratio for each class, which represents the ongoing expenses as a percentage of net assets for the period ended May 31, 2014. Deferred tax benefit (expense) is not included in the ratio calculation. Expenses are calculated by multiplying the annualized net expense ratio by the average account value for the period; then multiplying the result by the number of days in the most recent fiscal half year; and then dividing that result by the number of days in the fiscal year. The annualized net expense ratios for the period were as follows: | |
| | | | | | | | | | | | | | | | | | | | |
| Fund | | Class A | | | Class C | | | Institutional | | | Class IR | | | Class R | |
MLP Energy Infrastructure | | | 1.50 | % | | | 2.25 | % | | | 1.10 | % | | | 1.25 | % | | | 1.75 | % |
| | + | | Hypothetical expenses are based on the Fund’s actual annualized net expense ratios and an assumed rate of return of 5% per year before expenses. | |
28
FUNDS PROFILE
Goldman Sachs Funds

Goldman Sachs is a premier financial services firm, known since 1869 for creating thoughtful and customized investment solutions in complex global markets.
Today, the Investment Management Division of Goldman Sachs serves a diverse set of clients worldwide, including private institutions, public entities and individuals. With approximately $935.2 billion in assets under supervision as of March 31, 2014, Goldman Sachs Asset Management (“GSAM”) has portfolio management teams located around the world and our investment professionals bring firsthand knowledge of local markets to every investment decision. Assets under supervision includes assets under management and other client assets for which Goldman Sachs does not have full discretion. GSAM leverages the resources of Goldman, Sachs & Co. subject to legal, internal and regulatory restrictions.

Money Market1
Financial Square FundsSM
| n | | Financial Square Tax-Exempt Funds |
| n | | Financial Square Federal Fund |
| n | | Financial Square Government Fund |
| n | | Financial Square Money Market Fund |
| n | | Financial Square Prime Obligations Fund |
| n | | Financial Square Treasury Instruments Fund |
| n | | Financial Square Treasury Obligations Fund |
Fixed Income
Short Duration and Government
| n | | High Quality Floating Rate Fund |
| n | | Limited Maturity Obligations Fund |
| n | | Short Duration Government Fund |
| n | | Short Duration Income Fund |
| n | | Inflation Protected Securities Fund |
Multi-Sector
| n | | Core Plus Fixed Income Fund |
Municipal and Tax-Free
| n | | High Yield Municipal Fund |
| n | | Short Duration Tax-Free Fund |
Single Sector
| n | | Investment Grade Credit Fund |
| n | | High Yield Floating Rate Fund |
| n | | Emerging Markets Debt Fund |
| n | | Local Emerging Markets Debt Fund |
| n | | Dynamic Emerging Markets Debt Fund |
Corporate Credit
| n | | Long Short Credit Strategies Fund2 |
Fundamental Equity
| n | | Small/Mid Cap Value Fund |
| n | | Small/Mid Cap Growth Fund |
| n | | Flexible Cap Growth Fund |
| n | | Concentrated Growth Fund |
| n | | Technology Tollkeeper Fund |
| n | | Growth Opportunities Fund |
| n | | Rising Dividend Growth Fund |
Tax-Advantaged Equity
| n | | U.S. Tax-Managed Equity Fund3 |
| n | | International Tax-Managed Equity Fund3 |
| n | | U.S. Equity Dividend and Premium Fund |
| n | | International Equity Dividend and Premium Fund |
Equity Insights
| n | | Small Cap Equity Insights Fund |
| n | | U.S. Equity Insights Fund |
| n | | Small Cap Growth Insights Fund |
| n | | Large Cap Growth Insights Fund |
| n | | Large Cap Value Insights Fund |
| n | | Small Cap Value Insights Fund |
| n | | International Small Cap Insights Fund |
| n | | International Equity Insights Fund |
| n | | Emerging Markets Equity Insights Fund |
Fundamental Equity International
| n | | Strategic International Equity Fund |
| n | | Focused International Equity Fund4 |
| n | | International Small Cap Fund |
| n | | Emerging Markets Equity Fund |
| n | | BRIC Fund (Brazil, Russia, India, China) |
Select Satellite5
| n | | Real Estate Securities Fund |
| n | | International Real Estate Securities Fund |
| n | | Commodity Strategy Fund |
| n | | Dynamic Commodity Strategy Fund |
| n | | Dynamic Allocation Fund |
| n | | Absolute Return Tracker Fund |
| n | | Managed Futures Strategy Fund |
| n | | MLP Energy Infrastructure Fund |
| n | | Multi-Manager Alternatives Fund |
| n | | Multi-Asset Real Return Fund |
| n | | Retirement Portfolio Completion Fund |
| n | | Fixed Income Macro Strategies Fund |
Total Portfolio Solutions5
| n | | Balanced Strategy Portfolio |
| n | | Growth and Income Strategy Portfolio |
| n | | Growth Strategy Portfolio |
| n | | Equity Growth Strategy Portfolio |
| n | | Satellite Strategies Portfolio |
| n | | Enhanced Dividend Global Equity Portfolio |
| n | | Tax Advantaged Global Equity Portfolio |
| 1 | | An investment in a money market fund is neither insured nor guaranteed by the Federal Deposit Insurance Corporation (“FDIC”) or any other government agency. Although the Funds seek to preserve the value of your investment at $1.00 per share, it is possible to lose money by investing in the Funds. |
| 2 | | Effective at the close of business on March 21, 2014, the Goldman Sachs Credit Strategies Fund was reorganized with and into the Goldman Sachs Long Short Credit Strategies Fund. |
| 3 | | Effective at the close of business on April 30, 2014, the Goldman Sachs Structured Tax-Managed Equity and Structured International Tax-Managed Equity Funds were renamed the Goldman Sachs U.S. Tax-Managed Equity and International Tax-Managed Equity Funds respectively. |
| 4 | | Effective at the close of business on February 28, 2014, the Goldman Sachs Concentrated International Equity Fund was renamed the Goldman Sachs Focused International Equity Fund. |
| 5 | | Individual Funds within the Total Portfolio Solutions and Select Satellite categories will have various placement on the risk/return spectrum and may have greater or lesser risk than that indicated by the placement of the general Total Portfolio Solutions or Select Satellite category. |
Financial Square FundsSM is a registered service mark of Goldman, Sachs & Co.
*This list covers open-end funds only. Please visit our website at www.GSAMFUNDS.com to learn about our closed-end fund.
| | |
TRUSTEES Ashok N. Bakhru, Chairman John P. Coblentz, Jr. Diana M. Daniels Joseph P. LoRusso Herbert J. Markley James A. McNamara Jessica Palmer Alan A. Shuch Richard P. Strubel Roy W. Templin | | OFFICERS James A. McNamara, President Scott M. McHugh, Principal Financial Officer and Treasurer Caroline Kraus, Secretary |
| |
GOLDMAN, SACHS & CO. Distributor and Transfer Agent | | GOLDMAN SACHS ASSET MANAGEMENT, L.P. Investment Adviser |
Visit our web site at www.GSAMFUNDS.com to obtain the most recent month-end returns.
Goldman Sachs Asset Management, L.P., 200 West Street, New York, New York 10282
The reports concerning the Fund included in this shareholder report may contain certain forward-looking statements about the factors that may affect the performance of the Fund in the future. These statements are based on Fund management’s predictions and expectations concerning certain future events and their expected impact on the Fund, such as performance of the economy as a whole and of specific industry sectors, changes in the levels of interest rates, the impact of developing world events, and other factors that may influence the future performance of the Fund. Management believes these forward-looking statements to be reasonable, although they are inherently uncertain and difficult to predict. Actual events may cause adjustments in portfolio management strategies from those currently expected to be employed.
A description of the policies and procedures that the Fund uses to determine how to vote proxies relating to portfolio securities and information regarding how a Fund voted proxies relating to portfolio securities during the most recent 12-month period ended June 30 is available (I) without charge, upon request by calling 1-800-526-7384 (for Retail Shareholders) or 1-800-621-2550 (for Institutional Shareholders); and (II) on the Securities and Exchange Commission web site at http://www.sec.gov.
The Fund files its complete schedule of portfolio holdings with the Securities and Exchange Commission (’’SEC’’) for the first and third quarters of each fiscal year on Form N-Q. The Fund’s Forms N-Q are available on the SEC’s web site at http://www.sec.gov within 60 days after the Fund’s first and third fiscal quarters. The Fund’s Forms N-Q may be reviewed and copied at the SEC’s Public Reference Room in Washington, D.C., and information on the operation of the Public Reference Room may also be obtained by calling 1-800-SEC-0330. Form N-Q may be obtained upon request and without charge by calling 1-800-526-7384 (for Retail Shareholders) or 1-800-621-2550 (for Institutional Shareholders).
Holdings and allocations shown are as of May 31, 2014 and may not be representative of future investments. Fund holdings should not be relied on in making investment decisions and should not be construed as research or investment advice regarding particular securities. Current and future holdings are subject to risk.
Economic and market forecasts presented herein reflect a series of assumptions and judgments as of the date of this presentation and are subject to change without notice. These forecasts do not take into account the specific investment objectives, restrictions, tax and financial situation or other needs of any specific client. Actual data will vary and may not be reflected here. These forecasts are subject to high levels of uncertainty that may affect actual performance. Accordingly, these forecasts should be viewed as merely representative of a broad range of possible outcomes. These forecasts are estimated, based on assumptions, and are subject to significant revision and may change materially as economic and market conditions change. Goldman Sachs has no obligation to provide updates or changes to these forecasts. Case studies and examples are for illustrative purposes only.
“Alerian MLP Index”, “Alerian MLP Total Return Index”, “AMZ” and “AMZX” are trademarks of Alerian and their use is granted under a license from Alerian.
The portfolio risk management process includes an effort to monitor and manage risk, but does not imply low risk.
This material is not authorized for distribution to prospective investors unless preceded or accompanied by a current Prospectus or summary prospectus, if applicable. Investors should consider a Fund’s objective, risks, and charges and expenses, and read the summary prospectus, if available, and/or the Prospectus carefully before investing or sending money. The summary prospectus, if available, and the Prospectus contain this and other information about a Fund and may be obtained from your authorized dealer or from Goldman, Sachs & Co. by calling (retail – 1-800-526-7384) (institutional – 1-800-621-2550).
© 2014 Goldman Sachs. All rights reserved. 135100.MF.MED.TMPL /7/2014 MLPEISAR14 / 23k
The information required by this Item is only required in an annual report on this Form N-CSR.
| ITEM 3. | AUDIT COMMITTEE FINANCIAL EXPERT. |
The information required by this Item is only required in an annual report on this Form N-CSR.
| ITEM 4. | PRINCIPAL ACCOUNTANT FEES AND SERVICES. |
The information required by this Item is only required in an annual report on this Form N-CSR.
| ITEM 5. | AUDIT COMMITTEE OF LISTED REGISTRANTS. |
| ITEM 6. | SCHEDULE OF INVESTMENTS. |
| | Schedule of Investments is included as part of the Report to Stockholders filed under Item 1. |
| ITEM 7. | DISCLOSURE OF PROXY VOTING POLICIES AND PROCEDURES FOR CLOSED-END MANAGEMENT INVESTMENT COMPANIES. |
| ITEM 8. | PORTFOLIO MANAGERS OF CLOSED-END MANAGEMENT INVESTMENT COMPANIES. |
| ITEM 9. | PURCHASES OF EQUITY SECURITIES BY CLOSED-END MANAGEMENT INVESTMENT COMPANY AND AFFILIATED PURCHASERS. |
| ITEM 10. | SUBMISSION OF MATTERS TO A VOTE OF SECURITY HOLDERS. |
| | There have been no material changes to the procedures by which shareholders may recommend nominees to the registrant’s board of trustees. |
| ITEM 11. | CONTROLS AND PROCEDURES. |
| | (a) | The registrant’s principal executive and principal financial officers, or persons performing similar functions have concluded that the registrant’s disclosure controls and procedures (as defined in Rule 30a-3(c) under the Investment Company Act of 1940, as amended (the “1940 Act”)) are effective as of a date within 90 days of the filing of this report that includes the disclosure required by this paragraph, based on the evaluation of these controls and procedures required by Rule 30a-3(b) under the 1940 Act and 15d-15(b) under the Securities Exchange Act of 1934, as amended. |
| | (b) | There were no changes in the registrant’s internal control over financial reporting (as defined in Rule 30a-3(d) under the 1940 Act) that occurred during the registrant’s second fiscal quarter of the period covered by this report that have materially affected, or are reasonably likely to materially affect, the registrant’s internal control over financial reporting. |
| | | | |
| (a)(1) | | The information required by this Item is only required in connection with an annual report on this Form N-CSR. |
| | |
| (a)(2) | | Exhibit 99.CERT | | Certifications pursuant to Section 302 of the Sarbanes-Oxley Act of 2002 filed herewith. |
| | |
| (b) | | Exhibit 99.906CERT | | Certifications pursuant to Section 906 of the Sarbanes-Oxley Act of 2002 filed herewith. |
SIGNATURES
Pursuant to the requirements of the Securities Exchange Act of 1934 and the Investment Company Act of 1940, the registrant has duly caused this report to be signed on its behalf by the undersigned, thereunto duly authorized.
| | |
| | | Goldman Sachs Trust |
| |
| By: | | /s/ James A. McNamara |
| |
| | |
| | James A. McNamara |
| | President/Principal Executive Officer |
| | Goldman Sachs Trust |
| |
| Date: | | August 6, 2014 |
Pursuant to the requirements of the Securities Exchange Act of 1934 and the Investment Company Act of 1940, this report has been signed below by the following persons on behalf of the registrant and in the capacities and on the dates indicated.
| | |
| By: | | /s/ James A. McNamara |
| |
| | |
| | James A. McNamara |
| | President/Principal Executive Officer |
| | Goldman Sachs Trust |
| |
| Date: | | August 6, 2014 |
| |
| By: | | /s/ Scott McHugh |
| |
| | |
| | Scott McHugh |
| | Principal Financial Officer |
| | Goldman Sachs Trust |
| |
| Date: | | August 6, 2014 |