UNITED STATES
SECURITIES AND EXCHANGE COMMISSION
Washington, D.C. 20549
FORM N-CSR
CERTIFIED SHAREHOLDER REPORT OF REGISTERED
MANAGEMENT INVESTMENT COMPANIES
Investment Company Act file number 811-05349
Goldman Sachs Trust
(Exact name of registrant as specified in charter)
71 South Wacker Drive, Chicago, Illinois 60606
(Address of principal executive offices) (Zip code)
| | |
| Caroline Kraus, Esq. | | Copies to: |
| Goldman, Sachs & Co. | | Geoffrey R.T. Kenyon, Esq. |
| 200 West Street | | Dechert LLP |
| New York, New York 10282 | | 100 Oliver Street |
| | 40th Floor |
| | Boston, MA 02110-2605 |
(Name and address of agents for service)
Registrant’s telephone number, including area code: (312) 655-4400
Date of fiscal year end: October 31
Date of reporting period: April 30, 2014
| ITEM 1. | REPORTS TO STOCKHOLDERS. |
| | The Semi-Annual Report to Stockholders is filed herewith. |
Goldman Sachs Funds

| | | | |
| | |
| Semi-Annual Report | | | | April 30, 2014 |
| | |
| | | | Fundamental Emerging Markets Equity Funds |
| | | | Asia Equity |
| | | | BRIC |
| | | | Emerging Markets Equity |
| | | | N-11 Equity |

Goldman Sachs Fundamental Emerging Markets Equity Funds
| n | | EMERGING MARKETS EQUITY |
| | | | |
TABLE OF CONTENTS | | | | |
| |
Principal Investment Strategies and Risks | | | 1 | |
| |
Investment Process | | | 3 | |
| |
Market Review | | | 4 | |
| |
Portfolio Management Discussions and Performance Summaries | | | 6 | |
| |
Schedules of Investments | | | 29 | |
| |
Financial Statements | | | 40 | |
| |
Financial Highlights | | | 44 | |
| |
Notes to Financial Statements | | | 52 | |
| |
Other Information | | | 68 | |
| | | | |
| | | |
| NOT FDIC-INSURED | | May Lose Value | | No Bank Guarantee |
GOLDMAN SACHS FUNDAMENTAL EMERGING MARKETS EQUITY FUNDS
Principal Investment Strategies and Risks
This is not a complete list of risks that may affect the Funds. For additional information concerning the risks applicable to the Funds, please see the Funds’ Prospectuses.
The Goldman Sachs Asia Equity Fund invests primarily in a diversified portfolio of equity investments in Asian issuers (excluding Japanese issuers). The Fund is subject to market risk, which means that the value of the securities in which it invests may go up or down in response to the prospects of individual companies, particular sectors and/or general economic conditions. Foreign and emerging markets investments may be more volatile than investments in U.S. securities and are subject to the risks of currency fluctuations and adverse economic or political developments. Because of its exposure to Asian issuers, the Fund is subject to greater risk of loss as a result of adverse securities markets, exchange rates and social, political, regulatory or economic events that may occur in Asian countries. The securities of mid- and small-capitalization companies involve greater risks than those associated with larger, more established companies and may be subject to more abrupt or erratic price movements. At times, the Fund may be unable to sell certain of its illiquid investments without a substantial drop in price, if at all.
The Goldman Sachs BRIC Fund invests primarily in a portfolio of equity investments in Brazil, Russia, India and China (“BRIC countries”) or in issuers that participate in the markets of the BRIC countries. The Fund is subject to market risk, which means that the value of the securities in which it invests may go up or down in response to the prospects of individual companies, particular sectors and/ or general economic conditions. Foreign and emerging markets investments may be more volatile than investments in U.S. securities and are subject to the risks of currency fluctuations and adverse economic or political developments. Because of its exposure to the BRIC countries, the Fund is subject to greater risk of loss as a result of adverse securities markets, exchange rates and social, political, regulatory or economic events that may occur in those countries. Because the Fund may invest heavily in specific sectors, the Fund is subject to greater risk of loss as a result of adverse economic, business or other developments affecting such sectors. At times, the Fund may be unable to sell certain of its illiquid investments without a substantial drop in price, if at all. The Fund is “non-diversified” and may invest a larger percentage of its assets in fewer issuers than “diversified” mutual funds. Accordingly, the Fund may be more susceptible to adverse developments affecting any single issuer held in its portfolio and to greater losses resulting from these developments.
The Goldman Sachs Emerging Markets Equity Fund invests primarily in a diversified portfolio of equity investments in emerging country issuers. The Fund is subject to market risk, which means that the value of the securities in which it invests may go up or down in response to the prospects of individual companies, particular sectors and/or general economic conditions. Foreign and emerging markets investments may be more volatile than investments in U.S. securities and are subject to the risks of currency fluctuations and adverse economic or political developments. The securities markets of emerging countries have less government regulation and are subject to less extensive accounting and financial reporting requirements than the markets of more developed countries. Because the Fund may invest heavily in specific sectors, the Fund is subject to greater risk of loss as a result of adverse economic, business or other developments affecting such sectors. At times, the Fund may be unable to sell certain of its illiquid investments without a substantial drop in price, if at all.
The Goldman Sachs N-11 Equity Fund invests primarily in a portfolio of equity investments that are tied economically to the “N-11 countries” or in issuers that participate in the markets of the following N-11 countries: Bangladesh, Egypt, Indonesia, Mexico, Nigeria, Pakistan, Philippines, South Korea, Turkey and Vietnam. While Iran is among the N-11 countries, the Fund will not invest in issuers organized under the laws of Iran, or domiciled in Iran, or in certain other issuers as necessary to comply
1
GOLDMAN SACHS FUNDAMENTAL EMERGING MARKETS EQUITY FUNDS
with U.S. economic sanctions against Iran. The Fund is subject to market risk, which means that the value of the securities in which it invests may go up or down in response to the prospects of individual companies, particular sectors and/or general economic conditions. Foreign and emerging markets investments may be more volatile than investments in U.S. securities and are subject to the risks of currency fluctuations and adverse economic or political developments. Such securities are also subject to foreign custody risk. Because of its exposure to the N-11 countries, the Fund is subject to greater risk of loss as a result of adverse securities markets, exchange rates and social, political, regulatory or economic events that may occur in those countries. The N-11 countries generally have smaller economies or less developed capital markets than traditional emerging markets countries, and, as a result, the risks of investing in these countries are magnified. Because the Fund may invest heavily in specific sectors, the Fund is subject to greater risk of loss as a result of adverse economic, business or other developments affecting such sectors. The Fund may concentrate its investments in a specific industry (only in the event that that industry represents 20% or more of the Fund’s benchmark index at the time of investment), subjecting it to greater risk of loss as a result of adverse economic, business or other developments affecting that industry. At times, the Fund may be unable to sell certain of its illiquid investments without a substantial drop in price, if at all. The Fund is “non-diversified” and may invest a larger percentage of its assets in fewer issuers than “diversified” mutual funds. Accordingly, the Fund may be more susceptible to adverse developments affecting any single issuer held in its portfolio and to greater losses resulting from these developments.
2
GOLDMAN SACHS FUNDAMENTAL EMERGING MARKETS EQUITY FUNDS
What Differentiates Goldman Sachs’ Fundamental Emerging Markets Equity Investment Process?
Goldman Sachs’ Fundamental Emerging Markets Equity investment process is based on the belief that strong, consistent results are best achieved through expert stock selection, performed by our dedicated Emerging Markets Team that works together on a global scale. Our deep, diverse and experienced team of research analysts and portfolio managers combines local insights with global, industry-specific expertise to identify its best investment ideas.

| n | | The Emerging Markets Equity research team, based in the United States, United Kingdom, Japan, China, Korea, Singapore, Brazil, India, and Australia focuses on long- term business and management quality |
| n | | Proprietary, bottom-up research is the key driver of our investment process |
| n | | Analysts collaborate regularly to leverage regional and industry-specific research and insights |

| n | | Members of each local investment team are aligned by sector and are responsible for finding ideas with the best risk-adjusted upside in their respective areas of coverage |
| n | | The decision-making process includes active participation in frequent and regular research meetings |
| n | | The Emerging Market Equity team benefits from the country and currency expertise of our Global Emerging Markets Debt and Currency teams |

| n | | Security selections are aligned with levels of investment conviction and risk-adjusted upside |
| n | | Continual risk monitoring identifies various risks at the stock and portfolio level and assesses whether they are intended and justified |
| n | | Dedicated portfolio construction team assists in ongoing monitoring and adjustment of the Funds |

Emerging markets equity portfolios that strive to offer:
| | n | | Access to markets across emerging markets | |
| | n | | Disciplined approach to stock selection | |
| | n | | Optimal risk/return profiles | |
3
MARKET REVIEW
Goldman Sachs Fundamental Emerging
Markets Equity Funds
Market Review
Emerging markets equities declined during the six-month period ended April 30, 2014 (the “Reporting Period”). The MSCI Emerging Markets Index (gross, USD, unhedged) (the “MSCI EM Index”) posted a return of -2.98%.* Emerging markets equities significantly lagged developed markets equities, as measured by the MSCI Europe, Australasia, Far East (net) Index (unhedged) (the “MSCI EAFE Index”), as concerns over slowing economic growth, high inflation and election uncertainty weighed on many of the growth and emerging markets during the Reporting Period. Also contributing to weak performance of emerging market equities during the Reporting Period was the December 2013 announcement by the U.S. Federal Reserve (the “Fed”) that it would begin tapering its asset purchases in January 2014. The announcement ended seven months of speculation about the beginning of the end of ultra-loose monetary policy that had fueled many emerging market economies in recent years. Further, Argentina’s currency devaluation in January 2014 rippled through emerging market currency and equity markets, forcing many central banks to hike interest rates, which further pressured equity markets.
Looking at some key individual emerging markets more specifically, Chinese equities struggled during most of the Reporting Period amidst renewed concerns about China’s shadow banking system, credit quality and decelerating growth. The Russian equity market plunged during the Reporting Period due to the rapidly escalating geopolitical situation in Ukraine. Weakness in Latin American equity markets persisted into early 2014, though the region began to rebound later in the Reporting Period. After a slow start, Indian equities also rallied sharply later in the Reporting Period, as polls suggested that the Bharatiya Janata Party (“BJP”), which is perceived as business-friendly, is likely to win in the country’s upcoming election. Protest movements increased the political risk of some countries, such as Turkey, which was one of the worst performing markets during the Reporting Period. At the other end of the spectrum, Indonesia’s equity market rallied such that it was one of the best performing markets during the Reporting Period, largely due to an improving current account balance and strong foreign flows.
For the Reporting Period overall, the energy sector declined particularly sharply, reflecting a mix of geopolitical and economic issues in big energy-producing countries, such as Russia and Brazil. In line with global trends, information technology was the best performing sector in the MSCI EM Index during the Reporting Period, largely due to increased merger and acquisition activity.
Looking Ahead
During the Reporting Period, emerging markets equities underperformed developed markets equities, as many developing markets faced macroeconomic headwinds, negative headlines and country-specific challenges. We fully acknowledge these medium-term factors—including the end of Chinese double-digit economic growth, the impact of quantitative easing tapering on broader equity markets, currency volatility and upcoming elections in India and Brazil—and incorporate them in our bottom-up fundamental analysis.
| *All | | index returns are expressed in U.S. dollar terms. |
4
MARKET REVIEW
The macro concerns that pressured emerging markets equities during the Reporting Period have not changed our longer-term positive view of emerging markets equity fundamentals. We believe the structural story is still intact and the domestically-focused growth of the emerging markets should continue to drive strong returns in their equity markets over the long term. Finally, we believe the sell-off amongst emerging markets equities, which, at the end of the Reporting Period, were trading at a significant discount to developed markets on a forward-looking price/earnings ratio basis, forms an attractive entry point for long-term investors.
As bottom-up fundamental investors, we constantly look across a broad range of sectors, countries and market capitalizations to identify what we believe are the most compelling investment opportunities trading at attractive valuations and that may outperform over the market cycle. In particular, we look for companies with strong or improving cash flows and sustainable competitive advantages that should be able to withstand inflationary pressures on their margins while taking advantage of secular growth themes in the growth and emerging markets. Finally, we seek to invest in companies with strong corporate governance track records, especially with respect to their treatment of minority shareholders. With the uncertainty of the markets anticipated to continue, we believe our focus on companies with strong or improving fundamentals and secular growth opportunities should serve our shareholders well.
As always, we maintain our focus on seeking high-quality equity investments trading at what we believe to be compelling valuations and intend to stay true to our long-term discipline as we seek to navigate potentially volatile markets ahead.
5
PORTFOLIO RESULTS
Goldman Sachs Asia Equity Fund
Investment Objective
The Fund seeks long-term capital appreciation.
Portfolio Management Discussion and Analysis
Effective as of the close of business on April 25, 2014, the Goldman Sachs China Equity Fund was merged into the Goldman Sachs Asia Equity Fund. The reorganization was recommended by Goldman Sachs Asset Management International in connection with an effort to optimize the Goldman Sachs Funds and eliminate overlapping products. The Goldman Sachs Asia Equity Fund (the “Fund”) acquired all of the assets of the Goldman Sachs China Equity Fund — which totaled approximately $25.1 million as of April 25, 2014 — and the Goldman Sachs China Equity Fund was subsequently liquidated and shareholders of the Goldman Sachs China Equity Fund became shareholders of the Fund. Below, the Goldman Sachs Fundamental Asia ex Japan Equity Portfolio Management Team discusses the Goldman Sachs Asia Equity Fund’s (the “Fund”) performance and positioning for the six-month period ended April 30, 2014 (the “Reporting Period”).
| Q | | How did the Fund perform during the Reporting Period? |
| A | | During the Reporting Period, the Fund’s Class A, B, C and Institutional Shares generated cumulative total returns, without sales charges, of 0.41%, 0.00%, 0.06% and 0.59%, respectively. These returns compare to the -0.94% cumulative total return of the Fund’s benchmark, the MSCI All Country Asia ex-Japan Index (net, USD, unhedged) (the “Index”), during the same time period. During the period from inception on February 28, 2014 to April 30, 2014, the Fund’s Class IR Shares generated a cumulative total return, without sales charges, of -2.99%. This compares to the 1.73% cumulative total return of the Index during the same time period. |
| Q | | What key factors were responsible for the Fund’s performance during the Reporting Period? |
| A | | The Fund’s outperformance relative to the Index during the Reporting Period can be primarily attributed to individual stock selection. From a country perspective, effective stock selection in China, South Korea, the Philippines and India contributed most positively. Stock selection in Indonesia and Thailand detracted. |
| Q | | What were some of the Fund’s best-performing individual stocks? |
| A | | The Fund benefited most relative to the Index from holdings in Bloomage Biotechnology, Hanssem and Canadian Solar. |
| | The top individual stock contributor to the Fund’s results during the Reporting Period was Bloomage Biotechnology, which engages in the manufacture and sale of a diversified portfolio of hyaluronic acid (“HA”) products. The company began to diversify its business to end products, such as HA dermal fillers, which are used in cosmetic surgeries, for which we believe there could be significant demand that could drive volume growth over the next decade. |
| | Another significant contributor was Hanssem, which primarily engages in the manufacture and distribution of kitchen and interior furniture. South Korean-listed Hanssem reported strong first quarter 2014 sales revenue growth and gained market share on effective branding and on its strong distribution channel strategy. The company particularly benefited from a shift in consumer behavior toward selecting key brand name products over the non-brand market. In our view, major competitors of Hanssem have not yet been successful reading this change in the market, causing them to lose market share. |
| | Canadian Solar designs, manufactures and sells solar module products. The company reported revenues at the higher end of its preannouncement and provided strong 2014 shipment guidance. Its stock also performed well as key growth markets accounted for a larger than expected proportion of its shipments. |
6
PORTFOLIO RESULTS
| Q | | Which stocks detracted significantly from the Fund’s performance during the Reporting Period? |
| A | | Detracting most from the Fund’s results relative to the Index were positions in distressed asset management company China Cinda Asset Management (“Cinda”), Chinese integrated oilfield equipment and service provider Hilong Holdings and Indonesian integrated textile manufacturer Sri Rejeki Isman. |
| | A position in Cinda detracted most from the Fund’s results. The stock’s pullback during the Reporting Period was due primarily to concerns about property price weakness impacting the value of its assets. We believe the negative sentiment may have been overdone given that Cinda’s acquisition costs of these assets were attractive, in our view, leaving substantial room for potential profit realization. Indeed, we maintained the Fund’s position in Cinda because we believe the company has a strong growth opportunity in the coming years, as banks and non-financial companies in China are expected to increase the securitization and sales of their non-performing loans and receivables in order to strengthen their balance sheets. We believe this provides a robust business opportunity for distressed asset managers such as Cinda. |
| | Hilong Holdings is one of China’s leading non-state-owned integrated oilfield equipment and services providers, with a focus on drill pipes, line pipes, oil country tubular goods (“OCTG”) coatings and oilfield services. We believe its stock underperformed during the Reporting Period, as corruption investigations of senior management of its key domestic customer, PetroChina, somewhat impacted its drill pipe sales during the second half of 2013. |
| | Sri Rejeki Isman is the largest integrated textile manufacturer in Indonesia’s consumer discretionary sector. We initially liked the company because we believed that Indonesia, with its low labor costs, young demographic profile and low tariffs, was well positioned to benefit from a shift by retailers to production in low-cost economies and to reduce their dependence on Chinese manufacturers. Positive macro tailwinds, such as a weak rupiah and China’s labor cost hikes, further affirmed our investment thesis. However, we were concerned about the company’s lack of management depth, and the company founder’s sudden and unfortunate death without any proper succession plans significantly increased our concern about the company’s ability to make sizable deals with global brands and caused its stock price to decline. We thus exited the Fund’s position in the company. |
| Q | | Which equity market sectors most significantly affected Fund performance during the Reporting Period? |
| A | | The sectors that contributed most positively to the Fund’s performance relative to the Index were materials, information technology and financials. Stock selection proved particularly effective in materials. Having an overweight allocation to information technology, which strongly outpaced the Index during the Reporting Period, also added value. Financials was a strong contributor based on both effective stock selection and having an underweighted exposure to the poorly performing sector. The biggest detractors from the Fund’s relative results during the Reporting Period were the consumer discretionary, health care and industrials sectors, each due primarily to poor stock selection. |
| Q | | How did the Fund use derivatives and similar instruments during the Reporting Period? |
| A | | During the Reporting Period, we did not use derivatives to hedge positions or as part of an active management strategy, but we used index futures on an opportunistic basis to ensure the Fund remained almost fully exposed to equities following cash inflows or stock sales. |
| Q | | Did the Fund make any significant purchases or sales during the Reporting Period? |
| A | | We established a Fund position in KT, a South Korean telecommunication services company. KT operates in the mobile, broadband Internet, telephone, wireless broadband Internet and Internet protocol television industries. With the appointment of its new chief executive officer, Mr. Hwang Chang-gyu, the man who built Samsung’s semiconductor business, we believe KT could transition into a corporation from a state-owned enterprise. We believe Mr. Hwang may bring back the company’s core competency in telecommunication operations, which contrasts with the ex-management’s unsuccessful expansion of non-core operations. We believe under the new leadership KT will make restructuring efforts throughout 2014, some of which may include realignment of its operations, disposal of idle, non-performing assets and reasonable reductions in advertising and promotions spending. |
Any mention of an investment decision is intended only to illustrate our investment approach or strategy, and is not indicative of the performance of our strategy as a whole. Any such illustration is not necessarily representative of other investment decisions.
7
PORTFOLIO RESULTS
| | We also established a Fund position in Silergy, a Taiwan-based information technology company. Silergy engages in the manufacture and sale of power management integrated circuits. The company has already penetrated the supply chains of light emitting diode (“LED”) lighting, tablets, laptops, personal computers, LED television, branded smartphone clients and security surveillance. The company is also attempting to gain new clients in other applications through its integrated circuit distributors. We expect Silergy to enjoy strong sales growth following the increase of new products and localization of component purchases in China. We further expect Silergy’s earnings performance to drive its share price performance going forward. |
| | In addition to those sales already mentioned, we eliminated the Fund’s position in NCSoft, a South Korea-based online video and mobile game development company. We liked NCSoft when it decided to float one of its games, Blade and Soul, in the Chinese market despite some failures from similar trials in China several years ago. Because of Blade and Soul’s improved game content and the strong marketing power of NCSoft’s publisher, Tencent, the initial results were promising. However, we remained cautious to interpret this data, as stock prices and investor sentiment for game makers are often highly influenced by the performance of new games. As evidenced by its declining user base, Blade and Soul’s spectacular launch did not last long and its user traffic declined. We thus sold the Fund’s position in NCSoft. |
| | We sold the Fund’s position in Anhui Conch Cement, a Chinese company in the materials sector that engages in the production and sale of clinker and cement products. In our view, most of the company’s positive attributes had already been priced into its stock following relative outperformance. Due to sluggish industry demand growth, we expect a deceleration in price increases and believe the company’s earnings growth peaked at the end of 2013. With earnings growth losing momentum, we saw more downside risk at Anhui Conch Cement’s then-current valuation. Thus, as our investment thesis had played out, we took a profit and eliminated the position. |
| Q | | Were there any notable changes in the Fund’s weightings during the Reporting Period? |
| A | | Most sector weights are usually established within a relatively narrow range from the Index, as our team prefers to make decisions at the individual stock level, where we believe we can generate more added value. That said, during the Reporting Period, the Fund’s exposure to financials, consumer discretionary and utilities increased, and its allocations to information technology, industrials and telecommunication services decreased. |
| | Similarly, allocations to countries are directly the result of various stock selection decisions. During the Reporting Period, the Fund’s allocations to China, the Philippines and India increased, and its exposure to South Korea, Thailand and Singapore decreased. |
| Q | | How was the Fund positioned relative to the Index at the end of the Reporting Period? |
| A | | At the end of the Reporting Period, the Fund had overweighted exposure to China, the Philippines and India compared to the Index. On the same date, the Fund had underweighted exposure relative to the Index to Hong Kong, Taiwan, Singapore, Malaysia, South Korea and Thailand and had rather neutral exposure relative to the Index in Indonesia. |
| | From a sector allocation perspective, the Fund had overweighted positions relative to the Index in the information technology, consumer discretionary, utilities and health care sectors at the end of the Reporting Period. On the same date, the Fund had underweighted positions compared to the Index in the financials, telecommunication services and energy sectors and was relatively neutrally weighted compared to the Index in materials, consumer staples and industrials. |
| | As always, we remained focused on individual stock selection, with sector and country positioning being a secondary, closely-monitored effect. |
| Q | | Were there any changes to the Fund’s portfolio management team during the Reporting Period? |
| A | | During the Reporting Period, Eddie Perkin, managing director and chief investment officer (“CIO”) of International and Emerging Markets Equity and a lead portfolio manager of the Fund, left the firm. The Fund continues to be managed by Kevin Ohn, CFA, Managing Director, who has managed the Fund since 2013, and Alina Chiew, CFA, Managing Director, who has managed the Fund since 2011. |
8
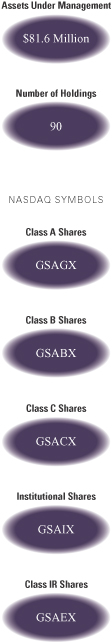
FUND BASICS
Asia Equity Fund
as of April 30, 2014
| | | | | | | | | | |
| | PERFORMANCE REVIEW | |
| | | November 1, 2013–April 30, 2014 | | Fund Total Return
(based on NAV)1 | | | MSCI AC (All Country)
Asia ex-Japan Index2 | |
| | Class A | | | 0.41 | % | | | -0.94 | % |
| | Class B | | | 0.00 | | | | -0.94 | |
| | Class C | | | 0.06 | | | | -0.94 | |
| | | Institutional | | | 0.59 | | | | -0.94 | |
| | | February 28, 2014–April 30, 2014 | | | | | | |
| | | Class IR | | | -2.99 | % | | | 1.73 | % |
| | 1 | | The net asset value (“NAV”) represents the net assets of the class of the Fund (ex-dividend) divided by the total number of shares of the class outstanding. The Fund’s performance assumes the reinvestment of dividends and other distributions. The Fund’s performance does not reflect the deduction of any applicable sales charges. |
| | 2 | | The MSCI AC (All Country) Asia ex-Japan Index (net, USD, unhedged) is a free float-adjusted market capitalization weighted index that is designed to measure the equity market performance of Asia, excluding Japan. The MSCI AC Asia ex-Japan Index consists of the following 10 developed and emerging market country indices: China, Hong Kong, India, Indonesia, Korea, Malaysia, Philippines, Singapore, Taiwan, and Thailand. This index is net of dividends re-invested after deduction of withholding taxes, using a tax rate applicable to non-resident institutional investors who do not benefit from double taxation treaties. This series approximates the minimum possible dividend reinvestment. The dividend is reinvested after deduction of withholding tax, applying the rate to nonresident individuals who do not benefit from double taxation treaties. MSCI Barra uses withholding tax rates applicable to Luxembourg holding companies, as Luxembourg applies the highest rates. It is not possible to invest directly in an index. |
| | | | | | | | | | | | | | | | | | | | |
| | STANDARDIZED TOTAL RETURNS3 |
| | | For the period ended 3/31/14 | | One Year | | | Five Years | | | Ten Years | | | Since Inception | | | Inception Date |
| | Class A | | | 1.71 | % | | | 13.88 | % | | | 6.32 | % | | | 2.23 | % | | 7/08/94 |
| | Class B | | | 1.86 | | | | 14.11 | | | | 6.26 | | | | 1.26 | | | 5/01/96 |
| | Class C | | | 5.82 | | | | 14.30 | | | | 6.11 | | | | 1.45 | | | 8/15/97 |
| | Institutional | | | 8.09 | | | | 15.67 | | | | 7.35 | | | | 2.26 | | | 2/02/96 |
| | | Class IR | | | N/A | | | | N/A | | | | N/A | | | | -2.99 | | | 2/28/14 |
| | 3 | | The Standardized Total Returns are average annual total returns as of the most recent calendar quarter-end. They assume reinvestment of all distributions at NAV. These returns reflect a maximum initial sales charge of 5.5% for Class A Shares, the assumed contingent deferred sales charge for Class B Shares (5% maximum declining to 0% after six years) and the assumed contingent deferred sales charge for Class C Shares (1% if redeemed within 12 months of purchase). Class B Shares convert to Class A Shares on or about the fifteenth day of the last month of the calendar quarter that is eight years after purchase. Returns for Class B Shares for the period after conversion reflect the performance of Class A Shares. Because Institutional and Class IR Shares do not involve a sales charge, such a charge is not applied to their Standardized Total Returns. The Fund’s Class B Shares are no longer available for purchase by new or existing shareholders (although current Class B shareholders may continue to reinvest income and capital gains distributions into Class B Shares, and Class B shareholders may continue to exchange their shares for Class B Shares of certain other Goldman Sachs Funds). |
The returns set forth in the tables above represent past performance. Past performance does not guarantee future results. The Fund’s investment return and principal value will fluctuate so that an investor’s shares, when redeemed, may be worth more or less than their original cost. Current performance may be lower or higher than the performance quoted above. Please visit our web site at www.GSAMFUNDS.com to obtain the most recent month-end returns. Performance reflects applicable fee waivers and/or expense limitations in effect during the periods shown. In their absence, performance would be reduced. Returns do not reflect the deduction of taxes that a shareholder would pay on Fund distributions or the redemption of Fund shares.
9
FUND BASICS
| | | | | | | | | | |
| | EXPENSE RATIOS4 | |
| | | | | Net Expense Ratio (Current) | | | Gross Expense Ratio (Before Waivers) | |
| | Class A | | | 1.69 | % | | | 2.19 | % |
| | Class B | | | 2.45 | | | | 2.95 | |
| | Class C | | | 2.45 | | | | 2.95 | |
| | Institutional | | | 1.29 | | | | 1.79 | |
| | | Class IR | | | 1.44 | | | | 1.94 | |
| | 4 | | The expense ratios of the Fund, both current (net of applicable fee waivers and/or expense limitations) and before waivers (gross of applicable fee waivers and/or expense limitations) are as set forth above according to the most recent publicly available Prospectus for the Fund and may differ from the expense ratios disclosed in the Financial Highlights in this report. The Fund’s waivers and/or expense limitations will remain in place through at least February 28, 2015, and prior to such date the Investment Adviser may not terminate the arrangements without the approval of the Fund’s Board of Trustees. If these arrangements are discontinued in the future, the expense ratios may change without shareholder approval. |
| | | | | | | | | | |
| | TOP TEN HOLDINGS AS OF 4/30/145 |
| | | Holding | | % of Total
Net Assets | | | Line of Business | | Country |
| | Taiwan Semiconductor Manufacturing Co. Ltd. | | | 3.4 | % | | Semiconductors & Semiconductor Equipment | | Taiwan |
| | Industrial & Commercial Bank of China Ltd. Class H | | | 3.2 | | | Banks | | China |
| | China Cinda Asset Management Co. Ltd. Class H | | | 3.1 | | | Diversified Financials | | China |
| | SIIC Environment Holdings Ltd. | | | 2.8 | | | Utilities | | Singapore |
| | Samsung Electronics Co. Ltd. | | | 2.7 | | | Semiconductors & Semiconductor Equipment | | South Korea |
| | Hollysys Automation Technologies Ltd. | | | 2.5 | | | Technology Hardware & Equipment | | China |
| | Tencent Holdings Ltd. | | | 2.4 | | | Software & Services | | China |
| | ENN Energy Holdings Ltd. | | | 2.4 | | | Utilities | | China |
| | Just Dial Ltd. | | | 2.2 | | | Software & Services | | India |
| | | Bloomage Biotechnology Corp. Ltd. | | | 2.1 | | | Materials | | China |
| | 5 | | The top 10 holdings may not be representative of the Fund’s future investments. |
10
FUND BASICS
|
| FUND VS. BENCHMARK SECTOR ALLOCATIONS6 |
| As of April 30, 2014 |
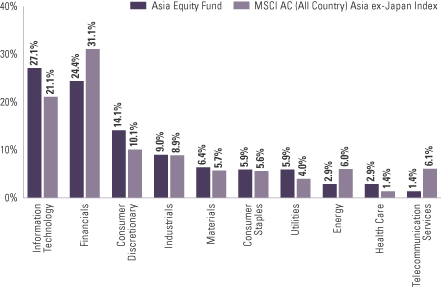
| | 6 | | The Fund is actively managed and, as such, its composition may differ over time. Consequently, the Fund’s overall sector allocations may differ from percentages contained in the graph above. The graph categorizes investments using Global Industry Classification Standard (“GICS”), however, the sector classifications used by the portfolio management team may differ from GICS. Underlying sector allocations of exchange traded funds held by the Fund are not reflected in the graph above. The percentage shown for each investment category reflects the value of investments in that category as a percentage of market value. The graph depicts the Fund’s investments but may not represent the Fund’s market exposure due to the exclusion of certain derivatives, if any, as listed in the Additional Investment Information section of the Schedules of Investments. |
11
PORTFOLIO RESULTS
Goldman Sachs BRIC Fund
Investment Objective
The Fund seeks long-term capital appreciation.
Portfolio Management Discussion and Analysis
Below, the Goldman Sachs Fundamental Emerging Markets Equity Portfolio Management Team discusses the Goldman Sachs BRIC Fund’s (the “Fund”) performance and positioning for the six-month period ended April 30, 2014 (the “Reporting Period”).
| Q | | How did the Fund perform during the Reporting Period? |
| A | | During the Reporting Period, the Fund’s Class A, C, Institutional and IR Shares generated cumulative total returns, without sales charges, of -5.36%, -5.69%, -5.21% and -5.29%, respectively. These returns compare to the -6.78% cumulative total return of the Fund’s benchmark, the MSCI BRIC Index (net, USD, unhedged) (the “Index”), during the same period. |
| Q | | What key factors were responsible for the Fund’s performance during the Reporting Period? |
| A | | The Fund generated disappointing absolute returns but outperformed the Index on a relative basis during the Reporting Period. Weak stock selection and a modest overweighting in the poorly performing Russian equity market and weak stock selection and a modest underweighting in the better performing Brazilian equity market detracted most. The Fund benefited from effective stock selection in China and India as well as from having a modest underweight to China and a modest overweight to India. |
| Q | | What were some of the Fund’s best-performing individual stocks? |
| A | | The strongest contributors to the Fund’s performance during the Reporting Period were Chinese automation control systems manufacturer Hollysys Automation Technology, Brazilian insurance and brokerage holding company BB Seguridade and Chinese Internet service company Tencent Holdings. |
| | Hollysys Automation Technology is China’s leading manufacturer of automation control systems, including railway signaling systems. It is not a component of the Index and thus its strong performance during the Reporting Period made it a top contributor to Fund results. The stock outperformed the Index, as market participants focused on its expanding order book in the industrial automation and railway signaling businesses. Its management has guided to robust net profit growth for its fiscal year 2014. |
| | BB Seguridade performed well following better than expected 2013 results and positive 2014 return on equity guidance. The company was able to significantly increase its market share in new pension contribution and insurance premiums by leveraging the existing client base of Banco do Brasil, its parent company. |
| | Tencent Holdings is an Internet service company in China engaged in social networks, web portals, e-commerce and multiplayer online games. Tencent Holdings’ stock performed well during the Reporting Period, as its introduction of a new version of WeChat — its proprietary social messaging platform, saw the monetization of its mobile platform in 2013. Also, subscriber growth for WeChat was strong in both its domestic and overseas markets. |
| Q | | Which stocks detracted significantly from the Fund’s performance during the Reporting Period? |
| A | | Detracting most from the Fund’s results relative to the Index were positions in Brazilian bank Itau, Russian bank Sberbank and Russian retailer Magnit. |
| | Itau detracted from relative results because the Fund held an underweighted position in this strongly performing Brazilian bank. However, we had maintained an underweight exposure to Brazilian banks broadly in the Fund given our concerns related to necessary adjustments at the macro level after the nation’s elections and the effects of the deteriorating asset quality of public sector banks on the industry and the Brazilian economy. Itau, Brazil’s second biggest bank by assets, performed well after reporting stronger than expected fourth quarter 2013 results and raising its 2014 guidance. |
12
PORTFOLIO RESULTS
| | Sberbank, Russia’s largest bank, and Magnit, Russia’s biggest retailer, performed poorly during the Reporting Period due to heightened tensions in Ukraine and worries around potential sanctions imposed by the West. |
| Q | | Which equity market sectors most significantly affected Fund performance during the Reporting Period? |
| A | | Having an overweight to the strongly performing information technology sector boosted the Fund’s results most during the Reporting Period. Effective stock selection in information technology, financials and utilities also contributed positively to the Fund’s performance. In information technology, the Fund’s position in Hollysys Automation Technology, mentioned earlier, was the strongest contributor to relative performance within the sector. In financials, the Fund’s holding in BB Seguridade, already mentioned, was a particularly strong performer. In utilities, a position in Enn Energy, which operates and manages gas pipeline infrastructure and also engages in the sale and distribution of piped and bottled gas in China, was the largest contributor. |
| | Conversely, weak stock selection in the industrials, consumer staples and energy sectors detracted most from the Fund’s performance relative to the Index during the Reporting Period. At an individual stock level, the Fund’s position in Global Trans Investment, a Russian rail freight transportation service provider, was the largest detractor within the industrials sector. Within consumer staples, the Fund’s position in Magnit, mentioned earlier, detracted most from performance during the Reporting Period. In energy, the Fund’s holding in Lukoil, Russia’s second-largest oil company, detracted most from returns. |
| Q | | How did the Fund use derivatives and similar instruments during the Reporting Period? |
| A | | During the Reporting Period, the Fund gained exposure to select stocks through equity-linked notes and participatory notes. We used index futures on an opportunistic basis to ensure the Fund remained almost fully exposed to equities following cash inflows or stock sales. |
| Q | | Did the Fund make any significant purchases or sales during the Reporting Period? |
| A | | We opted to change the Fund’s positioning within the financials sector during the Reporting Period. We eliminated the Fund’s position in BM&F Bovespa, Latin America’s biggest exchange operator. The company had revised its volume guidance for 2014, which we believed would have a significant impact on its profitability, as 80% of its revenues are non-recurrent and depend on volumes. The company also revised its capital expenditures guidance upwards. Further, BM&F Bovespa had an outstanding tax dispute appeal with the authorities, and a potential setback weighed on its stock price. Within China, we trimmed the Fund’s position in Industrial and Commercial Bank of China (“ICBC”), the world’s largest bank by market capitalization and one of the largest commercial banks in China. We trimmed the Fund’s position in the stock to reduce exposure to Chinese banks given headwinds in the form of slower economic growth and competition from Internet finance. Conversely, we established new Fund positions in ICICI Bank and Axis Bank. Both are commercial banks and are the second and third biggest lenders in India, respectively. We believe the banks are well poised to benefit from the prospect of economic recovery and falling interest rates in India, anticipated to be realized later in 2014. |
| Q | | Were there any notable changes in the Fund’s weightings during the Reporting Period? |
| A | | Most sector weights are usually established within a narrow range from the Index, as our team prefers to make decisions at the individual stock level, where we believe we can generate more added value. That said, during the Reporting Period, the Fund’s exposure relative to the Index in health care, consumer discretionary, industrials and information technology increased, and its allocations relative to the Index to financials, energy and telecommunication services decreased. |
| | Resulting from various stock selection decisions, the Fund’s exposure relative to the Index to India and Russia increased, and its allocations relative to the Index to China and more modestly so to Brazil decreased. |
| Q | | How was the Fund positioned relative to the Index at the end of the Reporting Period? |
| A | | At the end of the Reporting Period, the Fund had overweighted exposure to India and Russia and underweighted exposure to Brazil and China relative to the Index. |
| | From a sector perspective, the Fund had overweighted allocations to information technology, consumer discretionary, consumer staples and health care compared to the Index at the end of the Reporting Period. On the same date, the Fund had underweighted exposure to the energy, telecommunication services, financials, utilities and materials |
13
PORTFOLIO RESULTS
| | sectors and was rather neutrally weighted relative to the Index in the industrials sector. |
| | As always, we remained focused on individual stock selection, with sector and country positioning being a secondary, closely-monitored effect. |
| Q | | Were there any changes to the Fund’s portfolio management team during the Reporting Period? |
| A | | During the Reporting Period, Eddie Perkin, managing director and chief investment officer (“CIO”) of International and Emerging Markets Equity and a lead portfolio manager of the Fund, left the firm. The Fund continues to be managed by Alina Chiew, CFA, Managing Director, who has managed the Fund since 2010. |
14
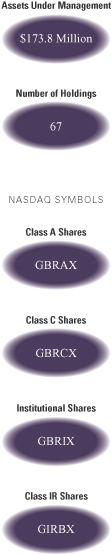
FUND BASICS
BRIC Fund
as of April 30, 2014
| | | | | | | | | | |
| | PERFORMANCE REVIEW | |
| | | November 1, 2013–April 30, 2014 | | Fund Total Return
(based on NAV)1 | | | MSCI BRIC Index2 | |
| | Class A | | | -5.36 | % | | | -6.78 | % |
| | Class C | | | -5.69 | | | | -6.78 | |
| | Institutional | | | -5.21 | | | | -6.78 | |
| | | Class IR | | | -5.29 | | | | -6.78 | |
| | 1 | | The net asset value (“NAV”) represents the net assets of the class of the Fund (ex-dividend) divided by the total number of shares of the class outstanding. The Fund’s performance assumes the reinvestment of dividends and other distributions. The Fund’s performance does not reflect the deduction of any applicable sales charges. |
| | 2 | | The MSCI BRIC Index (net, USD, unhedged) is a free float-adjusted market capitalization weighted index that is designed to measure the equity market performance of the following four emerging market country indices: Brazil, Russia, India and China. This series approximates the minimum possible dividend reinvestment. The dividend is reinvested after deduction of withholding tax, applying the rate to non-resident individuals who do not benefit from double taxation treaties. MSCI Barra uses withholding tax rates applicable to Luxembourg holding companies, as Luxembourg applies the highest rates. It is not possible to invest directly in an index. |
| | | | | | | | | | | | | | | | |
| | STANDARDIZED TOTAL RETURNS3 |
| | | For the period ended 3/31/14 | | One Year | | | Five Years | | | Since Inception | | | Inception Date |
| | Class A | | | -5.23 | % | | | 10.55 | % | | | 3.26 | % | | 6/30/06 |
| | Class C | | | -1.48 | | | | 10.96 | | | | 3.23 | | | 6/30/06 |
| | Institutional | | | 0.67 | | | | 12.24 | | | | 4.42 | | | 6/30/06 |
| | | Class IR | | | 0.55 | | | | N/A | | | | -1.54 | | | 8/31/10 |
| | 3 | | The Standardized Total Returns are average annual total returns as of the most recent calendar quarter-end. They assume reinvestment of all distributions at NAV. These returns reflect a maximum initial sales charge of 5.5% for Class A Shares and the assumed contingent deferred sales charge for Class C Shares (1% if redeemed within 12 months of purchase). Because Institutional and Class IR Shares do not involve a sales charge, such a charge is not applied to their Standardized Total Returns. |
The returns set forth in the tables above represent past performance. Past performance does not guarantee future results. The Fund’s investment return and principal value will fluctuate so that an investor’s shares, when redeemed, may be worth more or less than their original cost. Current performance may be lower or higher than the performance quoted above. Please visit our web site at www.GSAMFUNDS.com to obtain the most recent month-end returns. Performance reflects applicable fee waivers and/or expense limitations in effect during the periods shown. In their absence, performance would be reduced. Returns do not reflect the deduction of taxes that a shareholder would pay on Fund distributions or the redemption of Fund shares.
15
FUND BASICS
| | | | | | | | | | |
| | EXPENSE RATIOS4 | |
| | | | | Net Expense Ratio (Current) | | | Gross Expense Ratio (Before Waivers) | |
| | Class A | | | 1.71 | % | | | 1.97 | % |
| | Class C | | | 2.45 | | | | 2.71 | |
| | Institutional | | | 1.31 | | | | 1.57 | |
| | | Class IR | | | 1.46 | | | | 1.72 | |
| | 4 | | The expense ratios of the Fund, both current (net of applicable fee waivers and/or expense limitations) and before waivers (gross of applicable fee waivers and/or expense limitations) are as set forth above according to the most recent publicly available Prospectus for the Fund and may differ from the expense ratios disclosed in the Financial Highlights in this report. The Fund’s waivers and/or expense limitations will remain in place through at least February 28, 2015, and prior to such date the Investment Adviser may not terminate the arrangements without the approval of the Fund’s Board of Trustees. If these arrangements are discontinued in the future, the expense ratios may change without shareholder approval. |
| | | | | | | | | | |
| | TOP TEN HOLDINGS AS OF 4/30/145 |
| | | Holding | | % of Total
Net Assets | | | Line of Business | | Country |
| | Tencent Holdings Ltd. | | | 6.8 | % | | Software & Services | | China |
| | BB Seguridade Participacoes SA | | | 4.0 | | | Insurance | | Brazil |
| | OAO Lukoil ADR | | | 3.2 | | | Energy | | Russia |
| | AMBEV SA | | | 3.1 | | | Food, Beverage & Tobacco | | Brazil |
| | China Mengniu Dairy Co. Ltd. | | | 3.0 | | | Food, Beverage & Tobacco | | China |
| | Vale SA ADR | | | 2.9 | | | Materials | | Brazil |
| | Odontoprev SA | | | 2.8 | | | Health Care Equipment & Services | | Brazil |
| | ENN Energy Holdings Ltd. | | | 2.7 | | | Utilities | | China |
| | Sberbank of Russia | | | 2.6 | | | Banks | | Russia |
| | | Agricultural Bank of China Ltd. Class H | | | 2.4 | | | Banks | | China |
| | 5 | | The top 10 holdings may not be representative of the Fund’s future investments. |
16
FUND BASICS
| | |
| FUND VS. BENCHMARK SECTOR ALLOCATIONS6 | | |
| As of April 30, 2014 | | |
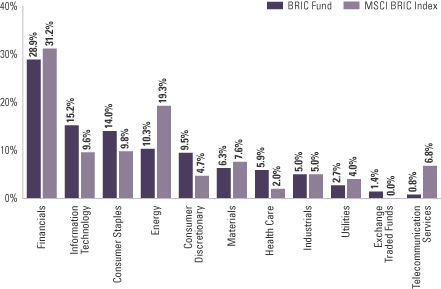
| | 6 | | The Fund is actively managed and, as such, its composition may differ over time. Consequently, the Fund’s overall sector allocations may differ from percentages contained in the graph above. The graph categorizes investments using Global Industry Classification Standard (“GICS”), however, the sector classifications used by the portfolio management team may differ from GICS. Underlying sector allocations of exchange traded funds held by the Fund are not reflected in the graph above. The percentage shown for each investment category reflects the value of investments in that category as a percentage of market value. The graph depicts the Fund’s investments but may not represent the Fund’s market exposure due to the exclusion of certain derivatives, if any, as listed in the Additional Investment Information section of the Schedules of Investments. |
17
PORTFOLIO RESULTS
Goldman Sachs Emerging Markets Equity Fund
Investment Objective
The Fund seeks long-term capital appreciation.
Portfolio Management Discussion and Analysis
Below, the Goldman Sachs Fundamental Emerging Markets Equity Portfolio Management Team discusses the Goldman Sachs Emerging Markets Equity Fund’s (the “Fund”) performance and positioning for the six-month period ended April 30, 2014 (the “Reporting Period”).
| Q | | How did the Fund perform during the Reporting Period? |
| A | | During the Reporting Period, the Fund’s Class A, B, C, Institutional, Service and IR Shares generated cumulative total returns, without sales charges, of 0.19%, -0.15%, -0.22%, 0.45%, 0.11% and 0.32%, respectively. These returns compare to the -2.98% cumulative total return of the Fund’s benchmark, the MSCI Emerging Markets Index (gross, USD, unhedged) (the “Index”), during the same period. |
| Q | | What key factors were responsible for the Fund’s performance during the Reporting Period? |
| A | | The Fund generated disappointing absolute returns but outperformed the Index on a relative basis during the Reporting Period. Effective stock selection in China, South Korea and India benefited the Fund’s performance most. Having an overweighted allocation to India, which significantly outpaced the Index during the Reporting Period, also boosted the Fund’s results. Such positive contributors were only partially offset by the detracting effect of weak stock selection and allocation positioning in Russia, South Africa and Brazil. |
| Q | | What were some of the Fund’s best-performing individual stocks? |
| A | | The strongest contributors to the Fund’s performance during the Reporting Period were Hanssem, Bajaj Finance and Interpark. |
| | The top individual stock contributor to the Fund’s results during the Reporting Period was Hanssem, which primarily engages in the manufacture and distribution of kitchen and interior furniture. South Korean-listed Hanssem reported strong first quarter 2014 sales revenue growth and gained market share on effective branding and on its strong distribution channel strategy. The company particularly benefited from a shift in consumer behavior toward selecting key brand name products over the non-brand market. In our view, major competitors of Hanssem have not yet been successful reading this change in the market, causing them to lose market share. |
| | Bajaj Finance, a non-banking finance company engaged in consumer finance, small and medium enterprises (“SME”) finance and commercial lending in India, contributed positively to the Fund’s returns. The company reported a strong set of results, performing well in terms of loan growth, margins and asset quality. At the end of the Reporting Period, we continued to like the company’s return ratios and valuations relative to its peers. |
| | Interpark is a South Korea-based on-line retailer operating an Internet-based shopping mall. Its stock performed well during the Reporting Period, as the company reported better than expected results and continued to grow revenues ahead of the industry average. |
| Q | | Which stocks detracted significantly from the Fund’s performance during the Reporting Period? |
| A | | Detracting most from the Fund’s results relative to the Index were positions in Magnit, Lukoil and Haier Electronics. |
| | Magnit, Russia’s biggest retailer, and Lukoil, Russia’s second largest oil producer, performed poorly during the Reporting Period due to heightened tensions in Ukraine and worries around potential sanctions imposed by the West. |
| | Haier Electronics is a Hong Kong-based home appliance manufacturer focusing on washing machines and water heaters. Its stock fell after the company posted a decline in its washing machine segment due to a weak macro environment and dampened consumer confidence. |
18
PORTFOLIO RESULTS
| Q | | Which equity market sectors most significantly affected Fund performance during the Reporting Period? |
| A | | Relative to the Index, strong stock selection within the financials, information technology and consumer discretionary sectors contributed most positively to the Fund’s performance. Having an overweighted allocation to the information technology sector, which significantly outpaced the Index during the Reporting Period, also boosted the Fund’s results. In financials, the Fund’s holding in Bajaj Finance, already mentioned, was the strongest contributor. In information technology, the Fund’s position in Hollysys Automation Technology, China’s leading manufacturer of automation control systems, including railway signaling systems, was an outstanding performer. In consumer discretionary, the Fund’s holding in Hanssem, mentioned earlier, boosted Fund results most. |
| | Conversely, the only two sectors to detract from the Fund’s relative results during the Reporting Period were consumer staples and health care, each primarily driven by weak stock selection. In consumer staples, the Fund’s position in Magnit, already mentioned, was a large detractor from relative returns. In health care, the Fund’s position in Netcare Limited, the largest provider of private health care in South Africa, was the biggest disappointment. |
| Q | | How did the Fund use derivatives and similar instruments during the Reporting Period? |
| A | | During the Reporting Period, the Fund used equity-linked notes and participatory notes to gain exposure to select stocks. We used index futures on an opportunistic basis to ensure the Fund remained almost fully exposed to equities following cash inflows or stock sales. |
| Q | | Did the Fund make any significant purchases or sales during the Reporting Period? |
| A | | Within the industrials sector in South Korea, we initiated a Fund position in Hanjin Kal, a holding company with subsidiaries in the South Korean travel industry. We believe the company may be a direct beneficiary of strong tourism in South Korea and that its recent restructuring should improve transparency of the company and crystalize its value. |
| | Within the consumer discretionary sector in South Korea, we added to the Fund’s position in Hanssem, mentioned earlier. We increased the Fund’s position in Hanssem because we believe the company has good growth prospects based on what we consider to be its strong brand, focus on superior design and material quality, well diversified business-to-consumer distribution channels and execution capability of its management. Additionally, we expect a recovery in the property market in 2014 to help Hanssem’s performance. |
| | We exited the Fund’s position in Naver, a South Korean information technology company engaged in Internet search engines and online computer games. In Japan, key operational metrics, such as per-user-expenditure, ad rate-per-unit time and number of games launched, were showing signs of a slowdown, prompting us to eliminate the position. |
| | Within the consumer staples sector in Brazil, we trimmed the Fund’s position in beverage company Ambev during the Reporting Period. The company reported lower than expected sales in the fourth quarter of 2013, and we believe it is likely to face both structural deceleration of volume growth and the headwind posed by a proposed excise hike in Brazil. |
| Q | | Were there any notable changes in the Fund’s weightings during the Reporting Period? |
| A | | Most sector weights are usually established within a narrow range from the Index, as our team prefers to make decisions at the individual stock level, where we believe we can generate more added value. That said, during the Reporting Period, the Fund’s exposure relative to the Index to financials, industrials, health care and consumer discretionary increased, and its allocations relative to the Index to energy and telecommunication services decreased. |
| | Similarly, allocations to countries are directly the result of various stock selection decisions. As such, the Fund’s exposure relative to the Index in India, Colombia, the Philippines and Peru increased, and its allocations relative to the Index to South Africa, South Korea, China and Taiwan decreased. |
| Q | | How was the Fund positioned relative to the Index at the end of the Reporting Period? |
| A | | At the end of the Reporting Period, the Fund had overweighted exposures to India, Russia, Peru, Turkey, the Philippines and Indonesia and underweighted exposures to South Africa, South Korea, Taiwan, Malaysia, China and Poland relative to the Index. On the same date, the Fund was relatively neutrally weighted to the Index in the remaining components of the Index. |
| | From a sector allocation perspective, the Fund had overweighted positions relative to the Index in consumer |
19
PORTFOLIO RESULTS
| | staples, health care, information technology, consumer discretionary, industrials and financials at the end of the Reporting Period. The Fund had underweighted positions compared to the Index in the energy, telecommunication services, materials and utilities sectors at the end of the Reporting Period. |
| | As always, we remained focused on individual stock selection, with sector and country positioning being a secondary, closely-monitored effect. |
| Q | | Were there any changes to the Fund’s portfolio management team during the Reporting Period? |
| A | | During the Reporting Period, Eddie Perkin, managing director and chief investment officer (“CIO”) of International and Emerging Markets Equity and a lead portfolio manager of the Fund, left the firm. The Fund continues to be managed by Alina Chiew, CFA, Managing Director, who has managed the Fund since 2010. |
20
FUND BASICS
Emerging Markets Equity Fund
as of April 30, 2014
| | | | | | | | | | |
| | PERFORMANCE REVIEW | |
| | | November 1, 2013–April 30, 2014 | | Fund Total Return
(based on NAV)1 | | | MSCI Emerging
Markets Index2 | |
| | Class A | | | 0.19 | % | | | -2.98 | % |
| | Class B | | | -0.15 | | | | -2.98 | |
| | Class C | | | -0.22 | | | | -2.98 | |
| | Institutional | | | 0.45 | | | | -2.98 | |
| | Service | | | 0.11 | | | | -2.98 | |
| | | Class IR | | | 0.32 | | | | -2.98 | |
| | 1 | | The net asset value (“NAV”) represents the net assets of the class of the Fund (ex-dividend) divided by the total number of shares of the class outstanding. The Fund’s performance assumes the reinvestment of dividends and other distributions. The Fund’s performance does not reflect the deduction of any applicable sales charges. |
| | 2 | | The MSCI Emerging Markets Index (gross, USD, unhedged) is a free float-adjusted market capitalization index that is designed to measure equity market performance of emerging markets. As of November 27, 2013 the MSCI Emerging Markets Index consisted of the following 21 emerging market country indices: Brazil, Chile, China, Colombia, Czech Republic, Egypt, Greece, Hungary, India, Indonesia, Korea, Malaysia, Mexico, Peru, Philippines, Poland, Russia, South Africa, Taiwan, Thailand, and Turkey. This Index offers an exhaustive representation of the emerging markets by targeting all companies with a market capitalization within the top 85% of their investable equity universe, subject to a global minimum size requirement. It is based on the Global Investable Market Indices methodology. This series approximates the minimum possible dividend reinvestment. The dividend is reinvested after deduction of withholding tax, applying the rate to non-resident individuals who do not benefit from double taxation treaties. MSCI Barra uses withholding tax rates applicable to Luxembourg holding companies, as Luxembourg applies the highest rates. It is not possible to invest directly in an index. |
| | | | | | | | | | | | | | |
| | STANDARDIZED TOTAL RETURNS3 |
| | | For the period ended 3/31/14 | | One Year | | | Five Years | | Ten Years | | Since Inception | | Inception Date |
| | Class A | | | -5.46 | % | | 12.18% | | 7.39% | | 6.07% | | 12/15/97 |
| | Class B | | | -5.68 | | | 12.38 | | 7.36 | | 6.18 | | 12/15/97 |
| | Class C | | | -1.71 | | | 12.62 | | 7.18 | | 5.76 | | 12/15/97 |
| | Institutional | | | 0.45 | | | 13.92 | | 8.43 | | 6.98 | | 12/15/97 |
| | Service | | | -0.03 | | | 13.38 | | 7.89 | | 6.32 | | 12/15/97 |
| | | Class IR | | | 0.38 | | | N/A | | N/A | | 2.30 | | 8/31/10 |
| | 3 | | The Standardized Total Returns are average annual total returns as of the most recent calendar quarter-end. They assume reinvestment of all distributions at NAV. These returns reflect a maximum initial sales charge of 5.5% for Class A Shares, the assumed contingent deferred sales charge for Class B Shares (5% maximum declining to 0% after six years) and the assumed contingent deferred sales charge for Class C Shares (1% if redeemed within 12 months of purchase). Class B Shares convert to Class A Shares on or about the fifteenth day of the last month of the calendar quarter that is eight years after purchase. Returns for Class B Shares for the period after conversion reflect the performance of Class A Shares. Because Institutional, Service and Class IR Shares do not involve a sales charge, such a charge is not applied to their Standardized Total Returns. The Fund’s Class B Shares are no longer available for purchase by new or existing shareholders (although current Class B shareholders may continue to reinvest income and capital gains distributions into Class B Shares, and Class B shareholders may continue to exchange their shares for Class B Shares of certain other Goldman Sachs Funds). |
The returns set forth in the tables above represent past performance. Past performance does not guarantee future results. The Fund’s investment return and principal value will fluctuate so that an investor’s shares, when redeemed, may be worth more or less than their original cost. Current performance may be lower or higher than the performance quoted above. Please visit our web site at www.GSAMFUNDS.com to obtain the most recent month-end returns. Performance reflects applicable fee waivers and/or expense limitations in effect during the periods shown. In their absence, performance would be reduced. Returns do not reflect the deduction of taxes that a shareholder would pay on Fund distributions or the redemption of Fund shares.
21
FUND BASICS
| | | | | | | | | | |
| | EXPENSE RATIOS4 | |
| | | | | Net Expense Ratio (Current) | | | Gross Expense Ratio (Before Waivers) | |
| | Class A | | | 1.72 | % | | | 1.90 | % |
| | Class B | | | 2.47 | | | | 2.65 | |
| | Class C | | | 2.47 | | | | 2.65 | |
| | Institutional | | | 1.32 | | | | 1.50 | |
| | Service | | | 1.82 | | | | 2.00 | |
| | | Class IR | | | 1.47 | | | | 1.65 | |
| | 4 | | The expense ratios of the Fund, both current (net of applicable fee waivers and/or expense limitations) and before waivers (gross of applicable fee waivers and/or expense limitations) are as set forth above according to the most recent publicly available Prospectus for the Fund and may differ from the expense ratios disclosed in the Financial Highlights in this report. The Fund’s waivers and/or expense limitations will remain in place through at least February 28, 2015, and prior to such date the Investment Adviser may not terminate the arrangements without the approval of the Fund’s Board of Trustees. If these arrangements are discontinued in the future, the expense ratios may change without shareholder approval. |
| | | | | | | | | | |
| | TOP TEN HOLDINGS AS OF 4/30/145 |
| | | Holding | | % of Total
Net Assets | | | Line of Business | | Country |
| | Taiwan Semiconductor Manufacturing Co. Ltd. | | | 3.4 | % | | Semiconductors &
Semiconductor Equipment | | Taiwan |
| | Tencent Holdings Ltd. | | | 3.1 | | | Software & Services | | China |
| | Vale SA ADR | | | 2.0 | | | Materials | | Brazil |
| | BB Seguridade Participacoes SA | | | 1.9 | | | Insurance | | Brazil |
| | Odontoprev SA | | | 1.8 | | | Health Care Equipment &
Services | | Brazil |
| | OAO Lukoil ADR | | | 1.8 | | | Energy | | Russia |
| | Hanssem Co. Ltd. | | | 1.8 | | | Consumer Durables &
Apparel | | South Korea |
| | PT Bank Central Asia Tbk | | | 1.7 | | | Banks | | Indonesia |
| | ENN Energy Holdings Ltd. | | | 1.6 | | | Utilities | | China |
| | | Airports of Thailand PCL | | | 1.5 | | | Transportation | | Thailand |
| | 5 | | The top 10 holdings may not be representative of the Fund’s future investments. |
22
FUND BASICS
|
| FUND VS. BENCHMARK SECTOR ALLOCATIONS6 |
| As of April 30, 2014 |
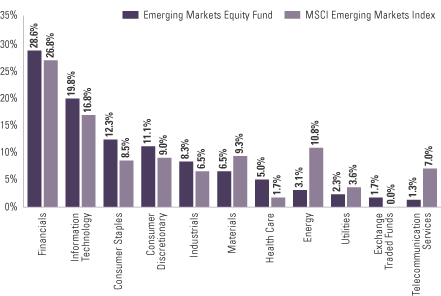
| | 6 | | The Fund is actively managed and, as such, its composition may differ over time. Consequently, the Fund’s overall sector allocations may differ from percentages contained in the graph above. The graph categorizes investments using Global Industry Classification Standard (“GICS”), however, the sector classifications used by the portfolio management team may differ from GICS. Underlying sector allocations of exchange traded funds held by the Fund are not reflected in the graph above. The percentage shown for each investment category reflects the value of investments in that category as a percentage of market value. The graph depicts the Fund’s investments but may not represent the Fund’s market exposure due to the exclusion of certain derivatives, if any, as listed in the Additional Investment Information section of the Schedules of Investments. |
23
PORTFOLIO RESULTS
Goldman Sachs N-11 Equity Fund
Investment Objective
The Fund seeks long-term capital appreciation.
Portfolio Management Discussion and Analysis
Below, the Goldman Sachs Fundamental Emerging Markets Equity Portfolio Management Team discusses the Goldman Sachs N-11 Equity Fund’s (the “Fund”) performance and positioning for the six-month period ended April 30, 2014 (the “Reporting Period”).
| Q | | How did the Fund perform during the Reporting Period? |
| A | | During the Reporting Period, the Fund’s Class A, C, Institutional and IR Shares generated cumulative total returns, without sales charges, of 2.45%, 2.03%, 2.61% and 2.58%, respectively. These returns compare to the 2.83% cumulative total return of the Fund’s benchmark, the MSCI Next 11 ex-Iran GDP Weighted Index (net, unhedged, USD) (the “Index”), during the same period. |
| Q | | What key factors were responsible for the Fund’s performance during the Reporting Period? |
| A | | The Fund only modestly underperformed the Index during the Reporting Period. The Fund’s stock selection in South Korea, Bangladesh and South Vietnam detracted most. Having underweighted allocations to South Vietnam and Bangladesh, which each significantly outpaced the Index during the Reporting Period, also hurt. Such detractors were only partially offset by the positive contributions of effective stock selection in Mexico, Nigeria and Pakistan. |
| Q | | Which stocks detracted significantly from the Fund’s performance during the Reporting Period? |
| A | | Detracting most from the Fund’s results relative to the Index were positions in Square Pharmaceuticals, Turkiye Halk Bank and Commercial International Bank. |
| | Square Pharmaceuticals is an industry leader in Bangladesh. It was a significant detractor from the Fund’s results during the Reporting Period, as the Fund was underweight this stock, and its shares rallied robustly. The company reported third quarter 2013 earnings results that showed its net profit after tax had increased significantly compared to the same quarter the previous year. These strong results were driven by revenue growth, lower cost of sales and higher operating efficiency. |
| | Turkiye Halk Bank, a Turkish bank, saw its share decline driven by political instability in Turkey. |
| | Commercial International Bank is a financial company based in Egypt. It detracted from the Fund’s relative results because the Fund held an underweight position in its stock, and the stock rallied in response to greater political stability in Egypt, as the military government maintained power and benefited from the financial support of Saudi Arabia. Commercial International Bank is a sizable constituent of the Index. |
| Q | | What were some of the Fund’s best-performing individual stocks? |
| A | | The strongest contributors to the Fund’s performance during the Reporting Period were Turkiye IS Bankasi, Infraestructura Energetica Nova (“IENova”) and Engro. |
| | Turkiye IS Bankasi, Turkey’s first public bank and one of the largest financial institutions in the country, was the top contributor to the Fund’s relative results during the Reporting Period. The stock declined during the Reporting Period, but the Fund held an underweighted position in Turkiye IS Bankasi when its stock price dipped amidst Turkey’s political instability. We subsequently increased the Fund’s position in Turkiye IS Bankasi as its valuation became more attractive in our view. |
| | IENova develops, builds and operates energy infrastructure in Mexico. A series of reforms widely anticipated to impact the energy sector were being pushed by Mexico’s Congress, and as many investors believed IENova is likely to benefit from post-reform projects in 2015, creating new growth opportunities, its stock rallied sharply. |
| | Engro, a conglomerate based in Pakistan that produces fertilizer, performed well after the company and other industry players entered into long-term gas supply agreements with the field operators that are expected to ensure long-term gas supply from fields to fertilizer plants. |
24
PORTFOLIO RESULTS
| Q | | Which equity market sectors most significantly affected Fund performance during the Reporting Period? |
| A | | Relative to the Index, weak stock selection within the financials and consumer discretionary sectors detracted most from the Fund’s performance during the Reporting Period. Having an underweighted allocation to health care, which outpaced the Index during the Reporting Period, also hurt. Notable individual drivers of underperformance in the financials sector were holdings in the banks industry. The Fund’s holding in Turkey’s Turkiye Halk Bank and its exposure to Egypt’s Commercial International Bank, each already mentioned, were the largest detractors from performance. In consumer discretionary, holdings in the retail industry hurt most, with a position in South Korea’s Hyundai Department Store especially disappointing. A position in Hyundai Motor was another detractor. |
| | Conversely, strong stock selection within consumer staples, information technology and energy contributed most positively to the Fund’s performance. In consumer staples, holdings within the food and beverage industry performed particularly well, with Indonesian cigarette manufacturer Gudang Garam and Egyptian tobacco company Eastern Company boosting results. In information technology, holdings within the semiconductor industry helped most, with South Korea’s SK Hynix and Seoul Semiconductor especially strong performers. In energy, a position in Pakistan Oilfields was the largest individual contributor to relative returns. A holding in SK Innovation, a South Korean company, was also a strong performer. |
| Q | | How did the Fund use derivatives and similar instruments during the Reporting Period? |
| A | | During the Reporting Period, the Fund gained exposure to select stocks through equity-linked notes and participatory notes. We used index futures on an opportunistic basis to ensure the Fund remained almost fully exposed to equities following cash inflows or stock sales. |
| Q | | Did the Fund make any significant purchases or sales during the Reporting Period? |
| A | | In Egypt, we added shares of Commercial International Bank to bring the underweight position in its stock, held earlier in the Reporting Period, closer to a neutral position relative to the Index. We trimmed the Fund’s position in Telecom Egypt, which had performed well, in order to fund the position. |
| | We eliminated the Fund’s position in NCSoft, a South Korea-based online video and mobile game development company. |
| | We liked NCSoft when it decided to float one of its games, Blade and Soul, in the Chinese market despite some failures from similar trials in China several years ago. Because of Blade and Soul’s improved game content and the strong marketing power of NCSoft’s publisher, Tencent, the initial results were promising. However, we remained cautious to interpret this data, as stock prices and investor sentiment for game makers are often highly influenced by the performance of new games. As evidenced by its declining user base, Blade and Soul’s spectacular launch did not last long and its user traffic declined. We thus sold the Fund’s position in NCSoft and reallocated some of the proceeds to Orion, an entertainment and sports business. In our view, Orion’s stock was attractively valued at the time of purchase. |
| Q | | Were there any notable changes in the Fund’s weightings during the Reporting Period? |
| A | | Most sector weights are usually established within a narrow range from the Index, as our team prefers to make decisions at the individual stock level, where we believe we can generate more added value. That said, during the Reporting Period, the Fund’s exposure relative to the Index to financials and materials increased, and its allocations relative to the Index to industrials, consumer staples and information technology decreased. |
| | Similarly, allocations to countries are directly the result of various stock selection decisions. As such, the Fund’s allocation relative to the Index to Nigeria increased modestly, and its exposure relative to the Index in the Philippines decreased modestly. |
| Q | | How was the Fund positioned relative to the Index at the end of the Reporting Period? |
| A | | At the end of the Reporting Period, the Fund was relatively neutrally weighted to the Index in all of the country components of the Index. |
| | From a sector allocation perspective, the Fund had an overweighted position relative to the Index in materials at the end of the Reporting Period. The Fund had underweighted positions compared to the Index in the industrials and consumer staples sectors and rather neutral positions relative to the Index in the financials, consumer discretionary, utilities, telecommunication services, energy, health care and information technology sectors at the end the Reporting Period. |
| | As always, we remained focused on individual stock selection, with sector and country positioning being a secondary, closely-monitored effect. |
25
FUND BASICS
N-11 Equity Fund
as of April 30, 2014
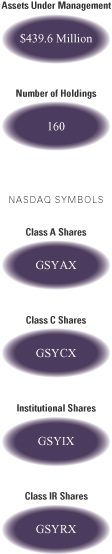
| | | | | | | | | | |
| | PERFORMANCE REVIEW | |
| | | November 1, 2013–April 30, 2014 | | Fund Total Return
(based on NAV)1 | | | MSCI Next 11 ex-Iran GDP
Weighted Index2 | |
| | Class A | | | 2.45 | % | | | 2.83 | % |
| | Class C | | | 2.03 | | | | 2.83 | |
| | Institutional | | | 2.61 | | | | 2.83 | |
| | | Class IR | | | 2.58 | | | | 2.83 | |
| | 1 | | The net asset value (“NAV”) represents the net assets of the class of the Fund (ex-dividend) divided by the total number of shares of the class outstanding. The Fund’s performance assumes the reinvestment of dividends and other distributions. The Fund’s performance does not reflect the deduction of any applicable sales charges. |
| | 2 | | The Fund’s benchmark index is the MSCI Next 11 ex-Iran GDP Weighted Index (net, unhedged, USD). The MSCI Next 11 ex-Iran GDP Weighted Index comprises the following 10 emerging and frontier market indices: Bangladesh, Egypt, Indonesia, Mexico, Nigeria, Pakistan, Philippines, South Korea, Turkey and Vietnam. The index is designed to reflect the performance of the N-11 ex Iran countries based on the size of each country’s economy rather than the size of its equity market, by using country weights based on a country’s gross domestic product (GDP). Each country is divided into large- and mid-cap segments and provides exhaustive coverage of these size segments by targeting a coverage range around 85% of free float-adjusted market capitalization in that market. It is not possible to invest directly in an index. |
| | | | | | | | | | |
| | STANDARDIZED TOTAL RETURNS3 |
| | | For the period ended 3/31/14 | | One Year | | | Since Inception | | Inception Date |
| | Class A | | | -9.91 | % | | 1.31% | | 2/28/11 |
| | Class C | | | -6.31 | | | 2.40 | | 2/28/11 |
| | Institutional | | | -4.24 | | | 3.59 | | 2/28/11 |
| | | Class IR | | | -4.46 | | | 3.43 | | 2/28/11 |
| | 3 | | The Standardized Total Returns are average annual total returns as of the most recent calendar quarter-end. They assume reinvestment of all distributions at NAV. These returns reflect a maximum initial sales charge of 5.5% for Class A Shares and the assumed contingent deferred sales charge for Class C Shares (1% if redeemed within 12 months of purchase). Because Institutional and Class IR Shares do not involve a sales charge, such a charge is not applied to their Standardized Total Returns. |
The returns set forth in the tables above represent past performance. Past performance does not guarantee future results. The Fund’s investment return and principal value will fluctuate so that an investor’s shares, when redeemed, may be worth more or less than their original cost. Current performance may be lower or higher than the performance quoted above. Please visit our web site at www.GSAMFUNDS.com to obtain the most recent month-end returns. Performance reflects applicable fee waivers and/or expense limitations in effect during the periods shown. In their absence, performance would be reduced. Returns do not reflect the deduction of taxes that a shareholder would pay on Fund distributions or the redemption of Fund shares.
26
FUND BASICS
| | | | | | | | | | |
| | EXPENSE RATIOS4 | |
| | | | | Net Expense Ratio (Current) | | | Gross Expense Ratio (Before Waivers) | |
| | Class A | | | 1.73 | % | | | 2.12 | % |
| | Class C | | | 2.48 | | | | 2.87 | |
| | Institutional | | | 1.34 | | | | 1.73 | |
| | | Class IR | | | 1.48 | | | | 1.87 | |
| | 4 | | The expense ratios of the Fund, both current (net of applicable fee waivers and/or expense limitations) and before waivers (gross of applicable fee waivers and/or expense limitations) are as set forth above according to the most recent publicly available Prospectus for the Fund and may differ from the expense ratios disclosed in the Financial Highlights in this report. The Fund’s waivers and/or expense limitations will remain in place through at least February 28, 2015, and prior to such date the Investment Adviser may not terminate the arrangements without the approval of the Fund’s Board of Trustees. If these arrangements are discontinued in the future, the expense ratios may change without shareholder approval. |
| | | | | | | | | | |
| | TOP TEN HOLDINGS AS OF 4/30/145 |
| | | Holding | | % of Total
Net Assets | | | Line of Business | | Country |
| | Samsung Electronics Co. Ltd. | | | 6.3 | % | | Semiconductors &
Semiconductor Equipment | | South Korea |
| | America Movil SAB de CV Series L ADR | | | 4.1 | | | Telecommunication Services | | Mexico |
| | Commercial International Bank Egypt SAE | | | 2.5 | | | Banks | | Egypt |
| | Grupo Financiero Banorte SAB de CV Class O | | | 2.3 | | | Banks | | Mexico |
| | Cemex SAB de CV ADR | | | 2.2 | | | Materials | | Mexico |
| | Hyundai Motor Co. | | | 1.8 | | | Automobiles & Components | | South Korea |
| | Fomento Economico Mexicano SAB de CV ADR | | | 1.7 | | | Food, Beverage & Tobacco | | Mexico |
| | Oil & Gas Development Co. Ltd. | | | 1.7 | | | Energy | | Pakistan |
| | PT Bank Central Asia Tbk | | | 1.6 | | | Banks | | Indonesia |
| | | Wal-Mart de Mexico SAB de CV Series V | | | 1.6 | | | Food & Staples Retailing | | Mexico |
| | 5 | | The top 10 holdings may not be representative of the Fund’s future investments. |
27
FUND BASICS
|
| FUND VS. BENCHMARK SECTOR ALLOCATIONS6 |
| As of April 30, 2014 |
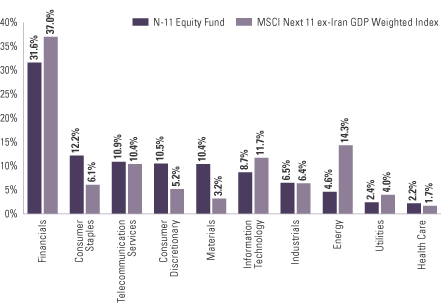
| | 6 | | The Fund is actively managed and, as such, its composition may differ over time. Consequently, the Fund’s overall sector allocations may differ from percentages contained in the graph above. The graph categorizes investments using Global Industry Classification Standard (“GICS”), however, the sector classifications used by the portfolio management team may differ from GICS. Underlying sector allocations of exchange traded funds held by the Fund are not reflected in the graph above. The percentage shown for each investment category reflects the value of investments in that category as a percentage of market value. The graph depicts the Fund’s investments but may not represent the Fund’s market exposure due to the exclusion of certain derivatives, if any, as listed in the Additional Investment Information section of the Schedules of Investments. |
28
GOLDMAN SACHS ASIA EQUITY FUND
Schedule of Investments
April 30, 2014 (Unaudited)
| | | | | | | | |
Shares | | | Description | | Value | |
| | Common Stocks – 97.7% | |
| | Canada – 1.8% | |
| | 55,163 | | | Canadian Solar, Inc. (Semiconductors & Semiconductor Equipment)* | | $ | 1,496,020 | |
| | |
| | China – 28.9% | |
| | 678,000 | | | Baoxin Auto Group Ltd. (Retailing) | | | 513,553 | |
| | 645,000 | | | Bloomage Biotechnology Corp. Ltd. (Materials) | | | 1,740,227 | |
| | 5,065,000 | | | China Cinda Asset Management Co. Ltd. Class H (Diversified Financials)* | | | 2,554,371 | |
| | 1,340,110 | | | China Construction Bank Corp. Class H (Banks) | | | 927,857 | |
| | 1,397,500 | | | China Hongqiao Group Ltd. (Materials) | | | 956,726 | |
| | 220,000 | | | China Mengniu Dairy Co. Ltd. (Food, Beverage & Tobacco) | | | 1,132,149 | |
| | 830,800 | | | China Petroleum & Chemical Corp. Class H (Energy) | | | 737,548 | |
| | 12,794 | | | Ctrip.com International Ltd. ADR (Retailing)* | | | 597,992 | |
| | 276,000 | | | ENN Energy Holdings Ltd. (Utilities) | | | 1,930,431 | |
| | 620,000 | | | Hilong Holding Ltd. (Energy) | | | 323,951 | |
| | 95,364 | | | Hollysys Automation Technologies Ltd. (Technology Hardware & Equipment)* | | | 2,041,743 | |
| | 1,026,000 | | | Huadian Fuxin Energy Corp. Ltd. Class H (Utilities) | | | 479,762 | |
| | 4,316,635 | | | Industrial & Commercial Bank of China Ltd. Class H (Banks) | | | 2,579,268 | |
| | 50,377 | | | JinkoSolar Holding Co. Ltd. ADR (Semiconductors & Semiconductor Equipment)* | | | 1,355,141 | |
| | 846,000 | | | PetroChina Co. Ltd. Class H (Energy) | | | 976,094 | |
| | 32,506 | | | Qunar Cayman Islands Ltd. ADR (Retailing)* | | | 802,898 | |
| | 224,000 | | | Shanghai Fosun Pharmaceutical Group Co. Ltd. Class H (Pharmaceuticals, Biotechnology & Life Sciences) | | | 760,181 | |
| | 134,000 | | | Shenzhou International Group Holdings Ltd. (Consumer Durables & Apparel) | | | 462,320 | |
| | 31,200 | | | Tencent Holdings Ltd. (Software & Services) | | | 1,964,350 | |
| | 5,176 | | | Vipshop Holdings Ltd. ADR (Retailing)* | | | 725,623 | |
| | | | | | | | |
| | | | | | | 23,562,185 | |
| | |
| | Hong Kong – 9.5% | | | | |
| | 204,436 | | | AIA Group Ltd. (Insurance) | | | 994,294 | |
| | 682,000 | | | Brilliance China Automotive Holdings Ltd. (Automobiles & Components) | | | 1,053,994 | |
| | 38,000 | | | Cheung Kong Holdings Ltd. (Real Estate) | | | 648,940 | |
| | 139,000 | | | Galaxy Entertainment Group Ltd. (Consumer Services)* | | | 1,097,290 | |
| | |
| | Common Stocks – (continued) | |
| | Hong Kong – (continued) | |
| | 210,000 | | | Haier Electronics Group Co. Ltd. (Consumer Durables & Apparel) | | $ | 516,572 | |
| | 73,000 | | | Hutchison Whampoa Ltd. (Capital Goods) | | | 1,001,524 | |
| | 508,000 | | | Paradise Entertainment Ltd. (Consumer Services)* | | | 379,163 | |
| | 1,960,000 | | | Peace Mark Holdings Ltd. (Consumer Durables & Apparel)* | | | — | |
| | 1,972,000 | | | Sino Biopharmaceutical Ltd. (Pharmaceuticals, Biotechnology & Life Sciences) | | | 1,547,582 | |
| | 38,555 | | | Sun Hung Kai Properties Ltd. (Real Estate) | | | 486,489 | |
| | | | | | | | |
| | | | | | | 7,725,848 | |
| | |
| | India – 11.1% | | | | |
| | 34,842 | | | Axis Bank Ltd. (Banks) | | | 884,319 | |
| | 17,196 | | | Bajaj Finance Ltd. (Diversified Financials) | | | 533,115 | |
| | 1,503 | | | Bosch Ltd. (Automobiles & Components) | | | 262,582 | |
| | 6,866 | | | Gillette India Ltd. (Household & Personal Products) | | | 216,572 | |
| | 28,785 | | | HCL Technologies Ltd. (Software & Services) | | | 669,838 | |
| | 38,034 | | | ICICI Bank Ltd. (Banks) | | | 784,184 | |
| | 79,146 | | | Indiabulls Housing Finance Ltd. (Banks) | | | 392,830 | |
| | 35,176 | | | IndusInd Bank Ltd. (Banks) | | | 287,212 | |
| | 92,698 | | | Just Dial Ltd. (Software & Services)* | | | 1,815,846 | |
| | 14,087 | | | Monsanto India Ltd. (Materials) | | | 404,860 | |
| | 91,495 | | | Prestige Estates Projects Ltd. (Real Estate) | | | 258,464 | |
| | 77,683 | | | Siemens Ltd. (Capital Goods) | | | 894,249 | |
| | 71,160 | | | Sobha Developers Ltd. (Real Estate) | | | 439,570 | |
| | 102,734 | | | Thermax Ltd. (Capital Goods) | | | 1,250,641 | |
| | | | | | | | |
| | | | | | | 9,094,282 | |
| | |
| | Indonesia – 4.1% | | | | |
| | 375,300 | | | PT Bank Central Asia Tbk (Banks) | | | 357,435 | |
| | 118,000 | | | PT Gudang Garam Tbk (Food, Beverage & Tobacco) | | | 578,113 | |
| | 5,757,500 | | | PT Media Nusantara Citra Tbk (Media) | | | 1,357,410 | |
| | 1,397,500 | | | PT Vale Indonesia Tbk (Materials) | | | 430,468 | |
| | 3,199,000 | | | PT Wijaya Karya Persero Tbk (Capital Goods) | | | 628,959 | |
| | | | | | | | |
| | | | | | | 3,352,385 | |
| | |
| | Malaysia – 2.5% | | | | |
| | 239,400 | | | Gamuda Bhd (Capital Goods) | | | 338,396 | |
| | 73,100 | | | Public Bank Bhd (Banks) | | | 451,254 | |
| | 1,837,500 | | | Tune Ins Holdings Bhd (Insurance)* | | | 1,226,523 | |
| | | | | | | | |
| | | | | | | 2,016,173 | |
| | |
| | |
| The accompanying notes are an integral part of these financial statements. | | 29 |
GOLDMAN SACHS ASIA EQUITY FUND
Schedule of Investments (continued)
April 30, 2014 (Unaudited)
| | | | | | | | |
Shares | | | Description | | Value | |
| | Common Stocks – (continued) | |
| | Philippines – 5.6% | | | | |
| | 5,230,200 | | | Emperador, Inc. (Software & Services)* | | $ | 1,494,053 | |
| | 2,067,100 | | | Lafarge Republic, Inc. (Materials) | | | 466,466 | |
| | 12,506,000 | | | Megaworld Corp. (Real Estate) | | | 1,309,383 | |
| | 397,260 | | | Universal Robina Corp. (Food, Beverage & Tobacco) | | | 1,304,508 | |
| | | | | | | | |
| | | | | | | 4,574,410 | |
| | |
| | Singapore – 5.5% | | | | |
| | 620,000 | | | CapitaCommercial Trust (REIT) | | | 793,443 | |
| | 83,230 | | | DBS Group Holdings Ltd. (Banks) | | | 1,127,531 | |
| | 327,000 | | | Pacc Offshore Services Holdings Ltd. (Energy)* | | | 301,256 | |
| | 16,879,000 | | | SIIC Environment Holdings Ltd. (Utilities)* | | | 2,261,614 | |
| | | | | | | | |
| | | | | | | 4,483,844 | |
| | |
| | South Korea – 19.0% | | | | |
| | 23,620 | | | CJ CGV Co. Ltd. (Media) | | | 1,101,224 | |
| | 10,650 | | | Grand Korea Leisure Co. Ltd. (Consumer Services) | | | 445,353 | |
| | 43,230 | | | Hana Financial Group, Inc. (Banks) | | | 1,525,418 | |
| | 53,210 | | | Hanjin Kal Corp. (Transportation)* | | | 1,142,429 | |
| | 923 | | | Hanssem Co. Ltd. (Consumer Durables & Apparel) | | | 75,517 | |
| | 25,170 | | | Hyundai Development Co. – Engineering & Construction (Capital Goods) | | | 721,638 | |
| | 18,780 | | | Industrial Bank of Korea (Banks) | | | 231,319 | |
| | 55,271 | | | Industrial Bank of Korea GDR (Banks)(a) | | | 680,788 | |
| | 48,247 | | | Jinsung T.E.C. Co. Ltd. (Capital Goods) | | | 322,031 | |
| | 25,325 | | | Kia Motors Corp. (Automobiles & Components) | | | 1,405,087 | |
| | 12,390 | | | Kolon Industries, Inc. (Materials) | | | 822,563 | |
| | 20,780 | | | KONA I Co. Ltd. (Technology Hardware & Equipment) | | | 776,150 | |
| | 34,950 | | | KT Corp. (Telecommunication Services) | | | 1,114,001 | |
| | 17,850 | | | KT Skylife Co. Ltd. (Media) | | | 417,967 | |
| | 2,610 | | | NHN Entertainment Corp. (Software & Services)* | | | 213,508 | |
| | 1,749 | | | POSCO Chemtech Co. Ltd. (Materials) | | | 252,645 | |
| | 1,663 | | | Samsung Electronics Co. Ltd. (Semiconductors & Semiconductor Equipment) | | | 2,168,487 | |
| | 16,504 | | | Seoul Semiconductor Co. Ltd. (Semiconductors & Semiconductor Equipment) | | | 664,325 | |
| | 29,030 | | | SK Hynix, Inc. (Semiconductors & Semiconductor Equipment)* | | | 1,131,981 | |
| | |
| | Common Stocks – (continued) | |
| | South Korea – (continued) | | | | |
| | 31,700 | | | Wonik IPS Co. Ltd. (Semiconductors & Semiconductor Equipment)* | | $ | 317,479 | |
| | | | | | | | |
| | | | | | | 15,529,910 | |
| | |
| | Taiwan – 8.6% | | | | |
| | 337,000 | | | Chipbond Technology Corp. (Semiconductors & Semiconductor Equipment) | | | 577,197 | |
| | 192,000 | | | Epistar Corp. (Semiconductors & Semiconductor Equipment)* | | | 420,164 | |
| | 14,000 | | | Hermes Microvision, Inc. (Semiconductors & Semiconductor Equipment) | | | 581,504 | |
| | 215,600 | | | Hon Hai Precision Industry Co. Ltd. (Technology Hardware & Equipment) | | | 619,195 | |
| | 34,000 | | | MediaTek, Inc. (Semiconductors & Semiconductor Equipment) | | | 532,780 | |
| | 68,899 | | | PChome Online, Inc. (Software & Services) | | | 473,688 | |
| | 130,000 | | | Silergy Corp. (Semiconductors & Semiconductor Equipment)* | | | 1,078,187 | |
| | 703,338 | | | Taiwan Semiconductor Manufacturing Co. Ltd. (Semiconductors & Semiconductor Equipment) | | | 2,763,666 | |
| | | | | | | | |
| | | | | | | 7,046,381 | |
| | |
| | Thailand – 1.1% | | | | |
| | 149,600 | | | Airports of Thailand PCL (Transportation) | | | 903,473 | |
| | |
| | TOTAL INVESTMENTS – 97.7% | |
| | (Cost $78,444,985) | | $ | 79,784,911 | |
| | |
| OTHER ASSETS IN EXCESS OF
LIABILITIES – 2.3% | | | 1,843,249 | |
| | |
| | NET ASSETS – 100.0% | | $ | 81,628,160 | |
| | |
| | |
| 30 | | The accompanying notes are an integral part of these financial statements. |
GOLDMAN SACHS ASIA EQUITY FUND
| | |
| The percentage shown for each investment category reflects the value of investments in that category as a percentage of net assets. |
* | | Non-income producing security. |
(a) | | Exempt from registration under Rule 144A of the Securities Act of 1933. Under procedures approved by the Board of Trustees, such securities have been determined to be liquid by the Investment Adviser and may be resold, normally to qualified institutional buyers in transactions exempt from registration. Total market value of Rule 144A securities amounts to $680,788, which represents approximately 0.8% of net assets as of April 30, 2014. |
| | | | |
|
Investment Abbreviations: |
ADR | | —American Depositary Receipt |
GDR | | —Global Depositary Receipt |
REIT | | —Real Estate Investment Trust |
|
| | |
| The accompanying notes are an integral part of these financial statements. | | 31 |
GOLDMAN SACHS BRIC FUND
Schedule of Investments
April 30, 2014 (Unaudited)
| | | | | | | | |
| Shares | | | Description | | Value | |
| | Common Stocks – 94.2% | | | | |
| | Brazil – 20.2% | | | | |
| | 739,432 | | | AMBEV SA (Food, Beverage & Tobacco) | | $ | 5,405,423 | |
| | 600,407 | | | BB Seguridade Participacoes SA (Insurance) | | | 7,036,051 | |
| | 110,915 | | | BRF SA (Food, Beverage & Tobacco) | | | 2,512,034 | |
| | 202,528 | | | CETIP SA – Mercados Organizados (Diversified Financials) | | | 2,580,478 | |
| | 1,231,390 | | | Odontoprev SA (Health Care Equipment & Services) | | | 4,942,680 | |
| | 134,000 | | | Petroleo Brasileiro SA ADR (Energy) | | | 1,859,920 | |
| | 99,348 | | | Qualicorp SA (Health Care Equipment & Services)* | | | 965,521 | |
| | 98,239 | | | Totvs SA (Software & Services) | | | 1,604,163 | |
| | 233,138 | | | Vale SA (Materials) | | | 3,074,003 | |
| | 387,143 | | | Vale SA ADR (Materials) | | | 5,118,030 | |
| | | | | | | | |
| | | | | | | 35,098,303 | |
| | |
| | China – 33.1% | | | | |
| | 322,500 | | | AAC Technologies Holdings, Inc. (Technology Hardware & Equipment) | | | 1,805,784 | |
| | 10,008,800 | | | Agricultural Bank of China Ltd. Class H (Banks) | | | 4,211,510 | |
| | 5,272,360 | | | China Construction Bank Corp. Class H (Banks) | | | 3,650,443 | |
| | 1,005,000 | | | China Mengniu Dairy Co. Ltd. (Food, Beverage & Tobacco) | | | 5,171,863 | |
| | 396,000 | | | China Pacific Insurance Group Co. Ltd. Class H (Insurance) | | | 1,245,070 | |
| | 2,280,400 | | | China Petroleum & Chemical Corp. Class H (Energy) | | | 2,024,439 | |
| | 14,726 | | | Ctrip.com International Ltd. ADR (Retailing)* | | | 688,293 | |
| | 678,000 | | | ENN Energy Holdings Ltd. (Utilities) | | | 4,742,146 | |
| | 692,000 | | | Great Wall Motor Co. Ltd. Class H (Automobiles & Components) | | | 3,148,102 | |
| | 342,000 | | | Haitian International Holdings Ltd. (Capital Goods) | | | 688,999 | |
| | 345,000 | | | Hengan International Group Co. Ltd. (Household & Personal Products) | | | 3,637,010 | |
| | 177,644 | | | Hollysys Automation Technologies Ltd. (Technology Hardware & Equipment)* | | | 3,803,358 | |
| | 3,883,050 | | | Industrial & Commercial Bank of China Ltd. Class H (Banks) | | | 2,320,193 | |
| | 1,808,000 | | | PetroChina Co. Ltd. Class H (Energy) | | | 2,086,026 | |
| | 358,500 | | | Shanghai Fosun Pharmaceutical Group Co. Ltd. Class H (Pharmaceuticals, Biotechnology & Life Sciences) | | | 1,216,628 | |
| | 429,000 | | | Shenzhou International Group Holdings Ltd. (Consumer Durables & Apparel) | | | 1,480,115 | |
| | |
| | Common Stocks – (continued) | | | | |
| | China – (continued) | | | | |
| | 97,068 | | | TAL Education Group ADR (Consumer Services)* | | $ | 2,147,144 | |
| | 187,200 | | | Tencent Holdings Ltd. (Software & Services) | | | 11,786,102 | |
| | 560,000 | | | Zhuzhou CSR Times Electric Co. Ltd. Class H (Capital Goods) | | | 1,646,779 | |
| | | | | | | | |
| | | | | | | 57,500,004 | |
| | |
| | Cyprus – 0.4% | | | | |
| | 82,645 | | | Globaltrans Investment PLC GDR (Transportation) | | | 787,660 | |
| | |
| | Hong Kong – 5.0% | | | | |
| | 208,000 | | | Galaxy Entertainment Group Ltd. (Consumer Services)* | | | 1,641,989 | |
| | 849,000 | | | Haier Electronics Group Co. Ltd. (Consumer Durables & Apparel) | | | 2,088,425 | |
| | 911,000 | | | Shimao Property Holdings Ltd. (Real Estate) | | | 1,806,432 | |
| | 3,920,000 | | | Sino Biopharmaceutical Ltd. (Pharmaceuticals, Biotechnology & Life Sciences) | | | 3,076,330 | |
| | | | | | | | |
| | | | | | | 8,613,176 | |
| | |
| | India – 20.9% | | | | |
| | 121,297 | | | Axis Bank Ltd. (Banks) | | | 3,078,617 | |
| | 77,777 | | | Bajaj Finance Ltd. (Diversified Financials) | | | 2,411,261 | |
| | 13,529 | | | Bosch Ltd. (Automobiles & Components) | | | 2,363,588 | |
| | 75,719 | | | CRISIL Ltd. (Diversified Financials) | | | 1,629,876 | |
| | 23,839 | | | Gillette India Ltd. (Household & Personal Products) | | | 751,947 | |
| | 28,112 | | | Grasim Industries Ltd. GDR (Materials) | | | 1,220,612 | |
| | 110,382 | | | HCL Technologies Ltd. (Software & Services) | | | 2,568,633 | |
| | 191,839 | | | HDFC Bank Ltd. (Banks) | | | 2,397,100 | |
| | 36,393 | | | Hero MotoCorp Ltd. (Automobiles & Components) | | | 1,330,829 | |
| | 106,861 | | | ICICI Bank Ltd. (Banks) | | | 2,203,258 | |
| | 192,499 | | | IndusInd Bank Ltd. (Banks) | | | 1,571,751 | |
| | 143,534 | | | Just Dial Ltd. (Software & Services)* | | | 2,811,664 | |
| | 37,328 | | | Oracle Financial Services Software Ltd. (Software & Services)* | | | 1,856,900 | |
| | 540,992 | | | Prestige Estates Projects Ltd. (Real Estate) | | | 1,528,245 | |
| | 169,052 | | | Siemens Ltd. (Capital Goods) | | | 1,946,045 | |
| | 227,476 | | | Sobha Developers Ltd. (Real Estate) | | | 1,405,166 | |
| | 293,415 | | | Thermax Ltd. (Capital Goods) | | | 3,571,914 | |
| | 365,607 | | | Titan Co. Ltd. (Consumer Durables & Apparel) | | | 1,640,769 | |
| | | | | | | | |
| | | | | | | 36,288,175 | |
| | |
| | Russia – 14.6% | | | | |
| | 1,441,707 | | | Alrosa AO (Materials) | | | 1,489,813 | |
| | |
| | |
| 32 | | The accompanying notes are an integral part of these financial statements. |
GOLDMAN SACHS BRIC FUND
| | | | | | | | |
| Shares | | | Description | | Value | |
| | Common Stocks – (continued) | | | | |
| | Russia – (continued) | | | | |
| | 550,052 | | | OAO Gazprom ADR (Energy) | | $ | 3,975,191 | |
| | 105,968 | | | OAO Lukoil ADR (Energy) | | | 5,609,889 | |
| | 958,916 | | | OAO Moscow Exchange MICEX-RTS (Diversified Financials) | | | 1,422,149 | |
| | 358,906 | | | OAO Rosneft GDR (Energy) | | | 2,256,478 | |
| | 88,190 | | | DIXY Group OJSC (Food & Staples Retailing)* | | | 736,458 | |
| | 19,812 | | | OJSC Magnit (Food & Staples Retailing) | | | 3,934,826 | |
| | 45,056 | | | OJSC Mobile Telesystems (Telecommunication Services) | | | 327,141 | |
| | 61,623 | | | OJSC Mobile Telesystems ADR (Telecommunication Services) | | | 1,032,801 | |
| | 2,241,247 | | | Sberbank of Russia (Banks)* | | | 4,573,664 | |
| | | | | | | | |
| | | | | | | 25,358,410 | |
| | |
| | TOTAL COMMON STOCKS | | | | |
| | (Cost $163,018,190) | | $ | 163,645,728 | |
| | |
| | | | | | | | |
| | Preferred Stocks – 4.0% | | | | |
| | Brazil – 4.0% | | | | |
| | 233,068 | | | Banco Bradesco SA (Banks) | | $ | 3,469,235 | |
| | 43,860 | | | Cia Brasileira de Distribuicao Grupo Pao de Acucar (Food & Staples Retailing) | | | 2,075,224 | |
| | 90,069 | | | Itau Unibanco Holding SA (Banks) | | | 1,486,507 | |
| | |
| | TOTAL PREFERRED STOCKS | | | | |
| | (Cost $6,907,880) | | $ | 7,030,966 | |
| | |
| | | | | | | | |
| | Exchange Traded Fund – 1.4% | | | | |
| | United States – 1.4% | | | | |
| | 67,949 | | | iShares China Large-Cap Fund | | $ | 2,373,459 | |
| | (Cost $2,367,540) | | | | |
| | |
| | | | | | | | |
| | | | | | | | | | |
| Units | | | Description | | Expiration
Month | | Value | |
| | Right – 0.0% | |
| | Brazil – 0.0% | |
| | 1,034 | | | AMBEV SA (Food, Beverage & Tobacco)* | | 05/29 | | $ | 116 | |
| | (Cost $0) | | | | | | |
| | |
| | TOTAL INVESTMENTS – 99.6% | | | | |
| | (Cost $172,293,610) | | | | $ | 173,050,269 | |
| | |
| OTHER ASSETS IN EXCESS OF
LIABILITIES – 0.4% | | | 756,570 | |
| | |
| | NET ASSETS – 100.0% | | $ | 173,806,839 | |
| | |
| | |
| The percentage shown for each investment category reflects the value of investments in that category as a percentage of net assets. |
* | | Non-income producing security. |
| | | | |
|
Investment Abbreviations: |
ADR | | —American Depositary Receipt |
GDR | | —Global Depositary Receipt |
|
| | |
| The accompanying notes are an integral part of these financial statements. | | 33 |
GOLDMAN SACHS EMERGING MARKETS EQUITY FUND
Schedule of Investments
April 30, 2014 (Unaudited)
| | | | | | | | |
| Shares | | | Description | | Value | |
| | | | | | | | |
| | Common Stocks – 96.4% | | | | |
| | Brazil – 10.9% | | | | |
| | 350,913 | | | AMBEV SA (Food, Beverage & Tobacco) | | $ | 2,565,257 | |
| | 554,095 | | | BB Seguridade Participacoes SA (Insurance) | | | 6,493,330 | |
| | 105,274 | | | BRF SA (Food, Beverage & Tobacco) | | | 2,384,275 | |
| | 230,938 | | | CETIP SA – Mercados Organizados (Diversified Financials) | | | 2,942,459 | |
| | 117,242 | | | Multiplus SA (Media) | | | 1,500,130 | |
| | 1,569,846 | | | Odontoprev SA (Health Care Equipment & Services) | | | 6,301,209 | |
| | 357,234 | | | Qualicorp SA (Health Care Equipment & Services)* | | | 3,471,807 | |
| | 97,542 | | | Sao Martinho SA (Food, Beverage & Tobacco) | | | 1,461,107 | |
| | 216,113 | | | Totvs SA (Software & Services) | | | 3,528,949 | |
| | 536,411 | | | Vale SA ADR (Materials) | | | 7,091,353 | |
| | | | | | | | |
| | | | | | | 37,739,876 | |
| | |
| | Chile – 0.7% | | | | |
| | 31,817 | | | Banco de Chile ADR (Banks) | | | 2,461,681 | |
| | |
| | China – 13.8% | | | | |
| | 309,500 | | | AAC Technologies Holdings, Inc. (Technology Hardware & Equipment) | | | 1,732,993 | |
| | 5,829,000 | | | Agricultural Bank of China Ltd. Class H (Banks) | | | 2,452,731 | |
| | 575,000 | | | Bloomage Biotechnology Corp. Ltd. (Materials) | | | 1,551,365 | |
| | 873,000 | | | China Mengniu Dairy Co. Ltd. (Food, Beverage & Tobacco) | | | 4,492,573 | |
| | 24,611 | | | Ctrip.com International Ltd. ADR (Retailing)* | | | 1,150,318 | |
| | 802,000 | | | ENN Energy Holdings Ltd. (Utilities) | | | 5,609,441 | |
| | 754,000 | | | Great Wall Motor Co. Ltd. Class H (Automobiles & Components) | | | 3,430,157 | |
| | 773,000 | | | Haitian International Holdings Ltd. (Capital Goods) | | | 1,557,300 | |
| | 411,000 | | | Hengan International Group Co. Ltd. (Household & Personal Products) | | | 4,332,785 | |
| | 204,134 | | | Hollysys Automation Technologies Ltd. (Technology Hardware & Equipment)* | | | 4,370,509 | |
| | 598,500 | | | Shanghai Fosun Pharmaceutical Group Co. Ltd. Class H (Pharmaceuticals, Biotechnology & Life Sciences) | | | 2,031,108 | |
| | 154,725 | | | TAL Education Group ADR (Consumer Services)* | | | 3,422,517 | |
| | 169,800 | | | Tencent Holdings Ltd. (Software & Services) | | | 10,690,599 | |
| | 6,459 | | | Vipshop Holdings Ltd. ADR (Retailing)* | | | 905,487 | |
| | | | | | | | |
| | | | | | | 47,729,883 | |
| | |
| | | | | | | | |
| | Common Stocks – (continued) | | | | |
| | Colombia – 0.9% | | | | |
| | 63,329 | | | Banco de Bogota SA (Banks) | | $ | 2,285,838 | |
| | 1,169,519 | | | Grupo Aval Acciones y Valores (Banks) | | | 794,143 | |
| | | | | | | | |
| | | | | | | 3,079,981 | |
| | |
| | Cyprus – 0.2% | | | | |
| | 84,136 | | | Globaltrans Investment PLC GDR (Transportation) | | | 801,870 | |
| | |
| | Georgia – 0.8% | | | | |
| | 66,513 | | | Bank of Georgia Holdings PLC (Banks) | | | 2,925,435 | |
| | |
| | Hong Kong – 2.9% | | | | |
| | 2,952,000 | | | Dawnrays Pharmaceutical Holdings Ltd. (Pharmaceuticals, Biotechnology & Life Sciences) | | | 2,237,165 | |
| | 207,000 | | | Galaxy Entertainment Group Ltd. (Consumer Services)* | | | 1,634,095 | |
| | 673,000 | | | Haier Electronics Group Co. Ltd. (Consumer Durables & Apparel) | | | 1,655,489 | |
| | 4,144,000 | | | Sino Biopharmaceutical Ltd. (Pharmaceuticals, Biotechnology & Life Sciences) | | | 3,252,120 | |
| | 808,000 | | | Vinda International Holdings Ltd. (Household & Personal Products) | | | 1,183,268 | |
| | | | | | | | |
| | | | | | | 9,962,137 | |
| | |
| | India – 12.0% | | | | |
| | 156,615 | | | Axis Bank Ltd. (Banks) | | | 3,975,017 | |
| | 149,122 | | | Bajaj Finance Ltd. (Diversified Financials) | | | 4,623,116 | |
| | 12,269 | | | Bosch Ltd. (Automobiles & Components) | | | 2,143,459 | |
| | 38,948 | | | Gillette India Ltd. (Household & Personal Products) | | | 1,228,526 | |
| | 38,890 | | | Grasim Industries Ltd. GDR (Materials) | | | 1,688,589 | |
| | 61,422 | | | HCL Technologies Ltd. (Software & Services) | | | 1,429,314 | |
| | 191,403 | | | ICICI Bank Ltd. (Banks) | | | 3,946,344 | |
| | 361,281 | | | Indiabulls Housing Finance Ltd. (Banks) | | | 1,793,168 | |
| | 262,032 | | | IndusInd Bank Ltd. (Banks) | | | 2,139,487 | |
| | 170,282 | | | Just Dial Ltd. (Software & Services)* | | | 3,335,626 | |
| | 41,000 | | | Monsanto India Ltd. (Materials) | | | 1,178,338 | |
| | 27,509 | | | Oracle Financial Services Software Ltd. (Software & Services)* | | | 1,368,449 | |
| | 692,389 | | | Prestige Estates Projects Ltd. (Real Estate) | | | 1,955,925 | |
| | 276,028 | | | Siemens Ltd. (Capital Goods) | | | 3,177,501 | |
| | 443,907 | | | Sobha Developers Ltd. (Real Estate) | | | 2,742,106 | |
| | 290,979 | | | Thermax Ltd. (Capital Goods) | | | 3,542,259 | |
| | 299,346 | | | Titan Co. Ltd. (Consumer Durables & Apparel) | | | 1,343,403 | |
| | | | | | | | |
| | | | | | | 41,610,627 | |
| | |
| | |
| 34 | | The accompanying notes are an integral part of these financial statements. |
GOLDMAN SACHS EMERGING MARKETS EQUITY FUND
| | | | | | | | |
| Shares | | | Description | | Value | |
| | | | | | | | |
| | Common Stocks – (continued) | | | | |
| | Indonesia – 3.9% | | | | |
| | 6,219,000 | | | PT Bank Central Asia Tbk (Banks) | | $ | 5,922,962 | |
| | 9,144,500 | | | PT Media Nusantara Citra Tbk (Media) | | | 2,155,942 | |
| | 6,767,200 | | | PT Surya Citra Media Tbk (Media) | | | 1,845,833 | |
| | 866,500 | | | PT Unilever Indonesia Tbk (Household & Personal Products) | | | 2,201,407 | |
| | 7,865,300 | | | PT Wijaya Karya Persero Tbk (Capital Goods) | | | 1,546,405 | |
| | | | | | | | |
| | | | | | | 13,672,549 | |
| | |
| | Malaysia – 1.7% | | | | |
| | 288,900 | | | Public Bank Bhd (Banks) | | | 1,783,411 | |
| | 4,145,300 | | | Tune Ins Holdings Bhd (Insurance)* | | | 2,766,969 | |
| | 2,013,400 | | | UEM Sunrise Bhd (Real Estate) | | | 1,421,626 | |
| | | | | | | | |
| | | | | | | 5,972,006 | |
| | |
| | Mexico – 5.3% | | | | |
| | 1,013,476 | | | Alsea SAB de CV (Consumer Services) | | | 3,500,715 | |
| | 1,974,610 | | | Bolsa Mexicana de Valores SAB de CV (Diversified Financials) | | | 4,051,024 | |
| | 1,645,878 | | | Compartamos SAB de CV (Diversified Financials) | | | 2,883,455 | |
| | 408,600 | | | Infraestructura Energetica Nova SAB de CV (Utilities) | | | 2,127,522 | |
| | 963,468 | | | Mexichem SAB de CV (Materials) | | | 3,585,734 | |
| | 156,100 | | | Promotora y Operadora de Infraestructura SAB de CV (Capital Goods)* | | | 2,181,838 | |
| | | | | | | | |
| | | | | | | 18,330,288 | |
| | |
| | Netherlands – 0.5% | | | | |
| | 41,891 | | | OCI (Capital Goods)* | | | 1,791,471 | |
| | |
| | Peru – 2.6% | | | | |
| | 1,370,057 | | | BBVA Banco Continental SA (Banks) | | | 2,664,474 | |
| | 32,500 | | | Credicorp Ltd. (Banks) | | | 4,850,625 | |
| | 50,866 | | | Intercorp Financial Services, Inc. (Banks) | | | 1,627,712 | |
| | | | | | | | |
| | | | | | | 9,142,811 | |
| | |
| | Philippines – 2.5% | | | | |
| | 13,805,500 | | | Emperador, Inc. (Software & Services)* | | | 3,943,664 | |
| | 21,601,000 | | | Megaworld Corp. (Real Estate) | | | 2,261,634 | |
| | 696,240 | | | Universal Robina Corp. (Food, Beverage & Tobacco) | | | 2,286,288 | |
| | | | | | | | |
| | | | | | | 8,491,586 | |
| | |
| | Poland – 0.6% | | | | |
| | 33,766 | | | Bank Pekao SA (Banks) | | | 2,167,116 | |
| | |
| | Russia – 7.3% | | | | |
| | 2,207,955 | | | Alrosa AO (Materials) | | | 2,281,629 | |
| | 232,482 | | | OAO Gazprom ADR (Energy) | | | 1,680,133 | |
| | |
| | | | | | | | |
| | Common Stocks – (continued) | | | | |
| | Russia – (continued) | | | | |
| | 119,025 | | | OAO Lukoil ADR (Energy) | | $ | 6,301,119 | |
| | 1,615,441 | | | OAO Moscow Exchange MICEX-RTS (Diversified Financials) | | | 2,395,829 | |
| | 451,678 | | | OAO Rosneft GDR (Energy) | | | 2,839,745 | |
| | 111,310 | | | OJSC DIXY Group (Food & Staples Retailing)* | | | 929,529 | |
| | 16,556 | | | OJSC Magnit (Food & Staples Retailing) | | | 3,288,157 | |
| | 112,241 | | | OJSC Mobile Telesystems (Telecommunication Services) | | | 814,955 | |
| | 60,841 | | | OJSC Mobile Telesystems ADR (Telecommunication Services) | | | 1,019,695 | |
| | 447,997 | | | Sberbank of Russia ADR (Banks)* | | | 3,773,959 | |
| | | | | | | | |
| | | | | | | 25,324,750 | |
| | |
| | South Africa – 3.1% | | | | |
| | 298,955 | | | JSE Ltd. (Diversified Financials) | | | 2,742,185 | |
| | 754,047 | | | Nampak Ltd. (Materials) | | | 2,813,093 | |
| | 754,504 | | | PPC Ltd. (Materials) | | | 2,195,247 | |
| | 144,361 | | | Santam Ltd. (Insurance) | | | 2,914,709 | |
| | | | | | | | |
| | | | | | | 10,665,234 | |
| | |
| | South Korea – 11.8% | | | | |
| | 36,360 | | | CJ CGV Co. Ltd. (Media) | | | 1,695,195 | |
| | 22,340 | | | Grand Korea Leisure Co. Ltd. (Consumer Services) | | | 934,196 | |
| | 93,360 | | | Hana Financial Group, Inc. (Banks) | | | 3,294,310 | |
| | 212,370 | | | Hanjin Kal Corp. (Transportation)* | | | 4,559,625 | |
| | 75,140 | | | Hanssem Co. Ltd. (Consumer Durables & Apparel) | | | 6,147,706 | |
| | 337,069 | | | Industrial Bank of Korea GDR (Banks)(a) | | | 4,151,774 | |
| | 87,406 | | | Kia Motors Corp. (Automobiles & Components) | | | 4,849,480 | |
| | 46,860 | | | KONA I Co. Ltd. (Technology Hardware & Equipment) | | | 1,750,259 | |
| | 82,740 | | | KT Corp. (Telecommunication Services) | | | 2,637,266 | |
| | 3,411 | | | Samsung Electronics Co. Ltd. (Semiconductors & Semiconductor Equipment) | | | 4,447,811 | |
| | 68,038 | | | Seoul Semiconductor Co. Ltd. (Semiconductors & Semiconductor Equipment) | | | 2,738,689 | |
| | 98,890 | | | SK Hynix, Inc. (Semiconductors & Semiconductor Equipment)* | | | 3,856,066 | |
| | | | | | | | |
| | | | | | | 41,062,377 | |
| | |
| | Taiwan – 8.9% | | | | |
| | 1,007,000 | | | Chipbond Technology Corp. (Semiconductors & Semiconductor Equipment) | | | 1,724,739 | |
| | 671,000 | | | Epistar Corp. (Semiconductors & Semiconductor Equipment)* | | | 1,468,387 | |
| | |
| | |
| The accompanying notes are an integral part of these financial statements. | | 35 |
GOLDMAN SACHS EMERGING MARKETS EQUITY FUND
Schedule of Investments (continued)
April 30, 2014 (Unaudited)
| | | | | | | | |
| Shares | | | Description | | Value | |
| | | | | | | | |
| | Common Stocks – (continued) | | | | |
| | Taiwan – (continued) | | | | |
| | 73,000 | | | Hermes Microvision, Inc. (Semiconductors & Semiconductor Equipment) | | $ | 3,032,127 | |
| | 901,963 | | | Hon Hai Precision Industry Co. Ltd. (Technology Hardware & Equipment) | | | 2,590,403 | |
| | 133,000 | | | MediaTek, Inc. (Semiconductors & Semiconductor Equipment) | | | 2,084,110 | |
| | 403,000 | | | PChome Online, Inc. (Software & Services) | | | 2,770,666 | |
| | 203,000 | | | President Chain Store Corp. (Food & Staples Retailing) | | | 1,510,547 | |
| | 477,000 | | | Silergy Corp. (Semiconductors & Semiconductor Equipment)* | | | 3,956,116 | |
| | 2,963,883 | | | Taiwan Semiconductor Manufacturing Co. Ltd. (Semiconductors & Semiconductor Equipment) | | | 11,646,157 | |
| | | | | | | | |
| | | | | | | 30,783,252 | |
| | |
| | Thailand – 2.4% | | | | |
| | 864,400 | | | Airports of Thailand PCL (Transportation) | | | 5,220,336 | |
| | 530,200 | | | Kasikornbank PCL NVDR (Banks) | | | 3,145,242 | |
| | | | | | | | |
| | | | | | | 8,365,578 | |
| | |
| | Turkey – 3.6% | | | | |
| | 542,831 | | | Aselsan Elektronik Sanayi Ve Ticaret AS (Capital Goods) | | | 2,417,054 | |
| | 200,446 | | | BIM Birlesik Magazalar AS (Food & Staples Retailing) | | | 4,640,039 | |
| | 229,561 | | | TAV Havalimanlari Holding AS (Transportation) | | | 1,843,183 | |
| | 457,619 | | | Ulker Biskuvi Sanayi AS (Food, Beverage & Tobacco) | | | 3,506,884 | |
| | | | | | | | |
| | | | | | | 12,407,160 | |
| | |
| | TOTAL COMMON STOCKS | | | | |
| | (Cost $310,965,122) | | $ | 334,487,668 | |
| | |
| | | | | | | | |
| | Preferred Stocks – 1.5% | | | | |
| | Brazil – 0.8% | | | | |
| | 54,826 | | | Cia Brasileira de Distribuicao Grupo Pao de Acucar (Food & Staples Retailing) | | $ | 2,594,077 | |
| | |
| | Colombia – 0.7% | | | | |
| | 3,508,557 | | | Grupo Aval Acciones y Valores (Banks) | | | 2,373,370 | |
| | |
| | TOTAL PREFERRED STOCKS | | | | |
| | (Cost $4,571,254) | | $ | 4,967,447 | |
| | |
| | | | | | | | |
| | | | | | | | |
| | Exchange Traded Funds – 1.7% | | | | |
| | United States – 1.7% | | | | |
| | 74,353 | | | iShares MSCI South Korea Capped Fund | | $ | 4,650,780 | |
| | 91,630 | | | iShares MSCI Taiwan Fund | | | 1,341,464 | |
| | |
| | TOTAL EXCHANGE TRADED FUNDS | | | | |
| | (Cost $6,046,982) | | $ | 5,992,244 | |
| | |
| | | | | | | | | | |
| Units | | Description | | Expiration
Month | | | Value | |
| Right – 0.0% | |
| Brazil – 0.0% | |
| 491 | | AMBEV SA (Food,
Beverage & Tobacco)* | | | 05/14 | | | $ | 55 | |
| (Cost $0) | | | | | | | | |
| |
| TOTAL INVESTMENTS – 99.6% | |
| (Cost $321,583,358) | | | $ | 345,447,414 | |
| |
| OTHER ASSETS IN EXCESS OF LIABILITIES – 0.4% | | | | 1,487,039 | |
| |
| NET ASSETS – 100.0% | | | $ | 346,934,453 | |
| |
| | |
| The percentage shown for each investment category reflects the value of investments in that category as a percentage of net assets. |
* | | Non-income producing security. |
(a) | | Exempt from registration under Rule 144A of the Securities Act of 1933. Under procedures approved by the Board of Trustees, such securities have been determined to be liquid by the Investment Adviser and may be resold, normally to qualified institutional buyers in transactions exempt from registration. Total market value of Rule 144A securities amounts to $4,151,774, which represents approximately 1.2% of net assets as of April 30, 2014. |
| | |
|
Investment Abbreviations: |
ADR | | —American Depositary Receipt |
GDR | | —Global Depositary Receipt |
NVDR | | —Non-Voting Depositary Receipt |
|
| | |
| 36 | | The accompanying notes are an integral part of these financial statements. |
GOLDMAN SACHS N-11 EQUITY FUND
Schedule of Investments
April 30, 2014 (Unaudited)
| | | | | | | | |
| Shares | | | Description | | Value | |
| | | | | | | | |
| | Common Stocks – 98.4% | |
| | Bangladesh – 2.9% | |
| | 1,026,000 | | | GrameenPhone Ltd. (Telecommunication Services) | | $ | 3,547,374 | |
| | 5,553,454 | | | Islami Bank Bangladesh Ltd. (Banks) | | | 1,882,163 | |
| | 1,544,379 | | | Square Pharmaceuticals Ltd. (Pharmaceuticals, Biotechnology & Life Sciences) | | | 5,606,334 | |
| | 1,891,775 | | | Titas Gas Transmission & Distribution Co. Ltd. (Energy) | | | 1,915,813 | |
| | | | | | | | |
| | | | | | | 12,951,684 | |
| | |
| | Egypt – 6.8% | |
| | 2,034,620 | | | Commercial International Bank Egypt SAE (Banks) | | | 10,919,379 | |
| | 946,193 | | | Commercial International Bank Egypt SAE (Registered) GDR (Banks) | | | 4,770,187 | |
| | 34,561 | | | Eastern Tobacco (Food, Beverage & Tobacco) | | | 823,638 | |
| | 3,059,775 | | | Global Telecom Holding (Telecommunication Services)* | | | 2,266,160 | |
| | 860,304 | | | Global Telecom Holding GDR (Telecommunication Services)* | | | 3,205,340 | |
| | 93,285 | | | Oriental Weavers (Consumer Durables & Apparel)* | | | 648,963 | |
| | 3,971,215 | | | Talaat Moustafa Group (Real Estate) | | | 5,072,012 | |
| | 972,013 | | | Telecom Egypt Co. (Telecommunication Services) | | | 2,062,163 | |
| | | | | | | | |
| | | | | | | 29,767,842 | |
| | |
| | Indonesia – 14.3% | |
| | 9,311,100 | | | PT Astra International Tbk (Automobiles & Components) | | | 5,999,070 | |
| | 7,281,800 | | | PT Bank Central Asia Tbk (Banks) | | | 6,935,170 | |
| | 6,832,500 | | | PT Bank Mandiri (Persero) Tbk (Banks) | | | 5,837,798 | |
| | 7,285,000 | | | PT Bank Negara Indonesia (Persero) Tbk (Banks) | | | 3,044,728 | |
| | 5,609,000 | | | PT Bank Rakyat Indonesia (Persero) Tbk (Banks) | | | 4,816,759 | |
| | 15,282,600 | | | PT Bumi Serpong Damai (Real Estate) | | | 2,070,355 | |
| | 2,255,000 | | | PT Charoen Pokphand Indonesia Tbk (Food, Beverage & Tobacco) | | | 737,336 | |
| | 9,049,400 | | | PT Global Mediacom Tbk (Media) | | | 1,717,786 | |
| | 523,000 | | | PT Gudang Garam Tbk (Food, Beverage & Tobacco) | | | 2,562,314 | |
| | 251,500 | | | PT Indo Tambangraya Megah Tbk (Energy) | | | 555,886 | |
| | 1,054,000 | | | PT Indocement Tunggal Prakarsa Tbk (Materials) | | | 2,000,379 | |
| | 3,867,500 | | | PT Indofood Sukses Makmur Tbk (Food, Beverage & Tobacco) | | | 2,365,875 | |
| | 5,341,435 | | | PT Jasa Marga (Persero) Tbk (Transportation) | | | 2,729,006 | |
| | 14,537,400 | | | PT Kalbe Farma Tbk (Pharmaceuticals, Biotechnology & Life Sciences) | | | 1,947,012 | |
| | |
| | | | | | | | |
| | Common Stocks – (continued) | |
| | Indonesia – (continued) | |
| | 1,867,200 | | | PT Matahari Department Store Tbk (Retailing)* | | $ | 2,426,131 | |
| | 7,316,500 | | | PT Media Nusantara Citra Tbk (Media) | | | 1,724,966 | |
| | 9,739,500 | | | PT Perusahaan Gas Negara (Persero) Tbk (Utilities) | | | 4,498,226 | |
| | 2,450,500 | | | PT Semen Indonesia (Persero) Tbk (Materials) | | | 3,159,166 | |
| | 1,255,500 | | | PT Tambang Batubara Bukit Asam (Persero) Tbk (Energy) | | | 1,074,851 | |
| | 23,787,800 | | | PT Telekomunikasi Indonesia (Persero) Tbk (Telecommunication Services) | | | 4,675,506 | |
| | 3,193,900 | | | PT Tower Bersama Infrastructure Tbk (Telecommunication Services) | | | 1,799,112 | |
| | | | | | | | |
| | | | | | | 62,677,432 | |
| | |
| | Mexico – 22.5% | |
| | 1,904,500 | | | Alfa SAB de CV Class A (Capital Goods) | | | 5,015,002 | |
| | 500,800 | | | Alpek SA de CV (Materials) | | | 861,287 | |
| | 280,881 | | | Alsea SAB de CV (Consumer Services) | | | 970,210 | |
| | 904,048 | | | America Movil SAB de CV Series L ADR (Telecommunication Services) | | | 18,153,284 | |
| | 437,500 | | | Arca Continental SAB de CV (Food, Beverage & Tobacco) | | | 2,787,640 | |
| | 481,200 | | | Bolsa Mexicana de Valores SAB de CV (Diversified Financials) | | | 987,209 | |
| | 756,806 | | | Cemex SAB de CV ADR (Materials)* | | | 9,566,028 | |
| | 264,854 | | | Coca-Cola Femsa SAB de CV Series L (Food, Beverage & Tobacco) | | | 2,958,534 | |
| | 1,792,053 | | | Compartamos SAB de CV (Diversified Financials) | | | 3,139,543 | |
| | 183,400 | | | El Puerto de Liverpool SAB de CV (Retailing) | | | 1,888,707 | |
| | 83,900 | | | Fomento Economico Mexicano SAB de CV ADR (Food, Beverage & Tobacco) | | | 7,615,603 | |
| | 755,772 | | | Genomma Lab Internacional SAB de CV Class B (Pharmaceuticals, Biotechnology & Life Sciences)* | | | 1,915,606 | |
| | 132,722 | | | Gruma SAB de CV Class B (Food, Beverage & Tobacco)* | | | 1,172,537 | |
| | 208,873 | | | Grupo Aeroportuario del Sureste SAB de CV Class B (Transportation) | | | 2,555,762 | |
| | 1,532,715 | | | Grupo Financiero Banorte SAB de CV Class O (Banks) | | | 10,160,889 | |
| | 1,188,700 | | | Grupo Financiero Inbursa SAB de CV Class O (Banks) | | | 3,040,179 | |
| | 2,060,994 | | | Grupo Mexico SAB de CV Series B (Materials) | | | 6,189,559 | |
| | 198,618 | | | Grupo Televisa SAB ADR (Media) | | | 6,516,657 | |
| | 51,205 | | | Industrias Penoles SAB de CV (Materials) | | | 1,191,910 | |
| | |
| | |
| The accompanying notes are an integral part of these financial statements. | | 37 |
GOLDMAN SACHS N-11 EQUITY FUND
Schedule of Investments (continued)
April 30, 2014 (Unaudited)
| | | | | | | | |
| Shares | | | Description | | Value | |
| | | | | | | | |
| | Common Stocks – (continued) | |
| | Mexico – (continued) | |
| | 469,700 | | | Kimberly-Clark de Mexico SAB de CV Class A (Household & Personal Products) | | $ | 1,221,035 | |
| | 1,139,670 | | | Mexichem SAB de CV (Materials) | | | 4,241,504 | |
| | 2,736,494 | | | Wal-Mart de Mexico SAB de CV Series V (Food & Staples Retailing) | | | 6,919,281 | |
| | | | | | | | |
| | | | | | | 99,067,966 | |
| | |
| | Nigeria – 4.8% | |
| | 1,261,700 | | | Dangote Cement PLC (Materials) | | | 1,778,145 | |
| | 8,623,629 | | | FBN Holdings PLC (Banks) | | | 761,794 | |
| | 25,150,056 | | | Guaranty Trust Bank PLC (Banks) | | | 4,108,086 | |
| | 472,200 | | | Guinness Nigeria PLC (Food, Beverage & Tobacco) | | | 517,318 | |
| | 3,245,415 | | | Intercontinental Wapic Insurance PLC (Insurance)* | | | 14,545 | |
| | 1,711,583 | | | Lafarge Cement WAPCO Nigeria PLC (Materials) | | | 1,158,016 | |
| | 678,974 | | | Lekoil Ltd. (Energy)* | | | 733,683 | |
| | 389,664 | | | Nestle Nigeria PLC (Food, Beverage & Tobacco) | | | 2,522,568 | |
| | 4,079,589 | | | Nigerian Breweries PLC (Food, Beverage & Tobacco) | | | 3,809,140 | |
| | 187,387 | | | SEPLAT Petroleum Development Co. PLC (Energy)* | | | 754,576 | |
| | 14,519,431 | | | United Bank for Africa PLC (Banks) | | | 610,918 | |
| | 31,087,091 | | | Zenith Bank PLC (Banks) | | | 4,406,299 | |
| | | | | | | | |
| | | | | | | 21,175,088 | |
| | |
| | Pakistan – 5.4% | |
| | 361,500 | | | DG Khan Cement Co. Ltd. (Materials) | | | 323,074 | |
| | 921,133 | | | Engro Corp. Ltd. (Materials)* | | | 1,854,685 | |
| | 120,743 | | | Engro Fertilizers Ltd. (Materials)* | | | 81,454 | |
| | 2,958,500 | | | Fatima Fertilizer Co. Ltd. (Materials) | | | 969,572 | |
| | 619,300 | | | Fauji Fertilizer Co. Ltd. (Materials) | | | 712,336 | |
| | 1,945,667 | | | MCB Bank Ltd. (Banks) | | | 5,574,686 | |
| | 2,871,100 | | | Oil & Gas Development Co. Ltd. (Energy) | | | 7,341,169 | |
| | 275,700 | | | Pakistan Oilfields Ltd. (Energy) | | | 1,486,843 | |
| | 446,920 | | | Pakistan Petroleum Ltd. (Energy) | | | 1,052,768 | |
| | 1,824,000 | | | The HUB Power Co. Ltd. (Utilities) | | | 1,062,043 | |
| | 1,881,400 | | | United Bank Ltd. (Banks) | | | 3,503,428 | |
| | | | | | | | |
| | | | | | | 23,962,058 | |
| | |
| | Philippines – 4.1% | |
| | 949,900 | | | Aboitiz Power Corp. (Utilities) | | | 777,682 | |
| | 191,240 | | | Ayala Corp. (Diversified Financials) | | | 2,682,721 | |
| | 4,970,900 | | | Ayala Land, Inc. (Real Estate) | | | 3,368,636 | |
| | 440,792 | | | Bank of the Philippine Islands (Banks) | | | 898,535 | |
| | 316,760 | | | BDO Unibank, Inc. (Banks) | | | 628,650 | |
| | 2,950,900 | | | Energy Development Corp. (Utilities) | | | 370,410 | |
| | 20,270 | | | Globe Telecom, Inc. (Telecommunication Services) | | | 753,648 | |
| | 9,036,000 | | | Megaworld Corp. (Real Estate) | | | 946,073 | |
| | |
| | | | | | | | |
| | Common Stocks – (continued) | |
| | Philippines – (continued) | |
| | 6,302,100 | | | Metro Pacific Investments Corp. (Diversified Financials) | | $ | 719,025 | |
| | 598,988 | | | Metropolitan Bank & Trust Co. (Banks)* | | | 1,140,775 | |
| | 7,340 | | | Philippine Long Distance Telephone Co. (Telecommunication Services) | | | 474,471 | |
| | 67,657 | | | SM Investments Corp. (Capital Goods) | | | 1,102,897 | |
| | 6,814,700 | | | SM Prime Holdings, Inc. (Real Estate) | | | 2,501,697 | |
| | 471,430 | | | Universal Robina Corp. (Food, Beverage & Tobacco) | | | 1,548,065 | |
| | | | | | | | |
| | | | | | | 17,913,285 | |
| | |
| | South Korea – 23.3% | |
| | 28,710 | | | CJ CGV Co. Ltd. (Media) | | | 1,338,533 | |
| | 4,256 | | | Daelim Industrial Co. Ltd. (Capital Goods) | | | 347,281 | |
| | 7,170 | | | Doosan Heavy Industries & Construction Co. Ltd. (Capital Goods) | | | 242,355 | |
| | 3,600 | | | E-Mart Co. Ltd. (Food & Staples Retailing) | | | 823,199 | |
| | 32,540 | | | Grand Korea Leisure Co. Ltd. (Consumer Services) | | | 1,360,732 | |
| | 9,380 | | | GS Holdings (Energy) | | | 437,709 | |
| | 107,450 | | | Hana Financial Group, Inc. (Banks) | | | 3,791,491 | |
| | 18,522 | | | Hyundai Department Store Co. Ltd. (Retailing) | | | 2,388,459 | |
| | 29,317 | | | Hyundai Engineering & Construction Co. Ltd. (Capital Goods) | | | 1,587,218 | |
| | 7,671 | | | Hyundai Heavy Industries Co. Ltd. (Capital Goods) | | | 1,442,256 | |
| | 6,520 | | | Hyundai Mipo Dockyard (Capital Goods) | | | 890,140 | |
| | 5,968 | | | Hyundai Mobis (Automobiles & Components) | | | 1,704,959 | |
| | 35,766 | | | Hyundai Motor Co. (Automobiles & Components) | | | 7,974,621 | |
| | 9,504 | | | Hyundai Wia Corp. (Automobiles & Components) | | | 1,567,025 | |
| | 126,780 | | | KB Financial Group, Inc. (Banks) | | | 4,336,993 | |
| | 78,018 | | | Kia Motors Corp. (Automobiles & Components) | | | 4,328,613 | |
| | 13,940 | | | Kolon Industries, Inc. (Materials) | | | 925,466 | |
| | 16,440 | | | Korea Electric Power Corp. (Utilities) | | | 628,580 | |
| | 5,055 | | | Korea Gas Corp. (Utilities)* | | | 302,727 | |
| | 53,760 | | | KT Corp. (Telecommunication Services) | | | 1,713,553 | |
| | 21,043 | | | Kumho Petro Chemical Co. Ltd. (Materials) | | | 1,784,329 | |
| | 9,372 | | | LG Chem Ltd. (Materials) | | | 2,392,284 | |
| | 38,096 | | | LG Electronics, Inc. (Consumer Durables & Apparel) | | | 2,537,421 | |
| | 4,191 | | | LG Household & Health Care Ltd. (Household & Personal Products) | | | 1,919,046 | |
| | |
| | |
| 38 | | The accompanying notes are an integral part of these financial statements. |
GOLDMAN SACHS N-11 EQUITY FUND
| | | | | | | | |
| Shares | | | Description | | Value | |
| | | | | | | | |
| | Common Stocks – (continued) | |
| | South Korea – (continued) | |
| | 10,818 | | | Lotte Chemical Corp. (Materials) | | $ | 1,712,515 | |
| | 2,296 | | | NAVER Corp. (Software & Services) | | | 1,653,388 | |
| | 2,566 | | | Orion Corp. (Food, Beverage & Tobacco) | | | 1,960,516 | |
| | 11,572 | | | POSCO (Materials) | | | 3,418,697 | |
| | 44,434 | | | Samsung C&T Corp. (Capital Goods) | | | 2,794,354 | |
| | 21,126 | | | Samsung Electronics Co. Ltd. (Semiconductors & Semiconductor Equipment) | | | 27,547,482 | |
| | 7,178 | | | Samsung Fire & Marine Insurance Co. Ltd. (Insurance) | | | 1,704,996 | |
| | 11,900 | | | Samsung Life Insurance Co. Ltd. (Insurance) | | | 1,107,537 | |
| | 75,520 | | | Shinhan Financial Group Co. Ltd. (Banks) | | | 3,296,329 | |
| | 14,389 | | | SK Holdings Co. Ltd. (Capital Goods) | | | 2,552,326 | |
| | 122,090 | | | SK Hynix, Inc. (Semiconductors & Semiconductor Equipment)* | | | 4,760,714 | |
| | 10,859 | | | SK Innovation Co. Ltd. (Energy) | | | 1,244,001 | |
| | 8,434 | | | SK Telecom Co. Ltd. (Telecommunication Services) | | | 1,746,302 | |
| | | | | | | | |
| | | | | | | 102,264,147 | |
| | |
| | Turkey – 10.9% | |
| | 748,307 | | | Akbank TAS (Banks) | | | 2,627,095 | |
| | 210,066 | | | Aselsan Elektronik Sanayi Ve Ticaret AS (Capital Goods) | | | 935,357 | |
| | 239,613 | | | Aygaz AS (Utilities) | | | 992,009 | |
| | 215,988 | | | BIM Birlesik Magazalar AS (Food & Staples Retailing) | | | 4,999,814 | |
| | 2,479,420 | | | Emlak Konut Gayrimenkul Yatirim Ortakligi AS (REIT) | | | 3,255,762 | |
| | 330,885 | | | Enka Insaat ve Sanayi AS (Capital Goods) | | | 1,005,810 | |
| | 949,237 | | | Haci Omer Sabanci Holding AS (Diversified Financials) | | | 4,018,692 | |
| | 54,844 | | | Koza Altin Isletmeleri AS (Materials) | | | 549,962 | |
| | 301,095 | | | TAV Havalimanlari Holding AS (Transportation) | | | 2,417,541 | |
| | 100,516 | | | Tofas Turk Otomobil Fabrikasi AS (Automobiles & Components) | | | 616,946 | |
| | 845,680 | | | Turk Hava Yollari (Transportation) | | | 2,715,308 | |
| | 691,931 | | | Turk Telekomunikasyon AS (Telecommunication Services) | | | 2,082,669 | |
| | 886,102 | | | Turkcell Iletisim Hizmetleri AS (Telecommunication Services)* | | | 5,175,254 | |
| | 1,787,048 | | | Turkiye Garanti Bankasi AS (Banks) | | | 6,582,951 | |
| | 500,481 | | | Turkiye Halk Bankasi AS (Banks) | | | 3,365,044 | |
| | 1,704,496 | | | Turkiye Is Bankasi Class C (Banks) | | | 4,031,113 | |
| | 354,353 | | | Ulker Biskuvi Sanayi AS (Food, Beverage & Tobacco) | | | 2,715,523 | |
| | | | | | | | |
| | | | | | | 48,086,850 | |
| | |
| | | | | | | | |
| | Common Stocks – (continued) | |
| | United Kingdom – 0.6% | |
| | 264,904 | | | Afren PLC (Energy)* | | $ | 703,645 | |
| | 109,624 | | | Genel Energy PLC (Energy)* | | | 1,794,920 | |
| | | | | | | | |
| | | | | | | 2,498,565 | |
| | |
| | Vietnam – 2.8% | |
| | 713,710 | | | Bank for Foreign Trade of Vietnam JSC (Banks)* | | | 976,091 | |
| | 65,812 | | | Bao Viet Holdings (Insurance) | | | 114,563 | |
| | 759,810 | | | Masan Group Corp. (Food, Beverage & Tobacco)* | | | 3,453,862 | |
| | 195,822 | | | PetroVietnam Drilling and Well Services JSC (Energy) | | | 788,207 | |
| | 395,750 | | | Petrovietnam Fertilizer & Chemicals JSC (Materials) | | | 649,494 | |
| | 382,170 | | | PetroVietnam Gas JSC (Utilities) | | | 1,803,672 | |
| | 302,601 | | | Saigon Thuong Tin Commercial JSB (Banks) | | | 282,758 | |
| | 406,192 | | | Vietnam Joint Stock Commercial Bank for Industry and Trade (Banks) | | | 304,415 | |
| | 1,260,463 | | | Vingroup JSC (Real Estate)* | | | 3,886,166 | |
| | | | | | | | |
| | | | | | | 12,259,228 | |
| | |
| | TOTAL COMMON STOCKS | | | | |
| | (Cost $395,543,733) | | $ | 432,624,145 | |
| | |
| | | | | | | | |
| | Preferred Stock – 1.0% | |
| | South Korea – 1.0% | |
| | 4,152 | | | Samsung Electronics Co. Ltd. (Semiconductors & Semiconductor Equipment) | | $ | 4,175,166 | |
| | (Cost $3,095,611) | | | | |
| | |
| | TOTAL INVESTMENTS – 99.4% | | | | |
| | (Cost $398,639,344) | | $ | 436,799,311 | |
| | |
| OTHER ASSETS IN EXCESS OF
LIABILITIES – 0.6% | | | 2,823,764 | |
| | |
| | NET ASSETS – 100.0% | | $ | 439,623,075 | |
| | |
| | |
| The percentage shown for each investment category reflects the value of investments in that category as a percentage of net assets. |
* | | Non-income producing security. |
| | |
|
Investment Abbreviations: |
ADR | | —American Depositary Receipt |
GDR | | —Global Depositary Receipt |
REIT | | —Real Estate Investment Trust |
|
| | |
| The accompanying notes are an integral part of these financial statements. | | 39 |
GOLDMAN SACHS FUNDAMENTAL EMERGING MARKETS EQUITY FUNDS
Statements of Assets and Liabilities
April 30, 2014 (Unaudited)
| | | | | | | | | | | | | | | | | | |
| | | | | Asia
Equity Fund | | | BRIC Fund | | | Emerging Markets
Equity Fund | | | N-11
Equity Fund | |
| | Assets: | |
| | Investments, at value (cost $78,444,985, $172,293,610, $321,583,358 and $398,639,344) | | $ | 79,784,911 | | | $ | 173,050,269 | | | $ | 345,447,414 | | | $ | 436,799,311 | |
| | Cash | | | 4,593,566 | | | | — | | | | 98,898 | | | | 1,727,366 | |
| | Foreign currencies, at value (cost $320,517, $156,866, $869,552 and $1,510,680) | | | 318,969 | | | | 153,453 | | | | 870,612 | | | | 1,510,848 | |
| | Receivables: | | | | | | | | | | | | | | | | |
| | Investments sold | | | 412,042 | | | | 4,423,357 | | | | 5,721,089 | | | | 2,103,876 | |
| | Reimbursement from investment adviser | | | 94,991 | | | | — | | | | 15,839 | | | | 55,540 | |
| | Dividends | | | 41,248 | | | | 396,080 | | | | 657,143 | | | | 1,789,480 | |
| | Fund shares sold | | | 709 | | | | 59,710 | | | | 35,711 | | | | 330,517 | |
| | Foreign tax reclaims | | | — | | | | — | | | | 8,043 | | | | 5,532 | |
| | Other assets | | | 15,960 | | | | 15,389 | | | | 8,424 | | | | 18,456 | |
| | Total assets | | | 85,262,396 | | | | 178,098,258 | | | | 352,863,173 | | | | 444,340,926 | |
| | | | | | | | | | | | | | | | | | |
| | Liabilities: | | | | | | | | | | | | | | | | |
| | Due to custodian | | | — | | | | 524,047 | | | | — | | | | — | |
| | Payables: | | | | | | | | | | | | | | | | |
| | Investments purchased | | | 3,282,332 | | | | 2,368,833 | | | | 2,303,510 | | | | 1,833,937 | |
| | Amounts owed to affiliates | | | 58,824 | | | | 227,681 | | | | 346,264 | | | | 478,941 | |
| | Fund shares redeemed | | | 52,137 | | | | 998,249 | | | | 2,572,415 | | | | 1,690,449 | |
| | Foreign capital gains taxes | | | 41,448 | | | | — | | | | 466,717 | | | | 389,450 | |
| | Accrued expenses | | | 199,495 | | | | 172,609 | | | | 239,814 | | | | 325,074 | |
| | Total liabilities | | | 3,634,236 | | | | 4,291,419 | | | | 5,928,720 | | | | 4,717,851 | |
| | | | | | | | | | | | | | | | | | |
| | Net Assets: | | | | | | | | | | | | | | | | |
| | Paid-in capital | | | 94,787,311 | | | | 411,651,552 | | | | 798,599,131 | | | | 421,350,780 | |
| | Undistributed (distributions in excess of) net investment income (loss) | | | (534,094 | ) | | | (744,337 | ) | | | 35,526 | | | | 612,788 | |
| | Accumulated net realized loss | | | (13,920,149 | ) | | | (237,815,756 | ) | | | (474,940,883 | ) | | | (20,372,524 | ) |
| | Net unrealized gain | | | 1,295,092 | | | | 715,380 | | | | 23,240,679 | | | | 38,032,031 | |
| | | NET ASSETS | | $ | 81,628,160 | | | $ | 173,806,839 | | | $ | 346,934,453 | | | $ | 439,623,075 | |
| | | Net Assets: | | | | | | | | | | | | | | | | |
| | | Class A | | $ | 13,503,590 | | | $ | 65,969,926 | | | $ | 30,048,830 | | | $ | 103,546,529 | |
| | | Class B | | | 373,147 | | | | — | | | | 2,361,666 | | | | — | |
| | | Class C | | | 2,235,539 | | | | 43,197,452 | | | | 10,764,126 | | | | 16,574,116 | |
| | | Institutional | | | 65,492,419 | | | | 63,817,601 | | | | 288,883,628 | | | | 292,241,903 | |
| | | Service | | | — | | | | — | | | | 14,562,814 | | | | — | |
| | | Class IR | | | 23,465 | (a) | | | 821,860 | | | | 313,389 | | | | 27,260,527 | |
| | | Total Net Assets | | $ | 81,628,160 | | | $ | 173,806,839 | | | $ | 346,934,453 | | | $ | 439,623,075 | |
| | | Shares outstanding $0.001 par value (unlimited shares authorized): | | | | | | | | | | | | | | | | |
| | | Class A | | | 702,930 | | | | 5,376,220 | | | | 1,980,735 | | | | 9,215,524 | |
| | | Class B | | | 20,466 | | | | — | | | | 171,892 | | | | — | |
| | | Class C | | | 124,059 | | | | 3,676,817 | | | | 777,774 | | | | 1,503,441 | |
| | | Institutional | | | 3,259,990 | | | | 5,100,687 | | | | 17,883,412 | | | | 25,839,488 | |
| | | Service | | | — | | | | — | | | | 989,213 | | | | — | |
| | | Class IR | | | 1,168 | (a) | | | 65,164 | | | | 19,480 | | | | 2,416,954 | |
| | | Net asset value, offering and redemption price per share:(b) | | | | | | | | | | | | | | | | |
| | | Class A | | | $19.21 | | | | $12.27 | | | | $15.17 | | | | $11.24 | |
| | | Class B | | | 18.23 | | | | — | | | | 13.74 | | | | — | |
| | | Class C | | | 18.02 | | | | 11.75 | | | | 13.84 | | | | 11.02 | |
| | | Institutional | | | 20.09 | | | | 12.51 | | | | 16.15 | | | | 11.31 | |
| | | Service | | | — | | | | — | | | | 14.72 | | | | — | |
| | | Class IR | | | 20.09 | (a) | | | 12.61 | | | | 16.09 | | | | 11.28 | |
| | (a) | | Commenced operations on February 28, 2014 for the Asia Equity Fund. |
| | (b) | | Maximum public offering price per share for Class A shares of the Asia Equity, BRIC, Emerging Markets Equity and N-11 Equity Funds is $20.33, $12.98, $16.05 and $11.89, respectively. At redemption, Class B and Class C Shares may be subject to a contingent deferred sales charge assessed on the amount equal to the lesser of the current NAV or the original purchase price of the shares. |
| | |
| 40 | | The accompanying notes are an integral part of these financial statements. |
GOLDMAN SACHS FUNDAMENTAL EMERGING MARKETS EQUITY FUNDS
Statements of Operations
For the Six Months Ended April 30, 2014 (Unaudited)
| | | | | | | | | | | | | | | | | | |
| | | | | Asia Equity Fund | | | BRIC Fund | | | Emerging Markets
Equity Fund | | | N-11
Equity Fund | |
| | Investment income: | |
| | Dividends (net of foreign taxes withheld of $29,959, $5,354, $208,638 and $738,473) | | $ | 240,118 | | | $ | 1,095,281 | | | $ | 2,809,001 | | | $ | 6,008,582 | |
| | | | | | | | | | | | | | | | | | |
| | Expenses: | |
| | Management fees | | | 298,428 | | | | 1,359,102 | | | | 2,249,388 | | | | 2,861,261 | |
| | Custody, accounting and administrative services | | | 128,805 | | | | 129,127 | | | | 336,863 | | | | 522,730 | |
| | Professional fees | | | 77,251 | | | | 48,194 | | | | 47,409 | | | | 66,286 | |
| | Distribution and Service fees(a) | | | 31,044 | | | | 340,088 | | | | 110,071 | | | | 212,814 | |
| | Registration fees | | | 26,223 | | | | 13,832 | | | | 16,010 | | | | 45,455 | |
| | Transfer Agent fees(a) | | | 24,594 | | | | 136,512 | | | | 110,175 | | | | 201,061 | |
| | Printing and mailing costs | | | 12,600 | | | | 36,640 | | | | 78,399 | | | | 68,740 | |
| | Trustee fees | | | 11,735 | | | | 12,053 | | | | 12,337 | | | | 12,367 | |
| | Service share fees — Service Plan | | | — | | | | — | | | | 17,921 | | | | — | |
| | Service share fees — Shareholder Administration Plan | | | — | | | | — | | | | 17,921 | | | | — | |
| | Other | | | 19,820 | | | | 35,158 | | | | 18,850 | | | | 38,607 | |
| | Total expenses | | | 630,500 | | | | 2,110,706 | | | | 3,015,344 | | | | 4,029,321 | |
| | Less — expense reductions | | | (178,412 | ) | | | (272,192 | ) | | | (430,898 | ) | | | (741,732 | ) |
| | Net expenses | | | 452,088 | | | | 1,838,514 | | | | 2,584,446 | | | | 3,287,589 | |
| | NET INVESTMENT INCOME (LOSS) | | | (211,970 | ) | | | (743,233 | ) | | | 224,555 | | | | 2,720,993 | |
| | | | | | | | | | | | | | | | | | |
| | Realized and unrealized gain (loss): | |
| | Net realized gain (loss) from: | | | | | | | | | | | | | | | | |
| | Investments | | | 6,349,216 | | | | (91,768 | ) | | | 4,272,581 | | | | (8,138,124 | ) |
| | Futures contracts | | | — | | | | — | | | | — | | | | 70,584 | |
| | Foreign currency transactions | | | (92,821 | ) | | | (90,309 | ) | | | (469,826 | ) | | | (143,791 | ) |
| | Net change in unrealized gain (loss) on: | | | | | | | | | | | | | | | | |
| | Investments (including the effects of the net change in the foreign capital gains tax liability of $198,676, $0, $649,168 and $89,156) | | | (5,968,079 | ) | | | (11,328,633 | ) | | | (4,171,426 | ) | | | 15,308,320 | |
| | Foreign currency translation | | | (106,482 | ) | | | 4,139 | | | | (482,555 | ) | | | (105,039 | ) |
| | Net realized and unrealized gain (loss) | | | 181,834 | | | | (11,506,571 | ) | | | (851,226 | ) | | | 6,991,950 | |
| | NET INCREASE (DECREASE) IN NET ASSETS RESULTING FROM OPERATIONS | | $ | (30,136 | ) | | $ | (12,249,804 | ) | | $ | (626,671 | ) | | $ | 9,712,943 | |
| | (a) | | Class specific Distribution and Service, and Transfer Agent fees were as follows: |
| | | | | | | | | | | | | | | | | | | | | | | | | | | | | | | | | | | | |
| | | Distribution and Service Fees | | | Transfer Agent Fees | |
Fund | | Class A | | | Class B | | | Class C | | | Class A | | | Class B | | | Class C | | | Institutional | | | Service | | | Class IR | |
Asia Equity | | $ | 17,770 | | | $ | 2,615 | | | $ | 10,659 | | | $ | 13,505 | | | $ | 497 | | | $ | 2,025 | | | $ | 8,562 | | | $ | — | | | $ | 5 | (b) |
BRIC | | | 95,549 | | | | — | | | | 244,539 | | | | 72,618 | | | | — | | | | 46,463 | | | | 16,567 | | | | — | | | | 864 | |
Emerging Markets Equity | | | 41,028 | | | | 14,187 | | | | 54,856 | | | | 31,182 | | | | 2,696 | | | | 10,423 | | | | 62,728 | | | | 2,867 | | | | 279 | |
N-11 Equity | | | 129,158 | | | | — | | | | 83,656 | | | | 98,160 | | | | — | | | | 15,895 | | | | 57,900 | | | | — | | | | 29,106 | |
| | (b) | | Commenced operations on February 28, 2014 for the Asia Equity Fund. |
| | |
| The accompanying notes are an integral part of these financial statements. | | 41 |
GOLDMAN SACHS FUNDAMENTAL EMERGING MARKETS EQUITY FUNDS
Statements of Changes in Net Assets
| | | | | | | | | | | | | | | | | | | | |
| | | | | Asia Equity Fund | | | | | BRIC Fund | |
| | | | | For the
Six Months Ended
April 30, 2014
(Unaudited) | | | For the Fiscal Year Ended
October 31, 2013 | | | | | For the
Six Months Ended
April 30, 2014
(Unaudited) | | | For the Fiscal Year Ended
October 31, 2013 | |
| | From operations: | |
| | Net investment income (loss) | | $ | (211,970 | ) | | $ | 282,707 | | | | | $ | (743,233 | ) | | $ | 2,812,081 | |
| | Net realized gain (loss) | | | 6,256,395 | | | | 5,837,132 | | | | | | (182,077 | ) | | | 19,221,533 | |
| | Net change in unrealized gain (loss) | | | (6,074,561 | ) | | | (880,952 | ) | | | | | (11,324,494 | ) | | | (15,940,375 | ) |
| | Net increase (decrease) in net assets resulting from operations | | | (30,136 | ) | | | 5,238,887 | | | | | | (12,249,804 | ) | | | 6,093,239 | |
| | | | | | | | | | | | | | | | | | | | |
| | Distributions to shareholders: | |
| | From net investment income | | | | | | | | | | | | | | | | | | |
| | Class A Shares | | | (57,630 | ) | | | (95,521 | ) | | | | | (878,085 | ) | | | (1,017,354 | ) |
| | Class B Shares | | | — | | | | (2,425 | ) | | | | | — | | | | — | |
| | Class C Shares | | | — | | | | (12,432 | ) | | | | | (92,382 | ) | | | — | |
| | Institutional Shares | | | (337,444 | ) | | | (646,294 | ) | | | | | (1,612,238 | ) | | | (2,044,696 | ) |
| | Service Shares | | | — | | | | — | | | | | | — | | | | — | |
| | Class IR Shares | | | — | (a) | | | — | | | | | | (9,450 | ) | | | (25,542 | ) |
| | Total distributions to shareholders | | | (395,074 | ) | | | (756,672 | ) | | | | | (2,592,155 | ) | | | (3,087,592 | ) |
| | | | | | | | | | | | | | | | | | | | |
| | From share transactions: | |
| | Proceeds from sales of shares | | | 7,544,398 | | | | 3,564,748 | | | | | | 7,887,869 | | | | 50,945,290 | |
| | Proceeds received in connection with merger | | | 25,146,142 | | | | — | | | | | | — | | | | — | |
| | Reinvestment of distributions | | | 393,393 | | | | 747,985 | | | | | | 2,403,225 | | | | 2,829,897 | |
| | Cost of shares redeemed | | | (11,294,315 | ) | | | (11,525,428 | ) | | | | | (81,980,526 | ) | | | (185,568,666 | ) |
| | Net increase (decrease) in net assets resulting from share transactions | | | 21,789,618 | | | | (7,212,695 | ) | | | | | (71,689,432 | ) | | | (131,793,479 | ) |
| | TOTAL INCREASE (DECREASE) | | | 21,364,408 | | | | (2,730,480 | ) | | | | | (86,531,391 | ) | | | (128,787,832 | ) |
| | | | | | | | | | | | | | | | | | | | |
| | Net assets: | |
| | Beginning of period | | | 60,263,752 | | | | 62,994,232 | | | | | | 260,338,230 | | | | 389,126,062 | |
| | End of period | | $ | 81,628,160 | | | $ | 60,263,752 | | | | | $ | 173,806,839 | | | $ | 260,338,230 | |
| | Undistributed (distributions in excess of) net investment loss | | $ | (534,094 | ) | | $ | 72,950 | | | | | $ | (744,337 | ) | | $ | 2,591,051 | |
| | (a) | | Commenced operations on February 28, 2014. |
| | |
| 42 | | The accompanying notes are an integral part of these financial statements. |
GOLDMAN SACHS FUNDAMENTAL EMERGING MARKETS EQUITY FUNDS
| | | | | | | | | | | | | | | | | | | | | | |
| | Emerging Markets Equity Fund | | | | | N-11 Equity Fund | |
| | | For the
Six Months Ended
April 30, 2014
(Unaudited) | | | | | For the Fiscal Year Ended
October 31, 2013 | | | | | For the
Six Months Ended
April 30, 2014
(Unaudited) | | | | | For the Fiscal Year Ended
October 31, 2013 | |
| | | | | | | | | | | | | | | | | | | | | | |
| | $ | 224,555 | | | | | $ | 3,005,772 | | | | | $ | 2,720,993 | | | | | $ | 1,040,072 | |
| | | 3,802,755 | | | | | | 20,338,559 | | | | | | (8,211,331 | ) | | | | | (3,590,389 | ) |
| | | (4,653,981 | ) | | | | | (8,521,391 | ) | | | | | 15,203,281 | | | | | | 8,725,006 | |
| | | (626,671 | ) | | | | | 14,822,940 | | | | | | 9,712,943 | | | | | | 6,174,689 | |
| | | | | | | | | | | | | | | | | | | | | | |
| | | | | | | | | | | | | | | | | | | | | | |
| | | | | | | | | | | | | | | | | | | | | | |
| | | (138,840 | ) | | | | | (190,220 | ) | | | | | (574,638 | ) | | | | | (20,076 | ) |
| | | — | | | | | | — | | | | | | — | | | | | | — | |
| | | — | | | | | | — | | | | | | (15,699 | ) | | | | | — | |
| | | (2,726,144 | ) | | | | | (2,931,010 | ) | | | | | (2,695,030 | ) | | | | | (369,180 | ) |
| | | (34,951 | ) | | | | | (77,760 | ) | | | | | — | | | | | | — | |
| | | (1,886 | ) | | | | | (1,945 | ) | | | | | (258,613 | ) | | | | | (27,660 | ) |
| | | (2,901,821 | ) | | | | | (3,200,935 | ) | | | | | (3,543,980 | ) | | | | | (416,916 | ) |
| | | | | | | | | | | | | | | | | | | | | | |
| | | | | | | | | | | | | | | | | | | | | | |
| | | 39,842,560 | | | | | | 181,644,756 | | | | | | 54,684,050 | | | | | | 430,326,569 | |
| | | — | | | | | | — | | | | | | — | | | | | | — | |
| | | 2,705,592 | | | | | | 2,915,644 | | | | | | 3,290,940 | | | | | | 412,563 | |
| | | (146,984,092 | ) | | | | | (126,231,261 | ) | | | | | (103,128,412 | ) | | | | | (121,352,608 | ) |
| | | (104,435,940 | ) | | | | | 58,329,139 | | | | | | (45,153,422 | ) | | | | | 309,386,524 | |
| | | (107,964,432 | ) | | | | | 69,951,144 | | | | | | (38,984,459 | ) | | | | | 315,144,297 | |
| | | | | | | | | | | | | | | | | | | | | | |
| | | | | | | | | | | | | | | | | | | | | | |
| | | 454,898,885 | | | | | | 384,947,741 | | | | | | 478,607,534 | | | | | | 163,463,237 | |
| | $ | 346,934,453 | | | | | $ | 454,898,885 | | | | | $ | 439,623,075 | | | | | $ | 478,607,534 | |
| | $ | 35,526 | | | | | $ | 2,712,792 | | | | | $ | 612,788 | | | | | $ | 1,435,775 | |
| | |
| The accompanying notes are an integral part of these financial statements. | | 43 |
GOLDMAN SACHS ASIA EQUITY FUND
Financial Highlights
Selected Data for a Share Outstanding Throughout Each Period
| | | | | | | | | | | | | | | | | | | | | | | | | | | | | | | | | | |
| | | | | | | | Income (loss) from
investment operations | | | Distributions
to shareholders | | | | |
| | | Year - Share Class | | Net asset
value,
beginning
of period | | | Net
investment
income (loss)(a) | | | Net realized
and unrealized
gain (loss) | | | Total from
investment
operations | | | From net
investment
income | | | From net
realized
gains | | | Total
distributions | | | Increase from
regulatory
settlements | |
| | FOR THE SIX MONTHS ENDED APRIL 30, (UNAUDITED) | | | | | |
| | 2014 - A | | $ | 19.21 | | | $ | (0.09 | ) | | $ | 0.17 | | | $ | 0.08 | | | $ | (0.08 | ) | | $ | — | | | $ | (0.08 | ) | | $ | — | |
| | 2014 - B | | | 18.23 | | | | (0.15 | ) | | | 0.15 | | | | — | (e) | | | — | | | | — | | | | — | | | | — | |
| | 2014 - C | | | 18.02 | | | | (0.16 | ) | | | 0.16 | | | | — | (e) | | | — | | | | — | | | | — | | | | — | |
| | 2014 - Institutional | | | 20.13 | | | | (0.06 | ) | | | 0.18 | | | | 0.12 | | | | (0.16 | ) | | | — | | | | (0.16 | ) | | | — | |
| | 2014 - IR (Commenced February 28, 2014) | | | 20.71 | | | | (0.04 | ) | | | (0.58 | ) | | | (0.62 | ) | | | — | | | | — | | | | — | | | | — | |
| | | | | | | | | | | | | | | | | | | | | | | | | | | | | | | | | | |
| | FOR THE FISCAL YEARS ENDED OCTOBER 31, | | | | | |
| | 2013 - A | | | 17.78 | | | | 0.04 | | | | 1.51 | | | | 1.55 | | | | (0.12 | ) | | | — | | | | (0.12 | ) | | | — | |
| | 2013 - B | | | 16.94 | | | | (0.10 | ) | | | 1.44 | | | | 1.34 | | | | (0.05 | ) | | | — | | | | (0.05 | ) | | | — | |
| | 2013 - C | | | 16.77 | | | | (0.10 | ) | | | 1.43 | | | | 1.33 | | | | (0.08 | ) | | | — | | | | (0.08 | ) | | | — | |
| | 2013 - Institutional | | | 18.71 | | | | 0.12 | | | | 1.58 | | | | 1.70 | | | | (0.28 | ) | | | — | | | | (0.28 | ) | | | — | |
| | 2012 - A | | | 17.33 | | | | 0.11 | | | | 0.41 | | | | 0.52 | | | | (0.07 | ) | | | — | | | | (0.07 | ) | | | — | |
| | 2012 - B | | | 16.56 | | | | (0.03 | ) | | | 0.41 | | | | 0.38 | | | | — | | | | — | | | | — | | | | — | |
| | 2012 - C | | | 16.39 | | | | (0.03 | ) | | | 0.41 | | | | 0.38 | | | | — | | | | — | | | | — | | | | — | |
| | 2012 - Institutional | | | 18.24 | | | | 0.19 | | | | 0.43 | | | | 0.62 | | | | (0.15 | ) | | | — | | | | (0.15 | ) | | | — | |
| | 2011 - A | | | 19.14 | | | | 0.12 | | | | (1.69 | ) | | | (1.57 | ) | | | (0.24 | ) | | | — | | | | (0.24 | ) | | | — | |
| | 2011 - B | | | 18.28 | | | | (0.03 | ) | | | (1.60 | ) | | | (1.63 | ) | | | (0.09 | ) | | | — | | | | (0.09 | ) | | | — | |
| | 2011 - C | | | 18.12 | | | | (0.03 | ) | | | (1.59 | ) | | | (1.62 | ) | | | (0.11 | ) | | | — | | | | (0.11 | ) | | | — | |
| | 2011 - Institutional | | | 20.12 | | | | 0.23 | | | | (1.80 | ) | | | (1.57 | ) | | | (0.31 | ) | | | — | | | | (0.31 | ) | | | — | |
| | 2010 - A | | | 15.39 | | | | 0.07 | (f) | | | 3.84 | | | | 3.91 | | | | (0.16 | ) | | | — | | | | (0.16 | ) | | | — | |
| | 2010 - B | | | 14.75 | | | | (0.06 | )(f) | | | 3.68 | | | | 3.62 | | | | (0.09 | ) | | | — | | | | (0.09 | ) | | | — | |
| | 2010 - C | | | 14.64 | | | | (0.05 | )(f) | | | 3.64 | | | | 3.59 | | | | (0.11 | ) | | | — | | | | (0.11 | ) | | | — | |
| | 2010 - Institutional | | | 16.16 | | | | 0.14 | (f) | | | 4.03 | | | | 4.17 | | | | (0.21 | ) | | | — | | | | (0.21 | ) | | | — | |
| | 2009 - A | | | 10.11 | | | | 0.12 | | | | 5.32 | | | | 5.44 | | | | (0.22 | ) | | | (0.02 | ) | | | (0.24 | ) | | | 0.08 | |
| | 2009 - B | | | 9.58 | | | | 0.02 | | | | 5.11 | | | | 5.13 | | | | (0.02 | ) | | | (0.02 | ) | | | (0.04 | ) | | | 0.08 | |
| | 2009 - C | | | 9.51 | | | | 0.02 | | | | 5.07 | | | | 5.09 | | | | (0.02 | ) | | | (0.02 | ) | | | (0.04 | ) | | | 0.08 | |
| | 2009 - Institutional | | | 10.70 | | | | 0.17 | | | | 5.59 | | | | 5.76 | | | | (0.36 | ) | | | (0.02 | ) | | | (0.38 | ) | | | 0.08 | |
| | (a) | | Calculated based on the average shares outstanding methodology. |
| | (b) | | Assumes investment at the net asset value at the beginning of the period, reinvestment of all distributions, a complete redemption of the investment at the net asset value at the end of the period and no sales or redemption charges. Total returns would be reduced if a sales or redemption charge was taken into account. Returns do not reflect the deduction of taxes that a shareholder would pay on Fund distributions or the redemption of Fund shares. Total returns for periods less than one full year are not annualized. |
| | (c) | | The Fund's portfolio turnover rate is calculated in accordance with regulatory requirements, without regard to transactions involving short term investments and certain derivatives. If such transactions were included, the Fund's portfolio turnover rate may be higher. |
| | (e) | | Amount is less than $0.005 per share. |
| | (f) | | Reflects income recognized from special dividends which amounted to $0.02 per share and 0.10% of average net assets. |
| | (g) | | Total returns reflects the impact of payments for regulatory settlements entitled to be received during the year and recorded as an increase to capital by the Fund. Excluding such payments, the total return would have been: |
| | | | | | | | | | | | | | | | |
| | | Class A | | | Class B | | | Class C | | | Institutional | |
For the Fiscal Year Ended October 31, 2009 | | | 55.33 | % | | | 54.06 | % | | | 54.16 | % | | | 55.93 | % |
| | |
| 44 | | The accompanying notes are an integral part of these financial statements. |
GOLDMAN SACHS ASIA EQUITY FUND
| | | | | | | | | | | | | | | | | | | | | | | | | | | | | | | | | | | | | | | | |
| | | | | | | | | | | | | | | | | | | | | | | | | | | | | | | | | | |
| | | Net asset value, end of period | | | | | Total
return(b) | | | | | Net assets, end of period (in 000s) | | | | | Ratio of
net expenses
to average
net assets | | | | | Ratio of total expenses to average net assets | | | | | Ratio of
net investment
income (loss)
to average net assets | | | | | Portfolio turnover rate(c) | |
| | | | | | | | | | | | | | | | | | | | | | | | | | | | | | | | | | | | | | | | |
| | $ | 19.21 | | | | | | 0.41 | % | | | | $ | 13,504 | | | | | | 1.77 | %(d) | | | | | 2.29 | %(d) | | | | | (0.93 | )%(d) | | | | | 107 | % |
| | | 18.23 | | | | | | 0.00 | | | | | | 373 | | | | | | 2.52 | (d) | | | | | 2.99 | (d) | | | | | (1.67 | )(d) | | | | | 107 | |
| | | 18.02 | | | | | | 0.06 | | | | | | 2,236 | | | | | | 2.52 | (d) | | | | | 3.05 | (d) | | | | | (1.73 | )(d) | | | | | 107 | |
| | | 20.09 | | | | | | 0.59 | | | | | | 65,492 | | | | | | 1.36 | (d) | | | | | 1.99 | (d) | | | | | (0.57 | )(d) | | | | | 107 | |
| | | 20.09 | | | | | | (2.99 | ) | | | | | 23 | | | | | | 1.46 | (d) | | | | | 2.78 | (d) | | | | | (1.28 | )(d) | | | | | 107 | |
| | | | | | | | | | | | | | | | | | | | | | | | | | | | | | | | | | | | | | | | |
| | | | | | | | | | | | | | | | | | | | | | | | | | | | | | | | | | | | | | | | |
| | | 19.21 | | | | | | 8.72 | | | | | | 14,097 | | | | | | 1.72 | | | | | | 2.25 | | | | | | 0.21 | | | | | | 102 | |
| | | 18.23 | | | | | | 7.92 | | | | | | 628 | | | | | | 2.47 | | | | | | 2.99 | | | | | | (0.56 | ) | | | | | 102 | |
| | | 18.02 | | | | | | 7.87 | | | | | | 2,331 | | | | | | 2.47 | | | | | | 2.99 | | | | | | (0.56 | ) | | | | | 102 | |
| | | 20.13 | | | | | | 9.16 | | | | | | 43,208 | | | | | | 1.32 | | | | | | 1.85 | | | | | | 0.62 | | | | | | 102 | |
| | | 17.78 | | | | | | 3.05 | | | | | | 15,136 | | | | | | 1.60 | | | | | | 2.24 | | | | | | 0.66 | | | | | | 83 | |
| | | 16.94 | | | | | | 2.29 | | | | | | 829 | | | | | | 2.35 | | | | | | 2.98 | | | | | | (0.20 | ) | | | | | 83 | |
| | | 16.77 | | | | | | 2.31 | | | | | | 2,684 | | | | | | 2.35 | | | | | | 2.97 | | | | | | (0.18 | ) | | | | | 83 | |
| | | 18.71 | | | | | | 3.50 | | | | | | 44,345 | | | | | | 1.20 | | | | | | 1.79 | | | | | | 1.03 | | | | | | 83 | |
| | | 17.33 | | | | | | (8.33 | ) | | | | | 39,688 | | | | | | 1.60 | | | | | | 2.17 | | | | | | 0.61 | | | | | | 107 | |
| | | 16.56 | | | | | | (8.95 | ) | | | | | 1,164 | | | | | | 2.35 | | | | | | 2.92 | | | | | | (0.18 | ) | | | | | 107 | |
| | | 16.39 | | | | | | (9.00 | ) | | | | | 3,219 | | | | | | 2.35 | | | | | | 2.92 | | | | | | (0.18 | ) | | | | | 107 | |
| | | 18.24 | | | | | | (7.94 | ) | | | | | 27,071 | | | | | | 1.20 | | | | | | 1.77 | | | | | | 1.15 | | | | | | 107 | |
| | | 19.14 | | | | | | 25.59 | | | | | | 47,238 | | | | | | 1.60 | | | | | | 2.32 | | | | | | 0.40 | (f) | | | | | 85 | |
| | | 18.28 | | | | | | 24.66 | | | | | | 1,622 | | | | | | 2.35 | | | | | | 3.07 | | | | | | (0.38 | )(f) | | | | | 85 | |
| | | 18.12 | | | | | | 24.53 | | | | | | 4,986 | | | | | | 2.35 | | | | | | 3.07 | | | | | | (0.32 | )(f) | | | | | 85 | |
| | | 20.12 | | | | | | 26.05 | | | | | | 24,864 | | | | | | 1.20 | | | | | | 1.92 | | | | | | 0.82 | (f) | | | | | 85 | |
| | | 15.39 | | | | | | 55.89 | (g) | | | | | 43,833 | | | | | | 1.60 | | | | | | 2.36 | | | | | | 0.97 | | | | | | 117 | |
| | | 14.75 | | | | | | 54.55 | (g) | | | | | 1,807 | | | | | | 2.35 | | | | | | 3.11 | | | | | | 0.19 | | | | | | 117 | |
| | | 14.64 | | | | | | 54.64 | (g) | | | | | 4,160 | | | | | | 2.35 | | | | | | 3.11 | | | | | | 0.20 | | | | | | 117 | |
| | | 16.16 | | | | | | 56.48 | (g) | | | | | 20,575 | | | | | | 1.20 | | | | | | 1.96 | | | | | | 1.35 | | | | | | 117 | |
| | |
| The accompanying notes are an integral part of these financial statements. | | 45 |
GOLDMAN SACHS BRIC FUND
Financial Highlights
Selected Data for a Share Outstanding Throughout Each Period
| | | | | | | | | | | | | | | | | | | | | | |
| | | | | | | | Income (loss) from
investment operations | | | | |
| | | Year - Share Class | | Net asset
value,
beginning
of period | | | Net
investment
income (loss)(a) | | | Net realized
and unrealized
gain (loss) | | | Total from
investment
operations | | | Distributions
to shareholders
from net
investment
income | |
| | FOR THE SIX MONTHS ENDED APRIL 30, (UNAUDITED) | |
| | 2014 - A | | $ | 13.10 | | | $ | (0.04 | ) | | $ | (0.66 | ) | | $ | (0.70 | ) | | $ | (0.13 | ) |
| | 2014 - C | | | 12.49 | | | | (0.08 | ) | | | (0.64 | ) | | | (0.72 | ) | | | (0.02 | ) |
| | 2014 - Institutional | | | 13.40 | | | | (0.02 | ) | | | (0.67 | ) | | | (0.69 | ) | | | (0.20 | ) |
| | 2014 - IR | | | 13.47 | | | | (0.02 | ) | | | (0.69 | ) | | | (0.71 | ) | | | (0.15 | ) |
| | | | | | | | | | | | | | | | | | | | | | |
| FOR THE FISCAL YEARS ENDED OCTOBER 31, | | | | | |
| | 2013 - A | | | 12.71 | | | | 0.10 | | | | 0.39 | | | | 0.49 | | | | (0.10 | ) |
| | 2013 - C | | | 12.11 | | | | — | (e) | | | 0.38 | | | | 0.38 | | | | — | |
| | 2013 - Institutional | | | 13.01 | | | | 0.17 | | | | 0.38 | | | | 0.55 | | | | (0.16 | ) |
| | 2013 - IR | | | 13.08 | | | | 0.12 | | | | 0.41 | | | | 0.53 | | | | (0.14 | ) |
| | 2012 - A | | | 13.13 | | | | 0.09 | | | | (0.51 | ) | | | (0.42 | ) | | | — | |
| | 2012 - C | | | 12.60 | | | | — | (e) | | | (0.49 | ) | | | (0.49 | ) | | | — | |
| | 2012 - Institutional | | | 13.38 | | | | 0.15 | | | | (0.52 | ) | | | (0.37 | ) | | | — | |
| | 2012 - IR | | | 13.47 | | | | 0.15 | | | | (0.54 | ) | | | (0.39 | ) | | | — | |
| | 2011 - A | | | 15.78 | | | | 0.03 | | | | (2.68 | ) | | | (2.65 | ) | | | — | |
| | 2011 - C | | | 15.26 | | | | (0.06 | ) | | | (2.60 | ) | | | (2.66 | ) | | | — | |
| | 2011 - Institutional | | | 16.04 | | | | 0.18 | | | | (2.81 | ) | | | (2.63 | ) | | | (0.03 | ) |
| | 2011 - IR | | | 16.19 | | | | 0.03 | | | | (2.72 | ) | | | (2.69 | ) | | | (0.03 | ) |
| | 2010 - A | | | 13.12 | | | | (0.03 | )(f) | | | 2.69 | | | | 2.66 | | | | — | |
| | 2010 - C | | | 12.79 | | | | (0.13 | )(f) | | | 2.60 | | | | 2.47 | | | | — | |
| | 2010 - Institutional | | | 13.29 | | | | 0.05 | (f) | | | 2.70 | | | | 2.75 | | | | — | |
| | 2010 - IR (Commenced August 31, 2010) | | | 14.12 | | | | (0.02 | )(f) | | | 2.09 | | | | 2.07 | | | | — | |
| | 2009 - A | | | 7.39 | | | | 0.02 | | | | 5.71 | | | | 5.73 | | | | — | |
| | 2009 - C | | | 7.26 | | | | (0.05 | ) | | | 5.58 | | | | 5.53 | | | | — | |
| | 2009 - Institutional | | | 7.46 | | | | 0.05 | | | | 5.78 | | | | 5.83 | | | | — | |
| | (a) | | Calculated based on the average shares outstanding methodology. |
| | (b) | | Assumes investment at the net asset value at the beginning of the period, reinvestment of all distributions, a complete redemption of the investment at the net asset value at the end of the period and no sales or redemption charges. Total returns would be reduced if a sales or redemption charge was taken into account. Returns do not reflect the deduction of taxes that a shareholder would pay on Fund distributions or the redemption of Fund shares. Total returns for periods less than one full year are not annualized. |
| | (c) | | The Fund's portfolio turnover rate is calculated in accordance with regulatory requirements, without regard to transactions involving short term investments and certain derivatives. If such transactions were included, the Fund's portfolio turnover rate may be higher. |
| | (e) | | Amount is less than $0.005 per share. |
| | (f) | | Reflects income recognized from special dividends which amounted to $0.02 per share and 0.12% of average net assets. |
| | |
| 46 | | The accompanying notes are an integral part of these financial statements. |
GOLDMAN SACHS BRIC FUND
| | | | | | | | | | | | | | | | | | | | | | | | | | | | | | | | | | | | | | | | |
| | | | | | | | | | | | | | | | | | | | | | | | | | | | | | | | | | |
| | | Net asset
value, end
of period | | | | | Total
return(b) | | | | | Net assets,
end of period (in 000s) | | | | | Ratio of
net expenses
to average
net assets | | | | | Ratio of
total expenses
to average
net assets | | | | | Ratio of
net investment
income (loss)
to average net assets | | | | | Portfolio
turnover
rate(c) | |
| | | | | | | | | | | | | | | | | | | | | | | | | | | | | | | | | | | | | | | | |
| | $ | 12.27 | | | | | | (5.36 | )% | | | | $ | 65,970 | | | | | | 1.74 | %(d) | | | | | 2.00 | %(d) | | | | | (0.68 | )%(d) | | | | | 28 | % |
| | | 11.75 | | | | | | (5.69 | ) | | | | | 43,197 | | | | | | 2.49 | (d) | | | | | 2.75 | (d) | | | | | (1.42 | )(d) | | | | | 28 | |
| | | 12.51 | | | | | | (5.21 | ) | | | | | 63,818 | | | | | | 1.34 | (d) | | | | | 1.60 | (d) | | | | | (0.32 | )(d) | | | | | 28 | |
| | | 12.61 | | | | | | (5.29 | ) | | | | | 822 | | | | | | 1.50 | (d) | | | | | 1.76 | (d) | | | | | (0.38 | )(d) | | | | | 28 | |
| | | | | | | | | | | | | | | | | | | | | | | | | | | | | | | | | | | | | | | | |
| | | | | | | | | | | | | | | | | | | | | | | | | | | | | | | | | | | | | | | | |
| | | 13.10 | | | | | | 3.83 | | | | | | 90,652 | | | | | | 1.76 | | | | | | 1.97 | | | | | | 0.77 | | | | | | 94 | |
| | | 12.49 | | | | | | 3.06 | | | | | | 57,124 | | | | | | 2.50 | | | | | | 2.72 | | | | | | 0.04 | | | | | | 94 | |
| | | 13.40 | | | | | | 4.26 | | | | | | 111,712 | | | | | | 1.36 | | | | | | 1.57 | | | | | | 1.29 | | | | | | 94 | |
| | | 13.47 | | | | | | 4.09 | | | | | | 851 | | | | | | 1.51 | | | | | | 1.72 | | | | | | 0.93 | | | | | | 94 | |
| | | 12.71 | | | | | | (3.19 | ) | | | | | 140,354 | | | | | | 1.82 | | | | | | 1.96 | | | | | | 0.69 | | | | | | 82 | |
| | | 12.11 | | | | | | (3.88 | ) | | | | | 81,879 | | | | | | 2.57 | | | | | | 2.71 | | | | | | (0.02 | ) | | | | | 82 | |
| | | 13.01 | | | | | | (2.76 | ) | | | | | 164,600 | | | | | | 1.42 | | | | | | 1.56 | | | | | | 1.20 | | | | | | 82 | |
| | | 13.08 | | | | | | (2.89 | ) | | | | | 2,292 | | | | | | 1.57 | | | | | | 1.71 | | | | | | 1.19 | | | | | | 82 | |
| | | 13.13 | | | | | | (16.79 | ) | | | | | 227,178 | | | | | | 1.86 | | | | | | 1.92 | | | | | | 0.16 | | | | | | 91 | |
| | | 12.60 | | | | | | (17.43 | ) | | | | | 114,773 | | | | | | 2.61 | | | | | | 2.67 | | | | | | (0.41 | ) | | | | | 91 | |
| | | 13.38 | | | | | | (16.45 | ) | | | | | 219,820 | | | | | | 1.46 | | | | | | 1.52 | | | | | | 1.15 | | | | | | 91 | |
| | | 13.47 | | | | | | (16.66 | ) | | | | | 200 | | | | | | 1.60 | | | | | | 1.66 | | | | | | 0.18 | | | | | | 91 | |
| | | 15.78 | | | | | | 20.27 | | | | | | 474,512 | | | | | | 1.89 | | | | | | 1.92 | | | | | | (0.22 | )(f) | | | | | 87 | |
| | | 15.26 | | | | | | 19.31 | | | | | | 178,404 | | | | | | 2.64 | | | | | | 2.67 | | | | | | (0.96 | )(f) | | | | | 87 | |
| | | 16.04 | | | | | | 20.69 | | | | | | 158,912 | | | | | | 1.49 | | | | | | 1.52 | | | | | | 0.36 | (f) | | | | | 87 | |
| | | 16.19 | | | | | | 14.66 | | | | | | 23 | | | | | | 1.64 | (d) | | | | | 1.64 | (d) | | | | | (0.83 | )(d)(f) | | | | | 87 | |
| | | 13.12 | | | | | | 77.54 | | | | | | 367,897 | | | | | | 1.97 | | | | | | 2.00 | | | | | | 0.19 | | | | | | 117 | |
| | | 12.79 | | | | | | 76.17 | | | | | | 141,614 | | | | | | 2.72 | | | | | | 2.75 | | | | | | (0.54 | ) | | | | | 117 | |
| | | 13.29 | | | | | | 78.15 | | | | | | 30,269 | | | | | | 1.57 | | | | | | 1.60 | | | | | | 0.46 | | | | | | 117 | |
| | |
| The accompanying notes are an integral part of these financial statements. | | 47 |
GOLDMAN SACHS EMERGING MARKETS EQUITY FUND
Financial Highlights
Selected Data for a Share Outstanding Throughout Each Period
| | | | | | | | | | | | | | | | | | | | | | | | | | | | | | |
| | | | | | | | Income (loss) from investment operations | | | Distributions to shareholders | |
| | | Year - Share Class | | Net asset
value,
beginning
of period | | | Net
investment
income (loss)(a) | | | Net realized
and unrealized
gain (loss) | | | Total from
investment
operations | | | From net
investment
income | | | From net
realized
gains | | | Total
distributions | |
| | FOR THE SIX MONTHS ENDED APRIL 30, (UNAUDITED) | |
| | 2014 - A | | $ | 15.20 | | | $ | (0.01 | ) | | $ | 0.04 | | | $ | 0.03 | | | $ | (0.06 | ) | | $ | — | | | $ | (0.06 | ) |
| | 2014 - B | | | 13.77 | | | | (0.07 | ) | | | 0.04 | | | | (0.03 | ) | | | — | | | | — | | | | — | |
| | 2014 - C | | | 13.87 | | | | (0.06 | ) | | | 0.03 | | | | (0.03 | ) | | | — | | | | — | | | | — | |
| | 2014 - Institutional | | | 16.22 | | | | 0.02 | | | | 0.03 | | | | 0.05 | | | | (0.12 | ) | | | — | | | | (0.12 | ) |
| | 2014 - Service | | | 14.74 | | | | (0.02 | ) | | | 0.04 | | | | 0.02 | | | | (0.04 | ) | | | — | | | | (0.04 | ) |
| | 2014 - IR | | | 16.14 | | | | 0.01 | | | | 0.04 | | | | 0.05 | | | | (0.10 | ) | | | — | | | | (0.10 | ) |
| | | | | | | | | | | | | | | | | | | | | | | | | | | | | | |
| | FOR THE FISCAL YEARS ENDED OCTOBER 31, | |
| | 2013 - A | | | 14.68 | | | | 0.05 | | | | 0.54 | | | | 0.59 | | | | (0.07 | ) | | | — | | | | (0.07 | ) |
| | 2013 - B | | | 13.33 | | | | (0.06 | ) | | | 0.50 | | | | 0.44 | | | | — | | | | — | | | | — | |
| | 2013 - C | | | 13.42 | | | | (0.06 | ) | | | 0.51 | | | | 0.45 | | | | — | | | | — | | | | — | |
| | 2013 - Institutional | | | 15.65 | | | | 0.13 | | | | 0.58 | | | | 0.71 | | | | (0.14 | ) | | | — | | | | (0.14 | ) |
| | 2013 - Service | | | 14.24 | | | | 0.04 | | | | 0.53 | | | | 0.57 | | | | (0.07 | ) | | | — | | | | (0.07 | ) |
| | 2013 - IR | | | 15.58 | | | | 0.10 | | | | 0.58 | | | | 0.68 | | | | (0.12 | ) | | | — | | | | (0.12 | ) |
| | 2012 - A | | | 14.66 | | | | 0.06 | | | | (0.04 | ) | | | 0.02 | | | | — | | | | — | | | | — | |
| | 2012 - B | | | 13.41 | | | | (0.05 | ) | | | (0.03 | ) | | | (0.08 | ) | | | — | | | | — | | | | — | |
| | 2012 - C | | | 13.51 | | | | (0.05 | ) | | | (0.04 | ) | | | (0.09 | ) | | | — | | | | — | | | | — | |
| | 2012 - Institutional | | | 15.63 | | | | 0.12 | | | | (0.05 | ) | | | 0.07 | | | | (0.05 | ) | | | — | | | | (0.05 | ) |
| | 2012 - Service | | | 14.24 | | | | 0.05 | | | | (0.05 | ) | | | — | (e) | | | — | | | | — | | | | — | |
| | 2012 - IR | | | 15.59 | | | | 0.12 | | | | (0.07 | ) | | | 0.05 | | | | (0.06 | ) | | | — | | | | (0.06 | ) |
| | 2011 - A | | | 16.38 | | | | 0.04 | | | | (1.73 | ) | | | (1.69 | ) | | | (0.03 | ) | | | — | | | | (0.03 | ) |
| | 2011 - B | | | 15.09 | | | | (0.08 | ) | | | (1.58 | ) | | | (1.66 | ) | | | (0.02 | ) | | | — | | | | (0.02 | ) |
| | 2011 - C | | | 15.20 | | | | (0.07 | ) | | | (1.60 | ) | | | (1.67 | ) | | | (0.02 | ) | | | — | | | | (0.02 | ) |
| | 2011 - Institutional | | | 17.48 | | | | 0.11 | | | | (1.84 | ) | | | (1.73 | ) | | | (0.12 | ) | | | — | | | | (0.12 | ) |
| | 2011 - Service | | | 15.95 | | | | 0.02 | | | | (1.68 | ) | | | (1.66 | ) | | | (0.05 | ) | | | — | | | | (0.05 | ) |
| | 2011 - IR | | | 17.56 | | | | 0.02 | | | | (1.87 | ) | | | (1.85 | ) | | | (0.12 | ) | | | — | | | | (0.12 | ) |
| | 2010 - A | | | 13.37 | | | | (0.02 | )(f) | | | 3.03 | | | | 3.01 | | | | — | | | | — | | | | — | |
| | 2010 - B | | | 12.41 | | | | (0.10 | )(f) | | | 2.78 | | | | 2.68 | | | | — | | | | — | | | | — | |
| | 2010 - C | | | 12.50 | | | | (0.10 | )(f) | | | 2.80 | | | | 2.70 | | | | — | | | | — | | | | — | |
| | 2010 - Institutional | | | 14.22 | | | | 0.07 | (f) | | | 3.20 | | | | 3.27 | | | | (0.01 | ) | | | — | | | | (0.01 | ) |
| | 2010 - Service | | | 13.03 | | | | (0.01 | )(f) | | | 2.93 | | | | 2.92 | | | | — | | | | — | | | | — | |
| | 2010 - IR (Commenced August 31, 2010) | | | 15.24 | | | | (0.01 | )(f) | | | 2.33 | | | | 2.32 | | | | — | | | | — | | | | — | |
| | 2009 - A | | | 11.97 | | | | 0.15 | | | | 4.64 | | | | 4.79 | | | | (0.26 | ) | | | (3.13 | ) | | | (3.39 | ) |
| | 2009 - B | | | 11.30 | | | | 0.07 | | | | 4.31 | | | | 4.38 | | | | (0.14 | ) | | | (3.13 | ) | | | (3.27 | ) |
| | 2009 - C | | | 11.31 | | | | 0.07 | | | | 4.34 | | | | 4.41 | | | | (0.09 | ) | | | (3.13 | ) | | | (3.22 | ) |
| | 2009 - Institutional | | | 12.60 | | | | 0.21 | | | | 4.93 | | | | 5.14 | | | | (0.39 | ) | | | (3.13 | ) | | | (3.52 | ) |
| | 2009 - Service | | | 11.80 | | | | 0.15 | | | | 4.51 | | | | 4.66 | | | | (0.30 | ) | | | (3.13 | ) | | | (3.43 | ) |
| | (a) | | Calculated based on the average shares outstanding methodology. |
| | (b) | | Assumes investment at the net asset value at the beginning of the period, reinvestment of all distributions, a complete redemption of the investment at the net asset value at the end of the period and no sales or redemption charges. Total returns would be reduced if a sales or redemption charge was taken into account. Returns do not reflect the deduction of taxes that a shareholder would pay on Fund distributions or the redemption of Fund shares. Total returns for periods less than one full year are not annualized. |
| | (c) | | The Fund's portfolio turnover rate is calculated in accordance with regulatory requirements, without regard to transactions involving short term investments and certain derivatives. If such transactions were included, the Fund's portfolio turnover rate may be higher. |
| | (e) | | Amount is less than $0.005 per share. |
| | (f) | | Reflects income recognized from special dividends which amounted to $0.02 per share and 0.12% of average net assets. |
| | |
| 48 | | The accompanying notes are an integral part of these financial statements. |
GOLDMAN SACHS EMERGING MARKETS EQUITY FUND
| | | | | | | | | | | | | | | | | | | | | | | | | | | | | | | | | | | | | | | | |
| | | | | | | | | | | | | |
| | | | | | | | | | | | | | | | | | | | | | | | | | | | | | | | | | |
| | | Net asset
value, end
of period | | | | | Total return(b) | | | | | Net assets,
end of
period
(in 000s) | | | | | Ratio of net expenses to average net assets | | | | | Ratio of
total expenses
to average
net assets | | | | | Ratio of net investment income (loss) to average net assets | | | | | Portfolio
turnover
rate(c) | |
| | | | | | | | | | | | | | | | | | | | | | | | | | | | | | | | | | | | | | | | |
| | $ | 15.17 | | | | | | 0.19 | % | | | | $ | 30,049 | | | | | | 1.68 | %(d) | | | | | 1.91 | %(d) | | | | | (0.18 | )%(d) | | | | | 57 | % |
| | | 13.74 | | | | | | (0.15 | ) | | | | | 2,362 | | | | | | 2.43 | (d) | | | | | 2.66 | (d) | | | | | (0.98 | )(d) | | | | | 57 | |
| | | 13.84 | | | | | | (0.22 | ) | | | | | 10,764 | | | | | | 2.43 | (d) | | | | | 2.67 | (d) | | | | | (0.92 | )(d) | | | | | 57 | |
| | | 16.15 | | | | | | 0.45 | | | | | | 288,884 | | | | | | 1.28 | (d) | | | | | 1.51 | (d) | | | | | 0.22 | (d) | | | | | 57 | |
| | | 14.72 | | | | | | 0.11 | | | | | | 14,563 | | | | | | 1.79 | (d) | | | | | 2.02 | (d) | | | | | (0.28 | )(d) | | | | | 57 | |
| | | 16.09 | | | | | | 0.32 | | | | | | 313 | | | | | | 1.44 | (d) | | | | | 1.67 | (d) | | | | | 0.07 | (d) | | | | | 57 | |
| | | | | | | | | | | | | | | | | | | | | | | | | | | | | | | | | | | | | | | | |
| | | | | | | | | | | | | | | | | | | | | | | | | | | | | | | | | | | | | | | | |
| | | 15.20 | | | | | | 4.04 | | | | | | 36,578 | | | | | | 1.73 | | | | | | 1.89 | | | | | | 0.32 | | | | | | 159 | |
| | | 13.77 | | | | | | 3.23 | | | | | | 3,492 | | | | | | 2.48 | | | | | | 2.64 | | | | | | (0.46 | ) | | | | | 159 | |
| | | 13.87 | | | | | | 3.35 | | | | | | 11,869 | | | | | | 2.48 | | | | | | 2.64 | | | | | | (0.44 | ) | | | | | 159 | |
| | | 16.22 | | | | | | 4.49 | | | | | | 388,046 | | | | | | 1.33 | | | | | | 1.49 | | | | | | 0.80 | | | | | | 159 | |
| | | 14.74 | | | | | | 4.02 | | | | | | 14,584 | | | | | | 1.83 | | | | | | 1.99 | | | | | | 0.25 | | | | | | 159 | |
| | | 16.14 | | | | | | 4.37 | | | | | | 329 | | | | | | 1.84 | | | | | | 1.64 | | | | | | 0.62 | | | | | | 159 | |
| | | 14.68 | | | | | | 0.14 | | | | | | 38,889 | | | | | | 1.82 | �� | | | | | 1.94 | | | | | | 0.39 | | | | | | 119 | |
| | | 13.33 | | | | | | (0.59 | ) | | | | | 4,788 | | | | | | 2.57 | | | | | | 2.69 | | | | | | (0.37 | ) | | | | | 119 | |
| | | 13.42 | | | | | | (0.66 | ) | | | | | 15,418 | | | | | | 2.57 | | | | | | 2.69 | | | | | | (0.35 | ) | | | | | 119 | |
| | | 15.65 | | | | | | 0.49 | | | | | | 310,167 | | | | | | 1.41 | | | | | | 1.54 | | | | | | 0.80 | | | | | | 119 | |
| | | 14.24 | | | | | | 0.00 | | | | | | 15,446 | | | | | | 1.91 | | | | | | 2.03 | | | | | | 0.36 | | | | | | 119 | |
| | | 15.58 | | | | | | 0.35 | | | | | | 240 | | | | | | 1.55 | | | | | | 1.68 | | | | | | 0.78 | | | | | | 119 | |
| | | 14.66 | | | | | | (10.33 | ) | | | | | 51,221 | | | | | | 1.90 | | | | | | 1.93 | | | | | | 0.24 | | | | | | 121 | |
| | | 13.41 | | | | | | (11.02 | ) | | | | | 6,841 | | | | | | 2.65 | | | | | | 2.68 | | | | | | (0.53 | ) | | | | | 121 | |
| | | 13.51 | | | | | | (11.01 | ) | | | | | 18,896 | | | | | | 2.65 | | | | | | 2.68 | | | | | | (0.49 | ) | | | | | 121 | |
| | | 15.63 | | | | | | (9.98 | ) | | | | | 351,982 | | | | | | 1.50 | | | | | | 1.53 | | | | | | 0.61 | | | | | | 121 | |
| | | 14.24 | | | | | | (10.43 | ) | | | | | 14,432 | | | | | | 2.00 | | | | | | 2.03 | | | | | | 0.15 | | | | | | 121 | |
| | | 15.59 | | | | | | (10.21 | ) | | | | | 21 | | | | | | 1.65 | | | | | | 1.68 | | | | | | 0.16 | | | | | | 121 | |
| | | 16.38 | | | | | | 22.51 | | | | | | 68,118 | | | | | | 1.91 | | | | | | 1.91 | | | | | | (0.16 | )(f) | | | | | 147 | |
| | | 15.09 | | | | | | 21.60 | | | | | | 10,335 | | | | | | 2.66 | | | | | | 2.66 | | | | | | (0.75 | )(f) | | | | | 147 | |
| | | 15.20 | | | | | | 21.60 | | | | | | 23,226 | | | | | | 2.66 | | | | | | 2.66 | | | | | | (0.73 | )(f) | | | | | 147 | |
| | | 17.48 | | | | | | 23.04 | | | | | | 472,994 | | | | | | 1.51 | | | | | | 1.51 | | | | | | 0.43 | (f) | | | | | 147 | |
| | | 15.95 | | | | | | 22.41 | | | | | | 13,954 | | | | | | 2.01 | | | | | | 2.01 | | | | | | (0.10 | )(f) | | | | | 147 | |
| | | 17.56 | | | | | | 15.22 | | | | | | 1 | | | | | | 1.66 | (d) | | | | | 1.66 | (d) | | | | | (0.09 | )(d)(f) | | | | | 147 | |
| | | 13.37 | | | | | | 58.12 | | | | | | 256,648 | | | | | | 1.89 | | | | | | 1.89 | | | | | | 1.43 | | | | | | 179 | |
| | | 12.41 | | | | | | 56.96 | | | | | | 10,350 | | | | | | 2.64 | | | | | | 2.64 | | | | | | 0.73 | | | | | | 179 | |
| | | 12.50 | | | | | | 57.03 | | | | | | 17,637 | | | | | | 2.64 | | | | | | 2.64 | | | | | | 0.70 | | | | | | 179 | |
| | | 14.22 | | | | | | 58.76 | | | | | | 347,017 | | | | | | 1.49 | | | | | | 1.49 | | | | | | 1.88 | | | | | | 179 | |
| | | 13.03 | | | | | | 57.99 | | | | | | 10,273 | | | | | | 1.99 | | | | | | 1.99 | | | | | | 1.38 | | | | | | 179 | |
| | |
| The accompanying notes are an integral part of these financial statements. | | 49 |
GOLDMAN SACHS N-11 EQUITY FUND
Financial Highlights
Selected Data for a Share Outstanding Throughout Each Period
| | | | | | | | | | | | | | | | | | | | | | |
| | | | | | | | Income (loss) from
investment operations | | | | |
| | | Year - Share Class | | Net asset
value,
beginning
of period | | | Net
investment
income (loss)(a) | | | Net realized
and unrealized
gain (loss) | | | Total from
investment
operations | | | Distributions
to shareholders
from net
investment
income | |
| | FOR THE SIX MONTHS ENDED APRIL 30, (UNAUDITED) | |
| | 2014 - A | | $ | 11.03 | | | $ | 0.05 | | | $ | 0.22 | | | $ | 0.27 | | | $ | (0.06 | ) |
| | 2014 - C | | | 10.81 | | | | 0.01 | | | | 0.21 | | | | 0.22 | | | | (0.01 | ) |
| | 2014 - Institutional | | | 11.12 | | | | 0.07 | | | | 0.22 | | | | 0.29 | | | | (0.10 | ) |
| | 2014 - IR | | | 11.08 | | | | 0.06 | | | | 0.22 | | | | 0.28 | | | | (0.08 | ) |
| | | | | | | | | | | | | | | | | | | | | | |
| | FOR THE FISCAL YEARS ENDED OCTOBER 31, | |
| | 2013 - A | | | 10.38 | | | | 0.01 | | | | 0.65 | | | | 0.66 | | | | (0.01 | ) |
| | 2013 - C | | | 10.25 | | | | (0.07 | ) | | | 0.63 | | | | 0.56 | | | | — | |
| | 2013 - Institutional | | | 10.45 | | | | 0.05 | | | | 0.65 | | | | 0.70 | | | | (0.03 | ) |
| | 2013 - IR | | | 10.42 | | | | 0.03 | | | | 0.65 | | | | 0.68 | | | | (0.02 | ) |
| | 2012 - A | | | 9.57 | | | | 0.01 | | | | 0.80 | | | | 0.81 | | | | — | |
| | 2012 - C | | | 9.52 | | | | (0.06 | ) | | | 0.79 | | | | 0.73 | | | | — | |
| | 2012 - Institutional | | | 9.60 | | | | 0.05 | | | | 0.80 | | | | 0.85 | | | | — | |
| | 2012 - IR | | | 9.59 | | | | 0.02 | | | | 0.81 | | | | 0.83 | | | | — | |
| | | | | | | | | | | | | | | | | | | | | | |
| | FOR THE PERIOD ENDED OCTOBER 31, | |
| | 2011 - A (Commenced February 28, 2011) | | | 10.00 | | | | (0.03 | ) | | | (0.40 | ) | | | (0.43 | ) | | | — | |
| | 2011 - C (Commenced February 28, 2011) | | | 10.00 | | | | (0.08 | ) | | | (0.40 | ) | | | (0.48 | ) | | | — | |
| | 2011 - Institutional (Commenced February 28, 2011) | | | 10.00 | | | | 0.02 | | | | (0.42 | ) | | | (0.40 | ) | | | — | |
| | 2011 - IR (Commenced February 28, 2011) | | | 10.00 | | | | (0.02 | ) | | | (0.39 | ) | | | (0.41 | ) | | | — | |
| | (a) | | Calculated based on the average shares outstanding methodology. |
| | (b) | | Assumes investment at the net asset value at the beginning of the period, reinvestment of all distributions, a complete redemption of the investment at the net asset value at the end of the period and no sales or redemption charges. Total returns would be reduced if a sales or redemption charge was taken into account. Returns do not reflect the deduction of taxes that a shareholder would pay on Fund distributions or the redemption of Fund shares. Total returns for periods less than one full year are not annualized. |
| | (c) | | The Fund's portfolio turnover rate is calculated in accordance with regulatory requirements, without regard to transactions involving short term investments and certain derivatives. If such transactions were included, the Fund's portfolio turnover rate may be higher. |
| | |
| 50 | | The accompanying notes are an integral part of these financial statements. |
GOLDMAN SACHS N-11 EQUITY FUND
| | | | | | | | | | | | | | | | | | | | | | | | | | | | | | | | | | | | | | | | |
| | | | | | | | | | |
| | | | | | | | | | | | | | | | | | | | | | | | | | |
| | | Net asset
value, end
of period | | | | | Total
return(b) | | | | | Net assets,
end of
period (in 000s) | | | | | Ratio of
net expenses
to average
net assets | | | | | Ratio of
total expenses
to average
net assets | | | | | Ratio of
net investment
income (loss)
to average net assets | | | | | Portfolio
turnover
rate(c) | |
| | | | | | | | | | | | | | | | | | | | | | | | | | | | | | | | | | | | | | | | |
| | $ | 11.24 | | | | | | 2.45 | % | | | | $ | 103,547 | | | | | | 1.75 | %(d) | | | | | 2.08 | %(d) | | | | | 0.98 | %(d) | | | | | 20 | % |
| | | 11.02 | | | | | | 2.03 | | | | | | 16,574 | | | | | | 2.50 | (d) | | | | | 2.83 | (d) | | | | | 0.23 | (d) | | | | | 20 | |
| | | 11.31 | | | | | | 2.61 | | | | | | 292,242 | | | | | | 1.35 | (d) | | | | | 1.68 | (d) | | | | | 1.39 | (d) | | | | | 20 | |
| | | 11.28 | | | | | | 2.58 | | | | | | 27,261 | | | | | | 1.50 | (d) | | | | | 1.82 | (d) | | | | | 1.15 | (d) | | | | | 20 | |
| | | | | | | | | | | | | | | | | | | | | | | | | | | | | | | | | | | | | | | | |
| | | | | | | | | | | | | | | | | | | | | | | | | | | | | | | | | | | | | | | | |
| | | 11.03 | | | | | | 6.31 | | | | | | 114,658 | | | | | | 1.74 | | | | | | 2.12 | | | | | | 0.07 | | | | | | 53 | |
| | | 10.81 | | | | | | 5.46 | | | | | | 19,018 | | | | | | 2.49 | | | | | | 2.87 | | | | | | (0.66 | ) | | | | | 53 | |
| | | 11.12 | | | | | | 6.73 | | | | | | 308,502 | | | | | | 1.35 | | | | | | 1.72 | | | | | | 0.44 | | | | | | 53 | |
| | | 11.08 | | | | | | 6.48 | | | | | | 36,429 | | | | | | 1.49 | | | | | | 1.87 | | | | | | 0.26 | | | | | | 53 | |
| | | 10.38 | | | | | | 8.33 | | | | | | 35,417 | | | | | | 1.79 | | | | | | 2.35 | | | | | | 0.09 | | | | | | 90 | |
| | | 10.25 | | | | | | 7.53 | | | | | | 6,720 | | | | | | 2.54 | | | | | | 3.12 | | | | | | (0.57 | ) | | | | | 90 | |
| | | 10.45 | | | | | | 8.83 | | | | | | 111,826 | | | | | | 1.39 | | | | | | 1.94 | | | | | | 0.52 | | | | | | 90 | |
| | | 10.42 | | | | | | 8.73 | | | | | | 9,500 | | | | | | 1.54 | | | | | | 2.05 | | | | | | 0.22 | | | | | | 90 | |
| | | | | | | | | | | | | | | | | | | | | | | | | | | | | | | | | | | | | | | | |
| | | | | | | | | | | | | | | | | | | | | | | | | | | | | | | | | | | | | | | | |
| | | 9.57 | | | | | | (4.20 | ) | | | | | 18,335 | | | | | | 1.82 | (d) | | | | | 3.92 | (d) | | | | | (0.40 | )(d) | | | | | 73 | |
| | | 9.52 | | | | | | (4.70 | ) | | | | | 3,528 | | | | | | 2.57 | (d) | | | | | 4.67 | (d) | | | | | (1.29 | )(d) | | | | | 73 | |
| | | 9.60 | | | | | | (4.00 | ) | | | | | 42,740 | | | | | | 1.42 | (d) | | | | | 3.52 | (d) | | | | | 0.24 | (d) | | | | | 73 | |
| | | 9.59 | | | | | | (4.10 | ) | | | | | 1,448 | | | | | | 1.57 | (d) | | | | | 3.67 | (d) | | | | | (0.28 | )(d) | | | | | 73 | |
| | |
| The accompanying notes are an integral part of these financial statements. | | 51 |
GOLDMAN SACHS FUNDAMENTAL EMERGING MARKETS EQUITY FUNDS
Notes to Financial Statements
April 30, 2014 (Unaudited)
Goldman Sachs Trust (the “Trust”) is a Delaware statutory trust registered under the Investment Company Act of 1940, as amended (the “Act”), as an open-end management investment company. The following table lists those series of the Trust that are included in this report (collectively, the “Funds” or individually a “Fund”), along with their corresponding share classes and respective diversification status under the Act:
| | | | |
| Fund | | Share Classes Offered* | | Diversified/ Non-diversified |
Asia Equity | | A, B, C and Institutional and IR | | Diversified |
BRIC and N-11 Equity | | A, C, Institutional and IR | | Non-diversified |
Emerging Markets Equity | | A, B, C, Institutional, Service and IR | | Diversified |
| * | | Class B Shares are generally no longer available for purchase by current or prospective investors. |
Class A Shares are sold with a front-end sales charge of up to 5.50%. Class B Shares were sold with a contingent deferred sales charge (“CDSC”) that declines from 5.00% to zero, depending upon the period of time the shares are held. Class C Shares are sold with a CDSC of 1.00%, which is imposed on redemptions made within 12 months of purchase. Institutional, Service and Class IR Shares are not subject to a sales charge.
Goldman Sachs Asset Management International (“GSAMI”), an affiliate of Goldman, Sachs & Co. (“Goldman Sachs”), serves as investment adviser to the Funds pursuant to a management agreement (the “Agreement”) with the Trust.
Pursuant to an Agreement and Plan of Reorganization (the “Reorganization Agreement”) approved by the Trust’s Board of Trustees, all of the assets and liabilities of the Goldman Sachs China Equity Fund (the “Acquired Fund”) were transferred to the Goldman Sachs Asia Equity Fund (the “Survivor Fund”) as of the close of business on April 25, 2014 (the “Reorganization”). As part of the Reorganization, holders of Class A, Class C, Institutional, and Class IR shares of the Acquired Fund respectively received Class A, Class C, Institutional, and Class IR shares of the Survivor Fund, in an amount equal to the aggregate net asset value of his or her investment in the Acquired Fund. The exchange was a tax-free event to shareholders and the Survivor Fund was the accounting survivor in the reorganization.
|
| 2. SIGNIFICANT ACCOUNTING POLICIES |
The financial statements have been prepared in accordance with accounting principles generally accepted in the United States of America (“GAAP”) and require management to make estimates and assumptions that may affect the reported amounts and disclosures. Actual results may differ from those estimates and assumptions.
A. Investment Valuation — The Funds’ valuation policy is to value investments at fair value.
B. Investment Income and Investments — Investment income includes interest income and dividend income, net of any foreign withholding taxes, less any amounts reclaimable. Interest income is accrued daily and adjusted for amortization of premiums and accretion of discounts. Dividend income is recognized on ex-dividend date or, for certain foreign securities, as soon as such information is obtained subsequent to the ex-dividend date. Investment transactions are reflected on trade date. Realized gains and losses are calculated using identified cost. Investment transactions are recorded on the following business day for daily net asset value (“NAV”) calculations. Any foreign capital gains tax is accrued daily based upon net unrealized gains, and is
52
GOLDMAN SACHS FUNDAMENTAL EMERGING MARKETS EQUITY FUNDS
|
| 2. SIGNIFICANT ACCOUNTING POLICIES (continued) |
payable upon sale of such investments. Distributions received from the Funds’ investments in U.S. real estate investment trusts (“REITs”) may be characterized as ordinary income, net capital gain or a return of capital. A return of capital is recorded by the Funds as a reduction to the cost basis of the REIT.
For derivative contracts, realized gains and losses are recorded upon settlement of the contract.
C. Class Allocations and Expenses — Investment income, realized and unrealized gain (loss), and non-class specific expenses of each Fund are allocated daily based upon the proportion of net assets of each class. Class specific expenses, where applicable, are borne by the respective share classes and include Distribution and Service, Transfer Agent and Service and Shareholder Administration fees. Non-class specific expenses directly incurred by a Fund are charged to that Fund, while such expenses incurred by the Trust are allocated across the respective Funds on a straight-line and/or pro-rata basis depending upon the nature of the expenses.
D. Federal Taxes and Distributions to Shareholders — It is each Fund’s policy to comply with the requirements of the Internal Revenue Code of 1986, as amended (the “Code”), applicable to regulated investment companies (mutual funds) and to distribute each year substantially all of its investment company taxable income and capital gains to its shareholders. Accordingly, the Funds are not required to make any provisions for the payment of federal income tax. Distributions to shareholders are recorded on the ex-dividend date. Income and capital gains distributions, if any, are declared and paid annually.
Net capital losses are carried forward to future fiscal years and may be used to the extent allowed by the Code to offset any future capital gains. Utilization of capital loss carryforwards will reduce the requirement of future capital gains distributions.
Under the Regulated Investment Company Modernization Act of 2010, the Funds are permitted to carry forward capital losses incurred in taxable years beginning after December 22, 2010 for an unlimited period. However, any losses incurred during those future taxable years will be required to be utilized prior to the losses incurred in pre-enactment taxable years. As a result of this ordering rule, pre-enactment capital loss carryforwards may be more likely to expire unused. Additionally, post-enactment capital losses that are carried forward will retain their character as either short-term or long-term capital losses rather than being considered all short-term as under previous law.
The characterization of distributions to shareholders for financial reporting purposes is determined in accordance with federal income tax rules, which may differ from GAAP. The source of each Fund’s distributions may be shown in the accompanying financial statements as either from net investment income, net realized gain or capital. Certain components of the Funds’ net assets on the Statements of Assets and Liabilities reflect permanent GAAP/tax differences based on the appropriate tax character.
E. Foreign Currency Translation — The accounting records and reporting currency of the Funds are maintained in United States (“U.S.”) dollars. Assets and liabilities denominated in foreign currencies are translated into U.S. dollars using the current exchange rates at the close of each business day. The effect of changes in foreign currency exchange rates on investments is included within net realized and unrealized gain (loss) on investments. Changes in the value of other assets and liabilities as a result of fluctuations in foreign exchange rates are included in the Statements of Operations within net change in unrealized gain (loss) on foreign currency transactions. Transactions denominated in foreign currencies are translated into U.S. dollars on the date the transaction occurred, the effects of which are included within net realized gain (loss) on foreign currency transactions.
53
GOLDMAN SACHS FUNDAMENTAL EMERGING MARKETS EQUITY FUNDS
Notes to Financial Statements (continued)
April 30, 2014 (Unaudited)
|
| 3. INVESTMENTS AND FAIR VALUE MEASUREMENTS |
The fair value of a financial instrument is the amount that would be received to sell an asset or paid to transfer a liability in an orderly transaction between market participants at the measurement date (i.e., the exit price). GAAP establishes a fair value hierarchy that prioritizes the inputs to valuation techniques used to measure fair value. The hierarchy gives the highest priority to unadjusted quoted prices in active markets for identical assets or liabilities (Level 1 measurements) and the lowest priority to unobservable inputs (Level 3 measurements). The levels used for classifying investments are not necessarily an indication of the risk associated with investing in these investments. The three levels of the fair value hierarchy are described below:
Level 1 — Unadjusted quoted prices in active markets that are accessible at the measurement date for identical, unrestricted assets or liabilities;
Level 2 — Quoted prices in markets that are not active or financial instruments for which significant inputs are observable (including, but not limited to, quoted prices for similar investments, interest rates, foreign exchange rates, volatility and credit spreads), either directly or indirectly;
Level 3 — Prices or valuations that require significant unobservable inputs (including GSAMI’s assumptions in determining fair value measurement).
The Trustees have adopted Valuation Procedures that govern the valuation of the portfolio investments held by the Funds, including investments for which market quotations are not readily available. The Trustees have delegated to GSAMI day-to-day responsibility for implementing and maintaining internal controls and procedures related to the valuation of the Funds’ portfolio investments. To assess the continuing appropriateness of pricing sources and methodologies, GSAMI regularly performs price verification procedures and issues challenges as necessary to third party pricing vendors or brokers, and any differences are reviewed in accordance with the Valuation Procedures.
A. Level 1 and Level 2 Fair Value Investments — The valuation techniques and significant inputs used in determining the fair values for investments classified as Level 1 and Level 2 are as follows:
Equity Securities — Equity securities and investment companies traded on a U.S securities exchange or the NASDAQ system, or those located on certain foreign exchanges, including but not limited to the Americas, are valued daily at their last sale price or official closing price on the principal exchange or system on which they are traded. If no sale occurs, equity securities and exchange traded investment companies are valued at the last bid price for long positions and at the last ask price for short positions. Investments in investment companies (other than those that are exchange traded) are valued at the NAV on the valuation date. To the extent these investments are actively traded, they are classified as Level 1 of the fair value hierarchy, otherwise they are generally classified as Level 2.
Unlisted equity securities for which market quotations are available are valued at the last sale price on the valuation date, or if no sale occurs, at the last bid price. Securities traded on certain foreign securities exchanges are valued daily at fair value determined by an independent fair value service (if available) under Valuation Procedures approved by the Trustees and consistent with applicable regulatory guidance. The independent fair value service takes into account multiple factors including, but not limited to, movements in the securities markets, certain depositary receipts, futures contracts and foreign currency exchange rates that have occurred subsequent to the close of the foreign securities exchange. These investments are generally classified as Level 2 of the fair value hierarchy.
54
GOLDMAN SACHS FUNDAMENTAL EMERGING MARKETS EQUITY FUNDS
|
| 3. INVESTMENTS AND FAIR VALUE MEASUREMENTS (continued) |
Derivative Contracts — A derivative is an instrument whose value is derived from underlying assets, indices, reference rates or a combination of these factors.
Exchange-traded derivatives, including futures contracts, typically fall within Level 1 of the fair value hierarchy.
i. Futures Contracts — Futures contracts are contracts to buy or sell a standardized quantity of a specified commodity or security and are valued based on exchanged settlement prices or independent market quotes. Futures contracts are valued at the last settlement price, or in the absence of a sale, the last bid price for long positions and at the last ask price for short positions, at the end of each day on the board of trade or exchange upon which they are traded. Upon entering into a futures contract, a Fund deposits cash or securities in an account on behalf of the broker in an amount sufficient to meet the initial margin requirement. Subsequent payments are made or received by a Fund equal to the daily change in the contract value and are recorded as variation margin receivable or payable with a corresponding offset to unrealized gains or losses.
B. Level 3 Fair Value Investments — To the extent that the aforementioned significant inputs are unobservable, or if quotations are not readily available, or if GSAMI believes that such quotations do not accurately reflect fair value, the fair value of the Funds’ investments may be determined under Valuation Procedures approved by the Trustees. GSAMI, consistent with its procedures and applicable regulatory guidance, may make an adjustment to the most recent valuation prices of either domestic or foreign securities in light of significant events to reflect what it believes to be the fair value of the securities at the time of determining a Fund’s NAV. Significant events which could affect a large number of securities in a particular market may include, but are not limited to: significant fluctuations in U.S. or foreign markets; market dislocations; market disruptions; or unscheduled market closings. Significant events which could also affect a single issuer may include, but are not limited to: corporate actions such as reorganizations, mergers and buy-outs; ratings downgrades; and bankruptcies.
C. Fair Value Hierarchy — The following is a summary of the Funds’ investments and derivatives classified in the fair value hierarchy as of April 30, 2014:
| | | | | | | | | | | | |
| | | |
| ASIA EQUITY | | | | | | | | | | | | |
| | | |
| Investment Type | | Level 1 | | | Level 2 | | | Level 3 | |
| Assets | | | | | | | | | | | | |
Common Stock and/or Other Equity Investments | | | | | | | | | | | | |
North and South America | | $ | 1,496,020 | | | $ | — | | | $ | — | |
Asia | | | 5,523,398 | | | | 72,765,493 | (a) | | | — | |
| Total | | $ | 7,019,418 | | | $ | 72,765,493 | | | $ | — | |
| | | |
| BRIC | | | | | | | | | | | | |
| | | |
| Investment Type | | Level 1 | | | Level 2 | | | Level 3 | |
| Assets | | | | | | | | | | | | |
Common Stock and/or Other Equity Investments | | | | | | | | | | | | |
North and South America | | $ | 37,471,761 | | | $ | 7,031,083 | | | $ | — | |
Asia and Europe | | | 7,671,596 | | | | 120,875,829 | (a) | | | — | |
| Total | | $ | 45,143,357 | | | $ | 127,906,912 | | | $ | — | |
55
GOLDMAN SACHS FUNDAMENTAL EMERGING MARKETS EQUITY FUNDS
Notes to Financial Statements (continued)
April 30, 2014 (Unaudited)
|
| 3. INVESTMENTS AND FAIR VALUE MEASUREMENTS (continued) |
| | | | | | | | | | | | |
| | | |
| EMERGING MARKETS EQUITY | | | | | | | | | | | | |
| | | |
| Investment Type | | Level 1 | | | Level 2 | �� | | Level 3 | |
| Assets | | | | | | | | | | | | |
Common Stock and/or Other Equity Investments | | | | | | | | | | | | |
North and South America | | $ | 76,746,881 | | | $ | 4,967,502 | | | $ | — | |
Africa, Asia and Europe | | | 10,868,526 | | | | 252,864,505 | (a) | | | — | |
| Total | | $ | 87,615,407 | | | $ | 257,832,007 | | | $ | — | |
| | | |
| N-11 EQUITY | | | | | | | | | | | | |
| | | |
| Investment Type | | Level 1 | | | Level 2 | | | Level 3 | |
| Assets | | | | | | | | | | | | |
Common Stock and/or Other Equity Investments | | | | | | | | | | | | |
North and South America | | $ | 99,067,966 | | | $ | — | | | $ | — | |
Africa, Asia and Europe | | | — | | | | 337,731,345 | (a) | | | — | |
| Total | | $ | 99,067,966 | | | $ | 337,731,345 | | | $ | — | |
| (a) | | To adjust for the time difference between local market close and the calculation of net asset value, the Funds utilize fair value model prices for certain international equities provided by an independent fair value service resulting in a Level 2 classification. |
For further information regarding security characteristics, see the Schedules of Investments.
|
| 4. INVESTMENTS IN DERIVATIVES |
The following table sets forth, by certain risk types, the Funds’ gains (losses) related to these derivatives and their indicative volumes for the six months ended April 30, 2014. These gains (losses) should be considered in the context that these derivative contracts may have been executed to create investment opportunities and/or economically hedge certain investments, and accordingly, certain gains (losses) on such derivative contracts may offset certain (losses) gains attributable to investments. These gains (losses) are included in “Net realized gain (loss)” or “Net change in unrealized gain (loss)” on the Statements of Operations:
| | | | | | | | | | | | | | | | |
| Fund | | Risk | | Statements of Operations | | Net Realized
Gain (Loss) | | | Net Change in
Unrealized
Gain (Loss) | | | Average
Number of
Contracts(a) | |
N-11 Equity | | Equity | | Net realized gain (loss) from futures contracts/Net change in unrealized gain (loss) on futures contracts | | | 70,584 | | | | — | | | | 5 | |
| (a) | | Average number of contracts is based on the average of month end balances for the period ended April 30, 2014. |
56
GOLDMAN SACHS FUNDAMENTAL EMERGING MARKETS EQUITY FUNDS
|
| 5. AGREEMENTS AND AFFILIATED TRANSACTIONS |
A. Management Agreement — Under the Agreement, GSAMI manages the Funds, subject to the general supervision of the Trustees.
As compensation for the services rendered pursuant to the Agreement, the assumption of the expenses related thereto and administration of the Funds’ business affairs, including providing facilities, GSAMI is entitled to a management fee, accrued daily and paid monthly, equal to an annual percentage rate of each Fund’s average daily net assets.
For the six months ended April 30, 2014, contractual and effective net management fees with GSAMI were at the following rates:
| | | | | | | | | | | | | | | | | | | | | | | | | | | | | | |
| | | | | Contractual Management Rate | | | Effective Net
Management
Fee Rate | |
| Fund | | | | First
$1 billion | | | Next
$1 billion | | | Next
$3 billion | | | Next
$3 billion | | | Over
$8 billion | | | Effective
Rate | | |
Asia Equity | | | | | 1.00 | % | | | 0.90 | % | | | 0.86 | % | | | 0.84 | % | | | 0.82 | % | | | 1.00 | % | | | 1.00 | % |
BRIC | | | | | 1.30 | | | | 1.30 | | | | 1.17 | | | | 1.11 | | | | 1.09 | | | | 1.30 | | | | 1.04 | * |
Emerging Markets Equity | | | | | 1.20 | | | | 1.20 | | | | 1.08 | | | | 1.03 | | | | 1.01 | | | | 1.20 | | | | 1.02 | * |
N-11 Equity | | | | | 1.30 | | | | 1.30 | | | | 1.24 | | | | 1.21 | | | | 1.19 | | | | 1.30 | | | | 1.13 | * |
| * | | GSAMI has agreed to waive a portion of its management fee in order to achieve net management rates, as defined in the Funds’ most recent prospectuses. These waivers will be effective through at least February 28, 2015, and prior to such date, GSAMI may not terminate the arrangements without the approval of the Trustees. The Effective Net Management Rates above are calculated based on management rates before and after the waivers had been adjusted, if applicable. |
B. Distribution and Service Plans — The Trust, on behalf of each Fund, has adopted Distribution and Service Plans (the “Plans”). Under the Plans, Goldman Sachs, which serves as distributor (the “Distributor”), is entitled to a fee accrued daily and paid monthly, for distribution services and personal and account maintenance services, which may then be paid by Goldman Sachs to authorized dealers, at the following annual rates calculated on a Fund’s average daily net assets of each respective share class:
| | | | | | | | | | | | |
| | | Distribution and Service Plan Rates | |
| | | Class A* | | | Class B | | | Class C | |
Distribution Plan | | | 0.25 | % | | | 0.75 | % | | | 0.75 | % |
Service Plan | | | — | | | | 0.25 | | | | 0.25 | |
| * | | With respect to Class A Shares, the Distributor at its discretion may use compensation for distribution services paid under the Distribution Plan to compensate service organizations for personal and account maintenance services and expenses as long as such total compensation does not exceed the maximum cap on “service fees” imposed by the Financial Industry Regulatory Authority. |
57
GOLDMAN SACHS FUNDAMENTAL EMERGING MARKETS EQUITY FUNDS
Notes to Financial Statements (continued)
April 30, 2014 (Unaudited)
|
| 5. AGREEMENTS AND AFFILIATED TRANSACTIONS (continued) |
C. Distribution Agreement — Goldman Sachs, as Distributor of the shares of the Funds pursuant to a Distribution Agreement, may retain a portion of the Class A front end sales charge and Class B and Class C Shares’ CDSC. During the six months ended April 30, 2014, Goldman Sachs advised that it retained the following amounts:
| | | | | | | | | | |
| | | | | Front End
Sales Charge | | | Contingent Deferred
Sales Charge* | |
| Fund | | | | Class A | | | Class C | |
Asia Equity | | | | $ | 1,153 | | | $ | — | |
BRIC | | | | | 4,540 | | | | 81 | |
Emerging Markets Equity | | | | | 4,633 | | | | — | |
N-11 Equity | | | | | 4,022 | | | | — | |
| * | | Goldman Sachs did not retain any contingent deferred sales charges for Class B Shares. |
D. Service Plan and Shareholder Administration Plan — The Trust, on behalf of each Fund that offers Service Shares, has adopted a Service Plan and a Shareholder Administration Plan. These plans allow for service organizations to provide varying levels of personal and account maintenance and shareholder administration services to their customers who are beneficial owners of such shares. The Service Plan and Shareholder Administration Plan each provide for compensation to the service organizations which is accrued daily and paid monthly at an annual rate of 0.25% (0.50% in aggregate) of the average daily net assets of the Service Shares.
E. Transfer Agency Agreement — Goldman Sachs also serves as the transfer agent of the Funds for a fee pursuant to Transfer Agency Agreement. The fees charged for such transfer agency services are accrued daily and paid monthly at annual rates as follows: 0.19% of the average daily net assets of Class A, Class B, Class C, and Class IR Shares; and 0.04% of the average daily net assets of Institutional and Service Shares.
F. Other Expense Agreements and Affiliated Transactions — GSAMI has agreed to limit certain “Other Expense” of the Funds (excluding transfer agent fees and expenses, service fees and shareholder administration fees (as applicable), taxes, interest, brokerage fees, shareholder meetings, litigation, indemnification, and other extraordinary expenses) to the extent such expenses exceed, on an annual basis, a percentage rate of the average daily net assets of each Fund. Such Other Expense reimbursements, if any, are accrued daily and paid monthly. In addition, the Funds are not obligated to reimburse GSAMI for prior fiscal year expense reimbursements, if any. The Other Expense limitations as an annual percentage rate of average daily net assets for the Asia Equity, BRIC, Emerging Markets Equity and N-11 Equity Funds are 0.254%, 0.264%, 0.264% and 0.164%, respectively. Prior to February 28, 2014, the Other Expense limitation for the Asia Equity Fund and Emerging Markets Equity were 0.344% and 0.354%, respectively. These Other Expense limitations will remain in place through at least February 28, 2015 and prior to such date GSAMI may not terminate the arrangements without the approval of the Board of Trustees. The Funds bear their respective share of costs related to proxy and shareholder meetings, and GSAMI has agreed to reimburse each Fund to the extent such expense exceed a specified percentage of the Fund’s net assets. In addition, the Funds have entered into certain offset arrangements with the custodian and the transfer agent, which may result in a reduction of the Funds’ expenses and are received irrespective of the application of the “Other Expense” limitations described above.
58
GOLDMAN SACHS FUNDAMENTAL EMERGING MARKETS EQUITY FUNDS
|
| 5. AGREEMENTS AND AFFILIATED TRANSACTIONS (continued) |
For the six months ended April 30, 2014, these expense reductions, including any fee waivers and Other Expense reimbursements, were as follows:
| | | | | | | | | | | | | | | | | | |
| Fund | | | | Management
Fee Waiver | | | Other Expense
Reimbursement | | | Custody Fee
Credits | | | Total Expense
Reductions | |
Asia Equity | | | | $ | — | | | $ | 177,984 | | | $ | 428 | | | $ | 178,412 | |
BRIC | | | | | 271,821 | | | | — | | | | 371 | | | | 272,192 | |
Emerging Markets Equity | | | | | 337,408 | | | | 92,359 | | | | 1,131 | | | | 430,898 | |
N-11 Equity | | | | | 374,163 | | | | 366,046 | | | | 1,523 | | | | 741,732 | |
As of April 30, 2014, the amounts owed to affiliates of the Funds were as follows:
| | | | | | | | | | | | | | | | | | |
| Fund | | | | Management
Fees | | | Distribution
and Service
Fees | | | Transfer
Agent
Fees | | | Total | |
Asia Equity | | | | $ | 49,999 | | | $ | 4,845 | | | $ | 3,980 | | | $ | 58,824 | |
BRIC | | | | | 156,226 | | | | 51,263 | | | | 20,192 | | | | 227,681 | |
Emerging Markets Equity | | | | | 305,695 | | | | 23,408 | | | | 17,161 | | | | 346,264 | |
N-11 Equity | | | | | 411,096 | | | | 35,004 | | | | 32,841 | | | | 478,941 | |
G. Line of Credit Facility — As of April 30, 2014, the Funds participated in a $780,000,000 committed, unsecured revolving line of credit facility (the “facility”) together with other funds of the Trust and registered investment companies having management agreements with GSAMI or its affiliates (“Other Borrowers”). Pursuant to the terms of the facility, the Funds and Other Borrowers could increase the credit amount by an additional $220,000,000, for a total of up to $1,000,000,000. This facility is to be used solely for temporary or emergency purposes, which may include the funding of redemptions. The interest rate on borrowings is based on the federal funds rate. The facility also requires a fee to be paid by the Funds based on the amount of the commitment that has not been utilized. For the six months ended April 30, 2014, the Funds did not have any borrowings under the facility. The facility was increased to $1,080,000,000 effective May 6, 2014.
H. Other Transactions with Affiliates — For the six months ended April 30, 2014, Goldman Sachs earned $257,096, $1,565,113 and $506,659 in brokerage commissions from portfolio transactions, including futures transactions executed with Goldman Sachs as the Futures Commission Merchant, on behalf of the Asia Equity and Emerging Markets Equity Funds, respectively.
As of April 30, 2014 the Goldman Sachs Satellite Strategies Portfolio was the beneficial owner of 18% or more of total outstanding shares of the Emerging Markets Equity Fund.
As of April 30, 2014, the Goldman Sachs Group, Inc. was the beneficial owner of approximately 100% of the Class IR Shares of the Asia Equity Fund.
59
GOLDMAN SACHS FUNDAMENTAL EMERGING MARKETS EQUITY FUNDS
Notes to Financial Statements (continued)
April 30, 2014 (Unaudited)
|
| 6.PORTFOLIO SECURITIES TRANSACTIONS |
The cost of purchases and proceeds from sales and maturities of long-term securities for the six months ended April 30, 2014, were as follows:
| | | | | | | | | | |
| Fund | | | | Purchases | | | Sales and Maturities | |
Asia Equity | | | | $ | 67,233,415 | | | $ | 67,694,964 | |
BRIC | | | | | 60,069,358 | | | | 133,067,527 | |
Emerging Markets Equity | | | | | 216,093,306 | | | | 320,268,214 | |
N-11 Equity | | | | | 87,161,532 | | | | 130,344,895 | |
As of the Fund’s most recent fiscal year end, October 31, 2013, the Funds’ capital loss carryforwards on a tax-basis were as follows:
| | | | | | | | | | | | | | | | |
| | | Asia Equity | | | BRIC | | | Emerging
Markets Equity | | | N-11 Equity | |
Capital loss carryforwards: | | | | | | | | | | | | | | | | |
Expiring 2016(1) | | $ | — | | | $ | (46,894,391 | ) | | $ | (30,277,067 | ) | | $ | — | |
Expiring 2017(1) | | | (19,951,704 | ) | | | (151,677,917 | ) | | | (445,745,035 | ) | | | — | |
Perpetual Long-term | | | — | | | | (13,813,501 | ) | | | — | | | | (1,628,149 | ) |
Perpetual Short-term | | | — | | | | (23,042,349 | ) | | | (979,173 | ) | | | (5,130,977 | ) |
Total capital loss forwards | | $ | (19,951,704 | ) | | $ | (235,428,158 | ) | | $ | (477,001,275 | ) | | $ | (6,759,126 | ) |
| (1) | | Expiration occurs on October 31 of the year indicated. Due to a Fund merger, utilization of the Asia Equity Fund’s losses may be substantially limited under the Code. |
As of April 30, 2014, the Funds’ aggregate security unrealized gains and losses based on cost for U.S. federal income tax purposes were as follows:
| | | | | | | | | | | | | | | | |
| | | Asia Equity | | | BRIC | | | Emerging
Markets Equity | | | N-11 Equity | |
Tax cost | | $ | 78,968,201 | | | $ | 174,499,131 | | | $ | 323,326,759 | | | $ | 404,825,176 | |
Gross unrealized gain | | | 6,696,690 | | | | 18,213,050 | | | | 40,097,808 | | | | 53,857,232 | |
Gross unrealized loss | | | (5,879,980 | ) | | | (19,661,912 | ) | | | (17,977,153 | ) | | | (21,883,097 | ) |
Net unrealized security gain | | $ | 816,710 | | | $ | (1,448,862 | ) | | $ | 22,120,655 | | | $ | 31,974,135 | |
The difference between GAAP-basis and tax-basis unrealized gains (losses) is attributable primarily to wash sales and differences related to the tax treatment of passive foreign investment company investments.
GSAMI has reviewed the Funds’ tax positions for all open tax years (the current and prior three years, as applicable) and has concluded that no provision for income tax is required in the Funds’ financial statements. Such open tax years remain subject to examination and adjustment by tax authorities.
60
GOLDMAN SACHS FUNDAMENTAL EMERGING MARKETS EQUITY FUNDS
The Funds’ risks include, but are not limited to, the following:
Foreign Custody Risk — A Fund that invests in foreign securities may hold such securities and foreign currency with foreign banks, agents, and securities depositories appointed by the Fund’s custodian (each a “Foreign Custodian”). In some countries, Foreign Custodians may be subject to little or no regulatory oversight or independent evaluation of their operations. Further, the laws of certain countries may place limitations on a Fund’s ability to recover its assets if a Foreign Custodian enters into bankruptcy. Investments in emerging markets may be subject to greater custody risks than investments in more developed markets. Custody services in emerging market countries are often undeveloped and may be less regulated than in more developed countries, and thus may not afford the same level of investor protection as would apply in developed countries.
Shareholder Concentration Risk — Certain funds, accounts, individuals or Goldman Sachs affiliates may from time to time own (beneficially or of record) or control a significant percentage of the Funds’ shares. Redemptions by these entities of their holdings in the Funds may impact the Funds’ liquidity and NAV. These redemptions may also force the Funds to sell securities.
Investments in Other Investment Companies — As a shareholder of another investment company, including an exchange traded fund (“ETF”), a Fund will directly bear its proportionate share of any management fees and other expenses paid by such other investment companies, in addition to the fees and expenses regularly borne by the Fund. ETFs are subject to risks that do not apply to conventional mutual funds, including but not limited to the following: (i) the market price of the ETF’s shares may trade at a premium or a discount to their NAV; and (ii) an active trading market for an ETF’s shares may not develop or be maintained.
Geographic Risk — Concentration of the investments of a Fund in issuers located in a particular country or region will subject the Fund, to a greater extent than if investments were less concentrated, to the risks of adverse securities markets, exchange rates and social, political, regulatory or economic events which may occur in a given country or region. The Asia Equity Fund invests primarily in equity investments in Asian issuers. The BRIC Fund invests primarily in equity investments in Brazil, Russia, India and China issuers. The N-11 Equity Fund invests primarily in equity investments in the N-11 countries, and may invest up to 50% of its assets in any one N-11 country.
Liquidity Risk — The Funds may make investments that are illiquid or that may become less liquid in response to market developments or adverse investor perceptions. Illiquid investments may be more difficult to value. Liquidity risk may also refer to the risk that a Fund will not be able to pay redemption proceeds within the allowable time period because of unusual market conditions, an unusually high volume of redemption requests, or other reasons. To meet redemption requests, a Fund may be forced to sell investments at an unfavorable time and/or under unfavorable conditions.
Market and Credit Risks — In the normal course of business, the Funds trade financial instruments and enter into financial transactions where risk of potential loss exists due to changes in the market (market risk). Additionally, the Funds may also be exposed to credit risk in the event that an issuer or guarantor fails to perform or that an institution or entity with which the Funds have unsettled or open transactions defaults.
Investing in foreign markets may involve special risks and considerations not typically associated with investing in the U.S. Foreign securities may be subject to risk of loss because of more or less foreign government regulation, less public information and less economic, political and social stability in the countries in which the Fund invests. Loss may also result from the imposition of exchange controls, confiscations and other government restrictions by the U.S. or other governments, or from problems in registration, settlement or custody. Foreign risk also involves the risk of negative foreign currency rate fluctuations, which may
61
GOLDMAN SACHS FUNDAMENTAL EMERGING MARKETS EQUITY FUNDS
Notes to Financial Statements (continued)
April 30, 2014 (Unaudited)
|
| 8. OTHER RISKS (continued) |
cause the value of securities denominated in such foreign currency (or other instruments through which the Fund has exposure to foreign currencies) to decline in value. Currency exchange rates may fluctuate significantly over short periods of time. To the extent that the Fund also invests in securities of issuers located in emerging markets, these risks may be more pronounced.
Non-Diversification Risk — The BRIC and N-11 Equity Funds are non-diversified, meaning that they are permitted to invest a larger percentage of their assets in fewer issuers than diversified mutual funds. Thus, a Fund may be more susceptible to adverse developments affecting any single issuer held in its portfolio, and may be more susceptible to greater losses because of these developments.
Under the Trust’s organizational documents, its Trustees, officers, employees and agents are indemnified, to the extent permitted by the Act and state law, against certain liabilities that may arise out of performance of their duties to the Funds. Additionally, in the course of business, the Funds enter into contracts that contain a variety of indemnification clauses. The Funds’ maximum exposure under these arrangements is unknown, as this would involve future claims that may be made against the Funds that have not yet occurred. However, GSAMI believes the risk of loss under these arrangements to be remote.
Mergers and Reorganizations — At a meeting held on February 11, 2014, the Board of Trustees of Trust approved an Agreement and Plan of Reorganization (the “Reorganization Agreement”) providing for the tax-free acquisition of the Goldman Sachs China Equity Fund by the Goldman Sachs Asia Equity Fund. The acquisition was completed on April 28, 2014 as of April 25, 2014.
Pursuant to the Reorganization Agreement, the assets and liabilities of the Acquired Fund’s Shares were transferred in exchange for the Survivor Fund’s Shares, in a tax-free exchange as follows:
| | | | | | | | | | | | |
| Survivor/Acquired Fund | | Exchanged Shares of Survivor Issued | | | Value of
Exchanged Shares | | | Acquired Fund’s Shares
Outstanding as of
April 25, 2014 | |
Asia Equity Class A/China Equity Class A | | | 1,463 | | | $ | 28,606 | | | | 3,258 | |
Asia Equity Class C/China Equity Class C | | | 16,455 | | | | 301,777 | | | | 34,927 | |
Asia Equity Institutional Class/China Equity Institutional Class | | | 1,213,633 | | | | 24,806,694 | | | | 2,815,194 | |
Asia Equity Class IR/China Equity Class IR | | | 443 | | | | 9,065 | | | | 1,030 | |
62
GOLDMAN SACHS FUNDAMENTAL EMERGING MARKETS EQUITY FUNDS
|
| 10. OTHER MATTERS (continued) |
The following chart shows the Survivor Fund’s and Acquired Fund’s aggregate net assets (immediately before and after the completion of the acquisition) and the Acquired Fund’s unrealized appreciation:
| | | | | | | | | | | | | | | | | | | | |
| Survivor/Acquired Fund | | Survivor Fund’s
Aggregate net
Assets before
acquisition | | | Acquired Fund’s
Aggregate Net
Assets before
acquisition | | | Acquired Fund’s
Aggregate Net
Assets Immediately
after acquisition | | | Acquired Fund’s
Unrealized
Appreciation | | | Acquired Fund’s
Capital Loss
Carryforward | |
Asia Equity/China Equity | | $ | 57,966,754 | | | $ | 25,146,142 | | | $ | 83,112,896 | | | $ | 1,103,562 | | | $ | 296,719 | |
Subsequent events after the Statement of Assets and Liabilities date have been evaluated through the date the financial statements were issued. GSAMI has concluded that there is no impact requiring adjustment or disclosure in the financial statements.
63
GOLDMAN SACHS FUNDAMENTAL EMERGING MARKETS EQUITY FUNDS
Notes to Financial Statements (continued)
April 30, 2014 (Unaudited)
|
| 12. SUMMARY OF SHARE TRANSACTIONS |
Share activity is as follows:
| | | | | | | | | | | | | | | | |
| | | Asia Equity Fund | |
| | | | |
| | | For the Six Months Ended April 30, 2014 (Unaudited) | | | For the Fiscal Year Ended October 31, 2013 | |
| | | | |
| | | Shares | | | Dollars | | | Shares | | | Dollars | |
| | | | |
| Class A Shares | | | | | | | | | | | | | | | | |
Shares sold | | | 331,579 | | | $ | 6,347,854 | | | | 48,908 | | | $ | 904,805 | |
Shares issued in connection with merger | | | 1,463 | | | | 28,606 | | | | — | | | | — | |
Shares converted from Class B(a) | | | 761 | | | | 14,763 | | | | 805 | | | | 14,712 | |
Reinvestment of distributions | | | 2,986 | | | | 56,823 | | | | 5,101 | | | | 94,117 | |
Shares redeemed | | | (367,525 | ) | | | (7,109,719 | ) | | | (172,410 | ) | | | (3,143,752 | ) |
| | | | (30,736 | ) | | | (661,673 | ) | | | (117,596 | ) | | | (2,130,118 | ) |
| Class B Shares | | | | | | | | | | | | | | | | |
Shares sold | | | — | | | | — | | | | 1,489 | | | | 26,519 | |
Shares converted to Class A(a) | | | (801 | ) | | | (14,763 | ) | | | (845 | ) | | | (14,712 | ) |
Reinvestment of distributions | | | — | | | | — | | | | 93 | | | | 1,635 | |
Shares redeemed | | | (13,181 | ) | | | (243,092 | ) | | | (15,235 | ) | | | (269,068 | ) |
| | | | (13,982 | ) | | | (257,855 | ) | | | (14,498 | ) | | | (255,626 | ) |
| Class C Shares | | | | | | | | | | | | | | | | |
Shares sold | | | 13,721 | | | | 249,182 | | | | 20,039 | | | | 350,387 | |
Shares issued in connection with merger | | | 16,455 | | | | 301,777 | | | | — | | | | — | |
Reinvestment of distributions | | | — | | | | — | | | | 608 | | | | 10,581 | |
Shares redeemed | | | (35,499 | ) | | | (640,874 | ) | | | (51,355 | ) | | | (887,537 | ) |
| | | | (5,323 | ) | | | (89,915 | ) | | | (30,708 | ) | | | (526,569 | ) |
| Institutional Shares | | | | | | | | | | | | | | | | |
Shares sold | | | 46,941 | | | | 932,357 | | | | 117,645 | | | | 2,283,037 | |
Shares issued in connection with merger | | | 1,213,633 | | | | 24,806,694 | | | | — | | | | — | |
Reinvestment of distributions | | | 16,939 | | | | 336,570 | | | | 33,315 | | | | 641,652 | |
Shares redeemed | | | (163,813 | ) | | | (3,300,630 | ) | | | (374,927 | ) | | | (7,225,071 | ) |
| | | | 1,113,700 | | | | 22,774,991 | | | | (223,967 | ) | | | (4,300,382 | ) |
| Class IR Shares(b) | | | | | | | | | | | | | | | | |
Shares sold | | | 725 | | | | 15,005 | | | | — | | | | — | |
Shares issued in connection with merger | | | 443 | | | | 9,065 | | | | — | | | | — | |
| | | | 1,168 | | | | 24,070 | | | | — | | | | — | |
NET INCREASE (DECREASE) | | | 1,064,827 | | | $ | 21,789,618 | | | | (386,769 | ) | | $ | (7,212,695 | ) |
| (a) | | Class B Shares convert into Class A Shares on or about the fifteenth day of the last month of the calendar quarter that is eight years after the initial purchase date of either the Fund or another Goldman Sachs Fund. |
| (b) | | Class IR Shares commenced operations on February 28, 2014. |
64
GOLDMAN SACHS FUNDAMENTAL EMERGING MARKETS EQUITY FUNDS
|
| 12. SUMMARY OF SHARE TRANSACTIONS (continued) |
Share activity is as follows:
| | | | | | | | | | | | | | | | |
| | | BRIC Fund | |
| | | | |
| | | For the Six Months Ended April 30, 2014 (Unaudited) | | | For the Fiscal Year Ended October 31, 2013 | |
| | | | |
| | | Shares | | | Dollars | | | Shares | | | Dollars | |
| | | | |
| Class A Shares | | | | | | | | | | | | | | | | |
Shares sold | | | 264,153 | | | $ | 3,305,475 | | | | 1,142,685 | | | $ | 14,903,715 | |
Reinvestment of distributions | | | 64,277 | | | | 830,475 | | | | 69,332 | | | | 906,863 | |
Shares redeemed | | | (1,869,746 | ) | | | (23,360,698 | ) | | | (5,337,106 | ) | | | (67,703,737 | ) |
| | | | (1,541,316 | ) | | | (19,224,748 | ) | | | (4,125,089 | ) | | | (51,893,159 | ) |
| Class C Shares | | | | | | | | | | | | | | | | |
Shares sold | | | 123,446 | | | | 1,468,894 | | | | 352,073 | | | | 4,270,279 | |
Reinvestment of distributions | | | 5,310 | | | | 65,892 | | | | — | | | | — | |
Shares redeemed | | | (1,027,043 | ) | | | (12,296,170 | ) | | | (2,537,381 | ) | | | (30,561,235 | ) |
| | | | (898,287 | ) | | | (10,761,384 | ) | | | (2,185,308 | ) | | | (26,290,956 | ) |
| Institutional Shares | | | | | | | | | | | | | | | | |
Shares sold | | | 209,083 | | | | 2,694,676 | | | | 2,359,241 | | | | 31,462,752 | |
Reinvestment of distributions | | | 113,871 | | | | 1,497,408 | | | | 142,348 | | | | 1,897,492 | |
Shares redeemed | | | (3,558,901 | ) | | | (45,927,230 | ) | | | (6,818,804 | ) | | | (85,565,784 | ) |
| | | | (3,235,947 | ) | | | (41,735,146 | ) | | | (4,317,215 | ) | | | (52,205,540 | ) |
| Class IR Shares | | | | | | | | | | | | | | | | |
Shares sold | | | 32,380 | | | | 418,824 | | | | 23,044 | | | | 308,544 | |
Reinvestment of distributions | | | 712 | | | | 9,450 | | | | 1,903 | | | | 25,542 | |
Shares redeemed | | | (31,077 | ) | | | (396,428 | ) | | | (137,097 | ) | | | (1,737,910 | ) |
| | | | 2,015 | | | | 31,846 | | | | (112,150 | ) | | | (1,403,824 | ) |
NET DECREASE | | | (5,673,535 | ) | | $ | (71,689,432 | ) | | | (10,739,762 | ) | | $ | (131,793,479 | ) |
65
GOLDMAN SACHS FUNDAMENTAL EMERGING MARKETS EQUITY FUNDS
Notes to Financial Statements (continued)
April 30, 2014 (Unaudited)
|
| 12. SUMMARY OF SHARE TRANSACTIONS (continued) |
Share activity is as follows:
| | | | | | | | | | | | | | | | |
| | | Emerging Markets Equity Fund | |
| | | | |
| | | For the Six Months Ended April 30, 2014 (Unaudited) | | | For the Fiscal Year Ended October 31, 2013 | |
| | | | |
| | | Shares | | | Dollars | | | Shares | | | Dollars | |
| | | | |
| Class A Shares | | | | | | | | | | | | | | | | |
Shares sold | | | 289,723 | | | $ | 4,306,398 | | | | 568,041 | | | $ | 8,500,222 | |
Shares converted from Class B(a) | | | 4,563 | | | | 66,708 | | | | 5,209 | | | | 78,747 | |
Reinvestment of distributions | | | 9,026 | | | | 136,017 | | | | 12,073 | | | | 184,480 | |
Shares redeemed | | | (728,733 | ) | | | (10,865,094 | ) | | | (829,122 | ) | | | (12,376,906 | ) |
| | | | (425,421 | ) | | | (6,355,971 | ) | | | (243,799 | ) | | | (3,613,457 | ) |
| Class B Shares | | | | | | | | | | | | | | | | |
Shares sold | | | 341 | | | | 4,412 | | | | 2,924 | | | | 39,354 | |
Shares converted to Class A(a) | | | (5,032 | ) | | | (66,708 | ) | | | (5,727 | ) | | | (78,747 | ) |
Shares redeemed | | | (77,054 | ) | | | (1,034,301 | ) | | | (102,860 | ) | | | (1,392,253 | ) |
| | | | (81,745 | ) | | | (1,096,597 | ) | | | (105,663 | ) | | | (1,431,646 | ) |
| Class C Shares | | | | | | | | | | | | | | | | |
Shares sold | | | 54,257 | | | | 735,666 | | | | 150,214 | | | | 2,081,408 | |
Shares redeemed | | | (132,454 | ) | | | (1,768,966 | ) | | | (442,875 | ) | | | (5,973,906 | ) |
| | | | (78,197 | ) | | | (1,033,300 | ) | | | (292,661 | ) | | | (3,892,498 | ) |
| Institutional Shares | | | | | | | | | | | | | | | | |
Shares sold | | | 2,026,924 | | | | 32,242,305 | | | | 10,131,460 | | | | 161,225,599 | |
Reinvestment of distributions | | | 158,000 | | | | 2,532,738 | | | | 163,167 | | | | 2,651,459 | |
Shares redeemed | | | (8,231,694 | ) | | | (130,686,789 | ) | | | (6,178,223 | ) | | | (95,880,633 | ) |
| | | | (6,046,770 | ) | | | (95,911,746 | ) | | | 4,116,404 | | | | 67,996,425 | |
| Service Shares | | | | | | | | | | | | | | | | |
Shares sold | | | 174,709 | | | | 2,512,454 | | | | 642,685 | | | | 9,497,267 | |
Reinvestment of distributions | | | 2,389 | | | | 34,951 | | | | 5,244 | | | | 77,760 | |
Shares redeemed | | | (177,371 | ) | | | (2,570,483 | ) | | | (742,772 | ) | | | (10,391,730 | ) |
| | | | (273 | ) | | | (23,078 | ) | | | (94,843 | ) | | | (816,703 | ) |
| Class IR Shares | | | | | | | | | | | | | | | | |
Shares sold | | | 2,645 | | | | 41,325 | | | | 18,949 | | | | 300,906 | |
Reinvestment of distributions | | | 118 | | | | 1,886 | | | | 120 | | | | 1,945 | |
Shares redeemed | | | (3,694 | ) | | | (58,459 | ) | | | (14,041 | ) | | | (215,833 | ) |
| | | | (931 | ) | | | (15,248 | ) | | | 5,028 | | | | 87,018 | |
NET INCREASE (DECREASE) | | | (6,633,337 | ) | | $ | (104,435,940 | ) | | | 3,384,466 | | | $ | 58,329,139 | |
| (a) | | Class B Shares convert into Class A Shares on or about the fifteenth day of the last month of the calendar quarter that is eight years after the initial purchase date of either the Fund or another Goldman Sachs Fund. |
66
GOLDMAN SACHS FUNDAMENTAL EMERGING MARKETS EQUITY FUNDS
|
| 12. SUMMARY OF SHARE TRANSACTIONS (continued) |
Share activity is as follows:
| | | | | | | | | | | | | | | | |
| | | N-11 Equity Fund | |
| | | | |
| | | For the Six Months Ended April 30, 2014 (Unaudited) | | | For the Fiscal Year Ended October 31, 2013 | |
| | | | |
| | | Shares | | | Dollars | | | Shares | | | Dollars | |
| | | | |
| Class A Shares | | | | | | | | | | | | | | | | |
Shares sold | | | 928,411 | | | $ | 9,882,984 | | | | 9,035,603 | | | $ | 100,619,699 | |
Reinvestment of distributions | | | 52,792 | | | | 572,817 | | | | 1,844 | | | | 19,768 | |
Shares redeemed | | | (2,161,818 | ) | | | (23,146,663 | ) | | | (2,052,943 | ) | | | (22,102,004 | ) |
| | | | (1,180,615 | ) | | | (12,690,862 | ) | | | 6,984,504 | | | | 78,537,463 | |
| Class C Shares | | | | | | | | | | | | | | | | |
Shares sold | | | 64,906 | | | | 679,690 | | | | 1,328,175 | | | | 14,609,334 | |
Reinvestment of distributions | | | 1,484 | | | | 15,699 | | | | — | | | | — | |
Shares redeemed | | | (321,812 | ) | | | (3,358,575 | ) | | | (224,863 | ) | | | (2,427,812 | ) |
| | | | (255,422 | ) | | | (2,663,186 | ) | | | 1,103,312 | | | | 12,181,522 | |
| Institutional Shares | | | | | | | | | | | | | | | | |
Shares sold | | | 3,908,621 | | | | 41,850,564 | | | | 25,420,802 | | | | 283,007,151 | |
Reinvestment of distributions | | | 223,827 | | | | 2,443,811 | | | | 33,935 | | | | 365,135 | |
Shares redeemed | | | (6,042,106 | ) | | | (64,823,599 | ) | | | (8,407,405 | ) | | | (90,814,397 | ) |
| | | | (1,909,658 | ) | | | (20,529,224 | ) | | | 17,047,332 | | | | 192,557,889 | |
| Class IR Shares | | | | | | | | | | | | | | | | |
Shares sold | | | 210,758 | | | | 2,270,812 | | | | 2,925,053 | | | | 32,090,385 | |
Reinvestment of distributions | | | 23,756 | | | | 258,613 | | | | 2,575 | | | | 27,660 | |
Shares redeemed | | | (1,104,794 | ) | | | (11,799,575 | ) | | | (551,695 | ) | | | (6,008,395 | ) |
| | | | (870,280 | ) | | | (9,270,150 | ) | | | 2,375,933 | | | | 26,109,650 | |
NET INCREASE (DECREASE) | | | (4,215,975 | ) | | $ | (45,153,422 | ) | | | 27,511,081 | | | $ | 309,386,524 | |
67
GOLDMAN SACHS FUNDAMENTAL EMERGING MARKETS EQUITY FUNDS
Fund Expenses — Six Month Period Ended April 30, 2014 (Unaudited)
As a shareholder of Class A, Class B, Class C, Institutional, Service or Class IR Shares of a Fund you incur two types of costs: (1) transaction costs, including sales charges on purchase payments (with respect to Class A Shares) and contingent deferred sales charges on redemptions (with respect to Class B and Class C Shares); and (2) ongoing costs, including management fees; distribution and service (12b-1) fees (with respect to Class A, Class B and Class C Shares); and other Fund expenses. This example is intended to help you understand your ongoing costs (in dollars) of investing in Class A, Class B, Class C, Institutional, Service and Class IR Shares of the Funds and to compare these costs with the ongoing costs of investing in other mutual funds.
The example is based on an investment of $1,000 invested at the beginning of the period and held for the entire period from November 1, 2013 through April 30, 2014.
Actual Expenses — The first line under each share class in the table below provides information about actual account values and actual expenses. You may use the information in this line, together with the amount you invested, to estimate the expenses that you paid over the period. Simply divide your account value by $1,000 (for example, an $8,600 account value divided by $1,000=8.6), then multiply the result by the number in the first line under the heading entitled “Expenses Paid” to estimate the expenses you paid on your account during this period.
Hypothetical Example for Comparison Purposes — The second line under each share class in the table below provides information about hypothetical account values and hypothetical expenses based on the Funds’ actual net expense ratio and an assumed rate of return of 5% per year before expenses, which is not the Funds’ actual return. The hypothetical account values and expenses may not be used to estimate the actual ending account balance or expenses you paid for the period. You may use this information to compare the ongoing costs of investing in the Funds and other funds. To do so, compare this 5% hypothetical example with the 5% hypothetical examples that appear in the shareholder reports of the other funds.
Please note that the expenses shown in the table are meant to highlight your ongoing costs only and do not reflect any transactional costs, such as sales charges, redemption fees, or exchange fees. Therefore, the second line of the table is useful in comparing ongoing costs only, and will not help you determine the relative total costs of owning different funds. In addition, if these transactional costs were included, your costs would have been higher.
| | | | | | | | | | | | | | | | | | | | | | | | | | | | | | | | | | | | | | | | | | | | | | | | |
| | | Asia Equity Fund | | | BRIC Fund | | | Emerging Markets Equity Fund | | | N-11 Equity Fund | |
| Share Class | | Beginning
Account
Value
11/01/13 | | | Ending Account Value 04/30/14 | | | Expenses
Paid for the
6 Months Ended
04/30/14* | | | Beginning
Account
Value
11/01/13 | | | Ending Account Value 04/30/14 | | | Expenses
Paid for the
6 Months Ended
04/30/14* | | | Beginning
Account
Value
11/01/13 | | | Ending Account Value 04/30/14 | | | Expenses
Paid for the
6 Months Ended
04/30/14* | | | Beginning
Account
Value
11/01/13 | | | Ending Account Value 04/30/14 | | | Expenses
Paid for the
6 Months Ended
04/30/14* | |
| Class A | | | | | | | | | | | | | | | | | | | | | | | | | | | | | | | | | | | | | | | | | | | | | | | | |
Actual | | $ | 1,000 | | | $ | 1,004.10 | | | $ | 8.80 | | | $ | 1,000 | | | $ | 946.40 | | | $ | 8.40 | | | $ | 1,000 | | | $ | 1,001.90 | | | $ | 8.34 | | | $ | 1,000 | | | $ | 1,024.50 | | | $ | 8.78 | |
Hypothetical 5% return | | | 1,000 | | | | 1,016.02 | + | | | 8.85 | | | | 1,000 | | | | 1,016.17 | + | | | 8.70 | | | | 1,000 | | | | 1,016.46 | + | | | 8.40 | | | | 1,000 | | | | 1,016.12 | + | | | 8.75 | |
| Class B | | | | | | | | | | | | | | | | | | | | | | | | | | | | | | | | | | | | | | | | | | | | | | | | |
Actual | | | 1,000 | | | | 1,000.00 | | | | 12.50 | | | | N/A | | | | N/A | | | | N/A | | | | 1,000 | | | | 998.50 | | | | 12.04 | | | | N/A | | | | N/A | | | | N/A | |
Hypothetical 5% return | | | 1,000 | | | | 1,012.30 | + | | | 12.57 | | | | N/A | | | | N/A | | | | N/A | | | | 1,000 | | | | 1,012.74 | + | | | 12.13 | | | | N/A | | | | N/A | | | | N/A | |
| Class C | | | | | | | | | | | | | | | | | | | | | | | | | | | | | | | | | | | | | | | | | | | | | | | | |
Actual | | | 1,000 | | | | 1,000.60 | | | | 12.50 | | | | 1,000 | | | | 943.10 | | | | 12.00 | | | | 1,000 | | | | 997.80 | | | | 12.04 | | | | 1,000 | | | | 1,020.30 | | | | 12.52 | |
Hypothetical 5% return | | | 1,000 | | | | 1,012.30 | + | | | 12.57 | | | | 1,000 | | | | 1,012.45 | + | | | 12.42 | | | | 1,000 | | | | 1,012.74 | + | | | 12.13 | | | | 1,000 | | | | 1,012.40 | + | | | 12.47 | |
| Institutional | | | | | | | | | | | | | | | | | | | | | | | | | | | | | | | | | | | | | | | | | | | | | | | | |
Actual | | | 1,000 | | | | 1,005.90 | | | | 6.76 | | | | 1,000 | | | | 947.90 | | | | 6.47 | | | | 1,000 | | | | 1,004.50 | | | | 6.36 | | | | 1,000 | | | | 1,026.10 | | | | 6.78 | |
Hypothetical 5% return | | | 1,000 | | | | 1,018.05 | + | | | 6.81 | | | | 1,000 | | | | 1,018.15 | + | | | 6.71 | | | | 1,000 | | | | 1,018.45 | + | | | 6.41 | | | | 1,000 | | | | 1,018.10 | + | | | 6.76 | |
| Service | | | | | | | | | | | | | | | | | | | | | | | | | | | | | | | | | | | | | | | | | | | | | | | | |
Actual | | | N/A | | | | N/A | | | | N/A | | | | N/A | | | | N/A | | | | N/A | | | | 1,000 | | | | 1,001.10 | | | | 8.88 | | | | N/A | | | | N/A | | | | N/A | |
Hypothetical 5% return | | | N/A | | | | N/A | | | | N/A | | | | N/A | | | | N/A | | | | N/A | | | | 1,000 | | | | 1,015.92 | + | | | 8.95 | | | | N/A | | | | N/A | | | | N/A | |
| Class IR(a) | | | | | | | | | | | | | | | | | | | | | | | | | | | | | | | | | | | | | | | | | | | | | | | | |
Actual | | | 1,000 | | | | 970.10 | | | | 2.32 | | | | 1,000 | | | | 947.10 | | | | 7.24 | | | | 1,000 | | | | 1,003.20 | | | | 7.15 | | | | 1,000 | | | | 1,025.80 | | | | 7.53 | |
Hypothetical 5% return | | | 1,000 | | | | 1,017.55 | + | | | 7.30 | | | | 1,000 | | | | 1,017.36 | + | | | 7.50 | | | | 1,000 | | | | 1,017.65 | + | | | 7.20 | | | | 1,000 | | | | 1,017.36 | + | | | 7.50 | |
| (a) | | Commenced operations on February 28, 2014 for the Asia Equity Fund. |
| * | | Expenses are calculated using each Fund’s annualized net expense ratio for each class, which represents the ongoing expenses as a percentage of net assets for the six months ended April 30, 2014. Expenses are calculated by multiplying the annualized net expense ratio by the average account value for the period; then multiplying the result by the number of days in the most recent fiscal half year; and then dividing that result by the number of days in the fiscal year. The annualized net expense ratios for the period were as follows: |
| | | | | | | | | | | | | | | | | | | | | | | | |
| Fund | | Class A | | | Class B | | | Class C | | | Institutional | | | Service | | | Class IR | |
Asia Equity | | | 1.77 | % | | | 2.52 | % | | | 2.52 | % | | | 1.36 | % | | | N/A | | | | 1.46 | % |
BRIC | | | 1.74 | | | | N/A | | | | 2.49 | | | | 1.34 | | | | N/A | | | | 1.50 | |
Emerging Markets Equity | | | 1.68 | | | | 2.43 | | | | 2.43 | | | | 1.28 | | | | 1.79 | % | | | 1.44 | |
N-11 Equity | | | 1.75 | | | | N/A | | | | 2.50 | | | | 1.35 | | | | N/A | | | | 1.50 | |
| + | | Hypothetical expenses are based on each Fund's actual annualized net expense ratios and an assumed rate of return of 5% per year before expenses. |
68
FUNDS PROFILE
Goldman Sachs Funds

Goldman Sachs is a premier financial services firm, known since 1869 for creating thoughtful and customized investment solutions in complex global markets.
Today, the Investment Management Division of Goldman Sachs serves a diverse set of clients worldwide, including private institutions, public entities and individuals. With approximately $935.2 billion in assets under supervision as of March 31, 2014, Goldman Sachs Asset Management (“GSAM”) has portfolio management teams located around the world and our investment professionals bring firsthand knowledge of local markets to every investment decision. Assets under supervision includes assets under management and other client assets for which Goldman Sachs does not have full discretion. GSAM leverages the resources of Goldman, Sachs & Co. subject to legal, internal and regulatory restrictions.

Money Market1
Financial Square FundsSM
| n | | Financial Square Tax-Exempt Funds |
| n | | Financial Square Federal Fund |
| n | | Financial Square Government Fund |
| n | | Financial Square Money Market Fund |
| n | | Financial Square Prime Obligations Fund |
| n | | Financial Square Treasury Instruments Fund |
| n | | Financial Square Treasury Obligations Fund |
Fixed Income
Short Duration and Government
| n | | High Quality Floating Rate Fund |
| n | | Limited Maturity Obligations Fund |
| n | | Short Duration Government Fund |
| n | | Short Duration Income Fund |
| n | | Inflation Protected Securities Fund |
Multi-Sector
| n | | Core Plus Fixed Income Fund |
Municipal and Tax-Free
| n | | High Yield Municipal Fund |
| n | | Short Duration Tax-Free Fund |
Single Sector
| n | | Investment Grade Credit Fund |
| n | | High Yield Floating Rate Fund |
| n | | Emerging Markets Debt Fund |
| n | | Local Emerging Markets Debt Fund |
| n | | Dynamic Emerging Markets Debt Fund |
Corporate Credit
| n | | Long Short Credit Strategies Fund2 |
Fundamental Equity
| n | | Small/Mid Cap Value Fund |
| n | | Small/Mid Cap Growth Fund |
| n | | Flexible Cap Growth Fund |
| n | | Concentrated Growth Fund |
| n | | Technology Tollkeeper Fund |
| n | | Growth Opportunities Fund |
| n | | Rising Dividend Growth Fund |
Tax-Advantaged Equity
| n | | U.S. Tax-Managed Equity Fund3 |
| n | | International Tax-Managed Equity Fund3 |
| n | | U.S. Equity Dividend and Premium Fund |
| n | | International Equity Dividend and Premium Fund |
Equity Insights
| n | | Small Cap Equity Insights Fund |
| n | | U.S. Equity Insights Fund |
| n | | Small Cap Growth Insights Fund |
| n | | Large Cap Growth Insights Fund |
| n | | Large Cap Value Insights Fund |
| n | | Small Cap Value Insights Fund |
| n | | International Small Cap Insights Fund |
| n | | International Equity Insights Fund |
| n | | Emerging Markets Equity Insights Fund |
Fundamental Equity International
| n | | Strategic International Equity Fund |
| n | | Focused International Equity Fund4 |
| n | | International Small Cap Fund |
| n | | Emerging Markets Equity Fund |
| n | | BRIC Fund (Brazil, Russia, India, China) |
Select Satellite5
| n | | Real Estate Securities Fund |
| n | | International Real Estate Securities Fund |
| n | | Commodity Strategy Fund |
| n | | Dynamic Commodity Strategy Fund |
| n | | Dynamic Allocation Fund |
| n | | Absolute Return Tracker Fund |
| n | | Managed Futures Strategy Fund |
| n | | MLP Energy Infrastructure Fund |
| n | | Multi-Manager Alternatives Fund |
| n | | Multi-Asset Real Return Fund |
| n | | Retirement Portfolio Completion Fund |
| n | | Fixed Income Macro Strategies Fund |
Total Portfolio Solutions5
| n | | Balanced Strategy Portfolio |
| n | | Growth and Income Strategy Portfolio |
| n | | Growth Strategy Portfolio |
| n | | Equity Growth Strategy Portfolio |
| n | | Satellite Strategies Portfolio |
| n | | Enhanced Dividend Global Equity Portfolio |
| n | | Tax Advantaged Global Equity Portfolio |
| 1 | | An investment in a money market fund is neither insured nor guaranteed by the Federal Deposit Insurance Corporation (“FDIC”) or any other government agency. Although the Funds seek to preserve the value of your investment at $1.00 per share, it is possible to lose money by investing in the Funds. |
| 2 | | Effective at the close of business on March 21, 2014, the Goldman Sachs Credit Strategies Fund was reorganized with and into the Goldman Sachs Long Short Credit Strategies Fund. |
| 3 | | Effective at the close of business on April 30, 2014, the Goldman Sachs Structured Tax-Managed Equity and Structured International Tax-Managed Equity Funds were renamed the Goldman Sachs U.S. Tax-Managed Equity and International Tax-Managed Equity Funds respectively. |
| 4 | | Effective at the close of business on February 28, 2014, the Goldman Sachs Concentrated International Equity Fund was renamed the Goldman Sachs Focused International Equity Fund. |
| 5 | | Individual Funds within the Total Portfolio Solutions and Select Satellite categories will have various placement on the risk/return spectrum and may have greater or lesser risk than that indicated by the placement of the general Total Portfolio Solutions or Select Satellite category. |
Financial Square FundsSM is a registered service mark of Goldman, Sachs & Co.
| *This | | list covers open-end funds only. Please visit our website at www.GSAMFUNDS.com to learn about our closed-end fund. |
| | |
TRUSTEES Ashok N. Bakhru, Chairman Donald C. Burke John P. Coblentz, Jr. Diana M. Daniels Joseph P. LoRusso Herbert J. Markley James A. McNamara Jessica Palmer Alan A. Shuch Richard P. Strubel Roy W. Templing | | OFFICERS James A. McNamara, President Scott M. McHugh, Principal Financial Officer and Treasurer Caroline L. Kraus, Secretary |
| |
GOLDMAN, SACHS & CO. Distributor and Transfer Agent | | GOLDMAN SACHS ASSET MANAGEMENT, L.P. Investment Adviser |
Visit our Web site at www.GSAMFUNDS.com to obtain the most recent month-end returns.
Goldman Sachs Asset Management, L.P., 200 West Street, New York, New York 10282
The reports concerning the Funds included in this shareholder report may contain certain forward-looking statements about the factors that may affect the performance of the Funds in the future. These statements are based on Fund management’s predictions and expectations concerning certain future events and their expected impact on the Funds, such as performance of the economy as a whole and of specific industry sectors, changes in the levels of interest rates, the impact of developing world events, and other factors that may influence the future performance of the Funds. Management believes these forward-looking statements to be reasonable, although they are inherently uncertain and difficult to predict. Actual events may cause adjustments in portfolio management strategies from those currently expected to be employed.
A description of the policies and procedures that the Funds use to determine how to vote proxies relating to portfolio securities and information regarding how a Fund voted proxies relating to portfolio securities during the most recent 12-month period ended June 30 is available (I) without charge, upon request by calling 1-800-526-7384 (for Retail Shareholders) or 1-800-621-2550 (for Institutional Shareholders); and (II) on the Securities and Exchange Commission (“SEC”) Web site at http://www.sec.gov.
The Funds file their complete schedule of portfolio holdings with the SEC for the first and third quarters of each fiscal year on Form N-Q. The Funds’ Forms N-Q are available on the SEC’s web site at http://www.sec.gov within 60 days after the Funds’ first and third fiscal quarters. The Funds’ Forms N-Q may be reviewed and copied at the SEC’s Public Reference Room in Washington, D.C., and information on the operation of the Public Reference Room may also be obtained by calling 1-800-SEC-0330. Forms N-Q may be obtained upon request and without charge by calling 1-800-526-7384 (for Retail Shareholders) or 1-800-621-2550 (for Institutional Shareholders).
The website links provided are for your convenience only and are not an endorsement or recommendation by GSAM of any of these websites or the products or services offered. GSAM is not responsible for the accuracy and validity of the content of these websites.
Holdings and allocations shown are as of April 30, 2014 and may not be representative of future investments. Fund holdings should not be relied on in making investment decisions and should not be construed as research or investment advice regarding particular securities. Current and future holdings are subject to risk.
Economic and market forecasts presented herein reflect a series of assumptions and judgments as of the date of this presentation and are subject to change without notice. These forecasts do not take into account the specific investment objectives, restrictions, tax and financial situation or other needs of any specific client. Actual data will vary and may not be reflected here. These forecasts are subject to high levels of uncertainty that may affect actual performance. Accordingly, these forecasts should be viewed as merely representative of a broad range of possible outcomes. These forecasts are estimated, based on assumptions, and are subject to significant revision and may change materially as economic and market conditions change. Goldman Sachs has no obligation to provide updates or changes to these forecasts. Case studies and examples are for illustrative purposes only.
The Global Industry Classification Standard (GICS) was developed by and is the exclusive property and a service mark of Morgan Stanley Capital International Inc. (MSCI) and Standard & Poor’s, a division of The McGraw-Hill Companies, Inc. (S&P) and is licensed for use by Goldman Sachs. Neither MSCI, S&P nor any other party involved in making or compiling the GICS or any GICS classifications makes any express or implied warranties or representations with respect to such standard or classification (or the results to be obtained by the use thereof), and all such parties hereby expressly disclaim all warranties of originality, accuracy, completeness, merchantability or fitness for a particular purpose with respect to any of such standard or classification. Without limiting any of the foregoing, in no event shall MSCI, S&P, any of their affiliates or any third party involved in making or compiling the GICS or any GICS classifications have any liability for any direct, indirect, special, punitive, consequential or any other damages (including lost profits) even if notified of the possibility of such damages.
The portfolio risk management process includes an effort to monitor and manage risk, but does not imply low risk.
This material is not authorized for distribution to prospective investors unless preceded or accompanied by a current Prospectus or summary prospectus, if applicable. Investors should consider a Fund’s objective, risks, and charges and expenses, and read the summary prospectus, if available, and/or the Prospectus carefully before investing or sending money. The summary prospectus, if available, and the Prospectus contain this and other information about a Fund and may be obtained from your authorized dealer or from Goldman, Sachs & Co. by calling (retail – 1-800-526-7384) (institutional – 1-800-621-2550).
© 2013 Goldman Sachs. All rights reserved. 131639.MF.MED.TMPL /6/2014 EMESAR14 / 24K
The information required by this Item is only required in an annual report on this Form N-CSR.
| ITEM 3. | AUDIT COMMITTEE FINANCIAL EXPERT. |
The information required by this Item is only required in an annual report on this Form N-CSR.
| ITEM 4. | PRINCIPAL ACCOUNTANT FEES AND SERVICES. |
The information required by this Item is only required in an annual report on this Form N-CSR.
| ITEM 5. | AUDIT COMMITTEE OF LISTED REGISTRANTS. |
| ITEM 6. | SCHEDULE OF INVESTMENTS. |
| | Schedule of Investments is included as part of the Report to Stockholders filed under Item 1. |
| ITEM 7. | DISCLOSURE OF PROXY VOTING POLICIES AND PROCEDURES FOR CLOSED-END MANAGEMENT INVESTMENT COMPANIES. |
| ITEM 8. | PORTFOLIO MANAGERS OF CLOSED-END MANAGEMENT INVESTMENT COMPANIES. |
| ITEM 9. | PURCHASES OF EQUITY SECURITIES BY CLOSED-END MANAGEMENT INVESTMENT COMPANY AND AFFILIATED PURCHASERS. |
| ITEM 10. | SUBMISSION OF MATTERS TO A VOTE OF SECURITY HOLDERS. |
| | There have been no material changes to the procedures by which shareholders may recommend nominees to the registrant’s board of trustees. |
| ITEM 11. | CONTROLS AND PROCEDURES. |
| | (a) | The registrant’s principal executive and principal financial officers, or persons performing similar functions have concluded that the registrant’s disclosure controls and procedures (as defined in Rule 30a-3(c) under the Investment Company Act of 1940, as amended (the “1940 Act”)) are effective as of a date within 90 days of the filing of this report that includes the disclosure required by this paragraph, based on the evaluation of these controls and procedures required by Rule 30a-3(b) under the 1940 Act and 15d-15(b) under the Securities Exchange Act of 1934, as amended. |
| | (b) | There were no changes in the registrant’s internal control over financial reporting (as defined in Rule 30a-3(d) under the 1940 Act) that occurred during the registrant’s second fiscal quarter of the period covered by this report that have materially affected, or are reasonably likely to materially affect, the registrant’s internal control over financial reporting. |
| | | | |
| (a)(1) | | The information required by this Item is only required in connection with an annual report on this Form N-CSR. |
| | |
| (a)(2) | | Exhibit 99.CERT | | Certifications pursuant to Section 302 of the Sarbanes-Oxley Act of 2002 filed herewith. |
| | |
| (b) | | Exhibit 99.906CERT | | Certifications pursuant to Section 906 of the Sarbanes-Oxley Act of 2002 filed herewith. |
SIGNATURES
Pursuant to the requirements of the Securities Exchange Act of 1934 and the Investment Company Act of 1940, the registrant has duly caused this report to be signed on its behalf by the undersigned, thereunto duly authorized.
| | |
| | | Goldman Sachs Trust |
| |
| By: | | /s/ James A. McNamara |
| |
| | |
| | James A. McNamara |
| | President/Principal Executive Officer |
| | Goldman Sachs Trust |
| |
| Date: | | June 30, 2014 |
Pursuant to the requirements of the Securities Exchange Act of 1934 and the Investment Company Act of 1940, this report has been signed below by the following persons on behalf of the registrant and in the capacities and on the dates indicated.
| | |
| By: | | /s/ James A. McNamara |
| |
| | |
| | James A. McNamara |
| | President/Principal Executive Officer |
| | Goldman Sachs Trust |
| |
| Date: | | June 30, 2014 |
| |
| By: | | /s/ Scott McHugh |
| |
| | |
| | Scott McHugh |
| | Principal Financial Officer |
| | Goldman Sachs Trust |
| |
| Date: | | June 30, 2014 |