UNITED STATES
SECURITIES AND EXCHANGE COMMISSION
Washington, D.C. 20549
FORM N-CSR
CERTIFIED SHAREHOLDER REPORT OF REGISTERED
MANAGEMENT INVESTMENT COMPANIES
Investment Company Act file number 811-05349
Goldman Sachs Trust
(Exact name of registrant as specified in charter)
71 South Wacker Drive, Chicago, Illinois 60606
(Address of principal executive offices) (Zip code)
| | |
| Caroline Kraus, Esq. | | Copies to: |
| Goldman, Sachs & Co. | | Geoffrey R.T. Kenyon, Esq. |
| 200 West Street | | Dechert LLP |
| New York, New York 10282 | | 100 Oliver Street |
| | 40th Floor |
| | Boston, MA 02110-2605 |
(Name and address of agents for service)
Registrant’s telephone number, including area code: (312) 655-4400
Date of fiscal year end: December 31
Date of reporting period: June 30, 2014
| ITEM 1. | REPORTS TO STOCKHOLDERS. |
| | The Semi-Annual Report to Stockholders is filed herewith. |
Goldman Sachs Funds

| | | | |
| | |
| Semi-Annual Report | | | | June 30, 2014 |
| | |
| | | | Tax-Advantaged Equity Funds |
| | | | U.S. Equity Dividend and Premium |
| | | | International Equity Dividend and Premium |
| | | | U.S. Tax-Managed Equity* |
| | | | International Tax-Managed Equity* |
*Effective on April 30, 2014, the Goldman Sachs Structured Tax-Managed Equity and Structured International Tax-Managed Equity Funds were renamed the Goldman Sachs U.S. Tax-Managed Equity and International Tax-Managed Equity Funds, respectively.

Goldman Sachs Tax-Advantaged Equity Funds
| n | | U.S. EQUITY DIVIDEND AND PREMIUM |
| n | | INTERNATIONAL EQUITY DIVIDEND AND PREMIUM |
| n | | U.S. TAX-MANAGED EQUITY |
| n | | INTERNATIONAL TAX-MANAGED EQUITY |
| | | | |
TABLE OF CONTENTS | |
| |
Principal Investment Strategies and Risks | | | 1 | |
| |
Market Review | | | 3 | |
| |
Investment Process — Equity Dividend and Premium Funds | | | 5 | |
| |
Portfolio Management Discussions and Performance Summaries — Equity Dividend and Premium Funds | | | 6 | |
| |
Investment Process — Global Tax-Managed | | | 16 | |
| |
Portfolio Management Discussions and Performance Summaries — Tax-Managed Funds | | | 17 | |
| |
Index Definitions | | | 27 | |
| |
Schedules of Investments | | | 28 | |
| |
Financial Statements | | | 50 | |
| |
Financial Highlights | | | 54 | |
| |
Notes to the Financial Statements | | | 62 | |
| |
Other Information | | | 81 | |
| | | | |
| | | |
| NOT FDIC-INSURED | | May Lose Value | | No Bank Guarantee |
GOLDMAN SACHS TAX-ADVANTAGED EQUITY FUNDS
Principal Investment Strategies and Risks
This is not a complete list of risks that may affect the Funds. For additional information concerning the risks applicable to the Funds, please see the Funds’ Prospectuses.
The Goldman Sachs U.S. Equity Dividend and Premium Fund invests primarily in dividend-paying equity investments in large-capitalization U.S. equity issuers, including foreign issuers that are traded in the United States. The Fund is subject to market risk, which means that the value of the securities in which it invests may go up or down in response to the prospects of individual companies, particular sectors and/or general economic conditions. The Fund is also subject to the risks associated with writing (selling) call options, which limits the opportunity to profit from an increase in the market value of stocks in exchange for up-front cash at the time of selling the call option. In a rising market, the Fund could significantly underperform the market, and the Fund’s options strategies may not fully protect it against declines in the value of the market. The Investment Adviser’s use of quantitative models to execute the Fund’s investment strategy may fail to produce the intended result. Different investment styles (e.g., “quantitative”) tend to shift in and out of favor, and at times the Fund may underperform other funds that invest in similar asset classes. The Fund is also subject to the risk that the pre-tax performance of the Fund may be lower than the performance of a similar fund that is not tax-managed. No assurance can be offered that the Fund’s tax-managed strategies will reduce the amount of taxable income and capital gains distributed by the Fund to shareholders.
The Goldman Sachs International Equity Dividend and Premium Fund invests primarily in dividend-paying equity investments in companies that are organized outside the United States or whose securities are principally traded outside the United States. The Fund is subject to market risk, which means that the value of the securities in which it invests may go up or down in response to the prospects of individual companies, particular sectors and/or general economic conditions. Foreign and emerging markets investments may be more volatile and less liquid than investments in U.S. securities and are subject to the risks of currency fluctuations and adverse economic or political developments. The Fund is also subject to the risks associated with writing (selling) call options, which limits the opportunity to profit from an increase in the market value of stocks in exchange for up-front cash at the time of selling the call option. In a rising market, the Fund could significantly underperform the market, and the Fund’s options strategies may not fully protect it against declines in the value of the market. The Investment Adviser’s use of quantitative models to execute the Fund’s investment strategy may fail to produce the intended result. Different investment styles (e.g., “quantitative”) tend to shift in and out of favor, and at times the Fund may underperform other funds that invest in similar asset classes. The Fund is also subject to the risk that the pre-tax performance of the Fund may be lower than the performance of a similar fund that is not tax-managed. No assurance can be offered that the Fund’s tax managed strategies will reduce the amount of taxable income and capital gains distributed by the Fund to shareholders.
The Goldman Sachs U.S. Tax-Managed Equity Fund (formerly, Structured Tax-Managed Equity Fund) invests in equity investments in U.S. issuers, including foreign issuers that are traded in the United States. The Fund is subject to market risk, which means that the value of the securities in which it invests may go up or down in response to the prospects of individual companies, particular sectors and/or general economic conditions. The Investment Adviser’s use of quantitative models to execute the Fund’s investment strategy may fail to produce the intended result. Different investment styles (e.g., “quantitative”) tend to shift in and out of favor, and at times the Fund may underperform other funds that invest in similar asset classes. Foreign and emerging markets investments may be more volatile and less liquid than U.S. securities and are subject to the risks of currency fluctuations and adverse economic or political developments. The Fund is also subject to the risk that the pre-tax performance of the Fund may be lower than the performance of a similar fund that is not tax-managed. No assurance can be offered that the Fund’s tax-managed strategies will reduce the amount of taxable income and capital gains distributed by the Fund to shareholders. The Fund is not suitable for IRAs or other tax-exempt or tax-deferred accounts.
1
GOLDMAN SACHS TAX-ADVANTAGED EQUITY FUNDS
The Goldman Sachs International Tax-Managed Equity Fund (formerly, Structured International Tax-Managed Equity Fund) invests primarily in equity investments in companies that are organized outside the United States or whose securities are principally traded outside the United States. The Fund is subject to market risk, which means that the value of the securities in which it invests may go up or down in response to the prospects of individual companies, particular sectors and/ or general economic conditions. Foreign and emerging markets investments may be more volatile than investments in U.S. securities and are subject to the risks of currency fluctuations and adverse economic or political developments. The Investment Adviser’s use of quantitative models to execute the Fund’s investment strategy may fail to produce the intended result. Different investment styles (e.g., “quantitative”) tend to shift in and out of favor, and at times the Fund may underperform other funds that invest in similar asset classes. The Fund is also subject to the risk that the pre-tax performance of the Fund may be lower than the performance of a similar fund that is not tax-managed. No assurance can be offered that the Fund’s tax-managed strategies will reduce the amount of taxable income and capital gains distributed by the Fund to shareholders. The Fund is not suitable for IRAs or other tax-exempt or tax-deferred accounts.
2
MARKET REVIEW
Goldman Sachs Tax-Advantaged Equity Funds
Market Review
After a weak January 2014, U.S. and international equities rallied through the remainder of the six months ended June 30, 2014 (the “Reporting Period”).
In the U.S., economic data was slightly disappointing early in the Reporting Period. The housing market maintained its recovery, but the labor market remained weaker than expected. Additionally, fourth quarter 2013 U.S. Gross Domestic Product (“GDP”) was revised down to an annualized rate of 2.4% from 3.2%. The Federal Reserve (the “Fed”) reduced its asset purchases each month beginning in January 2014 and suggested a more hawkish stance in March 2014, dropping the threshold of 6.5% unemployment as a condition for raising interest rates. Fed Chair Yellen implied that interest rates could start to increase six months after the asset purchase program ends. Many U.S. corporate earnings announcements reflected top-line growth, though overall management guidance for 2014 was less optimistic than consensus. Meanwhile, in the first quarter of 2014, the Eurozone reported that its economy grew at a stronger than expected 0.5% year over year rate for the fourth quarter of 2013, and the European Commission raised its estimates for GDP growth to 1.2% for calendar year 2014 and to 1.8% for calendar year 2015. Based largely on such economic optimism, many European stock markets outperformed the broader international equities market in the first calendar quarter, despite some disappointing corporate earnings reports and conservative guidance from management and the potentially immediate threat of disinflation. Economic activity was also strong in Japan during the first quarter of 2014 ahead of the consumption tax hike on April 1, 2014. However, the Japanese equity market underperformed international equities in the first quarter of 2014 in part based on concerns that economic trends would be more difficult to assess ahead of the tax increase.
During the second calendar quarter, first quarter 2014 U.S. GDP was revised down to a contraction of 2.9%, largely due to disruption from severe winter weather. However, other economic data suggested the economy is improving. U.S. non-farm payrolls added 217,000 jobs in May 2014, and the national manufacturing Purchasing Managers Index (“PMI”), which rose to 56.4 in May 2014 from 55.4 in April 2014, showed the strongest reading in the past three months. In Europe, the U.K. equity market rose on an improving economic outlook, but many continental European stock markets declined in June 2014 amidst worries about deflation, disappointing European PMI data and the lowest reading in six months of the German Ifo Business Climate Index, a survey of German business confidence. In an effort to stimulate the European economy, the European Central Bank cut interest rates by 10 basis points, which put deposit rates in negative territory to promote lending. (A basis point is 1/100th of a percentage point.) In contrast, Japanese stocks rallied sharply into the end of the Reporting Period, as evidence suggested that underlying growth trends following the consumption tax increase were stronger than expected. In addition, it was reported late in the second quarter of 2014 that the tax increase in Japan had driven the biggest year over year increase in inflation in that nation in more than 20 years in April 2014.
3
MARKET REVIEW
U.S. Equity Markets
U.S. equities, as represented by the S&P 500® Index, gained 7.14% during the Reporting Period. All ten sectors within the S&P 500® Index were up, with the utilities (+18.64%) and energy (+12.98%) sectors posting the largest gains in absolute terms. The information technology (+8.95%) sector was the largest contributor on the basis of impact, which takes both weightings and total returns into account.
All segments of the U.S. equity market advanced during the Reporting Period, with mid-cap stocks, as measured by the Russell Midcap® Index, gaining most, followed by large-cap stocks and then at some distance by small-cap stocks, as measured by the Russell 1000® Index and the Russell 2000® Index, respectively. Large-cap stocks were most successful relative to small-caps in the information technology sector. From a style perspective, value-oriented stocks significantly outpaced growth-oriented stocks across the capitalization spectrum. (All as measured by the Russell Investments indices.)
International Equity Markets
International equities, as measured by the MSCI EAFE Index, returned 4.78% in U.S. dollar terms during the Reporting Period. Nineteen of the 21 countries in the MSCI EAFE Index were up for the period, with Israel (+20.66%) and Denmark (+19.61%) posting the largest gains in absolute terms. The U.K. (+4.56%) was the largest contributor on the basis of impact.
All 10 sectors in the MSCI EAFE Index were up, with the utilities (+15.32%) and energy (+13.72%) sectors gaining the most ground. The health care (+11.91%) sector was the largest positive contributor on the basis of impact.
Looking Ahead
In the months ahead, we believe less expensive stocks may outpace more expensive stocks. We also believe that stocks with good momentum are potentially more likely to outperform those with poor momentum. Our plan is to seek profitable companies with positive fundamentals, sustainable earnings and a track record of using capital to enhance shareholder value. To that end, we anticipate remaining fully invested, with long-term performance likely to be the result of stock selection rather than sector or capitalization allocations.
We stand behind our investment philosophy that sound economic investment principles, coupled with a disciplined quantitative approach, can provide potentially strong, uncorrelated returns over the long term. We consider our research agenda to be robust, and we continue to enhance our existing models, add new proprietary forecasting signals and improve our trading execution as we seek to provide the most value to our shareholders.
4
INVESTMENT PROCESS
What Differentiates the Goldman Sachs U.S. Equity Dividend and Premium and Goldman Sachs International Equity Dividend and Premium Funds’ Investment Process?
The Goldman Sachs U.S. Equity Dividend and Premium Fund seeks to maximize income and total return. The Goldman Sachs International Equity Dividend and Premium Fund seeks to maximize total return with an emphasis on income. Their portfolios consist primarily of large-cap, dividend-paying stocks.1 By investing in these securities, and through the use of option call writing, the Funds seek to generate an attractive after-tax cash flow.

A diversified portfolio:
| n | | Create a diversified large-cap equity portfolio that participates in all industries and sectors. |
| n | | Emphasize higher dividend-paying stocks within each industry and sector. |
Written call options:
| n | | The Funds utilize index call writing to seek to enhance their cash flow. |

| n | | We use proprietary quantitative techniques, including optimization tools, a risk model and a transactions cost model, in identifying a portfolio of stocks that we believe may enhance expected dividend yield while limiting deviations when compared to the S&P 500 Index or MSCI EAFE Index, as applicable. |

| n | | A fully invested, style-consistent portfolio. |
| n | | The Funds seek attractive after-tax cash flow from qualified dividends, long-term capital gains and option call writing. |
| n | | The Funds seek to enhance after-tax returns by generating distributions primarily from qualified dividends and long-term capital gains. |
| 1 | | Dividends are not guaranteed and a company’s future ability to pay dividends may be limited. |
| | | There is no guarantee that these objectives will be met. |
| | | Diversification does not protect an investor from market risk and does not ensure a profit. |
5
PORTFOLIO RESULTS
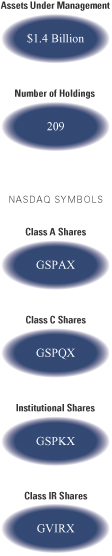
U.S. Equity Dividend and Premium Fund
Investment Objective
The Fund seeks to maximize income and total return.
Portfolio Management Discussion and Analysis
Below, the Goldman Sachs Quantitative Investment Strategies Team discusses the Goldman Sachs U.S. Equity Dividend and Premium Fund’s (the “Fund”) performance and positioning for the six-month period ended June 30, 2014 (the “Reporting Period”).
| Q | | How did the Fund perform during the Reporting Period? |
| A | | During the Reporting Period, the Fund’s Class A, C, Institutional and IR Shares generated cumulative total returns, without sales charges, of 5.78%, 5.32%, 5.91% and 5.82%, respectively. These returns compare to the 7.14% cumulative total return of the Fund’s benchmark, the Standard & Poor’s 500® Index (the “S&P 500® Index”), during the same period. The Barclays U.S. Aggregate Bond Index returned 3.93%. Although the Fund does not invest in fixed income securities, maximizing income is part of the Fund’s investment objective, and therefore we believe that a comparison of the Fund’s performance to that of the Barclays U.S. Aggregate Bond Index is useful to investors. |
| Q | | What key factors were most responsible for the Fund’s performance during the Reporting Period? |
| A | | The sale of call options on the S&P 500® Index detracted from the Fund’s total return during the Reporting Period. (A call option is an option that gives the holder the right to buy a certain quantity of an underlying security at an agreed-upon price at any time up to an agreed-upon date.) |
| | The impact of security selection was relatively neutral during the Reporting Period. The Fund was hurt by our stock picks in the financials, industrials, utilities and energy sectors. Stock selection in the telecommunication services, consumer discretionary and consumer staples sectors contributed positively. |
| Q | | How did the Fund’s call writing affect its performance? |
| A | | Consistent with our investment approach, we wrote index call options on a portion of the stock portfolio’s market value. When the Fund sells an index call option, it retains the premium it receives from the sale. However, if the purchaser exercises the option, the Fund is obligated to pay the purchaser the difference between the price of the index and the exercise price of the option. Although the Fund retains the premium it receives from the sale of the option, the premium may not exceed the difference in the value of the index as call options are exercised. This is what happened during the Reporting Period when the S&P 500® Index appreciated, and thus the Fund’s call writing detracted from performance. |
| | Overall, call option writing typically reduces volatility. Since its inception, the realized daily volatility of the Fund has been 19.91% compared to the realized volatility of the S&P 500® Index of 21.24%. During the Reporting Period, the realized daily volatility of the Fund was 10.34% compared to the realized volatility of the S&P 500® Index of 10.67%.1 |
| Q | | What was the Fund’s dividend yield during the Reporting Period? |
| A | | While maintaining industry and sector weights consistent with the S&P 500® Index, we favor stocks with higher dividend yields. The dividend yield of the Fund during the Reporting Period was 2.94% compared to 2.00% for the S&P 500® Index. The Fund’s dividend yield served to enhance its quarterly net income distributions. |
| Q | | Which individual stock holdings detracted significantly from relative performance during the Reporting Period? |
| A | | Relative to the S&P 500® Index, the Fund was hampered by its overweighted positions in integrated communications firm R.R. Donnelley & Sons and bank holding company New York Community Bancorp. It was hurt by its underweighted position in oilfield services company Schlumberger. |
| 1 | | The realized daily volatility of the Fund quoted herein is gross of fees. |
| | | There is no guarantee that these objectives will be met. |
6
PORTFOLIO RESULTS
| Q | | Among individual holdings, which stocks contributed most to the Fund’s results? |
| A | | Relative to the S&P 500® Index, the Fund benefited from overweighted positions in energy firm Williams Companies; voice and data network communications provider Windstream Holdings; and pharmaceutical company Eli Lilly. |
| Q | | How did the Fund use derivatives and similar instruments during the Reporting Period? |
| A | | During the Reporting Period, we used equity index futures, on an opportunistic basis, to equitize the Fund’s excess cash holdings. In other words, we put the Fund’s excess cash holdings to work by using them as collateral for the purchase of equity index futures. Consistent with our investment approach, we also wrote equity index options on a portion of the portfolio’s market value in an effort to generate premiums and reduce volatility. |
| Q | | What changes or enhancements did you make to your quantitative model during the Reporting Period? |
| A | | No material changes or enhancements were made to our quantitative model during the Reporting Period. |
7
FUND BASICS
U.S. Equity Dividend and Premium Fund
as of June 30, 2014
| | | | | | | | | | | | | | |
| | PERFORMANCE REVIEW | |
| | | January 1, 2014–
June 30, 2014 | | Fund Total Return
(based on NAV)1 | | | S&P 500 Index2 | | | Barclays U.S. Aggregate
Bond Index3 | |
| | Class A | | | 5.78 | % | | | 7.14 | % | | | 3.93 | % |
| | Class C | | | 5.32 | | | | 7.14 | | | | 3.93 | |
| | Institutional | | | 5.91 | | | | 7.14 | | | | 3.93 | |
| | | Class IR | | | 5.82 | | | | 7.14 | | | | 3.93 | |
| | 1 | | The net asset value (“NAV”) represents the net assets of the class of the Fund (ex-dividend) divided by the total number of shares of the class outstanding. The Fund’s performance reflects the reinvestment of dividends and other distributions. The Fund’s performance does not reflect the deduction of any applicable sales charges. |
| | 2 | | The S&P 500 Index is an unmanaged composite index of 500 common stock prices. The Index figures do not include any deduction for fees, expenses or taxes. It is not possible to invest directly in an index. |
| | 3 | | The Barclays U.S. Aggregate Bond Index represents an unmanaged diversified portfolio of fixed income securities, including U.S. Treasuries, investment-grade corporate bonds, and mortgage-backed and asset-backed securities. The Index figures do not reflect any deduction for fees, expenses or taxes. It is not possible to invest directly in an index. |
| | | | | | | | | | | | | | | | |
| | STANDARDIZED TOTAL RETURNS4 |
| | | For the period ended 6/30/14 | | One Year | | | Five Years | | | Since Inception | | | Inception Date |
| | Class A | | | 12.18 | % | | | 14.85 | % | | | 5.99 | % | | 8/31/05 |
| | Class C | | | 16.68 | | | | 15.25 | | | | 5.85 | | | 8/31/05 |
| | Institutional | | | 19.08 | | | | 16.61 | | | | 7.08 | | | 8/31/05 |
| | | Class IR | | | 18.88 | | | | N/A | | | | 16.66 | | | 8/31/10 |
| | 4 | | The Standardized Total Returns are average annual total returns as of the most recent calendar quarter-end. They assume reinvestment of all distributions at NAV. These returns reflect a maximum initial sales charge of 5.5% for Class A Shares and the assumed contingent deferred sales charge for Class C Shares (1% if redeemed within 12 months of purchase). Because Institutional and Class IR Shares do not involve a sales charge, such a charge is not applied to their Standardized Total Returns. |
The returns set forth in the tables above represent past performance. Past performance does not guarantee future results. The Fund’s investment return and principal value will fluctuate so that an investor’s shares, when redeemed, may be worth more or less than their original cost. Current performance may be lower or higher than the performance quoted above. Please visit our web site at www.GSAMFUNDS.com to obtain the most recent month-end returns. Performance reflects applicable fee waivers and/or expense limitations in effect during the periods shown. In their absence, performance would be reduced. Returns do not reflect the deduction of taxes that a shareholder would pay on Fund distributions or the redemption of Fund shares.
8
FUND BASICS
| | | | | | | | | | |
| | EXPENSE RATIOS5 | |
| | | | | Net Expense Ratio (Current) | | | Gross Expense Ratio (Before Waivers) | |
| | Class A | | | 1.19 | % | | | 1.21 | % |
| | Class C | | | 1.94 | | | | 1.96 | |
| | Institutional | | | 0.79 | | | | 0.81 | |
| | | Class IR | | | 0.94 | | | | 0.96 | |
| | 5 | | The expense ratios of the Fund, both current (net of applicable fee waivers and/or expense limitations) and before waivers (gross of applicable fee waivers and/or expense limitations) are as set forth above according to the most recent publicly available Prospectus for the Fund and may differ from the expense ratios disclosed in the Financial Highlights in this report. The Fund’s waivers and/or expense limitations will remain in place through at least April 30, 2015, and prior to such date the Investment Adviser may not terminate the arrangements without the approval of the Fund’s Board of Trustees. If these arrangements are discontinued in the future, the expense ratios may change without shareholder approval. |
| | | | | | | | | | |
| | STANDARDIZED AFTER-TAX PERFORMANCE AS OF 6/30/146 |
| | | Class A Shares | | One Year | | | Five Years | | Since Inception (8/31/05) |
| | Returns before taxes* | | | 12.18 | % | | 14.85% | | 5.99% |
| | Returns after taxes on distributions** | | | 10.37 | | | 13.87 | | 5.14 |
| | | Returns after taxes on distributions*** and sale of Fund shares | | | 7.82 | | | 11.94 | | 4.80 |
| | 6 | | The after-tax returns are calculated using the historically highest individual federal marginal income tax rates at the time of distributions (currently 23.8% for qualifying ordinary income dividends and long-term capital gain distributions and 43.4% for non-qualifying ordinary income dividends) and do not reflect state and local taxes. Actual after-tax returns will be calculated at calendar year-end and depend on an investor’s tax situation and may differ from those shown. In addition, the after-tax returns shown are not relevant to investors who hold Fund shares through tax-deferred arrangements such as 401(k) plans or individual retirement accounts. Under certain circumstances, the addition of the tax benefits from capital losses resulting from redemptions may cause the Returns After Taxes on Distributions and Sale of Fund Shares to be greater than the Returns After Taxes on Distributions or even Returns Before Taxes. Standardized after-tax returns assume reinvestment of all distributions at NAV and reflect a maximum initial sales charge of 5.5% for Class A Shares. |
| * | | Returns Before Taxes do not reflect taxes on distributions on the Fund’s Class A Shares nor do they show how performance can be impacted by taxes when shares are redeemed. |
| ** | | Returns After Taxes on Distributions assume that taxes are paid on distributions on the Fund’s Class A Shares (i.e., dividends and capital gains) but do not reflect taxes that may be incurred upon redemption of the Class A Shares at the end of the performance period. |
| *** | | Returns After Taxes on Distributions and Sale of Fund Shares reflect taxes paid on distributions on the Fund’s Class A Shares and taxes applicable when the shares are redeemed. |
9
FUND BASICS
| | | | | | | | |
| | TOP TEN HOLDINGS AS OF 6/30/147 |
| | | Holding | | % of Net Assets | | | Line of Business |
| | Apple, Inc. | | | 3.6 | % | | Technology Hardware & Equipment |
| | General Electric Co. | | | 2.4 | | | Capital Goods |
| | Microsoft Corp. | | | 2.3 | | | Software & Services |
| | The Procter & Gamble Co. | | | 1.9 | | | Household & Personal Products |
| | Wells Fargo & Co. | | | 1.9 | | | Banks |
| | Johnson & Johnson | | | 1.8 | | | Pharmaceuticals, Biotechnology & Life
Sciences |
| | Exxon Mobil Corp. | | | 1.6 | | | Energy |
| | Chevron Corp. | | | 1.6 | | | Energy |
| | JPMorgan Chase & Co. | | | 1.5 | | | Banks |
| | | Lockheed Martin Corp. | | | 1.5 | | | Capital Goods |
| | 7 | | The top 10 holdings may not be representative of the Fund’s future investments. |
|
| FUND VS. BENCHMARK SECTOR ALLOCATIONS8 |
| As of June 30, 2014 |
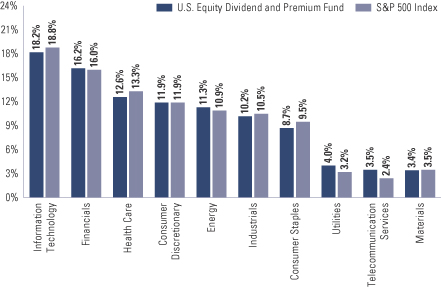
| | 8 | | The Fund is actively managed and, as such, its composition may differ over time. Consequently, the Fund’s overall sector allocations may differ from percentages contained in the graph above. The graph categorizes investments using Global Industry Classification Standard (“GICS”), however, the sector classifications used by the portfolio management team may differ from GICS. The percentage shown for each investment category reflects the value of investments in that category as a percentage of market value. The graph depicts the Fund’s investments but may not represent the Fund’s market exposure due to the exclusion of certain derivatives, if any, as listed in the Additional Investment Information section of the Schedule of Investments. |
10
PORTFOLIO RESULTS
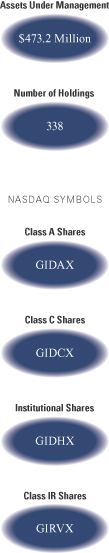
International Equity Dividend and Premium Fund
Investment Objective
The Fund seeks to maximize total return with an emphasis on income.
Portfolio Management Discussion and Analysis
Below, the Goldman Sachs Quantitative Investment Strategies Team discusses the Goldman Sachs International Equity Dividend and Premium Fund’s (the “Fund”) performance and positioning for the six-month period ended June 30, 2014 (the “Reporting Period”).
| Q | | How did the Fund perform during the Reporting Period? |
| A | | During the Reporting Period, the Fund’s Class A, C, Institutional and IR Shares generated cumulative total returns, without sales charges, of 6.48%, 6.01%, 6.65% and 6.58%, respectively. These returns compare to the 4.78% cumulative total return of the Fund’s benchmark, the MSCI EAFE Index (Net, USD, Unhedged). The Barclays Global Aggregate Bond Index (Gross USD, Unhedged) returned 4.08%. Although the Fund does not invest in fixed income securities, maximizing income is part of the Fund’s investment objective, and therefore we believe that a comparison of the Fund’s performance to that of the Barclays Global Aggregate Bond Index is useful to investors. |
| Q | | What key factors were most responsible for the Fund’s performance during the Reporting Period? |
| A | | Security selection contributed positively to the Fund’s relative performance. Stock picks in the industrials, telecommunication services, information technology and health care sectors added to relative returns versus the MSCI EAFE Index. Stock selection in the financials sector detracted. |
| | | The sale of call options detracted from the Fund’s total return during the Reporting Period. (A call option is an option that gives the holder the right to buy a certain quantity of an underlying security at an agreed-upon price at any time up to an agreed-upon date.) |
| Q | | How did the Fund’s call writing affect its performance? |
| A | | Consistent with our investment approach, we wrote index call options on a portion of the stock portfolio’s market value, primarily on the Japanese, United Kingdom and European indices. When the Fund sells an index call option, it retains the premium it receives from the sale. However, if the purchaser exercises the option, the Fund is obligated to pay the purchaser the difference between the price of the index and the exercise price of the option. Although the Fund retains the premium it receives from the sale of the option, the premium may not exceed the difference in the value of the index as call options are exercised. This is what happened during the Reporting Period when the MSCI EAFE Index appreciated, and thus the Fund’s call writing hurt performance. |
| | | Overall, call option writing typically reduces volatility. Since its inception, the realized daily volatility of the Fund has been 21.44% compared to the realized volatility of the MSCI EAFE Index of 22.44%. During the Reporting Period, realized daily volatility of the Fund was 9.49% compared to the realized volatility of the MSCI EAFE Index of 9.78%.1 |
| Q | | What was the Fund’s dividend yield during the Reporting Period? |
| A | | While maintaining industry and sector weights consistent with the MSCI EAFE Index, we favor stocks with higher dividend yields. The dividend yield of the Fund during the Reporting Period was 3.92% compared to 3.23% for the MSCI EAFE Index. The Fund’s dividend yield served to enhance its quarterly net income distributions. |
| Q | | Among individual holdings, which stocks contributed most to the Fund’s results? |
| A | | Relative to the MSCI EAFE Index, the Fund benefited from overweighted positions relative to the MSCI EAFE Index in RWE, a German electric, gas and water utility; Atlantia, an Italian holding company that owns the largest concessionaire on the Italian autostrade network; and Orion, a Finnish pharmaceutical company. |
| 1 | | The realized daily volatility of the Fund quoted herein is gross of fees. |
| | | There is no guarantee that these objectives will be met. |
11
PORTFOLIO RESULTS
| Q | | Which individual stock holdings detracted significantly from relative performance during the Reporting Period? |
| A | | The Fund’s performance was hampered by its overweighted position in ICAP, a U.K.-based financial markets operator and provider of post-trade risk mitigation and information services. It was also hurt by its underweighted positions in Danish pharmaceutical company Novo-Nordisk and Ireland- headquartered biopharmaceutical company Shire. |
| Q | | How did the Fund use derivatives and similar instruments during the Reporting Period? |
| A | | During the Reporting Period, we used equity index futures, on an opportunistic basis, to equitize the Fund’s excess cash holdings. In other words, we put the Fund’s excess cash holdings to work by using them as collateral for the purchase of equity index futures. Consistent with our investment approach, we also wrote equity index options on a portion of the portfolio’s market value in an effort to generate premiums and reduce volatility. |
| Q | | What changes or enhancements did you make to your quantitative model during the Reporting Period? |
| A | | No material changes or enhancements were made to our quantitative model during the Reporting Period. |
12
FUND BASICS
International Equity Dividend and Premium Fund
as of June 30, 2014
| | | | | | | | | | | | | | |
| | PERFORMANCE REVIEW | |
| | | January 1, 2014–
June 30, 2014 | | Fund Total Return
(based on NAV)1 | | | MSCI EAFE (Net) Index
(unhedged)2 | | | Barclays Global Aggregate
Bond Index3 | |
| | Class A | | | 6.48 | % | | | 4.78 | % | | | 4.08 | % |
| | Class C | | | 6.01 | | | | 4.78 | | | | 4.08 | |
| | Institutional | | | 6.65 | | | | 4.78 | | | | 4.08 | |
| | | Class IR | | | 6.58 | | | | 4.78 | | | | 4.08 | |
| | 1 | | The net asset value (“NAV”) represents the net assets of the class of the Fund (ex-dividend) divided by the total number of shares of the class outstanding. The Fund’s performance reflects the reinvestment of dividends and other distributions. The Fund’s performance does not reflect the deduction of any applicable sales charges. |
| | 2 | | The MSCI EAFE Index (unhedged and net of dividend withholding taxes) is an unmanaged market capitalization-weighted composite of securities in 22 developed markets. The Index figures do not include any deduction for fees or expenses. It is not possible to invest directly in an index. |
| | 3 | | The Barclays Global Aggregate Bond Index represents an unmanaged diversified portfolio of fixed income securities, including U.S. Treasuries, investment-grade corporate bonds, and mortgage-backed and asset-backed securities. The Index figures do not reflect any deduction for fees, expenses or taxes. It is not possible to invest directly in an index. |
| | | | | | | | | | | | | | | | |
| | STANDARDIZED TOTAL RETURNS4 |
| | | For the period ended 6/30/14 | | One Year | | | Five Years | | | Since Inception | | | Inception Date |
| | Class A | | | 15.74 | % | | | 8.42 | % | | | 0.54 | % | | 1/31/08 |
| | Class C | | | 20.51 | | | | 8.83 | | | | 0.48 | | | 1/31/08 |
| | Institutional | | | 23.02 | | | | 10.11 | | | | 1.65 | | | 1/31/08 |
| | | Class IR | | | 22.86 | | | | N/A | | | | 10.12 | | | 8/31/10 |
| | 4 | | The Standardized Total Returns are average annual total returns as of the most recent calendar quarter-end. They assume reinvestment of all distributions at NAV. These returns reflect a maximum initial sales charge of 5.5% for Class A Shares and the assumed contingent deferred sales charge for Class C Shares (1% if redeemed within 12 months of purchase). Because Institutional and Class IR Shares do not involve a sales charge, such a charge is not applied to their Standardized Total Returns. |
The returns set forth in the tables above represent past performance. Past performance does not guarantee future results. The Fund’s investment return and principal value will fluctuate so that an investor’s shares, when redeemed, may be worth more or less than their original cost. Current performance may be lower or higher than the performance quoted above. Please visit our web site at www.GSAMFUNDS.com to obtain the most recent month-end returns. Performance reflects applicable fee waivers and/or expense limitations in effect during the periods shown. In their absence, performance would be reduced. Returns do not reflect the deduction of taxes that a shareholder would pay on Fund distributions or the redemption of Fund shares.
13
FUND BASICS
| | | | | | | | | | |
| | EXPENSE RATIOS5 | |
| | | | | Net Expense Ratio (Current) | | | Gross Expense Ratio (Before Waivers) | |
| | Class A | | | 1.36 | % | | | 1.36 | % |
| | Class C | | | 2.11 | | | | 2.11 | |
| | Institutional | | | 0.96 | | | | 0.96 | |
| | | Class IR | | | 1.11 | | | | 1.11 | |
| | 5 | | The expense ratios of the Fund, both current (net of applicable fee waivers and/or expense limitations) and before waivers (gross of applicable fee waivers and/or expense limitations), are as set forth above according to the most recent publicly available Prospectus for the Fund and may differ from the expense ratios disclosed in the Financial Highlights in this report. The Fund’s waivers and/or expense limitations will remain in place through at least April 30, 2015, and prior to such date the Investment Adviser may not terminate the arrangements without the approval of the Fund’s Board of Trustees. If these arrangements are discontinued in the future, the expense ratios may change without shareholder approval. |
| | | | | | | | | | | | | | |
| | STANDARDIZED AFTER-TAX PERFORMANCE AS OF 6/30/146 | |
| | | Class A Shares | | One Year | | | Five Years | | | Since Inception
(1/31/08) | |
| | Returns before taxes* | | | 15.74 | % | | | 8.42 | % | | | 0.54 | % |
| | Returns after taxes on distributions** | | | 13.71 | | | | 7.60 | | | | -0.07 | |
| | | Returns after taxes on distributions***
and sale of Fund shares | | | 9.75 | | | | 6.80 | | | | 0.63 | |
| | 6 | | The after-tax returns are calculated using the historically highest individual federal marginal income tax rates at the time of distributions (currently 23.8% for qualifying ordinary income dividends and long-term capital gain distributions and 43.4% for non-qualifying ordinary income dividends) and do not reflect state and local taxes. Actual after-tax returns will be calculated at calendar year-end and depend on an investor’s tax situation and may differ from those shown. In addition, the after-tax returns shown are not relevant to investors who hold Fund shares through tax-deferred arrangements such as 401(k) plans or individual retirement accounts. Under certain circumstances, the addition of the tax benefits from capital losses resulting from redemptions may cause the Returns After Taxes on Distributions and Sale of Fund Shares to be greater than the Returns After Taxes on Distributions or even Returns Before Taxes. Standardized after-tax returns assume reinvestment of all distributions at NAV and reflect a maximum initial sales charge of 5.5% for Class A Shares. |
| | * | | Returns Before Taxes do not reflect taxes on distributions on the Fund’s Class A Shares nor do they show how performance can be impacted by taxes when shares are redeemed. |
| | ** | | Returns After Taxes on Distributions assume that taxes are paid on distributions on the Fund’s Class A Shares (i.e., dividends and capital gains) but do not reflect taxes that may be incurred upon redemption of the Class A Shares at the end of the performance period. |
| *** | | Returns After Taxes on Distributions and Sale of Fund Shares reflect taxes paid on distributions on the Fund’s Class A Shares and taxes applicable when the shares are redeemed. |
14
FUND BASICS
| | | | | | | | |
| | TOP TEN HOLDINGS AS OF 6/30/147 |
| | | Company | | % of Net Assets | | | Line of Business |
| | HSBC Holdings PLC | | | 2.3 | % | | Banks |
| | Banco Santander SA | | | 2.3 | | | Banks |
| | Nestle SA (Registered) | | | 2.3 | | | Food, Beverage & Tobacco |
| | Novartis AG (Registered) | | | 1.8 | | | Pharmaceuticals, Biotechnology &
Life Sciences |
| | GlaxoSmithKline PLC ADR | | | 1.7 | | | Pharmaceuticals, Biotechnology &
Life Sciences |
| | Daimler AG (Registered) | | | 1.5 | | | Automobiles & Components |
| | National Australia Bank Ltd. | | | 1.5 | | | Banks |
| | Sanofi | | | 1.4 | | | Pharmaceuticals, Biotechnology &
Life Sciences |
| | Australia & New Zealand Banking Group Ltd. | | | 1.4 | | | Banks |
| | | Royal Dutch Shell PLC Class A | | | 1.4 | | | Energy |
| | 7 | | The top 10 holdings may not be representative of the Fund’s future investments. |
|
| FUND VS. BENCHMARK SECTOR ALLOCATIONS8 |
| As of June 30, 2014 |
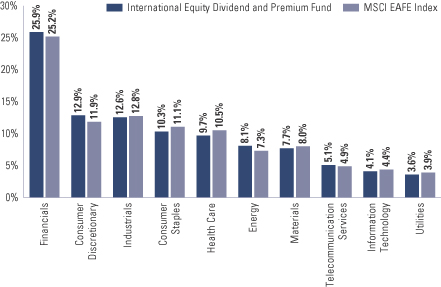
| | 8 | | The Fund is actively managed and, as such, its composition may differ over time. Consequently, the Fund’s overall sector allocations may differ from percentages contained in the graph above. The graph categorizes investments using Global Industry Classification Standard (“GICS”), however, the sector classifications used by the portfolio management team may differ from GICS. The percentage shown for each investment category reflects the value of investments in that category as a percentage of market value. The graph depicts the Fund’s investments but may not represent the Fund’s market exposure due to the exclusion of certain derivatives, if any, as listed in the Additional Investment Information section of the Schedule of Investments. |
15
INVESTMENT PROCESS
What Differentiates the Goldman Sachs Global Tax-Management Investment Process?
In managing money for many of the world’s wealthiest taxable investors, Goldman Sachs often constructs a diversified investment portfolio around a tax-managed core. With the Goldman Sachs U.S. Tax-Managed Equity Fund and International Tax-Managed Equity Fund, investors can access Goldman Sachs’ tax-smart investment expertise while potentially capitalizing on this same strategic approach to portfolio construction.
Goldman Sachs Global Tax-Management Investment Process
The Goldman Sachs Global Tax-Management investment process is a disciplined quantitative approach that has been consistently applied since 1989. With the Goldman Sachs U.S. Tax-Managed Equity Fund and the Goldman Sachs International Tax-Managed Equity Fund, the investment process is enhanced with an additional layer that seeks to maximize after-tax returns.
| | | | |
n Comprehensive | | n Extensive | | |
| | |
n Rigorous | | n Fundamental | | |
| | |
n Objective | | n Insightful | | |
Advantage: Daily analysis of approximately 3,000 U.S. and international equity securities using a proprietary model.
| n | | Sector and size neutral |
Tax optimization is an additional layer that is built into the existing Structured investment process — a distinct advantage. While other managers may simply seek to minimize taxable distributions through a low turnover strategy, this extension of the Structured investment process seeks to maximize after-tax returns — the true objective of every taxable investor.
Advantage: Value added through stock selection — not market timing, industry rotation or style bias.
| n | | A fully invested, style-consistent portfolio |
| n | | Broad access to the total U.S. and international equity markets |
| n | | A consistent goal of seeking to maximize after-tax risk-adjusted returns |
16
PORTFOLIO RESULTS
U.S. Tax-Managed Equity Fund
Investment Objective
The Fund seeks to provide long-term after-tax growth of capital through tax-sensitive participation in a broadly diversified portfolio of U.S. equity securities.
Portfolio Management Discussion and Analysis
Effective on April 30, 2014, the Goldman Sachs Structured Tax-Managed Equity Fund was renamed the Goldman Sachs U.S. Tax-Managed Equity Fund (the “Fund”). Below, the Goldman Sachs Quantitative Investment Strategies Team discusses the Fund’s performance and positioning for the six-month period ended June 30, 2014 (the “Reporting Period”).
| Q | | How did the Fund perform during the Reporting Period? |
| A | | During the Reporting Period, the Fund’s Class A, B, C, Institutional, Service and IR Shares generated cumulative total returns, without sales charges, of 7.96%, 7.55%, 7.56%, 8.24%, 7.88% and 8.10%, respectively. These returns compare to the 6.94% cumulative total return of the Fund’s benchmark, the Russell 3000® Index (the “Index”), over the same time period. |
| Q | | What key factors were most responsible for the Fund’s performance during the Reporting Period? |
| A | | During the Reporting Period, the Fund outperformed the Index, largely because of security selection. Our quantitative model, including our six investment themes, detracted from relative returns. |
| Q | | What impact did the Fund’s investment themes have on performance during the Reporting Period? |
| A | | In keeping with our investment approach, we use our quantitative model and its six investment themes to take a long-term view of market patterns and look for inefficiencies, selecting stocks for the Fund and overweighting or underweighting the ones chosen by the model. Over time and by design, the performance of any one of the model’s investment themes tends to have a low correlation with the model’s other themes, demonstrating the diversification benefit of the Fund’s theme-driven quantitative model. The variance in performance supports our research indicating that the diversification provided by the Fund’s different investment themes may be a significant investment advantage over the long term, even though the Fund may experience underperformance in the short term. Of course, diversification does not protect an investor from market risk nor does it ensure a profit. |
| | | During the Reporting Period, all six of our investment themes detracted from the Fund’s relative performance. Our Profitability theme, which assesses whether a company is earning more than its cost of capital, dampened returns the most. Momentum, Management, Quality, Sentiment and Valuation also hampered results. The Momentum theme seeks to predict drifts in stock prices caused by delayed investor reaction to company-specific information and information about related companies. The Management theme assesses the characteristics, policies and strategic decisions of company management. Quality seeks to assess both firm and management quality, while Sentiment reflects selected investment views and decisions of individuals and financial intermediaries. Our Valuation theme attempts to capture potential mispricings of securities, typically by comparing a measure of the company’s intrinsic value to its market value. |
| Q | | How did the Fund sector and industry allocations affect relative performance? |
| A | | In constructing the Fund’s portfolio, we focus on picking stocks rather than on making sector or industry bets. Consequently, the Fund is similar to the Index in terms of its sector and industry allocations and its style. Changes in its sector or industry weights generally do not have a meaningful impact on relative performance. |
17
PORTFOLIO RESULTS
| Q | | How successful was your stock selection during the Reporting Period? |
| A | | The Fund seeks to provide investors with a tax-efficient means for maintaining broadly diversified exposure to the entire U.S. equity market, ranging from large- to small-cap stocks. During the Reporting Period, our stock picks contributed positively to the Fund’s relative performance. |
| Q | | Among individual holdings, which stocks contributed most to the Fund’s results? |
| A | | Stock selection in the information technology, consumer discretionary and industrials sectors added most to the Fund’s relative returns during the Reporting Period. The Fund benefited from overweighted positions in Zillow, a real estate information marketplace; American Airlines Group, an airline holding company; and Pilgrim’s Pride, a chicken products producer. We assumed the overweight in Zillow because of our positive view on Profitability. The Fund was overweight American Airlines Group as a result of our positive view on Valuation, while we chose to overweight Pilgrim’s Pride given our positive views on Quality. |
| Q | | Which individual stock holdings detracted significantly from relative performance during the Reporting Period? |
| A | | Security selection in the energy, financials and telecommunication services sectors detracted most from the Fund’s relative performance. The Fund was hurt by overweighted positions in Nu Skin Enterprises, an anti-aging personal care products and nutritional supplements developer and distributor; Realogy Holdings, a provider of real estate and relocation services; and Ocwen Financial Group, which provides residential and commercial mortgage loan servicing. The Fund was overweight Nu Skin Enterprises due to our positive view on Quality. We adopted the overweights in Realogy Holdings and Ocwen Financial Group because of our positive view on Valuation. |
| Q | | How did the Fund use derivatives and similar instruments during the Reporting Period? |
| A | | During the Reporting Period, we did not use derivatives as part of an active management strategy to add value to the Fund’s results. However, we used equity index futures, on an opportunistic basis, to equitize the Fund’s excess cash holdings. In other words, we put the Fund’s excess cash holdings to work by using them as collateral for the purchase of equity index futures. |
| Q | | What changes or enhancements did you make to your quantitative model during the Reporting Period? |
| A | | In the first quarter of 2014, we implemented an enhancement within the small capitalization segment of the U.S. equity market. Based on our research, we adjusted our U.S. model to place more weight on fundamental factors, such as attractive valuations and high-quality earnings, compared to the large- and mid-capitalization segments of the market. Our research found that behavioral factors, such as positive sentiment and exposure to global themes and trends, allow us to seek more dynamic returns within more liquid segments of the market, including large- and mid-capitalization stocks. In addition, we made refinements to our transaction cost model, an important component of our portfolio construction process for all regions. |
| | | In the second quarter of 2014, we implemented an enhancement to our Sentiment theme, using natural language processing to analyze earnings call transcripts and research analyst reports every quarter. We read through the entirety of each company’s latest earnings call transcript, identifying key words and phrases that capture the underlying tone of the management team. We believe this provides us with better insight into management’s perception of their company. In addition, we enhanced our ability to identify groups of related companies within our global linkages theme. We read through hundreds of research analyst reports on a daily basis to identify groups of companies related to common trending investment topics in the market. |
| Q | | How was the Fund positioned relative to the Index at the end of the Reporting Period? |
| A | | In constructing the Fund’s portfolio, we focus on picking stocks rather than on making industry or sector bets. Consequently, the Fund is similar to the Index in terms of its sector allocation and style. That said, at the end of the Reporting Period, the Fund was overweight relative to the Index in the health care, consumer discretionary and information technology sectors. It was underweight compared to the Index in energy, financials, materials, utilities, consumer staples and telecommunication services. The Fund was relatively neutral in the industrials sector at the end of the Reporting Period. |
18
FUND BASICS
U.S. Tax-Managed Equity Fund
as of June 30, 2014
| | | | | | | | | | |
| | PERFORMANCE REVIEW | |
| | | January 1, 2014–June 30, 2014 | | Fund Total Return
(based on NAV)1 | | | Russell 3000 Index2 | |
| | Class A | | | 7.96 | % | | | 6.94 | % |
| | Class B | | | 7.55 | | | | 6.94 | |
| | Class C | | | 7.56 | | | | 6.94 | |
| | Institutional | | | 8.24 | | | | 6.94 | |
| | Service | | | 7.88 | | | | 6.94 | |
| | | Class IR | | | 8.10 | | | | 6.94 | |
| | 1 | | The net asset value (“NAV”) represents the net assets of the class of the Fund (ex-dividend) divided by the total number of shares of the class outstanding. The Fund’s performance assumes the reinvestment of dividends and other distributions. The Fund’s performance does not reflect the deduction of any applicable sales charges. |
| | 2 | | The Russell 3000 Index (with dividends reinvested) is an unmanaged index that measures the performance of the 3,000 largest U.S. companies based on total market capitalization, which represents approximately 98% of the investable U.S. equity market. Index figures do not reflect any deduction for fees, expenses or taxes. It is not possible to invest directly in an index. |
| | | | | | | | | | | | | | | | | | | | |
| | STANDARDIZED TOTAL RETURNS3 |
| | | For the period ended 6/30/14 | | One Year | | | Five Years | | | Ten Years | | | Since Inception | | | Inception Date |
| | Class A | | | 22.48 | % | | | 18.59 | % | | | 7.12 | % | | | 3.90 | % | | 4/3/00 |
| | Class B | | | 23.53 | | | | 18.81 | | | | 7.05 | | | | 3.86 | | | 4/3/00 |
| | Class C | | | 27.62 | | | | 19.01 | | | | 6.91 | | | | 3.52 | | | 4/3/00 |
| | Institutional | | | 30.17 | | | | 20.41 | | | | 8.16 | | | | 4.73 | | | 4/3/00 |
| | Service | | | 29.40 | | | | 19.80 | | | | 7.61 | | | | 4.21 | | | 4/3/00 |
| | | Class IR | | | 29.91 | | | | N/A | | | | N/A | | | | 22.73 | | | 8/31/10 |
| | 3 | | The Standardized Total Returns are average annual total returns as of the most recent calendar quarter-end. They assume reinvestment of all distributions at NAV. These returns reflect a maximum initial sales charge of 5.5% for Class A Shares, the assumed contingent deferred sales charge for Class B Shares (5% maximum declining to 0% after six years) and the assumed contingent deferred sales charge for Class C Shares (1% if redeemed within 12 months of purchase). Because Institutional, Service and Class IR Shares do not involve a sales charge, such a charge is not applied to their Standardized Total Returns. The Fund’s Class B Shares are no longer available for purchase by new or existing shareholders (although current Class B shareholders may continue to reinvest income and capital gains distributions into Class B Shares, and Class B shareholders may continue to exchange their shares for Class B Shares of certain other Goldman Sachs Funds). |
The returns set forth in the tables above represent past performance. Past performance does not guarantee future results. The Fund’s investment return and principal value will fluctuate so that an investor’s shares, when redeemed, may be worth more or less than their original cost. Current performance may be lower or higher than the performance quoted above. Please visit our web site at www.GSAMFUNDS.com to obtain the most recent month-end returns. Performance reflects applicable fee waivers and/or expense limitations in effect during the periods shown. In their absence, performance would be reduced. Returns do not reflect the deduction of taxes that a shareholder would pay on Fund distributions or the redemption of Fund shares.
19
FUND BASICS
| | | | | | | | | | |
| | EXPENSE RATIOS4 | |
| | | | | Net Expense Ratio (Current) | | | Gross Expense Ratio (Before Waivers) | |
| | Class A | | | 1.18 | % | | | 1.21 | % |
| | Class B | | | 1.93 | | | | 1.96 | |
| | Class C | | | 1.93 | | | | 1.96 | |
| | Institutional | | | 0.78 | | | | 0.81 | |
| | Service | | | 1.28 | | | | 1.31 | |
| | | Class IR | | | 0.93 | | | | 0.96 | |
| | 4 | | The expense ratios of the Fund, both current (net of applicable fee waivers and/or expense limitations) and before waivers (gross of applicable fee waivers and/or expense limitations) are as set forth above according to the most recent publicly available Prospectus for the Fund and may differ from the expense ratios disclosed in the Financial Highlights in this report. The Fund’s waivers and/or expense limitations will remain in place through at least April 30, 2015, and prior to such date the Investment Adviser may not terminate the arrangements without the approval of the Fund’s Board of Trustees. If these arrangements are discontinued in the future, the expense ratios may change without shareholder approval. |
| | | | | | | | | | | | | | | | | | |
| | STANDARDIZED AFTER-TAX PERFORMANCE AS OF 6/30/145 | |
| | | Class A Shares | | One Year | | | Five Years | | | Ten Years | | | Since Inception
(4/3/00) | |
| | Returns before taxes* | | | 22.48 | % | | | 18.59 | % | | | 7.12 | % | | | 3.90 | % |
| | Returns after taxes on distributions** | | | 21.97 | | | | 18.35 | | | | 6.98 | | | | 3.79 | |
| | | Returns after taxes on distributions*** and sale of Fund shares | | | 13.07 | | | | 15.14 | | | | 5.77 | | | | 3.12 | |
| | 5 | | The after-tax returns are calculated using the historically highest individual federal marginal income tax rates at the time of distributions (currently 23.8% for qualifying ordinary income dividends and long-term capital gain distributions and 43.4% for non-qualifying ordinary income dividends) and do not reflect state and local taxes. Actual after-tax returns will be calculated at calendar year-end and depend on an investor’s tax situation and may differ from those shown. In addition, the after-tax returns shown are not relevant to investors who hold Fund shares through tax-deferred arrangements such as 401(k) plans or individual retirement accounts. Under certain circumstances, the addition of the tax benefits from capital losses resulting from redemptions may cause the Returns After Taxes on Distributions and Sale of Fund Shares to be greater than the Returns After Taxes on Distributions or even Returns Before Taxes. Standardized after-tax returns assume reinvestment of all distributions at NAV and reflect a maximum initial sales charge of 5.5% for Class A Shares. |
| * | | Returns Before Taxes do not reflect taxes on distributions on the Fund’s Class A Shares nor do they show how performance can be impacted by taxes when shares are redeemed. |
| ** | | Returns After Taxes on Distributions assume that taxes are paid on distributions on the Fund’s Class A Shares (i.e., dividends and capital gains) but do not reflect taxes that may be incurred upon redemption of the Class A Shares at the end of the performance period. |
| *** | | Returns After Taxes on Distributions and Sale of Fund Shares reflect taxes paid on distributions on the Fund’s Class A Shares and taxes applicable when the shares are redeemed. |
20
FUND BASICS
| | | | | | | | |
| | TOP TEN HOLDINGS AS OF 6/30/146 |
| | | Holding | | % of Net Assets | | | Line of Business |
| | Johnson & Johnson | | | 2.3 | % | | Pharmaceuticals, Biotechnology &
Life Sciences |
| | Wells Fargo & Co. | | | 2.0 | | | Banks |
| | Apple, Inc. | | | 1.8 | | | Technology Hardware & Equipment |
| | Pfizer, Inc. | | | 1.8 | | | Pharmaceuticals, Biotechnology &
Life Sciences |
| | JPMorgan Chase & Co. | | | 1.3 | | | Banks |
| | CVS Caremark Corp. | | | 1.3 | | | Food & Staples Retailing |
| | Oracle Corp. | | | 1.3 | | | Software & Services |
| | Micron Technology, Inc. | | | 1.3 | | | Semiconductors & Semiconductor
Equipment |
| | Gilead Sciences, Inc. | | | 1.3 | | | Pharmaceuticals, Biotechnology &
Life Sciences |
| | | ConocoPhillips | | | 1.2 | | | Energy |
| | 6 | | The top 10 holdings may not be representative of the Fund’s future investments. |
|
| FUND VS. BENCHMARK SECTOR ALLOCATIONS7 |
| As of June 30, 2014 |
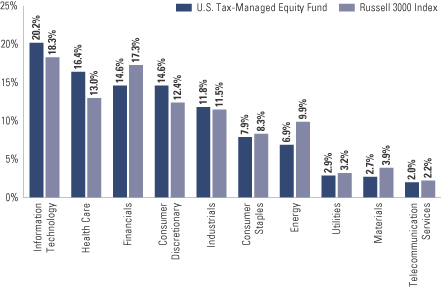
| | 7 | | The Fund is actively managed and, as such, its composition may differ over time. Consequently, the Fund’s overall sector allocations may differ from percentages contained in the graph above. The graph categorizes investments using Global Industry Classification Standard (“GICS”), however, the sector classifications used by the portfolio management team may differ from GICS. The percentage shown for each investment category reflects the value of investments in that category as a percentage of market value (excluding investments in the securities lending reinvestment vehicle, if any). Investments in the securities lending reinvestment vehicle represented 3.9% of the Fund’s net assets at June 30, 2014. The graph depicts the Fund’s investments but may not represent the Fund’s market exposure due to the exclusion of certain derivatives, if any, as listed in the Additional Investment Information section of the Schedule of Investments. |
21
PORTFOLIO RESULTS
International Tax-Managed Equity Fund
Investment Objective
The Fund seeks to provide long-term after-tax growth of capital through tax-sensitive participation in a broadly diversified portfolio of international equity securities.
Portfolio Management Discussion and Analysis
Effective on April 30, 2014, the Goldman Sachs Structured International Tax-Managed Equity Fund was renamed the Goldman Sachs International Tax-Managed Equity Fund (the “Fund”). Below, the Goldman Sachs Quantitative Investment Strategies Team discusses the Fund’s performance and positioning for the six-month period ended June 30, 2014 (the “Reporting Period”).
| Q | | How did the Fund perform during the Reporting Period? |
| A | | During the Reporting Period, the Fund’s Class A, C, Institutional and IR Shares generated cumulative total returns, without sales charges, of 4.79%, 4.32%, 4.95% and 4.91%, respectively. These returns compare to the 4.78% cumulative total return of the Fund’s benchmark, the MSCI EAFE Index (Net, USD, Unhedged) (the “Index”), during the same time period. |
| Q | | What key factors were most responsible for the Fund’s performance during the Reporting Period? |
| A | | During the Reporting Period, most share classes of the Fund outperformed the Index. Our quantitative model, including our investment themes and security selection, contributed positively. |
| Q | | What impact did the Fund’s investment themes have on performance during the Reporting Period? |
| A | | In keeping with our investment approach, we use our quantitative model and its six investment themes to take a long-term view of market patterns and look for inefficiencies, selecting stocks for the Fund and overweighting or underweighting the ones chosen by the model. Over time and by design, the performance of any one of the model’s investment themes tends to have a low correlation with the model’s other themes, demonstrating the diversification benefit of the Fund’s theme-driven quantitative model. The variance in performance supports our research indicating that the diversification provided by the Fund’s different investment themes may be significant investment advantage over the long term, even though the Fund may experience underperformance in the short term. Of course, diversification does not protect an investor from market risk nor does it ensure a profit. |
| | | During the Reporting Period, all six of our investment themes — Momentum, Sentiment, Profitability, Valuation, Quality and Management — contributed positively to the Fund’s relative performance. Momentum seeks to predict drifts in stock prices caused by delayed investor reaction to company-specific information and information about related companies. Sentiment reflects selected investment views and decisions of individuals and financial intermediaries, while the Profitability theme assesses whether a company is earning more than its cost of capital. Valuation attempts to capture potential mispricings of securities, typically by comparing a measure of the company’s intrinsic value to its market value. Our Quality theme seeks to assess both firm and management quality. The Management theme assesses the characteristics, policies and strategic decisions of company management. |
| Q | | How did the Fund sector and industry allocations affect relative performance? |
| A | | In constructing the Fund’s portfolio, we focus on picking stocks rather than on making sector or industry bets. Consequently, the Fund is similar to the Index in terms of its sector and industry allocations and its style. Changes in its sector or industry weights generally do not have a meaningful impact on relative performance. |
| Q | | How successful was your stock selection during the Reporting Period? |
| A | | The Fund seeks to provide investors with a tax-efficient means for maintaining broadly diversified exposure to the entire EAFE equity market. During the Reporting Period, security selection added to the Fund’s relative returns. |
22
PORTFOLIO RESULTS
| Q | | Among individual holdings, which stocks contributed most to the Fund’s results? |
| A | | Stock picks in the industrials, health care and information technology sectors added most to relative results. The Fund benefited from overweighted positions in Shire, an Irish- headquartered global specialty biopharmaceutical company; Celesio, a German health care and pharmaceutical company; and Vestas Wind Systems, a Danish manufacturer of wind turbines. We chose to overweight Shire because of our positive views on Momentum and Sentiment. The Fund was overweight Celesio and Vestas Wind Systems as a result of our positive views on Momentum and Valuation. |
| Q | | Which individual stock holdings detracted significantly from relative performance during the Reporting Period? |
| A | | Our stock selection in the consumer discretionary, materials and energy sectors detracted most from relative performance. The Fund was hindered by its overweighted positions in Arrium, an Australian mining and materials company; Deutsche Lufthansa, a German airline; and Amadeus IT Group, a Spanish transaction processor for the travel and tourism industry. We adopted the overweight in Arrium as a result of our positive views on Valuation and Momentum. The Fund was overweight Deutsche Lufthansa due to our positive views on Valuation and Quality. We assumed the overweight in Amadeus IT Group because of our positive views on Sentiment and Management. |
| Q | | How did the Fund use derivatives and similar instruments during the Reporting Period? |
| A | | During the Reporting Period, we did not use derivatives as part of an active management strategy to add value to the Fund’s results. However, we used equity index futures, on an opportunistic basis, to equitize the Fund’s excess cash holdings. In other words, we put the Fund’s excess cash holdings to work by using them as collateral for the purchase of equity index futures. |
| Q | | What changes or enhancements did you make to your quantitative model during the Reporting Period? |
| A | | We made no enhancements to our quantitative model in the first quarter of 2014. In the second quarter of 2014, we implemented an enhancement to our Sentiment theme, using natural language processing to analyze earnings call transcripts and research analyst reports every quarter. We read through the entirety of each company’s latest earnings call transcript, identifying key words and phrases that capture the underlying tone of the management team. We believe this provides us with better insight into management’s perception of their company. In addition, we enhanced our ability to identify groups of related companies within our global linkages theme. We read through hundreds of research analyst reports on a daily basis to identify groups of companies related to commonly trending investment topics in the market. |
| Q | | How was the Fund positioned relative to the Index at the end of the Reporting Period? |
| A | | In constructing the Fund’s portfolio, we focus on picking stocks rather than on country weightings. Consequently, the Fund is similar to the Index in terms of its sector and country allocations. That said, at the end of the Reporting Period, the Fund was overweight the energy, health care, industrials and utilities sectors relative to the Index. It was underweight the consumer discretionary, telecommunication services, materials, consumer staples and financials sectors. The Fund was relatively neutrally weighted compared to the Index in the information technology sector at the end of the Reporting Period. |
| | | At the end of the Reporting Period, the Fund was overweight relative to the Index in France, Australia, Norway, Spain, Singapore, Finland and Sweden. Compared to the Index, it was underweight the U.K., Switzerland, Denmark, Germany, the Netherlands, Israel, Japan, Ireland and Belgium. The Fund was relatively neutrally weighted relative to the Index in Hong Kong, Italy, Austria, Portugal and New Zealand at the end of the Reporting Period. |
23
FUND BASICS
International Tax-Managed Equity Fund
as of June 30, 2014
| | | | | | | | | | |
| | PERFORMANCE REVIEW | |
| | | January 1, 2014–June 30, 2014 | | Fund Total Return
(based on NAV)1 | | | MSCI EAFE (net) Index
(unhedged)2 | |
| | Class A | | | 4.79 | % | | | 4.78 | % |
| | Class C | | | 4.32 | | | | 4.78 | |
| | Institutional | | | 4.95 | | | | 4.78 | |
| | | Class IR | | | 4.91 | | | | 4.78 | |
| | 1 | | The net asset value (“NAV”) represents the net assets of the class of the Fund (ex-dividend) divided by the total number of shares of the class outstanding. The Fund’s performance reflects the reinvestment of dividends and other distributions. The Fund’s performance does not reflect the deduction of any applicable sales charges. |
| | 2 | | The unmanaged MSCI EAFE Index (net, unhedged and net of dividend withholding taxes) is a market capitalization-weighted composite of securities in 22 developed markets. The Index figures do not include any deduction for fees or expenses. It is not possible to invest directly in an index. |
| | | | | | | | | | | | | | | | |
| | STANDARDIZED TOTAL RETURNS3 |
| | | For the period ended 6/30/14 | | One Year | | | Five Years | | | Since Inception | | | Inception Date |
| | Class A | | | 15.92 | % | | | 10.23 | % | | | 0.54 | % | | 1/31/08 |
| | Class C | | | 20.61 | | | | 10.62 | | | | 0.67 | | | 1/31/08 |
| | Institutional | | | 23.09 | | | | 11.92 | | | | 1.83 | | | 1/31/08 |
| | | Class IR | | | 22.91 | | | | N/A | | | | 12.15 | | | 8/31/10 |
| | 3 | | The Standardized Total Returns are average annual total returns as of the most recent calendar quarter-end. They assume reinvestment of all distributions at NAV. These returns reflect a maximum initial sales charge of 5.5% for Class A Shares and the assumed contingent deferred sales charge for Class C Shares (1% if redeemed within 12 months of purchase). Because Institutional and Class IR Shares do not involve a sales charge, such a charge is not applied to their Standardized Total Returns. |
The returns set forth in the tables above represent past performance. Past performance does not guarantee future results. The Fund’s investment return and principal value will fluctuate so that an investor’s shares, when redeemed, may be worth more or less than their original cost. Current performance may be lower or higher than the performance quoted above. Please visit our web site at www.GSAMFUNDS.com to obtain the most recent month-end returns. Performance reflects applicable fee waivers and/or expense limitations in effect during the periods shown. In their absence, performance would be reduced. Returns do not reflect the deduction of taxes that a shareholder would pay on Fund distributions or the redemption of Fund shares.
24
FUND BASICS
| | | | | | | | | | |
| | EXPENSE RATIOS4 | |
| | | | | Net Expense Ratio (Current) | | | Gross Expense Ratio (Before Waivers) | |
| | Class A | | | 1.38 | % | | | 1.48 | % |
| | Class C | | | 2.13 | | | | 2.23 | |
| | Institutional | | | 0.98 | | | | 1.08 | |
| | | Class IR | | | 1.13 | | | | 1.23 | |
| | 4 | | The expense ratios of the Fund, both current (net of applicable fee waivers and/or expense limitations) and before waivers (gross of applicable fee waivers and/or expense limitations) are as set forth above according to the most recent publicly available Prospectus for the Fund and may differ from the expense ratios disclosed in the Financial Highlights in this report. The Fund’s waivers and/or expense limitations will remain in place through at least April 30, 2015, and prior to such date the Investment Adviser may not terminate the arrangements without the approval of the Fund’s Board of Trustees. If these arrangements are discontinued in the future, the expense ratios may change without shareholder approval. |
| | | | | | | | | | | | | | |
| | STANDARDIZED AFTER-TAX PERFORMANCE AS OF 6/30/135 | |
| | | Class A Shares | | One Year | | | Five Years | | | Since Inception
(1/31/08) | |
| | Returns before taxes* | | | 15.92 | % | | | 10.23 | % | | | 0.54 | % |
| | Returns after taxes on distributions** | | | 15.54 | | | | 9.94 | | | | 0.28 | |
| | | Returns after taxes on distributions***
and sale of Fund shares | | | 9.31 | | | | 8.25 | | | | 0.51 | |
| | 5 | | The after-tax returns are calculated using the historically highest individual federal marginal income tax rates at the time of distributions (currently 23.8% for qualifying ordinary income dividends and long-term capital gain distributions and 43.4% for non-qualifying ordinary income dividends) and do not reflect state and local taxes. Actual after-tax returns will be calculated at calendar year-end and depend on an investor’s tax situation and may differ from those shown. In addition, the after-tax returns shown are not relevant to investors who hold Fund shares through tax-deferred arrangements such as 401(k) plans or individual retirement accounts. Under certain circumstances, the addition of the tax benefits from capital losses resulting from redemptions may cause the Returns After Taxes on Distributions and Sale of Fund Shares to be greater than the Returns After Taxes on Distributions or even Returns Before Taxes. Standardized after-tax returns assume reinvestment of all distributions at NAV and reflect a maximum initial sales charge of 5.5% for Class A Shares. |
| | * | | Returns Before Taxes do not reflect taxes on distributions on the Fund’s Class A Shares nor do they show how performance can be impacted by taxes when shares are redeemed. |
| | ** | | Returns After Taxes on Distributions assume that taxes are paid on distributions on the Fund’s Class A Shares (i.e., dividends and capital gains) but do not reflect taxes that may be incurred upon redemption of the Class A Shares at the end of the performance period. |
| *** | | Returns After Taxes on Distributions and Sale of Fund Shares reflect taxes paid on distributions on the Fund’s Class A Shares and taxes applicable when the shares are redeemed. |
25
FUND BASICS
| | | | | | | | |
| | TOP TEN HOLDINGS AS OF 6/30/146 |
| | | Holding | | % of Total
Net Assets | | | Line of Business |
| | Total SA | | | 1.6 | % | | Energy |
| | HSBC Holdings PLC | | | 1.5 | | | Banks |
| | BP PLC ADR | | | 1.4 | | | Energy |
| | British American Tobacco PLC | | | 1.3 | | | Food, Beverage & Tobacco |
| | Roche Holding AG | | | 1.3 | | | Pharmaceuticals, Biotechnology &
Life Sciences |
| | Legrand SA | | | 1.2 | | | Capital Goods |
| | Amadeus IT Holding SA Class A | | | 1.2 | | | Software & Services |
| | Royal Dutch Shell PLC Class A | | | 1.2 | | | Energy |
| | BHP Billiton Ltd. | | | 1.2 | | | Materials |
| | | Australia & New Zealand Banking Group Ltd. | | | 1.1 | | | Banks |
| | 6 | | The top 10 holdings may not be representative of the Fund’s future investments. |
|
| FUND VS. BENCHMARK SECTOR ALLOCATIONS7 |
| As of June 30, 2014 |
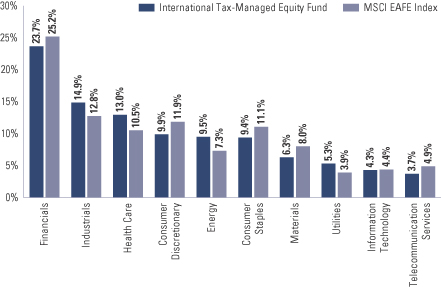
| | 7 | | The Fund is actively managed and, as such, its composition may differ over time. Consequently, the Fund’s overall sector allocations may differ from percentages contained in the graph above. The graph categorizes investments using Global Industry Classification Standard (“GICS”), however, the sector classifications used by the portfolio management team may differ from GICS. The percentage shown for each investment category reflects the value of investments in that category as a percentage of market value (excluding investments in the securities lending reinvestment vehicle, if any). Investments in the securities lending reinvestment vehicle represented 1.1% of the Fund’s net assets at June 30, 2014. The graph depicts the Fund’s investments but may not represent the Fund’s market exposure due to the exclusion of certain derivatives, if any, as listed in the Additional Investment Information section of the Schedule of Investments. |
26
FUND BASICS
Index Definitions:
The Russell 2000® Index measures the performance of the small-cap segment of the U.S. equity universe. The Russell 2000® Index is a subset of the Russell 3000® Index representing approximately 10% of the total market capitalization of that index.
The Russell 1000® Index measures the performance of the large-cap segment of the U.S. equity universe. It is a subset of the Russell 3000® Index and includes approximately 1000 of the largest securities based on a combination of their market cap and current index membership.
The Russell Midcap® Index measures the performance of the mid-cap segment of the U.S. equity universe. The Russell Midcap® Index is a subset of the Russell 1000® Index. It includes approximately 800 of the smallest securities based on a combination of their market cap and current index membership.
All index figures do not reflect any deduction for fees, expenses or taxes. It is not possible to invest directly in an unmanaged index.
27
GOLDMAN SACHS U.S. EQUITY DIVIDEND AND PREMIUM FUND
Schedule of Investments
June 30, 2014 (Unaudited)
| | | | | | | | |
| Shares | | | Description | |
Value | |
| | | | | | | | |
| | Common Stocks – 98.3% | |
| | Automobiles & Components – 1.7% | |
| | 541,400 | | | Ford Motor Co.(a) | | $ | 9,333,736 | |
| | 273,800 | | | General Motors Co. | | | 9,938,940 | |
| | 900 | | | Gentex Corp. | | | 26,181 | |
| | 86,600 | | | Johnson Controls, Inc. | | | 4,323,938 | |
| | | | | | | | |
| | | | | | | 23,622,795 | |
| | |
| | Banks – 5.9% | |
| | 293,181 | | | Bank of America Corp. | | | 4,506,192 | |
| | 2,000 | | | Bank of Hawaii Corp. | | | 117,380 | |
| | 179,400 | | | Citigroup, Inc. | | | 8,449,740 | |
| | 800 | | | East West Bancorp, Inc. | | | 28,004 | |
| | 93,800 | | | First Niagara Financial Group, Inc. | | | 819,812 | |
| | 350,200 | | | JPMorgan Chase & Co.(a) | | | 20,178,524 | |
| | 1,053,300 | | | New York Community Bancorp, Inc.(b) | | | 16,831,734 | |
| | 100,300 | | | U.S. Bancorp | | | 4,345,006 | |
| | 476,600 | | | Wells Fargo & Co.(a) | | | 25,050,096 | |
| | | | | | | | |
| | | | | | | 80,326,488 | |
| | |
| | Capital Goods – 8.2% | |
| | 120,000 | | | 3M Co. | | | 17,188,800 | |
| | 2,200 | | | Allison Transmission Holdings, Inc. | | | 68,420 | |
| | 38,800 | | | Caterpillar, Inc. | | | 4,216,396 | |
| | 3,700 | | | Crane Co. | | | 275,132 | |
| | 182,400 | | | Eaton Corp. PLC | | | 14,077,632 | |
| | 86,900 | | | Emerson Electric Co. | | | 5,766,684 | |
| | 2,600 | | | Exelis, Inc. | | | 44,148 | |
| | 15,700 | | | Fortune Brands Home & Security, Inc. | | | 626,901 | |
| | 1,241,850 | | | General Electric Co.(a) | | | 32,635,818 | |
| | 3,500 | | | Graco, Inc. | | | 273,280 | |
| | 45,300 | | | Honeywell International, Inc. | | | 4,210,635 | |
| | 3,200 | | | IDEX Corp. | | | 258,368 | |
| | 900 | | | ITT Corp. | | | 43,290 | |
| | 125,200 | | | Lockheed Martin Corp. | | | 20,123,396 | |
| | 1,000 | | | Oshkosh Corp. | | | 55,530 | |
| | 2,500 | | | SPX Corp. | | | 270,525 | |
| | 3,600 | | | Terex Corp. | | | 147,960 | |
| | 84,200 | | | The Boeing Co.(a) | | | 10,712,766 | |
| | 2,400 | | | The Timken Co. | | | 162,816 | |
| | | | | | | | |
| | | | | | | 111,158,497 | |
| | |
| | Commercial & Professional Services – 0.6% | |
| | 493,700 | | | R.R. Donnelley & Sons Co. | | | 8,373,152 | |
| | |
| | Consumer Durables & Apparel – 0.6% | |
| | 68,300 | | | Garmin Ltd. | | | 4,159,470 | |
| | 110,200 | | | Leggett & Platt, Inc. | | | 3,777,656 | |
| | | | | | | | |
| | | | | | | 7,937,126 | |
| | |
| | Consumer Services – 2.3% | |
| | 78,400 | | | Darden Restaurants, Inc. | | | 3,627,568 | |
| | 53,700 | | | Las Vegas Sands Corp. | | | 4,093,014 | |
| | 96,600 | | | McDonald’s Corp. | | | 9,731,484 | |
| | 23,800 | | | Royal Caribbean Cruises Ltd. | | | 1,323,280 | |
| | |
| | | | | | | | |
| | Common Stocks – (continued) | |
| | Consumer Services – (continued) | |
| | 82,300 | | | Six Flags Entertainment Corp. | | $ | 3,501,865 | |
| | 59,900 | | | Starwood Hotels & Resorts Worldwide, Inc. | | | 4,841,118 | |
| | 21,600 | | | Wynn Resorts Ltd. | | | 4,483,296 | |
| | | | | | | | |
| | | | | | | 31,601,625 | |
| | |
| | Diversified Financials – 3.7% | |
| | 47,800 | | | Ameriprise Financial, Inc.(a) | | | 5,736,000 | |
| | 23,000 | | | Artisan Partners Asset Management, Inc. Class A | | | 1,303,640 | |
| | 48,100 | | | BlackRock, Inc.(a) | | | 15,372,760 | |
| | 109,300 | | | CME Group, Inc. | | | 7,754,835 | |
| | 6,600 | | | Eaton Vance Corp. | | | 249,414 | |
| | 159,200 | | | Federated Investors, Inc. Class B | | | 4,922,464 | |
| | 149,300 | | | Invesco Ltd. | | | 5,636,075 | |
| | 1,000 | | | LPL Financial Holdings, Inc. | | | 49,740 | |
| | 125,200 | | | Morgan Stanley | | | 4,047,716 | |
| | 44,000 | | | Santander Consumer USA Holdings, Inc. | | | 855,360 | |
| | 23,000 | | | TD Ameritrade Holding Corp. | | | 721,050 | |
| | 43,900 | | | Waddell & Reed Financial, Inc. Class A | | | 2,747,701 | |
| | | | | | | | |
| | | | | | | 49,396,755 | |
| | |
| | Energy – 11.1% | |
| | 162,600 | | | Chevron Corp.(b) | | | 21,227,430 | |
| | 136,200 | | | ConocoPhillips | | | 11,676,426 | |
| | 120,400 | | | CVR Energy, Inc. | | | 5,802,076 | |
| | 200,900 | | | Diamond Offshore Drilling, Inc.(a) | | | 9,970,667 | |
| | 222,100 | | | Ensco PLC Class A | | | 12,342,097 | |
| | 220,100 | | | Exxon Mobil Corp.(a) | | | 22,159,668 | |
| | 33,100 | | | Golar LNG Ltd. | | | 1,989,310 | |
| | 28,500 | | | HollyFrontier Corp. | | | 1,245,165 | |
| | 284,500 | | | Kinder Morgan, Inc. | | | 10,315,970 | |
| | 67,200 | | | Occidental Petroleum Corp. | | | 6,896,736 | |
| | 44,900 | | | PBF Energy, Inc. Class A | | | 1,196,585 | |
| | 46,000 | | | Phillips 66 | | | 3,699,780 | |
| | 375,100 | | | Seadrill Ltd. | | | 14,985,245 | |
| | 283,800 | | | The Williams Companies, Inc. | | | 16,519,998 | |
| | 181,100 | | | Transocean Ltd. | | | 8,154,933 | |
| | 45,700 | | | Valero Energy Corp. | | | 2,289,570 | |
| | | | | | | | |
| | | | | | | 150,471,656 | |
| | |
| | Food & Staples Retailing – 1.0% | |
| | 112,900 | | | Walgreen Co. | | | 8,369,277 | |
| | 63,400 | | | Wal-Mart Stores, Inc. | | | 4,759,438 | |
| | | | | | | | |
| | | | | | | 13,128,715 | |
| | |
| | Food, Beverage & Tobacco – 5.0% | |
| | 249,000 | | | Altria Group, Inc.(a) | | | 10,443,060 | |
| | 273,500 | | | Kraft Foods Group, Inc. | | | 16,396,325 | |
| | 168,800 | | | PepsiCo, Inc. | | | 15,080,592 | |
| | 80,800 | | | Philip Morris International, Inc. | | | 6,812,248 | |
| | 200 | | | Pinnacle Foods, Inc. | | | 6,580 | |
| | |
| | |
| 28 | | The accompanying notes are an integral part of these financial statements. |
GOLDMAN SACHS U.S. EQUITY DIVIDEND AND PREMIUM FUND
| | | | | | | | |
| Shares | | | Description | |
Value | |
| | | | | | | | |
| | Common Stocks – (continued) | |
| | Food, Beverage & Tobacco – (continued) | |
| | 68,600 | | | Reynolds American, Inc. | | $ | 4,140,010 | |
| | 356,900 | | | The Coca-Cola Co.(a) | | | 15,118,284 | |
| | | | | | | | |
| | | | | | | 67,997,099 | |
| | |
| | Health Care Equipment & Services – 2.9% | |
| | 261,000 | | | Abbott Laboratories(a)(b) | | | 10,674,900 | |
| | 46,400 | | | Baxter International, Inc. | | | 3,354,720 | |
| | 82,300 | | | Cardinal Health, Inc. | | | 5,642,488 | |
| | 53,300 | | | Covidien PLC | | | 4,806,594 | |
| | 139,300 | | | Medtronic, Inc. | | | 8,881,768 | |
| | 70,800 | | | UnitedHealth Group, Inc. | | | 5,787,900 | |
| | | | | | | | |
| | | | | | | 39,148,370 | |
| | |
| | Household & Personal Products – 2.5% | |
| | 200 | | | Herbalife Ltd. | | | 12,908 | |
| | 74,100 | | | Kimberly-Clark Corp. | | | 8,241,402 | |
| | 6,500 | | | Nu Skin Enterprises, Inc. Class A | | | 480,740 | |
| | 325,200 | | | The Procter & Gamble Co.(a) | | | 25,557,468 | |
| | | | | | | | |
| | | | | | | 34,292,518 | |
| | |
| | Insurance – 4.3% | |
| | 105,000 | | | American International Group, Inc. | | | 5,730,900 | |
| | 2,500 | | | Arthur J. Gallagher & Co. | | | 116,500 | |
| | 209,100 | | | Mercury General Corp. | | | 9,836,064 | |
| | 280,500 | | | MetLife, Inc. | | | 15,584,580 | |
| | 662,700 | | | Old Republic International Corp.(a) | | | 10,961,058 | |
| | 300 | | | Protective Life Corp. | | | 20,799 | |
| | 166,600 | | | Prudential Financial, Inc.(a) | | | 14,789,082 | |
| | 19,800 | | | StanCorp Financial Group, Inc. | | | 1,267,200 | |
| | | | | | | | |
| | | | | | | 58,306,183 | |
| | |
| | Materials – 3.3% | |
| | 12,800 | | | Domtar Corp. | | | 548,480 | |
| | 87,400 | | | E.I. du Pont de Nemours & Co. | | | 5,719,456 | |
| | 294,500 | | | Freeport-McMoRan Copper & Gold, Inc. | | | 10,749,250 | |
| | 80,500 | | | International Paper Co. | | | 4,062,835 | |
| | 67,800 | | | LyondellBasell Industries NV Class A | | | 6,620,670 | |
| | 20,000 | | | Packaging Corp. of America | | | 1,429,800 | |
| | 2,400 | | | Rockwood Holdings, Inc. | | | 182,376 | |
| | 13,100 | | | Royal Gold, Inc. | | | 997,202 | |
| | 285,200 | | | The Dow Chemical Co.(a) | | | 14,676,392 | |
| | 2,800 | | | The Scotts Miracle-Gro Co. Class A | | | 159,208 | |
| | | | | | | | |
| | | | | | | 45,145,669 | |
| | |
| | Media – 3.5% | |
| | 224,200 | | | Cablevision Systems Corp. Class A(a) | | | 3,957,130 | |
| | 16,900 | | | CBS Outdoor Americas, Inc. | | | 552,292 | |
| | 4,800 | | | Cinemark Holdings, Inc. | | | 169,728 | |
| | 225,400 | | | Comcast Corp. Class A | | | 12,094,467 | |
| | 15,000 | | | Lamar Advertising Co. Class A | | | 795,000 | |
| | 78,800 | | | Regal Entertainment Group Class A | | | 1,662,680 | |
| | 92,500 | | | The Walt Disney Co. | | | 7,930,950 | |
| | 199,500 | | | Thomson Reuters Corp. | | | 7,253,820 | |
| | |
| | | | | | | | |
| | Common Stocks – (continued) | |
| | Media – (continued) | |
| | 54,100 | | | Time Warner Cable, Inc. | | $ | 7,968,930 | |
| | 60,700 | | | Time Warner, Inc. | | | 4,264,199 | |
| | | | | | | | |
| | | | | | | 46,649,196 | |
| | |
| | Pharmaceuticals, Biotechnology & Life Sciences – 9.5% | |
| | 220,100 | | | AbbVie, Inc.(a) | | | 12,422,444 | |
| | 700 | | | Alkermes PLC* | | | 35,231 | |
| | 6,400 | | | Alnylam Pharmaceuticals, Inc.* | | | 404,288 | |
| | 89,700 | | | Amgen, Inc. | | | 10,617,789 | |
| | 27,200 | | | Biogen Idec, Inc.* | | | 8,576,432 | |
| | 292,500 | | | Bristol-Myers Squibb Co. | | | 14,189,175 | |
| | 64,600 | | | Celgene Corp.* | | | 5,547,848 | |
| | 258,600 | | | Eli Lilly & Co. | | | 16,077,162 | |
| | 45,100 | | | Gilead Sciences, Inc.* | | | 3,739,241 | |
| | 23,500 | | | Incyte Corp. Ltd.* | | | 1,326,340 | |
| | 600 | | | Intercept Pharmaceuticals, Inc.* | | | 141,978 | |
| | 236,600 | | | Johnson & Johnson | | | 24,753,092 | |
| | 1,800 | | | Medivation, Inc.* | | | 138,744 | |
| | 221,050 | | | Merck & Co., Inc. | | | 12,787,743 | |
| | 561,800 | | | Pfizer, Inc.(a) | | | 16,674,224 | |
| | 3,000 | | | Pharmacyclics, Inc.* | | | 269,130 | |
| | 2,200 | | | Seattle Genetics, Inc.* | | | 84,150 | |
| | | | | | | | |
| | | | | | | 127,785,011 | |
| | |
| | Real Estate Investment Trust – 2.1% | |
| | 26,100 | | | American Realty Capital Properties, Inc. | | | 327,033 | |
| | 70,400 | | | American Tower Corp. | | | 6,334,611 | |
| | 50,600 | | | Crown Castle International Corp. | | | 3,757,556 | |
| | 38,500 | | | Duke Realty Corp. | | | 699,160 | |
| | 15,000 | | | Extra Space Storage, Inc. | | | 798,772 | |
| | 138,600 | | | Prologis, Inc. | | | 5,695,074 | |
| | 31,100 | | | Simon Property Group, Inc. | | | 5,171,308 | |
| | 1,400 | | | SL Green Realty Corp. | | | 153,241 | |
| | 14,700 | | | Washington Prime Group, Inc.* | | | 275,478 | |
| | 156,900 | | | Weyerhaeuser Co. | | | 5,191,821 | |
| | | | | | | | |
| | | | | | | 28,404,054 | |
| | |
| | Retailing – 3.6% | |
| | 33,800 | | | Amazon.com, Inc.*(a) | | | 10,977,564 | |
| | 1,900 | | | DSW, Inc. Class A | | | 53,086 | |
| | 2,500 | | | Foot Locker, Inc. | | | 126,800 | |
| | 79,600 | | | L Brands, Inc. | | | 4,669,336 | |
| | 105,200 | | | Lowe’s Companies, Inc. | | | 5,048,548 | |
| | 7,200 | | | Netflix, Inc.* | | | 3,172,320 | |
| | 2,600 | | | Penske Automotive Group, Inc. | | | 128,700 | |
| | 59,300 | | | Target Corp. | | | 3,436,435 | |
| | 157,000 | | | The Home Depot, Inc. | | | 12,710,720 | |
| | 6,500 | | | The Priceline Group, Inc.* | | | 7,819,500 | |
| | | | | | | | |
| | | | | | | 48,143,009 | |
| | |
| | Semiconductors & Semiconductor Equipment – 2.8% | |
| | 43,900 | | | Avago Technologies Ltd. | | | 3,163,873 | |
| | 445,400 | | | Intel Corp. | | | 13,762,860 | |
| | 161,500 | | | Maxim Integrated Products, Inc. | | | 5,460,315 | |
| | |
| | |
| The accompanying notes are an integral part of these financial statements. | | 29 |
GOLDMAN SACHS U.S. EQUITY DIVIDEND AND PREMIUM FUND
Schedule of Investments (continued)
June 30, 2014 (Unaudited)
| | | | | | | | |
| Shares | | | Description | |
Value | |
| | | | | | | | |
| | Common Stocks – (continued) | |
| | Semiconductors & Semiconductor Equipment – (continued) | |
| | 3,900 | | | Skyworks Solutions, Inc. | | $ | 183,144 | |
| | 307,700 | | | Texas Instruments, Inc. | | | 14,704,983 | |
| | | | | | | | |
| | | | | | | 37,275,175 | |
| | |
| | Software & Services – 9.5% | |
| | 57,600 | | | Accenture PLC Class A | | | 4,656,384 | |
| | 126,600 | | | Automatic Data Processing, Inc.(a)(b) | | | 10,036,848 | |
| | 7,100 | | | Broadridge Financial Solutions, Inc. | | | 295,644 | |
| | 330,200 | | | CA, Inc. | | | 9,489,948 | |
| | 100 | | | CoStar Group, Inc.* | | | 15,817 | |
| | 157,200 | | | Facebook, Inc. Class A* | | | 10,577,988 | |
| | 14,700 | | | Google, Inc. Class A* | | | 8,594,649 | |
| | 14,700 | | | Google, Inc. Class C* | | | 8,456,616 | |
| | 43,400 | | | International Business Machines Corp. | | | 7,867,118 | |
| | 6,400 | | | Leidos Holdings, Inc. | | | 245,376 | |
| | 4,400 | | | LinkedIn Corp. Class A* | | | 754,468 | |
| | 71,000 | | | Mastercard, Inc. Class A | | | 5,216,370 | |
| | 750,950 | | | Microsoft Corp.(a)(b) | | | 31,314,615 | |
| | 6,000 | | | NetSuite, Inc.* | | | 521,280 | |
| | 211,900 | | | Oracle Corp. | | | 8,588,307 | |
| | 38,000 | | | Pandora Media, Inc.* | | | 1,121,000 | |
| | 294,100 | | | Paychex, Inc. | | | 12,222,796 | |
| | 11,400 | | | ServiceNow, Inc.* | | | 706,344 | |
| | 10,300 | | | Splunk, Inc.* | | | 569,899 | |
| | 33,500 | | | Visa, Inc. Class A | | | 7,058,785 | |
| | 3,900 | | | Workday, Inc. Class A* | | | 350,454 | |
| | 4,700 | | | Yelp, Inc.* | | | 360,396 | |
| | | | | | | | |
| | | | | | | 129,021,102 | |
| | |
| | Technology Hardware & Equipment – 5.6% | |
| | 527,200 | | | Apple, Inc.(a)(b) | | | 48,992,696 | |
| | 7,400 | | | AVX Corp. | | | 98,272 | |
| | 294,100 | | | Cisco Systems, Inc. | | | 7,308,385 | |
| | 72,000 | | | Hewlett-Packard Co. | | | 2,424,960 | |
| | 151,400 | | | QUALCOMM, Inc. | | | 11,990,880 | |
| | 78,400 | | | Seagate Technology PLC | | | 4,454,688 | |
| | | | | | | | |
| | | | | | | 75,269,881 | |
| | |
| | Telecommunication Services – 3.5% | |
| | 427,528 | | | AT&T, Inc.(a) | | | 15,117,390 | |
| | 321,900 | | | CenturyLink, Inc. | | | 11,652,780 | |
| | 713,801 | | | Frontier Communications Corp. | | | 4,168,598 | |
| | 1,576,100 | | | Windstream Holdings, Inc. | | | 15,697,956 | |
| | | | | | | | |
| | | | | | | 46,636,724 | |
| | |
| | Transportation – 1.2% | |
| | 77,300 | | | Delta Air Lines, Inc. | | | 2,993,056 | |
| | 44,500 | | | Union Pacific Corp. | | | 4,438,875 | |
| | 600 | | | United Continental Holdings, Inc.* | | | 24,642 | |
| | 78,600 | | | United Parcel Service, Inc. Class B | | | 8,069,076 | |
| | | | | | | | |
| | | | | | | 15,525,649 | |
| | |
| | | | | | | | |
| | Common Stocks – (continued) | |
| | Utilities – 3.9% | |
| | 157,000 | | | Ameren Corp.(a) | | $ | 6,418,160 | |
| | 238,000 | | | Duke Energy Corp.(a) | | | 17,657,220 | |
| | 38,900 | | | Entergy Corp. | | | 3,193,301 | |
| | 142,300 | | | PPL Corp. | | | 5,055,919 | |
| | 472,400 | | | TECO Energy, Inc. | | | 8,729,952 | |
| | 259,900 | | | The Southern Co. | | | 11,794,262 | |
| | | | | | | | |
| | | | | | | 52,848,814 | |
| | |
| | TOTAL INVESTMENTS – 98.3% | |
| | (Cost $1,127,253,189) | | $ | 1,328,465,263 | |
| | |
| OTHER ASSETS IN EXCESS OF
LIABILITIES – 1.7% | | | 23,332,940 | |
| | |
| | NET ASSETS – 100.0% | | $ | 1,351,798,203 | |
| | |
| | |
| The percentage shown for each investment category reflects the value of investments in that category as a percentage of net assets. |
* | | Non-income producing security. |
(a) | | All or a portion of this security is held as collateral for call options written. |
(b) | | All or a portion of security is segregated as collateral for initial margin requirements on futures transactions. |
| | |
| 30 | | The accompanying notes are an integral part of these financial statements. |
GOLDMAN SACHS U.S. EQUITY DIVIDEND AND PREMIUM FUND
|
| ADDITIONAL INVESTMENT INFORMATION |
FUTURES CONTRACTS — At June 30, 2014, the Fund had the following futures contracts:
| | | | | | | | | | | | | | |
| Type | | Number of
Contracts
Long (Short) | | | Expiration Date | | Current
Value | | | Unrealized
Gain (Loss) | |
S&P 500 E-mini Index | | | 301 | | | September 2014 | | $ | 29,383,620 | | | $ | 280,340 | |
WRITTEN OPTIONS CONTRACTS — At June 30, 2014, the Fund had the following written options:
| | | | | | | | | | | | | | |
| Call Options | | Number of
Contracts | | | Exercise
Rate | | | Expiration Month | | Value | |
S&P 500 Index | | | 2,739 | | | $ | 1,975 | | | September 2014 | | $ | (8,340,255 | ) |
(Premiums Received $8,208,783) | | | | | | | | | | | | | | |
For the six months ended June 30, 2014, the Fund had the following written options activity:
| | | | | | | | |
| | | Number of
Contracts | | | Premiums
Received | |
Contracts Outstanding December 31, 2013 | | | 2,799 | | | $ | 8,758,071 | |
Contracts written | | | 5,406 | | | | 16,500,486 | |
Contracts bought to close | | | (5,466 | ) | | | (17,049,774 | ) |
Contracts Outstanding June 30, 2014 | | | 2,739 | | | $ | 8,208,783 | |
| | |
| The accompanying notes are an integral part of these financial statements. | | 31 |
GOLDMAN SACHS INTERNATIONAL EQUITY DIVIDEND AND PREMIUM FUND
Schedule of Investments
June 30, 2014 (Unaudited)
| | | | | | | | |
Shares | | | Description | | Value | |
| | | | | | | | |
| | Common Stocks – 97.1% | | | | |
| | Australia – 8.3% | | | | |
| | 192,223 | | | ALS Ltd. (Commercial & Professional Services) | | $ | 1,605,654 | |
| | 413,064 | | | AMP Ltd. (Insurance) | | | 2,064,845 | |
| | 203,991 | | | Australia & New Zealand Banking Group Ltd. (Banks) | | | 6,414,396 | |
| | 93,218 | | | Bendigo and Adelaide Bank Ltd. (Banks) | | | 1,072,466 | |
| | 136,327 | | | BHP Billiton Ltd. (Materials) | | | 4,649,386 | |
| | 136,650 | | | Coca-Cola Amatil Ltd. (Food, Beverage & Tobacco) | | | 1,220,142 | |
| | 30,550 | | | Computershare Ltd. (Software & Services) | | | 359,578 | |
| | 333,637 | | | Dexus Property Group (REIT) | | | 349,192 | |
| | 157,650 | | | Federation Centres Ltd. (REIT) | | | 369,973 | |
| | 246,309 | | | GPT Group (REIT) | | | 892,026 | |
| | 25,529 | | | Iluka Resources Ltd. (Materials) | | | 196,163 | |
| | 351,943 | | | Incitec Pivot Ltd. (Materials) | | | 962,195 | |
| | 1,131,767 | | | Metcash Ltd. (Food & Staples Retailing) | | | 2,817,407 | |
| | 223,807 | | | National Australia Bank Ltd. (Banks) | | | 6,917,598 | |
| | 36,132 | | | Orica Ltd. (Materials) | | | 663,614 | |
| | 10,587 | | | Rio Tinto Ltd. (Materials) | | | 593,930 | |
| | 14,950 | | | Suncorp Group Ltd. (Insurance) | | | 190,910 | |
| | 550,085 | | | Tabcorp Holdings Ltd. (Consumer Services) | | | 1,742,239 | |
| | 345,470 | | | Tatts Group Ltd. (Consumer Services) | | | 1,065,125 | |
| | 173,047 | | | Toll Holdings Ltd. (Transportation) | | | 832,804 | |
| | 113,320 | | | Woodside Petroleum Ltd. (Energy) | | | 4,393,575 | |
| | | | | | | | |
| | | | | | | 39,373,218 | |
| | |
| | Austria – 0.1% | | | | |
| | 11,071 | | | Raiffeisen Bank International AG (Banks) | | | 352,942 | |
| | |
| | Belgium – 2.2% | | | | |
| | 38,760 | | | Anheuser-Busch InBev NV (Food, Beverage & Tobacco)(a) | | | 4,453,537 | |
| | 110,562 | | | Belgacom SA (Telecommunication Services) | | | 3,670,295 | |
| | 38,754 | | | Telenet Group Holding NV (Media)*(a) | | | 2,208,661 | |
| | | | | | | | |
| | | | | | | 10,332,493 | |
| | |
| | Bermuda – 1.1% | | | | |
| | 132,483 | | | Seadrill Ltd. (Energy) | | | 5,250,381 | |
| | |
| | Denmark – 1.2% | | | | |
| | 30,658 | | | Coloplast A/S (Health Care Equipment & Services) | | | 2,774,094 | |
| | 30,447 | | | Novo Nordisk A/S (Pharmaceuticals, Biotechnology & Life Sciences) | | | 1,405,219 | |
| | 963 | | | Pandora A/S (Consumer Durables & Apparel) | | | 73,904 | |
| | |
| | | | | | | | |
| | Common Stocks – (continued) | | | | |
| | Denmark – (continued) | | | | |
| | 95,344 | | | TDC A/S (Telecommunication Services) | | $ | 986,277 | |
| | 4,753 | | | Tryg A/S (Insurance) | | | 480,230 | |
| | | | | | | | |
| | | | | | | 5,719,724 | |
| | |
| | Finland – 1.8% | | | | |
| | 12,202 | | | Fortum OYJ (Utilities) | | | 327,648 | |
| | 31,212 | | | Metso OYJ (Capital Goods)(a) | | | 1,181,636 | |
| | 106,760 | | | Nokia OYJ (Technology Hardware & Equipment) | | | 807,827 | |
| | 11,908 | | | Nokian Renkaat OYJ (Automobiles & Components) | | | 464,257 | |
| | 110,555 | | | Orion OYJ (Pharmaceuticals, Biotechnology & Life Sciences) | | | 4,120,692 | |
| | 2,749 | | | Pohjola Bank PLC (Diversified Financials) | | | 59,851 | |
| | 12,601 | | | Stora Enso OYJ (Materials) | | | 122,508 | |
| | 95,758 | | | UPM-Kymmene OYJ (Materials) | | | 1,635,695 | |
| | | | | | | | |
| | | | | | | 8,720,114 | |
| | |
| | France – 8.6% | | | | |
| | 2,865 | | | Airbus Group NV (Capital Goods) | | | 192,093 | |
| | 13,285 | | | Alstom SA (Capital Goods) | | | 482,476 | |
| | 51,065 | | | AXA SA (Insurance) | | | 1,220,113 | |
| | 20,965 | | | BNP Paribas SA (Banks)(a) | | | 1,424,756 | |
| | 48,313 | | | Bouygues SA (Capital Goods) | | | 2,010,313 | |
| | 10,253 | | | Cap Gemini SA (Software & Services) | | | 731,693 | |
| | 1,534 | | | Casino Guichard Perrachon SA (Food & Staples Retailing)(a) | | | 203,378 | |
| | 38,970 | | | Credit Agricole SA (Banks) | | | 550,212 | |
| | 12,703 | | | Danone SA (Food, Beverage & Tobacco) | | | 944,576 | |
| | 3,628 | | | Edenred (Commercial & Professional Services) | | | 110,015 | |
| | 11,956 | | | Electricite de France SA (Utilities) | | | 376,469 | |
| | 3,579 | | | Eutelsat Communications SA (Media) | | | 124,369 | |
| | 151,278 | | | GDF Suez (Utilities)(a) | | | 4,167,944 | |
| | 2,506 | | | Imerys SA (Materials) | | | 211,342 | |
| | 1,521 | | | Kering (Consumer Durables & Apparel) | | | 333,663 | |
| | 9,504 | | | Lafarge SA (Materials) | | | 826,460 | |
| | 6,921 | | | Lagardere SCA (Media) | | | 225,497 | |
| | 12,448 | | | L’Oreal SA (Household & Personal Products)(a) | | | 2,143,285 | |
| | 8,154 | | | LVMH Moet Hennessy Louis Vuitton SA (Consumer Durables & Apparel) | | | 1,573,468 | |
| | 217,745 | | | Orange SA (Telecommunication Services) | | | 3,445,231 | |
| | 7,175 | | | Pernod-Ricard SA (Food, Beverage & Tobacco) | | | 861,865 | |
| | 7,061 | | | Renault SA (Automobiles & Components) | | | 638,277 | |
| | 106,286 | | | Rexel SA (Capital Goods) | | | 2,485,779 | |
| | 3,108 | | | Safran SA (Capital Goods) | | | 203,465 | |
| | 60,491 | | | Sanofi (Pharmaceuticals, Biotechnology & Life Sciences) | | | 6,429,561 | |
| | 22,267 | | | Societe Generale SA (Banks) | | | 1,167,741 | |
| | 40,738 | | | Total SA (Energy)(a) | | | 2,947,382 | |
| | |
| | |
| 32 | | The accompanying notes are an integral part of these financial statements. |
GOLDMAN SACHS INTERNATIONAL EQUITY DIVIDEND AND PREMIUM FUND
| | | | | | | | |
Shares | | | Description | | Value | |
| | | | | | | | |
| | Common Stocks – (continued) | | | | |
| | France – (continued) | | | | |
| | 3,926 | | | Unibail-Rodamco SE (REIT) | | $ | 1,142,507 | |
| | 6,244 | | | Veolia Environnement SA (Utilities) | | | 118,953 | |
| | 33,922 | | | Vinci SA (Capital Goods) | | | 2,535,967 | |
| | 24,646 | | | Vivendi SA (Telecommunication Services)*(a) | | | 603,126 | |
| | | | | | | | |
| | | | | | | 40,431,976 | |
| | |
| | Germany – 8.1% | | | | |
| | 1,625 | | | adidas AG (Consumer Durables & Apparel) | | | 164,314 | |
| | 1,287 | | | Axel Springer SE (Media) | | | 79,095 | |
| | 48,743 | | | BASF SE (Materials) | | | 5,669,962 | |
| | 23,554 | | | Bayer AG (Registered) (Pharmaceuticals, Biotechnology & Life Sciences) | | | 3,322,839 | |
| | 15,144 | | | Bayerische Motoren Werke AG (Automobiles & Components) | | | 1,917,681 | |
| | 74,214 | | | Daimler AG (Registered) (Automobiles & Components)(a) | | | 6,932,670 | |
| | 15,840 | | | Deutsche Bank AG (Registered) (Diversified Financials) | | | 556,697 | |
| | 20,468 | | | Deutsche Boerse AG (Diversified Financials) | | | 1,586,979 | |
| | 28,847 | | | Deutsche Post AG (Registered) (Transportation) | | | 1,041,230 | |
| | 40,069 | | | E.ON SE (Utilities) | | | 826,045 | |
| | 633 | | | Hugo Boss AG (Consumer Durables & Apparel) | | | 94,519 | |
| | 29,127 | | | K+S AG (Registered) (Materials) | | | 956,484 | |
| | 5,218 | | | MAN SE (Capital Goods) | | | 644,876 | |
| | 5,486 | | | Metro AG (Food & Staples Retailing)* | | | 238,944 | |
| | 59,987 | | | ProSiebenSat.1 Media AG (Registered) (Media) | | | 2,669,962 | |
| | 113,885 | | | RWE AG (Utilities)(a) | | | 4,884,315 | |
| | 33,223 | | | SAP AG (Software & Services) | | | 2,559,989 | |
| | 22,897 | | | Siemens AG (Registered) (Capital Goods)(a) | | | 3,023,185 | |
| | 115,320 | | | Telefonica Deutschland Holding AG (Telecommunication Services)* | | | 953,266 | |
| | | | | | | | |
| | | | | | | 38,123,052 | |
| | |
| | Hong Kong – 2.8% | | | | |
| | 203,400 | | | AIA Group Ltd. (Insurance) | | | 1,022,006 | |
| | 8,900 | | | ASM Pacific Technology Ltd. (Semiconductors & Semiconductor Equipment) | | | 97,263 | |
| | 437,500 | | | BOC Hong Kong Holdings Ltd. (Banks) | | | 1,267,466 | |
| | 42,000 | | | Cheung Kong Holdings Ltd. (Real Estate) | | | 745,149 | |
| | 30,000 | | | Cheung Kong Infrastructure Holdings Ltd. (Utilities) | | | 207,244 | |
| | 174,000 | | | Galaxy Entertainment Group Ltd. (Consumer Services) | | | 1,390,691 | |
| | 112,000 | | | Hang Lung Properties Ltd. (Real Estate) | | | 345,389 | |
| | |
| | | | | | | | |
| | Common Stocks – (continued) | | | | |
| | Hong Kong – (continued) | | | | |
| | 169,400 | | | Henderson Land Development Co. Ltd. (Real Estate) | | $ | 991,428 | |
| | 184,910 | | | Hong Kong & China Gas Co. Ltd. (Utilities) | | | 404,634 | |
| | 92,200 | | | Hong Kong Exchanges and Clearing Ltd. (Diversified Financials) | | | 1,718,800 | |
| | 23,000 | | | Hutchison Whampoa Ltd. (Capital Goods) | | | 314,561 | |
| | 27,000 | | | Hysan Development Co. Ltd. (Real Estate) | | | 126,458 | |
| | 214,000 | | | Li & Fung Ltd. (Consumer Durables & Apparel) | | | 316,977 | |
| | 92,000 | | | MTR Corp. Ltd. (Transportation) | | | 354,302 | |
| | 137,189 | | | New World Development Co. Ltd. (Real Estate) | | | 156,175 | |
| | 115,500 | | | Power Assets Holdings Ltd. (Utilities) | | | 1,010,964 | |
| | 138,800 | | | Sands China Ltd. (Consumer Services) | | | 1,047,619 | |
| | 155,261 | | | Sino Land Co. Ltd. (Real Estate) | | | 255,578 | |
| | 41,000 | | | SJM Holdings Ltd. (Consumer Services) | | | 102,711 | |
| | 58,200 | | | Swire Properties Ltd. (Real Estate) | | | 170,087 | |
| | 30,500 | | | Techtronic Industries Co. (Consumer Durables & Apparel) | | | 97,774 | |
| | 112,000 | | | Wharf Holdings Ltd. (Real Estate) | | | 806,492 | |
| | 103,600 | | | Wynn Macau Ltd. (Consumer Services) | | | 405,767 | |
| | | | | | | | |
| | | | | | | 13,355,535 | |
| | |
| | Israel – 0.4% | | | | |
| | 217,852 | | | Israel Chemicals Ltd. (Materials) | | | 1,866,567 | |
| | |
| | Italy – 2.8% | | | | |
| | 223,832 | | | Atlantia SpA (Transportation)(a) | | | 6,376,517 | |
| | 83,413 | | | Banca Monte dei Paschi di Siena SpA (Banks)* | | | 161,264 | |
| | 215,912 | | | Eni SpA (Energy) | | | 5,905,123 | |
| | 73,429 | | | Intesa Sanpaolo SpA (Banks) | | | 226,553 | |
| | 538,083 | | | Telecom Italia SpA (Telecommunication Services) | | | 532,263 | |
| | | | | | | | |
| | | | | | | 13,201,720 | |
| | |
| | Japan – 19.3% | | | | |
| | 45,200 | | | Advantest Corp. (Semiconductors & Semiconductor Equipment) | | | 559,282 | |
| | 17,400 | | | AEON Financial Service Co. Ltd. (Diversified Financials) | | | 455,080 | |
| | 8,300 | | | Aisin Seiki Co. Ltd. (Automobiles & Components) | | | 330,390 | |
| | 2,000 | | | Alfresa Holdings Corp. (Health Care Equipment & Services) | | | 128,946 | |
| | 11,000 | | | Amada Co. Ltd. (Capital Goods) | | | 112,045 | |
| | 258,000 | | | Aozora Bank Ltd. (Banks) | | | 848,252 | |
| | 159,000 | | | Asahi Glass Co. Ltd. (Capital Goods) | | | 937,414 | |
| | 25,000 | | | Astellas Pharma, Inc. (Pharmaceuticals, Biotechnology & Life Sciences) | | | 328,764 | |
| | 46,400 | | | Bridgestone Corp. (Automobiles & Components) | | | 1,625,089 | |
| | |
| | |
| The accompanying notes are an integral part of these financial statements. | | 33 |
GOLDMAN SACHS INTERNATIONAL EQUITY DIVIDEND AND PREMIUM FUND
Schedule of Investments (continued)
June 30, 2014 (Unaudited)
| | | | | | | | |
Shares | | | Description | | Value | |
| | | | | | | | |
| | Common Stocks – (continued) | | | | |
| | Japan – (continued) | | | | |
| | 115,600 | | | Canon, Inc. (Technology Hardware & Equipment) | | $ | 3,778,039 | |
| | 21,500 | | | Casio Computer Co. Ltd. (Consumer Durables & Apparel) | | | 312,291 | |
| | 61,000 | | | Dai Nippon Printing Co. Ltd. (Commercial & Professional Services) | | | 637,326 | |
| | 37,000 | | | Daihatsu Motor Co. Ltd. (Automobiles & Components) | | | 658,463 | |
| | 10,900 | | | Daiichi Sankyo Co. Ltd. (Pharmaceuticals, Biotechnology & Life Sciences) | | | 203,740 | |
| | 13,500 | | | Daito Trust Construction Co. Ltd. (Real Estate) | | | 1,587,452 | |
| | 332,000 | | | Daiwa Securities Group, Inc. (Diversified Financials) | | | 2,876,540 | |
| | 28,700 | | | Denso Corp. (Automobiles & Components) | | | 1,371,016 | |
| | 4,900 | | | Eisai Co. Ltd. (Pharmaceuticals, Biotechnology & Life Sciences) | | | 205,630 | |
| | 4,200 | | | FANUC Corp. (Capital Goods) | | | 725,289 | |
| | 1,800 | | | Fast Retailing Co. Ltd. (Retailing) | | | 592,973 | |
| | 27,500 | | | Fuji Heavy Industries Ltd. (Automobiles & Components) | | | 762,541 | |
| | 61,000 | | | Fukuoka Financial Group, Inc. (Banks) | | | 294,634 | |
| | 40,100 | | | Hino Motors Ltd. (Capital Goods) | | | 553,233 | |
| | 3,000 | | | Hitachi Construction Machinery Co., Ltd.. (Capital Goods) | | | 59,881 | |
| | 58,600 | | | Honda Motor Co. Ltd. (Automobiles & Components) | | | 2,044,833 | |
| | 63,200 | | | Hoya Corp. (Technology Hardware & Equipment) | | | 2,101,262 | |
| | 91,000 | | | IHI Corp. (Capital Goods) | | | 424,189 | |
| | 11,500 | | | Iida Group Holdings Co. Ltd. (Consumer Durables & Apparel) | | | 174,783 | |
| | 37,000 | | | Isuzu Motors Ltd. (Automobiles & Components) | | | 245,013 | |
| | 197,100 | | | ITOCHU Corp. (Capital Goods) | | | 2,530,328 | |
| | 41,000 | | | J. Front Retailing Co. Ltd. (Retailing) | | | 287,862 | |
| | 23,600 | | | Japan Airlines Co. Ltd. (Transportation) | | | 1,304,832 | |
| | 19,500 | | | Japan Exchange Group, Inc. (Diversified Financials) | | | 480,601 | |
| | 50,700 | | | Japan Tobacco, Inc. (Food, Beverage & Tobacco) | | | 1,848,629 | |
| | 26,300 | | | JFE Holdings, Inc. (Materials) | | | 543,995 | |
| | 3,000 | | | JGC Corp. (Capital Goods) | | | 91,258 | |
| | 18,500 | | | Kao Corp. (Household & Personal Products) | | | 728,599 | |
| | 64,000 | | | Kawasaki Heavy Industries Ltd. (Capital Goods) | | | 243,980 | |
| | 7,100 | | | KDDI Corp. (Telecommunication Services) | | | 433,196 | |
| | 39,000 | | | Kintetsu Corp. (Transportation) | | | 142,111 | |
| | 29,600 | | | Kirin Holdings Co. Ltd. (Food, Beverage & Tobacco) | | | 427,389 | |
| | 228,000 | | | Kobe Steel Ltd. (Materials) | | | 342,903 | |
| | 38,300 | | | Komatsu Ltd. (Capital Goods) | | | 889,069 | |
| | |
| | | | | | | | |
| | Common Stocks – (continued) | | | | |
| | Japan – (continued) | | | | |
| | 24,000 | | | Kubota Corp. (Capital Goods) | | $ | 340,567 | |
| | 18,000 | | | Kuraray Co. Ltd. (Materials) | | | 228,298 | |
| | 43,400 | | | Kyushu Electric Power Co., Inc. (Utilities) | | | 488,595 | |
| | 11,100 | | | Lawson, Inc. (Food & Staples Retailing) | | | 833,137 | |
| | 5,800 | | | LIXIL Group Corp. (Capital Goods) | | | 156,982 | |
| | 23,000 | | | Marubeni Corp. (Capital Goods) | | | 168,336 | |
| | 22,000 | | | Marui Group Co. Ltd. (Retailing) | | | 211,370 | |
| | 40,900 | | | Mitsubishi Chemical Holdings Corp. (Materials) | | | 181,393 | |
| | 85,600 | | | Mitsubishi Corp. (Capital Goods) | | | 1,781,715 | |
| | 74,000 | | | Mitsubishi Electric Corp. (Capital Goods) | | | 914,103 | |
| | 36,000 | | | Mitsubishi Estate Co. Ltd. (Real Estate) | | | 889,398 | |
| | 20,000 | | | Mitsubishi Heavy Industries Ltd. (Capital Goods) | | | 124,918 | |
| | 357,000 | | | Mitsubishi UFJ Financial Group, Inc. (Banks) | | | 2,191,522 | |
| | 139,200 | | | Mitsui & Co. Ltd. (Capital Goods) | | | 2,231,604 | |
| | 69,000 | | | Mitsui Chemicals, Inc. (Materials) | | | 188,792 | |
| | 41,000 | | | Mitsui Fudosan Co. Ltd. (Real Estate) | | | 1,383,720 | |
| | 794,100 | | | Mizuho Financial Group, Inc. (Banks) | | | 1,632,277 | |
| | 7,800 | | | Murata Manufacturing Co. Ltd. (Technology Hardware & Equipment) | | | 731,489 | |
| | 7,600 | | | Nabtesco Corp. (Capital Goods) | | | 168,196 | |
| | 39,000 | | | NEC Corp. (Technology Hardware & Equipment) | | | 124,469 | |
| | 9,800 | | | Nikon Corp. (Consumer Durables & Apparel) | | | 154,390 | |
| | 800 | | | Nintendo Co. Ltd. (Software & Services) | | | 96,070 | |
| | 90 | | | Nippon Building Fund, Inc. (REIT) | | | 526,221 | |
| | 14,000 | | | Nippon Electric Glass Co. Ltd. (Technology Hardware & Equipment) | | | 81,590 | |
| | 163,500 | | | Nippon Steel & Sumitomo Metal Corp. (Materials) | | | 523,774 | |
| | 368,000 | | | Nippon Yusen Kabushiki Kaisha (Transportation) | | | 1,061,525 | |
| | 127,000 | | | Nissan Motor Co. Ltd. (Automobiles & Components) | | | 1,202,621 | |
| | 7,300 | | | Nitto Denko Corp. (Materials) | | | 341,942 | |
| | 88,900 | | | Nomura Holdings, Inc. (Diversified Financials) | | | 629,706 | |
| | 162,000 | | | NTT DoCoMo, Inc. (Telecommunication Services) | | | 2,765,471 | |
| | 14,900 | | | NTT Urban Development Corp. (Real Estate) | | | 167,800 | |
| | 56,000 | | | Oji Holdings Corp. (Materials) | | | 230,441 | |
| | 4,300 | | | Olympus Corp. (Health Care Equipment & Services)* | | | 147,947 | |
| | 12,300 | | | Oracle Corp. Japan (Software & Services) | | | 538,036 | |
| | 49,400 | | | Panasonic Corp. (Consumer Durables & Apparel) | | | 598,830 | |
| | 8,300 | | | Rakuten, Inc. (Retailing) | | | 107,311 | |
| | |
| | |
| 34 | | The accompanying notes are an integral part of these financial statements. |
GOLDMAN SACHS INTERNATIONAL EQUITY DIVIDEND AND PREMIUM FUND
| | | | | | | | |
Shares | | | Description | | Value | |
| | | | | | | | |
| | Common Stocks – (continued) | | | | |
| | Japan – (continued) | | | | |
| | 79,000 | | | Ricoh Co. Ltd. (Technology Hardware & Equipment) | | $ | 941,573 | |
| | 9,300 | | | Rohm Co. Ltd. (Semiconductors & Semiconductor Equipment) | | | 533,401 | |
| | 39,300 | | | Sankyo Co. Ltd. (Consumer Durables & Apparel) | | | 1,511,759 | |
| | 14,600 | | | SBI Holdings, Inc. (Diversified Financials) | | | 178,931 | |
| | 13,200 | | | Sega Sammy Holdings, Inc. (Consumer Durables & Apparel) | | | 259,942 | |
| | 21,000 | | | Sekisui Chemical Co. Ltd. (Consumer Durables & Apparel) | | | 243,466 | |
| | 177,200 | | | Sekisui House Ltd. (Consumer Durables & Apparel) | | | 2,431,625 | |
| | 4,400 | | | Seven & I Holdings Co. Ltd. (Food & Staples Retailing) | | | 185,459 | |
| | 98,500 | | | Seven Bank Ltd. (Banks) | | | 402,782 | |
| | 7,400 | | | Shin-Etsu Chemical Co. Ltd. (Materials) | | | 449,981 | |
| | 56,700 | | | Shiseido Co. Ltd. (Household & Personal Products) | | | 1,034,151 | |
| | 67,100 | | | Showa Shell Sekiyu KK (Energy) | | | 762,726 | |
| | 20,900 | | | SoftBank Corp. (Telecommunication Services) | | | 1,557,530 | |
| | 25,200 | | | Sony Corp. (Consumer Durables & Apparel) | | | 421,105 | |
| | 79,000 | | | Sumitomo Chemical Co. Ltd. (Materials) | | | 298,635 | |
| | 129,600 | | | Sumitomo Corp. (Capital Goods) | | | 1,748,713 | |
| | 61,100 | | | Sumitomo Mitsui Financial Group, Inc. (Banks) | | | 2,563,568 | |
| | 281,000 | | | Sumitomo Mitsui Trust Holdings, Inc. (Banks) | | | 1,284,309 | |
| | 7,000 | | | Sumitomo Realty & Development Co. Ltd. (Real Estate) | | | 300,696 | |
| | 10,000 | | | Sumitomo Rubber Industries Ltd. (Automobiles & Components) | | | 144,535 | |
| | 4,800 | | | Sysmex Corp. (Health Care Equipment & Services) | | | 180,486 | |
| | 63,000 | | | Taiheiyo Cement Corp. (Materials) | | | 254,019 | |
| | 71,100 | | | Takeda Pharmaceutical Co. Ltd. (Pharmaceuticals, Biotechnology & Life Sciences) | | | 3,299,946 | |
| | 11,200 | | | Terumo Corp. (Health Care Equipment & Services) | | | 250,912 | |
| | 29,000 | | | The Bank of Yokohama Ltd. (Banks) | | | 167,011 | |
| | 12,400 | | | The Chugoku Electric Power Co., Inc. (Utilities) | | | 168,968 | |
| | 99,500 | | | The Kansai Electric Power Co., Inc. (Utilities)* | | | 937,900 | |
| | 8,000 | | | The Yokohama Rubber Co. Ltd. (Automobiles & Components) | | | 69,253 | |
| | 55,300 | | | Tohoku Electric Power Co., Inc. (Utilities) | | | 647,186 | |
| | 1,200 | | | Tokyo Electron Ltd. (Semiconductors & Semiconductor Equipment) | | | 81,785 | |
| | |
| | | | | | | | |
| | Common Stocks – (continued) | | | | |
| | Japan – (continued) | | | | |
| | 84,000 | | | Tokyu Corp. (Transportation) | | $ | 595,802 | |
| | 28,000 | | | Tokyu Fudosan Holdings Corp. (Real Estate) | | | 221,005 | |
| | 125,000 | | | TonenGeneral Sekiyu KK (Energy) | | | 1,187,208 | |
| | 51,000 | | | Toppan Printing Co. Ltd. (Commercial & Professional Services) | | | 394,346 | |
| | 248,000 | | | Toshiba Corp. (Capital Goods) | | | 1,159,259 | |
| | 4,200 | | | Toyoda Gosei Co. Ltd. (Automobiles & Components) | | | 87,306 | |
| | 2,200 | | | Toyota Industries Corp. (Automobiles & Components) | | | 113,675 | |
| | 57,300 | | | Toyota Motor Corp. (Automobiles & Components) | | | 3,430,701 | |
| | 22,400 | | | Trend Micro, Inc. (Software & Services) | | | 738,122 | |
| | 48,700 | | | USS Co. Ltd. (Retailing) | | | 831,226 | |
| | | | | | | | |
| | | | | | | 91,444,701 | |
| | |
| | Luxembourg – 0.1% | | | | |
| | 44,379 | | | ArcelorMittal (Materials) | | | 661,609 | |
| | |
| | Netherlands – 4.1% | | | | |
| | 8,714 | | | Akzo Nobel NV (Materials) | | | 653,369 | |
| | 124,496 | | | Delta Lloyd NV (Insurance)(a) | | | 3,160,895 | |
| | 4,805 | | | Koninklijke Boskalis Westminster NV (Capital Goods) | | | 275,555 | |
| | 1,645 | | | Koninklijke DSM NV (Materials) | | | 119,711 | |
| | 13,488 | | | Koninklijke Philips NV (Capital Goods) | | | 428,086 | |
| | 103,900 | | | Royal Dutch Shell PLC (Energy) | | | 4,515,506 | |
| | 154,845 | | | Royal Dutch Shell PLC (Energy)(a) | | | 6,393,708 | |
| | 88,285 | | | Unilever NV CVA (Food, Beverage & Tobacco)(a) | | | 3,864,506 | |
| | | | | | | | |
| | | | | | | 19,411,336 | |
| | |
| | New Zealand – 0.1% | | | | |
| | 172,630 | | | Auckland International Airport Ltd. (Transportation) | | | 589,416 | |
| | |
| | Norway – 0.7% | | | | |
| | 154,108 | | | Gjensidige Forsikring ASA (Insurance) | | | 2,763,661 | |
| | 64,713 | | | Orkla ASA (Food, Beverage & Tobacco) | | | 575,878 | |
| | | | | | | | |
| | | | | | | 3,339,539 | |
| | |
| | Singapore – 0.4% | | | | |
| | 547,000 | | | CapitaCommercial Trust (REIT) | | | 747,104 | |
| | 21,000 | | | City Developments Ltd. (Real Estate) | | | 172,524 | |
| | 254,000 | | | Genting Singapore PLC (Consumer Services) | | | 271,189 | |
| | 197,000 | | | Global Logistic Properties Ltd. (Real Estate) | | | 426,947 | |
| | 183,000 | | | Golden Agri-Resources Ltd. (Food, Beverage & Tobacco) | | | 81,616 | |
| | 10,000 | | | Singapore Airlines Ltd. (Transportation) | | | 83,220 | |
| | |
| | |
| The accompanying notes are an integral part of these financial statements. | | 35 |
GOLDMAN SACHS INTERNATIONAL EQUITY DIVIDEND AND PREMIUM FUND
Schedule of Investments (continued)
June 30, 2014 (Unaudited)
| | | | | | | | |
Shares | | | Description | | Value | |
| | | | | | | | |
| | Common Stocks – (continued) | | | | |
| | Singapore – (continued) | | | | |
| | 62,000 | | | Wilmar International Ltd. (Food, Beverage & Tobacco) | | $ | 158,711 | |
| | | | | | | | |
| | | | | | | 1,941,311 | |
| | |
| | Spain – 4.5% | | | | |
| | 27,568 | | | Abertis Infraestructuras SA (Transportation) | | | 634,237 | |
| | 34,326 | | | ACS Actividades de Construccion y Servicios SA (Capital Goods) | | | 1,571,108 | |
| | 3,723 | | | Amadeus IT Holding SA (Software & Services) | | | 153,474 | |
| | 367,512 | | | Banco Bilbao Vizcaya Argentaria SA (Banks) | | | 4,684,096 | |
| | 1,033,722 | | | Banco Santander SA (Banks)(a) | | | 10,801,633 | |
| | 19,701 | | | Ferrovial SA (Capital Goods) | | | 438,957 | |
| | 3,042 | | | Repsol SA (Energy) | | | 80,208 | |
| | 160,234 | | | Telefonica SA (Telecommunication Services)(a) | | | 2,750,874 | |
| | | | | | | | |
| | | | | | | 21,114,587 | |
| | |
| | Sweden – 4.0% | | | | |
| | 25,228 | | | Boliden AB (Materials) | | | 366,000 | |
| | 49,453 | | | Electrolux AB (Consumer Durables & Apparel) | | | 1,248,030 | |
| | 124,940 | | | Hennes & Mauritz AB (Retailing) | | | 5,454,860 | |
| | 5,533 | | | Industrivarden AB (Diversified Financials) | | | 109,223 | |
| | 69,815 | | | Nordea Bank AB (Banks) | | | 984,248 | |
| | 103,177 | | | Sandvik AB (Capital Goods) | | | 1,409,107 | |
| | 224,493 | | | Skandinaviska Enskilda Banken AB (Banks) | | | 2,996,478 | |
| | 26,455 | | | Skanska AB (Capital Goods) | | | 603,922 | |
| | 8,910 | | | SKF AB (Capital Goods) | | | 227,184 | |
| | 3,967 | | | Svenska Cellulosa AB SCA (Household & Personal Products) | | | 103,316 | |
| | 11,693 | | | Svenska Handelsbanken AB (Banks) | | | 571,783 | |
| | 139,966 | | | Swedbank AB (Banks) | | | 3,707,297 | |
| | 78,882 | | | Telefonaktiebolaget LM Ericsson (Technology Hardware & Equipment) | | | 952,954 | |
| | 15,913 | | | Volvo AB (Capital Goods) | | | 219,068 | |
| | | | | | | | |
| | | | | | | 18,953,470 | |
| | |
| | Switzerland – 8.5% | | | | |
| | 34,031 | | | ABB Ltd. (Registered) (Capital Goods)* | | | 783,065 | |
| | 1,994 | | | Cie Financiere Richemont SA (Registered) (Consumer Durables & Apparel) | | | 208,950 | |
| | 130,045 | | | Credit Suisse Group AG (Registered) (Diversified Financials)* | | | 3,698,412 | |
| | 378 | | | Givaudan SA (Registered) (Materials)* | | | 629,720 | |
| | 74,351 | | | Glencore PLC (Materials)* | | | 414,337 | |
| | 5,723 | | | Kuehne + Nagel International AG (Registered) (Transportation) | | | 760,987 | |
| | |
| | | | | | | | |
| | Common Stocks – (continued) | | | | |
| | Switzerland – (continued) | | | | |
| | 137,552 | | | Nestle SA (Registered) (Food, Beverage & Tobacco)(a) | | $ | 10,658,485 | |
| | 93,124 | | | Novartis AG (Registered) (Pharmaceuticals, Biotechnology & Life Sciences)(a) | | | 8,433,159 | |
| | 426 | | | Partners Group Holding AG (Diversified Financials) | | | 116,381 | |
| | 14,127 | | | Roche Holding AG (Pharmaceuticals, Biotechnology & Life Sciences) | | | 4,209,237 | |
| | 219,074 | | | STMicroelectronics NV (Semiconductors & Semiconductor Equipment) | | | 1,962,696 | |
| | 6,178 | | | Syngenta AG (Registered) (Materials) | | | 2,282,458 | |
| | 20,819 | | | Zurich Insurance Group AG (Insurance)* | | | 6,270,398 | |
| | | | | | | | |
| | | | | | | 40,428,285 | |
| | |
| | United Kingdom – 18.0% | | | | |
| | 33,272 | | | Aberdeen Asset Management PLC (Diversified Financials) | | | 258,218 | |
| | 16,870 | | | AMEC PLC (Energy) | | | 350,303 | |
| | 43,939 | | | Anglo American PLC (Materials) | | | 1,076,874 | |
| | 74,742 | | | Antofagasta PLC (Materials) | | | 976,426 | |
| | 50,287 | | | ARM Holdings PLC (Semiconductors & Semiconductor Equipment) | | | 756,160 | |
| | 16,601 | | | AstraZeneca PLC (Pharmaceuticals, Biotechnology & Life Sciences) | | | 1,235,076 | |
| | 535,025 | | | BAE Systems PLC (Capital Goods) | | | 3,962,788 | |
| | 476,911 | | | Barclays PLC (Banks) | | | 1,737,280 | |
| | 73,753 | | | BHP Billiton PLC (Materials) | | | 2,397,637 | |
| | 103,997 | | | BP PLC ADR (Energy)(a)(b) | | | 5,485,842 | |
| | 68,949 | | | British American Tobacco PLC (Food, Beverage & Tobacco) | | | 4,102,623 | |
| | 44,418 | | | British Land Co. PLC (REIT) | | | 533,710 | |
| | 108,358 | | | Centrica PLC (Utilities) | | | 579,025 | |
| | 114,037 | | | Compass Group PLC (Consumer Services) | | | 1,982,697 | |
| | 47,423 | | | Diageo PLC (Food, Beverage & Tobacco) | | | 1,510,380 | |
| | 41,463 | | | easyJet PLC (Transportation) | | | 968,273 | |
| | 630,237 | | | Friends Life Group Ltd. (Insurance) | | | 3,398,377 | |
| | 253,718 | | | G4S PLC (Commercial & Professional Services) | | | 1,107,687 | |
| | 153,189 | | | GlaxoSmithKline PLC ADR (Pharmaceuticals, Biotechnology & Life Sciences)(a)(b) | | | 8,192,548 | |
| | 1,085,891 | | | HSBC Holdings PLC (Banks)(a) | | | 11,016,449 | |
| | 452,283 | | | ICAP PLC (Diversified Financials) | | | 2,938,452 | |
| | 36,969 | | | Imperial Tobacco Group PLC (Food, Beverage & Tobacco) | | | 1,663,164 | |
| | 40,156 | | | Inmarsat PLC (Telecommunication Services) | | | 513,257 | |
| | 8,177 | | | Land Securities Group PLC (REIT) | | | 144,892 | |
| | 27,368 | | | Legal & General Group PLC (Insurance) | | | 105,435 | |
| | 647,980 | | | Lloyds Banking Group PLC (Banks)* | | | 823,630 | |
| | |
| | |
| 36 | | The accompanying notes are an integral part of these financial statements. |
GOLDMAN SACHS INTERNATIONAL EQUITY DIVIDEND AND PREMIUM FUND
| | | | | | | | |
Shares | | | Description | | Value | |
| | | | | | | | |
| | Common Stocks – (continued) | | | | |
| | United Kingdom – (continued) | | | | |
| | 132,560 | | | Marks & Spencer Group PLC (Retailing) | | $ | 964,282 | |
| | 279,518 | | | Melrose Industries PLC (Capital Goods) | | | 1,243,829 | |
| | 54,298 | | | Pearson PLC (Media) | | | 1,072,361 | |
| | 286,770 | | | Persimmon PLC (Consumer Durables & Apparel)* | | | 3,294,652 | |
| | 15,317 | | | Reckitt Benckiser Group PLC (Household & Personal Products) | | | 1,335,568 | |
| | 71,344 | | | Rio Tinto PLC (Materials) | | | 3,852,167 | |
| | 9,279 | | | SABMiller PLC (Food, Beverage & Tobacco) | | | 537,764 | |
| | 27,557 | | | Segro PLC (REIT) | | | 162,679 | |
| | 49,848 | | | SSE PLC (Utilities) | | | 1,335,381 | |
| | 124,464 | | | Standard Chartered PLC (Banks) | | | 2,544,055 | |
| | 48,254 | | | Standard Life PLC (Insurance) | | | 308,704 | |
| | 102,230 | | | Unilever PLC (Food, Beverage & Tobacco) | | | 4,634,034 | |
| | 160,011 | | | Vodafone Group PLC ADR (Telecommunication Services)(a)(b) | | | 5,342,767 | |
| | 51,959 | | | William Hill PLC (Consumer Services) | | | 291,726 | |
| | 56,937 | | | WM Morrison Supermarkets PLC (Food & Staples Retailing) | | | 178,569 | |
| | | | | | | | |
| | | | | | | 84,915,741 | |
| | |
| | TOTAL COMMON STOCKS | | | | |
| | (Cost $446,116,869) | | $ | 459,527,717 | |
| | |
| | | | | | | | |
| | Preferred Stocks – 0.2% | | | | |
| | Germany – 0.2% | | | | |
| | 5,593 | | | Bayerische Motoren Werke AG(a) (Automobiles & Components) | | $ | 535,487 | |
| | 1,129 | | | Porsche Automobil Holding SE (Automobiles & Components) | | | 117,385 | |
| | 484 | | | Volkswagen AG (Automobiles & Components) | | | 126,768 | |
| | |
| | TOTAL PREFERRED STOCKS | |
| | (Cost $555,803) | | $ | 779,640 | |
| | |
| | TOTAL INVESTMENTS – 97.3% | |
| | (Cost $446,672,672) | | $ | 460,307,357 | |
| | |
| OTHER ASSETS IN EXCESS OF
LIABILITIES – 2.7% | | | 12,922,418 | |
| | |
| | NET ASSETS – 100.0% | | $ | 473,229,775 | |
| | |
| | |
| The percentage shown for each investment category reflects the value of investments in that category as a percentage of net assets. |
* | | Non-income producing security. |
(a) | | All or a portion of this security is held as collateral for call options written. |
(b) | | All or a portion of security is segregated as collateral for initial margin requirements on futures transactions. |
| | |
|
Investment Abbreviations: |
ADR | | —American Depositary Receipt |
CVA | | —Dutch Certification |
REIT | | —Real Estate Investment Trust |
|
| | |
| The accompanying notes are an integral part of these financial statements. | | 37 |
GOLDMAN SACHS INTERNATIONAL EQUITY DIVIDEND AND PREMIUM FUND
Schedule of Investments (continued)
June 30, 2014 (Unaudited)
|
| ADDITIONAL INVESTMENT INFORMATION |
FUTURES CONTRACTS — At June 30, 2014, the Fund had the following futures contracts:
| | | | | | | | | | | | | | |
| Type | | Number of
Contracts
Long (Short) | | | Expiration Date | | Current Value | | | Unrealized
Gain (Loss) | |
EURO STOXX 50 Index | | | 139 | | | September 2014 | | $ | 6,151,553 | | | $ | (77,848 | ) |
FTSE 100 Index | | | 25 | | | September 2014 | | | 2,871,301 | | | | (8,711 | ) |
TSE TOPIX Index | | | 22 | | | September 2014 | | | 2,741,721 | | | | 56,822 | |
| TOTAL | | | | | | | | | | | | $ | (29,737 | ) |
WRITTEN OPTIONS CONTRACTS — At June 30, 2014, the Fund had the following written options:
| | | | | | | | | | | | | | |
| Call Options | | Number of
Contracts | | | Exercise
Rate | | | Expiration
Month | | Value | |
Nikkei-225 Stock Average | | | 283 | | | | JPY 15,250 | | | September 2014 | | $ | (1,145,353 | ) |
EURO STOXX 50 Index | | | 2,198 | | | | EUR 3,350 | | | September 2014 | | | (1,011,266 | ) |
FTSE 100 Index | | | 397 | | | | GBP 6,900 | | | September 2014 | | | (302,345 | ) |
| Total (Premiums Received $3,524,662) | | | 2,878 | | | | | | | | | $ | (2,458,964 | ) |
For the six months ended June 30, 2014, the Fund had the following written options activity:
| | | | | | | | |
| | | Number of
Contracts | | | Premiums
Received | |
Contracts Outstanding December 31, 2013 | | | 2,440 | | | $ | 3,970,972 | |
Contracts written | | | 5,591 | | | | 6,715,774 | |
Contracts expired | | | (868 | ) | �� | | (3,138,380 | ) |
Contracts bought to close | | | (4,285 | ) | | | (4,023,704 | ) |
Contracts Outstanding June 30, 2014 | | | 2,878 | | | $ | 3,524,662 | |
| | |
| 38 | | The accompanying notes are an integral part of these financial statements. |
GOLDMAN SACHS U.S. TAX-MANAGED EQUITY FUND
Schedule of Investments
June 30, 2014 (Unaudited)
| | | | | | | | |
| Shares | | | Description | | Value | |
| | | | | | | | |
| | Common Stocks – 94.1% | |
| | Automobiles & Components – 1.1% | |
| | 58,680 | | | BorgWarner, Inc. | | $ | 3,825,349 | |
| | 16,019 | | | General Motors Co. | | | 581,490 | |
| | 92,927 | | | Gentex Corp. | | | 2,703,246 | |
| | | | | | | | |
| | | | | | | 7,110,085 | |
| | |
| | Banks – 4.7% | |
| | 52,986 | | | Citigroup, Inc. | | | 2,495,641 | |
| | 7,860 | | | Hancock Holding Co. | | | 277,615 | |
| | 153,495 | | | JPMorgan Chase & Co. | | | 8,844,382 | |
| | 67,338 | | | The PNC Financial Services Group, Inc. | | | 5,996,449 | |
| | 15,761 | | | U.S. Bancorp | | | 682,766 | |
| | 245,185 | | | Wells Fargo & Co. | | | 12,886,924 | |
| | | | | | | | |
| | | | | | | 31,183,777 | |
| | |
| | Capital Goods – 7.7% | |
| | 31,608 | | | Alliant Techsystems, Inc. | | | 4,232,943 | |
| | 2,900 | | | Danaher Corp. | | | 228,317 | |
| | 20,780 | | | Donaldson Co., Inc. | | | 879,410 | |
| | 168,234 | | | General Electric Co. | | | 4,421,190 | |
| | 9,481 | | | Honeywell International, Inc. | | | 881,259 | |
| | 3,718 | | | Hyster-Yale Materials Handling, Inc. | | | 329,192 | |
| | 73,341 | | | Illinois Tool Works, Inc. | | | 6,421,681 | |
| | 49,459 | | | L-3 Communications Holdings, Inc. | | | 5,972,174 | |
| | 29,272 | | | Lockheed Martin Corp. | | | 4,704,889 | |
| | 64,168 | | | Raytheon Co. | | | 5,919,498 | |
| | 37,020 | | | Spirit AeroSystems Holdings, Inc. Class A* | | | 1,247,574 | |
| | 9,368 | | | TAL International Group, Inc.* | | | 415,565 | |
| | 23,061 | | | Taser International, Inc.* | | | 306,711 | |
| | 56,217 | | | The Boeing Co. | | | 7,152,489 | |
| | 13,054 | | | Trex Co., Inc.* | | | 376,216 | |
| | 18,029 | | | United Technologies Corp. | | | 2,081,448 | |
| | 26,059 | | | WABCO Holdings, Inc.* | | | 2,783,622 | |
| | 23,184 | | | Watsco, Inc. | | | 2,382,388 | |
| | | | | | | | |
| | | | | | | 50,736,566 | |
| | |
| | Commercial & Professional Services – 0.5% | |
| | 9,909 | | | Kforce, Inc. | | | 214,530 | |
| | 17,718 | | | Manpowergroup, Inc. | | | 1,503,372 | |
| | 58,295 | | | Steelcase, Inc. Class A | | | 882,003 | |
| | 8,764 | | | Waste Management, Inc. | | | 392,014 | |
| | | | | | | | |
| | | | | | | 2,991,919 | |
| | |
| | Consumer Durables & Apparel – 2.6% | |
| | 9,843 | | | Columbia Sportswear Co. | | | 813,524 | |
| | 104,934 | | | Garmin Ltd.(a) | | | 6,390,481 | |
| | 3,479 | | | Harman International Industries, Inc. | | | 373,749 | |
| | 33,386 | | | Hasbro, Inc. | | | 1,771,127 | |
| | 81,639 | | | NIKE, Inc. Class B | | | 6,331,105 | |
| | 1,147 | | | NVR, Inc.* | | | 1,319,738 | |
| | 6,113 | | | Sturm, Ruger & Co., Inc.(a) | | | 360,728 | |
| | | | | | | | |
| | | | | | | 17,360,452 | |
| | |
| | | | | | | | |
| | Common Stocks – (continued) | |
| | Consumer Services – 3.1% | |
| | 38,746 | | | Boyd Gaming Corp.* | | $ | 469,989 | |
| | 52,566 | | | Carnival Corp. | | | 1,979,110 | |
| | 24,309 | | | Las Vegas Sands Corp. | | | 1,852,832 | |
| | 6,048 | | | Marriott International, Inc. Class A | | | 387,677 | |
| | 71,306 | | | McDonald’s Corp. | | | 7,183,366 | |
| | 24,592 | | | Papa John’s International, Inc. | | | 1,042,455 | |
| | 17,760 | | | Starbucks Corp. | | | 1,374,269 | |
| | 5,310 | | | Wyndham Worldwide Corp. | | | 402,073 | |
| | 26,107 | | | Wynn Resorts Ltd. | | | 5,418,769 | |
| | | | | | | | |
| | | | | | | 20,110,540 | |
| | |
| | Diversified Financials – 2.5% | |
| | 12,435 | | | Ameriprise Financial, Inc. | | | 1,492,200 | |
| | 38,603 | | | Berkshire Hathaway, Inc. Class B* | | | 4,885,596 | |
| | 28,423 | | | BGC Partners, Inc. Class A | | | 211,467 | |
| | 43,055 | | | Capital One Financial Corp. | | | 3,556,343 | |
| | 14,466 | | | CBOE Holdings, Inc. | | | 711,849 | |
| | 13,256 | | | Morgan Stanley | | | 428,566 | |
| | 11,360 | | | PHH Corp.* | | | 261,053 | |
| | 163,531 | | | TD Ameritrade Holding Corp. | | | 5,126,697 | |
| | | | | | | | |
| | | | | | | 16,673,771 | |
| | |
| | Energy – 6.5% | |
| | 11,675 | | | Apache Corp. | | | 1,174,739 | |
| | 18,486 | | | Baker Hughes, Inc. | | | 1,376,283 | |
| | 13,897 | | | Chevron Corp. | | | 1,814,253 | |
| | 95,472 | | | ConocoPhillips | | | 8,184,815 | |
| | 3,223 | | | Core Laboratories NV | | | 538,434 | |
| | 34,463 | | | Devon Energy Corp. | | | 2,736,362 | |
| | 7,714 | | | EOG Resources, Inc. | | | 901,458 | |
| | 6,150 | | | Exterran Holdings, Inc. | | | 276,689 | |
| | 68,894 | | | Exxon Mobil Corp. | | | 6,936,248 | |
| | 40,501 | | | Green Plains, Inc. | | | 1,331,268 | |
| | 5,681 | | | Helmerich & Payne, Inc. | | | 659,621 | |
| | 42,992 | | | Hess Corp. | | | 4,251,479 | |
| | 44,514 | | | Marathon Petroleum Corp. | | | 3,475,208 | |
| | 2,426 | | | Occidental Petroleum Corp. | | | 248,980 | |
| | 20,582 | | | PBF Energy, Inc. Class A | | | 548,510 | |
| | 38,803 | | | Phillips 66 | | | 3,120,925 | |
| | 86,449 | | | Valero Energy Corp. | | | 4,331,095 | |
| | 20,542 | | | Western Refining, Inc. | | | 771,352 | |
| | | | | | | | |
| | | | | | | 42,677,719 | |
| | |
| | Food & Staples Retailing – 1.5% | |
| | 116,275 | | | CVS Caremark Corp. | | | 8,763,647 | |
| | 31,304 | | | Safeway, Inc. | | | 1,074,979 | |
| | 4,392 | | | The Andersons, Inc. | | | 226,539 | |
| | | | | | | | |
| | | | | | | 10,065,165 | |
| | |
| | Food, Beverage & Tobacco – 4.4% | |
| | 67,825 | | | Archer-Daniels-Midland Co. | | | 2,991,761 | |
| | 29,998 | | | Keurig Green Mountain, Inc. | | | 3,738,051 | |
| | 19,866 | | | Lancaster Colony Corp. | | | 1,890,449 | |
| | 21,314 | | | Mead Johnson Nutrition Co. | | | 1,985,825 | |
| | 26,705 | | | Philip Morris International, Inc. | | | 2,251,498 | |
| | |
| | |
| The accompanying notes are an integral part of these financial statements. | | 39 |
GOLDMAN SACHS U.S. TAX-MANAGED EQUITY FUND
Schedule of Investments (continued)
June 30, 2014 (Unaudited)
| | | | | | | | |
| Shares | | | Description | | Value | |
| | | | | | | | |
| | Common Stocks – (continued) | |
| | Food, Beverage & Tobacco – (continued) | |
| | 254,314 | | | Pilgrim’s Pride Corp.* | | $ | 6,958,031 | |
| | 54,013 | | | Sanderson Farms, Inc. | | | 5,250,064 | |
| | 12,845 | | | The Hershey Co. | | | 1,250,718 | |
| | 65,319 | | | Tyson Foods, Inc. Class A | | | 2,452,075 | |
| | | | | | | | |
| | | | | | | 28,768,472 | |
| | |
| | Health Care Equipment & Services – 4.5% | |
| | 93,269 | | | Abbott Laboratories(b) | | | 3,814,702 | |
| | 12,250 | | | Becton, Dickinson and Co. | | | 1,449,175 | |
| | 205,911 | | | Boston Scientific Corp.* | | | 2,629,483 | |
| | 20,463 | | | Cardinal Health, Inc. | | | 1,402,943 | |
| | 36,357 | | | McKesson Corp. | | | 6,770,037 | |
| | 128,246 | | | Medtronic, Inc. | | | 8,176,965 | |
| | 75,971 | | | St. Jude Medical, Inc. | | | 5,260,992 | |
| | | | | | | | |
| | | | | | | 29,504,297 | |
| | |
| | Household & Personal Products – 1.6% | |
| | 20,503 | | | Kimberly-Clark Corp. | | | 2,280,344 | |
| | 34,866 | | | Nu Skin Enterprises, Inc. Class A | | | 2,578,689 | |
| | 50,325 | | | The Clorox Co. | | | 4,599,705 | |
| | 8,185 | | | The Procter & Gamble Co. | | | 643,259 | |
| | 5,291 | | | USANA Health Sciences, Inc.*(a) | | | 413,439 | |
| | | | | | | | |
| | | | | | | 10,515,436 | |
| | |
| | Insurance – 3.4% | |
| | 22,279 | | | Aflac, Inc.(b) | | | 1,386,868 | |
| | 44,179 | | | Allied World Assurance Co. Holdings AG | | | 1,679,685 | |
| | 46,306 | | | Amtrust Financial Services, Inc.(a) | | | 1,936,054 | |
| | 4,418 | | | Argo Group International Holdings Ltd. | | | 225,804 | |
| | 26,042 | | | Aspen Insurance Holdings Ltd. | | | 1,182,828 | |
| | 2,261 | | | Everest Re Group Ltd. | | | 362,868 | |
| | 17,026 | | | Marsh & McLennan Companies, Inc. | | | 882,287 | |
| | 12,012 | | | MetLife, Inc. | | | 667,387 | |
| | 64,085 | | | Prudential Financial, Inc. | | | 5,688,825 | |
| | 11,861 | | | Reinsurance Group of America, Inc. | | | 935,833 | |
| | 78,128 | | | The Travelers Companies, Inc. | | | 7,349,501 | |
| | 10,305 | | | Unum Group | | | 358,202 | |
| | | | | | | | |
| | | | | | | 22,656,142 | |
| | |
| | Materials – 2.7% | |
| | 5,471 | | | Allegheny Technologies, Inc. | | | 246,742 | |
| | 23,744 | | | Globe Specialty Metals, Inc. | | | 493,400 | |
| | 66,105 | | | LyondellBasell Industries NV Class A | | | 6,455,153 | |
| | 14,360 | | | Minerals Technologies, Inc. | | | 941,729 | |
| | 74,710 | | | Olin Corp. | | | 2,011,193 | |
| | 6,258 | | | Packaging Corp. of America | | | 447,385 | |
| | 30,447 | | | PPG Industries, Inc. | | | 6,398,437 | |
| | 25,080 | | | SunCoke Energy, Inc.* | | | 539,220 | |
| | | | | | | | |
| | | | | | | 17,533,259 | |
| | |
| | Media – 2.8% | |
| | 81,873 | | | Comcast Corp. Class A | | | 4,384,675 | |
| | 86,959 | | | DIRECTV* | | | 7,392,384 | |
| | 14,898 | | | Regal Entertainment Group Class A(a) | | | 314,348 | |
| | |
| | | | | | | | |
| | Common Stocks – (continued) | |
| | Media – (continued) | |
| | 8,529 | | | Time Warner Cable, Inc. | | $ | 1,256,322 | |
| | 62,130 | | | Viacom, Inc. Class B | | | 5,388,535 | |
| | | | | | | | |
| | | | | | | 18,736,264 | |
| | |
| | Pharmaceuticals, Biotechnology & Life Sciences – 10.9% | |
| | 77,032 | | | AbbVie, Inc. | | | 4,347,686 | |
| | 15,723 | | | Actavis PLC* | | | 3,507,015 | |
| | 28,864 | | | Alexion Pharmaceuticals, Inc.* | | | 4,510,000 | |
| | 19,843 | | | Amgen, Inc. | | | 2,348,816 | |
| | 16,914 | | | Biogen Idec, Inc.* | | | 5,333,154 | |
| | 48,696 | | | Cambrex Corp.* | | | 1,008,007 | |
| | 13,570 | | | Celgene Corp.* | | | 1,165,392 | |
| | 102,197 | | | Gilead Sciences, Inc.* | | | 8,473,153 | |
| | 144,250 | | | Johnson & Johnson | | | 15,091,435 | |
| | 138,561 | | | Merck & Co., Inc. | | | 8,015,754 | |
| | 31,704 | | | PDL BioPharma, Inc.(a) | | | 306,895 | |
| | 405,768 | | | Pfizer, Inc. | | | 12,043,194 | |
| | 16,654 | | | Pharmacyclics, Inc.* | | | 1,494,030 | |
| | 14,856 | | | Questcor Pharmaceuticals, Inc.(a) | | | 1,374,032 | |
| | 4,670 | | | United Therapeutics Corp.* | | | 413,248 | |
| | 28,865 | | | Vertex Pharmaceuticals, Inc.* | | | 2,732,938 | |
| | | | | | | | |
| | | | | | | 72,164,749 | |
| | |
| | Real Estate – 3.0% | |
| | 53,031 | | | American Tower Corp. (REIT) | | | 4,771,729 | |
| | 43,919 | | | Annaly Capital Management, Inc. (REIT) | | | 501,994 | |
| | 15,622 | | | Apartment Investment & Management Co. Class A (REIT) | | | 504,122 | |
| | 197,661 | | | Capstead Mortgage Corp. (REIT)(a) | | | 2,599,242 | |
| | 41,224 | | | CBRE Group, Inc. Class A* | | | 1,320,817 | |
| | 30,992 | | | Crown Castle International Corp. (REIT) | | | 2,301,466 | |
| | 16,546 | | | Equity Lifestyle Properties, Inc. (REIT) | | | 730,671 | |
| | 13,450 | | | Equity Residential (REIT) | | | 847,350 | |
| | 28,074 | | | Extra Space Storage, Inc. (REIT) | | | 1,494,940 | |
| | 7,862 | | | Hospitality Properties Trust (REIT) | | | 239,005 | |
| | 22,966 | | | Public Storage (REIT) | | | 3,935,214 | |
| | 20,195 | | | The Geo Group, Inc. (REIT) | | | 721,622 | |
| | | | | | | | |
| | | | | | | 19,968,172 | |
| | |
| | Retailing – 4.1% | |
| | 10,897 | | | AutoZone, Inc.* | | | 5,842,905 | |
| | 57,272 | | | GameStop Corp. Class A(a) | | | 2,317,798 | |
| | 178,063 | | | Liberty Interactive Corp. Series A* | | | 5,227,930 | |
| | 16,726 | | | Lowe’s Companies, Inc. | | | 802,681 | |
| | 5,167 | | | Lumber Liquidators Holdings, Inc.* | | | 392,434 | |
| | 37,334 | | | O’Reilly Automotive, Inc.* | | | 5,622,500 | |
| | 5,544 | | | The Priceline Group, Inc.* | | | 6,669,432 | |
| | 2,503 | | | TripAdvisor, Inc.* | | | 271,976 | |
| | | | | | | | |
| | | | | | | 27,147,656 | |
| | |
| | Semiconductors & Semiconductor Equipment – 4.4% | |
| | 18,548 | | | Advanced Energy Industries, Inc.* | | | 357,049 | |
| | 181,233 | | | Broadcom Corp. Class A | | | 6,727,369 | |
| | |
| | |
| 40 | | The accompanying notes are an integral part of these financial statements. |
GOLDMAN SACHS U.S. TAX-MANAGED EQUITY FUND
| | | | | | | | |
| Shares | | | Description | | Value | |
| | | | | | | | |
| | Common Stocks – (continued) | |
| | Semiconductors & Semiconductor Equipment – (continued) | |
| | 41,761 | | | Intel Corp. | | $ | 1,290,415 | |
| | 42,708 | | | Lam Research Corp. | | | 2,886,207 | |
| | 260,998 | | | Micron Technology, Inc.* | | | 8,599,884 | |
| | 78,832 | | | SunPower Corp.*(a) | | | 3,230,535 | |
| | 117,298 | | | Texas Instruments, Inc. | | | 5,605,671 | |
| | | | | | | | |
| | | | | | | 28,697,130 | |
| | |
| | Software & Services – 8.4% | |
| | 89,702 | | | Activision Blizzard, Inc. | | | 2,000,355 | |
| | 31,239 | | | Amdocs Ltd. | | | 1,447,296 | |
| | 25,773 | | | Aspen Technology, Inc.* | | | 1,195,867 | |
| | 9,155 | | | Constant Contact, Inc.* | | | 293,967 | |
| | 25,148 | | | eBay, Inc.* | | | 1,258,909 | |
| | 11,331 | | | Google, Inc. Class A* | | | 6,624,896 | |
| | 11,331 | | | Google, Inc. Class C* | | | 6,518,498 | |
| | 7,365 | | | IAC/InterActiveCorp | | | 509,879 | |
| | 92,280 | | | Mastercard, Inc. Class A | | | 6,779,812 | |
| | 36,898 | | | Mentor Graphics Corp. | | | 795,890 | |
| | 89,598 | | | Microsoft Corp.(b) | | | 3,736,237 | |
| | 212,944 | | | Oracle Corp. | | | 8,630,620 | |
| | 17,420 | | | Pandora Media, Inc.* | | | 513,890 | |
| | 10,026 | | | Shutterstock, Inc.*(a) | | | 831,957 | |
| | 89,564 | | | Take-Two Interactive Software, Inc.* | | | 1,991,903 | |
| | 7,333 | | | TeleTech Holdings, Inc.* | | | 212,584 | |
| | 12,293 | | | VeriSign, Inc.* | | | 600,021 | |
| | 6,244 | | | VistaPrint NV*(a) | | | 252,632 | |
| | 11,116 | | | VMware, Inc. Class A* | | | 1,076,140 | |
| | 256,360 | | | Xerox Corp. | | | 3,189,118 | |
| | 50,292 | | | Zillow, Inc. Class A*(a) | | | 7,188,236 | |
| | | | | | | | |
| | | | | | | 55,648,707 | |
| | |
| | Technology Hardware & Equipment – 6.3% | |
| | 130,410 | | | Apple, Inc.(b) | | | 12,119,001 | |
| | 58,531 | | | Benchmark Electronics, Inc.* | | | 1,491,370 | |
| | 29,610 | | | Ciena Corp.* | | | 641,353 | |
| | 337,676 | | | Corning, Inc. | | | 7,411,988 | |
| | 34,310 | | | Daktronics, Inc. | | | 408,975 | |
| | 24,038 | | | EchoStar Corp. Class A* | | | 1,272,572 | |
| | 10,830 | | | EMC Corp. | | | 285,262 | |
| | 6,000 | | | FLIR Systems, Inc. | | | 208,380 | |
| | 3,680 | | | Harris Corp. | | | 278,760 | |
| | 165,813 | | | Hewlett-Packard Co. | | | 5,584,582 | |
| | 25,521 | | | Lexmark International, Inc. Class A | | | 1,229,110 | |
| | 88,249 | | | QUALCOMM, Inc. | | | 6,989,321 | |
| | 17,811 | | | SanDisk Corp. | | | 1,859,914 | |
| | 17,200 | | | Western Digital Corp. | | | 1,587,560 | |
| | | | | | | | |
| | | | | | | 41,368,148 | |
| | |
| | Telecommunication Services – 1.8% | |
| | 137,001 | | | AT&T, Inc.(b) | | | 4,844,397 | |
| | 149,353 | | | Verizon Communications, Inc. | | | 7,307,842 | |
| | | | | | | | |
| | | | | | | 12,152,239 | |
| | |
| | Transportation – 2.9% | |
| | 12,321 | | | Alaska Air Group, Inc. | | | 1,171,111 | |
| | 14,103 | | | Allegiant Travel Co. | | | 1,660,910 | |
| | |
| | | | | | | | |
| | Common Stocks – (continued) | |
| | Transportation – (continued) | |
| | 154,374 | | | American Airlines Group, Inc.* | | $ | 6,631,907 | |
| | 11,928 | | | ArcBest Corp. | | | 518,987 | |
| | 15,629 | | | CSX Corp. | | | 481,529 | |
| | 28,966 | | | Delta Air Lines, Inc. | | | 1,121,563 | |
| | 3,220 | | | FedEx Corp. | | | 487,444 | |
| | 51,198 | | | Hertz Global Holdings, Inc.* | | | 1,435,080 | |
| | 5,745 | | | Saia, Inc.* | | | 252,378 | |
| | 30,565 | | | Spirit Airlines, Inc.* | | | 1,932,931 | |
| | 19,376 | | | Union Pacific Corp. | | | 1,932,756 | |
| | 16,477 | | | United Parcel Service, Inc. Class B | | | 1,691,529 | |
| | | | | | | | |
| | | | | | | 19,318,125 | |
| | |
| | Utilities – 2.7% | |
| | 9,873 | | | American Water Works Co., Inc. | | | 488,220 | |
| | 113,422 | | | Edison International | | | 6,590,953 | |
| | 68,958 | | | Entergy Corp. | | | 5,660,762 | |
| | 136,313 | | | Exelon Corp. | | | 4,972,698 | |
| | | | | | | | |
| | | | | | | 17,712,633 | |
| | |
| TOTAL INVESTMENTS BEFORE SECURITIES LENDING
REINVESTMENT VEHICLE |
|
| | (Cost $446,335,445) | | $ | 620,801,423 | |
| | |
| | | | | | |
| Shares | | Distribution
Rate | | Value | |
| Securities Lending Reinvestment Vehicle(c)(d) – 3.9% | |
Goldman Sachs Financial Square Money Market
Fund – FST Shares | |
| 25,485,950 | | 0.066% | | $ | 25,485,950 | |
| (Cost $25,485,950) | | | | |
| |
| TOTAL INVESTMENTS – 98.0% | |
| (Cost $471,821,395) | | $ | 646,287,373 | |
| |
OTHER ASSETS IN EXCESS OF LIABILITIES – 2.0% | | | 13,288,282 | |
| |
| NET ASSETS – 100.0% | | $ | 659,575,655 | |
| |
| | |
| The percentage shown for each investment category reflects the value of investments in that category as a percentage of net assets. |
* | | Non-income producing security. |
(a) | | All or a portion of security is on loan. |
(b) | | All or a portion of security is segregated as collateral for initial margin requirements on futures transactions. |
(c) | | Variable rate security. Interest rate or distribution rate disclosed is that which is in effect at June 30, 2014. |
(d) | | Represents an affiliated issuer. |
| | |
|
Investment Abbreviation: |
REIT | | —Real Estate Investment Trust |
|
| | |
| The accompanying notes are an integral part of these financial statements. | | 41 |
GOLDMAN SACHS U.S. TAX-MANAGED EQUITY FUND
Schedule of Investments (continued)
June 30, 2014 (Unaudited)
|
| ADDITIONAL INVESTMENT INFORMATION |
FUTURES CONTRACTS — At June 30, 2014, the Fund had the following futures contracts:
| | | | | | | | | | | | | | |
| Type | | Number of
Contracts
Long (Short) | | | Expiration
Date | | Current
Value | | | Unrealized
Gain (Loss) | |
Russell 2000 Mini Index | | | 30 | | | September 2014 | | $ | 3,570,900 | | | $ | 57,673 | |
S&P 500 E-mini Index | | | 374 | | | September 2014 | | | 36,509,880 | | | | 261,977 | |
| TOTAL | | | | | | | | | | | | $ | 319,650 | |
| | |
| 42 | | The accompanying notes are an integral part of these financial statements. |
GOLDMAN SACHS INTERNATIONAL TAX-MANAGED EQUITY FUND
Schedule of Investments
June 30, 2014 (Unaudited)
| | | | | | | | |
Shares | | | Description | | Value | |
| | | | | | | | |
| | Common Stocks – 90.9% | |
| | Australia – 8.3% | | | | |
| | 104,509 | | | Australia & New Zealand Banking Group Ltd. (Banks) | | $ | 3,286,234 | |
| | 103,253 | | | BHP Billiton Ltd. (Materials) | | | 3,521,409 | |
| | 30,957 | | | BlueScope Steel Ltd. (Materials)* | | | 158,554 | |
| | 15,839 | | | Challenger Ltd. (Diversified Financials) | | | 111,105 | |
| | 357,317 | | | Dexus Property Group (REIT) | | | 373,976 | |
| | 750,907 | | | Envestra Ltd. (Utilities) | | | 961,996 | |
| | 229,535 | | | GPT Group (REIT) | | | 831,278 | |
| | 38,244 | | | National Australia Bank Ltd. (Banks) | | | 1,182,075 | |
| | 22,980 | | | NIB Holdings Ltd. (Insurance) | | | 70,630 | |
| | 138,010 | | | Origin Energy Ltd. (Energy) | | | 1,902,270 | |
| | 38,948 | | | Ramsay Health Care Ltd. (Health Care Equipment & Services) | | | 1,672,859 | |
| | 2,605 | | | REA Group Ltd. (Media) | | | 104,956 | |
| | 22,865 | | | Rio Tinto Ltd. (Materials) | | | 1,282,726 | |
| | 122,870 | | | Santos Ltd. (Energy) | | | 1,652,922 | |
| | 59,665 | | | Sonic Healthcare Ltd. (Health Care Equipment & Services) | | | 976,011 | |
| | 387,712 | | | Telstra Corp. Ltd. (Telecommunication Services) | | | 1,904,739 | |
| | 91,229 | | | Westpac Banking Corp. (Banks) | | | 2,918,063 | |
| | 54,356 | | | Woodside Petroleum Ltd. (Energy) | | | 2,107,458 | |
| | | | | | | | |
| | | | | | | 25,019,261 | |
| | |
| | Austria – 0.3% | |
| | 1,532 | | | ams AG (Semiconductors & Semiconductor Equipment) | | | 254,291 | |
| | 14,397 | | | OMV AG (Energy) | | | 650,384 | |
| | | | | | | | |
| | | | | | | 904,675 | |
| | |
| | Belgium – 0.9% | |
| | 6,916 | | | Anheuser-Busch InBev NV (Food, Beverage & Tobacco) | | | 794,651 | |
| | 4,659 | | | Bekaert SA NV (Materials) | | | 174,100 | |
| | 33,506 | | | KBC Groep NV (Banks)* | | | 1,822,764 | |
| | | | | | | | |
| | | | | | | 2,791,515 | |
| | |
| | Bermuda – 0.2% | |
| | 29,270 | | | Catlin Group Ltd. (Insurance) | | | 267,855 | |
| | 15,579 | | | Hiscox Ltd. (Insurance) | | | 188,499 | |
| | | | | | | | |
| | | | | | | 456,354 | |
| | |
| | China – 0.1% | |
| | 64,000 | | | AAC Technologies Holdings, Inc. (Technology Hardware & Equipment) | | | 416,516 | |
| | |
| | Denmark – 0.5% | |
| | 9,877 | | | GN Store Nord A/S (Health Care Equipment & Services) | | | 283,061 | |
| | 4,653 | | | H Lundbeck A/S (Pharmaceuticals, Biotechnology & Life Sciences) | | | 114,512 | |
| | 5,510 | | | Novo Nordisk A/S (Pharmaceuticals, Biotechnology & Life Sciences) | | | 254,303 | |
| | 15,764 | | | Vestas Wind Systems A/S (Capital Goods)* | | | 795,430 | |
| | | | | | | | |
| | | | | | | 1,447,306 | |
| | |
| | | | | | | | |
| | Common Stocks – (continued) | |
| | Finland – 1.3% | |
| | 34,490 | | | Fortum OYJ (Utilities) | | $ | 926,125 | |
| | 79,916 | | | Neste Oil OYJ (Energy) | | | 1,559,363 | |
| | 29,242 | | | Orion OYJ (Pharmaceuticals, Biotechnology & Life Sciences) | | | 1,089,930 | |
| | 15,663 | | | Ramirent OYJ (Capital Goods) | | | 175,086 | |
| | 12,357 | | | Rautaruukki OYJ (Materials)* | | | 173,379 | |
| | | | | | | | |
| | | | | | | 3,923,883 | |
| | |
| | France – 11.1% | | | | |
| | 40,355 | | | AXA SA (Insurance) | | | 964,216 | |
| | 34,896 | | | BNP Paribas SA (Banks) | | | 2,371,489 | |
| | 1,201 | | | Ciments Francais SA (Materials) | | | 130,740 | |
| | 985 | | | Compagnie de Saint-Gobain (Capital Goods) | | | 55,576 | |
| | 26,635 | | | Compagnie Generale des Etablissements Michelin (Automobiles & Components) | | | 3,180,278 | |
| | 134,669 | | | Credit Agricole SA (Banks) | | | 1,901,373 | |
| | 4,219 | | | Danone SA (Food, Beverage & Tobacco) | | | 313,718 | |
| | 8,371 | | | Electricite de France SA (Utilities) | | | 263,585 | |
| | 7,096 | | | Fonciere Des Regions (REIT) | | | 769,723 | |
| | 10,418 | | | Gecina SA (REIT) | | | 1,517,948 | |
| | 5,792 | | | Lagardere SCA (Media) | | | 188,713 | |
| | 60,073 | | | Legrand SA (Capital Goods) | | | 3,678,906 | |
| | 256,592 | | | Natixis (Banks) | | | 1,646,782 | |
| | 24,447 | | | Plastic Omnium SA (Automobiles & Components) | | | 766,803 | |
| | 19,402 | | | Renault SA (Automobiles & Components) | | | 1,753,838 | |
| | 24,451 | | | Sanofi (Pharmaceuticals, Biotechnology & Life Sciences) | | | 2,598,886 | |
| | 5,699 | | | Schneider Electric SE (Capital Goods) | | | 537,378 | |
| | 89,669 | | | Suez Environnement Co. (Utilities) | | | 1,715,384 | |
| | 4,921 | | | Thales SA (Capital Goods) | | | 297,545 | |
| | 68,318 | | | Total SA (Energy) | | | 4,942,786 | |
| | 7,433 | | | Valeo SA (Automobiles & Components) | | | 997,320 | |
| | 34,300 | | | Vinci SA (Capital Goods) | | | 2,564,226 | |
| | | | | | | | |
| | | | | | | 33,157,213 | |
| | |
| | Germany – 6.7% | | | | |
| | 6,330 | | | Allianz SE (Registered) (Insurance) | | | 1,056,565 | |
| | 6,307 | | | BASF SE (Materials) | | | 733,653 | |
| | 15,296 | | | Bayer AG (Registered) (Pharmaceuticals, Biotechnology & Life Sciences) | | | 2,157,856 | |
| | 42,402 | | | Celesio AG (Health Care Equipment & Services)* | | | 1,507,805 | |
| | 8,158 | | | Continental AG (Automobiles & Components) | | | 1,886,217 | |
| | 594 | | | Daimler AG (Registered) (Automobiles & Components) | | | 55,488 | |
| | 65,679 | | | Deutsche Lufthansa AG (Registered) (Transportation)(a) | | | 1,409,935 | |
| | 22,764 | | | Drillisch AG (Telecommunication Services) | | | 904,419 | |
| | 123,094 | | | E.ON SE (Utilities) | | | 2,537,652 | |
| | |
| | |
| The accompanying notes are an integral part of these financial statements. | | 43 |
GOLDMAN SACHS INTERNATIONAL TAX-MANAGED EQUITY FUND
Schedule of Investments (continued)
June 30, 2014 (Unaudited)
| | | | | | | | |
Shares | | | Description | | Value | |
| | | | | | | | |
| | Common Stocks – (continued) | |
| | Germany – (continued) | | | | |
| | 47,591 | | | Freenet AG (Telecommunication Services) | | $ | 1,511,360 | |
| | 706 | | | Henkel AG & Co. KGaA (Household & Personal Products) | | | 70,999 | |
| | 9,843 | | | Hochtief AG (Capital Goods) | | | 851,894 | |
| | 1,971 | | | KUKA AG (Capital Goods) | | | 119,189 | |
| | 21,217 | | | Leoni AG (Automobiles & Components) | | | 1,685,924 | |
| | 4,970 | | | Merck KGaA (Pharmaceuticals, Biotechnology & Life Sciences) | | | 430,982 | |
| | 78,764 | | | Nordex SE (Capital Goods)* | | | 1,744,582 | |
| | 5,007 | | | OSRAM Licht AG (Capital Goods)* | | | 252,150 | |
| | 4,580 | | | ProSiebenSat.1 Media AG (Registered) (Media)(a) | | | 203,851 | |
| | 18,955 | | | United Internet AG (Registered) (Software & Services) | | | 832,734 | |
| | 1,096 | | | XING AG (Software & Services) | | | 135,485 | |
| | | | | | | | |
| | | | | | | 20,088,740 | |
| | |
| | Hong Kong – 3.2% | |
| | 168,000 | | | AIA Group Ltd. (Insurance) | | | 844,135 | |
| | 81,500 | | | BOC Hong Kong Holdings Ltd. (Banks) | | | 236,111 | |
| | 115,000 | | | Cheung Kong Infrastructure Holdings Ltd. (Utilities) | | | 794,436 | |
| | 27,000 | | | CLP Holdings Ltd. (Utilities) | | | 221,803 | |
| | 16,100 | | | Hang Seng Bank Ltd. (Banks) | | | 262,905 | |
| | 502,700 | | | Hong Kong & China Gas Co. Ltd. (Utilities) | | | 1,100,045 | |
| | 171,000 | | | Hutchison Whampoa Ltd. (Capital Goods) | | | 2,338,692 | |
| | 99,600 | | | MGM China Holdings Ltd. (Consumer Services) | | | 345,425 | |
| | 1,867,000 | | | Noble Group Ltd. (Capital Goods) | | | 2,054,997 | |
| | 243,000 | | | SJM Holdings Ltd. (Consumer Services) | | | 608,750 | |
| | 35,000 | | | Swire Pacific Ltd. (Real Estate) | | | 430,792 | |
| | 32,000 | | | Wheelock & Co. Ltd. (Real Estate) | | | 133,588 | |
| | 70,000 | | | Wynn Macau Ltd. (Consumer Services) | | | 274,167 | |
| | | | | | | | |
| | | | | | | 9,645,846 | |
| | |
| | India – 0.1% | |
| | 18,291 | | | Vedanta Resources PLC (Materials) | | | 346,896 | |
| | |
| | Ireland – 1.5% | | | | |
| | 117,856 | | | James Hardie Industries PLC CDI (Materials) | | | 1,537,532 | |
| | 38,332 | | | Shire PLC (Pharmaceuticals, Biotechnology & Life Sciences) | | | 3,006,880 | |
| | 51,264 | | | Total Produce PLC (Food & Staples Retailing) | | | 77,917 | |
| | | | | | | | |
| | | | | | | 4,622,329 | |
| | |
| | Israel – 0.0% | | | | |
| | 6,854 | | | Mizrahi Tefahot Bank Ltd. (Banks) | | | 88,612 | |
| | |
| | | | | | | | |
| | Common Stocks – (continued) | |
| | Italy – 2.4% | | | | |
| | 60,296 | | | A2A SpA (Utilities)(a) | | $ | 69,438 | |
| | 6,149 | | | ASTM SpA (Transportation) | | | 97,275 | |
| | 7,358 | | | Banca IFIS SpA (Diversified Financials) | | | 136,626 | |
| | 625,815 | | | Banca Popolare di Milano Scarl (Banks)* | | | 560,273 | |
| | 12,564 | | | Credito Emiliano SpA (Banks) | | | 112,268 | |
| | 27,209 | | | Enel SpA (Utilities) | | | 158,265 | |
| | 1,626 | | | Exor SpA (Diversified Financials) | | | 66,702 | |
| | 18,973 | | | Gtech SpA (Consumer Services)(a) | | | 463,568 | |
| | 783,918 | | | Intesa Sanpaolo SpA (Banks) | | | 2,307,955 | |
| | 200,071 | | | Iren SpA (Utilities) | | | 308,731 | |
| | 131,653 | | | Mediaset SpA (Media)* | | | 641,195 | |
| | 288,727 | | | UniCredit SpA (Banks) | | | 2,414,154 | |
| | | | | | | | |
| | | | | | | 7,336,450 | |
| | |
| | Japan – 18.3% | |
| | 19,800 | | | Accordia Golf Co. Ltd. (Consumer Services) | | | 262,806 | |
| | 14,200 | | | AEON Financial Service Co. Ltd. (Diversified Financials) | | | 371,388 | |
| | 2,800 | | | Aisin Seiki Co. Ltd. (Automobiles & Components) | | | 111,457 | |
| | 2,500 | | | Alfresa Holdings Corp. (Health Care Equipment & Services) | | | 161,182 | |
| | 21,000 | | | Amada Co. Ltd. (Capital Goods) | | | 213,904 | |
| | 3,500 | | | Asahi Group Holdings Ltd. (Food, Beverage & Tobacco) | | | 109,910 | |
| | 177,400 | | | Astellas Pharma, Inc. (Pharmaceuticals, Biotechnology & Life Sciences) | | | 2,332,911 | |
| | 33,800 | | | Avex Group Holdings, Inc. (Media) | | | 595,546 | |
| | 14,400 | | | Bandai Namco Holdings, Inc. (Consumer Durables & Apparel) | | | 337,617 | |
| | 5,800 | | | Bridgestone Corp. (Automobiles & Components) | | | 203,136 | |
| | 32,000 | | | Calbee, Inc. (Food, Beverage & Tobacco) | | | 881,907 | |
| | 13,400 | | | Capcom Co. Ltd. (Software & Services) | | | 227,199 | |
| | 3,800 | | | Central Japan Railway Co. (Transportation) | | | 542,443 | |
| | 25,100 | | | Coca-Cola West Co. Ltd. (Food, Beverage & Tobacco) | | | 432,844 | |
| | 1,100 | | | Cosmos Pharmaceutical Corp. (Food & Staples Retailing) | | | 116,095 | |
| | 25,000 | | | Daihen Corp. (Capital Goods) | | | 116,845 | |
| | 111,900 | | | Daiichi Sankyo Co. Ltd. (Pharmaceuticals, Biotechnology & Life Sciences) | | | 2,091,607 | |
| | 41,000 | | | Daiwa Securities Group, Inc. (Diversified Financials) | | | 355,235 | |
| | 11,700 | | | Doutor Nichires Holdings Co. Ltd. (Consumer Services) | | | 207,301 | |
| | 12,000 | | | East Japan Railway Co. (Transportation) | | | 945,505 | |
| | 4,000 | | | Electric Power Development Co. Ltd. (Utilities) | | | 129,803 | |
| | 18,900 | | | FIDEA Holdings Co. Ltd. (Banks) | | | 39,004 | |
| | |
| | |
| 44 | | The accompanying notes are an integral part of these financial statements. |
GOLDMAN SACHS INTERNATIONAL TAX-MANAGED EQUITY FUND
| | | | | | | | |
Shares | | | Description | | Value | |
| | | | | | | | |
| | Common Stocks – (continued) | |
| | Japan – (continued) | |
| | 24,000 | | | Fuji Heavy Industries Ltd. (Automobiles & Components) | | $ | 665,490 | |
| | 14,700 | | | FUJIFILM Holdings Corp. (Technology Hardware & Equipment) | | | 410,286 | |
| | 7,000 | | | Fujitsu General Ltd. (Consumer Durables & Apparel) | | | 77,216 | |
| | 16,000 | | | Fujitsu Ltd. (Software & Services) | | | 119,886 | |
| | 1,100 | | | Fuyo General Lease Co. Ltd. (Diversified Financials) | | | 49,190 | |
| | 12,600 | | | Heiwa Real Estate Co. Ltd. (Real Estate) | | | 202,854 | |
| | 2,800 | | | HIS Co. Ltd. (Consumer Services) | | | 90,436 | |
| | 7,500 | | | Hisamitsu Pharmaceutical Co., Inc. (Pharmaceuticals, Biotechnology & Life Sciences) | | | 335,378 | |
| | 68,000 | | | Hitachi Ltd. (Technology Hardware & Equipment) | | | 498,377 | |
| | 79,500 | | | Honda Motor Co. Ltd. (Automobiles & Components) | | | 2,774,134 | |
| | 4,900 | | | ITOCHU Corp. (Capital Goods) | | | 62,905 | |
| | 26,700 | | | Japan Airlines Co. Ltd. (Transportation) | | | 1,476,230 | |
| | 4,600 | | | Japan Digital Laboratory Co. Ltd. (Technology Hardware & Equipment) | | | 81,324 | |
| | 10,200 | | | JTEKT Corp. (Capital Goods) | | | 172,103 | |
| | 10,400 | | | Kao Corp. (Household & Personal Products) | | | 409,591 | |
| | 165,000 | | | Kawasaki Kisen Kaisha Ltd. (Transportation) | | | 345,564 | |
| | 6,500 | | | KDDI Corp. (Telecommunication Services) | | | 396,588 | |
| | 7,000 | | | Kinden Corp. (Capital Goods) | | | 68,116 | |
| | 35,000 | | | Kirin Holdings Co. Ltd. (Food, Beverage & Tobacco) | | | 505,359 | |
| | 21,900 | | | Konica Minolta, Inc. (Technology Hardware & Equipment) | | | 216,462 | |
| | 4,500 | | | Kuroda Electric Co. Ltd. (Capital Goods) | | | 69,434 | |
| | 4,100 | | | Kyocera Corp. (Technology Hardware & Equipment) | | | 194,684 | |
| | 17,800 | | | Kyokuto Securities Co. Ltd. (Diversified Financials)(a) | | | 308,505 | |
| | 7,700 | | | Kyushu Electric Power Co., Inc. (Utilities) | | | 86,686 | |
| | 3,600 | | | Mandom Corp. (Household & Personal Products) | | | 128,091 | |
| | 14,000 | | | Marudai Food Co. Ltd. (Food, Beverage & Tobacco) | | | 46,560 | |
| | 5,900 | | | Matsumotokiyoshi Holdings Co. Ltd. (Food & Staples Retailing) | | | 204,215 | |
| | 3,600 | | | Melco Holdings, Inc. (Technology Hardware & Equipment) | | | 73,069 | |
| | 126,000 | | | Mitsubishi Electric Corp. (Capital Goods) | | | 1,556,445 | |
| | 520,900 | | | Mitsubishi UFJ Financial Group, Inc. (Banks) | | | 3,197,658 | |
| | 102,300 | | | Mitsui & Co. Ltd. (Capital Goods) | | | 1,640,036 | |
| | 57,000 | | | Mitsui Fudosan Co. Ltd. (Real Estate) | | | 1,923,708 | |
| | |
| | | | | | | | |
| | Common Stocks – (continued) | |
| | Japan – (continued) | |
| | 12,000 | | | Mitsui Sugar Co. Ltd. (Food, Beverage & Tobacco) | | $ | 45,362 | |
| | 204,600 | | | Mizuho Financial Group, Inc. (Banks) | | | 420,556 | |
| | 38,000 | | | Nippon Formula Feed Manufacturing Co. Ltd. (Food, Beverage & Tobacco) | | | 43,848 | |
| | 43,600 | | | Nippon Light Metal Holdings Co. Ltd. (Materials) | | | 66,410 | |
| | 8,100 | | | Nippon Paper Industries Co. Ltd. (Materials) | | | 152,337 | |
| | 19,700 | | | Nippon Telegraph & Telephone Corp. (Telecommunication Services) | | | 1,227,859 | |
| | 35,900 | | | Nissan Motor Co. Ltd. (Automobiles & Components) | | | 339,954 | |
| | 2,400 | | | Nissin Foods Holdings Co. Ltd. (Food, Beverage & Tobacco) | | | 123,392 | |
| | 2,100 | | | Noevir Holdings Co. Ltd. (Household & Personal Products) | | | 42,145 | |
| | 64,600 | | | Nomura Holdings, Inc. (Diversified Financials) | | | 457,582 | |
| | 7,400 | | | Nomura Real Estate Holdings, Inc. (Real Estate) | | | 140,161 | |
| | 2,500 | | | NS Solutions Corp. (Software & Services) | | | 68,273 | |
| | 22,500 | | | NTT Data Corp. (Software & Services) | | | 865,271 | |
| | 4,000 | | | Paltac Corp. (Retailing) | | | 56,348 | |
| | 21,000 | | | Ricoh Co. Ltd. (Technology Hardware & Equipment) | | | 250,292 | |
| | 3,000 | | | Riso Kagaku Corp. (Technology Hardware & Equipment) | | | 85,087 | |
| | 13,200 | | | Rohm Co. Ltd. (Semiconductors & Semiconductor Equipment) | | | 757,085 | |
| | 53,100 | | | Rohto Pharmaceutical Co. Ltd. (Pharmaceuticals, Biotechnology & Life Sciences) | | | 825,962 | |
| | 21,000 | | | Ryobi Ltd. (Capital Goods) | | | 70,973 | |
| | 13,000 | | | Sankyu, Inc. (Transportation) | | | 65,853 | |
| | 7,500 | | | Santen Pharmaceutical Co. Ltd. (Pharmaceuticals, Biotechnology & Life Sciences) | | | 422,513 | |
| | 50,300 | | | Seiko Epson Corp. (Technology Hardware & Equipment) | | | 2,139,973 | |
| | 19,000 | | | Sekisui Chemical Co. Ltd. (Consumer Durables & Apparel) | | | 220,279 | |
| | 28,900 | | | Seven & I Holdings Co. Ltd. (Food & Staples Retailing) | | | 1,218,130 | |
| | 57,200 | | | Shionogi & Co. Ltd. (Pharmaceuticals, Biotechnology & Life Sciences) | | | 1,194,714 | |
| | 7,900 | | | Showa Corp. (Automobiles & Components) | | | 96,246 | |
| | 174,000 | | | Showa Denko KK (Materials) | | | 247,573 | |
| | 17,000 | | | SKY Perfect JSAT Holdings, Inc. (Media) | | | 99,685 | |
| | 11,800 | | | SoftBank Corp. (Telecommunication Services) | | | 879,371 | |
| | 43,500 | | | Sumitomo Corp. (Capital Goods) | | | 586,952 | |
| | |
| | |
| The accompanying notes are an integral part of these financial statements. | | 45 |
GOLDMAN SACHS INTERNATIONAL TAX-MANAGED EQUITY FUND
Schedule of Investments (continued)
June 30, 2014 (Unaudited)
| | | | | | | | |
Shares | | | Description | | Value | |
| | | | | | | | |
| | Common Stocks – (continued) | |
| | Japan – (continued) | |
| | 139,100 | | | Sumitomo Dainippon Pharma Co. Ltd. (Pharmaceuticals, Biotechnology & Life Sciences) | | $ | 1,600,836 | |
| | 40,500 | | | Sumitomo Electric Industries Ltd. (Capital Goods) | | | 570,138 | |
| | 15,000 | | | Sumitomo Heavy Industries Ltd. (Capital Goods) | | | 71,399 | |
| | 21,700 | | | Sumitomo Mitsui Financial Group, Inc. (Banks) | | | 910,465 | |
| | 202,000 | | | Sumitomo Mitsui Trust Holdings, Inc. (Banks) | | | 923,240 | |
| | 8,500 | | | T&D Holdings, Inc. (Insurance) | | | 115,613 | |
| | 16,400 | | | The Chugoku Electric Power Co., Inc. (Utilities) | | | 223,474 | |
| | 28,200 | | | The Dai-ichi Life Insurance Co. Ltd. (Insurance) | | | 420,254 | |
| | 24,600 | | | The Kansai Electric Power Co., Inc. (Utilities)* | | | 231,883 | |
| | 12,000 | | | The Nippon Road Co. Ltd. (Capital Goods) | | | 67,545 | |
| | 20,300 | | | Tohoku Electric Power Co., Inc. (Utilities) | | | 237,575 | |
| | 54,600 | | | Tokio Marine Holdings, Inc. (Insurance) | | | 1,797,091 | |
| | 18,000 | | | Tokyo Tatemono Co. Ltd. (Real Estate) | | | 166,723 | |
| | 1,800 | | | Towa Pharmaceutical Co. Ltd. (Pharmaceuticals, Biotechnology & Life Sciences) | | | 73,350 | |
| | 26,800 | | | Toyota Motor Corp. (Automobiles & Components) | | | 1,604,586 | |
| | 8,200 | | | Trend Micro, Inc. (Software & Services) | | | 270,205 | |
| | 9,800 | | | Tv Tokyo Holdings Corp. (Media) | | | 153,260 | |
| | 17,200 | | | Unicharm Corp. (Household & Personal Products) | | | 1,025,487 | |
| | 2,900 | | | Wacom Co. Ltd. (Technology Hardware & Equipment)(a) | | | 16,552 | |
| | 43,400 | | | West Japan Railway Co. (Transportation) | | | 1,911,791 | |
| | | | | | | | |
| | | | | | | 54,773,878 | |
| | |
| | Luxembourg – 0.2% | |
| | 14,441 | | | Aperam (Materials)* | | | 487,648 | |
| | |
| | Netherlands – 3.9% | |
| | 5,125 | | | Eurocommercial Properties NV CVA (Real Estate) | | | 253,016 | |
| | 2,877 | | | Heineken Holding NV (Food, Beverage & Tobacco) | | | 189,062 | |
| | 127,308 | | | ING Groep NV CVA (Diversified Financials)* | | | 1,786,448 | |
| | 92,664 | | | Koninklijke Ahold NV (Food & Staples Retailing) | | | 1,737,551 | |
| | 25,722 | | | Randstad Holding NV (Commercial & Professional Services) | | | 1,394,368 | |
| | 86,111 | | | Royal Dutch Shell PLC Class A (Energy) | | | 3,555,655 | |
| | |
| | | | | | | | |
| | Common Stocks – (continued) | |
| | Netherlands – (continued) | |
| | 58,022 | | | Royal Dutch Shell PLC Class B (Energy) | | $ | 2,521,643 | |
| | 3,382 | | | Vastned Retail NV | | | 172,283 | |
| | | | | | | | |
| | | | | | | 11,610,026 | |
| | |
| | Norway – 2.2% | |
| | 13,288 | | | DNB ASA (Banks) | | | 242,789 | |
| | 47,005 | | | Gjensidige Forsikring ASA (Insurance) | | | 842,953 | |
| | 85,559 | | | Kongsberg Automotive Holding ASA (Automobiles & Components)* | | | 98,843 | |
| | 341,451 | | | Norsk Hydro ASA (Materials) | | | 1,828,330 | |
| | 49,336 | | | Orkla ASA (Food, Beverage & Tobacco) | | | 439,039 | |
| | 29,392 | | | Statoil ASA (Energy) | | | 903,477 | |
| | 14,758 | | | Telenor ASA (Telecommunication Services) | | | 336,017 | |
| | 38,335 | | | Yara International ASA (Materials) | | | 1,920,547 | |
| | | | | | | | |
| | | | | | | 6,611,995 | |
| | |
| | Portugal – 0.1% | | | | |
| | 1,152,180 | | | Banco Comercial Portugues SA (Banks)*(a) | | | 301,141 | |
| | |
| | Singapore – 1.7% | | | | |
| | 224,000 | | | Cityspring Infrastructure Trust (Utilities) | | | 85,368 | |
| | 56,504 | | | DBS Group Holdings Ltd. (Banks) | | | 759,962 | |
| | 80,000 | | | Fortune Real Estate Investment Trust (REIT) | | | 70,218 | |
| | 26,000 | | | Jardine Cycle & Carriage Ltd. (Retailing) | | | 924,039 | |
| | 109,000 | | | Oversea-Chinese Banking Corp. Ltd. (Banks) | | | 836,044 | |
| | 120,000 | | | Singapore Telecommunications Ltd. (Telecommunication Services) | | | 370,883 | |
| | 6,000 | | | United Overseas Bank Ltd. (Banks) | | | 108,496 | |
| | 69,000 | | | UOL Group Ltd. (Real Estate) | | | 361,175 | |
| | 609,000 | | | Wilmar International Ltd. (Food, Beverage & Tobacco) | | | 1,558,954 | |
| | | | | | | | |
| | | | | | | 5,075,139 | |
| | |
| | Spain – 4.6% | | | | |
| | 2,482 | | | ACS Actividades de Construccion y Servicios SA (Capital Goods) | | | 113,602 | |
| | 89,214 | | | Amadeus IT Holding SA (Software & Services) | | | 3,677,694 | |
| | 70,257 | | | Banco Bilbao Vizcaya Argentaria SA (Banks) | | | 895,455 | |
| | 22,193 | | | Banco Popular Espanol SA (Banks) | | | 148,257 | |
| | 31,184 | | | Banco Santander SA (Banks) | | | 325,850 | |
| | 7,739 | | | Bankinter SA (Banks) | | | 60,565 | |
| | 72,980 | | | Ferrovial SA (Capital Goods) | | | 1,626,063 | |
| | 146,656 | | | Gamesa Corp. Tecnologica SA (Capital Goods)* | | | 1,829,169 | |
| | 65,638 | | | Gas Natural SDG SA (Utilities)(a) | | | 2,073,717 | |
| | |
| | |
| 46 | | The accompanying notes are an integral part of these financial statements. |
GOLDMAN SACHS INTERNATIONAL TAX-MANAGED EQUITY FUND
| | | | | | | | |
Shares | | | Description | | Value | |
| | | | | | | | |
| | Common Stocks – (continued) | |
| | Spain – (continued) | | | | |
| | 6,472 | | | Grupo Catalana Occidente SA (Insurance) | | $ | 234,930 | |
| | 93,447 | | | Iberdrola SA (Utilities) | | | 714,827 | |
| | 23,745 | | | Mediaset Espana Comunicacion SA (Media)* | | | 277,101 | |
| | 65,213 | | | Repsol SA (Energy)(a) | | | 1,719,450 | |
| | | | | | | | |
| | | | | | | 13,696,680 | |
| | |
| | Sweden – 3.3% | |
| | 4,588 | | | Axfood AB (Food & Staples Retailing) | | | 249,191 | |
| | 4,019 | | | Hennes & Mauritz AB (Retailing) | | | 175,469 | |
| | 5,747 | | | NCC AB (Capital Goods) | | | 197,807 | |
| | 216,928 | | | Nordea Bank AB (Banks) | | | 3,058,240 | |
| | 157,156 | | | Skandinaviska Enskilda Banken AB (Banks) | | | 2,097,680 | |
| | 80,133 | | | Skanska AB (Capital Goods) | | | 1,829,297 | |
| | 18,969 | | | Swedbank AB (Banks) | | | 502,434 | |
| | 52,299 | | | Swedish Match AB (Food, Beverage & Tobacco) | | | 1,815,951 | |
| | | | | | | | |
| | | | | | | 9,926,069 | |
| | |
| | Switzerland – 5.9% | |
| | 19,312 | | | Actelion Ltd. (Registered) (Pharmaceuticals, Biotechnology & Life Sciences)* | | | 2,444,315 | |
| | 3,776 | | | Basilea Pharmaceutica (Registered) (Pharmaceuticals, Biotechnology & Life Sciences)* | | | 439,992 | |
| | 3,524 | | | EMS-Chemie Holding AG (Registered) (Materials) | | | 1,406,237 | |
| | 5,140 | | | Geberit AG (Registered) (Capital Goods) | | | 1,803,080 | |
| | 65 | | | Gurit Holding AG (Materials)* | | | 32,910 | |
| | 5,582 | | | Kudelski SA (Technology Hardware & Equipment) | | | 97,835 | |
| | 24 | | | Lindt & Spruengli AG (Registered) (Food, Beverage & Tobacco) | | | 1,482,544 | |
| | 1,606 | | | Lonza Group AG (Registered) (Pharmaceuticals, Biotechnology & Life Sciences)* | | | 174,650 | |
| | 9,857 | | | Nestle SA (Registered) (Food, Beverage & Tobacco) | | | 763,789 | |
| | 14,028 | | | Novartis AG (Registered) (Pharmaceuticals, Biotechnology & Life Sciences) | | | 1,270,353 | |
| | 75,899 | | | OC Oerlikon Corp. AG (Registered) (Capital Goods)* | | | 1,098,623 | |
| | 12,762 | | | Roche Holding AG (Pharmaceuticals, Biotechnology & Life Sciences) | | | 3,791,976 | |
| | 64 | | | Sika AG (Materials) | | | 261,479 | |
| | 26,181 | | | Swiss Re AG (Insurance)* | | | 2,327,942 | |
| | 1,267 | | | U-Blox AG (Semiconductors & Semiconductor Equipment)* | | | 167,902 | |
| | | | | | | | |
| | | | | | | 17,563,627 | |
| | |
| | | | | | | | |
| | Common Stocks – (continued) | |
| | United Kingdom – 14.1% | |
| | 16,828 | | | Aberdeen Asset Management PLC (Diversified Financials) | | $ | 130,599 | |
| | 4,294 | | | Admiral Group PLC (Insurance) | | | 113,777 | |
| | 20,255 | | | AstraZeneca PLC (Pharmaceuticals, Biotechnology & Life Sciences) | | | 1,506,925 | |
| | 69,647 | | | BAE Systems PLC (Capital Goods) | | | 515,857 | |
| | 54,919 | | | Barclays PLC (Banks) | | | 200,058 | |
| | 17,962 | | | BHP Billiton PLC (Materials) | | | 583,927 | |
| | 6,399 | | | Bodycote PLC (Capital Goods) | | | 75,224 | |
| | 82,396 | | | BP PLC ADR (Energy)(b) | | | 4,346,389 | |
| | 64,772 | | | British American Tobacco PLC (Food, Beverage & Tobacco) | | | 3,854,082 | |
| | 27,422 | | | BT Group PLC (Telecommunication Services) | | | 180,192 | |
| | 14,449 | | | Cobham PLC (Capital Goods) | | | 77,195 | |
| | 15,032 | | | Diageo PLC (Food, Beverage & Tobacco) | | | 478,756 | |
| | 78,621 | | | easyJet PLC (Transportation) | | | 1,836,013 | |
| | 58,626 | | | GlaxoSmithKline PLC ADR (Pharmaceuticals, Biotechnology & Life Sciences)(b) | | | 3,135,318 | |
| | 36,733 | | | Hammerson PLC (REIT) | | | 364,493 | |
| | 429,774 | | | HSBC Holdings PLC (Banks) | | | 4,360,091 | |
| | 5,923 | | | IG Group Holdings PLC (Diversified Financials) | | | 59,504 | |
| | 26,588 | | | IMI PLC (Capital Goods) | | | 676,063 | |
| | 31,752 | | | Imperial Tobacco Group PLC (Food, Beverage & Tobacco) | | | 1,428,461 | |
| | 119,083 | | | Intermediate Capital Group PLC (Diversified Financials) | | | 794,849 | |
| | 181,719 | | | ITV PLC (Media) | | | 553,780 | |
| | 7,482 | | | Lancashire Holdings Ltd. (Insurance) | | | 83,743 | |
| | 21,924 | | | Land Securities Group PLC (REIT) | | | 388,482 | |
| | 93,620 | | | Lavendon Group PLC (Capital Goods) | | | 330,857 | |
| | 104,522 | | | Mondi PLC (Materials) | | | 1,897,587 | |
| | 30,742 | | | National Grid PLC (Utilities) | | | 442,587 | |
| | 9,667 | | | Next PLC (Retailing) | | | 1,070,167 | |
| | 810 | | | Rank Group PLC (Consumer Services) | | | 2,316 | |
| | 29,344 | | | Reckitt Benckiser Group PLC (Household & Personal Products) | | | 2,558,655 | |
| | 9,999 | | | Rio Tinto PLC (Materials) | | | 539,889 | |
| | 37,298 | | | Severn Trent PLC (Utilities) | | | 1,232,988 | |
| | 125,246 | | | Standard Chartered PLC (Banks) | | | 2,560,039 | |
| | 20,990 | | | Subsea 7 SA (Energy) | | | 391,243 | |
| | 12,330 | | | TalkTalk Telecom Group PLC (Telecommunication Services) | | | 68,639 | |
| | 25,784 | | | Tetragon Financial Group Ltd. (Diversified Financials) | | | 258,768 | |
| | 217,857 | | | TUI Travel PLC (Consumer Services) | | | 1,483,053 | |
| | 26,766 | | | Unilever PLC (Food, Beverage & Tobacco) | | | 1,213,289 | |
| | 72,703 | | | Vodafone Group PLC ADR (Telecommunication Services)(b) | | | 2,427,553 | |
| | | | | | | | |
| | | | | | | 42,221,408 | |
| | |
| | |
| The accompanying notes are an integral part of these financial statements. | | 47 |
GOLDMAN SACHS INTERNATIONAL TAX-MANAGED EQUITY FUND
Schedule of Investments (continued)
June 30, 2014 (Unaudited)
| | | | | | | | |
Shares | | | Description | | Value | |
| | | | | | | | |
| | Common Stocks – (continued) | |
| | United States – 0.0% | |
| | 9,407 | | | APR Energy PLC (Utilities) | | $ | 104,409 | |
| | |
| | TOTAL COMMON STOCKS | |
| | (Cost $217,875,103) | | $ | 272,617,616 | |
| | |
| | | | | | | | |
| | Preferred Stocks – 1.2% | |
| | Germany – 1.2% | | | | |
| | 14,255 | | | Henkel AG & Co. KGaA (Household & Personal Products) | | $ | 1,646,913 | |
| | 16,189 | | | Porsche Automobil Holding SE (Automobiles & Components) | | | 1,683,211 | |
| | 6,224 | | | Sixt SE (Transportation) | | | 202,925 | |
| | |
| | TOTAL PREFERRED STOCKS | |
| | (Cost $2,571,703) | | $ | 3,533,049 | |
| | |
| TOTAL INVESTMENTS BEFORE SECURITIES LENDING
REINVESTMENT VEHICLE |
|
| | (Cost $220,446,806) | | $ | 276,150,665 | |
| | |
| | | | | | | | |
| Shares | | | Distribution
Rate | | Value | |
| | Securities Lending Reinvestment Vehicle(c)(d) – 1.1% | |
| Goldman Sachs Financial Square Money Market
Fund – FST Shares |
|
| | 3,352,170 | | | 0.066% | | $ | 3,352,170 | |
| | (Cost $3,352,170) | | | | |
| | |
| | TOTAL INVESTMENTS – 93.2% | |
| | (Cost $223,798,976) | | $ | 279,502,835 | |
| | |
| OTHER ASSETS IN EXCESS OF
LIABILITIES – 6.8% | | | 20,262,913 | |
| | |
| | NET ASSETS – 100.0% | | $ | 299,765,748 | |
| | |
| | |
| The percentage shown for each investment category reflects the value of investments in that category as a percentage of net assets. |
* | | Non-income producing security. |
(a) | | All or a portion of security is on loan. |
(b) | | All or a portion of security is segregated as collateral for initial margin requirements on futures transactions. |
(c) | | Variable rate security. Interest rate or distribution rate disclosed is that which is in effect at June 30, 2014. |
(d) | | Represents an affiliated issuer. |
| | |
|
Investment Abbreviations: |
ADR | | —American Depositary Receipt |
CDI | | —CHESS Depositary Interest |
CVA | | —Dutch Certification |
REIT | | —Real Estate Investment Trust |
|
| | |
| 48 | | The accompanying notes are an integral part of these financial statements. |
GOLDMAN SACHS INTERNATIONAL TAX-MANAGED EQUITY FUND
|
| ADDITIONAL INVESTMENT INFORMATION |
FUTURES CONTRACTS — At June 30, 2014, the Fund had the following futures contracts:
| | | | | | | | | | | | | | |
| Type | | Number of
Contracts
Long (Short) | | | Expiration Date | | Current Value | | | Unrealized
Gain (Loss) | |
EURO STOXX 50 Index | | | 182 | | | September 2014 | | $ | 8,054,551 | | | $ | (116,953 | ) |
FTSE 100 Index | | | 33 | | | September 2014 | | | 3,790,118 | | | | (18,299 | ) |
Hang Seng Index | | | 2 | | | July 2014 | | | 298,101 | | | | 4,160 | |
MSCI Singapore Index | | | 4 | | | July 2014 | | | 237,710 | | | | (790 | ) |
SPI 200 Index | | | 11 | | | September 2014 | | | 1,388,352 | | | | (1,053 | ) |
TSE TOPIX Index | | | 29 | | | September 2014 | | | 3,614,086 | | | | 47,926 | |
| TOTAL | | | | | | | | | | | | $ | (85,009 | ) |
| | |
| The accompanying notes are an integral part of these financial statements. | | 49 |
GOLDMAN SACHS TAX-ADVANTAGED EQUITY FUNDS
Statements of Assets and Liabilities
June 30, 2014 (Unaudited)
| | | | | | | | | | | | | | | | | | |
| | | | | U.S. Equity Dividend and Premium Fund | | | International Equity Dividend and
Premium Fund | | | U.S. Tax-
Managed
Equity Fund | | | International
Tax-Managed
Equity Fund | |
| Assets: | |
| | Investments in unaffiliated issuers, at value (cost $1,127,253,189, $446,672,672, $446,335,445 and $220,446,806)(a) | | $ | 1,328,465,263 | | | $ | 460,307,357 | | | $ | 620,801,423 | | | $ | 276,150,665 | |
| | Investments in affiliated securities lending reinvestment vehicle, at value which equals cost | | | — | | | | — | | | | 25,485,950 | | | | 3,352,170 | |
| | Cash | | | 20,154,322 | | | | — | | | | 41,848,120 | | | | 1,676,760 | |
| | Foreign currencies, at value (cost $0, $27,851,411, $0 and $17,874,481) | | | — | | | | 28,239,124 | | | | — | | | | 18,026,663 | |
| | Receivables: | | | | | | | | | | | | | | | | |
| | Investments sold | | | 127,154,586 | | | | 25,775,709 | | | | — | | | | 44,256 | |
| | Dividends | | | 1,792,863 | | | | 1,203,981 | | | | 575,874 | | | | 652,150 | |
| | Fund shares sold | | | 946,202 | | | | 2,940,505 | | | | 158,929 | | | | 3,400,000 | |
| | Reimbursement from investment adviser | | | 77,093 | | | | — | | | | 72,016 | | | | 65,647 | |
| | Variation margin on certain derivative contracts | | | 6,020 | | | | 37,415 | | | | 32,383 | | | | 22,266 | |
| | Foreign tax reclaims | | | — | | | | 1,123,222 | | | | — | | | | 181,874 | |
| | Securities lending income | | | — | | | | — | | | | 9,206 | | | | 11,288 | |
| | Other assets | | | 12,966 | | | | 3,690 | | | | 4,739 | | | | 2,085 | |
| | Total assets | | | 1,478,609,315 | | | | 519,631,003 | | | | 688,988,640 | | | | 303,585,824 | |
| | | | | | | | | | | | | | | | | | |
| | Liabilities: | |
| | Payables: | | | | | | | | | | | | | | | | |
| | Investments purchased | | | 114,379,972 | | | | 41,205,743 | | | | — | | | | — | |
| | Written options, at value (premiums received $8,208,783, $3,524,662, $0 and $0) | | | 8,340,255 | | | | 2,458,964 | | | | — | | | | — | |
| | Fund shares redeemed | | | 2,958,285 | | | | 197,220 | | | | 3,247,411 | | | | 105,363 | |
| | Amounts owed to affiliates | | | 979,835 | | | | 334,570 | | | | 418,137 | | | | 214,073 | |
| | Payable upon return of securities loaned | | | — | | | | — | | | | 25,485,950 | | | | 3,352,170 | |
| | Due to custodian | | | — | | | | 2,045,731 | | | | — | | | | — | |
| | Accrued expenses and other liabilities | | | 152,765 | | | | 159,000 | | | | 261,487 | | | | 148,470 | |
| | Total liabilities | | | 126,811,112 | | | | 46,401,228 | | | | 29,412,985 | | | | 3,820,076 | |
| | | | | | | | | | | | | | | | | | |
| | Net Assets: | |
| | Paid-in capital | | | 1,116,310,798 | | | | 446,433,920 | | | | 482,163,484 | | | | 285,277,681 | |
| | Undistributed (distributions in excess of) net investment income | | | 4,774 | | | | (1,086,891 | ) | | | 2,923,791 | | | | 6,074,233 | |
| | Accumulated net realized gain (loss) | | | 34,121,689 | | | | 12,770,387 | | | | (297,248 | ) | | | (47,369,195 | ) |
| | Net unrealized gain | | | 201,360,942 | | | | 15,112,359 | | | | 174,785,628 | | | | 55,783,029 | |
| | | NET ASSETS | | $ | 1,351,798,203 | | | $ | 473,229,775 | | | $ | 659,575,655 | | | $ | 299,765,748 | |
| | | Net Assets: | | | | | | | | | | | | | | | | |
| | | Class A | | $ | 168,345,072 | | | $ | 11,886,242 | | | $ | 40,233,904 | | | $ | 2,890,183 | |
| | | Class B | | | — | | | | — | | | | 518,232 | | | | — | |
| | | Class C | | | 72,227,957 | | | | 2,916,886 | | | | 12,261,568 | | | | 117,770 | |
| | | Institutional | | | 1,072,411,400 | | | | 457,121,780 | | | | 602,992,388 | | | | 296,523,648 | |
| | | Service | | | — | | | | — | | | | 63,573 | | | | — | |
| | | Class IR | | | 38,813,774 | | | | 1,304,867 | | | | 3,505,990 | | | | 234,147 | |
| | | Total Net Assets | | $ | 1,351,798,203 | | | $ | 473,229,775 | | | $ | 659,575,655 | | | $ | 299,765,748 | |
| | | Shares outstanding $0.001 par value (unlimited shares authorized): | | | | | | | | | | | | | | | | |
| | | Class A | | | 14,282,831 | | | | 1,430,051 | | | | 2,411,956 | | | | 300,310 | |
| | | Class B | | | — | | | | — | | | | 32,202 | | | | — | |
| | | Class C | | | 6,139,492 | | | | 360,549 | | | | 769,070 | | | | 12,495 | |
| | | Institutional | | | 91,187,550 | | | | 55,830,865 | | | | 35,584,803 | | | | 31,035,451 | |
| | | Service | | | — | | | | — | | | | 3,804 | | | | — | |
| | | Class IR | | | 3,296,433 | | | | 159,601 | | | | 206,875 | | | | 24,328 | |
| | | Net asset value, offering and redemption price per share:(b) | | | | | | | | | | | | | | | | |
| | | Class A | | | $11.79 | | | | $8.31 | | | | $16.68 | | | | $9.62 | |
| | | Class B | | | — | | | | — | | | | 16.09 | | | | — | |
| | | Class C | | | 11.76 | | | | 8.09 | | | | 15.94 | | | | 9.42 | |
| | | Institutional | | | 11.76 | | | | 8.19 | | | | 16.95 | | | | 9.55 | |
| | | Service | | | — | | | | — | | | | 16.71 | | | | — | |
| | | Class IR | | | 11.77 | | | | 8.18 | | | | 16.95 | | | | 9.62 | |
| | (a) | | Includes loaned securities having a market value of $25,163,013 and $3,141,111 for the U.S. Tax-Managed Equity and International Tax-Managed Equity Funds, respectively. |
| | (b) | | Maximum public offering price per share for Class A Shares of the U.S. Equity Dividend and Premium, International Equity Dividend and Premium, U.S. Tax-Managed Equity and International Tax-Managed Equity Funds is $12.48, $8.79, $17.65 and $10.18, respectively. At redemption, Class B and Class C Shares may be subject to a contingent deferred sales charge assessed on the amount equal to the lesser of the current NAV or the original purchase price of the shares. |
| | |
| 50 | | The accompanying notes are an integral part of these financial statements. |
GOLDMAN SACHS TAX-ADVANTAGED EQUITY FUNDS
Statements of Operations
For the Six Months Ended June 30, 2014 (Unaudited)
| | | | | | | | | | | | | | | | | | |
| | | | | U.S. Equity
Dividend and
Premium Fund | | | International
Equity
Dividend and
Premium Fund | | | U.S. Tax- Managed
Equity Fund | | | International
Tax-Managed
Equity Fund | |
| | Investment income: | |
| | Dividends (net of foreign taxes withheld of $20,226, $1,242,508, $483 and $540,078) | | $ | 20,607,550 | | | $ | 13,553,788 | | | $ | 4,654,873 | | | $ | 7,805,892 | |
| | Securities lending income — affiliated issuer | | | — | | | | — | | | | 71,372 | | | | 175,754 | |
| | Total investment income | | | 20,607,550 | | | | 13,553,788 | | | | 4,726,245 | | | | 7,981,646 | |
| | | | | | | | | | | | | | | | | | |
| | Expenses: | |
| | Management fees | | | 4,758,011 | | | | 1,775,311 | | | | 2,008,599 | | | | 1,100,457 | |
| | Distribution and Service fees(a) | | | 538,517 | | | | 27,354 | | | | 103,919 | | | | 4,255 | |
| | Transfer Agent fees(a) | | | 459,934 | | | | 99,035 | | | | 152,646 | | | | 54,312 | |
| | Custody, accounting and administrative services | | | 55,490 | | | | 85,295 | | | | 31,752 | | | | 67,999 | |
| | Printing and mailing costs | | | 44,791 | | | | 15,627 | | | | 12,037 | | | | 6,880 | |
| | Professional fees | | | 40,996 | | | | 66,272 | | | | 43,315 | | | | 53,294 | |
| | Registration fees | | | 37,734 | | | | 23,878 | | | | 84,960 | | | | 45,248 | |
| | Trustee fees | | | 15,109 | | | | 13,779 | | | | 13,538 | | | | 12,924 | |
| | Service share fees — Service Plan | | | — | | | | — | | | | 145 | | | | — | |
| | Service share fees — Shareholder Administration Plan | | | — | | | | — | | | | 145 | | | | — | |
| | Other | | | 33,186 | | | | 15,037 | | | | 16,865 | | | | 12,075 | |
| | Total expenses | | | 5,983,768 | | | | 2,121,588 | | | | 2,467,921 | | | | 1,357,444 | |
| | Less — expense reductions | | | (127,988 | ) | | | (1,229 | ) | | | (83,915 | ) | | | (74,956 | ) |
| | Net expenses | | | 5,855,780 | | | | 2,120,359 | | | | 2,384,006 | | | | 1,282,488 | |
| | NET INVESTMENT INCOME | | | 14,751,770 | | | | 11,433,429 | | | | 2,342,239 | | | | 6,699,158 | |
| | | | | | | | | | | | | | | | | | |
| | Realized and unrealized gain (loss): | |
| | Net realized gain (loss) from: | | | | | | | | | | | | | | | | |
| | Investments | | | 57,542,869 | | | | 9,960,110 | | | | (226,610 | ) | | | (4,475,042 | ) |
| | Futures contracts | | | 297,317 | | | | 1,653,886 | | | | 2,281,951 | | | | 595,606 | |
| | Foreign currency transactions | | | — | | | | 1,639 | | | | — | | | | (98,402 | ) |
| | Written options | | | (13,852,227 | ) | | | (175,171 | ) | | | — | | | | — | |
| | Net change in unrealized gain (loss) on: | | | | | | | | | | | | | | | | |
| | Investments | | | 12,623,468 | | | | 2,910,932 | | | | 43,443,861 | | | | 11,259,790 | |
| | Futures contracts | | | 487,893 | | | | (75,426 | ) | | | (398,401 | ) | | | (519,889 | ) |
| | Foreign currency translation | | | — | | | | 391,999 | | | | — | | | | 127,113 | |
| | Written options | | | 3,426,057 | | | | 3,056,670 | | | | — | | | | — | |
| | Net realized and unrealized gain | | | 60,525,377 | | | | 17,724,639 | | | | 45,100,801 | | | | 6,889,176 | |
| | NET INCREASE IN NET ASSETS RESULTING FROM OPERATIONS | | $ | 75,277,147 | | | $ | 29,158,068 | | | $ | 47,443,040 | | | $ | 13,588,334 | |
| | (a) | | Class specific Distribution and Service, and Transfer Agent fees were as follows: |
| | | | | | | | | | | | | | | | | | | | | | | | | | | | | | | | | | | | |
| | | Distribution and Service Fees | | | Transfer Agent Fees | |
Fund | | Class A | | | Class B | | | Class C | | | Class A | | | Class B | | | Class C | | | Institutional | | | Service | | | Class IR | |
U.S. Equity Dividend and Premium | | $ | 204,048 | | | $ | — | | | $ | 334,469 | | | $ | 155,078 | | | $ | — | | | $ | 63,549 | | | $ | 206,009 | | | $ | — | | | $ | 35,298 | |
International Equity Dividend and Premium | | | 13,760 | | | | — | | | | 13,594 | | | | 10,458 | | | | — | | | | 2,583 | | | | 84,639 | | | | — | | | | 1,355 | |
U.S. Tax-Managed Equity | | | 45,426 | | | | 2,752 | | | | 55,741 | | | | 34,524 | | | | 523 | | | | 10,591 | | | | 104,656 | | | | 23 | | | | 2,329 | |
International Tax-Managed Equity | | | 3,824 | | | | — | | | | 431 | | | | 2,906 | | | | — | | | | 82 | | | | 51,113 | | | | — | | | | 211 | |
| | |
| The accompanying notes are an integral part of these financial statements. | | 51 |
GOLDMAN SACHS TAX-ADVANTAGED EQUITY FUNDS
Statements of Changes in Net Assets
| | | | | | | | | | |
| | | | | U.S. Equity Dividend and Premium Fund | |
| | | | | For the Six Months Ended
June 30, 2014
(Unaudited) | | | For the Fiscal Year Ended
December 31, 2013 | |
| | From operations: | |
| | Net investment income | | $ | 14,751,770 | | | $ | 27,733,144 | |
| | Net realized gain (loss) | | | 43,987,959 | | | | 41,087,822 | |
| | Net change in unrealized gain | | | 16,537,418 | | | | 208,053,842 | |
| | Net increase in net assets resulting from operations | | | 75,277,147 | | | | 276,874,808 | |
| | | | | | | | | | |
| | Distributions to shareholders: | |
| | From net investment income | | | | | | | | |
| | Class A Shares | | | (1,672,978 | ) | | | (3,047,018 | ) |
| | Class B Shares | | | — | | | | — | |
| | Class C Shares | | | (457,379 | ) | | | (686,738 | ) |
| | Institutional Shares | | | (12,744,107 | ) | | | (23,318,921 | ) |
| | Service Shares | | | — | | | | — | |
| | Class IR Shares | | | (435,334 | ) | | | (610,924 | ) |
| | From net realized gains | | | | | | | | |
| | Class A Shares | | | — | | | | (6,580,117 | ) |
| | Class B Shares | | | — | | | | — | |
| | Class C Shares | | | — | | | | (2,621,248 | ) |
| | Institutional Shares | | | — | | | | (42,757,396 | ) |
| | Service Shares | | | — | | | | — | |
| | Class IR Shares | | | — | | | | (1,379,858 | ) |
| | From capital | | | | | | | | |
| | Class A Shares | | | — | | | | — | |
| | Class C Shares | | | — | | | | — | |
| | Institutional Shares | | | — | | | | — | |
| | Class IR Shares | | | — | | | | — | |
| | Total distributions to shareholders | | | (15,309,798 | ) | | | (81,002,220 | ) |
| | | | | | | | | | |
| | From share transactions: | |
| | Proceeds from sales of shares | | | 141,886,622 | | | | 370,038,789 | |
| | Reinvestment of distributions | | | 12,896,169 | | | | 69,717,772 | |
| | Cost of shares redeemed | | | (205,418,195 | ) | | | (398,636,137 | ) |
| | Net increase (decrease) in net assets resulting from share transactions | | | (50,635,404 | ) | | | 41,120,424 | |
| | TOTAL INCREASE | | | 9,331,945 | | | | 236,993,012 | |
| | | | | | | | | | |
| | Net assets: | |
| | Beginning of period | | | 1,342,466,258 | | | | 1,105,473,246 | |
| | End of period | | $ | 1,351,798,203 | | | $ | 1,342,466,258 | |
| | Undistributed (distributions in excess of) net investment income | | $ | 4,774 | | | $ | 562,802 | |
| | |
| 52 | | The accompanying notes are an integral part of these financial statements. |
GOLDMAN SACHS TAX-ADVANTAGED EQUITY FUNDS
| | | | | | | | | | | | | | | | | | | | | | | | | | | | | | | | | | |
| | | International Equity Dividend and Premium Fund | | | | | U.S. Tax-Managed Equity Fund | | | | | International Tax-Managed Equity Fund | |
| | | For the Six Months Ended
June 30, 2014
(Unaudited) | | | | | For the Fiscal Year Ended
December 31, 2013 | | | | | For the Six Months Ended
June 30, 2014
(Unaudited) | | | | | For the Fiscal Year Ended
December 31, 2013 | | | | | For the Six Months Ended
June 30, 2014
(Unaudited) | | | | | For the Fiscal Year Ended
December 31, 2013 | |
| |
| | $ | 11,433,429 | | | | | $ | 10,852,021 | | | | | $ | 2,342,239 | | | | | $ | 4,725,067 | | | | | $ | 6,699,158 | | | | | $ | 4,119,396 | |
| | | 11,440,464 | | | | | | 23,320,813 | | | | | | 2,055,341 | | | | | | (2,264,626 | ) | | | | | (3,977,838 | ) | | | | | (9,342,981 | ) |
| | | 6,284,175 | | | | | | 25,551,358 | | | | | | 43,045,460 | | | | | | 135,438,808 | | | | | | 10,867,014 | | | | | | 43,310,425 | |
| | | 29,158,068 | | | | | | 59,724,192 | | | | | | 47,443,040 | | | | | | 137,899,249 | | | | | | 13,588,334 | | | | | | 38,086,840 | |
| | | | | | | | | | | | | | | | | | | | | | | | | | | | | | | | | | |
| |
| | | | | | | | | | | | | | | | | | | | | | | | | | | | | | | | | | |
| | | (286,728 | ) | | | | | (304,428 | ) | | | | | — | | | | | | (184,418 | ) | | | | | — | | | | | | (48,143 | ) |
| | | — | | | | | | — | | | | | | — | | | | | | — | | | | | | — | | | | | | — | |
| | | (62,090 | ) | | | | | (39,351 | ) | | | | | — | | | | | | — | | | | | | — | | | | | | (686 | ) |
| | | (11,961,031 | ) | | | | | (10,566,288 | ) | | | | | — | | | | | | (4,174,443 | ) | | | | | — | | | | | | (4,806,624 | ) |
| | | — | | | | | | — | | | | | | — | | | | | | (3,886 | ) | | | | | — | | | | | | — | |
| | | (36,059 | ) | | | | | (53,014 | ) | | | | | — | | | | | | (5,934 | ) | | | | | — | | | | | | (4,509 | ) |
| | | | | | | | | | | | | | | | | | | | | | | | | | | | | | | | | | |
| | | — | | | | | | (300,145 | ) | | | | | — | | | | | | (409,643 | ) | | | | | — | | | | | | — | |
| | | — | | | | | | — | | | | | | — | | | | | | (8,281 | ) | | | | | — | | | | | | — | |
| | | — | | | | | | (77,825 | ) | | | | | — | | | | | | (131,050 | ) | | | | | — | | | | | | — | |
| | | — | | | | | | (12,224,977 | ) | | | | | — | | | | | | (5,390,876 | ) | | | | | — | | | | | | — | |
| | | — | | | | | | — | | | | | | — | | | | | | (5,604 | ) | | | | | — | | | | | | — | |
| | | — | | | | | | (50,895 | ) | | | | | — | | | | | | (8,918 | ) | | | | | — | | | | | | — | |
| | | | | | | | | | | | | | | | | | | | | | | | | | | | | | | | | | |
| | | — | | | | | | — | | | | | | — | | | | | | — | | | | | | — | | | | | | (357 | ) |
| | | — | | | | | | — | | | | | | — | | | | | | — | | | | | | — | | | | | | (5 | ) |
| | | — | | | | | | — | | | | | | — | | | | | | — | | | | | | — | | | | | | (35,610 | ) |
| | | — | | | | | | — | | | | | | — | | | | | | — | | | | | | — | | | | | | (33 | ) |
| | | (12,345,908 | ) | | | | | (23,616,923 | ) | | | | | — | | | | | | (10,323,053 | ) | | | | | — | | | | | | (4,895,967 | ) |
| | | | | | | | | | | | | | | | | | | | | | | | | | | | | | | | | | |
| |
| | | 68,777,819 | | | | | | 106,927,807 | | | | | | 108,523,176 | | | | | | 176,510,247 | | | | | | 59,712,089 | | | | | | 88,954,530 | |
| | | 11,906,038 | | | | | | 23,159,810 | | | | | | — | | | | | | 10,211,977 | | | | | | — | | | | | | 4,888,674 | |
| | | (42,494,777 | ) | | | | | (132,826,675 | ) | | | | | (37,460,948 | ) | | | | | (122,880,276 | ) | | | | | (5,619,639 | ) | | | | | (44,655,961 | ) |
| | | 38,189,080 | | | | | | (2,739,058 | ) | | | | | 71,062,228 | | | | | | 63,841,948 | | | | | | 54,092,450 | | | | | | 49,187,243 | |
| | | 55,001,240 | | | | | | 33,368,211 | | | | | | 118,505,268 | | | | | | 191,418,144 | | | | | | 67,680,784 | | | | | | 82,378,116 | |
| | | | | | | | | | | | | | | | | | | | | | | | | | | | | | | | | | |
| |
| | | 418,228,535 | | | | | | 384,860,324 | | | | | | 541,070,387 | | | | | | 349,652,243 | | | | | | 232,084,964 | | | | | | 149,706,848 | |
| | $ | 473,229,775 | | | | | $ | 418,228,535 | | | | | $ | 659,575,655 | | | | | $ | 541,070,387 | | | | | $ | 299,765,748 | | | | | $ | 232,084,964 | |
| | $ | (1,086,891 | ) | | | | $ | (174,412 | ) | | | | $ | 2,923,791 | | | | | $ | 581,552 | | | | | $ | 6,074,233 | | | | | $ | (624,925 | ) |
| | |
| The accompanying notes are an integral part of these financial statements. | | 53 |
GOLDMAN SACHS U.S. EQUITY DIVIDEND AND PREMIUM FUND
Financial Highlights
Selected Data for a Share Outstanding Throughout Each Period
| | | | | | | | | | | | | | | | | | | | | | | | | | | | | | |
| | | | | | | | Income (loss) from
investment operations | | | Distributions
to shareholders | |
| | | Year - Share Class | | Net asset value beginning of period | | | Net
investment
income(a) | | | Net realized
and unrealized
gain | | | Total from
investment
operations | | | From net
investment
income | | | From net
realized
gains | | | Total
distributions | |
| FOR THE SIX MONTHS ENDED JUNE 30, (UNAUDITED) | | | | | |
| | 2014 - A | | $ | 11.26 | | | $ | 0.11 | | | $ | 0.54 | | | $ | 0.65 | | | $ | (0.12 | ) | | $ | — | | | $ | (0.12 | ) |
| | 2014 - C | | | 11.24 | | | | 0.07 | | | | 0.53 | | | | 0.60 | | | | (0.08 | ) | | | — | | | | (0.08 | ) |
| | 2014 - Institutional | | | 11.24 | | | | 0.13 | | | | 0.53 | | | | 0.66 | | | | (0.14 | ) | | | — | | | | (0.14 | ) |
| | 2014 - IR | | | 11.25 | | | | 0.13 | | | | 0.52 | | | | 0.65 | | | | (0.13 | ) | | | — | | | | (0.13 | ) |
| | | | | | | | | | | | | | | | | | | | | | | | | | | | | | |
| | FOR THE FISCAL YEARS ENDED DECEMBER 31, | |
| | 2013 - A | | | 9.60 | | | | 0.20 | | | | 2.12 | | | | 2.32 | | | | (0.20 | ) | | | (0.46 | ) | | | (0.66 | ) |
| | 2013 - C | | | 9.59 | | | | 0.13 | | | | 2.11 | | | | 2.24 | | | | (0.13 | ) | | | (0.46 | ) | | | (0.59 | ) |
| | 2013 - Institutional | | | 9.58 | | | | 0.25 | | | | 2.12 | | | | 2.37 | | | | (0.25 | ) | | | (0.46 | ) | | | (0.71 | ) |
| | 2013 - IR | | | 9.59 | | | | 0.23 | | | | 2.12 | | | | 2.35 | | | | (0.23 | ) | | | (0.46 | ) | | | (0.69 | ) |
| | 2012 - A | | | 9.39 | | | | 0.25 | | | | 0.71 | | | | 0.96 | | | | (0.24 | ) | | | (0.51 | ) | | | (0.75 | ) |
| | 2012 - C | | | 9.38 | | | | 0.18 | | | | 0.71 | | | | 0.89 | | | | (0.17 | ) | | | (0.51 | ) | | | (0.68 | ) |
| | 2012 - Institutional | | | 9.37 | | | | 0.28 | | | | 0.72 | | | | 1.00 | | | | (0.28 | ) | | | (0.51 | ) | | | (0.79 | ) |
| | 2012 - IR | | | 9.38 | | | | 0.29 | | | | 0.70 | | | | 0.99 | | | | (0.27 | ) | | | (0.51 | ) | | | (0.78 | ) |
| | 2011 - A | | | 9.38 | | | | 0.18 | (e) | | | 0.27 | | | | 0.45 | | | | (0.19 | ) | | | (0.25 | ) | | | (0.44 | ) |
| | 2011 - C | | | 9.38 | | | | 0.11 | (e) | | | 0.27 | | | | 0.38 | | | | (0.13 | ) | | | (0.25 | ) | | | (0.38 | ) |
| | 2011 - Institutional | | | 9.36 | | | | 0.22 | (e) | | | 0.27 | | | | 0.49 | | | | (0.23 | ) | | | (0.25 | ) | | | (0.48 | ) |
| | 2011 - IR | | | 9.38 | | | | 0.21 | (e) | | | 0.26 | | | | 0.47 | | | | (0.22 | ) | | | (0.25 | ) | | | (0.47 | ) |
| | 2010 - A | | | 8.29 | | | | 0.16 | (f) | | | 1.08 | | | | 1.24 | | | | (0.15 | ) | | | — | | | | (0.15 | ) |
| | 2010 - C | | | 8.29 | | | | 0.13 | (f) | | | 1.05 | | | | 1.18 | | | | (0.09 | ) | | | — | | | | (0.09 | ) |
| | 2010 - Institutional | | | 8.28 | | | | 0.26 | (f) | | | 1.01 | | | | 1.27 | | | | (0.19 | ) | | | — | | | | (0.19 | ) |
| | 2010 - IR (Commenced August 31, 2010) | | | 8.06 | | | | 0.11 | (f) | | | 1.30 | | | | 1.41 | | | | (0.09 | ) | | | — | | | | (0.09 | ) |
| | 2009 - A | | | 6.86 | | | | 0.13 | | | | 1.43 | | | | 1.56 | | | | (0.13 | ) | | | — | | | | (0.13 | ) |
| | 2009 - C | | | 6.87 | | | | 0.08 | | | | 1.42 | | | | 1.50 | | | | (0.08 | ) | | | — | | | | (0.08 | ) |
| | 2009 - Institutional | | | 6.85 | | | | 0.17 | | | | 1.42 | | | | 1.59 | | | | (0.16 | ) | | | — | | | | (0.16 | ) |
| | (a) | | Calculated based on the average shares outstanding methodology. |
| | (b) | | Assumes investment at the net asset value at the beginning of the period, reinvestment of all distributions, a complete redemption of the investment at the net asset value at the end of the period and no sales or redemption charges. Total returns would be reduced if a sales or redemption charge was taken into account. Returns do not reflect the deduction of taxes that a shareholder would pay on Fund distributions or the redemption of Fund shares. Total returns for periods less than one full year are not annualized. |
| | (c) | | The Fund’s portfolio turnover rate is calculated in accordance with regulatory requirements, without regard to transactions involving short term investments and certain derivatives. If such transactions were included, the Fund’s portfolio turnover rate may be higher. |
| | (e) | | Reflects income recognized from special dividends which amounted to $0.01 per share and 0.12% of average net assets. |
| | (f) | | Reflects income recognized from special dividends which amounted to $0.05 per share and 0.56% of average net assets. |
| | |
| 54 | | The accompanying notes are an integral part of these financial statements. |
GOLDMAN SACHS U.S. EQUITY DIVIDEND AND PREMIUM FUND
| | | | | | | | | | | | | | | | | | | | | | | | | | | | | | | | | | | | | | | | |
| | | | | | | | | | | | | | | | | | | | | | | | | | | | | | | | | | |
| | | Net asset
value, end
of period | | | | | Total
return(b) | | | | | Net assets, end of period (in 000s) | | | | | Ratio of net expenses to average net assets | | | | | Ratio of
total expenses
to average
net assets | | | | | Ratio of
net investment
income to average net assets | | | | | Portfolio
turnover
rate(c) | |
| | | | | | | | | | | | | | | | | | | | | | | | | | | | | | | | | | | | | | | | |
| | $ | 11.79 | | | | | | 5.78 | % | | | | $ | 168,345 | | | | | | 1.19 | %(d) | | | | | 1.21 | %(d) | | | | | 1.99 | %(d) | | | | | 33 | % |
| | | 11.76 | | | | | | 5.32 | | | | | | 72,228 | | | | | | 1.94 | (d) | | | | | 1.96 | (d) | | | | | 1.24 | (d) | | | | | 33 | |
| | | 11.76 | | | | | | 5.91 | | | | | | 1,072,411 | | | | | | 0.79 | (d) | | | | | 0.81 | (d) | | | | | 2.39 | (d) | | | | | 33 | |
| | | 11.77 | | | | | | 5.82 | | | | | | 38,814 | | | | | | 0.94 | (d) | | | | | 0.96 | (d) | | | | | 2.24 | (d) | | | | | 33 | |
| | | | | | | | | | | | | | | | | | | | | | | | | | | | | | | | | | | | | | | | |
| | | | | | | | | | | | | | | | | | | | | | | | | | | | | | | | | | | | | | | | |
| | | 11.26 | | | | | | 24.58 | | | | | | 167,149 | | | | | | 1.19 | | | | | | 1.21 | | | | | | 1.92 | | | | | | 69 | |
| | | 11.24 | | | | | | 23.61 | | | | | | 66,872 | | | | | | 1.94 | | | | | | 1.96 | | | | | | 1.17 | | | | | | 69 | |
| | | 11.24 | | | | | | 25.14 | | | | | | 1,072,965 | | | | | | 0.79 | | | | | | 0.81 | | | | | | 2.32 | | | | | | 69 | |
| | | 11.25 | | | | | | 24.93 | | | | | | 35,480 | | | | | | 0.94 | | | | | | 0.96 | | | | | | 2.18 | | | | | | 69 | |
| | | 9.60 | | | | | | 10.30 | | | | | | 145,184 | | | | | | 1.21 | | | | | | 1.22 | | | | | | 2.48 | | | | | | 67 | |
| | | 9.59 | | | | | | 9.57 | | | | | | 45,243 | | | | | | 1.96 | | | | | | 1.97 | | | | | | 1.83 | | | | | | 67 | |
| | | 9.58 | | | | | | 10.74 | | | | | | 895,258 | | | | | | 0.81 | | | | | | 0.82 | | | | | | 2.83 | | | | | | 67 | |
| | | 9.59 | | | | | | 10.60 | | | | | | 19,787 | | | | | | 0.96 | | | | | | 0.97 | | | | | | 2.90 | | | | | | 67 | |
| | | 9.39 | | | | | | 4.90 | | | | | | 70,499 | | | | | | 1.24 | | | | | | 1.25 | | | | | | 1.94 | (e) | | | | | 90 | |
| | | 9.38 | | | | | | 4.03 | | | | | | 17,378 | | | | | | 1.99 | | | | | | 2.00 | | | | | | 1.14 | (e) | | | | | 90 | |
| | | 9.37 | | | | | | 5.31 | | | | | | 688,194 | | | | | | 0.84 | | | | | | 0.85 | | | | | | 2.29 | (e) | | | | | 90 | |
| | | 9.38 | | | | | | 5.05 | | | | | | 1,425 | | | | | | 0.99 | | | | | | 1.00 | | | | | | 2.20 | (e) | | | | | 90 | |
| | | 9.38 | | | | | | 15.07 | | | | | | 37,112 | | | | | | 1.24 | | | | | | 1.26 | | | | | | 1.84 | (f) | | | | | 140 | |
| | | 9.38 | | | | | | 14.32 | | | | | | 10,851 | | | | | | 1.99 | | | | | | 2.01 | | | | | | 1.52 | (f) | | | | | 140 | |
| | | 9.36 | | | | | | 15.53 | | | | | | 408,032 | | | | | | 0.84 | | | | | | 0.86 | | | | | | 2.95 | (f) | | | | | 140 | |
| | | 9.38 | | | | | | 17.53 | | | | | | 1 | | | | | | 0.99 | (d) | | | | | 1.01 | (d) | | | | | 4.04 | (d)(f) | | | | | 140 | |
| | | 8.29 | | | | | | 23.03 | | | | | | 139,340 | | | | | | 1.24 | | | | | | 1.30 | | | | | | 1.85 | | | | | | 125 | |
| | | 8.29 | | | | | | 21.93 | | | | | | 9,540 | | | | | | 1.99 | | | | | | 2.05 | | | | | | 1.10 | | | | | | 125 | |
| | | 8.28 | | | | | | 23.55 | | | | | | 147,446 | | | | | | 0.84 | | | | | | 0.90 | | | | | | 2.30 | | | | | | 125 | |
| | |
| The accompanying notes are an integral part of these financial statements. | | 55 |
GOLDMAN SACHS INTERNATIONAL EQUITY DIVIDEND AND PREMIUM FUND
Financial Highlights
Selected Data for a Share Outstanding Throughout Each Period
| | | | | | | | | | | | | | | | | | | | | | | | | | | | | | |
| | | | | | | | Income (loss) from
investment operations | | | Distributions
to shareholders | |
| | | Year - Share Class | | Net asset
value,
beginning
of period | | | Net
investment
income | | | Net realized
and unrealized
gain (loss) | | | Total from
investment
operations | | | From net
investment
income | | | From net
realized
gains | | | Total
distributions | |
| | FOR THE SIX MONTHS ENDED JUNE 30, (UNAUDITED) | |
| | 2014 - A | | $ | 8.00 | | | $ | 0.20 | (c)(d) | | $ | 0.31 | | | $ | 0.51 | | | $ | (0.20 | ) | | $ | — | | | $ | (0.20 | ) |
| | 2014 - C | | | 7.80 | | | | 0.16 | (c)(d) | | | 0.31 | | | | 0.47 | | | | (0.18 | ) | | | — | | | | (0.18 | ) |
| | 2014 - Institutional | | | 7.89 | | | | 0.21 | (c)(d) | | | 0.31 | | | | 0.52 | | | | (0.22 | ) | | | — | | | | (0.22 | ) |
| | 2014 - IR | | | 7.88 | | | | 0.20 | (c)(d) | | | 0.31 | | | | 0.51 | | | | (0.21 | ) | | | — | | | | (0.21 | ) |
| | | | | | | | | | | | | | | | | | | | | | | | | | | | | | |
| | FOR THE FISCAL YEARS ENDED DECEMBER 31, | |
| | 2013 - A | | | 7.31 | | | | 0.19 | | | | 0.92 | | | | 1.11 | | | | (0.18 | ) | | | (0.24 | ) | | | (0.42 | ) |
| | 2013 - C | | | 7.15 | | | | 0.12 | | | | 0.90 | | | | 1.02 | | | | (0.13 | ) | | | (0.24 | ) | | | (0.37 | ) |
| | 2013 - Institutional | | | 7.21 | | | | 0.20 | | | | 0.93 | | | | 1.13 | | | | (0.21 | ) | | | (0.24 | ) | | | (0.45 | ) |
| | 2013 - IR | | | 7.20 | | | | 0.21 | | | | 0.91 | | | | 1.12 | | | | (0.20 | ) | | | (0.24 | ) | | | (0.44 | ) |
| | 2012 - A | | | 6.60 | | | | 0.16 | | | | 0.78 | | | | 0.94 | | | | (0.17 | ) | | | (0.06 | ) | | | (0.23 | ) |
| | 2012 - C | | | 6.47 | | | | 0.13 | | | | 0.74 | | | | 0.87 | | | | (0.13 | ) | | | (0.06 | ) | | | (0.19 | ) |
| | 2012 - Institutional | | | 6.52 | | | | 0.21 | | | | 0.74 | | | | 0.95 | | | | (0.20 | ) | | | (0.06 | ) | | | (0.26 | ) |
| | 2012 - IR | | | 6.52 | | | | 0.26 | | | | 0.67 | | | | 0.93 | | | | (0.19 | ) | | | (0.06 | ) | | | (0.25 | ) |
| | 2011 - A | | | 8.17 | | | | 0.21 | (f) | | | (1.20 | ) | | | (0.99 | ) | | | (0.23 | ) | | | (0.35 | ) | | | (0.58 | ) |
| | 2011 - C | | | 8.02 | | | | 0.16 | (f) | | | (1.19 | ) | | | (1.03 | ) | | | (0.17 | ) | | | (0.35 | ) | | | (0.52 | ) |
| | 2011 - Institutional | | | 8.07 | | | | 0.24 | (f) | | | (1.18 | ) | | | (0.94 | ) | | | (0.26 | ) | | | (0.35 | ) | | | (0.61 | ) |
| | 2011 - IR | | | 8.06 | | | | 0.24 | (f) | | | (1.18 | ) | | | (0.94 | ) | | | (0.25 | ) | | | (0.35 | ) | | | (0.60 | ) |
| | 2010 - A | | | 7.86 | | | | 0.16 | (c) | | | 0.41 | | | | 0.57 | | | | (0.14 | ) | | | (0.12 | ) | | | (0.26 | ) |
| | 2010 - C | | | 7.73 | | | | 0.10 | (c) | | | 0.41 | | | | 0.51 | | | | (0.10 | ) | | | (0.12 | ) | | | (0.22 | ) |
| | 2010 - Institutional | | | 7.76 | | | | 0.18 | (c) | | | 0.42 | | | | 0.60 | | | | (0.17 | ) | | | (0.12 | ) | | | (0.29 | ) |
| | 2010 - IR (Commenced August 31, 2010) | | | 7.08 | | | | 0.04 | (c) | | | 1.10 | | | | 1.14 | | | | (0.04 | ) | | | (0.12 | ) | | | (0.16 | ) |
| | 2009 - A | | | 6.36 | | | | 0.09 | (c) | | | 1.53 | | | | 1.62 | | | | (0.12 | ) | | | — | | | | (0.12 | ) |
| | 2009 - C | | | 6.28 | | | | 0.02 | (c) | | | 1.52 | | | | 1.54 | | | | (0.09 | ) | | | — | | | | (0.09 | ) |
| | 2009 - Institutional | | | 6.30 | | | | 0.14 | (c) | | | 1.47 | | | | 1.61 | | | | (0.15 | ) | | | — | | | | (0.15 | ) |
| | (a) | | Assumes investment at the net asset value at the beginning of the period, reinvestment of all distributions, a complete redemption of the investment at the net asset value at the end of the period and no sales or redemption charges. Total returns would be reduced if a sales or redemption charge was taken into account. Returns do not reflect the deduction of taxes that a shareholder would pay on Fund distributions or the redemption of Fund shares. Total returns for periods less than one full year are not annualized. |
| | (b) | | The Fund’s portfolio turnover rate is calculated in accordance with regulatory requirements, without regard to transactions involving short term investments and certain derivatives. If such transactions were included, the Fund’s portfolio turnover rate may be higher. |
| | (c) | | Calculated based on the average shares outstanding methodology. |
| | (d) | | Reflects income recognized from a corporate action which amounted to $0.06 per share and 1.46% of average net assets. |
| | (f) | | Reflects income recognized from a corporate action which amounted to $0.01 per share and 0.13% of average net assets. |
| | |
| 56 | | The accompanying notes are an integral part of these financial statements. |
GOLDMAN SACHS INTERNATIONAL EQUITY DIVIDEND AND PREMIUM FUND
| | | | | | | | | | | | | | | | | | | | | | | | | | | | | | | | | | | | | | | | |
| | | | | | | | | | | | | | | | | | | | | | | | | | | | | | | | | | |
| | | Net asset
value, end
of period | | | | | Total
return(a) | | | | | Net assets,
end of period (in 000s) | | | | | Ratio of net expenses
to average net assets | | | | | Ratio of
total expenses
to average net assets | | | | | Ratio of
net investment
income to average net assets | | | | | Portfolio
turnover
rate(b) | |
| | | | | | | | | | | | | | | | | | | | | | | | | | | | | | | | | | | | | | | | |
| | $ | 8.31 | | | | | | 6.48 | % | | | | $ | 11,886 | | | | | | 1.35 | %(e) | | | | | 1.35 | %(e) | | | | | 4.89 | %(d)(e) | | | | | 25 | % |
| | | 8.09 | | | | | | 6.01 | | | | | | 2,917 | | | | | | 2.10 | (e) | | | | | 2.10 | (e) | | | | | 4.08 | (d)(e) | | | | | 25 | |
| | | 8.19 | | | | | | 6.65 | | | | | | 457,122 | | | | | | 0.95 | (e) | | | | | 0.95 | (e) | | | | | 5.23 | (d)(e) | | | | | 25 | |
| | | 8.18 | | | | | | 6.58 | | | | | | 1,305 | | | | | | 1.10 | (e) | | | | | 1.10 | (e) | | | | | 5.00 | (d)(e) | | | | | 25 | |
| | | | | | | | | | | | | | | | | | | | | | | | | | | | | | | | | | | | | | | | |
| | | | | | | | | | | | | | | | | | | | | | | | | | | | | | | | | | | | | | | | |
| | | 8.00 | | | | | | 15.57 | | | | | | 10,323 | | | | | | 1.34 | | | | | | 1.36 | | | | | | 2.56 | | | | | | 97 | |
| | | 7.80 | | | | | | 14.68 | | | | | | 2,582 | | | | | | 2.10 | | | | | | 2.11 | | | | | | 1.54 | | | | | | 97 | |
| | | 7.89 | | | | | | 16.14 | | | | | | 403,776 | | | | | | 0.94 | | | | | | 0.96 | | | | | | 2.71 | | | | | | 97 | |
| | | 7.88 | | | | | | 15.98 | | | | | | 1,547 | | | | | | 1.09 | | | | | | 1.11 | | | | | | 2.74 | | | | | | 97 | |
| | | 7.31 | | | | | | 14.48 | | | | | | 14,952 | | | | | | 1.30 | | | | | | 1.37 | | | | | | 3.51 | | | | | | 60 | |
| | | 7.15 | | | | | | 13.71 | | | | | | 1,640 | | | | | | 2.05 | | | | | | 2.11 | | | | | | 1.99 | | | | | | 60 | |
| | | 7.21 | | | | | | 14.93 | | | | | | 366,136 | | | | | | 0.90 | | | | | | 0.95 | | | | | | 2.68 | | | | | | 60 | |
| | | 7.20 | | | | | | 14.56 | | | | | | 2,133 | | | | | | 1.05 | | | | | | 1.10 | | | | | | 4.06 | | | | | | 60 | |
| | | 6.60 | | | | | | (12.44 | ) | | | | | 171,063 | | | | | | 1.30 | | | | | | 1.38 | | | | | | 2.74 | (f) | | | | | 51 | |
| | | 6.47 | | | | | | (13.06 | ) | | | | | 1,502 | | | | | | 2.05 | | | | | | 2.13 | | | | | | 1.87 | (f) | | | | | 51 | |
| | | 6.52 | | | | | | (11.99 | ) | | | | | 116,023 | | | | | | 0.90 | | | | | | 0.98 | | | | | | 3.17 | (f) | | | | | 51 | |
| | | 6.52 | | | | | | (12.01 | ) | | | | | 1,315 | | | | | | 1.05 | | | | | | 1.13 | | | | | | 0.54 | (f) | | | | | 51 | |
| | | 8.17 | | | | | | 7.59 | | | | | | 158,348 | | | | | | 1.30 | | | | | | 1.45 | | | | | | 2.06 | | | | | | 41 | |
| | | 8.02 | | | | | | 6.81 | | | | | | 1,342 | | | | | | 2.05 | | | | | | 2.20 | | | | | | 1.28 | | | | | | 41 | |
| | | 8.07 | | | | | | 8.10 | | | | | | 97,651 | | | | | | 0.90 | | | | | | 1.05 | | | | | | 2.38 | | | | | | 41 | |
| | | 8.06 | | | | | | 16.12 | | | | | | 1 | | | | | | 1.05 | (e) | | | | | 1.20 | (e) | | | | | 1.48 | (e) | | | | | 41 | |
| | | 7.86 | | | | | | 26.17 | | | | | | 67,681 | | | | | | 1.30 | | | | | | 2.09 | | | | | | 1.23 | | | | | | 98 | |
| | | 7.73 | | | | | | 25.12 | | | | | | 894 | | | | | | 2.05 | | | | | | 2.84 | | | | | | 0.28 | | | | | | 98 | |
| | | 7.76 | | | | | | 26.06 | | | | | | 35,883 | | | | | | 0.90 | | | | | | 1.69 | | | | | | 2.07 | | | | | | 98 | |
| | |
| The accompanying notes are an integral part of these financial statements. | | 57 |
GOLDMAN SACHS U.S. TAX-MANAGED EQUITY FUND
Financial Highlights
Selected Data for a Share Outstanding Throughout Each Period
| | | | | | | | | | | | | | | | | | | | | | | | | | | | | | |
| | | | | | | | Income (loss) from
investment operations | | | Distributions
to shareholders | |
| | | Year - Share Class | | Net asset
value,
beginning
of period | | | Net
investment
income (loss)(a) | | | Net realized
and unrealized
gain | | | Total from
investment
operations | | | From net
investment
income | | | From net
realized
gains | | | Total
distributions | |
| | FOR THE SIX MONTHS ENDED JUNE 30, (UNAUDITED) | |
| | 2014 - A | | $ | 15.45 | | | $ | 0.04 | | | $ | 1.19 | | | $ | 1.23 | | | $ | — | | | $ | — | | | $ | — | |
| | 2014 - B | | | 14.96 | | | | (0.02 | ) | | | 1.15 | | | | 1.13 | | | | — | | | | — | | | | — | |
| | 2014 - C | | | 14.82 | | | | (0.02 | ) | | | 1.14 | | | | 1.12 | | | | — | | | | — | | | | — | |
| | 2014 - Institutional | | | 15.66 | | | | 0.07 | | | | 1.22 | | | | 1.29 | | | | — | | | | — | | | | — | |
| | 2014 - Service | | | 15.49 | | | | 0.01 | | | | 1.21 | | | | 1.22 | | | | — | | | | — | | | | — | |
| | 2014 - IR | | | 15.68 | | | | 0.06 | | | | 1.21 | | | | 1.27 | | | | — | | | | — | | | | — | |
| | | | | | | | | | | | | | | | | | | | | | | | | | | | | | |
| | FOR THE FISCAL YEARS ENDED DECEMBER 31, | |
| | 2013 - A | | | 11.38 | | | | 0.11 | | | | 4.22 | | | | 4.33 | | | | (0.08 | ) | | | (0.18 | ) | | | (0.26 | ) |
| | 2013 - B | | | 11.05 | | | | 0.01 | | | | 4.08 | | | | 4.09 | | | | — | | | | (0.18 | ) | | | (0.18 | ) |
| | 2013 - C | | | 10.95 | | | | — | (e) | | | 4.05 | | | | 4.05 | | | | — | | | | (0.18 | ) | | | (0.18 | ) |
| | 2013 - Institutional | | | 11.54 | | | | 0.16 | | | | 4.28 | | | | 4.44 | | | | (0.14 | ) | | | (0.18 | ) | | | (0.32 | ) |
| | 2013 - Service | | | 11.46 | | | | 0.12 | | | | 4.22 | | | | 4.34 | | | | (0.13 | ) | | | (0.18 | ) | | | (0.31 | ) |
| | 2013 - IR | | | 11.55 | | | | 0.14 | | | | 4.29 | | | | 4.43 | | | | (0.12 | ) | | | (0.18 | ) | | | (0.30 | ) |
| | 2012 - A | | | 9.94 | | | | 0.12 | | | | 1.44 | (f) | | | 1.56 | | | | (0.12 | ) | | | — | | | | (0.12 | ) |
| | 2012 - B | | | 9.64 | | | | 0.04 | | | | 1.39 | (f) | | | 1.43 | | | | (0.02 | ) | | | — | | | | (0.02 | ) |
| | 2012 - C | | | 9.57 | | | | 0.05 | | | | 1.38 | (f) | | | 1.43 | | | | (0.05 | ) | | | — | | | | (0.05 | ) |
| | 2012 - Institutional | | | 10.08 | | | | 0.18 | | | | 1.46 | (f) | | | 1.64 | | | | (0.18 | ) | | | — | | | | (0.18 | ) |
| | 2012 - Service | | | 10.01 | | | | 0.12 | | | | 1.45 | (f) | | | 1.57 | | | | (0.12 | ) | | | — | | | | (0.12 | ) |
| | 2012 - IR | | | 10.09 | | | | 0.16 | | | | 1.46 | (f) | | | 1.62 | | | | (0.16 | ) | | | — | | | | (0.16 | ) |
| | 2011 - A | | | 9.73 | | | | 0.09 | (g) | | | 0.20 | | | | 0.29 | | | | (0.08 | ) | | | — | | | | (0.08 | ) |
| | 2011 - B | | | 9.44 | | | | 0.01 | (g) | | | 0.21 | | | | 0.22 | | | | (0.02 | ) | | | — | | | | (0.02 | ) |
| | 2011 - C | | | 9.39 | | | | 0.01 | (g) | | | 0.20 | | | | 0.21 | | | | (0.03 | ) | | | — | | | | (0.03 | ) |
| | 2011 - Institutional | | | 9.89 | | | | 0.13 | (g) | | | 0.21 | | | | 0.34 | | | | (0.15 | ) | | | — | | | | (0.15 | ) |
| | 2011 - Service | | | 9.81 | | | | 0.07 | (g) | | | 0.22 | | | | 0.29 | | | | (0.09 | ) | | | — | | | | (0.09 | ) |
| | 2011 - IR | | | 9.89 | | | | 0.10 | (g) | | | 0.23 | | | | 0.33 | | | | (0.13 | ) | | | — | | | | (0.13 | ) |
| | 2010 - A | | | 8.64 | | | | 0.08 | | | | 1.08 | | | | 1.16 | | | | (0.07 | ) | | | — | | | | (0.07 | ) |
| | 2010 - B | | | 8.38 | | | | 0.01 | | | | 1.05 | | | | 1.06 | | | | — | | | | — | | | | — | |
| | 2010 - C | | | 8.33 | | | | 0.01 | | | | 1.05 | | | | 1.06 | | | | — | | | | — | | | | — | |
| | 2010 - Institutional | | | 8.78 | | | | 0.11 | | | | 1.11 | | | | 1.22 | | | | (0.11 | ) | | | — | | | | (0.11 | ) |
| | 2010 - Service | | | 8.72 | | | | 0.07 | | | | 1.09 | | | | 1.16 | | | | (0.07 | ) | | | — | | | | (0.07 | ) |
| | 2010 - IR (Commenced August 31, 2010) | | | 8.18 | | | | 0.03 | | | | 1.78 | | | | 1.81 | | | | (0.10 | ) | | | — | | | | (0.10 | ) |
| | 2009 - A | | | 7.20 | | | | 0.09 | (h) | | | 1.45 | | | | 1.54 | | | | (0.10 | ) | | | — | | | | (0.10 | ) |
| | 2009 - B | | | 6.97 | | | | 0.04 | (h) | | | 1.39 | | | | 1.43 | | | | (0.02 | ) | | | — | | | | (0.02 | ) |
| | 2009 - C | | | 6.94 | | | | 0.04 | (h) | | | 1.39 | | | | 1.43 | | | | (0.04 | ) | | | — | | | | (0.04 | ) |
| | 2009 - Institutional | | | 7.31 | | | | 0.14 | (h) | | | 1.47 | | | | 1.61 | | | | (0.14 | ) | | | — | | | | (0.14 | ) |
| | 2009 - Service | | | 7.26 | | | | 0.09 | (h) | | | 1.46 | | | | 1.55 | | | | (0.09 | ) | | | — | | | | (0.09 | ) |
| | (a) | | Calculated based on the average shares outstanding methodology. |
| | (b) | | Assumes investment at the net asset value at the beginning of the period, reinvestment of all distributions, a complete redemption of the investment at the net asset value at the end of the period and no sales or redemption charges. Total returns would be reduced if a sales or redemption charge was taken into account. Returns do not reflect the deduction of taxes that a shareholder would pay on Fund distributions or the redemption of Fund shares. Total returns for periods less than one full year are not annualized. |
| | (c) | | The Fund’s portfolio turnover rate is calculated in accordance with regulatory requirements, without regard to transactions involving short term investments and certain derivatives. If such transactions were included, the Fund’s portfolio turnover rate may be higher. |
| | (e) | | Amount is less than $0.005 per share. |
| | (f) | | Reflects payment from affiliate relating to certain investment transactions which amounted to $0.02 per share. Excluding such payment, the total return would have been 15.49%, 14.74%, 14.68%, 15.92%, 15.36% and 15.80%, respectively. |
| | (g) | | Reflects income recognized from special dividends which amounted to $0.02 per share and 0.18% of average net assets. |
| | (h) | | Reflects income recognized from special dividends which amounted to $0.01 per share and 0.01% of average net assets. |
| | |
| 58 | | The accompanying notes are an integral part of these financial statements. |
GOLDMAN SACHS U.S. TAX-MANAGED EQUITY FUND
| | | | | | | | | | | | | | | | | | | | | | | | | | | | | | | | | | | | | | | | |
| | | | | | | | | | | | | | | | | | | | | | | | | | | | | | | | | | |
| | | Net asset
value, end
of period | | | | | Total
return(b) | | | | | Net assets,
end of period (in 000s) | | | | | Ratio of
net expenses
to average net assets | | | | | Ratio of
total expenses
to average
net assets | | | | | Ratio of
net investment
income (loss)
to average net assets | | | | | Portfolio
turnover
rate(c) | |
| | | | | | | | | | | | | | | | | | | | | | | | | | | | | | | | | | | | | | | | |
| | $ | 16.68 | | | | | | 7.96 | % | | | | $ | 40,234 | | | | | | 1.18 | %(d) | | | | | 1.21 | %(d) | | | | | 0.46 | %(d) | | | | | 27 | % |
| | | 16.09 | | | | | | 7.55 | | | | | | 518 | | | | | | 1.93 | (d) | | | | | 1.95 | (d) | | | | | (0.29 | )(d) | | | | | 27 | |
| | | 15.94 | | | | | | 7.56 | | | | | | 12,262 | | | | | | 1.93 | (d) | | | | | 1.96 | (d) | | | | | (0.29 | )(d) | | | | | 27 | |
| | | 16.95 | | | | | | 8.24 | | | | | | 602,992 | | | | | | 0.78 | (d) | | | | | 0.81 | (d) | | | | | 0.87 | (d) | | | | | 27 | |
| | | 16.71 | | | | | | 7.88 | | | | | | 64 | | | | | | 1.28 | (d) | | | | | 1.30 | (d) | | | | | 0.15 | (d) | | | | | 27 | |
| | | 16.95 | | | | | | 8.10 | | | | | | 3,506 | | | | | | 0.93 | (d) | | | | | 0.97 | (d) | | | | | 0.70 | (d) | | | | | 27 | |
| | | | | | | | | | | | | | | | | | | | | | | | | | | | | | | | | | | | | | | | |
| | | | | | | | | | | | | | | | | | | | | | | | | | | | | | | | | | | | | | | | |
| | | 15.45 | | | | | | 38.17 | | | | | | 34,792 | | | | | | 1.15 | | | | | | 1.21 | | | | | | 0.80 | | | | | | 95 | |
| | | 14.96 | | | | | | 37.09 | | | | | | 648 | | | | | | 1.90 | | | | | | 1.96 | | | | | | 0.04 | | | | | | 95 | |
| | | 14.82 | | | | | | 37.07 | | | | | | 10,648 | | | | | | 1.90 | | | | | | 1.96 | | | | | | 0.04 | | | | | | 95 | |
| | | 15.66 | | | | | | 38.73 | | | | | | 493,729 | | | | | | 0.75 | | | | | | 0.81 | | | | | | 1.17 | | | | | | 95 | |
| | | 15.49 | | | | | | 38.08 | | | | | | 411 | | | | | | 1.27 | | | | | | 1.29 | | | | | | 0.81 | | | | | | 95 | |
| | | 15.68 | | | | | | 38.48 | | | | | | 843 | | | | | | 0.91 | | | | | | 0.96 | | | | | | 1.02 | | | | | | 95 | |
| | | 11.38 | | | | | | 15.69 | (f) | | | | | 35,890 | | | | | | 1.09 | | | | | | 1.23 | | | | | | 1.13 | | | | | | 184 | |
| | | 11.05 | | | | | | 14.95 | (f) | | | | | 584 | | | | | | 1.84 | | | | | | 1.98 | | | | | | 0.35 | | | | | | 184 | |
| | | 10.95 | | | | | | 14.89 | (f) | | | | | 8,228 | | | | | | 1.84 | | | | | | 1.97 | | | | | | 0.44 | | | | | | 184 | |
| | | 11.54 | | | | | | 16.12 | (f) | | | | | 304,435 | | | | | | 0.69 | | | | | | 0.82 | | | | | | 1.65 | | | | | | 184 | |
| | | 11.46 | | | | | | 15.56 | (f) | | | | | 40 | | | | | | 1.19 | | | | | | 1.32 | | | | | | 1.11 | | | | | | 184 | |
| | | 11.55 | | | | | | 16.01 | (f) | | | | | 476 | | | | | | 0.84 | | | | | | 0.97 | | | | | | 1.42 | | | | | | 184 | |
| | | 9.94 | | | | | | 3.02 | | | | | | 51,064 | | | | | | 1.09 | | | | | | 1.24 | | | | | | 0.85 | (g) | | | | | 99 | |
| | | 9.64 | | | | | | 2.18 | | | | | | 895 | | | | | | 1.84 | | | | | | 1.99 | | | | | | 0.12 | (g) | | | | | 99 | |
| | | 9.57 | | | | | | 2.22 | | | | | | 7,964 | | | | | | 1.84 | | | | | | 1.99 | | | | | | 0.14 | (g) | | | | | 99 | |
| | | 10.08 | | | | | | 3.43 | | | | | | 227,070 | | | | | | 0.69 | | | | | | 0.84 | | | | | | 1.31 | (g) | | | | | 99 | |
| | | 10.01 | | | | | | 2.92 | | | | | | 36 | | | | | | 1.19 | | | | | | 1.34 | | | | | | 0.72 | (g) | | | | | 99 | |
| | | 10.09 | | | | | | 3.35 | | | | | | 494 | | | | | | 0.84 | | | | | | 0.99 | | | | | | 1.01 | (g) | | | | | 99 | |
| | | 9.73 | | | | | | 13.46 | | | | | | 91,857 | | | | | | 1.09 | | | | | | 1.25 | | | | | | 0.82 | | | | | | 200 | |
| | | 9.44 | | | | | | 12.65 | | | | | | 1,539 | | | | | | 1.84 | | | | | | 2.00 | | | | | | 0.08 | | | | | | 200 | |
| | | 9.39 | | | | | | 12.59 | | | | | | 9,484 | | | | | | 1.84 | | | | | | 2.00 | | | | | | 0.07 | | | | | | 200 | |
| | | 9.89 | | | | | | 14.04 | | | | | | 200,795 | | | | | | 0.69 | | | | | | 0.85 | | | | | | 1.22 | | | | | | 200 | |
| | | 9.81 | | | | | | 13.34 | | | | | | 59 | | | | | | 1.19 | | | | | | 1.35 | | | | | | 0.69 | | | | | | 200 | |
| | | 9.89 | | | | | | 22.18 | | | | | | 1 | | | | | | 0.84 | (d) | | | | | 1.00 | (d) | | | | | 0.97 | (d) | | | | | 200 | |
| | | 8.64 | | | | | | 21.43 | | | | | | 90,909 | | | | | | 1.09 | | | | | | 1.28 | | | | | | 1.37 | (h) | | | | | 352 | |
| | | 8.38 | | | | | | 20.48 | | | | | | 2,259 | | | | | | 1.84 | | | | | | 2.03 | | | | | | 0.62 | (h) | | | | | 352 | |
| | | 8.33 | | | | | | 20.56 | | | | | | 10,887 | | | | | | 1.84 | | | | | | 2.03 | | | | | | 0.63 | (h) | | | | | 352 | |
| | | 8.78 | | | | | | 21.90 | | | | | | 133,016 | | | | | | 0.69 | | | | | | 0.88 | | | | | | 1.88 | (h) | | | | | 352 | |
| | | 8.72 | | | | | | 21.41 | | | | | | 48 | | | | | | 1.19 | | | | | | 1.38 | | | | | | 1.28 | (h) | | | | | 352 | |
| | |
| The accompanying notes are an integral part of these financial statements. | | 59 |
GOLDMAN SACHS INTERNATIONAL TAX-MANAGED EQUITY FUND
Financial Highlights
Selected Data for a Share Outstanding Throughout Each Period
| | | | | | | | | | | | | | | | | | | | | | |
| | | | | | | | Income (loss) from
investment operations | | | | |
| | | Year - Share Class | | Net asset
value,
beginning
of period | | | Net
investment
income(a) | | | Net realized
and unrealized
gain (loss) | | | Total from
investment
operations | | | Distributions
to shareholders
from net
investment
income | |
| | FOR THE SIX MONTHS ENDED JUNE 30, (UNAUDITED) | |
| | 2014 - A | | $ | 9.18 | | | $ | 0.21 | (d) | | $ | 0.23 | | | $ | 0.44 | | | $ | — | |
| | 2014 - C | | | 9.03 | | | | 0.18 | (d) | | | 0.21 | | | | 0.39 | | | | — | |
| | 2014 - Institutional | | | 9.10 | | | | 0.24 | (d) | | | 0.21 | | | | 0.45 | | | | — | |
| | 2014 - IR | | | 9.17 | | | | 0.23 | (d) | | | 0.22 | | | | 0.45 | | | | — | |
| | | | | | | | | | | | | | | | | | | | | | |
| | FOR THE FISCAL YEARS ENDED DECEMBER 31, | |
| | 2013 - A | | | 7.62 | | | | 0.15 | | | | 1.54 | | | | 1.69 | | | | (0.13 | )(f) |
| | 2013 - C | | | 7.55 | | | | 0.10 | | | | 1.51 | | | | 1.61 | | | | (0.13 | )(f) |
| | 2013 - Institutional | | | 7.59 | | | | 0.19 | | | | 1.53 | | | | 1.72 | | | | (0.21 | )(f) |
| | 2013 - IR | | | 7.66 | | | | 0.20 | | | | 1.51 | | | | 1.71 | | | | (0.20 | )(f) |
| | 2012 - A | | | 6.65 | | | | 0.17 | | | | 0.98 | | | | 1.15 | | | | (0.18 | ) |
| | 2012 - C | | | 6.64 | | | | 0.11 | | | | 0.96 | | | | 1.07 | | | | (0.16 | ) |
| | 2012 - Institutional | | | 6.64 | | | | 0.19 | | | | 0.98 | | | | 1.17 | | | | (0.22 | ) |
| | 2012 - IR | | | 6.64 | | | | 0.35 | | | | 0.82 | | | | 1.17 | | | | (0.15 | ) |
| | 2011 - A | | | 7.90 | | | | 0.20 | (g) | | | (1.25 | ) | | | (1.05 | ) | | | (0.20 | ) |
| | 2011 - C | | | 7.88 | | | | 0.13 | (g) | | | (1.23 | ) | | | (1.10 | ) | | | (0.14 | ) |
| | 2011 - Institutional | | | 7.90 | | | | 0.21 | (g) | | | (1.23 | ) | | | (1.02 | ) | | | (0.24 | ) |
| | 2011 - IR | | | 7.90 | | | | 0.20 | (g) | | | (1.24 | ) | | | (1.04 | ) | | | (0.22 | ) |
| | 2010 - A | | | 7.40 | | | | 0.13 | | | | 0.51 | | | | 0.64 | | | | (0.14 | ) |
| | 2010 - C | | | 7.39 | | | | 0.08 | | | | 0.50 | | | | 0.58 | | | | (0.09 | ) |
| | 2010 - Institutional | | | 7.39 | | | | 0.15 | | | | 0.53 | | | | 0.68 | | | | (0.17 | ) |
| | 2010 - IR (Commenced August 31, 2010) | | | 6.82 | | | | 0.03 | | | | 1.21 | | | | 1.24 | | | | (0.16 | ) |
| | 2009 - A | | | 6.07 | | | | 0.13 | | | | 1.32 | | | | 1.45 | | | | (0.12 | ) |
| | 2009 - C | | | 6.06 | | | | 0.09 | | | | 1.31 | | | | 1.40 | | | | (0.07 | ) |
| | 2009 - Institutional | | | 6.06 | | | | 0.15 | | | | 1.33 | | | | 1.48 | | | | (0.15 | ) |
| | (a) | | Calculated based on the average shares outstanding methodology. |
| | (b) | | Assumes investment at the net asset value at the beginning of the period, reinvestment of all distributions, a complete redemption of the investment at the net asset value at the end of the period and no sales or redemption charges. Total returns would be reduced if a sales or redemption charge was taken into account. Returns do not reflect the deduction of taxes that a shareholder would pay on Fund distributions or the redemption of Fund shares. Total returns for periods less than one full year are not annualized. |
| | (c) | | The Fund’s portfolio turnover rate is calculated in accordance with regulatory requirements, without regard to transactions involving short term investments and certain derivatives. If such transactions were included, the Fund’s portfolio turnover rate may be higher. |
| | (d) | | Reflects income recognized from a corporate action which amounted to $0.08 per share and 1.72% of average net assets. |
| | (f) | | Includes a distribution from capital of less than $0.01 per share. |
| | (g) | | Reflects income recognized from special dividends which amounted to $0.01 per share and 0.16% of average net assets. |
| | |
| 60 | | The accompanying notes are an integral part of these financial statements. |
GOLDMAN SACHS INTERNATIONAL TAX-MANAGED EQUITY FUND
| | | | | | | | | | | | | | | | | | | | | | | | | | | | | | | | | | | | | | | | |
| | | | | | | | | | | | | | | | | | | | | | | | | | | | | | | | | | |
| | | Net asset
value, end
of period | | | | | Total
return(b) | | | | | Net assets,
end of period (in 000s) | | | | | Ratio of
net expenses
to average
net assets | | | | | Ratio of
total expenses
to average
net assets | | | | | Ratio of
net investment
income to average net assets | | | | | Portfolio
turnover
rate(c) | |
| | | | | | | | | | | | | | | | | | | | | | | | | | | | | | | | | | | | | | | | |
| | $ | 9.62 | | | | | | 4.79 | % | | | | $ | 2,890 | | | | | | 1.39 | %(e) | | | | | 1.44 | %(e) | | | | | 4.63 | %(d)(e) | | | | | 44 | % |
| | | 9.42 | | | | | | 4.32 | | | | | | 118 | | | | | | 2.13 | (e) | | | | | 2.20 | (e) | | | | | 4.01 | (d)(e) | | | | | 44 | |
| | | 9.55 | | | | | | 4.95 | | | | | | 296,524 | | | | | | 0.99 | (e) | | | | | 1.04 | (e) | | | | | 5.18 | (d)(e) | | | | | 44 | |
| | | 9.62 | | | | | | 4.91 | | | | | | 234 | | | | | | 1.14 | (e) | | | | | 1.19 | (e) | | | | | 5.01 | (d)(e) | | | | | 44 | |
| | | | | | | | | | | | | | | | | | | | | | | | | | | | | | | | | | | | | | | | |
| | | | | | | | | | | | | | | | | | | | | | | | | | | | | | | | | | | | | | | | |
| | | 9.18 | | | | | | 22.23 | | | | | | 3,388 | | | | | | 1.31 | | | | | | 1.51 | | | | | | 1.79 | | | | | | 95 | |
| | | 9.03 | | | | | | 21.38 | | | | | | 70 | | | | | | 2.10 | | | | | | 2.23 | | | | | | 1.15 | | | | | | 95 | |
| | | 9.10 | | | | | | 22.70 | | | | | | 228,410 | | | | | | 0.95 | | | | | | 1.08 | | | | | | 2.27 | | | | | | 95 | |
| | | 9.17 | | | | | | 22.36 | | | | | | 217 | | | | | | 1.12 | | | | | | 1.21 | | | | | | 2.34 | | | | | | 95 | |
| | | 7.62 | | | | | | 17.25 | | | | | | 15,384 | | | | | | 1.26 | | | | | | 1.59 | | | | | | 2.44 | | | | | | 182 | |
| | | 7.55 | | | | | | 16.20 | | | | | | 32 | | | | | | 2.01 | | | | | | 2.30 | | | | | | 1.52 | | | | | | 182 | |
| | | 7.59 | | | | | | 17.71 | | | | | | 134,290 | | | | | | 0.86 | | | | | | 1.17 | | | | | | 2.69 | | | | | | 182 | |
| | | 7.66 | | | | | | 17.68 | | | | | | 1 | | | | | | 1.02 | | | | | | 1.36 | | | | | | 5.14 | | | | | | 182 | |
| | | 6.65 | | | | | | (13.33 | ) | | | | | 40,837 | | | | | | 1.26 | | | | | | 1.57 | | | | | | 2.60 | (g) | | | | | 88 | |
| | | 6.64 | | | | | | (13.88 | ) | | | | | 19 | | | | | | 2.01 | | | | | | 2.32 | | | | | | 1.72 | (g) | | | | | 88 | |
| | | 6.64 | | | | | | (12.92 | ) | | | | | 101,165 | | | | | | 0.86 | | | | | | 1.17 | | | | | | 2.81 | (g) | | | | | 88 | |
| | | 6.64 | | | | | | (13.11 | ) | | | | | 1 | | | | | | 1.01 | | | | | | 1.32 | | | | | | 2.68 | (g) | | | | | 88 | |
| | | 7.90 | | | | | | 8.64 | | | | | | 75,854 | | | | | | 1.26 | | | | | | 1.56 | | | | | | 1.75 | | | | | | 70 | |
| | | 7.88 | | | | | | 7.89 | | | | | | 24 | | | | | | 2.01 | | | | | | 2.31 | | | | | | 1.05 | | | | | | 70 | |
| | | 7.90 | | | | | | 9.17 | | | | | | 85,604 | | | | | | 0.86 | | | | | | 1.16 | | | | | | 2.12 | | | | | | 70 | |
| | | 7.90 | | | | | | 18.21 | | | | | | 1 | | | | | | 1.01 | (e) | | | | | 1.31 | (e) | | | | | 1.26 | (e) | | | | | 70 | |
| | | 7.40 | | | | | | 23.98 | | | | | | 77,469 | | | | | | 1.26 | | | | | | 1.67 | | | | | | 2.00 | | | | | | 101 | |
| | | 7.39 | | | | | | 23.13 | | | | | | 8 | | | | | | 2.01 | | | | | | 2.42 | | | | | | 1.38 | | | | | | 101 | |
| | | 7.39 | | | | | | 24.47 | | | | | | 53,159 | | | | | | 0.86 | | | | | | 1.27 | | | | | | 2.24 | | | | | | 101 | |
| | |
| The accompanying notes are an integral part of these financial statements. | | 61 |
GOLDMAN SACHS TAX-ADVANTAGED EQUITY FUNDS
Notes to Financial Statements
June 30, 2014 (Unaudited)
Goldman Sachs Trust (the “Trust”) is a Delaware statutory trust registered under the Investment Company Act of 1940, as amended (the “Act”), as an open-end management investment company. The following table lists those series of the Trust that are included in this report (collectively, the “Funds” or individually a “Fund”), along with their corresponding share classes and respective diversification status under the Act:
| | | | |
| Fund | | Share Classes Offered* | | Diversified/ Non-diversified |
U.S. Equity Dividend and Premium, International Equity Dividend and Premium, International Tax-Managed Equity† | | A, C, Institutional and IR | | Diversified |
U.S. Tax-Managed Equity† | | A, B, C, Institutional, Service and IR | | Diversified |
| * | | Class B Shares are generally no longer available for purchase by current or prospective investors. |
| † | | Formerly, Structured International Tax-Managed Equity and Structured Tax-Managed Equity Funds, respectively. Effective on April 30, 2014, the Funds changed their names to the International Tax-Managed Equity and U.S. Tax-Managed Equity Funds, respectively. |
Class A Shares are sold with a front-end sales charge of up to 5.50%. Class B Shares were sold with a contingent deferred sales charge (“CDSC”) that declines from 5.00% to zero, depending upon the period of time the shares are held. Class C Shares are sold with a CDSC of 1.00%, which is imposed on redemptions made within 12 months of purchase. Institutional, Service and Class IR Shares are not subject to a sales charge.
Goldman Sachs Asset Management, L.P. (“GSAM”), an affiliate of Goldman, Sachs & Co. (“Goldman Sachs”), serves as investment adviser to the Funds pursuant to a management agreement (the “Agreement”) with the Trust.
|
| 2. SIGNIFICANT ACCOUNTING POLICIES |
The financial statements have been prepared in accordance with accounting principles generally accepted in the United States of America (“GAAP”) and require management to make estimates and assumptions that may affect the reported amounts and disclosures. Actual results may differ from those estimates and assumptions.
A. Investment Valuation — The Funds’ valuation policy is to value investments at fair value.
B. Investment Income and Investments — Investment income includes interest income and dividend income, net of any foreign withholding taxes, less any amounts reclaimable. Interest income is accrued daily and adjusted for amortization of premiums and accretion of discounts. Dividend income is recognized on ex-dividend date or, for certain foreign securities, as soon as such information is obtained subsequent to the ex-dividend date. Investment transactions are reflected on trade date. Realized gains and losses are calculated using identified cost. Investment transactions are recorded on the following business day for daily net asset value (“NAV”) calculations. Any foreign capital gains tax is accrued daily based upon net unrealized gains, and is payable upon sale of such investments. Distributions received from the Funds’ investments in United States (“U.S.”) real estate investment trusts (“REITs”) may be characterized as ordinary income, net capital gain or a return of capital. A return of capital is recorded by the Funds as a reduction to the cost basis of the REIT.
For derivative contracts, realized gains and losses are recorded upon settlement of the contract.
C. Class Allocations and Expenses — Investment income, realized and unrealized gain (loss), and non-class specific expenses of each Fund are allocated daily based upon the proportion of net assets of each class. Class specific expenses, where applicable, are borne by the respective share classes and include Distribution and Service, Transfer Agent and Service and Shareholder
62
GOLDMAN SACHS TAX-ADVANTAGED EQUITY FUNDS
|
| 2. SIGNIFICANT ACCOUNTING POLICIES (continued) |
Administration fees. Non-class specific expenses directly incurred by a Fund are charged to that Fund, while such expenses incurred by the Trust are allocated across the respective Funds on a straight-line and/or pro-rata basis depending upon the nature of the expenses.
D. Federal Taxes and Distributions to Shareholders — It is each Fund’s policy to comply with the requirements of the Internal Revenue Code of 1986, as amended (the “Code”), applicable to regulated investment companies (mutual funds) and to distribute each year substantially all of its investment company taxable income and capital gains to its shareholders. Accordingly, the Funds are not required to make any provisions for the payment of federal income tax. Distributions to shareholders are recorded on the ex-dividend date. Income and capital gains distributions, if any, are declared and paid according to the following schedule:
| | | | | | |
| Fund | | | | Income Distributions Declared/Paid | | Capital Gains Distributions Declared/Paid |
U.S. Equity Dividend and Premium International Equity Dividend and Premium | | | | Quarterly | | Annually |
U.S. Tax-Managed Equity International Tax-Managed Equity | | | | Annually | | Annually |
Net capital losses are carried forward to future fiscal years and may be used to the extent allowed by the Code to offset any future capital gains. Utilization of capital loss carryforwards will reduce the requirement of future capital gains distributions.
Under the Regulated Investment Company Modernization Act of 2010, the Funds are permitted to carry forward capital losses incurred in taxable years beginning after December 22, 2010 for an unlimited period. However, any losses incurred during those future taxable years will be required to be utilized prior to the losses incurred in pre-enactment taxable years. As a result of this ordering rule, pre-enactment capital loss carryforwards may be more likely to expire unused. Additionally, post-enactment capital losses that are carried forward will retain their character as either short-term or long-term capital losses rather than being considered all short-term as under previous law.
The characterization of distributions to shareholders for financial reporting purposes is determined in accordance with federal income tax rules, which may differ from GAAP. The source of each Fund’s distributions may be shown in the accompanying financial statements as either from net investment income, net realized gain or capital. Certain components of the Funds’ net assets on the Statements of Assets and Liabilities reflect permanent GAAP/tax differences based on the appropriate tax character.
E. Foreign Currency Translation — The accounting records and reporting currency of the Funds are maintained in U.S. dollars. Assets and liabilities denominated in foreign currencies are translated into U.S. dollars using the current exchange rates at the close of each business day. The effect of changes in foreign currency exchange rates on investments is included within net realized and unrealized gain (loss) on investments. Changes in the value of other assets and liabilities as a result of fluctuations in foreign exchange rates are included in the Statements of Operations within net change in unrealized gain (loss) on foreign currency transactions. Transactions denominated in foreign currencies are translated into U.S. dollars on the date the transaction occurred, the effects of which are included within net realized gain (loss) on foreign currency transactions.
|
| 3. INVESTMENTS AND FAIR VALUE MEASUREMENTS |
The fair value of a financial instrument is the amount that would be received to sell an asset or paid to transfer a liability in an orderly transaction between market participants at the measurement date (i.e., the exit price). GAAP establishes a fair value
63
GOLDMAN SACHS TAX-ADVANTAGED EQUITY FUNDS
Notes to Financial Statements (continued)
June 30, 2014 (Unaudited)
|
| 3. INVESTMENTS AND FAIR VALUE MEASUREMENTS (continued) |
hierarchy that prioritizes the inputs to valuation techniques used to measure fair value. The hierarchy gives the highest priority to unadjusted quoted prices in active markets for identical assets or liabilities (Level 1 measurements) and the lowest priority to unobservable inputs (Level 3 measurements). The levels used for classifying investments are not necessarily an indication of the risk associated with investing in these investments. The three levels of the fair value hierarchy are described below:
Level 1 — Unadjusted quoted prices in active markets that are accessible at the measurement date for identical, unrestricted assets or liabilities;
Level 2 — Quoted prices in markets that are not active or financial instruments for which significant inputs are observable (including, but not limited to, quoted prices for similar investments, interest rates, foreign exchange rates, volatility and credit spreads), either directly or indirectly;
Level 3 — Prices or valuations that require significant unobservable inputs (including GSAM’s assumptions in determining fair value measurement).
The Trustees have adopted Valuation Procedures that govern the valuation of the portfolio investments held by the Funds, including investments for which market quotations are not readily available. The Trustees have delegated to GSAM day-to-day responsibility for implementing and maintaining internal controls and procedures related to the valuation of the Funds’ portfolio investments. To assess the continuing appropriateness of pricing sources and methodologies, GSAM regularly performs price verification procedures and issues challenges as necessary to third party pricing vendors or brokers, and any differences are reviewed in accordance with the Valuation Procedures.
A. Level 1 and Level 2 Fair Value Investments — The valuation techniques and significant inputs used in determining the fair values for investments classified as Level 1 and Level 2 are as follows:
Equity Securities — Equity securities and investment companies traded on a U.S. securities exchange or the NASDAQ system, or those located on certain foreign exchanges, including but not limited to the Americas, are valued daily at their last sale price or official closing price on the principal exchange or system on which they are traded. If no sale occurs, equity securities and exchange traded investment companies are valued at the last bid price for long positions and at the last ask price for short positions. Investments in investment companies (other than those that are exchange traded) are valued at the NAV on the valuation date. To the extent these investments are actively traded, they are classified as Level 1 of the fair value hierarchy, otherwise they are generally classified as Level 2.
Unlisted equity securities for which market quotations are available are valued at the last sale price on the valuation date, or if no sale occurs, at the last bid price. Securities traded on certain foreign securities exchanges are valued daily at fair value determined by an independent fair value service (if available) under Valuation Procedures approved by the Trustees and consistent with applicable regulatory guidance. The independent fair value service takes into account multiple factors including, but not limited to, movements in the securities markets, certain depositary receipts, futures contracts and foreign currency exchange rates that have occurred subsequent to the close of the foreign securities exchange. These investments are generally classified as Level 2 of the fair value hierarchy.
Derivative Contracts — A derivative is an instrument whose value is derived from underlying assets, indices, reference rates or a combination of these factors.
Exchange-traded derivatives, including futures contracts, typically fall within Level 1 of the fair value hierarchy. Over-the-counter (“OTC”) and centrally cleared derivatives are valued using market transactions and other market evidence, including market-based inputs to models, calibration to market-clearing transactions, broker or dealer quotations, or other alternative pricing sources. Where models are used, the selection of a particular model to value OTC and centrally cleared derivatives depends upon the contractual terms of, and specific risks inherent in, the instrument, as well as the availability of pricing information in the
64
GOLDMAN SACHS TAX-ADVANTAGED EQUITY FUNDS
|
| 3. INVESTMENTS AND FAIR VALUE MEASUREMENTS (continued) |
market. Valuation models require a variety of inputs, including contractual terms, market prices, yield curves, credit curves, measures of volatility, voluntary and involuntary prepayment rates, loss severity rates and correlations of such inputs. For OTC and centrally cleared derivatives that trade in liquid markets, model inputs can generally be verified and model selection does not involve significant management judgment. OTC and centrally cleared derivatives are classified within Level 2 of the fair value hierarchy when significant inputs are corroborated by market evidence.
i. Futures Contracts — Futures contracts are contracts to buy or sell a standardized quantity of a specified commodity or security and are valued based on exchanged settlement prices or independent market quotes. Futures contracts are valued at the last settlement price, or in the absence of a sale, the last bid price for long positions and at the last ask price for short positions, at the end of each day on the board of trade or exchange upon which they are traded. Upon entering into a futures contract, a Fund deposits cash or securities in an account on behalf of the broker in an amount sufficient to meet the initial margin requirement. Subsequent payments are made or received by a Fund equal to the daily change in the contract value and are recorded as variation margin receivable or payable with a corresponding offset to unrealized gains or losses.
ii. Options — When a Fund writes call or put options, an amount equal to the premium received is recorded as a liability and is subsequently marked-to-market to reflect the current value of the option written. Swaptions are options on interest rate swap contracts.
Upon the purchase of a call option or a put option by a Fund, the premium paid is recorded as an investment and subsequently marked-to-market to reflect the current value of the option. Certain options may be purchased with premiums to be determined on a future date. The premiums for these options are based upon implied volatility parameters at specified terms.
B. Level 3 Fair Value Investments — To the extent that the aforementioned significant inputs are unobservable, or if quotations are not readily available, or if GSAM believes that such quotations do not accurately reflect fair value, the fair value of the Funds’ investments may be determined under Valuation Procedures approved by the Trustees. GSAM, consistent with its procedures and applicable regulatory guidance, may make an adjustment to the most recent valuation prices of either domestic or foreign securities in light of significant events to reflect what it believes to be the fair value of the securities at the time of determining a Fund’s NAV. Significant events which could affect a large number of securities in a particular market may include, but are not limited to: significant fluctuations in U.S. or foreign markets; market dislocations; market disruptions; or unscheduled market closings. Significant events which could also affect a single issuer may include, but are not limited to: corporate actions such as reorganizations, mergers and buy-outs; ratings downgrades; and bankruptcies.
C. Fair Value Hierarchy — The following is a summary of the Funds’ investments and derivatives classified in the fair value hierarchy as of June 30, 2014:
| | | | | | | | | | | | |
| | | |
| U.S. EQUITY DIVIDEND AND PREMIUM | | | | | | | | | | | | |
| | | |
| Investment Type | | Level 1 | | | Level 2 | | | Level 3 | |
| Assets | | | | | | | | | | | | |
Common Stock and/or Other Equity Investments(a) | | | | | | | | | | | | |
North America | | $ | 1,328,465,263 | | | $ | — | | | $ | — | |
65
GOLDMAN SACHS TAX-ADVANTAGED EQUITY FUNDS
Notes to Financial Statements (continued)
June 30, 2014 (Unaudited)
|
| 3. INVESTMENTS AND FAIR VALUE MEASUREMENTS (continued) |
| | | | | | | | | | | | |
| | | |
| U.S. EQUITY DIVIDEND AND PREMIUM (continued) | | | | | | | | | | | | |
| | | |
| Derivative Type | | Level 1 | | | Level 2 | | | Level 3 | |
| Assets(b) | | | | | | | | | | | | |
Futures Contracts | | $ | 280,340 | | | $ | — | | | $ | — | |
| Liabilities | | | | | | | | | | | | |
Written Options | | $ | (8,340,255 | ) | | $ | — | | | $ | — | |
| | | |
| INTERNATIONAL EQUITY DIVIDEND AND PREMIUM | | | | | | | | | | | | |
| | | |
| Investment Type | | Level 1 | | | Level 2 | | | Level 3 | |
| Assets | | | | | | | | | | | | |
Common Stock and/or Other Equity Investments(a) | | | | | | | | | | | | |
Asia | | $ | — | | | $ | 108,608,114 | | | | | |
Australia | | | — | | | | 39,373,218 | | | | | |
Europe | | | 19,021,157 | | | | 288,054,487 | | | | | |
North America | | | — | | | | 5,250,381 | | | | — | |
| Total | | $ | 19,021,157 | | | $ | 441,286,200 | | | $ | — | |
| | | |
| Derivative Type | | | | | | | | | |
| Assets(b) | | | | | | | | | | | | |
Futures Contracts | | $ | 56,822 | | | $ | — | | | $ | — | |
| Liabilities | | | | | | | | | | | | |
Futures Contracts(b) | | $ | (86,559 | ) | | $ | — | | | $ | — | |
Written Options | | | (2,458,964 | ) | | | — | | | | — | |
| Total | | $ | (2,545,523 | ) | | $ | — | | | $ | — | |
| | | |
| U.S. TAX-MANAGED EQUITY | | | | | | | | | | | | |
| | | |
| Investment Type | | Level 1 | | | Level 2 | | | Level 3 | |
| Assets | | | | | | | | | | | | |
Common Stock and/or Other Equity Investments(a) | | $ | — | | | $ | — | | | $ | — | |
North America | | | 620,801,423 | | | | — | | | | — | |
Securities Lending Reinvestment Vehicle | | | 25,485,950 | | | | — | | | | — | |
| Total | | $ | 646,287,373 | | | $ | — | | | $ | — | |
| | | |
| Derivative Type | | | | | | | | | |
| Assets(b) | | | | | | | | | | | | |
Futures Contracts | | $ | 319,650 | | | $ | — | | | $ | — | |
66
GOLDMAN SACHS TAX-ADVANTAGED EQUITY FUNDS
|
| 3. INVESTMENTS AND FAIR VALUE MEASUREMENTS (continued) |
| | | | | | | | | | | | |
| | | |
| INTERNATIONAL TAX-MANAGED EQUITY | | | | | | | | | | | | |
| | | |
| Investment Type | | Level 1 | | | Level 2 | | | Level 3 | |
| Assets | | | | | | | | | | | | |
Common Stock and/or Other Equity Investments(a) | | | | | | | | | | | | |
Asia | | $ | — | | | $ | 69,999,991 | | | $ | — | |
Australia | | | — | | | | 25,019,261 | | | | | |
Europe | | | 9,909,260 | | | | 170,661,390 | | | | | |
North America | | | — | | | | 560,763 | | �� | | | |
Securities Lending Reinvestment Vehicle | | | 3,352,170 | | | | — | | | | — | |
| Total | | $ | 13,261,430 | | | $ | 266,241,405 | | | $ | — | |
| | | |
| Derivative Type | | | | | | | | | |
| Assets(b) | | | | | | | | | | | | |
Futures Contracts | | $ | 52,086 | | | $ | — | | | $ | — | |
| Liabilities(b) | | | | | | | | | | | | |
Futures Contracts | | $ | (137,095 | ) | | $ | — | | | $ | — | |
| (a) | | Amounts are disclosed by continent to highlight the impact of time zone differences between local market close and the calculation of net asset value. Security valuations are based on the principal exchange or system on which they are traded, which may differ from country of domicile. The Fund(s) utilize(s) fair value model prices provided by an independent fair value service for international equities, resulting in a Level 2 classification. |
| (b) | | Amount shown represents unrealized gain (loss) at period end. |
For further information regarding security characteristics, see the Schedules of Investments.
67
GOLDMAN SACHS TAX-ADVANTAGED EQUITY FUNDS
Notes to Financial Statements (continued)
June 30, 2014 (Unaudited)
|
| 4. INVESTMENTS IN DERIVATIVES |
The following table sets forth, by certain risk types, the gross value of derivative contracts as of June 30, 2014. These instruments were used to meet the Funds’ investment objectives and to obtain and/or manage exposure related to the risks below. The values in the tables below exclude the effects of cash collateral received or posted pursuant to these derivative contracts, and therefore are not representative of the Funds’ net exposure.
| | | | | | | | | | | | | | |
| Fund | | Risk | | Statements of Assets
and Liabilities | | Assets(a) | | | Statements of Assets
and Liabilities | | Liabilities | |
U.S. Equity Dividend and Premium | | Equity | | Variation margin on certain derivative contracts | | $ | 280,340 | | | Payable for written options, at value | | $ | (8,340,255) | |
International Equity Dividend and Premium | | Equity | | Variation margin on certain derivative contracts, | | | 56,822 | | | Variation margin on certain derivative contracts, Payable for written options, at value | | | (2,545,525) | (a) |
U.S. Tax-Managed Equity | | Equity | | Variation margin on certain derivative contracts | | | 319,650 | | | — | | | — | |
International Tax-Managed Equity | | Equity | | Variation margin on certain derivative contracts | | | 52,086 | | | Variation margin on certain derivative contracts | | | (137,095) | (a) |
| Total | | | | | | | $708,898 | | | | | $ | (11,022,875) | |
| (a) | | Includes cumulative appreciation (depreciation) on futures contracts described in the Additional Investment Information sections of the Schedules of Investments. Only current day’s variation margin is reported within the Statements of Assets and Liabilities. |
The following table sets forth, by certain risk types, the Funds’ gains (losses) related to these derivatives and their indicative volumes for the six months ended June 30, 2014. These gains (losses) should be considered in the context that these derivative contracts may have been executed to create investment opportunities and/or economically hedge certain investments, and
68
GOLDMAN SACHS TAX-ADVANTAGED EQUITY FUNDS
|
| 4. INVESTMENTS IN DERIVATIVES (continued) |
accordingly, certain gains (losses) on such derivative contracts may offset certain (losses) gains attributable to investments. These gains (losses) are included in “Net realized gain (loss)” or “Net change in unrealized gain (loss)” on the Statements of Operations:
| | | | | | | | | | | | | | | | |
| Fund | | Risk | | Statements of Operations | | Net
Realized
Gain (Loss) | | | Net Change in
Unrealized
Gain (Loss) | | | Average
Number of
Contracts(a) | |
U.S. Equity Dividend and Premium | | Equity | | Net realized gain (loss) from futures contracts and written options/Net change in unrealized gain (loss) on futures contracts and written options | | $ | (13,554,910 | ) | | $ | 3,913,950 | | | | 2,907 | |
International Equity Dividend and Premium | | Equity | | Net realized gain (loss) from futures contracts and written options/Net change in unrealized gain (loss) on futures contracts, and written options | | | 1,478,715 | | | | 2,981,244 | | | | 2,973 | |
U.S. Tax-Managed Equity | | Equity | | Net realized gain (loss) from futures contracts/Net change in unrealized gain (loss) on futures contracts | | | 2,281,951 | | | | (398,401 | ) | | | 233 | |
International Tax-Managed Equity | | Equity | | Net realized gain (loss) from futures contracts/Net change in unrealized gain (loss) on futures contracts | | | 595,606 | | | | (519,889 | ) | | | 162 | |
| (a) | | Average number of contracts is based on the average of month end balances for the period ended June 30, 2014. |
In order to better define its contractual rights and to secure rights that will help a Fund mitigate its counterparty risk, a Fund may enter into an International Swaps and Derivatives Association, Inc. Master Agreement (“ISDA Master Agreement”) or similar agreement with its derivatives counterparties. An ISDA Master Agreement is a bilateral agreement between a Fund and a counterparty that governs OTC derivatives, including foreign exchange contracts, and typically contains, among other things, collateral posting terms and netting provisions in the event of a default and/or termination event. The provisions of the ISDA Master Agreement typically permit a single net payment in the event of a default (close-out netting) or similar event, including the bankruptcy or insolvency of the counterparty.
Collateral and margin requirements differ between exchange traded derivatives and OTC derivatives. Margin requirements are established by the broker or clearing house for exchange-traded and centrally cleared derivatives (financial futures contracts, options and centrally cleared swaps) pursuant to governing agreements for those instrument types. Brokers can ask for margin in excess of the minimum in certain circumstances. Collateral terms are contract-specific for OTC derivatives (foreign currency exchange contracts, and certain options and swaps). For derivatives traded under an ISDA Master Agreement, the collateral requirements are typically calculated by netting the marked to market amount for each transaction under such agreement and comparing that amount to the value of any collateral currently pledged by a Fund and the counterparty. Additionally, a Fund may be required to post initial margin to the counterparty, the terms of which would be outlined in the confirmation of the OTC transaction.
For financial reporting purposes, cash collateral that has been pledged to cover obligations of a Fund and cash collateral received from the counterparty, if any, is reported separately on the Statements of Assets and Liabilities as receivables/payables for collateral on certain derivative contracts. Non-cash collateral pledged by a Fund, if any, is noted in the Schedules of Investments. Generally, the amount of collateral due from or to a counterparty must exceed a minimum transfer amount threshold before a transfer is required to be made. To the extent amounts due to a Fund from its counterparties are not fully collateralized,
69
GOLDMAN SACHS TAX-ADVANTAGED EQUITY FUNDS
Notes to Financial Statements (continued)
June 30, 2014 (Unaudited)
|
| 4. INVESTMENTS IN DERIVATIVES (continued) |
contractually or otherwise, the Fund bears the risk of loss from counterparty nonperformance. A Fund attempts to mitigate counterparty risk by only entering into agreements with counterparties that it believes to be of good standing and by monitoring the financial stability of those counterparties.
Additionally, the netting of assets and liabilities and the offsetting of collateral pledged or received are based on contractual netting/set-off provisions in the ISDA Master Agreement or similar agreements. However, in the event of a default or insolvency of a counterparty, a court could determine that such rights are not enforceable due the restrictions or prohibitions against the right of setoff that may be imposed due to a particular jurisdiction’s bankruptcy or insolvency laws.
|
| 5. AGREEMENTS AND AFFILIATED TRANSACTIONS |
A. Management Agreement — Under the Agreement, GSAM manages the Funds, subject to the general supervision of the Trustees.
As compensation for the services rendered pursuant to the Agreement, the assumption of the expenses related thereto and administration of the Funds’ business affairs, including providing facilities, GSAM is entitled to a management fee, accrued daily and paid monthly, equal to an annual percentage rate of each Fund’s average daily net assets.
For the six months ended June 30, 2014, contractual and effective net management fees with GSAM were at the following rates:
| | | | | | | | | | | | | | | | | | | | | | | | | | |
| | | | | Contractual Management Fee Rate | |
| Fund | | | | First
$1 billion | | | Next
$1 billion | | | Next
$3 billion | | | Next
$3 billion | | | Over
$8 billion | | | Effective
Rate | |
U.S. Equity Dividend and Premium | | | | | 0.75 | % | | | 0.68 | % | | | 0.65 | % | | | 0.64 | % | | | 0.63 | % | | | 0.73 | % |
International Equity Dividend and Premium | | | | | 0.81 | | | | 0.73 | | | | 0.69 | | | | 0.68 | | | | 0.67 | | | | 0.81 | |
U.S. Tax-Managed Equity | | | | | 0.70 | | | | 0.63 | | | | 0.60 | | | | 0.59 | | | | 0.58 | | | | 0.70 | |
International Tax-Managed Equity | | | | | 0.85 | | | | 0.77 | | | | 0.73 | | | | 0.72 | | | | 0.71 | | | | 0.85 | |
B. Distribution and Service Plans — The Trust, on behalf of each Fund, has adopted Distribution and Service Plans (the “Plans”). Under the Plans, Goldman Sachs, which serves as distributor (the “Distributor”), is entitled to a fee accrued daily and paid monthly for distribution services and personal and account maintenance services, which may then be paid by Goldman Sachs to authorized dealers, at the following annual rates calculated on a Fund’s average daily net assets of each respective share class:
| | | | | | | | | | | | |
| | | Distribution and Service Plan Rates | |
| | | Class A* | | | Class B | | | Class C | |
Distribution Plan | | | 0.25 | % | | | 0.75 | % | | | 0.75 | % |
Service Plan | | | — | | | | 0.25 | | | | 0.25 | |
| * | | With respect to Class A Shares, the Distributor at its discretion may use compensation for distribution services paid under the Distribution Plan to compensate service organizations for personal and account maintenance services and expenses as long as such total compensation does not exceed the maximum cap on “service fees” imposed by the Financial Industry Regulatory Authority. |
C. Distribution Agreement — Goldman Sachs, as Distributor of the shares of the Funds pursuant to a Distribution Agreement, may retain a portion of the Class A front end sales charge and Class B and Class C Shares’ CDSC. During the six months ended
70
GOLDMAN SACHS TAX-ADVANTAGED EQUITY FUNDS
|
| 5. AGREEMENTS AND AFFILIATED TRANSACTIONS (continued) |
June 30, 2014, Goldman Sachs advised that it retained front end sales charges of 10,154, $637, $4,557 and $327 for the U.S. Equity Dividend and Premium, International Equity Dividend and Premium, U.S. Tax-Managed Equity and International Tax-Managed Equity Funds, respectively. Goldman Sachs retained $13 of contingent deferred sales charges for the U.S. Tax-Managed Equity Fund for the six months ended June 30, 2014.
D. Service Plan and Shareholder Administration Plan — The Trust, on behalf of each Fund that offers Service Shares, has adopted a Service Plan and a Shareholder Administration Plan. These plans allow for service organizations to provide varying levels of personal and account maintenance and shareholder administration services to their customers who are beneficial owners of such shares. The Service Plan and Shareholder Administration Plan each provide for compensation to the service organizations which is accrued daily and paid monthly at an annual rate of 0.25% (0.50% in aggregate) of the average daily net assets of the Service Shares.
E. Transfer Agency Agreement — Goldman Sachs also serves as the transfer agent of the Funds for a fee pursuant to Transfer Agency Agreement. The fees charged for such transfer agency services are accrued daily and paid monthly at annual rates as follows: 0.19% of the average daily net assets of Class A, Class B, Class C and Class IR Shares; and 0.04% of the average daily net assets of Institutional and Service Shares.
F. Other Expense Agreements and Affiliated Transactions — GSAM has agreed to limit certain “Other Expense” of the Funds (excluding transfer agent fees and expenses, service fees and shareholder administration fees (as applicable), taxes, interest, brokerage fees, shareholder meeting, litigation, indemnification and extraordinary expenses) to the extent such expenses exceed, on an annual basis, a percentage rate of the average daily net assets of each Fund. Such Other Expense reimbursements, if any, are accrued daily and paid monthly. In addition, the Funds are not obligated to reimburse GSAM for prior fiscal year expense reimbursements, if any. The Other Expense limitations as an annual percentage rate of average daily net assets for the U.S. Equity Dividend and Premium, International Equity Dividend and Premium, U.S. Tax-Managed Equity and International Tax-Managed Equity Funds are 0.014%, 0.124%, 0.044% and 0.094%, respectively. These Other Expense limitations will remain in place through at least April 30, 2015, and prior to such date GSAM may not terminate the arrangements without the approval of the Trustees. The Funds bear their respective share of costs related to proxy and shareholder meetings, and GSAM has agreed to reimburse each Fund to the extent such expenses exceed a specified percentage of the Fund’s net assets. In addition, the Funds have entered into certain offset arrangements with the custodian and the transfer agent, which may result in a reduction of the Funds’ expenses and are received irrespective of the application of the “Other Expense” limitations described above.
For the six months ended June 30, 2014, these expense reductions, including any fee waivers and Other Expense reimbursements, were as follows:
| | | | | | | | | | | | | | |
| Fund | | | | Other Expense
Reimbursement | | | Custody Fee
Credits | | | Total Expense
Reductions | |
U.S. Equity Dividend and Premium | | | | $ | 119,678 | | | $ | 8,310 | | | $ | 127,988 | |
International Equity Dividend and Premium | | | | | — | | | | 1,229 | | | | 1,229 | |
U.S. Tax-Managed Equity | | | | | 72,015 | | | | 11,900 | | | | 83,915 | |
International Tax-Managed Equity | | | | | 73,446 | | | | 1,510 | | | | 74,956 | |
71
GOLDMAN SACHS TAX-ADVANTAGED EQUITY FUNDS
Notes to Financial Statements (continued)
June 30, 2014 (Unaudited)
|
| 5. AGREEMENTS AND AFFILIATED TRANSACTIONS (continued) |
As of June 30, 2014, the amounts owed to affiliates of the Funds were as follows:
| | | | | | | | | | | | | | | | | | |
| Fund | | | | Management
Fees | | | Distribution
and Service
Fees | | | Transfer
Agent
Fees | | | Total | |
U.S. Equity Dividend and Premium | | | | $ | 808,499 | | | $ | 92,974 | | | $ | 78,362 | | | $ | 979,835 | |
International Equity Dividend and Premium | | | | | 312,302 | | | | 4,842 | | | | 17,426 | | | | 334,570 | |
U.S. Tax-Managed Equity | | | | | 371,839 | | | | 18,645 | | | | 28,103 | | | | 418,137 | |
International Tax-Managed Equity | | | | | 203,393 | | | | 701 | | | | 9,979 | | | | 214,073 | |
G. Line of Credit Facility — As of June 30, 2014, the Funds participated in a $1,080,000,000 committed, unsecured revolving line of credit facility (the “facility”) together with other funds of the Trust and registered investment companies having management agreements with GSAM or its affiliates (“Other Borrowers”). Pursuant to the terms of the facility, the Funds and Other Borrowers could increase the credit amount by an additional $120,000,000, for a total of up to $1,200,000,000. This facility is to be used solely for temporary or emergency purposes, which may include the funding of redemptions. The interest rate on borrowings is based on the federal funds rate. The facility also requires a fee to be paid by the Funds based on the amount of the commitment that has not been utilized. For the six months ended June 30, 2014, the Funds did not have any borrowings under the facility.
H. Other Transactions with Affiliates — For the six months ended June 30, 2014, Goldman Sachs earned $1,295, $9,841, $2,504 and $4,634 in brokerage commissions from portfolio transactions, including futures transactions executed with Goldman Sachs as the Futures Commission Merchant, on behalf of the U.S. Equity Dividend and Premium, International Equity Dividend and Premium, U.S. Tax-Managed Equity and International Tax-Managed Equity Funds, respectively.
As of June 30, 2014, the following Goldman Sachs Fund of Funds Portfolios were the beneficial owners of 5% or more of total outstanding shares of the following Funds:
| | | | | | | | | | |
| Fund | | | | Goldman Sachs Enhanced Dividend
Global Equity
Portfolio | | | Goldman Sachs Tax-Advantaged
Global Equity
Portfolio | |
U.S. Equity Dividend and Premium | | | | | 11 | % | | | — | % |
International Equity Dividend and Premium | | | | | 18 | | | | — | |
U.S. Tax-Managed Equity | | | | | — | | | | 86 | |
International Tax-Managed Equity | | | | | — | | | | 88 | |
As of June 30, 2014, the Goldman Sachs Group, Inc. was the beneficial owner of approximately 9% of the Class C Shares of the International Tax-Managed Equity Fund.
72
GOLDMAN SACHS TAX-ADVANTAGED EQUITY FUNDS
|
| 6. PORTFOLIO SECURITIES TRANSACTIONS |
The cost of purchases and proceeds from sales and maturities of long-term securities for the six months ended June 30, 2014, were as follows:
| | | | | | | | | | |
| Fund | | | | Purchases | | | Sales | |
U.S. Equity Dividend and Premium | | | | $ | 428,442,661 | | | $ | 515,684,183 | |
International Equity Dividend and Premium | | | | | 134,335,885 | | | | 103,930,009 | |
U.S. Tax-Managed Equity | | | | | 221,336,371 | | | | 150,461,192 | |
International Tax-Managed Equity | | | | | 162,740,721 | | | | 107,924,245 | |
Pursuant to exemptive relief granted by the Securities and Exchange Commission (“SEC”) and the terms and conditions contained therein, the Funds may lend their securities through a securities lending agent, Goldman Sachs Agency Lending (“GSAL”), a wholly-owned subsidiary of Goldman Sachs, to certain qualified borrowers including Goldman Sachs and affiliates. In accordance with the Funds’ securities lending procedures, the Funds receive cash collateral at least equal to the market value of the securities on loan. The market value of the loaned securities is determined at the close of business of the Funds, at their last sale price or official closing price on the principal exchange or system on which they are traded, and any additional required collateral is delivered to the Funds on the next business day. As with other extensions of credit, the Funds may experience delay in the recovery of their securities or incur a loss should the borrower of the securities breach its agreement with the Funds or become insolvent at a time when the collateral is insufficient to cover the cost of repurchasing securities on loan. Dividend income received from securities on loan may not be subject to withholding taxes and therefore withholding taxes paid may differ from the amounts listed in the Statement of Operations.
The Funds invest the cash collateral received in connection with securities lending transactions in the Goldman Sachs Financial Square Money Market Fund (“Money Market Fund”), an affiliated series of the Trust. The Money Market Fund is registered under the Act as an open end investment company, is subject to Rule 2a-7 under the Act, and is managed by GSAM, for which GSAM may receive an investment advisory fee of up to 0.205% on an annualized basis of the average daily net assets of the Money Market Fund.
In the event of a default by a borrower with respect to any loan, GSAL will exercise any and all remedies provided under the applicable borrower agreement to make the Funds whole. These remedies include purchasing replacement securities by applying the collateral held from the defaulting broker against the purchase cost of the replacement securities. If, despite such efforts by GSAL to exercise these remedies, the Funds sustain losses as a result of a borrower’s default, GSAL indemnifies the Funds by purchasing replacement securities at its expense, or paying the Funds an amount equal to the market value of the replacement securities, subject to an exclusion for any shortfalls resulting from a loss of value in the cash collateral pool due to reinvestment risk and a requirement that the Funds agree to assign rights to the collateral to GSAL for purpose of using the collateral to cover purchase of replacement securities as more fully described in the Securities Lending Agency Agreement.
73
GOLDMAN SACHS TAX-ADVANTAGED EQUITY FUNDS
Notes to Financial Statements (continued)
June 30, 2014 (Unaudited)
|
| 7. SECURITIES LENDING (continued) |
At June 30, 2014, the Funds’ loaned securities were all subject to enforceable Securities Lending Agreements. Securities lending transactions on a net basis were as follows:
| | | | | | | | | | |
| Security Lending Transactions | | | | U.S.
TAX-MANAGED
EQUITY | | | INTERNATIONAL
TAX-MANAGED
EQUITY | |
Total gross amount presented in Statements of Assets and Liabilities | | | | $ | 25,163,013 | | | $ | 3,141,111 | |
Cash Collateral offsetting (1) | | | | | (25,134,103 | ) | | | (3,141,111 | ) |
Net Amount (2) | | | | $ | 28,910 | | | $ | — | |
| (1) | | At June 30, 2014 the value of the collateral received from each borrower exceeded the value of the related securities on loan. |
| (2) | | Net amount represents the net amount due from the borrower or GSAL in the event of a default based on the contractual set-off rights under the agreement. |
Both the Funds and GSAL received compensation relating to the lending of the Funds’ securities. The amounts earned by the Funds for the six months ended June 30, 2014, are reported under Investment Income on the Statements of Operations.
The table below details securities lending activity with affiliates of Goldman Sachs:
| | | | | | | | | | | | | | |
| | | | | For the Six Months Ended June 30, 2014 | | | Amounts Payable to Goldman Sachs Upon Return of Securities Loaned as of June 30, 2014 | |
| Fund | | | | Earnings of GSAL Relating to Securities Loaned | | | Amounts Received by the Funds from Lending to Goldman Sachs | | |
U.S. Tax-Managed Equity | | | | $ | 7,911 | | | $ | 4,743 | | | $ | 2,432,630 | |
International Tax-Managed Equity | | | | | 19,561 | | | | 26,158 | | | | 11,953 | |
The following table provides information about the Funds’ investment in the Money Market Fund for the six months ended June 30, 2014:
| | | | | | | | | | | | | | | | | | | | | | |
| Fund | | | | Number of
Shares Held
Beginning
of Period | | | Shares
Bought | | | Shares
Sold | | | Number of
Shares Held
End of Period | | | Value at
End of Period | |
U.S. Tax-Managed Equity | | | | | 19,546,094 | | | | 59,534,462 | | | | (53,594,606 | ) | | | 25,485,950 | | | $ | 25,485,950 | |
International Tax-Managed Equity | | | | | 2,752,108 | | | | 71,426,871 | | | | (70,826,809 | ) | | | 3,352,170 | | | | 3,352,170 | |
74
GOLDMAN SACHS TAX-ADVANTAGED EQUITY FUNDS
As of the Funds’ most recent fiscal year end, December 31, 2013 the Funds’ capital loss carryforwards and certain timing differences on a tax-basis were as follows:
| | | | | | | | | | | | | | | | |
| | | U.S. Equity
Dividend and
Premium | | | International
Equity Dividend
and Premium | | | U.S.
Tax-Managed
Equity | | | International
Tax-Managed
Equity | |
Capital loss carryforwards:(1) | | | | | | | | | | | | | | | | |
Expiring 2016 | | $ | — | | | $ | — | | | $ | — | | | $ | (2,078,605 | ) |
Expiring 2017 | | | — | | | | — | | | | — | | | | (31,387,420 | ) |
Perpetual Long-term | | | — | | | | — | | | | — | | | | (6,801,807 | ) |
Perpetual Short-term | | | — | | | | — | | | | (1,238,798 | ) | | | (2,734,536 | ) |
Total capital loss carryforwards | | $ | — | | | $ | — | | | $ | (1,238,798 | ) | | $ | (43,002,368 | ) |
Timing differences (Qualified Late Year Loss Deferrals) | | $ | (12,672,625 | ) | | $ | (226,546 | ) | | $ | (380,014 | ) | | $ | (116,473 | ) |
| (1) | | Expiration occurs on December 31 of the year indicated. |
As of June 30, 2014, the Funds’ aggregate security unrealized gains and losses based on cost for U.S. federal income tax purposes were as follows:
| | | | | | | | | | | | | | | | |
| | | U.S. Equity
Dividend and
Premium | | | International
Equity Dividend
and Premium | | | U.S.
Tax-Managed
Equity | | | International
Tax-Managed
Equity | |
Tax cost | | $ | 1,127,989,964 | | | $ | 447,719,290 | | | $ | 471,641,820 | | | $ | 224,381,140 | |
Gross unrealized gain | | | 206,605,596 | | | | 38,418,176 | | | | 174,787,664 | | | | 56,658,826 | |
Gross unrealized loss | | | (6,130,297 | ) | | | (25,830,109 | ) | | | (142,111 | ) | | | (1,537,131 | ) |
Net unrealized security gain | | $ | 200,475,299 | | | $ | 12,588,067 | | | $ | 174,645,553 | | | $ | 55,121,695 | |
The difference between GAAP-basis and tax-basis unrealized gains (losses) is attributable primarily to wash sales, net mark to market gains (losses) on regulated futures and options contracts and differences related to the tax treatment of underlying fund investments and of passive foreign investment company investments.
GSAM has reviewed the Funds’ tax positions for all open tax years (the current and prior three years, as applicable) and has concluded that no provision for income tax is required in the Funds’ financial statements. Such open tax years remain subject to examination and adjustment by tax authorities.
The Funds’ risks include, but are not limited to, the following:
Foreign Custody Risk — A Fund that invests in foreign securities may hold such securities and foreign currency with foreign banks, agents, and securities depositories appointed by the Fund’s custodian (each a “Foreign Custodian”). In some countries, Foreign Custodians may be subject to little or no regulatory oversight or independent evaluation of their operations. Further, the laws of certain countries may place limitations on a Fund’s ability to recover its assets if a Foreign Custodian enters into bankruptcy. Investments in emerging markets may be subject to greater custody risks than investments in more developed markets.
75
GOLDMAN SACHS TAX-ADVANTAGED EQUITY FUNDS
Notes to Financial Statements (continued)
June 30, 2014 (Unaudited)
|
| 9. OTHER RISKS (continued) |
Custody services in emerging market countries are often undeveloped and may be less regulated than in more developed countries, and thus may not afford the same level of investor protection as would apply in developed countries.
Large Shareholder Redemptions Risk — A Fund may experience adverse effects when certain large shareholders, such as other funds, institutional investors (including those trading by use of non-discretionary mathematical formulas), financial intermediaries (who may make investment decisions on behalf of underlying clients and/or include a Fund in their investment model), individuals, accounts and Goldman Sachs affiliates, purchase or redeem large amounts of shares of a Fund. Such large shareholder redemptions may cause a Fund to sell portfolio securities at times when it would not otherwise do so, which may negatively impact a Fund’s NAV and liquidity. Similarly, large Fund share purchases may adversely affect a Fund’s performance to the extent that the Fund is delayed in investing new cash and is required to maintain a larger cash position than it ordinarily would. These transactions may also accelerate the realization of taxable income to shareholders if such sales of investments resulted in gains, and may also increase transaction costs. In addition, a large redemption could result in a Fund’s current expenses being allocated over a smaller asset base, leading to an increase in the Fund’s expense ratio.
Liquidity Risk — The Funds may make investments that are illiquid or that may become less liquid in response to market developments or adverse investor perceptions. Illiquid investments may be more difficult to value. Liquidity risk may also refer to the risk that a Fund will not be able to pay redemption proceeds within the allowable time period because of unusual market conditions, an unusually high volume of redemption requests, or other reasons. To meet redemption requests, a Fund may be forced to sell investments at an unfavorable time and/or under unfavorable conditions.
Market and Credit Risks — In the normal course of business, the Funds trade financial instruments and enter into financial transactions where risk of potential loss exists due to changes in the market (market risk). Additionally, the Funds may also be exposed to credit risk in the event that an issuer or guarantor fails to perform or that an institution or entity with which the Funds have unsettled or open transactions defaults.
Investing in foreign markets may involve special risks and considerations not typically associated with investing in the U.S. Foreign securities may be subject to risk of loss because of more or less foreign government regulation, less public information and less economic, political and social stability in the countries in which the Fund invests. Loss may also result from the imposition of exchange controls, confiscations and other government restrictions by the United States or other governments, or from problems in registration, settlement or custody. Foreign risk also involves the risk of negative foreign currency rate fluctuations, which may cause the value of securities denominated in such foreign currency (or other instruments through which the Fund has exposure to foreign currencies) to decline in value. Currency exchange rates may fluctuate significantly over short periods of time. To the extent that the Fund also invests in securities of issuers located in emerging markets, these risks may be more pronounced.
Under the Trust’s organizational documents, its Trustees, officers, employees and agents are indemnified, to the extent permitted by the Act and state law, against certain liabilities that may arise out of performance of their duties to the Funds. Additionally, in the course of business, the Funds enter into contracts that contain a variety of indemnification clauses. The Funds’ maximum exposure under these arrangements is unknown, as this would involve future claims that may be made against the Funds that have not yet occurred. However, GSAM believes the risk of loss under these arrangements to be remote.
Subsequent events after the Statements of Assets and Liabilities date have been evaluated through the date the financial statements were issued. GSAM has concluded that there is no impact requiring adjustment or disclosure in the financial statements.
76
GOLDMAN SACHS TAX-ADVANTAGED EQUITY FUNDS
|
| 12. SUMMARY OF SHARE TRANSACTIONS |
Share activity is as follows:
| | | | | | | | | | | | | | | | |
| | | U.S. Equity Dividend and Premium Fund | |
| | | | |
| | | For the Six Months Ended
June 30, 2014
(Unaudited) | | | For the Fiscal Year Ended
December 31, 2013 | |
| | | | |
| | | Shares | | | Dollars | | | Shares | | | Dollars | |
| | | | |
| Class A Shares | | | | | | | | | | | | | | | | |
Shares sold | | | 2,407,632 | | | $ | 27,052,568 | | | | 6,108,125 | | | $ | 64,299,556 | |
Reinvestment of distributions | | | 138,637 | | | | 1,589,594 | | | | 838,129 | | | | 9,095,796 | |
Shares redeemed | | | (3,104,590 | ) | | | (34,897,428 | ) | | | (7,223,467 | ) | | | (76,920,444 | ) |
| | | | (558,321 | ) | | | (6,255,266 | ) | | | (277,213 | ) | | | (3,525,092 | ) |
| Class C Shares | | | | | | | | | | | | | | | | |
Shares sold | | | 609,501 | | | | 6,886,642 | | | | 1,988,985 | | | | 21,061,355 | |
Reinvestment of distributions | | | 30,438 | | | | 348,127 | | | | 230,827 | | | | 2,508,475 | |
Shares redeemed | | | (449,102 | ) | | | (5,032,608 | ) | | | (989,419 | ) | | | (10,588,198 | ) |
| | | | 190,837 | | | | 2,202,161 | | | | 1,230,393 | | | | 12,981,632 | |
| Institutional Shares | | | | | | | | | | | | | | | | |
Shares sold | | | 9,068,715 | | | | 101,963,939 | | | | 25,541,741 | | | | 269,051,914 | |
Reinvestment of distributions | | | 919,385 | | | | 10,526,435 | | | | 5,189,375 | | | | 56,140,321 | |
Shares redeemed | | | (14,287,749 | ) | | | (160,628,797 | ) | | | (28,673,088 | ) | | | (305,279,302 | ) |
| | | | (4,299,649 | ) | | | (48,138,423 | ) | | | 2,058,028 | | | | 19,912,933 | |
| Class IR Shares | | | | | | | | | | | | | | | | |
Shares sold | | | 530,591 | | | | 5,983,473 | | | | 1,456,248 | | | | 15,625,964 | |
Reinvestment of distributions | | | 37,713 | | | | 432,013 | | | | 181,852 | | | | 1,973,180 | |
Shares redeemed | | | (425,700 | ) | | | (4,859,362 | ) | | | (546,796 | ) | | | (5,848,193 | ) |
| | | | 142,604 | | | | 1,556,124 | | | | 1,091,304 | | | | 11,750,951 | |
NET INCREASE (DECREASE) | | | (4,524,529 | ) | | $ | (50,635,404 | ) | | | 4,102,512 | | | $ | 41,120,424 | |
77
GOLDMAN SACHS TAX-ADVANTAGED EQUITY FUNDS
Notes to Financial Statements (continued)
June 30, 2014 (Unaudited)
|
| 12. SUMMARY OF SHARE TRANSACTIONS (continued) |
Share activity is as follows:
| | | | | | | | | | | | | | | | |
| | | International Equity Dividend and Premium Fund | |
| | | | |
| | | For the Six Months Ended
June 30, 2014
(Unaudited) | | | For the Fiscal Year Ended
December 31, 2013 | |
| | | | |
| | | Shares | | | Dollars | | | Shares | | | Dollars | |
| | | | |
| Class A Shares | | | | | | | | | | | | | | | | |
Shares sold | | | 220,055 | | | $ | 1,787,322 | | | | 502,838 | | | $ | 3,817,269 | |
Reinvestment of distributions | | | 34,863 | | | | 286,728 | | | | 79,732 | | | | 603,085 | |
Shares redeemed | | | (114,650 | ) | | | (930,623 | ) | | | (1,337,206 | ) | | | (10,029,720 | ) |
| | | | 140,268 | | | | 1,143,427 | | | | (754,636 | ) | | | (5,609,366 | ) |
| Class C Shares | | | | | | | | | | | | | | | | |
Shares sold | | | 23,711 | | | | 185,602 | | | | 101,427 | | | | 746,450 | |
Reinvestment of distributions | | | 7,748 | | | | 62,090 | | | | 15,751 | | | | 117,176 | |
Shares redeemed | | | (2,072 | ) | | | (16,546 | ) | | | (15,534 | ) | | | (118,336 | ) |
| | | | 29,387 | | | | 231,146 | | | | 101,644 | | | | 745,290 | |
| Institutional Shares | | | | | | | | | | | | | | | | |
Shares sold | | | 8,368,323 | | | | 66,750,159 | | | | 13,547,979 | | | | 101,658,103 | |
Reinvestment of distributions | | | 1,423,203 | | | | 11,521,161 | | | | 2,978,509 | | | | 22,335,640 | |
Shares redeemed | | | (5,155,782 | ) | | | (41,160,460 | ) | | | (16,089,980 | ) | | | (121,145,795 | ) |
| | | | 4,635,744 | | | | 37,110,860 | | | | 436,508 | | | | 2,847,948 | |
| Class IR Shares | | | | | | | | | | | | | | | | |
Shares sold | | | 6,948 | | | | 54,736 | | | | 93,294 | | | | 705,985 | |
Reinvestment of distributions | | | 4,463 | | | | 36,059 | | | | 13,951 | | | | 103,909 | |
Shares redeemed | | | (48,231 | ) | | | (387,148 | ) | | | (206,977 | ) | | | (1,532,824 | ) |
| | | | (36,820 | ) | | | (296,353 | ) | | | (99,732 | ) | | | (722,930 | ) |
NET INCREASE (DECREASE) | | | 4,768,579 | | | $ | 38,189,080 | | | | (316,216 | ) | | $ | (2,739,058 | ) |
78
GOLDMAN SACHS TAX-ADVANTAGED EQUITY FUNDS
|
| 12. SUMMARY OF SHARE TRANSACTIONS (continued) |
Share activity is as follows:
| | | | | | | | | | | | | | | | |
| | | U.S. Tax-Managed Equity Fund | |
| | | | |
| | | For the Six Months Ended
June 30, 2014
(Unaudited) | | | For the Fiscal Year Ended
December 31, 2013 | |
| | | | |
| | | Shares | | | Dollars | | | Shares | | | Dollars | |
| | | | |
| Class A Shares | | | | | | | | | | | | | | | | |
Shares sold | | | 272,342 | | | $ | 4,292,104 | | | | 296,245 | | | $ | 3,996,452 | |
Shares converted from Class B(a) | | | 42 | | | | 673 | | | | 1,014 | | | | 14,074 | |
Reinvestment of distributions | | | — | | | | — | | | | 34,088 | | | | 506,199 | |
Shares redeemed | | | (112,149 | ) | | | (1,768,883 | ) | | | (1,232,624 | ) | | | (15,722,104 | ) |
| | | | 160,235 | | | | 2,523,894 | | | | (901,277 | ) | | | (11,205,379 | ) |
| Class B Shares | | | | | | | | | | | | | | | | |
Shares sold | | | 3,947 | | | | 60,731 | | | | 2,944 | | | | 39,471 | |
Shares converted to Class A(a) | | | (44 | ) | | | (673 | ) | | | (1,050 | ) | | | (14,074 | ) |
Reinvestment of distributions | | | — | | | | — | | | | 394 | | | | 5,663 | |
Shares redeemed | | | (14,979 | ) | | | (228,277 | ) | | | (11,834 | ) | | | (155,283 | ) |
| | | | (11,076 | ) | | | (168,219 | ) | | | (9,546 | ) | | | (124,223 | ) |
| Class C Shares | | | | | | | | | | | | | | | | |
Shares sold | | | 81,381 | | | | 1,225,514 | | | | 37,546 | | | | 492,793 | |
Reinvestment of distributions | | | — | | | | — | | | | 8,351 | | | | 119,092 | |
Shares redeemed | | | (30,674 | ) | | | (463,989 | ) | | | (79,111 | ) | | | (1,025,785 | ) |
| | | | 50,707 | | | | 761,525 | | | | (33,214 | ) | | | (413,900 | ) |
| Institutional Shares | | | | | | | | | | | | | | | | |
Shares sold | | | 6,252,764 | | | | 100,395,269 | | | | 12,632,061 | | | | 171,267,776 | |
Reinvestment of distributions | | | — | | | | — | | | | 634,995 | | | | 9,556,681 | |
Shares redeemed | | | (2,186,578 | ) | | | (34,571,963 | ) | | | (8,136,260 | ) | | | (105,756,540 | ) |
| | | | 4,066,186 | | | | 65,823,306 | | | | 5,130,796 | | | | 75,067,917 | |
| Service Shares | | | | | | | | | | | | | | | | |
Shares sold | | | 3,662 | | | | 57,000 | | | | 32,608 | | | | 487,835 | |
Reinvestment of distributions | | | — | | | | — | | | | 637 | | | | 9,490 | |
Shares redeemed | | | (26,382 | ) | | | (405,731 | ) | | | (10,196 | ) | | | (155,262 | ) |
| | | | (22,720 | ) | | | (348,731 | ) | | | 23,049 | | | | 342,063 | |
| Class IR Shares | | | | | | | | | | | | | | | | |
Shares sold | | | 154,459 | | | | 2,492,558 | | | | 16,579 | | | | 225,920 | |
Reinvestment of distributions | | | — | | | | — | | | | 986 | | | | 14,852 | |
Shares redeemed | | | (1,357 | ) | | | (22,105 | ) | | | (4,986 | ) | | | (65,302 | ) |
| | | | 153,102 | | | | 2,470,453 | | | | 12,579 | | | | 175,470 | |
NET INCREASE | | | 4,396,434 | | | $ | 71,062,228 | | | | 4,222,387 | | | $ | 63,841,948 | |
| (a) | | Class B Shares automatically convert into Class A Shares on or about the fifteenth day of the last month of the calendar quarter that is eight years after the initial purchase date of either the Fund or another Goldman Sachs Fund. |
79
GOLDMAN SACHS TAX-ADVANTAGED EQUITY FUNDS
Notes to Financial Statements (continued)
June 30, 2014 (Unaudited)
|
| 12. SUMMARY OF SHARE TRANSACTIONS (continued) |
Share activity is as follows:
| | | | | | | | | | | | | | | | |
| | | International Tax-Managed Equity Fund | |
| | | | |
| | | For the Six Months Ended
June 30, 2014
(Unaudited) | | | For the Fiscal Year Ended
December 31, 2013 | |
| | | | |
| | | Shares | | | Dollars | | | Shares | | | Dollars | |
| | | | |
| Class A Shares | | | | | | | | | | | | | | | | |
Shares sold | | | 7,965 | | | $ | 74,478 | | | | 422,476 | | | $ | 3,288,063 | |
Reinvestment of distributions | | | — | | | | — | | | | 5,085 | | | | 45,002 | |
Shares redeemed | | | (76,604 | ) | | | (713,347 | ) | | | (2,076,152 | ) | | | (16,632,248 | ) |
| | | | (68,639 | ) | | $ | (638,869 | ) | | | (1,648,591 | ) | | $ | (13,299,183 | ) |
| Class C Shares | | | | | | | | | | | | | | | | |
Shares sold | | | 4,741 | | | | 43,600 | | | | 3,470 | | | | 30,992 | |
Reinvestment of distributions | | | — | | | | — | | | | 79 | | | | 691 | |
Shares redeemed | | | — | | | | — | | | | (28 | ) | | | (226 | ) |
| | | | 4,741 | | | | 43,600 | | | | 3,521 | | | | 31,457 | |
| Institutional Shares | | | | | | | | | | | | | | | | |
Shares sold | | | 6,463,953 | | | | 59,581,761 | | | | 10,290,102 | | | | 85,450,457 | |
Reinvestment of distributions | | | — | | | | — | | | | 551,704 | | | | 4,838,439 | |
Shares redeemed | | | (534,635 | ) | | | (4,899,813 | ) | | | (3,429,939 | ) | | | (28,023,487 | ) |
| | | | 5,929,318 | | | | 54,681,948 | | | | 7,411,867 | | | | 62,265,409 | |
| Class IR Shares | | | | | | | | | | | | | | | | |
Shares sold | | | 1,328 | | | | 12,250 | | | | 23,038 | | | | 185,018 | |
Reinvestment of distributions | | | — | | | | — | | | | 514 | | | | 4,542 | |
Shares redeemed | | | (710 | ) | | | (6,479 | ) | | | — | | | | — | |
| | | | 618 | | | | 5,771 | | | | 23,552 | | | | 189,560 | |
NET INCREASE | | | 5,866,038 | | | $ | 54,092,450 | | | | 5,790,349 | | | $ | 49,187,243 | |
80
GOLDMAN SACHS TAX-ADVANTAGED EQUITY FUNDS
Fund Expenses — Six Month Period Ended June 30, 2014 (Unaudited)
As a shareholder of Class A, Class B, Class C, Institutional, Service or Class IR Shares of a Fund you incur types of costs: (1) transaction costs, including sales charges on purchase payments (with respect to Class A Shares), contingent deferred sales charges on redemptions (with respect to Class B and Class C Shares), (if any); and (2) ongoing costs, including management fees; distribution and service (12b-1) fees (with respect to Class A, Class B and Class C Shares); and other Fund expenses. This example is intended to help you understand your ongoing costs (in dollars) of investing in Class A, Class B, Class C, Institutional, Service or Class IR Shares of the Funds and to compare these costs with the ongoing costs of investing in other mutual funds.
The example is based on an investment of $1,000 invested at the beginning of the period and held for the entire period from January 1, 2014 through June 30, 2014
Actual Expenses — The first line under each share class in the table below provides information about actual account values and actual expenses. You may use the information in this line, together with the amount you invested, to estimate the expenses that you paid over the period. Simply divide your account value by $1,000 (for example, an $8,600 account value divided by $1,000=8.6), then multiply the result by the number in the first line under the heading entitled “Expenses Paid” to estimate the expenses you paid on your account during this period.
Hypothetical Example for Comparison Purposes — The second line under each share class in the table below provides information about hypothetical account values and hypothetical expenses based on the Funds' actual net expense ratio and an assumed rate of return of 5% per year before expenses, which is not the Funds' actual return. The hypothetical account values and expenses may not be used to estimate the actual ending account balance or expenses you paid for the period. You may use this information to compare the ongoing costs of investing in the Funds and other funds. To do so, compare this 5% hypothetical example with the 5% hypothetical examples that appear in the shareholder reports of the other funds.
Please note that the expenses shown in the table are meant to highlight your ongoing costs only and do not reflect any transactional costs, such as sales charges, redemption fees, or exchange fees. Therefore, the second line of the table is useful in comparing ongoing costs only, and will not help you determine the relative total costs of owning different funds. In addition, if these transactional costs were included, your costs would have been higher.
| | | | | | | | | | | | | | | | | | | | | | | | | | | | | | | | | | | | | | | | | | | | | | | | |
| | | U.S. Equity Dividend and Premium Fund | | | International Equity Dividend and Premium Fund | | | U.S. Tax-Managed Equity Fund | | | International Tax-Managed Equity Fund | |
| Share Class | | Beginning
Account
Value
1/01/14 | | | Ending Account Value 6/30/14 | | | Expenses
Paid for the
6 Months Ended
6/30/14* | | | Beginning
Account
Value
1/01/14 | | | Ending Account Value 6/30/14 | | | Expenses
Paid for the
6 Months Ended
6/30/14* | | | Beginning
Account
Value
1/01/14 | | | Ending Account Value 6/30/14 | | | Expenses
Paid for the
6 Months Ended
6/30/14* | | | Beginning
Account
Value
1/01/14 | | | Ending Account Value 6/30/14 | | | Expenses
Paid for the
6 Months Ended
6/30/14* | |
| Class A | | | | | | | | | | | | | | | | | | | | | | | | | | | | | | | | | | | | | | | | | | | | | | | | |
Actual | | $ | 1,000 | | | $ | 1,057.80 | | | $ | 6.07 | | | $ | 1,000 | | | $ | 1,064.80 | | | $ | 6.91 | | | $ | 1,000 | | | $ | 1,079.60 | | | $ | 6.08 | | | $ | 1,000 | | | $ | 1,047.90 | | | $ | 7.06 | |
Hypothetical 5% return | | | 1,000 | | | | 1,018.89 | + | | | 5.96 | | | | 1,000 | | | | 1,018.10 | + | | | 6.76 | | | | 1,000 | | | | 1,018.94 | + | | | 5.91 | | | | 1,000 | | | | 1,017.90 | + | | | 6.95 | |
| Class B | | | | | | | | | | | | | | | | | | | | | | | | | | | | | | | | | | | | | | | | | | | | | | | | |
Actual | | | N/A | | | | N/A | | | | N/A | | | | N/A | | | | N/A | | | | N/A | | | | 1,000 | | | | 1,075.50 | | | | 9.93 | | | | N/A | | | | N/A | | | | N/A | |
Hypothetical 5% return | | | N/A | | | | N/A | | | | N/A | | | | N/A | | | | N/A | | | | N/A | | | | 1,000 | | | | 1,015.22 | + | | | 9.64 | | | | N/A | | | | N/A | | | | N/A | |
| Class C | | | | | | | | | | | | | | | | | | | | | | | | | | | | | | | | | | | | | | | | | | | | | | | | |
Actual | | | 1,000 | | | | 1,053.20 | | | | 9.88 | | | | 1,000 | | | | 1,060.10 | | | | 10.73 | | | | 1,000 | | | | 1,075.60 | | | | 9.93 | | | | 1,000 | | | | 1,043.20 | | | | 10.79 | |
Hypothetical 5% return | | | 1,000 | | | | 1,015.17 | + | | | 9.69 | | | | 1,000 | | | | 1,014.38 | + | | | 10.49 | | | | 1,000 | | | | 1,015.22 | + | | | 9.64 | | | | 1,000 | | | | 1,014.23 | + | | | 10.64 | |
| Institutional | | | | | | | | | | | | | | | | | | | | | | | | | | | | | | | | | | | | | | | | | | | | | | | | |
Actual | | | 1,000 | | | | 1,066.50 | | | | 4.03 | | | | 1,000 | | | | 1,066.50 | | | | 4.87 | | | | 1,000 | | | | 1,082.40 | | | | 4.03 | | | | 1,000 | | | | 1,049.50 | | | | 5.03 | |
Hypothetical 5% return | | | 1,000 | | | | 1,020.08 | + | | | 3.96 | | | | 1,000 | | | | 1,020.08 | + | | | 4.76 | | | | 1,000 | | | | 1,020.93 | + | | | 3.91 | | | | 1,000 | | | | 1,019.89 | + | | | 4.96 | |
| Service | | | | | | | | | | | | | | | | | | | | | | | | | | | | | | | | | | | | | | | | | | | | | | | | |
Actual | | | N/A | | | | N/A | | | | N/A | | | | N/A | | | | N/A | | | | N/A | | | | 1,000 | | | | 1,078.80 | | | | 6.60 | | | | N/A | | | | N/A | | | | N/A | |
Hypothetical 5% return | | | N/A | | | | N/A | | | | N/A | | | | N/A | | | | N/A | | | | N/A | | | | 1,000 | | | | 1,018.45 | + | | | 6.41 | | | | N/A | | | | N/A | | | | N/A | |
| Class IR | | | | | | | | | | | | | | | | | | | | | | | | | | | | | | | | | | | | | | | | | | | | | | | | |
Actual | | | 1,000 | | | | 1,058.20 | | | | 4.80 | | | | 1,000 | | | | 1,065.80 | | | | 5.63 | | | | 1,000 | | | | 1,081.00 | | | | 4.80 | | | | 1,000 | | | | 1,049.10 | | | | 5.79 | |
Hypothetical 5% return | | | 1,000 | | | | 1,020.13 | + | | | 4.71 | | | | 1,000 | | | | 1,019.34 | + | | | 5.51 | | | | 1,000 | | | | 1,020.18 | + | | | 4.66 | | | | 1,000 | | | | 1,019.14 | + | | | 5.71 | |
| * | | Expenses are calculated using each Fund’s annualized net expense ratio for each class, which represents the ongoing expenses as a percentage of net assets for the six months ended June 30, 2014. Expenses are calculated by multiplying the annualized net expense ratio by the average account value for the period; then multiplying the result by the number of days in the most recent fiscal half year; and then dividing that result by the number of days in the fiscal year. The annualized net expense ratios for the period were as follows: |
| | | | | | | | | | | | | | | | | | | | | | | | |
| Fund | | Class A | | | Class B | | | Class C | | | Institutional | | | Service | | | Class IR | |
U.S. Equity Dividend and Premium | | | 1.19 | % | | | N/A | | | | 1.94 | % | | | 0.79 | % | | | N/A | | | | 0.94 | % |
International Equity Dividend and Premium | | | 1.35 | | | | N/A | | | | 2.10 | | | | 0.95 | | | | N/A | | | | 1.10 | |
U.S. Tax-Managed Equity | | | 1.18 | | | | 1.93 | % | | | 1.93 | | | | 0.78 | | | | 1.28 | % | | | 0.93 | |
International Tax-Managed Equity | | | 1.39 | | | | N/A | | | | 2.13 | | | | 0.99 | | | | N/A | | | | 1.14 | |
| + | | Hypothetical expenses are based on each Fund’s actual annualized net expense ratios and an assumed rate of return of 5% per year before expenses. |
81
GOLDMAN SACHS TAX-ADVANTAGED EQUITY FUNDS
Statement Regarding Basis for Approval of Management Agreement (Unaudited)
Background
The Goldman Sachs International Equity Dividend and Premium Fund, Goldman Sachs International Tax-Managed Equity Fund, Goldman Sachs U.S. Tax-Managed Equity Fund, and Goldman Sachs U.S. Equity Dividend and Premium Fund (the “Funds”) are investment portfolios of Goldman Sachs Trust (the “Trust”). The Board of Trustees oversees the management of the Trust and reviews the investment performance and expenses of the Funds at regularly scheduled meetings held during the year. In addition, the Board of Trustees determines annually whether to approve the continuance of the Trust’s investment management agreement (the “Management Agreement”) with Goldman Sachs Asset Management, L.P. (the “Investment Adviser”) on behalf of the Funds.
The Management Agreement was most recently approved for continuation until June 30, 2015 by the Board of Trustees, including those Trustees who are not parties to the Management Agreement or “interested persons” (as defined in the Investment Company Act of 1940, as amended) of any party thereto (the “Independent Trustees”), at a meeting held on June 11-12, 2014 (the “Annual Meeting”).
The review process undertaken by the Trustees spans the course of the year and culminates with the Annual Meeting. To assist the Trustees in their deliberations, the Trustees have established a Contract Review Committee (the “Committee”), comprised of the Independent Trustees. The Committee held four meetings over the course of the year since the Management Agreement was last approved. At those Committee meetings, regularly scheduled Board or other committee meetings and/or the Annual Meeting, the Board, or the Independent Trustees, as applicable, considered matters relating to the Management Agreement, including:
| | (a) | | the nature and quality of the advisory, administrative and other services provided to the Funds by the Investment Adviser and its affiliates, including information about: |
| | (i) | | the structure, staff and capabilities of the Investment Adviser and its portfolio management teams; |
| | (ii) | | the groups within the Investment Adviser and its affiliates that support the portfolio management teams or provide other types of necessary services, including fund services groups (e.g., accounting and financial reporting, tax, shareholder services and operations), controls and risk management groups (e.g., legal, compliance, valuation oversight, credit risk management, internal audit, compliance testing, market risk analysis, finance and strategy and central funding), sales and distribution support groups and others (e.g., information technology and training); |
| | (iii) | | trends in headcount; |
| | (iv) | | the Investment Adviser’s financial resources and ability to hire and retain talented personnel and strengthen its operations; and |
| | (v) | | the parent company’s support of the Investment Adviser and its mutual fund business, as expressed by the firm’s senior management; |
| | (b) | | information on the investment performance of each Fund, including comparisons to the performance of similar mutual funds, as provided by a third party mutual fund data provider engaged as part of the contract review process (the “Outside Data Provider”), and benchmark performance indices, and general investment outlooks in the markets in which the Funds invest; |
82
GOLDMAN SACHS TAX-ADVANTAGED EQUITY FUNDS
Statement Regarding Basis for Approval of Management Agreement (Unaudited) (continued)
| | (c) | | the terms of the Management Agreement and agreements with affiliated service providers entered into by the Trust on behalf of the Funds; |
| | (d) | | expense information for the Funds, including: |
| | (i) | | the relative management fee and expense levels of each Fund as compared to those of comparable funds managed by other advisers, as provided by the Outside Data Provider; and |
| | (ii) | | each Fund’s expense trends over time; |
| | (e) | | with respect to the extensive investment performance and expense comparison data provided by the Outside Data Provider, its processes in producing that data for the Funds; |
| | (f) | | the undertakings of the Investment Adviser to limit certain expenses of each Fund that exceed specified levels, and a summary of contractual fee reductions made by the Investment Adviser and/or its affiliates over the past several years with respect to the Funds; |
| | (g) | | information relating to the profitability of the Management Agreement and the transfer agency and distribution and service arrangements of each Fund and the Trust as a whole to the Investment Adviser and its affiliates; |
| | (h) | | whether each Fund’s existing management fee schedule adequately addressed any economies of scale; |
| | (i) | | a summary of the “fall-out” benefits derived by the Investment Adviser and its affiliates from their relationships with the Funds, including the fees received by the Investment Adviser’s affiliates from the Funds for transfer agency, securities lending, portfolio trading, distribution and other services; |
| | (j) | | a summary of potential benefits derived by the Funds as a result of their relationship with the Investment Adviser; |
| | (k) | | information regarding commissions paid by the Funds and broker oversight, other information regarding portfolio trading and how the Investment Adviser carries out its duty to seek best execution; |
| | (l) | | portfolio manager ownership of Fund shares; the manner in which portfolio manager compensation is determined; and the number and types of accounts managed by the portfolio managers; |
| | (m) | | the nature and quality of the services provided to the Funds by their unaffiliated service providers, and the Investment Adviser’s general oversight and evaluation (including reports on due diligence) of those service providers as part of the administration services provided under the Management Agreement; and |
| | (n) | | the Investment Adviser’s processes and policies addressing various types of potential conflicts of interest; its approach to risk management; the annual review of the effectiveness of the Funds’ compliance program; and periodic compliance reports. |
The Trustees also received an overview of the Funds’ distribution arrangements. They received information regarding the Funds’ assets, share purchase and redemption activity and the payment of Rule 12b-1 distribution and service fees by the Funds and the payment of non-Rule 12b-1 shareholder service and/or administration fees by the U.S. Tax-Managed Equity Fund’s Service Shares. Information was also provided to the Trustees relating to revenue sharing payments made by and services provided by the Investment Adviser and its affiliates to intermediaries that promote the sale, distribution and/or servicing of Fund shares.
83
GOLDMAN SACHS TAX-ADVANTAGED EQUITY FUNDS
Statement Regarding Basis for Approval of Management Agreement (Unaudited) (continued)
The presentations made at the Board and Committee meetings and at the Annual Meeting encompassed the Funds and other mutual fund portfolios for which the Board of Trustees has responsibility. In evaluating the Management Agreement at the Annual Meeting, the Trustees relied upon their knowledge, resulting from their meetings and other interactions throughout the year, of the Investment Adviser, its affiliates, their services and the Funds. In conjunction with these meetings, the Trustees received written materials and oral presentations on the topics covered, and were advised by their independent legal counsel regarding their responsibilities and other regulatory requirements related to the approval and continuation of mutual fund investment management agreements under applicable law. In addition, the Investment Adviser and its affiliates provided the Independent Trustees with a written response to a formal request for information sent on behalf of the Independent Trustees by their independent legal counsel. During the course of their deliberations, the Independent Trustees met in executive sessions with their independent legal counsel, without representatives of the Investment Adviser or its affiliates present. The Independent Trustees also discussed the broad range of other investment choices that are available to Fund investors, including the availability of comparable funds managed by other advisers.
Nature, Extent and Quality of the Services Provided Under the Management Agreement
As part of their review, the Trustees considered the nature, extent and quality of the services provided by the Investment Adviser. In this regard, the Trustees considered both the investment advisory services and non-advisory services that are provided to the Funds by the Investment Adviser and its affiliates. The Trustees noted the transition in the leadership and changes in personnel of various of the Investment Adviser’s portfolio management teams that had occurred in recent periods, and the ongoing recruitment efforts aimed at bringing high quality investment talent to the Investment Adviser. They also noted the Investment Adviser’s commitment to maintaining high quality systems. The Trustees concluded that the Investment Adviser continued to commit substantial financial and operational resources to the Funds and expressed confidence that the Investment Adviser would continue to do so in the future. The Trustees also recognized that the Investment Adviser had made significant commitments to address regulatory compliance requirements applicable to the Funds and the Investment Adviser.
Investment Performance
The Trustees also considered the investment performance of the Funds. In this regard, they compared the investment performance of each Fund to its peers using rankings and ratings compiled by the Outside Data Provider as of December 31, 2013, and updated performance information prepared by the Investment Adviser using the peer groups identified by the Outside Data Provider as of March 31, 2014. The information on each Fund’s investment performance was provided for the one-, three-, five- and ten-year periods ending on the applicable dates, to the extent that each Fund had been in existence for those periods. The Trustees also reviewed each Fund’s investment performance over time (including on a year-by-year basis) relative to its performance benchmark. As part of this review, they considered the investment performance trends of the Funds over time, and reviewed the investment performance of each Fund in light of its investment objective and policies and market conditions.
84
GOLDMAN SACHS TAX-ADVANTAGED EQUITY FUNDS
Statement Regarding Basis for Approval of Management Agreement (Unaudited) (continued)
In addition, the Trustees considered materials prepared and presentations made by the Investment Adviser’s senior management and portfolio management personnel, in which Fund performance was assessed. The Trustees also considered the Investment Adviser’s periodic reports with respect to the Funds’ risk profiles, and how the Investment Adviser’s approach to risk monitoring and management influences portfolio management. They noted the efforts of the Funds’ portfolio management team to enhance the investment models used in managing the Funds.
The Trustees observed that the U.S. Equity Dividend and Premium Fund’s Class A Shares had placed in the fourth quartile of the Fund’s peer group and had underperformed the Fund’s benchmark index for the one-, three-, and five-year periods ended March 31, 2014. They noted that the International Equity Dividend and Premium Fund’s Class A Shares had placed in the third quartile of the Fund’s peer group for the one- and three- year periods and in the fourth quartile for the five-year period, and had underperformed the Fund’s benchmark index for the one-, three-, and five-year periods ended March 31, 2014. The Trustees also noted that the International Equity Dividend and Premium and U.S. Equity Dividend and Premium Funds had certain significant differences from their peer groups (Foreign Large Value and Large Blend, respectively) and benchmark indices (MSCI EAFE Index (net) and S&P 500 Index, respectively) that caused the peer groups and benchmark indices to be imperfect bases for performance comparison. The Trustees observed that the U.S. Tax-Managed Equity Fund’s Class A Shares had placed in the top half of the Fund’s peer group for the one-, three-, five-, and ten-year periods, and had outperformed the Fund’s benchmark index for the one- and three-year periods and underperformed the Fund’s benchmark index for the five- and ten-year periods ended March 31, 2014. They noted that the International Tax-Managed Equity Fund’s Class A Shares had placed in the second quartile of the Fund’s peer group for the three- and five-year periods and in the third quartile for the one-year period, and had outperformed the Fund’s benchmark index for the one-year period and underperformed the Fund’s benchmark index for the three- and five-year periods ended March 31, 2014.
Costs of Services Provided and Competitive Information
The Trustees considered the contractual terms of the Management Agreement and the fee rates payable by each Fund thereunder. In this regard, the Trustees considered information on the services rendered by the Investment Adviser to the Funds, which included both advisory and administrative services that were directed to the needs and operations of the Funds as registered mutual funds.
In particular, the Trustees reviewed analyses prepared by the Outside Data Provider regarding the expense rankings of the Funds. The analyses provided a comparison of the Funds’ management fees and breakpoints to those of relevant peer groups and category universes; an expense analysis which compared each Fund’s overall net and gross expenses to a peer group and a category universe; and a five-year history comparing each Fund’s net expenses to the peer and category medians. The analyses also compared each Fund’s transfer agency, custody, and distribution fees, other expenses and fee waivers/reimbursements to those of the peer group and category medians. The Trustees concluded that the comparisons provided by the Outside Data Provider were useful in evaluating the reasonableness of the management fees and total expenses paid by the Funds.
85
GOLDMAN SACHS TAX-ADVANTAGED EQUITY FUNDS
Statement Regarding Basis for Approval of Management Agreement (Unaudited) (continued)
In addition, the Trustees considered the Investment Adviser’s undertakings to limit certain expenses of the Funds that exceed specified levels. The Trustees also noted that certain changes were being made to existing fee waiver or expense limitation arrangements of the U.S. Tax-Managed Equity and International Tax-Managed Equity Funds that would have the effect of lowering total Fund expenses, with such changes taking effect in connection with the Funds’ next annual registration statement update. They also noted that the Investment Adviser did not manage institutional accounts or collective investment vehicles having investment objectives and policies similar to those of the Funds, and therefore this type of fee comparison was not possible.
In addition, the Trustees noted that shareholders are able to redeem their Fund shares at any time if shareholders believe that the Fund fees and expenses are too high or if they are dissatisfied with the performance of the Fund.
Profitability
The Trustees reviewed the Investment Adviser’s revenues and pre-tax profit margins with respect to the Trust and each of the Funds. In this regard the Trustees noted that they had received, among other things, profitability analyses and summaries, revenue and expense schedules by Fund and by function (i.e., investment management, transfer agency and distribution and service) and information on the Investment Adviser’s expense allocation methodology. They observed that the profitability and expense figures are substantially similar to those used by the Investment Adviser for many internal purposes, including compensation decisions among various business groups, and are thus subject to a vigorous internal debate about how certain revenue and expenses should be allocated. The Trustees also noted that the internal audit group within the Goldman Sachs organization had audited the expense allocation methodology and was satisfied with the reasonableness, consistency, and accuracy of the Investment Adviser’s expense allocation methodology and profitability analysis calculations. Profitability data for the Trust and each Fund were provided for 2013 and 2012, and the Trustees considered this information in relation to the Investment Adviser’s overall profitability. The Trustees considered the Investment Adviser’s revenues and pre-tax profit margins both in absolute terms and in comparison to information on the reported pre-tax profit margins earned by certain other asset management firms.
Economies of Scale
The Trustees considered the information that had been provided regarding the Investment Adviser’s profitability. The Trustees also considered the breakpoints in the fee rate payable under the Management Agreement for each of the Funds at the following annual percentage rates of the average daily net assets of the Funds:
| | | | | | | | | | | | | | | | |
| | | International
Equity Dividend
and Premium
Fund | | | International
Tax-Managed
Equity Fund | | | U.S. Tax-Managed Equity Fund | | | U.S. Equity
Dividend and
Premium Fund | |
| First $1 billion | | | 0.81 | % | | | 0.85 | % | | | 0.70 | % | | | 0.75 | % |
| Next $1 billion | | | 0.73 | | | | 0.77 | | | | 0.63 | | | | 0.68 | |
| Next $3 billion | | | 0.69 | | | | 0.73 | | | | 0.60 | | | | 0.65 | |
| Next $3 billion | | | 0.68 | | | | 0.72 | | | | 0.59 | | | | 0.64 | |
| Over $8 billion | | | 0.67 | | | | 0.71 | | | | 0.58 | | | | 0.63 | |
86
GOLDMAN SACHS TAX-ADVANTAGED EQUITY FUNDS
Statement Regarding Basis for Approval of Management Agreement (Unaudited) (continued)
The Trustees noted that the breakpoints were meant to share potential economies of scale, if any, with the Funds and their shareholders as assets under management reach those asset levels. The Trustees considered the amounts of assets in the Funds; the Funds’ recent share purchase and redemption activity; the information provided by the Investment Adviser relating to the costs of the services provided by the Investment Adviser and its affiliates and their realized profits; information comparing fee rates charged by the Investment Adviser with fee rates charged to other funds in the peer groups; and the Investment Adviser’s undertakings to limit certain expenses of the Funds that exceed specified levels. Upon reviewing these matters at the Annual Meeting, the Trustees concluded that the fee breakpoints represented a means of assuring that benefits of scalability, if any, would be passed along to shareholders at the specified asset levels. They also noted that the Investment Adviser had passed along savings to shareholders of the U.S. Equity Dividend and Premium Fund, which had asset levels above at least the first breakpoint during the prior fiscal year.
Other Benefits to the Investment Adviser and Its Affiliates
The Trustees also considered the other benefits derived by the Investment Adviser and its affiliates from their relationships with the Funds as stated above, including: (a) transfer agency fees received by Goldman, Sachs & Co. (“Goldman Sachs”); (b) brokerage and futures commissions earned by Goldman Sachs for executing securities and futures transactions on behalf of the Funds; (c) trading efficiencies resulting from aggregation of orders of the Funds with those for other funds or accounts managed by the Investment Adviser; (d) fees earned by Goldman Sachs Agency Lending (“GSAL”), an affiliate of the Investment Adviser, as securities lending agent (and fees earned by the Investment Adviser for managing the fund in which the Funds’ cash collateral is invested); (e) the Investment Adviser’s ability to leverage the infrastructure designed to service the Funds on behalf of its other clients; (f) the Investment Adviser’s ability to cross-market other products and services to Fund shareholders; (g) Goldman Sachs’ retention of certain fees as Fund Distributor; (h) the Investment Adviser’s ability to negotiate better pricing with custodians on behalf of its other clients, as a result of the relationship with the Funds; and (i) the possibility that the working relationship between the Investment Adviser and the Funds’ third party service providers may cause those service providers to be more likely to do business with other areas of Goldman Sachs. In the course of considering the foregoing, the Independent Trustees requested and received further information quantifying certain of these fall-out benefits. They also considered the benefits to GSAL and the Investment Adviser from the Funds’ ability to participate in the securities lending program and observed that, although the benefits to GSAL and the Investment Adviser were meaningful, the benefits to the Funds from their participation in the program were greater, as measured by the revenue they received by those Funds in connection with the program.
87
GOLDMAN SACHS TAX-ADVANTAGED EQUITY FUNDS
Statement Regarding Basis for Approval of Management Agreement (Unaudited) (continued)
Other Benefits to the Funds and Their Shareholders
The Trustees also noted that the Funds receive certain potential benefits as a result of their relationship with the Investment Adviser, including: (a) trading efficiencies resulting from aggregation of orders of the Funds with those of other funds or accounts managed by the Investment Adviser; (b) enhanced servicing from vendors because of the volume of business generated by the Investment Adviser and its affiliates; (c) enhanced servicing from broker-dealers because of the volume of business generated by the Investment Adviser and its affiliates; (d) the Investment Adviser’s ability to negotiate favorable terms with derivatives counterparties on behalf of the Funds as a result of the size and reputation of the Goldman Sachs organization; (e) the Investment Adviser’s knowledge and experience gained from managing other accounts and products; (f) the Investment Adviser’s ability to hire and retain qualified personnel to provide services to the Funds because of the reputation of the Goldman Sachs organization; (g) the Funds’ access, through the Investment Adviser, to certain firmwide resources (e.g., proprietary risk management systems and databases), subject to certain restrictions; and (h) the Funds’ access to certain affiliated distribution channels. In addition, the Trustees noted the competitive nature of the mutual fund marketplace, and considered that many of the Funds’ shareholders invested in the Funds in part because of the Funds’ relationship with the Investment Adviser and that those shareholders have a general expectation that the relationship will continue.
Conclusion
In connection with their consideration of the Management Agreement, the Trustees gave weight to each of the factors described above, but did not identify any particular factor as controlling their decision. After deliberation and consideration of all of the information provided, including the factors described above, the Trustees concluded, in the exercise of their business judgment, that the management fees paid by each of the Funds were reasonable in light of the services provided to it by the Investment Adviser, the Investment Adviser’s costs and each Fund’s current and reasonably foreseeable asset levels. The Trustees unanimously concluded that the Investment Adviser’s continued management likely would benefit each Fund and its shareholders and that the Management Agreement should be approved and continued with respect to each Fund until June 30, 2015.
88
FUNDS PROFILE
Goldman Sachs Funds

Goldman Sachs is a premier financial services firm, known since 1869 for creating thoughtful and customized investment solutions in complex global markets.
Today, the Investment Management Division of Goldman Sachs serves a diverse set of clients worldwide, including private institutions, public entities and individuals. With approximately $992.3 billion in assets under supervision as of June 30, 2014, Goldman Sachs Asset Management (“GSAM”) has portfolio management teams located around the world and our investment professionals bring firsthand knowledge of local markets to every investment decision. Assets under supervision includes assets under management and other client assets for which Goldman Sachs does not have full discretion. GSAM leverages the resources of Goldman, Sachs & Co. subject to legal, internal and regulatory restrictions.

Money Market1
Financial Square FundsSM
| n | | Financial Square Tax-Exempt Funds |
| n | | Financial Square Federal Fund |
| n | | Financial Square Government Fund |
| n | | Financial Square Money Market Fund |
| n | | Financial Square Prime Obligations Fund |
| n | | Financial Square Treasury Instruments Fund |
| n | | Financial Square Treasury Obligations Fund |
Fixed Income
Short Duration and Government
| n | | High Quality Floating Rate Fund |
| n | | Limited Maturity Obligations Fund |
| n | | Short Duration Government Fund |
| n | | Short Duration Income Fund |
| n | | Inflation Protected Securities Fund |
Multi-Sector
| n | | Core Plus Fixed Income Fund |
Municipal and Tax-Free
| n | | High Yield Municipal Fund |
| n | | Short Duration Tax-Free Fund |
Single Sector
| n | | Investment Grade Credit Fund |
| n | | High Yield Floating Rate Fund |
| n | | Emerging Markets Debt Fund |
| n | | Local Emerging Markets Debt Fund |
| n | | Dynamic Emerging Markets Debt Fund |
Corporate Credit
| n | | Long Short Credit Strategies Fund2 |
Fundamental Equity
| n | | Small/Mid Cap Value Fund |
| n | | Small/Mid Cap Growth Fund |
| n | | Flexible Cap Growth Fund |
| n | | Concentrated Growth Fund |
| n | | Technology Tollkeeper Fund |
| n | | Growth Opportunities Fund |
| n | | Rising Dividend Growth Fund |
Tax-Advantaged Equity
| n | | U.S. Tax-Managed Equity Fund3 |
| n | | International Tax-Managed Equity Fund3 |
| n | | U.S. Equity Dividend and Premium Fund |
| n | | International Equity Dividend and Premium Fund |
Equity Insights
| n | | Small Cap Equity Insights Fund |
| n | | U.S. Equity Insights Fund |
| n | | Small Cap Growth Insights Fund |
| n | | Large Cap Growth Insights Fund |
| n | | Large Cap Value Insights Fund |
| n | | Small Cap Value Insights Fund |
| n | | International Small Cap Insights Fund |
| n | | International Equity Insights Fund |
| n | | Emerging Markets Equity Insights Fund |
Fundamental Equity International
| n | | Strategic International Equity Fund |
| n | | Focused International Equity Fund4 |
| n | | International Small Cap Fund |
| n | | Emerging Markets Equity Fund |
| n | | BRIC Fund (Brazil, Russia, India, China) |
Select Satellite5
| n | | Real Estate Securities Fund |
| n | | International Real Estate Securities Fund |
| n | | Commodity Strategy Fund |
| n | | Dynamic Commodity Strategy Fund |
| n | | Dynamic Allocation Fund |
| n | | Absolute Return Tracker Fund |
| n | | Managed Futures Strategy Fund |
| n | | MLP Energy Infrastructure Fund |
| n | | Multi-Manager Alternatives Fund |
| n | | Multi-Asset Real Return Fund |
| n | | Retirement Portfolio Completion Fund |
| n | | Fixed Income Macro Strategies Fund |
Total Portfolio Solutions5
| n | | Balanced Strategy Portfolio |
| n | | Growth and Income Strategy Portfolio |
| n | | Growth Strategy Portfolio |
| n | | Equity Growth Strategy Portfolio |
| n | | Satellite Strategies Portfolio |
| n | | Enhanced Dividend Global Equity Portfolio |
| n | | Tax Advantaged Global Equity Portfolio |
| 1 | | An investment in a money market fund is neither insured nor guaranteed by the Federal Deposit Insurance Corporation (“FDIC”) or any other government agency. Although the Funds seek to preserve the value of your investment at $1.00 per share, it is possible to lose money by investing in the Funds. |
| 2 | | Effective at the close of business on March 21, 2014, the Goldman Sachs Credit Strategies Fund was reorganized with and into the Goldman Sachs Long Short Credit Strategies Fund. |
| 3 | | Effective on April 30, 2014, the Goldman Sachs Structured Tax-Managed Equity and Structured International Tax-Managed Equity Funds were renamed the Goldman Sachs U.S. Tax-Managed Equity and International Tax-Managed Equity Funds respectively. |
| 4 | | Effective at the close of business on February 28, 2014, the Goldman Sachs Concentrated International Equity Fund was renamed the Goldman Sachs Focused International Equity Fund. |
| 5 | | Individual funds within the Total Portfolio Solutions and Select Satellite categories will have various placement on the risk/return spectrum and may have greater or lesser risk than that indicated by the placement of the general Total Portfolio Solutions or Select Satellite category. |
Financial Square FundsSM is a registered service mark of Goldman, Sachs & Co.
This list covers open-end funds only. Please visit our website at www.GSAMFUNDS.com to learn about our closed-end fund.
| | |
TRUSTEES Ashok N. Bakhru, Chairman John P. Coblentz, Jr. Diana M. Daniels Joseph P. LoRusso Herbert J. Markley James A. McNamara Jessica Palmer Alan A. Shuch Richard P. Strubel Roy W. Templin | | OFFICERS James A. McNamara, President Scott M. McHugh, Principal Financial Officer and Treasurer Caroline Kraus, Secretary |
| |
GOLDMAN, SACHS & CO. Distributor and Transfer Agent | | GOLDMAN SACHS ASSET MANAGEMENT, L.P. Investment Adviser |
Visit our web site at www.GSAMFUNDS.com to obtain the most recent month-end returns.
Goldman Sachs Asset Management, L.P. 200 West Street, New York, New York 10282
The reports concerning the Funds included in this shareholder report may contain certain forward-looking statements about the factors that may affect the performance of the Funds in the future. These statements are based on Fund management’s predictions and expectations concerning certain future events and their expected impact on the Funds, such as performance of the economy as a whole and of specific industry sectors, changes in the levels of interest rates, the impact of developing world events, and other factors that may influence the future performance of the Funds. Management believes these forward-looking statements to be reasonable, although they are inherently uncertain and difficult to predict. Actual events may cause adjustments in portfolio management strategies from those currently expected to be employed.
A description of the policies and procedures that the Funds use to determine how to vote proxies relating to portfolio securities and information regarding how a Fund voted proxies relating to portfolio securities during the most recent 12-month period ended June 30 is available (i) without charge, upon request by calling 1-800-526-7384 (for Retail Shareholders) or 1-800-621-2550 (for Institutional Shareholders); and (ii) on the Securities and Exchange Commission (“SEC”) web site at http://www.sec.gov.
The Funds file their complete schedule of portfolio holdings with the SEC for the first and third quarters of each fiscal year on Form N-Q. The Funds’ Forms N-Q are available on the SEC’s web site at http://www.sec.gov within 60 days after the Funds’ first and third fiscal quarters. The Funds’ Forms N-Q may be reviewed and copied at the SEC’s Public Reference Room in Washington, D.C. and information on the operation of the Public Reference Room may also be obtained by calling 1-800-SEC-0330. Forms N-Q may be obtained upon request and without charge by calling 1-800-526-7384 (for Retail Shareholders) or 1-800-621-2550 (for Institutional Shareholders).
Goldman, Sachs & Co. (‘‘Goldman Sachs’’) does not provide legal, tax or accounting advice. Any statement contained in this communication (including any attachments) concerning U.S. tax matters was not intended or written to be used, and cannot be used, for the purpose of avoiding penalties under the Internal Revenue Code, and was written to support the promotion or marketing of the transaction(s) or matter(s) addressed. Clients of Goldman Sachs should obtain their own independent tax advice based on their particular circumstances.
Fund holdings and allocations shown are as of June 30, 2014 and may not be representative of future investments. Fund holdings should not be relied on in making investment decisions and should not be construed as research or investment advice regarding particular securities. Current and future holdings are subject to risk.
References to indices, benchmarks or other measures of relative market performance over a specified period of time are provided for your information only and do not imply that the portfolio will achieve similar results. The index composition may not reflect the manner in which a portfolio is constructed. While an adviser seeks to design a portfolio which reflects appropriate risk and return features, portfolio characteristics may deviate from those of the benchmark.
The Global Industry Classification Standard (GICS) was developed by and is the exclusive property and a service mark of Morgan Stanley Capital International Inc. (MSCI) and Standard & Poor’s, a division of The McGraw-Hill Companies, Inc. (S&P) and is licensed for use by Goldman Sachs. Neither MSCI, S&P nor any other party involved in making or compiling the GICS or any GICS classifications makes any express or implied warranties or representations with respect to such standard or classification (or the results to be obtained by the use thereof), and all such parties hereby expressly disclaim all warranties of originality, accuracy, completeness, merchantability or fitness for a particular purpose with respect to any of such standard or classification. Without limiting any of the foregoing, in no event shall MSCI, S&P, any of their affiliates or any third party involved in making or compiling the GICS or any GICS classifications have any liability for any direct, indirect, special, punitive, consequential or any other damages (including lost profits) even if notified of the possibility of such damages.
The portfolio risk management process includes an effort to monitor and manage risk, but does not imply low risk.
This material is not authorized for distribution to prospective investors unless preceded or accompanied by a current Prospectus or summary prospectus, if applicable. Investors should consider a Fund’s objective, risks, and charges and expenses, and read the summary prospectus, if available, and/or the Prospectus carefully before investing or sending money. The summary prospectus, if available, and the Prospectus contain this and other information about a Fund and may be obtained from your Authorized Institution or from Goldman, Sachs & Co. by calling (retail – 1-800-526-7384) (institutional – 1-800-621-2550).
© 2014 Goldman Sachs. All rights reserved. 137083.MF.MED.TMPL/8/2014 TAXADVSAR-14/14K
The information required by this Item is only required in an annual report on this Form N-CSR.
| ITEM 3. | AUDIT COMMITTEE FINANCIAL EXPERT. |
The information required by this Item is only required in an annual report on this Form N-CSR.
| ITEM 4. | PRINCIPAL ACCOUNTANT FEES AND SERVICES. |
The information required by this Item is only required in an annual report on this Form N-CSR.
| ITEM 5. | AUDIT COMMITTEE OF LISTED REGISTRANTS. |
| ITEM 6. | SCHEDULE OF INVESTMENTS. |
| | Schedule of Investments is included as part of the Report to Stockholders filed under Item 1. |
| ITEM 7. | DISCLOSURE OF PROXY VOTING POLICIES AND PROCEDURES FOR CLOSED-END MANAGEMENT INVESTMENT COMPANIES. |
| ITEM 8. | PORTFOLIO MANAGERS OF CLOSED-END MANAGEMENT INVESTMENT COMPANIES. |
| ITEM 9. | PURCHASES OF EQUITY SECURITIES BY CLOSED-END MANAGEMENT INVESTMENT COMPANY AND AFFILIATED PURCHASERS. |
| ITEM 10. | SUBMISSION OF MATTERS TO A VOTE OF SECURITY HOLDERS. |
| | There have been no material changes to the procedures by which shareholders may recommend nominees to the registrant’s board of trustees. |
| ITEM 11. | CONTROLS AND PROCEDURES. |
| | (a) | The registrant’s principal executive and principal financial officers, or persons performing similar functions have concluded that the registrant’s disclosure controls and procedures (as defined in Rule 30a-3(c) under the Investment Company Act of 1940, as amended (the “1940 Act”)) are effective as of a date within 90 days of the filing of this report that includes the disclosure required by this paragraph, based on the evaluation of these controls and procedures required by Rule 30a-3(b) under the 1940 Act and 15d-15(b) under the Securities Exchange Act of 1934, as amended. |
| | (b) | There were no changes in the registrant’s internal control over financial reporting (as defined in Rule 30a-3(d) under the 1940 Act) that occurred during the registrant’s second fiscal quarter of the period covered by this report that have materially affected, or are reasonably likely to materially affect, the registrant’s internal control over financial reporting. |
| | | | |
| (a)(1) | | The information required by this Item is only required in connection with an annual report on this Form N-CSR. |
| | |
| (a)(2) | | Exhibit 99.CERT | | Certifications pursuant to Section 302 of the Sarbanes-Oxley Act of 2002 filed herewith. |
| | |
| (b) | | Exhibit 99.906CERT | | Certifications pursuant to Section 906 of the Sarbanes-Oxley Act of 2002 filed herewith. |
SIGNATURES
Pursuant to the requirements of the Securities Exchange Act of 1934 and the Investment Company Act of 1940, the registrant has duly caused this report to be signed on its behalf by the undersigned, thereunto duly authorized.
| | |
| | | Goldman Sachs Trust |
| |
| By: | | /s/ James A. McNamara |
| |
| | |
| | James A. McNamara |
| | President/Principal Executive Officer |
| | Goldman Sachs Trust |
| |
| Date: | | September 3, 2014 |
Pursuant to the requirements of the Securities Exchange Act of 1934 and the Investment Company Act of 1940, this report has been signed below by the following persons on behalf of the registrant and in the capacities and on the dates indicated.
| | |
| By: | | /s/ James A. McNamara |
| |
| | |
| | James A. McNamara |
| | President/Principal Executive Officer |
| | Goldman Sachs Trust |
| |
| Date: | | September 3, 2014 |
| |
| By: | | /s/ Scott McHugh |
| |
| | |
| | Scott McHugh |
| | Principal Financial Officer |
| | Goldman Sachs Trust |
| |
| Date: | | September 3, 2014 |