UNITED STATES
SECURITIES AND EXCHANGE COMMISSION
Washington, D.C. 20549
FORM N-CSR
CERTIFIED SHAREHOLDER REPORT OF REGISTERED
MANAGEMENT INVESTMENT COMPANIES
Investment Company Act file number 811-05349
Goldman Sachs Trust
(Exact name of registrant as specified in charter)
71 South Wacker Drive, Chicago, Illinois 60606
(Address of principal executive offices) (Zip code)
| | |
| Caroline Kraus, Esq. | | Copies to: |
| Goldman, Sachs & Co. | | Geoffrey R.T. Kenyon, Esq. |
| 200 West Street | | Dechert LLP |
| New York, New York 10282 | | 100 Oliver Street |
| | 40th Floor |
| | Boston, MA 02110-2605 |
(Name and address of agents for service)
Registrant’s telephone number, including area code: (312) 655-4400
Date of fiscal year end: March 31
Date of reporting period: September 30, 2014
| ITEM 1. | REPORTS TO STOCKHOLDERS. |
| | The Semi-Annual Report to Stockholders is filed herewith. |
Goldman Sachs Funds

| | | | |
| | |
| Semi-Annual Report | | | | September 30, 2014 |
| | |
| | | | Multi Sector Fixed Income Funds |
| | | | Bond* |
| | | | Core Fixed Income |
| | | | Global Income |
| | | | Strategic Income |
| | | | World Bond |
*Effective October 1, 2014, the Goldman Sachs Core Plus Fixed Income Fund was renamed the Goldman Sachs Bond Fund.

Goldman Sachs Multi Sector Fixed Income Funds
| | | | |
TABLE OF CONTENTS | | | | |
| |
Principal Investment Strategies and Risks | | | 1 | |
| |
Investment Process | | | 3 | |
| |
Market Review | | | 4 | |
| |
Portfolio Management Discussions and Performance Summaries | | | 6 | |
| |
Schedules of Investments | | | 30 | |
| |
Financial Statements | | | 120 | |
| |
Financial Highlights | | | 128 | |
| |
Notes to the Financial Statements | | | 138 | |
| |
Other Information | | | 167 | |
| | | | |
| | | |
| NOT FDIC-INSURED | | May Lose Value | | No Bank Guarantee |
GOLDMAN SACHS MULTI SECTOR FIXED INCOME FUNDS
Principal Investment Strategies and Risks
This is not a complete list of risks that affect the Funds. For additional information concerning the risks applicable to the Funds, please see the Funds’ Prospectuses.
The Goldman Sachs Bond Fund invests primarily in fixed income securities, including U.S. government securities, corporate debt securities, privately issued mortgage-backed securities, asset-backed securities, high yield non-investment grade securities and fixed income securities of issuers located in emerging countries. The Fund’s investments in fixed income securities are subject to the risks associated with debt securities generally, including credit, liquidity and interest rate risk. Any guarantee on U.S. government securities applies only to the underlying securities of the Fund if held to maturity and not to the value of the Fund’s shares. Investments in mortgage-backed securities are also subject to prepayment risk (i.e., the risk that in a declining interest rate environment, issuers may pay principal more quickly than expected, causing the Fund to reinvest proceeds at lower prevailing interest rates). High yield, lower rated investments involve greater price volatility and present greater risks than higher rated fixed income securities. Foreign and emerging markets investments may be more volatile and less liquid than investments in U.S. securities and are subject to the risks of currency fluctuations and adverse economic and political developments. Derivative instruments may involve a high degree of financial risk. These risks include the risk that a small movement in the price of the underlying security or benchmark may result in a disproportionately large movement, unfavorable or favorable, in the price of the derivative instrument; risks of default by a counterparty; and liquidity risk (i.e., the risk that an investment may not be able to be sold without a substantial drop in price, if at all).
The Goldman Sachs Core Fixed Income Fund invests primarily in fixed income securities, including U.S. government securities, corporate debt securities, privately issued mortgage-backed securities and asset-backed securities. The Fund’s investments in fixed income securities are subject to the risks associated with debt securities generally, including credit, liquidity and interest rate risk. Any guarantee on U.S. government securities applies only to the underlying securities of the Fund if held to maturity and not to the value of the Fund’s shares. Investments in mortgage-backed securities are also subject to prepayment risk (i.e., the risk that in a declining interest rate environment, issuers may pay principal more quickly than expected, causing the Fund to reinvest proceeds at lower prevailing interest rates). Foreign and emerging markets investments may be more volatile and less liquid than investments in U.S. securities and are subject to the risks of currency fluctuations and adverse economic and political developments. Derivative instruments may involve a high degree of financial risk. These risks include the risk that a small movement in the price of the underlying security or benchmark may result in a disproportionately large movement, unfavorable or favorable, in the price of the derivative instrument; risks of default by a counterparty; and liquidity risk (i.e., the risk that an investment may not be able to be sold without a substantial drop in price, if at all).
The Goldman Sachs Global Income Fund invests primarily in a portfolio of fixed income securities of U.S. and foreign issuers. The Fund’s investments in fixed income securities are subject to the risks associated with debt securities generally, including credit, liquidity and interest rate risk. Foreign and emerging markets investments may be more volatile and less liquid than investments in U.S. securities and are subject to the risks of currency fluctuations and adverse economic or political developments. Issuers of sovereign debt may be unable or unwilling to repay principal or interest when due. Any guarantee on U.S. government securities applies only to the underlying securities of the Fund if held to maturity and not to the value of the Fund’s shares. Investments in mortgage-backed securities are also subject to prepayment risk (i.e., the risk that in a declining interest rate environment, issuers may pay principal more quickly than expected, causing the Fund to reinvest proceeds at lower prevailing interest rates). Derivative instruments may involve a high degree of financial risk. These risks include the risk that a small movement in the price of the underlying security or benchmark may result in a disproportionately large movement, unfavorable or favorable, in the price of the derivative instrument; risks of default by a counterparty; and liquidity risk (i.e., the risk that an investment may not be able to be sold without a substantial drop in price, if at all). The Fund may invest heavily in investments in particular countries or regions and may be subject to greater losses than if it were less concentrated in a particular country or region. The Fund is “non-diversified” and may invest more of its assets in fewer issuers than “diversified” funds. Accordingly, the Fund may be more susceptible to adverse developments affecting any single issuer held in its portfolio and to greater losses resulting from these developments.
The Goldman Sachs Strategic Income Fund invests in a broadly diversified portfolio of U.S. and foreign investment grade and non-investment grade fixed income investments including, but not limited to: U.S. government securities,
1
GOLDMAN SACHS MULTI SECTOR FIXED INCOME FUNDS
non-U.S. sovereign debt, agency securities, corporate debt securities, agency and non-agency mortgage-backed securities, asset-backed securities, custodial receipts, municipal securities, loan participations and loan assignments and convertible securities. Investments in fixed income securities are subject to the risks associated with debt securities generally, including credit, liquidity and interest rate risk. Investments in mortgage-backed securities are also subject to, among other risks, prepayment risk (i.e., the risk that in a declining interest rate environment, issuers may pay principal more quickly than expected, causing the Fund to reinvest proceeds at lower prevailing interest rates). High yield, lower rated investments involve greater price volatility, are less liquid and present greater risks than higher rated fixed income securities. Foreign and emerging markets investments may be more volatile and less liquid than investments in U.S. securities and are subject to the risks of currency fluctuations and adverse economic or political developments. The Fund is also subject to the risk that the issuers of sovereign debt or the government authorities that control the payment of debt may be unable or unwilling to repay principal or interest when due. The Fund may be more sensitive to adverse economic, business or political developments if it invests a substantial portion of its assets in bonds of similar projects or in particular types of municipal securities. The Fund may invest in loans directly, through loan assignments, or indirectly, by purchasing participations or sub-participations from financial institutions. Indirect purchases may subject the Fund to greater delays, expenses and risks than direct obligations in the case that a borrower fails to pay scheduled principal and interest. Derivative instruments may involve a high degree of financial risk. These risks include the risk that a small movement in the price of the underlying security or benchmark may result in a disproportionately large movement, unfavorable or favorable, in the price of the derivative instrument; risks of default by a counterparty; and liquidity risk. At times, the Fund may be unable to sell certain of its illiquid investments without a substantial drop in price, if at all. The Fund is subject to the risks associated with implementing short positions. Taking short positions involves leverage of the Fund’s assets and presents various other risks. Losses on short positions are potentially unlimited as a loss occurs when the value of an asset with respect to which the Fund has a short position increases.
The Investment Adviser will not manage the investment program of the Fund by reference to a benchmark index (i.e., unconstrained). By removing benchmark constraints, the Fund is able to invest across the global fixed income spectrum without regard to sector, quality, maturity or market capitalization limitations, including in asset classes in which more traditional or benchmark-constrained fixed income funds do not typically invest (or do not invest to such an extent). Due to this flexible strategy, the Fund’s risk exposure may vary, and the Fund may underperform traditional fixed income indices. There can be no assurance that the discretionary element of the investment processes of the Investment Adviser will be exercised in a manner that is successful or that is not adverse to the Fund, or that the Fund will outperform more traditional or benchmark-constrained fixed income funds.
The Goldman Sachs World Bond Fund invests primarily in a portfolio of debt instruments, including bonds, derivatives and other instruments with similar economic exposures. Investments in fixed income securities are subject to the risks associated with debt securities generally, including credit, liquidity and interest rate risk. High yield, lower rated investments involve greater price volatility and present greater risks than higher rated fixed income securities. Foreign and emerging market investments may be more volatile and less liquid than investments in U.S. securities and will be subject to the risks of currency fluctuations and adverse economic or political developments. Issuers of sovereign debt may be unable or unwilling to repay principal or interest when due. Any guarantee on U.S. government securities applies only to the underlying securities of the Fund if held to maturity and not to the value of the Fund’s shares. Derivative instruments may involve a high degree of financial risk. These risks include the risk that a small movement in the price of the underlying security or benchmark may result in a disproportionately large movement, unfavorable or favorable, in the price of the derivative instrument; risks of default by a counterparty; and liquidity risk. The Fund is subject to the risks associated with implementing short positions. Taking short positions involves leverage of the Fund’s assets and presents various other risks. Losses on short positions are potentially unlimited as a loss occurs when the value of an asset with respect to which the Fund has a short position increases. The Fund is “non-diversified” and may invest more of its assets in fewer issuers than “diversified” funds. Accordingly, the Fund may be more susceptible to adverse developments affecting any single issuer held in its portfolio and to greater losses resulting from these developments.
2
GOLDMAN SACHS MULTI SECTOR FIXED INCOME FUNDS
What Differentiates the Goldman Sachs Asset Management Fixed Income Investment Process?
At Goldman Sachs Asset Management, L.P. (“GSAM”), the goal of our fixed income investment process is to provide consistent, strong performance by actively managing our portfolios within a research-intensive, risk-managed framework.
A key element of our fixed income investment philosophy is to evaluate the broadest global opportunity set to capture relative value across sectors and instruments. Our globally integrated investment process involves managing dynamically along the risk/return spectrum, as we continue to develop value-added strategies through:

| n | | Assess relative value among sectors (such as mortgage-backed and corporate debt securities) and sub-sectors |
| n | | Leverage the vast resources of GSAM in selecting securities for each portfolio |

| n | | Team approach to decision making |
| n | | Manage risk by avoiding significant sector and interest rate bets |
| n | | Careful management of yield curve strategies — while closely managing portfolio duration |

Fixed Income portfolios that:
| | n | | Include domestic and global investment options, income opportunities, and access to areas of specialization | |
| | n | | Capitalize on GSAM’s industry-renowned credit research capabilities | |
| | n | | Use a risk-managed framework to seek total return, recognizing the importance of investors’ capital accumulation goals as well as their need for income | |
The portfolio risk management process includes an effort to monitor and manage risk, but does not imply low risk.
3
MARKET REVIEW
Goldman Sachs Multi Sector Fixed Income Funds
Market Review
Economic conditions, geopolitical tensions and monetary policies of global central banks drove the performance of the global fixed income markets during the six months ended September 30, 2014 (the “Reporting Period”).
When the Reporting Period began in April 2014, spread, or non-government bond, sectors rallied as global bond yields fell. Markets focused in part on events in Ukraine, as Russia’s intervention led to sanctions by the U.S. and Europe. Emerging markets debt overall appeared to benefit from investment flows diverted from Russia. Economic influences included the U.S. Commerce Department’s announcement that first quarter 2014 Gross Domestic Product (“GDP”) had declined, indicating an economic contraction. However, second calendar quarter economic data releases, such as auto sales, jobless claims and manufacturing activity, suggested a rebound was underway. This supported the view of some market participants that the first quarter 2014 contraction might have been due to inclement winter weather and that economic growth could accelerate in the remainder of the calendar year. From a monetary policy perspective, in June 2014, the European Central Bank (“ECB”) cut interest rates by 10 basis points, moving the deposit rate for the Eurozone into negative territory for the first time in history. (A basis point is 1/100th of a percentage point.) The ECB also announced it would be implementing additional liquidity measures targeted at stimulating lending. Meanwhile, India’s elections delivered a victory to its existing government, which is seeking to revive the country’s economic growth, tame inflation and remove roadblocks to reform.
At the beginning of the third calendar quarter, spread sectors generally continued to rally. In July 2014, core European government bond yields fell, while U.S. Treasury yields rose modestly. U.S. economic data was mixed, with labor and manufacturing indicators continuing to improve and housing data showing signs of weakening. In the U.K., economic growth continued at a brisk pace, broadly in line with market expectations. During August 2014, global spread sectors continued to post gains. Eurozone GDP came in below expectations, with Italy, France and Germany surprising to the downside. In the U.S., Treasury yields fell despite the release of positive durable goods orders and manufacturing data. The decline in U.S. Treasury yields may have reflected market concern about increased geopolitical risk in Ukraine and the Middle East. Meanwhile, Federal Reserve (“Fed”) comments suggested a modest shift in tone towards policy tightening. In the U.K., data continued to indicate strong economic momentum. However, heightened concerns about European economic growth appeared to decrease the likelihood of a rate hike by the Bank of England in the near term.
In September 2014, the spread sector rally ended. Core government bond yields in the U.S., U.K., Eurozone and Japan also rose during the month. In the U.S., economic data remained generally positive, despite a disappointing August 2014 payroll number, with employment, auto sales and manufacturing showing improvement. In the Eurozone, the ECB cut interest rates to record lows and announced plans to start purchasing asset-backed securities as it sought to combat a drop in inflation and weak economic growth. In the U.K., unemployment continued to fall rapidly. Scotland voted to remain part of the European Union, although this had little effect on U.K. government yields.
For the Reporting Period overall, sovereign emerging markets debt generated the strongest positive returns within the broad fixed income market. Mortgage-backed securities also outperformed U.S. Treasuries, followed at some distance by agency securities, asset-backed
securities and commercial mortgage-backed securities. Conversely, high yield corporate bonds underperformed U.S. Treasuries, while investment grade corporate bonds also lagged, albeit more modestly. The U.S. Treasury yield curve, or spectrum of maturities, flattened during the
4
MARKET REVIEW
Reporting Period, as intermediate-term and longer-term yields declined and shorter-term maturities edged up. The yield on the bellwether 10-year U.S. Treasury fell approximately 23 basis points during the Reporting Period to 2.49%.
Looking Ahead
At the end of the Reporting Period, we believed global macroeconomic conditions had diverged and that the divergence was continuing to intensify. In our opinion, the U.S. is the growth leader among developed nations, while the Eurozone appears to be falling further behind. We believe the Eurozone’s economic weakness could persist for some time and could also affect other economies. Most notably, we think Eurozone weakness could pose a risk to the U.K.’s economic expansion. Inflation seems to be trending higher in the U.S. and Japan, but Eurozone inflation is significantly below the ECB’s target rate, and we do not expect a change in the near term.
Meanwhile, developed central bank activity is also moving in opposite directions. The Fed has indicated it will end its quantitative easing asset purchase program in October 2014, and we believe the first short-term rate hike could occur in mid-2015, unless the recent increase in market volatility leads to slower economic growth. By contrast, the ECB has committed to bolder stimulus, and we think it may resort to full-scale quantitative easing in 2015. The Bank of Japan remains in easing, or accommodative, mode, but we do not expect any action in the near term as the impact of its sales tax hike, put into effect in April 2014, works its way through the nation’s economy.
We are also seeing divergence in the emerging markets, with investors seemingly favoring countries that have passed reforms necessary for sustainable growth. These countries include India, Mexico and Indonesia. In China, we believe the balancing act between that nation’s economic reforms and a potential 2014 growth rate of 7.5% has tilted in favor of the growth target. However, in our view, the economy’s longer-term health depends on China switching to more sustainable economic drivers. At the end of the Reporting Period, wage inflation was eroding China’s competitiveness, with credit growth and the slowing real estate sector our key concerns.
In the near term, we believe the divergence in macroeconomic conditions around the globe could stir volatility. However, we believe economic growth and strong corporate fundamentals should support the corporate credit sector. Meanwhile, geopolitical risks have increased and may also contribute to market volatility, but, in our view, are unlikely to have much impact on global GDP. Energy prices have fallen, suggesting to us that global oversupply was a stronger market driver than geopolitics at the end of the Reporting Period.
5
PORTFOLIO RESULTS
Goldman Sachs Bond Fund
Investment Objective
The Fund seeks a total return consisting of capital appreciation and income that exceeds the total return of the Barclays U.S. Aggregate Bond Index.
Portfolio Management Discussion and Analysis
Effective October 1, 2014, the Goldman Sachs Core Plus Fixed Income Fund’s name changed to the Goldman Sachs Bond Fund (the “Fund”). Below, the Goldman Sachs U.S. Fixed Income Investment Management Team discusses the Fund’s performance and positioning for the six-month period ended September 30, 2014 (the “Reporting Period”).
| Q | | How did the Fund perform during the Reporting Period? |
| A | | During the Reporting Period, the Fund’s Class A, B, C, Institutional, Service, IR and R Shares generated cumulative total returns, without sales charges, of 2.37%, 1.99%, 1.99%, 2.54%, 2.29%, 2.50% and 2.24%, respectively. These returns compare to the 2.21% cumulative total return of the Fund’s benchmark, the Barclays U.S. Aggregate Bond Index (the “Barclays Index”), during the same time period. |
| Q | | What key factors were responsible for the Fund’s performance during the Reporting Period? |
| A | | Tactical management of the Fund’s duration and yield curve positioning strategy detracted from relative performance during the Reporting Period. Duration is a measure of the Fund’s sensitivity to changes in interest rates. Yield curve indicates the spectrum of maturities within a particular sector. |
| | | Our top-down currency and cross-sector strategies were the primary positive contributors to Fund performance during the Reporting Period. In our currency strategy, underweighted positions in the Swiss franc, Australian dollar and New Zealand dollar proved particularly beneficial during the Reporting Period. Our cross-sector strategy is one in which we invest Fund assets across a variety of fixed income sectors, including some that may not be included in the Fund’s benchmark. Bottom-up individual issue selection overall added value as well. |
| Q | | Which fixed income market sectors most significantly affected Fund performance? |
| A | | Implemented via our cross-sector strategy, the Fund’s exposure to corporate bonds and non-agency mortgage- backed securities contributed positively to relative results. Corporate credit spreads, or yield differentials to U.S. Treasuries, tightened, or narrowed, for most of the Reporting Period, as the sector benefited from supportive credit fundamentals and low levels of volatility. Non- agency mortgage-backed securities performed well, supported by appreciating home values and improving borrower credit performance. In contrast, the Fund’s underweighted position relative to the Barclays Index in agency mortgage-backed securities detracted, as mortgage spreads tightened largely on a favorable technical, or supply/demand, environment. |
| | Individual issue selection of non-agency collateralized mortgage obligations within the securitized debt sector added value. Selections within the government/swaps sector also contributed positively to relative results. Partially offsetting these positive contributors was the Fund’s exposure to Brazil within the emerging markets debt sector, which detracted from relative results. |
| Q | | Did the Fund’s duration and yield curve positioning strategy help or hurt its results during the Reporting Period? |
| A | | Tactical management of the Fund’s duration and yield curve positioning detracted from its results during the Reporting Period. We further shortened the Fund’s already short U.S. duration position relative to the Barclays Index over the course of the Reporting Period, as strong durable goods numbers, elevated readings on manufacturing and services purchasing managers indices (“PMI”) and other data suggested, in our view, the U.S. economy continued to grow at an above-trend rate and thus that we anticipated rates would move higher. Such duration positioning hurt, however, as U.S. Treasury yields shrugged off improving economic data and declined instead. Political turmoil in Ukraine and the Middle East also weighed on U.S. Treasury yields later in |
6
PORTFOLIO RESULTS
| | the Reporting Period. Rates rose somewhat in September 2014, partially offsetting earlier losses, following that month’s Federal Reserve (“Fed”) meeting during which there was a shift up in future interest rate projections. |
| | We reduced the Fund’s short U.K. duration position following modest underperformance, as we believed the likelihood for a near-term rate hike from the Bank of England decreased. |
| Q | | How did the Fund use derivatives and similar instruments during the Reporting Period? |
| A | | As market conditions warranted during the Reporting Period, currency transactions were carried out using primarily over-the-counter (“OTC”) spot and forward foreign exchange contracts as well as purchased OTC options. Currency transactions were used as we sought both to enhance returns and to hedge the Fund’s portfolio against currency exchange rate fluctuations. Also, Treasury futures were used as warranted to facilitate specific duration, yield curve and country strategies; swaptions (or options on interest rate swap contracts) to express an outright term structure view and manage volatility (term structure, most often depicted as a yield curve, refers to the term structure of interest rates, which is the relationship between the yield to maturity and the time to maturity for pure discount bonds); credit default swaps to manage exposure to fluctuations in credit spreads (or the differential in yields between Treasury securities and non-Treasury securities that are identical in all respects except for quality rating); and interest rate swaps to manage exposure to fluctuations in interest rates. The Fund also used forward sales contracts to help manage duration. Overall, we employ derivatives and similar instruments for the efficient management of the Fund’s portfolio. Derivatives and similar instruments allow us to manage interest rate, credit and currency risks more effectively by allowing us both to hedge and to apply active investment views with greater versatility and to afford greater risk management precision than we would otherwise be able to implement. |
| Q | | Were there any notable changes in the Fund’s weightings during the Reporting Period? |
| A | | As mentioned earlier, we further shortened the Fund’s already short U.S. duration position relative to the Barclays Index on what we perceived to be the continued strength of the U.S. economy and the upward shift in the Fed’s interest rate projections. We reduced the Fund’s short U.K. duration as we believed the likelihood for a nearer-term rate hike from the Bank of England decreased and our concerns about economic growth momentum in Europe increased. |
| | From a sector perspective, we tactically reduced the Fund’s corporate credit target to neutral as we sought to reduce exposure in a sector that we believed had reached its fair value. That said, we remained constructive in our view toward credit fundamentals and economic growth outlooks for the latter part of 2014. |
| | Within the agency mortgage-backed securities sector, we maintained the Fund’s overweighted exposure relative to the Barclays Index to agency multi-family securities and an underweighted exposure relative to the Barclays Index to mortgage-backed security pass-throughs. (Pass-through mortgages consist of a pool of residential mortgage loans, where homeowners’ monthly payments of principal, interest and prepayments pass from the original bank through a government agency or investment bank to investors.) We maintained the Fund’s overweighted exposure relative to the Barclays Index to non-agency mortgage-backed securities throughout the Reporting Period given what we believed were supportive housing fundamentals. Though recent housing data slowed somewhat, the U.S. housing market continues to recover at a moderate pace in our view. We expect increasing household formation to prove beneficial for the sector. |
| Q | | How was the Fund positioned relative to its benchmark index at the end of September 2014? |
| A | | At the end of September 2014, the Fund had overweighted allocations relative to the Barclays Index on a market- value weighted basis in asset-backed securities, high yield corporate bonds, emerging market debt, investment grade corporate bonds, residential mortgage-backed securities and covered bonds. (Covered bonds are debt securities backed by cash flows from mortgage loans or public sector loans.) The Fund also had exposure to municipal bonds, which is a sector not represented in the Barclays Index. The Fund had underweighted exposure relative to the Barclays Index in U.S. government securities, commercial mortgage- backed securities and quasi-government securities. The Fund maintained a short overall duration compared to the Barclays Index at the end of the Reporting Period. |
7
FUND BASICS
Bond Fund
as of September 30, 2014
| | | | | | | | | | | | | | | | | | |
| | PERFORMANCE REVIEW | |
| | | April 1, 2014–
September 30, 2014 | | Fund Total
Return
(based on NAV)1 | | | Barclays
U.S. Aggregate
Bond Index2 | | | 30-Day
Standardized
Subsidized Yield3 | | | 30-Day
Standardized
Unsubsidized Yield3 | |
| | Class A | | | 2.37 | % | | | 2.21 | % | | | 1.63 | % | | | 1.34 | % |
| | Class B | | | 1.99 | | | | 2.21 | | | | 0.96 | | | | 0.65 | |
| | Class C | | | 1.99 | | | | 2.21 | | | | 0.95 | | | | 0.65 | |
| | Institutional | | | 2.54 | | | | 2.21 | | | | 2.04 | | | | 1.73 | |
| | Service | | | 2.29 | | | | 2.21 | | | | 1.56 | | | | 1.25 | |
| | Class IR | | | 2.50 | | | | 2.21 | | | | 1.95 | | | | 1.64 | |
| | | Class R | | | 2.24 | | | | 2.21 | | | | 1.45 | | | | 1.14 | |
| | 1 | | The net asset value (“NAV”) represents the net assets of the class of the Fund (ex-dividend) divided by the total number of shares of the class outstanding. The Fund’s performance assumes the reinvestment of dividends and other distributions. The Fund’s performance does not reflect the deduction of any applicable sales charges. |
| | 2 | | The Barclays U.S. Aggregate Bond Index represents an unmanaged diversified portfolio of fixed income securities, including U.S. Treasuries, investment-grade corporate bonds, and mortgage-backed and asset-backed securities. The Index figure does not reflect any deduction for fees, expenses or taxes. It is not possible to invest directly in an index. |
| | 3 | | The method of calculation of the 30-Day Standardized Subsidized Yield is mandated by the Securities and Exchange Commission and is determined by dividing the net investment income per share earned during the last 30 days of the period by the maximum public offering price (“POP”) per share on the last day of the period. This number is then annualized. The 30-Day Standardized Subsidized Yield reflects fee waivers and/or expense reimbursements recorded by the Fund during the period. Without waivers and/or reimbursements, yields would be reduced. This yield does not necessarily reflect income actually earned and distributed by the Fund and, therefore, may not be correlated with the dividends or other distributions paid to shareholders. The 30-Day Standardized Unsubsidized Yield does not adjust for any fee waivers and/or expense reimbursements in effect. If the Fund does not incur any fee waivers and/or expense reimbursements during the period, the 30-Day Standardized Subsidized Yield and 30-Day Standardized Unsubsidized Yield will be identical. |
The returns set forth in the table above represent past performance. Past performance does not guarantee future results. The Fund’s investment return and principal value will fluctuate so that an investor’s shares, when redeemed, may be worth more or less than their original cost. Current performance may be lower or higher than the performance quoted above. Please visit our web site at www.GSAMFUNDS.com to obtain the most recent month-end returns. Performance reflects applicable fee waivers and/or expense limitations in effect during the periods shown. In their absence, performance would be reduced. Returns do not reflect the deduction of taxes that a shareholder would pay on Fund distributions or the redemption of Fund shares.
8
FUND BASICS
| | | | | | | | | | | | | | | | |
| | STANDARDIZED TOTAL RETURNS4 |
| | | For the period ended 9/30/14 | | One Year | | | Five Years | | | Since Inception | | | Inception Date |
| | Class A | | | 1.18 | % | | | 4.70 | % | | | 4.68 | % | | 11/30/06 |
| | Class B | | | -0.78 | | | | 4.34 | | | | 4.81 | | | 6/20/07 |
| | Class C | | | 3.30 | | | | 4.72 | | | | 4.40 | | | 11/30/06 |
| | Institutional | | | 5.46 | | | | 5.88 | | | | 5.56 | | | 11/30/06 |
| | Service | | | 4.95 | | | | 5.36 | | | | 5.45 | | | 6/20/07 |
| | Class IR | | | 5.27 | | | | 5.68 | | | | 5.33 | | | 11/30/07 |
| | | Class R | | | 4.84 | | | | 5.24 | | | | 4.86 | | | 11/30/07 |
| | 4 | | The Standardized Total Returns are average annual total returns as of the most recent calendar quarter-end. They assume reinvestment of all distributions at NAV. These returns reflect a maximum initial sales charge of 3.75% for Class A Shares, the assumed contingent deferred sales charge for Class B Shares (5% maximum declining to 0% after six years) and the assumed contingent deferred sales charge for Class C Shares (1% if redeemed within 12 months of purchase). Class B Shares convert automatically to Class A Shares on or about the fifteenth day of the last month of the calendar quarter that is eight years after purchase. Prior to July 29, 2009, the maximum initial sales charge applicable to Class A Shares was 4.5%, which is not reflected in the average annual total return figures shown. Because Institutional, Service, Class IR and Class R Shares do not involve a sales charge, such a charge is not applied to their Standardized Total Returns. The Fund’s Class B Shares are no longer available for purchase by new or existing shareholders (although current Class B shareholders may continue to reinvest income and capital gains distributions into Class B Shares, and Class B shareholders may continue to exchange their shares for Class B Shares of certain other Goldman Sachs Funds). |
The returns set forth in the table above represent past performance. Past performance does not guarantee future results. The Fund’s investment return and principal value will fluctuate so that an investor’s shares, when redeemed, may be worth more or less than their original cost. Current performance may be lower or higher than the performance quoted above. Please visit our web site at www.GSAMFUNDS.com to obtain the most recent month-end returns. Performance reflects applicable fee waivers and/or expense limitations in effect during the periods shown. In their absence, performance would be reduced. Returns do not reflect the deduction of taxes that a shareholder would pay on Fund distributions or the redemption of Fund shares.
| | | | | | | | | | |
| | EXPENSE RATIOS5 | |
| | | | | Net Expense Ratio (Current) | | | Gross Expense Ratio (Before Waivers) | |
| | Class A | | | 0.84 | % | | | 1.06 | % |
| | Class B | | | 1.59 | | | | 1.80 | |
| | Class C | | | 1.59 | | | | 1.81 | |
| | Institutional | | | 0.50 | | | | 0.71 | |
| | Service | | | 1.00 | | | | 1.22 | |
| | Class IR | | | 0.59 | | | | 0.81 | |
| | | Class R | | | 1.09 | | | | 1.29 | |
| | 5 | | The expense ratios of the Fund, both current (net of applicable fee waivers and/or expense limitations) and before waivers (gross of applicable fee waivers and/or expense limitations) are as set forth above according to the most recent publicly available Prospectus for the Fund and may differ from the expense ratios disclosed in the Financial Highlights in this report. Pursuant to a contractual arrangement, the Fund’s waivers and/or expense limitations will remain in place through at least July 29, 2015, and prior to such date the Investment Adviser may not terminate the arrangements without the approval of the Fund’s Board of Trustees. If these arrangements are discontinued in the future, the expense ratios may change without shareholder approval. |
9
FUND BASICS
| | |
| SECTOR ALLOCATIONS6 |
| Percentage of Net Assets |
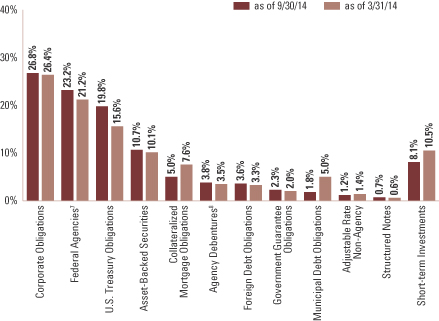
| | 6 | | The percentage shown for each investment category reflects the value of investments in that category as a percentage of net assets. Short-term investments represent repurchase agreements. Figures in the graph may not sum to 100% due to the exclusion of other assets and liabilities. The graph depicts the Fund’s investments but may not represent the Fund’s market exposure due to the exclusion of certain derivatives, if any, as listed in the Additional Investment Information section of the Schedule of Investments. |
| | 7 | | “Federal Agencies” are mortgage-backed securities guaranteed by the Government National Mortgage Association (“GNMA”), Federal National Mortgage Association (“FNMA”) and Federal Home Loan Mortgage Corp. (“FHLMC”). GNMA instruments are backed by the full faith and credit of the U.S. Government. |
| | 8 | | “Agency Debentures” include agency securities offered by companies such as FNMA and FHLMC, which operate under a government charter. While they are required to report to a government regulator, their assets are not explicitly guaranteed by the government and they otherwise operate like any other publicly traded company. |
10
PORTFOLIO RESULTS
Goldman Sachs Core Fixed Income Fund
Investment Objective
The Fund seeks a total return consisting of capital appreciation and income that exceeds the total return of the Barclays U.S. Aggregate Bond Index.
Portfolio Management Discussion and Analysis
Below, the Goldman Sachs U.S. Fixed Income Investment Management Team discusses the Goldman Sachs Core Fixed Income Fund’s (the “Fund”) performance and positioning for the six-month period ended September 30, 2014 (the “Reporting Period”).
| Q | | How did the Fund perform during the Reporting Period? |
| A | | During the Reporting Period, the Fund’s Class A, B, C, Institutional, Service, IR and R Shares generated cumulative total returns, without sales charges, of 2.15%, 1.77%, 1.86%, 2.42%, 2.07%, 2.28% and 2.12%, respectively. These returns compare to the 2.21% cumulative total return of the Fund’s benchmark, the Barclays U.S. Aggregate Bond Index (the “Barclays Index”), during the same period. |
| Q | | What key factors were responsible for the Fund’s performance during the Reporting Period? |
| A | | Tactical management of the Fund’s duration and yield curve positioning strategy detracted from relative performance during the Reporting Period. Duration is a measure of the Fund’s sensitivity to changes in interest rates. Yield curve indicates the spectrum of maturities within a particular sector. |
| | Our top-down currency and cross-sector strategies were the primary positive contributors to Fund performance during the Reporting Period. In our currency strategy, underweighted positions the Swiss franc, Australian dollar and New Zealand dollar proved particularly beneficial during the Reporting Period. Our cross-sector strategy is one in which we invest Fund assets across a variety of fixed income sectors, including some that may not be included in the Fund’s benchmark. Bottom-up individual issue selection overall added value as well. |
| Q | | Which fixed income market sectors most significantly affected Fund performance? |
| A | | Implemented via our cross-sector strategy, the Fund’s exposure to U.S. government agency securities, corporate bonds and non-agency mortgage-backed securities contributed positively to relative results. U.S. government agency securities outperformed U.S. Treasuries during the Reporting Period. Corporate credit spreads, or yield differentials to U.S. Treasuries, tightened, or narrowed, for most of the Reporting Period, as the sector benefited from supportive credit fundamentals and low levels of volatility. Non-agency mortgage-backed securities performed well, supported by appreciating home values and improving borrower credit performance. In contrast, the Fund’s underweighted position relative to the Barclays Index in agency mortgage-backed securities detracted, as mortgage spreads tightened largely on a favorable technical, or supply/demand, environment. |
| | Individual issue selection within the corporate bond and securitized sectors added value. Effective selection in the corporate bond sector was driven by the Fund’s underweight to longer-dated U.S. corporate bonds. Selections of non- agency collateralized mortgage obligations within the securitized debt sector buoyed results. Selections within the government/swaps sector detracted from relative results. |
| Q | | Did the Fund’s duration and yield curve positioning strategy help or hurt its results during the Reporting Period? |
| A | | Tactical management of the Fund’s duration and yield curve positioning detracted from its results during the Reporting Period. We further shortened the Fund’s already short U.S. duration position relative to the Barclays Index over the course of the Reporting Period, as strong durable goods numbers, elevated readings on manufacturing and services purchasing managers indices (“PMI”) and other data suggested, in our view, the U.S. economy continued to grow at an above-trend rate and thus that we anticipated rates would move higher. Such duration positioning hurt, however, as U.S. Treasury yields shrugged off improving economic data and declined instead. Political turmoil in Ukraine and the Middle East also weighed on U.S. Treasury yields later in the Reporting Period. Rates rose somewhat in September |
11
PORTFOLIO RESULTS
| | 2014, partially offsetting earlier losses, following that month’s Federal Reserve (“Fed”) meeting during which there was a shift up in future interest rate projections. |
| | We reduced the Fund’s short U.K. duration position following modest underperformance, as we believed the likelihood for a near-term rate hike from the Bank of England decreased. |
| Q | | How did the Fund use derivatives and similar instruments during the Reporting Period? |
| A | | As market conditions warranted during the Reporting Period, currency transactions were carried out using primarily over-the-counter (“OTC”) spot and forward foreign exchange contracts as well as purchased OTC options. Currency transactions were used as we sought both to enhance returns and to hedge the Fund’s portfolio against currency exchange rate fluctuations. Also, Treasury and international government bond futures, Eurodollar futures and other futures contracts were used as warranted to facilitate specific duration, yield curve and country strategies; swaptions (or options on interest rate swap contracts) to express an outright term structure view and manage volatility (term structure, most often depicted as a yield curve, refers to the term structure of interest rates, which is the relationship between the yield to maturity and the time to maturity for pure discount bonds); credit default swaps to manage exposure to fluctuations in credit spreads (or the differential in yields between Treasury securities and non-Treasury securities that are identical in all respects except for quality rating); and interest rate swaps to manage exposure to fluctuations in interest rates. The Fund also used forward sales contracts to help manage duration. Overall, we employ derivatives and similar instruments for the efficient management of the Fund’s portfolio. Derivatives and similar instruments allow us to manage interest rate, credit and currency risks more effectively by allowing us both to hedge and to apply active investment views with greater versatility and to afford greater risk management precision than we would otherwise be able to implement. |
| Q | | Were there any notable changes in the Fund’s weightings during the Reporting Period? |
| A | | As mentioned earlier, we further shortened the Fund’s already short U.S. duration position relative to the Barclays Index on what we perceived to be the continued strength of the U.S. economy and the upward shift in the Fed’s interest rate projections. We reduced the Fund’s short U.K. duration as we believed the likelihood for a nearer-term rate hike from the Bank of England decreased and our concerns about economic growth momentum in Europe increased. |
| | From a sector perspective, we maintained the Fund’s modest overweight to corporate credit for much of the Reporting Period amidst U.S. economic recovery while favoring lower-rated securities, though moved to a neutral position over the summer. Within the agency mortgage-backed securities sector, we maintained the Fund’s overweighted exposure relative to the Barclays Index to agency multi- family securities and an underweighted exposure to mortgage-backed security pass-throughs. (Pass-through mortgages consist of a pool of residential mortgage loans, where homeowners’ monthly payments of principal, interest and prepayments pass from the original bank through a government agency or investment bank to investors.) We maintained the Fund’s overweighted exposure to non-agency mortgage-backed securities throughout the Reporting Period given what we believed were supportive U.S. housing market fundamentals and positive expectations overall for the U.S. economy. We maintained the Fund’s rather neutral position relative to the Barclays Index in emerging markets debt due to volatility in Eastern Europe and the Middle East. |
| Q | | How was the Fund positioned relative to its benchmark index at the end of September 2014? |
| A | | At the end of September 2014, the Fund had its most overweighted allocations relative to the Barclays Index on a market-value weighted basis in asset-backed securities and investment grade corporate bonds, with an emphasis in the latter on the financials industry. The Fund also had more modestly overweighted exposure at the end of the Reporting Period to quasi-government securities, covered bonds and commercial mortgage-backed securities. (Covered bonds are debt securities backed by cash flows from mortgage loans or public sector loans.) The Fund had its most underweighted exposure relative to the Barclays Index in U.S. government securities. The Fund also had an underweighted exposure to the residential mortgage-backed securities sector overall. However, within the residential mortgage-backed securities sector, the Fund had overweighted allocations to agency collateralized mortgage obligations and an underweighted exposure to mortgage-backed security pass-throughs. The Fund had a rather neutral position compared to the Barclays Index in emerging markets debt at the end of September 2014. The Fund had a short overall duration compared to the Barclays Index at the end of the Reporting Period. |
12
FUND BASICS
Core Fixed Income Fund
as of September 30, 2014
| | | | | | | | | | | | | | | | | | |
| | PERFORMANCE REVIEW | |
| | | April 1, 2014–
September 30, 2014 | | Fund Total
Return
(based on NAV)1 | | | Barclays
U.S. Aggregate
Bond Index2 | | | 30-Day
Standardized
Subsidized Yield3 | | | 30-Day
Standardized
Unsubsidized Yield3 | |
| | Class A | | | 2.15 | % | | | 2.21 | % | | | 1.47 | % | | | 1.47 | % |
| | Class B | | | 1.77 | | | | 2.21 | | | | 0.79 | | | | 0.79 | |
| | Class C | | | 1.86 | | | | 2.21 | | | | 0.79 | | | | 0.79 | |
| | Institutional | | | 2.42 | | | | 2.21 | | | | 1.87 | | | | 1.87 | |
| | Service | | | 2.07 | | | | 2.21 | | | | 1.37 | | | | 1.37 | |
| | Class IR | | | 2.28 | | | | 2.21 | | | | 1.78 | | | | 1.78 | |
| | | Class R | | | 2.12 | | | | 2.21 | | | | 1.28 | | | | 1.28 | |
| | 1 | | The net asset value (“NAV”) represents the net assets of the class of the Fund (ex-dividend) divided by the total number of shares of the class outstanding. The Fund’s performance assumes the reinvestment of dividends and other distributions. The Fund’s performance does not reflect the deduction of any applicable sales charges. |
| | 2 | | The Barclays U.S. Aggregate Bond Index represents an unmanaged diversified portfolio of fixed income securities, including U.S. Treasuries, investment-grade corporate bonds and mortgage-backed and asset-backed securities. The Index figure does not reflect any deduction for fees, expenses or taxes. It is not possible to invest directly in an index. |
| | 3 | | The method of calculation of the 30-Day Standardized Subsidized Yield is mandated by the Securities and Exchange Commission and is determined by dividing the net investment income per share earned during the last 30 days of the period by the maximum public offering price (“POP”) per share on the last day of the period. This number is then annualized. The 30-Day Standardized Subsidized Yield reflects fee waivers and/or expense reimbursements recorded by the Fund during the period. Without waivers and/or reimbursements, yields would be reduced. This yield does not necessarily reflect income actually earned and distributed by the Fund and, therefore, may not be correlated with the dividends or other distributions paid to shareholders. The 30-Day Standardized Unsubsidized Yield does not adjust for any fee waivers and/or expense reimbursements in effect. If the Fund does not incur any fee waivers and/or expense reimbursements during the period, the 30-Day Standardized Subsidized Yield and 30-Day Standardized Unsubsidized Yield will be identical. |
The returns set forth in the table above represent past performance. Past performance does not guarantee future results. The Fund’s investment return and principal value will fluctuate so that an investor’s shares, when redeemed, may be worth more or less than their original cost. Current performance may be lower or higher than the performance quoted above. Please visit our web site at www.GSAMFUNDS.com to obtain the most recent month-end returns. Performance reflects applicable fee waivers and/or expense limitations in effect during the periods shown. In their absence, performance would be reduced. Returns do not reflect the deduction of taxes that a shareholder would pay on Fund distributions or the redemption of Fund shares.
13
FUND BASICS
| | | | | | | | | | | | | | | | | | |
| | STANDARDIZED TOTAL RETURNS4 |
| | | For the period ended 9/30/14 | | One Year | | | Five Years | | | Ten Years | | | Since Inception | | Inception Date |
| | Class A | | | 0.46 | % | | | 3.99 | % | | | 3.46 | % | | 4.91% | | 5/1/97 |
| | Class B | | | -1.52 | | | | 3.65 | | | | 3.23 | | | 4.78 | | 5/1/97 |
| | Class C | | | 2.55 | | | | 4.04 | | | | 3.09 | | | 4.22 | | 8/15/97 |
| | Instititutional | | | 4.70 | | | | 5.17 | | | | 4.23 | | | 5.60 | | 1/5/94 |
| | Service | | | 4.18 | | | | 4.63 | | | | 3.71 | | | 5.05 | | 3/13/96 |
| | Class IR | | | 4.61 | | | | 5.04 | | | | N/A | | | 4.01 | | 11/30/07 |
| | | Class R | | | 4.09 | | | | 4.55 | | | | N/A | | | 3.52 | | 11/30/07 |
| | 4 | | The Standardized Total Returns are average annual total returns as of the most recent calendar quarter-end. They assume reinvestment of all distributions at NAV. These returns reflect a maximum initial sales charge of 3.75% for Class A Shares, the assumed contingent deferred sales charge for Class B Shares (5% maximum declining to 0% after six years) and the assumed contingent deferred sales charge for Class C Shares (1% if redeemed within 12 months of purchase). Class B Shares convert automatically to Class A Shares on or about the fifteenth day of the last month of the calendar quarter that is eight years after purchase. Returns for Class B Shares for the period after conversion reflect the performance of Class A Shares. Prior to July 29, 2009, the maximum initial sales charge applicable to Class A Shares was 4.5%, which is not reflected in the average annual total return figures shown. Because Institutional, Service, Class IR and Class R Shares do not involve a sales charge, such a charge is not applied to their Standardized Total Returns. The Fund’s Class B Shares are no longer available for purchase by new or existing shareholders (although current Class B shareholders may continue to reinvest income and capital gains distributions into Class B Shares, and Class B shareholders may continue to exchange their shares for Class B Shares of certain other Goldman Sachs Funds). |
The returns set forth in the table above represent past performance. Past performance does not guarantee future results. The Fund’s investment return and principal value will fluctuate so that an investor’s shares, when redeemed, may be worth more or less than their original cost. Current performance may be lower or higher than the performance quoted above. Please visit our web site at www.GSAMFUNDS.com to obtain the most recent month-end returns. Performance reflects applicable fee waivers and/or expense limitations in effect during the periods shown. In their absence, performance would be reduced. Returns do not reflect the deduction of taxes that a shareholder would pay on Fund distributions or the redemption of Fund shares.
| | | | | | | | | | |
| | EXPENSE RATIOS5 | |
| | | | | Net Expense Ratio (Current) | | | Gross Expense Ratio (Before Waivers) | |
| | Class A | | | 0.83 | % | | | 0.83 | % |
| | Class B | | | 1.58 | | | | 1.58 | |
| | Class C | | | 1.58 | | | | 1.58 | |
| | Institutional | | | 0.49 | | | | 0.49 | |
| | Service | | | 0.98 | | | | 0.98 | |
| | Class IR | | | 0.58 | | | | 0.58 | |
| | | Class R | | | 1.08 | | | | 1.08 | |
| | 5 | | The expense ratios of the Fund, both current (net of applicable fee waivers and/or expense limitations) and before waivers (gross of applicable fee waivers and/or expense limitations) are as set forth above according to the most recent publicly available Prospectus for the Fund and may differ from the expense ratios disclosed in the Financial Highlights in this report. |
14
FUND BASICS
| | |
| SECTOR ALLOCATIONS6 |
| Percentage of Net Assets |
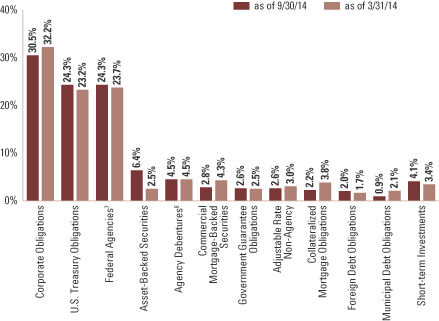
| | 6 | | The percentage shown for each investment category reflects the value of investments in that category as a percentage of net assets. Short-term investments represent repurchase agreements. Figures in the graph may not sum to 100% due to the exclusion of other assets and liabilities. The graph depicts the Fund’s investments but may not represent the Fund’s market exposure due to the exclusion of certain derivatives, if any, as listed in the Additional Investment Information section of the Schedule of Investments. |
| | 7 | | “Federal Agencies” are mortgage-backed securities guaranteed by the Government National Mortgage Association (“GNMA”), Federal National Mortgage Association (“FNMA”) and Federal Home Loan Mortgage Corp. (“FHLMC”). GNMA instruments are backed by the full faith and credit of the U.S. Government. |
| | 8 | | “Agency Debentures” include agency securities offered by companies such as FNMA and FHLMC, which operate under a government charter. While they are required to report to a government regulator, their assets are not explicitly guaranteed by the government and they otherwise operate like any other publicly traded company. |
15
PORTFOLIO RESULTS
Goldman Sachs Global Income Fund
Investment Objective
The Fund seeks a high total return, emphasizing current income, and, to a lesser extent, providing opportunities for capital appreciation.
Portfolio Management Discussion and Analysis
Below, the Goldman Sachs Global Fixed Income Investment Management Team discusses the Goldman Sachs Global Income Fund’s (the “Fund”) performance and positioning for the six-month period ended September 30, 2014 (the “Reporting Period”).
| Q | | How did the Fund perform during the Reporting Period? |
| A | | During the Reporting Period, the Fund’s Class A, B, C, Institutional, Service and IR Shares generated cumulative total returns, without sales charges, of 2.95%, 2.57%, 2.58%, 3.13%, 2.87% and 3.16%, respectively. These returns compare to the 3.17% cumulative total return of the Fund’s benchmark, the Barclays Global Aggregate Bond (Gross, USD, Hedged) Index (the “Barclays Index”), during the same time period. |
| Q | | What key factors were responsible for the Fund’s performance during the Reporting Period? |
| A | | Our duration strategy detracted from the Fund’s results. Duration is a measure of the Fund’s sensitivity to changes in interest rates. |
| | Primary contributors to the Fund’s performance were our currency and country strategies. Within our currency strategy, an underweighted position in the Swiss franc contributed the most. The Swiss franc depreciated relative to the U.S. dollar, as inflation concerns prompted market speculation that the Swiss National Bank might provide support in terms of monetary easing. Within our country strategy, an overweighted exposure to European rates relative to U.S. rates contributed the most. Overall, the Fund’s positioning in the European peripheral nations of Spain and Italy and in New Zealand also proved to be beneficial, more than offsetting the detracting impact of positioning in Sweden, Japan and Australia during the Reporting Period. To a more modest degree, our cross-sector strategy also added value. Our cross-sector strategy is one in which we invest Fund assets across a variety of fixed income sectors, including some that may not be included in the Fund’s benchmark. |
| Q | | Which fixed income market sectors most significantly affected Fund performance? |
| A | | Within the government/swaps selection strategy, U.K. yield curve positioning detracted from the Fund’s results during the Reporting Period. |
| | Conversely, the Fund’s tactical overweights to non-agency mortgage-backed securities and corporate bonds contributed positively to its performance. Bottom-up individual issue selection of collateralized mortgage obligations and adjustable rate mortgage securities — through our securitized selection strategy — also boosted the Fund’s relative results during the Reporting Period. |
| Q | | Did the Fund’s duration and yield curve positioning strategy help or hurt its results during the Reporting Period? |
| A | | The combined effect of the Fund’s duration and yield curve positioning detracted from results during the Reporting Period. The Fund’s duration strategy is actively managed and constantly monitored in an effort to generate greater performance and reduced risk through volatile markets. We tactically adjusted the Fund’s duration position throughout the Reporting Period as market conditions shifted. However, the Fund’s tactical short U.S. and U.K. duration positions relative to the Barclays Index hurt, as yields were generally driven lower in both regions amidst mixed global economic data and elevated volatility in several emerging markets. In the U.S., the Federal Reserve (the “Fed”) maintained an accommodative monetary policy stance due to slack in the labor market, low inflation and a slowdown in the housing market. In the U.K., other factors driving yields lower were dovish inflation figures and the uncertainty of the Scottish independence vote. |
16
PORTFOLIO RESULTS
| Q | | How did the Fund use derivatives and similar instruments during the Reporting Period? |
| A | | We used derivatives and similar instruments for the efficient management of the Fund. These derivatives and similar instruments allowed us to manage interest rate, credit and currency risks more effectively by allowing us both to hedge and to apply active investment views with greater versatility and to afford greater risk management precision than we would otherwise be able to implement. |
| | During the Reporting Period, we used interest rate and bond exchange traded futures contracts to implement duration and country strategies within the Fund, especially in the U.S., Eurozone, U.K. and Japanese markets. Currency transactions were carried out using primarily over-the-counter (“OTC”) spot and forward foreign exchange contracts as well as by purchasing OTC options. Currency transactions were used as we sought both to enhance returns and to hedge the Fund’s portfolio against currency exchange rate fluctuations. Interest rate and credit default swaps were also used as cost-efficient instruments to help grant us greater precision and versatility in the management of active strategies. Forward sales contracts were used to implement currency transactions based on our active views and for hedging purposes. Written option contracts were used to implement active views within our top-down and bottom-up selection strategies and for hedging purposes. |
| Q | | Were there any notable changes in the Fund’s weightings during the Reporting Period? |
| A | | As mentioned earlier, we generally maintained a short duration stance relative to the Barclays Index throughout the Reporting Period, but tactically adjusted the Fund’s duration position as market conditions shifted. We increased the Fund’s weightings in government securities and investment grade corporate bonds and reduced the Fund’s relative exposure to commercial mortgage-backed securities, residential mortgage-backed securities, covered bonds and municipal bonds. (Covered bonds are debt securities backed by cash flows from mortgage loans or public sector loans.) We reduced the Fund’s position in cash. |
| | From a country perspective, we pared back overweighted positions in Spain and Italy, as we grew more cautious about the near-term outlook in Europe. We decreased the Fund’s relative exposure to the U.S. during the Reporting Period. |
| Q | | How was the Fund positioned relative to its benchmark index at the end of September 2014? |
| A | | At the end of September 2014, as measured by contribution to duration, the Fund had a modestly overweighted allocation relative to the Barclays Index in investment grade corporate bonds. The Fund had an underweighted exposure relative to the Barclays Index in government securities and more modestly underweighted allocations to quasi-government securities, emerging markets debt and collateralized securities, including commercial mortgage-backed securities, residential mortgage-backed securities, asset-backed securities and covered bonds. |
| | From a country perspective, as measured by contribution to duration, the Fund was rather neutral relative to the benchmark in the Eurozone overall, but within the region, was modestly underweight France and overweight Germany, Spain and Italy at the end of the Reporting Period. The Fund was underweight relative to the Barclays Index in Japan, the U.K. and the U.S. The Fund had a shorter duration than the Barclays Index at the end of the Reporting Period. |
17
FUND BASICS
Global Income Fund
as of September 30, 2014
| | | | | | | | | | | | | | | | | | |
| | PERFORMANCE REVIEW | |
| | | April 1, 2014–
September 30, 2014 | | Fund Total
Return
(based on NAV)1 | | | Barclays Global
Aggregate Bond
(Gross, USD,
Hedged) Index2 | | | 30-Day
Standardized
Subsidized Yield3 | | | 30-Day
Standardized
Unsubsidized Yield3 | |
| | Class A | | | 2.95 | % | | | 3.17 | % | | | 0.74 | % | | | 0.55 | % |
| | Class B | | | 2.57 | | | | 3.17 | | | | 0.03 | | | | -0.17 | |
| | Class C | | | 2.58 | | | | 3.17 | | | | 0.03 | | | | -0.17 | |
| | Institutional | | | 3.13 | | | | 3.17 | | | | 1.11 | | | | 0.90 | |
| | Service | | | 2.87 | | | | 3.17 | | | | 0.60 | | | | 0.40 | |
| | | Class IR | | | 3.16 | | | | 3.17 | | | | 1.01 | | | | 0.81 | |
| | 1 | | The net asset value (“NAV”) represents the net assets of the class of the Fund (ex-dividend) divided by the total number of shares of the class outstanding. The Fund’s performance reflects the reinvestment of dividends and other distributions. The Fund’s performance does not reflect the deduction of any applicable sales charges. |
| | 2 | | The Barclays Global Aggregate Bond (Gross, USD, Hedged) Index, an unmanaged index, provides a broad based measure of the global investment-grade fixed-rate debt markets and covers the most liquid portion of the global investment grade fixed-rate bond market, including government, credit and collateralized securities. The Index figures do not include any deduction for fees, expenses or taxes. It is not possible to invest directly in an index. |
| | 3 | | The method of calculation of the 30-Day Standardized Subsidized Yield is mandated by the Securities and Exchange Commission and is determined by dividing the net investment income per share earned during the last 30 days of the period by the maximum public offering price (“POP”) per share on the last day of the period. This number is then annualized. The 30-Day Standardized Subsidized Yield reflects fee waivers and/or expense reimbursements recorded by the Fund during the period. Without waivers and/or reimbursements, yields would be reduced. This yield does not necessarily reflect income actually earned and distributed by the Fund and, therefore, may not be correlated with the dividends or other distributions paid to shareholders. The 30-Day Standardized Unsubsidized Yield does not adjust for any fee waivers and/or expense reimbursements in effect. If the Fund does not incur any fee waivers and/or expense reimbursements during the period, the 30-Day Standardized Subsidized Yield and 30-Day Standardized Unsubsidized Yield will be identical. |
The returns set forth in the table above represent past performance. Past performance does not guarantee future results. The Fund’s investment return and principal value will fluctuate so that an investor’s shares, when redeemed, may be worth more or less than their original cost. Current performance may be lower or higher than the performance quoted above. Please visit our web site at www.GSAMFUNDS.com to obtain the most recent month-end returns. Performance reflects applicable fee waivers and/or expense limitations in effect during the periods shown. In their absence, performance would be reduced. Returns do not reflect the deduction of taxes that a shareholder would pay on Fund distributions or the redemption of Fund shares.
18
FUND BASICS
| | | | | | | | | | | | | | | | | | |
| | STANDARDIZED TOTAL RETURNS4 |
| | | For the period ended 9/30/14 | | One Year | | | Five Years | | | Ten Years | | | Since Inception | | Inception Date |
| | Class A | | | 2.21 | % | | | 3.70 | % | | | 4.09 | % | | 5.50% | | 8/2/91 |
| | Class B | | | 0.11 | | | | 3.33 | | | | 3.85 | | | 4.97 | | 5/1/96 |
| | Class C | | | 4.34 | | | | 3.74 | | | | 3.72 | | | 4.17 | | 8/15/97 |
| | Institutional | | | 6.52 | | | | 4.87 | | | | 4.86 | | | 5.96 | | 8/1/95 |
| | Service | | | 5.99 | | | | 4.33 | | | | 4.34 | | | 4.88 | | 3/12/97 |
| | | Class IR | | | 6.43 | | | | N/A | | | | N/A | | | 4.21 | | 7/30/10 |
| | 4 | | The Standardized Total Returns are average annual total returns as of the most recent calendar quarter-end. They assume reinvestment of all distributions at NAV. These returns reflect a maximum initial sales charge of 3.75% for Class A Shares, the assumed contingent deferred sales charge for Class B Shares (5% maximum declining to 0% after six years) and the assumed contingent deferred sales charge for Class C Shares (1% if redeemed within 12 months of purchase). Class B Shares convert automatically to Class A Shares on or about the fifteenth day of the last month of the calendar quarter that is eight years after purchase. Returns for Class B Shares for the period after conversion reflect the performance of Class A Shares. Prior to July 29, 2009, the maximum initial sales charge applicable to Class A Shares was 4.5%, which is not reflected in the average annual total return figures shown. Because Institutional, Service and Class IR Shares do not involve a sales charge, such a charge is not applied to their Standardized Total Returns. The Fund’s Class B Shares are no longer available for purchase by new or existing shareholders (although current Class B shareholders may continue to reinvest income and capital gains distributions into Class B Shares, and Class B shareholders may continue to exchange their shares for Class B Shares of certain other Goldman Sachs Funds). |
The returns set forth in the table above represent past performance. Past performance does not guarantee future results. The Fund’s investment return and principal value will fluctuate so that an investor’s shares, when redeemed, may be worth more or less than their original cost. Current performance may be lower or higher than the performance quoted above. Please visit our web site at www.GSAMFUNDS.com to obtain the most recent month-end returns. Performance reflects applicable fee waivers and/or expense limitations in effect during the periods shown. In their absence, performance would be reduced. Returns do not reflect the deduction of taxes that a shareholder would pay on Fund distributions or the redemption of Fund shares.
| | | | | | | | | | |
| | EXPENSE RATIOS5 | |
| | | | | Net Expense Ratio (Current) | | | Gross Expense Ratio (Before Waivers) | |
| | Class A | | | 1.04 | % | | | 1.20 | % |
| | Class B | | | 1.79 | | | | 1.95 | |
| | Class C | | | 1.79 | | | | 1.95 | |
| | Institutional | | | 0.70 | | | | 0.86 | |
| | Service | | | 1.20 | | | | 1.35 | |
| | | Class IR | | | 0.79 | | | | 0.95 | |
| | 5 | | The expense ratios of the Fund, both current (net of applicable fee waivers and/or expense limitations) and before waivers (gross of applicable fee waivers and/or expense limitations) are as set forth above according to the most recent publicly available Prospectus for the Fund and may differ from the expense ratios disclosed in the Financial Highlights in this report. Pursuant to a contractual arrangement, the Fund’s waivers and/or expense limitations will remain in place through at least July 29, 2015, and prior to such date the Investment Adviser may not terminate the arrangements without the approval of the Fund’s Board of Trustees. If these arrangements are discontinued in the future, the expense ratios may change without shareholder approval. |
19
FUND BASICS
| | | | | | | | | | |
| | CURRENCY ALLOCATION6 | |
| | | | | Percentage of Net Assets | |
| | | | | as of 9/30/14 | | | as of 3/31/14 | |
| | U.S. Dollar7 | | | 47.5 | % | | | 48.7 | % |
| | Euro | | | 33.0 | | | | 28.3 | |
| | Japanese Yen | | | 6.8 | | | | 11.6 | |
| | British Pound | | | 5.0 | | | | 4.7 | |
| | Canadian Dollar | | | 3.1 | | | | 2.8 | |
| | Mexican Peso | | | 1.5 | | | | 1.0 | |
| | South Korean Won | | | 0.9 | | | | 0.8 | |
| | Australian Dollar | | | 0.6 | | | | 0.6 | |
| | South African Rand | | | 0.5 | | | | 0.5 | |
| | Czech Koruna | | | 0.1 | | | | 0.1 | |
| | Polish Zloty | | | 0.1 | | | | 0.0 | |
| | Danish Krone | | | 0.0 | | | | 0.6 | |
| | | Swedish Krona | | | 0.0 | | | | 0.9 | |
| | 6 | | The percentage shown for each currency reflects the value of investments in that category as a percentage of net assets. Figures in the table may not sum to 100% due to the exclusion of other assets and liabilities. The table depicts the Fund’s investments but may not represent the Fund’s market exposure due to the exclusion of certain derivatives, if any, as listed in the Additional Investment Information section of the Schedule of Investments. |
| | 7 | | These figures represent the value excluding short-term obligations. If short-term obligations had been included, the percentages for 9/30/14 and 3/31/14 would have been 48.4% and 55.9%, respectively. |
20
PORTFOLIO RESULTS
Goldman Sachs Strategic Income Fund
Investment Objective
The Fund seeks total return comprised of income and capital appreciation.
Portfolio Management Discussion and Analysis
Below, the Goldman Sachs U.S. Fixed Income Investment Management Team discusses the Goldman Sachs Strategic Income Fund’s (the “Fund”) performance and positioning for the six-month period ended September 30, 2014 (the “Reporting Period”).
| Q | | How did the Fund perform during the Reporting Period? |
| A | | During the Reporting Period, the Fund’s Class A, C, Institutional, IR and R Shares generated cumulative total returns, without sales charges, of 0.58%, 0.20%, 0.75%, 0.70% and 0.45%, respectively. These returns compare to the 0.13% cumulative total return of the Fund’s benchmark, the Bank of America Merrill Lynch U.S. Dollar Three-Month LIBOR Constant Maturity Index (the “LIBOR Index”), during the same period. |
| | We note that the Fund’s benchmark being the LIBOR Index is a means of emphasizing that the Fund has an unconstrained strategy. That said, this Fund employs a benchmark agnostic strategy and thus comparisons to a benchmark index are not particularly relevant. |
| Q | | What key factors were responsible for the Fund’s performance during the Reporting Period? |
| A | | Within our top-down strategies, our currency, cross-sector and country strategies contributed positively to Fund performance. Within our currency strategy, the Fund benefited most from an overweighted position in the U.S. dollar, primarily against emerging market currencies which experienced volatility toward the end of the Reporting Period on slow global economic growth and increasing monetary policy divergence among central banks. Our cross-sector strategy is one in which we invest Fund assets based on a discipline of valuing each fixed income sector in the context of all investment opportunities within the Fund’s universe. Within our country strategy, an overweight to European peripheral nations versus Germany proved beneficial, as market expectations for easy monetary policy from the European Central Bank (“ECB”) encouraged yield hunting activity in the periphery nations’ markets. |
| | Detracting from the Fund’s performance was our duration strategy and individual issue selection within the emerging markets debt and government/swaps sectors. These strategies reflect any active views we take on these particular sectors. Duration is a measure of the Fund’s sensitivity to changes in interest rates. |
| Q | | Which fixed income market sectors most significantly affected Fund performance? |
| A | | The Fund’s sizable exposure to high yield corporate bonds and its modest exposure to agency mortgage-backed securities contributed positively to its performance. |
| | Conversely, individual issue selection within the emerging markets debt sector detracted from performance, primarily as a result of the Fund’s positioning in local Brazilian debt. Issue selection within the government/swaps sector also detracted from performance, driven mainly by a steepening position the Fund held on the U.K. swap yield curve. (A steepening position is a Fund stance based on the belief that the differential between longer-term yields and shorter-term yields would widen. Yield curve represents a spectrum of maturities.) |
| Q | | Did the Fund’s duration and yield curve positioning strategy help or hurt its results during the Reporting Period? |
| A | | The combined effect of the Fund’s tactical duration and yield curve positioning detracted from results during the Reporting Period. The Fund maintained a short duration on the U.S. Treasury yield curve. Such positioning hurt as rates declined during the Reporting Period while the Fund was positioned in anticipation of rising rates. The decline in rates came in part as a result of mixed economic growth data globally as well as on geopolitical tensions in Ukraine and the Middle East. The 10-year U.S. Treasury yield ended the Reporting |
21
PORTFOLIO RESULTS
| | Period approximately 23 basis points lower at 2.49%. (A basis point is 1/100th of a percentage point.) |
| Q | | How did the Fund use derivatives and similar instruments during the Reporting Period? |
| A | | We used derivatives and similar instruments for the efficient management of the Fund. These derivatives and similar instruments allowed us to manage interest rate, credit and currency risks more effectively by allowing us both to hedge and to apply active investment views with greater versatility and to afford greater risk management precision than we would otherwise be able to implement. |
| | During the Reporting Period, we used interest rate and bond exchange traded futures contracts to implement duration and country strategies within the Fund, especially in the U.S., Eurozone and Japanese markets. Currency transactions were carried out using primarily over-the-counter (“OTC”) spot and forward foreign exchange contracts as well as by purchasing OTC options. Currency transactions were used as we sought both to enhance returns and to hedge the Fund’s portfolio against currency exchange rate fluctuations. Also, we used written options contracts and swaptions (or options on interest rate swap contracts) to express an outright term structure view and manage volatility (term structure, most often depicted as a yield curve, refers to the term structure of interest rates, which is the relationship between the yield to maturity and the time to maturity for pure discount bonds); credit default swaps to manage exposure to fluctuations in credit spreads (or the differential in yields between Treasury securities and non-Treasury securities that are identical in all respects except for quality rating); and interest rate swaps to manage exposure to fluctuations in interest rates. We used total return swaps to manage curve exposure across various strategies within the Fund. Our currency strategy used forward sales contracts to implement long and short views within the strategy. |
| Q | | Were there any notable changes in the Fund’s weightings during the Reporting Period? |
| A | | The Fund is a broadly diversified, multi-sector portfolio designed to provide total return opportunities from across the fixed income spectrum, including government, securitized, corporate credit and emerging market fixed income sectors. The Fund’s overall positioning remained fairly consistent through the Reporting Period, with the major themes being short duration and an emphasis on growth-sensitive assets and interest rate volatility. That said, global monetary policy divergence, geopolitical risk surrounding Russia and the |
| | Middle East and the sell-off in high yield during the third quarter of 2014 drove the Fund’s prudent reduced risk positioning with more moderate exposures to high yield corporate bond and interest rate volatility for the majority of the Reporting Period. More specifically, the Fund had held a sizable exposure to high yield corporate bonds, which we pared back on strong performance in the second quarter of 2014. We subsequently added back to that exposure following spread, or yield differential, widening that occurred as a result of heightened geopolitical risk and exchange-traded fund outflows late in the third calendar quarter. |
| Q | | How was the Fund positioned at the end of September 2014? |
| A | | At the end of September 2014, the Fund had the majority of its total net assets invested in U.S. government securities, followed at some distance by quasi-government securities, collateralized loan obligations, agency and non-agency mortgage-backed securities, high yield corporate bonds and emerging markets debt. The Fund also maintained exposure at the end of the Reporting Period to commercial mortgage-backed securities, municipal bonds, corporate bank loans, investment grade corporate bonds, asset-backed securities and covered bonds. (Covered bonds are debt securities backed by cash flows from mortgage loans or public sector loans.) The Fund also had a sizable position in cash at the end of the Reporting Period. |
| | The Fund’s largest duration positions at the end of the Reporting Period were its short duration positions in the U.S. and the U.K. The Fund had more modest short duration positions in Japan and Europe and a modestly long duration position in Canada. The Fund had a short duration overall relative to the LIBOR Index at the end of the Reporting Period. |
| | From a currency perspective, the Fund maintained long currency positions in the U.S. dollar and, to a significantly more modest degree, in the Indian rupee, the Australian dollar, the Norwegian krona, the Japanese yen, the Polish zloty, the Swedish krona and the Mexican peso. The Fund was most short the Swiss franc, the Chinese renminbi, the Singapore dollar, the South Korean won, the Turkish lira, the euro, the New Zealand dollar and the British pound at the end of the Reporting Period. |
22
FUND BASICS
Strategic Income Fund
as of September 30, 2014
| | | | | | | | | | | | | | | | | | |
| | PERFORMANCE REVIEW | |
| | | April 1, 2014–
September 30, 2014 | | Fund Total
Return
(based on NAV)1 | | | Bank of America
Merrill Lynch
U.S. Dollar
Three-Month
LIBOR Constant
Maturity Index2 | | | 30-Day
Standardized
Subsidized Yield3 | | | 30-Day
Standardized
Unsubsidized Yield3 | |
| | Class A | | | 0.58 | % | | | 0.13 | % | | | 1.82 | % | | | 1.82 | % |
| | Class C | | | 0.20 | | | | 0.13 | | | | 1.15 | | | | 1.15 | |
| | Institutional | | | 0.75 | | | | 0.13 | | | | 2.23 | | | | 2.23 | |
| | Class IR | | | 0.70 | | | | 0.13 | | | | 2.14 | | | | 2.14 | |
| | | Class R | | | 0.45 | | | | 0.13 | | | | 1.65 | | | | 1.65 | |
| | 1 | | The net asset value (NAV) represents the net assets of the class of the Fund (ex-dividend) divided by the total number of shares of the class outstanding. The Fund’s performance reflects the reinvestment of dividends and other distributions. The Fund’s performance does not reflect the deduction of any applicable sales charges. |
| | 2 | | The Bank of America Merrill Lynch U.S. Dollar Three-Month LIBOR Constant Maturity Index tracks the performance of a synthetic asset paying Libor to a stated maturity. The index is based on the assumed purchase at par of a synthetic instrument having exactly its stated maturity and with a coupon equal to that day’s fixing rate. That issue is assumed to be sold the following business day (priced at a yield equal to the current day fixing rate) and rolled into a new instrument. |
| | 3 | | The method of calculation of the 30-Day Standardized Subsidized Yield is mandated by the Securities and Exchange Commission and is determined by dividing the net investment income per share earned during the last 30 days of the period by the maximum public offering price (“POP”) per share on the last day of the period. This number is then annualized. The 30-Day Standardized Subsidized Yield reflects fee waivers and/or expense reimbursements recorded by the Fund during the period. Without waivers and/or reimbursements, yields would be reduced. This yield does not necessarily reflect income actually earned and distributed by the Fund and, therefore, may not be correlated with the dividends or other distributions paid to shareholders. The 30-Day Standardized Unsubsidized Yield does not adjust for any fee waivers and/or expense reimbursements in effect. If the Fund does not incur any fee waivers and/or expense reimbursements during the period, the 30-Day Standardized Subsidized Yield and 30-Day Standardized Unsubsidized Yield will be identical. |
The returns set forth in the table above represent past performance. Past performance does not guarantee future results. The Fund’s investment return and principal value will fluctuate so that an investor’s shares, when redeemed, may be worth more or less than their original cost. Current performance may be lower or higher than the performance quoted above. Please visit our web site at www.GSAMFUNDS.com to obtain the most recent month-end returns. Performance reflects applicable fee waivers and/or expense limitations in effect during the periods shown. In their absence, performance would be reduced. Returns do not reflect the deduction of taxes that a shareholder would pay on Fund distributions or the redemption of Fund shares.
23
FUND BASICS
| | | | | | | | | | | | |
| | STANDARDIZED TOTAL RETURNS4 |
| | | For the period ended 9/30/14 | | One Year | | | Since Inception | | | Inception Date |
| | Class A | | | -0.43 | % | | | 3.59 | % | | 6/30/10 |
| | Class C | | | 1.67 | | | | 3.74 | | | 6/30/10 |
| | Institutional | | | 3.81 | | | | 4.87 | | | 6/30/10 |
| | Class IR | | | 3.72 | | | | 4.76 | | | 6/30/10 |
| | | Class R | | | 3.21 | | | | 4.25 | | | 6/30/10 |
| | 4 | | The Standardized Total Returns are average annual total returns as of the most recent calendar quarter-end. They assume reinvestment of all distributions at NAV. These returns reflect a maximum initial sales charge of 3.75% for Class A Shares and the assumed contingent deferred sales charge for Class C Shares (1% if redeemed within 12 months of purchase). Because Institutional, Class IR and Class R Shares do not involve a sales charge, such a charge is not applied to their Standardized Total Returns. |
The returns set forth in the table above represent past performance. Past performance does not guarantee future results. The Fund’s investment return and principal value will fluctuate so that an investor’s shares, when redeemed, may be worth more or less than their original cost. Current performance may be lower or higher than the performance quoted above. Please visit our web site at www.GSAMFUNDS.com to obtain the most recent month-end returns. Performance reflect applicable fee waivers and/or expense limitations in effect during the periods shown. In their absence, performance would be reduced. Returns do not reflect the deduction of taxes that a shareholder would pay on Fund distributions or the redemption of Fund shares.
| | | | | | | | | | |
| | EXPENSE RATIOS5 | |
| | | | | Net Expense Ratio (Current) | | | Gross Expense Ratio (Before Waivers) | |
| | Class A | | | 0.91 | % | | | 0.91 | % |
| | Class C | | | 1.66 | | | | 1.66 | |
| | Institutional | | | 0.57 | | | | 0.57 | |
| | Class IR | | | 0.66 | | | | 0.66 | |
| | | Class R | | | 1.16 | | | | 1.16 | |
| | 5 | | The expense ratios of the Fund, both current (net of applicable fee waivers and/or expense limitations) and before waivers (gross of applicable fee waivers and/or expense limitations) are as set forth above according to the most recent publicly available Prospectus for the Fund and may differ from the expense ratios disclosed in the Financial Highlights in this report. |
24
FUND BASICS
|
| SECTOR ALLOCATIONS6 |
| Percentage of Net Assets |
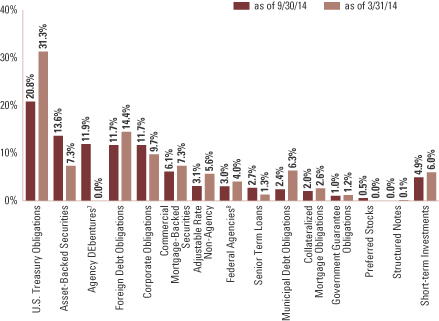
| | 6 | | The percentage shown for each investment category reflects the value of investments in that category as a percentage of net assets. Short-term investments represent repurchase agreements. Figures in the graph may not sum to 100% due to the exclusion of other assets and liabilities. The graph depicts the Fund’s investments but may not represent the Fund’s market exposure due to the exclusion of certain derivatives, if any, as listed in the Additional Investment Information section of the Schedule of Investments. |
| | 7 | | “Federal Agencies” are mortgage-backed securities guaranteed by the Government National Mortgage Association (“GNMA”), Federal National Mortgage Association and Federal Home Loan Mortgage Corp. GNMA instruments are backed by the full faith and credit of the U.S. Government. |
25
PORTFOLIO RESULTS
Goldman Sachs World Bond Fund
Investment Objective
The Fund seeks total return, emphasizing current income, and, to a lesser extent, capital appreciation.
Portfolio Management Discussion and Analysis
Below, the Goldman Sachs Global Fixed Income Investment Management Team discusses the Goldman Sachs World Bond Fund’s (the “Fund”) performance and positioning for the six-month period ended September 30, 2014 (the “Reporting Period”).
| Q | | How did the Fund perform during the Reporting Period? |
| A | | During the Reporting Period, the Fund’s Class A, C, Institutional, IR and R Shares generated cumulative total returns, without sales charges, of -0.72%, -1.20%, -0.65%, -0.70% and -0.96%, respectively. These returns compare to the -1.00% cumulative total return of the Fund’s benchmark, the Barclays Global Sovereign Fiscal Strength (Gross, USD, Unhedged) Index (the “Barclays Index”), during the same time period. |
| Q | | What key factors were responsible for the Fund’s performance during the Reporting Period? |
| A | | Primary contributors to the Fund’s performance were our currency and country strategies. Within our currency strategy, positioning in the Swiss franc, New Zealand dollar and Australian dollar contributed the most. Within our country strategy, an overweighted exposure to European rates relative to U.S. rates contributed the most. Overall, the Fund’s favoring of the European peripheral nations versus the core European countries also proved to be beneficial. |
| | Our duration strategy detracted from the Fund’s results. Duration is a measure of the Fund’s sensitivity to changes in interest rates. Individual issue selection overall also detracted from results. |
| Q | | Which fixed income market sectors most significantly affected Fund performance? |
| A | | Individual issue selection within the emerging markets debt and government/swaps sectors detracted from the Fund’s results during the Reporting Period. Within the emerging markets debt sector, selection of local debt securities was most challenged, particularly in South Korea, Romania and Hungary. In the government/swaps sector, weak relative performance can be attributed to exposure to the short-term segment of the U.K. yield curve. |
| Q | | Did the Fund’s duration and yield curve positioning strategy help or hurt its results during the Reporting Period? |
| A | | The combined effect of the Fund’s duration and yield curve positioning detracted from results during the Reporting Period, most especially during May 2014 and August 2014 when U.S. interest rates declined most significantly. Overall, the Fund maintained a shorter duration than the Barclays Index during the Reporting Period, although the Fund’s duration strategy is actively managed and constantly monitored in an effort to generate greater performance and reduced risk through volatile markets. |
| | Within the strategy, the Fund’s short U.S. duration position relative to the Barclays Index hurt most. Its exposure to the intermediate-to-longer-term end of the U.S. yield curve together with its U.K. and Japan yield curve positioning also detracted from results. |
| Q | | How did the Fund use derivatives and similar instruments during the Reporting Period? |
| A | | We used derivatives and similar instruments for the efficient management of the Fund. These derivatives and similar instruments allowed us to manage interest rate and currency risks more effectively by allowing us both to hedge and to apply active investment views with greater versatility and to afford greater risk management precision than we would otherwise be able to implement. |
| | During the Reporting Period, we used interest rate and bond exchange traded futures contracts to implement duration and country strategies within the Fund, especially in the U.S., Eurozone, U.K. and Japanese markets. Currency transactions were carried out using primarily over-the-counter (“OTC”) spot and forward foreign exchange contracts. Currency |
26
PORTFOLIO RESULTS
| | transactions were used as we sought both to enhance returns and to hedge the Fund’s portfolio against currency exchange rate fluctuations. Interest rate swaps were also used as cost-efficient instruments to help grant us greater precision and versatility in the management of active strategies, especially our country strategy. |
| Q | | Were there any notable changes in the Fund’s weightings during the Reporting Period? |
| A | | We increased the Fund’s exposure to emerging markets debt from an underweighted position at the start of the Reporting Period to an overweighted position in June 2014 and then reduced the position slightly to a more modestly overweighted position by the end of the Reporting Period. We increased the Fund’s exposure to government securities during the Reporting Period but remained underweighted to the sector throughout. In April 2014, we reduced the Fund’s exposure to France to an underweighted position. In May 2014, we moved from a neutral position in the Indian rupee to an overweighted position and shifted from an overweight to an underweight in the Turkish lira. We changed the Fund’s exposure to the U.K. yield curve from an underweight to an overweight in June 2014. |
| Q | | How was the Fund positioned relative to its benchmark index at the end of September 2014? |
| A | | At the end of September 2014, the Fund had an underweighted allocation relative to the Barclays Index in U.S. Treasuries. To a more modest degree, the Fund also had an underweighted exposure relative to the Barclays Index in emerging markets debt. The Fund had a sizable position in cash at the end of the Reporting Period. The Fund had an underweight in foreign sovereign bonds in duration terms relative to the Barclays Index. |
| | From a country perspective, the Fund was overweight relative to the Barclays Index in Italy, Germany and Spain at the end of September 2014. The Fund was underweight relative to the Barclays Index in France, Japan and the emerging markets overall. The Fund was neutral to the Barclays Index in Australia, Canada, Denmark, Ireland, Norway, Sweden, the U.K. and the U.S. at the end of the Reporting Period. |
| | In terms of currencies, the Fund was underweight the Swiss franc and overweight the U.S. dollar compared to the Barclays Index at the end of the Reporting Period. The Fund was neutral to the remaining currency components of the Barclays Index at the end of September 2014. |
| | The Fund had a shorter duration than the Barclays Index at the end of the Reporting Period. |
27
FUND BASICS
World Bond Fund
as of September 30, 2014
| | | | | | | | | | | | | | | | | | |
| | PERFORMANCE REVIEW | |
| | | April 1, 2014–
September 30, 2014 | | Fund Total
Return
(based on NAV)1 | | | Barclays Global
Sovereign Fiscal
Strength Weighted
(Gross, USD,
Unhedged) Index2 | | | 30-Day
Standardized
Subsidized Yield3 | | | 30-Day
Standardized
Unsubsidized Yield3 | |
| | Class A | | | -0.72 | % | | | -1.00 | % | | | 1.26 | % | | | -5.29 | % |
| | Class C | | | -1.20 | | | | -1.00 | | | | 0.56 | | | | -6.21 | |
| | Institutional | | | -0.65 | | | | -1.00 | | | | 1.66 | | | | -5.17 | |
| | Class IR | | | -0.70 | | | | -1.00 | | | | 1.52 | | | | -5.30 | |
| | | Class R | | | -0.96 | | | | -1.00 | | | | 1.07 | | | | -5.75 | |
| | 1 | | The net asset value (“NAV”) represents the net assets of the Fund (ex-dividend) divided by the total number of shares outstanding. The Fund’s performance assumes the reinvestment of dividends and other distributions. The Fund’s performance does not reflect the deduction of any applicable sales charges. |
| | 2 | | The Barclays Global Sovereign Fiscal Strength Weighted (Gross, USD, Unhedged) Index family is a new rules-based alternative weight benchmark offering that uses fundamental measures of fiscal sustainability to depart from market capitalization country weights in existing bond indices. It is not possible to invest directly in an unmanaged index. |
| | 3 | | The method of calculation of the 30-Day Standardized Subsidized Yield is mandated by the Securities and Exchange Commission and is determined by dividing the net investment income per share earned during the last 30 days of the period by the maximum public offering price (“POP”) per share on the last day of the period. This number is then annualized. The 30-Day Standardized Subsidized Yield reflects fee waivers and/or expense reimbursements recorded by the Fund during the period. Without waivers and/or reimbursements, yields would be reduced. This yield does not necessarily reflect income actually earned and distributed by the Fund and, therefore, may not be correlated with the dividends or other distributions paid to shareholders. The 30-Day Standardized Unsubsidized Yield does not adjust for any fee waivers and/or expense reimbursements in effect. If the Fund does not incur any fee waivers and/or expense reimbursements during the period, the 30-Day Standardized Subsidized Yield and 30-Day Standardized Unsubsidized Yield will be identical. |
| | | | | | | | | | | | |
| | STANDARDIZED TOTAL RETURNS4 |
| | | For the period ended 9/30/14 | | One Year | | | Since Inception | | | Inception Date |
| | Class A | | | -3.07 | % | | | -3.04 | % | | 11/30/12 |
| | Class C | | | -1.02 | | | | -1.73 | | | 11/30/12 |
| | Institutional | | | 1.08 | | | | -0.72 | | | 11/30/12 |
| | Class IR | | | 1.01 | | | | -0.76 | | | 11/30/12 |
| | | Class R | | | 0.47 | | | | -1.33 | | | 11/30/12 |
| | 4 | | The Standardized Total Returns are average annual total returns as of the most recent calendar quarter-end. They assume reinvestment of all distributions at NAV. These returns reflect a maximum initial sales charge of 3.75% for Class A Shares and the assumed contingent deferred sales charge for Class C Shares (1% if redeemed within 12 months of purchase). Because Institutional, Class IR and Class R Shares do not involve a sales charge, such a charge is not applied to their Standardized Total Returns. |
The returns set forth in the tables above represent past performance. Past performance does not guarantee future results. The Fund’s investment return and principal value will fluctuate so that an investor’s shares, when redeemed, may be worth more or less than their original cost. Current performance may be lower or higher than the performance quoted above. Please visit our web site at www.GSAMFUNDS.com to obtain the most recent month-end returns. Performance reflects applicable fee waivers and/or expense limitations in effect during the periods shown. In their absence, performance would be reduced. Returns do not reflect the deduction of taxes that a shareholder would pay on Fund distributions or the redemption of Fund shares.
28
FUND BASICS
| | | | | | | | | | |
| | EXPENSE RATIOS5 | |
| | | | | Net Expense Ratio (Current) | | | Gross Expense Ratio (Before Waivers) | |
| | Class A | | | 1.04 | % | | | 4.99 | % |
| | Class C | | | 1.71 | | | | 5.64 | |
| | Institutional | | | 0.71 | | | | 4.55 | |
| | Class IR | | | 0.77 | | | | 4.61 | |
| | | Class R | | | 1.30 | | | | 5.14 | |
| | 5 | | The expense ratios of the Fund, both current (net of applicable fee waivers and/or expense limitations) and before waivers (gross of applicable fee waivers and/or expense limitations) are as set forth above according to the most recent publicly available Prospectus for the Fund and may differ from the expense ratios disclosed in the Financial Highlights in this report. Pursuant to a contractual arrangement, the Fund’s waivers and/or expense limitations will remain in place through at least July 29, 2015, and prior to such date the Investment Adviser may not terminate the arrangements without the approval of the Fund’s Board of Trustees. If these arrangements are discontinued in the future, the expense ratios may change without shareholder approval. |
| | | | | | | | | | |
| | CURRENCY ALLOCATIONS6 | |
| | | | | Percentage of Net Assets | |
| | | | | as of 9/30/14 | | | as of 3/31/14 | |
| | Euro | | | 27.3 | % | | | 32.2 | % |
| | U.S. Dollar7 | | | 24.8 | | | | 10.4 | |
| | Japanese Yen | | | 5.3 | | | | 3.0 | |
| | British Pound | | | 5.0 | | | | 5.3 | |
| | Mexican Peso | | | 4.5 | | | | 4.3 | |
| | Brazilian Real | | | 3.4 | | | | 3.4 | |
| | Russian Ruble | | | 2.8 | | | | 3.0 | |
| | Colombian Peso | | | 2.7 | | | | 3.5 | |
| | Australian Dollar | | | 2.5 | | | | 2.6 | |
| | Canadian Dollar | | | 2.2 | | | | 2.2 | |
| | | Other Currencies | | | 14.0 | | | | 13.4 | |
| | 6 | | The percentage shown for each currency reflects the value of investments in that category as a percentage of net assets. Figures in the table may not sum to 100% due to the exclusion of other assets and liabilities. The table depicts the Fund’s investments but may not represent the Fund’s market exposure due to the exclusion of certain derivatives, if any, as listed in the Additional Investment Information section of the Schedule of Investments. |
| | 7 | | These figures represent the value excluding short-term obligations. If short-term obligations had been included, the percentages for 9/30/14 and 3/31/14 would have been 28.1% and 26.2%, respectively. |
29
GOLDMAN SACHS BOND FUND
Schedule of Investments
September 30, 2014 (Unaudited)
| | | | | | | | | | | | | | |
Principal
Amount | | | Interest
Rate | | | Maturity
Date | | | Value | |
| | Corporate Obligations – 26.8% | |
| | Automotive – 0.4% | |
| Ford Motor Credit Co. LLC | |
| $ | 375,000 | | | | 5.000 | % | | | 05/15/18 | | | $ | 410,254 | |
| | 500,000 | | | | 5.875 | | | | 08/02/21 | | | | 574,583 | |
| | | | | | | | | | | | | | |
| | | | | | | | | | | | | 984,837 | |
| | |
| | Banks – 7.4% | |
| Abbey National Treasury Services PLC | |
| | 925,000 | | | | 4.000 | | | | 04/27/16 | | | | 966,592 | |
| American Express Co.(a)(b) | |
| | 500,000 | | | | 6.800 | | | | 09/01/66 | | | | 533,750 | |
| Australia & New Zealand Banking Group Ltd.(c) | |
| | 350,000 | | | | 4.500 | | | | 03/19/24 | | | | 353,009 | |
| Banco Nacional de Costa Rica(c) | |
| | 260,000 | | | | 6.250 | | | | 11/01/23 | | | | 260,650 | |
| Bank of America Corp. | |
| | 625,000 | | | | 4.125 | | | | 01/22/24 | | | | 634,947 | |
| | 575,000 | | | | 4.000 | | | | 04/01/24 | | | | 580,499 | |
| | 300,000 | | | | 6.250 | (a)(b) | | | 09/29/49 | | | | 297,000 | |
| Barclays Bank PLC | |
| | 425,000 | | | | 2.500 | | | | 02/20/19 | | | | 426,041 | |
| Citigroup, Inc. | |
| | 305,000 | | | | 6.125 | | | | 11/21/17 | | | | 343,502 | |
| | 325,000 | | | | 6.300 | (a)(b) | | | 05/15/49 | | | | 321,344 | |
| Compass Bank | |
| | 275,000 | | | | 1.850 | (b) | | | 09/29/17 | | | | 274,937 | |
| | 475,000 | | | | 5.500 | | | | 04/01/20 | | | | 519,094 | |
| Credit Agricole SA(a)(b)(c) | |
| | 225,000 | | | | 7.875 | | | | 01/29/49 | | | | 227,250 | |
| Credit Suisse AG(c) | |
| | 250,000 | | | | 6.500 | | | | 08/08/23 | | | | 271,909 | |
| Credit Suisse Group AG(a)(b)(c) | |
| | 300,000 | | | | 6.250 | | | | 12/11/49 | | | | 290,250 | |
| | 350,000 | | | | 7.500 | | | | 12/18/49 | | | | 367,920 | |
| Fifth Third Bancorp | |
| | 300,000 | | | | 3.625 | | | | 01/25/16 | | | | 310,928 | |
| HSBC Holdings PLC(a)(b) | |
| | 300,000 | | | | 6.375 | | | | 12/29/49 | | | | 298,837 | |
| ING Bank NV(a)(b) | |
| | 700,000 | | | | 4.125 | | | | 11/21/23 | | | | 712,201 | |
| Intesa Sanpaolo SPA | |
| | 475,000 | | | | 2.375 | | | | 01/13/17 | | | | 478,336 | |
| | 1,150,000 | | | | 3.875 | | | | 01/16/18 | | | | 1,196,658 | |
| | 325,000 | | | | 5.017 | (c) | | | 06/26/24 | | | | 315,700 | |
| Lloyds Bank PLC | |
| | 350,000 | | | | 2.300 | | | | 11/27/18 | | | | 351,372 | |
| Macquarie Bank Ltd.(c) | |
| | 600,000 | | | | 2.600 | | | | 06/24/19 | | | | 599,513 | |
| MUFG Capital Finance 1 Ltd.(a)(b) | |
| | 450,000 | | | | 6.346 | | | | 07/29/49 | | | | 479,250 | |
| Northern Rock Asset Management PLC(c) | |
| | 1,700,000 | | | | 5.625 | | | | 06/22/17 | | | | 1,887,334 | |
| PNC Preferred Funding Trust II(a)(b)(c) | |
| | 800,000 | | | | 1.457 | | | | 03/29/49 | | | | 769,000 | |
| Regions Financial Corp. | |
| | 325,000 | | | | 5.750 | | | | 06/15/15 | | | | 335,358 | |
| Royal Bank of Scotland PLC | |
| | 675,000 | | | | 2.550 | | | | 09/18/15 | | | | 684,770 | |
| | |
| | | | | | | | | | | | | | |
Principal
Amount | | | Interest
Rate | | | Maturity
Date | | | Value | |
| | Corporate Obligations – (continued) | |
| | Banks – (continued) | |
| Royal Bank of Scotland PLC – (continued) | |
| $ | 300,000 | | | | 9.500 | % (a)(b) | | | 03/16/22 | | | $ | 342,000 | |
| Santander Bank NA | |
| | 400,000 | | | | 8.750 | | | | 05/30/18 | | | | 481,522 | |
| Santander Holdings USA, Inc. | |
| | 270,000 | | | | 4.625 | | | | 04/19/16 | | | | 283,829 | |
| Sumitomo Mitsui Financial Group, Inc.(c) | |
| | 725,000 | | | | 4.436 | | | | 04/02/24 | | | | 742,668 | |
| | | | | | | | | | | | | | |
| | | | | | | | | | | | | 16,937,970 | |
| | |
| | Brokerage – 0.5% | |
| Morgan Stanley, Inc. | |
| | 575,000 | | | | 6.250 | | | | 08/28/17 | | | | 644,429 | |
| | 525,000 | | | | 6.625 | | | | 04/01/18 | | | | 600,360 | |
| | | | | | | | | | | | | | |
| | | | | | | | | | | | | 1,244,789 | |
| | |
| | Chemicals – 0.5% | |
| Ashland, Inc.(b) | |
| | 225,000 | | | | 4.750 | | | | 08/15/22 | | | | 219,375 | |
| Ecolab, Inc. | |
| | 425,000 | | | | 3.000 | | | | 12/08/16 | | | | 440,829 | |
| | 200,000 | | | | 5.500 | | | | 12/08/41 | | | | 228,938 | |
| LyondellBasell Industries NV(b) | |
| | 300,000 | | | | 5.000 | | | | 04/15/19 | | | | 331,169 | |
| | | | | | | | | | | | | | |
| | | | | | | | | | | | | 1,220,311 | |
| | |
| | Consumer Cyclical Services(b) – 0.2% | |
| Equinix, Inc. | |
| | 450,000 | | | | 7.000 | | | | 07/15/21 | | | | 479,250 | |
| | |
| | Consumer Products – 0.3% | |
| Avon Products, Inc. | |
| | 725,000 | | | | 4.600 | | | | 03/15/20 | | | | 740,414 | |
| | |
| | Electric – 0.7% | |
| Arizona Public Service Co. | |
| | 375,000 | | | | 8.750 | | | | 03/01/19 | | | | 475,287 | |
| Consumers Energy Co.(b) | |
| | 850,000 | | | | 3.950 | | | | 05/15/43 | | | | 820,943 | |
| Puget Sound Energy, Inc.(a)(b) | |
| | 250,000 | | | | 6.974 | | | | 06/01/67 | | | | 261,875 | |
| | | | | | | | | | | | | | |
| | | | | | | | | | | | | 1,558,105 | |
| | |
| | Energy – 1.9% | |
| Anadarko Petroleum Corp. | |
| | 325,000 | | | | 6.450 | | | | 09/15/36 | | | | 395,468 | |
| Brazil Minas SPE via State of Minas Gerais | |
| | 420,000 | | | | 5.333 | | | | 02/15/28 | | | | 415,800 | |
| Nexen, Inc. | |
| | 265,000 | | | | 6.400 | | | | 05/15/37 | | | | 321,542 | |
| Pacific Rubiales Energy Corp.(b)(c) | |
| | 260,000 | | | | 5.375 | | | | 01/26/19 | | | | 261,950 | |
| Petrobras Global Finance BV | |
| | 430,000 | | | | 4.875 | | | | 03/17/20 | | | | 432,197 | |
| | 200,000 | | | | 6.250 | | | | 03/17/24 | | | | 209,060 | |
| Petroleos Mexicanos | |
| | 70,000 | | | | 5.500 | | | | 01/21/21 | | | | 76,661 | |
| | 240,000 | | | | 6.375 | (c) | | | 01/23/45 | | | | 271,392 | |
| | |
| | |
| 30 | | The accompanying notes are an integral part of these financial statements. |
GOLDMAN SACHS BOND FUND
| | | | | | | | | | | | | | |
Principal
Amount | | | Interest
Rate | | | Maturity
Date | | | Value | |
| | Corporate Obligations – (continued) | |
| | Energy – (continued) | |
| PTTEP Canada International Finance Ltd.(c) | |
| $ | 460,000 | | | | 5.692 | % | | | 04/05/21 | | | $ | 517,408 | |
| Transocean, Inc. | |
| | 625,000 | | | | 6.500 | | | | 11/15/20 | | | | 659,375 | |
| Transportadora de Gas Internacional SA ESP(b) | |
| | 330,000 | | | | 5.700 | | | | 03/20/22 | | | | 349,800 | |
| Weatherford International Ltd. | |
| | 400,000 | | | | 9.625 | | | | 03/01/19 | | | | 513,686 | |
| | | | | | | | | | | | | | |
| | | | | | | | | | | | | 4,424,339 | |
| | |
| | Food & Beverage – 1.3% | |
| Constellation Brands, Inc. | |
| | 50,000 | | | | 3.750 | | | | 05/01/21 | | | | 49,000 | |
| | 900,000 | | | | 6.000 | | | | 05/01/22 | | | | 981,000 | |
| Pernod-Ricard SA(c) | |
| | 525,000 | | | | 5.750 | | | | 04/07/21 | | | | 597,575 | |
| SABMiller Holdings, Inc.(c) | |
| | 200,000 | | | | 4.950 | | | | 01/15/42 | | | | 208,127 | |
| Suntory Holdings Ltd.(c) | |
| | 550,000 | | | | 2.550 | | | | 09/29/19 | | | | 549,286 | |
| Sysco Corp.(b) | |
| | 600,000 | | | | 3.500 | | | | 10/02/24 | | | | 601,559 | |
| | | | | | | | | | | | | | |
| | | | | | | | | | | | | 2,986,547 | |
| | |
| | Health Care – Services – 0.2% | |
| HCA, Inc. | |
| | 375,000 | | | | 7.500 | | | | 02/15/22 | | | | 422,813 | |
| | |
| | Home Construction – 0.7% | |
| D.R. Horton, Inc.(b) | |
| | 450,000 | | | | 4.375 | | | | 09/15/22 | | | | 429,750 | |
| MDC Holdings, Inc. | |
| | 500,000 | | | | 5.625 | | | | 02/01/20 | | | | 520,833 | |
| | 200,000 | | | | 5.500 | (b) | | | 01/15/24 | | | | 197,018 | |
| | 375,000 | | | | 6.000 | (b) | | | 01/15/43 | | | | 344,697 | |
| | | | | | | | | | | | | | |
| | | | | | | | | | | | | 1,492,298 | |
| | |
| | Life Insurance – 0.9% | |
| AIG Life Holdings, Inc. | |
| | 425,000 | | | | 8.500 | | | | 07/01/30 | | | | 558,875 | |
| Genworth Holdings, Inc. | |
| | 350,000 | | | | 7.625 | | | | 09/24/21 | | | | 424,708 | |
| Teachers Insurance & Annuity Association of America(c) | |
| | 420,000 | | | | 4.900 | | | | 09/15/44 | | | | 428,031 | |
| The Northwestern Mutual Life Insurance Co.(c) | |
| | 500,000 | | | | 6.063 | | | | 03/30/40 | | | | 619,201 | |
| | | | | | | | | | | | | | |
| | | | | | | | | | | | | 2,030,815 | |
| | |
| | Media – Cable – 1.6% | |
| CCO Holdings LLC/CCO Holdings Capital Corp.(b) | |
| | 450,000 | | | | 5.250 | | | | 09/30/22 | | | | 439,875 | |
| DIRECTV Holdings LLC/DIRECTV Financing Co., Inc. | |
| | 725,000 | | | | 3.800 | | | | 03/15/22 | | | | 738,741 | |
| Time Warner Cable, Inc. | |
| | 850,000 | | | | 7.300 | | | | 07/01/38 | | | | 1,148,355 | |
| | 375,000 | | | | 5.500 | (b) | | | 09/01/41 | | | | 419,793 | |
| | |
| | Corporate Obligations – (continued) | |
| | Media – Cable – 1.6% – (continued) | |
| Videotron Ltd. | |
| 825,000 | | | | 5.000 | | | | 07/15/22 | | | | 816,750 | |
| | | | | | | | | | | | | | |
| | | | | | | | | | | | | 3,563,514 | |
| | |
| | Media – Non Cable – 0.6% | |
| NBCUniversal Media LLC | |
| | 750,000 | | | | 4.375 | | | | 04/01/21 | | | | 816,096 | |
| Nielsen Finance LLC/Nielsen Finance Co.(b) | |
| | 525,000 | | | | 4.500 | | | | 10/01/20 | | | | 509,250 | |
| | | | | | | | | | | | | | |
| | | | | | | | | | | | | 1,325,346 | |
| | |
| | Metals & Mining – 0.6% | |
| CITIC Ltd. | |
| | 400,000 | | | | 6.800 | | | | 01/17/23 | | | | 460,371 | |
| Glencore Funding LLC(c) | |
| | 880,000 | | | | 2.700 | | | | 10/25/17 | | | | 894,683 | |
| | | | | | | | | | | | | | |
| | | | | | | | | | | | | 1,355,054 | |
| | |
| | Noncaptive – Financial – 0.4% | |
| GE Capital Trust I(a)(b) | |
| | 458,000 | | | | 6.375 | | | | 11/15/67 | | | | 498,075 | |
| General Electric Capital Corp. | |
| MXN | 1,000,000 | | | | 8.500 | | | | 04/06/18 | | | | 82,424 | |
| $ | 175,000 | | | | 5.875 | | | | 01/14/38 | | | | 210,484 | |
| | | | | | | | | | | | | | |
| | | | | | | | | | | | | 790,983 | |
| | |
| | Packaging – 0.4% | |
| Ball Corp. | |
| | 225,000 | | | | 5.000 | | | | 03/15/22 | | | | 225,563 | |
| Crown Americas LLC/Crown Americas Capital Corp. IV | |
| | 250,000 | | | | 4.500 | | | | 01/15/23 | | | | 236,250 | |
| Sealed Air Corp.(b)(c) | |
| | 400,000 | | | | 8.375 | | | | 09/15/21 | | | | 443,000 | |
| | | | | | | | | | | | | | |
| | | | | | | | | | | | | 904,813 | |
| | |
| | Pharmaceuticals(c) – 0.2% | |
| Forest Laboratories, Inc. | |
| | 425,000 | | | | 4.375 | | | | 02/01/19 | | | | 448,375 | |
| | |
| | Pipelines – 1.7% | |
| El Paso LLC | |
| | 500 | | | | 7.750 | | | | 01/15/32 | | | | 612 | |
| Enterprise Products Operating LLC(a)(b) | |
| | 775,000 | | | | 8.375 | | | | 08/01/66 | | | | 850,562 | |
| | 375,000 | | | | 7.034 | | | | 01/15/68 | | | | 423,750 | |
| Kinder Morgan, Inc.(b)(c) | |
| | 725,000 | | | | 5.000 | | | | 02/15/21 | | | | 755,813 | |
| Southern Star Central Gas Pipeline, Inc.(c) | |
| | 300,000 | | | | 6.000 | | | | 06/01/16 | | | | 317,742 | |
| TransCanada PipeLines Ltd.(a)(b) | |
| | 875,000 | | | | 6.350 | | | | 05/15/67 | | | | 892,500 | |
| Williams Partners LP(b) | |
| | 625,000 | | | | 3.900 | | | | 01/15/25 | | | | 615,648 | |
| | | | | | | | | | | | | | |
| | | | | | | | | | | | | 3,856,627 | |
| | |
| | Property/Casualty Insurance(b) – 0.2% | |
| American International Group, Inc. | |
| | 525,000 | | | | 4.500 | | | | 07/16/44 | | | | 520,316 | |
| | |
| | |
| The accompanying notes are an integral part of these financial statements. | | 31 |
GOLDMAN SACHS BOND FUND
Schedule of Investments (continued)
September 30, 2014 (Unaudited)
| | | | | | | | | | | | | | |
Principal
Amount | | | Interest
Rate | | | Maturity
Date | | | Value | |
| | Corporate Obligations – (continued) | |
| | Real Estate Investment Trust – 2.1% | |
| American Campus Communities Operating Partnership LP(b) | |
| $ | 800,000 | | | | 3.750 | % | | | 04/15/23 | | | $ | 794,347 | |
| DDR Corp. | |
| | 755,000 | | | | 7.500 | | | | 04/01/17 | | | | 858,247 | |
| ERP Operating LP(b) | |
| | 700,000 | | | | 4.500 | | | | 07/01/44 | | | | 693,696 | |
| HCP, Inc. | |
| | 525,000 | | | | 6.000 | | | | 01/30/17 | | | | 579,434 | |
| Healthcare Realty Trust, Inc. | |
| | 550,000 | | | | 6.500 | | | | 01/17/17 | | | | 609,477 | |
| Senior Housing Properties Trust(b) | |
| | 350,000 | | | | 3.250 | | | | 05/01/19 | | | | 352,374 | |
| Trust F/1401(c) | |
| | 300,000 | | | | 5.250 | | | | 12/15/24 | | | | 313,050 | |
| WEA Finance LLC/Westfield UK & Europe Finance PLC(b)(c) | |
| | 500,000 | | | | 3.750 | | | | 09/17/24 | | | | 498,643 | |
| | | | | | | | | | | | | | |
| | | | | | | | | | | | | 4,699,268 | |
| | |
| | Schools – 0.2% | |
| Rensselaer Polytechnic Institute | |
| | 350,000 | | | | 5.600 | | | | 09/01/20 | | | | 395,389 | |
| | |
| | Technology – 0.7% | |
| Hewlett-Packard Co. | |
| | 525,000 | | | | 3.000 | | | | 09/15/16 | | | | 543,450 | |
| | 375,000 | | | | 2.600 | | | | 09/15/17 | | | | 385,148 | |
| | 300,000 | | | | 2.750 | | | | 01/14/19 | | | | 304,241 | |
| Tech Data Corp. | |
| | 400,000 | | | | 3.750 | | | | 09/21/17 | | | | 416,260 | |
| | | | | | | | | | | | | | |
| | | | | | | | | | | | | 1,649,099 | |
| | |
| | Transportation(c) – 0.3% | |
| Penske Truck Leasing Co. LP/PTL Finance Corp. | |
| | 750,000 | | | | 2.875 | | | | 07/17/18 | | | | 767,206 | |
| | |
| | Wireless Telecommunications – 0.4% | |
| American Tower Corp. | |
| | 300,000 | | | | 3.400 | | | | 02/15/19 | | | | 306,480 | |
| Crown Castle International Corp. | |
| | 575,000 | | | | 5.250 | | | | 01/15/23 | | | | 567,094 | |
| | | | | | | | | | | | | | |
| | | | | | | | | | | | | 873,574 | |
| | |
| | Wirelines Telecommunications – 2.4% | |
| AT&T, Inc. | |
| | 550,000 | | | | 2.950 | | | | 05/15/16 | | | | 567,511 | |
| Mobile Telesystems OJSC via MTS International Funding Ltd. | |
| | 100,000 | | | | 8.625 | | | | 06/22/20 | | | | 106,000 | |
| Verizon Communications, Inc. | |
| | 275,000 | | | | 2.625 | (c) | | | 02/21/20 | | | | 271,377 | |
| | 1,500,000 | | | | 4.500 | | | | 09/15/20 | | | | 1,619,310 | |
| | 1,350,000 | | | | 5.150 | | | | 09/15/23 | | | | 1,489,523 | |
| | 1,150,000 | | | | 4.150 | (b) | | | 03/15/24 | | | | 1,182,963 | |
| | 266,000 | | | | 6.550 | | | | 09/15/43 | | | | 329,903 | |
| | | | | | | | | | | | | | |
| | | | | | | | | | | | | 5,566,587 | |
| | |
| | TOTAL CORPORATE OBLIGATIONS | |
| | (Cost $59,712,388) | | | $ | 61,238,639 | |
| | |
| | | | | | | | | | | | | | |
| | | | | | | | | | | | | | |
Principal
Amount | | | Interest
Rate | | | Maturity
Date | | | Value | |
| | Mortgage-Backed Obligations – 29.4% | |
| | Adjustable Rate Non-Agency(a) – 1.2% | |
| Aire Valley Mortgages PLC Series 2004-1X, Class 3A2 | |
| EUR | 1,005,854 | | | | 0.502 | % | | | 09/20/66 | | | $ | 1,255,225 | |
| Aire Valley Mortgages PLC Series 2006-1X, Class 2A1 | |
| | 218,374 | | | | 0.382 | | | | 09/20/66 | | | | 271,213 | |
| Eurosail Prime-UK PLC Series 2007-PR1X, Class A1 | |
| GBP | 169,382 | | | | 0.952 | | | | 09/13/45 | | | | 264,495 | |
| Granite Mortgages PLC Series 2003-3, Class 3A | |
| | 47,298 | | | | 0.936 | | | | 01/20/44 | | | | 76,601 | |
| Lehman XS Trust Series 2007-4N, Class 1A1 | |
| $ | 221,150 | | | | 0.285 | | | | 03/25/47 | | | | 205,847 | |
| Master Adjustable Rate Mortgages Trust Series 2006-OA2,
Class 4A1B |
|
| | 373,961 | | | | 1.318 | | | | 12/25/46 | | | | 294,643 | |
| Quadrivio Finance Series 2011-1, Class A1 | |
| EUR | 331,728 | | | | 0.708 | | | | 07/25/60 | | | | 418,518 | |
| | |
| TOTAL ADJUSTABLE RATE
NON-AGENCY |
| | $ | 2,786,542 | |
| | |
| | Collateralized Mortgage Obligations – 5.0% | |
| | Inverse Floaters(a) – 0.2% | |
| FNMA REMIC Series 2010-126, Class LS | |
| $ | 1,258,740 | | | | 4.846 | % | | | 11/25/40 | | | $ | 230,924 | |
| GNMA REMIC Series 2013-113, Class SD | |
| | 1,073,785 | | | | 6.546 | | | | 08/16/43 | | | | 172,331 | |
| | | | | | | | | | | | | | |
| | | | | | | | | | | | | 403,255 | |
| | |
| | Planned Amortization Class – 0.1% | |
| FNMA REMIC Series 2005-70, Class PA | |
| | 155,179 | | | | 5.500 | | | | 08/25/35 | | | | 173,432 | |
| | |
| | Sequential Fixed Rate – 2.2% | |
| FHLMC Multifamily Structured Pass-Through Certificates
Series K005, Class A2 |
|
| | 1,500,000 | | | | 4.317 | | | | 11/25/19 | | | | 1,650,863 | |
| FNMA REMIC Series 2011-52, Class GB | |
| | 1,025,000 | | | | 5.000 | | | | 06/25/41 | | | | 1,137,313 | |
| FNMA REMIC Series 2012-111, Class B | |
| | 150,902 | | | | 7.000 | | | | 10/25/42 | | | | 171,201 | |
| FNMA REMIC Series 2012-153, Class B | |
| | 333,268 | | | | 7.000 | | | | 07/25/42 | | | | 377,972 | |
| NCUA Guaranteed Notes Series 2010-C1, Class APT | |
| | 1,060,588 | | | | 2.650 | | | | 10/29/20 | | | | 1,088,693 | |
| NCUA Guaranteed Notes Series A4 | |
| | 600,000 | | | | 3.000 | | | | 06/12/19 | | | | 628,068 | |
| | | | | | | | | | | | | | |
| | | | | | | | | | | | | 5,054,110 | |
| | |
| | Sequential Floating Rate(a) – 2.5% | |
| Banc of America Commercial Mortgage, Inc. Series 2007-2,
Class AM |
|
| | 225,000 | | | | 5.791 | | | | 04/10/49 | | | | 245,173 | |
| Countrywide Alternative Loan Trust Series 2006-0C8, Class 2A3 | |
| | 1,911,563 | | | | 0.405 | | | | 11/25/36 | | | | 1,059,928 | |
| Deutsche Alt-A Securities, Inc. Alternative Loan Trust
Series 2006-AR3, Class A6 |
|
| | 2,878,252 | | | | 0.435 | | | | 08/25/36 | | | | 2,041,411 | |
| | |
| | |
| 32 | | The accompanying notes are an integral part of these financial statements. |
GOLDMAN SACHS BOND FUND
| | | | | | | | | | | | | | |
Principal
Amount | | | Interest
Rate | | | Maturity
Date | | | Value | |
| | Mortgage-Backed Obligations – (continued) | |
| | Sequential Floating Rate(a) – (continued) | |
| FHLMC Multifamily Structured Pass-Through Certificates
Series K033, Class A2 |
|
| $ | 1,200,000 | | | | 3.060 | % | | | 07/25/23 | | | $ | 1,213,355 | |
| FHLMC Multifamily Structured Pass-Through Certificates
Series K714, Class A2 |
|
| | 600,000 | | | | 3.034 | | | | 10/25/20 | | | | 620,953 | |
| FNMA Connecticut Avenue Securities Series 2014-C03,
Class 1M1 |
|
| | 124,605 | | | | 1.355 | | | | 07/25/24 | | | | 123,599 | |
| FNMA REMIC Series 2011-63, Class FG | |
| | 346,432 | | | | 0.605 | | | | 07/25/41 | | | | 348,237 | |
| Morgan Stanley Capital I Trust Series 2007-HQ11, Class AM | |
| | 50,000 | | | | 5.478 | | | | 02/12/44 | | | | 53,794 | |
| Morgan Stanley Capital I Trust Series 2007-HQ13, Class AM | |
| | 50,000 | | | | 5.931 | | | | 12/15/44 | | | | 48,415 | |
| | | | | | | | | | | | | | |
| | | | | | | | | | | | | 5,754,865 | |
| | |
| TOTAL COLLATERALIZED
MORTGAGE OBLIGATIONS |
| | $ | 11,385,662 | |
| | |
| | Federal Agencies – 23.2% | |
| | Adjustable Rate FHLMC(a) – 0.1% | |
| $ | 102,921 | | | | 2.413 | % | | | 09/01/35 | | | $ | 109,743 | |
| | |
| | FHLMC – 2.2% | |
| | 23,148 | | | | 5.000 | | | | 05/01/18 | | | | 24,429 | |
| | 408,870 | | | | 6.000 | | | | 08/01/27 | | | | 461,206 | |
| | 40,305 | | | | 5.000 | | | | 08/01/33 | | | | 44,554 | |
| | 7,657 | | | | 5.000 | | | | 09/01/33 | | | | 8,464 | |
| | 10,793 | | | | 5.000 | | | | 10/01/33 | | | | 11,931 | |
| | 6,984 | | | | 6.000 | | | | 12/01/33 | | | | 8,017 | |
| | 9,111 | | | | 5.000 | | | | 11/01/34 | | | | 10,078 | |
| | 565,753 | | | | 5.000 | | | | 12/01/34 | | | | 625,751 | |
| | 15,280 | | | | 5.000 | | | | 07/01/35 | | | | 16,901 | |
| | 12,849 | | | | 5.000 | | | | 11/01/35 | | | | 14,204 | |
| | 79,236 | | | | 6.500 | | | | 08/01/37 | | | | 89,130 | |
| | 222,092 | | | | 6.500 | | | | 10/01/37 | | | | 249,773 | |
| | 22,728 | | | | 6.500 | | | | 09/01/38 | | | | 25,915 | |
| | 498,416 | | | | 6.000 | | | | 01/01/39 | | | | 561,862 | |
| | 426,557 | | | | 7.000 | | | | 02/01/39 | | | | 485,375 | |
| | 131,353 | | | | 5.000 | | | | 03/01/39 | | | | 144,733 | |
| | 39,230 | | | | 5.000 | | | | 05/01/39 | | | | 43,226 | |
| | 62,083 | | | | 5.000 | | | | 04/01/40 | | | | 68,550 | |
| | 14,382 | | | | 5.000 | | | | 08/01/40 | | | | 15,881 | |
| | 1,782,782 | | | | 5.500 | | | | 08/01/40 | | | | 1,981,304 | |
| | 10,838 | | | | 5.000 | | | | 04/01/41 | | | | 11,993 | |
| | 11,870 | | | | 5.000 | | | | 06/01/41 | | | | 13,135 | |
| | | | | | | | | | | | | | |
| | | | | | | | | | | | | 4,916,412 | |
| | |
| | FNMA – 19.2% | |
| | 936,868 | | | | 3.070 | | | | 12/01/17 | | | | 968,947 | |
| | 744,361 | | | | 2.800 | | | | 03/01/18 | | | | 770,441 | |
| | 4,559 | | | | 6.000 | | | | 12/01/18 | | | | 5,147 | |
| | 1,600,000 | | | | 4.506 | | | | 06/01/19 | | | | 1,729,972 | |
| | 56,067 | | | | 6.000 | | | | 06/01/21 | | | | 59,848 | |
| | 69,909 | | | | 5.000 | | | | 08/01/23 | | | | 75,948 | |
| | 38,676 | | | | 5.500 | | | | 09/01/23 | | | | 41,928 | |
| | |
| | | | | | | | | | | | | | |
Principal
Amount | | | Interest
Rate | | | Maturity
Date | | | Value | |
| | Mortgage-Backed Obligations – (continued) | |
| | FNMA – (continued) | |
| $ | 21,981 | | | | 5.500 | % | | | 10/01/23 | | | $ | 23,847 | |
| | 165,021 | | | | 5.000 | | | | 02/01/24 | | | | 177,974 | |
| | 874,500 | | | | 5.500 | | | | 05/01/25 | | | | 926,197 | |
| | 64 | | | | 6.000 | | | | 03/01/32 | | | | 73 | |
| | 97,311 | | | | 6.000 | | | | 12/01/32 | | | | 111,261 | |
| | 1,594 | | | | 5.000 | | | | 01/01/33 | | | | 1,763 | |
| | 2,015 | | | | 5.500 | | | | 03/01/33 | | | | 2,264 | |
| | 161,983 | | | | 5.500 | | | | 04/01/33 | | | | 181,994 | |
| | 267 | | | | 6.000 | | | | 05/01/33 | | | | 305 | |
| | 5,161 | | | | 5.000 | | | | 08/01/33 | | | | 5,723 | |
| | 11,100 | | | | 5.500 | | | | 09/01/33 | | | | 12,469 | |
| | 46,627 | | | | 5.500 | | | | 12/01/33 | | | | 52,387 | |
| | 241 | | | | 6.000 | | | | 12/01/33 | | | | 272 | |
| | 68,959 | | | | 5.500 | | | | 02/01/34 | | | | 77,474 | |
| | 19,378 | | | | 6.000 | | | | 02/01/34 | | | | 22,160 | |
| | 3,666 | | | | 5.500 | | | | 03/01/34 | | | | 4,119 | |
| | 6,577 | | | | 5.500 | | | | 04/01/34 | | | | 7,391 | |
| | 395,342 | | | | 5.500 | | | | 05/01/34 | | | | 444,181 | |
| | 8,007 | | | | 5.500 | | | | 09/01/34 | | | | 8,996 | |
| | 4,241 | | | | 5.500 | | | | 10/01/34 | | | | 4,765 | |
| | 32,792 | | | | 5.500 | | | | 11/01/34 | | | | 36,840 | |
| | 11,695 | | | | 5.500 | | | | 12/01/34 | | | | 13,114 | |
| | 14,168 | | | | 5.500 | | | | 02/01/35 | | | | 15,917 | |
| | 55,069 | | | | 5.000 | | | | 04/01/35 | | | | 61,120 | |
| | 169 | | | | 6.000 | | | | 04/01/35 | | | | 192 | |
| | 9,655 | | | | 5.500 | | | | 05/01/35 | | | | 10,797 | |
| | 3,921 | | | | 5.500 | | | | 07/01/35 | | | | 4,385 | |
| | 628,578 | | | | 6.000 | | | | 07/01/35 | | | | 711,106 | |
| | 2,316 | | | | 5.500 | | | | 09/01/35 | | | | 2,603 | |
| | 235,834 | | | | 6.000 | | | | 09/01/35 | | | | 266,797 | |
| | 6,311 | | | | 6.000 | | | | 03/01/36 | | | | 7,123 | |
| | 8,743 | | | | 5.500 | | | | 04/01/36 | | | | 9,776 | |
| | 13,093 | | | | 6.000 | | | | 04/01/36 | | | | 14,778 | |
| | 162,656 | | | | 6.000 | | | | 06/01/36 | | | | 183,622 | |
| | 68,147 | | | | 5.500 | | | | 09/01/36 | | | | 76,565 | |
| | 159 | | | | 5.500 | | | | 02/01/37 | | | | 178 | |
| | 250 | | | | 5.500 | | | | 04/01/37 | | | | 279 | |
| | 234 | | | | 5.500 | | | | 05/01/37 | | | | 261 | |
| | 47,153 | | | | 6.000 | | | | 12/01/37 | | | | 53,218 | |
| | 23,882 | | | | 5.500 | | | | 02/01/38 | | | | 26,705 | |
| | 2,324 | | | | 6.000 | | | | 02/01/38 | | | | 2,624 | |
| | 382 | | | | 5.500 | | | | 03/01/38 | | | | 426 | |
| | 120,805 | | | | 6.000 | | | | 03/01/38 | | | | 136,351 | |
| | 193,908 | | | | 6.000 | | | | 05/01/38 | | | | 218,885 | |
| | 231 | | | | 5.500 | | | | 06/01/38 | | | | 258 | |
| | 382 | | | | 5.500 | | | | 07/01/38 | | | | 427 | |
| | 393 | | | | 5.500 | | | | 08/01/38 | | | | 439 | |
| | 311 | | | | 5.500 | | | | 09/01/38 | | | | 348 | |
| | 709,456 | | | | 6.000 | | | | 10/01/38 | | | | 800,754 | |
| | 526,877 | | | | 6.000 | | | | 11/01/38 | | | | 594,648 | |
| | 138 | | | | 5.500 | | | | 12/01/38 | | | | 154 | |
| | 119,704 | | | | 6.000 | | | | 12/01/38 | | | | 135,134 | |
| | 834,976 | | | | 6.000 | | | | 02/01/39 | | | | 942,711 | |
| | 281,865 | | | | 7.000 | | | | 03/01/39 | | | | 319,514 | |
| | 27,778 | | | | 4.500 | | | | 04/01/39 | | | | 30,251 | |
| | 6,324 | | | | 5.500 | | | | 06/01/39 | | | | 7,037 | |
| | |
| | |
| The accompanying notes are an integral part of these financial statements. | | 33 |
GOLDMAN SACHS BOND FUND
Schedule of Investments (continued)
September 30, 2014 (Unaudited)
| | | | | | | | | | | | | | |
Principal
Amount | | | Interest
Rate | | | Maturity
Date | | | Value | |
| | Mortgage-Backed Obligations – (continued) | |
| | FNMA – (continued) | |
| $ | 797,894 | | | | 6.000 | % | | | 07/01/39 | | | $ | 900,573 | |
| | 27,632 | | | | 4.500 | | | | 08/01/39 | | | | 30,109 | |
| | 795,593 | | | | 6.000 | | | | 09/01/39 | | | | 897,964 | |
| | 56,465 | | | | 6.000 | | | | 10/01/39 | | | | 63,744 | |
| | 5,690 | | | | 5.500 | | | | 11/01/39 | | | | 6,331 | |
| | 326,123 | | | | 4.500 | | | | 12/01/39 | | | | 355,360 | |
| | 146,743 | | | | 6.000 | | | | 01/01/40 | | | | 165,616 | |
| | 166,187 | | | | 6.000 | | | | 10/01/40 | | | | 187,560 | |
| | 1,417,526 | | | | 6.000 | | | | 05/01/41 | | | | 1,599,830 | |
| | 154,608 | | | | 4.500 | | | | 08/01/41 | | | | 167,139 | |
| | 39,972 | | | | 4.500 | | | | 10/01/41 | | | | 43,193 | |
| | 593,470 | | | | 3.000 | | | | 08/01/42 | | | | 589,784 | |
| | 526,295 | | | | 3.000 | | | | 09/01/42 | | | | 523,029 | |
| | 75,777 | | | | 3.000 | | | | 10/01/42 | | | | 75,312 | |
| | 277,225 | | | | 3.000 | | | | 11/01/42 | | | | 275,433 | |
| | 3,324,840 | | | | 3.000 | | | | 12/01/42 | | | | 3,302,240 | |
| | 2,668,669 | | | | 3.000 | | | | 01/01/43 | | | | 2,651,137 | |
| | 1,145,038 | | | | 3.000 | | | | 02/01/43 | | | | 1,136,914 | |
| | 453,580 | | | | 3.000 | | | | 03/01/43 | | | | 450,656 | |
| | 744,624 | | | | 3.000 | | | | 04/01/43 | | | | 739,494 | |
| | 325,969 | | | | 3.000 | | | | 05/01/43 | | | | 323,915 | |
| | 91,860 | | | | 3.000 | | | | 06/01/43 | | | | 91,238 | |
| | 799,143 | | | | 3.000 | | | | 07/01/43 | | | | 793,493 | |
| | 6,000,000 | | | | 3.500 | | | | TBA-30yr | (d) | | | 6,131,719 | |
| | 10,000,000 | | | | 4.500 | | | | TBA-30yr | (d) | | | 10,762,500 | |
| | 1,000,000 | | | | 5.000 | | | | TBA-30yr | (d) | | | 1,103,594 | |
| | | | | | | | | | | | | | |
| | | | | | | | | | | | | 43,771,060 | |
| | |
| | GNMA – 1.7% | |
| | 214,267 | | | | 3.950 | | | | 07/15/25 | | | | 223,376 | |
| | 122,138 | | | | 5.500 | | | | 11/15/32 | | | | 139,148 | |
| | 90,861 | | | | 5.500 | | | | 01/15/33 | | | | 103,417 | |
| | 101,432 | | | | 5.500 | | | | 02/15/33 | | | | 115,450 | |
| | 105,008 | | | | 5.500 | | | | 03/15/33 | | | | 119,519 | |
| | 118,861 | | | | 5.500 | | | | 07/15/33 | | | | 135,288 | |
| | 61,962 | | | | 5.500 | | | | 08/15/33 | | | | 70,525 | |
| | 49,643 | | | | 5.500 | | | | 09/15/33 | | | | 56,503 | |
| | 51,304 | | | | 5.500 | | | | 04/15/34 | | | | 58,344 | |
| | 76,434 | | | | 5.500 | | | | 05/15/34 | | | | 86,922 | |
| | 584,381 | | | | 5.500 | | | | 09/15/34 | | | | 664,561 | |
| | 452,661 | | | | 5.500 | | | | 12/15/34 | | | | 514,769 | |
| | 477,183 | | | | 5.500 | | | | 01/15/35 | | | | 537,828 | |
| | 2,599 | | | | 5.500 | | | | 05/15/36 | | | | 2,912 | |
| | 70,103 | | | | 5.000 | | | | 11/15/40 | | | | 78,052 | |
| | 45,398 | | | | 2.500 | | | | 12/20/42 | | | | 44,015 | |
| | 1,000,000 | | | | 3.500 | | | | TBA-30yr | (d) | | | 1,033,750 | |
| | | | | | | | | | | | | | |
| | | | | | | | | | | | | 3,984,379 | |
| | |
| | TOTAL FEDERAL AGENCIES | | | $ | 52,781,594 | |
| | |
| | TOTAL MORTGAGE-BACKED OBLIGATIONS | |
| | (Cost $63,304,750) | | | $ | 66,953,798 | |
| | |
| | | | | | | | | | | | | | |
| | | | | | | | | | | | | | |
Principal
Amount | | | Interest
Rate | | | Maturity
Date | | | Value | |
| | Agency Debentures – 3.8% | |
| | FFCB | | | | | | | | | | | | | |
| $ | 1,400,000 | | | | 3.500 | % | | | 12/20/23 | | | $ | 1,476,955 | |
| | FHLB | | | | | | | | | | | | | |
| | 2,400,000 | | | | 4.625 | | | | 09/11/20 | | | | 2,725,946 | |
| | 1,200,000 | | | | 3.000 | | | | 09/10/21 | | | | 1,237,396 | |
| | 400,000 | | | | 5.375 | | | | 08/15/24 | | | | 484,662 | |
| | FHLMC | | | | | | | | | | | | | |
| | 400,000 | | | | 2.375 | | | | 01/13/22 | | | | 397,936 | |
| | FNMA | | | | | | | | | | | | | |
| | 800,000 | | | | 6.250 | | | | 05/15/29 | | | | 1,080,505 | |
| Tennessee Valley Authority | |
| | 1,200,000 | | | | 3.875 | | | | 02/15/21 | | | | 1,312,798 | |
| | |
| | TOTAL AGENCY DEBENTURES | | | | | |
| | (Cost $8,264,866) | | | $ | 8,716,198 | |
| | |
| | | | | | | | | | | | | | |
| | Asset-Backed Securities – 10.7% | |
| | Collateralized Loan Obligations – 10.5% | |
| Aberdeen Loan Funding Ltd. Series 2008-1A, Class A(a)(c) | |
| $ | 3,339,578 | | | | 0.890 | % | | | 11/01/18 | | | $ | 3,314,598 | |
| ACIS CLO Ltd. Series 2013-1A, Class ACOM(a)(c) | |
| | 2,600,000 | | | | 1.461 | | | | 04/18/24 | | | | 2,505,880 | |
| ACIS CLO Ltd. Series 2013-2A, Class A(a)(c) | |
| | 400,000 | | | | 0.734 | | | | 10/14/22 | | | | 391,804 | |
| ACIS CLO Ltd. Series 2013-2A, Class ACOM(a)(c) | |
| | 2,650,000 | | | | 1.149 | | | | 10/14/22 | | | | 2,593,820 | |
| Crown Point CLO Ltd. Series 2012-1A, Class ACOM(a)(c) | |
| | 1,250,000 | | | | 1.452 | | | | 11/21/22 | | | | 1,234,000 | |
| Golub Capital Management CLO Ltd. Series 2007-1A,
Class A(a)(c) |
|
| | 749,836 | | | | 0.477 | | | | 07/31/21 | | | | 743,994 | |
| OCP CLO Ltd. Series 2012-2A, Class ACOM(a)(c) | |
| | 2,200,000 | | | | 1.475 | | | | 11/22/23 | | | | 2,159,300 | |
| OFSI Fund V Ltd. Series 2013-5A, Class ACOM(c) | |
| | 1,650,000 | | | | 1.618 | | | | 04/17/25 | | | | 1,625,415 | |
| Red River CLO Ltd. Series 1A, Class A(a)(c) | |
| | 1,494,632 | | | | 0.510 | | | | 07/27/18 | | | | 1,486,634 | |
| Regatta IV Funding Ltd. Series 2014-1A, Class ACOM(a)(c) | |
| | 1,850,000 | | | | 1.775 | | | | 07/25/26 | | | | 1,834,830 | |
| Westchester CLO Ltd. Series 2007-1X, Class A1A(a) | |
| | 6,018,982 | | | | 0.465 | | | | 08/01/22 | | | | 5,962,946 | |
| | | | | | | | | | | | | | |
| | | | | | | | | | | | | 23,853,221 | |
| | |
| | Home Equity(a) – 0.2% | |
| Bear Stearns Asset Backed Securities Trust Series 2001-3,
Class A2 |
|
| | 7,141 | | | | 0.955 | | | | 10/27/32 | | | | 6,859 | |
| Bear Stearns Asset Backed Securities Trust Series 2002-2,
Class A1 |
|
| | 5,085 | | | | 0.815 | | | | 10/25/32 | | | | 4,971 | |
| Bear Stearns Asset Backed Securities Trust Series 2005-SD4,
Class 2A1 |
|
| | 245,742 | | | | 0.955 | | | | 12/25/42 | | | | 245,152 | |
| CS First Boston Mortgage Securities Corp. Series 2001-HE17,
Class A1 |
|
| | 1,638 | | | | 0.775 | | | | 01/25/32 | | | | 1,392 | |
| | |
| | |
| 34 | | The accompanying notes are an integral part of these financial statements. |
GOLDMAN SACHS BOND FUND
| | | | | | | | | | | | | | |
Principal
Amount | | | Interest
Rate | | | Maturity
Date | | | Value | |
| | Asset-Backed Securities – (continued) | |
| | Home Equity(a) – (continued) | |
| First Alliance Mortgage Loan Trust Series 1999-4, Class A2 | |
| $ | 149 | | | | 0.914 | % | | | 03/20/31 | | | $ | 128 | |
| GMAC Mortgage Corp. Loan Trust Series 2007-HE3, Class 1A1 | |
| | 123,802 | | | | 7.000 | | | | 09/25/37 | | | | 123,061 | |
| GMAC Mortgage Corp. Loan Trust Series 2007-HE3, Class 2A1 | |
| | 52,399 | | | | 6.827 | | | | 09/25/37 | | | | 52,408 | |
| Home Equity Asset Trust Series 2002-1, Class A4 | |
| | 257 | | | | 0.755 | | | | 11/25/32 | | | | 239 | |
| Renaissance Home Equity Loan Trust Series 2003-2, Class A | |
| | 1,600 | | | | 1.035 | | | | 08/25/33 | | | | 1,528 | |
| Renaissance Home Equity Loan Trust Series 2003-3, Class A | |
| | 4,706 | | | | 0.655 | | | | 12/25/33 | | | | 4,568 | |
| | | | | | | | | | | | | | |
| | | | | | | | | | | | | 440,306 | |
| | |
| | TOTAL ASSET-BACKED SECURITIES | |
| | (Cost $23,266,146) | | | $ | 24,293,527 | |
| | |
| | | | | | | | | | | | | | |
| | Foreign Debt Obligations – 3.6% | |
| | Sovereign – 3.3% | |
| Dominican Republic | |
| | DOP500,000 | | | | 14.500 | % | | | 02/10/23 | | | $ | 13,117 | |
| $ | 280,000 | | | | 6.600 | (c) | | | 01/28/24 | | | | 300,300 | |
| | 191,000 | | | | 8.625 | | | | 04/20/27 | | | | 231,110 | |
| Italy Buoni Poliennali Del Tesoro | |
| EUR | 890,000 | | | | 1.150 | | | | 05/15/17 | | | | 1,141,089 | |
| | 507,293 | | | | 2.350 | | | | 09/15/19 | | | | 708,011 | |
| | 10,000 | | | | 4.750 | (c) | | | 09/01/44 | | | | 15,172 | |
| Republic of Argentina(a) | |
| | 486,000 | | | | 0.000 | | | | 12/15/35 | | | | 45,424 | |
| $ | 2,925,000 | | | | 0.000 | | | | 12/15/35 | | | | 222,300 | |
| Republic of Colombia | |
| | 530,000 | | | | 4.000 | | | | 02/26/24 | | | | 536,625 | |
| Republic of Turkey | |
| | 820,000 | | | | 6.250 | | | | 09/26/22 | | | | 902,000 | |
| Spain Government Bond(c) | |
| | EUR10,000 | | | | 5.150 | | | | 10/31/44 | | | | 16,466 | |
| United Mexican States | |
| MXN | 9,579,400 | | | | 0.000 | (e) | | | 10/16/14 | | | | 711,360 | |
| | 7,051,120 | | | | 0.000 | (e) | | | 12/18/14 | | | | 521,753 | |
| | 9,543,780 | | | | 0.000 | (e) | | | 12/24/14 | | | | 704,761 | |
| | 2,518,820 | | | | 0.000 | (e) | | | 03/19/15 | | | | 184,938 | |
| | 2,128,400 | | | | 6.500 | | | | 06/10/21 | | | | 165,510 | |
| | 186,400 | | | | 8.000 | | | | 12/07/23 | | | | 15,761 | |
| | 4,356,000 | | | | 7.500 | | | | 06/03/27 | | | | 355,164 | |
| | 1,065,300 | | | | 8.500 | | | | 05/31/29 | | | | 93,732 | |
| $ | 660,000 | | | | 4.750 | | | | 03/08/44 | | | | 653,400 | |
| | | | | | | | | | | | | | |
| | | | | | | | | | | | | 7,537,993 | |
| | |
| | Supranational – 0.3% | |
| Inter-American Development Bank | |
| | 700,000 | | | | 1.000 | | | | 02/27/18 | | | | 676,739 | |
| | |
| | TOTAL FOREIGN DEBT OBLIGATIONS | |
| | (Cost $8,421,237) | | | $ | 8,214,732 | |
| | |
| | | | | | | | | | | | | | |
| | | | | | | | | | | | | | |
Principal
Amount | | | Interest
Rate | | | Maturity
Date | | | Value | |
| | Structured Note – 0.7% | |
| Notas do Tesouro Nacional Series B (Issuer HSBC Corp.) | |
| BRL | 4,040,464 | | | | 6.000 | % | | | 08/15/40 | | | $ | 1,606,358 | |
| | (Cost $2,353,781) | |
| | |
| | | | | | | | | | | | | | |
| | Municipal Debt Obligations – 1.8% | |
| | California – 0.5% | |
| California State GO Bonds Build America Taxable Series 2009 | |
| $ | 210,000 | | | | 7.550 | % | | | 04/01/39 | | | $ | 306,222 | |
| California State GO Bonds Build America Taxable Series 2010 | |
| | 625,000 | | | | 7.950 | | | | 03/01/36 | | | | 762,368 | |
| | | | | | | | | | | | | | |
| | | | | | | | | | | | | 1,068,590 | |
| | |
| | Illinois – 0.3% | |
| Illinois State GO Bonds Build America Series 2010 | |
| | 500,000 | | | | 7.350 | | | | 07/01/35 | | | | 573,895 | |
| Illinois State GO Bonds Taxable-Pension Series 2003 | |
| | 115,000 | | | | 5.100 | | | | 06/01/33 | | | | 111,671 | |
| | | | | | | | | | | | | | |
| | | | | | | | | | | | | 685,566 | |
| | |
| | Ohio – 0.1% | |
| American Municipal Power-Ohio, Inc. RB Build America
Taxable Series 2010 |
|
| | 250,000 | | | | 6.270 | | | | 02/15/50 | | | | 306,780 | |
| | |
| | Puerto Rico – 0.9% | |
| Puerto Rico Commonwealth Aqueduct & Sewer Authority RB
(Senior Lien) Series 2008 A |
|
| | 30,000 | | | | 6.000 | | | | 07/01/38 | | | | 22,590 | |
| | 45,000 | | | | 6.000 | | | | 07/01/44 | | | | 33,188 | |
| Puerto Rico Commonwealth Aqueduct & Sewer Authority RB
(Senior Lien) Series 2012 A |
|
| | 20,000 | | | | 5.750 | | | | 07/01/37 | | | | 14,754 | |
| Puerto Rico Commonwealth Aqueduct & Sewer Authority RB
(Senior Lien) Series 2012 D |
|
| | 20,000 | | | | 5.000 | | | | 07/01/33 | | | | 14,205 | |
| Puerto Rico Commonwealth GO Bonds for Public Improvement
Series 2011 A |
|
| | 10,000 | | | | 5.750 | | | | 07/01/41 | | | | 7,505 | |
| Puerto Rico Commonwealth GO Bonds Refunding for Public
Improvement Series 2009 B |
|
| | 10,000 | | | | 5.750 | | | | 07/01/38 | | | | 7,683 | |
| | 10,000 | | | | 6.000 | | | | 07/01/39 | | | | 7,674 | |
| Puerto Rico Commonwealth GO Bonds Refunding for Public
Improvement Series 2012 A |
|
| | 70,000 | | | | 5.500 | | | | 07/01/39 | | | | 52,317 | |
| | 20,000 | | | | 5.000 | | | | 07/01/41 | | | | 14,641 | |
| Puerto Rico Commonwealth GO Bonds Series 2007 A | |
| | 15,000 | | | | 5.250 | | | | 07/01/37 | | | | 11,288 | |
| Puerto Rico Commonwealth GO Bonds Series 2014 A | |
| | 1,375,000 | | | | 8.000 | | | | 07/01/35 | | | | 1,210,028 | |
| Puerto Rico Commonwealth GO Bonds Unrefunded Balance for
Public Improvement Series 2006 A |
|
| | 10,000 | | | | 5.250 | | | | 07/01/27 | | | | 7,719 | |
| Puerto Rico Sales Tax Financing Corp. Sales Tax RB Capital
Appreciation SubSeries 2010 C(e) |
|
| | 15,000 | | | | 0.000 | | | | 08/01/37 | | | | 2,219 | |
| | 15,000 | | | | 0.000 | | | | 08/01/38 | | | | 2,097 | |
| | |
| | |
| The accompanying notes are an integral part of these financial statements. | | 35 |
GOLDMAN SACHS BOND FUND
Schedule of Investments (continued)
September 30, 2014 (Unaudited)
| | | | | | | | | | | | | | |
Principal
Amount | | | Interest
Rate | | | Maturity
Date | | | Value | |
| | Municipal Debt Obligations – (continued) | |
| | Puerto Rico – (continued) | |
| Puerto Rico Sales Tax Financing Corp. Sales Tax RB
SubSeries 2009 A |
|
| $ | 10,000 | | | | 5.250 | % | | | 08/01/27 | | | $ | 8,325 | |
| | 135,000 | | | | 0.000 | (e) | | | 08/01/32 | | | | 106,223 | |
| | 95,000 | | | | 5.750 | | | | 08/01/37 | | | | 77,570 | |
| | 15,000 | | | | 6.375 | | | | 08/01/39 | | | | 12,610 | |
| | 20,000 | | | | 6.000 | | | | 08/01/42 | | | | 16,045 | |
| Puerto Rico Sales Tax Financing Corp. Sales Tax RB
SubSeries 2010 A |
|
| | 50,000 | | | | 0.000 | (e) | | | 08/01/33 | | | | 29,246 | |
| | 70,000 | | | | 5.500 | | | | 08/01/37 | | | | 54,865 | |
| | 50,000 | | | | 5.375 | | | | 08/01/39 | | | | 38,151 | |
| | 170,000 | | | | 5.500 | | | | 08/01/42 | | | | 129,849 | |
| Puerto Rico Sales Tax Financing Corp. Sales Tax RB
SubSeries 2010 C |
|
| | 15,000 | | | | 5.375 | | | | 08/01/38 | | | | 11,634 | |
| | 15,000 | | | | 6.000 | | | | 08/01/39 | | | | 12,279 | |
| | 65,000 | | | | 5.250 | | | | 08/01/41 | | | | 47,962 | |
| Puerto Rico Sales Tax Financing Corp. Sales Tax RB
SubSeries 2011 A-1 |
|
| | 15,000 | | | | 5.000 | | | | 08/01/43 | | | | 10,746 | |
| | 15,000 | | | | 5.250 | | | | 08/01/43 | | | | 10,982 | |
| Puerto Rico Sales Tax Financing Corp. Sales Tax RB Unrefunded
SubSeries 2009 A |
|
| | 55,000 | | | | 5.500 | | | | 08/01/28 | | | | 46,464 | |
| | 15,000 | | | | 6.125 | | | | 08/01/29 | | | | 12,754 | |
| | | | | | | | | | | | | | |
| | | | | | | | | | | | | 2,033,613 | |
| | |
| | TOTAL MUNICIPAL DEBT OBLIGATIONS | |
| | (Cost $3,778,798) | | | $ | 4,094,549 | |
| | |
| | |
| | Government Guarantee Obligations(f) – 2.3% | |
| Hashemite Kingdom of Jordan Government AID Bond | |
| $ | 1,600,000 | | | | 2.503 | % | | | 10/30/20 | | | $ | 1,632,000 | |
| Israel Government AID Bond | |
| | 2,000,000 | | | | 5.500 | | | | 09/18/23 | | | | 2,435,511 | |
| | 300,000 | | | | 5.500 | | | | 12/04/23 | | | | 365,519 | |
| | 650,000 | | | | 5.500 | | | | 04/26/24 | | | | 793,843 | |
| | 40,000 | | | | 5.500 | | | | 09/18/33 | | | | 50,799 | |
| | |
| | TOTAL GOVERNMENT GUARANTEE OBLIGATIONS | |
| | (Cost $5,319,306) | | | $ | 5,277,672 | |
| | |
| | |
| | U.S. Treasury Obligations – 19.8% | |
| United States Treasury Bonds | |
| $ | 600,000 | | | | 3.625 | % | | | 08/15/43 | | | $ | 648,534 | |
| | 1,900,000 | | | | 3.750 | (g) | | | 11/15/43 | | | | 2,099,899 | |
| | 3,500,000 | | | | 3.625 | (g) | | | 02/15/44 | | | | 3,782,625 | |
| | 2,900,000 | | | | 3.375 | | | | 05/15/44 | | | | 2,993,728 | |
| United States Treasury Inflation Protected Securities | |
| | 1,368,458 | | | | 0.125 | | | | 01/15/22 | | | | 1,337,449 | |
| | 409,512 | | | | 0.375 | | | | 07/15/23 | | | | 405,482 | |
| | 1,664,393 | | | | 0.625 | | | | 01/15/24 | | | | 1,673,747 | |
| | 766,718 | | | | 1.375 | | | | 02/15/44 | | | | 820,748 | |
| | |
| | | | | | | | | | | | | | |
Principal
Amount | | | Interest
Rate | | | Maturity
Date | | | Value | |
| | U.S. Treasury Obligations – (continued) | |
| United States Treasury Notes | |
| $ | 19,200,000 | | | | 0.500 | % | | | 06/30/16 | | | $ | 19,211,520 | |
| | 11,500,000 | | | | 1.000 | | | | 03/31/17 | | | | 11,534,615 | |
| | 700,000 | | | | 2.500 | | | | 05/15/24 | | | | 700,427 | |
| | |
| | TOTAL U.S. TREASURY OBLIGATIONS | |
| | (Cost $44,633,600) | | | $ | 45,208,774 | |
| | |
| | |
Notional
Amount | | | Exercise
Rate | | | Expiration
Date | | | Value | |
| | Options Purchased – 1.8% | |
| | Interest Rate Swaptions | |
| Bank of America Securities LLC Put - OTC - 30 year Interest
Rate Swap Strike Price 3.950% |
|
| $ | 1,200,000 | | | | 3.950 | % | | | 01/29/16 | | | $ | 161,328 | |
| Bank of America Securities LLC Call - OTC - 30 year Interest
Rate Swap Strike Price 3.950% |
|
| | 1,200,000 | | | | 3.950 | | | | 01/29/16 | | | | 31,638 | |
| Citibank NA Put - OTC - 10 year Interest Rate Swap
Strike Price 3.388% |
|
| | 2,100,000 | | | | 3.388 | | | | 09/19/16 | | | | 97,706 | |
| Citibank NA Call - OTC - 10 year Interest Rate Swap
Strike Price 3.388% |
|
| | 2,100,000 | | | | 3.388 | | | | 09/19/16 | | | | 74,757 | |
| Deutsche Bank AG Put - OTC - 5 year Interest Rate Swap
Strike Price 2.550% |
|
| | 2,000,000 | | | | 2.550 | | | | 09/28/15 | | | | 32,467 | |
| Deutsche Bank AG Call - OTC - 5 year Interest Rate Swap
Strike Price 2.550% |
|
| | 2,000,000 | | | | 2.550 | | | | 09/28/15 | | | | 30,568 | |
| Deutsche Bank AG Put - OTC - 5 year Interest Rate Swap
Strike Price 2.940% |
|
| | 2,200,000 | | | | 2.940 | | | | 09/29/16 | | | | 50,189 | |
| Deutsche Bank AG Call - OTC - 5 year Interest Rate Swap
Strike Price 2.940% |
|
| | 2,200,000 | | | | 2.940 | | | | 09/29/16 | | | | 52,615 | |
| Deutsche Bank AG Put - OTC - 5 year Interest Rate Swap
Strike Price 3.018% |
|
| | 2,600,000 | | | | 3.018 | | | | 09/26/16 | | | | 64,476 | |
| Deutsche Bank AG Call - OTC - 5 year Interest Rate Swap
Strike Price 3.018% |
|
| | 2,600,000 | | | | 3.018 | | | | 09/26/16 | | | | 57,469 | |
| Deutsche Bank AG Call - OTC - 10 year Interest Rate Swap
Strike Price 3.780% |
|
| | 2,800,000 | | | | 3.780 | | | | 09/26/16 | | | | 66,654 | |
| Deutsche Bank AG Put - OTC - 10 year Interest Rate Swap
Strike Price 3.963% |
|
| | 1,300,000 | | | | 3.963 | | | | 05/07/19 | | | | 98,139 | |
| Deutsche Bank AG Call - OTC - 10 year Interest Rate Swap
Strike Price 3.963% |
|
| | 1,300,000 | | | | 3.963 | | | | 05/07/19 | | | | 57,336 | |
| Deutsche Bank AG Put - OTC - 10 year Interest Rate Swap
Strike Price 4.095% |
|
| | 2,000,000 | | | | 4.095 | | | | 04/24/19 | | | | 164,391 | |
| | |
| | |
| 36 | | The accompanying notes are an integral part of these financial statements. |
GOLDMAN SACHS BOND FUND
| | | | | | | | | | | | | | |
Notional
Amount | | | Exercise
Rate | | | Expiration
Date | | | Value | |
| | Options Purchased – (continued) | |
| | Interest Rate Swaptions – (continued) | |
| Deutsche Bank AG Call - OTC - 10 year Interest Rate Swap
Strike Price 4.095% |
|
| $ | 2,000,000 | | | | 4.095 | % | | | 04/24/19 | | | $ | 80,270 | |
| Deutsche Bank AG Put - OTC - 10 year Interest Rate Swap Strike
Price 4.113% |
|
| | 5,000,000 | | | | 4.113 | | | | 04/16/19 | | | | 415,628 | |
| Deutsche Bank AG Call - OTC - 10 year Interest Rate Swap
Strike Price 4.113% |
|
| | 5,000,000 | | | | 4.113 | | | | 04/16/19 | | | | 197,691 | |
| Deutsche Bank AG Put - OTC - 10 year Interest Rate Swap Strike
Price 4.135% |
|
| | 3,300,000 | | | | 4.135 | | | | 04/17/19 | | | | 277,973 | |
| Deutsche Bank AG Call - OTC - 10 year Interest Rate Swap
Strike Price 4.135% |
|
| | 3,300,000 | | | | 4.135 | | | | 04/17/19 | | | | 128,608 | |
| JPMorgan Securities, Inc. Call - OTC - 5 year Interest Rate Swap
Strike Price 2.783% |
|
| | 4,300,000 | | | | 2.783 | | | | 09/30/15 | | | | 47,838 | |
| JPMorgan Securities, Inc. Put - OTC - 5 year Interest Rate Swap
Strike Price 2.973% |
|
| | 3,000,000 | | | | 2.973 | | | | 09/26/16 | | | | 70,957 | |
| JPMorgan Securities, Inc. Call - OTC - 5 year Interest Rate Swap
Strike Price 2.973% |
|
| | 3,000,000 | | | | 2.973 | | | | 09/26/16 | | | | 69,091 | |
| JPMorgan Securities, Inc. Put - OTC - 5 year Interest Rate Swap
Strike Price 2.988% |
|
| | 2,000,000 | | | | 2.988 | | | | 09/26/16 | | | | 48,062 | |
| JPMorgan Securities, Inc. Call - OTC - 5 year Interest Rate Swap
Strike Price 2.988% |
|
| | 2,000,000 | | | | 2.988 | | | | 09/26/16 | | | | 45,436 | |
| JPMorgan Securities, Inc. Put - OTC - 5 year Interest Rate Swap
Strike Price 3.000% |
|
| | 3,500,000 | | | | 3.000 | | | | 09/22/16 | | | | 85,207 | |
| JPMorgan Securities, Inc. Call - OTC - 5 year Interest Rate Swap
Strike Price 3.000% |
|
| | 3,500,000 | | | | 3.000 | | | | 09/22/16 | | | | 78,365 | |
| JPMorgan Securities, Inc. Put - OTC - 5 year Interest Rate Swap
Strike Price 3.080% |
|
| | 2,300,000 | | | | 3.080 | | | | 09/19/16 | | | | 60,907 | |
| JPMorgan Securities, Inc. Call - OTC - 5 year Interest Rate Swap
Strike Price 3.080% |
|
| | 2,300,000 | | | | 3.080 | | | | 09/19/16 | | | | 47,393 | |
| JPMorgan Securities, Inc. Put - OTC - 10 year Interest Rate Swap
Strike Price 3.413% |
|
| | 3,200,000 | | | | 3.413 | | | | 09/19/16 | | | | 152,772 | |
| JPMorgan Securities, Inc. Call - OTC - 10 year Interest Rate
Swap Strike Price 3.413% |
|
| | 3,200,000 | | | | 3.413 | | | | 09/19/16 | | | | 111,100 | |
| JP Morgan Securities, Inc. Put - OTC - 10 year Interest Rate Swap
Strike Price 3.955% |
|
| | 1,500,000 | | | | 3.955 | | | | 05/07/19 | | | | 112,685 | |
| JP Morgan Securities, Inc. Call - OTC - 10 year Interest Rate
Swap Strike Price 3.955% |
|
| | 1,500,000 | | | | 3.955 | | | | 05/07/19 | | | | 66,488 | |
| JP Morgan Securities, Inc. Put - OTC - 10 year Interest Rate Swap
Strike Price 4.105% |
|
| | 2,000,000 | | | | 4.105 | | | | 04/29/19 | | | | 165,350 | |
| | |
| | | | | | | | | | | | | | |
Notional
Amount | | | Exercise
Rate | | | Expiration
Date | | | Value | |
| | Options Purchased – (continued) | |
| | Interest Rate Swaptions – (continued) | |
| JP Morgan Securities, Inc. Call - OTC - 10 year Interest Rate
Swap Strike Price 4.105% |
|
| $ | 2,000,000 | | | | 4.105 | % | | | 04/29/19 | | | $ | 79,896 | |
| Morgan Stanley Capital Services, Inc. Put - OTC - 5 year Interest
Rate Swap Strike Price 2.513% |
|
| | 2,000,000 | | | | 2.513 | | | | 09/29/15 | | | | 31,500 | |
| Morgan Stanley Capital Services, Inc. Call - OTC - 5 year Interest
Rate Swap Strike Price 2.513% |
|
| | 2,000,000 | | | | 2.513 | | | | 09/29/15 | | | | 31,500 | |
| Morgan Stanley Capital Services, Inc. Put - OTC - 5 year Interest
Rate Swap Strike Price 2.550% |
|
| | 1,700,000 | | | | 2.550 | | | | 09/28/15 | | | | 27,597 | |
| Morgan Stanley Capital Services, Inc. Call - OTC - 5 year Interest
Rate Swap Strike Price 2.550% |
|
| | 1,700,000 | | | | 2.550 | | | | 09/28/15 | | | | 25,983 | |
| Morgan Stanley Capital Services, Inc. Put - OTC - 5 year Interest
Rate Swap Strike Price 2.930% |
|
| | 2,000,000 | | | | 2.930 | | | | 09/29/16 | | | | 46,600 | |
| Morgan Stanley Capital Services, Inc. Call - OTC - 5 year Interest
Rate Swap Strike Price 2.930% |
|
| | 2,000,000 | | | | 2.930 | | | | 09/29/16 | | | | 46,600 | |
| Morgan Stanley Capital Services, Inc. Put - OTC - 5 year Interest
Rate Swap Strike Price 2.940% |
|
| | 2,000,000 | | | | 2.940 | | | | 09/29/16 | | | | 46,550 | |
| Morgan Stanley Capital Services, Inc. Call - OTC - 5 year Interest
Rate Swap Strike Price 2.940% |
|
| | 2,000,000 | | | | 2.940 | | | | 09/29/16 | | | | 46,550 | |
| Morgan Stanley Capital Services, Inc. Put - OTC - 5 year Interest
Rate Swap Strike Price 2.950% |
|
| | 4,100,000 | | | | 2.950 | | | | 09/26/16 | | | | 94,670 | |
| Morgan Stanley Capital Services, Inc. Call - OTC - 5 year Interest
Rate Swap Strike Price 2.950% |
|
| | 4,100,000 | | | | 2.950 | | | | 09/26/16 | | | | 96,371 | |
| Morgan Stanley Capital Services, Inc. Call - OTC - 7 year Interest
Rate Swap Strike Price 3.010% |
|
| | 3,400,000 | | | | 3.010 | | | | 09/29/15 | | | | 50,730 | |
| Morgan Stanley Capital Services, Inc. Call - OTC - 5 year Interest
Rate Swap Strike Price 3.115% |
|
| | 2,300,000 | | | | 3.115 | | | | 09/19/16 | | | | 45,862 | |
| Morgan Stanley Capital Services, Inc. Put - OTC - 5 year Interest
Rate Swap Strike Price 3.115% |
|
| | 2,300,000 | | | | 3.115 | | | | 09/19/16 | | | | 63,087 | |
| | |
| | TOTAL OPTIONS PURCHASED | |
| | (Cost $3,934,102) | | | | | | | $ | 4,035,050 | |
| | |
| TOTAL INVESTMENTS BEFORE SHORT-TERM
INVESTMENT |
|
| | (Cost $222,988,974) | | | | | | | $ | 229,639,297 | |
| | |
| | | | | | | | | | | | | | |
| | |
| The accompanying notes are an integral part of these financial statements. | | 37 |
GOLDMAN SACHS BOND FUND
Schedule of Investments (continued)
September 30, 2014 (Unaudited)
| | | | | | | | | | | | | | |
Principal
Amount | | | Interest
Rate | | | Maturity
Date | | | Value | |
| | Short-term Investment(h) – 8.1% | |
| | Repurchase Agreement – 8.1% | |
| Joint Repurchase Agreement Account II | |
| $ | 18,600,000 | | | | 0.012 | % | | | 10/01/14 | | | $ | 18,600,000 | |
| | (Cost $18,600,000) | | | | | |
| | |
| | TOTAL INVESTMENTS – 108.8% | |
| | (Cost $241,588,974) | | | | | | | $ | 248,239,297 | |
| | |
| LIABILITIES IN EXCESS OF
OTHER ASSETS – (8.8)% |
| | | (20,104,550 | ) |
| | |
| | NET ASSETS – 100.0% | | | $ | 228,134,747 | |
| | |
| | |
| The percentage shown for each investment category reflects the value of investments in that category as a percentage of net assets. |
(a) | | Variable rate security. Interest rate or distribution rate disclosed is that which is in effect at September 30, 2014. |
(b) | | Security with “Call” features with resetting interest rates. Maturity dates disclosed are the final maturity dates. |
(c) | | Exempt from registration under Rule 144A of the Securities Act of 1933. Under procedures approved by the Board of Trustees, such securities have been determined to be liquid by the investment adviser and may be resold, normally to qualified institutional buyers in transactions exempt from registration. Total market value of Rule 144A securities amounts to $32,470,275, which represents approximately 14.2% of net assets as of September 30, 2014. |
(d) | | TBA (To Be Announced) Securities are purchased on a forward commitment basis with an approximate principal amount and no defined maturity date. The actual principal and maturity date will be determined upon settlement when the specific mortgage pools are assigned. Total market value of TBA securities (excluding forward sales contracts, if any) amounts to $19,031,563 which represents approximately 8.3% of net assets as of September 30, 2014. |
(e) | | Issued with a zero coupon. Income is recognized through the accretion of discount. |
(f) | | Guaranteed by the United States Government until maturity. Total market value for these securities amounts to $5,277,672, which represents approximately 2.3% of net assets as of September 30, 2014. |
(g) | | All or a portion of security is segregated as collateral for initial margin requirements on futures transactions. |
(h) | | Joint repurchase agreement was entered into on September 30, 2014. Additional information appears on page 118. |
| | |
|
Currency Abbreviations: |
AUD | | —Australian Dollar |
BRL | | —Brazilian Real |
CAD | | —Canadian Dollar |
CHF | | —Swiss Franc |
CNH | | —Chinese Yuan Renminbi Offshore |
DOP | | —Dominican Peso |
EUR | | —Euro |
GBP | | —British Pound |
HUF | | —Hungarian Forint |
IDR | | —Indonesian Rupiah |
ILS | | —Israeli Shekel |
INR | | —Indian Rupee |
JPY | | —Japanese Yen |
KRW | | —South Korean Won |
MXN | | —Mexican Peso |
MYR | | —Malaysian Ringgit |
NOK | | —Norwegian Krone |
NZD | | —New Zealand Dollar |
PHP | | —Philippine Peso |
PLN | | —Polish Zloty |
RUB | | —Russian Ruble |
SEK | | —Swedish Krona |
SGD | | —Singapore Dollar |
TRY | | —Turkish Lira |
TWD | | —Taiwan Dollar |
USD | | —United States Dollar |
| | |
Investment Abbreviations: |
AUDOR | | —Australian Dollar Offered Rate |
CDOR | | —Canadian Dollar Offered Rate |
CHFOR | | —Swiss Franc Offered Rate |
CLO | | —Collateralized Loan Obligation |
EURO | | —Euro Offered Rate |
FFCB | | —Federal Farm Credit Bank |
FHLB | | —Federal Home Loan Bank |
FHLMC | | —Federal Home Loan Mortgage Corp. |
FNMA | | —Federal National Mortgage Association |
GNMA | | —Government National Mortgage Association |
GO | | —General Obligation |
JYOR | | —Japanese Yen Offered Rate |
KLIBOR | | —Kuala Lumpur Interbank Offered Rate |
KWCDC | | —South Korean Won Certificate of Deposit |
LIBOR | | —London Interbank Offered Rate |
NCUA | | —National Credit Union Administration |
NZDOR | | —New Zealand Dollar Offered Rate |
OTC | | —Over the Counter |
RB | | —Revenue Bond |
REMIC | | —Real Estate Mortgage Investment Conduit |
SPA | | —Stand-by Purchase Agreement |
STIBOR | | —Stockholm Interbank Offered Rate |
|
| | |
| 38 | | The accompanying notes are an integral part of these financial statements. |
GOLDMAN SACHS BOND FUND
|
| ADDITIONAL INVESTMENT INFORMATION |
FORWARD FOREIGN CURRENCY EXCHANGE CONTRACTS — At September 30, 2014, the Fund had the following forward foreign currency exchange contracts:
FORWARD FOREIGN CURRENCY EXCHANGE CONTRACTS WITH UNREALIZED GAIN
| | | | | | | | | | | | | | |
| Counterparty | | Contracts to
Buy/Sell | | Settlement
Date | | | Current
Value | | | Unrealized
Gain | |
Bank of America Securities LLC | | GBP/EUR | | | 12/17/14 | | | $ | 227,477 | | | $ | 6,157 | |
| | NOK/EUR | | | 12/17/14 | | | | 226,213 | | | | 4,615 | |
| | USD/EUR | | | 12/17/14 | | | | 4,506,570 | | | | 148,173 | |
| | USD/JPY | | | 12/17/14 | | | | 452,654 | | | | 10,346 | |
| | USD/MXN | | | 10/31/14 | | | | 3,070,057 | | | | 56,678 | |
| | USD/MYR | | | 10/03/14 | | | | 235,064 | | | | 3,751 | |
| | USD/SEK | | | 11/06/14 | | | | 231,674 | | | | 3,400 | |
Barclays Bank PLC | | CAD/CHF | | | 12/17/14 | | | | 224,142 | | | | 139 | |
| | GBP/USD | | | 12/17/14 | | | | 699,855 | | | | 3,210 | |
| | USD/AUD | | | 12/17/14 | | | | 660,707 | | | | 27,138 | |
| | USD/BRL | | | 10/24/14 | | | | 556,075 | | | | 44,553 | |
| | USD/ILS | | | 12/17/14 | | | | 244,801 | | | | 16,977 | |
| | USD/INR | | | 10/07/14 | | | | 470,564 | | | | 7,436 | |
| | USD/INR | | | 10/27/14 | | | | 224,415 | | | | 3,585 | |
| | USD/KRW | | | 10/27/14 | | | | 339,476 | | | | 3,274 | |
| | USD/NZD | | | 12/17/14 | | | | 219,957 | | | | 8,816 | |
| | USD/SEK | | | 12/17/14 | | | | 403,604 | | | | 6,989 | |
BNP Paribas SA | | EUR/PLN | | | 12/17/14 | | | | 224,481 | | | | 468 | |
| | EUR/USD | | | 12/17/14 | | | | 457,481 | | | | 62 | |
| | GBP/EUR | | | 12/17/14 | | | | 230,004 | | | | 5,367 | |
| | USD/AUD | | | 12/17/14 | | | | 894,173 | | | | 23,963 | |
| | USD/BRL | | | 10/22/14 | | | | 222,500 | | | | 6,500 | |
| | USD/GBP | | | 12/17/14 | | | | 455,230 | | | | 1,745 | |
| | USD/MYR | | | 10/20/14 | | | | 227,338 | | | | 3,662 | |
| | USD/RUB | | | 10/27/14 | | | | 449,353 | | | | 7,647 | |
| | USD/TRY | | | 12/17/14 | | | | 221,826 | | | | 10,824 | |
Citibank NA (London) | | CHF/EUR | | | 12/17/14 | | | | 226,213 | | | | 678 | |
| | GBP/EUR | | | 12/17/14 | | | | 447,371 | | | | 2,431 | |
| | NOK/EUR | | | 12/17/14 | | | | 673,584 | | | | 9,180 | |
| | PHP/USD | | | 10/20/14 | | | | 114,023 | | | | 23 | |
| | USD/CAD | | | 12/17/14 | | | | 343,116 | | | | 4,884 | |
| | USD/CHF | | | 12/17/14 | | | | 712,559 | | | | 14,368 | |
| | USD/INR | | | 10/14/14 | | | | 457,975 | | | | 8,025 | |
| | USD/MYR | | | 10/29/14 | | | | 276,279 | | | | 1,071 | |
| | USD/NZD | | | 12/17/14 | | | | 322,844 | | | | 19,409 | |
| | USD/PHP | | | 10/14/14 | | | | 113,319 | | | | 2,681 | |
| | USD/SGD | | | 12/17/14 | | | | 375,778 | | | | 6,294 | |
| | USD/TRY | | | 12/17/14 | | | | 224,512 | | | | 7,488 | |
| | USD/TWD | | | 10/17/14 | | | | 457,186 | | | | 4,814 | |
| | USD/TWD | | | 10/20/14 | | | | 456,946 | | | | 4,054 | |
Credit Suisse International (London) | | USD/CHF | | | 12/17/14 | | | | 768,192 | | | | 16,004 | |
| | USD/RUB | | | 10/02/14 | | | | 227,058 | | | | 11,942 | |
Deutsche Bank AG (London) | | RUB/USD | | | 11/17/14 | | | | 56,186 | | | | 98 | |
| | USD/CNH | | | 12/17/14 | | | | 914,358 | | | | 3,642 | |
| | USD/EUR | | | 12/17/14 | | | | 226,213 | | | | 5,642 | |
| | USD/GBP | | | 10/22/14 | | | | 792,023 | | | | 11,973 | |
| | USD/KRW | | | 10/14/14 | | | | 456,428 | | | | 9,572 | |
| | USD/MXN | | | 12/17/14 | | | | 451,944 | | | | 6,056 | |
| | USD/MYR | | | 10/07/14 | | | | 533,696 | | | | 15,304 | |
| | |
| The accompanying notes are an integral part of these financial statements. | | 39 |
GOLDMAN SACHS BOND FUND
Schedule of Investments (continued)
September 30, 2014 (Unaudited)
|
| ADDITIONAL INVESTMENT INFORMATION (continued) |
FORWARD FOREIGN CURRENCY EXCHANGE CONTRACTS WITH UNREALIZED GAIN (continued)
| | | | | | | | | | | | | | |
| Counterparty | | Contracts to
Buy/Sell | | Settlement
Date | | | Current
Value | | | Unrealized
Gain | |
Deutsche Bank AG (London) (continued) | | USD/NZD | | | 12/17/14 | | | $ | 887,574 | | | $ | 17,835 | |
| | USD/PHP | | | 10/14/14 | | | | 113,342 | | | | 2,658 | |
| | USD/PHP | | | 10/20/14 | | | | 227,791 | | | | 3,209 | |
| | USD/RUB | | | 10/02/14 | | | | 56,668 | | | | 4 | |
| | USD/RUB | | | 11/17/14 | | | | 250,274 | | | | 17,819 | |
| | USD/SEK | | | 12/17/14 | | | | 436,720 | | | | 8,283 | |
| | USD/TWD | | | 10/20/14 | | | | 54,662 | | | | 383 | |
HSBC Bank PLC | | GBP/USD | | | 12/17/14 | | | | 234,905 | | | | 2,009 | |
| | SEK/EUR | | | 12/17/14 | | | | 458,745 | | | | 168 | |
| | TWD/USD | | | 10/20/14 | | | | 228,142 | | | | 142 | |
| | USD/BRL | | | 10/27/14 | | | | 92,433 | | | | 1,453 | |
| | USD/CNH | | | 12/17/14 | | | | 912,034 | | | | 966 | |
| | USD/GBP | | | 12/17/14 | | | | 466,570 | | | | 12,125 | |
| | USD/JPY | | | 12/17/14 | | | | 226,048 | | | | 4,952 | |
| | USD/KRW | | | 10/22/14 | | | | 67,251 | | | | 853 | |
| | USD/KRW | | | 10/23/14 | | | | 157,953 | | | | 2,047 | |
| | USD/NZD | | | 12/17/14 | | | | 322,844 | | | | 20,632 | |
| | USD/SGD | | | 12/17/14 | | | | 541,449 | | | | 10,174 | |
| | USD/TRY | | | 12/17/14 | | | | 236,304 | | | | 11,922 | |
JPMorgan Chase Bank (London) | | MXN/USD | | | 12/17/14 | | | | 228,754 | | | | 754 | |
| | SEK/EUR | | | 12/17/14 | | | | 845,456 | | | | 3,079 | |
| | USD/EUR | | | 10/30/14 | | | | 3,424,221 | | | | 88,308 | |
| | USD/EUR | | | 12/17/14 | | | | 226,213 | | | | 1,892 | |
| | USD/IDR | | | 10/31/14 | | | | 185,165 | | | | 3,735 | |
| | USD/INR | | | 10/29/14 | | | | 337,912 | | | | 4,088 | |
| | USD/JPY | | | 12/17/14 | | | | 772,502 | | | | 34,814 | |
| | USD/MXN | | | 12/17/14 | | | | 1,179,631 | | | | 20,569 | |
| | USD/RUB | | | 10/20/14 | | | | 110,941 | | | | 3,059 | |
| | USD/RUB | | | 11/17/14 | | | | 245,064 | | | | 15,665 | |
| | USD/TRY | | | 12/17/14 | | | | 446,950 | | | | 18,050 | |
Morgan Stanley & Co. International PLC | | TWD/USD | | | 10/17/14 | | | | 457,243 | | | | 243 | |
| | USD/AUD | | | 12/17/14 | | | | 302,454 | | | | 10,399 | |
| | USD/ILS | | | 12/17/14 | | | | 397,549 | | | | 24,388 | |
| | USD/TRY | | | 12/17/14 | | | | 224,753 | | | | 11,212 | |
Royal Bank of Canada | | USD/AUD | | | 12/17/14 | | | | 451,875 | | | | 1,669 | |
| | USD/CAD | | | 12/17/14 | | | | 1,139,238 | | | | 9,262 | |
| | USD/EUR | | | 10/30/14 | | | | 197,298 | | | | 4,523 | |
| | USD/INR | | | 10/14/14 | | | | 539,759 | | | | 7,058 | |
| | USD/JPY | | | 12/17/14 | | | | 227,268 | | | | 1,732 | |
Royal Bank of Scotland PLC | | USD/EUR | | | 12/17/14 | | | | 226,213 | | | | 5,741 | |
| | USD/GBP | | | 12/17/14 | | | | 453,610 | | | | 2,199 | |
| | USD/JPY | | | 12/17/14 | | | | 223,524 | | | | 974 | |
| | USD/MYR | | | 10/03/14 | | | | 41,963 | | | | 875 | |
| | USD/TRY | | | 12/17/14 | | | | 447,776 | | | | 10,224 | |
Standard Chartered Bank | | USD/AUD | | | 12/17/14 | | | | 807,027 | | | | 32,854 | |
| | USD/CNH | | | 12/17/14 | | | | 921,001 | | | | 2,999 | |
| | USD/EUR | | | 12/17/14 | | | | 224,949 | | | | 6,156 | |
| | USD/INR | | | 10/29/14 | | | | 190,990 | | | | 1,584 | |
| | USD/TRY | | | 12/17/14 | | | | 216,240 | | | | 11,096 | |
State Street Bank and Trust | | AUD/USD | | | 12/17/14 | | | | 456,664 | | | | 2,174 | |
| | USD/CHF | | | 12/17/14 | | | | 717,763 | | | | 15,726 | |
| | USD/JPY | | | 12/17/14 | | | | 676,177 | | | | 15,823 | |
| | |
| 40 | | The accompanying notes are an integral part of these financial statements. |
GOLDMAN SACHS BOND FUND
|
| ADDITIONAL INVESTMENT INFORMATION (continued) |
FORWARD FOREIGN CURRENCY EXCHANGE CONTRACTS WITH UNREALIZED GAIN (continued)
| | | | | | | | | | | | | | |
| Counterparty | | Contracts to
Buy/Sell | | Settlement
Date | | | Current
Value | | | Unrealized
Gain | |
State Street Bank and Trust (continued) | | USD/NZD | | | 12/17/14 | | | $ | 347,678 | | | $ | 21,948 | |
| | USD/SEK | | | 12/17/14 | | | | 403,286 | | | | 6,071 | |
UBS AG (London) | | NZD/USD | | | 12/17/14 | | | | 454,630 | | | | 1,389 | |
| | USD/BRL | | | 10/14/14 | | | | 451,172 | | | | 4,828 | |
| | USD/BRL | | | 10/24/14 | | | | 1,006,995 | | | | 83,571 | |
| | USD/EUR | | | 12/17/14 | | | | 226,213 | | | | 1,756 | |
| | USD/HUF | | | 12/17/14 | | | | 349,372 | | | | 8,718 | |
Westpac Banking Corp. | | AUD/USD | | | 12/17/14 | | | | 682,602 | | | | 1,732 | |
| | USD/AUD | | | 12/17/14 | | | | 1,092,791 | | | | 42,366 | |
| | USD/EUR | | | 10/30/14 | | | | 200,065 | | | | 4,595 | |
| | USD/EUR | | | 12/17/14 | | | | 974,359 | | | | 23,077 | |
| | USD/MYR | | | 10/07/14 | | | | 164,857 | | | | 4,783 | |
| | USD/MYR | | | 10/20/14 | | | | 229,470 | | | | 4,480 | |
| | USD/NZD | | | 12/17/14 | | | | 446,110 | | | | 27,205 | |
| | | USD/SGD | | | 12/17/14 | | | | 472,558 | | | | 8,915 | |
| TOTAL | | | | | | | | | | | | $ | 1,317,100 | |
FORWARD FOREIGN CURRENCY EXCHANGE CONTRACTS WITH UNREALIZED LOSS
| | | | | | | | | | | | | | |
| Counterparty | | Contracts to
Buy/Sell | | Settlement
Date | | | Current
Value | | | Unrealized
Loss | |
Bank of America Securities LLC | | EUR/GBP | | | 12/17/14 | | | $ | 467,074 | | | $ | (7,065 | ) |
| | EUR/USD | | | 12/17/14 | | | | 1,128,538 | | | | (18,295 | ) |
| | HUF/USD | | | 12/17/14 | | | | 223,754 | | | | (4,246 | ) |
Barclays Bank PLC | | EUR/PLN | | | 12/17/14 | | | | 459,411 | | | | (3,193 | ) |
| | EUR/USD | | | 12/17/14 | | | | 226,213 | | | | (5,266 | ) |
| | ILS/USD | | | 12/17/14 | | | | 103,329 | | | | (3,132 | ) |
| | INR/USD | | | 10/07/14 | | | | 49,449 | | | | (553 | ) |
| | JPY/USD | | | 12/17/14 | | | | 222,746 | | | | (9,254 | ) |
| | MYR/USD | | | 10/20/14 | | | | 182,728 | | | | (272 | ) |
| | MYR/USD | | | 10/29/14 | | | | 113,212 | | | | (788 | ) |
| | NZD/USD | | | 12/17/14 | | | | 217,634 | | | | (12,904 | ) |
| | PLN/USD | | | 12/17/14 | | | | 339,254 | | | | (11,148 | ) |
| | TWD/USD | | | 10/27/14 | | | | 226,490 | | | | (1,510 | ) |
BNP Paribas SA | | AUD/USD | | | 12/17/14 | | | | 440,557 | | | | (16,752 | ) |
| | GBP/USD | | | 12/17/14 | | | | 248,320 | | | | (6,319 | ) |
| | ILS/USD | | | 12/17/14 | | | | 342,570 | | | | (4,430 | ) |
| | INR/USD | | | 10/14/14 | | | | 114,057 | | | | (1,552 | ) |
| | PLN/USD | | | 12/17/14 | | | | 342,009 | | | | (7,889 | ) |
Citibank NA (London) | | AUD/USD | | | 12/17/14 | | | | 670,412 | | | | (13,585 | ) |
| | EUR/CHF | | | 12/17/14 | | | | 452,697 | | | | (271 | ) |
| | EUR/GBP | | | 12/17/14 | | | | 226,468 | | | | (2,782 | ) |
| | IDR/USD | | | 10/31/14 | | | | 185,165 | | | | (7,290 | ) |
| | ILS/USD | | | 12/17/14 | | | | 206,782 | | | | (5,218 | ) |
| | MXN/USD | | | 12/17/14 | | | | 465,024 | | | | (6,279 | ) |
| | MYR/USD | | | 10/03/14 | | | | 277,026 | | | | (892 | ) |
| | NOK/EUR | | | 12/17/14 | | | | 458,745 | | | | (677 | ) |
| | NZD/USD | | | 12/17/14 | | | | 219,183 | | | | (8,683 | ) |
| | PHP/USD | | | 10/29/14 | | | | 113,564 | | | | (436 | ) |
Credit Suisse International (London) | | EUR/CHF | | | 12/17/14 | | | | 459,001 | | | | (256 | ) |
| | RUB/USD | | | 10/02/14 | | | | 224,165 | | | | (14,835 | ) |
| | RUB/USD | | | 10/27/14 | | | | 442,995 | | | | (13,005 | ) |
| | |
| The accompanying notes are an integral part of these financial statements. | | 41 |
GOLDMAN SACHS BOND FUND
Schedule of Investments (continued)
September 30, 2014 (Unaudited)
|
| ADDITIONAL INVESTMENT INFORMATION (continued) |
FORWARD FOREIGN CURRENCY EXCHANGE CONTRACTS WITH UNREALIZED LOSS (continued)
| | | | | | | | | | | | | | |
| Counterparty | | Contracts to
Buy/Sell | | Settlement
Date | | | Current
Value | | | Unrealized
Loss | |
Deutsche Bank AG (London) | | AUD/USD | | | 12/17/14 | | | $ | 441,427 | | | $ | (17,241 | ) |
| | EUR/USD | | | 12/17/14 | | | | 1,362,334 | | | | (27,552 | ) |
| | IDR/USD | | | 11/03/14 | | | | 227,630 | | | | (370 | ) |
| | PHP/USD | | | 10/20/14 | | | | 227,849 | | | | (151 | ) |
| | RUB/USD | | | 10/02/14 | | | | 59,561 | | | | (3,127 | ) |
HSBC Bank PLC | | EUR/USD | | | 12/17/14 | | | | 449,899 | | | | (6,123 | ) |
| | MXN/USD | | | 12/17/14 | | | | 460,630 | | | | (5,851 | ) |
| | RUB/USD | | | 10/17/14 | | | | 111,679 | | | | (3,321 | ) |
| | SGD/USD | | | 12/17/14 | | | | 452,218 | | | | (3,782 | ) |
| | USD/GBP | | | 12/17/14 | | | | 464,950 | | | | (1,495 | ) |
JPMorgan Chase Bank (London) | | EUR/GBP | | | 12/17/14 | | | | 466,365 | | | | (12,675 | ) |
| | EUR/NOK | | | 12/17/14 | | | | 458,802 | | | | (6,376 | ) |
| | JPY/USD | | | 12/17/14 | | | | 901,321 | | | | (21,679 | ) |
| | MXN/USD | | | 10/31/14 | | | | 416,563 | | | | (5,745 | ) |
| | MYR/USD | | | 10/07/14 | | | | 967,637 | | | | (17,248 | ) |
| | MYR/USD | | | 10/20/14 | | | | 113,597 | | | | (403 | ) |
| | RUB/USD | | | 11/17/14 | | | | 210,081 | | | | (8,624 | ) |
| | SEK/USD | | | 12/17/14 | | | | 456,763 | | | | (8,237 | ) |
| | TRY/USD | | | 12/17/14 | | | | 223,239 | | | | (4,761 | ) |
| | USD/MXN | | | 12/17/14 | | | | 686,487 | | | | (1,487 | ) |
Morgan Stanley & Co. International PLC | | AUD/USD | | | 12/17/14 | | | | 444,039 | | | | (16,997 | ) |
| | BRL/USD | | | 10/14/14 | | | | 88,129 | | | | (3,852 | ) |
| | BRL/USD | | | 10/27/14 | | | | 223,143 | | | | (4,857 | ) |
| | CHF/USD | | | 12/17/14 | | | | 226,154 | | | | (4,846 | ) |
| | EUR/CHF | | | 12/17/14 | | | | 447,726 | | | | (355 | ) |
| | EUR/HUF | | | 12/17/14 | | | | 115,925 | | | | (2,187 | ) |
| | EUR/USD | | | 12/17/14 | | | | 1,362,966 | | | | (7,144 | ) |
| | KRW/USD | | | 10/27/14 | | | | 223,614 | | | | (4,386 | ) |
Royal Bank of Canada | | CAD/USD | | | 11/06/14 | | | | 378,413 | | | | (7,142 | ) |
| | CAD/USD | | | 12/17/14 | | | | 1,211,950 | | | | (19,944 | ) |
| | EUR/USD | | | 12/17/14 | | | | 456,218 | | | | (8,580 | ) |
| | GBP/USD | | | 12/17/14 | | | | 447,130 | | | | (7,221 | ) |
| | JPY/USD | | | 12/17/14 | | | | 444,202 | | | | (20,798 | ) |
| | MXN/USD | | | 12/17/14 | | | | 930,081 | | | | (17,986 | ) |
Royal Bank of Scotland PLC | | NZD/USD | | | 12/17/14 | | | | 217,634 | | | | (9,321 | ) |
| | TRY/USD | | | 12/17/14 | | | | 1,120,981 | | | | (36,004 | ) |
| | USD/TRY | | | 12/17/14 | | | | 228,831 | | | | (831 | ) |
Standard Chartered Bank | | CNH/USD | | | 12/17/14 | | | | 924,973 | | | | (5,027 | ) |
| | INR/USD | | | 10/07/14 | | | | 192,190 | | | | (1,199 | ) |
| | INR/USD | | | 10/14/14 | | | | 2,837,661 | | | | (31,339 | ) |
| | JPY/USD | | | 12/17/14 | | | | 1,009,904 | | | | (36,096 | ) |
| | KRW/USD | | | 10/14/14 | | | | 227,866 | | | | (134 | ) |
| | MXN/USD | | | 12/17/14 | | | | 724,382 | | | | (15,673 | ) |
| | PLN/USD | | | 12/17/14 | | | | 320,796 | | | | (10,171 | ) |
| | TRY/USD | | | 12/17/14 | | | | 224,710 | | | | (4,290 | ) |
State Street Bank and Trust | | AUD/USD | | | 12/17/14 | | | | 222,890 | | | | (4,832 | ) |
| | EUR/GBP | | | 12/17/14 | | | | 234,087 | | | | (4,083 | ) |
| | EUR/USD | | | 12/17/14 | | | | 456,218 | | | | (9,981 | ) |
| | GBP/USD | | | 12/17/14 | | | | 458,470 | | | | (6,108 | ) |
| | JPY/USD | | | 12/17/14 | | | | 791,389 | | | | (6,611 | ) |
UBS AG (London) | | BRL/USD | | | 10/14/14 | | | | 436,839 | | | | (28,161 | ) |
| | CHF/USD | | | 12/17/14 | | | | 225,956 | | | | (5,044 | ) |
| | |
| 42 | | The accompanying notes are an integral part of these financial statements. |
GOLDMAN SACHS BOND FUND
|
| ADDITIONAL INVESTMENT INFORMATION (continued) |
FORWARD FOREIGN CURRENCY EXCHANGE CONTRACTS WITH UNREALIZED LOSS (continued)
| | | | | | | | | | | | | | |
| Counterparty | | Contracts to
Buy/Sell | | Settlement
Date | | | Current
Value | | | Unrealized
Loss | |
UBS AG (London) (continued) | | INR/USD | | | 10/07/14 | | | $ | 228,925 | | | $ | (3,755 | ) |
| | PLN/USD | | | 12/17/14 | | | | 343,223 | | | | (7,076 | ) |
| | RUB/USD | | | 11/17/14 | | | | 243,834 | | | | (13,955 | ) |
Westpac Banking Corp. | | AUD/USD | | | 12/17/14 | | | | 1,333,859 | | | | (36,209 | ) |
| | | NZD/USD | | | 12/17/14 | | | | 1,043,991 | | | | (46,472 | ) |
| TOTAL | | | | | | | | | | | | $ | (793,692 | ) |
FORWARD SALES CONTRACTS — At September 30, 2014, the Fund had the following forward sales contracts:
| | | | | | | | | | | | | | | | | | |
| Description | | Interest
Rate | | | Maturity
Date(d) | | Settlement
Date | | | Principal
Amount | | | Value | |
FNMA (Proceeds Receivable: $8,834,688) | | | 3.000 | % | | TBA-30yr | | | 10/14/14 | | | $ | (9,000,000 | ) | | $ | (8,869,922 | ) |
FUTURES CONTRACTS — At September 30, 2014, the Fund had the following futures contracts:
| | | | | | | | | | | | | | |
| Type | | Number of
Contracts
Long (Short) | | | Expiration
Date | | Current
Value | | | Unrealized
Gain (Loss) | |
Eurodollars | | | (83 | ) | | December 2016 | | $ | (16,462,861 | ) | | $ | 7,823 | |
Eurodollars | | | (155 | ) | | March 2017 | | | (37,810,313 | ) | | | 42,058 | |
Eurodollars | | | (131 | ) | | June 2017 | | | (31,893,587 | ) | | | 46,331 | |
Eurodollars | | | (85 | ) | | September 2017 | | | (20,662,437 | ) | | | 44,259 | |
French 10 Year Government Bonds | | | (7 | ) | | December 2014 | | | (1,270,945 | ) | | | (12,226 | ) |
Italian 10 Year Government Bonds | | | 11 | | | December 2014 | | | 1,812,831 | | | | 18,144 | |
Ultra Long U.S. Treasury Bonds | | | (34 | ) | | December 2014 | | | (5,185,000 | ) | | | 72,279 | |
10 Year German Euro-Bund | | | 5 | | | December 2014 | | | 945,393 | | | | 3,136 | |
10 Year U.K. Long Gilt | | | (13 | ) | | December 2014 | | | (2,384,420 | ) | | | (10,449 | ) |
2 Year U.S. Treasury Notes | | | 408 | | | December 2014 | | | 89,288,250 | | | | (11,233 | ) |
5 Year U.S. Treasury Notes | | | (73 | ) | | December 2014 | | | (8,632,820 | ) | | | 7,894 | |
10 Year U.S. Treasury Notes | | | 14 | | | December 2014 | | | 1,744,969 | | | | 4,913 | |
20 Year U.S. Treasury Bonds | | | 133 | | | December 2014 | | | 18,341,531 | | | | (176,457 | ) |
| TOTAL | | | | | | | | | | | | $ | 36,472 | |
SWAP CONTRACTS — At September 30, 2014, the Fund had the following swap contracts:
OVER THE COUNTER INTEREST RATE SWAP CONTRACTS
| | | | | | | | | | | | | | | | | | | | |
| | | | | | | | | | | | Rates Exchanged | | | |
| Counterparty | | Notional
Amount
(000s) | | | Termination
Date | | | Payments
Received | | Payments
Made | | Unrealized
Gain (Loss)* | |
Bank of America Securities LLC | | | KRW | | | | 50,630 | | | | 01/16/24 | | | 3 month KWCDC | | 3.445% | | $ | (3,152 | ) |
Barclays Bank PLC | | | MYR | | | | 380 | | | | 08/14/23 | | | 3 month KLIBOR | | 4.485 | | | (1,653 | ) |
Citibank NA | | | | | | | 1,220 | | | | 11/19/18 | | | 3 month KLIBOR | | 3.915 | | | 586 | |
| | | KRW | | | | 2,257,900 | | | | 08/08/23 | | | 3 month KWCDC | | 3.450 | | | (136,930 | ) |
| | | | | | | 231,040 | | | | 08/16/23 | | | 3 month KWCDC | | 3.485 | | | (14,671 | ) |
| | | MYR | | | | 775 | | | | 11/15/23 | | | 3 month KLIBOR | | 4.450 | | | (2,514 | ) |
| | | KRW | | | | 129,770 | | | | 01/10/24 | | | 3 month KWCDC | | 3.475 | | | (8,408 | ) |
| | |
| The accompanying notes are an integral part of these financial statements. | | 43 |
GOLDMAN SACHS BOND FUND
Schedule of Investments (continued)
September 30, 2014 (Unaudited)
|
| ADDITIONAL INVESTMENT INFORMATION (continued) |
OVER THE COUNTER INTEREST RATE SWAP CONTRACTS (continued)
| | | | | | | | | | | | | | | | | | | | |
| | | | | | | | | | | | Rates Exchanged | | | |
| Counterparty | | Notional
Amount
(000s) | | | Termination
Date | | | Payments
Received | | Payments
Made | | Unrealized
Gain (Loss)* | |
Deutsche Bank AG | | | BRL | | | | 2,260 | | | | 01/02/17 | | | 12.650% | | 1 month Brazilian
Interbank Deposit
Average | | $ | 15,947 | |
| | | MYR | | | | 1,100 | | | | 11/14/18 | | | 3 month KLIBOR | | 3.880% | | | 963 | |
| | | | | | | 330 | | | | 08/14/23 | | | 3 month KLIBOR | | 4.490 | | | (1,473 | ) |
| | | KRW | | | | 128,620 | | | | 01/08/24 | | | 3 month KWCDC | | 3.470 | | | (8,287 | ) |
JPMorgan Securities, Inc. | | | | | | | 291,170 | | | | 08/19/23 | | | 3 month KWCDC | | 3.563 | | | (20,229 | ) |
| | | MYR | | | | 420 | | | | 09/26/23 | | | 3 month KLIBOR | | 4.330 | | | (174 | ) |
| | | KRW | | | | 257,820 | | | | 01/07/24 | | | 3 month KWCDC | | 3.471 | | | (16,636 | ) |
| | | | | | | 67,770 | | | | 01/13/24 | | | 3 month KWCDC | | 3.465 | | | (4,338 | ) |
| | | | | | | 133,720 | | | | 01/15/24 | | | 3 month KWCDC | | 3.445 | | | (8,328 | ) |
| | | | | | | 163,440 | | | | 01/16/24 | | | 3 month KWCDC | | 3.457 | | | (10,329 | ) |
| | | | | | | 224,325 | | | | 01/17/24 | | | 3 month KWCDC | | 3.440 | | | (13,872 | ) |
| | | | | | | 308,990 | | | | 01/27/24 | | | 3 month KWCDC | | 3.383 | | | (17,629 | ) |
Morgan Stanley & Co. International PLC | | | MYR | | | | 1,440 | | | | 11/20/18 | | | 3 month KLIBOR | | 3.934 | | | 413 | |
| | | KRW | | | | 225,810 | | | | 08/16/23 | | | 3 month KWCDC | | 3.485 | | | (14,360 | ) |
| | | | | | | | 115,670 | | | | 01/09/24 | | | 3 month KWCDC | | 3.455 | | | (7,311 | ) |
| TOTAL | | | | | | | | | | | | | | | | | | $ | (272,385 | ) |
| | * | | There are no upfront payments on the swap contract(s), therefore the unrealized gain (loss) on the swap contracts is equal to their market value. |
CENTRALLY CLEARED INTEREST RATE SWAP CONTRACTS
| | | | | | | | | | | | | | | | | | |
| | | | | | | Rates Exchanged | | Market Value | |
Notional
Amount
(000s) | | | Termination
Date | | | Payments
Received | | Payments
Made | | Upfront
Payments
Made (Received) | | | Unrealized
Gain (Loss) | |
| $ | 32,200 | | | | 03/19/16 | | | 0.750% | | 3 month LIBOR | | $ | 63 | | | $ | 99,745 | |
| | 1,700 | (a) | | | 02/01/17 | | | 3 month LIBOR | | 1.625% | | | (419 | ) | | | 919 | |
| | 6,200 | (a) | | | 08/04/17 | | | 3 month LIBOR | | 2.195 | | | (5,974 | ) | | | 3,942 | |
| GBP | 2,970 | (a) | | | 09/12/17 | | | 6 month GBP | | 2.250 | | | 6,549 | | | | (8,170 | ) |
| EUR | 3,360 | (a) | | | 12/17/19 | | | 1.000 | | 6 month EURO | | | 102,554 | | | | 6,297 | |
| $ | 6,200 | (a) | | | 12/17/19 | | | 3 month LIBOR | | 2.250 | | | (54,051 | ) | | | 737 | |
| SEK | 28,700 | (a) | | | 12/17/19 | | | 3 month STIBOR | | 1.250 | | | (34,973 | ) | | | 9,145 | |
| NZD | 5,520 | (a) | | | 12/17/19 | | | 4.500 | | 3 month NZDOR | | | (12,260 | ) | | | 29,470 | |
| AUD | 3,630 | (a) | | | 12/17/19 | | | 6 month AUDOR | | 3.750 | | | (35,486 | ) | | | (19,118 | ) |
| $ | 1,600 | (a) | | | 10/02/20 | | | 2.532 | | 3 month LIBOR | | | 8 | | | | — | |
| GBP | 1,090 | (a) | | | 02/05/21 | | | 2.840 | | 6 month GBP | | | (8,838 | ) | | | 36,842 | |
| $ | 9,500 | (a) | | | 08/04/21 | | | 3.025 | | 3 month LIBOR | | | 38,467 | | | | 13,196 | |
| GBP | 3,020 | (a) | | | 09/12/21 | | | 2.680 | | 6 month GBP | | | (39,245 | ) | | | 44,933 | |
| $ | 5,700 | (a) | | | 12/17/21 | | | 3 month LIBOR | | 2.500 | | | (13,545 | ) | | | (18,067 | ) |
| | 1,400 | (a) | | | 10/01/22 | | | 2.760 | | 3 month LIBOR | | | 11 | | | | (1,280 | ) |
| JPY | 139,170 | (a) | | | 12/19/23 | | | 1.250 | | 6 month JYOR | | | 19,464 | | | | 2,847 | |
| SEK | 6,380 | (a) | | | 12/19/23 | | | 3 month STIBOR | | 3.500 | | | (61,991 | ) | | | 15,546 | |
| CAD | 4,320 | (a) | | | 12/19/23 | | | 4.000 | | 6 month CDOR | | | 109,033 | | | | 33,279 | |
| $ | 3,735 | (a) | | | 12/19/23 | | | 4.500 | | 3 month LIBOR | | | 138,454 | | | | 42,206 | |
| AUD | 280 | (a) | | | 12/19/23 | | | 6 month AUDOR | | 5.500 | | | (10,588) | | | | (594) | |
| CHF | 2,350 | (a) | | | 12/19/23 | | | 6 month CHFOR | | 2.500 | | | (159,074 | ) | | | 8,433 | |
| | |
| 44 | | The accompanying notes are an integral part of these financial statements. |
GOLDMAN SACHS BOND FUND
|
| ADDITIONAL INVESTMENT INFORMATION (continued) |
CENTRALLY CLEARED INTEREST RATE SWAP CONTRACTS (continued)
| | | | | | | | | | | | | | | | | | |
| | | | | | | Rates Exchanged | | Market Value | |
Notional
Amount
(000s) | | | Termination
Date | | | Payments
Received | | Payments
Made | | Upfront
Payments
Made (Received) | | | Unrealized
Gain (Loss) | |
| EUR | 3,510 | (a) | | | 12/19/23 | | | 6 month EURO | | 3.250 % | | $ | (507,573 | ) | | $ | 165,221 | |
| GBP | 680 | (a) | | | 12/19/23 | | | 6 month GBP | | 3.750 | | | (38,754 | ) | | | 1,608 | |
| $ | 5,100 | (a) | | | 01/30/24 | | | 4.252% | | 3 month LIBOR | | | 5,990 | | | | 182,542 | |
| AUD | 2,580 | (a) | | | 09/17/24 | | | 4.500 | | 6 month AUDOR | | | (9,193 | ) | | | 12,832 | |
| GBP | 1,650 | (a) | | | 09/17/24 | | | 6 month GBP | | 3.250 | | | (11,197 | ) | | | (11,795 | ) |
| $ | 30,220 | (a) | | | 12/17/24 | | | 3 month LIBOR | | 3.000 | | | (841,814 | ) | | | 104,205 | |
| SEK | 2,830 | (a) | | | 12/17/24 | | | 3 month STIBOR | | 1.750 | | | 441 | | | | 1,224 | |
| CAD | 1,060 | (a) | | | 12/17/24 | | | 3.000 | | 6 month CDOR | | | 43,547 | | | | (14,822 | ) |
| AUD | 1,090 | (a) | | | 12/17/24 | | | 4.500 | | 6 month AUDOR | | | 38,519 | | | | 11,369 | |
| NZD | 3,260 | (a) | | | 12/17/24 | | | 5.000 | | 3 month NZDOR | | | 55,201 | | | | 26,092 | |
| EUR | 1,200 | (a) | | | 12/17/24 | | | 6 month EURO | | 2.000 | | | (132,495 | ) | | | 12,746 | |
| GBP | 1,210 | (a) | | | 12/17/24 | | | 6 month GBP | | 3.000 | | | (78,927 | ) | | | (1,628 | ) |
| JPY | 183,030 | (a) | | | 12/17/24 | | | 6 month JYOR | | 0.750 | | | (16,327 | ) | | | 5,362 | |
| NOK | 14,510 | (a) | | | 12/18/24 | | | 3 month NIBOR | | 3.500 | | | (18,799 | ) | | | (13,224 | ) |
| GBP | 2,000 | (a) | | | 12/18/24 | | | 3.250 | | 6 month GBP | | | 16,272 | | | | 8,446 | |
| EUR | 2,700 | (a) | | | 12/18/24 | | | 6 month EURO | | 2.000 | | | 5,151 | | | | (16,790 | ) |
| JPY | 1,828,000 | (a) | | | 05/09/25 | | | 6 month JYOR | | 1.650 | | | 23,487 | | | | (164,726 | ) |
| $ | 5,100 | (a) | | | 08/04/26 | | | 3 month LIBOR | | 3.409 | | | (34,960 | ) | | | (42,221 | ) |
| GBP | 1,640 | (a) | | | 09/12/26 | | | 6 month GBP | | 2.980 | | | 25,521 | | | | (42,103 | ) |
| $ | 1,000 | (a) | | | 09/28/26 | | | 3.280 | | 3 month LIBOR | | | 8 | | | | 1,345 | |
| JPY | 1,121,000 | (a) | | | 05/09/27 | | | 1.880 | | 6 month JYOR | | | (22,230 | ) | | | 182,967 | |
| $ | 7,800 | (a) | | | 12/17/29 | | | 3.250 | | 3 month LIBOR | | | 254,414 | | | | (22,541 | ) |
| GBP | 600 | (a) | | | 02/05/36 | | | 6 month GBP | | 3.500 | | | 5,190 | | | | (79,331 | ) |
| $ | 1,600 | (a) | | | 01/30/39 | | | 3 month LIBOR | | 4.370 | | | (58,030 | ) | | | (110,722 | ) |
| | 1,290 | (a) | | | 12/17/44 | | | 3.500 | | 3 month LIBOR | | | 42,527 | | | | 26,437 | |
| GBP | 1,200 | (a) | | | 12/17/44 | | | 6 month GBP | | 3.250 | | | (122,527 | ) | | | (20,518 | ) |
| | TOTAL | | | | | | | | | | | $ | (1,398,399 | ) | | $ | 502,283 | |
| | (a) | | Represents forward starting interest rate swaps whose effective dates of commencement of accruals and cash flows occur subsequent to September 30, 2014. |
OVER THE COUNTER CREDIT DEFAULT SWAP CONTRACTS
| | | | | | | | | | | | | | | | | | | | | | | | | | |
| | | | | | | | | | | | | | | | | Market Value | |
| Counterparty | | Referenced
Obligation | | Notional
Amount
(000s) | | | Rates Received
(Paid) | | | Termination
Date | | | Credit
Spread at
September 30,
2014(b) | | | Upfront
Payments
Made (Received) | | | Unrealized
Gain (Loss) | |
Protection Purchased: | | | | | | | | | | | | | | | | | | | | | | | | | | |
Bank of America Securities LLC | | People’s Republic of China, 4.250%, 10/28/14 | | $ | 100 | | | | (1.000 | )% | | | 06/20/19 | | | | 0.809 | % | | $ | (589 | ) | | $ | (303 | ) |
Barclays Bank PLC | | | | | 270 | | | | (1.000 | ) | | | 03/20/19 | | | | 0.760 | | | | (940 | ) | | | (1,921 | ) |
Citibank NA | | | | | 3080 | | | | (1.000 | ) | | | 03/20/19 | | | | 0.760 | | | | (12,861 | ) | | | (19,771 | ) |
| | | | | 4,940 | | | | (1.000 | ) | | | 06/20/19 | | | | 0.809 | | | | (22,915 | ) | | | (21,106 | ) |
JPMorgan Securities, Inc. | | | | | 270 | | | | (1.000 | ) | | | 03/20/19 | | | | 0.760 | | | | (847 | ) | | | (2,013 | ) |
| | | | | 120 | | | | (1.000 | ) | | | 06/20/19 | | | | 0.809 | | | | (766 | ) | | | (303 | ) |
| | |
| The accompanying notes are an integral part of these financial statements. | | 45 |
GOLDMAN SACHS BOND FUND
Schedule of Investments (continued)
September 30, 2014 (Unaudited)
|
| ADDITIONAL INVESTMENT INFORMATION (continued) |
OVER THE COUNTER CREDIT DEFAULT SWAP CONTRACTS (continued)
| | | | | | | | | | | | | | | | | | | | | | | | | | |
| | | | | | | | | | | | | | | | | Market Value | |
| Counterparty | | Referenced
Obligation | | Notional
Amount
(000s) | | | Rates Received
(Paid) | | | Termination
Date | | | Credit
Spread at
September 30,
2014(b) | | | Upfront
Payments
Made (Received) | | | Unrealized
Gain (Loss) | |
Protection Sold: | | | | | | | | | | | | | | | | | | | | | | | | | | |
Bank of America Securities LLC | | CDX North America Investment Grade Index 16 | | $ | 2,425 | | | | 1.000 | % | | | 06/20/16 | | | | 0.227 | % | | $ | 1,191 | | | $ | 31,913 | |
| TOTAL | | | | | | | | | | | | | | | | | | | | $ | (37,727 | ) | | $ | (13,504 | ) |
| | (b) | | Credit spread on the Referenced Obligation, together with the term of the swap contract, are indicators of payment/performance risk. The likelihood of a credit event occurring which would require a fund to make a payment or otherwise be required to perform under the swap contract is generally greater as the credit spread and the term of the swap contract increase. |
CENTRALLY CLEARED CREDIT DEFAULT SWAP CONTRACT
| | | | | | | | | | | | | | | | | | | | | | |
| | | | | | | | | | | | | | Market Value | |
| Referenced Obligation | | Notional
Amount
(000s) | | Rates Received
(Paid) | | | Termination
Date | | | Credit
Spread at
September 30,
2014(b) | | | Upfront
Payments
Made (Received) | | | Unrealized
Gain (Loss) | |
Protection Purchased: | | | | | | | | | | | | | | | | | | | | | | |
CDX North America Investment Grade Index 22 | | $14,375 | | | (1.000 | )% | | | 06/20/19 | | | | 0.644 | % | | $ | (234,784 | ) | | $ | 260 | |
| | (b) | | Credit spread on the Referenced Obligation, together with the term of the swap contract, are indicators of payment/performance risk. The likelihood of a credit event occurring which would require a fund to make a payment or otherwise be required to perform under the swap contract is generally greater as the credit spread and the term of the swap contract increase. |
| | |
| 46 | | The accompanying notes are an integral part of these financial statements. |
GOLDMAN SACHS CORE FIXED INCOME FUND
Schedule of Investments
September 30, 2014 (Unaudited)
| | | | | | | | | | | | | | |
Principal Amount | | | Interest
Rate | | | Maturity
Date | | | Value | |
| | Corporate Obligations – 30.5% | |
| | Automotive – 0.6% | |
| Ford Motor Credit Co. LLC | |
| $ | 5,250,000 | | | | 5.875 | % | | | 08/02/21 | | | $ | 6,033,124 | |
| | |
| | Banks – 9.4% | |
| American Express Co.(a)(b) | |
| | 2,125,000 | | | | 6.800 | | | | 09/01/66 | | | | 2,268,438 | |
| Australia & New Zealand Banking Group Ltd.(c) | |
| | 1,475,000 | | | | 4.500 | | | | 03/19/24 | | | | 1,487,679 | |
| Bank of America Corp. | |
| | 3,225,000 | | | | 4.125 | | | | 01/22/24 | | | | 3,276,328 | |
| | 2,300,000 | | | | 4.000 | | | | 04/01/24 | | | | 2,321,997 | |
| Bank of Scotland PLC(c) | |
| | 400,000 | | | | 5.250 | | | | 02/21/17 | | | | 437,145 | |
| Barclays Bank PLC | |
| | 2,200,000 | | | | 2.500 | | | | 02/20/19 | | | | 2,205,389 | |
| BB&T Corp.(b) | |
| | 2,025,000 | | | | 1.600 | | | | 08/15/17 | | | | 2,017,763 | |
| CBA Capital Trust II(a)(b)(c) | |
| | 4,140,000 | | | | 6.024 | | | | 12/31/49 | | | | 4,336,650 | |
| Citigroup, Inc. | |
| | 1,000,000 | | | | 3.375 | | | | 03/01/23 | | | | 983,147 | |
| Compass Bank | |
| | 875,000 | | | | 1.850 | (b) | | | 09/29/17 | | | | 874,801 | |
| | 1,000,000 | | | | 2.750 | (b) | | | 09/29/19 | | | | 998,588 | |
| | 1,950,000 | | | | 5.500 | | | | 04/01/20 | | | | 2,131,015 | |
| Credit Suisse AG(c) | |
| | 1,475,000 | | | | 6.500 | | | | 08/08/23 | | | | 1,604,264 | |
| Credit Suisse New York | |
| | 1,475,000 | | | | 2.300 | | | | 05/28/19 | | | | 1,461,411 | |
| HSBC Holdings PLC(a)(b) | |
| | 1,325,000 | | | | 6.375 | | | | 12/29/49 | | | | 1,319,861 | |
| ING Bank NV(a)(b) | |
| | 3,650,000 | | | | 4.125 | | | | 11/21/23 | | | | 3,713,620 | |
| Intesa Sanpaolo SPA | |
| | 3,400,000 | | | | 3.125 | | | | 01/15/16 | | | | 3,476,514 | |
| | 1,375,000 | | | | 2.375 | | | | 01/13/17 | | | | 1,384,658 | |
| | 3,850,000 | | | | 3.875 | | | | 01/16/18 | | | | 4,006,203 | |
| | 1,550,000 | | | | 5.017 | (c) | | | 06/26/24 | | | | 1,505,647 | |
| Lloyds Bank PLC | |
| | 1,575,000 | | | | 2.300 | | | | 11/27/18 | | | | 1,581,173 | |
| Macquarie Bank Ltd.(c) | |
| | 2,350,000 | | | | 2.600 | | | | 06/24/19 | | | | 2,348,094 | |
| Nordea Bank AB(a)(b)(c) | |
| | 1,500,000 | | | | 6.125 | | | | 12/29/49 | | | | 1,470,000 | |
| Northern Rock Asset Management PLC(c) | |
| | 8,900,000 | | | | 5.625 | | | | 06/22/17 | | | | 9,880,746 | |
| PNC Preferred Funding Trust II(a)(b)(c) | |
| | 3,200,000 | | | | 1.457 | | | | 03/29/49 | | | | 3,076,000 | |
| Regions Bank | |
| | 1,575,000 | | | | 7.500 | | | | 05/15/18 | | | | 1,836,037 | |
| Regions Financial Corp. | |
| | 3,475,000 | | | | 5.750 | | | | 06/15/15 | | | | 3,585,755 | |
| Resona Preferred Global Securities Ltd.(a)(b)(c) | |
| | 3,650,000 | | | | 7.191 | | | | 12/31/49 | | | | 3,805,125 | |
| Royal Bank of Scotland PLC | |
| | 2,825,000 | | | | 2.550 | | | | 09/18/15 | | | | 2,865,889 | |
| | 1,025,000 | | | | 9.500 | (a)(b) | | | 03/16/22 | | | | 1,168,500 | |
| | |
| | | | | | | | | | | | | | |
Principal Amount | | | Interest
Rate | | | Maturity
Date | | | Value | |
| | Corporate Obligations – (continued) | |
| | Banks – (continued) | |
| Santander Bank NA | |
| $ | 975,000 | | | | 8.750 | % | | | 05/30/18 | | | $ | 1,173,710 | |
| Santander Holdings USA, Inc.(b) | |
| | 1,400,000 | | | | 3.000 | | | | 09/24/15 | | | | 1,425,121 | |
| Santander UK PLC(c) | |
| | 1,125,000 | | | | 5.000 | | | | 11/07/23 | | | | 1,180,450 | |
| Sparebank 1 Boligkreditt AS(c) | |
| | 9,900,000 | | | | 2.625 | | | | 05/26/17 | | | | 10,179,758 | |
| | 600,000 | | | | 1.750 | | | | 11/15/20 | | | | 583,913 | |
| Sumitomo Mitsui Financial Group, Inc.(c) | |
| | 2,950,000 | | | | 4.436 | | | | 04/02/24 | | | | 3,021,889 | |
| SunTrust Banks, Inc.(b) | |
| | 2,450,000 | | | | 3.600 | | | | 04/15/16 | | | | 2,543,393 | |
| Synchrony Financial(b) | |
| | 575,000 | | | | 1.875 | | | | 08/15/17 | | | | 575,813 | |
| | 1,900,000 | | | | 3.000 | | | | 08/15/19 | | | | 1,904,094 | |
| Wells Fargo & Co.(a)(b) | |
| | 4,175,000 | | | | 5.900 | | | | 06/15/49 | | | | 4,253,281 | |
| | | | | | | | | | | | | | |
| | | | | | | | | | | | | 100,269,859 | |
| | |
| | Brokerage – 0.6% | |
| Morgan Stanley, Inc. | |
| | 5,625,000 | | | | 6.625 | | | | 04/01/18 | | | | 6,432,421 | |
| | |
| | Chemicals – 0.6% | |
| Ecolab, Inc. | |
| | 2,650,000 | | | | 1.450 | | | | 12/08/17 | | | | 2,626,437 | |
| | 975,000 | | | | 5.500 | | | | 12/08/41 | | | | 1,116,074 | |
| LyondellBasell Industries NV(b) | |
| | 1,188,000 | | | | 5.000 | | | | 04/15/19 | | | | 1,311,428 | |
| Monsanto Co.(b) | |
| | 1,725,000 | | | | 4.400 | | | | 07/15/44 | | | | 1,698,078 | |
| | | | | | | | | | | | | | |
| | | | | | | | | | | | | 6,752,017 | |
| | |
| | Consumer Products – 0.6% | |
| Avon Products, Inc. | |
| | 3,425,000 | | | | 4.600 | | | | 03/15/20 | | | | 3,497,820 | |
| Kimberly-Clark Corp. | |
| | 3,125,000 | | | | 3.700 | | | | 06/01/43 | | | | 2,887,888 | |
| | | | | | | | | | | | | | |
| | | | | | | | | | | | | 6,385,708 | |
| | |
| | Diversified Manufacturing(b) – 0.1% | |
| Amphenol Corp. | |
| | 1,225,000 | | | | 3.125 | | | | 09/15/21 | | | | 1,225,021 | |
| | |
| | Electric – 0.6% | |
| Florida Power & Light Co.(b) | |
| | 2,132,000 | | | | 4.125 | | | | 02/01/42 | | | | 2,135,317 | |
| Puget Sound Energy, Inc.(a)(b) | |
| | 1,180,000 | | | | 6.974 | | | | 06/01/67 | | | | 1,236,050 | |
| Ruwais Power Co. PJSC(c) | |
| | 740,000 | | | | 6.000 | | | | 08/31/36 | | | | 828,800 | |
| Southern California Edison Co.(b) | |
| | 1,950,000 | | | | 4.050 | | | | 03/15/42 | | | | 1,916,596 | |
| | | | | | | | | | | | | | |
| | | | | | | | | | | | | 6,116,763 | |
| | |
| | |
| The accompanying notes are an integral part of these financial statements. | | 47 |
GOLDMAN SACHS CORE FIXED INCOME FUND
Schedule of Investments (continued)
September 30, 2014 (Unaudited)
| | | | | | | | | | | | | | |
Principal Amount | | | Interest
Rate | | | Maturity
Date | | | Value | |
| | Corporate Obligations – (continued) | |
| | Energy – 2.2% | |
| Anadarko Petroleum Corp. | |
| $ | 1,350,000 | | | | 6.450 | % | | | 09/15/36 | | | $ | 1,642,715 | |
| BG Energy Capital PLC(a)(b) | |
| | 3,375,000 | | | | 6.500 | | | | 11/30/72 | | | | 3,669,272 | |
| Dolphin Energy Ltd.(c) | |
| | 1,080,625 | | | | 5.888 | | | | 06/15/19 | | | | 1,188,687 | |
| | 1,760,000 | | | | 5.500 | | | | 12/15/21 | | | | 1,971,376 | |
| Gazprom Neft OAO Via GPN Capital SA | |
| | 400,000 | | | | 4.375 | | | | 09/19/22 | | | | 343,000 | |
| Nexen, Inc. | |
| | 1,069,000 | | | | 6.400 | | | | 05/15/37 | | | | 1,297,087 | |
| Petrobras Global Finance BV | |
| | 2,770,000 | | | | 4.875 | | | | 03/17/20 | | | | 2,784,155 | |
| | 490,000 | | | | 6.250 | | | | 03/17/24 | | | | 512,197 | |
| Petroleos Mexicanos(c) | |
| | 1,180,000 | | | | 6.375 | | | | 01/23/45 | | | | 1,334,344 | |
| PTTEP Canada International Finance Ltd.(c) | |
| | 1,990,000 | | | | 5.692 | | | | 04/05/21 | | | | 2,238,352 | |
| Transocean, Inc. | |
| | 2,645,000 | | | | 6.500 | | | | 11/15/20 | | | | 2,790,474 | |
| Transportadora de Gas Internacional SA ESP(b) | |
| | 1,020,000 | | | | 5.700 | | | | 03/20/22 | | | | 1,081,200 | |
| Weatherford International Ltd. | |
| | 1,921,000 | | | | 9.625 | | | | 03/01/19 | | | | 2,466,979 | |
| | | | | | | | | | | | | | |
| | | | | | | | | | | | | 23,319,838 | |
| | |
| | Food & Beverage – 1.0% | |
| Pernod-Ricard SA(c) | |
| | 5,425,000 | | | | 4.450 | | | | 01/15/22 | | | | 5,732,907 | |
| SABMiller Holdings, Inc.(c) | |
| | 775,000 | | | | 4.950 | | | | 01/15/42 | | | | 806,494 | |
| Suntory Holdings Ltd.(c) | |
| | 2,550,000 | | | | 2.550 | | | | 09/29/19 | | | | 2,546,690 | |
| Sysco Corp.(b) | |
| | 1,550,000 | | | | 2.350 | | | | 10/02/19 | | | | 1,551,422 | |
| | | | | | | | | | | | | | |
| | | | | | | | | | | | | 10,637,513 | |
| | |
| | Health Care – Medical Products – 0.1% | |
| DENTSPLY International, Inc. | |
| | 1,550,000 | | | | 2.750 | | | | 08/15/16 | | | | 1,588,035 | |
| | |
| | Health Care – Services – 0.3% | |
| Express Scripts Holding Co. | |
| | 3,475,000 | | | | 3.125 | | | | 05/15/16 | | | | 3,590,270 | |
| | |
| | Home Construction – 0.3% | |
| MDC Holdings, Inc. | |
| | 1,950,000 | | | | 5.625 | | | | 02/01/20 | | | | 2,031,249 | |
| | 1,575,000 | | | | 6.000 | (b) | | | 01/15/43 | | | | 1,447,725 | |
| | | | | | | | | | | | | | |
| | | | | | | | | | | | | 3,478,974 | |
| | |
| | Life Insurance – 0.7% | |
| Genworth Financial, Inc. | |
| | 875,000 | | | | 8.625 | | | | 12/15/16 | | | | 1,004,828 | |
| Genworth Holdings, Inc. | |
| | 625,000 | | | | 7.200 | | | | 02/15/21 | | | | 737,633 | |
| Teachers Insurance & Annuity Association of America(c) | |
| | 1,760,000 | | | | 4.900 | | | | 09/15/44 | | | | 1,793,657 | |
| | |
| | | | | | | | | | | | | | |
Principal Amount | | | Interest
Rate | | | Maturity
Date | | | Value | |
| | Corporate Obligations – (continued) | |
| | Life Insurance – (continued) | |
| The Northwestern Mutual Life Insurance Co.(c) | |
| $ | 3,100,000 | | | | 6.063 | % | | | 03/30/40 | | | $ | 3,839,046 | |
| | | | | | | | | | | | | | |
| | | | | | | | | | | | | 7,375,164 | |
| | |
| | Media – Cable – 1.1% | |
| DIRECTV Holdings LLC/DIRECTV Financing Co., Inc. | |
| | 4,325,000 | | | | 3.800 | | | | 03/15/22 | | | | 4,406,970 | |
| Time Warner Cable, Inc. | |
| | 3,377,000 | | | | 7.300 | | | | 07/01/38 | | | | 4,562,346 | |
| | 725,000 | | | | 5.875 | (b) | | | 11/15/40 | | | | 848,069 | |
| | 1,594,000 | | | | 5.500 | (b) | | | 09/01/41 | | | | 1,784,402 | |
| | | | | | | | | | | | | | |
| | | | | | | | | | | | | 11,601,787 | |
| | |
| | Media – Non Cable – 0.4% | |
| NBCUniversal Media LLC | |
| | 3,850,000 | | | | 4.375 | | | | 04/01/21 | | | | 4,189,292 | |
| | |
| | Metals & Mining(c) – 0.7% | |
| Glencore Funding LLC | |
| | 5,025,000 | | | | 2.700 | | | | 10/25/17 | | | | 5,108,842 | |
| | 2,400,000 | | | | 2.500 | | | | 01/15/19 | | | | 2,349,408 | |
| | | | | | | | | | | | | | |
| | | | | | | | | | | | | 7,458,250 | |
| | |
| | Noncaptive – Financial – 0.8% | |
| GE Capital Trust I(a)(b) | |
| | 1,475,000 | | | | 6.375 | | | | 11/15/67 | | | | 1,604,063 | |
| General Electric Capital Corp. | |
| | 2,625,000 | | | | 5.875 | | | | 01/14/38 | | | | 3,157,256 | |
| International Lease Finance Corp. | |
| | 4,000,000 | | | | 5.750 | | | | 05/15/16 | | | | 4,160,000 | |
| | | | | | | | | | | | | | |
| | | | | | | | | | | | | 8,921,319 | |
| | |
| | Pharmaceuticals(c) – 0.2% | |
| Forest Laboratories, Inc. | |
| | 1,975,000 | | | | 4.375 | | | | 02/01/19 | | | | 2,083,625 | |
| | |
| | Pipelines – 1.3% | |
| Enterprise Products Operating LLC(a)(b) | |
| | 4,100,000 | | | | 8.375 | | | | 08/01/66 | | | | 4,499,750 | |
| | 1,350,000 | | | | 7.000 | | | | 06/01/67 | | | | 1,410,750 | |
| Tennessee Gas Pipeline Co. | |
| | 1,450,000 | | | | 8.375 | | | | 06/15/32 | | | | 1,916,822 | |
| TransCanada PipeLines Ltd.(a)(b) | |
| | 3,200,000 | | | | 6.350 | | | | 05/15/67 | | | | 3,264,000 | |
| Williams Partners LP(b) | |
| | 2,550,000 | | | | 3.900 | | | | 01/15/25 | | | | 2,511,844 | |
| | | | | | | | | | | | | | |
| | | | | | | | | | | | | 13,603,166 | |
| | |
| | Property/Casualty Insurance – 0.6% | |
| American International Group, Inc.(b) | |
| | 5,000,000 | | | | 4.500 | | | | 07/16/44 | | | | 4,955,392 | |
| Arch Capital Group Ltd. | |
| | 1,200,000 | | | | 7.350 | | | | 05/01/34 | | | | 1,608,769 | |
| | | | | | | | | | | | | | |
| | | | | | | | | | | | | 6,564,161 | |
| | |
| | Real Estate Investment Trusts – 3.4% | |
| American Campus Communities Operating Partnership LP(b) | |
| | 3,175,000 | | | | 3.750 | | | | 04/15/23 | | | | 3,152,563 | |
| | |
| | |
| 48 | | The accompanying notes are an integral part of these financial statements. |
GOLDMAN SACHS CORE FIXED INCOME FUND
| | | | | | | | | | | | | | |
Principal Amount | | | Interest
Rate | | | Maturity
Date | | | Value | |
| | Corporate Obligations – (continued) | |
| | Real Estate Investment Trusts – (continued) | |
| Camden Property Trust | |
| $ | 3,575,000 | | | | 5.700 | % | | | 05/15/17 | | | $ | 3,941,241 | |
| CBL & Associates LP(b) | |
| | 1,675,000 | | | | 5.250 | | | | 12/01/23 | | | | 1,793,324 | |
| DDR Corp. | |
| | 4,155,000 | | | | 7.500 | | | | 04/01/17 | | | | 4,723,199 | |
| ERP Operating LP(b) | |
| | 2,825,000 | | | | 4.500 | | | | 07/01/44 | | | | 2,799,557 | |
| HCP, Inc. | |
| | 1,500,000 | | | | 6.300 | | | | 09/15/16 | | | | 1,646,282 | |
| | 2,950,000 | | | | 6.000 | | | | 01/30/17 | | | | 3,255,867 | |
| Health Care REIT, Inc. | |
| | 2,125,000 | | | | 2.250 | | | | 03/15/18 | | | | 2,140,484 | |
| | 1,557,000 | | | | 4.125 | (b) | | | 04/01/19 | | | | 1,659,726 | |
| Healthcare Trust of America Holdings LP(b) | |
| | 2,275,000 | | | | 3.700 | | | | 04/15/23 | | | | 2,216,758 | |
| Kilroy Realty LP | |
| | 1,125,000 | | | | 5.000 | | | | 11/03/15 | | | | 1,174,523 | |
| | 2,375,000 | | | | 6.625 | | | | 06/01/20 | | | | 2,793,077 | |
| | 1,500,000 | | | | 3.800 | (b) | | | 01/15/23 | | | | 1,493,740 | |
| Senior Housing Properties Trust(b) | |
| | 1,425,000 | | | | 3.250 | | | | 05/01/19 | | | | 1,434,668 | |
| WEA Finance LLC/Westfield UK & Europe Finance PLC(b)(c) | |
| | 2,300,000 | | | | 3.750 | | | | 09/17/24 | | | | 2,293,760 | |
| | | | | | | | | | | | | | |
| | | | | | | | | | | | | 36,518,769 | |
| | |
| | Schools – 0.4% | |
| Rensselaer Polytechnic Institute | |
| | 4,200,000 | | | | 5.600 | | | | 09/01/20 | | | | 4,744,673 | |
| | |
| | Technology – Hardware – 0.4% | |
| Hewlett-Packard Co. | |
| | 2,775,000 | | | | 3.000 | | | | 09/15/16 | | | | 2,872,519 | |
| | 1,425,000 | | | | 2.600 | | | | 09/15/17 | | | | 1,463,562 | |
| | | | | | | | | | | | | | |
| | | | | | | | | | | | | 4,336,081 | |
| | |
| | Telecommunications – Cellular(c) – 0.2% | |
| ENTEL Chile SA | |
| | 1,800,000 | | | | 4.875 | | | | 10/30/24 | | | | 1,848,960 | |
| | |
| | Tobacco(c) – 0.5% | |
| Imperial Tobacco Finance PLC | |
| | 4,920,000 | | | | 2.050 | | | | 02/11/18 | | | | 4,900,084 | |
| | |
| | Transportation(c) – 0.5% | |
| ERAC USA Finance LLC | |
| | 3,525,000 | | | | 2.350 | | | | 10/15/19 | | | | 3,504,784 | |
| Penske Truck Leasing Co. LP/PTL Finance Corp. | |
| | 1,425,000 | | | | 4.250 | | | | 01/17/23 | | | | 1,465,279 | |
| | | | | | | | | | | | | | |
| | | | | | | | | | | | | 4,970,063 | |
| | |
| | Wirelines Telecommunications – 2.9% | |
| AT&T, Inc. | |
| | 2,550,000 | | | | 2.950 | | | | 05/15/16 | | | | 2,631,189 | |
| Telefonica Emisiones SAU | |
| | 2,300,000 | | | | 3.192 | | | | 04/27/18 | | | | 2,373,907 | |
| | 1,450,000 | | | | 5.462 | | | | 02/16/21 | | | | 1,613,100 | |
| Verizon Communications, Inc. | |
| | 6,181,000 | | | | 2.625 | (c) | | | 02/21/20 | | | | 6,099,565 | |
| | 3,300,000 | | | | 4.500 | | | | 09/15/20 | | | | 3,562,482 | |
| | |
| | | | | | | | | | | | | | |
Principal Amount | | | Interest
Rate | | | Maturity
Date | | | Value | |
| | Corporate Obligations – (continued) | |
| | Wirelines Telecommunications – (continued) | |
| Verizon Communications, Inc. – (continued) | |
| $ | 11,875,000 | | | | 5.150 | % | | | 09/15/23 | | | $ | 13,102,289 | |
| | 1,050,000 | | | | 4.150 | (b) | | | 03/15/24 | | | | 1,080,097 | |
| | | | | | | | | | | | | | |
| | | | | | | | | | | | | 30,462,629 | |
| | |
| | TOTAL CORPORATE OBLIGATIONS | |
| | (Cost $315,083,073) | | | $ | 325,407,566 | |
| | |
| | | | | | | | | | | | | | |
| | Mortgage-Backed Obligations – 31.9% | |
| | Adjustable Rate Non-Agency(a) – 2.6% | |
| Aire Valley Mortgages PLC Series 2005-1X, Class 2A3 | |
| $ | 2,386,383 | | | | 0.573 | % | | | 09/20/66 | | | $ | 2,349,797 | |
| Aire Valley Mortgages PLC Series 2006-1A, Class 1A(c) | |
| | 1,000,433 | | | | 0.453 | | | | 09/20/66 | | | | 980,403 | |
| Aire Valley Mortgages PLC Series 2007-1A, Class 2A1(c) | |
| | 2,138,005 | | | | 0.473 | | | | 09/20/66 | | | | 2,097,020 | |
| Granite Master Issuer PLC Series 2005-4, Class A6 | |
| GBP | 1,894,129 | | | | 0.749 | | | | 12/20/54 | | | | 3,060,325 | |
| Granite Master Issuer PLC Series 2006-1X, Class A7 | |
| | 2,446,583 | | | | 0.749 | | | | 12/20/54 | | | | 3,951,637 | |
| Granite Master Issuer PLC Series 2006-3, Class A4 | |
| $ | 4,064,486 | | | | 0.234 | | | | 12/20/54 | | | | 4,043,757 | |
| Granite Master Issuer PLC Series 2007-1, Class 2A1 | |
| | 2,091,434 | | | | 0.294 | | | | 12/20/54 | | | | 2,081,780 | |
| Granite Master Issuer PLC Series 2007-2, Class 4A2 | |
| GBP | 485,173 | | | | 0.726 | | | | 12/17/54 | | | | 783,603 | |
| Granite Mortgages PLC Series 2003-3, Class 3A | |
| | 299,555 | | | | 0.936 | | | | 01/20/44 | | | | 485,141 | |
| Harborview Mortgage Loan Trust Series 2005-16, Class 2A1A | |
| $ | 944,467 | | | | 0.393 | | | | 01/19/36 | | | | 616,075 | |
| Leek Finance Number Eighteen PLC Series 2018X, Class A2C | |
| EUR | 293,916 | | | | 0.472 | | | | 09/21/38 | | | | 387,701 | |
| Leek Finance Number Seventeen PLC Series 2017X, Class A2A | |
| GBP | 192,822 | | | | 0.833 | | | | 12/21/37 | | | | 328,979 | |
| Leek Finance PLC Series 2017X, Class A2C | |
| EUR | 417,781 | | | | 0.492 | | | | 12/21/37 | | | | 556,028 | |
| Leek Finance PLC Series 2018X, Class A2B | |
| $ | 2,008,426 | | | | 0.490 | | | | 09/21/38 | | | | 2,096,765 | |
| Master Adjustable Rate Mortgages Trust Series 2006-OA2,
Class 4A1A |
|
| | 1,488,372 | | | | 0.968 | | | | 12/25/46 | | | | 1,141,433 | |
| Sequoia Mortgage Trust Series 2003-4, Class 1A2 | |
| | 976,913 | | | | 0.987 | | | | 07/20/33 | | | | 924,190 | |
| Thrones PLC Series 2013-1, Class A | |
| GBP | 900,025 | | | | 2.028 | | | | 07/20/44 | | | | 1,485,378 | |
| Washington Mutual Mortgage Pass-Through Certificates
Series 2002-AR19, Class A7 |
|
| $ | 69,651 | | | | 2.437 | | | | 02/25/33 | | | | 69,690 | |
| | |
| TOTAL ADJUSTABLE RATE
NON-AGENCY |
| | $ | 27,439,702 | |
| | |
| | | | | | | | | | | | | | |
| | |
| The accompanying notes are an integral part of these financial statements. | | 49 |
GOLDMAN SACHS CORE FIXED INCOME FUND
Schedule of Investments (continued)
September 30, 2014 (Unaudited)
| | | | | | | | | | | | | | |
Principal Amount | | | Interest
Rate | | | Maturity
Date | | | Value | |
| | Mortgage-Backed Obligations – (continued) | |
| | Collateralized Mortgage Obligations – 2.2% | |
| | Interest Only(a)(d) – 0.0% | |
| CS First Boston Mortgage Securities Corp. Series 2002-AR31,
Class 5X |
|
| $ | 257,696 | | | | 0.000 | % | | | 11/25/32 | | | $ | — | |
| CS First Boston Mortgage Securities Corp. Series 2003-AR18,
Class 2X |
|
| | 818,118 | | | | 0.000 | | | | 07/25/33 | | | | 1 | |
| CS First Boston Mortgage Securities Corp. Series 2003-AR20,
Class 2X |
|
| | 1,047,206 | | | | 0.000 | | | | 08/25/33 | | | | 1 | |
| | | | | | | | | | | | | | |
| | | | | | | | | | | | | 2 | |
| | |
| | Inverse Floaters(a) – 0.1% | |
| GNMA Series 2001-48, Class SA | |
| | 49,527 | | | | 25.988 | | | | 10/16/31 | | | | 75,180 | |
| GNMA Series 2001-51, Class SA | |
| | 93,173 | | | | 31.834 | | | | 10/16/31 | | | | 153,855 | |
| GNMA Series 2001-51, Class SB | |
| | 96,290 | | | | 25.988 | | | | 10/16/31 | | | | 154,651 | |
| GNMA Series 2002-13, Class SB | |
| | 124,249 | | | | 36.850 | | | | 02/16/32 | | | | 198,822 | |
| | | | | | | | | | | | | | |
| | | | | | | | | | | | | 582,508 | |
| | |
| | Planned Amortization Class – 0.0% | |
| FHLMC REMIC Series 2639, Class UL | |
| | 365 | | | | 4.750 | | | | 03/15/22 | | | | 365 | |
| FNMA REMIC Series 2003-134, Class ME | |
| | 44,191 | | | | 4.500 | | | | 06/25/33 | | | | 46,455 | |
| FNMA REMIC Series 2004-64, Class BA | |
| | 29,654 | | | | 5.000 | | | | 03/25/34 | | | | 30,658 | |
| | | | | | | | | | | | | | |
| | | | | | | | | | | | | 77,478 | |
| | |
| | Sequential Fixed Rate – 2.1% | |
| FHLMC REMIC Series 2755, Class ZA | |
| | 1,111,399 | | | | 5.000 | | | | 02/15/34 | | | | 1,220,203 | |
| FHLMC REMIC Series 4273, Class PD | |
| | 3,305,830 | | | | 6.500 | | | | 11/15/43 | | | | 3,808,356 | |
| FNMA REMIC Series 2011-52, Class GB | |
| | 2,400,000 | | | | 5.000 | | | | 06/25/41 | | | | 2,662,976 | |
| FNMA REMIC Series 2011-99, Class DB | |
| | 2,125,000 | | | | 5.000 | | | | 10/25/41 | | | | 2,366,750 | |
| FNMA REMIC Series 2012-111, Class B | |
| | 653,908 | | | | 7.000 | | | | 10/25/42 | | | | 741,870 | |
| FNMA REMIC Series 2012-153, Class B | |
| | 1,888,516 | | | | 7.000 | | | | 07/25/42 | | | | 2,141,840 | |
| NCUA Guaranteed Notes Series 2010-C1, Class APT | |
| | 6,083,692 | | | | 2.650 | | | | 10/29/20 | | | | 6,244,910 | |
| NCUA Guaranteed Notes Series 2010-R1, Class 2A | |
| | 256,237 | | | | 1.840 | | | | 10/07/20 | | | | 257,328 | |
| NCUA Guaranteed Notes Series A4 | |
| | 3,500,000 | | | | 3.000 | | | | 06/12/19 | | | | 3,663,732 | |
| | | | | | | | | | | | | | |
| | | | | | | | | | | | | 23,107,965 | |
| | |
| TOTAL COLLATERALIZED
MORTGAGE OBLIGATIONS |
| | $ | 23,767,953 | |
| | |
| | |
| | | | | | | | | | | | | | |
Principal Amount | | | Interest
Rate | | | Maturity
Date | | | Value | |
| | Mortgage-Backed Obligations – (continued) | |
| | Commercial Mortgage-Backed Securities – 2.8% | |
| | Sequential Fixed Rate – 1.7% | |
| FHLMC Multifamily Structured Pass-Through Certificates
Series K020, Class A2 |
|
| $ | 800,000 | | | | 2.373 | % | | | 05/25/22 | | | $ | 783,084 | |
| FHLMC Multifamily Structured Pass-Through Certificates
Series K030, Class A1 |
|
| | 1,431,320 | | | | 2.779 | | | | 09/25/22 | | | | 1,467,772 | |
| LB-UBS Commercial Mortgage Trust Series 2006-C1, Class A4 | |
| | 6,000,000 | | | | 5.156 | | | | 02/15/31 | | | | 6,210,887 | |
| Wachovia Bank Commercial Mortgage Trust Series 2007-C31,
Class A4 |
|
| | 9,000,000 | | | | 5.509 | | | | 04/15/47 | | | | 9,622,447 | |
| | | | | | | | | | | | | | |
| | | | | | | | | | | | | 18,084,190 | |
| | |
| | Sequential Floating Rate(a) – 1.1% | |
| Citigroup Commercial Mortgage Trust Series 2008-C7,
Class A1A |
|
| | 10,466,861 | | | | 6.047 | | | | 12/10/49 | | | | 11,661,476 | |
| | |
| TOTAL COMMERCIAL
MORTGAGE-BACKED SECURITIES |
| | $ | 29,745,666 | |
| | |
| | Federal Agencies – 24.3% | |
| | Adjustable Rate FNMA(a) – 1.0% | |
| $ | 11,543 | | | | 2.340 | % | | | 06/01/33 | | | $ | 12,258 | |
| | 1,768,965 | | | | 2.207 | | | | 07/01/34 | | | | 1,879,670 | |
| | 4,131,102 | | | | 2.113 | | | | 09/01/34 | | | | 4,363,472 | |
| | 3,129,160 | | | | 2.358 | | | | 05/01/35 | | | | 3,334,210 | |
| | 626,210 | | | | 1.881 | | | | 06/01/35 | | | | 657,015 | |
| | | | | | | | | | | | | | |
| | | | | | | | | | | | | 10,246,625 | |
| | |
| | FHLMC – 0.9% | |
| | 4 | | | | 7.000 | | | | 10/01/14 | | | | 4 | |
| | 141 | | | | 7.000 | | | | 05/01/15 | | | | 142 | |
| | 1,661 | | | | 8.000 | | | | 07/01/15 | | | | 1,681 | |
| | 1,581 | | | | 7.000 | | | | 02/01/16 | | | | 1,599 | |
| | 2,891 | | | | 7.000 | | | | 03/01/16 | | | | 2,913 | |
| | 45,740 | | | | 7.500 | | | | 05/01/16 | | | | 47,194 | |
| | 665 | | | | 5.000 | | | | 01/01/17 | | | | 702 | |
| | 5,064 | | | | 5.000 | | | | 02/01/17 | | | | 5,342 | |
| | 4,541 | | | | 5.000 | | | | 03/01/17 | | | | 4,791 | |
| | 330 | | | | 5.000 | | | | 04/01/17 | | | | 348 | |
| | 30,120 | | | | 5.000 | | | | 09/01/17 | | | | 31,779 | |
| | 80,751 | | | | 5.000 | | | | 10/01/17 | | | | 85,201 | |
| | 336 | | | | 7.000 | | | | 10/01/17 | | | | 354 | |
| | 52,877 | | | | 5.000 | | | | 11/01/17 | | | | 55,790 | |
| | 22,930 | | | | 5.000 | | | | 12/01/17 | | | | 24,192 | |
| | 31,263 | | | | 5.000 | | | | 01/01/18 | | | | 32,962 | |
| | 80,016 | | | | 5.000 | | | | 02/01/18 | | | | 84,325 | |
| | 56,036 | | | | 5.000 | | | | 03/01/18 | | | | 59,150 | |
| | 40,115 | | | | 5.000 | | | | 04/01/18 | | | | 42,357 | |
| | 25,123 | | | | 5.000 | | | | 05/01/18 | | | | 26,549 | |
| | 18,624 | | | | 5.000 | | | | 06/01/18 | | | | 19,686 | |
| | 38,345 | | | | 5.000 | | | | 07/01/18 | | | | 40,607 | |
| | 11,928 | | | | 5.000 | | | | 08/01/18 | | | | 12,616 | |
| | 61,235 | | | | 4.500 | | | | 09/01/18 | | | | 64,572 | |
| | 5,239 | | | | 5.000 | | | | 10/01/18 | | | | 5,563 | |
| | |
| | |
| 50 | | The accompanying notes are an integral part of these financial statements. |
GOLDMAN SACHS CORE FIXED INCOME FUND
| | | | | | | | | | | | | | |
Principal Amount | | | Interest
Rate | | | Maturity
Date | | | Value | |
| | Mortgage-Backed Obligations – (continued) | |
| | FHLMC – (continued) | |
| $ | 10,414 | | | | 5.000 | % | | | 11/01/18 | | | $ | 11,057 | |
| | 106,517 | | | | 5.000 | | | | 06/01/19 | | | | 113,697 | |
| | 152,172 | | | | 5.000 | | | | 05/01/23 | | | | 167,867 | |
| | 427,133 | | | | 4.500 | | | | 10/01/23 | | | | 460,883 | |
| | 61,365 | | | | 5.500 | | | | 10/01/25 | | | | 68,129 | |
| | 78,275 | | | | 5.500 | | | | 11/01/25 | | | | 86,904 | |
| | 11,143 | | | | 7.000 | | | | 06/01/26 | | | | 12,184 | |
| | 21,761 | | | | 7.500 | | | | 12/01/30 | | | | 23,866 | |
| | 31,777 | | | | 7.500 | | | | 01/01/31 | | | | 37,031 | |
| | 801,466 | | | | 5.500 | | | | 03/01/33 | | | | 899,150 | |
| | 35,529 | | | | 5.000 | | | | 10/01/33 | | | | 39,276 | |
| | 90,316 | | | | 6.500 | | | | 10/01/33 | | | | 103,437 | |
| | 1,004 | | | | 5.500 | | | | 12/01/33 | | | | 1,126 | |
| | 32,135 | | | | 5.500 | | | | 09/01/34 | | | | 36,051 | |
| | 3,009 | | | | 5.500 | | | | 12/01/34 | | | | 3,375 | |
| | 3,009 | | | | 5.500 | | | | 03/01/35 | | | | 3,360 | |
| | 6,231 | | | | 5.000 | | | | 04/01/35 | | | | 6,888 | |
| | 52,691 | | | | 5.000 | | | | 07/01/35 | | | | 58,279 | |
| | 104,172 | | | | 5.500 | | | | 11/01/35 | | | | 116,346 | |
| | 274,772 | | | | 5.000 | | | | 12/01/35 | | | | 303,741 | |
| | 614 | | | | 5.500 | | | | 02/01/36 | | | | 685 | |
| | 125,195 | | | | 5.500 | | | | 06/01/36 | | | | 139,806 | |
| | 118,485 | | | | 5.500 | | | | 08/01/37 | | | | 131,651 | |
| | 534,969 | | | | 5.000 | | | | 01/01/38 | | | | 589,042 | |
| | 295,876 | | | | 5.500 | | | | 03/01/38 | | | | 328,823 | |
| | 113,971 | | | | 5.500 | | | | 04/01/38 | | | | 126,636 | |
| | 166,835 | | | | 5.500 | | | | 08/01/38 | | | | 185,413 | |
| | 4,041 | | | | 5.500 | | | | 09/01/38 | | | | 4,490 | |
| | 6,635 | | | | 6.500 | | | | 09/01/38 | | | | 7,565 | |
| | 19,301 | | | | 5.500 | | | | 11/01/38 | | | | 21,670 | |
| | 31,645 | | | | 5.500 | | | | 12/01/38 | | | | 35,338 | |
| | 1,504,826 | | | | 5.000 | | | | 01/01/39 | | | | 1,658,109 | |
| | 1,777,322 | | | | 7.000 | | | | 02/01/39 | | | | 2,022,398 | |
| | 10,041 | | | | 5.500 | | | | 03/01/39 | | | | 11,293 | |
| | 401,503 | | | | 5.000 | | | | 06/01/39 | | | | 442,400 | |
| | 12,968 | | | | 5.500 | | | | 10/01/39 | | | | 14,585 | |
| | 24,417 | | | | 5.500 | | | | 03/01/40 | | | | 27,130 | |
| | 62,012 | | | | 5.500 | | | | 06/01/40 | | | | 68,918 | |
| | 42,735 | | | | 5.000 | | | | 08/01/40 | | | | 47,187 | |
| | 10,013 | | | | 4.500 | | | | 11/01/40 | | | | 10,809 | |
| | 32,202 | | | | 5.000 | | | | 04/01/41 | | | | 35,636 | |
| | 35,269 | | | | 5.000 | | | | 06/01/41 | | | | 39,029 | |
| | | | | | | | | | | | | | |
| | | | | | | | | | | | | 9,151,679 | |
| | |
| | FNMA – 21.5% | |
| | 1,011,082 | | | | 7.040 | | | | 08/01/15 | | | | 1,042,873 | |
| | 21,282 | | | | 8.500 | | | | 10/01/15 | | | | 21,766 | |
| | 711 | | | | 7.000 | | | | 01/01/16 | | | | 722 | |
| | 4,652,259 | | | | 2.800 | | | | 03/01/18 | | | | 4,815,256 | |
| | 2,858,849 | | | | 3.740 | | | | 05/01/18 | | | | 3,051,101 | |
| | 3,480,000 | | | | 3.840 | | | | 05/01/18 | | | | 3,727,369 | |
| | 58,827 | | | | 5.000 | | | | 06/01/18 | | | | 62,274 | |
| | 542,701 | | | | 4.500 | | | | 07/01/18 | | | | 573,737 | |
| | 32,121 | | | | 4.500 | | | | 08/01/18 | | | | 33,958 | |
| | 4,746 | | | | 6.000 | | | | 08/01/18 | | | | 5,358 | |
| | 950 | | | | 6.500 | | | | 10/01/18 | | | | 1,075 | |
| | |
| | | | | | | | | | | | | | |
Principal Amount | | | Interest
Rate | | | Maturity
Date | | | Value | |
| | Mortgage-Backed Obligations – (continued) | |
| | FNMA – (continued) | |
| $ | 9,000,000 | | | | 4.506 | % | | | 06/01/19 | | | $ | 9,731,092 | |
| | 2,169,770 | | | | 3.416 | | | | 10/01/20 | | | | 2,288,617 | |
| | 1,522,263 | | | | 3.632 | | | | 12/01/20 | | | | 1,621,658 | |
| | 9,626,822 | | | | 3.763 | | | | 12/01/20 | | | | 10,303,875 | |
| | 4,099,165 | | | | 4.375 | | | | 06/01/21 | | | | 4,522,498 | |
| | 3,060,307 | | | | 5.000 | | | | 03/01/23 | | | | 3,376,237 | |
| | 223,542 | | | | 5.500 | | | | 09/01/23 | | | | 242,372 | |
| | 65,942 | | | | 5.500 | | | | 10/01/23 | | | | 71,542 | |
| | 660,083 | | | | 5.000 | | | | 02/01/24 | | | | 711,895 | |
| | 113,632 | | | | 6.000 | | | | 03/01/27 | | | | 128,617 | |
| | 76,596 | | | | 7.000 | | | | 08/01/27 | | | | 84,214 | |
| | 2,427 | | | | 6.500 | | | | 09/01/27 | | | | 2,747 | |
| | 378,477 | | | | 7.000 | | | | 03/01/28 | | | | 415,200 | |
| | 4,833 | | | | 6.500 | | | | 05/01/28 | | | | 5,471 | |
| | 738 | | | | 5.500 | | | | 01/01/29 | | | | 821 | |
| | 19,392 | | | | 8.000 | | | | 02/01/31 | | | | 22,719 | |
| | 133,013 | | | | 7.000 | | | | 03/01/31 | | | | 150,952 | |
| | 223,782 | | | | 5.500 | | | | 05/01/33 | | | | 251,427 | |
| | 330,317 | | | | 5.500 | | | | 06/01/33 | | | | 371,123 | |
| | 70,392 | | | | 5.000 | | | | 07/01/33 | | | | 78,268 | |
| | 213,113 | | | | 5.500 | | | | 07/01/33 | | | | 239,440 | |
| | 89,730 | | | | 5.000 | | | | 08/01/33 | | | | 99,460 | |
| | 478,696 | | | | 5.000 | | | | 09/01/33 | | | | 528,798 | |
| | 56,452 | | | | 5.500 | | | | 09/01/33 | | | | 63,403 | |
| | 5,128 | | | | 6.500 | | | | 09/01/33 | | | | 5,857 | |
| | 32,738 | | | | 5.000 | | | | 12/01/33 | | | | 36,164 | |
| | 1,190 | | | | 5.500 | | | | 12/01/33 | | | | 1,338 | |
| | 1,535 | | | | 5.500 | | | | 01/01/34 | | | | 1,722 | |
| | 26,196 | | | | 5.500 | | | | 02/01/34 | | | | 29,394 | |
| | 3,560 | | | | 5.500 | | | | 04/01/34 | | | | 4,022 | |
| | 11,495 | | | | 5.500 | | | | 05/01/34 | | | | 12,898 | |
| | 4,118 | | | | 6.000 | | | | 07/01/34 | | | | 4,705 | |
| | 9,941 | | | | 5.500 | | | | 08/01/34 | | | | 11,199 | |
| | 16,623 | | | | 5.500 | | | | 10/01/34 | | | | 18,676 | |
| | 28,533 | | | | 5.500 | | | | 11/01/34 | | | | 32,055 | |
| | 140,059 | | | | 5.500 | | | | 12/01/34 | | | | 157,046 | |
| | 353 | | | | 6.000 | | | | 12/01/34 | | | | 399 | |
| | 213,586 | | | | 6.000 | | | | 02/01/35 | | | | 241,629 | |
| | 295,259 | | | | 5.000 | | | | 04/01/35 | | | | 327,703 | |
| | 11,623 | | | | 5.500 | | | | 04/01/35 | | | | 13,030 | |
| | 11,254 | | | | 5.500 | | | | 07/01/35 | | | | 12,618 | |
| | 773,226 | | | | 5.500 | | | | 08/01/35 | | | | 868,749 | |
| | 34,847 | | | | 5.500 | | | | 09/01/35 | | | | 39,125 | |
| | 2,194 | | | | 5.500 | | | | 12/01/35 | | | | 2,476 | |
| | 536 | | | | 5.500 | | | | 02/01/36 | | | | 600 | |
| | 216,194 | | | | 5.500 | | | | 03/01/36 | | | | 241,944 | |
| | 31,555 | | | | 6.000 | | | | 03/01/36 | | | | 35,618 | |
| | 2,262 | | | | 5.500 | | | | 04/01/36 | | | | 2,517 | |
| | 6,666 | | | | 6.000 | | | | 04/01/36 | | | | 7,525 | |
| | 2,439,267 | | | | 5.500 | | | | 09/01/36 | | | | 2,740,343 | |
| | 629,334 | | | | 6.000 | | | | 10/01/36 | | | | 710,455 | |
| | 4,298 | | | | 5.500 | | | | 01/01/37 | | | | 4,804 | |
| | 798,943 | | | | 6.000 | | | | 01/01/37 | | | | 901,887 | |
| | 1,800 | | | | 5.500 | | | | 02/01/37 | | | | 2,011 | |
| | 839,589 | | | | 6.000 | | | | 02/01/37 | | | | 947,566 | |
| | 2,574 | | | | 6.000 | | | | 03/01/37 | | | | 2,905 | |
| | |
| | |
| The accompanying notes are an integral part of these financial statements. | | 51 |
GOLDMAN SACHS CORE FIXED INCOME FUND
Schedule of Investments (continued)
September 30, 2014 (Unaudited)
| | | | | | | | | | | | | | |
Principal Amount | | | Interest
Rate | | | Maturity
Date | | | Value | |
| | Mortgage-Backed Obligations – (continued) | |
| | FNMA – (continued) | |
| $ | 3,315 | | | | 5.500 | % | | | 04/01/37 | | | $ | 3,703 | |
| | 26,304 | | | | 6.000 | | | | 04/01/37 | | | | 29,687 | |
| | 4,576 | | | | 5.500 | | | | 05/01/37 | | | | 5,105 | |
| | 1,424 | | | | 5.500 | | | | 06/01/37 | | | | 1,590 | |
| | 1,742 | | | | 5.500 | | | | 07/01/37 | | | | 1,939 | |
| | 887,518 | | | | 6.000 | | | | 07/01/37 | | | | 1,001,778 | |
| | 100 | | | | 5.500 | | | | 08/01/37 | | | | 111 | |
| | 943,617 | | | | 6.000 | | | | 08/01/37 | | | | 1,064,973 | |
| | 2,074,226 | | | | 6.000 | | | | 09/01/37 | | | | 2,340,987 | |
| | 860,697 | | | | 6.000 | | | | 10/01/37 | | | | 971,389 | |
| | 643 | | | | 5.500 | | | | 12/01/37 | | | | 718 | |
| | 767,567 | | | | 5.500 | | | | 01/01/38 | | | | 862,389 | |
| | 763,334 | | | | 6.000 | | | | 01/01/38 | | | | 861,505 | |
| | 30,324 | | | | 5.000 | | | | 02/01/38 | | | | 32,844 | |
| | 1,859 | | | | 5.500 | | | | 02/01/38 | | | | 2,077 | |
| | 10,425 | | | | 5.500 | | | | 03/01/38 | | | | 11,619 | |
| | 87,530 | | | | 6.000 | | | | 03/01/38 | | | | 98,789 | |
| | 2,254 | | | | 5.500 | | | | 05/01/38 | | | | 2,519 | |
| | 4,868,573 | | | | 6.000 | | | | 05/01/38 | | | | 5,494,735 | |
| | 11,418 | | | | 5.500 | | | | 06/01/38 | | | | 12,729 | |
| | 113,648 | | | | 6.000 | | | | 06/01/38 | | | | 128,264 | |
| | 8,481 | | | | 5.500 | | | | 07/01/38 | | | | 9,463 | |
| | 4,299 | | | | 5.500 | | | | 08/01/38 | | | | 4,783 | |
| | 4,304 | | | | 5.500 | | | | 09/01/38 | | | | 4,789 | |
| | 656,349 | | | | 6.000 | | | | 11/01/38 | | | | 740,772 | |
| | 6,432 | | | | 5.500 | | | | 12/01/38 | | | | 7,226 | |
| | 627,368 | | | | 6.000 | | | | 12/01/38 | | | | 708,102 | |
| | 153,632 | | | | 6.000 | | | | 02/01/39 | | | | 173,403 | |
| | 1,127,459 | | | | 7.000 | | | | 03/01/39 | | | | 1,278,054 | |
| | 73,666 | | | | 4.500 | | | | 04/01/39 | | | | 80,224 | |
| | 715,136 | | | | 6.000 | | | | 04/01/39 | | | | 807,108 | |
| | 20,033 | | | | 4.500 | | | | 05/01/39 | | | | 21,829 | |
| | 24,262 | | | | 5.500 | | | | 06/01/39 | | | | 26,998 | |
| | 16,531 | | | | 4.500 | | | | 07/01/39 | | | | 18,013 | |
| | 113,852 | | | | 4.500 | | | | 08/01/39 | | | | 124,059 | |
| | 1,188,116 | | | | 6.000 | | | | 09/01/39 | | | | 1,340,917 | |
| | 395,257 | | | | 6.000 | | | | 10/01/39 | | | | 446,205 | |
| | 21,858 | | | | 5.500 | | | | 11/01/39 | | | | 24,323 | |
| | 6,726,678 | | | | 6.000 | | | | 11/01/39 | | | | 7,592,100 | |
| | 864,873 | | | | 4.500 | | | | 12/01/39 | | | | 942,408 | |
| | 1,562,916 | | | | 5.500 | | | | 12/01/39 | | | | 1,746,376 | |
| | 96,329 | | | | 6.000 | | | | 04/01/40 | | | | 108,725 | |
| | 317,784 | | | | 6.000 | | | | 10/01/40 | | | | 358,653 | |
| | 738,615 | | | | 6.000 | | | | 04/01/41 | | | | 833,607 | |
| | 4,928,049 | | | | 6.000 | | | | 05/01/41 | | | | 5,561,832 | |
| | 326,395 | | | | 4.500 | | | | 08/01/41 | | | | 352,851 | |
| | 84,386 | | | | 4.500 | | | | 10/01/41 | | | | 91,187 | |
| | 2,166,229 | | | | 3.000 | | | | 08/01/42 | | | | 2,152,710 | |
| | 1,902,842 | | | | 3.000 | | | | 09/01/42 | | | | 1,891,039 | |
| | 323,619 | | | | 3.000 | | | | 10/01/42 | | | | 321,634 | |
| | 1,336,660 | | | | 3.000 | | | | 11/01/42 | | | | 1,328,084 | |
| | 12,671,245 | | | | 3.000 | | | | 12/01/42 | | | | 12,583,148 | |
| | 9,425,656 | | | | 3.000 | | | | 01/01/43 | | | | 9,364,217 | |
| | 3,757,270 | | | | 3.000 | | | | 02/01/43 | | | | 3,730,583 | |
| | 5,655,655 | | | | 2.500 | | | | 03/01/43 | | | | 5,366,828 | |
| | 2,264,665 | | | | 3.000 | | | | 03/01/43 | | | | 2,250,066 | |
| | |
| | | | | | | | | | | | | | |
Principal Amount | | | Interest
Rate | | | Maturity
Date | | | Value | |
| | Mortgage-Backed Obligations – (continued) | |
| | FNMA – (continued) | |
| $ | 2,997,172 | | | | 3.000 | % | | | 04/01/43 | | | $ | 2,976,801 | |
| | 1,814,834 | | | | 3.000 | | | | 05/01/43 | | | | 1,803,348 | |
| | 179,288 | | | | 3.000 | | | | 06/01/43 | | | | 178,077 | |
| | 1,559,754 | | | | 3.000 | | | | 07/01/43 | | | | 1,548,726 | |
| | 31,000,000 | | | | 3.500 | | | | TBA-30yr | (e) | | | 31,680,546 | |
| | 47,000,000 | | | | 4.500 | | | | TBA-30yr | (e) | | | 50,586,484 | |
| | 4,000,000 | | | | 5.000 | | | | TBA-30yr | (e) | | | 4,414,375 | |
| | 4,000,000 | | | | 6.000 | | | | TBA-30yr | (e) | | | 4,517,656 | |
| | | | | | | | | | | | | | |
| | | | | | | | | | | | | 229,094,694 | |
| | |
| | GNMA – 0.9% | |
| | 1,357,025 | | | | 3.950 | | | | 07/15/25 | | | | 1,414,717 | |
| | 18,029 | | | | 6.000 | | | | 11/15/38 | | | | 20,248 | |
| | 287,885 | | | | 5.000 | | | | 07/15/40 | | | | 320,528 | |
| | 553,715 | | | | 5.000 | | | | 01/15/41 | | | | 616,500 | |
| | 37,270 | | | | 2.500 | | | | 12/20/42 | | | | 36,135 | |
| | 4,000,000 | | | | 3.500 | | | | TBA-30yr | (e) | | | 4,135,000 | |
| | 3,000,000 | | | | 5.000 | | | | TBA-30yr | (e) | | | 3,300,937 | |
| | | | | | | | | | | | | | |
| | | | | | | | | | | | | 9,844,065 | |
| | |
| | TOTAL FEDERAL AGENCIES | | | $ | 258,337,063 | |
| | |
| | TOTAL MORTGAGE-BACKED OBLIGATIONS | |
| | (Cost $332,351,482) | | | $ | 339,290,384 | |
| | |
| | | | | | | | | | | | | | |
| | Agency Debentures – 4.5% | |
| FHLB | |
| $ | 2,000,000 | | | | 1.875 | % | | | 03/13/20 | | | $ | 1,985,415 | |
| | 5,200,000 | | | | 3.000 | | | | 09/10/21 | | | | 5,362,051 | |
| | 6,800,000 | | | | 2.125 | | | | 06/09/23 | | | | 6,446,284 | |
| | 3,300,000 | | | | 3.250 | | | | 06/09/23 | | | | 3,405,122 | |
| | 3,500,000 | | | | 3.375 | | | | 09/08/23 | | | | 3,662,312 | |
| | 750,000 | | | | 3.375 | | | | 12/08/23 | | | | 780,946 | |
| | 2,400,000 | | | | 5.000 | | | | 09/28/29 | | | | 2,781,214 | |
| FNMA(f) | |
| | 4,200,000 | | | | 6.250 | | | | 05/15/29 | | | | 5,672,654 | |
| Kommunalbanken AS(c) | |
| | 3,000,000 | | | | 1.000 | | | | 09/26/17 | | | | 2,976,366 | |
| Private Export Funding Corp. | |
| | 7,000,000 | | | | 5.450 | | | | 09/15/17 | | | | 7,824,880 | |
| Small Business Administration | |
| | 63,657 | | | | 6.300 | | | | 06/01/18 | | | | 66,693 | |
| Tennessee Valley Authority | |
| | 5,400,000 | | | | 3.875 | | | | 02/15/21 | | | | 5,907,590 | |
| | 1,400,000 | | | | 4.625 | | | | 09/15/60 | | | | 1,523,777 | |
| | |
| | TOTAL AGENCY DEBENTURES | |
| | (Cost $48,162,125) | | | $ | 48,395,304 | |
| | |
| | | | | | | | | | | | | | |
| | Asset-Backed Securities(a) – 6.4% | |
| | Collateralized Loan Obligations(c) – 4.8% | |
| B&M CLO Ltd. Series 2014-1A, Class A1 | |
| $ | 3,700,000 | | | | 1.598 | % | | | 04/16/26 | | | $ | 3,673,523 | |
| | |
| | |
| 52 | | The accompanying notes are an integral part of these financial statements. |
GOLDMAN SACHS CORE FIXED INCOME FUND
| | | | | | | | | | | | | | |
Principal Amount | | | Interest
Rate | | | Maturity
Date | | | Value | |
| | Asset-Backed Securities(a) – (continued) | |
| | Collateralized Loan Obligations(c) – (continued) | |
| B&M CLO Ltd. Series 2014-1A, Class A2 | |
| $ | 650,000 | | | | 2.148 | % | | | 04/16/26 | | | $ | 622,867 | |
| CIFC Funding Ltd. Series 2014-2A, Class A1L | |
| | 5,300,000 | | | | 1.725 | | | | 05/24/26 | | | | 5,294,886 | |
| Halcyon Loan Advisors Funding Ltd. Series 2014-1A, Class A1 | |
| | 3,400,000 | | | | 1.808 | | | | 04/18/26 | | | | 3,396,726 | |
| Halcyon Loan Advisors Funding Ltd. Series 2014-2A, Class A1B | |
| | 6,950,000 | | | | 1.655 | | | | 04/28/25 | | | | 6,895,317 | |
| Halcyon Loan Advisors Funding Ltd. Series 2014-2A, Class A2 | |
| | 1,750,000 | | | | 2.228 | | | | 04/28/25 | | | | 1,687,114 | |
| Magnetite VIII Ltd. Series 2014-8A, Class A | |
| | 5,750,000 | | | | 1.708 | | | | 04/15/26 | | | | 5,754,945 | |
| Magnetite VIII Ltd. Series 2014-8A, Class B | |
| | 1,200,000 | | | | 2.228 | | | | 04/15/26 | | | | 1,175,336 | |
| Shackleton CLO Ltd. Series 2014-5A, Class A | |
| | 7,800,000 | | | | 1.737 | | | | 05/07/26 | | | | 7,805,000 | |
| Shackleton CLO Ltd. Series 2014-5A, Class B1 | |
| | 1,700,000 | | | | 2.237 | | | | 05/07/26 | | | | 1,659,217 | |
| Trinitas CLO Ltd. Series 2014-1A, Class A1 | |
| | 2,950,000 | | | | 1.833 | | | | 04/15/26 | | | | 2,936,342 | |
| Trinitas CLO Ltd. Series 2014-1A, Class B1 | |
| | 750,000 | | | | 2.203 | | | | 04/15/26 | | | | 716,382 | |
| Whitehorse VIII Ltd. Series 2014-1A, Class A | |
| | 7,500,000 | | | | 1.740 | | | | 05/01/26 | | | | 7,497,832 | |
| Whitehorse VIII Ltd. Series 2014-1A, Class B | |
| | 1,650,000 | | | | 2.290 | | | | 05/01/26 | | | | 1,616,739 | |
| | | | | | | | | | | | | | |
| | | | | | | | | | | | | 50,732,226 | |
| | |
| | Home Equity – 0.6% | |
| Countrywide Home Equity Loan Trust Series 2004-G, Class 2A | |
| | 252,109 | | | | 0.374 | | | | 12/15/29 | | | | 227,329 | |
| Countrywide Home Equity Loan Trust Series 2006-HW,
Class 2A1B |
|
| | 6,743,243 | | | | 0.305 | | | | 11/15/36 | | | | 5,934,728 | |
| Impac CMB Trust Series 2004-08, Class 1A | |
| | 387,884 | | | | 0.875 | | | | 10/25/34 | | | | 335,757 | |
| | | | | | | | | | | | | | |
| | | | | | | | | | | | | 6,497,814 | |
| | |
| | Student Loan – 1.0% | |
| Brazos Higher Education Authority, Inc. Series 2004-1, Class A2 | |
| | 531,472 | | | | 0.394 | | | | 06/27/22 | | | | 531,101 | |
| Education Funding Capital Trust I Series 2004-1, Class A2 | |
| | 41,856 | | | | 0.394 | | | | 12/15/22 | | | | 41,837 | |
| Educational Funding of the South, Inc. Series 2011-1, Class A2 | |
| | 5,200,000 | | | | 0.884 | | | | 04/25/35 | | | | 5,212,061 | |
| EFS Volunteer No 3 LLC Series 2012-1, Class A2(c) | |
| | 4,750,000 | | | | 1.155 | | | | 02/25/25 | | | | 4,807,102 | |
| Northstar Education Finance, Inc. Series 2005-1, Class A1 | |
| | 50,478 | | | | 0.335 | | | | 10/28/26 | | | | 50,280 | |
| US Education Loan Trust LLC Series 2006-1, Class A2(c) | |
| | 254,384 | | | | 0.364 | | | | 03/01/25 | | | | 254,094 | |
| | | | | | | | | | | | | | |
| | | | | | | | | | | | | 10,896,475 | |
| | |
| | TOTAL ASSET-BACKED SECURITIES | |
| | (Cost $68,885,151) | | | $ | 68,126,515 | |
| | |
| | | | | | | | | | | | | | |
| | | | | | | | | | | | | | |
Principal Amount | | | Interest
Rate | | | Maturity
Date | | | Value | |
| | Foreign Debt Obligations – 2.0% | |
| | Sovereign – 0.8% | |
| Federal Republic of Brazil | |
| $ | 1,210,000 | | | | 4.250 | % | | | 01/07/25 | | | $ | 1,197,900 | |
| | 400,000 | | | | 8.250 | | | | 01/20/34 | | | | 538,000 | |
| | 330,000 | | | | 7.125 | | | | 01/20/37 | | | | 404,250 | |
| Italy Buoni Poliennali Del Tesoro | |
| EUR | 2,050,000 | | | | 1.150 | | | | 05/15/17 | | | | 2,628,351 | |
| | 1,146,922 | | | | 2.350 | | | | 09/15/19 | | | | 1,600,720 | |
| | 30,000 | | | | 4.750 | (c) | | | 09/01/44 | | | | 45,517 | |
| Republic of Chile | |
| $ | 390,000 | | | | 3.625 | | | | 10/30/42 | | | | 342,225 | |
| Republic of Panama(g) | |
| | 100,000 | | | | 9.375 | | | | 04/01/29 | | | | 148,500 | |
| Spain Government Bond(c) | |
| EUR | 30,000 | | | | 5.150 | | | | 10/31/44 | | | | 49,399 | |
| United Mexican States | |
| $ | 20,000 | | | | 6.050 | | | | 01/11/40 | | | | 23,550 | |
| | 1,610,000 | | | | 4.750 | | | | 03/08/44 | | | | 1,593,900 | |
| | 60,000 | | | | 5.750 | | | | 10/12/10 | | | | 62,100 | |
| | | | | | | | | | | | | | |
| | | | | | | | | | | | | 8,634,412 | |
| | |
| | Supranational – 1.2% | |
| Inter-American Development Bank | |
| | 2,700,000 | | | | 1.000 | | | | 02/27/18 | | | | 2,610,279 | |
| International Finance Corp. | |
| | 10,800,000 | | | | 0.875 | | | | 06/15/18 | | | | 10,554,160 | |
| | | | | | | | | | | | | | |
| | | | | | | | | | | | | 13,164,439 | |
| | |
| | TOTAL FOREIGN DEBT OBLIGATIONS | |
| | (Cost $22,526,307) | | | $ | 21,798,851 | |
| | |
| | | | | | | | | | | | | | |
| | Municipal Debt Obligations – 0.9% | |
| | California – 0.6% | |
| California State GO Bonds Build America Taxable Series 2009 | |
| $ | 950,000 | | | | 7.500 | % | | | 04/01/34 | | | $ | 1,355,346 | |
| | 1,650,000 | | | | 7.550 | | | | 04/01/39 | | | | 2,406,030 | |
| California State GO Bonds Build America Taxable Series 2010 | |
| | 1,645,000 | | | | 7.950 | | | | 03/01/36 | | | | 2,006,555 | |
| | | | | | | | | | | | | | |
| | | | | | | | | | | | | 5,767,931 | |
| | |
| | Illinois – 0.1% | |
| Illinois State GO Bonds Build America Series 2010 | |
| | 1,280,000 | | | | 7.350 | | | | 07/01/35 | | | | 1,469,171 | |
| | |
| | Ohio – 0.2% | |
| American Municipal Power-Ohio, Inc. RB Build America
Taxable Series 2010 |
|
| | 1,700,000 | | | | 6.270 | | | | 02/15/50 | | | | 2,086,104 | |
| | |
| | TOTAL MUNICIPAL DEBT OBLIGATIONS | |
| | (Cost $7,449,869) | | | $ | 9,323,206 | |
| | |
| | | | | | | | | | | | | | |
| | Government Guarantee Obligations(h) – 2.6% | |
| Hashemite Kingdom of Jordan Government AID Bond | |
| $ | 7,400,000 | | | | 2.503 | % | | | 10/30/20 | | | $ | 7,548,000 | |
| | |
| | |
| The accompanying notes are an integral part of these financial statements. | | 53 |
GOLDMAN SACHS CORE FIXED INCOME FUND
Schedule of Investments (continued)
September 30, 2014 (Unaudited)
| | | | | | | | | | | | | | |
Principal Amount | | | Interest
Rate | | | Maturity
Date | | | Value | |
| | Government Guarantee Obligations(h) – (continued) | |
| Israel Government AID Bond | |
| $ | 7,827,000 | | | | 5.500 | % | | | 09/18/23 | | | $ | 9,531,371 | |
| | 1,200,000 | | | | 5.500 | | | | 12/04/23 | | | | 1,462,074 | |
| | 2,400,000 | | | | 5.500 | | | | 04/26/24 | | | | 2,931,115 | |
| | 4,700,000 | | | | 5.500 | | | | 09/18/33 | | | | 5,968,938 | |
| | |
| TOTAL GOVERNMENT GUARANTEE
OBLIGATIONS |
| | | | |
| | (Cost $26,984,822) | | | $ | 27,441,498 | |
| | |
| | | | | | | | | | | | | | |
| | U.S. Treasury Obligations – 24.3% | |
| United States Treasury Bonds | |
| $ | 3,600,000 | | | | 3.125 | %(f) | | | 11/15/41 | | | $ | 3,571,128 | |
| | 27,900,000 | | | | 3.125 | | | | 02/15/42 | | | | 27,629,370 | |
| | 10,500,000 | | | | 2.750 | | | | 08/15/42 | | | | 9,621,360 | |
| | 1,100,000 | | | | 2.750 | | | | 11/15/42 | | | | 1,006,302 | |
| | 4,100,000 | | | | 3.750 | (f) | | | 11/15/43 | | | | 4,531,361 | |
| | 8,200,000 | | | | 3.625 | | | | 02/15/44 | | | | 8,862,150 | |
| United States Treasury Inflation Protected Securities | |
| | 3,062,225 | | | | 1.875 | | | | 07/15/15 | | | | 3,132,074 | |
| | 4,000,108 | | | | 0.125 | | | | 01/15/22 | | | | 3,909,466 | |
| | 2,457,072 | | | | 0.375 | | | | 07/15/23 | | | | 2,432,894 | |
| | 6,800,526 | | | | 0.625 | | | | 01/15/24 | | | | 6,838,745 | |
| | 3,051,675 | | | | 2.500 | | | | 01/15/29 | | | | 3,728,781 | |
| | 2,709,069 | | | | 1.375 | | | | 02/15/44 | | | | 2,899,977 | |
| United States Treasury Notes | |
| | 63,500,000 | | | | 0.375 | | | | 01/31/16 | | | | 63,592,073 | |
| | 43,500,000 | | | | 1.000 | (f) | | | 03/31/17 | | | | 43,630,936 | |
| | 19,500,000 | | | | 1.500 | | | | 01/31/19 | | | | 19,379,294 | |
| | 4,600,000 | | | | 1.625 | | | | 04/30/19 | | | | 4,582,704 | |
| | 100,000 | | | | 1.625 | | | | 06/30/19 | | | | 99,471 | |
| | 3,900,000 | | | | 1.625 | | | | 08/31/19 | | | | 3,873,402 | |
| | 19,700,000 | | | | 1.750 | | | | 09/30/19 | | | | 19,671,436 | |
| | 8,600,000 | | | | 2.125 | | | | 01/31/21 | | | | 8,598,968 | |
| | 10,700,000 | | | | 2.250 | | | | 04/30/21 | | | | 10,752,537 | |
| | 5,000,000 | | | | 2.125 | | | | 06/30/21 | | | | 4,977,700 | |
| | 1,300,000 | | | | 2.250 | | | | 07/31/21 | | | | 1,304,394 | |
| | |
| | TOTAL U.S. TREASURY OBLIGATIONS | |
| | (Cost $259,031,676) | | | $ | 258,626,523 | |
| | |
| | | | | | | | | | | | | | |
Notional Amount | | | Exercise
Rate | | | Expiration
Date | | | Value | |
| | Options Purchased – 0.6% | |
| | Interest Rate Swaptions | |
| Deutsche Bank AG Put - OTC - 5 year Interest Rate Swap
Strike Price 2.550% |
|
| $ | 3,200,000 | | | | 2.550 | % | | | 09/28/15 | | | $ | 51,948 | |
| Deutsche Bank AG Call - OTC - 5 year Interest Rate Swap
Strike Price 2.550% |
|
| | 3,200,000 | | | | 2.550 | | | | 09/28/15 | | | | 48,909 | |
| Deutsche Bank AG Put - OTC - 5 year Interest Rate Swap
Strike Price 2.940% |
|
| | 4,600,000 | | | | 2.940 | | | | 09/29/16 | | | | 104,941 | |
| Deutsche Bank AG Call - OTC - 5 year Interest Rate Swap
Strike Price 2.940% |
|
| | 4,600,000 | | | | 2.940 | | | | 09/29/16 | | | | 110,014 | |
| | |
| | | | | | | | | | | | | | |
Notional Amount | | | Exercise
Rate | | | Expiration
Date | | | Value | |
| | Options Purchased – (continued) | |
| | Interest Rate Swaptions – (continued) | |
| Deutsche Bank AG Call - OTC - 10 year Interest Rate Swap
Strike Price 3.780% |
|
| $ | 6,500,000 | | | | 3.780 | % | | | 09/26/16 | | | $ | 154,731 | |
| Deutsche Bank AG Put - OTC - 10 year Interest Rate Swap
Strike Price 4.113% |
|
| | 10,800,000 | | | | 4.113 | | | | 04/16/19 | | | | 897,756 | |
| Deutsche Bank AG Call - OTC - 10 year Interest Rate Swap
Strike Price 4.113% |
|
| | 10,800,000 | | | | 4.113 | | | | 04/16/19 | | | | 427,011 | |
| Deutsche Bank AG Put - OTC - 10 year Interest Rate Swap
Strike Price 4.135% |
|
| | 10,200,000 | | | | 4.135 | | | | 04/17/19 | | | | 859,188 | |
| Deutsche Bank AG Call - OTC - 10 year Interest Rate Swap
Strike Price 4.135% |
|
| | 10,200,000 | | | | 4.135 | | | | 04/17/19 | | | | 397,515 | |
| Deutsche Bank AG Put - OTC - 10 year Interest Rate Swap
Strike Price 4.095% |
|
| | 4,000,000 | | | | 4.095 | | | | 04/24/19 | | | | 328,783 | |
| Deutsche Bank AG Call - OTC - 10 year Interest Rate Swap
Strike Price 4.095% |
|
| | 4,000,000 | | | | 4.095 | | | | 04/24/19 | | | | 160,540 | |
| Deutsche Bank AG Put - OTC - 10 year Interest Rate Swap
Strike Price 3.963% |
|
| | 3,800,000 | | | | 3.963 | | | | 05/07/19 | | | | 286,869 | |
| Deutsche Bank AG Call - OTC - 10 year Interest Rate Swap
Strike Price 3.963% |
|
| | 3,800,000 | | | | 3.963 | | | | 05/07/19 | | | | 167,597 | |
| Deutsche Bank AG Put - OTC - 30 Year Interest Rate Swap
Strike Price 3.960% |
|
| | 1,700,000 | | | | 3.960 | | | | 01/29/16 | | | | 231,058 | |
| Deutsche Bank AG Call - OTC - 30 Year Interest Rate Swap
Strike Price 3.960% |
|
| | 1,700,000 | | | | 3.960 | | | | 01/29/16 | | | | 44,031 | |
| Deutsche Bank AG Put - OTC - 30 year Interest Rate Swap
Strike Price 4.015% |
|
| | 1,100,000 | | | | 4.015 | | | | 04/15/19 | | | | 166,363 | |
| Deutsche Bank AG Call - OTC - 30 year Interest Rate Swap
Strike Price 4.015% |
|
| | 1,100,000 | | | | 4.015 | | | | 04/15/19 | | | | 79,836 | |
| JPMorgan Securities, Inc. Call - OTC - 5 year Interest Rate Swap
Strike Price 2.783% |
|
| | 9,200,000 | | | | 2.783 | | | | 09/30/15 | | | | 102,350 | |
| JPMorgan Securities, Inc. Put - OTC - 5 year Interest Rate Swap
Strike Price 2.973% |
|
| | 4,600,000 | | | | 2.973 | | | | 09/26/16 | | | | 108,800 | |
| JPMorgan Securities, Inc. Call - OTC - 5 year Interest Rate Swap
Strike Price 2.973% |
|
| | 4,600,000 | | | | 2.973 | | | | 09/26/16 | | | | 105,940 | |
| JPMorgan Securities, Inc. Put - OTC - 10 year Interest Rate Swap
Strike Price 4.105% |
|
| | 4,000,000 | | | | 4.105 | | | | 04/29/19 | | | | 330,700 | |
| JPMorgan Securities, Inc. Call - OTC - 10 year Interest Rate
Swap Strike Price 4.105% |
|
| | 4,000,000 | | | | 4.105 | | | | 04/29/19 | | | | 159,791 | |
| | |
| | |
| 54 | | The accompanying notes are an integral part of these financial statements. |
GOLDMAN SACHS CORE FIXED INCOME FUND
| | | | | | | | | | | | | | |
Notional Amount | | | Exercise
Rate | | | Expiration
Date | | | Value | |
| | Options Purchased – (continued) | |
| | Interest Rate Swaptions – (continued) | |
| JPMorgan Securities, Inc. Put - OTC - 10 year Interest Rate Swap
Strike Price 3.955% |
|
| $ | 3,600,000 | | | | 3.955 | % | | | 05/07/19 | | | $ | 270,444 | |
| JPMorgan Securities, Inc. Call - OTC - 10 year Interest Rate
Swap Strike Price 3.955% |
|
| | 3,600,000 | | | | 3.955 | | | | 05/07/19 | | | | 159,570 | |
| Morgan Stanley Capital Services, Inc. Put - OTC - 5 year Interest
Rate Swap Strike Price 2.550% |
|
| | 2,600,000 | | | | 2.550 | | | | 09/28/15 | | | | 42,208 | |
| Morgan Stanley Capital Services, Inc. Call - OTC - 5 year Interest
Rate Swap Strike Price 2.550% |
|
| | 2,600,000 | | | | 2.550 | | | | 09/28/15 | | | | 39,739 | |
| Morgan Stanley Capital Services, Inc. Put - OTC - 5 year Interest
Rate Swap Strike Price 2.513% |
|
| | 3,500,000 | | | | 2.513 | | | | 09/29/15 | | | | 55,125 | |
| Morgan Stanley Capital Services, Inc. Call - OTC - 5 year Interest
Rate Swap Strike Price 2.513% |
|
| | 3,500,000 | | | | 2.513 | | | | 09/29/15 | | | | 55,125 | |
| Morgan Stanley Capital Services, Inc. Put - OTC - 5 year Interest
Rate Swap Strike Price 2.950% |
|
| | 11,100,000 | | | | 2.950 | | | | 09/26/16 | | | | 256,302 | |
| Morgan Stanley Capital Services, Inc. Call - OTC - 5 year Interest
Rate Swap Strike Price 2.950% |
|
| | 11,100,000 | | | | 2.950 | | | | 09/26/16 | | | | 260,908 | |
| Morgan Stanley Capital Services, Inc. Put - OTC - 5 year Interest
Rate Swap Strike Price 2.930% |
|
| | 3,500,000 | | | | 2.930 | | | | 09/29/16 | | | | 81,550 | |
| Morgan Stanley Capital Services, Inc. Call - OTC - 5 year Interest
Rate Swap Strike Price 2.930% |
|
| | 3,500,000 | | | | 2.930 | | | | 09/29/16 | | | | 81,550 | |
| Morgan Stanley Capital Services, Inc. Put - OTC - 5 year Interest
Rate Swap Strike Price 2.940% |
|
| | 3,500,000 | | | | 2.940 | | | | 09/29/16 | | | | 81,463 | |
| Morgan Stanley Capital Services, Inc. Call - OTC - 5 year Interest
Rate Swap Strike Price 2.940% |
|
| | 3,500,000 | | | | 2.940 | | | | 09/29/16 | | | | 81,463 | |
| Morgan Stanley Capital Services, Inc. Call - OTC - 7 year Interest
Rate Swap Strike Price 3.010% |
|
| | 7,100,000 | | | | 3.010 | | | | 09/29/15 | | | | 105,936 | |
| | |
| | TOTAL OPTIONS PURCHASED | |
| | (Cost $6,700,785) | | | | | | | $ | 6,896,054 | |
| | |
| TOTAL INVESTMENTS BEFORE SHORT-TERM
INVESTMENT |
|
| | (Cost $1,087,175,290) | | | $ | 1,105,305,901 | |
| | |
| | | | | | | | | | | | | | |
| | | | | | | | | | | | | | |
Principal
Amount | | | Interest
Rate | | | Maturity
Date | | | Value | |
| | Short-term Investment(i) – 4.1% | |
| | Repurchase Agreement – 4.1% | |
| Joint Repurchase Agreement Account II | |
| $ | 43,300,000 | | | | 0.012 | % | | | 10/01/14 | | | $ | 43,300,000 | |
| | (Cost $43,300,000) | | | | | |
| | |
| | TOTAL INVESTMENTS – 107.8% | | | | | |
| | (Cost $1,130,475,290) | | | $ | 1,148,605,901 | |
| | |
| LIABILITIES IN EXCESS OF
OTHER ASSETS – (7.8)% |
| | | (83,320,535 | ) |
| | |
| | NET ASSETS – 100.0% | | | $ | 1,065,285,366 | |
| | |
| | |
| The percentage shown for each investment category reflects the value of investments in that category as a percentage of net assets. |
(a) | | Variable rate security. Interest rate or distribution rate disclosed is that which is in effect at September 30, 2014. |
(b) | | Security with “Call” features with resetting interest rates. Maturity dates disclosed are the final maturity dates. |
(c) | | Exempt from registration under Rule 144A of the Securities Act of 1933. Under procedures approved by the Board of Trustees, such securities have been determined to be liquid by the investment adviser and may be resold, normally to qualified institutional buyers in transactions exempt from registration. Total market value of Rule 144A securities amounts to $158,794,147, which represents approximately 14.9% of net assets as of September 30, 2014. |
(d) | | Security with a notional or nominal principal amount. The actual effective yield of this security is different than the stated interest rate. |
(e) | | TBA (To Be Announced) Securities are purchased on a forward commitment basis with an approximate principal amount and no defined maturity date. The actual principal and maturity date will be determined upon settlement when the specific mortgage pools are assigned. Total market value of TBA securities (excluding forward sales contracts, if any) amounts to $98,634,998 which represents approximately 9.3% of net assets as of September 30, 2014. |
(f) | | A portion of this security is segregated as collateral for initial margin requirements on futures transactions. |
(g) | | Security with “Put” features and resetting interest rates. Maturity dates disclosed are the puttable dates. Interest rate disclosed is that which is in effect at September 30, 2014. |
(h) | | Guaranteed by the United States Government until maturity. Total market value for these securities amounts to $27,441,498, which represents approximately 2.6% of net assets as of September 30, 2014. |
(i) | | Joint repurchase agreement was entered into on September 30, 2014. Additional information appears on page 118. |
| | |
| The accompanying notes are an integral part of these financial statements. | | 55 |
GOLDMAN SACHS CORE FIXED INCOME FUND
Schedule of Investments (continued)
September 30, 2014 (Unaudited)
| | |
|
Currency Abbreviations: |
AUD | | —Australian Dollar |
CAD | | —Canadian Dollar |
CHF | | —Swiss Franc |
EUR | | —Euro |
GBP | | —British Pound |
JPY | | —Japanese Yen |
NOK | | —Norwegian Krone |
NZD | | —New Zealand Dollar |
SEK | | —Swedish Krona |
USD | | —U.S. Dollar |
| | |
Investment Abbreviations: |
AUDOR | | —Australian Dollar Offered Rate |
BP | | —British Pound Offered Rate |
CDOR | | —Canadian Dollar Offered Rate |
CLO | | —Collateralized Loan Obligation |
EURO | | —Euro Offered Rate |
FHLB | | —Federal Home Loan Bank |
FHLMC | | —Federal Home Loan Mortgage Corp. |
FNMA | | —Federal National Mortgage Association |
GNMA | | —Government National Mortgage Association |
GO | | —General Obligation |
JYOR | | —Japanese Yen Offered Rate |
LIBOR | | —London Interbank Offered Rate |
LP | | —Limited Partnership |
NCUA | | —National Credit Union Administration |
NZDOR | | —New Zealand Dollar Offered Rate |
OTC | | —Over the Counter |
RB | | —Revenue Bond |
REIT | | —Real Estate Investment Trust |
REMIC | | —Real Estate Mortgage Investment Conduit |
SPA | | —Stand-by Purchase Agreement |
STIBOR | | —Stockholm Interbank Offered Rate |
|
| | |
| 56 | | The accompanying notes are an integral part of these financial statements. |
GOLDMAN SACHS CORE FIXED INCOME FUND
|
| ADDITIONAL INVESTMENT INFORMATION |
FORWARD FOREIGN CURRENCY EXCHANGE CONTRACTS — At September 30, 2014, the Fund had the following forward foreign currency exchange contracts:
FORWARD FOREIGN CURRENCY EXCHANGE CONTRACTS WITH UNREALIZED GAIN
| | | | | | | | | | | | | | |
| Counterparty | | Contracts to
Buy/Sell | | Settlement
Date | | | Current
Value | | | Unrealized
Gain | |
Bank of America Securities LLC | | GBP/EUR | | | 12/17/14 | | | $ | 1,213,210 | | | $ | 32,837 | |
| | NOK/EUR | | | 12/17/14 | | | | 1,208,155 | | | | 24,649 | |
| | SEK/EUR | | | 12/17/14 | | | | 4,589,978 | | | | 13,094 | |
| | USD/EUR | | | 12/17/14 | | | | 12,068,912 | | | | 396,818 | |
| | USD/JPY | | | 12/17/14 | | | | 1,818,436 | | | | 41,564 | |
Barclays Bank PLC | | CAD/CHF | | | 12/17/14 | | | | 457,853 | | | | 282 | |
| | GBP/USD | | | 12/17/14 | | | | 3,737,421 | | | | 17,144 | |
| | USD/AUD | | | 12/17/14 | | | | 7,678,251 | | | | 267,399 | |
| | USD/CAD | | | 12/17/14 | | | | 6,148,012 | | | | 45,488 | |
| | USD/EUR | | | 12/17/14 | | | | 1,208,155 | | | | 30,473 | |
| | USD/GBP | | | 12/17/14 | | | | 2,455,973 | | | | 11,719 | |
| | USD/JPY | | | 12/17/14 | | | | 918,844 | | | | 7,156 | |
| | USD/NZD | | | 12/17/14 | | | | 1,178,785 | | | | 47,247 | |
| | USD/SEK | | | 12/17/14 | | | | 2,081,511 | | | | 36,045 | |
BNP Paribas SA | | EUR/USD | | | 12/17/14 | | | | 1,241,013 | | | | 170 | |
| | GBP/EUR | | | 12/17/14 | | | | 1,200,572 | | | | 28,015 | |
| | NZD/USD | | | 12/17/14 | | | | 2,466,773 | | | | 5,469 | |
| | USD/AUD | | | 12/17/14 | | | | 2,395,201 | | | | 64,188 | |
| | USD/EUR | | | 12/17/14 | | | | 1,841,299 | | | | 14,661 | |
| | USD/GBP | | | 12/17/14 | | | | 2,459,213 | | | | 9,427 | |
| | USD/JPY | | | 12/17/14 | | | | 2,640,030 | | | | 78,639 | |
| | USD/NZD | | | 12/17/14 | | | | 4,807,304 | | | | 99,019 | |
Citibank NA (London) | | CHF/EUR | | | 12/17/14 | | | | 1,210,683 | | | | 3,626 | |
| | GBP/EUR | | | 12/17/14 | | | | 2,417,574 | | | | 13,133 | |
| | NOK/EUR | | | 12/17/14 | | | | 3,630,784 | | | | 49,408 | |
| | USD/CAD | | | 12/17/14 | | | | 1,830,940 | | | | 26,060 | |
| | USD/CHF | | | 12/17/14 | | | | 3,820,123 | | | | 77,029 | |
| | USD/EUR | | | 10/30/14 | | | | 3,975,841 | | | | 101,275 | |
| | USD/NZD | | | 12/17/14 | | | | 1,831,541 | | | | 110,113 | |
Deutsche Bank AG (London) | | USD/GBP | | | 10/22/14 | | | | 11,962,949 | | | | 180,843 | |
HSBC Bank PLC | | GBP/USD | | | 12/17/14 | | | | 1,250,667 | | | | 10,696 | |
| | SEK/EUR | | | 12/17/14 | | | | 2,487,081 | | | | 908 | |
| | USD/AUD | | | 12/17/14 | | | | 1,372,518 | | | | 47,040 | |
| | USD/GBP | | | 12/17/14 | | | | 2,439,773 | | | | 63,402 | |
| | USD/JPY | | | 12/17/14 | | | | 604,752 | | | | 13,248 | |
| | USD/NZD | | | 12/17/14 | | | | 1,831,541 | | | | 117,049 | |
State Street Bank and Trust | | AUD/USD | | | 12/17/14 | | | | 1,858,000 | | | | 8,846 | |
| | USD/CHF | | | 12/17/14 | | | | 3,848,024 | | | | 84,312 | |
| | USD/JPY | | | 12/17/14 | | | | 1,810,630 | | | | 42,370 | |
| | USD/NZD | | | 12/17/14 | | | | 1,972,429 | | | | 124,517 | |
| | USD/SEK | | | 12/17/14 | | | | 4,905,859 | | | | 84,322 | |
Westpac Banking Corp. | | AUD/USD | | | 12/17/14 | | | | 2,470,078 | | | | 6,268 | |
| | USD/AUD | | | 12/17/14 | | | | 4,959,016 | | | | 192,255 | |
| | USD/CHF | | | 12/17/14 | | | | 4,119,057 | | | | 85,364 | |
| | USD/EUR | | | 10/30/14 | | | | 885,058 | | | | 20,331 | |
| | USD/EUR | | | 12/17/14 | | | | 604,078 | | | | 15,310 | |
| | | USD/NZD | | | 12/17/14 | | | | 2,334,334 | | | | 142,361 | |
| TOTAL | | | | | | | | | | | | $ | 2,891,589 | |
| | |
| The accompanying notes are an integral part of these financial statements. | | 57 |
GOLDMAN SACHS CORE FIXED INCOME FUND
Schedule of Investments (continued)
September 30, 2014 (Unaudited)
|
| ADDITIONAL INVESTMENT INFORMATION (continued) |
FORWARD FOREIGN CURRENCY EXCHANGE CONTRACTS WITH UNREALIZED LOSS
| | | | | | | | | | | | | | |
| Counterparty | | Contracts to
Buy/Sell | | Settlement
Date | | | Current
Value | | | Unrealized
Loss | |
Bank of America Securities LLC | | CHF/USD | | | 12/17/14 | | | $ | 1,208,683 | | | $ | (27,317 | ) |
| | EUR/CHF | | | 12/17/14 | | | | 2,488,654 | | | | (1,573 | ) |
| | EUR/GBP | | | 12/17/14 | | | | 2,445,725 | | | | (36,998 | ) |
| | EUR/NOK | | | 12/17/14 | | | | 2,458,957 | | | | (40,119 | ) |
| | EUR/USD | | | 12/17/14 | | | | 3,046,926 | | | | (44,664 | ) |
Barclays Bank PLC | | AUD/USD | | | 12/17/14 | | | | 595,535 | | | | (20,578 | ) |
| | CAD/USD | | | 12/17/14 | | | | 6,663,156 | | | | (107,343 | ) |
| | EUR/USD | | | 12/17/14 | | | | 14,182,356 | | | | (326,089 | ) |
| | GBP/USD | | | 12/17/14 | | | | 2,423,573 | | | | (37,619 | ) |
| | JPY/USD | | | 12/17/14 | | | | 5,377,322 | | | | (208,678 | ) |
| | NZD/USD | | | 12/17/14 | | | | 2,334,334 | | | | (119,556 | ) |
BNP Paribas SA | | AUD/USD | | | 12/17/14 | | | | 4,131,308 | | | | (174,300 | ) |
| | CHF/USD | | | 12/17/14 | | | | 1,209,843 | | | | (26,157 | ) |
| | EUR/CHF | | | 12/17/14 | | | | 2,418,617 | | | | (2,307 | ) |
| | EUR/GBP | | | 12/17/14 | | | | 2,488,578 | | | | (64,685 | ) |
| | EUR/USD | | | 12/17/14 | | | | 4,913,501 | | | | (41,381 | ) |
| | GBP/USD | | | 12/17/14 | | | | 1,267,897 | | | | (32,264 | ) |
| | JPY/USD | | | 12/17/14 | | | | 2,415,370 | | | | (57,630 | ) |
| | SEK/USD | | | 12/17/14 | | | | 2,432,979 | | | | (47,021 | ) |
Citibank NA (London) | | AUD/USD | | | 12/17/14 | | | | 3,008,149 | | | | (64,047 | ) |
| | EUR/CHF | | | 12/17/14 | | | | 2,422,813 | | | | (1,448 | ) |
| | EUR/GBP | | | 12/17/14 | | | | 1,224,462 | | | | (15,043 | ) |
| | GBP/USD | | | 10/22/14 | | | | 1,483,389 | | | | (22,522 | ) |
| | NOK/EUR | | | 12/17/14 | | | | 2,487,081 | | | | (3,669 | ) |
| | NZD/USD | | | 12/17/14 | | | | 1,178,010 | | | | (46,669 | ) |
HSBC Bank PLC | | EUR/USD | | | 12/17/14 | | | | 614,188 | | | | (3,790 | ) |
| | USD/GBP | | | 12/17/14 | | | | 2,483,514 | | | | (7,987 | ) |
State Street Bank and Trust | | AUD/USD | | | 12/17/14 | | | | 600,759 | | | | (13,024 | ) |
| | EUR/GBP | | | 12/17/14 | | | | 1,227,030 | | | | (21,403 | ) |
| | EUR/USD | | | 12/17/14 | | | | 1,214,474 | | | | (26,571 | ) |
| | GBP/USD | | | 12/17/14 | | | | 2,455,973 | | | | (32,723 | ) |
| | JPY/USD | | | 12/17/14 | | | | 4,286,692 | | | | (35,808 | ) |
Westpac Banking Corp. | | AUD/USD | | | 12/17/14 | | | | 5,708,953 | | | | (177,703 | ) |
| | | NZD/USD | | | 12/17/14 | | | | 5,610,736 | | | | (249,609 | ) |
| TOTAL | | | | | | | | | | | | $ | (2,138,295 | ) |
FORWARD SALES CONTRACTS — At September 30, 2014, the Fund had the following forward sales contracts:
| | | | | | | | | | | | | | | | | | |
| Description | | Interest
Rate | | | Maturity
Date(e) | | Settlement
Date | | | Principal
Amount | | | Value | |
FNMA (Proceeds Receivable: $39,250,000) | | | 3.000 | % | | TBA-30yr | | | 10/14/14 | | | $ | (40,000,000 | ) | | $ | (39,421,876 | ) |
FUTURES CONTRACTS — At September 30, 2014, the Fund had the following futures contracts:
| | | | | | | | | | | | | | |
| Type | | Number of
Contracts
Long (Short) | | | Expiration
Date | | Current
Value | | | Unrealized
Gain (Loss) | |
Eurodollars | | | (164 | ) | | December 2016 | | $ | (32,529,027 | ) | | $ | 15,447 | |
Eurodollars | | | (349 | ) | | March 2017 | | | (85,134,188 | ) | | | 94,441 | |
Eurodollars | | | (283 | ) | | June 2017 | | | (68,899,887 | ) | | | 100,072 | |
| | |
| 58 | | The accompanying notes are an integral part of these financial statements. |
GOLDMAN SACHS CORE FIXED INCOME FUND
|
| ADDITIONAL INVESTMENT INFORMATION (continued) |
FUTURES CONTRACTS (continued)
| | | | | | | | | | | | | | |
| Type | | Number of
Contracts
Long (Short) | | | Expiration
Date | | Current
Value | | | Unrealized
Gain (Loss) | |
Eurodollars | | | (165 | ) | | September 2017 | | $ | (40,109,437 | ) | | $ | 85,977 | |
French 10 Year Government Bonds | | | (15 | ) | | December 2014 | | | (2,723,453 | ) | | | (26,234 | ) |
Italian 10 Year Government Bonds | | | 21 | | | December 2014 | | | 3,460,859 | | | | 34,067 | |
Ultra Long U.S. Treasury Bonds | | | (65 | ) | | December 2014 | | | (9,912,500 | ) | | | 141,796 | |
10 Year German Euro-Bund | | | 12 | | | December 2014 | | | 2,268,944 | | | | 9,503 | |
10 Year U.K. Long Gilt | | | (38 | ) | | December 2014 | | | (6,969,843 | ) | | | (29,287 | ) |
2 Year U.S. Treasury Notes | | | 581 | | | December 2014 | | | 127,148,219 | | | | (31,427 | ) |
5 Year U.S. Treasury Notes | | | 97 | | | December 2014 | | | 11,471,008 | | | | 13,472 | |
10 Year U.S. Treasury Notes | | | 33 | | | December 2014 | | | 4,113,141 | | | | 879 | |
20 Year U.S. Treasury Bonds | | | 165 | | | December 2014 | | | 22,754,531 | | | | (151,307 | ) |
| TOTAL | | | | | | | | | | | | $ | 257,399 | |
SWAP CONTRACTS — At September 30, 2014, the Fund had the following swap contracts:
CENTRALLY CLEARED INTEREST RATE SWAP CONTRACTS
| | | | | | | | | | | | | | | | | | |
| | | | | | | Rates Exchanged | | Market Value | |
Notional
Amount
(000s) | | | Termination
Date | | | Payments
Received | | Payments
Made | | Upfront
Payments
Made (Received) | | | Unrealized
Gain (Loss) | |
| $ | 2,400 | (a) | | | 02/01/17 | | | 3 month LIBOR | | 1.625% | | $ | (2,044 | ) | | $ | 2,750 | |
| | 11,200 | (a) | | | 08/04/17 | | | 3 month LIBOR | | 2.195 | | | (9,451 | ) | | | 5,779 | |
| GBP | 4,590 | (a) | | | 09/12/17 | | | 6 month GBP | | 2.250 | | | 10,121 | | | | (12,627 | ) |
| $ | 55,100 | (a) | | | 12/17/17 | | | 3 month LIBOR | | 1.500 | | | (174,777 | ) | | | 147,293 | |
| JPY | 859,480 | (a) | | | 02/12/19 | | | 6 month JYOR | | 0.420 | | | (202,209 | ) | | | 166,322 | |
| $ | 9,800 | (a) | | | 06/18/19 | | | 2.000% | | 3 month LIBOR | | | 64,270 | | | | 46,301 | |
| EUR | 7,970 | (a) | | | 12/17/19 | | | 1.000 | | 6 month EURO | | | 243,246 | | | | 14,950 | |
| $ | 23,400 | (a) | | | 12/17/19 | | | 3 month LIBOR | | 2.250 | | | (215,473 | ) | | | 14,254 | |
| SEK | 48,470 | (a) | | | 12/17/19 | | | 3 month STIBOR | | 1.250 | | | (59,064 | ) | | | 15,444 | |
| NZD | 7,500 | (a) | | | 12/17/19 | | | 4.500 | | 3 month NZDOR | | | (16,649 | ) | | | 40,032 | |
| AUD | 6,280 | (a) | | | 12/17/19 | | | 6 month AUDOR | | 3.750 | | | (61,370 | ) | | | (33,095 | ) |
| $ | 3,400 | (a) | | | 10/02/20 | | | 2.532 | | 3 month LIBOR | | | 17 | | | | — | |
| GBP | 2,050 | (a) | | | 02/05/21 | | | 2.840 | | 6 month GBP | | | (29,323 | ) | | | 81,992 | |
| $ | 16,700 | (a) | | | 08/04/21 | | | 3.025 | | 3 month LIBOR | | | 57,737 | | | | 33,081 | |
| GBP | 4,660 | (a) | | | 09/12/21 | | | 2.680 | | 6 month GBP | | | (60,557 | ) | | | 69,333 | |
| $ | 12,400 | (a) | | | 12/17/21 | | | 3 month LIBOR | | 2.500 | | | (67,645 | ) | | | (1,126 | ) |
| JPY | 1,485,980 | (a) | | | 02/12/22 | | | 1.080 | | 6 month JYOR | | | (342,396 | ) | | | 482,869 | |
| $ | 3,000 | (a) | | | 10/01/22 | | | 2.760 | | 3 month LIBOR | | | 24 | | | | (2,742 | ) |
| | 6,900 | | | | 01/30/24 | | | 4.252 | | 3 month LIBOR | | | (5,459 | ) | | | 260,531 | |
| | 1,330 | (a) | | | 04/04/24 | | | 4.000 | | 3 month LIBOR | | | (6,870 | ) | | | 40,182 | |
| AUD | 5,390 | | | | 09/17/24 | | | 4.500 | | 6 month AUDOR | | | (20,867 | ) | | | 28,470 | |
| GBP | 3,490 | (a) | | | 09/17/24 | | | 6 month GBP | | 3.250 | | | (22,240 | ) | | | (26,391 | ) |
| $ | 2,66 | (a) | | | 12/17/24 | | | 3 month LIBOR | | 3.000 | | | (44,971 | ) | | | (19,954 | ) |
| SEK | 8,090 | (a) | | | 12/17/24 | | | 3 month STIBOR | | 1.750 | | | 5,475 | | | | (714 | ) |
| CAD | 2,330 | (a) | | | 12/17/24 | | | 3.000 | | 6 month CDOR | | | 95,722 | | | | (32,581 | ) |
| AUD | 2,630 | (a) | | | 12/17/24 | | | 4.500 | | 6 month AUDOR | | | 92,750 | | | | 27,623 | |
| NZD | 6,460 | (a) | | | 12/17/24 | | | 5.000 | | 3 month NZDOR | | | 111,729 | | | | 49,360 | |
| EUR | 2,410 | (a) | | | 12/17/24 | | | 6 month EURO | | 2.000 | | | (266,134 | ) | | | 25,639 | |
| GBP | 2,890 | (a) | | | 12/17/24 | | | 6 month GBP | | 3.000 | | | (177,563 | ) | | | (14,835 | ) |
| | |
| The accompanying notes are an integral part of these financial statements. | | 59 |
GOLDMAN SACHS CORE FIXED INCOME FUND
Schedule of Investments (continued)
September 30, 2014 (Unaudited)
|
| ADDITIONAL INVESTMENT INFORMATION (continued) |
CENTRALLY CLEARED INTEREST RATE SWAP CONTRACTS (continued)
| | | | | | | | | | | | | | | | | | |
| | | | | | | Rates Exchanged | | Market Value | |
Notional
Amount
(000s) | | | Termination
Date | | | Payments
Received | | Payments
Made | | Upfront
Payments
Made (Received) | | | Unrealized
Gain (Loss) | |
| JPY | 468,120 | (a) | | | 12/17/24 | | | 6 month JYOR | | 0.750% | | $ | (41,776 | ) | | $ | 13,733 | |
| GBP | 4,700 | (a) | | | 12/18/24 | | | 3.250% | | 6 month GBP | | | 38,230 | | | | 19,856 | |
| EUR | 6,200 | (a) | | | 12/18/24 | | | 6 month EURO | | 2.000 | | | 11,813 | | | | (38,539 | ) |
| JPY | 985,360 | (a) | | | 02/14/25 | | | 6 month JYOR | | 1.720 | | | (228,625 | ) | | | 122,582 | |
| $ | 9,100 | (a) | | | 08/04/26 | | | 3 month LIBOR | | 3.409 | | | (51,180 | ) | | | (86,535 | ) |
| GBP | 2,530 | (a) | | | 09/12/26 | | | 6 month GBP | | 2.980 | | | 39,370 | | | | (64,952 | ) |
| $ | 2,200 | (a) | | | 09/28/26 | | | 3.280 | | 3 month LIBOR | | | 18 | | | | 2,960 | |
| | 21,100 | (a) | | | 12/17/29 | | | 3 month LIBOR | | 3.250 | | | (555,635 | ) | | | (71,614 | ) |
| GBP | 1,140 | (a) | | | 02/05/36 | | | 6 month GBP | | 3.500 | | | 5,766 | | | | (146,633 | ) |
| $ | 2,300 | (a) | | | 01/30/39 | | | 3 month LIBOR | | 4.370 | | | (77,646 | ) | | | (164,935 | ) |
| | 1,400 | (a) | | | 12/17/44 | | | 3 month LIBOR | | 3.500 | | | (34,682 | ) | | | (40,163 | ) |
| | 3,080 | | | | 12/17/44 | | | 3.500 | | 3 month LIBOR | | | 101,341 | | | | 63,317 | |
| GBP | 2,580 | (a) | | | 12/17/44 | | | 6 month GBP | | 3.250 | | | (262,695 | ) | | | (44,851 | ) |
| | TOTAL | | | | | | | | | | | $ | (2,159,672 | ) | | $ | 972,366 | |
| | (a) | | Represents forward starting interest rate swaps whose effective dates of commencement of accruals and cash flows occur subsequent to September 30, 2014. |
OVER THE COUNTER CREDIT DEFAULT SWAP CONTRACTS
| | | | | | | | | | | | | | | | | | | | | | | | | | |
| | | | | | | | | | | | | | | | | Market Value | |
| Swap Counterparty | | Referenced
Obligation | | Notional
Amount
(000s) | | | Rates Received
(Paid) | | | Termination
Date | | | Credit
Spread at
September 30,
2014(b) | | | Upfront
Payments
Made (Received) | | | Unrealized
Gain (Loss) | |
Protection Sold: | | | | | | | | | | | | | | | | | | | | | | | | |
Bank of America Securities LLC | | CDX North America Investment Grade Index 16 | | $ | 3,975 | | | | 1.000 | % | | | 06/20/16 | | | | 0.227 | % | | $ | 1,951 | | | $ | 52,311 | |
| | (b) | | Credit spread on the Referenced Obligation, together with the term of the swap contract, are indicators of payment/performance risk. The likelihood of a credit event occurring which would require a fund to make a payment or otherwise be required to perform under the swap contract is generally greater as the credit spread and the term of the swap contract increase. |
CENTRALLY CLEARED CREDIT DEFAULT SWAP CONTRACT
| | | | | | | | | | | | | | | | | | | | | | | | | | |
| | | | | | | | | | | | | | | | | Market Value | |
| Referenced Obligation | | | | Notional
Amount
(000s) | | | Rates Received
(Paid) | | | Termination
Date | | | Credit
Spread at
September 30,
2014(b) | | | Upfront
Payments
Made (Received) | | | Unrealized
Gain (Loss) | |
Protection Purchased: | | | | | | | | | | | | | | | | | | | | | | | | |
CDX North America Investment Grade Index 22 | | | | $ | 43,150 | | | | (1.000 | )% | | | 06/20/19 | | | | 0.644 | % | | $ | (666,803 | ) | | $ | (37,197 | ) |
| | (b) | | Credit spread on the Referenced Obligation, together with the term of the swap contract, are indicators of payment/performance risk. The likelihood of a credit event occurring which would require a fund to make a payment or otherwise be required to perform under the swap contract is generally greater as the credit spread and the term of the swap contract increase. |
| | |
| 60 | | The accompanying notes are an integral part of these financial statements. |
GOLDMAN SACHS GLOBAL INCOME FUND
Schedule of Investments
September 30, 2014 (Unaudited)
| | | | | | | | | | | | | | |
Principal
Amount | | | Interest
Rate | | | Maturity
Date | | | Value | |
| | Foreign Sovereign Debt Obligations – 40.2% | |
| | British Pound – 2.6% | |
| United Kingdom Treasury | |
| GBP | 2,690,000 | | | | 3.250 | % | | | 01/22/44 | | | $ | 4,517,947 | |
| | 3,720,000 | | | | 3.750 | | | | 07/22/52 | | | | 6,988,060 | |
| | 141,110 | | | | 0.375 | | | | 03/22/62 | | | | 310,131 | |
| | | | | | | | | | | | | | |
| | | | | | | | | | | | | 11,816,138 | |
| | |
| | Canadian Dollar – 3.1% | |
| British Columbia Province of Canada | |
| CAD | 800,000 | | | | 3.250 | | | | 12/18/21 | | | | 753,348 | |
| Government of Canada | |
| | 3,510,000 | | | | 1.500 | | | | 09/01/17 | | | | 3,153,249 | |
| | 2,250,000 | | | | 4.000 | | | | 06/01/41 | | | | 2,518,164 | |
| Ontario Province of Canada | |
| | 1,800,000 | | | | 4.400 | | | | 06/02/19 | | | | 1,775,811 | |
| | 4,200,000 | | | | 4.000 | | | | 06/02/21 | | | | 4,098,033 | |
| Quebec Province of Canada | |
| | 1,800,000 | | | | 4.250 | | | | 12/01/21 | | | | 1,779,347 | |
| | | | | | | | | | | | | | |
| | | | | | | | | | | | | 14,077,952 | |
| | |
| | Czech Koruna – 0.1% | |
| Czech Republic Government Bond | |
| CZK | 11,190,000 | | | | 1.500 | | | | 10/29/19 | | | | 539,066 | |
| | |
| | Euro – 24.1% | |
| Federal Republic of Germany | |
| EUR | 24,460,000 | | | | 0.000 | | | | 12/12/14 | | | | 30,894,523 | |
| | 1,440,000 | | | | 0.250 | | | | 04/13/18 | | | | 1,835,289 | |
| | 2,090,000 | | | | 2.000 | | | | 01/04/22 | | | | 2,924,106 | |
| | 1,010,000 | | | | 1.500 | | | | 09/04/22 | | | | 1,362,785 | |
| | 910,000 | | | | 2.000 | | | | 08/15/23 | | | | 1,269,693 | |
| | 650,000 | | | | 2.500 | | | | 07/04/44 | | | | 943,071 | |
| Government of Finland(a) | |
| | 390,000 | | | | 4.375 | | | | 07/04/19 | | | | 588,777 | |
| Government of France | |
| | 1,400,000 | | | | 3.750 | | | | 04/25/17 | | | | 1,938,067 | |
| | 2,620,000 | | | | 1.000 | | | | 05/25/18 | | | | 3,416,410 | |
| | 1,420,000 | | | | 4.250 | | | | 10/25/23 | | | | 2,288,546 | |
| | 1,330,000 | | | | 4.500 | | | | 04/25/41 | | | | 2,431,160 | |
| Italy Buoni Poliennali Del Tesoro | |
| | 2,800,000 | | | | 1.150 | | | | 05/15/17 | | | | 3,589,943 | |
| | 1,588,046 | | | | 2.350 | | | | 09/15/19 | | | | 2,216,382 | |
| | 1,100,000 | | | | 4.750 | | | | 09/01/21 | | | | 1,667,616 | |
| | 920,000 | | | | 5.500 | | | | 11/01/22 | | | | 1,462,222 | |
| | 4,870,000 | | | | 4.500 | | | | 05/01/23 | | | | 7,302,595 | |
| | 120,000 | | | | 4.750 | (a) | | | 09/01/44 | | | | 182,069 | |
| Kingdom of Belgium | |
| | 395,000 | | | | 3.750 | (a) | | | 09/28/20 | | | | 595,693 | |
| | 830,000 | | | | 2.250 | | | | 06/22/23 | | | | 1,154,234 | |
| | 970,000 | | | | 2.600 | (a) | | | 06/22/24 | | | | 1,379,002 | |
| Kingdom of The Netherlands | |
| | 2,280,000 | | | | 0.500 | | | | 04/15/17 | | | | 2,916,386 | |
| | 2,470,000 | | | | 4.500 | (a) | | | 07/15/17 | | | | 3,510,357 | |
| | 1,910,000 | | | | 1.500 | | | | 05/15/23 | | | | 2,567,521 | |
| | 1,000,000 | | | | 2.500 | (a) | | | 01/15/33 | | | | 1,424,001 | |
| Republic of Austria(a) | |
| | 3,670,000 | | | | 4.350 | | | | 03/15/19 | | | | 5,490,241 | |
| | |
| | | | | | | | | | | | | | |
Principal
Amount | | | Interest
Rate | | | Maturity
Date | | | Value | |
| | Foreign Sovereign Debt Obligations – (continued) | |
| | Euro – (continued) | |
| Republic of Italy | |
| EUR | 380,000 | | | | 3.500 | % | | | 11/01/17 | | | $ | 521,663 | |
| | 7,096,806 | | | | 2.150 | | | | 11/12/17 | | | | 9,352,646 | |
| | 1,680,000 | | | | 4.500 | | | | 08/01/18 | | | | 2,415,052 | |
| | 400,000 | | | | 5.000 | | | | 08/01/39 | | | | 630,458 | |
| Spain Government Bond | |
| | 1,560,000 | | | | 4.500 | | | | 01/31/18 | | | | 2,221,737 | |
| | 360,000 | | | | 5.400 | (a) | | | 01/31/23 | | | | 580,781 | |
| | 230,000 | | | | 4.400 | (a) | | | 10/31/23 | | | | 349,453 | |
| | 370,000 | | | | 4.800 | | | | 01/31/24 | | | | 577,945 | |
| | 2,670,000 | | | | 3.800 | (a) | | | 04/30/24 | | | | 3,877,252 | |
| | 2,535,000 | | | | 5.900 | | | | 07/30/26 | | | | 4,315,110 | |
| | 90,000 | | | | 5.150 | (a) | | | 10/31/44 | | | | 148,196 | |
| | | | | | | | | | | | | | |
| | | | | | | | | | | | | 110,340,982 | |
| | |
| | Japanese Yen – 6.8% | |
| Government of Japan | |
| JPY | 485,000,000 | | | | 2.500 | | | | 09/20/34 | | | | 5,303,647 | |
| | 430,000,000 | | | | 2.100 | | | | 12/20/26 | | | | 4,560,396 | |
| | 212,100,000 | | | | 2.500 | | | | 03/20/38 | | | | 2,320,218 | |
| | 100,000,000 | | | | 2.200 | | | | 09/20/39 | | | | 1,039,685 | |
| | 150,000,000 | | | | 2.200 | | | | 03/20/41 | | | | 1,558,672 | |
| | 59,500,000 | | | | 2.000 | | | | 09/20/41 | | | | 594,209 | |
| | 157,400,000 | | | | 2.000 | | | | 03/20/52 | | | | 1,544,466 | |
| | 29,000,000 | | | | 2.200 | | | | 03/20/31 | | | | 309,788 | |
| | 225,000,000 | | | | 1.700 | | | | 09/20/32 | | | | 2,219,715 | |
| | 200,000 | | | | 0.100 | | | | 12/15/14 | | | | 1,824 | |
| | 1,244,000,000 | | | | 0.300 | | | | 03/20/18 | | | | 11,415,706 | |
| | | | | | | | | | | | | | |
| | | | | | | | | | | | | 30,868,326 | |
| | |
| | Mexican Peso – 1.4% | |
| United Mexican States | |
| MXN | 32,641,190 | | | | 0.000 | (b) | | | 10/16/14 | | | | 2,423,913 | |
| | 24,125,960 | | | | 0.000 | (b) | | | 12/18/14 | | | | 1,785,219 | |
| | 8,640,320 | | | | 0.000 | (b) | | | 03/19/15 | | | | 634,393 | |
| | 13,763,300 | | | | 10.000 | | | | 11/20/36 | | | | 1,388,736 | |
| | 1,882,300 | | | | 8.500 | | | | 11/18/38 | | | | 165,962 | |
| | | | | | | | | | | | | | |
| | | | | | | | | | | | | 6,398,223 | |
| | |
| | Polish Zloty – 0.1% | |
| Poland Government Bond | |
| PLN | 980,000 | | | | 3.250 | | | | 07/25/19 | | | | 307,465 | |
| | 290,000 | | | | 4.000 | | | | 10/25/23 | | | | 94,462 | |
| | | | | | | | | | | | | | |
| | | | | | | | | | | | | 401,927 | |
| | |
| | South African Rand – 0.5% | |
| Republic of South Africa | |
| ZAR | 18,820,000 | | | | 7.750 | | | | 02/28/23 | | | | 1,628,976 | |
| | 6,569,608 | | | | 10.500 | | | | 12/21/26 | | | | 677,831 | |
| | | | | | | | | | | | | | |
| | | | | | | | | | | | | 2,306,807 | |
| | |
| | South Korean Won – 0.9% | |
| Republic of Korea | |
| KRW | 3,819,000,000 | | | | 5.000 | | | | 06/10/20 | | | | 4,081,924 | |
| | |
| | |
| The accompanying notes are an integral part of these financial statements. | | 61 |
GOLDMAN SACHS GLOBAL INCOME FUND
Schedule of Investments (continued)
September 30, 2014 (Unaudited)
| | | | | | | | | | | | | | |
Principal
Amount | | | Interest
Rate | | | Maturity
Date | | | Value | |
| | Foreign Sovereign Debt Obligations – (continued) | |
| | United States Dollar – 0.6% | |
| Federal Republic of Brazil | |
| $ | 610,000 | | | | 4.250 | % | | | 01/07/25 | | | $ | 603,900 | |
| | 90,000 | | | | 8.250 | | | | 01/20/34 | | | | 121,050 | |
| | 80,000 | | | | 7.125 | | | | 01/20/37 | | | | 98,000 | |
| Republic of Chile | |
| | 150,000 | | | | 3.625 | | | | 10/30/42 | | | | 131,625 | |
| Republic of Korea | |
| | 660,000 | | | | 7.125 | | | | 04/16/19 | | | | 801,577 | |
| Republic of Turkey | |
| | 200,000 | | | | 5.750 | | | | 03/22/24 | | | | 212,000 | |
| | 230,000 | | | | 6.000 | | | | 01/14/41 | | | | 238,050 | |
| United Mexican States | |
| | 470,000 | | | | 5.750 | | | | 10/12/2110 | | | | 486,450 | |
| | | | | | | | | | | | | | |
| | | | | | | | | | | | | 2,692,652 | |
| | |
| | TOTAL FOREIGN SOVEREIGN DEBT OBLIGATIONS | |
| | (Cost $184,078,842) | | | $ | 183,523,997 | |
| | |
| | | | | | | | | | | | | | |
| | Corporate Obligations – 21.0% | |
| | Automotive – 0.6% | |
| Ford Motor Credit Co. LLC | |
| $ | 2,300,000 | | | | 3.984 | % | | | 06/15/16 | | | $ | 2,406,280 | |
| | 300,000 | | | | 4.250 | | | | 02/03/17 | | | | 318,118 | |
| | | | | | | | | | | | | | |
| | | | | | | | | | | | | 2,724,398 | |
| | |
| | Automotive – 0.2% | |
| FCE Bank PLC | |
| EUR | 750,000 | | | | 1.625 | | | | 09/09/16 | | | | 966,127 | |
| | |
| | Banks – 7.9% | |
| Bank of America Corp. | |
| | 600,000 | | | | 4.625 | | | | 08/07/17 | | | | 844,788 | |
| $ | 1,550,000 | | | | 5.750 | | | | 12/01/17 | | | | 1,722,006 | |
| | 1,000,000 | | | | 5.650 | | | | 05/01/18 | | | | 1,109,825 | |
| | 1,400,000 | | | | 2.600 | | | | 01/15/19 | | | | 1,392,626 | |
| | 600,000 | | | | 2.650 | | | | 04/01/19 | | | | 597,969 | |
| | 1,450,000 | | | | 4.125 | | | | 01/22/24 | | | | 1,473,078 | |
| Barclays Bank PLC | |
| GBP | 400,000 | | | | 10.000 | | | | 05/21/21 | | | | 853,817 | |
| BNP Paribas SA(c)(d) | |
| EUR | 150,000 | | | | 4.730 | | | | 04/12/49 | | | | 194,668 | |
| Citigroup, Inc. | |
| $ | 105,000 | | | | 4.450 | | | | 01/10/17 | | | | 111,760 | |
| | 375,000 | | | | 6.125 | | | | 05/15/18 | | | | 424,141 | |
| Credit Agricole SA(a) | |
| | 1,500,000 | | | | 2.125 | | | | 04/17/18 | | | | 1,497,631 | |
| Dexia Credit Local SA(a) | |
| | 2,000,000 | | | | 1.500 | | | | 10/07/17 | | | | 1,998,080 | |
| HSBC Holdings PLC | |
| | 450,000 | | | | 6.800 | | | | 06/01/38 | | | | 577,568 | |
| | 900,000 | | | | 6.375 | (c)(d) | | | 09/17/49 | | | | 896,510 | |
| ING Bank NV | |
| | 1,600,000 | | | | 4.000 | (a) | | | 03/15/16 | | | | 1,669,901 | |
| EUR | 1,050,000 | | | | 6.125 | (c)(d) | | | 05/29/23 | | | | 1,518,502 | |
| | |
| | | | | | | | | | | | | | |
Principal
Amount | | | Interest
Rate | | | Maturity
Date | | | Value | |
| | Corporate Obligations – (continued) | |
| | Banks – (continued) | |
| Intesa Sanpaolo SpA | |
| EUR | 500,000 | | | | 4.125 | % | | | 01/14/16 | | | $ | 660,058 | |
| $ | 800,000 | | | | 2.375 | | | | 01/13/17 | | | | 805,619 | |
| | 1,700,000 | | | | 3.875 | | | | 01/16/18 | | | | 1,768,973 | |
| | 900,000 | | | | 3.875 | | | | 01/15/19 | | | | 933,997 | |
| | 500,000 | | | | 5.017 | (a) | | | 06/26/24 | | | | 485,693 | |
| JPMorgan Chase & Co. | |
| | 1,400,000 | | | | 4.250 | | | | 10/15/20 | | | | 1,489,584 | |
| Lloyds TSB Bank PLC(c)(d) | |
| EUR | 1,250,000 | | | | 11.875 | | | | 12/16/21 | | | | 1,926,231 | |
| Macquarie Bank Ltd.(a) | |
| $ | 1,450,000 | | | | 2.600 | | | | 06/24/19 | | | | 1,448,824 | |
| Morgan Stanley, Inc. | |
| | 1,650,000 | | | | 4.000 | | | | 07/24/15 | | | | 1,693,794 | |
| | 225,000 | | | | 5.550 | | | | 04/27/17 | | | | 246,363 | |
| | 850,000 | | | | 6.250 | | | | 08/28/17 | | | | 952,634 | |
| | 250,000 | | | | 6.625 | | | | 04/01/18 | | | | 285,885 | |
| | 400,000 | | | | 2.125 | | | | 04/25/18 | | | | 398,559 | |
| | 500,000 | | | | 5.625 | | | | 09/23/19 | | | | 561,485 | |
| EUR | 900,000 | | | | 2.375 | | | | 03/31/21 | | | | 1,204,387 | |
| Nordea Bank AB(a)(c)(d) | |
| $ | 500,000 | | | | 6.125 | | | | 09/23/49 | | | | 490,000 | |
| Regions Financial Corp.(d) | |
| | 750,000 | | | | 2.000 | | | | 05/15/18 | | | | 741,158 | |
| Santander Holdings USA, Inc.(d) | |
| | 850,000 | | | | 3.000 | | | | 09/24/15 | | | | 865,252 | |
| Standard Chartered PLC(a) | |
| | 400,000 | | | | 5.500 | | | | 11/18/14 | | | | 402,560 | |
| Sumitomo Mitsui Financial Group, Inc.(a) | |
| | 1,500,000 | | | | 4.436 | | | | 04/02/24 | | | | 1,536,553 | |
| Synchrony Financial(d) | |
| | 100,000 | | | | 1.875 | | | | 08/15/17 | | | | 100,141 | |
| | 250,000 | | | | 3.000 | | | | 08/15/19 | | | | 250,539 | |
| | | | | | | | | | | | | | |
| | | | | | | | | | | | | 36,131,159 | |
| | |
| | Chemicals – 0.3% | |
| LYB International Finance BV | |
| | 150,000 | | | | 5.250 | | | | 07/15/43 | | | | 159,607 | |
| LyondellBasell Industries NV(d) | |
| | 500,000 | | | | 5.000 | | | | 04/15/19 | | | | 551,948 | |
| Monsanto Co.(d) | |
| | 600,000 | | | | 4.400 | | | | 07/15/44 | | | | 590,636 | |
| | | | | | | | | | | | | | |
| | | | | | | | | | | | | 1,302,191 | |
| | |
| | Communications – 3.2% | |
| 21st Century Fox America, Inc. | |
| | 50,000 | | | | 4.000 | | | | 10/01/23 | | | | 51,687 | |
| America Movil SAB de CV | |
| MXN | 5,260,000 | | | | 6.000 | | | | 06/09/19 | | | | 394,376 | |
| American Tower Corp. | |
| $ | 250,000 | | | | 3.400 | | | | 02/15/19 | | | | 255,400 | |
| British Telecommunications PLC | |
| GBP | 244,000 | | | | 6.625 | | | | 06/23/17 | | | | 442,885 | |
| Comcast Corp. | |
| $ | 1,800,000 | | | | 4.500 | | | | 01/15/43 | | | | 1,827,370 | |
| | |
| | |
| 62 | | The accompanying notes are an integral part of these financial statements. |
GOLDMAN SACHS GLOBAL INCOME FUND
| | | | | | | | | | | | | | |
Principal
Amount | | | Interest
Rate | | | Maturity
Date | | | Value | |
| | Corporate Obligations – (continued) | |
| | Communications – (continued) | |
| DIRECTV Holdings LLC/DIRECTV Financing Co., Inc. | |
| $ | 200,000 | | | | 6.000 | %(d) | | | 08/15/40 | | | $ | 223,874 | |
| | 350,000 | | | | 6.375 | | | | 03/01/41 | | | | 412,917 | |
| Empresa Nacional de Telecomunicaciones SA(a) | |
| | 830,000 | | | | 4.875 | �� | | | 10/30/24 | | | | 852,576 | |
| Koninklijke KPN NV | |
| EUR | 600,000 | | | | 3.250 | | | | 02/01/21 | | | | 832,686 | |
| | 200,000 | | | | 4.250 | | | | 03/01/22 | | | | 293,510 | |
| Mobile Telesystems OJSC via MTS International Funding Ltd. | |
| $ | 380,000 | | | | 8.625 | | | | 06/22/20 | | | | 402,800 | |
| Time Warner Cable, Inc. | |
| | 200,000 | | | | 6.550 | | | | 05/01/37 | | | | 250,328 | |
| | 678,000 | | | | 7.300 | | | | 07/01/38 | | | | 915,982 | |
| Verizon Communications, Inc. | |
| | 2,248,806 | | | | 2.625 | (a) | | | 02/21/20 | | | | 2,219,178 | |
| | 350,000 | | | | 4.500 | | | | 09/15/20 | | | | 377,839 | |
| | 1,500,000 | | | | 5.150 | | | | 09/15/23 | | | | 1,655,026 | |
| | 546,000 | | | | 6.400 | | | | 09/15/33 | | | | 665,099 | |
| | 699,000 | | | | 6.550 | | | | 09/15/43 | | | | 866,925 | |
| | 566,000 | | | | 4.862 | (a) | | | 08/21/46 | | | | 567,518 | |
| | 23 | | | | 5.012 | (a) | | | 08/21/54 | | | | 23 | |
| Verizon Wireless Capital LLC | |
| EUR | 950,000 | | | | 8.750 | | | | 12/18/15 | | | | 1,321,762 | |
| | | | | | | | | | | | | | |
| | | | | | | | | | | | | 14,829,761 | |
| | |
| | Consumer Noncyclical – 0.3% | |
| Avon Products, Inc. | |
| $ | 1,000,000 | | | | 4.600 | | | | 03/15/20 | | | | 1,021,261 | |
| | 400,000 | | | | 5.000 | | | | 03/15/23 | | | | 391,959 | |
| | | | | | | | | | | | | | |
| | | | | | | | | | | | | 1,413,220 | |
| | |
| | Diversified Manufacturing – 0.1% | |
| Roper Industries, Inc. | |
| | 400,000 | | | | 2.050 | | | | 10/01/18 | | | | 396,192 | |
| | |
| | Electric – 0.7% | |
| Enel Finance International NV | |
| GBP | 1,000,000 | | | | 5.625 | | | | 08/14/24 | | | | 1,849,749 | |
| | 200,000 | | | | 5.750 | | | | 09/14/40 | | | | 368,946 | |
| MidAmerican Energy Holdings Co. | |
| $ | 350,000 | | | | 5.950 | | | | 05/15/37 | | | | 422,384 | |
| Ruwais Power Co. PJSC(a) | |
| | 520,000 | | | | 6.000 | | | | 08/31/36 | | | | 582,400 | |
| | | | | | | | | | | | | | |
| | | | | | | | | | | | | 3,223,479 | |
| | |
| | Energy – 1.8% | |
| Anadarko Petroleum Corp. | |
| | 200,000 | | | | 6.450 | | | | 09/15/36 | | | | 243,365 | |
| Brazil Minas SPE via State of Minas Gerais | |
| | 231,000 | | | | 5.333 | | | | 02/15/28 | | | | 228,690 | |
| Buckeye Partners LP(d) | |
| | 550,000 | | | | 4.150 | | | | 07/01/23 | | | | 555,544 | |
| Dolphin Energy Ltd. | |
| | 870,675 | | | | 5.888 | (a) | | | 06/15/19 | | | | 957,743 | |
| | 561,925 | | | | 5.888 | | | | 06/15/19 | | | | 618,118 | |
| Petrobras Global Finance BV | |
| | 400,000 | | | | 4.875 | | | | 03/17/20 | | | | 402,044 | |
| | |
| | | | | | | | | | | | | | |
Principal
Amount | | | Interest
Rate | | | Maturity
Date | | | Value | |
| | Corporate Obligations – (continued) | |
| | Energy – (continued) | |
| Petroleos Mexicanos | |
| $ | 920,000 | | | | 5.500 | % | | | 01/21/21 | | | $ | 1,007,538 | |
| Transocean, Inc. | |
| | 1,450,000 | | | | 6.375 | | | | 12/15/21 | | | | 1,534,325 | |
| Transportadora de Gas Internacional SA ESP(d) | |
| | 340,000 | | | | 5.700 | | | | 03/20/22 | | | | 360,400 | |
| Weatherford International Ltd. | |
| | 500,000 | | | | 9.625 | | | | 03/01/19 | | | | 642,108 | |
| | 718,000 | | | | 5.125 | | | | 09/15/20 | | | | 786,262 | |
| | 50,000 | | | | 4.500 | (d) | | | 04/15/22 | | | | 52,214 | |
| Williams Partners LP(d) | |
| | 650,000 | | | | 3.900 | | | | 01/15/25 | | | | 640,274 | |
| | | | | | | | | | | | | | |
| | | | | | | | | | | | | 8,028,625 | |
| | |
| | Financial Companies – 0.9% | |
| American Express Credit Corp. | |
| GBP | 1,200,000 | | | | 5.375 | | | | 10/01/14 | | | | 1,945,380 | |
| $ | 700,000 | | | | 2.800 | | | | 09/19/16 | | | | 723,966 | |
| GE Capital European Funding | |
| EUR | 1,200,000 | | | | 2.875 | | | | 06/18/19 | | | | 1,670,940 | |
| | | | | | | | | | | | | | |
| | | | | | | | | | | | | 4,340,286 | |
| | |
| | Food & Beverage – 0.8% | |
| Mondelez International, Inc. | |
| $ | 496,000 | | | | 6.500 | | | | 02/09/40 | | | | 618,429 | |
| Pernod-Ricard SA(a) | |
| | 400,000 | | | | 4.450 | | | | 01/15/22 | | | | 422,703 | |
| | 1,050,000 | | | | 4.250 | | | | 07/15/22 | | | | 1,093,909 | |
| | 885,000 | | | | 5.500 | | | | 01/15/42 | | | | 968,629 | |
| Sysco Corp.(d) | |
| | 100,000 | | | | 2.350 | | | | 10/02/19 | | | | 100,092 | |
| | 150,000 | | | | 3.000 | | | | 10/02/21 | | | | 150,607 | |
| | 150,000 | | | | 3.500 | | | | 10/02/24 | | | | 150,390 | |
| | 150,000 | | | | 4.350 | | | | 10/02/34 | | | | 152,873 | |
| | 200,000 | | | | 4.500 | | | | 10/02/44 | | | | 202,455 | |
| | | | | | | | | | | | | | |
| | | | | | | | | | | | | 3,860,087 | |
| | |
| | Health Care – Services(d) – 0.2% | |
| Celgene Corp. | |
| | 750,000 | | | | 3.625 | �� | | | 05/15/24 | | | | 738,965 | |
| | |
| | Insurance – 0.8% | |
| AIG Life Holdings, Inc. | |
| | 100,000 | | | | 8.500 | | | | 07/01/30 | | | | 131,500 | |
| Allianz Finance II BV(c)(d) | |
| EUR | 100,000 | | | | 5.750 | | | | 07/08/41 | | | | 147,196 | |
| Assicurazioni Generali SpA(c)(d) | |
| GBP | 150,000 | | | | 6.416 | | | | 02/28/49 | | | | 246,929 | |
| Generali Finance BV(c)(d) | |
| | 350,000 | | | | 6.214 | | | | 12/31/49 | | | | 573,856 | |
| Genworth Holdings, Inc. | |
| $ | 150,000 | | | | 7.700 | | | | 06/15/20 | | | | 180,335 | |
| | 300,000 | | | | 7.625 | | | | 09/24/21 | | | | 364,035 | |
| | 300,000 | | | | 4.900 | | | | 08/15/23 | | | | 310,711 | |
| QBE Insurance Group Ltd.(a) | |
| | 400,000 | | | | 2.400 | | | | 05/01/18 | | | | 400,166 | |
| | |
| | |
| The accompanying notes are an integral part of these financial statements. | | 63 |
GOLDMAN SACHS GLOBAL INCOME FUND
Schedule of Investments (continued)
September 30, 2014 (Unaudited)
| | | | | | | | | | | | | | |
Principal
Amount | | | Interest
Rate | | | Maturity
Date | | | Value | |
| | Corporate Obligations – (continued) | |
| | Insurance – (continued) | |
| Standard Life PLC(c)(d) | |
| GBP | 150,000 | | | | 6.546 | % | | | 01/06/49 | | | $ | 263,842 | |
| Teachers Insurance & Annuity Association of America(a) | |
| $ | 800,000 | | | | 4.900 | | | | 09/15/44 | | | | 815,298 | |
| | | | | | | | | | | | | | |
| | | | | | | | | | | | | 3,433,868 | |
| | |
| | Metals & Mining – 0.5% | |
| Glencore Finance Canada Ltd.(a) | |
| | 1,500,000 | | | | 4.250 | | | | 10/25/22 | | | | 1,503,237 | |
| Glencore Funding LLC(a) | |
| | 50,000 | | | | 4.125 | | | | 05/30/23 | | | | 49,485 | |
| Rio Tinto Finance USA Ltd. | |
| | 752,000 | | | | 9.000 | | | | 05/01/19 | | | | 962,390 | |
| | | | | | | | | | | | | | |
| | | | | | | | | | | | | 2,515,112 | |
| | |
| | Natural Gas(c)(d) – 0.3% | |
| GDF Suez | |
| EUR | 900,000 | | | | 3.875 | | | | 07/10/49 | | | | 1,189,320 | |
| | |
| | Noncaptive – Financial – 0.1% | |
| General Electric Capital Corp. | |
| MXN | 1,000,000 | | | | 8.500 | | | | 04/06/18 | | | | 82,424 | |
| $ | 350,000 | | | | 5.550 | | | | 05/04/20 | | | | 401,040 | |
| | | | | | | | | | | | | | |
| | | | | | | | | | | | | 483,464 | |
| | |
| | Pharmaceuticals – 0.6% | |
| AbbVie, Inc. | |
| | 1,500,000 | | | | 1.750 | | | | 11/06/17 | | | | 1,495,144 | |
| Actavis Funding SCS(a) | |
| | 50,000 | | | | 2.450 | | | | 06/15/19 | | | | 48,760 | |
| | 350,000 | | | | 4.850 | (d) | | | 06/15/44 | | | | 329,538 | |
| Actavis Funding SCS Co.(a)(d) | |
| | 100,000 | | | | 3.850 | | | | 06/15/24 | | | | 96,705 | |
| Forest Laboratories, Inc.(a) | |
| | 300,000 | | | | 4.375 | | | | 02/01/19 | | | | 316,500 | |
| | 400,000 | | | | 5.000 | (d) | | | 12/15/21 | | | | 427,554 | |
| | | | | | | | | | | | | | |
| | | | | | | | | | | | | 2,714,201 | |
| | |
| | Real Estate Investment Trusts – 1.4% | |
| Gecina SA | |
| EUR | 700,000 | | | | 4.250 | | | | 02/03/16 | | | | 928,043 | |
| Hammerson PLC | |
| | 850,000 | | | | 2.000 | | | | 07/01/22 | | | | 1,104,907 | |
| HCP, Inc.(d) | |
| $ | 100,000 | | | | 2.625 | | | | 02/01/20 | | | | 98,988 | |
| | 1,750,000 | | | | 5.375 | | | | 02/01/21 | | | | 1,953,045 | |
| | 200,000 | | | | 4.250 | | | | 11/15/23 | | | | 205,076 | |
| Prologis LP(d) | |
| EUR | 300,000 | | | | 3.000 | | | | 01/18/22 | | | | 414,685 | |
| | 400,000 | | | | 3.375 | | | | 02/20/24 | | | | 560,784 | |
| Trust F/1401(a) | |
| $ | 330,000 | | | | 5.250 | | | | 12/15/24 | | | | 344,355 | |
| Ventas Realty LP/Ventas Capital Corp.(d) | |
| | 200,000 | | | | 3.250 | | | | 08/15/22 | | | | 194,447 | |
| WEA Finance LLC/Westfield UK & Europe Finance PLC(a)(d) | |
| | 350,000 | | | | 2.700 | | | | 09/17/19 | | | | 350,830 | |
| | 400,000 | | | | 3.750 | | | | 09/17/24 | | | | 398,915 | |
| | | | | | | | | | | | | | |
| | | | | | | | | | | | | 6,554,075 | |
| | |
| | | | | | | | | | | | | | |
Principal
Amount | | | Interest
Rate | | | Maturity
Date | | | Value | |
| | Corporate Obligations – (continued) | |
| | Technology – 0.2% | |
| Apple, Inc. | |
| $ | 500,000 | | | | 3.850 | % | | | 05/04/43 | | | $ | 462,769 | |
| Hewlett-Packard Co. | |
| | 250,000 | | | | 2.600 | | | | 09/15/17 | | | | 256,765 | |
| | | | | | | | | | | | | | |
| | | | | | | | | | | | | 719,534 | |
| | |
| | Transportation(a) – 0.1% | |
| Penske Truck Leasing Co. LP/PTL Finance Corp. | |
| | 450,000 | | | | 4.250 | | | | 01/17/23 | | | | 462,720 | |
| | |
| | TOTAL CORPORATE OBLIGATIONS | |
| | (Cost $94,177,871) | | | $ | 96,026,784 | |
| | |
| | | | | | | | | | | | | | |
| | Foreign Debt Obligations(e) – 2.7% | |
| | Supranational – 2.7% | |
| European Financial Stability Facility | |
| EUR | 7,700,000 | | | | 2.000 | % | | | 05/15/17 | | | $ | 10,224,834 | |
| | 1,800,000 | | | | 0.875 | | | | 04/16/18 | | | | 2,333,129 | |
| | |
| | TOTAL FOREIGN DEBT OBLIGATIONS | |
| | (Cost $12,149,449) | | | $ | 12,557,963 | |
| | |
| | | | | | | | | | | | | | |
| | Asset-Backed Securities(c) – 8.8% | |
| | Collateralized Loan Obligations(a) – 6.2% | |
| B&M CLO Ltd. Series 2014-1A, Class A1 | |
| $ | 1,750,000 | | | | 1.598 | % | | | 04/16/26 | | | $ | 1,737,477 | |
| B&M CLO Ltd. Series 2014-1A, Class A2 | |
| | 300,000 | | | | 2.148 | | | | 04/16/26 | | | | 287,477 | |
| CIFC Funding Ltd. Series 2014-2A, Class A1L | |
| | 2,500,000 | | | | 1.725 | | | | 05/24/26 | | | | 2,497,587 | |
| Halcyon Loan Advisors Funding Ltd. Series 2014-1A, Class A1 | |
| | 1,600,000 | | | | 1.808 | | | | 04/18/26 | | | | 1,598,459 | |
| Halcyon Loan Advisors Funding Ltd. Series 2014-2A, Class A1B | |
| | 3,250,000 | | | | 1.655 | | | | 04/28/25 | | | | 3,224,429 | |
| Halcyon Loan Advisors Funding Ltd. Series 2014-2A, Class A2 | |
| | 850,000 | | | | 2.228 | | | | 04/28/25 | | | | 819,455 | |
| Magnetite VIII Ltd. Series 2014-8A, Class A | |
| | 2,700,000 | | | | 1.708 | | | | 04/15/26 | | | | 2,702,322 | |
| Magnetite VIII Ltd. Series 2014-8A, Class B | |
| | 550,000 | | | | 2.228 | | | | 04/15/26 | | | | 538,696 | |
| OFSI Fund V Ltd. Series 2014-7A, Class ACOM | |
| | 2,850,000 | | | | 1.872 | | | | 10/18/26 | | | | 2,820,930 | |
| Shackleton CLO Ltd. Series 2014-5A, Class A | |
| | 3,650,000 | | | | 1.737 | | | | 05/07/26 | | | | 3,652,340 | |
| Shackleton CLO Ltd. Series 2014-5A, Class B1 | |
| | 800,000 | | | | 2.237 | | | | 05/07/26 | | | | 780,808 | |
| Trinitas CLO II Ltd. Series 2014-2A, Class ACOM | |
| | 1,250,000 | | | | 1.691 | | | | 07/15/26 | | | | 1,225,250 | |
| Trinitas CLO Ltd. Series 2014-1A, Class A1 | |
| | 1,550,000 | | | | 1.833 | | | | 04/15/26 | | | | 1,542,824 | |
| Trinitas CLO Ltd. Series 2014-1A, Class B1 | |
| | 400,000 | | | | 2.203 | | | | 04/15/26 | | | | 382,070 | |
| Whitehorse VIII Ltd. Series 2014-1A, Class A | |
| | 3,500,000 | | | | 1.740 | | | | 05/01/26 | | | | 3,498,988 | |
| | |
| | |
| 64 | | The accompanying notes are an integral part of these financial statements. |
GOLDMAN SACHS GLOBAL INCOME FUND
| | | | | | | | | | | | | | |
Principal
Amount | | | Interest
Rate | | | Maturity
Date | | | Value | |
| | Asset-Backed Securities(c) – (continued) | |
| | Collateralized Loan Obligations – (continued) | |
| Whitehorse VIII Ltd. Series 2014-1A, Class B | |
| $ | 750,000 | | | | 2.290 | % | | | 05/01/26 | | | $ | 734,882 | |
| | | | | | | | | | | | | | |
| | | | | | | | | | | | | 28,043,994 | |
| | |
| | Home Equity – 0.6% | |
| CIT Mortgage Loan Trust Series 2007-1, Class 2A3(a) | |
| | 2,900,000 | | | | 1.605 | | | | 10/25/37 | | | | 2,718,362 | |
| GMAC Mortgage Corp. Loan Trust Series 2007-HE3, Class 1A1 | |
| | 73,156 | | | | 7.000 | | | | 09/25/37 | | | | 72,718 | |
| GMAC Mortgage Corp. Loan Trust Series 2007-HE3, Class 2A1 | |
| | 113,531 | | | | 6.827 | | | | 09/25/37 | | | | 113,551 | |
| | | | | | | | | | | | | | |
| | | | | | | | | | | | | 2,904,631 | |
| | |
| | Student Loans – 2.0% | |
| Access Group, Inc. Series 2004-2, Class A2 | |
| | 2,231,644 | | | | 0.384 | | | | 01/25/16 | | | | 2,145,439 | |
| Educational Services of America, Inc. Series 2010-1, Class A1(a) | |
| | 1,522,811 | | | | 1.084 | | | | 07/25/23 | | | | 1,532,442 | |
| Knowledgeworks Foundation Student Loan Series 2010-1,
Class A |
|
| | 843,855 | | | | 1.185 | | | | 02/25/42 | | | | 851,636 | |
| Nelnet Student Loan Trust Series 2010-3A, Class A(a) | |
| | 907,789 | | | | 1.014 | | | | 07/27/48 | | | | 914,433 | |
| Nelnet Student Loan Trust Series 2011-1A, Class A(a) | |
| | 508,357 | | | | 1.005 | | | | 02/25/43 | | | | 513,088 | |
| SLC Student Loan Center Series 2011-1, Class A(a) | |
| | 1,122,952 | | | | 1.375 | | | | 10/25/27 | | | | 1,145,518 | |
| SLC Student Loan Trust Series 2006-1, Class A4 | |
| | 1,483,957 | | | | 0.314 | | | | 12/15/21 | | | | 1,480,404 | |
| US Education Loan Trust LLC Series 2006-1, Class A2(a) | |
| | 195,680 | | | | 0.364 | | | | 03/01/25 | | | | 195,457 | |
| Wachovia Student Loan Trust Series 2006-1, Class A4(a) | |
| | 252,993 | | | | 0.314 | | | | 04/25/23 | | | | 252,944 | |
| | | | | | | | | | | | | | |
| | | | | | | | | | | | | 9,031,361 | |
| | |
| | TOTAL ASSET-BACKED SECURITIES | |
| | (Cost $40,089,505) | | | $ | 39,979,986 | |
| | |
| | | | | | | | | | | | | | |
| | Mortgage-Backed Obligations – 19.0% | |
| | Adjustable Rate Non-Agency(c) – 0.8% | |
| Countrywide Alternative Loan Trust Series 2005-38, Class A1 | |
| $ | 197,971 | | | | 1.618 | % | | | 09/25/35 | | | $ | 180,648 | |
| Countrywide Alternative Loan Trust Series 2006-OA1, Class 2A1 | |
| | 950,782 | | | | 0.366 | | | | 03/20/46 | | | | 730,581 | |
| Countrywide Home Loan Mortgage Pass-Through Trust
Series 2004-HYB5, Class 2A1 |
|
| | 185,165 | | | | 2.341 | | | | 04/20/35 | | | | 183,657 | |
| Harborview Mortgage Loan Trust Series 2006-6, Class 3A1A | |
| | 989,749 | | | | 2.631 | | | | 08/19/36 | | | | 810,028 | |
| Residential Accredit Loans, Inc. Series 2005-Q05, Class A1 | |
| | 1,269,521 | | | | 1.118 | | | | 01/25/46 | | | | 959,631 | |
| Sequoia Mortgage Trust Series 2004-10, Class A3A | |
| | 264,536 | | | | 0.651 | | | | 11/20/34 | | | | 254,646 | |
| | |
| | | | | | | | | | | | | | |
Principal
Amount | | | Interest
Rate | | | Maturity
Date | | | Value | |
| | Mortgage-Backed Obligations – (continued) | |
| | Adjustable Rate Non-Agency – (continued) | |
| Structured Adjustable Rate Mortgage Loan Trust Series 2004-16,
Class 3A1 |
|
| $ | 622,144 | | | | 2.492 | % | | | 11/25/34 | | | $ | 629,931 | |
| | |
| TOTAL ADJUSTABLE RATE
NON-AGENCY |
| | $ | 3,749,122 | |
| | |
| | Collateralized Mortgage Obligations – 3.9% | |
| Aire Valley Mortgages PLC Series 2006-1A, Class 1A(a)(c) | |
| $ | 757,084 | | | | 0.453 | % | | | 09/20/66 | | | $ | 741,926 | |
| Aire Valley Mortgages PLC Series 2006-1X, Class 2A1(c) | |
| EUR | 2,474,900 | | | | 0.382 | | | | 09/20/66 | | | | 3,073,749 | |
| Aire Valley Mortgages PLC Series 2007-1A, Class 2A1(a)(c) | |
| $ | 485,359 | | | | 0.473 | | | | 09/20/66 | | | | 476,055 | |
| Aire Valley Mortgages PLC Series 2007-1X, Class 2A2(c) | |
| EUR | 1,888,854 | | | | 0.342 | | | | 09/20/66 | | | | 2,341,814 | |
| Eurosail Prime-UK PLC Series 2007-PR1X, Class A1(c) | |
| GBP | 381,109 | | | | 0.952 | | | | 09/13/45 | | | | 595,113 | |
| FNMA REMIC Series 2010-126, Class LS(c) | |
| $ | 2,423,074 | | | | 4.846 | | | | 11/25/40 | | | | 444,529 | |
| FNMA REMIC Series 2011-52, Class GB | |
| | 1,000,000 | | | | 5.000 | | | | 06/25/41 | | | | 1,109,574 | |
| FNMA REMIC Series 2011-99, Class DB | |
| | 875,000 | | | | 5.000 | | | | 10/25/41 | | | | 974,544 | |
| FNMA REMIC Series 2012-111, Class B | |
| | 201,203 | | | | 7.000 | | | | 10/25/42 | | | | 228,268 | |
| FNMA REMIC Series 2012-153, Class B | |
| | 666,535 | | | | 7.000 | | | | 07/25/42 | | | | 755,943 | |
| Leek Finance Number Eighteen PLC Series 2018X, Class A2C(c) | |
| EUR | 146,958 | | | | 0.472 | | | | 09/21/38 | | | | 193,851 | |
| Leek Finance Number Seventeen PLC Series 2017X,
Class A2A(c) |
|
| GBP | 96,411 | | | | 0.833 | | | | 12/21/37 | | | | 164,489 | |
| Leek Finance PLC Series 2017X, Class A2C(c) | |
| EUR | 160,685 | | | | 0.492 | | | | 12/21/37 | | | | 213,857 | |
| Leek Finance PLC Series 2018X, Class A2B(c) | |
| $ | 832,762 | | | | 0.490 | | | | 09/21/38 | | | | 869,390 | |
| NCUA Guaranteed Notes Series 2010-C1, Class APT | |
| | 3,082,404 | | | | 2.650 | | | | 10/29/20 | | | | 3,164,088 | |
| NCUA Guaranteed Notes Series 2010-R1, Class 2A | |
| | 37,682 | | | | 1.840 | | | | 10/07/20 | | | | 37,842 | |
| Quadrivio Finance Series 2011-1, Class A1(c) | |
| EUR | 1,437,489 | | | | 0.708 | | | | 07/25/60 | | | | 1,813,577 | |
| Thrones PLC Series 2013-1, Class A(c) | |
| GBP | 428,583 | | | | 2.028 | | | | 07/20/44 | | | | 707,323 | |
| | |
| TOTAL COLLATERALIZED MORTGAGE
OBLIGATIONS |
| | $ | 17,905,932 | |
| | |
| | Commercial Mortgage-Backed Securities – 4.0% | |
| Banc of America Commercial Mortgage, Inc. Series 2007-2,
Class AM(c) |
|
| $ | 600,000 | | | | 5.622 | % | | | 04/10/49 | | | $ | 653,794 | |
| Bear Stearns Commercial Mortgage Securities Trust
Series 2007-PW18, Class A1A |
|
| | 2,526,109 | | | | 5.602 | | | | 06/11/50 | | | | 2,781,223 | |
| Commercial Mortgage Trust Series 2007-C9, Class A1A(c) | |
| | 4,480,445 | | | | 5.796 | | | | 12/10/49 | | | | 4,892,460 | |
| | |
| | |
| The accompanying notes are an integral part of these financial statements. | | 65 |
GOLDMAN SACHS GLOBAL INCOME FUND
Schedule of Investments (continued)
September 30, 2014 (Unaudited)
| | | | | | | | | | | | | | |
Principal
Amount | | | Interest
Rate | | | Maturity
Date | | | Value | |
| | Mortgage-Backed Obligations – (continued) | |
| | Commercial Mortgage-Backed Securities – (continued) | |
| FNMA ACES Series 2012-M8, Class ASQ2 | |
| $ | 200,000 | | | | 1.520 | % | | | 12/25/19 | | | $ | 199,476 | |
| FNMA ACES Series 2012-M8, Class ASQ3 | |
| | 300,000 | | | | 1.800 | | | | 12/25/19 | | | | 297,384 | |
| GS Mortgage Securities Trust Series 2007-GG10, Class A1A(c) | |
| | 3,496,021 | | | | 5.797 | | | | 08/10/45 | | | | 3,845,872 | |
| LB Commercial Mortgage Trust Series 2007-C3, Class A1A(c) | |
| | 3,009,833 | | | | 6.056 | | | | 07/15/44 | | | | 3,319,290 | |
| Morgan Stanley Capital I Trust Series 2007-HQ11, Class AM(c) | |
| | 150,000 | | | | 5.478 | | | | 02/12/44 | | | | 161,380 | |
| Morgan Stanley Capital I Trust Series 2007-HQ13, Class AM(c) | |
| | 250,000 | | | | 5.931 | | | | 12/15/44 | | | | 242,076 | |
| Wachovia Bank Commercial Mortgage Trust Series 2007-C34,
Class A1A(c) |
|
| | 1,736,971 | | | | 5.608 | | | | 05/15/46 | | | | 1,865,877 | |
| | |
| TOTAL COMMERCIAL
MORTGAGE-BACKED SECURITIES |
| | $ | 18,258,832 | |
| | |
| | Federal Agencies – 10.3% | |
| | FHLMC – 0.7% | |
| $ | 481 | | | | 5.000 | % | | | 09/01/16 | | | $ | 498 | |
| | 4,686 | | | | 5.000 | | | | 11/01/16 | | | | 4,943 | |
| | 942 | | | | 5.000 | | | | 12/01/16 | | | | 993 | |
| | 15,327 | | | | 5.000 | | | | 01/01/17 | | | | 16,169 | |
| | 24,049 | | | | 5.000 | | | | 02/01/17 | | | | 25,375 | |
| | 21,049 | | | | 5.000 | | | | 03/01/17 | | | | 22,210 | |
| | 38,010 | | | | 5.000 | | | | 04/01/17 | | | | 40,102 | |
| | 1,759 | | | | 5.000 | | | | 05/01/17 | | | | 1,856 | |
| | 682 | | | | 5.000 | | | | 06/01/17 | | | | 719 | |
| | 1,177 | | | | 5.000 | | | | 08/01/17 | | | | 1,242 | |
| | 114,143 | | | | 5.000 | | | | 09/01/17 | | | | 120,429 | |
| | 139,189 | | | | 5.000 | | | | 10/01/17 | | | | 146,860 | |
| | 81,621 | | | | 5.000 | | | | 11/01/17 | | | | 86,122 | |
| | 89,219 | | | | 5.000 | | | | 12/01/17 | | | | 94,134 | |
| | 105,833 | | | | 5.000 | | | | 01/01/18 | | | | 111,654 | |
| | 242,519 | | | | 5.000 | | | | 02/01/18 | | | | 255,814 | |
| | 226,194 | | | | 5.000 | | | | 03/01/18 | | | | 238,736 | |
| | 217,568 | | | | 5.000 | | | | 04/01/18 | | | | 229,635 | |
| | 162,701 | | | | 5.000 | | | | 05/01/18 | | | | 171,741 | |
| | 40,322 | | | | 5.000 | | | | 06/01/18 | | | | 42,588 | |
| | 41,173 | | | | 5.000 | | | | 07/01/18 | | | | 43,605 | |
| | 19,052 | | | | 5.000 | | | | 08/01/18 | | | | 20,136 | |
| | 15,258 | | | | 5.000 | | | | 09/01/18 | | | | 16,103 | |
| | 49,944 | | | | 5.000 | | | | 10/01/18 | | | | 52,746 | |
| | 63,270 | | | | 5.000 | | | | 11/01/18 | | | | 66,846 | |
| | 41,510 | | | | 5.000 | | | | 12/01/18 | | | | 43,808 | |
| | 30,238 | | | | 5.000 | | | | 01/01/19 | | | | 31,933 | |
| | 2,773 | | | | 5.000 | | | | 02/01/19 | | | | 2,941 | |
| | 7,147 | | | | 5.000 | | | | 03/01/19 | | | | 7,580 | |
| | 3,980 | | | | 5.000 | | | | 01/01/33 | | | | 4,391 | |
| | 1,628 | | | | 5.000 | | | | 06/01/33 | | | | 1,800 | |
| | 14,458 | | | | 5.000 | | | | 07/01/33 | | | | 15,983 | |
| | 17,875 | | | | 5.000 | | | | 08/01/33 | | | | 19,761 | |
| | 3,129 | | | | 5.000 | | | | 10/01/33 | | | | 3,458 | |
| | 13,573 | | | | 5.000 | | | | 11/01/33 | | | | 15,004 | |
| | 3,617 | | | | 5.000 | | | | 12/01/33 | | | | 3,999 | |
| | |
| | | | | | | | | | | | | | |
Principal
Amount | | | Interest
Rate | | | Maturity
Date | | | Value | |
| | Mortgage-Backed Obligations – (continued) | |
| | FHLMC – (continued) | |
| $ | 13,297 | | | | 5.000 | % | | | 02/01/34 | | | $ | 14,702 | |
| | 4,963 | | | | 5.000 | | | | 03/01/34 | | | | 5,490 | |
| | 9,806 | | | | 5.000 | | | | 04/01/34 | | | | 10,846 | |
| | 15,448 | | | | 5.000 | | | | 05/01/34 | | | | 17,077 | |
| | 180,403 | | | | 5.000 | | | | 06/01/34 | | | | 199,481 | |
| | 2,713 | | | | 5.000 | | | | 11/01/34 | | | | 3,000 | |
| | 58,168 | | | | 5.000 | | | | 04/01/35 | | | | 64,302 | |
| | 10,329 | | | | 5.000 | | | | 11/01/35 | | | | 11,418 | |
| | 8,692 | | | | 5.000 | | | | 02/01/37 | | | | 9,596 | |
| | 1,578 | | | | 5.000 | | | | 11/01/37 | | | | 1,737 | |
| | 568,743 | | | | 7.000 | | | | 02/01/39 | | | | 647,167 | |
| | 75,848 | | | | 5.000 | | | | 01/01/40 | | | | 84,141 | |
| | | | | | | | | | | | | | |
| | | | | | | | | | | | | 3,030,871 | |
| | |
| | FNMA – 9.5% | |
| | 1,673 | | | | 5.000 | | | | 04/01/18 | | | | 1,774 | |
| | 20,329 | | | | 5.000 | | | | 05/01/18 | | | | 21,480 | |
| | 2,678 | | | | 5.000 | | | | 06/01/18 | | | | 2,836 | |
| | 2,302 | | | | 5.000 | | | | 11/01/18 | | | | 2,442 | |
| | 2,506 | | | | 5.000 | | | | 03/01/19 | | | | 2,667 | |
| | 3,341 | | | | 5.000 | | | | 04/01/19 | | | | 3,567 | |
| | 4,000,000 | | | | 4.506 | | | | 06/01/19 | | | | 4,324,930 | |
| | 1,603,743 | | | | 3.416 | | | | 10/01/20 | | | | 1,691,586 | |
| | 1,164,084 | | | | 3.612 | | | | 12/01/20 | | | | 1,240,091 | |
| | 747,714 | | | | 3.763 | | | | 12/01/20 | | | | 800,301 | |
| | 2,049,582 | | | | 4.375 | | | | 06/01/21 | | | | 2,261,249 | |
| | 399,138 | | | | 3.830 | | | | 07/01/21 | | | | 428,764 | |
| | 250,496 | | | | 5.000 | | | | 05/01/26 | | | | 276,284 | |
| | 162,861 | | | | 6.000 | | | | 09/01/27 | | | | 184,493 | |
| | 5,161 | | | | 5.000 | | | | 08/01/33 | | | | 5,723 | |
| | 4,516 | | | | 5.500 | | | | 02/01/34 | | | | 5,067 | |
| | 5,891 | | | | 5.500 | | | | 05/01/34 | | | | 6,611 | |
| | 4,330 | | | | 5.500 | | | | 10/01/34 | | | | 4,855 | |
| | 24,889 | | | | 5.500 | | | | 12/01/34 | | | | 27,908 | |
| | 6,002 | | | | 5.500 | | | | 04/01/35 | | | | 6,728 | |
| | 5,667 | | | | 5.500 | | | | 07/01/35 | | | | 6,352 | |
| | 2,720,277 | | | | 6.000 | | | | 12/01/36 | | | | 3,070,919 | |
| | 894,326 | | | | 6.000 | | | | 07/01/37 | | | | 1,009,343 | |
| | 45,821 | | | | 6.000 | | | | 09/01/37 | | | | 51,714 | |
| | 1,120,601 | | | | 6.000 | | | | 03/01/38 | | | | 1,264,735 | |
| | 1,703,388 | | | | 6.000 | | | | 09/01/38 | | | | 1,922,593 | |
| | 842,051 | | | | 6.000 | | | | 10/01/38 | | | | 950,364 | |
| | 74,003 | | | | 6.000 | | | | 11/01/38 | | | | 83,520 | |
| | 515,483 | | | | 6.000 | | | | 12/01/38 | | | | 581,819 | |
| | 352,331 | | | | 7.000 | | | | 03/01/39 | | | | 399,392 | |
| | 54,543 | | | | 4.500 | | | | 05/01/39 | | | | 59,432 | |
| | 32,972 | | | | 4.500 | | | | 06/01/39 | | | | 35,928 | |
| | 27,632 | | | | 4.500 | | | | 08/01/39 | | | | 30,109 | |
| | 169,730 | | | | 6.000 | | | | 09/01/39 | | | | 191,560 | |
| | 56,465 | | | | 6.000 | | | | 10/01/39 | | | | 63,744 | |
| | 315,654 | | | | 5.000 | | | | 06/01/40 | | | | 348,767 | |
| | 2,015,626 | | | | 6.000 | | | | 07/01/40 | | | | 2,274,850 | |
| | 256,706 | | | | 6.000 | | | | 10/01/40 | | | | 289,720 | |
| | 61,216 | | | | 6.000 | | | | 05/01/41 | | | | 69,089 | |
| | 490,307 | | | | 5.000 | | | | 06/01/41 | | | | 541,788 | |
| | 83,130 | | | | 4.500 | | | | 07/01/41 | | | | 89,785 | |
| | |
| | |
| 66 | | The accompanying notes are an integral part of these financial statements. |
GOLDMAN SACHS GLOBAL INCOME FUND
| | | | | | | | | | | | | | |
Principal
Amount | | | Interest
Rate | | | Maturity
Date | | | Value | |
| | Mortgage-Backed Obligations – (continued) | |
| | FNMA – (continued) | |
| $ | 162,014 | | | | 5.000 | % | | | 07/01/41 | | | $ | 179,025 | |
| | 154,608 | | | | 4.500 | | | | 08/01/41 | | | | 167,139 | |
| | 39,972 | | | | 4.500 | | | | 10/01/41 | | | | 43,193 | |
| | 860,934 | | | | 3.000 | | | | 08/01/42 | | | | 855,552 | |
| | 757,431 | | | | 3.000 | | | | 09/01/42 | | | | 752,732 | |
| | 105,536 | | | | 3.000 | | | | 10/01/42 | | | | 104,888 | |
| | 467,517 | | | | 3.000 | | | | 11/01/42 | | | | 464,521 | |
| | 4,662,938 | | | | 3.000 | | | | 12/01/42 | | | | 4,631,268 | |
| | 3,216,292 | | | | 3.000 | | | | 01/01/43 | | | | 3,195,070 | |
| | 943,192 | | | | 3.000 | | | | 02/01/43 | | | | 936,233 | |
| | 232,553 | | | | 3.000 | | | | 03/01/43 | | | | 230,981 | |
| | 670,189 | | | | 3.000 | | | | 04/01/43 | | | | 665,332 | |
| | 1,000,000 | | | | 3.500 | | | | TBA-30yr | (f) | | | 1,021,953 | |
| | 4,000,000 | | | | 4.500 | | | | TBA-30yr | (f) | | | 4,305,000 | |
| | 1,000,000 | | | | 6.000 | | | | TBA-30yr | (f) | | | 1,130,313 | |
| | | | | | | | | | | | | | |
| | | | | | | | | | | | | 43,318,079 | |
| | |
| | GNMA – 0.1% | |
| | 642,801 | | | | 3.950 | | | | 07/15/25 | | | | 670,129 | |
| | |
| | TOTAL FEDERAL AGENCIES | | | $ | 47,019,079 | |
| | |
| | TOTAL MORTGAGE-BACKED OBLIGATIONS | |
| | (Cost $86,776,264) | | | | | | | $ | 86,932,965 | |
| | |
| | | | | | | | | | | | | | |
| | Agency Debentures – 0.7% | |
| FFCB | |
| $ | 700,000 | | | | 3.500 | % | | | 12/20/23 | | | $ | 738,477 | |
| FHLMC | |
| | 1,800,000 | | | | 6.750 | | | | 03/15/31 | | | | 2,595,581 | |
| | |
| | TOTAL AGENCY DEBENTURES | |
| | (Cost $3,112,356) | | | $ | 3,334,058 | |
| | |
| | | | | | | | | | | | | | |
| | Government Guarantee Obligations(e) – 2.4% | |
| Achmea Hypotheekbank NV(a) | |
| $ | 387,000 | | | | 3.200 | % | | | 11/03/14 | | | $ | 387,952 | |
| Banca Monte dei Paschi di Siena SpA | |
| EUR | 3,500,000 | | | | 3.500 | | | | 03/20/17 | | | | 4,681,496 | |
| Dexia Credit Local SA | |
| GBP | 1,800,000 | | | | 1.875 | | | | 07/17/17 | | | | 2,938,176 | |
| Kreditanstalt fuer Wiederaufbau | |
| AUD | 3,000,000 | | | | 6.000 | | | | 08/20/20 | | | | 2,944,008 | |
| | |
| | TOTAL GOVERNMENT GUARANTEE OBLIGATIONS | |
| | (Cost $11,054,369) | | | $ | 10,951,632 | |
| | |
| | | | | | | | | | | | | | |
| | U.S. Treasury Obligations – 4.3% | |
| United States Treasury Inflation Protected Securities | |
| $ | 2,036,692 | | | | 1.125 | % | | | 01/15/21 | | | $ | 2,137,895 | |
| | 2,006,609 | | | | 0.375 | (g) | | | 07/15/23 | | | | 1,986,864 | |
| | 5,289,298 | | | | 0.625 | | | | 01/15/24 | | | | 5,319,024 | |
| | 1,328,977 | | | | 1.375 | | | | 02/15/44 | | | | 1,422,630 | |
| | |
| | | | | | | | | | | | | | |
Principal
Amount | | | Interest
Rate | | | Maturity
Date | | | Value | |
| | U.S. Treasury Obligations – (continued) | |
| United States Treasury Notes | |
| $ | 30,000 | | | | 1.500 | % | | | 06/30/16 | | | $ | 30,531 | |
| | 7,750,000 | | | | 1.625 | (g) | | | 04/30/19 | | | | 7,720,860 | |
| | 800,000 | | | | 2.500 | | | | 05/15/24 | | | | 800,488 | |
| | 400,000 | | | | 2.375 | | | | 08/15/24 | | | | 395,344 | |
| | |
| | TOTAL U.S. TREASURY OBLIGATIONS | |
| | (Cost $19,791,867) | | | $ | 19,813,636 | |
| | |
| | | | | | | | | | | | | | |
Notional Amount | | | Exercise
Rate | | | Expiration
Date | | | Value | |
| | Options Purchased – 0.6% | | | | | |
| | Currency Options | |
| Bank of America Securities LLC | |
| | Put CNH 25,383,380 | | | | | | | | | | | | | |
| | Call USD 4,113,000 | | | | 6.172 | % | | | 02/18/15 | | | $ | 59,071 | |
| | Put USD 4,113,000 | | | | | | | | | | | | | |
| | Call CNH 25,383,380 | | | | 6.172 | | | | 02/18/15 | | | | 12,088 | |
| | Put CHN 33,911,946 | | | | | | | | | | | | | |
| | Call USD 5,408,000 | | | | 6.271 | | | | 04/14/15 | | | | 51,279 | |
| | Put USD5,408,000 | | | | | | | | | | | | | |
| | Call CHN33,911,946 | | | | 6.271 | | | | 04/14/15 | | | | 55,994 | |
| | Interest Rate Swaptions | |
| Deutsche Bank AG Put - OTC - 5 year Interest Rate Swap Strike
Price 2.550% |
|
| $ | 6,000,000 | | | | 2.550 | | | | 09/28/15 | | | | 97,402 | |
| Deutsche Bank AG Call - OTC - 5 year Interest Rate Swap Strike
Price 2.550% |
|
| | 6,000,000 | | | | 2.550 | | | | 09/28/15 | | | | 91,705 | |
| Deutsche Bank AG Put - OTC - 5 year Interest Rate Swap Strike
Price 2.940% |
|
| | 3,300,000 | | | | 2.940 | | | | 09/29/16 | | | | 75,284 | |
| Deutsche Bank AG Call - OTC - 5 year Interest Rate Swap Strike
Price 2.940% |
|
| | 3,300,000 | | | | 2.940 | | | | 09/29/16 | | | | 78,923 | |
| Deutsche Bank AG Call OTC - 10 year Interest Rate Swap Strike
Price 3.780% |
|
| | 2,200,000 | | | | 3.780 | | | | 09/26/16 | | | | 52,371 | |
| Deutsche Bank AG Put - OTC - 10 year Interest Rate Swap Strike
Price 4.113% |
|
| | 3,300,000 | | | | 4.113 | | | | 04/16/19 | | | | 274,315 | |
| Deutsche Bank AG Call - OTC - 10 year Interest Rate Swap
Strike Price 4.113% |
|
| | 3,300,000 | | | | 4.113 | | | | 04/16/19 | | | | 130,476 | |
| Deutsche Bank AG Put - OTC - 10 year Interest Rate Swap Strike
Price 4.135% |
|
| | 3,000,000 | | | | 4.135 | | | | 04/17/19 | | | | 252,702 | |
| Deutsche Bank AG Call - OTC - 10 year Interest Rate Swap
Strike Price 4.135% |
|
| | 3,000,000 | | | | 4.135 | | | | 04/17/19 | | | | 116,916 | |
| Royal Bank of Canada Call - OTC - 2 year Interest Rate Swap
Strike Price 1.916% |
|
| | 68,000,000 | | | | 1.916 | | | | 10/23/15 | | | | 398,011 | |
| | |
| | |
| The accompanying notes are an integral part of these financial statements. | | 67 |
GOLDMAN SACHS GLOBAL INCOME FUND
Schedule of Investments (continued)
September 30, 2014 (Unaudited)
| | | | | | | | | | | | | | |
Notional Amount | | | Exercise
Rate | | | Expiration
Date | | | Value | |
| | Options Purchased – (continued) | | | | | |
| | Interest Rate Swaptions – (continued) | |
| Royal Bank of Canada Call - OTC - 10 year Interest Rate Swap
Strike Price 3.623% |
|
| $ | 31,000,000 | | | | 3.623 | % | | | 02/22/16 | | | $ | 537,983 | |
| JPMorgan Securities, Inc. Call - OTC - 5 year Interest Rate Swap
Strike Price 2.783% |
|
| | 6,400,000 | | | | 2.783 | | | | 09/30/15 | | | | 71,200 | |
| JPMorgan Securities, Inc. Put - OTC - 5 year Interest Rate Swap
Strike Price 2.973% |
|
| | 4,800,000 | | | | 2.973 | | | | 09/26/16 | | | | 113,531 | |
| JPMorgan Securities, Inc. Call - OTC - 5 year Interest Rate Swap
Strike Price 2.973% |
|
| | 4,800,000 | | | | 2.973 | | | | 09/26/16 | | | | 110,546 | |
| | |
| | TOTAL OPTIONS PURCHASED | |
| | (Cost $3,214,331) | | | | | | | $ | 2,579,797 | |
| | |
| TOTAL INVESTMENTS BEFORE SHORT-TERM
INVESTMENT |
|
| | (Cost $454,444,854) | | | $ | 455,700,818 | |
| | |
| | | | | | | | | | | | | | |
Principal
Amount | | | Interest
Rate | | | Maturity
Date | | | Value | |
| | Short-term Investment(h) – 0.9% | |
| | Repurchase Agreement – 0.9% | |
| Joint Repurchase Agreement Account II | |
| $ | 3,900,000 | | | | 0.012 | % | | | 10/01/14 | | | $ | 3,900,000 | |
| | (Cost $3,900,000) | | | | | |
| | |
| | TOTAL INVESTMENTS – 100.6% | | | | | |
| | (Cost $458,344,854) | | | $ | 459,600,818 | |
| | |
| LIABILITIES IN EXCESS OF
OTHER ASSETS – (0.6)% |
| | | (2,588,262 | ) |
| | |
| | NET ASSETS – 100.0% | | | $ | 457,012,556 | |
| | |
| | |
| The percentage shown for each investment category reflects the value of investments in that category as a percentage of net assets. |
(a) | | Exempt from registration under Rule 144A of the Securities Act of 1933. Under procedures approved by the Board of Trustees, such securities have been determined to be liquid by the investment adviser and may be resold, normally to qualified institutional buyers in transactions exempt from registration. Total market value of Rule 144A securities amounts to $77,785,977, which represents approximately 17.0% of net assets as of September 30, 2014. |
(b) | | Issued with a zero coupon. Income is recognized through the accretion of discount. |
(c) | | Variable rate security. Interest rate or distribution rate disclosed is that which is in effect at September 30, 2014. |
(d) | | Security with “Call” features with resetting interest rates. Maturity dates disclosed are the final maturity dates. |
(e) | | Guaranteed by a foreign government until maturity. |
| | |
(f) | | TBA (To Be Announced) Securities are purchased on a forward commitment basis with an approximate principal amount and no defined maturity date. The actual principal and maturity date will be determined upon settlement when the specific mortgage pools are assigned. Total market value of TBA securities (excluding forward sales contracts, if any) amounts to $6,457,266, which represents approximately 1.4% of net assets as of September 30, 2014. |
(g) | | All or a portion of security is segregated as collateral for initial margin requirement on futures transactions. |
(h) | | Joint repurchase agreement was entered into on September 30, 2014. Additional information appears on page 118. |
| | |
|
Currency Abbreviations: |
AUD | | —Australian Dollar |
BRL | | —Brazilian Real |
CAD | | —Canadian Dollar |
CHF | | —Swiss Franc |
CNH | | —Chinese Yuan Renminbi Offshore |
CZK | | —Czech Koruna |
EUR | | —Euro |
GBP | | —British Pound |
HUF | | —Hungarian Forint |
IDR | | —Indonesian Rupiah |
ILS | | —Israeli Shekel |
INR | | —Indian Rupee |
JPY | | —Japanese Yen |
KRW | | —South Korean Won |
MXN | | —Mexican Peso |
MYR | | —Malaysian Ringgit |
NOK | | —Norwegian Krone |
NZD | | —New Zealand Dollar |
PHP | | —Philippine Peso |
PLN | | —Polish Zloty |
RUB | | —Russian Ruble |
SEK | | —Swedish Krona |
SGD | | —Singapore Dollar |
TRY | | —Turkish Lira |
TWD | | —Taiwan Dollar |
USD | | —U.S. Dollar |
ZAR | | —South African Rand |
| | |
Investment Abbreviations: |
ACES | | —Alternative Credit Enhancement Securities |
AUDOR | | —Australian Dollar Offered Rate |
CDOR | | —Canadian Dollar Offered Rate |
CHFOR | | —Swiss Franc Offered Rate |
CLO | | —Collateralized Loan Obligation |
EURO | | —Euro Offered Rate |
FFCB | | —Federal Farm Credit Bank |
FHLMC | | —Federal Home Loan Mortgage Corp. |
FNMA | | —Federal National Mortgage Association |
GNMA | | —Government National Mortgage Association |
JYOR | | —Japanese Yen Offered Rate |
LIBOR | | —London Interbank Offered Rate |
NCUA | | —National Credit Union Administration |
NIBOR | | —Norwegian Interbank Offered Rate |
NZDOR | | —New Zealand Dollar Offered Rate |
OTC | | —Over the Counter |
REMIC | | —Real Estate Mortgage Investment Conduit |
STIBOR | | —Stockholm Interbank Offered Rate |
|
| | |
| 68 | | The accompanying notes are an integral part of these financial statements. |
GOLDMAN SACHS GLOBAL INCOME FUND
|
| ADDITIONAL INVESTMENT INFORMATION |
FORWARD FOREIGN CURRENCY EXCHANGE CONTRACTS — At September 30, 2014, the Fund had the following forward foreign currency exchange contracts:
FORWARD FOREIGN CURRENCY EXCHANGE CONTRACTS WITH UNREALIZED GAIN
| | | | | | | | | | | | | | |
| Counterparty | | Contracts to
Buy/Sell | | Settlement
Date | | | Current
Value | | | Unrealized
Gain | |
Bank of America Securities LLC | | GBP/EUR | | | 12/17/14 | | | $ | 609,133 | | | $ | 16,486 | |
| | NOK/EUR | | | 12/17/14 | | | | 609,133 | | | | 12,427 | |
| | USD/AUD | | | 11/13/14 | | | | 2,977,994 | | | | 9,673 | |
| | USD/AUD | | | 12/17/14 | | | | 120,012 | | | | 4,217 | |
| | USD/CAD | | | 12/17/14 | | | | 134,333 | | | | 2,880 | |
| | USD/CHF | | | 12/17/14 | | | | 303,622 | | | | 7,151 | |
| | USD/EUR | | | 12/17/14 | | | | 12,055,011 | | | | 396,360 | |
| | USD/GBP | | | 12/17/14 | | | | 123,619 | | | | 610 | |
| | USD/JPY | | | 12/17/14 | | | | 1,218,157 | | | | 27,843 | |
| | USD/MXN | | | 10/31/14 | | | | 6,695,687 | | | | 123,614 | |
| | USD/MYR | | | 10/03/14 | | | | 495,025 | | | | 6,575 | |
| | USD/NZD | | | 12/17/14 | | | | 329,859 | | | | 17,271 | |
| | USD/SEK | | | 12/17/14 | | | | 244,321 | | | | 4,110 | |
Barclays Bank PLC | | CAD/CHF | | | 12/17/14 | | | | 647,075 | | | | 400 | |
| | CNH/USD | | | 04/16/15 | | | | 916,834 | | | | 10,834 | |
| | GBP/USD | | | 12/17/14 | | | | 1,876,001 | | | | 8,606 | |
| | USD/AUD | | | 12/17/14 | | | | 1,847,436 | | | | 75,882 | |
| | USD/ILS | | | 12/17/14 | | | | 652,037 | | | | 45,219 | |
| | USD/INR | | | 10/07/14 | | | | 1,225,633 | | | | 19,367 | |
| | USD/INR | | | 10/27/14 | | | | 522,650 | | | | 8,350 | |
| | USD/KRW | | | 10/27/14 | | | | 924,830 | | | | 8,920 | |
| | USD/NOK | | | 12/17/14 | | | | 297,030 | | | | 2,561 | |
| | USD/NZD | | | 12/17/14 | | | | 594,814 | | | | 23,841 | |
| | USD/SEK | | | 12/17/14 | | | | 875,288 | | | | 13,822 | |
BNP Paribas SA | | EUR/PLN | | | 12/17/14 | | | | 617,953 | | | | 1,290 | |
| | EUR/USD | | | 12/17/14 | | | | 1,249,859 | | | | 170 | |
| | GBP/EUR | | | 12/17/14 | | | | 849,247 | | | | 19,817 | |
| | USD/AUD | | | 12/17/14 | | | | 2,416,097 | | | | 64,747 | |
| | USD/BRL | | | 10/22/14 | | | | 608,231 | | | | 17,769 | |
| | USD/CHF | | | 12/17/14 | | | | 158,633 | | | | 2,775 | |
| | USD/GBP | | | 12/17/14 | | | | 1,381,889 | | | | 5,566 | |
| | USD/MYR | | | 10/20/14 | | | | 614,108 | | | | 9,892 | |
| | USD/PLN | | | 11/10/14 | | | | 397,050 | | | | 7,079 | |
| | USD/RUB | | | 10/27/14 | | | | 1,224,168 | | | | 20,832 | |
| | USD/TRY | | | 12/17/14 | | | | 556,253 | | | | 27,142 | |
Citibank NA (London) | | CHF/EUR | | | 12/17/14 | | | | 609,133 | | | | 1,824 | |
| | GBP/EUR | | | 12/17/14 | | | | 1,224,584 | | | | 6,653 | |
| | NOK/EUR | | | 12/17/14 | | | | 1,836,244 | | | | 24,973 | |
| | PHP/USD | | | 10/20/14 | | | | 312,064 | | | | 64 | |
| | USD/CAD | | | 12/17/14 | | | | 921,386 | | | | 13,114 | |
| | USD/CHF | | | 12/17/14 | | | | 2,042,812 | | | | 41,192 | |
| | USD/INR | | | 10/14/14 | | | | 1,225,526 | | | | 21,474 | |
| | USD/NZD | | | 12/17/14 | | | | 468,639 | | | | 28,175 | |
| | USD/PHP | | | 10/14/14 | | | | 304,790 | | | | 7,210 | |
| | USD/SGD | | | 12/17/14 | | | | 983,171 | | | | 16,467 | |
| | USD/TRY | | | 12/17/14 | | | | 602,893 | | | | 20,107 | |
| | USD/TWD | | | 10/17/14 | | | | 1,234,006 | | | | 12,994 | |
| | USD/TWD | | | 10/20/14 | | | | 1,236,033 | | | | 10,967 | |
| | |
| The accompanying notes are an integral part of these financial statements. | | 69 |
GOLDMAN SACHS GLOBAL INCOME FUND
Schedule of Investments (continued)
September 30, 2014 (Unaudited)
|
| ADDITIONAL INVESTMENT INFORMATION (continued) |
FORWARD FOREIGN CURRENCY EXCHANGE CONTRACTS WITH UNREALIZED GAIN (continued)
| | | | | | | | | | | | | | |
| Counterparty | | Contracts to
Buy/Sell | | Settlement
Date | | | Current
Value | | | Unrealized
Gain | |
Credit Suisse International (London) | | USD/CAD | | | 11/06/14 | | | $ | 14,066,097 | | | $ | 262,757 | |
| | USD/CHF | | | 12/17/14 | | | | 2,496,872 | | | | 53,210 | |
| | USD/RUB | | | 10/02/14 | | | | 591,872 | | | | 31,128 | |
Deutsche Bank AG (London) | | CNH/USD | | | 04/16/15 | | | | 1,371,608 | | | | 12,608 | |
| | RUB/USD | | | 11/17/14 | | | | 149,096 | | | | 260 | |
| | USD/CNH | | | 12/17/14 | | | | 2,498,049 | | | | 9,951 | |
| | USD/CNH | | | 04/16/15 | | | | 633,480 | | | | 3,042 | |
| | USD/CZK | | | 11/10/14 | | | | 508,378 | | | | 7,984 | |
| | USD/EUR | | | 12/17/14 | | | | 607,869 | | | | 15,161 | |
| | USD/GBP | | | 10/22/14 | | | | 19,830,745 | | | | 299,780 | |
| | USD/INR | | | 10/07/14 | | | | 512,486 | | | | 2,444 | |
| | USD/KRW | | | 10/14/14 | | | | 1,221,384 | | | | 25,616 | |
| | USD/MXN | | | 12/17/14 | | | | 1,234,458 | | | | 16,542 | |
| | USD/MYR | | | 10/07/14 | | | | 1,391,110 | | | | 39,890 | |
| | USD/NZD | | | 12/17/14 | | | | 2,422,627 | | | | 48,681 | |
| | USD/PHP | | | 10/14/14 | | | | 304,850 | | | | 7,150 | |
| | USD/PHP | | | 10/20/14 | | | | 615,333 | | | | 8,667 | |
| | USD/RUB | | | 10/02/14 | | | | 150,375 | | | | 11 | |
| | USD/RUB | | | 11/17/14 | | | | 537,324 | | | | 38,257 | |
| | USD/SEK | | | 12/17/14 | | | | 734,208 | | | | 13,926 | |
| | USD/TWD | | | 10/20/14 | | | | 75,038 | | | | 526 | |
HSBC Bank PLC | | GBP/USD | | | 12/17/14 | | | | 628,574 | | | | 5,376 | |
| | SEK/EUR | | | 12/17/14 | | | | 1,252,387 | | | | 457 | |
| | TWD/USD | | | 10/20/14 | | | | 622,389 | | | | 389 | |
| | USD/BRL | | | 10/27/14 | | | | 414,313 | | | | 6,515 | |
| | USD/CNH | | | 12/17/14 | | | | 2,486,365 | | | | 2,635 | |
| | USD/GBP | | | 12/17/14 | | | | 1,654,108 | | | | 38,317 | |
| | USD/JPY | | | 12/17/14 | | | | 610,623 | | | | 13,377 | |
| | USD/KRW | | | 10/22/14 | | | | 184,646 | | | | 2,340 | |
| | USD/KRW | | | 10/23/14 | | | | 432,397 | | | | 5,603 | |
| | USD/NOK | | | 12/17/14 | | | | 439,882 | | | | 5,819 | |
| | USD/NZD | | | 12/17/14 | | | | 468,639 | | | | 29,950 | |
| | USD/SGD | | | 12/17/14 | | | | 1,416,627 | | | | 26,619 | |
| | USD/TRY | | | 12/17/14 | | | | 592,556 | | | | 29,898 | |
JPMorgan Chase Bank (London) | | MXN/USD | | | 12/17/14 | | | | 624,056 | | | | 2,056 | |
| | SEK/EUR | | | 12/17/14 | | | | 2,311,418 | | | | 8,419 | |
| | USD/EUR | | | 10/30/14 | | | | 122,571,639 | | | | 3,161,001 | |
| | USD/EUR | | | 12/17/14 | | | | 617,979 | | | | 5,168 | |
| | USD/IDR | | | 10/31/14 | | | | 415,416 | | | | 8,377 | |
| | USD/INR | | | 10/29/14 | | | | 921,848 | | | | 11,152 | |
| | USD/JPY | | | 12/17/14 | | | | 2,727,481 | | | | 122,916 | |
| | USD/MXN | | | 12/17/14 | | | | 3,187,224 | | | | 55,576 | |
| | USD/RUB | | | 10/20/14 | | | | 304,601 | | | | 8,399 | |
| | USD/RUB | | | 11/17/14 | | | | 526,140 | | | | 33,632 | |
| | USD/TRY | | | 12/17/14 | | | | 1,197,635 | | | | 48,365 | |
Morgan Stanley & Co. International PLC | | TWD/USD | | | 10/17/14 | | | | 1,248,663 | | | | 663 | |
| | USD/AUD | | | 12/17/14 | | | | 852,147 | | | | 29,298 | |
| | USD/ILS | | | 12/17/14 | | | | 1,058,889 | | | | 64,956 | |
| | USD/TRY | | | 12/17/14 | | | | 563,591 | | | | 28,116 | |
Royal Bank of Canada | | USD/AUD | | | 12/17/14 | | | | 1,232,862 | | | | 4,552 | |
| | USD/CAD | | | 12/17/14 | | | | 3,235,160 | | | | 26,892 | |
| | USD/EUR | | | 10/30/14 | | | | 437,109 | | | | 10,020 | |
| | |
| 70 | | The accompanying notes are an integral part of these financial statements. |
GOLDMAN SACHS GLOBAL INCOME FUND
|
| ADDITIONAL INVESTMENT INFORMATION (continued) |
FORWARD FOREIGN CURRENCY EXCHANGE CONTRACTS WITH UNREALIZED GAIN (continued)
| | | | | | | | | | | | | | |
| Counterparty | | Contracts to
Buy/Sell | | Settlement
Date | | | Current
Value | | | Unrealized
Gain | |
Royal Bank of Canada (continued) | | USD/EUR | | | 12/17/14 | | | $ | 145,223 | | | $ | 3,615 | |
| | USD/GBP | | | 10/22/14 | | | | 1,183,579 | | | | 13,416 | |
| | USD/JPY | | | 12/17/14 | | | | 620,769 | | | | 4,731 | |
| | USD/ZAR | | | 10/31/14 | | | | 2,355,151 | | | | 73,102 | |
Royal Bank of Scotland PLC | | USD/EUR | | | 12/17/14 | | | | 608,501 | | | | 15,444 | |
| | USD/GBP | | | 12/17/14 | | | | 1,380,270 | | | | 6,692 | |
| | USD/JPY | | | 12/17/14 | | | | 598,399 | | | | 2,606 | |
| | USD/TRY | | | 12/17/14 | | | | 1,223,074 | | | | 27,926 | |
Standard Chartered Bank | | USD/AUD | | | 12/17/14 | | | | 2,273,750 | | | | 92,564 | |
| | USD/CNH | | | 12/17/14 | | | | 2,486,902 | | | | 8,098 | |
| | USD/EUR | | | 12/17/14 | | | | 607,869 | | | | 16,633 | |
| | USD/KRW | | | 10/31/14 | | | | 3,992,026 | | | | 119,306 | |
| | USD/TRY | | | 12/17/14 | | | | 542,245 | | | | 27,824 | |
State Street Bank and Trust | | AUD/USD | | | 12/17/14 | | | | 1,247,664 | | | | 5,941 | |
| | EUR/NOK | | | 12/17/14 | | | | 185,362 | | | | 72 | |
| | EUR/USD | | | 10/30/14 | | | | 474,107 | | | | 1,941 | |
| | GBP/JPY | | | 12/17/14 | | | | 172,863 | | | | 574 | |
| | USD/CHF | | | 12/17/14 | | | | 2,300,665 | | | | 49,977 | |
| | USD/EUR | | | 10/30/14 | | | | 30,892,368 | | | | 220,925 | |
| | USD/EUR | | | 12/17/14 | | | | 315,100 | | | | 7,453 | |
| | USD/GBP | | | 10/22/14 | | | | 474,900 | | | | 2,839 | |
| | USD/GBP | | | 12/17/14 | | | | 581,301 | | | | 1,548 | |
| | USD/JPY | | | 12/17/14 | | | | 2,069,272 | | | | 43,728 | |
| | USD/NZD | | | 12/17/14 | | | | 411,402 | | | | 25,971 | |
| | USD/SEK | | | 12/17/14 | | | | 677,999 | | | | 10,207 | |
UBS AG (London) | | CAD/CHF | | | 12/17/14 | | | | 132,271 | | | | 599 | |
| | NZD/USD | | | 12/17/14 | | | | 1,239,195 | | | | 3,784 | |
| | USD/BRL | | | 10/14/14 | | | | 1,230,829 | | | | 13,171 | |
| | USD/CAD | | | 12/17/14 | | | | 279,107 | | | | 5,988 | |
| | USD/EUR | | | 12/17/14 | | | | 1,525,580 | | | | 27,015 | |
| | USD/GBP | | | 10/22/14 | | | | 755,372 | | | | 931 | |
| | USD/GBP | | | 12/17/14 | | | | 297,056 | | | | 490 | |
| | USD/HUF | | | 12/17/14 | | | | 902,408 | | | | 22,518 | |
| | USD/JPY | | | 11/07/14 | | | | 47,805,191 | | | | 178,776 | |
| | USD/JPY | | | 12/17/14 | | | | 344,514 | | | | 14,476 | |
Westpac Banking Corp. | | AUD/JPY | | | 12/17/14 | | | | 269,540 | | | | 870 | |
| | AUD/USD | | | 12/17/14 | | | | 1,860,612 | | | | 4,722 | |
| | EUR/CAD | | | 12/17/14 | | | | 347,217 | | | | 924 | |
| | GBP/USD | | | 12/17/14 | | | | 648,229 | | | | 3,843 | |
| | USD/AUD | | | 12/17/14 | | | | 4,143,185 | | | | 181,465 | |
| | USD/CAD | | | 12/17/14 | | | | 216,390 | | | | 5,748 | |
| | USD/EUR | | | 10/30/14 | | | | 800,264 | | | | 18,382 | |
| | USD/EUR | | | 12/17/14 | | | | 1,829,925 | | | | 43,341 | |
| | USD/GBP | | | 12/17/14 | | | | 216,621 | | | | 5,536 | |
| | USD/JPY | | | 12/17/14 | | | | 272,817 | | | | 11,666 | |
| | USD/MYR | | | 10/20/14 | | | | 589,517 | | | | 11,516 | |
| | USD/NZD | | | 12/17/14 | | | | 1,250,038 | | | | 76,235 | |
| | | USD/SGD | | | 12/17/14 | | | | 1,236,384 | | | | 23,329 | |
| TOTAL | | | | | | | | | | | | $ | 7,362,214 | |
| | |
| The accompanying notes are an integral part of these financial statements. | | 71 |
GOLDMAN SACHS GLOBAL INCOME FUND
Schedule of Investments (continued)
September 30, 2014 (Unaudited)
|
| ADDITIONAL INVESTMENT INFORMATION (continued) |
FORWARD FOREIGN CURRENCY EXCHANGE CONTRACTS WITH UNREALIZED LOSS
| | | | | | | | | | | | | | |
| Counterparty | | Contracts to
Buy/Sell | | Settlement
Date | | | Current
Value | | | Unrealized
Loss | |
Bank of America Securities LLC | | EUR/GBP | | | 12/17/14 | | | $ | 1,216,447 | | | $ | (18,402 | ) |
| | EUR/USD | | | 12/17/14 | | | | 3,074,729 | | | | (49,778 | ) |
| | HUF/USD | | | 12/17/14 | | | | 615,323 | | | | (11,677 | ) |
Barclays Bank PLC | | EUR/PLN | | | 12/17/14 | | | | 1,230,610 | | | | (8,554 | ) |
| | EUR/USD | | | 12/17/14 | | | | 610,396 | | | | (14,210 | ) |
| | ILS/USD | | | 12/17/14 | | | | 310,601 | | | | (9,414 | ) |
| | INR/USD | | | 10/07/14 | | | | 2,040,407 | | | | (14,476 | ) |
| | INR/USD | | | 10/27/14 | | | | 930,733 | | | | (16,855 | ) |
| | JPY/SEK | | | 12/17/14 | | | | 121,734 | | | | (2,397 | ) |
| | JPY/USD | | | 12/17/14 | | | | 1,402,807 | | | | (34,966 | ) |
| | MYR/USD | | | 10/07/14 | | | | 972,471 | | | | (27,973 | ) |
| | MYR/USD | | | 10/20/14 | | | | 497,260 | | | | (740 | ) |
| | MYR/USD | | | 10/29/14 | | | | 308,851 | | | | (2,149 | ) |
| | NOK/USD | | | 12/17/14 | | | | 173,176 | | | | (675 | ) |
| | NZD/USD | | | 12/17/14 | | | | 582,422 | | | | (34,534 | ) |
| | PLN/USD | | | 12/17/14 | | | | 701,887 | | | | (23,064 | ) |
| | TWD/USD | | | 10/27/14 | | | | 622,847 | | | | (4,153 | ) |
| | USD/CNH | | | 04/16/15 | | | | 924,590 | | | | (1,019 | ) |
BNP Paribas SA | | AUD/USD | | | 12/17/14 | | | | 1,379,413 | | | | (49,607 | ) |
| | CAD/USD | | | 12/17/14 | | | | 328,457 | | | | (6,458 | ) |
| | ILS/USD | | | 12/17/14 | | | | 924,056 | | | | (11,944 | ) |
| | INR/USD | | | 10/14/14 | | | | 303,491 | | | | (4,130 | ) |
| | JPY/USD | | | 12/17/14 | | | | 2,435,881 | | | | (58,119 | ) |
| | PLN/USD | | | 12/17/14 | | | | 707,587 | | | | (16,322 | ) |
Citibank NA (London) | | AUD/USD | | | 12/17/14 | | | | 1,830,139 | | | | (36,959 | ) |
| | EUR/CHF | | | 12/17/14 | | | | 1,210,142 | | | | (723 | ) |
| | EUR/GBP | | | 12/17/14 | | | | 620,548 | | | | (7,624 | ) |
| | IDR/USD | | | 10/31/14 | | | | 415,416 | | | | (16,353 | ) |
| | ILS/USD | | | 12/17/14 | | | | 546,250 | | | | (13,750 | ) |
| | MXN/USD | | | 12/17/14 | | | | 1,195,837 | | | | (16,146 | ) |
| | MYR/USD | | | 10/03/14 | | | | 88,408 | | | | (2,125 | ) |
| | NOK/EUR | | | 12/17/14 | | | | 1,252,387 | | | | (1,848 | ) |
| | NZD/USD | | | 12/17/14 | | | | 598,686 | | | | (23,718 | ) |
| | PHP/USD | | | 10/29/14 | | | | 309,810 | | | | (1,190 | ) |
Credit Suisse International (London) | | EUR/CHF | | | 12/17/14 | | | | 1,253,085 | | | | (698 | ) |
| | RUB/USD | | | 10/02/14 | | | | 583,391 | | | | (38,609 | ) |
| | RUB/USD | | | 10/27/14 | | | | 1,219,207 | | | | (35,793 | ) |
Deutsche Bank AG (London) | | AUD/USD | | | 12/17/14 | | | | 1,192,812 | | | | (46,586 | ) |
| | EUR/USD | | | 12/17/14 | | | | 3,580,233 | | | | (72,598 | ) |
| | IDR/USD | | | 11/03/14 | | | | 622,986 | | | | (1,014 | ) |
| | INR/USD | | | 10/07/14 | | | | 512,486 | | | | (2,247 | ) |
| | INR/USD | | | 10/29/14 | | | | 509,287 | | | | (3,727 | ) |
| | PHP/USD | | | 10/20/14 | | | | 621,587 | | | | (413 | ) |
| | PLN/USD | | | 12/17/14 | | | | 526,436 | | | | (18,888 | ) |
| | RUB/USD | | | 10/02/14 | | | | 158,855 | | | | (8,340 | ) |
| | USD/CNH | | | 04/16/15 | | | | 1,363,852 | | | | (4,852 | ) |
| | USD/GBP | | | 10/22/14 | | | | 588,339 | | | | (3,909 | ) |
HSBC Bank PLC | | EUR/USD | | | 12/17/14 | | | | 1,580,465 | | | | (21,008 | ) |
| | INR/USD | | | 10/27/14 | | | | 860,501 | | | | (13,295 | ) |
| | MXN/USD | | | 12/17/14 | | | | 1,184,536 | | | | (15,048 | ) |
| | NOK/USD | | | 12/17/14 | | | | 132,957 | | | | (2,538 | ) |
| | RUB/USD | | | 10/17/14 | | | | 302,989 | | | | (9,011 | ) |
| | |
| 72 | | The accompanying notes are an integral part of these financial statements. |
GOLDMAN SACHS GLOBAL INCOME FUND
|
| ADDITIONAL INVESTMENT INFORMATION (continued) |
FORWARD FOREIGN CURRENCY EXCHANGE CONTRACTS WITH UNREALIZED LOSS (continued)
| | | | | | | | | | | | | | |
| Counterparty | | Contracts to
Buy/Sell | | Settlement
Date | | | Current
Value | | | Unrealized
Loss | |
HSBC Bank PLC (continued) | | SGD/USD | | | 12/17/14 | | | $ | 1,158,314 | | | $ | (9,686 | ) |
| | USD/GBP | | | 12/17/14 | | | | 1,247,427 | | | | (4,012 | ) |
JPMorgan Chase Bank (London) | | EUR/GBP | | | 12/17/14 | | | | 1,251,000 | | | | (33,999 | ) |
| | EUR/NOK | | | 12/17/14 | | | | 1,234,152 | | | | (17,151 | ) |
| | MYR/USD | | | 10/03/14 | | | | 426,652 | | | | (9,289 | ) |
| | MYR/USD | | | 10/07/14 | | | | 500,102 | | | | (8,914 | ) |
| | MYR/USD | | | 10/20/14 | | | | 309,899 | | | | (1,101 | ) |
| | NOK/USD | | | 12/17/14 | | | | 647,879 | | | | (8,498 | ) |
| | RUB/USD | | | 11/17/14 | | | | 247,621 | | | | (10,164 | ) |
| | SEK/USD | | | 12/17/14 | | | | 1,223,929 | | | | (22,071 | ) |
| | TRY/USD | | | 12/17/14 | | | | 471,936 | | | | (10,064 | ) |
| | USD/MXN | | | 12/17/14 | | | | 1,872,056 | | | | (4,056 | ) |
Merrill Lynch International Bank Ltd. | | EUR/USD | | | 10/30/14 | | | | 480,749 | | | | (9,667 | ) |
Morgan Stanley & Co. International PLC | | AUD/USD | | | 12/17/14 | | | | 1,192,812 | | | | (45,648 | ) |
| | BRL/USD | | | 10/14/14 | | | | 415,642 | | | | (18,167 | ) |
| | BRL/USD | | | 10/27/14 | | | | 613,644 | | | | (13,356 | ) |
| | CHF/USD | | | 12/17/14 | | | | 610,909 | | | | (13,091 | ) |
| | EUR/CHF | | | 12/17/14 | | | | 1,226,821 | | | | (973 | ) |
| | EUR/HUF | | | 12/17/14 | | | | 311,711 | | | | (5,881 | ) |
| | EUR/USD | | | 12/17/14 | | | | 3,717,351 | | | | (19,486 | ) |
| | INR/USD | | | 10/27/14 | | | | 866,833 | | | | (14,040 | ) |
| | KRW/USD | | | 10/27/14 | | | | 614,937 | | | | (12,063 | ) |
Royal Bank of Canada | | AUD/USD | | | 12/17/14 | | | | 120,654 | | | | (3,378 | ) |
| | CAD/USD | | | 12/17/14 | | | | 2,202,035 | | | | (40,426 | ) |
| | EUR/USD | | | 10/30/14 | | | | 361,309 | | | | (1,384 | ) |
| | EUR/USD | | | 12/17/14 | | | | 1,224,584 | | | | (23,033 | ) |
| | GBP/USD | | | 12/17/14 | | | | 1,231,227 | | | | (19,885 | ) |
| | JPY/USD | | | 12/17/14 | | | | 1,189,315 | | | | (55,685 | ) |
| | MXN/USD | | | 12/17/14 | | | | 2,429,430 | | | | (46,265 | ) |
| | NOK/USD | | | 12/17/14 | | | | 172,417 | | | | (533 | ) |
| | USD/GBP | | | 10/22/14 | | | | 399,064 | | | | (980 | ) |
Royal Bank of Scotland PLC | | EUR/USD | | | 10/30/14 | | | | 1,139,528 | | | | (28,074 | ) |
| | NZD/USD | | | 12/17/14 | | | | 595,588 | | | | (25,510 | ) |
| | TRY/USD | | | 12/17/14 | | | | 2,989,359 | | | | (94,583 | ) |
| | USD/TRY | | | 12/17/14 | | | | 624,267 | | | | (2,267 | ) |
Standard Chartered Bank | | CNH/USD | | | 12/17/14 | | | | 2,475,546 | | | | (13,454 | ) |
| | INR/USD | | | 10/14/14 | | | | 1,778,540 | | | | (19,642 | ) |
| | JPY/USD | | | 12/17/14 | | | | 2,706,272 | | | | (96,728 | ) |
| | KRW/USD | | | 10/14/14 | | | | 623,632 | | | | (368 | ) |
| | MXN/USD | | | 12/17/14 | | | | 2,095,207 | | | | (42,574 | ) |
| | PLN/USD | | | 12/17/14 | | | | 663,699 | | | | (21,044 | ) |
| | TRY/USD | | | 12/17/14 | | | | 615,255 | | | | (11,745 | ) |
State Street Bank and Trust | | AUD/SEK | | | 12/17/14 | | | | 161,336 | | | | (602 | ) |
| | AUD/USD | | | 12/17/14 | | | | 1,883,728 | | | | (52,603 | ) |
| | CAD/JPY | | | 12/17/14 | | | | 135,892 | | | | (538 | ) |
| | CAD/USD | | | 12/17/14 | | | | 121,203 | | | | (2,429 | ) |
| | EUR/GBP | | | 12/17/14 | | | | 609,656 | | | | (10,634 | ) |
| | EUR/USD | | | 12/17/14 | | | | 1,220,793 | | | | (26,709 | ) |
| | GBP/JPY | | | 12/17/14 | | | | 160,848 | | | | (283 | ) |
| | GBP/USD | | | 12/17/14 | | | | 1,226,367 | | | | (16,339 | ) |
| | JPY/USD | | | 12/17/14 | | | | 2,328,007 | | | | (22,350 | ) |
| | NZD/GBP | | | 12/17/14 | | | | 136,061 | | | | (3,071 | ) |
| | |
| The accompanying notes are an integral part of these financial statements. | | 73 |
GOLDMAN SACHS GLOBAL INCOME FUND
Schedule of Investments (continued)
September 30, 2014 (Unaudited)
|
| ADDITIONAL INVESTMENT INFORMATION (continued) |
FORWARD FOREIGN CURRENCY EXCHANGE CONTRACTS WITH UNREALIZED LOSS (continued)
| | | | | | | | | | | | | | |
| Counterparty | | Contracts to
Buy/Sell | | Settlement
Date | | | Current
Value | | | Unrealized
Loss | |
State Street Bank and Trust (continued) | | NZD/JPY | | | 12/17/14 | | | $ | 197,849 | | | $ | (5,598 | ) |
| | NZD/USD | | | 12/17/14 | | | | 166,888 | | | | (6,795 | ) |
UBS AG (London) | | AUD/USD | | | 12/17/14 | | | | 1,159,446 | | | | (44,083 | ) |
| | BRL/USD | | | 10/14/14 | | | | 1,170,539 | | | | (75,461 | ) |
| | CHF/USD | | | 12/17/14 | | | | 1,020,976 | | | | (24,168 | ) |
| | INR/USD | | | 10/07/14 | | | | 923,345 | | | | (15,145 | ) |
| | JPY/USD | | | 12/17/14 | | | | 808,858 | | | | (9,383 | ) |
| | NOK/USD | | | 12/17/14 | | | | 132,252 | | | | (3,083 | ) |
| | PLN/USD | | | 12/17/14 | | | | 1,031,729 | | | | (21,271 | ) |
| | RUB/USD | | | 11/17/14 | | | | 647,779 | | | | (46,662 | ) |
| | SEK/USD | | | 12/17/14 | | | | 145,247 | | | | (2,779 | ) |
Westpac Banking Corp. | | AUD/NOK | | | 12/17/14 | | | | 208,229 | | | | (484 | ) |
| | AUD/USD | | | 12/17/14 | | | | 3,489,627 | | | | (96,342 | ) |
| | INR/USD | | | 10/14/14 | | | | 484,646 | | | | (6,674 | ) |
| | NZD/EUR | | | 12/17/14 | | | | 147,105 | | | | (538 | ) |
| | NZD/GBP | | | 12/17/14 | | | | 122,859 | | | | (771 | ) |
| | | NZD/USD | | | 12/17/14 | | | | 2,997,785 | | | | (135,846 | ) |
| TOTAL | | | | | | | | | | | | $ | (2,310,202 | ) |
FORWARD SALES CONTRACTS — At September 30, 2014, the Fund had the following forward sales contracts:
| | | | | | | | | | | | | | | | | | |
| Description | | Interest
Rate | | | Maturity
Date(f) | | Settlement
Date | | | Principal
Amount | | | Value | |
FNMA (Proceeds Receivable: $10,846,563) | | | 3.000 | % | | TBA-30yr | | | 10/14/2014 | | | $ | (11,000,000 | ) | | $ | (10,841,016 | ) |
FUTURES CONTRACTS — At September 30, 2014, the Fund had the following futures contracts:
| | | | | | | | | | | | | | |
| Type | | Number of
Contracts
Long (Short) | | | Expiration
Date | | Current
Value | | | Unrealized
Gain (Loss) | |
Australian 10 Year Government Bonds | | | 11 | | | December 2014 | | $ | 1,163,433 | | | $ | 9,863 | |
Eurodollars | | | (160 | ) | | December 2016 | | | (31,735,636 | ) | | | 15,049 | |
Eurodollars | | | (72 | ) | | March 2017 | | | (17,563,500 | ) | | | 36,579 | |
Euro Buxl 30 Year Bonds | | | 2 | | | December 2014 | | | 359,717 | | | | 1,310 | |
French 10 Year Government Bonds | | | 22 | | | December 2014 | | | 3,994,397 | | | | 49,706 | |
Japan 10 Year Government Bonds | | | (9 | ) | | December 2014 | | | (11,967,723 | ) | | | (12,889 | ) |
Ultra Long U.S. Treasury Bonds | | | 52 | | | December 2014 | | | 7,930,000 | | | | (104,564 | ) |
2 Year German Euro-Schatz | | | (47 | ) | | December 2014 | | | (6,589,631 | ) | | | (6,610 | ) |
5 Year German Euro-Bobl | | | (7 | ) | | December 2014 | | | (1,130,986 | ) | | | (3,195 | ) |
10 Year German Euro-Bund | | | 65 | | | December 2014 | | | 12,290,112 | | | | 65,189 | |
10 Year U.K. Long Gilt | | | 20 | | | December 2014 | | | 3,668,339 | | | | (12,214 | ) |
2 Year U.S. Treasury Notes | | | 185 | | | December 2014 | | | 40,486,094 | | | | (313 | ) |
5 Year U.S. Treasury Notes | | | (758 | ) | | December 2014 | | | (89,639,422 | ) | | | 229,672 | |
10 Year U.S. Treasury Notes | | | 92 | | | December 2014 | | | 11,466,937 | | | | 8,907 | |
20 Year U.S. Treasury Bonds | | | (13 | ) | | December 2014 | | | (1,792,781 | ) | | | (23,183 | ) |
| TOTAL | | | | | | | | | | | | $ | 253,307 | |
| | |
| 74 | | The accompanying notes are an integral part of these financial statements. |
GOLDMAN SACHS GLOBAL INCOME FUND
|
| ADDITIONAL INVESTMENT INFORMATION (continued) |
SWAP CONTRACTS — At September 30, 2014, the Fund had the following swap contracts:
OVER THE COUNTER INTEREST RATE SWAP CONTRACTS
| | | | | | | | | | | | | | | | | | | | |
| | | | | | | | | | | | Rates Exchanged | | | |
| Counterparty | | Notional
Amount
(000s) | | | Termination
Date | | | Payments
Received | | Payments
Made | | Unrealized
Gain (Loss)* | |
Barclays Bank PLC | | | $ | | | | 6,080 | (a) | | | 03/10/26 | | �� | 3.210% | | 3 month LIBOR | | $ | 40,575 | |
UBS AG (London) | | | CHF | | | | 5,400 | | | | 01/06/17 | | | 2.105 | | 6 month CHFOR | | | 353,980 | |
| TOTAL | | | | | | | | | | | | | | | | | | $ | 394,555 | |
| | * | | There are no upfront payments on the swap contract(s), therefore the unrealized gain (loss) on the swap contracts is equal to their market value. |
| | (a) | | Represents forward starting interest rate swaps whose effective dates of commencement of accruals and cash flows occur subsequent to September 30, 2014. |
CENTRALLY CLEARED INTEREST RATE SWAP CONTRACTS
| | | | | | | | | | | | | | | | |
| | | | | | Rates Exchanged | | Market Value | |
Notional
Amount
(000s) | | | Termination
Date | | Payments
Received | | Payments
Made | | Upfront
Payments
Made (Received) | | | Unrealized
Gain (Loss) | |
| JPY | 798,500 | (a) | | 12/17/16 | | 0.250% | | 6 month JYOR | | $ | 10,639 | | | $ | (1,105 | ) |
| $ | 3,640 | (a) | | 12/17/16 | | 1.000 | | 3 month LIBOR | | | (186 | ) | | | (259 | ) |
| | 2,600 | (a) | | 02/01/17 | | 3 month LIBOR | | 1.625% | | | (559 | ) | | | 1,324 | |
| | 9,800 | (a) | | 08/04/17 | | 3 month LIBOR | | 2.195 | | | (8,314 | ) | | | 5,101 | |
| GBP | 4,140 | (a) | | 09/12/17 | | 6 month GBP | | 2.250 | | | 9,129 | | | | (11,389 | ) |
| $ | 30,710 | (a) | | 10/27/17 | | 1.416 | | 3 month LIBOR | | | (261,485 | ) | | | (4,360 | ) |
| JPY | 303,800 | (a) | | 12/17/17 | | 0.250 | | 6 month JYOR | | | 4,688 | | | | (580 | ) |
| GBP | 1,820 | (a) | | 12/17/17 | | 1.750 | | 6 month GBP | | | 2,859 | | | | 1,062 | |
| JPY | 1,045,430 | (a) | | 02/12/19 | | 6 month JYOR | | 0.420 | | | (170,205 | ) | | | 126,553 | |
| $ | 3,300 | (a) | | 08/29/19 | | 3.520 | | 3 month LIBOR | | | 8 | | | | 77,907 | |
| | 3,300 | (a) | | 08/29/19 | | 3.560 | | 3 month LIBOR | | | 8 | | | | 81,664 | |
| JPY | 700,150 | (a) | | 12/17/19 | | 0.250 | | 6 month JYOR | | | (8,326 | ) | | | (3,885 | ) |
| EUR | 13,280 | (a) | | 12/17/19 | | 1.000 | | 6 month EURO | | | 405,319 | | | | 24,899 | |
| GBP | 1,590 | (a) | | 12/17/19 | | 2.250 | | 6 month GBP | | | 20,847 | | | | (11 | ) |
| $ | 16,360 | (a) | | 12/17/19 | | 3 month LIBOR | | 2.250 | | | (118,391 | ) | | | (22,290 | ) |
| SEK | 83,000 | (a) | | 12/17/19 | | 3 month STIBOR | | 1.250 | | | (101,141 | ) | | | 26,446 | |
| NZD | 20,110 | (a) | | 12/17/19 | | 4.500 | | 3 month NZDOR | | | (44,430 | ) | | | 107,128 | |
| AUD | 9,200 | (a) | | 12/17/19 | | 6 month AUDOR | | 3.750 | | | (89,908 | ) | | | (48,481 | ) |
| $ | 2,300 | (a) | | 10/02/20 | | 2.532 | | 3 month LIBOR | | | 12 | | | | — | |
| GBP | 1,890 | (a) | | 02/05/21 | | 2.840 | | 6 month GBP | | | (28,702 | ) | | | 77,260 | |
| $ | 14,900 | (a) | | 08/04/21 | | 3.025 | | 3 month LIBOR | | | 51,148 | | | | 29,881 | |
| | 1,700 | (a) | | 08/27/21 | | 3 month LIBOR | | 3.095 | | | 10 | | | | (87,773 | ) |
| | 1,700 | (a) | | 08/27/21 | | 3 month LIBOR | | 3.133 | | | 10 | | | | (91,928 | ) |
| GBP | 4,210 | (a) | | 09/12/21 | | 2.680 | | 6 month GBP | | | (54,709 | ) | | | 62,638 | |
| | 940 | (a) | | 12/17/21 | | 2.500 | | 6 month GBP | | | 22,541 | | | | (4,045 | ) |
| $ | 31,310 | (a) | | 12/17/21 | | 3 month LIBOR | | 2.500 | | | (75,505 | ) | | | (98,141 | ) |
| JPY | 1,475,790 | (a) | | 02/12/22 | | 1.080 | | 6 month JYOR | | | (224,449 | ) | | | 363,958 | |
| | 482,835 | (a) | | 12/19/23 | | 1.250 | | 6 month JYOR | | | 68,934 | | | | 8,473 | |
| SEK | 19,300 | (a) | | 12/19/23 | | 3 month STIBOR | | 3.500 | | | (227,177 | ) | | | 86,675 | |
| CAD | 14,335 | (a) | | 12/19/23 | | 4.000 | | 6 month CDOR | | | 387,976 | | | | 84,255 | |
| $ | 10,955 | (a) | | 12/19/23 | | 4.500 | | 3 month LIBOR | | | 411,144 | | | | 118,746 | |
| AUD | 105 | (a) | | 12/19/23 | | 6 month AUDOR | | 5.500 | | | (3,971 | ) | | | (223 | ) |
| CHF | 7,370 | (a) | | 12/19/23 | | 6 month CHFOR | | 2.500 | | | (501,727 | ) | | | 29,290 | |
| | |
| The accompanying notes are an integral part of these financial statements. | | 75 |
GOLDMAN SACHS GLOBAL INCOME FUND
Schedule of Investments (continued)
September 30, 2014 (Unaudited)
|
| ADDITIONAL INVESTMENT INFORMATION (continued) |
CENTRALLY CLEARED INTEREST RATE SWAP CONTRACTS (continued)
| | | | | | | | | | | | | | | | | | | | |
| | | | | | | Rates Exchanged | | Market Value | |
Notional
Amount
(000s) | | | Termination
Date | | | Payments
Received | | | Payments
Made | | Upfront
Payments
Made (Received) | | | Unrealized
Gain (Loss) | |
| EUR | 10,805 | (a) | | | 12/19/23 | | | | 6 month EURO | | | 3.250% | | $ | (1,536,378 | ) | | $ | 482,497 | |
| GBP | 1,840 | (a) | | | 12/19/23 | | | | 6 month GBP | | | 3.750 | | | (109,172 | ) | | | 8,658 | |
| $ | 7,500 | (a) | | | 01/30/24 | | | | 4.252% | | | 3 month LIBOR | | | 100,294 | | | | 176,959 | |
| | 1,930 | (a) | | | 04/04/24 | | | | 4.000 | | | 3 month LIBOR | | | (9,970 | ) | | | 58,310 | |
| | 7,500 | | | | 06/12/24 | | | | 3 month LIBOR | | | 2.808 | | | 53 | | | | (182,954 | ) |
| | 8,320 | (a) | | | 09/17/24 | | | | 4.500 | | | 6 month AUDOR | | | (29,587 | ) | | | 41,324 | |
| GBP | 5,370 | (a) | | | 09/17/24 | | | | 6 month GBP | | | 3.250 | | | (36,297 | ) | | | (38,531 | ) |
| JPY | 75,360 | (a) | | | 12/17/24 | | | | 0.750 | | | 6 month JYOR | | | 2,411 | | | | 2,103 | |
| $ | 16,740 | (a) | | | 12/17/24 | | | | 3 month LIBOR | | | 3.000 | | | (283,014 | ) | | | (125,575 | ) |
| SEK | 14,080 | (a) | | | 12/17/24 | | | | 3 month STIBOR | | | 1.750 | | | 5,119 | | | | 3,166 | |
| CAD | 2,790 | (a) | | | 12/17/24 | | | | 3.000 | | | 6 month CDOR | | | 114,620 | | | | (39,013 | ) |
| AUD | 5,340 | (a) | | | 12/17/24 | | | | 4.500 | | | 6 month AUDOR | | | 187,676 | | | | 56,732 | |
| NZD | 6,320 | (a) | | | 12/17/24 | | | | 5.000 | | | 3 month NZDOR | | | 107,957 | | | | 49,641 | |
| EUR | 3,940 | (a) | | | 12/17/24 | | | | 6 month EURO | | | 2.000 | | | (435,144 | ) | | | 41,970 | |
| GBP | 4,190 | (a) | | | 12/17/24 | | | | 6 month GBP | | | 3.000 | | | (274,862 | ) | | | (4,082 | ) |
| NOK | 51,170 | (a) | | | 12/18/24 | | | | 3 month NIBOR | | | 3.500 | | | (74,638 | ) | | | (38,294 | ) |
| GBP | 6,500 | (a) | | | 12/18/24 | | | | 3.250 | | | 6 month GBP | | | 52,865 | | | | 27,466 | |
| EUR | 8,600 | (a) | | | 12/18/24 | | | | 6 month EURO | | | 2.000 | | | 16,412 | | | | (53,482 | ) |
| JPY | 1,170,910 | (a) | | | 02/14/25 | | | | 6 month JYOR | | | 1.720 | | | (182,025 | ) | | | 56,013 | |
| | 2,028,750 | (a) | | | 05/09/25 | | | | 6 month JYOR | | | 1.650 | | | 41,027 | | | | (197,776 | ) |
| $ | 11,560 | (a) | | | 02/24/26 | | | | 3.123 | | | 3 month LIBOR | | | (696,982 | ) | | | 697,115 | |
| | 8,000 | (a) | | | 08/04/26 | | | | 3 month LIBOR | | | 3.409 | | | (44,617 | ) | | | (76,451 | ) |
| GBP | 2,280 | (a) | | | 09/12/26 | | | | 6 month GBP | | | 2.980 | | | 35,480 | | | | (58,534 | ) |
| $ | 700 | (a) | | | 09/28/26 | | | | 3.280 | | | 3 month LIBOR | | | 6 | | | | 942 | |
| JPY | 1,241,660 | (a) | | | 05/09/27 | | | | 1.880 | | | 6 month JYOR | | | (36,883 | ) | | | 214,922 | |
| $ | 2,010 | (a) | | | 12/17/34 | | | | 3 month LIBOR | | | 3.500 | | | (79,164 | ) | | | (31,591 | ) |
| GBP | 1,050 | (a) | | | 02/05/36 | | | | 6 month GBP | | | 3.500 | | | 5,495 | | | | (135,241 | ) |
| $ | 2,400 | (a) | | | 01/30/39 | | | | 3 month LIBOR | | | 4.370 | | | (91,515 | ) | | | (161,614 | ) |
| EUR | 2,140 | (a) | | | 12/17/44 | | | | 2.500 | | | 6 month EURO | | | 491,389 | | | | (122,361 | ) |
| $ | 5,950 | (a) | | | 12/17/44 | | | | 3.500 | | | 3 month LIBOR | | | 186,458 | | | | 131,631 | |
| GBP | 6,940 | (a) | | | 12/17/44 | | | | 6 month GBP | | | 3.250 | | | (880,595 | ) | | | 53,319 | |
| | TOTAL | | | | | | | | | | | | | $ | (3,977,494 | ) | | $ | 1,776,059 | |
| | (a) | | Represents forward starting interest rate swaps whose effective dates of commencement of accruals and cash flows occur subsequent to September 30, 2014. |
OVER THE COUNTER CREDIT DEFAULT SWAP CONTRACTS
| | | | | | | | | | | | | | | | | | | | | | | | | | |
| | | | | | | | | | | | | | | | | Market Value | |
| Counterparty | | Referenced
Obligation | | Notional
Amount
(000s) | | | Rates Received
(Paid) | | | Termination
Date | | | Credit
Spread at
September 30,
2014(b) | | | Upfront
Payments
Made (Received) | | | Unrealized
Gain (Loss) | |
Protection Sold: | | | | | | | | | | | | | | | | | | | | | | | | | | |
Bank of America Securities LLC | | CDX North America Investment Grade Index 16 | | $ | 5,400 | | | | 1.000 | % | | | 06/20/16 | | | | 0.227 | % | | $ | 2,651 | | | $ | 71,064 | |
Morgan Stanley Capital Services, Inc. | | | | | 2,650 | | | | 1.000 | | | | 06/20/16 | | | | 0.227 | | | | 1,244 | | | | 34,932 | |
| TOTAL | | | | | | | | | | | | | | | | | | | | $ | 3,895 | | | $ | 105,996 | |
| | (b) | | Credit spread on the Referenced Obligation, together with the term of the swap contract, are indicators of payment/performance risk. The likelihood of a credit event occurring which would require a fund to make a payment or otherwise be required to perform under the swap contract is generally greater as the credit spread and the term of the swap contract increase. |
| | |
| 76 | | The accompanying notes are an integral part of these financial statements. |
GOLDMAN SACHS GLOBAL INCOME FUND
|
| ADDITIONAL INVESTMENT INFORMATION (continued) |
CENTRALLY CLEARED CREDIT DEFAULT SWAP CONTRACTS
| | | | | | | | | | | | | | | | | | | | | | | | |
| | | | | | | | | | | | | | | | Market Value | |
| Referenced Obligation | | Notional
Amount
(000s) | | Rates Received
(Paid) | | | Termination
Date | | | Credit
Spread at
September 30,
2014(b) | | | Upfront
Payments
Made (Received) | | | Unrealized
Gain (Loss) | |
Protection Purchased: | | | | | | | | | | | | | | | | | | | | | | | | |
CDX North America Investment Grade Index 22 | | $ | | 5,250 | | | (1.000 | )% | | | 06/20/19 | | | | 0.644 | % | | $ | (81,219 | ) | | $ | (4,443 | ) |
iTraxx Europe Index Series 21 | | EUR | | 4,650 | | | (1.000 | ) | | | 06/20/19 | | | | 0.627 | | | | (99,041 | ) | | | (3,885 | ) |
| TOTAL | | | | | | | | | | | | | | | | | | $ | (180,260 | ) | | $ | (8,328 | ) |
| | (b) | | Credit spread on the Referenced Obligation, together with the term of the swap contract, are indicators of payment/performance risk. The likelihood of a credit event occurring which would require a fund to make a payment or otherwise be required to perform under the swap contract is generally greater as the credit spread and the term of the swap contract increase. |
WRITTEN OPTIONS CONTRACTS — At September 30, 2014, the Fund had the following written options:
CURRENCY WRITTEN OPTION CONTRACTS
| | | | | | | | | | | | | | | | | | | | |
| Counterparty | | Description | | Notional
Amount
(000s) | | | Expiration
Date | | | Strike
Price | | | | | Value | |
Deutsche Bank AG | | Put USD/Call INR Strike Price 60.350% | | $ | 1,251 | | | | 10/21/14 | | | | 60.350 | % | | | | $ | (271 | ) |
| | Call USD/Put CNH Strike Price 6.172% | | | 4,113 | | | | 02/18/15 | | | | 6.172 | | | | | | (59,071 | ) |
| | | Put USD/Call CNH Strike Price 6.172% | | | 4,113 | | | | 02/18/15 | | | | 6.172 | | | | | | (12,088 | ) |
| TOTAL (Premium Received $111,617) | | $ | 9,477 | | | | | | | | | | | | | $ | (71,430 | ) |
CURRENCY WRITTEN OPTIONS CONTRACTS — For the period ended September 30, 2014, the Fund had the following written options activity:
| | | | | | | | |
| | | Notional
Amount
(000s) | | | Premiums
Received | |
Contracts Outstanding March 31, 2014 | | $ | — | | | $ | — | |
Contracts Written | | | 19,082 | | | | 137,919 | |
Contracts Bought to Close | | | — | | | | — | |
Contracts Expired | | | (9,605 | ) | | | (26,302 | ) |
Contracts Outstanding September 30, 2014 | | $ | 9,477 | | | $ | 111,617 | |
| | |
| The accompanying notes are an integral part of these financial statements. | | 77 |
GOLDMAN SACHS STRATEGIC INCOME FUND
Schedule of Investments
September 30, 2014 (Unaudited)
| | | | | | | | | | | | | | |
Principal
Amount | | | Interest
Rate | | | Maturity
Date | | | Value | |
| | | | | | | | | | | | | | |
| | Corporate Obligations – 11.7% | |
| | Automotive – 0.2% | |
| Chrysler Group LLC/CG Co-Issuer, Inc.(a) | |
| $ | 40,700,000 | | | | 8.000 | % | | | 06/15/19 | | | $ | 43,142,000 | |
| General Motors Co. | |
| | 2,200,000 | | | | 3.500 | | | | 10/02/18 | | | | 2,233,000 | |
| | 17,875,000 | | | | 4.875 | | | | 10/02/23 | | | | 18,768,750 | |
| | | | | | | | | | | | | | |
| | | | | | | | | | | | | 64,143,750 | |
| | |
| | Banks – 2.6% | |
| Abbey National Treasury Services PLC(b) | |
| GBP | 1,800,000 | | | | 2.161 | | | | 02/16/15 | | | | 2,934,954 | |
| ABN AMRO Bank NV(a)(b) | |
| | 2,940,000 | | | | 5.000 | | | | 02/17/49 | | | | 4,837,674 | |
| EUR | 21,765,000 | | | | 4.310 | | | | 03/10/49 | | | | 27,895,693 | |
| Banco Nacional de Costa Rica | |
| $ | 3,100,000 | | | | 6.250 | (c) | | | 11/01/23 | | | | 3,107,750 | |
| | 2,810,000 | | | | 6.250 | | | | 11/01/23 | | | | 2,817,025 | |
| Banco Santander SA(a)(b) | |
| | 25,800,000 | | | | 6.375 | | | | 05/19/49 | | | | 24,381,000 | |
| Bank of America Corp.(a)(b) | |
| EUR | 15,200,000 | | | | 0.922 | | | | 03/28/18 | | | | 18,986,225 | |
| $ | 54,950,000 | | | | 5.125 | | | | 06/17/49 | | | | 53,232,813 | |
| | 40,500,000 | | | | 6.250 | | | | 09/05/49 | | | | 40,095,000 | |
| Bank of Scotland PLC(a)(b) | |
| GBP | 12,330,000 | | | | 7.281 | | | | 05/31/49 | | | | 22,587,323 | |
| | 8,621,000 | | | | 7.286 | | | | 05/31/49 | | | | 14,845,379 | |
| Barclays Bank PLC(a)(b) | |
| EUR | 7,400,000 | | | | 6.500 | | | | 09/15/49 | | | | 8,974,393 | |
| $ | 2,850,000 | | | | 6.625 | | | | 09/15/49 | | | | 2,693,250 | |
| GBP | 6,800,000 | | | | 7.000 | | | | 09/15/49 | | | | 10,420,928 | |
| EUR | 19,450,000 | | | | 4.875 | | | | 12/15/49 | | | | 23,995,656 | |
| Citigroup, Inc.(a)(b) | |
| $ | 55,450,000 | | | | 6.300 | | | | 05/15/49 | | | | 54,826,187 | |
| Credit Agricole SA(a)(b)(c) | |
| | 15,150,000 | | | | 7.875 | | | | 01/23/49 | | | | 15,301,500 | |
| Credit Suisse Group AG(a)(b)(c) | |
| | 35,475,000 | | | | 7.500 | | | | 12/11/49 | | | | 37,291,320 | |
| | 20,050,000 | | | | 6.250 | | | | 12/18/49 | | | | 19,398,375 | |
| Deutsche Bank AG(a)(b) | |
| EUR | 17,500,000 | | | | 6.000 | | | | 04/30/49 | | | | 21,334,022 | |
| Intesa Sanpaolo SpA(c) | |
| $ | 52,550,000 | | | | 5.017 | | | | 06/26/24 | | | | 51,046,291 | |
| KBC Groep NV(a)(b) | |
| EUR | 15,900,000 | | | | 5.625 | | | | 03/19/49 | | | | 19,231,438 | |
| Lloyds Bank PLC(a)(b) | |
| $ | 17,730,000 | | | | 9.875 | | | | 12/16/21 | | | | 20,588,963 | |
| Lloyds Banking Group PLC(a)(b) | |
| | 17,655,000 | | | | 6.413 | (c) | | | 01/29/49 | | | | 18,879,904 | |
| | 2,956,000 | | | | 6.657 | (c) | | | 01/29/49 | | | | 3,198,037 | |
| GBP | 8,200,000 | | | | 7.000 | | | | 06/27/49 | | | | 13,092,294 | |
| $ | 3,300,000 | | | | 7.500 | | | | 06/27/49 | | | | 3,399,000 | |
| Northern Rock Asset Management PLC(c) | |
| | 10,354,000 | | | | 5.625 | | | | 06/22/17 | | | | 11,494,971 | |
| PNC Preferred Funding Trust II(a)(b)(c) | |
| | 102,900,000 | | | | 1.457 | | | | 03/29/49 | | | | 98,912,625 | |
| Sparebank 1 Boligkreditt AS(c) | |
| | 13,400,000 | | | | 1.750 | | | | 11/15/19 | | | | 13,040,734 | |
| | |
| Principal Amount | | | Interest
Rate | | | Maturity
Date | | | Value | |
| | | | | | | | | | | | | | |
| Corporate Obligations – (continued) | |
| Banks – (continued) | |
| Stadshypotek AB(c) | |
| $ | 8,100,000 | | | | 1.875 | % | | | 10/02/19 | | | $ | 7,965,218 | |
| | | | | | | | | | | | | | |
| | | | | | | | | | | | | 670,805,942 | |
| | |
| | Building Materials(a) – 0.3% | |
| HD Supply, Inc. | |
| | 53,975,000 | | | | 8.125 | | | | 04/15/19 | | | | 58,293,000 | |
| | 14,225,000 | | | | 11.000 | | | | 04/15/20 | | | | 16,145,375 | |
| | | | | | | | | | | | | | |
| | | | | | | | | | | | | 74,438,375 | |
| | |
| | Consumer Cyclical Services(a) – 0.5% | |
| Equinix, Inc. | |
| | 20,725,000 | | | | 7.000 | | | | 07/15/21 | | | | 22,072,125 | |
| First Data Corp.(c) | |
| | 56,325,000 | | | | 7.375 | | | | 06/15/19 | | | | 59,141,250 | |
| | 36,150,000 | | | | 8.875 | | | | 08/15/20 | | | | 38,725,687 | |
| | | | | | | | | | | | | | |
| | | | | | | | | | | | | 119,939,062 | |
| | |
| | Consumer Products – Household & Leisure – 0.1% | |
| Alphabet Holding Co., Inc.(a)(d) | |
| | 11,450,000 | | | | 7.750 | | | | 11/01/17 | | | | 11,249,625 | |
| Avon Products, Inc. | |
| | 10,025,000 | | | | 4.600 | | | | 03/15/20 | | | | 10,238,145 | |
| | | | | | | | | | | | | | |
| | | | | | | | | | | | | 21,487,770 | |
| | |
| | Energy – 0.8% | |
| Gazprom Neft OAO Via GPN Capital SA(c) | |
| | 27,950,000 | | | | 6.000 | | | | 11/27/23 | | | | 26,273,000 | |
| GPN Capital SA for Gazprom | |
| | 10,748,000 | | | | 4.375 | | | | 09/19/22 | | | | 9,216,410 | |
| Halcon Resources Corp.(a) | |
| | 41,125,000 | | | | 9.750 | | | | 07/15/20 | | | | 41,536,250 | |
| | 48,809,000 | | | | 8.875 | | | | 05/15/21 | | | | 48,320,910 | |
| Offshore Drilling Holding SA(a)(c) | |
| | 3,815,000 | | | | 8.375 | | | | 09/20/20 | | | | 4,039,131 | |
| Seadrill Ltd.(c) | |
| | 54,071,000 | | | | 6.125 | | | | 09/15/17 | | | | 53,868,234 | |
| Transocean, Inc. | |
| | 31,243,000 | | | | 6.800 | | | | 03/15/38 | | | | 29,989,094 | |
| | | | | | | | | | | | | | |
| | | | | | | | | | | | | 213,243,029 | |
| | |
| | Energy – Exploration & Production(a) – 0.5% | |
| Kodiak Oil & Gas Corp. | |
| | 72,689,000 | | | | 8.125 | | | | 12/01/19 | | | | 78,140,675 | |
| MEG Energy Corp.(c) | |
| | 40,700,000 | | | | 7.000 | | | | 03/31/24 | | | | 42,124,500 | |
| Pacific Rubiales Energy Corp.(c) | |
| | 20,900,000 | | | | 5.375 | | | | 01/26/19 | | | | 21,056,750 | |
| | | | | | | | | | | | | | |
| | | | | | | | | | | | | 141,321,925 | |
| | |
| | Food & Beverage(a) – 0.3% | |
| Bumble Bee Acquisition Corp.(c) | |
| | 41,625,000 | | | | 9.000 | | | | 12/15/17 | | | | 43,602,188 | |
| Olam International Ltd. | |
| | 8,780,000 | | | | 6.750 | | | | 01/29/18 | | | | 9,098,275 | |
| Post Holdings, Inc. | |
| | 22,475,000 | | | | 7.375 | | | | 02/15/22 | | | | 22,362,625 | |
| | | | | | | | | | | | | | |
| | | | | | | | | | | | | 75,063,088 | |
| | |
| | |
| 78 | | The accompanying notes are an integral part of these financial statements. |
GOLDMAN SACHS STRATEGIC INCOME FUND
| | | | | | | | | | | | | | |
Principal
Amount | | | Interest
Rate | | | Maturity
Date | | | Value | |
| | | | | | | | | | | | | | |
| Corporate Obligations – (continued) | |
| | Gaming(a) – 0.1% | |
| Caesars Entertainment Operating Co., Inc. | |
| $ | 27,600,000 | | | | 9.000 | % | | | 02/15/20 | | | $ | 21,183,000 | |
| | |
| | Health Care – Services(a) – 0.0% | |
| CHS/Community Health Systems, Inc. | |
| | 3,200,000 | | | | 8.000 | | | | 11/15/19 | | | | 3,416,000 | |
| | |
| | Home Construction(a) – 0.0% | |
| Beazer Homes USA, Inc. | |
| | 2,350,000 | | | | 9.125 | | | | 05/15/19 | | | | 2,461,625 | |
| | |
| | Media – Cable(a) – 0.1% | |
| Virgin Media Finance PLC | |
| | 24,201,000 | | | | 8.375 | | | | 10/15/19 | | | | 25,217,442 | |
| | |
| | Media – Non Cable(a)(c) – 0.3% | |
| Getty Images, Inc. | |
| | 20,104,000 | | | | 7.000 | | | | 10/15/20 | | | | 14,826,700 | |
| Univision Communications, Inc. | |
| | 67,651,000 | | | | 8.500 | | | | 05/15/21 | | | | 71,710,060 | |
| | | | | | | | | | | | | | |
| | | | | | | | | | | | | 86,536,760 | |
| | |
| | Metals & Mining – 0.4% | |
| CITIC Ltd. | |
| | 83,550,000 | | | | 6.800 | | | | 01/17/23 | | | | 96,160,043 | |
| | |
| | Noncaptive – Financial – 0.1% | |
| General Electric Capital Corp. | |
| MXN | 48,000,000 | | | | 8.500 | | | | 04/06/18 | | | | 3,956,368 | |
| GEO Maquinaria(a)(c) | |
| $ | 1,514,838 | | | | 9.625 | | | | 05/02/21 | | | | 424,155 | |
| Nuveen Investments, Inc. | |
| | 11,975,000 | | | | 5.500 | | | | 09/15/15 | | | | 12,244,437 | |
| | | | | | | | | | | | | | |
| | | | | | | | | | | | | 16,624,960 | |
| | |
| | Packaging(a) – 2.1% | |
| Ardagh Packaging Finance PLC | |
| | 115,304,000 | | | | 9.125 | (c) | | | 10/15/20 | | | | 124,869,085 | |
| EUR | 19,775,000 | | | | 9.250 | | | | 10/15/20 | | | | 26,741,436 | |
| Berry Plastics Corp. | |
| $ | 44,266,000 | | | | 9.750 | | | | 01/15/21 | | | | 49,024,595 | |
| Beverage Packaging Holdings Luxembourg II SA/Beverage
Packaging Holdings II Is(c) |
|
| | 33,633,000 | | | | 5.625 | | | | 12/15/16 | | | | 33,212,588 | |
| Reynolds Group Issuer, Inc. | |
| | 91,125,000 | | | | 9.000 | | | | 04/15/19 | | | | 94,997,812 | |
| | 28,100,000 | | | | 7.875 | | | | 08/15/19 | | | | 29,786,000 | |
| | 129,978,000 | | | | 9.875 | | | | 08/15/19 | | | | 139,888,822 | |
| Sealed Air Corp.(c) | |
| | 54,075,000 | | | | 8.125 | | | | 09/15/19 | | | | 58,130,625 | |
| | | | | | | | | | | | | | |
| | | | | | | | | | | | | 556,650,963 | |
| | |
| | Pipelines – 0.4% | |
| Enterprise Products Operating LLC(a)(b) | |
| | 22,300,000 | | | | 8.375 | | | | 08/01/66 | | | | 24,474,250 | |
| | 1,850,000 | | | | 7.000 | | | | 06/01/67 | | | | 1,933,250 | |
| | 16,275,000 | | | | 7.034 | | | | 01/15/68 | | | | 18,390,750 | |
| Sabine Pass LNG LP | |
| | 60,200,000 | | | | 7.500 | | | | 11/30/16 | | | | 64,037,750 | |
| | | | | | | | | | | | | | |
| | | | | | | | | | | | | 108,836,000 | |
| | |
Principal
Amount | | | Interest
Rate | | | Maturity
Date | | | Value | |
| | | | | | | | | | | | | | |
| Corporate Obligations – (continued) | |
| | Property/Casualty Insurance(a)(b) – 0.1% | |
| ING Capital Funding Trust III | |
| $ | 12,250,000 | | | | 3.833 | % | | | 12/29/49 | | | $ | 12,188,750 | |
| The Chubb Corp. | |
| | 11,794,000 | | | | 6.375 | | | | 03/29/67 | | | | 12,914,430 | |
| | | | | | | | | | | | | | |
| | | | | | | | | | | | | 25,103,180 | |
| | |
| | Real Estate Investment Trusts(c) – 0.1% | |
| Realogy Group LLC(a) | |
| | 12,250,000 | | | | 7.875 | | | | 02/15/19 | | | | 12,847,187 | |
| Trust F/1401 | |
| | 18,700,000 | | | | 5.250 | | | | 12/15/24 | | | | 19,513,450 | |
| | 300,000 | | | | 6.950 | | | | 01/30/44 | | | | 328,500 | |
| | | | | | | | | | | | | | |
| | | | | | | | | | | | | 32,689,137 | |
| | |
| | Restaurants(a)(c) – 0.2% | |
| New Red Finance, Inc. | |
| | 62,000,000 | | | | 6.000 | | | | 04/01/22 | | | | 61,535,000 | |
| | |
| | Retailers – 0.1% | |
| Best Buy Co., Inc. | |
| | 8,450,000 | | | | 5.000 | | | | 08/01/18 | | | | 8,745,750 | |
| The Men’s Wearhouse, Inc.(a)(c) | |
| | 5,550,000 | | | | 7.000 | | | | 07/01/22 | | | | 5,633,250 | |
| | | | | | | | | | | | | | |
| | | | | | | | | | | | | 14,379,000 | |
| | |
| | Retailers – Food & Drug(a) – 0.2% | |
| BI-LO LLC/BI-LO Finance Corp.(c) | |
| | 46,255,000 | | | | 8.625 | (d) | | | 09/15/18 | | | | 42,207,687 | |
| | 14,150,000 | | | | 9.250 | | | | 02/15/19 | | | | 13,937,750 | |
| Rite Aid Corp. | |
| | 9,250,000 | | | | 8.000 | | | | 08/15/20 | | | | 9,885,938 | |
| | | | | | | | | | | | | | |
| | | | | | | | | | | | | 66,031,375 | |
| | |
| | Services Cyclical – Rental Equipment(a)(c) – 0.2% | |
| Algeco Scotsman Global Finance PLC | |
| | 46,600,000 | | | | 10.750 | | | | 10/15/19 | | | | 44,503,000 | |
| | |
| | Technology(a) – 0.1% | |
| CDW LLC/CDW Finance Corp. | |
| | 23,356,000 | | | | 8.500 | | | | 04/01/19 | | | | 24,757,360 | |
| | |
| | Telecommunications – Cellular – 0.1% | |
| America Movil SAB de CV | |
| MXN | 256,740,000 | | | | 6.000 | | | | 06/09/19 | | | | 19,249,431 | |
| | |
| | Transportation Services(a)(c) – 0.1% | |
| Aguila 3 SA | |
| $ | 12,800,000 | | | | 7.875 | | | | 01/31/18 | | | | 13,088,000 | |
| | |
| | Water Utilities – 0.1% | |
| Anglian Water Osprey Financing PLC | |
| GBP | 15,944,000 | | | | 7.000 | | | | 01/31/18 | | | | 27,719,393 | |
| | |
| | Wireless Telecommunications – 1.1% | |
| Intelsat Jackson Holdings SA(a) | |
| $ | 29,180,000 | | | | 7.250 | | | | 04/01/19 | | | | 30,639,000 | |
| Softbank Corp. | |
| | 95,650,000 | | | | 4.500 | (c) | | | 04/15/20 | | | | 94,932,625 | |
| EUR | 39,850,000 | | | | 4.625 | | | | 04/15/20 | | | | 54,154,313 | |
| Sprint Communications, Inc. | |
| $ | 2,750,000 | | | | 11.500 | | | | 11/15/21 | | | | 3,506,250 | |
| | |
| | |
| The accompanying notes are an integral part of these financial statements. | | 79 |
GOLDMAN SACHS STRATEGIC INCOME FUND
Schedule of Investments (continued)
September 30, 2014 (Unaudited)
| | | | | | | | | | | | | | |
Principal
Amount | | | Interest
Rate | | | Maturity
Date | | | Value | |
| | | | | | | | | | | | | | |
| Corporate Obligations – (continued) | |
| Wireless Telecommunications – (continued) | |
| Sprint Corp.(c) | |
| $ | 92,675,000 | | | | 7.875 | % | | | 09/15/23 | | | $ | 98,467,187 | |
| | | | | | | | | | | | | | |
| | | | | | | | | | | | | 281,699,375 | |
| | |
| | Wirelines Telecommunications(a) – 0.5% | |
| Level 3 Communications, Inc. | |
| | 36,935,000 | | | | 8.875 | | | | 06/01/19 | | | | 39,428,112 | |
| Level 3 Financing, Inc. | |
| | 46,550,000 | | | | 9.375 | | | | 04/01/19 | | | | 49,808,500 | |
| | 9,850,000 | | | | 8.125 | | | | 07/01/19 | | | | 10,490,250 | |
| | 30,075,000 | | | | 8.625 | | | | 07/15/20 | | | | 32,556,188 | |
| | | | | | | | | | | | | | |
| | | | | | | | | | | | | 132,283,050 | |
| | |
| | TOTAL CORPORATE OBLIGATIONS | |
| | (Cost $3,119,611,384) | | | $ | 3,040,567,035 | |
| | |
| | | | | | | | | | | | | | |
| | Mortgage-Backed Obligations – 14.2% | |
| | Adjustable Rate Non-Agency(b) – 3.1% | |
| Aire Valley Mortgages PLC Series 2005-1X, Class 2A1 | |
| GBP | 1,883,988 | | | | 0.926 | % | | | 09/20/66 | | | $ | 3,009,776 | |
| Aire Valley Mortgages PLC Series 2005-1X, Class 2A2 | |
| EUR | 7,661,546 | | | | 0.442 | | | | 09/20/66 | | | | 9,540,250 | |
| Aire Valley Mortgages PLC Series 2005-1X, Class 2A3 | |
| $ | 4,647,167 | | | | 0.573 | | | | 09/20/66 | | | | 4,575,921 | |
| Aire Valley Mortgages PLC Series 2006-1A, Class 1A(c) | |
| | 38,735,686 | | | | 0.453 | | | | 09/20/66 | | | | 37,960,139 | |
| Aire Valley Mortgages PLC Series 2006-1X, Class 2A1 | |
| EUR | 12,374,502 | | | | 0.382 | | | | 09/20/66 | | | | 15,368,745 | |
| Aire Valley Mortgages PLC Series 2006-1X, Class 2A2 | |
| GBP | 7,351,910 | | | | 0.866 | | | | 09/20/66 | | | | 11,715,355 | |
| Aire Valley Mortgages PLC Series 2007-1A, Class 2A1(c) | |
| $ | 34,552,682 | | | | 0.473 | | | | 09/20/66 | | | | 33,890,321 | |
| Aire Valley Mortgages PLC Series 2007-1X, Class 2A2 | |
| EUR | 6,851,646 | | | | 0.342 | | | | 09/20/66 | | | | 8,494,716 | |
| American Home Mortgage Assets Trust Series 2006-2, Class 2A1 | |
| $ | 11,994,695 | | | | 0.345 | | | | 09/25/46 | | | | 8,733,338 | |
| American Home Mortgage Assets Trust Series 2006-6,
Class A1A |
|
| | 6,624,254 | | | | 0.345 | | | | 12/25/46 | | | | 4,685,335 | |
| American Home Mortgage Investment Trust Series 2005-3,
Class 2A4 |
|
| | 6,100,000 | | | | 1.954 | | | | 09/25/35 | | | | 3,716,561 | |
| American Home Mortgage Investment Trust Series 2006-3,
Class 11A1 |
|
| | 209,450 | | | | 0.335 | | | | 12/25/46 | | | | 173,613 | |
| American Home Mortgage Investment Trust Series 2007-2,
Class 11A1 |
|
| | 5,573,261 | | | | 0.385 | | | | 03/25/47 | | | | 3,581,935 | |
| Banc of America Funding Corp. Series 2006-H, Class 6A1 | |
| | 32,166,462 | | | | 0.346 | | | | 10/20/36 | | | | 23,461,478 | |
| Bear Stearns Mortgage Funding Series 2007-AR1, Class 1A1 | |
| | 7,093,167 | | | | 0.315 | | | | 01/25/37 | | | | 5,434,075 | |
| Bear Stearns Mortgage Funding Trust Series 2007-AR4,
Class 1A1 |
|
| | 4,913,341 | | | | 0.355 | | | | 09/25/47 | | | | 3,973,419 | |
| | |
Principal
Amount | | | Interest
Rate | | | Maturity
Date | | | Value | |
| | | | | | | | | | | | | | |
| Mortgage-Backed Obligations – (continued) | |
| Adjustable Rate Non-Agency(b) – (continued) | |
| Chevy Chase Funding LLC Mortgage-Backed Certificates
Series 2005-4A, Class A1(c) |
|
| 7,590,168 | | | | 0.355 | | | | 10/25/36 | | | | 6,743,864 | |
| Chevy Chase Funding LLC Mortgage-Backed Certificates
Series 2006-1A, Class A1(c) |
|
| | 38,532,766 | | | | 0.305 | | | | 12/25/46 | | | | 32,382,936 | |
| Chevy Chase Funding LLC Mortgage-Backed Certificates
Series 2006-2A, Class A1(c) |
|
| | 22,946,593 | | | | 0.285 | | | | 04/25/47 | | | | 18,188,417 | |
| Chevy Chase Funding LLC Mortgage-Backed Certificates
Series 2006-3A, Class A1(c) |
|
| | 19,542,612 | | | | 0.285 | | | | 08/25/47 | | | | 15,500,355 | |
| Chevy Chase Funding LLC Mortgage-Backed Certificates
Series 2006-4A, Class A1(c) |
|
| | 12,584,884 | | | | 0.285 | | | | 11/25/47 | | | | 10,009,853 | |
| Citigroup Mortgage Loan Trust, Inc. Series 2006-AR7,
Class 2A2A |
|
| | 6,335,951 | | | | 2.644 | | | | 11/25/36 | | | | 5,156,756 | |
| Countrywide Alternative Loan Trust Series 2005-16, Class A1 | |
| | 6,235,559 | | | | 1.763 | | | | 06/25/35 | | | | 5,508,493 | |
| Countrywide Alternative Loan Trust Series 2005-61, Class 1A1 | |
| | 778,029 | | | | 0.415 | | | | 12/25/35 | | | | 678,208 | |
| Countrywide Alternative Loan Trust Series 2005-76, Class 1A1 | |
| | 2,579,319 | | | | 1.598 | | | | 01/25/36 | | | | 2,410,374 | |
| Countrywide Alternative Loan Trust Series 2005-81, Class A1 | |
| | 9,528,960 | | | | 0.435 | | | | 02/25/37 | | | | 7,592,676 | |
| Countrywide Alternative Loan Trust Series 2005-9CB, Class 1A5 | |
| | 1,426,540 | | | | 0.655 | | | | 05/25/35 | | | | 1,219,979 | |
| Countrywide Alternative Loan Trust Series 2006-0C8,
Class 2A2B |
|
| | 5,044,757 | | | | 0.325 | | | | 11/25/36 | | | | 4,433,599 | |
| Countrywide Alternative Loan Trust Series 2006-OA1, Class 2A1 | |
| | 431,534 | | | | 0.366 | | | | 03/20/46 | | | | 331,591 | |
| Countrywide Alternative Loan Trust Series 2007-19, Class 1A11 | |
| | 14,524,605 | | | | 0.655 | | | | 08/25/37 | | | | 9,824,382 | |
| Countrywide Alternative Loan Trust Series 2007-HY6, Class A1 | |
| | 7,577,533 | | | | 0.365 | | | | 08/25/47 | | | | 6,178,878 | |
| Countrywide Alternative Loan Trust Series 2007-OA11,
Class A1A |
|
| | 35,074,010 | | | | 1.498 | | | | 11/25/47 | | | | 26,673,785 | |
| Countrywide Alternative Loan Trust Series 2007-OA2, Class 2A1 | |
| | 12,843,214 | | | | 0.285 | | | | 03/25/47 | | | | 8,570,277 | |
| Countrywide Alternative Loan Trust Series 2007-OH1,
Class A1D |
|
| | 12,476,204 | | | | 0.365 | | | | 04/25/47 | | | | 9,566,753 | |
| Countrywide Home Loans Mortgage Pass-Through Trust
Series 2005-3, Class 1A1 |
|
| | 9,879,486 | | | | 0.465 | | | | 04/25/35 | | | | 7,570,650 | |
| Countrywide Home Loans Mortgage Pass-Through Trust
Series 2006-OA5, Class 1A1 |
|
| | 4,963,818 | | | | 0.355 | | | | 04/25/46 | | | | 4,058,418 | |
| Deutsche Alt-A Securities Mortgage Loan Trust
Series 2007-OA5, Class A1A |
|
| | 4,181,737 | | | | 0.355 | | | | 08/25/47 | | | | 3,602,148 | |
| Deutsche Alt-A Securities Mortgage Loan Trust
Series 2007-OA5, Class A1B |
|
| | 5,218,808 | | | | 0.375 | | | | 08/25/47 | | | | 4,522,619 | |
| | |
| | |
| 80 | | The accompanying notes are an integral part of these financial statements. |
GOLDMAN SACHS STRATEGIC INCOME FUND
| | | | | | | | | | | | | | |
Principal
Amount | | | Interest
Rate | | | Maturity
Date | | | Value | |
| | | | | | | | | | | | | | |
| Mortgage-Backed Obligations – (continued) | |
| Adjustable Rate Non-Agency(b) – (continued) | |
| Downey Savings & Loan Association Mortgage Trust
Series 2005-AR5, Class 2A1A |
|
| $ | 12,127,685 | | | | 0.486 | % | | | 09/19/45 | | | $ | 8,918,700 | |
| Eurosail Prime-UK PLC Series 2007-PR1X, Class A1 | |
| GBP | 18,759,034 | | | | 0.952 | | | | 09/13/45 | | | | 29,292,779 | |
| GreenPoint Mortgage Funding Trust Series 2006-OH1, Class A1 | |
| $ | 2,006,794 | | | | 0.335 | | | | 01/25/37 | | | | 1,476,198 | |
| HarborView Mortgage Loan Trust Series 2006-11, Class A1A | |
| | 8,038,883 | | | | 0.326 | | | | 12/19/36 | | | | 5,643,700 | |
| HarborView Mortgage Loan Trust Series 2006-7, Class 2A1A | |
| | 2,336,694 | | | | 0.356 | | | | 09/19/46 | | | | 1,843,885 | |
| Impac Secured Assets Trust Series 2006-5, Class 1A1B | |
| | 28,141,305 | | | | 0.355 | | | | 02/25/37 | | | | 20,734,215 | |
| Indymac Index Mortgage Loan Trust Series 2005-AR10,
Class A1 |
|
| | 6,769,575 | | | | 0.415 | | | | 06/25/35 | | | | 5,934,886 | |
| Indymac Index Mortgage Loan Trust Series 2005-AR13,
Class 4A1 |
|
| | 1,276,560 | | | | 2.401 | | | | 08/25/35 | | | | 1,090,759 | |
| Indymac Index Mortgage Loan Trust Series 2005-AR23,
Class 6A1 |
|
| | 5,120,388 | | | | 4.427 | | | | 11/25/35 | | | | 4,380,815 | |
| Indymac Index Mortgage Loan Trust Series 2006-AR41,
Class A3 |
|
| | 9,109,117 | | | | 0.335 | | | | 02/25/37 | | | | 6,384,024 | |
| Indymac Index Mortgage Loan Trust Series 2007-AR1,
Class 1A1 |
|
| | 8,924,134 | | | | 2.822 | | | | 03/25/37 | | | | 8,149,411 | |
| Indymac Index Mortgage Loan Trust Series 2007-FLX4,
Class 2A1 |
|
| | 9,291,011 | | | | 0.335 | | | | 07/25/37 | | | | 7,888,997 | |
| JPMorgan Alternative Loan Trust Series 2006-A2, Class 2A2 | |
| | 9,250,841 | | | | 2.677 | | | | 05/25/36 | | | | 7,299,314 | |
| JPMorgan Alternative Loan Trust Series 2006-A5, Class 1A1 | |
| | 8,573,750 | | | | 0.315 | | | | 10/25/36 | | | | 7,027,041 | |
| Leek Finance Number Eighteen PLC Series 2018X, Class A2C | |
| EUR | 10,531,990 | | | | 0.472 | | | | 09/21/38 | | | | 13,892,637 | |
| Lehman XS Trust Series 2005-5N, Class 1A1 | |
| $ | 23,978,059 | | | | 0.455 | | | | 11/25/35 | | | | 20,697,860 | |
| Lehman XS Trust Series 2005-5N, Class 3A1A | |
| | 1,494,017 | | | | 0.455 | | | | 11/25/35 | | | | 1,291,876 | |
| Lehman XS Trust Series 2005-7N, Class 1A1A | |
| | 12,453,786 | | | | 0.425 | | | | 12/25/35 | | | | 11,020,355 | |
| Lehman XS Trust Series 2005-9N, Class 1A1 | |
| | 5,837,548 | | | | 0.425 | | | | 02/25/36 | | | | 4,901,205 | |
| Lehman XS Trust Series 2006-GP1, Class A2A | |
| | 675,110 | | | | 0.325 | | | | 05/25/46 | | | | 660,325 | |
| Lehman XS Trust Series 2007-12N, Class 2A1 | |
| | 5,453,835 | | | | 0.335 | | | | 07/25/37 | | | | 3,757,692 | |
| Lehman XS Trust Series 2007-15N, Class 4A1 | |
| | 11,040,559 | | | | 1.055 | | | | 08/25/47 | | | | 7,899,520 | |
| Lehman XS Trust Series 2007-16N, Class 2A2 | |
| | 14,706,520 | | | | 1.005 | | | | 09/25/47 | | | | 12,471,129 | |
| Lehman XS Trust Series 2007-4N, Class 3A2A | |
| | 6,857,799 | | | | 0.906 | | | | 03/25/47 | | | | 5,844,902 | |
| | |
Principal
Amount | | | Interest
Rate | | | Maturity
Date | | | Value | |
| | | | | | | | | | | | | | |
| Mortgage-Backed Obligations – (continued) | |
| Adjustable Rate Non-Agency(b) – (continued) | |
| Lehman XS Trust Series 2007-5H, Class 3A4 | |
| 9,744,765 | | | | 2.896 | | | | 05/25/37 | | | | 6,338,282 | |
| Luminent Mortgage Trust Series 2007-2, Class 2A1 | |
| | 2,326,703 | | | | 0.385 | | | | 05/25/37 | | | | 1,612,173 | |
| Master Adjustable Rate Mortgages Trust Series 2006-OA2,
Class 1A1 |
|
| | 11,795,034 | | | | 0.918 | | | | 12/25/46 | | | | 8,637,503 | |
| Master Adjustable Rate Mortgages Trust Series 2006-OA2,
Class 4A1A |
|
| | 4,675,580 | | | | 0.968 | | | | 12/25/46 | | | | 3,585,702 | |
| Master Adjustable Rate Mortgages Trust Series 2007-2, Class A1 | |
| | 5,383,399 | | | | 0.305 | | | | 03/25/47 | | | | 4,610,540 | |
| Master Adjustable Rate Mortgages Trust Series 2007-3,
Class 12A1 |
|
| | 2,056,699 | | | | 0.355 | | | | 05/25/47 | | | | 1,579,545 | |
| Master Adjustable Rate Mortgages Trust Series 2007-HF2,
Class A1 |
|
| | 9,190,821 | | | | 0.465 | | | | 09/25/37 | | | | 8,147,797 | |
| Morgan Stanley Mortgage Loan Trust Series 2005-6AR,
Class 1A3 |
|
| | 1,241,280 | | | | 0.565 | | | | 11/25/35 | | | | 1,094,153 | |
| Nomura Asset Acceptance Corp. Alternative Loan Trust
Series 2006-AR4, Class A4A |
|
| | 3,270,887 | | | | 0.395 | | | | 12/25/36 | | | | 2,324,828 | |
| Residential Accredit Loans, Inc. Series 2005-Q05, Class A1 | |
| | 7,093,449 | | | | 1.118 | | | | 01/25/46 | | | | 5,361,938 | |
| Residential Accredit Loans, Inc. Series 2005-QA12, Class CB3 | |
| | 8,957,117 | | | | 3.533 | | | | 12/25/35 | | | | 7,357,042 | |
| Residential Accredit Loans, Inc. Series 2006-QA10, Class A1 | |
| | 6,860,940 | | | | 0.340 | | | | 12/25/36 | | | | 5,145,426 | |
| Residential Accredit Loans, Inc. Series 2006-QA2, Class 2A1 | |
| | 5,756,463 | | | | 3.564 | | | | 02/25/36 | | | | 4,249,204 | |
| Residential Accredit Loans, Inc. Series 2006-QO1, Class 3A1 | |
| | 3,742,873 | | | | 0.425 | | | | 02/25/46 | | | | 2,527,562 | |
| Residential Accredit Loans, Inc. Series 2006-QO7, Class 1A1 | |
| | 7,757,310 | | | | 0.918 | | | | 09/25/46 | | | | 5,269,541 | |
| Residential Accredit Loans, Inc. Series 2007-QA4, Class A1A | |
| | 7,259,235 | | | | 0.305 | | | | 06/25/37 | | | | 5,270,813 | |
| Residential Accredit Loans, Inc. Series 2007-QH9, Class A1 | |
| | 16,301,918 | | | | 1.410 | | | | 11/25/37 | | | | 10,084,367 | |
| Residential Accredit Loans, Inc. Series 2007-QO4, Class A1A | |
| | 1,891,269 | | | | 0.345 | | | | 05/25/47 | | | | 1,533,252 | |
| Residential Accredit Loans, Inc. Series 2007-QS8, Class A3 | |
| | 3,455,566 | | | | 0.755 | | | | 06/25/37 | | | | 2,210,581 | |
| Residential Funding Mortgage Securities I Series 2005-SA4,
Class 2A1 |
|
| | 7,850,930 | | | | 2.822 | | | | 09/25/35 | | | | 6,960,032 | |
| Residential Funding Mortgage Securities I Series 2005-SA5,
Class 2A |
|
| | 4,278,189 | | | | 3.066 | | | | 11/25/35 | | | | 3,865,614 | |
| Structured Adjustable Rate Mortgage Loan Trust Series 2006-11,
Class 1A1 |
|
| | 7,206,244 | | | | 0.315 | | | | 12/25/36 | | | | 5,930,115 | |
| Structured Adjustable Rate Mortgage Loan Trust Series 2006-9,
Class 3A1 |
|
| | 4,792,175 | | | | 4.628 | | | | 10/25/36 | | | | 3,654,145 | |
| | |
| | |
| The accompanying notes are an integral part of these financial statements. | | 81 |
GOLDMAN SACHS STRATEGIC INCOME FUND
Schedule of Investments (continued)
September 30, 2014 (Unaudited)
| | | | | | | | | | | | | | |
Principal
Amount | | | Interest
Rate | | | Maturity
Date | | | Value | |
| | | | | | | | | | | | | | |
| Mortgage-Backed Obligations – (continued) | |
| Adjustable Rate Non-Agency(b) – (continued) | |
| Structured Adjustable Rate Mortgage Loan Trust Series 2007-11,
Class 1A1 |
|
| $ | 9,816,936 | | | | 1.305 | % | | | 12/25/37 | | | $ | 6,751,851 | |
| Structured Asset Mortgage Investments II Trust Series 2005-AR8,
Class A1B |
|
| | 3,501,615 | | | | 0.325 | | | | 02/25/36 | | | | 2,753,670 | |
| Structured Asset Mortgage Investments II Trust Series 2006-AR3,
Class 21A1 |
|
| | 5,224,337 | | | | 0.555 | | | | 02/25/36 | | | | 4,051,452 | |
| Structured Asset Mortgage Investments II Trust Series 2006-AR5,
Class 1A1 |
|
| | 7,681,142 | | | | 0.365 | | | | 05/25/46 | | | | 5,720,147 | |
| Structured Asset Mortgage Investments II Trust Series 2007-AR4,
Class A4A |
|
| | 7,837,439 | | | | 0.335 | | | | 09/25/47 | | | | 6,622,636 | |
| Structured Asset Mortgage Investments II Trust Series 2007-AR7,
Class 3A1 |
|
| | 19,130,383 | | | | 6.500 | | | | 05/25/47 | | | | 13,138,747 | |
| Structured Asset Mortgage Investments Trust, Inc.
Series 2005-AR7, Class 5A1 |
|
| | 1,720,298 | | | | 1.578 | | | | 03/25/46 | | | | 1,456,404 | |
| Structured Asset Mortgage Investments Trust, Inc.
Series 2006-AR6, Class 1A3 |
|
| | 592,200 | | | | 0.345 | | | | 07/25/46 | | | | 384,752 | |
| Structured Asset Mortgage Investments Trust, Inc.
Series 2006-AR7, Class A1A |
|
| | 670,205 | | | | 0.365 | | | | 08/25/36 | | | | 534,556 | |
| Structured Asset Mortgage Investments Trust, Inc.
Series 2007-AR6, Class A1 |
|
| | 14,793,232 | | | | 1.618 | | | | 08/25/47 | | | | 12,704,428 | |
| Structured Asset Mortgage Investments Trust, Inc.
Series 2007-AR7, Class 1A1 |
|
| | 1,945,702 | | | | 1.005 | | | | 05/25/47 | | | | 1,395,263 | |
| Washington Mutual Alternative Mortgage Pass-Through
Certificates Series 2005-4, Class CB1 |
|
| | 123,644 | | | | 0.605 | | | | 06/25/35 | | | | 96,761 | |
| Washington Mutual Alternative Mortgage Pass-Through
Certificates Series 2006-AR4, Class DA |
|
| | 3,468,344 | | | | 1.088 | | | | 06/25/46 | | | | 2,078,925 | |
| Washington Mutual Alternative Mortgage Pass-Through
Certificates Series 2007-OA3, Class 2A |
|
| | 3,985,610 | | | | 0.868 | | | | 02/25/47 | | | | 2,797,500 | |
| Washington Mutual Alternative Mortgage Pass-Through
Certificates Series 2007-OA6, Class 2A |
|
| | 6,853,692 | | | | 1.875 | | | | 07/25/47 | | | | 5,077,215 | |
| Washington Mutual Mortgage Pass-Through Certificates
Series 2005-AR1, Class A2A1 |
|
| | 11,281,072 | | | | 0.495 | | | | 01/25/45 | | | | 10,638,051 | |
| Washington Mutual Mortgage Pass-Through Certificates
Series 2005-AR19, Class A1A1 |
|
| | 662,371 | | | | 0.425 | | | | 12/25/45 | | | | 622,762 | |
| Washington Mutual Mortgage Pass-Through Certificates
Series 2005-AR2, Class 2A21 |
|
| | 4,315,802 | | | | 0.485 | | | | 01/25/45 | | | | 4,068,939 | |
| Washington Mutual Mortgage Pass-Through Certificates
Series 2005-AR8, Class 1A1A |
|
| | 409,135 | | | | 0.425 | | | | 07/25/45 | | | | 385,364 | |
| | |
Principal
Amount | | | Interest
Rate | | | Maturity
Date | | | Value | |
| | | | | | | | | | | | | | |
| Mortgage-Backed Obligations – (continued) | |
| Adjustable Rate Non-Agency(b) – (continued) | |
| Washington Mutual Mortgage Pass-Through Certificates
Series 2005-AR8, Class 2A1A |
|
| $ | 1,511,761 | | | | 0.445 | % | | | 07/25/45 | | | $ | 1,431,637 | |
| Washington Mutual Mortgage Pass-Through Certificates
Series 2005-AR9, Class A1A |
|
| | 5,537,200 | | | | 0.475 | | | | 07/25/45 | | | | 5,263,108 | |
| Washington Mutual Mortgage Pass-Through Certificates
Series 2006-AR11, Class 1A |
|
| | 4,938,274 | | | | 1.078 | | | | 09/25/46 | | | | 4,267,656 | |
| Washington Mutual Mortgage Pass-Through Certificates
Series 2006-AR13, Class 1A |
|
| | 8,559,030 | | | | 0.998 | | | | 10/25/46 | | | | 7,004,710 | |
| Washington Mutual Mortgage Pass-Through Certificates
Series 2006-AR19, Class 1A |
|
| | 11,461,995 | | | | 0.858 | | | | 01/25/47 | | | | 9,220,029 | |
| Washington Mutual Mortgage Pass-Through Certificates
Series 2006-AR2, Class A1A |
|
| | 11,939,346 | | | | 1.058 | | | | 04/25/46 | | | | 9,475,065 | |
| Washington Mutual Mortgage Pass-Through Certificates
Series 2007-0A1, Class A1A |
|
| | 6,421,956 | | | | 0.818 | | | | 02/25/47 | | | | 5,197,289 | |
| Washington Mutual Mortgage Pass-Through Certificates
Series 2007-OA2, Class 2A |
|
| | 9,035,082 | | | | 0.818 | | | | 01/25/47 | | | | 6,365,215 | |
| Washington Mutual Mortgage Pass-Through Certificates
Series 2007-OA4, Class A1A |
|
| | 7,352,702 | | | | 0.878 | | | | 04/25/47 | | | | 5,666,727 | |
| Wells Fargo Alternative Loan Trust Series 2007-PA2, Class 2A1 | |
| | 8,168,162 | | | | 0.585 | | | | 06/25/37 | | | | 6,103,655 | |
| | |
| TOTAL ADJUSTABLE RATE
NON-AGENCY |
| | $ | 816,166,882 | |
| | |
| | Collateralized Mortgage Obligations – 2.0% | |
| | Interest Only(e) – 0.1% | |
| GNMA REMIC Series 2013-182, Class PI | |
| $ | 65,755,852 | | | | 4.500 | % | | | 12/20/43 | | | $ | 14,622,490 | |
| | |
| | Inverse Floaters(b) – 1.1% | |
| FHLMC REMIC Series 3753, Class SK | |
| | 34,570,160 | | | | 5.896 | | | | 11/15/38 | | | | 4,992,854 | |
| FHLMC REMIC Series 4273, Class PS | |
| | 91,393,586 | | | | 5.946 | | | | 11/15/43 | | | | 13,480,791 | |
| FNMA REMIC Series 2010-126, Class LS | |
| | 7,460,770 | | | | 4.846 | | | | 11/25/40 | | | | 1,368,728 | |
| FNMA REMIC Series 2014-18, Class CS | |
| | 30,783,360 | | | | 5.946 | | | | 04/25/44 | | | | 4,851,725 | |
| GNMA REMIC Series 2010-1, Class SD | |
| | 17,780,940 | | | | 5.637 | | | | 01/20/40 | | | | 2,675,057 | |
| GNMA REMIC Series 2010-162, Class SE | |
| | 49,740,816 | | | | 6.397 | | | | 12/20/40 | | | | 7,891,838 | |
| GNMA REMIC Series 2010-20, Class SD | |
| | 23,453,335 | | | | 5.527 | | | | 02/20/40 | | | | 3,734,158 | |
| GNMA REMIC Series 2010-20, Class SE | |
| | 41,613,255 | | | | 6.097 | | | | 02/20/40 | | | | 7,530,414 | |
| GNMA REMIC Series 2010-35, Class DS | |
| | 63,973,687 | | | | 5.527 | | | | 03/20/40 | | | | 10,187,771 | |
| GNMA REMIC Series 2010-37, Class SG | |
| | 56,244,872 | | | | 5.547 | | | | 03/20/40 | | | | 8,953,520 | |
| | |
| | |
| 82 | | The accompanying notes are an integral part of these financial statements. |
GOLDMAN SACHS STRATEGIC INCOME FUND
| | | | | | | | | | | | | | |
Principal
Amount | | | Interest
Rate | | | Maturity
Date | | | Value | |
| | | | | | | | | | | | | | |
| Mortgage-Backed Obligations – (continued) | |
| Inverse Floaters(b) – (continued) | |
| GNMA REMIC Series 2010-85, Class SN | |
| $ | 30,214,228 | | | | 5.787 | % | | | 07/20/40 | | | $ | 5,654,318 | |
| GNMA REMIC Series 2010-9, Class XD | |
| | 163,008,924 | | | | 6.446 | | | | 01/16/40 | | | | 31,742,793 | |
| GNMA REMIC Series 2010-9, Class YD | |
| | 88,836,223 | | | | 6.646 | | | | 01/16/40 | | | | 18,112,267 | |
| GNMA REMIC Series 2010-90, Class ES | |
| | 52,732,760 | | | | 5.797 | | | | 07/20/40 | | | | 8,692,964 | |
| GNMA REMIC Series 2011-25, Class SA | |
| | 42,581,647 | | | | 5.947 | | | | 10/20/40 | | | | 6,513,604 | |
| GNMA REMIC Series 2012-149, Class LS | |
| | 43,964,375 | | | | 6.097 | | | | 12/20/42 | | | | 7,766,716 | |
| GNMA REMIC Series 2013-113, Class SA | |
| | 84,156,800 | | | | 6.547 | | | | 08/20/43 | | | | 16,389,453 | |
| GNMA REMIC Series 2013-113, Class SD | |
| | 143,405,577 | | | | 6.546 | | | | 08/16/43 | | | | 23,015,018 | |
| GNMA REMIC Series 2013-117, Class PS | |
| | 40,602,993 | | | | 5.997 | | | | 04/20/43 | | | | 7,319,814 | |
| GNMA REMIC Series 2013-147, Class AS | |
| | 23,880,946 | | | | 5.997 | | | | 10/20/43 | | | | 4,095,649 | |
| GNMA REMIC Series 2013-147, Class SD | |
| | 62,562,432 | | | | 6.497 | | | | 12/20/39 | | | | 12,042,355 | |
| GNMA REMIC Series 2013-148, Class SA | |
| | 110,286,499 | | | | 6.047 | | | | 10/20/43 | | | | 19,072,385 | |
| GNMA REMIC Series 2013-167, Class SG | |
| | 41,811,216 | | | | 5.997 | | | | 11/20/43 | | | | 7,291,638 | |
| GNMA REMIC Series 2013-169, Class SE | |
| | 69,118,460 | | | | 5.896 | | | | 11/16/43 | | | | 11,877,959 | |
| GNMA REMIC Series 2014-133, Class BS | |
| | 64,000,000 | | | | 5.445 | | | | 09/20/44 | | | | 9,624,550 | |
| GNMA REMIC Series 2014-3, Class TS | |
| | 22,171,590 | | | | 5.397 | | | | 01/20/44 | | | | 3,259,093 | |
| GNMA REMIC Series 2014-5, Class SA | |
| | 70,257,085 | | | | 5.397 | | | | 01/20/44 | | | | 10,893,333 | |
| GNMA REMIC Series 2014-56, Class ST | |
| | 58,287,057 | | | | 5.946 | | | | 12/16/39 | | | | 10,109,808 | |
| GNMA REMIC Series 2014-76, Class SA | |
| | 70,190,216 | | | | 5.447 | | | | 01/20/40 | | | | 11,077,118 | |
| GNMA REMIC Series 2014-96, Class SE | |
| | 38,667,002 | | | | 5.447 | | | | 07/20/44 | | | | 5,877,597 | |
| | | | | | | | | | | | | | |
| | | | | | | | | | | | | 296,095,288 | |
| | |
| | Planned Amortization Class(b) – 0.0% | |
| GNMA REMIC Series 2011-50, Class PS | |
| | 59,004,875 | | | | 5.947 | | | | 02/20/41 | | | | 9,820,807 | |
| | |
| | Regular Floater(b) – 0.4% | |
| Countrywide Alternative Loan Trust Series 2005-26CB, Class A1 | |
| | 1,277,215 | | | | 0.655 | | | | 07/25/35 | | | | 1,033,388 | |
| Countrywide Alternative Loan Trust Series 2005-36, Class 2A1A | |
| | 10,143,646 | | | | 0.465 | | | | 08/25/35 | | | | 7,722,358 | |
| Countrywide Alternative Loan Trust Series 2005-64CB,
Class 1A12 |
|
| | 1,630,670 | | | | 0.955 | | | | 12/25/35 | | | | 1,360,458 | |
| Countrywide Alternative Loan Trust Series 2005-77T1,
Class 1A3 |
|
| | 5,457,063 | | | | 0.555 | | | | 02/25/36 | | | | 3,978,882 | |
| | |
Principal
Amount | | | Interest
Rate | | | Maturity
Date | | | Value | |
| | | | | | | | | | | | | | |
| Mortgage-Backed Obligations – (continued) | |
| Regular Floater(b) – (continued) | |
| FHLMC REMIC Series 3231, Class FB | |
| 1,188,308 | | | | 0.504 | | | | 10/15/36 | | | | 1,189,183 | |
| FHLMC REMIC Series 3314, Class FC | |
| | 841,051 | | | | 0.554 | | | | 12/15/36 | | | | 844,011 | |
| FHLMC REMIC Series 3371, Class FA | |
| | 976,652 | | | | 0.754 | | | | 09/15/37 | | | | 987,498 | |
| FHLMC REMIC Series 3545, Class FA | |
| | 1,829,925 | | | | 1.004 | | | | 06/15/39 | | | | 1,856,442 | |
| FHLMC REMIC Series 3827, Class KF | |
| | 1,492,575 | | | | 0.524 | | | | 03/15/41 | | | | 1,497,227 | |
| FNMA Connecticut Avenue Securities Series 2014-C03,
Class 1M1 |
|
| | 25,927,347 | | | | 1.355 | | | | 07/25/24 | | | | 25,718,162 | |
| FNMA REMIC Series 2006-45, Class TF | |
| | 2,010,663 | | | | 0.555 | | | | 06/25/36 | | | | 2,015,923 | |
| FNMA REMIC Series 2006-76, Class QF | |
| | 2,105,399 | | | | 0.555 | | | | 08/25/36 | | | | 2,114,999 | |
| FNMA REMIC Series 2006-79, Class PF | |
| | 2,151,512 | | | | 0.555 | | | | 08/25/36 | | | | 2,161,167 | |
| FNMA REMIC Series 2007-33, Class HF | |
| | 2,857,976 | | | | 0.505 | | | | 04/25/37 | | | | 2,870,879 | |
| FNMA REMIC Series 2007-75, Class VF | |
| | 763,377 | | | | 0.605 | | | | 08/25/37 | | | | 766,328 | |
| FNMA REMIC Series 2009-84, Class WF | |
| | 614,615 | | | | 1.255 | | | | 10/25/39 | | | | 628,269 | |
| Granite Mortgages PLC Series 2004-3, Class 3A1 | |
| GBP | 1,652,940 | | | | 0.926 | | | | 09/20/44 | | | | 2,675,377 | |
| Quadrivio Finance Series 2011-1, Class A1 | |
| EUR | 26,648,839 | | | | 0.708 | | | | 07/25/60 | | | | 33,620,932 | |
| Residential Accredit Loans, Inc. Series 2005-QS10, Class 3A1 | |
| $ | 1,001,950 | | | | 0.655 | | | | 08/25/35 | | | | 765,953 | |
| Sequoia Mortgage Trust Series 2007-3, Class 2AA1 | |
| | 5,803,036 | | | | 2.517 | | | | 07/20/37 | | | | 4,769,846 | |
| | | | | | | | | | | | | | |
| | | | | | | | | | | | | 98,577,282 | |
| | |
| | Sequential Fixed Rate – 0.4% | |
| Banc of America Funding Corp. Series 2007-8, Class 2A1 | |
| | 2,836,725 | | | | 7.000 | | | | 10/25/37 | | | | 1,769,507 | |
| BCAP LLC Trust Series 2007-AA2, Class 2A7 | |
| | 2,585,112 | | | | 6.000 | | | | 04/25/37 | | | | 2,225,813 | |
| CHL Mortgage Pass-Through Trust Series 2007-10, Class A22 | |
| | 5,911,095 | | | | 6.000 | | | | 07/25/37 | | | | 5,357,383 | |
| CHL Mortgage Pass-Through Trust Series 2007-10, Class A5 | |
| | 3,145,031 | | | | 6.000 | | | | 07/25/37 | | | | 2,850,425 | |
| Citicorp Mortgage Securities, Inc. Series 2007-4, Class 2A1 | |
| | 215,042 | | | | 5.500 | | | | 05/25/22 | | | | 216,654 | |
| Citigroup Mortgage Loan Trust Series 2007-9, Class 1A1(c) | |
| | 10,684,634 | | | | 5.750 | | | | 04/25/47 | | | | 8,863,510 | |
| CitiMortgage Alternative Loan Trust Series 2006-A3, Class 1A13 | |
| | 4,830,398 | | | | 6.000 | | | | 07/25/36 | | | | 4,297,058 | |
| CitiMortgage Alternative Loan Trust Series 2007-A1, Class 1A7 | |
| | 1,773,685 | | | | 6.000 | | | | 01/25/37 | | | | 1,471,538 | |
| CitiMortgage Alternative Loan Trust Series 2007-A3, Class 1A7 | |
| | 9,817,478 | | | | 5.750 | | | | 03/25/37 | | | | 8,374,478 | |
| Countrywide Alternative Loan Trust Series 2005-77T1,
Class 1A2 |
|
| | 3,744,642 | | | | 6.000 | | | | 02/25/36 | | | | 3,206,744 | |
| | |
| | |
| The accompanying notes are an integral part of these financial statements. | | 83 |
GOLDMAN SACHS STRATEGIC INCOME FUND
Schedule of Investments (continued)
September 30, 2014 (Unaudited)
| | | | | | | | | | | | | | |
Principal
Amount | | | Interest
Rate | | | Maturity
Date | | | Value | |
| | | | | | | | | | | | | | |
| Mortgage-Backed Obligations – (continued) | |
| Sequential Fixed Rate – (continued) | |
| Countrywide Alternative Loan Trust Series 2007-06, Class A4 | |
| $ | 4,070,827 | | | | 5.750 | % | | | 04/25/47 | | | $ | 3,405,475 | |
| Countrywide Alternative Loan Trust Series 2007-15CB, Class A5 | |
| | 1,665,979 | | | | 5.750 | | | | 07/25/37 | | | | 1,496,314 | |
| Countrywide Alternative Loan Trust Series 2007-18CB,
Class 2A25 |
|
| | 698,157 | | | | 6.000 | | | | 08/25/37 | | | | 633,030 | |
| Countrywide Home Loans Mortgage Pass-Through Trust
Series 2007-1, Class A4 |
|
| | 2,104,500 | | | | 6.000 | | | | 03/25/37 | | | | 1,909,946 | |
| Countrywide Home Loans Mortgage Pass-Through Trust
Series 2007-7, Class A3 |
|
| | 4,285,982 | | | | 5.750 | | | | 06/25/37 | | | | 3,913,242 | |
| JPMorgan Alternative Loan Trust Series 2008-R2, Class A1(c) | |
| | 12,014,043 | | | | 6.000 | | | | 11/25/36 | | | | 10,519,768 | |
| Morgan Stanley Mortgage Loan Trust Series 2005-4, Class 1A | |
| | 1,402,834 | | | | 5.000 | | | | 08/25/35 | | | | 1,397,978 | |
| Residential Accredit Loans, Inc. Series 2006-QS2, Class 1A9 | |
| | 993,314 | | | | 5.500 | | | | 02/25/36 | | | | 838,798 | |
| Residential Accredit Loans, Inc. Series 2006-QS4, Class A9 | |
| | 5,252,873 | | | | 6.000 | | | | 04/25/36 | | | | 4,519,317 | |
| Residential Accredit Loans, Inc. Series 2006-QS6, Class 1A13 | |
| | 1,707,149 | | | | 6.000 | | | | 06/25/36 | | | | 1,336,613 | |
| Residential Accredit Loans, Inc. Series 2006-QS8, Class A3 | |
| | 3,084,628 | | | | 6.000 | | | | 08/25/36 | | | | 2,474,789 | |
| Residential Accredit Loans, Inc. Series 2006-QS9, Class 1A11 | |
| | 2,906,421 | | | | 6.500 | | | | 07/25/36 | | | | 2,361,440 | |
| Residential Accredit Loans, Inc. Series 2007-QS1, Class 2A5 | |
| | 3,330,335 | | | | 6.000 | | | | 01/25/37 | | | | 2,732,883 | |
| Residential Asset Securitization Trust Series 2005-A11CB,
Class 2A1 |
|
| | 12,096,231 | | | | 4.850 | | | | 10/25/35 | | | | 8,563,436 | |
| Residential Asset Securitization Trust Series 2006-A15,
Class A13 |
|
| | 8,861,837 | | | | 6.250 | | | | 01/25/37 | | | | 6,762,192 | |
| Residential Asset Securitization Trust Series 2006-A8, Class 1A1 | |
| | 2,195,494 | | | | 6.000 | | | | 08/25/36 | | | | 1,993,514 | |
| Residential Asset Securitization Trust Series 2006-A8, Class 2A3 | |
| | 8,166,019 | | | | 6.000 | | | | 08/25/36 | | | | 5,168,214 | |
| Residential Funding Mortgage Securities I Series 2007-S9,
Class 1A1 |
|
| | 7,462,708 | | | | 6.000 | | | | 10/25/37 | | | | 6,448,869 | |
| Wells Fargo Mortgage Backed Securities Trust Series 2007-11,
Class A85 |
|
| | 2,031,261 | | | | 6.000 | | | | 08/25/37 | | | | 2,021,678 | |
| | | | | | | | | | | | | | |
| | | | | | | | | | | | | 107,130,606 | |
| | |
| | Sequential Floating Rate(b) – 0.0% | |
| Banc of America Funding Corp. Series 2007-2, Class 2A1 | |
| | 139,412 | | | | 5.414 | | | | 03/25/37 | | | | 138,261 | |
| Countrywide Alternative Loan Trust Series 2007-16CB,
Class 4A3 |
|
| | 8,405,144 | | | | 0.655 | | | | 08/25/37 | | | | 6,398,797 | |
| | |
Principal
Amount | | | Interest
Rate | | | Maturity
Date | | | Value | |
| | | | | | | | | | | | | | |
| Mortgage-Backed Obligations – (continued) | |
| Sequential Floating Rate(b) – (continued) | |
| Washington Mutual Alternative Mortgage Pass-Through
Certificates Series 2006-AR10, Class A1 |
|
| 1,303,085 | | | | 0.255 | | | | 12/25/36 | | | | 859,200 | |
| | | | | | | | | | | | | | |
| | | | | | | | | | | | | 7,396,258 | |
| | |
| TOTAL COLLATERALIZED
MORTGAGE OBLIGATIONS |
| | $ | 533,642,731 | |
| | |
| | Commercial Mortgage-Backed Securities – 6.1% | |
| | Sequential Fixed Rate – 2.4% | |
| Credit Suisse Commercial Mortgage Trust Series 2007-C1,
Class A1A |
|
| $ | 125,587,575 | | | | 5.361 | % | | | 02/15/40 | | | $ | 133,406,406 | |
| CSMC Trust Series 2014-USA, Class E(c) | |
| | 33,100,000 | | | | 4.373 | | | | 09/15/37 | | | | 29,948,705 | |
| FHLMC Multifamily Structured Pass-Through Certificates
Series K030, Class A1 |
|
| | 23,143,493 | | | | 2.779 | | | | 09/25/22 | | | | 23,732,902 | |
| FHLMC Multifamily Structured Pass-Through Certificates
Series K037, Class A2 |
|
| | 272,500,000 | | | | 3.490 | | | | 01/25/24 | | | | 283,983,204 | |
| FHLMC Multifamily Structured Pass-Through Certificates
Series K038, Class A2 |
|
| | 24,500,000 | | | | 3.389 | | | | 03/25/24 | | | | 25,303,634 | |
| Morgan Stanley Bank of America Merrill Lynch Trust
Series 2013-C9, Class A4 |
|
| | 4,500,000 | | | | 3.102 | | | | 05/15/46 | | | | 4,426,433 | |
| Wachovia Bank Commercial Mortgage Trust Series 2006-C28,
ClassA1A |
|
| | 97,398,827 | | | | 5.559 | | | | 10/15/48 | | | | 104,686,110 | |
| WF-RBS Commercial Mortgage Trust Series 2012-C6 Class B | |
| | 2,500,000 | | | | 4.697 | | | | 04/15/45 | | | | 2,650,803 | |
| | | | | | | | | | | | | | |
| | | | | | | | | | | | | 608,138,197 | |
| | |
| | Sequential Floating Rate(b) – 3.7% | |
| Citigroup Commercial Mortgage Trust Series 2014-388G,
Class E(c) |
|
| | 27,996,000 | | | | 2.504 | | | | 06/15/33 | | | | 28,009,886 | |
| Commercial Mortgage Pass Through Certificates
Series 2014-KYO, Class F(c) |
|
| | 14,494,000 | | | | 3.654 | | | | 06/11/27 | | | | 14,458,055 | |
| Credit Suisse Commercial Mortgage Trust Series 2007-C2,
Class A1A |
|
| | 162,895,050 | | | | 5.526 | | | | 01/15/49 | | | | 174,043,914 | |
| Credit Suisse Commercial Mortgage Trust Series 2007-C3,
Class A1A1 |
|
| | 78,117,707 | | | | 5.892 | | | | 06/15/39 | | | | 84,363,998 | |
| FHLMC Multifamily Structured Pass-Through Certificates
Series K029, Class A2 |
|
| | 83,200,000 | | | | 3.320 | | | | 02/25/23 | | | | 85,982,782 | |
| FHLMC Multifamily Structured Pass-Through Certificates
Series K030, Class A2 |
|
| | 160,500,000 | | | | 3.250 | | | | 04/25/23 | | | | 165,115,932 | |
| FHLMC Multifamily Structured Pass-Through Certificates
Series K031, Class A2 |
|
| | 125,900,000 | | | | 3.300 | | | | 04/25/23 | | | | 129,711,534 | |
| | |
| | |
| 84 | | The accompanying notes are an integral part of these financial statements. |
GOLDMAN SACHS STRATEGIC INCOME FUND
| | | | | | | | | | | | | | |
Principal
Amount | | | Interest
Rate | | | Maturity
Date | | | Value | |
| | | | | | | | | | | | | | |
| Mortgage-Backed Obligations – (continued) | |
| Sequential Floating Rate(b) – (continued) | |
| FHLMC Multifamily Structured Pass-Through Certificates
Series K033, Class A2 |
|
| $ | 169,200,000 | | | | 3.060 | % | | | 07/25/23 | | | $ | 171,083,078 | |
| GRACE Mortgage Trust Series 2014-GRCE, Class F(c) | |
| | 26,250,000 | | | | 3.590 | | | | 06/10/28 | | | | 24,392,322 | |
| GS Mortgage Securities Trust Series 2007-GG10, Class A1A | |
| | 30,119,564 | | | | 5.797 | | | | 08/10/45 | | | | 33,133,669 | |
| Hilton Mortgage Trust Series 2014-ORL, Class E(c) | |
| | 17,950,000 | | | | 3.406 | | | | 07/15/29 | | | | 17,971,355 | |
| JPMorgan Chase Commercial Mortgage Securities Trust
Series 2014-FBLU, Class D(c) |
|
| | 10,200,000 | | | | 2.754 | | | | 12/15/28 | | | | 10,219,146 | |
| Morgan Stanley Capital I Trust Series 2007-HQ11, Class AM | |
| | 1,450,000 | | | | 5.478 | | | | 02/12/44 | | | | 1,560,009 | |
| Morgan Stanley Capital I Trust Series 2007-HQ13, Class AM | |
| | 1,200,000 | | | | 5.931 | | | | 12/15/44 | | | | 1,161,965 | |
| Morgan Stanley Capital I Trust Series 2014-CPT, Class F(c) | |
| | 25,245,000 | | | | 3.560 | | | | 07/13/29 | | | | 23,843,852 | |
| | | | | | | | | | | | | | |
| | | | | | | | | | | | | 965,051,497 | |
| | |
| TOTAL COMMERCIAL
MORTGAGE-BACKED SECURITIES |
| | $ | 1,573,189,694 | |
| | |
| | Federal Agencies – 3.0% | |
| | Adjustable Rate FNMA(b) – 0.0% | |
| $ | 2,131,805 | | | | 2.425 | % | | | 05/01/33 | | | $ | 2,271,506 | |
| | 1,092,320 | | | | 1.959 | | | | 10/01/34 | | | | 1,143,767 | |
| | 2,588,425 | | | | 1.915 | | | | 01/01/35 | | | | 2,737,429 | |
| | 2,001,517 | | | | 2.586 | | | | 09/01/35 | | | | 2,145,366 | |
| | 864,984 | | | | 2.411 | | | | 10/01/36 | | | | 921,785 | |
| | | | | | | | | | | | | | |
| | | | | | | | | | | | | 9,219,853 | |
| | |
| | FHLMC – 0.0% | |
| | 24,195 | | | | 5.000 | | | | 01/01/33 | | | | 26,691 | |
| | 3,762 | | | | 5.000 | | | | 03/01/33 | | | | 4,159 | |
| | 18,969 | | | | 5.000 | | | | 04/01/33 | | | | 20,970 | |
| | 8,780 | | | | 5.000 | | | | 05/01/33 | | | | 9,706 | |
| | 15,457 | | | | 5.000 | | | | 06/01/33 | | | | 17,088 | |
| | 87,887 | | | | 5.000 | | | | 07/01/33 | | | | 97,154 | |
| | 126,069 | | | | 5.000 | | | | 08/01/33 | | | | 139,364 | |
| | 14,866 | | | | 5.000 | | | | 09/01/33 | | | | 16,434 | |
| | 24,785 | | | | 5.000 | | | | 10/01/33 | | | | 27,399 | |
| | 82,503 | | | | 5.000 | | | | 11/01/33 | | | | 91,203 | |
| | 27,016 | | | | 5.000 | | | | 12/01/33 | | | | 29,864 | |
| | 26,133 | | | | 5.000 | | | | 01/01/34 | | | | 28,889 | |
| | 90,814 | | | | 5.000 | | | | 02/01/34 | | | | 100,407 | |
| | 36,286 | | | | 5.000 | | | | 03/01/34 | | | | 40,134 | |
| | 73,136 | | | | 5.000 | | | | 04/01/34 | | | | 80,892 | |
| | 100,041 | | | | 5.000 | | | | 05/01/34 | | | | 110,593 | |
| | 1,096,592 | | | | 5.000 | | | | 06/01/34 | | | | 1,212,561 | |
| | 20,302 | | | | 5.000 | | | | 11/01/34 | | | | 22,455 | |
| | 353,580 | | | | 5.000 | | | | 04/01/35 | | | | 390,865 | |
| | 62,783 | | | | 5.000 | | | | 11/01/35 | | | | 69,403 | |
| | | | | | | | | | | | | | |
| | | | | | | | | | | | | 2,536,231 | |
| | |
| | FNMA – 3.0% | |
| | 6,670,486 | | | | 3.104 | | | | 01/01/18 | | | | 6,974,819 | |
| | 6,585,274 | | | | 3.443 | | | | 01/01/18 | | | | 6,954,787 | |
| | |
Principal
Amount | | | Interest
Rate | | | Maturity
Date | | | Value | |
| | | | | | | | | | | | | | |
| Mortgage-Backed Obligations – (continued) | |
| FNMA – (continued) | |
| 4,294,338 | | | | 3.660 | | | | 01/01/18 | | | | 4,563,226 | |
| | 419,177 | | | | 5.000 | | | | 01/01/18 | | | | 442,890 | |
| | 2,090,092 | | | | 5.000 | | | | 02/01/18 | | | | 2,208,532 | |
| | 5,306,635 | | | | 3.750 | | | | 03/01/18 | | | | 5,659,598 | |
| | 1,371,180 | | | | 5.000 | | | | 03/01/18 | | | | 1,448,882 | |
| | 2,010,673 | | | | 5.000 | | | | 04/01/18 | | | | 2,124,613 | |
| | 3,550,000 | | | | 3.840 | | | | 05/01/18 | | | | 3,802,345 | |
| | 182,630 | | | | 5.000 | | | | 05/01/18 | | | | 192,979 | |
| | 175,461 | | | | 5.000 | | | | 06/01/18 | | | | 185,404 | |
| | 5,507 | | | | 6.000 | | | | 11/01/18 | | | | 6,217 | |
| | 30,565 | | | | 6.000 | | | | 12/01/18 | | | | 34,509 | |
| | 3,976 | | | | 5.500 | | | | 01/01/19 | | | | 4,212 | |
| | 76,582 | | | | 5.500 | | | | 02/01/19 | | | | 81,228 | |
| | 76,071 | | | | 5.500 | | | | 03/01/19 | | | | 81,232 | |
| | 60,056 | | | | 5.500 | | | | 04/01/19 | | | | 63,749 | |
| | 29,879 | | | | 5.500 | | | | 05/01/19 | | | | 31,684 | |
| | 321,993 | | | | 6.000 | | | | 05/01/19 | | | | 363,539 | |
| | 144,292 | | | | 5.500 | | | | 06/01/19 | | | | 153,556 | |
| | 450,257 | | | | 5.500 | | | | 07/01/19 | | | | 479,249 | |
| | 393,270 | | | | 5.500 | | | | 08/01/19 | | | | 419,564 | |
| | 365,015 | | | | 5.500 | | | | 09/01/19 | | | | 389,779 | |
| | 102,545 | | | | 5.500 | | | | 10/01/19 | | | | 109,252 | |
| | 102,103 | | | | 5.500 | | | | 11/01/19 | | | | 109,337 | |
| | 203,186 | | | | 5.500 | | | | 12/01/19 | | | | 217,928 | |
| | 16,882 | | | | 5.500 | | | | 01/01/20 | | | | 18,259 | |
| | 7,943 | | | | 5.500 | | | | 06/01/20 | | | | 8,490 | |
| | 2,109,133 | | | | 5.500 | | | | 07/01/20 | | | | 2,255,201 | |
| | 2,075,432 | | | | 3.416 | | | | 10/01/20 | | | | 2,189,112 | |
| | 1,432,719 | | | | 3.632 | | | | 12/01/20 | | | | 1,526,266 | |
| | 5,855,950 | | | | 4.375 | | | | 06/01/21 | | | | 6,460,711 | |
| | 141,223 | | | | 6.000 | | | | 08/01/21 | | | | 159,444 | |
| | 22,849 | | | | 6.000 | | | | 11/01/21 | | | | 25,797 | |
| | 49,263 | | | | 6.000 | | | | 09/01/22 | | | | 55,619 | |
| | 79,260 | | | | 6.000 | | | | 10/01/22 | | | | 89,490 | |
| | 24,055 | | | | 6.000 | | | | 11/01/22 | | | | 27,159 | |
| | 27,019 | | | | 6.000 | | | | 12/01/22 | | | | 30,508 | |
| | 109,864 | | | | 6.000 | | | | 01/01/23 | | | | 124,064 | |
| | 45,775 | | | | 6.000 | | | | 02/01/23 | | | | 51,681 | |
| | 107,146 | | | | 6.000 | | | | 09/01/23 | | | | 120,971 | |
| | 4,532 | | | | 6.000 | | | | 01/01/24 | | | | 5,117 | |
| | 189,473 | | | | 6.000 | | | | 04/01/24 | | | | 216,006 | |
| | 5,028,373 | | | | 5.500 | | | | 05/01/25 | | | | 5,325,631 | |
| | 124,367 | | | | 6.000 | | | | 05/01/25 | | | | 140,414 | |
| | 90,841 | | | | 6.000 | | | | 07/01/26 | | | | 103,253 | |
| | 41,009 | | | | 6.000 | | | | 12/01/26 | | | | 46,454 | |
| | 5,158 | | | | 6.000 | | | | 03/01/27 | | | | 5,838 | |
| | 138,903 | | | | 6.000 | | | | 04/01/27 | | | | 157,351 | |
| | 230,846 | | | | 6.000 | | | | 06/01/27 | | | | 261,422 | |
| | 503,887 | | | | 6.000 | | | | 07/01/27 | | | | 570,814 | |
| | 178,914 | | | | 6.000 | | | | 08/01/27 | | | | 202,435 | |
| | 82,899 | | | | 6.000 | | | | 09/01/27 | | | | 93,910 | |
| | 119,921 | | | | 6.000 | | | | 10/01/27 | | | | 135,775 | |
| | 144,948 | | | | 6.000 | | | | 11/01/27 | | | | 164,522 | |
| | 383,682 | | | | 6.000 | | | | 12/01/27 | | | | 435,745 | |
| | 617,314 | | | | 6.000 | | | | 01/01/28 | | | | 705,971 | |
| | 200,988 | | | | 6.000 | | | | 07/01/28 | | | | 228,098 | |
| | 179,700 | | | | 6.000 | | | | 09/01/28 | | | | 204,058 | |
| | |
| | |
| The accompanying notes are an integral part of these financial statements. | | 85 |
GOLDMAN SACHS STRATEGIC INCOME FUND
Schedule of Investments (continued)
September 30, 2014 (Unaudited)
| | | | | | | | | | | | | | |
Principal
Amount | | | Interest
Rate | | | Maturity
Date | | | Value | |
| | | | | | | | | | | | | | |
| Mortgage-Backed Obligations – (continued) | |
| FNMA – (continued) | |
| $ | 194,337 | | | | 6.000 | % | | | 03/01/29 | | | $ | 220,276 | |
| | 7,752 | | | | 4.500 | | | | 09/01/29 | | | | 8,397 | |
| | 85,563 | | | | 6.000 | | | | 09/01/29 | | | | 96,904 | |
| | 944,202 | | | | 6.000 | | | | 07/01/32 | | | | 1,065,634 | |
| | 9,282 | | | | 6.000 | | | | 12/01/32 | | | | 10,612 | |
| | 1,574 | | | | 6.000 | | | | 01/01/33 | | | | 1,800 | |
| | 219,998 | | | | 5.000 | | | | 04/01/33 | | | | 243,019 | |
| | 6,428 | | | | 6.000 | | | | 04/01/33 | | | | 7,349 | |
| | 1,144 | | | | 5.000 | | | | 05/01/33 | | | | 1,264 | |
| | 336,097 | | | | 5.000 | | | | 08/01/33 | | | | 371,265 | |
| | 450,896 | | | | 5.000 | | | | 09/01/33 | | | | 498,077 | |
| | 259,694 | | | | 6.000 | | | | 10/01/33 | | | | 296,971 | |
| | 9,623 | | | | 6.000 | | | | 02/01/34 | | | | 11,005 | |
| | 75,340 | | | | 6.000 | | | | 03/01/34 | | | | 86,154 | |
| | 365,177 | | | | 6.000 | | | | 08/01/34 | | | | 417,261 | |
| | 55,565 | | | | 6.000 | | | | 11/01/34 | | | | 63,541 | |
| | 664,239 | | | | 6.000 | | | | 05/01/35 | | | | 751,423 | |
| | 132,614 | | | | 6.000 | | | | 06/01/35 | | | | 150,026 | |
| | 324,988 | | | | 6.000 | | | | 10/01/35 | | | | 366,831 | |
| | 50,503 | | | | 6.000 | | | | 11/01/35 | | | | 57,133 | |
| | 62,892 | | | | 6.000 | | | | 12/01/35 | | | | 71,149 | |
| | 149,811 | | | | 6.000 | | | | 01/01/36 | | | | 169,121 | |
| | 553,229 | | | | 6.000 | | | | 02/01/36 | | | | 627,500 | |
| | 4,355,246 | | | | 6.000 | | | | 03/01/36 | | | | 4,916,636 | |
| | 391,551 | | | | 6.000 | | | | 04/01/36 | | | | 442,022 | |
| | 1,739,247 | | | | 6.000 | | | | 05/01/36 | | | | 1,963,432 | |
| | 725,151 | | | | 6.000 | | | | 06/01/36 | | | | 818,623 | |
| | 218,280 | | | | 6.000 | | | | 07/01/36 | | | | 246,415 | |
| | 704,148 | | | | 6.000 | | | | 08/01/36 | | | | 794,914 | |
| | 1,724,370 | | | | 6.000 | | | | 09/01/36 | | | | 1,946,642 | |
| | 669,625 | | | | 6.000 | | | | 10/01/36 | | | | 755,940 | |
| | 1,441,320 | | | | 6.000 | | | | 11/01/36 | | | | 1,627,041 | |
| | 1,694,487 | | | | 6.000 | | | | 12/01/36 | | | | 1,912,871 | |
| | 397,588 | | | | 6.000 | | | | 01/01/37 | | | | 448,779 | |
| | 8,694,859 | | | | 6.000 | | | | 02/01/37 | | | | 9,824,796 | |
| | 2,355,605 | | | | 6.000 | | | | 03/01/37 | | | | 2,661,087 | |
| | 1,326,411 | | | | 6.000 | | | | 04/01/37 | | | | 1,496,997 | |
| | 5,896,553 | | | | 6.000 | | | | 05/01/37 | | | | 6,655,546 | |
| | 1,696,038 | | | | 6.000 | | | | 06/01/37 | | | | 1,914,163 | |
| | 17,782,246 | | | | 6.000 | | | | 07/01/37 | | | | 20,069,200 | |
| | 7,626,199 | | | | 6.000 | | | | 08/01/37 | | | | 8,606,984 | |
| | 1,608,165 | | | | 6.000 | | | | 09/01/37 | | | | 1,814,996 | |
| | 2,521,115 | | | | 6.000 | | | | 10/01/37 | | | | 2,845,348 | |
| | 6,253,469 | | | | 6.000 | | | | 11/01/37 | | | | 7,057,709 | |
| | 429,407 | | | | 6.000 | | | | 12/01/37 | | | | 484,634 | |
| | 5,941,180 | | | | 6.000 | | | | 01/01/38 | | | | 6,705,470 | |
| | 2,228,933 | | | | 6.000 | | | | 02/01/38 | | | | 2,515,705 | |
| | 152,853 | | | | 5.000 | | | | 03/01/38 | | | | 168,569 | |
| | 963,022 | | | | 6.000 | | | | 03/01/38 | | | | 1,086,982 | |
| | 1,386,756 | | | | 6.000 | | | | 04/01/38 | | | | 1,565,160 | |
| | 87,338,505 | | | | 6.000 | | | | 05/01/38 | | | | 98,571,307 | |
| | 3,431,303 | | | | 6.000 | | | | 06/01/38 | | | | 3,872,865 | |
| | 19,104,282 | | | | 6.000 | | | | 07/01/38 | | | | 21,562,688 | |
| | 321,726 | | | | 6.000 | | | | 08/01/38 | | | | 363,129 | |
| | 7,729,098 | | | | 6.000 | | | | 09/01/38 | | | | 8,723,310 | |
| | 11,815,815 | | | | 6.000 | | | | 10/01/38 | | | | 13,336,903 | |
| | |
Principal
Amount | | | Interest
Rate | | | Maturity
Date | | | Value | |
| | | | | | | | | | | | | | |
| Mortgage-Backed Obligations – (continued) | |
| FNMA – (continued) | |
| 3,426,218 | | | | 6.000 | | | | 11/01/38 | | | | 3,866,929 | |
| | 1,564,001 | | | | 6.000 | | | | 12/01/38 | | | | 1,765,262 | |
| | 16,993,931 | | | | 6.000 | | | | 01/01/39 | | | | 19,179,758 | |
| | 33,127,123 | | | | 6.000 | | | | 02/01/39 | | | | 37,390,159 | |
| | 56,687 | | | | 6.000 | | | | 03/01/39 | | | | 63,977 | |
| | 6,835,314 | | | | 6.000 | | | | 04/01/39 | | | | 7,714,858 | |
| | 19,178 | | | | 6.000 | | | | 05/01/39 | | | | 21,652 | |
| | 58,949 | | | | 6.000 | | | | 06/01/39 | | | | 66,535 | |
| | 1,141,651 | | | | 6.000 | | | | 07/01/39 | | | | 1,288,602 | |
| | 37,488 | | | | 4.000 | | | | 08/01/39 | | | | 39,536 | |
| | 18,659 | | | | 4.000 | | | | 09/01/39 | | | | 19,678 | |
| | 3,890,319 | | | | 6.000 | | | | 09/01/39 | | | | 4,390,759 | |
| | 2,490,330 | | | | 6.000 | | | | 10/01/39 | | | | 2,810,808 | |
| | 1,453,214 | | | | 6.000 | | | | 11/01/39 | | | | 1,640,718 | |
| | 23,306,678 | | | | 6.000 | | | | 12/01/39 | | | | 26,304,201 | |
| | 1,463,689 | | | | 6.000 | | | | 01/01/40 | | | | 1,651,931 | |
| | 696,970 | | | | 6.000 | | | | 02/01/40 | | | | 786,661 | |
| | 19,757 | | | | 6.000 | | | | 03/01/40 | | | | 22,300 | |
| | 9,737,655 | | | | 6.000 | | | | 04/01/40 | | | | 10,989,989 | |
| | 39,577,810 | | | | 6.000 | | | | 06/01/40 | | | | 44,669,323 | |
| | 212,942 | | | | 6.000 | | | | 07/01/40 | | | | 240,327 | |
| | 6,739,657 | | | | 6.000 | | | | 10/01/40 | | | | 7,606,427 | |
| | 738,615 | | | | 6.000 | | | | 04/01/41 | | | | 833,607 | |
| | 13,343,784 | | | | 6.000 | | | | 05/01/41 | | | | 15,059,931 | |
| | 252,702 | | | | 6.000 | | | | 07/01/41 | | | | 285,202 | |
| | 2,516,676 | | | | 4.500 | | | | 08/01/41 | | | | 2,720,664 | |
| | 650,660 | | | | 4.500 | | | | 10/01/41 | | | | 703,094 | |
| | 509,464 | | | | 5.000 | | | | 11/01/41 | | | | 562,957 | |
| | 10,284,170 | | | | 3.000 | | | | 08/01/42 | | | | 10,219,993 | |
| | 9,045,149 | | | | 3.000 | | | | 09/01/42 | | | | 8,989,054 | |
| | 1,538,539 | | | | 3.000 | | | | 10/01/42 | | | | 1,529,103 | |
| | 6,094,389 | | | | 3.000 | | | | 11/01/42 | | | | 6,055,228 | |
| | 56,533,240 | | | | 3.000 | | | | 12/01/42 | | | | 56,149,276 | |
| | 39,461,975 | | | | 3.000 | | | | 01/01/43 | | | | 39,203,023 | |
| | 11,821,760 | | | | 3.000 | | | | 02/01/43 | | | | 11,735,060 | |
| | 2,908,539 | | | | 3.000 | | | | 03/01/43 | | | | 2,888,884 | |
| | 7,783,335 | | | | 3.000 | | | | 04/01/43 | | | | 7,726,992 | |
| | 681,018 | | | | 3.000 | | | | 05/01/43 | | | | 672,194 | |
| | 1,000,000 | | | | 5.000 | | | | TBA-30yr | (f) | | | 1,103,594 | |
| | 75,000,000 | | | | 5.500 | | | | TBA-30yr | (f) | | | 83,542,965 | |
| | 36,000,000 | | | | 6.000 | | | | TBA-30yr | (f) | | | 40,662,500 | |
| | | | | | | | | | | | | | |
| | | | | | | | | | | | | 765,791,982 | |
| | |
| | TOTAL FEDERAL AGENCIES | | | $ | 777,548,066 | |
| | |
| TOTAL MORTGAGE-BACKED OBLIGATIONS
|
|
| | (Cost $3,610,607,742) | | | $ | 3,700,547,373 | |
| | |
| | | | | | | | | | | | | | |
| | Agency Debentures – 11.9% | |
| FFCB | |
| $ | 132,400,000 | | | | 0.250 | % | | | 12/02/15 | | | $ | 132,206,829 | |
| FHLB | |
| | 400,000,000 | | | | 0.000 | (g) | | | 11/12/14 | | | | 399,994,000 | |
| | 486,980,000 | | | | 0.000 | (g) | | | 11/19/14 | | | | 486,971,234 | |
| | 1,023,800,000 | | | | 0.000 | (g) | | | 12/17/14 | | | | 1,023,767,239 | |
| | |
| | |
| 86 | | The accompanying notes are an integral part of these financial statements. |
GOLDMAN SACHS STRATEGIC INCOME FUND
| | | | | | | | | | | | | | |
Principal
Amount | | | Interest
Rate | | | Maturity
Date | | | Value | |
| | | | | | | | | | | | | | |
| Agency Debentures – (continued) | |
| FHLB – (continued) | |
| $ | 600,000,000 | | | | 0.000 | % (g) | | | 12/24/14 | | | $ | 599,979,000 | |
| | 50,300,000 | | | | 0.120 | | | | 01/09/15 | | | | 50,298,390 | |
| | 210,000,000 | | | | 0.090 | | | | 01/22/15 | | | | 209,971,860 | |
| | 44,000,000 | | | | 0.100 | | | | 01/23/15 | | | | 43,995,380 | |
| | 79,600,000 | | | | 0.100 | | | | 01/23/15 | | | | 79,591,642 | |
| | 54,900,000 | | | | 0.300 | | | | 01/04/16 | | | | 54,849,986 | |
| | |
| | TOTAL AGENCY DEBENTURES | |
| | (Cost $3,081,733,934) | | | $ | 3,081,625,560 | |
| | |
| | | | | | | | | | | | | | |
| | Asset-Backed Securities – 13.6% | |
| | Collateralized Loan Obligations – 12.7% | |
| Aberdeen Loan Funding Ltd. Series 2008-1A, Class A(b)(c) | |
| $ | 35,173,997 | | | | 0.890 | % | | | 11/01/18 | | | $ | 34,910,895 | |
| ACIS CLO Ltd. Series 2013-1A, Class ACOM(b)(c) | |
| | 23,550,000 | | | | 1.461 | | | | 04/18/24 | | | | 22,697,490 | |
| ACIS CLO Ltd. Series 2013-2A, Class A(b)(c) | |
| | 11,950,000 | | | | 0.734 | | | | 10/14/22 | | | | 11,705,145 | |
| ACIS CLO Ltd. Series 2013-2A, Class ACOM(b)(c) | |
| | 68,183,962 | | | | 1.149 | | | | 10/14/22 | | | | 66,738,462 | |
| ACIS CLO Ltd. Series 2014-4A, Class ACOM(b)(c) | |
| | 177,900,000 | | | | 1.713 | | | | 05/01/26 | | | | 174,377,580 | |
| ACIS CLO Ltd. Series 2014-4A, Class C(b)(c) | |
| | 11,050,000 | | | | 2.777 | | | | 05/01/26 | | | | 10,238,676 | |
| Anchorage Capital CLO Ltd. Series 2014-4A, Class A1A(b)(c) | |
| | 141,900,000 | | | | 1.732 | | | | 07/28/26 | | | | 140,823,121 | |
| Anchorage Capital CLO Ltd. Series 2014-4A, Class A2(b)(c) | |
| | 31,000,000 | | | | 2.442 | | | | 07/28/26 | | | | 30,458,368 | |
| B&M CLO Ltd. Series 2014-1A, Class A1(b)(c) | |
| | 74,650,000 | | | | 1.598 | | | | 04/16/26 | | | | 74,115,805 | |
| B&M CLO Ltd. Series 2014-1A, Class A2(b)(c) | |
| | 12,850,000 | | | | 2.148 | | | | 04/16/26 | | | | 12,313,602 | |
| Black Diamond CLO Ltd. Series 2005-1A, Class A1(b)(c) | |
| | 1,062,709 | | | | 0.503 | | | | 06/20/17 | | | | 1,061,805 | |
| Black Diamond CLO Ltd. Series 2006-1A, Class AD(b)(c) | |
| | 21,503,870 | | | | 0.484 | | | | 04/29/19 | | | | 21,141,186 | |
| Brentwood CLO Corp. Series 2006-1A, Class A1A(b)(c) | |
| | 53,059,027 | | | | 0.510 | | | | 02/01/22 | | | | 52,564,676 | |
| Brentwood CLO Corp. Series 2006-1A, Class A1B(b)(c) | |
| | 20,960,576 | | | | 0.510 | | | | 02/01/22 | | | | 20,723,135 | |
| Callidus Debt Partners CLO Fund VI Ltd. Series 6X, Class A1D(b) | |
| | 10,480,408 | | | | 0.493 | | | | 10/23/21 | | | | 10,276,543 | |
| CIFC Funding Ltd. Series 2014-2A, Class A1L(b)(c) | |
| | 148,600,000 | | | | 1.725 | | | | 05/24/26 | | | | 148,456,601 | |
| CIFC Funding Ltd. Series 2014-2A, Class A2L(b)(c) | |
| | 24,600,000 | | | | 2.395 | | | | 05/24/26 | | | | 24,155,478 | |
| Covenant Credit Partners CLO I Ltd. Series 2014-1A, Class C(b)(c) | |
| | 21,350,000 | | | | 3.154 | | | | 07/20/26 | | | | 20,422,898 | |
| Crown Point CLO Ltd. Series 2012-1A, Class ACOM(b)(c) | |
| | 7,650,000 | | | | 1.452 | | | | 11/21/22 | | | | 7,552,080 | |
| Crown Point CLO Ltd. Series 2013-2A, Class ACOM(b) | |
| | 118,100,000 | | | | 1.314 | | | | 12/14/23 | | | | 115,324,296 | |
| Doral CLO 1 Ltd. Series 2012-3A, Class A1(b)(c) | |
| | 10,000,000 | | | | 1.684 | | | | 12/19/22 | | | | 10,018,690 | |
| | |
Principal
Amount | | | Interest
Rate | | | Maturity
Date | | | Value | |
| | | | | | | | | | | | | | |
| Asset-Backed Securities – (continued) | |
| Collateralized Loan Obligations – (continued) | |
| Gleneagles CLO Ltd. Series 2005-1A, Class A1(b)(c) | |
| 4,187,963 | | | | 0.515 | | | | 11/01/17 | | | | 4,182,942 | |
| Golub Capital Management CLO Ltd. Series 2007-1A,
Class A(b)(c) |
|
| | 5,473,804 | | | | 0.477 | | | | 07/31/21 | | | | 5,431,152 | |
| Halcyon Loan Advisors Funding Ltd. Series 2014-1A,
Class A1(b)(c) |
|
| | 70,250,000 | | | | 1.808 | | | | 04/18/26 | | | | 70,182,349 | |
| Halcyon Loan Advisors Funding Ltd. Series 2014-2A,
Class A1B(b)(c) |
|
| | 64,150,000 | | | | 1.655 | | | | 04/28/25 | | | | 63,645,268 | |
| Halcyon Loan Advisors Funding Ltd. Series 2014-2A,
Class A2(b)(c) |
|
| | 55,600,000 | | | | 2.228 | | | | 04/28/25 | | | | 53,602,014 | |
| ICG US CLO Ltd. Series 2014-1A, Class ACOM(b)(c) | |
| | 112,150,000 | | | | 1.506 | | | | 04/20/26 | | | | 108,830,360 | |
| Jasper CLO Ltd. Series 2005-1A, Class A(b)(c) | |
| | 2,918,962 | | | | 0.510 | | | | 08/01/17 | | | | 2,913,442 | |
| KKR Financial CLO Corp. Series 2005-2X, Class A1(b) | |
| | 19,172,331 | | | | 0.495 | | | | 11/26/17 | | | | 19,131,034 | |
| KKR Financial CLO Ltd. Series 2006-1A, Class A1(b)(c) | |
| | 3,970,685 | | | | 0.515 | | | | 08/25/18 | | | | 3,968,445 | |
| KKR Financial CLO Ltd. Series 2007-1A, Class A(b)(c) | |
| | 21,410,116 | | | | 0.584 | | | | 05/15/21 | | | | 21,245,451 | |
| Liberty CLO Ltd. Series 2005-1A, Class A1C(b)(c) | |
| | 1,939,935 | | | | 0.490 | | | | 11/01/17 | | | | 1,939,266 | |
| Liberty CLO Ltd. Series 2005-1A, Class A2(b)(c) | |
| | 26,000,000 | | | | 0.615 | | | | 11/01/17 | | | | 25,910,092 | |
| Magnetite VIII Ltd. Series 2014-8A, Class A(b)(c) | |
| | 114,850,000 | | | | 1.708 | | | | 04/15/26 | | | | 114,948,771 | |
| Magnetite VIII Ltd. Series 2014-8A, Class B(b)(c) | |
| | 23,900,000 | | | | 2.228 | | | | 04/15/26 | | | | 23,408,783 | |
| Mountain View Funding CLO Series 2007-3A, Class A1(b)(c) | |
| | 2,678,194 | | | | 0.448 | | | | 04/16/21 | | | | 2,668,901 | |
| Neuberger Berman CLO XVII Ltd. Series 2014-17A, Class C(b)(c) | |
| | 8,650,000 | | | | 2.991 | | | | 08/04/25 | | | | 8,317,537 | |
| Ocean Trails CLO Ltd. Series 2006-1X, Class A1 | |
| | 3,521,212 | | | | 0.480 | | | | 10/12/20 | | | | 3,503,870 | |
| OCP CLO Ltd. Series 2012-2A, Class ACOM(b)(c) | |
| | 15,650,000 | | | | 1.475 | | | | 11/22/23 | | | | 15,360,475 | |
| OCP CLO Ltd. Series 2014-5A, Class ACOM(b)(c) | |
| | 140,200,000 | | | | 0.000 | | | | 04/26/26 | | | | 136,078,120 | |
| OFSI Fund V Ltd. Series 2013-5A, Class ACOM(c)(g) | |
| | 11,950,000 | | | | 0.000 | | | | 04/17/25 | | | | 11,771,945 | |
| OFSI Fund V Ltd. Series 2014-7A, Class ACOM(b)(c) | |
| | 146,000,000 | | | | 1.872 | | | | 10/18/26 | | | | 144,510,800 | |
| OFSI Fund V Ltd. Series 2014-7A, Class C(b)(c) | |
| | 20,050,000 | | | | 3.345 | | | | 10/18/26 | | | | 19,432,380 | |
| OFSI Fund VI Ltd. Series 2014-6A, Class ACOM(b)(c) | |
| | 120,000,000 | | | | 1.550 | | | | 03/20/25 | | | | 116,760,000 | |
| OHA Park Avenue CLO I Ltd. Series 2007-1A, Class A1A(b)(c) | |
| | 9,365,846 | | | | 0.484 | | | | 03/14/22 | | | | 9,286,910 | |
| OZLM Funding III Ltd. Series 2013-3A, Class A1(b)(c) | |
| | 14,750,000 | | | | 1.562 | | | | 01/22/25 | | | | 14,655,158 | |
| Red River CLO Ltd. Series 1A, Class A(b)(c) | |
| | 16,044,785 | | | | 0.510 | | | | 07/27/18 | | | | 15,958,929 | |
| | |
| | |
| The accompanying notes are an integral part of these financial statements. | | 87 |
GOLDMAN SACHS STRATEGIC INCOME FUND
Schedule of Investments (continued)
September 30, 2014 (Unaudited)
| | | | | | | | | | | | | | |
Principal
Amount | | | Interest
Rate | | | Maturity
Date | | | Value | |
| | | | | | | | | | | | | | |
| Asset-Backed Securities – (continued) | |
| Collateralized Loan Obligations – (continued) | |
| Regatta IV Funding Ltd. Series 2014-1A, Class ACOM(b)(c) | |
| $ | 162,350,000 | | | | 1.775 | % | | | 07/25/26 | | | $ | 161,018,730 | |
| Regatta IV Funding Ltd. Series 2014-1A, Class B(b)(c) | |
| | 776,094 | | | | 2.275 | | | | 07/25/26 | | | | 755,193 | |
| Regatta IV Funding Ltd. Series 2014-1A, Class C(b)(c) | |
| | 18,250,000 | | | | 3.215 | | | | 07/25/26 | | | | 17,667,332 | |
| Saratoga Investment CLO Corp. Series 2013-1A, Ltd.
Class A1(b)(c) |
|
| | 16,000,000 | | | | 1.534 | | | | 10/20/23 | | | | 15,898,784 | |
| Shackleton CLO Ltd. Series 2014-5A, Class A(b)(c) | |
| | 156,400,000 | | | | 1.737 | | | | 05/07/26 | | | | 156,500,252 | |
| Shackleton CLO Ltd. Series 2014-5A, Class B1(b)(c) | |
| | 33,700,000 | | | | 2.237 | | | | 05/07/26 | | | | 32,891,537 | |
| Silvermore CLO Ltd. Series 2014-1A, Class A1(b)(c) | |
| | 160,050,000 | | | | 1.680 | | | | 05/15/26 | | | | 159,236,626 | |
| Silvermore CLO Ltd. Series 2014-1A, Class A2(b)(c) | |
| | 28,700,000 | | | | 2.280 | | | | 05/15/26 | | | | 27,875,621 | |
| Sound Point CLO Ltd. Series 2014-1A, Class B1(b)(c) | |
| | 15,000,000 | | | | 2.134 | | | | 04/18/26 | | | | 14,372,745 | |
| Sound Point CLO VI Ltd. Series 2014-2A, Class ACOM(b)(c) | |
| | 199,450,000 | | | | 1.453 | | | | 10/20/26 | | | | 197,635,005 | |
| Sound Point CLO VI Ltd. Series 2014-2A, Class C(b)(c) | |
| | 15,000,000 | | | | 3.163 | | | | 10/20/26 | | | | 14,429,160 | |
| Symphony CLO XI Ltd. Series 2013-11A, Class A(b)(c) | |
| | 6,500,000 | | | | 1.533 | | | | 01/17/25 | | | | 6,458,472 | |
| Trinitas CLO II Ltd. Series 2014-2A, Class ACOM(b)(c) | |
| | 57,100,000 | | | | 1.691 | | | | 07/15/26 | | | | 55,969,420 | |
| Trinitas CLO II Ltd. Series 2014-2A, Class C(b)(c) | |
| | 10,050,000 | | | | 3.124 | | | | 07/15/26 | | | | 9,600,654 | |
| Trinitas CLO Ltd. Series 2014-1A, Class A1(b)(c) | |
| | 58,150,000 | | | | 1.833 | | | | 04/15/26 | | | | 57,880,766 | |
| Trinitas CLO Ltd. Series 2014-1A, Class B1(b)(c) | |
| | 14,950,000 | | | | 2.203 | | | | 04/15/26 | | | | 14,279,881 | |
| Westbrook CLO Ltd. Series 2006-1X, Class A1(b) | |
| | 14,479,157 | | | | 0.473 | | | | 12/20/20 | | | | 14,389,704 | |
| Westchester CLO Ltd. Series 2007-1X, Class A1A(b) | |
| | 32,502,505 | | | | 0.465 | | | | 08/01/22 | | | | 32,199,907 | |
| Whitehorse VIII Ltd. Series 2014-1A, Class A(b)(c) | |
| | 150,700,000 | | | | 1.740 | | | | 05/01/26 | | | | 150,656,448 | |
| Whitehorse VIII Ltd. Series 2014-1A, Class B(b)(c) | |
| | 32,800,000 | | | | 2.290 | | | | 05/01/26 | | | | 32,138,818 | |
| Zais CLO 1 Ltd. Series 2014-1A, Class ACOM(b)(c) | |
| | 93,200,000 | | | | 1.712 | | | | 04/15/26 | | | | 92,146,840 | |
| | | | | | | | | | | | | | |
| | | | | | | | | | | | | 3,291,722,821 | |
| | |
| | Home Equity – 0.8% | |
| ACE Securities Corp. Home Equity Loan Trust
Series 2007-ASAP1, Class A2C(b) |
|
| | 12,480,505 | | | | 0.415 | | | | 03/25/37 | | | | 7,324,168 | |
| ACE Securities Corp. Home Equity Loan Trust Series 2007-HE2,
Class A2D(b) |
|
| | 16,641,000 | | | | 0.425 | | | | 05/25/36 | | | | 10,939,094 | |
| Ameriquest Mortgage Securities, Inc. Asset-Backed Pass-Through
Certificates Series 05-R8, Class M2(b) |
|
| | 5,440,000 | | | | 0.645 | | | | 10/25/35 | | | | 4,723,277 | |
| | |
Principal
Amount | | | Interest
Rate | | | Maturity
Date | | | Value | |
| | | | | | | | | | | | | | |
| Asset-Backed Securities – (continued) | |
| Home Equity – (continued) | |
| Bayview Financial Mortgage Pass-Through Trust 2006-A,
Class M3(b) |
|
| 10,095,000 | | | | 0.802 | | | | 02/28/41 | | | | 7,975,809 | |
| Citigroup Mortgage Loan Trust Series 2006-WFH1, Class M3(b) | |
| | 6,400,000 | | | | 0.555 | | | | 01/25/36 | | | | 5,305,138 | |
| Citigroup Mortgage Loan Trust Series 2007-WFH2, Class A4(b) | |
| | 300,000 | | | | 0.505 | | | | 03/25/37 | | | | 266,800 | |
| Countrywide Asset-Backed Certificates Series 2007-2,
Class 2A4(b) |
|
| | 20,000,000 | | | | 0.375 | | | | 08/25/37 | | | | 8,688,694 | |
| Credit-Based Asset Servicing and Securitization LLC
Series 2005-CB8, Class AF3(h) |
|
| | 8,886,000 | | | | 4.230 | | | | 12/25/35 | | | | 8,478,197 | |
| First Franklin Mortgage Loan Trust Series 2006-FF12, Class A4(b) | |
| | 3,010,233 | | | | 0.295 | | | | 09/25/36 | | | | 2,775,278 | |
| First Franklin Mortgage Loan Trust Series 2006-FF6, Class A4(b) | |
| | 25,000,000 | | | | 0.405 | | | | 04/25/36 | | | | 20,288,802 | |
| GSAA Home Equity Trust Series 2006-17, Class A1(b) | |
| | 11,223,700 | | | | 0.215 | | | | 11/25/36 | | | | 5,907,192 | |
| GSAA Home Equity Trust Series 2007-10, Class A2A | |
| | 5,229,339 | | | | 6.500 | | | | 11/25/37 | | | | 3,921,525 | |
| GSAMP Trust Series 2006-HE8, Class A2C(b) | |
| | 14,600,000 | | | | 0.325 | | | | 01/25/37 | | | | 11,178,192 | |
| HLSS Servicer Advance Receivables Trust Series 2014-T1,
Class AT1(c) |
|
| | 7,150,000 | | | | 1.244 | | | | 01/17/45 | | | | 7,157,333 | |
| HSI Asset Securitization Corp. Trust Series 2006-OPT1,
Class 2A4(b) |
|
| | 8,600,000 | | | | 0.455 | | | | 12/25/35 | | | | 7,549,071 | |
| HSI Asset Securitization Corp. Trust Series 2006-OPT2,
Class M2(b) |
|
| | 5,900,000 | | | | 0.545 | | | | 01/25/36 | | | | 4,790,334 | |
| JPMorgan Mortgage Acquisition Trust Series 2006-CH1,
Class A5(b) |
|
| | 3,850,000 | | | | 0.385 | | | | 07/25/36 | | | | 3,693,576 | |
| JPMorgan Mortgage Acquisition Trust Series 2007-CH2,
Class AV5(b) |
|
| | 5,100,000 | | | | 0.415 | | | | 01/25/37 | | | | 4,108,554 | |
| Lehman XS Trust Series 2006-16N, Class A321(b) | |
| | 9,340,992 | | | | 0.355 | | | | 11/25/46 | | | | 6,713,371 | |
| Morgan Stanley Mortgage Loan Trust Series 2007-1XS,
Class 2A1(b) |
|
| | 8,453,402 | | | | 0.235 | | | | 09/25/46 | | | | 3,783,227 | |
| Saxon Asset Securities Trust Series 2007-2, Class A2C(b) | |
| | 7,745,084 | | | | 0.395 | | | | 05/25/47 | | | | 5,565,342 | |
| Securitized Asset Backed Receivables LLC Trust
Series 2004-DO1, Class M1(b) |
|
| | 6,416,029 | | | | 1.130 | | | | 07/25/34 | | | | 5,742,617 | |
| Structured Asset Securities Corp. Mortgage Loan Trust
Series 2006-BC3, Class A3(b) |
|
| | 3,985,961 | | | | 0.315 | | | | 10/25/36 | | | | 2,929,325 | |
| Vericrest Opportunity Loan Transferee LLC Series 2014-NPL4,
Class A1(c)(h) |
|
| | 58,854,458 | | | | 3.125 | | | | 04/27/54 | | | | 58,710,818 | |
| Wachovia Mortgage Loan Trust Series 2005-WMC1, Class M1(b) | |
| | 4,200,000 | | | | 0.815 | | | | 10/25/35 | | | | 3,872,869 | |
| | | | | | | | | | | | | | |
| | | | | | | | | | | | | 212,388,603 | |
| | |
| | |
| 88 | | The accompanying notes are an integral part of these financial statements. |
GOLDMAN SACHS STRATEGIC INCOME FUND
| | | | | | | | | | | | | | |
Principal
Amount | | | Interest
Rate | | | Maturity
Date | | | Value | |
| | | | | | | | | | | | | | |
| Asset-Backed Securities – (continued) | |
| | Student Loan(b) – 0.1% | |
| GCO Education Loan Funding Trust Series 2006-1, Class A8L | |
| $ | 5,336,710 | | | | 0.365 | % | | | 05/25/25 | | | $ | 5,230,117 | |
| Panhandle-Plains Higher Education Authority, Inc. Series 2011-1,
Class A2 |
|
| | 9,228,706 | | | | 1.185 | | | | 07/01/24 | | | | 9,321,354 | |
| US Education Loan Trust LLC Series 2006-1, Class A2(c) | |
| | 234,816 | | | | 0.364 | | | | 03/01/25 | | | | 234,548 | |
| | | | | | | | | | | | | | |
| | | | | | | | | | | | | 14,786,019 | |
| | |
| | TOTAL ASSET-BACKED SECURITIES | | | | | |
| | (Cost $3,499,528,772) | | | $ | 3,518,897,443 | |
| | |
| | | | | | | | | | | | | | |
| | Foreign Debt Obligations – 11.7% | |
| | Sovereign – 11.7% | |
| Brazil Letras do Tesouro Nacional(g) | |
| BRL | 37,433,000 | | | | 0.000 | % | | | 01/01/15 | | | $ | 14,872,309 | |
| Brazil Loan Trust 1 | |
| $ | 8,580,000 | | | | 5.477 | | | | 07/24/23 | | | | 8,794,500 | |
| Brazil Notas do Tesouro Nacional | |
| BRL | 44,563,361 | | | | 6.000 | | | | 08/15/40 | | | | 17,716,953 | |
| | 749,190,713 | | | | 6.000 | | | | 08/15/50 | | | | 295,228,034 | |
| Dominican Republic | |
| DOP | 201,600,000 | | | | 14.500 | | | | 02/10/23 | | | | 5,288,733 | |
| $ | 17,540,000 | | | | 6.600 | (c) | | | 01/28/24 | | | | 18,811,650 | |
| | 16,850,000 | | | | 6.600 | | | | 01/28/24 | | | | 18,071,625 | |
| | 6,105,000 | | | | 5.875 | | | | 04/18/24 | | | | 6,196,575 | |
| | 2,784,000 | | | | 8.625 | | | | 04/20/27 | | | | 3,368,640 | |
| DOP | 30,000,000 | | | | 18.500 | | | | 02/04/28 | | | | 924,814 | |
| $ | 15,210,000 | | | | 7.450 | (c) | | | 04/30/44 | | | | 16,274,700 | |
| Federal Republic of Germany | |
| EUR | 210,290,000 | | | | 2.000 | | | | 08/15/23 | | | | 293,410,612 | |
| Italy Buoni Poliennali Del Tesoro | |
| | 347,150,000 | | | | 1.150 | | | | 05/15/17 | | | | 445,088,837 | |
| | 191,513,985 | | | | 2.350 | | | | 09/15/19 | | | | 267,289,502 | |
| | 129,900,000 | | | | 4.750 | | | | 09/01/21 | | | | 196,930,247 | |
| | 38,740,000 | | | | 5.500 | | | | 11/01/22 | | | | 61,572,279 | |
| | 71,380,000 | | | | 4.500 | | | | 05/01/23 | | | | 107,034,749 | |
| Republic of Argentina(b) | |
| | 144,875,000 | | | | 0.000 | | | | 12/15/35 | | | | 13,540,848 | |
| $ | 1,630,000 | | | | 0.000 | | | | 12/15/35 | | | | 118,990 | |
| | 1,100,947,000 | | | | 0.000 | | | | 12/15/35 | | | | 83,671,972 | |
| Republic of Costa Rica | |
| | 3,360,000 | | | | 9.995 | | | | 08/01/20 | | | | 4,250,400 | |
| | 10,280,000 | | | | 5.625 | | | | 04/30/43 | | | | 8,789,400 | |
| | 4,487,000 | | | | 7.000 | | | | 04/04/44 | | | | 4,509,435 | |
| Republic of Honduras(c) | |
| | 23,950,000 | | | | 8.750 | | | | 12/16/20 | | | | 27,123,375 | |
| Spain Government Bond | |
| EUR | 61,920,000 | | | | 4.400 | (c) | | | 10/31/23 | | | | 94,078,852 | |
| | 134,890,000 | | | | 5.900 | | | | 07/30/26 | | | | 229,611,527 | |
| United Mexican States | |
| MXN | 1,590,163,270 | | | | 0.000 | (g) | | | 10/16/14 | | | | 118,084,467 | |
| | 275,783,350 | | | | 0.000 | (g) | | | 11/20/14 | | | | 20,420,925 | |
| | 1,654,156,400 | | | | 0.000 | (g) | | | 11/27/14 | | | | 122,415,826 | |
| | 316,404,650 | | | | 0.000 | (g) | | | 12/11/14 | | | | 23,389,608 | |
| | |
Principal
Amount | | | Interest
Rate | | | Maturity
Date | | | Value | |
| | | | | | | | | | | | | | |
| Foreign Debt Obligations – (continued) | |
| Sovereign – (continued) | |
| United Mexican States – (continued) | |
| MXN | 820,692,900 | | | | 0.000 | %(g) | | | 12/18/14 | | | | 60,727,791 | |
| | 534,083,530 | | | | 0.000 | (g) | | | 12/24/14 | | | | 39,439,427 | |
| | 976,370,600 | | | | 0.000 | (g) | | | 02/05/15 | | | | 71,836,464 | |
| | 300,969,830 | | | | 0.000 | (g) | | | 02/19/15 | | | | 22,118,386 | |
| | 293,239,180 | | | | 0.000 | (g) | | | 03/19/15 | | | | 21,530,334 | |
| | 1,553,045,544 | | | | 5.000 | | | | 06/16/16 | | | | 125,601,831 | |
| | 1,850,614,300 | | | | 4.750 | | | | 06/14/18 | | | | 136,904,878 | |
| | 241,369,600 | | | | 6.500 | | | | 06/10/21 | | | | 18,769,474 | |
| | 154,502,100 | | | | 8.000 | | | | 12/07/23 | | | | 13,063,917 | |
| | 39,328,100 | | | | 10.000 | | | | 12/05/24 | | | | 3,795,723 | |
| | 75,763,000 | | | | 8.500 | | | | 05/31/29 | | | | 6,666,139 | |
| | 11,492,900 | | | | 7.750 | | | | 05/29/31 | | | | 947,238 | |
| | 475,100 | | | | 10.000 | | | | 11/20/36 | | | | 47,938 | |
| | 3,417,300 | | | | 8.500 | | | | 11/18/38 | | | | 301,304 | |
| | |
| | TOTAL FOREIGN DEBT OBLIGATIONS | |
| | (Cost $3,130,514,317) | | | $ | 3,048,631,228 | |
| | |
| | | | | | | | | | | | | | |
| | Structured Note – 0.0% | |
| Notas do Tesouro Nacional Series B (Issuer HSBC Corp.) | |
| BRL | 18,354,547 | | | | 6.000 | % | | | 08/15/40 | | | $ | 7,297,175 | |
| | (Cost $10,839,236) | | | | | |
| | |
| | | | | | | | | | | | | | |
| | Municipal Debt Obligations – 2.4% | |
| | Puerto Rico – 2.4% | |
| Puerto Rico Commonwealth Aqueduct & Sewer Authority RB
(Senior Lien) Series 2008 A |
|
| $ | 5,255,000 | | | | 6.000 | % | | | 07/01/38 | | | $ | 3,956,962 | |
| | 17,570,000 | | | | 6.000 | | | | 07/01/44 | | | | 12,958,051 | |
| Puerto Rico Commonwealth Aqueduct & Sewer Authority RB
(Senior Lien) Series 2012 A |
|
| | 8,105,000 | | | | 5.750 | | | | 07/01/37 | | | | 5,979,221 | |
| Puerto Rico Commonwealth Aqueduct & Sewer Authority RB
(Senior Lien) Series 2012 D |
|
| | 3,965,000 | | | | 5.000 | | | | 07/01/33 | | | | 2,816,062 | |
| Puerto Rico Commonwealth GO Bonds for Public Improvement
Series 2011 A |
|
| | 3,020,000 | | | | 5.750 | | | | 07/01/41 | | | | 2,266,510 | |
| Puerto Rico Commonwealth GO Bonds for Public Improvement
Series 2012 A |
|
| | 1,095,000 | | | | 5.125 | | | | 07/01/37 | | | | 818,534 | |
| Puerto Rico Commonwealth GO Bonds Refunding for Public
Improvement Series 2008 A |
|
| | 1,485,000 | | | | 5.500 | | | | 07/01/32 | | | | 1,115,562 | |
| Puerto Rico Commonwealth GO Bonds Refunding for Public
Improvement Series 2009 B |
|
| | 1,150,000 | | | | 5.875 | | | | 07/01/36 | | | | 894,252 | |
| | 5,555,000 | | | | 5.750 | | | | 07/01/38 | | | | 4,268,073 | |
| | 2,955,000 | | | | 6.000 | | | | 07/01/39 | | | | 2,267,756 | |
| Puerto Rico Commonwealth GO Bonds Refunding for Public
Improvement Series 2009 C |
|
| | 275,000 | | | | 6.000 | | | | 07/01/39 | | | | 211,043 | |
| | |
| | |
| The accompanying notes are an integral part of these financial statements. | | 89 |
GOLDMAN SACHS STRATEGIC INCOME FUND
Schedule of Investments (continued)
September 30, 2014 (Unaudited)
| | | | | | | | | | | | | | |
Principal
Amount | | | Interest
Rate | | | Maturity
Date | | | Value | |
| | | | | | | | | | | | | | |
| Municipal Debt Obligations – (continued) | |
| Puerto Rico – (continued) | |
| Puerto Rico Commonwealth GO Bonds Refunding for Public
Improvement Series 2011 A |
|
| $ | 1,110,000 | | | | 6.000 | % | | | 07/01/34 | | | $ | 860,439 | |
| Puerto Rico Commonwealth GO Bonds Refunding for Public
Improvement Series 2011 E |
|
| | 1,000,000 | | | | 5.625 | | | | 07/01/32 | | | | 760,440 | |
| Puerto Rico Commonwealth GO Bonds Refunding for Public
Improvement Series 2012 A |
|
| | 515,000 | | | | 5.500 | | | | 07/01/26 | | | | 409,780 | |
| | 20,810,000 | | | | 5.500 | | | | 07/01/39 | | | | 15,552,978 | |
| | 8,010,000 | | | | 5.000 | | | | 07/01/41 | | | | 5,863,640 | |
| Puerto Rico Commonwealth GO Bonds Series 2007 A | |
| | 6,670,000 | | | | 5.250 | | | | 07/01/37 | | | | 5,019,375 | |
| Puerto Rico Commonwealth GO Bonds Series 2014 A | |
| | 343,490,000 | | | | 8.000 | | | | 07/01/35 | | | | 302,278,070 | |
| Puerto Rico Commonwealth GO Bonds Unrefunded Balance for
Public Improvement Series 2001 A |
|
| | 1,950,000 | | | | 5.125 | | | | 07/01/31 | | | | 1,458,736 | |
| Puerto Rico Commonwealth GO Bonds Unrefunded Balance for
Public Improvement Series 2004 A |
|
| | 455,000 | | | | 5.000 | | | | 07/01/34 | | | | 342,469 | |
| Puerto Rico Commonwealth GO Bonds Unrefunded Balance for
Public Improvement Series 2006 A |
|
| | 605,000 | | | | 5.250 | | | | 07/01/27 | | | | 467,024 | |
| Puerto Rico Sales Tax Financing Corp. Sales Tax RB Capital
Appreciation Series 2010 A(g) |
|
| | 1,990,000 | | | | 0.000 | | | | 08/01/35 | | | | 336,370 | |
| Puerto Rico Sales Tax Financing Corp. Sales Tax RB Capital
Appreciation SubSeries 2010 C(g) |
|
| | 5,285,000 | | | | 0.000 | | | | 08/01/37 | | | | 781,652 | |
| | 4,305,000 | | | | 0.000 | | | | 08/01/38 | | | | 601,882 | |
| Puerto Rico Sales Tax Financing Corp. Sales Tax RB
Series 2011 C |
|
| | 1,205,000 | | | | 5.250 | | | | 08/01/40 | | | | 1,026,877 | |
| Puerto Rico Sales Tax Financing Corp. Sales Tax RB
SubSeries 2009 A |
|
| | 1,005,000 | | | | 5.500 | | | | 08/01/23 | | | | 889,867 | |
| | 1,650,000 | | | | 5.250 | | | | 08/01/27 | | | | 1,373,592 | |
| | 35,660,000 | | | | 0.000 | (h) | | | 08/01/32 | | | | 28,058,714 | |
| | 22,040,000 | | | | 5.750 | | | | 08/01/37 | | | | 17,996,321 | |
| | 2,795,000 | | | | 6.375 | | | | 08/01/39 | | | | 2,349,729 | |
| | 59,935,000 | | | | 6.000 | | | | 08/01/42 | | | | 48,081,655 | |
| | 500,000 | | | | 6.500 | | | | 08/01/44 | | | | 423,090 | |
| Puerto Rico Sales Tax Financing Corp. Sales Tax RB
SubSeries 2010 A |
|
| | 9,275,000 | | | | 0.000 | (h) | | | 08/01/33 | | | | 5,425,040 | |
| | 19,375,000 | | | | 5.500 | | | | 08/01/37 | | | | 15,185,931 | |
| | 23,885,000 | | | | 5.375 | | | | 08/01/39 | | | | 18,224,494 | |
| | 41,790,000 | | | | 5.500 | | | | 08/01/42 | | | | 31,920,038 | |
| Puerto Rico Sales Tax Financing Corp. Sales Tax RB
SubSeries 2010 C |
|
| | 5,965,000 | | | | 5.375 | | | | 08/01/38 | | | | 4,626,514 | |
| | 3,150,000 | | | | 6.000 | | | | 08/01/39 | | | | 2,578,527 | |
| | 48,685,000 | | | | 5.250 | | | | 08/01/41 | | | | 35,923,688 | |
| | |
Principal
Amount | | | Interest
Rate | | | Maturity
Date | | | Value | |
| | | | | | | | | | | | | | |
| Municipal Debt Obligations – (continued) | |
| Puerto Rico – (continued) | |
| Puerto Rico Sales Tax Financing Corp. Sales Tax RB
SubSeries 2011 A-1 |
|
| 12,440,000 | | | | 5.000 | | | | 08/01/43 | | | | 8,912,140 | |
| | 4,060,000 | | | | 5.250 | | | | 08/01/43 | | | | 2,972,488 | |
| Puerto Rico Sales Tax Financing Corp. Sales Tax RB Unrefunded
SubSeries 2009 A |
|
| | 29,245,000 | | | | 5.500 | | | | 08/01/28 | | | | 24,706,176 | |
| | 2,995,000 | | | | 6.125 | | | | 08/01/29 | | | | 2,546,589 | |
| | |
| | TOTAL MUNICIPAL DEBT OBLIGATIONS | |
| | (Cost $623,530,494) | | | $ | 625,506,351 | |
| | |
| | | | | | | | | | | | | | |
| | Government Guarantee Obligation(b)(i) – 1.0% | |
| FMS Wertmanagement | |
| $ | 251,800,000 | | | | 0.484 | % | | | 06/30/15 | | | $ | 252,243,168 | |
| | (Cost $252,243,663) | | | | | |
| | |
| | | | | | | | | | | | | | |
| | U.S. Treasury Obligations – 20.8% | |
| United States Treasury Bonds | |
| $ | 111,200,000 | | | | 2.750 | % | | | 11/15/42 | | | $ | 101,727,986 | |
| | 99,400,000 | | | | 2.875 | | | | 05/15/43 | | | | 93,114,940 | |
| | 142,300,000 | | | | 3.625 | (j) | | | 08/15/43 | | | | 153,810,643 | |
| | 168,900,000 | | | | 3.750 | (j) | | | 11/15/43 | | | | 186,669,976 | |
| | 640,800,000 | | | | 3.625 | (j) | | | 02/15/44 | | | | 692,544,581 | |
| | 436,600,000 | | | | 3.375 | | | | 05/15/44 | | | | 450,710,921 | |
| United States Treasury Inflation Protected Securities | |
| | 28,698,480 | | | | 1.625 | | | | 01/15/15 | | | | 28,729,761 | |
| | 285,624,120 | | | | 0.500 | | | | 04/15/15 | | | | 285,935,450 | |
| | 132,533,098 | | | | 1.875 | | | | 07/15/15 | | | | 135,556,178 | |
| | 125,371,806 | | | | 0.125 | | | | 01/15/22 | | | | 122,530,881 | |
| | 79,906,029 | | | | 0.375 | | | | 07/15/23 | | | | 79,119,754 | |
| | 176,047,851 | | | | 0.625 | | | | 01/15/24 | | | | 177,037,240 | |
| | 34,844,580 | | | | 2.500 | | | | 01/15/29 | | | | 42,575,895 | |
| | 91,852,757 | | | | 1.375 | | | | 02/15/44 | | | | 98,325,620 | |
| United States Treasury Notes | |
| | 89,500,000 | | | | 0.250 | (j) | | | 01/15/15 | | | | 89,552,803 | |
| | 89,000,000 | | | | 0.250 | (j) | | | 02/15/15 | | | | 89,066,747 | |
| | 51,100,000 | | | | 0.125 | | | | 04/30/15 | | | | 51,118,909 | |
| | 220,000,000 | | | | 0.375 | | | | 01/31/16 | | | | 220,318,993 | |
| | 403,100,000 | | | | 1.625 | | | | 03/31/19 | | | | 401,955,208 | |
| | 425,700,000 | | | | 2.125 | (j) | | | 01/31/21 | | | | 425,648,912 | |
| | 990,500,000 | | | | 2.250 | | | | 04/30/21 | | | | 995,363,325 | |
| | 474,800,000 | | | | 2.125 | | | | 06/30/21 | | | | 472,682,397 | |
| | |
| | TOTAL U.S. TREASURY OBLIGATIONS | |
| | (Cost $5,278,914,340) | | | $ | 5,394,097,120 | |
| | |
| | | | | | | | | | | | | | |
| | Senior Term Loans(k) – 2.7% | |
| | Energy – 0.0% | |
| American Energy – Marcellus LLC | |
| $ | 7,600,000 | | | | 8.500 | % | | | 08/04/21 | | | $ | 7,524,000 | |
| | |
| | |
| 90 | | The accompanying notes are an integral part of these financial statements. |
GOLDMAN SACHS STRATEGIC INCOME FUND
| | | | | | | | | | | | | | |
Principal
Amount | | | Interest
Rate | | | Maturity
Date | | | Value | |
| | | | | | | | | | | | | | |
| Senior Term Loans(k) – (continued) | |
| | Environmental – 0.2% | |
| EnergySolutions LLC | |
| $ | 44,313,938 | | | | 6.750 | % | | | 05/29/20 | | | $ | 44,867,862 | |
| | |
| | Finance(l) – 0.2% | |
| Nuveen Investments, Inc. | |
| | 50,824,794 | | | | 0.000 | | | | 05/15/17 | | | | 50,670,287 | |
| | |
| | Food & Beverage(l) – 0.5% | |
| Burger King Corp. | |
| | 131,325,000 | | | | 0.000 | | | | 09/04/15 | | | | 131,325,000 | |
| | |
| | Health Care – Services – 0.1% | |
| American Renal Holdings, Inc. | |
| | 13,790,000 | | | | 4.500 | | | | 09/20/19 | | | | 13,548,675 | |
| | 18,775,000 | | | | 8.500 | | | | 03/20/20 | | | | 18,587,250 | |
| | | | | | | | | | | | | | |
| | | | | | | | | | | | | 32,135,925 | |
| | |
| | Media – Broadcasting & Radio – 0.5% | |
| Getty Images, Inc. | |
| | 21,288,960 | | | | 4.750 | | | | 10/18/19 | | | | 19,488,339 | |
| iHeart Communications, Inc. | |
| | 57,478,513 | | | | 3.804 | | | | 01/29/16 | | | | 56,868,091 | |
| Promotora de Informaciones SA | |
| EUR | 38,795,669 | | | | 9.750 | | | | 12/10/15 | | | | 51,695,937 | |
| | | | | | | | | | | | | | |
| | | | | | | | | | | | | 128,052,367 | |
| | |
| | Media – Non Cable – 0.2% | |
| Checkout Holding Corp. | |
| $ | 23,790,375 | | | | 4.500 | | | | 04/09/21 | | | | 23,118,297 | |
| | 16,750,000 | | | | 7.750 | | | | 04/11/22 | | | | 15,975,312 | |
| | | | | | | | | | | | | | |
| | | | | | | | | | | | | 39,093,609 | |
| | |
| | Restaurants(l) – 0.3% | |
| 1011778 B.C. Unlimited | |
| | 90,175,000 | | | | 0.000 | | | | 09/24/21 | | | | 89,473,438 | |
| | |
| | Retailers – 0.7% | |
| Alliance Boots Holdings Ltd. | |
| GBP | 41,241,941 | | | | 0.000 | | | | 07/09/15 | | | | 66,723,655 | |
| EUR | 8,971,352 | | | | 0.000 | | | | 07/09/17 | | | | 11,324,698 | |
| GBP | 21,125,000 | | | | 0.000 | | | | 07/09/17 | | | | 34,216,318 | |
| True Religion Apparel, Inc. | |
| $ | 57,288,866 | | | | 5.875 | | | | 07/30/19 | | | | 52,562,535 | |
| | 5,000,000 | | | | 11.000 | | | | 01/29/20 | | | | 4,700,000 | |
| | | | | | | | | | | | | | |
| | | | | | | | | | | | | 169,527,206 | |
| | |
| | TOTAL SENIOR TERM LOANS | | | | | |
| | (Cost $700,448,201) | | | $ | 692,669,694 | |
| | |
| | | | | | | | |
| Shares | | Rate | | | Value | |
| | | | | | | | |
| Preferred Stocks – 0.5% | |
| Banks – 0.3% | |
Citigroup Capital XIII(b) | |
| 797,300 | | | 7.875 | % | | $ | 21,463,316 | |
ING Groep NV | |
| 288,739 | | | 6.125 | | | | 7,241,574 | |
| 96,663 | | | 6.200 | | | | 2,423,341 | |
| 71,259 | | | 6.375 | | | | 1,801,428 | |
| |
Shares | | Rate | | | Value | |
| | | | | | | | |
| Preferred Stocks – (continued) | |
| Banks – (continued) | |
Morgan Stanley(b) | |
| 1,700,000 | | | 6.375 | | | | 42,619,000 | |
| | | | | | | | |
| | | | | | | 75,548,659 | |
| |
| Diversified Financial Services(b) – 0.2% | |
GMAC Capital Trust I | |
| 2,329,998 | | | 8.125 | | | | 62,001,247 | |
Merrill Lynch Capital Trust II | |
| 80,976 | | | 6.450 | | | | 2,046,263 | |
| | | | | | | | |
| | | | | | | 64,047,510 | |
| |
| TOTAL PREFERRED STOCKS – 0.5% | |
| (Cost $140,928,673) | | | $ | 139,596,169 | |
| |
| | | | | | | | |
| | | | | | | | | | | | | | |
Notional
Amount | | | Exercise
Rate | | | Expiration
Date | | | Value | |
| | | | | | | | | | | | | | |
| | Options Purchased – 2.7% | |
| | Interest Rate Swaptions | |
| Bank of America NA Call - OTC - 10 year Interest Rate Swap
Strike Price 3.590% |
|
| $ | 197,100,000 | | | | 3.590 | % | | | 03/22/16 | | | $ | 3,884,309 | |
| Bank of America NA Call - OTC - 10 year Interest Rate Swap
Strike Price 4.070% |
|
| | 197,600,000 | | | | 4.070 | | | | 03/29/16 | | | | 2,044,646 | |
| Citibank NA Put - OTC - 10 year Interest Rate Swap Strike
Price 3.017% |
|
| | 97,100,000 | | | | 3.017 | | | | 05/29/15 | | | | 2,730,617 | |
| Citibank NA Call - OTC - 10 year Interest Rate Swap Strike
Price 3.017% |
|
| | 97,100,000 | | | | 3.017 | | | | 05/29/15 | | | | 1,659,206 | |
| Citibank NA Put - OTC - 10 year Interest Rate Swap Strike
Price 3.040% |
|
| | 153,900,000 | | | | 3.040 | | | | 06/03/15 | | | | 4,530,093 | |
| Citibank NA Call - OTC - 10 year Interest Rate Swap Strike
Price 3.040% |
|
| | 153,900,000 | | | | 3.040 | | | | 06/03/15 | | | | 2,558,618 | |
| Citibank NA Call - OTC - 10 year Interest Rate Swap Strike
Price 3.645% |
|
| | 109,700,000 | | | | 3.645 | | | | 02/16/16 | | | | 1,813,089 | |
| Citibank NA Call - OTC - 10 year Interest Rate Swap Strike
Price 3.633% |
|
| | 86,400,000 | | | | 3.633 | | | | 02/19/16 | | | | 1,473,647 | |
| Citibank NA Call - OTC - 10 year Interest Rate Swap Strike
Price 3.570% |
|
| | 81,900,000 | | | | 3.570 | | | | 02/22/16 | | | | 1,529,769 | |
| Citibank NA Call - OTC - 10 year Interest Rate Swap Strike
Price 3.625% |
|
| | 79,000,000 | | | | 3.625 | | | | 02/22/16 | | | | 1,367,166 | |
| Citibank NA Put - OTC - 10 year Interest Rate Swap Strike
Price 3.725% |
|
| | 200,000,000 | | | | 3.725 | | | | 04/04/16 | | | | 13,324,800 | |
| Citibank NA Call - OTC - 10 year Interest Rate Swap Strike
Price 3.725% |
|
| | 200,000,000 | | | | 3.725 | | | | 04/04/16 | | | | 3,403,380 | |
| | |
| | |
| The accompanying notes are an integral part of these financial statements. | | 91 |
GOLDMAN SACHS STRATEGIC INCOME FUND
Schedule of Investments (continued)
September 30, 2014 (Unaudited)
| | | | | | | | | | | | | | |
Notional
Amount | | | Exercise
Rate | | | Expiration
Date | | | Value | |
| | | | | | | | | | | | | | |
| Options Purchased – (continued) | |
| Interest Rate Swaptions – (continued) | |
| Citibank NA Call - OTC - 10 year Interest Rate Swap Strike
Price 3.650% |
|
| $ | 415,000,000 | | | | 3.650 | % | | | 05/20/16 | | | $ | 8,827,797 | |
| Citibank NA Put - OTC - 10 year Interest Rate Swap Strike
Price 3.388% |
|
| | 310,100,000 | | | | 3.388 | | | | 09/19/16 | | | | 14,427,961 | |
| Citibank NA Call - OTC - 10 year Interest Rate Swap Strike
Price 3.388% |
|
| | 310,100,000 | | | | 3.388 | | | | 09/19/16 | | | | 11,039,126 | |
| Citibank NA Put - OTC - 30 year Interest Rate Swap Strike
Price 4.050% |
|
| | 24,100,000 | | | | 4.050 | | | | 01/28/16 | | | | 3,602,680 | |
| Citibank NA Call - OTC - 30 year Interest Rate Swap Strike
Price 4.050% |
|
| | 24,100,000 | | | | 4.050 | | | | 01/28/16 | | | | 528,638 | |
| Citibank NA Put - OTC - 30 year Interest Rate Swap Strike
Price 3.945% |
|
| | 24,700,000 | | | | 3.945 | | | | 03/18/16 | | | | 3,303,546 | |
| Citibank NA Call - OTC - 30 year Interest Rate Swap Strike
Price 3.945% |
|
| | 24,700,000 | | | | 3.945 | | | | 03/18/16 | | | | 741,790 | |
| Deutsche Bank AG Call - OTC - 2 year Interest Rate Swap Strike
Price 1.950% |
|
| | 269,900,000 | | | | 1.950 | | | | 10/26/15 | | | | 1,527,121 | |
| Deutsche Bank AG Call - OTC - 2 year Interest Rate Swap Strike
Price 2.030% |
|
| | 249,500,000 | | | | 2.030 | | | | 10/26/15 | | | | 1,265,414 | |
| Deutsche Bank AG Put - OTC - 5 year Interest Rate Swap Strike
Price 2.550% |
|
| | 361,400,000 | | | | 2.550 | | | | 09/28/15 | | | | 5,866,859 | |
| Deutsche Bank AG Call - OTC - 5 year Interest Rate Swap Strike
Price 2.550% |
|
| | 361,400,000 | | | | 2.550 | | | | 09/28/15 | | | | 5,523,710 | |
| Deutsche Bank AG Put - OTC - 5 year Interest Rate Swap Strike
Price 2.980% |
|
| | 337,600,000 | | | | 2.980 | | | | 03/04/16 | | | | 8,701,640 | |
| Deutsche Bank AG Call - OTC - 5 year Interest Rate Swap Strike
Price 2.980% |
|
| | 337,600,000 | | | | 2.980 | | | | 03/04/16 | | | | 4,941,620 | |
| Deutsche Bank AG Put - OTC - 5 year Interest Rate Swap Strike
Price 3.110% |
|
| | 477,100,000 | | | | 3.110 | | | | 09/19/16 | | | | 13,021,395 | |
| Deutsche Bank AG Call - OTC - 5 year Interest Rate Swap Strike
Price 3.110% |
|
| | 477,100,000 | | | | 3.110 | | | | 09/19/16 | | | | 9,558,221 | |
| Deutsche Bank AG Put - OTC - 5 year Interest Rate Swap Strike
Price 3.018% |
|
| | 479,800,000 | | | | 3.018 | | | | 09/26/16 | | | | 11,898,224 | |
| Deutsche Bank AG Call - OTC - 5 year Interest Rate Swap Strike
Price 3.018% |
|
| | 479,800,000 | | | | 3.018 | | | | 09/26/16 | | | | 10,605,211 | |
| Deutsche Bank AG Put - OTC - 5 year Interest Rate Swap Strike
Price 2.940% |
|
| | 382,200,000 | | | | 2.940 | | | | 09/29/16 | | | | 8,719,243 | |
| | |
Notional
Amount | | | Exercise
Rate | | | Expiration
Date | | | Value | |
| | | | | | | | | | | | | | |
| Options Purchased – (continued) | |
| Interest Rate Swaptions – (continued) | |
| Deutsche Bank AG Call - OTC - 5 year Interest Rate Swap Strike
Price 2.940% |
|
| 382,200,000 | | | | 2.940 | | | | 09/29/16 | | | | 9,140,733 | |
| Deutsche Bank AG Put - OTC - 10 year Interest Rate Swap Strike
Price 3.503% |
|
| | 301,100,000 | | | | 3.503 | | | | 07/02/15 | | | | 17,653,613 | |
| Deutsche Bank AG Call - OTC - 10 year Interest Rate Swap
Strike Price 3.503% |
|
| | 301,100,000 | | | | 3.503 | | | | 07/02/15 | | | | 2,261,381 | |
| Deutsche Bank AG Put - OTC - 10 year Interest Rate Swap Strike
Price 3.408% |
|
| | 305,600,000 | | | | 3.408 | | | | 09/19/16 | | | | 14,513,555 | |
| Deutsche Bank AG Call - OTC - 10 year Interest Rate Swap
Strike Price 3.408% |
|
| | 305,600,000 | | | | 3.408 | | | | 09/19/16 | | | | 10,664,462 | |
| Deutsche Bank AG Call - OTC - 10 year Interest Rate Swap
Strike Price 3.780% |
|
| | 402,300,000 | | | | 3.780 | | | | 09/26/16 | | | | 9,576,671 | |
| Deutsche Bank AG Put - OTC - 10 year Interest Rate Swap Strike
Price 4.120% |
|
| | 188,500,000 | | | | 4.120 | | | | 04/23/19 | | | | 15,736,772 | |
| Deutsche Bank AG Call - OTC - 10 year Interest Rate Swap
Strike Price 4.120% |
|
| | 188,500,000 | | | | 4.120 | | | | 04/23/19 | | | | 7,434,384 | |
| Deutsche Bank AG Put - OTC - 10 year Interest Rate Swap Strike
Price 4.130% |
|
| | 188,000,000 | | | | 4.130 | | | | 04/23/19 | | | | 15,792,940 | |
| Deutsche Bank AG Call - OTC - 10 year Interest Rate Swap
Strike Price 4.130% |
|
| | 188,000,000 | | | | 4.130 | | | | 04/23/19 | | | | 7,364,674 | |
| Deutsche Bank AG Put - OTC - 10 year Interest Rate Swap Strike
Price 4.095% |
|
| | 162,400,000 | | | | 4.095 | | | | 04/24/19 | | | | 13,348,582 | |
| Deutsche Bank AG Call - OTC - 10 year Interest Rate Swap
Strike Price 4.095% |
|
| | 162,400,000 | | | | 4.095 | | | | 04/24/19 | | | | 6,517,924 | |
| Deutsche Bank AG Put - OTC - 10 year Interest Rate Swap Strike
Price 3.963% |
|
| | 162,200,000 | | | | 3.963 | | | | 05/07/19 | | | | 12,244,770 | |
| Deutsche Bank AG Call - OTC - 10 year Interest Rate Swap
Strike Price 3.963% |
|
| | 162,200,000 | | | | 3.963 | | | | 05/07/19 | | | | 7,153,734 | |
| Deutsche Bank AG Call - OTC - 30 Year Interest Rate Swap
Strike Price 3.960% |
|
| | 18,500,000 | | | | 3.960 | | | | 01/29/16 | | | | 479,159 | |
| Deutsche Bank AG Put - OTC - 30 Year Interest Rate Swap
Strike Price 3.960% |
|
| | 18,500,000 | | | | 3.960 | | | | 01/29/16 | | | | 2,514,450 | |
| Deutsche Bank AG Put - OTC - 30 year Interest Rate Swap Strike
Price 3.920% |
|
| | 25,400,000 | | | | 3.920 | | | | 03/14/16 | | | | 3,306,369 | |
| Deutsche Bank AG Call - OTC - 30 year Interest Rate Swap
Strike Price 3.920% |
|
| | 25,400,000 | | | | 3.920 | | | | 03/14/16 | | | | 784,583 | |
| | |
| | |
| 92 | | The accompanying notes are an integral part of these financial statements. |
GOLDMAN SACHS STRATEGIC INCOME FUND
| | | | | | | | | | | | | | |
Notional
Amount | | | Exercise
Rate | | | Expiration
Date | | | Value | |
| | | | | | | | | | | | | | |
| Options Purchased – (continued) | |
| Interest Rate Swaptions – (continued) | |
| Deutsche Bank AG Put - OTC - 30 year Interest Rate Swap Strike
Price 4.015% |
|
| $ | 21,300,000 | | | | 4.015 | % | | | 04/15/19 | | | $ | 3,221,395 | |
| Deutsche Bank AG Call - OTC - 30 year Interest Rate Swap
Strike Price 4.015% |
|
| | 21,300,000 | | | | 4.015 | | | | 04/15/19 | | | | 1,545,924 | |
| JPMorgan Securities, Inc. Call - OTC - 2 year Interest Rate Swap
Strike Price 1.855% |
|
| | 262,500,000 | | | | 1.855 | | | | 11/02/15 | | | | 1,752,266 | |
| JPMorgan Securities, Inc. Call - OTC - 5 year Interest Rate Swap
Strike Price 2.783% |
|
| | 774,500,000 | | | | 2.783 | | | | 09/30/15 | | | | 8,616,313 | |
| JPMorgan Securities, Inc. Put - OTC - 5 year Interest Rate Swap
Strike Price 3.080% |
|
| | 319,000,000 | | | | 3.080 | | | | 09/19/16 | | | | 8,447,567 | |
| JPMorgan Securities, Inc. Call - OTC - 5 year Interest Rate Swap
Strike Price 3.080% |
|
| | 319,000,000 | | | | 3.080 | | | | 09/19/16 | | | | 6,573,155 | |
| JPMorgan Securities, Inc. Put - OTC - 5 year Interest Rate Swap
Strike Price 3.000% |
|
| | 624,200,000 | | | | 3.000 | | | | 09/22/16 | | | | 15,195,962 | |
| JPMorgan Securities, Inc. Call - OTC - 5 year Interest Rate Swap
Strike Price 3.000% |
|
| | 624,200,000 | | | | 3.000 | | | | 09/22/16 | | | | 13,975,900 | |
| JPMorgan Securities, Inc. Put - OTC - 5 year Interest Rate Swap
Strike Price 2.973% |
|
| | 535,500,000 | | | | 2.973 | | | | 09/26/16 | | | | 12,665,753 | |
| JPMorgan Securities, Inc. Call - OTC - 5 year Interest Rate Swap
Strike Price 2.973% |
|
| | 535,500,000 | | | | 2.973 | | | | 09/26/16 | | | | 12,332,779 | |
| JPMorgan Securities, Inc. Put - OTC - 5 year Interest Rate Swap
Strike Price 2.988% |
|
| | 323,200,000 | | | | 2.988 | | | | 09/26/16 | | | | 7,766,787 | |
| JPMorgan Securities, Inc. Call - OTC - 5 year Interest Rate Swap
Strike Price 2.988% |
|
| | 323,200,000 | | | | 2.988 | | | | 09/26/16 | | | | 7,342,490 | |
| JPMorgan Securities, Inc. Put - OTC - 10 year Interest Rate Swap
Strike Price 3.080% |
|
| | 147,700,000 | | | | 3.080 | | | | 06/04/15 | | | | 4,665,370 | |
| JPMorgan Securities, Inc. Call - OTC - 10 year Interest Rate
Swap Strike Price 3.080% |
|
| | 147,700,000 | | | | 3.080 | | | | 06/04/15 | | | | 2,287,223 | |
| JPMorgan Securities, Inc. Put - OTC - 10 year Interest Rate Swap
Strike Price 3.498% |
|
| | 186,000,000 | | | | 3.498 | | | | 07/02/15 | | | | 10,838,201 | |
| JPMorgan Securities, Inc. Call - OTC - 10 year Interest Rate
Swap Strike Price 3.498% |
|
| | 186,000,000 | | | | 3.498 | | | | 07/02/15 | | | | 1,412,261 | |
| JPMorgan Securities, Inc. Put - OTC - 10 year Interest Rate Swap
Strike Price 3.385% |
|
| | 160,300,000 | | | | 3.385 | | | | 09/19/16 | | | | 7,434,602 | |
| JPMorgan Securities, Inc. Call - OTC - 10 year Interest Rate
Swap Strike Price 3.610% |
|
| | 76,300,000 | | | | 3.610 | | | | 02/16/16 | | | | 1,324,827 | |
| | |
Notional
Amount | | | Exercise
Rate | | | Expiration
Date | | | Value | |
| | | | | | | | | | | | | | |
| Options Purchased – (continued) | |
| Interest Rate Swaptions – (continued) | |
| JPMorgan Securities, Inc. Call - OTC - 10 year Interest Rate
Swap Strike Price 3.385% |
|
| 160,300,000 | | | | 3.385 | | | | 09/19/16 | | | | 5,723,928 | |
| JPMorgan Securities, Inc. Put - OTC - 10 year Interest Rate Swap
Strike Price 3.391% |
|
| | 163,600,000 | | | | 3.391 | | | | 09/19/16 | | | | 7,637,977 | |
| JPMorgan Securities, Inc. Call - OTC - 10 year Interest Rate
Swap Strike Price 3.391% |
|
| | 163,600,000 | | | | 3.391 | | | | 09/19/16 | | | | 5,804,675 | |
| JPMorgan Securities, Inc. Put - OTC - 10 year Interest Rate Swap
Strike Price 3.413% |
|
| | 129,300,000 | | | | 3.413 | | | | 09/19/16 | | | | 6,172,950 | |
| JPMorgan Securities, Inc. Call - OTC - 10 year Interest Rate
Swap Strike Price 3.413% |
|
| | 129,300,000 | | | | 3.413 | | | | 09/19/16 | | | | 4,489,115 | |
| JPMorgan Securities, Inc. Put - OTC - 10 year Interest Rate Swap
Strike Price 3.293% |
|
| | 163,200,000 | | | | 3.293 | | | | 09/23/16 | | | | 6,851,169 | |
| JPMorgan Securities, Inc. Call - OTC - 10 year Interest Rate
Swap Strike Price 3.293% |
|
| | 163,200,000 | | | | 3.293 | | | | 09/23/16 | | | | 6,449,893 | |
| JPMorgan Securities, Inc. Call - OTC - 10 year Interest Rate
Swap Strike Price 4.105% |
|
| | 149,000,000 | | | | 4.105 | | | | 04/29/19 | | | | 5,952,222 | |
| JPMorgan Securities, Inc. Put - OTC - 10 year Interest Rate Swap
Strike Price 4.105% |
|
| | 149,000,000 | | | | 4.105 | | | | 04/29/19 | | | | 12,318,590 | |
| JPMorgan Securities, Inc. Put - OTC - 10 year Interest Rate Swap
Srike Price 3.955% |
|
| | 163,900,000 | | | | 3.955 | | | | 05/07/19 | | | | 12,312,693 | |
| JPMorgan Securities, Inc. Call - OTC - 10 year Interest Rate
Swap Strike Price 3.955% |
|
| | 163,900,000 | | | | 3.955 | | | | 05/07/19 | | | | 7,264,884 | |
| Morgan Stanley Capital Services, Inc. Put - OTC - 5 year Interest
Rate Swap Strike Price 2.550% |
|
| | 307,000,000 | | | | 2.550 | | | | 09/28/15 | | | | 4,983,746 | |
| Morgan Stanley Capital Services, Inc. Call - OTC - 5 year Interest
Rate Swap Strike Price 2.550% |
|
| | 307,000,000 | | | | 2.550 | | | | 09/28/15 | | | | 4,692,249 | |
| Morgan Stanley Capital Services, Inc. Put - OTC - 5 year Interest
Rate Swap Strike Price 2.513% |
|
| | 308,900,000 | | | | 2.513 | | | | 09/29/15 | | | | 4,865,175 | |
| Morgan Stanley Capital Services, Inc. Call - OTC - 5 year Interest
Rate Swap Strike Price 2.513% |
|
| | 308,900,000 | | | | 2.513 | | | | 09/29/15 | | | | 4,865,175 | |
| Morgan Stanley Capital Services, Inc. Put - OTC - 5 year Interest
Rate Swap Strike Price 3.050% |
|
| | 362,700,000 | | | | 3.050 | | | | 03/07/16 | | | | 10,108,558 | |
| Morgan Stanley Capital Services, Inc. Call - OTC - 5 year Interest
Rate Swap Strike Price 3.050% |
|
| | 362,700,000 | | | | 3.050 | | | | 03/07/16 | | | | 4,903,849 | |
| Morgan Stanley Capital Services, Inc. Put - OTC - 5 year Interest
Rate Swap Strike Price 3.115% |
|
| | 319,000,000 | | | | 3.115 | | | | 09/19/16 | | | | 8,749,947 | |
| | |
| | |
| The accompanying notes are an integral part of these financial statements. | | 93 |
GOLDMAN SACHS STRATEGIC INCOME FUND
Schedule of Investments (continued)
September 30, 2014 (Unaudited)
| | | | | | | | | | | | | | |
Notional
Amount | | | Exercise
Rate | | | Expiration
Date | | | Value | |
| | | | | | | | | | | �� | | | |
| Options Purchased – (continued) | |
| Interest Rate Swaptions – (continued) | |
| Morgan Stanley Capital Services, Inc. Call - OTC - 5 year Interest
Rate Swap Strike Price 3.115% |
|
| $ | 319,000,000 | | | | 3.115 | % | | | 09/19/16 | | | $ | 6,360,860 | |
| Morgan Stanley Capital Services, Inc. Put - OTC - 5 year Interest
Rate Swap Strike Price 2.950% |
|
| | 553,800,000 | | | | 2.950 | | | | 09/26/16 | | | | 12,787,408 | |
| Morgan Stanley Capital Services, Inc. Call - OTC - 5 year Interest
Rate Swap Strike Price 2.950% |
|
| | 553,800,000 | | | | 2.950 | | | | 09/26/16 | | | | 13,017,180 | |
| Morgan Stanley Capital Services, Inc. Put - OTC - 5 year Interest
Rate Swap Strike Price 2.930% |
|
| | 308,900,000 | | | | 2.930 | | | | 09/29/16 | | | | 7,197,370 | |
| Morgan Stanley Capital Services, Inc. Call - OTC - 5 year Interest
Rate Swap Strike Price 2.930% |
|
| | 308,900,000 | | | | 2.930 | | | | 09/29/16 | | | | 7,197,370 | |
| Morgan Stanley Capital Services, Inc. Put - OTC - 5 year Interest
Rate Swap Strike Price 2.940% |
|
| | 308,900,000 | | | | 2.940 | | | | 09/29/16 | | | | 7,189,648 | |
| Morgan Stanley Capital Services, Inc. Call - OTC - 5 year Interest
Rate Swap Strike Price 2.940% |
|
| | 308,900,000 | | | | 2.940 | | | | 09/29/16 | | | | 7,189,648 | |
| Morgan Stanley Capital Services, Inc. Call - OTC - 7 year Interest
Rate Swap Strike Price 3.010% |
|
| | 599,700,000 | | | | 3.010 | | | | 09/29/15 | | | | 8,947,884 | |
| Morgan Stanley Capital Services, Inc. Call - OTC - 10 year
Interest Rate Swap Strike Price 3.630% |
|
| | 300,200,000 | | | | 3.630 | | | | 02/16/16 | | | | 5,067,856 | |
| Morgan Stanley Capital Services, Inc. Call - OTC - 10 year
Interest Rate Swap Strike Price 3.652% |
|
| | 125,800,000 | | | | 3.652 | | | | 02/22/16 | | | | 2,096,331 | |
| Morgan Stanley Capital Services, Inc. Put - OTC - 10 year
Interest Rate Swap Strike Price 3.640% |
|
| | 369,800,000 | | | | 3.640 | | | | 03/04/16 | | | | 22,835,520 | |
| Morgan Stanley Capital Services, Inc. Call - OTC - 10 year
Interest Rate Swap Strike Price 3.640% |
|
| | 369,800,000 | | | | 3.640 | | | | 03/04/16 | | | | 6,503,673 | |
| Morgan Stanley Capital Services, Inc. Call - OTC - 10 year
Interest Rate Swap Strike Price 3.620% |
|
| | 297,700,000 | | | | 3.620 | | | | 03/07/16 | | | | 5,398,730 | |
| Morgan Stanley Capital Services, Inc. Put - OTC - 10 year
Interest Rate Swap Strike Price 3.388% |
|
| | 170,000,000 | | | | 3.388 | | | | 09/19/16 | | | | 7,905,374 | |
| Morgan Stanley Capital Services, Inc. Call - OTC - 10 year
Interest Rate Swap Strike Price 3.388% |
|
| | 170,000,000 | | | | 3.388 | | | | 09/19/16 | | | | 6,054,856 | |
| Morgan Stanley Capital Services, Inc. Put - OTC - 30 year
Interest Rate Swap Strike Price 4.180% |
|
| | 55,200,000 | | | | 4.180 | | | | 04/02/19 | | | | 9,403,927 | |
| Morgan Stanley Capital Services, Inc. Call - OTC - 30 year
Interest Rate Swap Strike Price 4.180% |
|
| | 55,200,000 | | | | 4.180 | | | | 04/02/19 | | | | 3,456,696 | |
| | |
| | TOTAL OPTIONS PURCHASED | |
| | (Cost $777,322,395) | | | $ | 711,064,193 | |
| | |
| TOTAL INVESTMENTS BEFORE SHORT-TERM
INVESTMENTS |
|
| | (Cost $24,226,223,151) | | | $ | 24,212,742,509 | |
| | |
Principal
Amount | | | Interest
Rate | | | Maturity
Date | | | Value | |
| | | | | | | | | | | | | | |
| | Short-term Investments – 4.9% | |
| | Repurchase Agreement – 4.9% | |
| Citigroup Global Markets, Inc. | |
| $ | 350,000,000 | | | | 1.133 | % | | | 03/23/15 | | | $ | 350,000,000 | |
| Maturity Value: $351,993,765 | |
| Settlement Date: 09/23/14 | |
| Collateralized by various asset-backed obligations, 0.335% to
7.120%, due 05/1/22 to 04/25/38, various collateralized
mortgage obligations, 0.494% to 6.031%, due 10/15/20 to
01/25/54, and various corporate obligations, 0.390% to 6.250%,
due 04/11/20 to 01/15/26. The aggregate market value of the
collateral, including accrued interest, was $417,635,740. |
|
| | |
| Joint Repurchase Agreement Account II(m) | |
| | 294,700,000 | | | | 0.012 | | | | 10/01/14 | | | | 294,700,000 | |
| | |
| Morgan Stanley | |
| | 100,000,000 | | | | 1.133 | | | | 03/23/15 | | | | 100,000,000 | |
| Maturity Value: $100,550,764 | |
| Settlement Date: 09/29/14 | |
| Collateralized by Champion Enterprises, Inc., 2.750%, due
01/11/37 and various equity securities. The aggregate market
value of the collateral, including accrued interest, was
$108,000,484. |
|
| | |
| Royal Bank of Scotland | |
| | 525,000,000 | | | | 1.156 | | | | 12/06/14 | | | | 525,000,000 | |
| Maturity Value: $528,000,786 | |
| Settlement Date: 06/11/14 | |
| Collateralized by various asset-backed obligations, 0.000% to
6.827%, due 08/17/20 to 04/12/49, various collateralized
mortgage obligations, 0.000% to 9.250%, due 12/01/16 to
10/15/57, various corporate obligations, 0.000% to 9.375%, due
10/31/14 to 10/31/49, and various government obligations,
0.000% to 9.040%, due 02/25/17 to 05/01/50. The aggregate
market value of the collateral, including accrued interest, was
$576,790,263. |
|
| | |
| | TOTAL SHORT-TERM INVESTMENTS | |
| | (Cost $1,269,700,000) | | | $ | 1,269,700,000 | |
| | |
| | TOTAL INVESTMENTS – 98.1% | | | | | |
| | (Cost $25,495,923,151) | | | $ | 25,482,442,509 | |
| | |
| OTHER ASSETS IN EXCESS OF
LIABILITIES – 1.9% |
| | | 505,804,333 | |
| | |
| | NET ASSETS – 100.0% | | | $ | 25,988,246,842 | |
| | |
| | |
| The percentage shown for each investment category reflects the value of investments in that category as a percentage of net assets. |
(a) | | Security with “Call” features with resetting interest rates. Maturity dates disclosed are the final maturity dates. |
(b) | | Variable rate security. Interest rate or distribution rate disclosed is that which is in effect at September 30, 2014. |
(c) | | Exempt from registration under Rule 144A of the Securities Act of 1933. Under procedures approved by the Board of Trustees, such securities have been determined to be liquid by the investment adviser and may be resold, normally to qualified institutional buyers in transactions exempt from registration. Total market value of Rule 144A securities amounts to $4,920,825,541, which represents approximately 18.9% of net assets as of September 30, 2014. |
| | |
| 94 | | The accompanying notes are an integral part of these financial statements. |
GOLDMAN SACHS STRATEGIC INCOME FUND
| | |
(d) | | Pay-in-kind securities. |
(e) | | Security with a notional or nominal principal amount. The actual effective yield of this security is different than the stated interest rate. |
(f) | | TBA (To Be Announced) Securities are purchased on a forward commitment basis with an approximate principal amount and no defined maturity date. The actual principal and maturity date will be determined upon settlement when the specific mortgage pools are assigned. Total market value of TBA securities (excluding forward sales contracts, if any) amounts to $125,309,059 which represents approximately 0.5% of net assets as of September 30, 2014. |
(g) | | Issued with a zero coupon. Income is recognized through the accretion of discount. |
(h) | | Coupon changes periodically based upon a predetermined schedule. Interest rate disclosed is that which is in effect at September 30, 2014. |
(i) | | Guaranteed by a foreign government until maturity. |
(j) | | All or a portion of security is segregated as collateral for initial margin requirements on futures transactions. |
(k) | | Senior Term Loans often require prepayments from excess cash flows or permit the borrower to repay at its election. The degree to which borrowers repay, whether as a contractual requirement or at their election, cannot be predicted with accuracy. As a result, the actual remaining maturity may be substantially less than the stated maturities shown. The stated interest rate represents the weighted average interest rate of all contracts within the senior loan facility at September 30, 2014. Senior Term Loans typically have rates of interest which are predetermined either daily, monthly, quarterly or semi-annually by reference to a base lending rate, plus a premium. These base lending rates are primarily the London-Interbank Offered Rate (“LIBOR”), and secondarily the prime rate offered by one or more major United States banks (the “Prime Rate”) and the certificate of deposit (“CD”) rate or other base lending rates used by commercial lenders. |
(l) | | This position represents an unsettled loan commitment at period end. Certain details associated with this purchase are not known prior to the settlement date, including coupon rate. |
(m) | | Joint repurchase agreement was entered into on September 30, 2014. Additional information appears on page 118. |
| | |
|
Currency Abbreviations: |
AUD | | —Australian Dollar |
BRL | | —Brazilian Real |
CAD | | —Canadian Dollar |
CHF | | —Swiss Franc |
CNH | | —Chinese Yuan Renminbi Offshore |
DOP | | —Dominican Peso |
EUR | | —Euro |
GBP | | —British Pound |
HUF | | —Hungarian Forint |
IDR | | —Indonesian Rupiah |
ILS | | —Israeli Shekel |
INR | | —Indian Rupee |
JPY | | —Japanese Yen |
KRW | | —South Korean Won |
MXN | | —Mexican Peso |
MYR | | —Malaysian Ringgit |
NOK | | —Norwegian Krone |
NZD | | —New Zealand Dollar |
PHP | | —Philippine Peso |
PLN | | —Polish Zloty |
RUB | | —Russian Ruble |
SEK | | —Swedish Krona |
SGD | | —Singapore Dollar |
TRY | | —Turkish Lira |
TWD | | —Taiwan Dollar |
USD | | —U.S. Dollar |
ZAR | | —South African Rand |
| | |
Investment Abbreviations: |
AUDOR | | —Australian Dollar Offered Rate |
CDOR | | —Canadian Dollar Offered Rate |
CHFOR | | —Swiss Franc Offered Rate |
CLO | | —Collateralized Loan Obligation |
EURO | | —Euro Offered Rate |
FFCB | | —Federal Farm Credit Bank |
FHLB | | —Federal Home Loan Bank |
FHLMC | | —Federal Home Loan Mortgage Corp. |
FNMA | | —Federal National Mortgage Association |
GNMA | | —Government National Mortgage Association |
GO | | —General Obligation |
JIBAR | | —Johannesburg Interbank Agreed Rate |
JYOR | | —Japanese Yen Offered Rate |
KLIBOR | | —Kuala Lumpur Interbank Offered Rate |
KWCDC | | —South Korean Won Certificate of Deposit |
LIBOR | | —London Interbank Offered Rate |
LP | | —Limited Partnership |
NIBOR | | —Norwegian Interbank Offered Rate |
NZDOR | | —New Zealand Dollar Offered Rate |
OTC | | —Over the Counter |
RB | | —Revenue Bond |
REMIC | | —Real Estate Mortgage Investment Conduit |
STIBOR | | —Stockholm Interbank Offered Rate |
TIIE | | —La Tasa de Interbank Equilibrium Interest Rate |
WIBOR | | —Warsaw Interbank Offered Rate |
|
| | |
| The accompanying notes are an integral part of these financial statements. | | 95 |
GOLDMAN SACHS STRATEGIC INCOME FUND
Schedule of Investments (continued)
September 30, 2014 (Unaudited)
|
| ADDITIONAL INVESTMENT INFORMATION |
FORWARD FOREIGN CURRENCY EXCHANGE CONTRACTS — At September 30, 2014, the Fund had the following forward foreign currency exchange contracts:
FORWARD FOREIGN CURRENCY EXCHANGE CONTRACTS WITH UNREALIZED GAIN
| | | | | | | | | | | | | | |
| Counterparty | | Contracts to
Buy/Sell | | Settlement
Date | | | Current
Value | | | Unrealized
Gain | |
Bank of America Securites LLC | | GBP/EUR | | | 12/17/14 | | | $ | 82,654,989 | | | $ | 2,237,158 | |
| | NOK/EUR | | | 12/17/14 | | | | 83,073,293 | | | | 1,694,876 | |
| | USD/EUR | | | 12/17/14 | | | | 1,624,341,638 | | | | 53,407,203 | |
| | USD/JPY | | | 12/17/14 | | | | 165,742,612 | | | | 3,788,388 | |
| | USD/MYR | | | 10/03/14 | | | | 67,348,673 | | | | 894,527 | |
| | USD/SEK | | | 11/06/14 | | | | 105,896,968 | | | | 1,554,006 | |
Barclays Bank PLC | | CAD/CHF | | | 12/17/14 | | | | 70,647,670 | | | | 43,639 | |
| | GBP/USD | | | 12/17/14 | | | | 254,713,265 | | | | 1,168,376 | |
| | USD/AUD | | | 12/17/14 | | | | 233,485,767 | | | | 9,590,148 | |
| | USD/BRL | | | 10/24/14 | | | | 137,704,246 | | | | 11,032,754 | |
| | USD/EUR | | | 10/30/14 | | | | 70,072,042 | | | | 273,592 | |
| | USD/ILS | | | 12/17/14 | | | | 89,906,242 | | | | 6,235,088 | |
| | USD/INR | | | 10/07/14 | | | | 170,119,787 | | | | 2,688,213 | |
| | USD/INR | | | 10/27/14 | | | | 66,495,625 | | | | 1,062,375 | |
| | USD/KRW | | | 10/27/14 | | | | 128,403,497 | | | | 1,238,503 | |
| | USD/MYR | | | 10/03/14 | | | | 62,287,860 | | | | 202,332 | |
| | USD/NZD | | | 12/17/14 | | | | 80,953,538 | | | | 3,244,725 | |
| | USD/SEK | | | 12/17/14 | | | | 145,779,556 | | | | 2,524,414 | |
BNP Paribas SA | | EUR/PLN | | | 12/17/14 | | | | 83,934,398 | | | | 175,179 | |
| | EUR/USD | | | 12/17/14 | | | | 170,511,615 | | | | 23,268 | |
| | GBP/EUR | | | 12/17/14 | | | | 80,236,151 | | | | 1,872,276 | |
| | USD/AUD | | | 12/17/14 | | | | 328,967,012 | | | | 8,815,828 | |
| | USD/BRL | | | 10/22/14 | | | | 82,601,837 | | | | 2,413,163 | |
| | USD/GBP | | | 12/17/14 | | | | 169,243,451 | | | | 648,738 | |
| | USD/MXN | | | 10/31/14 | | | | 413,227,565 | | | | 7,628,913 | |
| | USD/MYR | | | 10/20/14 | | | | 83,657,435 | | | | 1,347,565 | |
| | USD/RUB | | | 10/27/14 | | | | 167,414,132 | | | | 2,848,868 | |
| | USD/TRY | | | 12/17/14 | | | | 77,882,231 | | | | 3,800,275 | |
Citibank NA | | CHF/EUR | | | 12/17/14 | | | | 81,116,992 | | | | 242,963 | |
| | GBP/EUR | | | 12/17/14 | | | | 166,830,281 | | | | 906,323 | |
| | NOK/EUR | | | 12/17/14 | | | | 249,725,384 | | | | 3,396,525 | |
| | PHP/USD | | | 10/20/14 | | | | 42,597,684 | | | | 8,684 | |
| | USD/CAD | | | 12/17/14 | | | | 122,748,403 | | | | 1,747,097 | |
| | USD/CHF | | | 12/17/14 | | | | 254,675,351 | | | | 5,135,270 | |
| | USD/EUR | | | 10/30/14 | | | | 1,446,057,412 | | | | 36,834,531 | |
| | USD/INR | | | 10/14/14 | | | | 165,728,985 | | | | 2,904,015 | |
| | USD/NZD | | | 11/13/14 | | | | 46,463,661 | | | | 442,255 | |
| | USD/NZD | | | 12/17/14 | | | | 117,829,596 | | | | 7,083,931 | |
| | USD/PHP | | | 10/14/14 | | | | 41,285,375 | | | | 976,625 | |
| | USD/SGD | | | 12/17/14 | | | | 132,861,586 | | | | 2,225,257 | |
| | USD/TRY | | | 12/17/14 | | | | 81,433,078 | | | | 2,715,922 | |
| | USD/TWD | | | 10/17/14 | | | | 168,238,466 | | | | 1,771,534 | |
| | USD/TWD | | | 10/20/14 | | | | 168,305,691 | | | | 1,493,309 | |
Credit Suisse International (London) | | USD/CAD | | | 11/06/14 | | | | 62,485,173 | | | | 1,167,232 | |
| | USD/CHF | | | 12/17/14 | | | | 274,559,210 | | | | 5,719,947 | |
| | USD/RUB | | | 10/02/14 | | | | 79,026,727 | | | | 4,156,273 | |
Deutsche Bank AG (London) | | RUB/USD | | | 11/17/14 | | | | 12,076,950 | | | | 21,137 | |
| | USD/CNH | | | 12/17/14 | | | | 339,861,155 | | | | 1,353,845 | |
| | USD/EUR | | | 12/17/14 | | | | 82,724,495 | | | | 2,063,239 | |
| | |
| 96 | | The accompanying notes are an integral part of these financial statements. |
GOLDMAN SACHS STRATEGIC INCOME FUND
|
| ADDITIONAL INVESTMENT INFORMATION (continued) |
FORWARD FOREIGN CURRENCY EXCHANGE CONTRACTS WITH UNREALIZED GAIN (continued)
| | | | | | | | | | | | | | |
| Counterparty | | Contracts to
Buy/Sell | | Settlement
Date | | | Current
Value | | | Unrealized
Gain | |
Deutsche Bank AG (London) (continued) | | USD/GBP | | | 10/22/14 | | | $ | 251,400,820 | | | $ | 3,800,413 | |
| | USD/INR | | | 10/07/14 | | | | 15,266,778 | | | | 72,793 | |
| | USD/KRW | | | 10/14/14 | | | | 165,168,987 | | | | 3,464,013 | |
| | USD/MXN | | | 12/17/14 | | | | 167,780,684 | | | | 2,248,316 | |
| | USD/MYR | | | 10/07/14 | | | | 186,560,447 | | | | 5,349,553 | |
| | USD/NZD | | | 12/17/14 | | | | 331,836,394 | | | | 6,667,973 | |
| | USD/PHP | | | 10/14/14 | | | | 37,730,095 | | | | 884,905 | |
| | USD/PHP | | | 10/20/14 | | | | 83,719,759 | | | | 1,179,241 | |
| | USD/RUB | | | 10/02/14 | | | | 12,180,494 | | | | 892 | |
| | USD/RUB | | | 11/17/14 | | | | 86,910,086 | | | | 6,187,809 | |
| | USD/SEK | | | 12/17/14 | | | | 157,740,914 | | | | 2,991,851 | |
| | USD/TWD | | | 10/20/14 | | | | 13,201,180 | | | | 92,436 | |
HSBC Bank PLC | | GBP/USD | | | 12/17/14 | | | | 85,241,389 | | | | 729,016 | |
| | SEK/EUR | | | 12/17/14 | | | | 170,931,184 | | | | 62,438 | |
| | TWD/USD | | | 10/20/14 | | | | 85,577,424 | | | | 53,424 | |
| | USD/BRL | | | 10/24/14 | | | | 198,239,461 | | | | 15,681,228 | |
| | USD/BRL | | | 10/27/14 | | | | 71,344,434 | | | | 1,121,752 | |
| | USD/CNH | | | 12/17/14 | | | | 341,733,902 | | | | 362,098 | |
| | USD/GBP | | | 12/17/14 | | | | 162,009,994 | | | | 4,210,155 | |
| | USD/JPY | | | 12/17/14 | | | | 83,078,982 | | | | 1,820,018 | |
| | USD/KRW | | | 10/22/14 | | | | 25,075,812 | | | | 317,870 | |
| | USD/KRW | | | 10/23/14 | | | | 58,877,118 | | | | 762,882 | |
| | USD/NZD | | | 12/17/14 | | | | 117,829,596 | | | | 7,530,148 | |
| | USD/SGD | | | 12/17/14 | | | | 191,436,923 | | | | 3,597,248 | |
| | USD/TRY | | | 12/17/14 | | | | 82,965,199 | | | | 4,186,065 | |
JPMorgan Chase Bank (London) | | MXN/USD | | | 10/31/14 | | | | 54,650,750 | | | | 387,008 | |
| | MXN/USD | | | 12/17/14 | | | | 85,806,676 | | | | 282,676 | |
| | SEK/EUR | | | 12/17/14 | | | | 315,396,696 | | | | 1,148,738 | |
| | USD/BRL | | | 10/24/14 | | | | 36,844,689 | | | | 1,496,033 | |
| | USD/EUR | | | 10/30/14 | | | | 1,738,889,841 | | | | 42,553,794 | |
| | USD/EUR | | | 12/17/14 | | | | 84,570,849 | | | | 707,315 | |
| | USD/IDR | | | 10/31/14 | | | | 44,310,396 | | | | 893,632 | |
| | USD/INR | | | 10/29/14 | | | | 115,423,665 | | | | 1,396,335 | |
| | USD/JPY | | | 12/17/14 | | | | 263,657,559 | | | | 11,881,998 | |
| | USD/MXN | | | 10/31/14 | | | | 413,227,565 | | | | 8,154,983 | |
| | USD/MXN | | | 12/17/14 | | | | 422,814,044 | | | | 7,397,956 | |
| | USD/RUB | | | 10/20/14 | | | | 41,366,412 | | | | 1,140,588 | |
| | USD/RUB | | | 11/17/14 | | | | 85,101,037 | | | | 5,439,863 | |
| | USD/TRY | | | 12/17/14 | | | | 161,766,215 | | | | 6,532,785 | |
Merrill Lynch International Bank Ltd. | | MXN/USD | | | 10/31/14 | | | | 33,917,767 | | | | 164,248 | |
Morgan Stanley & Co. International PLC | | TWD/USD | | | 10/17/14 | | | | 170,445,451 | | | | 90,451 | |
| | USD/AUD | | | 12/17/14 | | | | 106,596,397 | | | | 3,664,914 | |
| | USD/ILS | | | 12/17/14 | | | | 146,006,147 | | | | 8,956,599 | |
| | USD/TRY | | | 12/17/14 | | | | 78,909,767 | | | | 3,936,474 | |
Royal Bank of Scotland PLC | | USD/AUD | | | 12/17/14 | | | | 168,874,272 | | | | 623,493 | |
| | USD/CAD | | | 12/17/14 | | | | 421,509,874 | | | | 3,415,626 | |
| | USD/EUR | | | 10/30/14 | | | | 68,897,584 | | | | 1,579,376 | |
| | USD/EUR | | | 12/17/14 | | | | 80,995,039 | | | | 2,055,674 | |
| | USD/GBP | | | 12/17/14 | | | | 180,758,661 | | | | 876,422 | |
| | USD/JPY | | | 12/17/14 | | | | 177,305,595 | | | | 1,047,848 | |
| | USD/MXN | | | 11/28/14 | | | | 180,583,610 | | | | 2,365,002 | |
| | USD/TRY | | | 12/17/14 | | | | 166,233,424 | | | | 3,795,576 | |
| | |
| The accompanying notes are an integral part of these financial statements. | | 97 |
GOLDMAN SACHS STRATEGIC INCOME FUND
Schedule of Investments (continued)
September 30, 2014 (Unaudited)
|
| ADDITIONAL INVESTMENT INFORMATION (continued) |
FORWARD FOREIGN CURRENCY EXCHANGE CONTRACTS WITH UNREALIZED GAIN (continued)
| | | | | | | | | | | | | | |
| Counterparty | | Contracts to
Buy/Sell | | Settlement
Date | | | Current
Value | | | Unrealized
Gain | |
Standard Chartered Bank | | USD/AUD | | | 12/17/14 | | | $ | 284,427,054 | | | $ | 11,578,944 | |
| | USD/CNH | | | 12/17/14 | | | | 332,896,024 | | | | 1,083,976 | |
| | USD/EUR | | | 12/17/14 | | | | 82,931,752 | | | | 2,269,214 | |
| | USD/TRY | | | 12/17/14 | | | | 75,921,044 | | | | 3,895,640 | |
State Street Bank (London) | | AUD/USD | | | 12/17/14 | | | | 170,240,781 | | | | 810,559 | |
| | EUR/USD | | | 10/30/14 | | | | 362,261,656 | | | | 1,483,236 | |
| | USD/AUD | | | 12/17/14 | | | | 53,095,330 | | | | 1,191,265 | |
| | USD/CHF | | | 12/17/14 | | | | 256,535,443 | | | | 5,620,786 | |
| | USD/JPY | | | 12/17/14 | | | | 248,828,280 | | | | 5,822,720 | |
| | USD/NZD | | | 12/17/14 | | | | 126,893,411 | | | | 8,010,595 | |
| | USD/SEK | | | 12/17/14 | | | | 145,664,559 | | | | 2,192,937 | |
UBS AG (London) | | NZD/USD | | | 12/17/14 | | | | 160,842,143 | | | | 491,174 | |
| | USD/BRL | | | 10/14/14 | | | | 168,666,142 | | | | 1,804,858 | |
| | USD/EUR | | | 12/17/14 | | | | 84,516,508 | | | | 655,899 | |
| | USD/HUF | | | 12/17/14 | | | | 112,764,129 | | | | 2,813,828 | |
| | USD/JPY | | | 11/07/14 | | | | 109,983,943 | | | | 411,304 | |
Westpac Banking Corp. | | AUD/USD | | | 12/17/14 | | | | 255,812,830 | | | | 649,167 | |
| | USD/AUD | | | 12/17/14 | | | | 385,141,105 | | | | 14,931,409 | |
| | USD/EUR | | | 10/30/14 | | | | 80,627,019 | | | | 1,852,084 | |
| | USD/EUR | | | 12/17/14 | | | | 327,761,205 | | | | 7,762,864 | |
| | USD/MYR | | | 10/07/14 | | | | 11,167,320 | | | | 324,108 | |
| | USD/MYR | | | 10/20/14 | | | | 79,228,532 | | | | 1,547,621 | |
| | USD/NZD | | | 12/17/14 | | | | 160,536,991 | | | | 9,790,380 | |
| | | USD/SGD | | | 12/17/14 | | | | 167,079,597 | | | | 3,152,470 | |
| TOTAL | | | | | | | | | | | | $ | 500,327,286 | |
FORWARD FOREIGN CURRENCY EXCHANGE CONTRACTS WITH UNREALIZED LOSS
| | | | | | | | | | | | | | |
| Counterparty | | Contracts to
Buy/Sell | | Settlement
Date | | | Current
Value | | | Unrealized
Loss | |
Bank of America Securites LLC | | EUR/GBP | | | 12/17/14 | | | $ | 162,400,753 | | | $ | (2,456,703 | ) |
| | EUR/USD | | | 12/17/14 | | | | 398,688,620 | | | | (6,517,056 | ) |
| | HUF/USD | | | 12/17/14 | | | | 76,499,305 | | | | (1,451,695 | ) |
| | NZD/USD | | | 11/13/14 | | | | 55,769,570 | | | | (717,470 | ) |
Barclays Bank PLC | | EUR/PLN | | | 12/17/14 | | | | 166,449,235 | | | | (1,156,951 | ) |
| | EUR/USD | | | 12/17/14 | | | | 83,160,493 | | | | (1,935,990 | ) |
| | ILS/USD | | | 12/17/14 | | | | 42,244,568 | | | | (1,280,379 | ) |
| | INR/USD | | | 10/07/14 | | | | 117,068,297 | | | | (1,307,773 | ) |
| | INR/USD | | | 10/27/14 | | | | 126,438,734 | | | | (2,289,673 | ) |
| | JPY/USD | | | 11/07/14 | | | | 55,233,666 | | | | (168,974 | ) |
| | JPY/USD | | | 12/17/14 | | | | 80,733,907 | | | | (3,354,093 | ) |
| | MYR/USD | | | 10/20/14 | | | | 68,317,364 | | | | (101,636 | ) |
| | MYR/USD | | | 10/29/14 | | | | 104,443,186 | | | | (544,877 | ) |
| | NZD/USD | | | 12/17/14 | | | | 78,707,497 | | | | (4,666,865 | ) |
| | PLN/USD | | | 12/17/14 | | | | 113,739,066 | | | | (3,737,581 | ) |
| | TWD/USD | | | 10/27/14 | | | | 84,590,001 | | | | (563,999 | ) |
BNP Paribas SA | | AUD/USD | | | 12/17/14 | | | | 162,231,965 | | | | (6,115,517 | ) |
| | GBP/USD | | | 12/17/14 | | | | 85,293,008 | | | | (2,170,442 | ) |
| | ILS/USD | | | 12/17/14 | | | | 125,539,208 | | | | (1,621,792 | ) |
| | INR/USD | | | 10/14/14 | | | | 29,855,225 | | | | (406,204 | ) |
| | PLN/USD | | | 12/17/14 | | | | 114,662,758 | | | | (2,644,989 | ) |
Citibank NA | | AUD/USD | | | 12/17/14 | | | | 248,790,042 | | | | (5,028,532 | ) |
| | |
| 98 | | The accompanying notes are an integral part of these financial statements. |
GOLDMAN SACHS STRATEGIC INCOME FUND
|
| ADDITIONAL INVESTMENT INFORMATION (continued) |
FORWARD FOREIGN CURRENCY EXCHANGE CONTRACTS WITH UNREALIZED LOSS (continued)
| | | | | | | | | | | | | | |
| Counterparty | | Contracts to
Buy/Sell | | Settlement
Date | | | Current
Value | | | Unrealized
Loss | |
Citibank NA (continued) | | EUR/CHF | | | 12/17/14 | | | $ | 163,006,247 | | | $ | (97,415 | ) |
| | EUR/GBP | | | 12/17/14 | | | | 84,252,443 | | | | (1,035,081 | ) |
| | GBP/USD | | | 10/22/14 | | | | 84,754,033 | | | | (1,286,765 | ) |
| | IDR/USD | | | 10/31/14 | | | | 44,310,396 | | | | (1,744,327 | ) |
| | ILS/USD | | | 12/17/14 | | | | 73,499,573 | | | | (1,848,427 | ) |
| | JPY/USD | | | 11/07/14 | | | | 64,580,851 | | | | (254,568 | ) |
| | MXN/USD | | | 12/17/14 | | | | 162,700,487 | | | | (2,196,675 | ) |
| | MYR/USD | | | 10/03/14 | | | | 65,726,873 | | | | (1,579,844 | ) |
| | NOK/EUR | | | 12/17/14 | | | | 170,931,184 | | | | (252,107 | ) |
| | NZD/USD | | | 12/17/14 | | | | 59,123,562 | | | | (2,342,269 | ) |
| | PHP/USD | | | 10/29/14 | | | | 30,994,994 | | | | (119,006 | ) |
Credit Suisse International (London) | | EUR/CHF | | | 12/17/14 | | | | 171,026,448 | | | | (95,264 | ) |
| | RUB/USD | | | 10/02/14 | | | | 78,259,746 | | | | (5,179,254 | ) |
| | RUB/USD | | | 10/27/14 | | | | 165,449,832 | | | | (4,857,168 | ) |
Deutsche Bank AG (London) | | AUD/USD | | | 12/17/14 | | | | 162,396,521 | | | | (6,342,527 | ) |
| | EUR/USD | | | 12/17/14 | | | | 493,439,059 | | | | (9,976,947 | ) |
| | IDR/USD | | | 11/03/14 | | | | 85,039,586 | | | | (138,414 | ) |
| | INR/USD | | | 10/29/14 | | | | 15,171,492 | | | | (111,009 | ) |
| | PHP/USD | | | 10/20/14 | | | | 85,467,245 | | | | (56,755 | ) |
| | PLN/USD | | | 12/17/14 | | | | 36,798,677 | | | | (1,320,323 | ) |
| | RUB/USD | | | 10/02/14 | | | | 12,947,476 | | | | (679,682 | ) |
| | SEK/USD | | | 11/06/14 | | | | 89,971,277 | | | | (1,177,734 | ) |
HSBC Bank PLC | | EUR/USD | | | 12/17/14 | | | | 147,509,911 | | | | (2,159,384 | ) |
| | INR/USD | | | 10/27/14 | | | | 116,897,738 | | | | (1,806,202 | ) |
| | MXN/USD | | | 12/17/14 | | | | 161,162,928 | | | | (2,047,283 | ) |
| | RUB/USD | | | 10/17/14 | | | | 41,223,980 | | | | (1,226,020 | ) |
| | SGD/USD | | | 12/17/14 | | | | 154,319,491 | | | | (1,290,509 | ) |
| | USD/GBP | | | 12/17/14 | | | | 168,551,696 | | | | (542,073 | ) |
JPMorgan Chase Bank (London) | | EUR/GBP | | | 12/17/14 | | | | 169,055,211 | | | | (4,594,481 | ) |
| | EUR/NOK | | | 12/17/14 | | | | 164,406,255 | | | | (2,284,746 | ) |
| | JPY/USD | | | 12/17/14 | | | | 331,620,612 | | | | (7,976,388 | ) |
| | MYR/USD | | | 10/03/14 | | | | 63,909,660 | | | | (1,391,482 | ) |
| | MYR/USD | | | 10/07/14 | | | | 148,813,931 | | | | (2,652,558 | ) |
| | MYR/USD | | | 10/20/14 | | | | 31,147,383 | | | | (110,617 | ) |
| | RUB/USD | | | 11/17/14 | | | | 24,302,725 | | | | (997,550 | ) |
| | SEK/USD | | | 12/17/14 | | | | 165,317,878 | | | | (2,981,122 | ) |
| | TRY/USD | | | 12/17/14 | | | | 83,532,603 | | | | (1,781,397 | ) |
| | USD/GBP | | | 10/22/14 | | | | 17,244,385 | | | | (90,010 | ) |
| | USD/MXN | | | 12/17/14 | | | | 239,058,955 | | | | (517,955 | ) |
Merrill Lynch International Bank Ltd. | | EUR/USD | | | 10/30/14 | | | | 600,370,384 | | | | (12,073,142 | ) |
Morgan Stanley & Co. International PLC | | AUD/USD | | | 12/17/14 | | | | 162,015,170 | | | | (6,199,591 | ) |
| | BRL/USD | | | 10/14/14 | | | | 71,607,737 | | | | (3,129,855 | ) |
| | BRL/USD | | | 10/27/14 | | | | 94,092,121 | | | | (2,047,879 | ) |
| | CHF/USD | | | 12/17/14 | | | | 83,117,874 | | | | (1,781,126 | ) |
| | EUR/CHF | | | 12/17/14 | | | | 167,138,502 | | | | (132,558 | ) |
| | EUR/HUF | | | 12/17/14 | | | | 42,106,711 | | | | (794,382 | ) |
| | EUR/USD | | | 12/17/14 | | | | 510,964,257 | | | | (2,678,441 | ) |
| | INR/USD | | | 10/27/14 | | | | 117,757,940 | | | | (1,907,354 | ) |
| | KRW/USD | | | 10/27/14 | | | | 83,515,734 | | | | (1,638,266 | ) |
Royal Bank of Scotland PLC | | CAD/USD | | | 11/06/14 | | | | 61,182,398 | | | | (1,154,792 | ) |
| | CAD/USD | | | 12/17/14 | | | | 460,966,579 | | | | (7,592,488 | ) |
| | EUR/USD | | | 10/30/14 | | | | 377,493,882 | | | | (1,445,816 | ) |
| | EUR/USD | | | 12/17/14 | | | | 165,369,374 | | | | (3,110,364 | ) |
| | GBP/USD | | | 12/17/14 | | | | 167,394,991 | | | | (2,703,563 | ) |
| | JPY/USD | | | 12/17/14 | | | | 160,654,025 | | | | (7,521,975 | ) |
| | |
| The accompanying notes are an integral part of these financial statements. | | 99 |
GOLDMAN SACHS STRATEGIC INCOME FUND
Schedule of Investments (continued)
September 30, 2014 (Unaudited)
|
| ADDITIONAL INVESTMENT INFORMATION (continued) |
FORWARD FOREIGN CURRENCY EXCHANGE CONTRACTS WITH UNREALIZED LOSS (continued)
| | | | | | | | | | | | | | |
| Counterparty | | Contracts to
Buy/Sell | | Settlement
Date | | | Current
Value | | | Unrealized
Loss | |
Royal Bank of Scotland PLC (continued) | | MXN/USD | | | 10/31/14 | | | $ | 28,119,906 | | | $ | (386,281 | ) |
| | MXN/USD | | | 12/17/14 | | | | 330,816,905 | | | | (6,294,760 | ) |
| | NZD/USD | | | 12/17/14 | | | | 80,859,050 | | | | (3,463,313 | ) |
| | TRY/USD | | | 12/17/14 | | | | 403,657,720 | | | | (12,759,079 | ) |
| | USD/TRY | | | 12/17/14 | | | | 85,835,679 | | | | (311,679 | ) |
Standard Chartered Bank | | CNH/USD | | | 12/17/14 | | | | 333,515,400 | | | | (1,812,600 | ) |
| | JPY/USD | | | 12/17/14 | | | | 365,604,485 | | | | (13,067,515 | ) |
| | KRW/USD | | | 10/14/14 | | | | 85,127,783 | | | | (50,217 | ) |
| | MXN/USD | | | 12/17/14 | | | | 258,773,781 | | | | (5,535,789 | ) |
| | PLN/USD | | | 12/17/14 | | | | 107,550,919 | | | | (3,410,081 | ) |
| | TRY/USD | | | 12/17/14 | | | | 71,383,351 | | | | (1,362,649 | ) |
State Street Bank (London) | | AUD/USD | | | 12/17/14 | | | | 82,916,083 | | | | (1,797,480 | ) |
| | EUR/GBP | | | 12/17/14 | | | | 81,530,583 | | | | (1,422,072 | ) |
| | EUR/USD | | | 12/17/14 | | | | 165,150,743 | | | | (3,613,299 | ) |
| | GBP/USD | | | 12/17/14 | | | | 165,285,706 | | | | (2,202,216 | ) |
| | JPY/USD | | | 12/17/14 | | | | 295,852,938 | | | | (2,471,312 | ) |
UBS AG (London) | | BRL/USD | | | 10/14/14 | | | | 157,377,983 | | | | (10,144,017 | ) |
| | CHF/USD | | | 12/17/14 | | | | 83,045,073 | | | | (1,853,927 | ) |
| | INR/USD | | | 10/07/14 | | | | 68,318,267 | | | | (1,120,591 | ) |
| | INR/USD | | | 10/14/14 | | | | 255,143,473 | | | | (2,460,799 | ) |
| | MXN/USD | | | 10/31/14 | | | | 45,618,029 | | | | (766,733 | ) |
| | PLN/USD | | | 12/17/14 | | | | 115,069,801 | | | | (2,372,370 | ) |
| | RUB/USD | | | 11/17/14 | | | | 125,380,130 | | | | (9,761,418 | ) |
Westpac Banking Corp. | | AUD/USD | | | 12/17/14 | | | | 492,971,652 | | | | (13,252,051 | ) |
| | INR/USD | | | 10/14/14 | | | | 112,083,584 | | | | (1,543,558 | ) |
| | | NZD/USD | | | 12/17/14 | | | | 385,439,527 | | | | (17,140,323 | ) |
| TOTAL | | | | | | | | | | | | $ | (303,668,250 | ) |
FORWARD SALES CONTRACTS — At September 30, 2014, the Fund had the following forward sales contracts:
| | | | | | | | | | | | | | | | | | |
| Description | | Interest
Rate | | | Maturity
Date(f) | | Settlement
Date | | | Principal
Amount | | | Value | |
FNMA (Proceeds Receivable: $144,135,781) | | | 3.000 | % | | TBA-30yr | | | 10/14/2014 | | | $ | (146,000,000 | ) | | $ | (143,889,847 | ) |
FUTURES CONTRACTS — At September 30, 2014, the Fund had the following futures contracts:
| | | | | | | | | | | | | | |
| Type | | Number of
Contracts
Long (Short) | | | Expiration
Date | | Current
Value | | | Unrealized
Gain (Loss) | |
Eurodollars | | | (33,923 | ) | | March 2017 | | $ | (8,275,091,813 | ) | | $ | 10,806,933 | |
Eurodollars | | | (27,253 | ) | | June 2017 | | | (6,635,083,513 | ) | | | 11,914,714 | |
Eurodollars | | | (16,937 | ) | | September 2017 | | | (4,117,172,988 | ) | | | 8,821,807 | |
French 10 Year Government Bonds | | | (2,736 | ) | | December 2014 | | | (496,757,749 | ) | | | (3,692,381 | ) |
Ultra Long U.S. Treasury Bonds | | | (7,386 | ) | | December 2014 | | | (1,126,365,000 | ) | | | 15,437,067 | |
10 Year German Euro-Bund | | | 64 | | | December 2014 | | | 12,101,034 | | | | 102,124 | |
2 Year U.S. Treasury Notes | | | 1,102 | | | December 2014 | | | 241,165,813 | | | | (56,083 | ) |
5 Year U.S. Treasury Notes | | | 21,766 | | | December 2014 | | | 2,573,999,558 | | | | 3,177,279 | |
10 Year U.S. Treasury Notes | | | (24,473 | ) | | December 2014 | | | (3,050,330,016 | ) | | | (6,877,487 | ) |
20 Year U.S. Treasury Bonds | | | 15,066 | | | December 2014 | | | 2,077,695,563 | | | | (18,392,296 | ) |
| TOTAL | | | | | | | | | | | | $ | 21,241,677 | |
| | |
| 100 | | The accompanying notes are an integral part of these financial statements. |
GOLDMAN SACHS STRATEGIC INCOME FUND
|
| ADDITIONAL INVESTMENT INFORMATION (continued) |
SWAP CONTRACTS — At September 30, 2014, the Fund had the following swap contracts:
OVER THE COUNTER INTEREST RATE SWAP CONTRACTS
| | | | | | | | | | | | | | | | | | | | |
| | | | | | | | | | | | Rates Exchanged | | | |
| Counterparty | | Notional
Amount
(000s) | | | Termination
Date | | | Payments
Received | | Payments
Made | | Unrealized
Gain (Loss)* | |
Bank of America Securities LLC | | | BRL | | | | 200,700 | | | | 01/02/17 | | | 11.890% | | 1 month Brazilian
Interbank Deposit
Average | | $ | (316,017 | ) |
| | | | | | | 309,890 | | | | 01/04/21 | | | 12.052 | | 1 month Brazilian
Interbank Deposit
Average | | | 108,019 | |
| | | KRW | | | | 62,976,210 | | | | 07/25/23 | | | 3 month KWCDC | | 3.352% | | | (3,372,337 | ) |
| | | MYR | | | | 106,220 | (a) | | | 09/18/23 | | | 3 month KLIBOR | | 4.945 | | | (349,743 | ) |
| | | | | | | 204,060 | (a) | | | 09/19/23 | | | 3 month KLIBOR | | 4.680 | | | (43,700 | ) |
| | | | | | | 76,770 | (a) | | | 11/01/23 | | | 4.780 | | 3 month KLIBOR | | | 92,055 | |
| | | KRW | | | | 12,749,890 | | | | 11/27/23 | | | 3 month KWCDC | | 3.450 | | | (786,766 | ) |
| | | | | | | 30,608,550 | | | | 12/13/23 | | | 3 month KWCDC | | 3.488 | | | (1,971,789 | ) |
| | | | | | | 12,039,840 | | | | 01/16/24 | | | 3 month KWCDC | | 3.445 | | | (749,585 | ) |
| | | MXN | | | | 453,760 | (a) | | | 08/19/24 | | | 7.260 | | Mexico Interbank TIIE
28 Days | | | (437,705 | ) |
Barclays Bank PLC | | | KRW | | | | 16,826,730 | | | | 05/10/23 | | | 3 month KWCDC | | 2.735 | | | (112,624 | ) |
| | | | | | | 19,262,500 | | | | 05/20/23 | | | 3 month KWCDC | | 2.830 | | | (272,511 | ) |
| | | | | | | 19,262,500 | | | | 05/20/23 | | | 3 month KWCDC | | 2.840 | | | (286,879 | ) |
| | | | | | | 6,800,000 | | | | 08/09/23 | | | 3 month KWCDC | | 3.440 | | | (407,814 | ) |
| | | MYR | | | | 31,310 | | | | 08/14/23 | | | 3 month KLIBOR | | 4.485 | | | (136,180 | ) |
Citibank NA | | | BRL | | | | 222,050 | | | | 01/04/16 | | | 11.190 | | 1 month Brazilian
Interbank Deposit
Average | | | (645,308 | ) |
| | | MYR | | | | 112,250 | | | | 09/17/18 | | | 3 month KLIBOR | | 3.830 | | | 150,645 | |
| | | | | | | 42,800 | | | | 09/24/18 | | | 3 month KLIBOR | | 3.785 | | | 79,442 | |
| | | | | | | 169,560 | | | | 11/19/18 | | | 3 month KLIBOR | | 3.915 | | | 81,397 | |
| | | | | | | 51,130 | | | | 11/21/18 | | | 3 month KLIBOR | | 3.960 | | | (1,386 | ) |
| | | KRW | | | | 98,915,810 | | | | 08/08/23 | | | 3 month KWCDC | | 3.450 | | | (5,998,740 | ) |
| | | | | | | 8,854,260 | | | | 08/16/23 | | | 3 month KWCDC | | 3.485 | | | (562,258 | ) |
| | | MYR | | | | 84,950 | | | | 11/12/23 | | | 4.990 | | 3 month KLIBOR | | | 303,638 | |
| | | | | | | 36,600 | | | | 11/15/23 | | | 3 month KLIBOR | | 4.450 | | | (118,722 | ) |
| | | | | | | 219,660 | (a) | | | 11/15/23 | | | 5.040 | | 3 month KLIBOR | | | 909,040 | |
| | | KRW | | | | 30,360,000 | | | | 12/18/23 | | | 3 month KWCDC | | 3.420 | | | (1,792,862 | ) |
| | | | | | | 28,266,470 | | | | 01/07/24 | | | 3 month KWCDC | | 3.472 | | | (1,826,069 | ) |
| | | | | | | 19,358,680 | | | | 01/10/24 | | | 3 month KWCDC | | 3.475 | | | (1,254,246 | ) |
Credit Suisse International (London) | | | BRL | | | | 36,980 | | | | 01/02/18 | | | 11.935 | | 1 month Brazilian
Interbank Deposit
Average | | | (76,389 | ) |
Deutsche Bank AG | | | BRL | | | | 218,630 | | | | 01/04/16 | | | 11.230 | | 1 month Brazilian
Interbank Deposit
Average | | | (597,500 | ) |
| | | | | | | 435,530 | | | | 01/04/16 | | | 11.680 | | 1 month Brazilian
Interbank Deposit
Average | | | (409,072 | ) |
| | | | | | | 349,950 | | | | 01/02/17 | | | 12.398 | | 1 month Brazilian
Interbank Deposit
Average | | | 1,757,876 | |
| | | KRW | | | | 55,677,880 | | | | 03/03/17 | | | 2.850 | | 3 month KWCDC | | | 720,871 | |
| | |
| The accompanying notes are an integral part of these financial statements. | | 101 |
GOLDMAN SACHS STRATEGIC INCOME FUND
Schedule of Investments (continued)
September 30, 2014 (Unaudited)
|
| ADDITIONAL INVESTMENT INFORMATION (continued) |
OVER THE COUNTER INTEREST RATE SWAP CONTRACTS (continued)
| | | | | | | | | | | | | | | | | | | | |
| | | | | | | | | | | | Rates Exchanged | | | |
| Counterparty | | Notional
Amount
(000s) | | | Termination
Date | | | Payments
Received | | Payments
Made | | Unrealized
Gain (Loss)* | |
Deutsche Bank AG (continued) | | | BRL | | | | 152,740 | | | | 01/02/18 | | | 11.900% | | 1 month Brazilian
Interbank Deposit
Average | | $ | (359,872 | ) |
| | | MYR | | | | 112,770 | | | | 09/13/18 | | | 3 month KLIBOR | | 3.920% | | | 27,568 | |
| | | | | | | 50,380 | | | | 11/14/18 | | | 3 month KLIBOR | | 3.880 | | | 44,089 | |
| | | | | | | 477,120 | | | | 03/12/19 | | | 3 month KLIBOR | | 4.027 | | | (232,355 | ) |
| | | KRW | | | | 19,262,510 | | | | 05/15/23 | | | 3 month KWCDC | | 2.815 | | | (246,055 | ) |
| | | MYR | | | | 26,840 | | | | 08/14/23 | | | 3 month KLIBOR | | 4.490 | | | (119,822 | ) |
| | | KRW | | | | 52,965,990 | | | | 08/26/23 | | | 3 month KWCDC | | 3.588 | | | (3,788,860 | ) |
| | | | | | | 26,410,690 | | | | 09/06/23 | | | 3 month KWCDC | | 3.570 | | | (1,853,370 | ) |
| | | MYR | | | | 194,330 | (a) | | | 11/13/23 | | | 5.075 | | 3 month KLIBOR | | | 884,175 | |
| | | KRW | | | | 31,522,520 | | | | 11/14/23 | | | 3 month KWCDC | | 3.415 | | | (1,849,295 | ) |
| | | | | | | 39,978,650 | | | | 11/22/23 | | | 3 month KWCDC | | 3.473 | | | (2,529,816 | ) |
| | | | | | | 71,090,000 | | | | 12/17/23 | | | 3 month KWCDC | | 3.456 | | | (4,399,639 | ) |
| | | | | | | 22,540,310 | | | | 01/08/24 | | | 3 month KWCDC | | 3.470 | | | (1,452,333 | ) |
| | | | | | | 20,035,410 | | | | 01/14/24 | | | 3 month KWCDC | | 3.433 | | | (1,228,257 | ) |
| | | | | | | 36,381,130 | | | | 01/22/24 | | | 3 month KWCDC | | 3.470 | | | (2,333,796 | ) |
| | | MXN | | | | 406,100 | (a) | | | 08/16/24 | | | 7.265 | | Mexico Interbank TIIE
28 Days | | | (385,221 | ) |
JPMorgan Securities, Inc. | | | KRW | | | | 230,094,560 | | | | 03/05/17 | | | 2.889 | | 3 month KWCDC | | | 3,192,171 | |
| | | MYR | | | | 113,040 | | | | 11/26/18 | | | 3 month KLIBOR | | 3.955 | | | 10,078 | |
| | | | | | | 254,240 | | | | 12/11/18 | | | 3 month KLIBOR | | 3.972 | | | (13,768 | ) |
| | | KRW | | | | 26,509,370 | | | | 08/13/23 | | | 3 month KWCDC | | 3.415 | | | (1,539,070 | ) |
| | | MYR | | | | 34,420 | | | | 08/15/23 | | | 3 month KLIBOR | | 4.520 | | | (176,803 | ) |
| | | KRW | | | | 11,159,200 | | | | 08/19/23 | | | 3 month KWCDC | | 3.563 | | | (775,289 | ) |
| | | MYR | | | | 64,380 | | | | 09/26/23 | | | 3 month KLIBOR | | 4.330 | | | (26,732 | ) |
| | | KRW | | | | 31,495,660 | | | | 10/31/23 | | | 3 month KWCDC | | 3.230 | | | (1,399,411 | ) |
| | | | | | | 62,836,430 | | | | 11/06/23 | | | 3 month KWCDC | | 3.320 | | | (3,225,551 | ) |
| | | | | | | 18,223,710 | | | | 11/13/23 | | | 3 month KWCDC | | 3.415 | | | (1,069,221 | ) |
| | | | | | | 12,906,270 | | | | 12/23/23 | | | 3 month KWCDC | | 3.470 | | | (811,552 | ) |
| | | | | | | 45,184,500 | | | | 01/07/24 | | | 3 month KWCDC | | 3.471 | | | (2,915,484 | ) |
| | | | | | | 20,648,340 | | | | 01/13/24 | | | 3 month KWCDC | | 3.465 | | | (1,321,581 | ) |
| | | | | | | 34,996,240 | | | | 01/15/24 | | | 3 month KWCDC | | 3.445 | | | (2,179,576 | ) |
| | | | | | | 38,722,640 | | | | 01/16/24 | | | 3 month KWCDC | | 3.457 | | | (2,447,101 | ) |
| | | | | | | 54,917,425 | | | | 01/17/24 | | | 3 month KWCDC | | 3.440 | | | (3,395,926 | ) |
| | | | | | | 25,805,850 | | | | 01/27/24 | | | 3 month KWCDC | | 3.383 | | | (1,472,281 | ) |
| | | | | | | 8,900,000 | | | | 12/18/28 | | | 3 month KWCDC | | 3.495 | | | (675,558 | ) |
Morgan Stanley & Co. International PLC | | | MYR | | | | 67,180 | | | | 11/20/18 | | | 3 month KLIBOR | | 3.934 | | | 19,278 | |
| | | BRL | | | | 320,120 | | | | 01/04/21 | | | 12.223 | | 1 month Brazilian
Interbank Deposit
Average | | | — | |
| | | KRW | | | | 36,546,310 | | | | 06/27/23 | | | 3 month KWCDC | | 3.413 | | | (2,080,614 | ) |
| | | | | | | 8,653,900 | | | | 08/16/23 | | | 3 month KWCDC | | 3.485 | | | (549,723 | ) |
| | | MYR | | | | 198,250 | (a) | | | 09/19/23 | | | 3 month KLIBOR | | 4.699 | | | (85,572 | ) |
| | | | | | | 116,840 | (a) | | | 09/20/23 | | | 3 month KLIBOR | | 4.802 | | | (189,804 | ) |
Morgan Stanley Capital Services, Inc. | | | KRW | | | | 24,219,470 | | | | 01/09/24 | | | 3 month KWCDC | | 3.455 | | | (1,530,849 | ) |
| | | | | | | | 13,384,100 | | | | 01/20/24 | | | 3 month KWCDC | | 3.440 | | | (826,837 | ) |
| TOTAL | | | | | | | | | | | | | | | | | | $ | (63,632,854 | ) |
| | * | | There are no upfront payments on the swaps contract(s), therefore the unrealized gain (loss) on the swaps contracts is equal to their market value. |
| | (a) | | Represents forward starting interest rate swaps whose effective dates of commencement of accruals and cash flows occur subsequent to September 30, 2014. |
| | |
| 102 | | The accompanying notes are an integral part of these financial statements. |
GOLDMAN SACHS STRATEGIC INCOME FUND
|
| ADDITIONAL INVESTMENT INFORMATION (continued) |
CENTRALLY CLEARED INTEREST RATE SWAP CONTRACTS
| | | | | | | | | | | | | | | | |
| | | | | | Rates Exchanged | | Market Value | |
Notional
Amount
(000s) | | | Termination
Date | | Payments
Received | | Payments
Made | | Upfront
Payments
Made (Received) | | | Unrealized
Gain (Loss) | |
| $ | 5,100 | | | 02/28/15 | | 3 month LIBOR | | 1.414% | | $ | (13,550 | ) | | $ | (16,280 | ) |
| | 1,791,200 | (a) | | 12/17/16 | | 3 month LIBOR | | 1.000 | | | (403,671 | ) | | | 622,556 | |
| | 319,800 | (a) | | 02/01/17 | | 3 month LIBOR | | 1.625 | | | (245,541 | ) | | | 339,626 | |
| | 1,311,100 | (a) | | 08/04/17 | | 3 month LIBOR | | 2.195 | | | (1,108,643 | ) | | | 678,864 | |
| GBP | 553,000 | (a) | | 09/12/17 | | 6 month GBP | | 2.250 | | | (190,963 | ) | | | (110,888 | ) |
| $ | 121,500 | (a) | | 10/28/17 | | 1.450% | | 3 month LIBOR | | | (1,489,782 | ) | | | 504,915 | |
| JPY | 139,198,470 | (a) | | 02/12/19 | | 6 month JYOR | | 0.420 | | | (9,593,883 | ) | | | 3,781,625 | |
| PLN | 285,790 | | | 06/17/19 | | 3.048 | | 6 month WIBOR | | | 1,398,083 | | | | 1,587,969 | |
| | 285,790 | | | 06/17/19 | | 6 month WIBOR | | 3.045 | | | 443 | | | | (2,966,728 | ) |
| EUR | 127,140 | | | 06/18/19 | | 6 month EURO | | 1.250 | | | (3,447,140 | ) | | | (3,283,029 | ) |
| | 1,467,490 | (a) | | 12/17/19 | | 1.000 | | 6 month EURO | | | 44,478,575 | | | | 3,062,204 | |
| $ | 5,930,400 | (a) | | 12/17/19 | | 3 month LIBOR | | 2.250 | | | (61,378,368 | ) | | | 10,382,265 | |
| SEK | 12,484,300 | (a) | | 12/17/19 | | 3 month STIBOR | | 1.250 | | | (13,838,005 | ) | | | 2,602,827 | |
| NZD | 2,265,620 | (a) | | 12/17/19 | | 4.500 | | 3 month NZDOR | | | (5,027,495 | ) | | | 12,091,154 | |
| AUD | 1,195,550 | (a) | | 12/17/19 | | 6 month AUDOR | | 3.750 | | | (11,684,376 | ) | | | (6,299,448 | ) |
| GBP | 486,150 | (a) | | 12/17/19 | | 6 month GBP | | 2.250 | | | (5,394,280 | ) | | | (976,506 | ) |
| $ | 283,700 | (a) | | 10/02/20 | | 2.533 | | 3 month LIBOR | | | 1,418 | | | | — | |
| GBP | 258,200 | (a) | | 02/05/21 | | 2.840 | | 6 month GBP | | | (5,713,378 | ) | | | 12,347,133 | |
| $ | 1,982,000 | (a) | | 08/04/21 | | 3.025 | | 3 month LIBOR | | | 6,787,661 | | | | 3,990,851 | |
| GBP | 561,480 | (a) | | 09/12/21 | | 2.680 | | 6 month GBP | | | (1,989,179 | ) | | | 3,046,609 | |
| $ | 5,891,400 | (a) | | 12/17/21 | | 3 month LIBOR | | 2.500 | | | (39,596,945 | ) | | | 6,923,240 | |
| EUR | 133,080 | (a) | | 12/17/21 | | 6 month EURO | | 1.500 | | | (8,450,976 | ) | | | 19,609 | |
| JPY | 289,533,840 | (a) | | 12/17/21 | | 6 month JYOR | | 0.500 | | | (15,040,725 | ) | | | 2,782,759 | |
| | 196,009,340 | (a) | | 02/12/22 | | 1.080 | | 6 month JYOR | | | (10,133,372 | ) | | | 28,662,532 | |
| $ | 255,100 | (a) | | 10/01/22 | | 2.760 | | 3 month LIBOR | | | 2,041 | | | | (233,136 | ) |
| JPY | 83,936,800 | (a) | | 12/19/23 | | 1.250 | | 6 month JYOR | | | 5,594,331 | | | | 7,862,190 | |
| SEK | 1,315,170 | (a) | | 12/19/23 | | 3 month STIBOR | | 3.500 | | | (15,680,631 | ) | | | 6,106,353 | |
| CAD | 1,095,780 | (a) | | 12/19/23 | | 4.000 | | 6 month CDOR | | | 37,425,792 | | | | (1,328,013 | ) |
| $ | 794,760 | (a) | | 12/19/23 | | 4.500 | | 3 month LIBOR | | | 29,948,529 | | | | 8,493,774 | |
| NZD | 58,830 | (a) | | 12/19/23 | | 5.750 | | 3 month NZDOR | | | (283,756 | ) | | | 1,895,093 | |
| CHF | 325,875 | (a) | | 12/19/23 | | 6 month CHFOR | | 2.500 | | | (19,912,482 | ) | | | (976,983 | ) |
| EUR | 944,290 | (a) | | 12/19/23 | | 6 month EURO | | 3.250 | | | (134,973,044 | ) | | | 42,870,378 | |
| GBP | 263,375 | (a) | | 12/19/23 | | 6 month GBP | | 3.750 | | | (14,637,078 | ) | | | 249,541 | |
| $ | 928,600 | (a) | | 01/30/24 | | 4.252 | | 3 month LIBOR | | | (212,691 | ) | | | 34,540,247 | |
| | 235,290 | (a) | | 04/04/24 | | 4.000 | | 3 month LIBOR | | | (1,215,665 | ) | | | 7,108,809 | |
| PLN | 147,230 | (a) | | 05/20/24 | | 6 month WIBOR | | 4.095 | | | 241 | | | | (1,307,397 | ) |
| | 200,040 | (a) | | 07/09/24 | | 6 month WIBOR | | 3.880 | | | — | | | | (1,163,568 | ) |
| | 207,060 | (a) | | 07/10/24 | | 6 month WIBOR | | 3.827 | | | 341 | | | | (1,064,038 | ) |
| ZAR | 556,240 | (a) | | 08/06/24 | | 9.210 | | 3 month JIBAR | | | 260 | | | | 167,908 | |
| PLN | 111,090 | (a) | | 08/21/24 | | 6 month WIBOR | | 3.325 | | | 177 | | | | 159,840 | |
| ZAR | 1,170,520 | (a) | | 08/28/24 | | 8.887 | | 3 month JIBAR | | | 551 | | | | (589,019 | ) |
| PLN | 139,130 | (a) | | 09/09/24 | | 6 month WIBOR | | 3.255 | | | 216 | | | | 336,995 | |
| | 45,890 | (a) | | 09/09/24 | | 6 month WIBOR | | 3.260 | | | 71 | | | | 108,269 | |
| AUD | 1,013,210 | (a) | | 09/17/24 | | 4.500 | | 6 month AUDOR | | | (3,601,491 | ) | | | 5,030,724 | |
| GBP | 653,410 | (a) | | 09/17/24 | | 6 month GBP | | 3.250 | | | (4,424,784 | ) | | | (4,680,115 | ) |
| $ | 835,220 | | | 12/17/24 | | 3 month LIBOR | | 3.000 | | | (14,078,507 | ) | | | (6,307,542 | ) |
| SEK | 1,578,820 | (a) | | 12/17/24 | | 3 month STIBOR | | 1.750 | | | 508,369 | | | | 420,697 | |
| CAD | 415,310 | (a) | | 12/17/24 | | 3.000 | | 6 month CDOR | | | 17,061,906 | | | | (5,807,360 | ) |
| AUD | 464,350 | (a) | | 12/17/24 | | 4.500 | | 6 month AUDOR | | | 16,380,391 | | | | 4,872,542 | |
| NZD | 1,096,870 | (a) | | 12/17/24 | | 5.000 | | 3 month NZDOR | | | 18,124,324 | | | | 9,227,640 | |
| | |
| The accompanying notes are an integral part of these financial statements. | | 103 |
GOLDMAN SACHS STRATEGIC INCOME FUND
Schedule of Investments (continued)
September 30, 2014 (Unaudited)
|
| ADDITIONAL INVESTMENT INFORMATION (continued) |
CENTRALLY CLEARED INTEREST RATE SWAP CONTRACTS (continued)
| | | | | | | | | | | | | | | | | | |
| | | | | | | Rates Exchanged | | Market Value | |
Notional
Amount
(000s) | | | Termination
Date | | | Payments
Received | | Payments
Made | | Upfront
Payments
Made (Received) | | | Unrealized
Gain (Loss) | |
| EUR | 291,040 | (a) | | | 12/17/24 | | | 6 month EURO | | 2.000 % | | $ | (32,101,658 | ) | | $ | 3,058,643 | |
| GBP | 819,800 | (a) | | | 12/17/24 | | | 6 month GBP | | 3.000 | | | (55,050,520 | ) | | | 473,296 | |
| JPY | 233,938,450 | (a) | | | 12/17/24 | | | 6 month JYOR | | 0.750 | | | (19,117,785 | ) | | | 5,103,661 | |
| NOK | 3,252,815 | (a) | | | 12/18/24 | | | 3 month NIBOR | | 3.500 | | | (6,167,124 | ) | | | (1,011,827 | ) |
| GBP | 791,200 | (a) | | | 12/18/24 | | | 3.250% | | 6 month GBP | | | 6,434,605 | | | | 3,343,580 | |
| EUR | 1,044,300 | (a) | | | 12/18/24 | | | 6 month EURO | | 2.000 | | | 1,994,114 | | | | (6,495,609 | ) |
| JPY | 155,599,190 | (a) | | | 02/14/25 | | | 6 month JYOR | | 1.720 | | | (8,547,125 | ) | | | (8,198,285 | ) |
| | 44,523,270 | (a) | | | 05/09/25 | | | 6 month JYOR | | 1.650 | | | 4,669,886 | | | | (8,109,920 | ) |
| $ | 153,000 | (a) | | | 05/24/26 | | | 3.150 | | 3 month LIBOR | | | 1,224 | | | | (485,806 | ) |
| | 1,070,400 | (a) | | | 08/04/26 | | | 3 month LIBOR | | 3.409 | | | (5,930,985 | ) | | | (10,267,914 | ) |
| GBP | 304,580 | (a) | | | 09/12/26 | | | 6 month GBP | | 2.980 | | | 1,982,848 | | | | (5,062,589 | ) |
| $ | 136,700 | (a) | | | 09/28/26 | | | 3.280 | | 3 month LIBOR | | | 1,094 | | | | 183,930 | |
| JPY | 27,115,470 | (a) | | | 05/09/27 | | | 1.880 | | 6 month JYOR | | | (4,070,551 | ) | | | 7,958,564 | |
| $ | 1,953,200 | (a) | | | 12/17/29 | | | 3 month LIBOR | | 3.250 | | | (51,731,083 | ) | | | (6,332,474 | ) |
| JPY | 49,048,910 | (a) | | | 12/18/34 | | | 2.250 | | 6 month JYOR | | | (5,245,847 | ) | | | 4,146,177 | |
| CAD | 42,540 | (a) | | | 12/18/34 | | | 3.750 | | 6 month CDOR | | | (111,299 | ) | | | (6,196 | ) |
| AUD | 100,300 | (a) | | | 12/18/34 | | | 5.000 | | 6 month AUDOR | | | (485,104 | ) | | | 541,395 | |
| EUR | 124,680 | (a) | | | 12/18/34 | | | 6 month EURO | | 2.250 | | | 626,726 | | | | 3,586,795 | |
| GBP | 798,030 | (a) | | | 12/18/34 | | | 6 month GBP | | 3.250 | | | 6,419,824 | | | | (3,222,379 | ) |
| | 143,360 | (a) | | | 02/05/36 | | | 6 month GBP | | 3.500 | | | (3,166,649 | ) | | | (14,547,914 | ) |
| $ | 310,900 | (a) | | | 01/30/39 | | | 3 month LIBOR | | 4.370 | | | (13,616,316 | ) | | | (19,174,431 | ) |
| | 1,120,500 | (a) | | | 12/17/44 | | | 3 month LIBOR | | 3.500 | | | (46,877,529 | ) | | | (13,024,962 | ) |
| | 534,990 | (a) | | | 12/17/44 | | | 3.500 | | 3 month LIBOR | | | 17,472,738 | | | | 11,128,095 | |
| GBP | 459,770 | (a) | | | 12/17/44 | | | 6 month GBP | | 3.250 | | | (46,204,877 | ) | | | (8,601,539 | ) |
| JPY | 74,123,100 | (a) | | | 12/20/44 | | | 2.250 | | 6 month JYOR | | | (6,179,999 | ) | | | 660,725 | |
| EUR | 29,700 | (a) | | | 12/20/44 | | | 6 month EURO | | 2.500 | | | (382,482 | ) | | | (199,867 | ) |
| GBP | 882,990 | (a) | | | 12/20/44 | | | 6 month GBP | | 3.000 | | | 2,215,944 | | | | (1,629,332 | ) |
| | TOTAL | | | | | | | | | | | $ | (489,214,611 | ) | | $ | 119,581,505 | |
| | (a) | | Represents forward starting interest rate swaps whose effective dates of commencement of accruals and cash flows occur subsequent to September 30, 2014. |
OVER THE COUNTER CREDIT DEFAULT SWAP CONTRACTS
| | | | | | | | | | | | | | | | | | | | | | | | | | |
| | | | | | | | | | | | | | | | | Market Value | |
| Counterparty | | Referenced
Obligation | | Notional
Amount
(000s) | | | Rates Received
(Paid) | | | Termination
Date | | | Credit
Spread at
September 30,
2014(b) | | | Upfront
Payments
Made (Received) | | | Unrealized
Gain (Loss) | |
Protection Purchased: | | | | | | | | | | | | | | | | | | | | | | | | | | |
Bank of America Securities LLC | | People’s Republic of China 4.250%, 10/28/14 | | $ | 13,180 | | | | (1.000 | )% | | | 03/20/19 | | | | 0.760 | % | | $ | (22,281 | ) | | $ | (117,361 | ) |
| | | | | 31,200 | | | | (1.000 | ) | | | 06/20/19 | | | | 0.809 | | | | (181,499 | ) | | | (96,527 | ) |
Barclays Bank PLC | | | | | 98,670 | | | | (1.000 | ) | | | 03/20/19 | | | | 0.760 | | | | (295,796 | ) | | | (749,611 | ) |
Citibank NA | | | | | 518,290 | | | | (1.000 | ) | | | 03/20/19 | | | | 0.760 | | | | (2,299,212 | ) | | | (3,192,069 | ) |
| | | | | 1,291,770 | | | | (1.000 | ) | | | 06/20/19 | | | | 0.809 | | | | (6,861,188 | ) | | | (4,649,906 | ) |
| | |
| 104 | | The accompanying notes are an integral part of these financial statements. |
GOLDMAN SACHS STRATEGIC INCOME FUND
|
| ADDITIONAL INVESTMENT INFORMATION (continued) |
OVER THE COUNTER CREDIT DEFAULT SWAP CONTRACTS (continued)
| | | | | | | | | | | | | | | | | | | | | | | | | | |
| | | | | | | | | | | | | | | | | Market Value | |
| Counterparty | | Referenced
Obligation | | Notional
Amount
(000s) | | | Rates Received
(Paid) | | | Termination
Date | | | Credit
Spread at
September 30,
2014(b) | | | Upfront
Payments
Made (Received) | | | Unrealized
Gain (Loss) | |
JPMorgan Securities, Inc. | | People’s Republic of China 4.250%, 10/28/14 | | $ | 66,660 | | | | (1.000 | )% | | | 03/20/19 | | | | 0.760 | % | | $ | (280,567 | ) | | $ | (425,697 | ) |
| | | | | 59,660 | | | | (1.000 | ) | | | 06/20/19 | | | | 0.809 | | | | (344,712 | ) | | | (186,924 | ) |
Protection Sold: | | | | | | | | | | | | | | | | | | | | | | | | | | |
Bank of America Securities LLC | | CDX North America Investment Grade Index 16 | | | 31,800 | | | | 1.000 | | | | 06/20/16 | | | | 0.227 | | | | 15,611 | | | | 418,491 | |
| TOTAL | | | | | | | | | | | | | | | | | | | | $ | (10,269,644 | ) | | $ | (8,999,604 | ) |
| | (b) | | Credit spread on the Referenced Obligation, together with the term of the swap contract, are indicators of payment/performance risk. The likelihood of a credit event occurring which would require a fund to make a payment or otherwise be required to perform under the swap contract is generally greater as the credit spread and the term of the swap contract increase. |
CENTRALLY CLEARED CREDIT DEFAULT SWAP CONTRACT
| | | | | | | | | | | | | | | | | | | | | | |
| | | | | | | | | | | | | | Market Value | |
| Referenced Obligation | | Notional
Amount
(000s) | | Rates Received
(Paid) | | | Termination
Date | | | Credit
Spread at
September 30,
2014(b) | | | Upfront
Payments
Made (Received) | | | Unrealized
Gain (Loss) | |
Protection Purchased: | | | | | | | | | | | | | | | | | | | | | | |
CDX North America Investment Grade Index 21 | | $8,446,200 | | | (1.000 | )% | | | 06/20/19 | | | | 0.644 | % | | $ | (132,013,301 | ) | | $ | (5,789,394 | ) |
| | (b) | | Credit spread on the Referenced Obligation, together with the term of the swap contract, are indicators of payment/performance risk. The likelihood of a credit event occurring which would require a fund to make a payment or otherwise be required to perform under the swap contract is generally greater as the credit spread and the term of the swap contract increase. |
OVER THE COUNTER TOTAL RETURN SWAP CONTRACTS
| | | | | | | | | | | | | | | | | | |
| | | | | | | | | | | | Market Value | |
| Counterparty | | Notional
Amount
(000s) | | | Reference
Security | | Termination
Date | | Financing
Fee# | | Upfront
Payments
Made (Received) | | | Unrealized
Gain (Loss) | |
Bank of America Securities LLC | | $ | 11,304 | | | Markit IOS Fannie-Mae Index, 30 yr Fixed Rate, 3.000%, Series 12 | | 01/12/43 | | One month LIBOR | | $ | 10,392 | | | $ | (2,647 | ) |
Barclays Bank PLC | | | 31,888 | | | Markit MBX Fannie-Mae Index, 30 yr Fixed Rate, 6.500%, Series 67 | | 01/12/38 | | One month LIBOR | | | 72,828 | | | | 63,877 | |
Citibank NA | | | 26,208 | | | Markit MBX Fannie-Mae Index, 30 yr Fixed Rate, 4.000%, Series 11 | | 01/12/42 | | One month LIBOR | | | (266,507 | ) | | | 205,052 | |
Credit Suisse International (London) | | | 110,435 | | | Markit IOS Fannie-Mae Index, 30 yr Fixed Rate, 3.000%, Series 12 | | 01/12/43 | | One month LIBOR | | | 195,951 | | | | (120,284 | ) |
| | | 25,131 | | | Markit MBX Fannie-Mae Index, 30 yr Fixed Rate, 3.000%, Series 12 | | 01/12/43 | | One month LIBOR | | | 23,232 | | | | (6,013 | ) |
| | | 53,422 | | | Markit MBX Fannie-Mae Index, 30 yr Fixed Rate, 3.500%, Series 12 | | 01/12/43 | | One month LIBOR | | | 84,778 | | | | (123,978 | ) |
| | | 38,766 | | | Markit MBX Fannie-Mae Index, 30 yr Fixed Rate, 4.000%, Series 11 | | 01/12/42 | | One month LIBOR | | | (169,414 | ) | | | 78,511 | |
| | |
| The accompanying notes are an integral part of these financial statements. | | 105 |
GOLDMAN SACHS STRATEGIC INCOME FUND
Schedule of Investments (continued)
September 30, 2014 (Unaudited)
|
| ADDITIONAL INVESTMENT INFORMATION (continued) |
OVER THE COUNTER TOTAL RETURN SWAP CONTRACTS (continued)
| | | | | | | | | | | | | | | | | | |
| | | | | | | | | | | | Market Value | |
| Counterparty | | Notional
Amount
(000s) | | | Reference
Security | | Termination
Date | | Financing
Fee# | | Upfront
Payments
Made (Received) | | | Unrealized
Gain (Loss) | |
Credit Suisse International (London) (continued) | | $ | 66,667 | | | Markit MBX Fannie-Mae Index, 30 yr Fixed Rate, 6.500%, Series 67 | | 01/12/38 | | One month LIBOR | | $ | 100,140 | | | $ | 185,665 | |
Deutsche Bank AG | | | 24,556 | | | Markit IOS Fannie-Mae Index, 30 yr Fixed Rate, 5.000%, Series 10 | | 01/12/41 | | One month LIBOR | | | 243,175 | | | | (348,190 | ) |
| | | 328,154 | | | Markit MBX Fannie-Mae Index, 30 yr Fixed Rate, 6.500%, Series 67 | | 01/12/38 | | One month LIBOR | | | (163,022 | ) | | | 1,569,833 | |
JPMorgan Securities, Inc. | | | 253,393 | | | Markit IOS Fannie-Mae Index, 30 yr Fixed Rate, 3.000%, Series 12 | | 01/12/43 | | One month LIBOR | | | 577,347 | | | | (403,728 | ) |
| | | 52,528 | | | Markit IOS Fannie-Mae Index, 30 yr Fixed Rate, 5.000%, Series 10 | | 01/12/41 | | One month LIBOR | | | 329,406 | | | | (554,047 | ) |
| | | 52,962 | | | Markit MBX Fannie-Mae Index, 30 yr Fixed Rate, 4.000%, Series 11 | | 01/12/42 | | One month LIBOR | | | (588,219 | ) | | | 464,028 | |
| | | 43,793 | | | Markit MBX Fannie-Mae Index, 30 yr Fixed Rate, 6.500%, Series 67 | | 01/12/38 | | One month LIBOR | | | 199,340 | | | | (11,599 | ) |
| | | | 40,783 | | | Markit MBX Ginnie-Mae Index, 30 yr Fixed Rate, 4.500%, Series 10 | | 01/12/41 | | One month LIBOR | | | 113,803 | | | | (264,711 | ) |
| TOTAL | | | | | | | | | | | | $ | 763,230 | | | $ | 731,769 | |
| | # | | The Fund receives annual coupon payments in accordance with the swap contract(s). On the termination date of the swap contract(s), the Fund will either receive from or pay to the counterparty an amount equal to the net of the accrued financing fees and the value of the reference security subtracted from the original notional cost (notional multiplied by the price change of the reference security, converted to U.S. Dollars). |
| | |
| 106 | | The accompanying notes are an integral part of these financial statements. |
GOLDMAN SACHS WORLD BOND FUND
Schedule of Investments
September 30, 2014 (Unaudited)
| | | | | | | | | | | | | | |
Principal
Amount | | | Interest
Rate | | | Maturity
Date | | | Value | |
| | Foreign Sovereign Debt Obligations – 70.2% | |
| | Australian Dollar – 2.5% | |
| Commonwealth of Australia | |
| AUD | 110,000 | | | | 4.750 | % | | | 10/21/15 | | | $ | 98,467 | |
| | 100,000 | | | | 5.250 | | | | 03/15/19 | | | | 96,095 | |
| | 100,000 | | | | 5.500 | | | | 04/21/23 | | | | 101,128 | |
| | | | | | | | | | | | | | |
| | | | | | | | | | | | | 295,690 | |
| | |
| | Brazilian Real – 3.4% | |
| Brazil Letras do Tesouro Nacional(a) | |
| BRL | 336,000 | | | | 0.000 | | | | 01/01/15 | | | | 133,494 | |
| | 357,000 | | | | 0.000 | | | | 01/01/16 | | | | 126,285 | |
| Brazil Notas do Tesouro Nacional | |
| | 64,056 | | | | 6.000 | | | | 08/15/22 | | | | 26,176 | |
| | 303,035 | | | | 6.000 | | | | 08/15/50 | | | | 119,415 | |
| | | | | | | | | | | | | | |
| | | | | | | | | | | | | 405,370 | |
| | |
| | British Pound – 5.0% | |
| United Kingdom Treasury | |
| GBP | 190,000 | | | | 2.000 | | | | 01/22/16 | | | | 313,313 | |
| | 20,000 | | | | 4.750 | | | | 03/07/20 | | | | 37,282 | |
| | 50,000 | | | | 1.750 | | | | 09/07/22 | | | | 78,394 | |
| | 100,000 | | | | 3.250 | | | | 01/22/44 | | | | 167,954 | |
| | 10,856 | | | | 0.375 | | | | 03/22/62 | | | | — | |
| | | | | | | | | | | | | | |
| | | | | | | | | | | | | 596,943 | |
| | |
| | Canadian Dollar – 2.2% | |
| Government of Canada | |
| CAD | 100,000 | | | | 3.750 | | | | 06/01/19 | | | | 98,064 | |
| | 110,000 | | | | 1.500 | | | | 06/01/23 | | | | 93,932 | |
| | 40,000 | | | | 5.750 | | | | 06/01/33 | | | | 52,671 | |
| | 20,000 | | | | 4.000 | | | | 06/01/41 | | | | 22,384 | |
| | | | | | | | | | | | | | |
| | | | | | | | | | | | | 267,051 | |
| | |
| | Colombian Peso – 2.7% | |
| Republic of Colombia | |
| COP | 545,600,000 | | | | 8.000 | | | | 10/28/15 | | | | 278,122 | |
| | 22,700,000 | | | | 11.000 | | | | 07/24/20 | | | | 13,668 | |
| | 9,100,000 | | | | 7.000 | | | | 05/04/22 | | | | 4,548 | |
| | 17,900,000 | | | | 7.500 | | | | 08/26/26 | | | | 9,024 | |
| | 47,500,000 | | | | 6.000 | | | | 04/28/28 | | | | 20,818 | |
| | | | | | | | | | | | | | |
| | | | | | | | | | | | | 326,180 | |
| | |
| | Czech Koruna – 0.1% | |
| Czech Republic Government Bond | |
| CZK | 300,000 | | | | 3.850 | | | | 09/29/21 | | | | 16,553 | |
| | |
| | Danish Krone – 0.7% | |
| Kingdom of Denmark | |
| DKK | 300,000 | | | | 3.000 | | | | 11/15/21 | | | | 59,558 | |
| | 80,000 | | | | 4.500 | | | | 11/15/39 | | | | 20,724 | |
| | | | | | | | | | | | | | |
| | | | | | | | | | | | | 80,282 | |
| | |
| | Euro – 27.3% | |
| Federal Republic of Germany | |
| EUR | 300,000 | | | | 1.000 | | | | 02/22/19 | | | | 394,299 | |
| | 80,000 | | | | 2.000 | | | | 01/04/22 | | | | 111,927 | |
| | 40,000 | | | | 1.500 | | | | 09/04/22 | | | | 53,972 | |
| | 30,000 | | | | 1.500 | | | | 02/15/23 | | | | 40,367 | |
| | 30,000 | | | | 2.000 | | | | 08/15/23 | | | | 41,858 | |
| | |
Principal
Amount | | | Interest
Rate | | | Maturity
Date | | | Value | |
| | Foreign Sovereign Debt Obligations – (continued) | |
| | Euro – (continued) | |
| Federal Republic of Germany – (continued) | |
| EUR | 70,000 | | | | 4.000 | % | | | 01/04/37 | | | $ | 124,759 | |
| | 30,000 | | | | 2.500 | | | | 07/04/44 | | | | 43,526 | |
| Government of Finland(b) | |
| | 20,000 | | | | 1.625 | | | | 09/15/22 | | | | 26,880 | |
| Government of France | |
| | 110,000 | | | | 1.000 | | | | 05/25/18 | | | | 143,437 | |
| | 80,000 | | | | 4.250 | | | | 10/25/23 | | | | 128,932 | |
| | 50,000 | | | | 4.500 | | | | 04/25/41 | | | | 91,397 | |
| Italy Buoni Poliennali Del Tesoro(b) | |
| | 20,000 | | | | 4.750 | | | | 09/01/44 | | | | 30,345 | |
| Kingdom of Belgium | |
| | 20,000 | | | | 3.500 | (b) | | | 06/28/17 | | | | 27,686 | |
| | 30,000 | | | | 3.000 | | | | 09/28/19 | | | | 42,956 | |
| | 6,000 | | | | 4.000 | | | | 03/28/32 | | | | 9,849 | |
| Kingdom of The Netherlands | |
| | 50,000 | | | | 4.500 | (b) | | | 07/15/17 | | | | 71,060 | |
| | 120,000 | | | | 2.250 | (b) | | | 07/15/22 | | | | 168,564 | |
| | 80,000 | | | | 1.500 | | | | 05/15/23 | | | | 107,540 | |
| | 110,000 | | | | 1.750 | | | | 02/15/24 | | | | 150,027 | |
| | 20,000 | | | | 2.000 | | | | 07/15/24 | | | | 27,383 | |
| Republic of Argentina(c) | |
| | 30,000 | | | | 0.000 | | | | 12/15/35 | | | | 2,804 | |
| Republic of Austria(b) | |
| | 30,000 | | | | 4.300 | | | | 09/15/17 | | | | 42,681 | |
| | 40,000 | | | | 3.400 | | | | 11/22/22 | | | | 60,673 | |
| | 5,000 | | | | 3.150 | | | | 06/20/44 | | | | 7,976 | |
| | Republic of Italy | | | | | | | | | | | | | |
| | 100,000 | | | | 3.750 | | | | 08/01/15 | | | | 129,931 | |
| | 120,000 | | | | 1.150 | | | | 05/15/17 | | | | 153,855 | |
| | 150,144 | | | | 2.150 | | | | 11/12/17 | | | | 197,870 | |
| | 40,000 | | | | 4.500 | | | | 08/01/18 | | | | 57,501 | |
| | 66,169 | | | | 2.350 | | | | 09/15/19 | | | | 92,349 | |
| | 50,000 | | | | 4.750 | | | | 09/01/21 | | | | 75,801 | |
| | 20,000 | | | | 5.500 | | | | 11/01/22 | | | | 31,787 | |
| | 120,000 | | | | 4.500 | | | | 05/01/23 | | | | 179,941 | |
| | 12,000 | | | | 5.750 | | | | 02/01/33 | | | | 20,651 | |
| Spain Government Bond | |
| | 20,000 | | | | 4.500 | | | | 01/31/18 | | | | 28,484 | |
| | 90,000 | | | | 3.750 | | | | 10/31/18 | | | | 127,361 | |
| | 110,000 | | | | 5.900 | | | | 07/30/26 | | | | 187,243 | |
| | 30,000 | | | | 5.150 | (b) | | | 10/31/44 | | | | 49,399 | |
| | | | | | | | | | | | | | |
| | | | | | | | | | | | | 3,283,071 | |
| | |
| | Hungarian Forint – 0.9% | |
| Hungary Government Bond | |
| HUF | 9,380,000 | | | | 6.500 | | | | 06/24/19 | | | | 42,706 | |
| | 4,040,000 | | | | 7.500 | | | | 11/12/20 | | | | 19,483 | |
| | 6,360,000 | | | | 7.000 | | | | 06/24/22 | | | | 30,164 | |
| | 4,050,000 | | | | 6.000 | | | | 11/24/23 | | | | 18,251 | |
| | 980,000 | | | | 5.500 | | | | 06/24/25 | | | | 4,249 | |
| | | | | | | | | | | | | | |
| | | | | | | | | | | | | 114,853 | |
| | |
| | Indonesian Rupiah – 0.6% | |
| Indonesia Government Bond | |
| IDR | 630,000,000 | | | | 8.375 | | | | 03/15/24 | | | | 51,108 | |
| | 335,000,000 | | | | 9.000 | | | | 03/15/29 | | | | 27,562 | |
| | | | | | | | | | | | | | |
| | | | | | | | | | | | | 78,670 | |
| | |
| | |
| The accompanying notes are an integral part of these financial statements. | | 107 |
GOLDMAN SACHS WORLD BOND FUND
Schedule of Investments (continued)
September 30, 2014 (Unaudited)
| | | | | | | | | | | | | | |
Principal
Amount | | | Interest
Rate | | | Maturity
Date | | | Value | |
| | Foreign Sovereign Debt Obligations – (continued) | |
| | Israeli Shekel – 0.4% | |
| Israel Government Bond | |
| ILS | 140,000 | | | | 5.500 | % | | | 01/31/22 | | | $ | 47,354 | |
| | |
| | Japanese Yen – 5.3% | |
| Government of Japan | |
| JPY | 16,000,000 | | | | 0.400 | | | | 06/20/16 | | | | 146,697 | |
| | 31,950,000 | | | | 0.100 | | | | 03/20/18 | | | | 291,180 | |
| | 15,600,000 | | | | 1.700 | | | | 06/20/33 | | | | 152,778 | |
| | 4,500,000 | | | | 1.900 | | | | 09/20/42 | | | | 43,913 | |
| | | | | | | | | | | | | | |
| | | | | | | | | | | | | 634,568 | |
| | |
| | Malaysian Ringgit – 0.8% | |
| Malaysia Government Bond | |
| MYR | 130,000 | | | | 3.654 | | | | 10/31/19 | | | | 39,573 | |
| | 10,000 | | | | 3.889 | | | | 07/31/20 | | | | 3,060 | |
| | 80,000 | | | | 4.048 | | | | 09/30/21 | | | | 24,731 | |
| | 10,000 | | | | 3.418 | | | | 08/15/22 | | | | 2,947 | |
| | 50,000 | | | | 3.480 | | | | 03/15/23 | | | | 14,778 | |
| | 20,000 | | | | 4.181 | | | | 07/15/24 | | | | 6,228 | |
| | | | | | | | | | | | | | |
| | | | | | | | | | | | | 91,317 | |
| | |
| | Mexican Peso – 4.5% | |
| United Mexican States | |
| MXN | 1,774,020 | | | | 0.000 | (a) | | | 10/16/14 | | | | 131,738 | |
| | 1,582,130 | | | | 0.000 | (a) | | | 12/11/14 | | | | 116,956 | |
| | 563,820 | | | | 0.000 | (a) | | | 12/24/14 | | | | 41,635 | |
| | 355,254 | | | | 5.000 | | | | 06/16/16 | | | | 28,731 | |
| | 86,483 | | | | 3.500 | | | | 12/14/17 | | | | 6,978 | |
| | 1,501,500 | | | | 4.750 | | | | 06/14/18 | | | | 111,078 | |
| | 109,600 | | | | 8.000 | | | | 06/11/20 | | | | 9,184 | |
| | 481,200 | | | | 6.500 | | | | 06/10/21 | | | | 37,419 | |
| | 122,900 | | | | 8.000 | | | | 12/07/23 | | | | 10,392 | |
| | 184,000 | | | | 7.500 | | | | 06/03/27 | | | | 15,002 | |
| | 256,600 | | | | 8.500 | | | | 05/31/29 | | | | 22,577 | |
| | 21,400 | | | | 7.750 | | | | 05/29/31 | | | | 1,764 | |
| | 134,200 | | | | 10.000 | | | | 11/20/36 | | | | 13,541 | |
| | 12,800 | | | | 8.500 | | | | 11/18/38 | | | | 1,129 | |
| | | | | | | | | | | | | | |
| | | | | | | | | | | | | 548,124 | |
| | |
| | Norwegian Krone – 1.7% | |
| Kingdom of Norway | |
| NOK | 400,000 | | | | 5.000 | | | | 05/15/15 | | | | 63,660 | |
| | 200,000 | | | | 4.250 | | | | 05/19/17 | | | | 33,294 | |
| | 400,000 | | | | 4.500 | | | | 05/22/19 | | | | 69,904 | |
| | 220,000 | | | | 2.000 | | | | 05/24/23 | | | | 33,858 | |
| | | | | | | | | | | | | | |
| | | | | | | | | | | | | 200,716 | |
| | |
| | Peruvian Nuevo Sol – 0.0% | |
| Republic of Peru | |
| PEN | 2,000 | | | | 6.900 | | | | 08/12/37 | | | | 698 | |
| | |
| | Polish Zloty – 0.4% | |
| Poland Government Bond | |
| PLN | 30,000 | | | | 5.750 | | | | 10/25/21 | | | | 10,769 | |
| | 60,000 | | | | 5.750 | | | | 09/23/22 | | | | 21,775 | |
| | 20,000 | | | | 4.000 | | | | 10/25/23 | | | | 6,514 | |
| | 40,000 | | | | 3.250 | | | | 07/25/25 | | | | 12,304 | |
| | | | | | | | | | | | | | |
| | | | | | | | | | | | | 51,362 | |
| | |
Principal
Amount | | | Interest
Rate | | | Maturity
Date | | | Value | |
| | Foreign Sovereign Debt Obligations – (continued) | |
| | Russian Ruble – 2.8% | |
| Russian Federation Bond | |
| RUB | 270,000 | | | | 7.600 | % | | | 04/14/21 | | | $ | 6,266 | |
| | 9,380,000 | | | | 7.600 | | | | 07/20/22 | | | | 214,223 | |
| | 1,010,000 | | | | 7.000 | | | | 01/25/23 | | | | 22,087 | |
| | 600,000 | | | | 7.000 | | | | 08/16/23 | | | | 13,097 | |
| | 3,640,000 | | | | 7.050 | | | | 01/19/28 | | | | 76,632 | |
| | | | | | | | | | | | | | |
| | | | | | | | | | | | | 332,305 | |
| | |
| | Singapore Dollar – 0.5% | |
| Republic of Singapore | |
| SGD | 75,000 | | | | 3.125 | | | | 09/01/22 | | | | 62,436 | |
| | |
| | South African Rand – 0.9% | |
| Republic of South Africa | |
| ZAR | 70,000 | | | | 7.750 | | | | 02/28/23 | | | | 6,059 | |
| | 600,000 | | | | 8.000 | | | | 01/31/30 | | | | 49,898 | |
| | 370,000 | | | | 8.250 | | | | 03/31/32 | | | | 30,810 | |
| | 90,000 | | | | 8.750 | | | | 01/31/44 | | | | 7,690 | |
| | 160,000 | | | | 8.750 | | | | 02/28/48 | | | | 13,808 | |
| | | | | | | | | | | | | | |
| | | | | | | | | | | | | 108,265 | |
| | |
| | Swedish Krona – 2.1% | |
| Kingdom of Sweden | |
| SEK | 700,000 | | | | 3.000 | | | | 07/12/16 | | | | 101,845 | |
| | 670,000 | | | | 3.500 | | | | 06/01/22 | | | | 108,620 | |
| | 180,000 | | | | 1.500 | | | | 11/13/23 | | | | 25,227 | |
| | 100,000 | | | | 3.500 | | | | 03/30/39 | | | | 17,512 | |
| | | | | | | | | | | | | | |
| | | | | | | | | | | | | 253,204 | |
| | |
| | Swiss Franc – 1.6% | |
| Swiss Confederation | |
| CHF | 60,000 | | | | 3.000 | | | | 01/08/18 | | | | 68,975 | |
| | 70,000 | | | | 2.000 | | | | 05/25/22 | | | | 82,721 | |
| | 30,000 | | | | 3.500 | | | | 04/08/33 | | | | 44,263 | |
| | | | | | | | | | | | | | |
| | | | | | | | | | | | | 195,959 | |
| | |
| | Thai Baht – 0.8% | |
| Thailand Government Bond | |
| THB | 230,000 | | | | 3.875 | | | | 06/13/19 | | | | 7,380 | |
| | 1,829,251 | | | | 1.200 | | | | 07/14/21 | | | | 54,794 | |
| | 590,000 | | | | 3.625 | | | | 06/16/23 | | | | 18,535 | |
| | 412,932 | | | | 1.250 | | | | 03/12/28 | | | | 11,737 | |
| | 300,000 | | | | 3.775 | | | | 06/25/32 | | | | 9,086 | |
| | | | | | | | | | | | | | |
| | | | | | | | | | | | | 101,532 | |
| | |
| | Turkish Lira – 1.1% | |
| Turkey Government Bond | |
| TRY | 300,000 | | | | 6.500 | | | | 01/07/15 | | | | 130,757 | |
| | |
| | United States Dollar – 1.9% | |
| Perusahaan Penerbit SBSN(b) | |
| $ | 200,000 | | | | 4.350 | | | | 09/10/24 | | | | 195,125 | |
| Republic of Argentina(c) | |
| | 488,000 | | | | 0.000 | | | | 12/15/35 | | | | 37,088 | |
| | | | | | | | | | | | | | |
| | | | | | | | | | | | | 232,213 | |
| | |
| | TOTAL FOREIGN SOVEREIGN DEBT OBLIGATIONS | |
| | (Cost $8,927,790) | | | $ | 8,455,473 | |
| | |
| | |
| 108 | | The accompanying notes are an integral part of these financial statements. |
GOLDMAN SACHS WORLD BOND FUND
| | | | | | | | | | | | | | |
Principal
Amount | | | Interest
Rate | | | Maturity
Date | | | Value | |
| | Structured Notes(b) – 1.4% | |
| Republic of Indonesia (Issuer Standard Chartered Bank) | |
| IDR | 1,008,000,000 | | | | 8.375 | % | | | 03/19/24 | | | $ | 81,774 | |
| | 1,000,000,000 | | | | 8.375 | | | | 03/19/24 | | | | 81,124 | |
| | |
| | TOTAL STRUCTURED NOTES | | | | | |
| | (Cost $174,711) | | | $ | 162,898 | |
| | |
| | | | | | | | | | | | | | |
| | U.S. Treasury Obligations – 22.9% | |
| United States Treasury Bill(a) | |
| $ | 930,000 | | | | 0.000 | % | | | 10/16/14 | | | $ | 929,997 | |
| United States Treasury Bonds | |
| | 620,000 | | | | 5.500 | (d) | | | 08/15/28 | | | | 814,060 | |
| | 130,000 | | | | 6.250 | | | | 05/15/30 | | | | 185,731 | |
| | 20,000 | | | | 2.750 | | | | 11/15/42 | | | | 18,297 | |
| United States Treasury Inflation Protected Securities | |
| | 54,457 | | | | 1.125 | | | | 01/15/21 | | | | 57,163 | |
| | 40,951 | | | | 0.375 | | | | 07/15/23 | | | | 40,548 | |
| | 112,321 | | | | 0.625 | | | | 01/15/24 | | | | 112,952 | |
| | 20,446 | | | | 1.375 | | | | 02/15/44 | | | | 21,887 | |
| United States Treasury Note | |
| | 570,000 | | | | 1.500 | | | | 06/30/16 | | | | 580,095 | |
| | |
| | TOTAL U.S. TREASURY OBLIGATIONS | |
| | (Cost $2,761,376) | | | $ | 2,760,730 | |
| | |
| TOTAL INVESTMENTS BEFORE SHORT-TERM
INVESTMENT |
|
| | (Cost $11,863,877) | | | $ | 11,379,101 | |
| | |
| | | | | | | | | | | | | | |
| | Short-term Investment(e) – 3.3% | |
| | Repurchase Agreement – 3.3% | |
| Joint Repurchase Agreement Account II | | | | | |
| $ | 400,000 | | | | 0.012 | % | | | 10/01/14 | | | $ | 400,000 | |
| | (Cost $400,000) | | | | | | | | | | | | | |
| | |
| | TOTAL INVESTMENTS – 97.8% | |
| | (Cost $12,263,877) | | | $ | 11,779,101 | |
| | |
| OTHER ASSETS IN EXCESS OF
LIABILITIES – 2.2% |
| | | 260,884 | |
| | |
| | NET ASSETS – 100.0% | | | $ | 12,039,985 | |
| | |
| | |
| The percentage shown for each investment category reflects the value of investments in that category as a percentage of net assets. |
(a) | | Issued with a zero coupon. Income is recognized through the accretion of discount. |
(b) | | Exempt from registration under Rule 144A of the Securities Act of 1933. Under procedures approved by the Board of Trustees, such securities have been determined to be liquid by the investment adviser and may be resold, normally to qualified institutional buyers in transactions exempt from registration. Total market value of Rule 144A securities amounts to $843,287, which represents approximately 7.0% of net assets as of September 30, 2014. |
(c) | | Variable rate security. Interest rate or distribution rate disclosed is that which is in effect at September 30, 2014. |
| | |
(d) | | All or a portion of security is segregated as collateral for initial margin requirement on futures transactions. |
(e) | | Joint repurchase agreement was entered into on September 30, 2014. Additional information appears on page 118. |
| | |
|
Currency Abbreviations: |
AUD | | —Australian Dollar |
BRL | | —Brazilian Real |
CAD | | —Canadian Dollar |
CHF | | —Swiss Franc |
CLP | | —Chilean Peso |
CNH | | —Chinese Yuan Renminbi Offshore |
COP | | —Colombian Peso |
CZK | | —Czech Koruna |
DKK | | —Danish Krone |
EUR | | —Euro |
GBP | | —British Pound |
HKD | | —Hong Kong Dollar |
HUF | | —Hungarian Forint |
IDR | | —Indonesian Rupiah |
ILS | | —Israeli Shekel |
INR | | —Indian Rupee |
JPY | | —Japanese Yen |
KRW | | —South Korean Won |
MXN | | —Mexican Peso |
MYR | | —Malaysian Ringgit |
NOK | | —Norwegian Krone |
NZD | | —New Zealand Dollar |
PEN | | —Peruvian Nuevo Sol |
PHP | | —Philippine Peso |
PLN | | —Polish Zloty |
RUB | | —Russian Ruble |
SEK | | —Swedish Krona |
SGD | | —Singapore Dollar |
THB | | —Thai Baht |
TRY | | —Turkish Lira |
TWD | | —Taiwan Dollar |
USD | | —U.S. Dollar |
ZAR | | —South African Rand |
| | |
Investment Abbreviations: |
AUDOR | | —Australian Dollar Offered Rate |
BUBOR | | —Budapest Interbank Offered Rate |
CDOR | | —Canadian Dollar Offered Rate |
CLICP | | —Sinacofi Chile Interbank Rate |
EURO | | —Euro Offered Rate |
JIBAR | | —Johannesburg Interbank Agreed Rate |
JYOR | | —Japanese Yen Offered Rate |
KLIBOR | | —Kuala Lumpur Interbank Offered Rate |
KWCDC | | —South Korean Won Certificate of Deposit |
LIBOR | | —London Interbank Offered Rate |
NZDOR | | —New Zealand Dollar Offered Rate |
STIBOR | | —Stockholm Interbank Offered Rate |
TIIE | | —La Tasa de Interbank Equilibrium Interest Rate |
|
| | |
| The accompanying notes are an integral part of these financial statements. | | 109 |
GOLDMAN SACHS WORLD BOND FUND
Schedule of Investments (continued)
September 30, 2014 (Unaudited)
|
| ADDITIONAL INVESTMENT INFORMATION |
FORWARD FOREIGN CURRENCY EXCHANGE CONTRACTS — At September 30, 2014, the Fund had the following forward foreign currency exchange contracts:
FORWARD FOREIGN CURRENCY EXCHANGE CONTRACTS WITH UNREALIZED GAIN
| | | | | | | | | | | | | | |
| Counterparty | | Contracts to
Buy/Sell | | Settlement
Date | | | Current
Value | | | Unrealized
Gain | |
Bank of America Securities LLC | | GBP/EUR | | | 12/17/14 | | | $ | 30,330 | | | $ | 821 | |
| | NOK/EUR | | | 12/17/14 | | | | 30,330 | | | | 619 | |
| | USD/AUD | | | 11/13/14 | | | | 44,085 | | | | 144 | |
| | USD/EUR | | | 12/17/14 | | | | 604,078 | | | | 19,861 | |
| | USD/JPY | | | 12/17/14 | | | | 60,615 | | | | 1,385 | |
| | USD/MXN | | | 10/31/14 | | | | 327,341 | | | | 6,044 | |
| | USD/MYR | | | 10/03/14 | | | | 24,475 | | | | 325 | |
| | USD/SEK | | | 11/06/14 | | | | 74,469 | | | | 1,093 | |
Barclays Bank PLC | | CAD/CHF | | | 12/17/14 | | | | 25,990 | | | | 16 | |
| | GBP/USD | | | 12/17/14 | | | | 92,342 | | | | 424 | |
| | USD/AUD | | | 12/17/14 | | | | 88,813 | | | | 3,648 | |
| | USD/HUF | | | 10/27/14 | | | | 145,259 | | | | 2,283 | |
| | USD/ILS | | | 12/17/14 | | | | 34,012 | | | | 2,359 | |
| | USD/INR | | | 10/07/14 | | | | 61,036 | | | | 964 | |
| | USD/INR | | | 10/27/14 | | | | 30,513 | | | | 487 | |
| | USD/KRW | | | 10/27/14 | | | | 45,313 | | | | 437 | |
| | USD/MYR | | | 10/03/14 | | | | 31,799 | | | | 104 | |
| | USD/NZD | | | 12/17/14 | | | | 29,431 | | | | 1,180 | |
| | USD/SEK | | | 12/17/14 | | | | 55,910 | | | | 968 | |
BNP Paribas SA | | EUR/PLN | | | 12/17/14 | | | | 30,267 | | | | 63 | |
| | EUR/USD | | | 12/17/14 | | | | 60,661 | | | | 9 | |
| | GBP/EUR | | | 12/17/14 | | | | 30,330 | | | | 708 | |
| | USD/AUD | | | 12/17/14 | | | | 118,411 | | | | 3,173 | |
| | USD/BRL | | | 10/22/14 | | | | 30,120 | | | | 880 | |
| | USD/GBP | | | 12/17/14 | | | | 61,561 | | | | 236 | |
| | USD/MYR | | | 10/20/14 | | | | 30,509 | | | | 491 | |
| | USD/PLN | | | 11/10/14 | | | | 19,445 | | | | 347 | |
| | USD/RUB | | | 10/27/14 | | | | 59,979 | | | | 1,021 | |
| | USD/TRY | | | 12/17/14 | | | | 28,946 | | | | 1,412 | |
Citibank NA (London) | | CHF/EUR | | | 12/17/14 | | | | 30,330 | | | | 91 | |
| | GBP/EUR | | | 12/17/14 | | | | 59,397 | | | | 322 | |
| | NOK/EUR | | | 12/17/14 | | | | 90,991 | | | | 1,240 | |
| | PHP/USD | | | 10/20/14 | | | | 15,003 | | | | 3 | |
| | USD/CAD | | | 12/17/14 | | | | 45,847 | | | | 653 | |
| | USD/CHF | | | 12/17/14 | | | | 96,975 | | | | 1,956 | |
| | USD/INR | | | 10/14/14 | | | | 60,932 | | | | 1,068 | |
| | USD/NZD | | | 12/17/14 | | | | 44,865 | | | | 2,698 | |
| | USD/PHP | | | 10/14/14 | | | | 14,653 | | | | 347 | |
| | USD/SGD | | | 12/17/14 | | | | 49,888 | | | | 835 | |
| | USD/TRY | | | 12/17/14 | | | | 29,999 | | | | 1,001 | |
| | USD/TWD | | | 10/17/14 | | | | 60,364 | | | | 636 | |
| | USD/TWD | | | 10/20/14 | | | | 60,464 | | | | 536 | |
Credit Suisse International (London) | | USD/CHF | | | 12/17/14 | | | | 104,547 | | | | 2,178 | |
| | USD/RUB | | | 10/02/14 | | | | 29,451 | | | | 1,549 | |
| | USD/RUB | | | 11/17/14 | | | | 4,052 | | | | 166 | |
Deutsche Bank AG (London) | | RUB/USD | | | 11/17/14 | | | | 7,312 | | | | 13 | |
| | USD/CNH | | | 12/17/14 | | | | 121,516 | | | | 484 | |
| | USD/EUR | | | 12/17/14 | | | | 30,330 | | | | 757 | |
| | USD/GBP | | | 10/22/14 | | | | 67,005 | | | | 1,012 | |
| | |
| 110 | | The accompanying notes are an integral part of these financial statements. |
GOLDMAN SACHS WORLD BOND FUND
|
| ADDITIONAL INVESTMENT INFORMATION (continued) |
FORWARD FOREIGN CURRENCY EXCHANGE CONTRACTS WITH UNREALIZED GAIN (continued)
| | | | | | | | | | | | | | |
| Counterparty | | Contracts to
Buy/Sell | | Settlement
Date | | | Current
Value | | | Unrealized
Gain | |
Deutsche Bank AG (London) (continued) | | USD/INR | | | 10/07/14 | | | $ | 24,137 | | | $ | 115 | |
| | USD/KRW | | | 10/14/14 | | | | 60,726 | | | | 1,274 | |
| | USD/MXN | | | 12/17/14 | | | | 60,193 | | | | 807 | |
| | USD/MYR | | | 10/07/14 | | | | 101,652 | | | | 2,580 | |
| | USD/NZD | | | 12/17/14 | | | | 119,273 | | | | 2,396 | |
| | USD/PHP | | | 10/14/14 | | | | 14,656 | | | | 344 | |
| | USD/PHP | | | 10/20/14 | | | | 30,569 | | | | 431 | |
| | USD/RUB | | | 10/02/14 | | | | 7,375 | | | | — | |
| | USD/RUB | | | 10/17/14 | | | | 3,097 | | | | 4 | |
| | USD/RUB | | | 11/17/14 | | | | 34,310 | | | | 2,443 | |
| | USD/SEK | | | 12/17/14 | | | | 60,497 | | | | 1,147 | |
| | USD/THB | | | 10/31/14 | | | | 40,795 | | | | 328 | |
| | USD/TWD | | | 10/20/14 | | | | 5,820 | | | | 41 | |
HSBC Bank PLC | | GBP/USD | | | 12/17/14 | | | | 30,781 | | | | 264 | |
| | SEK/EUR | | | 12/17/14 | | | | 60,661 | | | | 22 | |
| | TWD/USD | | | 10/20/14 | | | | 30,019 | | | | 19 | |
| | USD/BRL | | | 10/27/14 | | | | 17,409 | | | | 274 | |
| | USD/CNH | | | 12/17/14 | | | | 121,871 | | | | 129 | |
| | USD/GBP | | | 12/17/14 | | | | 61,561 | | | | 1,600 | |
| | USD/JPY | | | 12/17/14 | | | | 30,335 | | | | 665 | |
| | USD/KRW | | | 10/22/14 | | | | 8,849 | | | | 112 | |
| | USD/KRW | | | 10/23/14 | | | | 20,731 | | | | 269 | |
| | USD/MYR | | | 10/31/14 | | | | 129,750 | | | | 3,880 | |
| | USD/NZD | | | 12/17/14 | | | | 44,865 | | | | 2,868 | |
| | USD/SGD | | | 12/17/14 | | | | 71,882 | | | | 1,351 | |
| | USD/TRY | | | 12/17/14 | | | | 30,835 | | | | 1,556 | |
JPMorgan Chase Bank (London) | | MXN/USD | | | 10/31/14 | | | | 31,592 | | | | 224 | |
| | MXN/USD | | | 12/17/14 | | | | 30,099 | | | | 99 | |
| | SEK/EUR | | | 12/17/14 | | | | 112,475 | | | | 409 | |
| | USD/EUR | | | 10/30/14 | | | | 549,712 | | | | 14,177 | |
| | USD/EUR | | | 12/17/14 | | | | 30,330 | | | | 254 | |
| | USD/IDR | | | 10/31/14 | | | | 25,905 | | | | 522 | |
| | USD/INR | | | 10/29/14 | | | | 45,450 | | | | 550 | |
| | USD/JPY | | | 12/17/14 | | | | 103,726 | | | | 4,675 | |
| | USD/MXN | | | 12/17/14 | | | | 157,455 | | | | 2,745 | |
| | USD/RUB | | | 10/20/14 | | | | 14,598 | | | | 402 | |
| | USD/RUB | | | 11/17/14 | | | | 33,596 | | | | 2,147 | |
| | USD/TRY | | | 12/17/14 | | | | 59,593 | | | | 2,407 | |
Merrill Lynch International Bank Ltd. | | MXN/USD | | | 10/31/14 | | | | 10,921 | | | | 53 | |
Morgan Stanley & Co. International PLC | | TWD/USD | | | 10/17/14 | | | | 61,032 | | | | 32 | |
| | USD/AUD | | | 12/17/14 | | | | 40,659 | | | | 1,397 | |
| | USD/ILS | | | 12/17/14 | | | | 55,236 | | | | 3,389 | |
| | USD/TRY | | | 12/17/14 | | | | 29,328 | | | | 1,463 | |
Royal Bank of Canada | | USD/AUD | | | 12/17/14 | | | | 60,947 | | | | 225 | |
| | USD/CAD | | | 12/17/14 | | | | 152,261 | | | | 1,239 | |
| | USD/EUR | | | 10/30/14 | | | | 30,366 | | | | 696 | |
| | USD/JPY | | | 12/17/14 | | | | 30,269 | | | | 231 | |
| | USD/ZAR | | | 10/31/14 | | | | 106,566 | | | | 3,307 | |
Royal Bank of Scotland PLC | | USD/EUR | | | 10/30/14 | | | | 19,748 | | | | 335 | |
| | USD/EUR | | | 12/17/14 | | | | 30,330 | | | | 770 | |
| | USD/GBP | | | 12/17/14 | | | | 55,081 | | | | 267 | |
| | USD/JPY | | | 12/17/14 | | | | 29,428 | | | | 129 | |
| | USD/TRY | | | 12/17/14 | | | | 59,638 | | | | 1,361 | |
| | |
| The accompanying notes are an integral part of these financial statements. | | 111 |
GOLDMAN SACHS WORLD BOND FUND
Schedule of Investments (continued)
September 30, 2014 (Unaudited)
|
| ADDITIONAL INVESTMENT INFORMATION (continued) |
FORWARD FOREIGN CURRENCY EXCHANGE CONTRACTS WITH UNREALIZED GAIN (continued)
| | | | | | | | | | | | | | |
| Counterparty | | Contracts to
Buy/Sell | | Settlement
Date | | | Current
Value | | | Unrealized
Gain | |
Standard Chartered Bank | | USD/AUD | | | 12/17/14 | | | $ | 108,488 | | | $ | 4,415 | |
| | USD/CNH | | | 12/17/14 | | | | 122,601 | | | | 399 | |
| | USD/COP | | | 10/24/14 | | | | 300,779 | | | | 24,804 | |
| | USD/EUR | | | 12/17/14 | | | | 30,330 | | | | 830 | |
| | USD/IDR | | | 10/31/14 | | | | 85,874 | | | | 3,403 | |
| | USD/TRY | | | 12/17/14 | | | | 28,217 | | | | 1,448 | |
State Street Bank and Trust | | AUD/USD | | | 12/17/14 | | | | 60,511 | | | | 288 | |
| | EUR/USD | | | 10/30/14 | | | | 14,457 | | | | 59 | |
| | USD/CHF | | | 12/17/14 | | | | 97,684 | | | | 2,140 | |
| | USD/JPY | | | 12/17/14 | | | | 89,896 | | | | 2,104 | |
| | USD/NZD | | | 12/17/14 | | | | 48,317 | | | | 3,050 | |
| | USD/SEK | | | 12/17/14 | | | | 55,865 | | | | 841 | |
UBS AG (London) | | NZD/USD | | | 12/17/14 | | | | 60,411 | | | | 185 | |
| | USD/BRL | | | 10/14/14 | | | | 60,354 | | | | 646 | |
| | USD/EUR | | | 12/17/14 | | | | 30,330 | | | | 236 | |
| | USD/GBP | | | 10/22/14 | | | | 53,758 | | | | 52 | |
| | USD/HUF | | | 12/17/14 | | | | 38,982 | | | | 972 | |
Westpac Banking Corp. | | AUD/USD | | | 12/17/14 | | | | 91,420 | | | | 231 | |
| | USD/AUD | | | 12/17/14 | | | | 146,903 | | | | 5,694 | |
| | USD/EUR | | | 10/30/14 | | | | 15,394 | | | | 353 | |
| | USD/EUR | | | 12/17/14 | | | | 123,757 | | | | 2,930 | |
| | USD/MYR | | | 10/20/14 | | | | 29,764 | | | | 580 | |
| | USD/NZD | | | 12/17/14 | | | | 58,087 | | | | 3,542 | |
| | | USD/SGD | | | 12/17/14 | | | | 62,736 | | | | 1,183 | |
| TOTAL | | | | | | | | | | | | $ | 197,856 | |
FORWARD FOREIGN CURRENCY EXCHANGE CONTRACTS WITH UNREALIZED LOSS
| | | | | | | | | | | | | | |
| Counterparty | | Contracts to
Buy/Sell | | Settlement
Date | | | Current
Value | | | Unrealized
Loss | |
Bank of America Securities LLC | | EUR/GBP | | | 12/17/14 | | | $ | 61,592 | | | $ | (931 | ) |
| | EUR/USD | | | 12/17/14 | | | | 150,387 | | | | (2,433 | ) |
| | HUF/USD | | | 12/17/14 | | | | 30,423 | | | | (577 | ) |
| | MYR/USD | | | 10/31/14 | | | | 70,407 | | | | (1,307 | ) |
Barclays Bank PLC | | EUR/PLN | | | 12/17/14 | | | | 61,085 | | | | (424 | ) |
| | EUR/USD | | | 12/17/14 | | | | 30,330 | | | | (706 | ) |
| | ILS/USD | | | 12/17/14 | | | | 16,594 | | | | (503 | ) |
| | INR/USD | | | 10/07/14 | | | | 54,317 | | | | (607 | ) |
| | INR/USD | | | 10/27/14 | | | | 51,674 | | | | (936 | ) |
| | JPY/USD | | | 12/17/14 | | | | 29,763 | | | | (1,237 | ) |
| | MYR/USD | | | 10/07/14 | | | | 74,322 | | | | (2,138 | ) |
| | MYR/USD | | | 10/20/14 | | | | 23,964 | | | | (36 | ) |
| | MYR/USD | | | 10/29/14 | | | | 47,106 | | | | (235 | ) |
| | NZD/USD | | | 12/17/14 | | | | 28,656 | | | | (1,700 | ) |
| | PLN/USD | | | 12/17/14 | | | | 43,188 | | | | (1,420 | ) |
| | TWD/USD | | | 10/27/14 | | | | 30,795 | | | | (205 | ) |
BNP Paribas SA | | AUD/USD | | | 12/17/14 | | | | 58,335 | | | | (2,214 | ) |
| | GBP/USD | | | 12/17/14 | | | | 28,469 | | | | (725 | ) |
| | ILS/USD | | | 12/17/14 | | | | 45,415 | | | | (585 | ) |
| | INR/USD | | | 10/14/14 | | | | 15,869 | | | | (216 | ) |
| | PLN/USD | | | 12/17/14 | | | | 43,539 | | | | (1,004 | ) |
| | |
| 112 | | The accompanying notes are an integral part of these financial statements. |
GOLDMAN SACHS WORLD BOND FUND
|
| ADDITIONAL INVESTMENT INFORMATION (continued) |
FORWARD FOREIGN CURRENCY EXCHANGE CONTRACTS WITH UNREALIZED LOSS (continued)
| | | | | | | | | | | | | | |
| Counterparty | | Contracts to
Buy/Sell | | Settlement
Date | | | Current
Value | | | Unrealized
Loss | |
Citibank NA (London) | | AUD/USD | | | 12/17/14 | | | $ | 89,679 | | | $ | (1,813 | ) |
| | EUR/CHF | | | 12/17/14 | | | | 60,697 | | | | (36 | ) |
| | EUR/GBP | | | 12/17/14 | | | | 30,708 | | | | (378 | ) |
| | IDR/USD | | | 10/31/14 | | | | 25,905 | | | | (1,020 | ) |
| | ILS/USD | | | 12/17/14 | | | | 28,287 | | | | (713 | ) |
| | JPY/USD | | | 11/07/14 | | | | 149,232 | | | | (588 | ) |
| | MXN/USD | | | 12/17/14 | | | | 62,047 | | | | (838 | ) |
| | MYR/USD | | | 10/03/14 | | | | 30,470 | | | | (732 | ) |
| | NOK/EUR | | | 12/17/14 | | | | 60,661 | | | | (90 | ) |
| | NOK/USD | | | 11/06/14 | | | | 29,131 | | | | (437 | ) |
| | NZD/USD | | | 12/17/14 | | | | 29,431 | | | | (1,166 | ) |
| | PHP/USD | | | 10/29/14 | | | | 14,943 | | | | (57 | ) |
Credit Suisse International (London) | | DKK/USD | | | 11/10/14 | | | | 25,437 | | | | (488 | ) |
| | EUR/CHF | | | 12/17/14 | | | | 60,694 | | | | (33 | ) |
| | PEN/USD | | | 11/18/14 | | | | 19,107 | | | | (635 | ) |
| | RUB/USD | | | 10/02/14 | | | | 29,076 | | | | (1,924 | ) |
| | RUB/USD | | | 10/24/14 | | | | 60,028 | | | | (4,245 | ) |
| | RUB/USD | | | 10/27/14 | | | | 59,260 | | | | (1,740 | ) |
Deutsche Bank AG (London) | | AUD/USD | | | 12/17/14 | | | | 58,335 | | | | (2,278 | ) |
| | CNH/USD | | | 12/17/14 | | | | 124,324 | | | | (676 | ) |
| | EUR/USD | | | 12/17/14 | | | | 181,982 | | | | (3,677 | ) |
| | IDR/USD | | | 11/03/14 | | | | 29,951 | | | | (49 | ) |
| | ILS/USD | | | 10/27/14 | | | | 12,220 | | | | (281 | ) |
| | INR/USD | | | 10/29/14 | | | | 23,986 | | | | (176 | ) |
| | MYR/USD | | | 10/31/14 | | | | 7,293 | | | | (284 | ) |
| | PHP/USD | | | 10/20/14 | | | | 29,980 | | | | (20 | ) |
| | PLN/USD | | | 12/17/14 | | | | 9,654 | | | | (346 | ) |
| | RUB/USD | | | 10/02/14 | | | | 7,750 | | | | (407 | ) |
HSBC Bank PLC | | EUR/USD | | | 12/17/14 | | | | 60,661 | | | | (828 | ) |
| | INR/USD | | | 10/27/14 | | | | 47,775 | | | | (738 | ) |
| | MXN/USD | | | 12/17/14 | | | | 61,461 | | | | (780 | ) |
| | RUB/USD | | | 10/17/14 | | | | 14,567 | | | | (433 | ) |
| | RUB/USD | | | 10/24/14 | | | | 100,759 | | | | (9,537 | ) |
| | SGD/USD | | | 12/17/14 | | | | 60,494 | | | | (506 | ) |
| | USD/GBP | | | 12/17/14 | | | | 61,561 | | | | (198 | ) |
JPMorgan Chase Bank (London) | | EUR/GBP | | | 12/17/14 | | | | 62,355 | | | | (1,694 | ) |
| | EUR/NOK | | | 12/17/14 | | | | 61,515 | | | | (854 | ) |
| | JPY/USD | | | 12/17/14 | | | | 120,111 | | | | (2,889 | ) |
| | MYR/USD | | | 10/03/14 | | | | 25,804 | | | | (562 | ) |
| | MYR/USD | | | 10/20/14 | | | | 14,947 | | | | (53 | ) |
| | SEK/USD | | | 12/17/14 | | | | 60,902 | | | | (1,098 | ) |
| | TRY/USD | | | 12/17/14 | | | | 30,353 | | | | (647 | ) |
| | USD/MXN | | | 12/17/14 | | | | 92,200 | | | | (200 | ) |
Merrill Lynch International Bank Ltd. | | EUR/USD | | | 10/30/14 | | | | 14,574 | | | | (293 | ) |
| | HUF/USD | | | 10/27/14 | | | | 22,698 | | | | (192 | ) |
Morgan Stanley & Co. International PLC | | AUD/USD | | | 12/17/14 | | | | 59,205 | | | | (2,266 | ) |
| | BRL/USD | | | 10/14/14 | | | | 14,423 | | | | (630 | ) |
| | BRL/USD | | | 10/27/14 | | | | 30,340 | | | | (660 | ) |
| | CHF/USD | | | 12/17/14 | | | | 30,350 | | | | (650 | ) |
| | EUR/CHF | | | 12/17/14 | | | | 60,709 | | | | (48 | ) |
| | EUR/HUF | | | 12/17/14 | | | | 15,457 | | | | (292 | ) |
| | EUR/USD | | | 12/17/14 | | | | 181,982 | | | | (953 | ) |
| | |
| The accompanying notes are an integral part of these financial statements. | | 113 |
GOLDMAN SACHS WORLD BOND FUND
Schedule of Investments (continued)
September 30, 2014 (Unaudited)
|
| ADDITIONAL INVESTMENT INFORMATION (continued) |
FORWARD FOREIGN CURRENCY EXCHANGE CONTRACTS WITH UNREALIZED LOSS (continued)
| | | | | | | | | | | | | | |
| Counterparty | | Contracts to
Buy/Sell | | Settlement
Date | | | Current
Value | | | Unrealized
Loss | |
Morgan Stanley & Co. International PLC (continued) | | INR/USD | | | 10/27/14 | | | $ | 48,126 | | | $ | (781 | ) |
| | KRW/USD | | | 10/27/14 | | | | 30,404 | | | | (597 | ) |
Royal Bank of Canada | | CAD/USD | | | 12/17/14 | | | | 155,781 | | | | (2,542 | ) |
| | EUR/USD | | | 10/30/14 | | | | 17,846 | | | | (69 | ) |
| | EUR/USD | | | 12/17/14 | | | | 60,661 | | | | (1,140 | ) |
| | GBP/USD | | | 12/17/14 | | | | 58,321 | | | | (942 | ) |
| | JPY/USD | | | 12/17/14 | | | | 59,227 | | | | (2,773 | ) |
| | MXN/USD | | | 12/17/14 | | | | 123,677 | | | | (2,400 | ) |
| | PEN/USD | | | 10/24/14 | | | | 19,116 | | | | (612 | ) |
Royal Bank of Scotland PLC | | NZD/USD | | | 12/17/14 | | | | 29,431 | | | | (1,260 | ) |
| | TRY/USD | | | 12/17/14 | | | | 145,308 | | | | (4,694 | ) |
| | TWD/USD | | | 10/31/14 | | | | 324,774 | | | | (4,987 | ) |
| | USD/TRY | | | 12/17/14 | | | | 30,109 | | | | (109 | ) |
Standard Chartered Bank | | CLP/USD | | | 10/24/14 | | | | 52,976 | | | | (3,723 | ) |
| | INR/USD | | | 10/14/14 | | | | 101,503 | | | | (1,121 | ) |
| | JPY/USD | | | 12/17/14 | | | | 135,169 | | | | (4,831 | ) |
| | KRW/USD | | | 10/14/14 | | | | 29,982 | | | | (18 | ) |
| | MXN/USD | | | 12/17/14 | | | | 97,225 | | | | (2,097 | ) |
| | MYR/USD | | | 10/31/14 | | | | 40,521 | | | | (1,213 | ) |
| | PHP/USD | | | 10/31/14 | | | | 78,453 | | | | (3,086 | ) |
| | PLN/USD | | | 12/17/14 | | | | 40,839 | | | | (1,294 | ) |
| | TRY/USD | | | 12/17/14 | | | | 30,419 | | | | (581 | ) |
State Street Bank and Trust | | AUD/USD | | | 12/17/14 | | | | 29,603 | | | | (641 | ) |
| | EUR/GBP | | | 12/17/14 | | | | 30,869 | | | | (539 | ) |
| | EUR/USD | | | 12/17/14 | | | | 60,661 | | | | (1,327 | ) |
| | GBP/USD | | | 12/17/14 | | | | 61,561 | | | | (821 | ) |
| | HKD/USD | | | 11/13/14 | | | | 196,593 | | | | (218 | ) |
| | JPY/USD | | | 12/17/14 | | | | 105,866 | | | | (884 | ) |
| | SGD/USD | | | 11/13/14 | | | | 123,202 | | | | (411 | ) |
UBS AG (London) | | BRL/USD | | | 10/14/14 | | | | 58,245 | | | | (3,755 | ) |
| | CHF/USD | | | 11/06/14 | | | | 55,756 | | | | (1,067 | ) |
| | CHF/USD | | | 12/17/14 | | | | 30,323 | | | | (678 | ) |
| | INR/USD | | | 10/07/14 | | | | 30,855 | | | | (507 | ) |
| | PLN/USD | | | 12/17/14 | | | | 43,694 | | | | (900 | ) |
| | RUB/USD | | | 10/24/14 | | | | 49,565 | | | | (5,436 | ) |
| | RUB/USD | | | 11/17/14 | | | | 63,852 | | | | (5,352 | ) |
Westpac Banking Corp. | | AUD/USD | | | 12/17/14 | | | | 178,486 | | | | (4,864 | ) |
| | KRW/USD | | | 10/31/14 | | | | 434,912 | | | | (13,129 | ) |
| | | NZD/USD | | | 12/17/14 | | | | 140,076 | | | | (6,233 | ) |
| TOTAL | | | | | | | | | | | | $ | (159,899 | ) |
FUTURES CONTRACTS — At September 30, 2014, the Fund had the following futures contracts:
| | | | | | | | | | | | | | |
| Type | | Number of
Contracts
Long (Short) | | | Expiration
Date | | Current
Value | | | Unrealized
Gain (Loss) | |
Eurodollars | | | (16 | ) | | March 2017 | | $ | (3,903,000 | ) | | $ | 4,539 | |
Eurodollars | | | (8 | ) | | September 2017 | | | (1,944,700 | ) | | | 4,782 | |
Ultra Long U.S. Treasury Bonds | | | 4 | | | December 2014 | | | 610,000 | | | | (9,101 | ) |
2 Year German Euro-Schatz | | | 2 | | | December 2014 | | | 280,410 | | | | 262 | |
5 Year German Euro-Bobl | | | (1 | ) | | December 2014 | | | (161,569 | ) | | | (532 | ) |
| | |
| 114 | | The accompanying notes are an integral part of these financial statements. |
GOLDMAN SACHS WORLD BOND FUND
|
| ADDITIONAL INVESTMENT INFORMATION (continued) |
FUTURES CONTRACTS (continued)
| | | | | | | | | | | | | | |
| Type | | Number of
Contracts
Long (Short) | | | Expiration
Date | | Current
Value | | | Unrealized
Gain (Loss) | |
2 Year U.S. Treasury Notes | | | 2 | | | December 2014 | | $ | 437,688 | | | $ | 28 | |
5 Year U.S. Treasury Notes | | | (24 | ) | | December 2014 | | | (2,838,188 | ) | | | 7,480 | |
10 Year U.S. Treasury Notes | | | 7 | | | December 2014 | | | 872,484 | | | | (1,157 | ) |
20 Year U.S. Treasury Bonds | | | (3 | ) | | December 2014 | | | (413,719 | ) | | | 5,432 | |
| TOTAL | | | | | | | | | | | | $ | 11,733 | |
SWAP CONTRACTS — At September 30, 2014, the Fund had the following swap contracts:
OVER THE COUNTER INTEREST RATE SWAP CONTRACTS
| | | | | | | | | | | | | | | | | | | | |
| | | | | | | | | | | | Rates Exchanged | | | |
| Counterparty | | Notional
Amount
(000s) | | | Termination
Date | | | Payments
Received | | Payments
Made | | Unrealized
Gain (Loss)* | |
Bank of America Securities LLC | | | KRW | | | | 6,270 | | | | 12/13/23 | | | 3 month KWCDC | | 3.488% | | $ | (405 | ) |
| | | | | | | 2,150 | | | | 01/16/24 | | | 3 month KWCDC | | 3.445 | | | (134 | ) |
| | | MXN | | | | 610 | | | | 03/03/26 | | | 6.930% | | Mexico Interbank
TIIE 28 Days | | | 1,460 | |
Barclays Bank PLC | | | KRW | | | | 211,330 | | | | 05/30/23 | | | 3 month KWCDC | | 2.995 | | | (5,566 | ) |
Citibank NA (London) | | | BRL | | | | 110 | | | | 01/04/16 | | | 11.190 | | 1 month Brazilian
Interbank Deposit
Average | | | (320 | ) |
| | | | | | | 610 | | | | 01/04/16 | | | 8.890 | | 1 month Brazilian
Interbank Deposit
Average | | | (10,108 | ) |
| | | | | | | 250 | | | | 01/02/17 | | | 11.455 | | 1 month Brazilian
Interbank Deposit
Average | | | (1,046 | ) |
| | | CLP | | | | 22,720 | | | | 03/13/19 | | | 6 month CLICP | | 4.650 | | | (922 | ) |
| | | | | | | 11,530 | | | | 09/12/19 | | | 6 month CLICP | | 4.050 | | | 132 | |
| | | BRL | | | | 330 | | | | 01/04/21 | | | 11.765 | | 1 month Brazilian
Interbank Deposit
Average | | | (1,047 | ) |
| | | ZAR | | | | 820 | | | | 05/09/23 | | | 3 month JIBAR | | 6.380 | | | 7,910 | |
| | | KRW | | | | 6,300 | | | | 12/18/23 | | | 3 month KWCDC | | 3.420 | | | (372 | ) |
| | | | | | | 73,270 | | | | 01/10/24 | | | 3 month KWCDC | | 3.475 | | | (4,747 | ) |
| | | COP | | | | 10,590 | | | | 04/16/24 | | | Colombia 90 days DTF | | 5.920 | | | 111 | |
| | | KRW | | | | 47,740 | | | | 07/11/24 | | | 2.940 | | 3 month KWCDC | | | 1,017 | |
Credit Suisse First Boston Corp. | | | CLP | | | | 20,370 | | | | 04/28/17 | | | 6 month CLICP | | 3.980 | | | (413 | ) |
| | | | | | | 6,240 | | | | 07/28/17 | | | 6 month CLICP | | 3.640 | | | (18 | ) |
| | | | | | | 18,420 | | | | 02/28/19 | | | 6 month CLICP | | 4.573 | | | (673 | ) |
| | | COP | | | | 35,680 | | | | 04/15/19 | | | Colombia 90 days DTF | | 5.110 | | | 91 | |
| | | | | | | 28,990 | | | | 06/18/19 | | | Colombia IBR
Overnight Interbank | | 5.350 | | | (13 | ) |
Deutsche Bank AG (London) | | | KRW | | | | 36,990 | | | | 03/03/17 | | | 2.850 | | 3 month KWCDC | | | 479 | |
| | | BRL | | | | 770 | | | | 01/02/18 | | | 11.610 | | 1 month Brazilian
Interbank Deposit
Average | | | (3,703 | ) |
| | | MYR | | | | 1,230 | | | | 11/14/18 | | | 3 month KLIBOR | | 3.880 | | | 1,076 | |
| | |
| The accompanying notes are an integral part of these financial statements. | | 115 |
GOLDMAN SACHS WORLD BOND FUND
Schedule of Investments (continued)
September 30, 2014 (Unaudited)
|
| ADDITIONAL INVESTMENT INFORMATION (continued) |
OVER THE COUNTER INTEREST RATE SWAP CONTRACTS (continued)
| | | | | | | | | | | | | | | | | | | | |
| | | | | | | | | | | | Rates Exchanged | | | |
| Counterparty | | Notional
Amount
(000s) | | | Termination
Date | | | Payments
Received | | Payments
Made | | Unrealized
Gain (Loss)* | |
Deutsche Bank AG (London) (continued) | | | CLP | | | | 66,510 | | | | 04/10/19 | | | 6 month CLICP | | 4.430% | | $ | (1,859 | ) |
| | | COP | | | | 19,820 | | | | 06/17/19 | | | Colombia IBR
Overnight Interbank | | 5.320 | | | 3 | |
| | | CLP | | | | 6,220 | | | | 07/28/19 | | | 6 month CLICP | | 4.000 | | | 75 | |
| | | BRL | | | | 210 | | | | 01/04/21 | | | 11.230% | | 1 month Brazilian
Interbank Deposit
Average | | | (2,087 | ) |
| | | MXN | | | | 470 | | | | 06/01/23 | | | 6.255 | | Mexico Interbank TIIE
28 Days | | | 183 | |
| | | | | | | 170 | | | | 11/03/23 | | | 6.860 | | Mexico Interbank TIIE
28 Days | | | 579 | |
JPMorgan Securities, Inc. | | | MYR | | | | 410 | | | | 04/15/19 | | | 3 month KLIBOR | | 4.100 | | | (656 | ) |
| | | COP | | | | 31,850 | | | | 04/22/19 | | | Colombia IBR
Overnight Interbank | | 5.190 | | | 41 | |
| | | KRW | | | | 6,820 | | | | 12/23/23 | | | 3 month KWCDC | | 3.470 | | | (429 | ) |
| | | | | | | 54,420 | | | | 01/07/24 | | | 3 month KWCDC | | 3.471 | | | (3,511 | ) |
| | | | | | | 36,950 | | | | 01/15/24 | | | 3 month KWCDC | | 3.445 | | | (2,301 | ) |
Morgan Stanley & Co. International PLC | | | BRL | | | | 630 | | | | 01/02/17 | | | 11.565 | | 1 month Brazilian
Interbank Deposit
Average | | | (2,178 | ) |
| | | CLP | | | | 3,300 | | | | 04/15/19 | | | 6 month CLICP | | 4.350 | | | (71 | ) |
| | | | BRL | | | | 70 | | | | 01/04/21 | | | 1 month Brazilian
Interbank Deposit
Average | | 11.410 | | | 527 | |
| TOTAL | | | | | | | | | | | | | | | | | | $ | (28,895 | ) |
| | * | | There are no upfront payments on the swap contract(s), therefore the unrealized gain/loss of the swap contract(s) is equal to their market value. |
| | |
| 116 | | The accompanying notes are an integral part of these financial statements. |
GOLDMAN SACHS WORLD BOND FUND
|
| ADDITIONAL INVESTMENT INFORMATION (continued) |
CENTRALLY CLEARED INTEREST RATE SWAP CONTRACTS
| | | | | | | | | | | | | | | | | | |
| | | | | | | Rates Exchanged | | Market Value | |
Notional
Amount
(000s) | | | Termination
Date | | | Payments
Received | | Payments
Made | | Upfront
Payments
Made (Received) | | | Unrealized
Gain (Loss) | |
| GBP | 200 | (a) | | | 09/12/17 | | | 6 month GBP | | 2.250% | | $ | 441 | | | $ | (550 | ) |
| $ | 950 | (a) | | | 12/17/17 | | | 1.500% | | 3 month LIBOR | | | 533 | | | | (59 | ) |
| ZAR | 390 | | | | 06/13/19 | | | 7.640 | | 3 month JIBAR | | | — | | | | 51 | |
| | 480 | | | | 09/05/19 | | | 7.280 | | 3 month JIBAR | | | (1 | ) | | | (447 | ) |
| | 590 | | | | 09/08/19 | | | 7.310 | | 3 month JIBAR | | | (2 | ) | | | (522 | ) |
| EUR | 400 | (a) | | | 12/17/19 | | | 1.000 | | 6 month EURO | | | 12,215 | | | | 743 | |
| $ | 1,400 | (a) | | | 12/17/19 | | | 2.250 | | 3 month LIBOR | | | 10,213 | | | | 1,826 | |
| SEK | 4,320 | (a) | | | 12/17/19 | | | 3 month STIBOR | | 1.250 | | | (5,264 | ) | | | 1,376 | |
| NZD | 830 | (a) | | | 12/17/19 | | | 4.500 | | 3 month NZDOR | | | (1,664 | ) | | | 4,251 | |
| AUD | 460 | (a) | | | 12/17/19 | | | 6 month AUDOR | | 3.750 | | | (5,008 | ) | | | (1,911 | ) |
| GBP | 130 | (a) | | | 02/05/21 | | | 2.840 | | 6 month GBP | | | (31 | ) | | | 3,371 | |
| | 210 | (a) | | | 09/12/21 | | | 2.680 | | 6 month GBP | | | (2,729 | ) | | | 3,124 | |
| JPY | 40,230 | (a) | | | 12/17/21 | | | 0.500 | | 6 month JYOR | | | 2,560 | | | | (857 | ) |
| $ | 370 | (a) | | | 12/17/21 | | | 3 month LIBOR | | 2.500 | | | (829 | ) | | | (1,223 | ) |
| HUF | 30,350 | | | | 01/29/24 | | | 6 month BUBOR | | 5.360 | | | 1 | | | | (19,349 | ) |
| ZAR | 390 | | | | 03/14/24 | | | 3 month JIBAR | | 8.550 | | | — | | | | (838 | ) |
| AUD | 340 | (a) | | | 09/17/24 | | | 4.500 | | 6 month AUDOR | | | (1,198 | ) | | | 1,678 | |
| GBP | 220 | (a) | | | 09/17/24 | | | 6 month GBP | | 3.250 | | | (1,461 | ) | | | (1,604 | ) |
| $ | 490 | (a) | | | 12/17/24 | | | 3 month LIBOR | | 3.000 | | | (8,284 | ) | | | (3,676 | ) |
| CAD | 90 | (a) | | | 12/17/24 | | | 3.000 | | 6 month CDOR | | | 3,697 | | | | (1,258 | ) |
| GBP | 70 | (a) | | | 12/17/24 | | | 3.000 | | 6 month GBP | | | 5,070 | | | | (409 | ) |
| AUD | 220 | (a) | | | 12/17/24 | | | 4.500 | | 6 month AUDOR | | | 8,149 | | | | 1,920 | |
| EUR | 60 | (a) | | | 12/17/24 | | | 6 month EURO | | 2.000 | | | (6,618 | ) | | | 631 | |
| JPY | 79,940 | (a) | | | 12/17/24 | | | 6 month JYOR | | 0.750 | | | (7,504 | ) | | | 2,715 | |
| GBP | 270 | (a) | | | 12/18/24 | | | 3.250 | | 6 month GBP | | | 2,196 | | | | 1,141 | |
| EUR | 360 | (a) | | | 12/18/24 | | | 6 month EURO | | 2.000 | | | 689 | | | | (2,240 | ) |
| JPY | 70,000 | (a) | | | 05/09/25 | | | 6 month JYOR | | 1.650 | | | 9,529 | | | | (14,937 | ) |
| GBP | 110 | (a) | | | 09/12/26 | | | 6 month GBP | | 2.980 | | | 1,712 | | | | (2,824 | ) |
| JPY | 43,000 | (a) | | | 05/09/27 | | | 1.880 | | 6 month JYOR | | | (8,578 | ) | | | 14,743 | |
| $ | 850 | (a) | | | 12/17/29 | | | 3 month LIBOR | | 3.250 | | | (15,203 | ) | | | (10,066 | ) |
| GBP | 70 | (a) | | | 02/05/36 | | | 6 month GBP | | 3.500 | | | 842 | | | | (9,491 | ) |
| $ | 210 | (a) | | | 12/17/44 | | | 3.500 | | 3 month LIBOR | | | 6,986 | | | | 4,240 | |
| GBP | 140 | (a) | | | 12/17/44 | | | 6 month GBP | | 3.250 | | | (13,879 | ) | | | (2,810 | ) |
| | TOTAL | | | | | | | | | | | $ | (13,420 | ) | | $ | (33,261 | ) |
| | (a) | | Represents forward starting interest rate swaps whose effective dates of commencement of accruals and cash flows occur subsequent to September 30, 2014. |
| | |
| The accompanying notes are an integral part of these financial statements. | | 117 |
GOLDMAN SACHS MULTI SECTOR FIXED INCOME FUNDS
Schedule of Investments (continued)
September 30, 2014 (Unaudited)
|
| ADDITIONAL INVESTMENT INFORMATION (continued) |
JOINT REPURCHASE AGREEMENT ACCOUNT II — At September 30, 2014, the Funds had undivided interests in the Joint Repurchase Agreement Account II, with a maturity date of October 1, 2014, as follows:
| | | | | | | | | | | | |
| Fund | | Principal Amount | | | Maturity Value | | | Collateral
Allocation
Value | |
Bond Fund | | $ | 18,600,000 | | | $ | 18,600,006 | | | $ | 19,097,872 | |
Core Fixed Income | | | 43,300,000 | | | | 43,300,014 | | | | 44,459,025 | |
Global Income | | | 3,900,000 | | | | 3,900,001 | | | | 4,004,393 | |
Strategic Income | | | 294,700,000 | | | | 294,700,096 | | | | 302,588,328 | |
World Bond | | | 400,000 | | | | 400,000 | | | | 410,707 | |
REPURCHASE AGREEMENTS — At September 30, 2014, the Principal Amounts of the Funds’ interest in the Joint Repurchase Agreement Account II were as follows:
| | | | | | | | | | | | | | | | | | | | | | | | |
| Counterparty | | Interest
Rate | | | Bond
Fund | | | Core Fixed
Income | | | Global Income | | | Strategic Income | | | World Bond | |
BNP Paribas Securities Co. | | | 0.010 | % | | $ | 5,102,342 | | | $ | 11,878,033 | | | $ | 1,069,846 | | | $ | 80,841,950 | | | $ | 109,728 | |
Citigroup Global Markets, Inc. | | | 0.000 | | | | 545,558 | | | | 1,270,036 | | | | 114,391 | | | | 8,643,870 | | | | 11,732 | |
TD Securities (USA) LLC | | | 0.005 | | | | 7,064,782 | | | | 16,446,508 | | | | 1,481,325 | | | | 111,935,007 | | | | 151,931 | |
Wells Fargo Securities LLC | | | 0.030 | | | | 5,887,318 | | | | 13,705,423 | | | | 1,234,438 | | | | 93,279,173 | | | | 126,609 | |
| TOTAL | | | | | | $ | 18,600,000 | | | $ | 43,300,000 | | | $ | 3,900,000 | | | $ | 294,700,000 | | | $ | 400,000 | |
| | |
| 118 | | The accompanying notes are an integral part of these financial statements. |
GOLDMAN SACHS WORLD BOND FUND
|
| ADDITIONAL INVESTMENT INFORMATION (continued) |
At September 30, 2014, the Joint Repurchase Agreement Account II was fully collateralized by:
| | | | | | | | |
| Issuer | | Interest Rates | | | Maturity Dates | |
Federal National Mortgage Association | | | 2.500% to 6.000 | % | | | 05/01/21 to 09/01/44 | |
Government National Mortgage Association | | | 3.500 to 4.500 | | | | 08/15/42 to 06/20/44 | |
U.S. Treasury Bond | | | 5.375 | | | | 02/15/31 | |
U.S. Treasury Inflation Protected Securities | | | 0.125 to 0.500 | | | | 04/15/15 to 04/15/16 | |
U.S. Treasury Note | | | 0.875 | | | | 08/15/17 | |
| | |
| The accompanying notes are an integral part of these financial statements. | | 119 |
GOLDMAN SACHS MULTI SECTOR FIXED INCOME FUNDS
Statements of Assets and Liabilities
September 30, 2014 (Unaudited)
| | | | | | |
| | | | |
Bond Fund | |
| | Assets: | | | | |
| | Investments, at value (cost $241,588,974, $1,130,475,290, $458,344,854, $25,495,923,151 and $12,263,877) | | $ | 248,239,297 | |
| | Cash | | | 60,689 | |
| | Foreign currencies, at value (cost $30,392, $52,162, $92,340, $2,116,132 and $35,210, respectively) | | | 32,444 | |
| | Receivables: | | | | |
| | Investments sold on an extended-settlement basis | | | 31,014,453 | |
| | Investments sold | | | 307,920 | |
| | Collateral on certain derivative contracts(a) | | | 1,608,567 | |
| | Unrealized gain on forward foreign currency exchange contracts | | | 1,317,100 | |
| | Interest | | | 1,179,771 | |
| | Fund shares sold | | | 494,187 | |
| | Reimbursement from investment adviser | | | 58,761 | |
| | Unrealized gain on swap contracts | | | 49,822 | |
| | Upfront payments made on swap contracts | | | 1,191 | |
| | Variation margin on certain derivative contracts | | | 886 | |
| | Due from broker — upfront payment | | | 89 | |
| | Foreign tax reclaims | | | — | |
| | Other assets | | | 1,868 | |
| | Total assets | | | 284,367,045 | |
| | | | | | |
| | Liabilities: | | | | |
| | Payables: | | | | |
| | Investments purchased on an extended-settlement basis | | | 42,299,928 | |
| | Investments purchased | | | 870,853 | |
| | Forward sale contracts, at value (proceeds received $8,834,688, $39,250,000, $10,846,563, $144,135,781 and $0, respectively) | | | 8,869,922 | |
| | Collateral on certain derivative contracts | | | 2,260,003 | |
| | Unrealized loss on forward foreign currency exchange contracts | | | 793,692 | |
| | Fund shares redeemed | | | 408,488 | |
| | Unrealized loss on swap contracts | | | 335,711 | |
| | Management fees | | | 85,357 | |
| | Upfront payments received on swap contracts | | | 38,918 | |
| | Distribution and Service fees and Transfer Agent fee | | | 26,839 | |
| | Income distribution | | | 16,383 | |
| | Variation margin on certain derivative contracts | | | 15,808 | |
| | Written option contracts, at value (premium received $111,617 for the Global Income Fund) | | | — | |
| | Due to broker — upfront payment | | | — | |
| | Accrued expenses and other liabilities | | | 210,396 | |
| | Total liabilities | | | 56,232,298 | |
| | | | | | |
| | Net Assets: | | | | |
| | Paid-in capital | | | 217,253,759 | |
| | Undistributed (distributions in excess of) net investment income | | | 564,470 | |
| | Accumulated net realized gain (loss) | | | 2,935,019 | |
| | Net unrealized gain (loss) | | | 7,381,499 | |
| | | NET ASSETS | | $ | 228,134,747 | |
| | | Net Assets: | | | | |
| | | Class A | | $ | 37,386,740 | |
| | | Class B | | | 1,660,353 | |
| | | Class C | | | 7,671,547 | |
| | | Institutional | | | 176,467,066 | |
| | | Service | | | 14,721 | |
| | | Class IR | | | 4,863,572 | |
| | | Class R | | | 70,748 | |
| | | Total Net Assets | | $ | 228,134,747 | |
| | | Shares Outstanding $0.001 par value (unlimited shares authorized): | | | | |
| | | Class A | | | 3,543,445 | |
| | | Class B | | | 157,467 | |
| | | Class C | | | 727,553 | |
| | | Institutional | | | 16,728,796 | |
| | | Service | | | 1,396 | |
| | | Class IR | | | 462,582 | |
| | | Class R | | | 6,712 | |
| | | Net asset value, offering and redemption price per share:(b) | | | | |
| | | Class A | | | $10.55 | |
| | | Class B | | | 10.54 | |
| | | Class C | | | 10.54 | |
| | | Institutional | | | 10.55 | |
| | | Service | | | 10.55 | |
| | | Class IR | | | 10.51 | |
| | | Class R | | | 10.54 | |
| | (a) | | Includes segregated cash of $500,000 for the Bond Fund, relating to initial margin requirements and collateral on futures transactions. Also includes amounts segregated for initial margin on swap transactions of $1,056,874, $2,537,723, $2,165,785, $629,072,631 and $63,316 for the Bond, Core Fixed Income, Global Income, Strategic Income and World Bond Funds, respectively. |
| | (b) | | Maximum public offering price per share for Class A Shares of the Bond, Core Fixed Income, Global Income, Strategic Income and World Bond Funds is $10.96, $10.90, $13.46, $11.00 and $9.78, respectively. At redemption, Class B and Class C Shares may be subject to a contingent deferred sales charge, assessed on the amount equal to the lesser of the current net asset value or the original purchase price of the shares. |
| | |
| 120 | | The accompanying notes are an integral part of these financial statements. |
GOLDMAN SACHS MULTI SECTOR FIXED INCOME FUNDS
| | | | | | | | | | | | | | | | | | | | | | |
| | | Core Fixed Income
Fund | | | | | Global Income
Fund | | | | | Strategic Income
Fund | | | | | World Bond Fund | |
| | | | | | | | | | | | | | | | | | | | | | |
| | $ | 1,148,605,901 | | | | | $ | 459,600,818 | | | | | $ | 25,482,442,509 | | | | | $ | 11,779,101 | |
| | | 181,293 | | | | | | 73,735 | | | | | | 33,063,238 | | | | | | 103,428 | |
| | | 51,534 | | | | | | 89,126 | | | | | | 2,718,283 | | | | | | 35,719 | |
| | | | | | | | | | | | | | | | | | | | | | |
| | | 133,537,578 | | | | | | 25,544,375 | | | | | | 788,635,410 | | | | | | — | |
| | | 13,377,717 | | | | | | 27,093,400 | | | | | | 407,829,220 | | | | | | 297,464 | |
| | | 2,537,723 | | | | | | 2,165,785 | | | | | | 633,591,005 | | | | | | 63,316 | |
| | | 2,891,589 | | | | | | 7,362,214 | | | | | | 500,327,286 | | | | | | 197,856 | |
| | | 5,786,402 | | | | | | 3,157,180 | | | | | | 149,948,068 | | | | | | 104,277 | |
| | | 6,718,086 | | | | | | 1,928,916 | | | | | | 117,481,719 | | | | | | — | |
| | | — | | | | | | 80,012 | | | | | | — | | | | | | 68,867 | |
| | | 52,311 | | | | | | 500,551 | | | | | | 11,365,799 | | | | | | 13,684 | |
| | | 1,951 | | | | | | 3,895 | | | | | | 1,966,003 | | | | | | — | |
| | | 69,984 | | | | | | 8,134 | | | | | | 4,736,903 | | | | | | 1,286 | |
| | | — | | | | | | 73,132 | | | | | | 19,128,186 | | | | | | — | |
| | | — | | | | | | — | | | | | | — | | | | | | 4,123 | |
| | | 8,394 | | | | | | 3,796 | | | | | | 7,692,312 | | | | | | 3,210 | |
| | | 1,313,820,463 | | | | | | 527,685,069 | | | | | | 28,160,925,941 | | | | | | 12,672,331 | |
| | | | | | | | | | | | | | | | | | | | | | |
| | | | | | | | | | | | | | | | | | | | | | |
| | | | | | | | | | | | | | | | | | | | | | |
| | | 196,665,321 | | | | | | 23,870,019 | | | | | | 994,087,341 | | | | | | — | |
| | | 2,948,464 | | | | | | 7,478,108 | | | | | | 89,613,419 | | | | | | 274,327 | |
| | | 39,421,876 | | | | | | 10,841,016 | | | | | | 143,889,847 | | | | | | — | |
| | | 4,970,000 | | | | | | 2,394,065 | | | | | | 476,776,750 | | | | | | — | |
| | | 2,138,295 | | | | | | 2,310,202 | | | | | | 303,668,250 | | | | | | 159,899 | |
| | | 1,668,959 | | | | | | 22,969,292 | | | | | | 34,003,798 | | | | | | — | |
| | | — | | | | | | — | | | | | | 83,266,488 | | | | | | 42,579 | |
| | | 346,649 | | | | | | 255,830 | | | | | | 10,586,445 | | | | | | 6,526 | |
| | | — | | | | | | — | | | | | | 11,472,417 | | | | | | — | |
| | | 95,208 | | | | | | 38,121 | | | | | | 2,891,291 | | | | | | 491 | |
| | | 108,103 | | | | | | 13,781 | | | | | | 7,662,262 | | | | | | — | |
| | | — | | | | | | 184,549 | | | | | | 14,454,049 | | | | | | 381 | |
| | | — | | | | | | 71,430 | | | | | | — | | | | | | — | |
| | | 41 | | | | | | — | | | | | | — | | | | | | 596 | |
| | | 172,181 | | | | | | 246,100 | | | | | | 306,742 | | | | | | 147,547 | |
| | | 248,535,097 | | | | | | 70,672,513 | | | | | | 2,172,679,099 | | | | | | 632,346 | |
| | | | | | | | | | | | | | | | | | | | | | |
| | | | | | | | | | | | | | | | | | | | | | |
| | | 1,071,543,360 | | | | | | 427,373,443 | | | | | | 25,856,196,557 | | | | | | 12,728,788 | |
| | | 7,129,148 | | | | | | (856,940 | ) | | | | | 69,917,644 | | | | | | (384,512 | ) |
| | | (33,343,087 | ) | | | | | 21,744,060 | | | | | | (181,883,029 | ) | | | | | 199,625 | |
| | | 19,955,945 | | | | | | 8,751,993 | | | | | | 244,015,670 | | | | | | (503,916 | ) |
| | | $ | 1,065,285,366 | | | | | $ | 457,012,556 | | | | | $ | 25,988,246,842 | | | | | $ | 12,039,985 | |
| | | | | | | | | | | | | | | | | | | | | | | |
| | | $ | 142,355,225 | | | | | $ | 60,622,437 | | | | | $ | 3,177,088,759 | | | | | $ | 174,277 | |
| | | | 2,766,367 | | | | | | 899,487 | | | | | | — | | | | | | — | |
| | | | 19,432,766 | | | | | | 5,135,139 | | | | | | 1,220,249,848 | | | | | | 36,988 | |
| | | | 897,036,884 | | | | | | 387,247,668 | | | | | | 20,700,172,741 | | | | | | 11,809,093 | |
| | | | 1,642,690 | | | | | | 348,281 | | | | | | — | | | | | | — | |
| | | | 1,463,992 | | | | | | 2,759,544 | | | | | | 882,813,297 | | | | | | 9,864 | |
| | | | 587,442 | | | | | | — | | | | | | 7,922,197 | | | | | | 9,763 | |
| | | $ | 1,065,285,366 | | | | | $ | 457,012,556 | | | | | $ | 25,988,246,842 | | | | | $ | 12,039,985 | |
| | | | | | | | | | | | | | | | | | | | | | | |
| | | | 13,564,612 | | | | | | 4,676,761 | | | | | | 300,033,400 | | | | | | 18,525 | |
| | | | 262,384 | | | | | | 69,653 | | | | | | — | | | | | | — | |
| | | | 1,841,860 | | | | | | 399,015 | | | | | | 115,197,177 | | | | | | 3,933 | |
| | | | 85,130,601 | | | | | | 29,919,665 | | | | | | 1,954,843,893 | | | | | | 1,255,675 | |
| | | | 155,788 | | | | | | 26,955 | | | | | | — | | | | | | — | |
| | | | 139,402 | | | | | | 213,419 | | | | | | 83,411,231 | | | | | | 1,049 | |
| | | | 55,901 | | | | | | — | | | | | | 748,627 | | | | | | 1,038 | |
| | | | | | | | | | | | | | | | | | | | | | | |
| | | | $10.49 | | | | | | $12.96 | | | | | | $10.59 | | | | | | $9.41 | |
| | | | 10.54 | | | | | | 12.91 | | | | | | — | | | | | | — | |
| | | | 10.55 | | | | | | 12.87 | | | | | | 10.59 | | | | | | 9.40 | |
| | | | 10.54 | | | | | | 12.94 | | | | | | 10.59 | | | | | | 9.40 | |
| | | | 10.54 | | | | | | 12.92 | | | | | | — | | | | | | — | |
| | | | 10.50 | | | | | | 12.93 | | | | | | 10.58 | | | | | | 9.40 | |
| | | | 10.51 | | | | | | — | | | | | | 10.58 | | | | | | 9.40 | |
| | |
| The accompanying notes are an integral part of these financial statements. | | 121 |
GOLDMAN SACHS MULTI SECTOR FIXED INCOME FUNDS
Statements of Operations
For the Six Months Ended September 30, 2014 (Unaudited)
| | | | | | |
| | | | |
Bond Fund | |
| | Investment income: | |
| | Interest | | $ | 3,412,421 | |
| | Dividends | | | — | |
| | Total investment income | | | 3,412,421 | |
| | | | | | |
| | Expenses: | | | | |
| | Management fees | | | 550,427 | |
| | Custody, accounting and administrative services | | | 160,667 | |
| | Distribution and Service fees(a) | | | 92,187 | |
| | Transfer Agent fees(a) | | | 71,169 | |
| | Registration fees | | | 56,182 | |
| | Professional fees | | | 55,324 | |
| | Printing and mailing costs | | | 34,209 | |
| | Trustee fees | | | 10,290 | |
| | Service Share fees — Shareholder Administration Plan | | | 18 | |
| | Service Share fees — Service Plan | | | 18 | |
| | Other | | | 19,100 | |
| | Total expenses | | | 1,049,591 | |
| | Less — expense reductions | | | (326,473 | ) |
| | Net expenses | | | 723,118 | |
| | NET INVESTMENT INCOME | | | 2,689,303 | |
| | | | | | |
| | Realized and unrealized gain (loss): | | | | |
| | Net realized gain (loss) from: | | | | |
| | Investments | | | 4,992,161 | |
| | Futures contracts | | | 1,362,557 | |
| | Written options | | | — | |
| | Swap contracts | | | (1,402,689 | ) |
| | Forward foreign currency exchange contracts | | | 517,391 | |
| | Foreign currency transactions | | | (28,697 | ) |
| | Net change in unrealized gain (loss) on: | | | | |
| | Investments (including the effects of the net change in the foreign capital gains tax liability of $779 for World Bond Fund) | | | (2,146,956 | ) |
| | Futures contracts | | | (336,283 | ) |
| | Written options | | | — | |
| | Swap contracts | | | 12,790 | |
| | Forward foreign currency exchange contracts | | | 643,881 | |
| | Foreign currency translations | | | (12,639 | ) |
| | Net realized and unrealized gain (loss) | | | 3,601,516 | |
| | NET INCREASE (DECREASE) IN NET ASSETS RESULTING FROM OPERATIONS | | $ | 6,290,819 | |
| | (a) | | Class specific Distribution and Service, and Transfer Agent fees were as follows: |
| | | | | | | | | | | | | | | | | | | | | | | | | | | | | | | | | | | | | | | | | | | | |
| | | Distribution and Service Fees | | | Transfer Agent Fees | |
Fund | | Class A | | �� | Class B | | | Class C | | | Class R | | | Class A | | | Class B | | | Class C | | | Institutional | | | Service | | | Class IR | | | Class R | |
Bond | | $ | 44,012 | | | $ | 10,139 | | | $ | 37,832 | | | $ | 204 | | | $ | 22,886 | | | $ | 1,318 | | | $ | 4,918 | | | $ | 39,038 | | | $ | 4 | | | $ | 2,952 | | | $ | 53 | |
Core Fixed Income | | | 173,231 | | | | 16,540 | | | | 99,228 | | | | 1,397 | | | | 90,080 | | | | 2,150 | | | | 12,900 | | | | 179,274 | | | | 335 | | | | 982 | | | | 363 | |
Global Income | | | 75,650 | | | | 4,961 | | | | 24,775 | | | | — | | | | 39,338 | | | | 645 | | | | 3,221 | | | | 83,586 | | | | 47 | | | | 616 | | | | — | |
Strategic Income | | | 4,573,105 | | | | — | | | | 5,693,662 | | | | 17,537 | | | | 2,378,014 | | | | — | | | | 740,176 | | | | 3,662,504 | | | | — | | | | 530,294 | | | | 4,560 | |
World Bond | | | 161 | | | | — | | | | 173 | | | | 25 | | | | 84 | | | | — | | | | 23 | | | | 2,420 | | | | — | | | | 7 | | | | 7 | |
| | |
| 122 | | The accompanying notes are an integral part of these financial statements. |
GOLDMAN SACHS MULTI SECTOR FIXED INCOME FUNDS
| | | | | | | | | | | | | | | | | | | | | | |
| | | Core Fixed Income
Fund | | | | | Global Income
Fund | | | | | Strategic Income
Fund | | | | | World Bond Fund | |
| | | | | | | | | | | | | | | | | | | | | | |
| | $ | 14,745,851 | | | | | $ | 6,159,364 | | | | | $ | 358,888,495 | | | | | $ | 164,577 | |
| | | — | | | | | | — | | | | | | 1,130,524 | | | | | | — | |
| | | 14,745,851 | | | | | | 6,159,364 | | | | | | 360,019,019 | | | | | | 164,577 | |
| | | | | | | | | | | | | | | | | | | | | | |
| | | | | | | | | | | | | | | | | | | | | | |
| | | 2,111,877 | | | | | | 1,578,143 | | | | | | 59,888,264 | | | | | | 39,927 | |
| | | 155,427 | | | | | | 202,963 | | | | | | 1,609,571 | | | | | | 113,422 | |
| | | 290,396 | | | | | | 105,386 | | | | | | 10,284,304 | | | | | | 359 | |
| | | 286,084 | | | | | | 127,453 | | | | | | 7,315,548 | | | | | | 2,541 | |
| | | 52,865 | | | | | | 54,235 | | | | | | 664,408 | | | | | | 34,128 | |
| | | 57,154 | | | | | | 54,923 | | | | | | 82,930 | | | | | | 50,347 | |
| | | 44,315 | | | | | | 47,082 | | | | | | 686,771 | | | | | | 35,418 | |
| | | 11,882 | | | | | | 10,500 | | | | | | 62,117 | | | | | | 5,803 | |
| | | 2,091 | | | | | | 295 | | | | | | — | | | | | | — | |
| | | 2,091 | | | | | | 295 | | | | | | — | | | | | | — | |
| | | 36,824 | | | | | | 12,551 | | | | | | 328,898 | | | | | | 5,212 | |
| | | 3,051,006 | | | | | | 2,193,826 | | | | | | 80,922,811 | | | | | | 287,157 | |
| | | — | | | | | | (368,413 | ) | | | | | — | | | | | | (242,483 | ) |
| | | 3,051,006 | | | | | | 1,825,413 | | | | | | 80,922,811 | | | | | | 44,674 | |
| | | 11,694,845 | | | | | | 4,333,951 | | | | | | 279,096,208 | | | | | | 119,903 | |
| | | | | | | | | | | | | | | | | | | | | | |
| | | | | | | | | | | | | | | | | | | | | | |
| | | | | | | | | | | | | | | | | | | | | | |
| | | 6,712,619 | | | | | | 6,623,249 | | | | | | 254,202,832 | | | | | | 229,940 | |
| | | 798,547 | | | | | | 1,849,634 | | | | | | (66,872,627 | ) | | | | | 44,131 | |
| | | — | | | | | | 26,302 | | | | | | — | | | | | | — | |
| | | (2,331,185 | ) | | | | | (2,401,668 | ) | | | | | (637,162,882 | ) | | | | | (131,197 | ) |
| | | 1,887,812 | | | | | | 14,978,049 | | | | | | 403,636,048 | | | | | | 141,091 | |
| | | (190,148 | ) | | | | | (733,702 | ) | | | | | (34,334,092 | ) | | | | | (6,133 | ) |
| | | | | | | | | | | | | | | | | | | | | | |
| | | 5,567,441 | | | | | | (14,386,993 | ) | | | | | (266,567,912 | ) | | | | | (502,280 | ) |
| | | (628,191 | ) | | | | | (337,157 | ) | | | | | (9,899,585 | ) | | | | | (23,682 | ) |
| | | — | | | | | | 40,187 | | | | | | — | | | | | | — | |
| | | 250,556 | | | | | | 1,392,503 | | | | | | 50,134,784 | | | | | | 29,061 | |
| | | 776,686 | | | | | | 3,840,461 | | | | | | 200,924,737 | | | | | | 32,984 | |
| | | 2,206 | | | | | | (160,635 | ) | | | | | (2,648,194 | ) | | | | | (6,808 | ) |
| | | 12,846,343 | | | | | | 10,730,230 | | | | | | (108,586,891 | ) | | | | | (192,893 | ) |
| | $ | 24,541,188 | | | | | $ | 15,064,181 | | | | | $ | 170,509,317 | | | | | $ | (72,990 | ) |
| | |
| The accompanying notes are an integral part of these financial statements. | | 123 |
GOLDMAN SACHS MULTI SECTOR FIXED INCOME FUNDS
Statements of Changes in Net Assets
| | | | | | | | | | |
| | | | | Bond Fund | |
| | | | | For the
Six Months Ended
September 30, 2014
(Unaudited) | | | For the Fiscal
Year Ended
March 31, 2014 | |
| | From operations: | | | | | | | | |
| | Net investment income | | $ | 2,689,303 | | | $ | 7,141,192 | |
| | Net realized gain | | | 5,440,723 | | | | 419,436 | |
| | Net change in unrealized gain (loss) | | | (1,839,207 | ) | | | (6,256,916 | ) |
| | Net increase (decrease) in net assets resulting from operations | | | 6,290,819 | | | | 1,303,712 | |
| | | | | | | | | | |
| | Distributions to shareholders: | | | | | | | | |
| | From net investment income | | | | | | | | |
| | Class A Shares | | | (388,242 | ) | | | (958,151 | ) |
| | Class B Shares | | | (14,806 | ) | | | (55,017 | ) |
| | Class C Shares | | | (55,055 | ) | | | (162,740 | ) |
| | Institutional Shares | | | (2,484,634 | ) | | | (7,247,473 | ) |
| | Service Shares | | | (150 | ) | | | (359 | ) |
| | Class IR Shares | | | (55,557 | ) | | | (86,537 | ) |
| | Class R Shares | | | (796 | ) | | | (3,961 | ) |
| | From net realized gains | | | | | | | | |
| | Class A Shares | | | — | | | | — | |
| | Class B Shares | | | — | | | | — | |
| | Class C Shares | | | — | | | | — | |
| | Institutional Shares | | | — | | | | — | |
| | Service Shares | | | — | | | | — | |
| | Class IR Shares | | | — | | | | — | |
| | Total distributions to shareholders | | | (2,999,240 | ) | | | (8,514,238 | ) |
| | | | | | | | | | |
| | From share transactions: | | | | | | | | |
| | Proceeds from sales of shares | | | 28,717,952 | | | | 39,384,369 | |
| | Reinvestment of distributions | | | 2,888,818 | | | | 8,278,108 | |
| | Cost of shares redeemed(a) | | | (62,262,646 | ) | | | (143,892,620 | ) |
| | Net increase (decrease) in net assets resulting from share transactions | | | (30,655,876 | ) | | | (96,230,143 | ) |
| | TOTAL INCREASE (DECREASE) | | | (27,364,297 | ) | | | (103,440,669 | ) |
| | | | | | | | | | |
| | Net assets: | | | | | | | | |
| | Beginning of period | | | 255,499,044 | | | | 358,939,713 | |
| | End of period | | $ | 228,134,747 | | | $ | 255,499,044 | |
| | Undistributed (distributions in excess of) net investment income | | $ | 564,470 | | | $ | 874,407 | |
| | (a) | | Net of $3,029 of redemption fees for Global Income Fund for the fiscal year ended March 31, 2014. |
| | |
| 124 | | The accompanying notes are an integral part of these financial statements. |
GOLDMAN SACHS MULTI SECTOR FIXED INCOME FUNDS
| | | | | | | | | | | | | | | | | | | | | | |
Core Fixed Income Fund | | | | | Global Income Fund | |
| | | For the
Six Months Ended
September 30, 2014
(Unaudited) | | | | | For the Fiscal
Year Ended
March 31, 2014 | | | | | For the
Six Months Ended
September 30, 2014
(Unaudited) | | | | | For the Fiscal
Year Ended
March 31, 2014 | |
| | | | | | | | | | | | | | | | | | | | | | |
| | $ | 11,694,845 | | | | | $ | 24,888,467 | | | | | $ | 4,333,951 | | | | | $ | 10,940,458 | |
| | | 6,877,645 | | | | | | 1,242,527 | | | | | | 20,341,864 | | | | | | 8,693,832 | |
| | | 5,968,698 | | | | | | (27,508,514 | ) | | | | | (9,611,634 | ) | | | | | (5,422,409 | ) |
| | | 24,541,188 | | | | | | (1,377,520 | ) | | | | | 15,064,181 | | | | | | 14,211,881 | |
| | | | | | | | | | | | | | | | | | | | | | |
| | | | | | | | | | | | | | | | | | | | | | |
| | | | | | | | | | | | | | | | | | | | | | |
| | | (1,492,026 | ) | | | | | (3,229,048 | ) | | | | | (532,461 | ) | | | | | (2,869,741 | ) |
| | | (23,474 | ) | | | | | (71,991 | ) | | | | | (5,050 | ) | | | | | (47,252 | ) |
| | | (139,552 | ) | | | | | (343,888 | ) | | | | | (24,814 | ) | | | | | (180,501 | ) |
| | | (11,174,526 | ) | | | | | (26,759,876 | ) | | | | | (4,396,151 | ) | | | | | (21,880,046 | ) |
| | | (16,732 | ) | | | | | (112,378 | ) | | | | | (1,893 | ) | | | | | (8,507 | ) |
| | | (18,093 | ) | | | | | (34,701 | ) | | | | | (9,179 | ) | | | | | (29,166 | ) |
| | | (5,317 | ) | | | | | (11,960 | ) | | | | | — | | | | | | — | |
| | | | | | | | | | | | | | | | | | | | | | |
| | | — | | | | | | — | | | | | | — | | | | | | (924,409 | ) |
| | | — | | | | | | — | | | | | | — | | | | | | (18,935 | ) |
| | | — | | | | | | — | | | | | | — | | | | | | (71,786 | ) |
| | | — | | | | | | — | | | | | | — | | | | | | (7,169,813 | ) |
| | | — | | | | | | — | | | | | | — | | | | | | (3,069 | ) |
| | | — | | | | | | — | | | | | | — | | | | | | (9,276 | ) |
| | | (12,869,720 | ) | | | | | (30,563,842 | ) | | | | | (4,969,548 | ) | | | | | (33,212,501 | ) |
| | | | | | | | | | | | | | | | | | | | | | |
| | | | | | | | | | | | | | | | | | | | | | |
| | | 93,008,748 | | | | | | 212,696,889 | | | | | | 68,792,265 | | | | | | 278,133,116 | |
| | | 12,151,912 | | | | | | 28,632,885 | | | | | | 4,890,965 | | | | | | 32,961,613 | |
| | | (109,006,894 | ) | | | | | (562,034,991 | ) | | | | | (121,452,924 | ) | | | | | (273,363,689 | ) |
| | | (3,846,234 | ) | | | | | (320,705,217 | ) | | | | | (47,769,694 | ) | | | | | 37,731,040 | |
| | | 7,825,234 | | | | | | (352,646,579 | ) | | | | | (37,675,061 | ) | | | | | 18,730,420 | |
| | | | | | | | | | | | | | | | | | | | | | |
| | | | | | | | | | | | | | | | | | | | | | |
| | | 1,057,460,132 | | | | | | 1,410,106,711 | | | | | | 494,687,617 | | | | | | 475,957,197 | |
| | $ | 1,065,285,366 | | | | | $ | 1,057,460,132 | | | | | $ | 457,012,556 | | | | | $ | 494,687,617 | |
| | $ | 7,129,148 | | | | | $ | 8,304,023 | | | | | $ | (856,940 | ) | | | | $ | (221,343 | ) |
| | |
| The accompanying notes are an integral part of these financial statements. | | 125 |
GOLDMAN SACHS MULTI SECTOR FIXED INCOME FUNDS
Statements of Changes in Net Assets (continued)
| | | | | | | | | | |
| | | | | Strategic Income Fund | |
| | | | | For the
Six Months Ended
September 30, 2014
(Unaudited) | | | For the Fiscal
Year Ended
March 31, 2014 | |
| | From operations: | |
| | Net investment income | | $ | 279,096,208 | | | $ | 234,878,221 | |
| | Net realized gain (loss) | | | (80,530,721 | ) | | | 53,764,096 | |
| | Net change in unrealized gain (loss) | | | (28,056,170 | ) | | | 159,388,977 | |
| | Net increase (decrease) in net assets resulting from operations | | | 170,509,317 | | | | 448,031,294 | |
| | | | | | | | | | |
| | Distributions to shareholders: | | | | | | | | |
| | From net investment income | | | | | | | | |
| | Class A Shares | | | (38,288,743 | ) | | | (50,987,382 | ) |
| | Class C Shares | | | (7,505,586 | ) | | | (9,792,648 | ) |
| | Institutional Shares | | | (220,322,193 | ) | | | (200,729,078 | ) |
| | Class IR Shares | | | (9,462,636 | ) | | | (9,935,816 | ) |
| | Class R Shares | | | (63,736 | ) | | | (23,961 | ) |
| | From net realized gains | | | | | | | | |
| | Class A Shares | | | — | | | | — | |
| | Class C Shares | | | — | | | | — | |
| | Institutional Shares | | | — | | | | — | |
| | Class IR Shares | | | — | | | | — | |
| | Class R Shares | | | — | | | | — | |
| | Return of capital | | | | | | | | |
| | Class A Shares | | | — | | | | — | |
| | Class C Shares | | | — | | | | — | |
| | Institutional Shares | | | — | | | | — | |
| | Class IR Shares | | | — | | | | — | |
| | Class R Shares | | | — | | | | — | |
| | Total distributions to shareholders | | | (275,642,894 | ) | | | (271,468,885 | ) |
| | | | | | | | | | |
| | From share transactions: | | | | | | | | |
| | Proceeds from sales of shares | | | 8,707,860,636 | | | | 19,226,399,807 | |
| | Reinvestment of distributions | | | 224,270,702 | | | | 229,033,498 | |
| | Cost of shares redeemed | | | (3,739,599,725 | ) | | | (2,216,580,066 | ) |
| | Net increase in net assets resulting from share transactions | | | 5,192,531,613 | | | | 17,238,853,239 | |
| | TOTAL INCREASE | | | 5,087,398,036 | | | | 17,415,415,648 | |
| | | | | | | | | | |
| | Net assets: | | | | | | | | |
| | Beginning of period | | | 20,900,848,806 | | | | 3,485,433,158 | |
| | End of period | | $ | 25,988,246,842 | | | $ | 20,900,848,806 | |
| | Undistributed (distributions in excess of) net investment income | | $ | 69,917,644 | | | $ | 66,464,330 | |
| | |
| 126 | | The accompanying notes are an integral part of these financial statements. |
GOLDMAN SACHS MULTI SECTOR FIXED INCOME FUNDS
| | | | | | | | | | |
| | | World Bond Fund | |
| | | For the
Six Months Ended
September 30, 2014
(Unaudited) | | | | | For the Fiscal
Year Ended
March 31, 2014 | |
| | | | | | | | | | |
| | $ | 119,903 | | | | | $ | 172,550 | |
| | | 277,832 | | | | | | (404,291 | ) |
| | | (470,725 | ) | | | | | 213,084 | |
| | | (72,990 | ) | | | | | (18,657 | ) |
| | | | | | | | | | |
| | | | | | | | | | |
| | | | | | | | | | |
| | | (952 | ) | | | | | (2,661 | ) |
| | | (127 | ) | | | | | (211 | ) |
| | | (111,792 | ) | | | | | (363,149 | ) |
| | | (89 | ) | | | | | (302 | ) |
| | | (62 | ) | | | | | (248 | ) |
| | | | | | | | | | |
| | | — | | | | | | (113 | ) |
| | | — | | | | | | (11 | ) |
| | | — | | | | | | (13,574 | ) |
| | | — | | | | | | (12 | ) |
| | | — | | | | | | (11 | ) |
| | | | | | | | | | |
| | | — | | | | | | (318 | ) |
| | | — | | | | | | (25 | ) |
| | | — | | | | | | (43,432 | ) |
| | | — | | | | | | (36 | ) |
| | | — | | | | | | (30 | ) |
| | | (113,022 | ) | | | | | (424,133 | ) |
| | | | | | | | | | |
| | | | | | | | | | |
| | | 121,287 | | | | | | 93,614 | |
| | | 113,022 | | | | | | 424,133 | |
| | | (20,356 | ) | | | | | (33,444 | ) |
| | | 213,953 | | | | | | 484,303 | |
| | | 27,941 | | | | | | 41,513 | |
| | | | | | | | | | |
| | | | | | | | | | |
| | | 12,012,044 | | | | | | 11,970,531 | |
| | $ | 12,039,985 | | | | | $ | 12,012,044 | |
| | $ | (384,512 | ) | | | | $ | (391,393 | ) |
| | |
| The accompanying notes are an integral part of these financial statements. | | 127 |
GOLDMAN SACHS BOND FUND
Financial Highlights
Selected Data for a Share Outstanding Throughout Each Period
| | | | | | | | | | | | | | | | | | | | | | | | | | | | | | |
| | | | | | | | Income (loss) from
investment operations | | | Distributions
to shareholders | |
| | | Year - Share Class | |
Net asset
value,
beginning
of period | | | Net
investment
income(a) | | | Net realized
and unrealized
gain (loss) | | | Total from
investment
operations | | | From net
investment
income | | | From net
realized
gains | | | Total
distributions | |
| | FOR THE SIX MONTHS ENDED SEPTEMBER 30, (UNAUDITED) | |
| | 2014 - A | | $ | 10.42 | | | $ | 0.10 | | | $ | 0.15 | | | $ | 0.25 | | | $ | (0.12 | ) | | $ | — | | | $ | (0.12 | ) |
| | 2014 - B | | | 10.41 | | | | 0.06 | | | | 0.15 | | | | 0.21 | | | | (0.08 | ) | | | — | | | | (0.08 | ) |
| | 2014 - C | | | 10.41 | | | | 0.06 | | | | 0.15 | | | | 0.21 | | | | (0.08 | ) | | | — | | | | (0.08 | ) |
| | 2014 - Institutional | | | 10.42 | | | | 0.12 | | | | 0.14 | | | | 0.26 | | | | (0.13 | ) | | | — | | | | (0.13 | ) |
| | 2014 - Service | | | 10.42 | | | | 0.09 | | | | 0.15 | | | | 0.24 | | | | (0.11 | ) | | | — | | | | (0.11 | ) |
| | 2014 - IR | | | 10.38 | | | | 0.11 | | | | 0.15 | | | | 0.26 | | | | (0.13 | ) | | | — | | | | (0.13 | ) |
| | 2014 - R | | | 10.41 | | | | 0.09 | | | | 0.14 | | | | 0.23 | | | | (0.10 | ) | | | — | | | | (0.10 | ) |
| | | | | | | | | | | | | | | | | | | | | | | | | | | | | | |
| | FOR THE FISCAL YEARS ENDED MARCH 31, | |
| | 2014 - A | | | 10.57 | | | | 0.22 | | | | (0.09 | ) | | | 0.13 | | | | (0.28 | ) | | | — | | | | (0.28 | ) |
| | 2014 - B | | | 10.57 | | | | 0.14 | | | | (0.10 | ) | | | 0.04 | | | | (0.20 | ) | | | — | | | | (0.20 | ) |
| | 2014 - C | | | 10.57 | | | | 0.15 | | | | (0.11 | ) | | | 0.04 | | | | (0.20 | ) | | | — | | | | (0.20 | ) |
| | 2014 - Institutional | | | 10.57 | | | | 0.26 | | | | (0.09 | ) | | | 0.17 | | | | (0.32 | ) | | | — | | | | (0.32 | ) |
| | 2014 - Service | | | 10.57 | | | | 0.21 | | | | (0.10 | ) | | | 0.11 | | | | (0.26 | ) | | | — | | | | (0.26 | ) |
| | 2014 - IR | | | 10.54 | | | | 0.25 | | | | (0.11 | ) | | | 0.14 | | | | (0.30 | ) | | | — | | | | (0.30 | ) |
| | 2014 - R | | | 10.57 | | | | 0.19 | | | | (0.10 | ) | | | 0.09 | | | | (0.25 | ) | | | — | | | | (0.25 | ) |
| | 2013 - A | | | 10.37 | | | | 0.20 | | | | 0.57 | | | | 0.77 | | | | (0.25 | ) | | | (0.32 | ) | | | (0.57 | ) |
| | 2013 - B | | | 10.36 | | | | 0.12 | | | | 0.58 | | | | 0.70 | | | | (0.17 | ) | | | (0.32 | ) | | | (0.49 | ) |
| | 2013 - C | | | 10.37 | | | | 0.12 | | | | 0.57 | | | | 0.69 | | | | (0.17 | ) | | | (0.32 | ) | | | (0.49 | ) |
| | 2013 - Institutional | | | 10.37 | | | | 0.23 | | | | 0.57 | | | | 0.80 | | | | (0.28 | ) | | | (0.32 | ) | | | (0.60 | ) |
| | 2013 - Service | | | 10.37 | | | | 0.18 | | | | 0.57 | | | | 0.75 | | | | (0.23 | ) | | | (0.32 | ) | | | (0.55 | ) |
| | 2013 - IR | | | 10.34 | | | | 0.22 | | | | 0.57 | | | | 0.79 | | | | (0.27 | ) | | | (0.32 | ) | | | (0.59 | ) |
| | 2013 - R | | | 10.37 | | | | 0.18 | | | | 0.56 | | | | 0.74 | | | | (0.22 | ) | | | (0.32 | ) | | | (0.54 | ) |
| | 2012 - A | | | 10.17 | | | | 0.27 | | | | 0.42 | | | | 0.69 | | | | (0.27 | ) | | | (0.22 | ) | | | (0.49 | ) |
| | 2012 - B | | | 10.16 | | | | 0.19 | | | | 0.42 | | | | 0.61 | | | | (0.19 | ) | | | (0.22 | ) | | | (0.41 | ) |
| | 2012 - C | | | 10.16 | | | | 0.19 | | | | 0.43 | | | | 0.62 | | | | (0.19 | ) | | | (0.22 | ) | | | (0.41 | ) |
| | 2012 - Institutional | | | 10.17 | | | | 0.30 | | | | 0.43 | | | | 0.73 | | | | (0.31 | ) | | | (0.22 | ) | | | (0.53 | ) |
| | 2012 - Service | | | 10.17 | | | | 0.25 | | | | 0.43 | | | | 0.68 | | | | (0.26 | ) | | | (0.22 | ) | | | (0.48 | ) |
| | 2012 - IR | | | 10.18 | | | | 0.29 | | | | 0.38 | | | | 0.67 | | | | (0.29 | ) | | | (0.22 | ) | | | (0.51 | ) |
| | 2012 - R | | | 10.17 | | | | 0.25 | | | | 0.41 | | | | 0.66 | | | | (0.24 | ) | | | (0.22 | ) | | | (0.46 | ) |
| | 2011 - A | | | 10.20 | | | | 0.28 | | | | 0.33 | | | | 0.61 | | | | (0.31 | )(e) | | | (0.33 | ) | | | (0.64 | ) |
| | 2011 - B | | | 10.20 | | | | 0.21 | | | | 0.31 | | | | 0.52 | | | | (0.23 | )(e) | | | (0.33 | ) | | | (0.56 | ) |
| | 2011 - C | | | 10.20 | | | | 0.21 | | | | 0.31 | | | | 0.52 | | | | (0.23 | )(e) | | | (0.33 | ) | | | (0.56 | ) |
| | 2011 - Institutional | | | 10.20 | | | | 0.32 | | | | 0.32 | | | | 0.64 | | | | (0.34 | )(e) | | | (0.33 | ) | | | (0.67 | ) |
| | 2011 - Service | | | 10.20 | | | | 0.27 | | | | 0.32 | | | | 0.59 | | | | (0.29 | )(e) | | | (0.33 | ) | | | (0.62 | ) |
| | 2011 - IR | | | 10.21 | | | | 0.31 | | | | 0.32 | | | | 0.63 | | | | (0.33 | )(e) | | | (0.33 | ) | | | (0.66 | ) |
| | 2011 - R | | | 10.20 | | | | 0.26 | | | | 0.32 | | | | 0.58 | | | | (0.28 | )(e) | | | (0.33 | ) | | | (0.61 | ) |
| | 2010 - A | | | 9.16 | | | | 0.34 | | | | 1.07 | | | | 1.41 | | | | (0.37 | ) | | | — | | | | (0.37 | ) |
| | 2010 - B | | | 9.15 | | | | 0.28 | | | | 1.07 | | | | 1.35 | | | | (0.30 | ) | | | — | | | | (0.30 | ) |
| | 2010 - C | | | 9.15 | | | | 0.28 | | | | 1.07 | | | | 1.35 | | | | (0.30 | ) | | | — | | | | (0.30 | ) |
| | 2010 - Institutional | | | 9.16 | | | | 0.37 | | | | 1.07 | | | | 1.44 | | | | (0.40 | ) | | | — | | | | (0.40 | ) |
| | 2010 - Service | | | 9.16 | | | | 0.34 | | | | 1.05 | | | | 1.39 | | | | (0.35 | ) | | | — | | | | (0.35 | ) |
| | 2010 - IR | | | 9.16 | | | | 0.32 | | | | 1.12 | | | | 1.44 | | | | (0.39 | ) | | | — | | | | (0.39 | ) |
| | 2010 - R | | | 9.16 | | | | 0.31 | | | | 1.07 | | | | 1.38 | | | | (0.34 | ) | | | — | | | | (0.34 | ) |
| | (a) | | Calculated based on the average shares outstanding methodology. |
| | (b) | | Assumes investment at the net asset value at the beginning of the period, reinvestment of all dividends and distributions, a complete redemption of the investment at the net asset value at the end of the period and no sales or redemption charges. Total returns would be reduced if a sales or redemption charge was taken into account. Returns do not reflect the deduction of taxes that a shareholder would pay on Fund distributions or the redemption of Fund shares. Total returns for periods less than one full year are not annualized. |
| | (c) | | The Fund’s portfolio turnover rate is calculated in accordance with regulatory requirements, without regard to transactions involving short term investments and certain derivatives. If such transactions were included, the Fund’s portfolio turnover rate may be higher. |
| | (e) | | Includes a tax return of capital amounting to less than $0.01 per share. |
| | |
| 128 | | The accompanying notes are an integral part of these financial statements. |
GOLDMAN SACHS BOND FUND
| | | | | | | | | | | | | | | | | | | | | | | | | | | | | | | | | | | | | | | | |
| | | | | | | | | | | | | | | | | | | | | | | | | | | | | | | | | | |
| | | Net asset
value, end
of period | | | | | Total
return(b) | | | | | Net assets,
end of
period
(in 000s) | | | | | Ratio of
net expenses
to average
net assets | | | | | Ratio of
total expenses
to average
net assets | | | | | Ratio of
net investment
income
to average
net assets | | | | | Portfolio
turnover
rate(c) | |
| | | | | | | | | | | | | | | | | | | | | | | | | | | | | | | | | | | | | | | | |
| | $ | 10.55 | | | | | | 2.37 | % | | | | $ | 37,387 | | | | | | 0.84 | %(d) | | | | | 1.11 | %(d) | | | | | 1.94 | %(d) | | | | | 196 | % |
| | | 10.54 | | | | | | 1.99 | | | | | | 1,660 | | | | | | 1.59 | (d) | | | | | 1.85 | (d) | | | | | 1.20 | (d) | | | | | 196 | |
| | | 10.54 | | | | | | 1.99 | | | | | | 7,672 | | | | | | 1.59 | (d) | | | | | 1.86 | (d) | | | | | 1.19 | (d) | | | | | 196 | |
| | | 10.55 | | | | | | 2.54 | | | | | | 176,467 | | | | | | 0.50 | (d) | | | | | 0.76 | (d) | | | | | 2.29 | (d) | | | | | 196 | |
| | | 10.55 | | | | | | 2.29 | | | | | | 15 | | | | | | 0.99 | (d) | | | | | 1.26 | (d) | | | | | 1.78 | (d) | | | | | 196 | |
| | | 10.51 | | | | | | 2.50 | | | | | | 4,864 | | | | | | 0.59 | (d) | | | | | 0.85 | (d) | | | | | 2.18 | (d) | | | | | 196 | |
| | | 10.54 | | | | | | 2.24 | | | | | | 71 | | | | | | 1.09 | (d) | | | | | 1.35 | (d) | | | | | 1.70 | (d) | | | | | 196 | |
| | | | | | | | | | | | | | | | | | | | | | | | | | | | | | | | | | | | | | | | |
| | | | | | | | | | | | | | | | | | | | | | | | | | | | | | | | | | | | | | | | |
| | | 10.42 | | | | | | 1.27 | | | | | | 34,403 | | | | | | 0.84 | | | | | | 1.06 | | | | | | 2.15 | | | | | | 580 | |
| | | 10.41 | | | | | | 0.42 | | | | | | 2,239 | | | | | | 1.59 | | | | | | 1.80 | | | | | | 1.38 | | | | | | 580 | |
| | | 10.41 | | | | | | 0.42 | | | | | | 7,298 | | | | | | 1.59 | | | | | | 1.81 | | | | | | 1.40 | | | | | | 580 | |
| | | 10.42 | | | | | | 1.62 | | | | | | 207,604 | | | | | | 0.50 | | | | | | 0.71 | | | | | | 2.46 | | | | | | 580 | |
| | | 10.42 | | | | | | 1.12 | | | | | | 14 | | | | | | 1.00 | | | | | | 1.22 | | | | | | 2.01 | | | | | | 580 | |
| | | 10.38 | | | | | | 1.42 | | | | | | 3,808 | | | | | | 0.59 | | | | | | 0.81 | | | | | | 2.41 | | | | | | 580 | |
| | | 10.41 | | | | | | 0.92 | | | | | | 133 | | | | | | 1.09 | | | | | | 1.29 | | | | | | 1.83 | | | | | | 580 | |
| | | 10.57 | | | | | | 7.48 | | | | | | 40,783 | | | | | | 0.83 | | | | | | 0.98 | | | | | | 1.86 | | | | | | 1,025 | |
| | | 10.57 | | | | | | 6.79 | | | | | | 3,907 | | | | | | 1.58 | | | | | | 1.73 | | | | | | 1.11 | | | | | | 1,025 | |
| | | 10.57 | | | | | | 6.68 | | | | | | 9,993 | | | | | | 1.58 | | | | | | 1.73 | | | | | | 1.11 | | | | | | 1,025 | |
| | | 10.57 | | | | | | 7.84 | | | | | | 301,201 | | | | | | 0.49 | | | | | | 0.64 | | | | | | 2.20 | | | | | | 1,025 | |
| | | 10.57 | | | | | | 7.31 | | | | | | 14 | | | | | | 0.99 | | | | | | 1.13 | | | | | | 1.70 | | | | | | 1,025 | |
| | | 10.54 | | | | | | 7.76 | | | | | | 2,847 | | | | | | 0.58 | | | | | | 0.73 | | | | | | 2.11 | | | | | | 1,025 | |
| | | 10.57 | | | | | | 7.22 | | | | | | 195 | | | | | | 1.08 | | | | | | 1.24 | | | | | | 1.68 | | | | | | 1,025 | |
| | | 10.37 | | | | | | 6.89 | | | | | | 91,437 | | | | | | 0.83 | | | | | | 0.99 | | | | | | 2.60 | | | | | | 767 | |
| | | 10.36 | | | | | | 6.10 | | | | | | 4,924 | | | | | | 1.58 | | | | | | 1.74 | | | | | | 1.85 | | | | | | 767 | |
| | | 10.37 | | | | | | 6.20 | | | | | | 10,592 | | | | | | 1.58 | | | | | | 1.74 | | | | | | 1.85 | | | | | | 767 | |
| | | 10.37 | | | | | | 7.25 | | | | | | 232,692 | | | | | | 0.49 | | | | | | 0.65 | | | | | | 2.94 | | | | | | 767 | |
| | | 10.37 | | | | | | 6.75 | | | | | | 13 | | | | | | 0.99 | | | | | | 1.15 | | | | | | 2.44 | | | | | | 767 | |
| | | 10.34 | | | | | | 6.74 | | | | | | 2,739 | | | | | | 0.58 | | | | | | 0.74 | | | | | | 2.82 | | | | | | 767 | |
| | | 10.37 | | | | | | 6.63 | | | | | | 21 | | | | | | 1.08 | | | | | | 1.24 | | | | | | 2.37 | | | | | | 767 | |
| | | 10.17 | | | | | | 6.06 | | | | | | 93,196 | | | | | | 0.83 | | | | | | 1.00 | | | | | | 2.72 | | | | | | 673 | |
| | | 10.16 | | | | | | 5.27 | | | | | | 6,349 | | | | | | 1.58 | | | | | | 1.75 | | | | | | 2.01 | | | | | | 673 | |
| | | 10.16 | | | | | | 5.27 | | | | | | 10,824 | | | | | | 1.58 | | | | | | 1.75 | | | | | | 1.99 | | | | | | 673 | |
| | | 10.17 | | | | | | 6.42 | | | | | | 198,465 | | | | | | 0.49 | | | | | | 0.66 | | | | | | 3.07 | | | | | | 673 | |
| | | 10.17 | | | | | | 5.91 | | | | | | 12 | | | | | | 0.99 | | | | | | 1.16 | | | | | | 2.58 | | | | | | 673 | |
| | | 10.18 | | | | | | 6.32 | | | | | | 364 | | | | | | 0.58 | | | | | | 0.75 | | | | | | 2.96 | | | | | | 673 | |
| | | 10.17 | | | | | | 5.80 | | | | | | 36 | | | | | | 1.08 | | | | | | 1.25 | | | | | | 2.49 | | | | | | 673 | |
| | | 10.20 | | | | | | 15.60 | | | | | | 94,351 | | | | | | 0.83 | | | | | | 1.14 | | | | | | 3.48 | | | | | | 419 | |
| | | 10.20 | | | | | | 14.75 | | | | | | 9,193 | | | | | | 1.58 | | | | | | 1.89 | | | | | | 2.87 | | | | | | 419 | |
| | | 10.20 | | | | | | 14.75 | | | | | | 12,661 | | | | | | 1.58 | | | | | | 1.89 | | | | | | 2.83 | | | | | | 419 | |
| | | 10.20 | | | | | | 15.99 | | | | | | 191,051 | | | | | | 0.49 | | | | | | 0.80 | | | | | | 3.72 | | | | | | 419 | |
| | | 10.20 | | | | | | 15.42 | | | | | | 12 | | | | | | 0.99 | | | | | | 1.30 | | | | | | 3.44 | | | | | | 419 | |
| | | 10.21 | | | | | | 16.00 | | | | | | 294 | | | | | | 0.58 | | | | | | 0.89 | | | | | | 3.23 | | | | | | 419 | |
| | | 10.20 | | | | | | 15.30 | | | | | | 37 | | | | | | 1.08 | | | | | | 1.39 | | | | | | 3.15 | | | | | | 419 | |
| | |
| The accompanying notes are an integral part of these financial statements. | | 129 |
GOLDMAN SACHS CORE FIXED INCOME FUND
Financial Highlights
Selected Data for a Share Outstanding Throughout Each Period
| | | | | | | | | | | | | | | | | | | | | | |
| | | | | | | | Income (loss) from
investment operations | | | | |
| | | Year - Share Class | | Net asset
value,
beginning
of period | | | Net
investment
income(a) | | | Net realized
and unrealized
gain (loss) | | | Total from
investment
operations | | | Distributions to shareholders
from net
investment
income | |
| | FOR THE SIX MONTHS ENDED SEPTEMBER 30, (UNAUDITED) | |
| | 2014 - A | | $ | 10.38 | | | $ | 0.10 | | | $ | 0.12 | | | $ | 0.22 | | | $ | (0.11 | ) |
| | 2014 - B | | | 10.43 | | | | 0.06 | | | | 0.12 | | | | 0.18 | | | | (0.07 | ) |
| | 2014 - C | | | 10.43 | | | | 0.06 | | | | 0.13 | | | | 0.19 | | | | (0.07 | ) |
| | 2014 - Institutional | | | 10.42 | | | | 0.12 | | | | 0.13 | | | | 0.25 | | | | (0.13 | ) |
| | 2014 - Service | | | 10.43 | | | | 0.09 | | | | 0.13 | | | | 0.22 | | | | (0.11 | ) |
| | 2014 - IR | | | 10.39 | | | | 0.11 | | | | 0.13 | | | | 0.24 | | | | (0.13 | ) |
| | 2014 - R | | | 10.39 | | | | 0.09 | | | | 0.13 | | | | 0.22 | | | | (0.10 | ) |
| | | | | | | | | | | | | | | | | | | | | | |
| | FOR THE FISCAL YEARS ENDED MARCH 31, | |
| | 2014 - A | | | 10.61 | | | | 0.19 | | | | (0.18 | ) | | | 0.01 | | | | (0.24 | ) |
| | 2014 - B | | | 10.66 | | | | 0.11 | | | | (0.18 | ) | | | (0.07 | ) | | | (0.16 | ) |
| | 2014 - C | | | 10.67 | | | | 0.11 | | | | (0.19 | ) | | | (0.08 | ) | | | (0.16 | ) |
| | 2014 - Institutional | | | 10.65 | | | | 0.22 | | | | (0.17 | ) | | | 0.05 | | | | (0.28 | ) |
| | 2014 - Service | | | 10.66 | | | | 0.15 | | | | (0.16 | ) | | | (0.01 | ) | | | (0.22 | ) |
| | 2014 - IR | | | 10.62 | | | | 0.21 | | | | (0.17 | ) | | | 0.04 | | | | (0.27 | ) |
| | 2014 - R | | | 10.62 | | | | 0.16 | | | | (0.18 | ) | | | (0.02 | ) | | | (0.21 | ) |
| | 2013 - A | | | 10.31 | | | | 0.16 | | | | 0.36 | | | | 0.52 | | | | (0.22 | ) |
| | 2013 - B | | | 10.36 | | | | 0.08 | | | | 0.36 | | | | 0.44 | | | | (0.14 | ) |
| | 2013 - C | | | 10.37 | | | | 0.08 | | | | 0.36 | | | | 0.44 | | | | (0.14 | ) |
| | 2013 - Institutional | | | 10.36 | | | | 0.20 | | | | 0.35 | | | | 0.55 | | | | (0.26 | ) |
| | 2013 - Service | | | 10.36 | | | | 0.14 | | | | 0.37 | | | | 0.51 | | | | (0.21 | ) |
| | 2013 - IR | | | 10.32 | | | | 0.19 | | | | 0.36 | | | | 0.55 | | | | (0.25 | ) |
| | 2013 - R | | | 10.33 | | | | 0.13 | | | | 0.36 | | | | 0.49 | | | | (0.20 | ) |
| | 2012 - A | | | 9.79 | | | | 0.19 | | | | 0.53 | | | | 0.72 | | | | (0.20 | ) |
| | 2012 - B | | | 9.84 | | | | 0.12 | | | | 0.52 | | | | 0.64 | | | | (0.12 | ) |
| | 2012 - C | | | 9.84 | | | | 0.12 | | | | 0.53 | | | | 0.65 | | | | (0.12 | ) |
| | 2012 - Institutional | | | 9.83 | | | | 0.23 | | | | 0.53 | | | | 0.76 | | | | (0.23 | ) |
| | 2012 - Service | | | 9.84 | | | | 0.17 | | | | 0.53 | | | | 0.70 | | | | (0.18 | ) |
| | 2012 - IR | | | 9.79 | | | | 0.22 | | | | 0.53 | | | | 0.75 | | | | (0.22 | ) |
| | 2012 - R | | | 9.80 | | | | 0.17 | | | | 0.53 | | | | 0.70 | | | | (0.17 | ) |
| | 2011 - A | | | 9.53 | | | | 0.21 | | | | 0.29 | | | | 0.50 | | | | (0.24 | ) |
| | 2011 - B | | | 9.57 | | | | 0.14 | | | | 0.29 | | | | 0.43 | | | | (0.16 | ) |
| | 2011 - C | | | 9.58 | | | | 0.14 | | | | 0.28 | | | | 0.42 | | | | (0.16 | ) |
| | 2011 - Institutional | | | 9.57 | | | | 0.24 | | | | 0.29 | | | | 0.53 | | | | (0.27 | ) |
| | 2011 - Service | | | 9.58 | | | | 0.20 | | | | 0.28 | | | | 0.48 | | | | (0.22 | ) |
| | 2011 - IR | | | 9.54 | | | | 0.23 | | | | 0.28 | | | | 0.51 | | | | (0.26 | ) |
| | 2011 - R | | | 9.54 | | | | 0.18 | | | | 0.29 | | | | 0.47 | | | | (0.21 | ) |
| | 2010 - A | | | 8.27 | | | | 0.31 | | | | 1.27 | | | | 1.58 | | | | (0.32 | ) |
| | 2010 - B | | | 8.31 | | | | 0.24 | | | | 1.27 | | | | 1.51 | | | | (0.25 | ) |
| | 2010 - C | | | 8.31 | | | | 0.24 | | | | 1.28 | | | | 1.52 | | | | (0.25 | ) |
| | 2010 - Institutional | | | 8.30 | | | | 0.34 | | | | 1.28 | | | | 1.62 | | | | (0.35 | ) |
| | 2010 - Service | | | 8.31 | | | | 0.30 | | | | 1.27 | | | | 1.57 | | | | (0.30 | ) |
| | 2010 - IR | | | 8.28 | | | | 0.31 | | | | 1.29 | | | | 1.60 | | | | (0.34 | ) |
| | 2010 - R | | | 8.28 | | | | 0.28 | | | | 1.28 | | | | 1.56 | | | | (0.30 | ) |
| | (a) | | Calculated based on the average shares outstanding methodology. |
| | (b) | | Assumes investment at the net asset value at the beginning of the period, reinvestment of all dividends and distributions, a complete redemption of the investment at the net asset value at the end of the period and no sales or redemption charges. Total returns would be reduced if a sales or redemption charge was taken into account. Returns do not reflect the deduction of taxes that a shareholder would pay on Fund distributions or the redemption of Fund shares. Total returns for periods less than one full year are not annualized. |
| | (c) | | The Fund’s portfolio turnover rate is calculated in accordance with regulatory requirements, without regard to transactions involving short term investments and certain derivatives. If such transactions were included, the Fund’s portfolio turnover rate may be higher. |
| | |
| 130 | | The accompanying notes are an integral part of these financial statements. |
GOLDMAN SACHS CORE FIXED INCOME FUND
| | | | | | | | | | | | | | | | | | | | | | | | | | | | | | | | | | | | | | | | |
| | | | | | | | | | | | | | | | | | | | | | | | | | | | | | | | | | |
| | | Net asset
value, end
of period | | | | | Total
return(b) | | | | | Net assets,
end of
period
(in 000s) | | | | | Ratio of
net expenses
to average
net assets | | | | | Ratio of
total expenses
to average
net assets | | | | | Ratio of
net investment
income
to average
net assets | | | | | Portfolio
turnover
rate(c) | |
| | | | | | | | | | | | | | | | | | | | | | | | | | | | | | | | | | | | | | | | |
| | $ | 10.49 | | | | | | 2.15 | % | | | | $ | 142,355 | | | | | | 0.85 | %(d) | | | | | 0.85 | %(d) | | | | | 1.93 | %(d) | | | | | 182 | % |
| | | 10.54 | | | | | | 1.77 | | | | | | 2,766 | | | | | | 1.60 | (d) | | | | | 1.60 | (d) | | | | | 1.19 | (d) | | | | | 182 | |
| | | 10.55 | | | | | | 1.86 | | | | | | 19,433 | | | | | | 1.60 | (d) | | | | | 1.60 | (d) | | | | | 1.18 | (d) | | | | | 182 | |
| | | 10.54 | | | | | | 2.42 | | | | | | 897,037 | | | | | | 0.51 | (d) | | | | | 0.51 | (d) | | | | | 2.27 | (d) | | | | | 182 | |
| | | 10.54 | | | | | | 2.07 | | | | | | 1,643 | | | | | | 1.01 | (d) | | | | | 1.01 | (d) | | | | | 1.78 | (d) | | | | | 182 | |
| | | 10.50 | | | | | | 2.28 | | | | | | 1,464 | | | | | | 0.59 | (d) | | | | | 0.59 | (d) | | | | | 2.18 | (d) | | | | | 182 | |
| | | 10.51 | | | | | | 2.12 | | | | | | 587 | | | | | | 1.10 | (d) | | | | | 1.10 | (d) | | | | | 1.68 | (d) | | | | | 182 | |
| | | | | | | | | | | | | | | | | | | | | | | | | | | | | | | | | | | | | | | | |
| | | | | | | | | | | | | | | | | | | | | | | | | | | | | | | | | | | | | | | | |
| | | 10.38 | | | | | | 0.12 | | | | | | 134,288 | | | | | | 0.83 | | | | | | 0.83 | | | | | | 1.80 | | | | | | 516 | |
| | | 10.43 | | | | | | (0.61 | ) | | | | | 3,637 | | | | | | 1.58 | | | | | | 1.58 | | | | | | 1.02 | | | | | | 516 | |
| | | 10.43 | | | | | | (0.71 | ) | | | | | 20,262 | | | | | | 1.58 | | | | | | 1.58 | | | | | | 1.05 | | | | | | 516 | |
| | | 10.42 | | | | | | 0.47 | | | | | | 895,504 | | | | | | 0.49 | | | | | | 0.49 | | | | | | 2.13 | | | | | | 516 | |
| | | 10.43 | | | | | | (0.03 | ) | | | | | 1,837 | | | | | | 0.98 | | | | | | 0.98 | | | | | | 1.40 | | | | | | 516 | |
| | | 10.39 | | | | | | 0.37 | | | | | | 1,374 | | | | | | 0.58 | | | | | | 0.58 | | | | | | 2.03 | | | | | | 516 | |
| | | 10.39 | | | | | | (0.13 | ) | | | | | 557 | | | | | | 1.08 | | | | | | 1.08 | | | | | | 1.54 | | | | | | 516 | |
| | | 10.61 | | | | | | 5.08 | | | | | | 159,470 | | | | | | 0.81 | | | | | | 0.81 | | | | | | 1.54 | | | | | | 782 | |
| | | 10.66 | | | | | | 4.28 | | | | | | 6,531 | | | | | | 1.56 | | | | | | 1.56 | | | | | | 0.79 | | | | | | 782 | |
| | | 10.67 | | | | | | 4.28 | | | | | | 25,723 | | | | | | 1.56 | | | | | | 1.56 | | | | | | 0.79 | | | | | | 782 | |
| | | 10.65 | | | | | | 5.32 | | | | | | 1,198,584 | | | | | | 0.47 | | | | | | 0.47 | | | | | | 1.88 | | | | | | 782 | |
| | | 10.66 | | | | | | 4.90 | | | | | | 17,528 | | | | | | 0.97 | | | | | | 0.97 | | | | | | 1.35 | | | | | | 782 | |
| | | 10.62 | | | | | | 5.34 | | | | | | 1,622 | | | | | | 0.56 | | | | | | 0.56 | | | | | | 1.78 | | | | | | 782 | |
| | | 10.62 | | | | | | 4.72 | | | | | | 648 | | | | | | 1.06 | | | | | | 1.06 | | | | | | 1.24 | | | | | | 782 | |
| | | 10.31 | | | | | | 7.37 | | | | | | 204,327 | | | | | | 0.81 | | | | | | 0.81 | | | | | | 1.90 | | | | | | 687 | |
| | | 10.36 | | | | | | 6.55 | | | | | | 8,065 | | | | | | 1.56 | | | | | | 1.56 | | | | | | 1.14 | | | | | | 687 | |
| | | 10.37 | | | | | | 6.65 | | | | | | 28,539 | | | | | | 1.56 | | | | | | 1.56 | | | | | | 1.13 | | | | | | 687 | |
| | | 10.36 | | | | | | 7.81 | | | | | | 1,363,229 | | | | | | 0.47 | | | | | | 0.47 | | | | | | 2.23 | | | | | | 687 | |
| | | 10.36 | | | | | | 7.17 | | | | | | 10,969 | | | | | | 0.97 | | | | | | 0.97 | | | | | | 1.70 | | | | | | 687 | |
| | | 10.32 | | | | | | 7.74 | | | | | | 1,081 | | | | | | 0.56 | | | | | | 0.56 | | | | | | 2.14 | | | | | | 687 | |
| | | 10.33 | | | | | | 7.21 | | | | | | 19 | | | | | | 1.06 | | | | | | 1.06 | | | | | | 1.64 | | | | | | 687 | |
| | | 9.79 | | | | | | 5.24 | | | | | | 694,255 | | | | | | 0.81 | | | | | | 0.81 | | | | | | 2.13 | | | | | | 554 | |
| | | 9.84 | | | | | | 4.55 | | | | | | 11,234 | | | | | | 1.56 | | | | | | 1.56 | | | | | | 1.39 | | | | | | 554 | |
| | | 9.84 | | | | | | 4.44 | | | | | | 27,993 | | | | | | 1.56 | | | | | | 1.56 | | | | | | 1.38 | | | | | | 554 | |
| | | 9.83 | | | | | | 5.58 | | | | | | 1,041,837 | | | | | | 0.47 | | | | | | 0.47 | | | | | | 2.45 | | | | | | 554 | |
| | | 9.84 | | | | | | 5.17 | | | | | | 3,966 | | | | | | 0.97 | | | | | | 0.97 | | | | | | 1.98 | | | | | | 554 | |
| | | 9.79 | | | | | | 5.39 | | | | | | 1,538 | | | | | | 0.56 | | | | | | 0.56 | | | | | | 2.30 | | | | | | 554 | |
| | | 9.80 | | | | | | 4.98 | | | | | | 17 | | | | | | 1.06 | | | | | | 1.06 | | | | | | 1.88 | | | | | | 554 | |
| | | 9.53 | | | | | | 19.32 | | | | | | 804,834 | | | | | | 0.82 | | | | | | 0.82 | | | | | | 3.37 | | | | | | 418 | |
| | | 9.57 | | | | | | 18.36 | | | | | | 16,680 | | | | | | 1.57 | | | | | | 1.57 | | | | | | 2.68 | | | | | | 418 | |
| | | 9.58 | | | | | | 18.48 | | | | | | 33,260 | | | | | | 1.57 | | | | | | 1.57 | | | | | | 2.62 | | | | | | 418 | |
| | | 9.57 | | | | | | 19.79 | | | | | | 705,704 | | | | | | 0.48 | | | | | | 0.48 | | | | | | 3.78 | | | | | | 418 | |
| | | 9.58 | | | | | | 19.05 | | | | | | 5,580 | | | | | | 0.98 | | | | | | 0.98 | | | | | | 3.30 | | | | | | 418 | |
| | | 9.54 | | | | | | 19.58 | | | | | | 69 | | | | | | 0.57 | | | | | | 0.57 | | | | | | 3.30 | | | | | | 418 | |
| | | 9.54 | | | | | | 19.03 | | | | | | 14 | | | | | | 1.07 | | | | | | 1.07 | | | | | | 3.10 | | | | | | 418 | |
| | |
| The accompanying notes are an integral part of these financial statements. | | 131 |
GOLDMAN SACHS GLOBAL INCOME FUND
Financial Highlights
Selected Data for a Share Outstanding Throughout Each Period
| | | | | | | | | | | | | | | | | | | | | | | | | | | | | | |
| | | | | | | | Income (loss) from
investment operations | | | Distributions
to shareholders | |
| | | Year - Share Class | |
Net asset
value,
beginning
of period | | | Net
investment
income(a) | | | Net realized
and unrealized
gain (loss) | | | Total from
investment
operations | | | From net
investment
income | | | From net
realized
gains | | | Total
distributions | |
| | FOR THE SIX MONTHS ENDED SEPTEMBER 30, (UNAUDITED) | |
| | 2014 - A | | $ | 12.70 | | | $ | 0.10 | | | $ | 0.27 | | | $ | 0.37 | | | $ | (0.11 | ) | | $ | — | | | $ | (0.11 | ) |
| | 2014 - B | | | 12.65 | | | | 0.05 | | | | 0.27 | | | | 0.32 | | | | (0.06 | ) | | | — | | | | (0.06 | ) |
| | 2014 - C | | | 12.61 | | | | 0.05 | | | | 0.27 | | | | 0.32 | | | | (0.06 | ) | | | — | | | | (0.06 | ) |
| | 2014 - Institutional | | | 12.68 | | | | 0.12 | | | | 0.27 | | | | 0.39 | | | | (0.13 | ) | | | — | | | | (0.13 | ) |
| | 2014 - Service | | | 12.66 | | | | 0.09 | | | | 0.27 | | | | 0.36 | | | | (0.10 | ) | | | — | | | | (0.10 | ) |
| | 2014 - IR | | | 12.66 | | | | 0.11 | | | | 0.29 | | | | 0.40 | | | | (0.13 | ) | | | — | | | | (0.13 | ) |
| | | | | | | | | | | | | | | | | | | | | | | | | | | | | | |
| | FOR THE FISCAL YEARS ENDED MARCH 31, | |
| | 2014 - A | | | 13.20 | | | | 0.24 | | | | 0.03 | | | | 0.27 | | | | (0.58 | ) | | | (0.19 | ) | | | (0.77 | ) |
| | 2014 - B | | | 13.15 | | | | 0.14 | | | | 0.03 | | | | 0.17 | | | | (0.48 | ) | | | (0.19 | ) | | | (0.67 | ) |
| | 2014 - C | | | 13.11 | | | | 0.14 | | | | 0.03 | | | | 0.17 | | | | (0.48 | ) | | | (0.19 | ) | | | (0.67 | ) |
| | 2014 - Institutional | | | 13.18 | | | | 0.28 | | | | 0.03 | | | | 0.31 | | | | (0.62 | ) | | | (0.19 | ) | | | (0.81 | ) |
| | 2014 - Service | | | 13.16 | | | | 0.22 | | | | 0.03 | | | | 0.25 | | | | (0.56 | ) | | | (0.19 | ) | | | (0.75 | ) |
| | 2014 - IR | | | 13.17 | | | | 0.27 | | | | 0.02 | | | | 0.29 | | | | (0.61 | ) | | | (0.19 | ) | | | (0.80 | ) |
| | 2013 - A | | | 13.17 | | | | 0.22 | | | | 0.60 | | | | 0.82 | | | | (0.34 | ) | | | (0.45 | ) | | | (0.79 | ) |
| | 2013 - B | | | 13.12 | | | | 0.12 | | | | 0.60 | | | | 0.72 | | | | (0.24 | ) | | | (0.45 | ) | | | (0.69 | ) |
| | 2013 - C | | | 13.09 | | | | 0.12 | | | | 0.59 | | | | 0.71 | | | | (0.24 | ) | | | (0.45 | ) | | | (0.69 | ) |
| | 2013 - Institutional | | | 13.15 | | | | 0.27 | | | | 0.60 | | | | 0.87 | | | | (0.39 | ) | | | (0.45 | ) | | | (0.84 | ) |
| | 2013 - Service | | | 13.13 | | | | 0.20 | | | | 0.60 | | | | 0.80 | | | | (0.32 | ) | | | (0.45 | ) | | | (0.77 | ) |
| | 2013 - IR | | | 13.15 | | | | 0.26 | | | | 0.59 | | | | 0.85 | | | | (0.38 | ) | | | (0.45 | ) | | | (0.83 | ) |
| | 2012 - A | | | 12.63 | | | | 0.23 | | | | 0.54 | | | | 0.77 | | | | (0.23 | ) | | | — | | | | (0.23 | ) |
| | 2012 - B | | | 12.58 | | | | 0.14 | | | | 0.54 | | | | 0.68 | | | | (0.14 | ) | | | — | | | | (0.14 | ) |
| | 2012 - C | | | 12.55 | | | | 0.14 | | | | 0.54 | | | | 0.68 | | | | (0.14 | ) | | | — | | | | (0.14 | ) |
| | 2012 - Institutional | | | 12.61 | | | | 0.27 | | | | 0.55 | | | | 0.82 | | | | (0.28 | ) | | | — | | | | (0.28 | ) |
| | 2012 - Service | | | 12.59 | | | | 0.21 | | | | 0.54 | | | | 0.75 | | | | (0.21 | ) | | | — | | | | (0.21 | ) |
| | 2012 - IR | | | 12.61 | | | | 0.24 | | | | 0.57 | | | | 0.81 | | | | (0.27 | ) | | | — | | | | (0.27 | ) |
| | 2011 - A | | | 12.74 | | | | 0.26 | | | | (0.10 | ) | | | 0.16 | | | | (0.27 | ) | | | — | | | | (0.27 | ) |
| | 2011 - B | | | 12.69 | | | | 0.17 | | | | (0.11 | ) | | | 0.06 | | | | (0.17 | ) | | | — | | | | (0.17 | ) |
| | 2011 - C | | | 12.66 | | | | 0.16 | | | | (0.09 | ) | | | 0.07 | | | | (0.18 | ) | | | — | | | | (0.18 | ) |
| | 2011 - Institutional | | | 12.72 | | | | 0.30 | | | | (0.09 | ) | | | 0.21 | | | | (0.32 | ) | | | — | | | | (0.32 | ) |
| | 2011 - Service | | | 12.70 | | | | 0.24 | | | | (0.10 | ) | | | 0.14 | | | | (0.25 | ) | | | — | | | | (0.25 | ) |
| | 2011 - IR (Commenced July 30, 2010) | | | 12.91 | | | | 0.19 | | | | (0.29 | ) | | | (0.10 | ) | | | (0.20 | ) | | | — | | | | (0.20 | ) |
| | 2010 - A | | | 12.30 | | | | 0.38 | | | | 1.35 | | | | 1.73 | | | | (1.29 | ) | | | — | | | | (1.29 | ) |
| | 2010 - B | | | 12.25 | | | | 0.29 | | | | 1.34 | | | | 1.63 | | | | (1.19 | ) | | | — | | | | (1.19 | ) |
| | 2010 - C | | | 12.23 | | | | 0.28 | | | | 1.34 | | | | 1.62 | | | | (1.19 | ) | | | — | | | | (1.19 | ) |
| | 2010 - Institutional | | | 12.28 | | | | 0.42 | | | | 1.35 | | | | 1.77 | | | | (1.33 | ) | | | — | | | | (1.33 | ) |
| | 2010 - Service | | | 12.27 | | | | 0.36 | | | | 1.34 | | | | 1.70 | | | | (1.27 | ) | | | — | | | | (1.27 | ) |
| | (a) | | Calculated based on the average shares outstanding methodology. |
| | (b) | | Assumes investment at the net asset value at the beginning of the period, reinvestment of all dividends and distributions, a complete redemption of the investment at the net asset value at the end of the period and no sales or redemption charges. Total returns would be reduced if a sales or redemption charge was taken into account. Returns do not reflect the deduction of taxes that a shareholder would pay on Fund distributions or the redemption of Fund shares. Total returns for periods less than one full year are not annualized. |
| | (c) | | The Fund’s portfolio turnover rate is calculated in accordance with regulatory requirements, without regard to transactions involving short term investments and certain derivatives. If such transactions were included, the Fund’s portfolio turnover rate may be higher. |
| | |
| 132 | | The accompanying notes are an integral part of these financial statements. |
GOLDMAN SACHS GLOBAL INCOME FUND
| | | | | | | | | | | | | | | | | | | | | | | | | | | | | | | | | | | | | | | | |
| | | | | | | | | | | | | | | | | | | | | | | | | | | | | | | | | | |
| | | Net asset
value, end
of period | | | | | Total
return(b) | | | | | Net assets,
end of
period
(in 000s) | | | | | Ratio of
net expenses
to average
net assets | | | | | Ratio of
total expenses
to average
net assets | | | | | Ratio of
net investment
income to
average net
assets | | | | | Portfolio
turnover
rate(c) | |
| | | | | | | | | | | | | | | | | | | | | | | | | | | | | | | | | | | | | | | | |
| | $ | 12.96 | | | | | | 2.95 | % | | | | $ | 60,622 | | | | | | 1.04 | %(d) | | | | | 1.19 | %(d) | | | | | 1.49 | %(d) | | | | | 100 | % |
| | | 12.91 | | | | | | 2.57 | | | | | | 899 | | | | | | 1.79 | (d) | | | | | 1.94 | (d) | | | | | 0.76 | (d) | | | | | 100 | |
| | | 12.87 | | | | | | 2.58 | | | | | | 5,135 | | | | | | 1.78 | (d) | | | | | 1.94 | (d) | | | | | 0.74 | (d) | | | | | 100 | |
| | | 12.94 | | | | | | 3.13 | | | | | | 387,248 | | | | | | 0.70 | (d) | | | | | 0.85 | (d) | | | | | 1.84 | (d) | | | | | 100 | |
| | | 12.92 | | | | | | 2.87 | | | | | | 348 | | | | | | 1.19 | (d) | | | | | 1.34 | (d) | | | | | 1.33 | (d) | | | | | 100 | |
| | | 12.93 | | | | | | 3.16 | | | | | | 2,760 | | | | | | 0.78 | (d) | | | | | 0.93 | (d) | | | | | 1.68 | (d) | | | | | 100 | |
| | | | | | | | | | | | | | | | | | | | | | | | | | | | | | | | | | | | | | | | |
| | | | | | | | | | | | | | | | | | | | | | | | | | | | | | | | | | | | | | | | |
| | | 12.70 | | | | | | 2.16 | | | | | | 61,198 | | | | | | 1.04 | | | | | | 1.20 | | | | | | 1.83 | | | | | | 288 | |
| | | 12.65 | | | | | | 1.40 | | | | | | 1,060 | | | | | | 1.79 | | | | | | 1.95 | | | | | | 1.07 | | | | | | 288 | |
| | | 12.61 | | | | | | 1.40 | | | | | | 4,688 | | | | | | 1.79 | | | | | | 1.95 | | | | | | 1.08 | | | | | | 288 | |
| | | 12.68 | | | | | | 2.51 | | | | | | 426,746 | | | | | | 0.70 | | | | | | 0.86 | | | | | | 2.19 | | | | | | 288 | |
| | | 12.66 | | | | | | 1.98 | | | | | | 239 | | | | | | 1.20 | | | | | | 1.35 | | | | | | 1.70 | | | | | | 288 | |
| | | 12.66 | | | | | | 2.34 | | | | | | 757 | | | | | | 0.79 | | | | | | 0.95 | | | | | | 2.09 | | | | | | 288 | |
| | | 13.20 | | | | | | 6.32 | | | | | | 79,838 | | | | | | 1.04 | | | | | | 1.15 | | | | | | 1.64 | | | | | | 444 | |
| | | 13.15 | | | | | | 5.55 | | | | | | 1,784 | | | | | | 1.79 | | | | | | 1.90 | | | | | | 0.92 | | | | | | 444 | |
| | | 13.11 | | | | | | 5.57 | | | | | | 5,757 | | | | | | 1.79 | | | | | | 1.90 | | | | | | 0.92 | | | | | | 444 | |
| | | 13.18 | | | | | | 6.69 | | | | | | 387,889 | | | | | | 0.69 | | | | | | 0.81 | | | | | | 1.99 | | | | | | 444 | |
| | | 13.16 | | | | | | 6.16 | | | | | | 145 | | | | | | 1.19 | | | | | | 1.31 | | | | | | 1.49 | | | | | | 444 | |
| | | 13.17 | | | | | | 6.51 | | | | | | 545 | | | | | | 0.79 | | | | | | 0.90 | | | | | | 1.94 | | | | | | 444 | |
| | | 13.17 | | | | | | 6.16 | | | | | | 198,463 | | | | | | 1.03 | | | | | | 1.14 | | | | | | 1.78 | | | | | | 333 | |
| | | 13.12 | | | | | | 5.38 | | | | | | 2,310 | | | | | | 1.78 | | | | | | 1.89 | | | | | | 1.07 | | | | | | 333 | |
| | | 13.09 | | | | | | 5.32 | | | | | | 6,359 | | | | | | 1.78 | | | | | | 1.89 | | | | | | 1.06 | | | | | | 333 | |
| | | 13.15 | | | | | | 6.53 | | | | | | 574,373 | | �� | | | | 0.69 | | | | | | 0.80 | | | | | | 2.10 | | | | | | 333 | |
| | | 13.13 | | | | | | 6.01 | | | | | | 189 | | | | | | 1.19 | | | | | | 1.30 | | | | | | 1.61 | | | | | | 333 | |
| | | 13.15 | | | | | | 6.43 | | | | | | 402 | | | | | | 0.78 | | | | | | 0.89 | | | | | | 1.87 | | | | | | 333 | |
| | | 12.63 | | | | | | 1.27 | | | | | | 204,116 | | | | | | 1.03 | | | | | | 1.13 | | | | | | 2.03 | | | | | | 272 | |
| | | 12.58 | | | | | | 0.50 | | | | | | 2,979 | | | | | | 1.78 | | | | | | 1.88 | | | | | | 1.29 | | | | | | 272 | |
| | | 12.55 | | | | | | 0.60 | | | | | | 7,676 | | | | | | 1.78 | | | | | | 1.88 | | | | | | 1.29 | | | | | | 272 | |
| | | 12.61 | | | | | | 1.62 | | | | | | 469,982 | | | | | | 0.69 | | | | | | 0.79 | | | | | | 2.36 | | | | | | 272 | |
| | | 12.59 | | | | | | 1.12 | | | | | | 151 | | | | | | 1.19 | | | | | | 1.29 | | | | | | 1.89 | | | | | | 272 | |
| | | 12.61 | | | | | | (0.78 | ) | | | | | 23 | | | | | | 0.78 | (d) | | | | | 0.88 | (d) | | | | | 2.28 | (d) | | | | | 272 | |
| | | 12.74 | | | | | | 14.73 | | | | | | 218,572 | | | | | | 1.03 | | | | | | 1.11 | | | | | | 3.02 | | | | | | 237 | |
| | | 12.69 | | | | | | 13.92 | | | | | | 5,143 | | | | | | 1.78 | | | | | | 1.86 | | | | | | 2.30 | | | | | | 237 | |
| | | 12.66 | | | | | | 13.80 | | | | | | 7,606 | | | | | | 1.78 | | | | | | 1.86 | | | | | | 2.22 | | | | | | 237 | |
| | | 12.72 | | | | | | 15.14 | | | | | | 685,787 | | | | | | 0.69 | | | | | | 0.77 | | | | | | 3.36 | | | | | | 237 | |
| | | 12.70 | | | | | | 14.50 | | | | | | 95 | | | | | | 1.19 | | | | | | 1.27 | | | | | | 2.87 | | | | | | 237 | |
| | |
| The accompanying notes are an integral part of these financial statements. | | 133 |
GOLDMAN SACHS STRATEGIC INCOME FUND
Financial Highlights
Selected Data for a Share Outstanding Throughout Each Period
| | | | | | | | | | | | | | | | | | | | | | | | | | | | | | | | | | |
| | | | | | | | Income (loss) from
investment operations | | | Distributions
to shareholders | |
| | | Year - Share Class | |
Net asset
value,
beginning
of period | | | Net
investment
income | | | Net realized
and unrealized
gain (loss) | | | Total from
investment
operations | | | From net
investment
income | | | From net
realized
gains | | | From
capital | | | Total
distributions | |
| | FOR THE SIX MONTHS ENDED SEPTEMBER 30, (UNAUDITED) | |
| | 2014 - A | | $ | 10.64 | | | $ | 0.11 | (c) | | $ | (0.05 | ) | | $ | 0.06 | | | $ | (0.11 | ) | | $ | — | | | $ | — | | | $ | (0.11 | ) |
| | 2014 - C | | | 10.64 | | | | 0.07 | (c) | | | (0.05 | ) | | | 0.02 | | | | (0.07 | ) | | | — | | | | — | | | | (0.07 | ) |
| | 2014 - Institutional | | | 10.64 | | | | 0.13 | (c) | | | (0.05 | ) | | | 0.08 | | | | (0.13 | ) | | | — | | | | — | | | | (0.13 | ) |
| | 2014 - IR | | | 10.63 | | | | 0.12 | (c) | | | (0.05 | ) | | | 0.07 | | | | (0.12 | ) | | | — | | | | — | | | | (0.12 | ) |
| | 2014 - R | | | 10.63 | | | | 0.10 | (c) | | | (0.05 | ) | | | 0.05 | | | | (0.10 | ) | | | — | | | | — | | | | (0.10 | ) |
| | | | | | | | | | | | | | | | | | | | | | | | | | | | | | | | | | |
| | FOR THE FISCAL YEARS ENDED MARCH 31, | |
| | 2014 - A | | | 10.46 | | | | 0.22 | (c) | | | 0.21 | | | | 0.43 | | | | (0.25 | ) | | | — | | | | — | | | | (0.25 | ) |
| | 2014 - C | | | 10.46 | | | | 0.14 | (c) | | | 0.21 | | | | 0.35 | | | | (0.17 | ) | | | — | | | | — | | | | (0.17 | ) |
| | 2014 - Institutional | | | 10.46 | | | | 0.26 | (c) | | | 0.21 | | | | 0.47 | | | | (0.29 | ) | | | — | | | | — | | | | (0.29 | ) |
| | 2014 - IR | | | 10.46 | | | | 0.25 | (c) | | | 0.20 | | | | 0.45 | | | | (0.28 | ) | | | — | | | | — | | | | (0.28 | ) |
| | 2014 - R | | | 10.45 | | | | 0.21 | (c) | | | 0.19 | | | | 0.40 | | | | (0.22 | ) | | | — | | | | — | | | | (0.22 | ) |
| | 2013 - A | | | 9.87 | | | | 0.32 | (c) | | | 0.73 | | | | 1.05 | | | | (0.46 | ) | | | — | | | | — | | | | (0.46 | ) |
| | 2013 - C | | | 9.88 | | | | 0.24 | (c) | | | 0.72 | | | | 0.96 | | | | (0.38 | ) | | | — | | | | — | | | | (0.38 | ) |
| | 2013 - Institutional | | | 9.87 | | | | 0.35 | (c) | | | 0.73 | | | | 1.08 | | | | (0.49 | ) | | | — | | | | — | | | | (0.49 | ) |
| | 2013 - IR | | | 9.87 | | | | 0.34 | (c) | | | 0.73 | | | | 1.07 | | | | (0.48 | ) | | | — | | | | — | | | | (0.48 | ) |
| | 2013 - R | | | 9.87 | | | | 0.30 | (c) | | | 0.71 | | | | 1.01 | | | | (0.43 | ) | | | — | | | | — | | | | (0.43 | ) |
| | 2012 - A | | | 10.03 | | | | 0.32 | (c) | | | (0.16 | ) | | | 0.16 | | | | (0.32 | ) | | | — | | | | — | | | | (0.32 | ) |
| | 2012 - C | | | 10.04 | | | | 0.24 | (c) | | | (0.15 | ) | | | 0.09 | | | | (0.25 | ) | | | — | | | | — | | | | (0.25 | ) |
| | 2012 - Institutional | | | 10.03 | | | | 0.35 | (c) | | | (0.15 | ) | | | 0.20 | | | | (0.36 | ) | | | — | | | | — | | | | (0.36 | ) |
| | 2012 - IR | | | 10.03 | | | | 0.34 | (c) | | | (0.15 | ) | | | 0.19 | | | | (0.35 | ) | | | — | | | | — | | | | (0.35 | ) |
| | 2012 - R | | | 10.03 | | | | 0.29 | (c) | | | (0.15 | ) | | | 0.14 | | | | (0.30 | ) | | | — | | | | — | | | | (0.30 | ) |
| | | | | | | | | | | | | | | | | | | | | | | | | | | | | | | | | | |
| | FOR THE PERIOD ENDED MARCH 31, | |
| | 2011 - A (Commenced June 30, 2010) | | | 10.00 | | | | 0.17 | | | | 0.06 | | | | 0.23 | | | | (0.16 | ) | | | (0.02 | ) | | | (0.02 | ) | | | (0.20 | ) |
| | 2011 - C (Commenced June 30, 2010) | | | 10.00 | | | | 0.12 | | | | 0.06 | | | | 0.18 | | | | (0.10 | ) | | | (0.02 | ) | | | (0.02 | ) | | | (0.14 | ) |
| | 2011 - Institutional
(Commenced June 30, 2010) | | | 10.00 | | | | 0.20 | | | | 0.05 | | | | 0.25 | | | | (0.18 | ) | | | (0.02 | ) | | | (0.02 | ) | | | (0.22 | ) |
| | 2011 - IR (Commenced June 30, 2010) | | | 10.00 | | | | 0.19 | | | | 0.05 | | | | 0.24 | | | | (0.17 | ) | | | (0.02 | ) | | | (0.02 | ) | | | (0.21 | ) |
| | 2011 - R (Commenced June 30, 2010) | | | 10.00 | | | | 0.16 | | | | 0.05 | | | | 0.21 | | | | (0.14 | ) | | | (0.02 | ) | | | (0.02 | ) | | | (0.18 | ) |
| | (a) | | Assumes investment at the net asset value at the beginning of the period, reinvestment of all dividends and distributions, a complete redemption of the investment at the net asset value at the end of the period and no sales or redemption charges. Total returns would be reduced if a sales or redemption charge was taken into account. Returns do not reflect the deduction of taxes that a shareholder would pay on Fund distributions or the redemption of Fund shares. Total returns for periods less than one full year are not annualized. |
| | (b) | | The Fund’s portfolio turnover rate is calculated in accordance with regulatory requirements, without regard to transactions involving short term investments and certain derivatives. If such transactions were included, the Fund’s portfolio turnover rate may be higher. |
| | (c) | | Calculated based on the average shares outstanding methodology. |
| | |
| 134 | | The accompanying notes are an integral part of these financial statements. |
GOLDMAN SACHS STRATEGIC INCOME FUND
| | | | | | | | | | | | | | | | | | | | | | | | | | | | | | | | | | | | | | | | |
| | | | | | | | | | | | | | | | | | | | | | | | | | | | | | | | | | |
| | | Net asset
value, end
of period | | | | | Total
return(a) | | | | | Net assets,
end of
period
(in 000s) | | | | | Ratio of
net expenses
to average
net assets | | | | | Ratio of
total expenses
to average
net assets | | | | | Ratio of
net investment
income
to average
net assets | | | | | Portfolio
turnover
rate(b) | |
| | | | | | | | | | | | | | | | | | | | | | | | | | | | | | | | | | | | | | | | |
| | $ | 10.59 | | | | | | 0.58 | % | | | | $ | 3,177,089 | | | | | | 0.91 | %(d) | | | | | 0.91 | %(d) | | | | | 2.11 | %(d) | | | | | 91 | % |
| | | 10.59 | | | | | | 0.20 | | | | | | 1,220,250 | | | | | | 1.66 | (d) | | | | | 1.66 | (d) | | | | | 1.35 | (d) | | | | | 91 | |
| | | 10.59 | | | | | | 0.75 | | | | | | 20,700,173 | | | | | | 0.57 | (d) | | | | | 0.57 | (d) | | | | | 2.44 | (d) | | | | | 91 | |
| | | 10.58 | | | | | | 0.70 | | | | | | 882,813 | | | | | | 0.66 | (d) | | | | | 0.66 | (d) | | | | | 2.35 | (d) | | | | | 91 | |
| | | 10.58 | | | | | | 0.45 | | | | | | 7,922 | | | | | | 1.16 | (d) | | | | | 1.16 | (d) | | | | | 1.85 | (d) | | | | | 91 | |
| | | | | | | | | | | | | | | | | | | | | | | | | | | | | | | | | | | | | | | | |
| | | | | | | | | | | | | | | | | | | | | | | | | | | | | | | | | | | | | | | | |
| | | 10.64 | | | | | | 4.16 | | | | | | 3,693,934 | | | | | | 0.91 | | | | | | 0.91 | | | | | | 2.08 | | | | | | 302 | |
| | | 10.64 | | | | | | 3.37 | | | | | | 1,017,133 | | | | | | 1.66 | | | | | | 1.66 | | | | | | 1.31 | | | | | | 302 | |
| | | 10.64 | | | | | | 4.51 | | | | | | 15,468,555 | | | | | | 0.57 | | | | | | 0.57 | | | | | | 2.44 | | | | | | 302 | |
| | | 10.63 | | | | | | 4.32 | | | | | | 715,773 | | | | | | 0.66 | | | | | | 0.66 | | | | | | 2.32 | | | | | | 302 | |
| | | 10.63 | | | | | | 3.90 | | | | | | 5,454 | | | | | | 1.16 | | | | | | 1.16 | | | | | | 1.96 | | | | | | 302 | |
| | | 10.46 | | | | | | 10.80 | | | | | | 709,730 | | | | | | 0.99 | | | | | | 0.99 | | | | | | 3.17 | | | | | | 727 | |
| | | 10.46 | | | | | | 9.86 | | | | | | 239,501 | | | | | | 1.74 | | | | | | 1.74 | | | | | | 2.36 | | | | | | 727 | |
| | | 10.46 | | | | | | 11.18 | | | | | | 2,428,689 | | | | | | 0.65 | | | | | | 0.65 | | | | | | 3.42 | | | | | | 727 | |
| | | 10.46 | | | | | | 11.07 | | | | | | 107,502 | | | | | | 0.74 | | | | | | 0.74 | | | | | | 3.33 | | | | | | 727 | |
| | | 10.45 | | | | | | 10.45 | | | | | | 12 | | | | | | 1.23 | | | | | | 1.23 | | | | | | 2.98 | | | | | | 727 | |
| | | 9.87 | | | | | | 1.60 | | | | | | 728,059 | | | | | | 1.00 | | | | | | 1.00 | | | | | | 3.23 | | | | | | 636 | |
| | | 9.88 | | | | | | 0.94 | | | | | | 148,590 | | | | | | 1.75 | | | | | | 1.75 | | | | | | 2.51 | | | | | | 636 | |
| | | 9.87 | | | | | | 2.04 | | | | | | 993,936 | | | | | | 0.66 | | | | | | 0.66 | | | | | | 3.59 | | | | | | 636 | |
| | | 9.87 | | | | | | 1.95 | | | | | | 50,350 | | | | | | 0.75 | | | | | | 0.75 | | | | | | 3.54 | | | | | | 636 | |
| | | 9.87 | | | | | | 1.46 | | | | | | 29 | | | | | | 1.25 | | | | | | 1.25 | | | | | | 3.00 | | | | | | 636 | |
| | | | | | | | | | | | | | | | | | | | | | | | | | | | | | | | | | | | | | | | |
| | | | | | | | | | | | | | | | | | | | | | | | | | | | | | | | | | | | | | | | |
| | | 10.03 | | | | | | 2.37 | | | | | | 820,664 | | | | | | 1.02 | (d) | | | | | 1.08 | (d) | | | | | 2.63 | (d) | | | | | 342 | |
| | | 10.04 | | | | | | 1.81 | | | | | | 82,982 | | | | | | 1.77 | (d) | | | | | 1.83 | (d) | | | | | 1.81 | (d) | | | | | 342 | |
| |
|
10.03 |
| | | | | 2.51 | | | | | | 804,517 | | | | | | 0.68 | (d) | | | | | 0.74 | (d) | | | | | 2.96 | (d) | | | | | 342 | |
| | | 10.03 | | | | | | 2.44 | | | | | | 25,158 | | | | | | 0.77 | (d) | | | | | 0.83 | (d) | | | | | 2.82 | (d) | | | | | 342 | |
| | | 10.03 | | | | | | 2.09 | | | | | | 25 | | | | | | 1.27 | (d) | | | | | 1.33 | (d) | | | | | 2.07 | (d) | | | | | 342 | |
| | |
| The accompanying notes are an integral part of these financial statements. | | 135 |
GOLDMAN SACHS WORLD BOND FUND
Financial Highlights
Selected Data for a Share Outstanding Throughout Each Period
| | | | | | | | | | | | | | | | | | | | | | | | | | | | | | | | | | |
| | | | | | | | Income (loss) from
investment operations | | | Distributions
to shareholders | |
| | | Year - Share Class | | Net asset
value,
beginning
of period | | | Net
investment
income(a) | | | Net realized
and unrealized
gain (loss) | | | Total from
investment
operations | | | From net
investment
income | | | From net
realized
gains | | | From
capital | | | Total
distributions | |
| | FOR THE SIX MONTHS ENDED SEPTEMBER 30, (UNAUDITED) | |
| | 2014 - A | | $ | 9.55 | | | $ | 0.08 | | | $ | (0.15 | ) | | $ | (0.07 | ) | | $ | (0.07 | ) | | $ | — | | | $ | — | | | $ | (0.07 | ) |
| | 2014 - C | | | 9.55 | | | | 0.04 | | | | (0.15 | ) | | | (0.11 | ) | | | (0.04 | ) | | | — | | | | — | | | | (0.04 | ) |
| | 2014 - Institutional | | | 9.55 | | | | 0.09 | | | | (0.15 | ) | | | (0.06 | ) | | | (0.09 | ) | | | — | | | | — | | | | (0.09 | ) |
| | 2014 - IR | | | 9.55 | | | | 0.09 | | | | (0.16 | ) | | | (0.07 | ) | | | (0.08 | ) | | | — | | | | — | | | | (0.08 | ) |
| | 2014 - R | | | 9.55 | | | | 0.07 | | | | (0.16 | ) | | | (0.09 | ) | | | (0.06 | ) | | | — | | | | — | | | | (0.06 | ) |
| | | | | | | | | | | | | | | | | | | | | | | | | | | | | | | | | | |
| | FOR THE FISCAL YEAR ENDED MARCH 31, | |
| | 2014 - A | | | 9.92 | | | | 0.11 | | | | (0.17 | ) | | | (0.06 | ) | | | (0.26 | ) | | | (0.01 | ) | | | (0.04 | ) | | | (0.31 | ) |
| | 2014 - C | | | 9.91 | | | | 0.04 | | | | (0.15 | ) | | | (0.11 | ) | | | (0.20 | ) | | | (0.01 | ) | | | (0.04 | ) | | | (0.25 | ) |
| | 2014 - Institutional | | | 9.91 | | | | 0.14 | | | | (0.15 | ) | | | (0.01 | ) | | | (0.30 | ) | | | (0.01 | ) | | | (0.04 | ) | | | (0.35 | ) |
| | 2014 - IR | | | 9.91 | | | | 0.14 | | | | (0.15 | ) | | | (0.02 | ) | | | (0.29 | ) | | | (0.01 | ) | | | (0.04 | ) | | | (0.34 | ) |
| | 2014 - R | | | 9.91 | | | | 0.08 | | | | (0.15 | ) | | | (0.07 | ) | | | (0.24 | ) | | | (0.01 | ) | | | (0.04 | ) | | | (0.29 | ) |
| | | | | | | | | | | | | | | | | | | | | | | | | | | | | | | | | | |
| | FOR THE PERIOD ENDED MARCH 31, | |
| | 2013 - A (Commenced November 30, 2012) | | | 10.00 | | | | 0.02 | | | | (0.08 | ) | | | (0.06 | ) | | | (0.02 | ) | | | — | | | | — | | | | (0.02 | ) |
| | 2013 - C (Commenced November 30, 2012) | | | 10.00 | | | | — | (e) | | | (0.09 | ) | | | (0.09 | ) | | | — | (e) | | | — | | | | — | | | | — | (e) |
| | 2013 - Institutional
(Commenced November 30, 2012) | | | 10.00 | | | | 0.03 | | | | (0.09 | ) | | | (0.06 | ) | | | (0.03 | ) | | | — | | | | — | | | | (0.03 | ) |
| | 2013 - IR
(Commenced November 30, 2012) | | | 10.00 | | | | 0.03 | | | | (0.09 | ) | | | (0.06 | ) | | | (0.03 | ) | | | — | | | | — | | | | (0.03 | ) |
| | 2013 - R (Commenced November 30, 2012) | | | 10.00 | | | | 0.01 | | | | (0.09 | ) | | | (0.08 | ) | | | (0.01 | ) | | | — | | | | — | | | | (0.01 | ) |
| | (a) | | Calculated based on the average shares outstanding methodology. |
| | (b) | | Assumes investment at the net asset value at the beginning of the period, reinvestment of all dividends and distributions, a complete redemption of the investment at the net asset value at the end of the period and no sales or redemption charges. Total returns would be reduced if a sales or redemption charge was taken into account. Returns do not reflect the deduction of taxes that a shareholder would pay on Fund distributions or the redemption of Fund shares. Total returns for periods less than one full year are not annualized. |
| | (c) | | The Fund’s portfolio turnover rate is calculated in accordance with regulatory requirements, without regard to transactions involving short term investments and certain derivatives. If such transactions were included, the Fund’s portfolio turnover rate may be higher. |
| | (e) | | Amount is less than $0.005 per share. |
| | |
| 136 | | The accompanying notes are an integral part of these financial statements. |
GOLDMAN SACHS WORLD BOND FUND
| | | | | | | | | | | | | | | | | | | | | | | | | | | | | | | | | | | | | | | | |
| | | | | | | | | | | | | | | | | | | | | | | | | | | | | | | | | | |
| | | Net asset
value, end
of period | | | | | Total
return(b) | | | | | Net assets,
end of
period
(in 000s) | | | | | Ratio of
net expenses
to average
net assets | | | | | Ratio of
total expenses
to average
net assets | | | | | Ratio of
net investment
income (loss)
to average
net assets | | | | | Portfolio
turnover
rate(c) | |
| | | | | | | | | | | | | | | | | | | | | | | | | | | | | | | | | | | | | | | | |
| | $ | 9.41 | | | | | | (0.72 | )% | | | | $ | 174 | | | | | | 1.06 | %(d) | | | | | 5.25 | %(d) | | | | | 1.58 | %(d) | | | | | 77 | % |
| | | 9.40 | | | | | | (1.20 | ) | | | | | 37 | | | | | | 1.81 | (d) | | | | | 5.80 | (d) | | | | | 0.85 | (d) | | | | | 77 | |
| | | 9.40 | | | | | | (0.65 | ) | | | | | 11,809 | | | | | | 0.72 | (d) | | | | | 4.67 | (d) | | | | | 1.96 | (d) | | | | | 77 | |
| | | 9.40 | | | | | | (0.70 | ) | | | | | 10 | | | | | | 0.85 | (d) | | | | | 4.80 | (d) | | | | | 1.87 | (d) | | | | | 77 | |
| | | 9.40 | | | | | | (0.96 | ) | | | | | 10 | | | | | | 1.32 | (d) | | | | | 5.26 | (d) | | | | | 1.36 | (d) | | | | | 77 | |
| | | | | | | | | | | | | | | | | | | | | | | | | | | | | | | | | | | | | | | | |
| | | | | | | | | | | | | | | | | | | | | | | | | | | | | | | | | | | | | | | | |
| | | 9.55 | | | | | | (0.43 | ) | | | | | 98 | | | | | | 1.05 | | | | | | 5.95 | | | | | | 1.17 | | | | | | 252 | |
| | | 9.55 | | | | | | (1.11 | ) | | | | | 10 | | | | | | 1.72 | | | | | | 6.60 | | | | | | 0.43 | | | | | | 252 | |
| | | 9.55 | | | | | | (0.08 | ) | | | | | 11,887 | | | | | | 0.72 | | | | | | 5.51 | | | | | | 1.46 | | | | | | 252 | |
| | | 9.55 | | | | | | (0.10 | ) | | | | | 10 | | | | | | 0.78 | | | | | | 5.57 | | | | | | 1.47 | | | | | | 252 | |
| | | 9.55 | | | | | | (0.70 | ) | | | | | 10 | | | | | | 1.31 | | | | | | 6.10 | | | | | | 0.83 | | | | | | 252 | |
| | | | | | | | | | | | | | | | | | | | | | | | | | | | | | | | | | | | | | | | |
| | | | | | | | | | | | | | | | | | | | | | | | | | | | | | | | | | | | | | | | |
| | | 9.92 | | | | | | (0.69 | ) | | | | | 21 | | | | | | 1.04 | (d) | | | | | 4.59 | (d) | | | | | 0.69 | (d) | | | | | 192 | |
| | | 9.91 | | | | | | (0.89 | ) | | | | | 10 | | | | | | 1.78 | (d) | | | | | 5.92 | (d) | | | | | (0.10 | )(d) | | | | | 192 | |
| | | 9.91 | | | | | | (0.58 | ) | | | | | 11,920 | | | | | | 0.71 | (d) | | | | | 4.83 | (d) | | | | | 1.02 | (d) | | | | | 192 | |
| | | 9.91 | | | | | | (0.60 | ) | | | | | 10 | | | | | | 0.86 | (d) | | | | | 4.99 | (d) | | | | | 0.97 | (d) | | | | | 192 | |
| | | 9.91 | | | | | | (0.78 | ) | | | | | 10 | | | | | | 1.31 | (d) | | | | | 5.42 | (d) | | | | | 0.38 | (d) | | | | | 192 | |
| | |
| The accompanying notes are an integral part of these financial statements. | | 137 |
GOLDMAN SACHS MULTI SECTOR FIXED INCOME FUNDS
Notes to Financial Statements
September 30, 2014 (Unaudited)
Goldman Sachs Trust (the “Trust”) is a Delaware statutory trust registered under the Investment Company Act of 1940, as amended (the “Act”), as an open-end management investment company. The following table lists those series of the Trust that are included in this report (collectively, the “Funds” or individually a “Fund”), along with their corresponding share classes and respective diversification status under the Act:
| | | | |
| Fund | | Share Classes Offered* | | Diversified/ Non-diversified |
Bond† and Core Fixed Income | | A, B, C, Institutional, Service, IR and R | | Diversified |
Global Income | | A, B, C, Institutional, Service and IR | | Non-diversified |
Strategic Income | | A, C, Institutional, IR and R | | Diversified |
World Bond | | A, C, Institutional, IR and R | | Non-diversified |
| * | | Class B Shares are generally no longer available for purchase by current or prospective investors. |
| † | | Formerly, Goldman Sachs Core Plus Fixed Income Fund. Effective on October 1, 2014, the Fund changed its name to Goldman Sachs Bond Fund. |
Class A Shares are sold with a front-end sales charge of up to 3.75%. Class B Shares were sold with a contingent deferred sales charge (“CDSC”) that declines from 5.00% to zero, depending upon the period of time the shares are held. Class C Shares are sold with a CDSC of 1.00%, which is imposed on redemptions made within 12 months of purchase. Institutional, Service, Class IR and Class R Shares are not subject to a sales charge.
Goldman Sachs Asset Management, L.P. (“GSAM”), an affiliate of Goldman, Sachs & Co. (“Goldman Sachs”), serves as investment adviser to each of the Core Fixed Income, Bond and Strategic Income Funds pursuant to management agreements with the Trust. Goldman Sachs Asset Management International (“GSAMI”), an affiliate of GSAM and Goldman Sachs, serves as investment adviser pursuant to a management agreement with the Trust on behalf of the Global Income and World Bond Funds (the management agreements with GSAM and GSAMI are collectively referred to herein as the “Agreements”).
|
| 2. SIGNIFICANT ACCOUNTING POLICIES |
The financial statements have been prepared in accordance with accounting principles generally accepted in the United States of America (“GAAP”) and require management to make estimates and assumptions that may affect the reported amounts and disclosures. Actual results may differ from those estimates and assumptions.
A. Investment Valuation — The Funds’ valuation policy is to value investments at fair value.
B. Investment Income and Investments — Investment income includes interest income and dividend income, net of any foreign withholding taxes, less any amounts reclaimable. Interest income is accrued daily and adjusted for amortization of premiums and accretion of discounts. Dividend income is recognized on ex-dividend date or, for certain foreign securities, as soon as such information is obtained subsequent to the ex-dividend date. Investment transactions are reflected on trade date. Realized gains and losses are calculated using identified cost. Investment transactions are recorded on the following business day for daily net asset value (“NAV”) calculations. Any foreign capital gains tax is accrued daily based upon net unrealized gains, and is payable upon sale of such investments. Distributions received from the Funds’ investments in U.S. real estate investment trusts (“REITs”) may be characterized as ordinary income, net capital gain or a return of capital. A return of capital is recorded by the Funds as a reduction to the cost basis of the REIT.
For derivative contracts, realized gains and losses are recorded upon settlement of the contract. Upfront payments are made or received upon entering into a swap agreement and are reflected in the Statement of Assets and Liabilities. Upfront payments are recognized over the contract’s term/event as realized gains or losses, with the exception of forward starting interest rate swaps whose realized gains or losses are recognized from the effective start date. For securities with paydown provisions, principal payments received are treated as a proportionate reduction to the cost basis of the securities, and excess or shortfall amounts are
138
GOLDMAN SACHS MULTI SECTOR FIXED INCOME FUNDS
|
| 2. SIGNIFICANT ACCOUNTING POLICIES (continued) |
recorded as income. For treasury inflation protected securities (“TIPS”), adjustments to principal due to inflation/deflation are reflected as increases/decreases to interest income with a corresponding adjustment to cost.
C. Class Allocations and Expenses — Investment income, realized and unrealized gain (loss), and non-class specific expenses of each Fund are allocated daily based upon the proportion of net assets of each class. Class specific expenses, where applicable, are borne by the respective share classes and include Distribution and Service, Transfer Agent and Service and Shareholder Administration fees. Non-class specific expenses directly incurred by a Fund are charged to that Fund, while such expenses incurred by the Trust are allocated across the respective Funds on a straight-line and/or pro-rata basis depending upon the nature of the expenses.
D. Federal Taxes and Distributions to Shareholders — It is each Fund’s policy to comply with the requirements of the Internal Revenue Code of 1986, as amended (the “Code”), applicable to regulated investment companies (mutual funds) and to distribute each year substantially all of its investment company taxable income and capital gains to its shareholders. Accordingly, the Funds are not required to make any provisions for the payment of federal income tax. Distributions to shareholders are recorded on the ex-dividend date. Income distributions, if any, are declared daily and paid monthly, and capital gains distributions, if any, are declared and paid annually.
Net capital losses are carried forward to future fiscal years and may be used to the extent allowed by the Code to offset any future capital gains. Utilization of capital loss carryforwards will reduce the requirement of future capital gains distributions.
Under the Regulated Investment Company Modernization Act of 2010, the Funds are permitted to carry forward capital losses incurred in taxable years beginning after December 22, 2010 for an unlimited period. However, any losses incurred during those future taxable years will be required to be utilized prior to the losses incurred in pre-enactment taxable years. As a result of this ordering rule, pre-enactment capital loss carryforwards may be more likely to expire unused. Additionally, post-enactment capital losses that are carried forward will retain their character as either short-term or long-term capital losses rather than being considered all short-term as under previous law.
The characterization of distributions to shareholders for financial reporting purposes is determined in accordance with federal income tax rules, which may differ from GAAP. The source of each Fund’s distributions may be shown in the accompanying financial statements as either from net investment income, net realized gain or capital. Certain components of the Funds’ net assets on the Statements of Assets and Liabilities reflect permanent GAAP/tax differences based on the appropriate tax character.
E. Foreign Currency Translation — The accounting records and reporting currency of the Funds are maintained in U.S. dollars. Assets and liabilities denominated in foreign currencies are translated into U.S. dollars using the current exchange rates at the close of each business day. The effect of changes in foreign currency exchange rates on investments is included within net realized and unrealized gain (loss) on investments. Changes in the value of other assets and liabilities as a result of fluctuations in foreign exchange rates are included in the Statements of Operations within net change in unrealized gain (loss) on foreign currency transactions. Transactions denominated in foreign currencies are translated into U.S. dollars on the date the transaction occurred, the effects of which are included within net realized gain (loss) on foreign currency transactions.
|
| 3. INVESTMENTS AND FAIR VALUE MEASUREMENTS |
The fair value of a financial instrument is the amount that would be received to sell an asset or paid to transfer a liability in an orderly transaction between market participants at the measurement date (i.e., the exit price). GAAP establishes a fair value hierarchy that prioritizes the inputs to valuation techniques used to measure fair value. The hierarchy gives the highest priority to unadjusted quoted prices in active markets for identical assets or liabilities (Level 1 measurements) and the lowest priority to unobservable inputs (Level 3 measurements). The levels used for classifying investments are not necessarily an indication of the risk associated with investing in these investments. The three levels of the fair value hierarchy are described below:
Level 1 — Unadjusted quoted prices in active markets that are accessible at the measurement date for identical, unrestricted assets or liabilities;
139
GOLDMAN SACHS MULTI SECTOR FIXED INCOME FUNDS
Notes to Financial Statements (continued)
September 30, 2014 (Unaudited)
|
| 3. INVESTMENTS AND FAIR VALUE MEASUREMENTS (continued) |
Level 2 — Quoted prices in markets that are not active or financial instruments for which significant inputs are observable (including, but not limited to, quoted prices for similar investments, interest rates, foreign exchange rates, volatility and credit spreads), either directly or indirectly;
Level 3 — Prices or valuations that require significant unobservable inputs (including GSAM’s and GSAMI’s assumptions in determining fair value measurement).
The Trustees have adopted Valuation Procedures that govern the valuation of the portfolio investments held by the Funds, including investments for which market quotations are not readily available. The Trustees have delegated to GSAM and GSAMI day-to-day responsibility for implementing and maintaining internal controls and procedures related to the valuation of the Funds’ portfolio investments. To assess the continuing appropriateness of pricing sources and methodologies, GSAM and GSAMI regularly perform price verification procedures and issues challenges as necessary to third party pricing vendors or brokers, and any differences are reviewed in accordance with the Valuation Procedures.
A. Level 1 and Level 2 Fair Value Investments — The valuation techniques and significant inputs used in determining the fair values for investments classified as Level 1 and Level 2 are as follows:
Debt Securities — Debt securities for which market quotations are readily available are valued daily on the basis of quotations supplied by dealers or an independent pricing service approved by the Trustees. The pricing services may use valuation models or matrix pricing, which consider: (i) yield or price with respect to bonds that are considered comparable in characteristics such as rating, interest rate and maturity date or (ii) quotations from securities dealers to determine current value. Short-term debt obligations that mature in sixty days or less and that do not exhibit signs of credit deterioration are valued at amortized cost, which approximates fair value. With the exception of treasury securities of G8 countries (not held in money market funds), which are generally classified as Level 1, these investments are generally classified as Level 2 of the fair value hierarchy.
i. Inverse Floaters — The interest rate on inverse floating rate securities (“inverse floaters”) resets in the opposite direction from the market rate of interest to which the inverse floaters are indexed. An inverse floater may be considered to be leveraged to the extent that its interest rate varies by a magnitude that exceeds the magnitude of the change in the index rate of interest. The higher the degree of leverage of an inverse floater, the greater the volatility of its market value.
ii. Mortgage-Backed and Asset-Backed Securities — Mortgage-backed securities represent direct or indirect participations in, or are collateralized by and payable from, mortgage loans secured by residential and/or commercial real estate property. Asset-backed securities include securities whose principal and interest payments are collateralized by pools of other assets or receivables. The value of certain mortgage-backed and asset-backed securities (including adjustable rate mortgage loans) may be particularly sensitive to changes in prevailing interest rates. The value of these securities may also fluctuate in response to the market’s perception of the creditworthiness of the issuers.
Asset-backed securities may present credit risks that are not presented by mortgage-backed securities because they generally do not have the benefit of a security interest in collateral that is comparable to mortgage assets. Some asset-backed securities may only have a subordinated claim on collateral.
Stripped mortgage-backed securities are usually structured with two different classes: one that receives substantially all interest payments (interest-only, or “IO” and/or high coupon rate with relatively low principal amount, or “IOette”), and the other that receives substantially all principal payments (principal-only, or “PO”) from a pool of mortgage loans. Little to no principal will be received at the maturity of an IO; as a result, periodic adjustments are recorded to reduce the cost of the security until maturity. These adjustments are included in interest income.
iii. Mortgage Dollar Rolls — Mortgage dollar rolls are transactions whereby a Fund sells mortgage-backed-securities and simultaneously contracts with the same counterparty to repurchase similar securities on a specified future date. During the settlement period, a Fund will not be entitled to accrue interest and receive principal payments on the securities sold.
iv. Senior Term Loans — Senior term loans (“Loans”) are interests in amounts owed by corporate, governmental, or other borrowers to lenders or lending syndicates. Loans are arranged through private negotiations between the borrower and one or
140
GOLDMAN SACHS MULTI SECTOR FIXED INCOME FUNDS
|
| 3. INVESTMENTS AND FAIR VALUE MEASUREMENTS (continued) |
more financial institutions (“Lenders”). A Fund’s investments in Loans are in the form of either participations in Loans (“Participations”) or assignments of all or a portion of Loans from third parties (“Assignments”). With respect to Participations, a Fund has the right to receive payments of principal, interest and any fees to which it is entitled from the Lender selling the Participations and only upon receipt by the Lender of the payments from the borrower. A Fund generally has no right to enforce compliance by the borrower with the terms of the loan agreement with respect to Participations. Conversely, Assignments result in a Fund having a direct contractual relationship with the borrower, and the Fund may enforce compliance by the borrower with the terms of the loan agreement.
v. Structured Notes — The values of structured notes are based on the price movements of a reference security or index. Upon termination, a Fund will receive a payment from the issuer based on the value of the referenced instrument (notional amount multiplied by the price of the referenced instrument) and record a realized gain or loss.
vi. Treasury Inflation Protected Securities — TIPS are treasury securities in which the principal amount is adjusted daily to keep pace with inflation, as measured by the U.S. Consumer Pricing Index for Urban Consumers. The repayment of the original bond principal upon maturity is guaranteed by the full faith and credit of the U.S. Government.
vii. When-Issued Securities and Forward Commitments — When-issued securities, including TBA (“To Be Announced”) securities, are securities that are authorized but not yet issued in the market and purchased in order to secure what is considered to be an advantageous price or yield to a Fund. A forward commitment involves entering into a contract to purchase or sell securities, typically on an extended settlement basis, for a fixed price at a future date. The purchase of securities on a when-issued or forward commitment basis involves a risk of loss if the value of the security to be purchased declines before the settlement date. Conversely, the sale of securities on a forward commitment basis involves the risk that the value of the securities sold may increase before the settlement date. Although a Fund will generally purchase securities on a when-issued or forward commitment basis with the intention of acquiring the securities for its portfolio, the Fund may dispose of when-issued securities or forward commitments prior to settlement which may result in a realized gain or loss.
Equity Securities — Equity securities and investment companies traded on a United States (“U.S.”) securities exchange or the NASDAQ system, or those located on certain foreign exchanges, including but not limited to the Americas, are valued daily at their last sale price or official closing price on the principal exchange or system on which they are traded. If no sale occurs, equity securities and exchange traded investment companies are valued at the last bid price for long positions and at the last ask price for short positions. Investments in investment companies (other than those that are exchange traded) are valued at the NAV on the valuation date. To the extent these investments are actively traded, they are classified as Level 1 of the fair value hierarchy, otherwise they are generally classified as Level 2.
Unlisted equity securities for which market quotations are available are valued at the last sale price on the valuation date, or if no sale occurs, at the last bid price. Securities traded on certain foreign securities exchanges are valued daily at fair value determined by an independent fair value service (if available) under Valuation Procedures approved by the Trustees and consistent with applicable regulatory guidance. The independent fair value service takes into account multiple factors including, but not limited to, movements in the securities markets, certain depositary receipts, futures contracts and foreign currency exchange rates that have occurred subsequent to the close of the foreign securities exchange. These investments are generally classified as Level 2 of the fair value hierarchy.
Derivative Contracts — A derivative is an instrument whose value is derived from underlying assets, indices, reference rates or a combination of these factors.
Exchange-traded derivatives, including futures contracts, typically fall within Level 1 of the fair value hierarchy. Over-the-counter (“OTC”) and centrally cleared derivatives are valued using market transactions and other market evidence, including market-based inputs to models, calibration to market-clearing transactions, broker or dealer quotations, or other alternative pricing sources. Where models are used, the selection of a particular model to value OTC and centrally cleared derivatives depends upon the contractual terms of, and specific risks inherent in, the instrument, as well as the availability of pricing information in the market. Valuation models require a variety of inputs, including contractual terms, market prices, yield curves, credit curves,
141
GOLDMAN SACHS MULTI SECTOR FIXED INCOME FUNDS
Notes to Financial Statements (continued)
September 30, 2014 (Unaudited)
|
| 3. INVESTMENTS AND FAIR VALUE MEASUREMENTS (continued) |
measures of volatility, voluntary and involuntary prepayment rates, loss severity rates and correlations of such inputs. For OTC and centrally cleared derivatives that trade in liquid markets, model inputs can generally be verified and model selection does not involve significant management judgment. OTC and centrally cleared derivatives are classified within Level 2 of the fair value hierarchy when significant inputs are corroborated by market evidence.
i. Forward Contracts — A forward contract is a contract between two parties to buy or sell an asset at a specified price on a future date. A forward contract settlement can occur on a cash or delivery basis. Forward contracts are marked-to-market daily using counterparty prices, and the change in value, if any, is recorded as an unrealized gain or loss.
A forward foreign currency contract is a forward contract in which a Fund agrees to receive or deliver a fixed quantity of one currency for another, at a pre-determined price at a future date. All forward foreign currency exchange contracts are marked-to-market daily at the applicable forward rate. Non-deliverable forward foreign currency exchange contracts are settled with the counterparty in cash without the delivery of foreign currency.
A non-deliverable bond forward is a short term forward contract between two parties to buy or sell a bond denominated in a non-deliverable foreign currency at a specified future time and price. Non-deliverable bond forwards are marked-to-market daily using market quotations. Unrealized gains or losses on non-deliverable bond forwards are recorded by a Fund on a daily basis, and realized gains or losses are recorded on the termination date or sale of a contract.
ii. Futures Contracts — Futures contracts are contracts to buy or sell a standardized quantity of a specified commodity or security and are valued based on exchanged settlement prices or independent market quotes. Futures contracts are valued at the last settlement price, or in the absence of a sale, the last bid price for long positions and at the last ask price for short positions, at the end of each day on the board of trade or exchange upon which they are traded. Upon entering into a futures contract, a Fund deposits cash or securities in an account on behalf of the broker in an amount sufficient to meet the initial margin requirement. Subsequent payments are made or received by a Fund equal to the daily change in the contract value and are recorded as variation margin receivable or payable with a corresponding offset to unrealized gains or losses.
iii. Options — When a Fund writes call or put options, an amount equal to the premium received is recorded as a liability and is subsequently marked-to-market to reflect the current value of the option written. Swaptions are options on interest rate swap contracts.
Upon the purchase of a call option or a put option by a Fund, the premium paid is recorded as an investment and subsequently marked-to-market to reflect the current value of the option. Certain options may be purchased with premiums to be determined on a future date. The premiums for these options are based upon implied volatility parameters at specified terms.
iv. Swap Contracts — Bilateral swap contracts are agreements in which a Fund and a counterparty agree to exchange periodic payments on a specified notional amount or make a net payment upon termination. Bilateral swap transactions are privately negotiated in the OTC market and payments are settled through direct payments between a Fund and the counterparty. By contrast, certain swap transactions are subject to mandatory central clearing. These swaps are executed through a derivatives clearing member (“DCM”), acting in an agency capacity, and submitted to a central counterparty (“CCP”)(“centrally cleared swaps”), in which case all payments are settled with the CCP through the DCM. Swaps are marked-to-market daily using pricing vendor quotations, counterparty or clearinghouse prices or model prices, and the change in value, if any, is recorded as an unrealized gain or loss. Upon entering into a swap contract, a Fund is required to satisfy an initial margin requirement by delivering cash or securities to the counterparty (or in some cases, segregated in a triparty account on behalf of the counterparty), which can be adjusted by any mark-to-market gains or losses pursuant to bilateral or centrally cleared arrangements. For centrally cleared swaps the daily change in valuation, if any, is recorded as a receivable or payable for variation margin.
An interest rate swap is an agreement that obligates two parties to exchange a series of cash flows at specified intervals, based upon or calculated by reference to changes in interest rates on a specified notional principal amount. The payment flows are usually netted against each other, with the difference being paid by one party to the other.
142
GOLDMAN SACHS MULTI SECTOR FIXED INCOME FUNDS
|
| 3. INVESTMENTS AND FAIR VALUE MEASUREMENTS (continued) |
A credit default swap is an agreement that involves one party (the buyer of protection) making a stream of payments to another party (the seller of protection) in exchange for the right to receive protection on a reference security or obligation, including a group of assets or exposure to the performance of an index. A Fund’s investment in credit default swaps may involve greater risks than if the Fund had invested in the referenced obligation directly. Credit events are contract specific but may include bankruptcy, failure to pay, restructuring and obligation acceleration. If a Fund buys protection through a credit default swap and no credit event occurs, its payments are limited to the periodic payments previously made to the counterparty. Upon the occurrence of a specified credit event, a Fund, as a buyer of credit protection, is entitled to receive an amount equal to the notional amount of the swap and deliver to the seller the defaulted reference obligation in a physically settled trade. A Fund may also receive a net settlement amount in the form of cash or securities equal to the notional amount of the swap reduced by the recovery value of the reference obligation in cash settled trade.
As a seller of protection, a Fund generally receives a payment stream throughout the term of the swap, provided that there is no credit event. In addition, if a Fund sells protection through a credit default swap, a Fund could suffer a loss because the value of the referenced obligation and the premium payments received may be less than the notional amount of the swap paid to the buyer of protection. Upon the occurrence of a specified credit event, a Fund, as a seller of credit protection, may be required to take possession of the defaulted reference obligation and pay the buyer an amount equal to the notional amount of the swap in a physically settled trade. A Fund may also pay a net settlement amount in the form of cash or securities equal to the notional amount of the swap reduced by the recovery value of the reference obligation in cash settled trade. Recovery values are at times established through the credit event auction process in which market participants are ensured that a transparent price has been set for the defaulted security or obligation. In addition, a Fund is entitled to a return of any assets, which have been pledged as collateral to the counterparty.
The maximum potential amount of future payments (undiscounted) that a Fund as seller of protection could be required to make under a credit default swap would be an amount equal to the notional amount of the agreement. These potential amounts would be partially offset by any recovery values of the respective referenced obligations or net amounts received from a settlement of a credit default swap for the same reference security or obligation where a Fund bought credit protection.
A total return swap is an agreement that gives a Fund the right to receive the appreciation in the value of a specified security, index or other instrument in return for a fee paid to the counterparty, which will typically be an agreed upon interest rate. If the underlying asset declines in value over the term of the swap, a Fund may also be required to pay the dollar value of that decline to the counterparty.
Short Term Investments — Short-term investments having a maturity of 60 days or less are generally valued at amortized cost which approximates fair market value. These investments are classified as Level 2 of the fair value hierarchy.
i. Repurchase Agreements — Repurchase agreements involve the purchase of securities subject to the seller’s agreement to repurchase the securities at a mutually agreed upon date and price, under the terms of a Master Repurchase Agreement (“MRA”). During the term of a repurchase agreement, the value of the underlying securities held as collateral on behalf of a Fund, including accrued interest, is required to exceed the value of the repurchase agreement, including accrued interest. The gross value of repurchase agreements is included in the Statements of Assets and Liabilities for financial reporting purposes. The underlying securities for all repurchase agreements are held at the Funds’ custodian or designated sub-custodians under tri-party repurchase agreements.
An MRA governs transactions between a Fund and select counterparties. An MRA contains provisions for, among other things, initiation, income payments, events of default and maintenance of securities for repurchase agreements. A MRA also permits offsetting with collateral to create one single net payment in the event of default or similar events, including the bankruptcy or insolvency of a counterparty.
If the seller defaults, a Fund could suffer a loss to the extent that the proceeds from the sale of the underlying securities and other collateral held by the Fund are less than the repurchase price and the Fund’s costs associated with delay and enforcement of the repurchase agreement. In addition, in the event of default or insolvency of the seller, a court could determine that a Fund’s interest in the collateral is not enforceable, resulting in additional losses to the Fund.
143
GOLDMAN SACHS MULTI SECTOR FIXED INCOME FUNDS
Notes to Financial Statements (continued)
September 30, 2014 (Unaudited)
|
| 3. INVESTMENTS AND FAIR VALUE MEASUREMENTS (continued) |
Pursuant to exemptive relief granted by the Securities and Exchange Commission (“SEC”) and terms and conditions contained therein, the Funds, together with other funds of the Trust and registered investment companies having management agreements with GSAM or its affiliates, may transfer uninvested cash into joint accounts, the daily aggregate balance of which is invested in one or more repurchase agreements. Under these joint accounts, the Funds maintain pro-rata credit exposure to the underlying repurchase agreements’ counterparties. With the exception of certain transaction fees, the Funds are not subject to any expenses in relation to these investments.
B. Level 3 Fair Value Investments — To the extent that the aforementioned significant inputs are unobservable, or if quotations are not readily available, or if GSAM and GSAMI believe that such quotations do not accurately reflect fair value, the fair value of the Funds’ investments may be determined under Valuation Procedures approved by the Trustees. GSAM and GSAMI, consistent with its procedures and applicable regulatory guidance, may make an adjustment to the most recent valuation prices of either domestic or foreign securities in light of significant events to reflect what it believes to be the fair value of the securities at the time of determining a Fund’s NAV. Significant events which could affect a large number of securities in a particular market may include, but are not limited to: significant fluctuations in U.S. or foreign markets; market dislocations; market disruptions; or unscheduled market closings. Significant events which could also affect a single issuer may include, but are not limited to: corporate actions such as reorganizations, mergers and buy-outs; ratings downgrades; and bankruptcies.
C. Fair Value Hierarchy — The following is a summary of the Funds’ investments and derivatives classified in the fair value hierarchy as of September 30, 2014:
| | | | | | | | | | | | |
| | | |
| BOND | | | | | | | | | | | | |
| | | |
| Investment Type | | Level 1 | | | Level 2 | | | Level 3 | |
| Assets | | | | | | | | | | | | |
Fixed Income | | | | | | | | | | | | |
Corporate Obligations | | $ | — | | | $ | 61,238,639 | | | $ | — | |
Mortgage-Backed Obligations | | | — | | | | 66,953,798 | | | | — | |
U.S. Treasury Obligations and/or Other U.S. Government Agencies | | | 45,208,774 | | | | 8,716,198 | | | | — | |
Asset-Backed Securities | | | — | | | | 24,293,527 | | | | — | |
Foreign Debt Obligations | | | 1,864,272 | | | | 6,350,460 | | | | — | |
Structured Note | | | — | | | | 1,606,358 | | | | — | |
Municipal Debt Obligations | | | — | | | | 4,094,549 | | | | — | |
Government Guarantee Obligations | | | — | | | | 5,277,672 | | | | — | |
Short-term Investments | | | — | | | | 18,600,000 | | | | — | |
| Total | | $ | 47,073,046 | | | $ | 197,131,201 | | | $ | — | |
| Liabilities | | | | | | | | | | | | |
Fixed Income | | | | | | | | | | | | |
Mortgage-Backed Obligations — Forward Sales Contracts | | $ | — | | | $ | (8,869,922 | ) | | $ | — | |
| | | |
| Derivative Type | | | | | | | | | |
| Assets | | | | | | | | | | | | |
Options Purchased | | $ | — | | | $ | 4,035,050 | | | $ | — | |
Forward Foreign Currency Exchange Contracts(a) | | | — | | | | 1,317,100 | | | | — | |
Futures Contracts(a) | | | 246,837 | | | | — | | | | — | |
Interest Rate Swap Contracts(a) | | | — | | | | 1,107,842 | | | | — | |
Credit Default Swap Contracts(a) | | | — | | | | 32,173 | | | | — | |
| Total | | $ | 246,837 | | | $ | 6,492,165 | | | $ | — | |
144
GOLDMAN SACHS MULTI SECTOR FIXED INCOME FUNDS
|
| 3. INVESTMENTS AND FAIR VALUE MEASUREMENTS (continued) |
| | | | | | | | | | | | |
| | | |
| BOND (continued) | | | | | | | | | | | | |
| | | |
| Derivative Type | | Level 1 | | | Level 2 | | | Level 3 | |
| Liabilities(a) | | | | | | | | | | | | |
Forward Foreign Currency Exchange Contracts | | $ | — | | | $ | (793,692 | ) | | $ | — | |
Futures Contracts | | | (210,365 | ) | | | — | | | | — | |
Interest Rate Swap Contracts | | | — | | | | (877,944 | ) | | | — | |
Credit Default Swap Contracts | | | — | | | | (45,417 | ) | | | — | |
| Total | | $ | (210,365 | ) | | $ | (1,717,053 | ) | | $ | — | |
| | | |
| CORE FIXED INCOME | | | | | | | | | | | | |
| | | |
| Investment Type | | Level 1 | | | Level 2 | | | Level 3 | |
| Assets | | | | | | | | | | | | |
Fixed Income | | | | | | | | | | | | |
Corporate Obligations | | $ | — | | | $ | 325,407,566 | | | $ | — | |
Mortgage-Backed Obligations | | | — | | | | 339,290,384 | | | | — | |
U.S. Treasury Obligations and/or Other U.S. Government Agencies | | | 258,626,523 | | | | 48,395,304 | | | | — | |
Asset-Backed Securities | | | — | | | | 68,126,515 | | | | — | |
Foreign Debt Obligations | | | 4,274,588 | | | | 17,524,263 | | | | — | |
Municipal Debt Obligations | | | — | | | | 9,323,206 | | | | — | |
Government Guarantee Obligations | | | — | | | | 27,441,498 | | | | — | |
Short-term Investments | | | — | | | | 43,300,000 | | | | — | |
| Total | | $ | 262,901,111 | | | $ | 878,808,736 | | | $ | — | |
| Liabilities | | | | | | | | | | | | |
Fixed Income | | | | | | | | | | | | |
Mortgage-Backed Obligations — Forward Sales Contracts | | $ | — | | | $ | (39,421,876 | ) | | $ | — | |
| | | |
| Derivative Type | | | | | | | | | |
| Assets | | | | | | | | | | | | |
Options Purchased | | $ | — | | | $ | 6,896,054 | | | $ | — | |
Forward Foreign Currency Exchange Contracts(a) | | | — | | | | 2,891,589 | | | | — | |
Futures Contracts(a) | | | 495,654 | | | | — | | | | — | |
Interest Rate Swap Contracts(a) | | | — | | | | 1,774,653 | | | | — | |
Credit Default Swap Contracts(a) | | | — | | | | 52,311 | | | | — | |
| Total | | $ | 495,654 | | | $ | 11,614,607 | | | $ | — | |
| Liabilities(a) | | | | | | | | | | | | |
Forward Foreign Currency Exchange Contracts | | $ | — | | | $ | (2,138,295 | ) | | $ | — | |
Futures Contracts | | | (238,255 | ) | | | — | | | | — | |
Interest Rate Swap Contracts | | | — | | | | (802,287 | ) | | | — | |
Credit Default Swap Contracts | | | — | | | | (37,197 | ) | | | — | |
| Total | | $ | (238,255 | ) | | $ | (2,977,779 | ) | | $ | — | |
145
GOLDMAN SACHS MULTI SECTOR FIXED INCOME FUNDS
Notes to Financial Statements (continued)
September 30, 2014 (Unaudited)
|
| 3. INVESTMENTS AND FAIR VALUE MEASUREMENTS (continued) |
| | | | | | | | | | | | |
| | | |
| GLOBAL INCOME | | | | | | | | | | | | |
| | | |
| Investment Type | | Level 1 | | | Level 2 | | | Level 3 | |
| Assets | | | | | | | | | | | | |
Fixed Income | | | | | | | | | | | | |
Foreign Sovereign Debt Obligations | | $ | 137,974,233 | | | $ | 45,549,764 | | | $ | — | |
Corporate Obligations | | | — | | | | 96,026,784 | | | | — | |
Foreign Debt Obligations | | | — | | | | 12,557,963 | | | | — | |
Asset-Backed Securities | | | — | | | | 39,979,986 | | | | — | |
Mortgage-Backed Obligations | | | — | | | | 86,932,965 | | | | — | |
U.S. Treasury Obligations and/or Other U.S. Government Agencies | | | 19,813,636 | | | | 3,334,058 | | | | — | |
Government Guarantee Obligations | | | — | | | | 10,951,632 | | | | — | |
Short-term Investments | | | — | | | | 3,900,000 | | | | — | |
| Total | | $ | 157,787,869 | | | $ | 299,233,152 | | | $ | — | |
| Liabilities | | | | | | | | | | | | |
Fixed Income | | | | | | | | | | | | |
Mortgage-Backed Obligations — Forward Sales Contracts | | $ | — | | | $ | (10,841,016 | ) | | $ | — | |
| | | |
| Derivative Type | | | | | | | | | |
| Assets | | | | | | | | | | | | |
Options Purchased | | $ | — | | | $ | 2,579,797 | | | $ | — | |
Forward Foreign Currency Exchange Contracts(a) | | | — | | | | 7,362,214 | | | | — | |
Futures Contracts(a) | | | 416,275 | | | | — | | | | — | |
Interest Rate Swap Contracts(a) | | | — | | | | 3,810,583 | | | | — | |
Credit Default Swap Contracts(a) | | | — | | | | 105,996 | | | | — | |
| Total | | $ | 416,275 | | | $ | 13,858,590 | | | $ | — | |
| Liabilities | | | | | | | | | | | | |
Forward Foreign Currency Exchange Contracts(a) | | $ | — | | | $ | (2,310,202 | ) | | $ | — | |
Futures Contracts(a) | | | (162,968 | ) | | | — | | | | — | |
Interest Rate Swap Contracts(a) | | | — | | | | (1,639,969 | ) | | | — | |
Credit Default Swap Contracts(a) | | | — | | | | (8,328 | ) | | | — | |
Written Options Contracts | | | — | | | | (71,430 | ) | | | — | |
| Total | | $ | (162,968 | ) | | $ | (4,029,929 | ) | | $ | — | |
146
GOLDMAN SACHS MULTI SECTOR FIXED INCOME FUNDS
|
| 3. INVESTMENTS AND FAIR VALUE MEASUREMENTS (continued) |
| | | | | | | | | | | | |
| | | |
| STRATEGIC INCOME | | | | | | | | | | | | |
| | | |
| Investment Type | | Level 1 | | | Level 2 | | | Level 3 | |
| Assets | | | | | | | | | | | | |
Fixed Income | | | | | | | | | | | | |
Corporate Obligations | | $ | — | | | $ | 3,040,567,035 | | | $ | — | |
Mortgage-Backed Obligations | | | — | | | | 3,700,547,373 | | | | — | |
U.S. Treasury Obligations and/or Other U.S. Government Agencies | | | 5,394,097,120 | | | | 3,081,625,560 | | | | — | |
Asset-Backed Securities | | | — | | | | 3,518,897,443 | | | | — | |
Foreign Debt Obligations | | | 1,371,326,226 | | | | 1,677,305,002 | | | | — | |
Structured Note | | | — | | | | 7,297,175 | | | | — | |
Municipal Debt Obligations | | | — | | | | 625,506,351 | | | | — | |
Government Guarantee Obligation | | | — | | | | 252,243,168 | | | | — | |
Senior Term Loans | | | — | | | | 556,644,694 | | | | 136,025,000 | |
Preferred Stocks(b) | | | | | | | | | | | | |
Europe | | | — | | | | 11,466,343 | | | | — | |
North America | | | — | | | | 128,129,826 | | | | — | |
Short-term Investments | | | — | | | | 1,269,700,000 | | | | — | |
| Total | | $ | 6,765,423,346 | | | $ | 17,869,929,970 | | | $ | 136,025,000 | |
| Liabilities | | | | | | | | | | | | |
Fixed Income | | | | | | | | | | | | |
Mortgage-Backed Obligations — Forward Sales Contracts | | $ | — | | | $ | (143,889,847 | ) | | $ | — | |
| | | |
| Derivative Type | | | | | | | | | |
| Assets | | | | | | | | | | | | |
Options Purchased | | $ | — | | | $ | 711,064,193 | | | $ | — | |
Forward Foreign Currency Exchange Contracts(a) | | | — | | | | 500,327,286 | | | | — | |
Futures Contracts(a) | | | 50,259,924 | | | | — | | | | — | |
Interest Rate Swap Contracts(a) | | | — | | | | 271,442,941 | | | | — | |
Credit Default Swap Contracts(a) | | | — | | | | 418,491 | | | | — | |
Total Return Swap Contracts(a) | | | — | | | | 2,566,966 | | | | — | |
| Total | | $ | 50,259,924 | | | $ | 1,485,819,877 | | | $ | — | |
| Liabilities(a) | | | | | | | | | | | | |
Forward Foreign Currency Exchange Contracts | | $ | — | | | $ | (303,668,250 | ) | | $ | — | |
Futures Contracts | | | (29,018,247 | ) | | | — | | | | — | |
Interest Rate Swap Contracts | | | — | | | | (215,494,290 | ) | | | — | |
Credit Default Swap Contracts | | | — | | | | (15,207,489 | ) | | | — | |
Total Return Swap Contracts | | | — | | | | (1,835,197 | ) | | | — | |
| Total | | $ | (29,018,247 | ) | | $ | (536,205,226 | ) | | $ | — | |
147
GOLDMAN SACHS MULTI SECTOR FIXED INCOME FUNDS
Notes to Financial Statements (continued)
September 30, 2014 (Unaudited)
|
| 3. INVESTMENTS AND FAIR VALUE MEASUREMENTS (continued) |
| | | | | | | | | | | | |
| | | |
| WORLD BOND | | | | | | | | | | | | |
| | | |
| Investment Type | | Level 1 | | | Level 2 | | | Level 3 | |
| Assets | | | | | | | | | | | | |
Fixed Income | | | | | | | | | | | | |
Foreign Sovereign Debt Obligations | | $ | 3,900,634 | | | $ | 4,554,839 | | | $ | — | |
Structured Notes | | | — | | | | 162,898 | | | | — | |
U.S. Treasury Obligations | | | 2,760,730 | | | | — | | | | — | |
Short-term Investments | | | — | | | | 400,000 | | | | — | |
| Total | | $ | 6,661,364 | | | $ | 5,117,737 | | | $ | — | |
| | | |
| Derivative Type | | | | | | | | | |
| Assets(a) | | | | | | | | | | | | |
Forward Foreign Currency Exchange Contracts | | $ | — | | | $ | 197,856 | | | $ | — | |
Futures Contracts | | | 22,523 | | | | — | | | | — | |
Interest Rate Swap Contracts | | | — | | | | 55,494 | | | | — | |
| Total | | $ | 22,523 | | | $ | 253,350 | | | $ | — | |
| Liabilities(a) | | | | | | | | | | | | |
Forward Foreign Currency Exchange Contracts | | $ | — | | | $ | (159,899 | ) | | $ | — | |
Futures Contracts | | | (10,790 | ) | | | — | | | | — | |
Interest Rate Swap Contracts | | | — | | | | (117,650 | ) | | | — | |
| Total | | $ | (10,790 | ) | | $ | (277,549 | ) | | $ | — | |
| (a) | | Amount shown represents unrealized gain (loss) at period end. |
| (b) | | Amounts are disclosed by continent to highlight the impact of time zone differences between local market close and the calculation of net asset value. Security valuations are based on the principle exchange or system on which they are traded, which may differ from country of domicile. The Fund(s) utilize(s) fair value model prices provided by an independent fair value service for international equities, resulting in a Level 2 classification. |
For further information regarding security characteristics, see the Schedules of Investments.
148
GOLDMAN SACHS MULTI SECTOR FIXED INCOME FUNDS
|
| 4. INVESTMENTS IN DERIVATIVES |
The following tables set forth, by certain risk types, the gross value of derivative contracts as of September 30, 2014. These instruments were used to meet the Funds’ investment objectives and to obtain and/or manage exposure related to the risks below. The values in the tables below exclude the effects of cash collateral received or posted pursuant to these derivative contracts, and therefore are not representative of the Funds’ net exposure.
| | | | | | | | | | | | |
| | | | |
| Bond | | | | | | | | | | | | |
| Risk | | Statements of Assets
and Liabilities | | Assets | | | Statements of Assets
and Liabilities | | Liabilities | |
Interest rate | | Receivable for unrealized gain on swap contracts; Variation margin on certain derivative contracts; Investments, at value | | $ | 5,389,729 | (a) | | Payable for unrealized loss on swap contracts; Variation margin on certain derivative contracts | | $ | (1,088,309) | (a)(b) |
Credit | | Receivable for unrealized gain on swap contracts; Variation margin on certain derivative contracts | | | 32,173 | (a) | | Payable for unrealized loss on swap contracts | | | (45,417) | (a)(b) |
Currency | | Receivable for unrealized gain on forward foreign currency exchange contracts | | | 1,317,100 | | | Payable for unrealized loss on forward foreign currency exchange contracts | | | (793,692) | |
| Total | | | | $ | 6,739,002 | | | | | $ | (1,927,418) | |
| | | |
| Core Fixed Income | | | | | | | | | | |
| Risk | | Statements of Assets
and Liabilities | | Assets | | | Statements of Assets
and Liabilities | | Liabilities | |
Interest rate | | Variation margin on certain derivative contracts; Investments, at value | | $ | 9,166,361 | (a) | | Variation margin on certain derivative contracts | | $ | (1,040,542) | (a) |
Credit | | Receivable for unrealized gain on swap contracts | | | 52,311 | | | Variation margin on certain derivative contracts | | | (37,197) | |
Currency | | Receivable for unrealized gain on forward foreign currency exchange contracts | | | 2,891,589 | | | Payable for unrealized loss on forward foreign currency exchange contracts | | | (2,138,295) | |
| Total | | | | $ | 12,110,261 | | | | | $ | (3,216,034) | |
| | | |
| Global Income | | | | | | | | | | |
| Risk | | Statements of Assets
and Liabilities | | Assets | | | Statements of Assets
and Liabilities | | Liabilities | |
Interest rate | | Receivable for unrealized gain on swap contracts; Variation margin on certain derivative contracts; Investments, at value | | $ | 6,628,223 | (a) | | Variation margin on certain derivative contracts | | $ | (1,802,937) | (a) |
Credit | | Receivable for unrealized gain on swap contracts | | | 105,996 | | | Variation margin on certain derivative contracts | | | (8,328) | |
Currency | | Receivable for unrealized gain on forward foreign currency exchange contracts; Investments, at value | | | 7,540,646 | | | Payable for unrealized loss on forward foreign currency exchange contracts; Written options, at value | | | (2,381,632) | |
| Total | | | | $ | 14,274,865 | | | | | $ | (4,192,897) | |
149
GOLDMAN SACHS MULTI SECTOR FIXED INCOME FUNDS
Notes to Financial Statements (continued)
September 30, 2014 (Unaudited)
|
| 4. INVESTMENTS IN DERIVATIVES (continued) |
| | | | | | | | | | | | |
| | | |
| Strategic Income | | | | | | | | | | |
| Risk | | Statements of Assets
and Liabilities | | Assets | | | Statements of Assets
and Liabilities | | Liabilities | |
Interest rate | | Receivable for unrealized gain on swap contracts; Variation margin on certain derivative contracts; Investments, at value | | $ | 1,035,334,024 | (a) | | Payable for unrealized loss on swap contracts; Variation margin on certain derivative contracts | | $ | (246,347,734) | (a)(b) |
Credit | | Receivable for unrealized gain on swap contracts | | | 418,491 | | | Payable for unrealized loss on swap contracts; Variation margin on certain derivative contracts | | | (15,207,489) | (b) |
Currency | | Receivable for unrealized gain on forward foreign currency exchange contracts | | | 500,327,286 | | | Payable for unrealized loss on forward foreign currency exchange contracts | | | (303,668,250) | |
| Total | | | | $ | 1,536,079,801 | | | | | $ | (565,223,473) | |
| | | |
| World Bond | | | | | | | | | | |
| Risk | | Statements of Assets
and Liabilities | | Assets | | | Statements of Assets
and Liabilities | | Liabilities | |
Interest rate | | Receivable for unrealized gain on swap contracts; Variation margin on certain derivative contracts | | $ | 78,017 | (a) | | Payable for unrealized loss on swap contracts; Variation margin on certain derivative contracts | | $ | (128,440) | (a)(b) |
Currency | | Receivable for unrealized gain on forward foreign currency exchange contracts | | | 197,856 | | | Payable for unrealized loss on forward foreign currency exchange contracts | | | (159,899) | |
| Total | | | | $ | 275,873 | | | | | $ | (288,339) | |
| (a) | | Includes unrealized gain (loss) on futures contracts and centrally cleared swaps described in the Additional Investment Information sections of the Schedules of Investments. Only current day’s variation margin is reported within the Statements of Assets and Liabilities. |
| (b) | | Aggregate of amounts include $335,711, $83,266,488 and $42,579 for Bond, Strategic Income and World Bond Funds, respectively, which represent the payments to be made pursuant to bilateral agreements should counterparties exercise their “right to terminate” provisions based on, among others, the Funds’ performance, their failure to pay on their obligations or failure to pledge collateral. Such amounts do not include incremental charges directly associated with the close-out of the agreements. They also do not reflect the fair value of any assets pledged as collateral which, through the daily margining process, substantially offsets the aforementioned amounts and for which the Funds are entitled to a full return. |
150
GOLDMAN SACHS MULTI SECTOR FIXED INCOME FUNDS
|
| 4. INVESTMENTS IN DERIVATIVES (continued) |
The following tables set forth, by certain risk types, the Funds’ gains (losses) related to these derivatives and their indicative volumes for the six months ended September 30, 2014. These gains (losses) should be considered in the context that these derivative contracts may have been executed to create investment opportunities and/or economically hedge certain investments, and accordingly, certain gains (losses) on such derivative contracts may offset certain (losses) gains attributable to investments. These gains (losses) are included in “Net realized gain (loss)” or “Net change in unrealized gain (loss)” on the Statements of Operations:
| | | | | | | | | | | | | | |
| | | | |
| Bond | | | | | | | | | | | | | | |
| Risk | | Statements of Operations | | Net Realized
Gain (Loss) | | | Net Change in
Unrealized
Gain (Loss) | | | Average
Number of
Contracts(a) | |
| Interest rate | | Net realized gain (loss) from futures contracts and swap contracts/Net change in unrealized gain (loss) on investments, futures contracts and swap contracts | | $ | (41,483 | ) | | $ | (101,542 | ) | | | 1,546 | |
| Credit | | Net realized gain (loss) from swap contracts/Net change in unrealized gain (loss) on swap contracts | | | 1,351 | | | | (99,528 | ) | | | 42 | |
| Currency | | Net realized gain (loss) from forward foreign currency exchange contracts/Net change in unrealized gain (loss) on forward foreign currency exchange contracts | | | 517,391 | | | | 643,881 | | | | 328 | |
| Total | | | | $ | 477,259 | | | $ | 442,811 | | | | 1,916 | |
| | | |
| Core Fixed Income | | | | | | | | | | | | |
| Risk | | Statements of Operations | | Net Realized
Gain (Loss) | | | Net Change in
Unrealized
Gain (Loss) | | | Average
Number of
Contracts(a) | |
| Interest rate | | Net realized gain (loss) from futures contracts and swap contracts/Net change in unrealized gain (loss) on investments, futures contracts and swap contracts | | $ | (1,848,102 | ) | | $ | 486,903 | | | | 3,205 | |
| Credit | | Net realized gain (loss) from swap contracts/Net change in unrealized gain (loss) on swap contracts | | | 315,464 | | | | (637,164 | ) | | | 5 | |
| Currency | | Net realized gain (loss) from forward foreign currency exchange contracts/Net change in unrealized gain (loss) on forward foreign currency exchange contracts | | | 1,887,812 | | | | 776,686 | | | | 154 | |
| Total | | | | $ | 355,174 | | | $ | 626,425 | | | | 3,364 | |
| | | |
| Global Income | | | | | | | | | | | | |
| Risk | | Statements of Operations | | Net Realized
Gain (Loss) | | | Net Change in
Unrealized
Gain (Loss) | | | Average
Number of
Contracts(a) | |
| Interest rate | | Net realized gain (loss) from futures contracts and swap contracts/Net change in unrealized gain (loss) on investments, futures contracts and swap contracts | | $ | (880,306 | ) | | $ | 487,692 | | | | 2,066 | |
| Credit | | Net realized gain (loss) from swap contracts/Net change in unrealized gain (loss) on swap contracts | | | 328,272 | | | | (307,967 | ) | | | 5 | |
| Currency | | Net realized gain (loss) from investments, written options and forward foreign currency exchange contracts/Net change in unrealized gain (loss) on investments, written options and forward foreign currency exchange contracts | | | 14,772,254 | | | | 3,840,270 | | | | 396 | |
| Total | | | | $ | 14,220,220 | | | $ | 4,019,995 | | | | 2,467 | |
151
GOLDMAN SACHS MULTI SECTOR FIXED INCOME FUNDS
Notes to Financial Statements (continued)
September 30, 2014 (Unaudited)
|
| 4. INVESTMENTS IN DERIVATIVES (continued) |
| | | | | | | | | | | | | | |
| | | |
| Strategic Income | | | | | | | | | | | | |
| Risk | | Statements of Operations | | Net Realized
Gain (Loss) | | | Net Change in
Unrealized
Gain (Loss) | | | Average
Number of
Contracts(a) | |
| Interest rate | | Net realized gain (loss) from investments, futures contracts and swap contracts/Net change in unrealized gain (loss) on investments, futures contracts and swap contracts | | $ | (678,216,894 | ) | | $ | 9,270,214 | | | | 136,958 | |
| Credit | | Net realized gain (loss) from swap contracts/Net change in unrealized gain (loss) on swap contracts | | | (23,921,115 | ) | | | (9,498,289 | ) | | | 49 | |
| Currency | | Net realized gain (loss) from forward foreign currency exchange contracts/Net change in unrealized gain (loss) on forward foreign currency exchange contracts | | | 403,636,048 | | | | 200,924,737 | | | | 20,627 | |
| Total | | | | $ | (298,501,961 | ) | | $ | 200,696,662 | | | | 157,634 | |
| | | |
| World Bond | | | | | | | | | | | | |
| Risk | | Statements of Operations | | Net Realized
Gain (Loss) | | | Net Change in
Unrealized
Gain (Loss) | | | Average
Number of
Contracts(a) | |
| Interest rate | | Net realized gain (loss) from futures contracts and swap contracts/Net change in unrealized gain (loss) on futures contracts and swap contracts | | $ | (87,066 | ) | | $ | 5,379 | | | | 156 | |
| Currency | | Net realized gain (loss) from forward foreign currency exchange contracts/Net change in unrealized gain (loss) on forward foreign currency exchange contracts | | | 141,091 | | | | 32,984 | | | | 370 | |
| Total | | | | $ | 54,025 | | | $ | 38,363 | | | | 526 | |
| (a) | | Average number of contracts is based on the average of month end balances for the six months ended September 30, 2014. |
In order to better define its contractual rights and to secure rights that will help a Fund mitigate its counterparty risk, a Fund may enter into an International Swaps and Derivatives Association, Inc. Master Agreement (“ISDA Master Agreement”) or similar agreement with its derivatives counterparties. An ISDA Master Agreement is a bilateral agreement between a Fund and a counterparty that governs OTC derivatives, including foreign exchange contracts, and typically contains, among other things, collateral posting terms and netting provisions in the event of a default and/or termination event. The provisions of the ISDA Master Agreement typically permit a single net payment in the event of a default (close-out netting) or similar event, including the bankruptcy or insolvency of the counterparty.
Collateral and margin requirements differ between exchange traded derivatives and OTC derivatives. Margin requirements are established by the broker or clearing house for exchange-traded and centrally cleared derivatives (financial futures contracts, options and centrally cleared swaps) pursuant to governing agreements for those instrument types. Brokers can ask for margin in excess of the minimum in certain circumstances. Collateral terms are contract-specific for OTC derivatives (foreign currency exchange contracts, and certain options and swaps). For derivatives traded under an ISDA Master Agreement, the collateral requirements are typically calculated by netting the marked to market amount for each transaction under such agreement and comparing that amount to the value of any collateral currently pledged by a Fund and the counterparty. Additionally, a Fund may be required to post initial margin to the counterparty, the terms of which would be outlined in the confirmation of the OTC transaction.
For financial reporting purposes, cash collateral that has been pledged to cover obligations of a Fund and cash collateral received from the counterparty, if any, is reported separately on the Statements of Assets and Liabilities as receivables/payables for collateral on certain derivative contracts. Non-cash collateral pledged by a Fund, if any, is noted in the Schedules of Investments. Generally, the amount of collateral due from or to a counterparty must exceed a minimum transfer amount threshold before a transfer is required to be made. To the extent amounts due to a Fund from its counterparties are not fully collateralized,
152
GOLDMAN SACHS MULTI SECTOR FIXED INCOME FUNDS
|
| 4. INVESTMENTS IN DERIVATIVES (continued) |
contractually or otherwise, the Fund bears the risk of loss from counterparty nonperformance. A Fund attempts to mitigate counterparty risk by only entering into agreements with counterparties that it believes to be of good standing and by monitoring the financial stability of those counterparties.
Additionally, the netting of assets and liabilities and the offsetting of collateral pledged or received are based on contractual netting/set-off provisions in the ISDA Master Agreement or similar agreements. However, in the event of a default or insolvency of a counterparty, a court could determine that such rights are not enforceable due the restrictions or prohibitions against the right of setoff that may be imposed due to a particular jurisdiction’s bankruptcy or insolvency laws.
The following tables set forth the Funds’ net exposure for derivative instruments that are subject to enforceable master netting arrangements or similar agreements as of September 30, 2014:
| | | | | | | | | | | | | | | | | | | | | | | | | | | | | | | | | | | | | | | | |
| | | | | | | | | | |
| Bond | | | | | | | | | | | | | | | | | | | | | | | | | | | | | | | | | | | | | | | | |
| | | Derivative Assets(1) | | | Derivative Liabilities(1) | | | | | | | |
| Counterparty | | Options
Purchased | | | Swaps | | | Forward
Currency
Contracts | | | Total | | | Swaps | | | Forward
Currency
Contracts | | | Total | | | Net Derivative
Asset
(Liabilities) | | | Collateral
(Received)
Pledged(1) | | | Net
Amount(2) | |
Bank of America Securities LLC | | $ | 192,966 | | | $ | 31,913 | | | $ | 233,120 | | | $ | 457,999 | | | $ | (3,455 | ) | | $ | (29,606 | ) | | $ | (33,061 | ) | | $ | 424,938 | | | $ | (40,003 | ) | | $ | 384,935 | |
Barclays Bank PLC | | | — | | | | — | | | | 122,117 | | | | 122,117 | | | | (3,574 | ) | | | (48,020 | ) | | | (51,594 | ) | | | 70,523 | | | | — | | | | 70,523 | |
BNP Paribas SA | | | — | | | | — | | | | 60,238 | | | | 60,238 | | | | — | | | | (36,942 | ) | | | (36,942 | ) | | | 23,296 | | | | — | | | | 23,296 | |
Citibank NA | | | 172,463 | | | | 586 | | | | — | | | | 173,049 | | | | (203,400 | ) | | | — | | | | (203,400 | ) | | | (30,351 | ) | | | 30,351 | | | | — | |
Citibank NA (London) | | | — | | | | — | | | | 85,400 | | | | 85,400 | | | | — | | | | (46,113 | ) | | | (46,113 | ) | | | 39,287 | | | | — | | | | 39,287 | |
Credit Suisse International (London) | | | — | | | | — | | | | 27,946 | | | | 27,946 | | | | — | | | | (28,096 | ) | | | (28,096 | ) | | | (150 | ) | | | — | | | | (150 | ) |
Deutsche Bank AG (London) | | | — | | | | — | | | | 102,478 | | | | 102,478 | | | | — | | | | (48,441 | ) | | | (48,441 | ) | | | 54,037 | | | | — | | | | 54,037 | |
Deutsche Bank AG | | | 1,774,474 | | | | 16,910 | | | | — | | | | 1,791,384 | | | | (9,760 | ) | | | — | | | | (9,760 | ) | | | 1,781,624 | | | | (1,380,000 | ) | | | 401,624 | |
HSBC Bank PLC | | | — | | | | — | | | | 67,443 | | | | 67,443 | | | | — | | | | (20,572 | ) | | | (20,572 | ) | | | 46,871 | | | | — | | | | 46,871 | |
JPMorgan Chase Bank (London) | | | — | | | | — | | | | 194,013 | | | | 194,013 | | | | — | | | | (87,235 | ) | | | (87,235 | ) | | | 106,778 | | | | — | | | | 106,778 | |
JPMorgan Securities, Inc. | | | 1,241,547 | | | | — | | | | — | | | | 1,241,547 | | | | (93,851 | ) | | | — | | | | (93,851 | ) | | | 1,147,696 | | | | (840,000 | ) | | | 307,696 | |
Morgan Stanley & Co. International PLC | | | — | | | | 413 | | | | 46,242 | | | | 46,655 | | | | (21,671 | ) | | | (44,624 | ) | | | (66,295 | ) | | | (19,640 | ) | | | — | | | | (19,640 | ) |
Morgan Stanley Capital Services, Inc. | | | 653,600 | | | | — | | | | — | | | | 653,600 | | | | — | | | | — | | | | — | | | | 653,600 | | | | — | | | | 653,600 | |
Royal Bank of Canada | | | — | | | | — | | | | 24,244 | | | | 24,244 | | | | — | | | | (81,671 | ) | | | (81,671 | ) | | | (57,427 | ) | | | — | | | | (57,427 | ) |
Royal Bank of Scotland PLC | | | — | | | | — | | | | 20,013 | | | | 20,013 | | | | — | | | | (46,156 | ) | | | (46,156 | ) | | | (26,143 | ) | | | — | | | | (26,143 | ) |
Standard Chartered Bank | | | — | | | | — | | | | 54,689 | | | | 54,689 | | | | — | | | | (103,929 | ) | | | (103,929 | ) | | | (49,240 | ) | | | — | | | | (49,240 | ) |
State Street Bank and Trust | | | — | | | | — | | | | 61,742 | | | | 61,742 | | | | — | | | | (31,615 | ) | | | (31,615 | ) | | | 30,127 | | | | — | | | | 30,127 | |
UBS AG (London) | | | — | | | | — | | | | 100,262 | | | | 100,262 | | | | — | | | | (57,991 | ) | | | (57,991 | ) | | | 42,271 | | | | — | | | | 42,271 | |
Westpac Banking Corp. | | | — | | | | — | | | | 117,153 | | | | 117,153 | | | | — | | | | (82,681 | ) | | | (82,681 | ) | | | 34,472 | | | | — | | | | 34,472 | |
Total | | $ | 4,035,050 | | | $ | 49,822 | | | $ | 1,317,100 | | | $ | 5,401,972 | | | $ | (335,711 | ) | | $ | (793,692 | ) | | $ | (1,129,403 | ) | | $ | 4,272,569 | | | $ | (2,229,652 | ) | | $ | 2,042,917 | |
153
GOLDMAN SACHS MULTI SECTOR FIXED INCOME FUNDS
Notes to Financial Statements (continued)
September 30, 2014 (Unaudited)
|
| 4. INVESTMENTS IN DERIVATIVES (continued) |
| | | | | | | | | | | | | | | | | | | | | | | | | | | | | | | | | | | | |
| | | | | | | | |
| Core Fixed Income | | | | | | | | | | | | | | | | | | | | | | | | | | | | | | | | | |
| | | Derivative Assets(1) | | | Derivative Liabilities(1) | | | | | | | | | | |
| Counterparty | | Options
Purchased | | | Swaps | | | Forward
Currency
Contracts | | | Total | | | Forward
Currency
Contracts | | | Total | | | Net Derivative
Asset
(Liabilities) | | | Collateral
(Received)
Pledged(1) | | | Net
Amount(2) | |
Bank of America Securities LLC | | $ | — | | | $ | 52,311 | | | $ | 508,962 | | | $ | 561,273 | | | $ | (150,671 | ) | | $ | (150,671 | ) | | $ | 410,602 | | | $ | (300,000 | ) | | $ | 110,602 | |
Barclays Bank PLC | | | — | | | | — | | | | 462,953 | | | | 462,953 | | | | (819,863 | ) | | | (819,863 | ) | | | (356,910 | ) | | | — | | | | (356,910 | ) |
BNP Paribas SA | | | — | | | | — | | | | 299,588 | | | | 299,588 | | | | (445,745 | ) | | | (445,745 | ) | | | (146,157 | ) | | | — | | | | (146,157 | ) |
Citibank NA (London) | | | — | | | | — | | | | 380,644 | | | | 380,644 | | | | (153,398 | ) | | | (153,398 | ) | | | 227,246 | | | | — | | | | 227,246 | |
Deutsche Bank AG (London) | | | — | | | | — | | | | 180,843 | | | | 180,843 | | | | — | | | | — | | | | 180,843 | | | | — | | | | 180,843 | |
Deutsche Bank Securities, Inc. | | | 4,517,090 | | | | — | | | | — | | | | 4,517,090 | | | | — | | | | — | | | | 4,517,090 | | | | (3,850,000 | ) | | | 667,090 | |
HSBC Bank PLC | | | — | | | | — | | | | 252,343 | | | | 252,343 | | | | (11,777 | ) | | | (11,777 | ) | | | 240,566 | | | | — | | | | 240,566 | |
JPMorgan Securities, Inc. | | | 1,237,595 | | | | — | | | | — | | | | 1,237,595 | | | | — | | | | — | | | | 1,237,595 | | | | (820,000 | ) | | | 417,595 | |
Morgan Stanley Capital Services, Inc. | | | 1,141,369 | | | | — | | | | — | | | | 1,141,369 | | | | — | | | | — | | | | 1,141,369 | | | | — | | | | 1,141,369 | |
State Street Bank and Trust | | | — | | | | — | | | | 344,367 | | | | 344,367 | | | | (129,529 | ) | | | (129,529 | ) | | | 214,838 | | | | — | | | | 214,838 | |
Westpac Banking Corp. | | | — | | | | — | | | | 461,889 | | | | 461,889 | | | | (427,312 | ) | | | (427,312 | ) | | | 34,577 | | | | — | | | | 34,577 | |
Total | | $ | 6,896,054 | | | $ | 52,311 | | | $ | 2,891,589 | | | $ | 9,839,954 | | | $ | (2,138,295 | ) | | $ | (2,138,295 | ) | | $ | 7,701,659 | | | $ | (4,970,000 | ) | | $ | 2,731,659 | |
| | | | | | | | | | | | | | | | | | | | | | | | | | | | | | | | | | | | | | | | |
| | | | | | | | | | |
| Global Income | | | | | | | | | | | | | | | | | | | | | | | | | | | | | | | | | | | | | | | | |
| | | Derivative Assets(1) | | | Derivative Liabilities(1) | | | Net Derivative
Asset
(Liabilities) | | | Collateral
(Received)
Pledged(1) | | | Net
Amount(2) | |
| Counterparty | | Options
Purchased | | | Swaps | | | Forward
Currency
Contracts | | | Total | | | Forward
Currency
Contracts | | | Options
Written | | | Total | | | | |
Bank of America Securities LLC | | $ | 178,432 | | | $ | 71,064 | | | $ | 629,217 | | | $ | 878,713 | | | $ | (79,857 | ) | | $ | — | | | $ | (79,857 | ) | | $ | 798,856 | | | $ | — | | | $ | 798,856 | |
Barclays Bank PLC | | | — | | | | 40,575 | | | | 217,802 | | | | 258,377 | | | | (195,179 | ) | | | — | | | | (195,179 | ) | | | 63,198 | | | | — | | | | 63,198 | |
BNP Paribas SA | | | — | | | | — | | | | 177,079 | | | | 177,079 | | | | (146,580 | ) | | | — | | | | (146,580 | ) | | | 30,499 | | | | — | | | | 30,499 | |
Citibank NA (London) | | | — | | | | — | | | | 205,214 | | | | 205,214 | | | | (120,436 | ) | | | — | | | | (120,436 | ) | | | 84,778 | | | | — | | | | 84,778 | |
Credit Suisse International (London) | | | — | | | | — | | | | 347,095 | | | | 347,095 | | | | (75,100 | ) | | | — | | | | (75,100 | ) | | | 271,995 | | | | — | | | | 271,995 | |
Deutsche Bank AG | | | 1,170,094 | | | | — | | | | — | | | | 1,170,094 | | | | — | | | | (71,430 | ) | | | (71,430 | ) | | | 1,098,664 | | | | — | | | | 1,098,664 | |
Deutsche Bank AG (London) | | | — | | | | — | | | | 550,496 | | | | 550,496 | | | | (162,574 | ) | | | — | | | | (162,574 | ) | | | 387,922 | | | | (387,922 | ) | | | — | |
HSBC Bank PLC | | | — | | | | — | | | | 167,295 | | | | 167,295 | | | | (74,598 | ) | | | — | | | | (74,598 | ) | | | 92,697 | | | | — | | | | 92,697 | |
JPMorgan Chase Bank (London) | | | — | | | | — | | | | 3,465,061 | | | | 3,465,061 | | | | (125,307 | ) | | | — | | | | (125,307 | ) | | | 3,339,754 | | | | — | | | | 3,339,754 | |
JPMorgan Securities, Inc. | | | 295,277 | | | | — | | | | — | | | | 295,277 | | | | — | | | | — | | | | — | | | | 295,277 | | | | — | | | | 295,277 | |
Merrill Lynch International Bank Ltd. | | | — | | | | — | | | | — | | | | — | | | | (9,667 | ) | | | — | | | | (9,667 | ) | | | (9,667 | ) | | | — | | | | (9,667 | ) |
Morgan Stanley & Co. International PLC | | | — | | | | — | | | | 123,033 | | | | 123,033 | | | | (142,705 | ) | | | — | | | | (142,705 | ) | | | (19,672 | ) | | | — | | | | (19,672 | ) |
Morgan Stanley Capital Services, Inc. | | | — | | | | 34,932 | | | | — | | | | 34,932 | | | | — | | | | — | | | | — | | | | 34,932 | | | | — | | | | 34,932 | |
Royal Bank of Canada | | | 935,994 | | | | — | | | | 136,328 | | | | 1,072,322 | | | | (191,569 | ) | | | — | | | | (191,569 | ) | | | 880,753 | | | | (880,753 | ) | | | — | |
Royal Bank of Scotland PLC | | | — | | | | — | | | | 52,668 | | | | 52,668 | | | | (150,434 | ) | | | — | | | | (150,434 | ) | | | (97,766 | ) | | | — | | | | (97,766 | ) |
Standard Chartered Bank | | | — | | | | — | | | | 264,425 | | | | 264,425 | | | | (205,555 | ) | | | — | | | | (205,555 | ) | | | 58,870 | | | | — | | | | 58,870 | |
State Street Bank and Trust | | | — | | | | — | | | | 371,176 | | | | 371,176 | | | | (147,951 | ) | | | — | | | | (147,951 | ) | | | 223,225 | | | | — | | | | 223,225 | |
UBS AG (London) | | | — | | | | 353,980 | | | | 267,748 | | | | 621,728 | | | | (242,035 | ) | | | — | | | | (242,035 | ) | | | 379,693 | | | | (379,693 | ) | | | — | |
Westpac Banking Corp. | | | — | | | | — | | | | 387,577 | | | | 387,577 | | | | (240,655 | ) | | | — | | | | (240,655 | ) | | | 146,922 | | | | — | | | | 146,922 | |
Total | | $ | 2,579,797 | | | $ | 500,551 | | | $ | 7,362,214 | | | $ | 10,442,562 | | | $ | (2,310,202 | ) | | $ | (71,430 | ) | | $ | (2,381,632 | ) | | $ | 8,060,930 | | | $ | (1,648,368 | ) | | $ | 6,412,562 | |
154
GOLDMAN SACHS MULTI SECTOR FIXED INCOME FUNDS
|
| 4. INVESTMENTS IN DERIVATIVES (continued) |
| | | | | | | | | | | | | | | | | | | | | | | | | | | | | | | | | | | | | | | | |
| | | | | | | | | |
| Strategic Income | | | | | | | | | | | | | | | | | | | | | | | | | | | | | | | | | | | | | |
| | | Derivative Assets(1) | | | Derivative Liabilities(1) | | | Net
Derivative
Asset
(Liabilities) | | | Collateral
(Received)
Pledged(1) | | | Net
Amount(2) | |
| Counterparty | | Options
Purchased | | | Swaps | | | Forward
Currency
Contracts | | | Total | | | Swaps | | | Forward
Currency
Contracts | | | Total | | | | |
Bank of America Securites LLC | | $ | 5,928,955 | | | $ | 618,565 | | | $ | 63,576,158 | | | $ | 70,123,678 | | | $ | (8,244,177 | ) | | $ | (11,142,924 | ) | | $ | (19,387,101 | ) | | $ | 50,736,577 | | | $ | — | | | $ | 50,736,577 | |
Barclays Bank PLC | | | — | | | | 63,877 | | | | 39,304,159 | | | | 39,368,036 | | | | (1,965,619 | ) | | | (21,108,791 | ) | | | (23,074,410 | ) | | | 16,293,626 | | | | — | | | | 16,293,626 | |
BNP Paribas SA | | | — | | | | — | | | | 29,574,073 | | | | 29,574,073 | | | | — | | | | (12,958,944 | ) | | | (12,958,944 | ) | | | 16,615,129 | | | | — | | | | 16,615,129 | |
Citibank NA | | | 76,861,923 | | | | 1,729,214 | | | | 67,884,241 | | | | 146,475,378 | | | | (20,041,566 | ) | | | (17,785,016 | ) | | | (37,826,582 | ) | | | 108,648,796 | | | | (43,106,753 | ) | | | 65,542,043 | |
Credit Suisse International (London) | | | — | | | | 264,176 | | | | 11,043,452 | | | | 11,307,628 | | | | (326,664 | ) | | | (10,131,686 | ) | | | (10,458,350 | ) | | | 849,278 | | | | (350,024 | ) | | | 499,254 | |
Deutsche Bank AG | | | 242,884,733 | | | | 5,004,412 | | | | — | | | | 247,889,145 | | | | (22,133,453 | ) | | | — | | | | (22,133,453 | ) | | | 225,755,692 | | | | (187,259,886 | ) | | | 38,495,806 | |
Deutsche Bank AG (London) | | | — | | | | — | | | | 36,378,416 | | | | 36,378,416 | | | | — | | | | (19,803,391 | ) | | | (19,803,391 | ) | | | 16,575,025 | | | | — | | | | 16,575,025 | |
HSBC Bank PLC | | | — | | | | — | | | | 40,434,342 | | | | 40,434,342 | | | | — | | | | (9,071,471 | ) | | | (9,071,471 | ) | | | 31,362,871 | | | | — | | | | 31,362,871 | |
JPMorgan Chase Bank (London) | | | — | | | | — | | | | 89,413,704 | | | | 89,413,704 | | | | — | | | | (25,378,306 | ) | | | (25,378,306 | ) | | | 64,035,398 | | | | — | | | | 64,035,398 | |
JPMorgan Securities, Inc. | | | 203,609,552 | | | | 3,666,277 | | | | — | | | | 207,275,829 | | | | (25,291,610 | ) | | | — | | | | (25,291,610 | ) | | | 181,984,219 | | | | (145,664,971 | ) | | | 36,319,248 | |
Merrill Lynch International Bank Ltd. | | | — | | | | — | | | | 164,248 | | | | 164,248 | | | | — | | | | (12,073,142 | ) | | | (12,073,142 | ) | | | (11,908,894 | ) | | | — | | | | (11,908,894 | ) |
Morgan Stanley & Co. International PLC | | | — | | | | 19,278 | | | | 16,648,438 | | | | 16,667,716 | | | | (2,905,713 | ) | | | (20,309,452 | ) | | | (23,215,165 | ) | | | (6,547,449 | ) | | | 5,368,344 | | | | (1,179,105 | ) |
Morgan Stanley Capital Services, Inc. | | | 181,779,030 | | | | — | | | | — | | | | 181,779,030 | | | | (2,357,686 | ) | | | — | | | | (2,357,686 | ) | | | 179,421,344 | | | | (98,361,553 | ) | | | 81,059,791 | |
Royal Bank of Scotland PLC | | | — | | | | — | | | | 15,759,017 | | | | 15,759,017 | | | | — | | | | (46,744,110 | ) | | | (46,744,110 | ) | | | (30,985,093 | ) | | | — | | | | (30,985,093 | ) |
Standard Chartered Bank | | | — | | | | — | | | | 18,827,774 | | | | 18,827,774 | | | | — | | | | (25,238,851 | ) | | | (25,238,851 | ) | | | (6,411,077 | ) | | | — | | | | (6,411,077 | ) |
State Street Bank (London) | | | — | | | | — | | | | 25,132,098 | | | | 25,132,098 | | | | — | | | | (11,506,379 | ) | | | (11,506,379 | ) | | | 13,625,719 | | | | — | | | | 13,625,719 | |
UBS AG (London) | | | — | | | | — | | | | 6,177,063 | | | | 6,177,063 | | | | — | | | | (28,479,855 | ) | | | (28,479,855 | ) | | | (22,302,792 | ) | | | — | | | | (22,302,792 | ) |
Westpac Banking Corp. | | | — | | | | — | | | | 40,010,103 | | | | 40,010,103 | | | | — | | | | (31,935,932 | ) | | | (31,935,932 | ) | | | 8,074,171 | | | | — | | | | 8,074,171 | |
Total | | $ | 711,064,193 | | | $ | 11,365,799 | | | $ | 500,327,286 | | | $ | 1,222,757,278 | | | $ | (83,266,488 | ) | | $ | (303,668,250 | ) | | $ | (386,934,738 | ) | | $ | 835,822,540 | | | $ | (469,374,843 | ) | | $ | 366,447,697 | |
155
GOLDMAN SACHS MULTI SECTOR FIXED INCOME FUNDS
Notes to Financial Statements (continued)
September 30, 2014 (Unaudited)
|
| 4. INVESTMENTS IN DERIVATIVES (continued) |
| | | | | | | | | | | | | | | | | | | | | | | | | | | | | | | | | | | | |
| | | | | | | | | |
| World Bond | | | | | | | | | | | | | | | | | | | | | | | | | | | | | | | | | | | | |
| | | Derivative Assets(1) | | | Derivative Liabilities(1) | | | | | | | | | | |
| Counterparty | | Swaps | | | Forward
Currency
Contracts | | | Total | | | Swaps | | | Forward
Currency
Contracts | | | Total | | | Net Derivative
Assets
(Liabilities) | | | Collateral
(Received)
Pledged(1) | | | Net
Amount(2) | |
Bank of America Securities LLC | | $ | 1,460 | | | $ | 30,292 | | | $ | 31,752 | | | $ | (539 | ) | | $ | (5,248 | ) | | $ | (5,787 | ) | | $ | 25,965 | | | $ | — | | | $ | 25,965 | |
Barclays Bank PLC | | | — | | | | 12,870 | | | | 12,870 | | | | (5,566 | ) | | | (10,147 | ) | | | (15,713 | ) | | | (2,843 | ) | | | — | | | | (2,843 | ) |
BNP Paribas SA | | | — | | | | 8,340 | | | | 8,340 | | | | — | | | | (4,744 | ) | | | (4,744 | ) | | | 3,596 | | | | — | | | | 3,596 | |
Citibank NA (London) | | | 9,170 | | | | 11,386 | | | | 20,556 | | | | (18,562 | ) | | | (7,868 | ) | | | (26,430 | ) | | | (5,874 | ) | | | — | | | | (5,874 | ) |
Credit Suisse First Boston Corp. | | | 91 | | | | — | | | | 91 | | | | (1,117 | ) | | | — | | | | (1,117 | ) | | | (1,026 | ) | | | — | | | | (1,026 | ) |
Credit Suisse International (London) | | | — | | | | 3,893 | | | | 3,893 | | | | — | | | | (9,065 | ) | | | (9,065 | ) | | | (5,172 | ) | | | — | | | | (5,172 | ) |
Deutsche Bank AG (London) | | | 2,395 | | | | 14,176 | | | | 16,571 | | | | (7,649 | ) | | | (8,194 | ) | | | (15,843 | ) | | | 728 | | | | — | | | | 728 | |
HSBC Bank PLC | | | — | | | | 13,009 | | | | 13,009 | | | | — | | | | (13,020 | ) | | | (13,020 | ) | | | (11 | ) | | | — | | | | (11 | ) |
JPMorgan Chase Bank (London) | | | — | | | | 28,611 | | | | 28,611 | | | | — | | | | (7,997 | ) | | | (7,997 | ) | | | 20,614 | | | | — | | | | 20,614 | |
JPMorgan Securities, Inc. | | | 41 | | | | — | | | | 41 | | | | (6,897 | ) | | | — | | | | (6,897 | ) | | | (6,856 | ) | | | — | | | | (6,856 | ) |
Merrill Lynch International Bank Ltd. | | | — | | | | 53 | | | | 53 | | | | — | | | | (485 | ) | | | (485 | ) | | | (432 | ) | | | — | | | | (432 | ) |
Morgan Stanley & Co. International PLC | | | 527 | | | | 6,281 | | | | 6,808 | | | | (2,249 | ) | | | (6,877 | ) | | | (9,126 | ) | | | (2,318 | ) | | | — | | | | (2,318 | ) |
Royal Bank of Canada | | | — | | | | 5,698 | | | | 5,698 | | | | — | | | | (10,478 | ) | | | (10,478 | ) | | | (4,780 | ) | | | — | | | | (4,780 | ) |
Royal Bank of Scotland PLC | | | — | | | | 2,862 | | | | 2,862 | | | | — | | | | (11,050 | ) | | | (11,050 | ) | | | (8,188 | ) | | | — | | | | (8,188 | ) |
Standard Chartered Bank | | | — | | | | 35,299 | | | | 35,299 | | | | — | | | | (17,964 | ) | | | (17,964 | ) | | | 17,335 | | | | — | | | | 17,335 | |
State Street Bank and Trust | | | — | | | | 8,482 | | | | 8,482 | | | | — | | | | (4,841 | ) | | | (4,841 | ) | | | 3,641 | | | | — | | | | 3,641 | |
UBS AG (London) | | | — | | | | 2,091 | | | | 2,091 | | | | — | | | | (17,695 | ) | | | (17,695 | ) | | | (15,604 | ) | | | — | | | | (15,604 | ) |
Westpac Banking Corp. | | | — | | | | 14,513 | | | | 14,513 | | | | — | | | | (24,226 | ) | | | (24,226 | ) | | | (9,713 | ) | | | — | | | | (9,713 | ) |
Total | | $ | 13,684 | | | $ | 197,856 | | | $ | 211,540 | | | $ | (42,579 | ) | | $ | (159,899 | ) | | $ | (202,478 | ) | | $ | 9,062 | | | $ | — | | | $ | 9,062 | |
| (1) | | Gross amounts available for offset but not netted in the Statement of Assets and Liabilities. |
| (2) | | Net amount represents the net amount due (to) from counterparty in the event of a default based on the contractual set-off rights under the agreement. Net amount excludes any over-collateralized amounts. |
|
| 5. AGREEMENTS AND AFFILIATED TRANSACTIONS |
A. Management Agreement — Under the Agreement, GSAM and GSAMI manage the Funds, subject to the general supervision of the Trustees.
As compensation for the services rendered pursuant to the Agreement, the assumption of the expenses related thereto and administration of the Funds’ business affairs, including providing facilities, GSAM and GSAMI are entitled to a management fee, accrued daily and paid monthly, equal to an annual percentage rate of each Fund’s average daily net assets.
For the six months ended September 30, 2014, contractual and effective net management fees with GSAM and GSAMI were at the following rates:
| | | | | | | | | | | | | | | | | | | | | | | | | | |
| | | | | Contractual Management Rate | |
| Fund | | | | First
$1 billion | | | Next
$1 billion | | | Next
$3 billion | | | Next
$3 billion | | | Over
$8 billion | | | Effective
Rate | |
Bond | | | | | 0.45 | % | | | 0.41 | % | | | 0.39 | % | | | 0.38 | % | | | 0.37 | % | | | 0.45 | % |
Core Fixed Income | | | | | 0.40 | | | | 0.36 | | | | 0.34 | | | | 0.33 | | | | 0.32 | | | | 0.40 | |
Global Income | | | | | 0.65 | | | | 0.59 | | | | 0.56 | | | | 0.55 | | | | 0.54 | | | | 0.65 | |
Strategic Income | | | | | 0.60 | | | | 0.54 | | | | 0.51 | | | | 0.50 | | | | 0.49 | | | | 0.50 | |
World Bond | | | | | 0.65 | | | | 0.59 | | | | 0.56 | | | | 0.54 | | | | 0.53 | | | | 0.65 | |
156
GOLDMAN SACHS MULTI SECTOR FIXED INCOME FUNDS
|
| 5. AGREEMENTS AND AFFILIATED TRANSACTIONS (continued) |
B. Distribution and Service Plans — The Trust, on behalf of each Fund, has adopted Distribution and Service Plans (the “Plans”). Under the Plans, Goldman Sachs, which serves as distributor (the “Distributor”), is entitled to a fee accrued daily and paid monthly, for distribution services and personal and account maintenance services, which may then be paid by Goldman Sachs to authorized dealers, at the following annual rates calculated on a Fund’s average daily net assets of each respective share class:
| | | | | | | | | | | | | | | | |
| | | Distribution and Service Plan Rates | |
| | | Class A* | | | Class B | | | Class C | | | Class R* | |
Distribution Plan | | | 0.25 | % | | | 0.75 | % | | | 0.75 | % | | | 0.50 | % |
Service Plan | | | — | | | | 0.25 | | | | 0.25 | | | | — | |
| * | | With respect to Class A and Class R Shares, the Distributor at its discretion may use compensation for distribution services paid under the Distribution Plan to compensate service organizations for personal and account maintenance services and expenses as long as such total compensation does not exceed the maximum cap on “service fees” imposed by the Financial Industry Regulatory Authority. |
C. Distribution Agreement — Goldman Sachs, as Distributor of the shares of the Funds pursuant to a Distribution Agreement, may retain a portion of the Class A front end sales charge and Class B and Class C Shares’ CDSC. During the six months ended September 30, 2014, Goldman Sachs advised that it retained the following amounts:
| | | | | | | | | | | | | | | | |
| | | | | | | Front End
Sales Charge | | | Contingent Deferred
Sales Charge | |
| Fund | | | | | | Class A | | | Class B | | | Class C | |
Bond | | | | | | $ | 3,647 | | | $ | — | | | $ | 2 | |
Core Fixed Income | | | | | | | 1,958 | | | | — | | | | 341 | |
Global Income | | | | | | | 4,641 | | | | — | | | | — | |
Strategic Income | | | | | | | 277,637 | | | | N/A | | | | 155 | |
World Bond | | | | | | | 22 | | | | N/A | | | | — | |
D. Service Plan and Shareholder Administration Plan — The Trust, on behalf of each Fund that offers Service Shares, has adopted a Service Plan and a Shareholder Administration Plan. These plans allow for service organizations to provide varying levels of personal and account maintenance and shareholder administration services to their customers who are beneficial owners of such shares. The Service Plan and Shareholder Administration Plan each provide for compensation to the service organizations which is accrued daily and paid monthly at an annual rate of 0.25% (0.50% in aggregate) of the average daily net assets of the Service Shares.
E. Transfer Agency Agreement — Goldman Sachs also serves as the transfer agent of the Funds for a fee pursuant to the Transfer Agency Agreement. The fees charged for such transfer agency services are accrued daily and paid monthly at annual rates as follows: 0.13% of the average daily net assets of Class A, Class B, Class C, Class IR and Class R Shares and 0.04% of the average daily net assets of Institutional and Service Shares.
F. Other Expense Agreements and Affiliated Transactions — GSAM and GSAMI have agreed to limit certain “Other Expenses” of the Funds (excluding transfer agency fees and expenses, service fees, shareholder administration fees, taxes, interest, brokerage fees, shareholder meeting, litigation, indemnification and extraordinary expenses) to the extent such expenses exceed, on an annual basis, a percentage rate of the average daily net assets of each Fund. Such Other Expense reimbursements, if any, are accrued daily and paid monthly. In addition, the Funds are not obligated to reimburse GSAM and GSAMI for prior fiscal year expense reimbursements, if any. The Other Expense limitations an annual percentage rate of average daily net assets for the Core Fixed Income, Bond, Global Income, Strategic Income and World Bond Funds are 0.104%, 0.004%, 0.004%, 0.054% and 0.014%, respectively. These Other Expense reimbursements will remain in place through at least July 29, 2014, and prior to such date
157
GOLDMAN SACHS MULTI SECTOR FIXED INCOME FUNDS
Notes to Financial Statements (continued)
September 30, 2014 (Unaudited)
|
| 5. AGREEMENTS AND AFFILIATED TRANSACTIONS (continued) |
GSAM and GSAMI may not terminate the arrangements without the approval of the Trustees. The Funds bear their respective share of costs related to proxy and shareholder meetings, and GSAM has agreed to reimburse each Fund to the extent such expenses exceed a specified percentage of the Fund’s net assets. In addition, the Funds have entered into certain offset arrangements with the custodian and the transfer agent, which may result in a reduction of the Funds’ expenses and are received irrespective of the application of the “Other Expense” limitations described above.
For the six months ended September 30, 2014, these expense reductions, including any fee waivers and Other Expense reimbursements, were $326,473, $368,413 and $242,483 for the Bond, Global Income and World Bond Funds, respectively.
G. Line of Credit Facility — As of September 30, 2014, the Funds participated in a $1,080,000,000 committed, unsecured revolving line of credit facility (the “facility”) together with other funds of the Trust and registered investment companies having management agreements with GSAM or its affiliates (“Other Borrowers”). Pursuant to the terms of the facility, the Funds and Other Borrowers could increase the credit amount by an additional $120,000,000, for a total of up to $1,200,000,000. This facility is to be used solely for temporary or emergency purposes, which may include the funding of redemptions. The interest rate on borrowings is based on the federal funds rate. The facility also requires a fee to be paid by the Funds based on the amount of the commitment that has not been utilized. For the six months ended September 30, 2014, the Funds did not have any borrowings under the facility.
H. Other Transactions with Affiliates — For the six months ended September 30, 2014, Goldman Sachs earned approximately $21,058, $56,497, $2,215,717 and $893 in brokerage commissions from portfolio transactions, including futures transactions executed with Goldman Sachs as the Futures Commission Merchant, on behalf of the Bond, Global Income, Strategic Income and World Bond Funds, respectively.
As of September 30, 2014, the following Fund of Funds Portfolios were the beneficial owners of 5% or more of total outstanding shares of the following Fund:
| | | | | | | | | | |
| Fund | | | | Goldman Sachs
Balanced Strategy
Portfolio | | | Goldman Sachs
Growth and Income
Strategy Portfolio | |
Global Income | | | | | 31 | % | | | 27 | % |
As of September 30, 2014, Goldman Sachs Group, Inc. was the beneficial owner of 5% or more of outstanding Class A, Class C, Institutional, Service, Class IR and Class R Shares of the following Funds:
| | | | | | | | | | | | | | | | | | | | | | | | | | |
| Fund | | | | Class A | | | Class C | | | Institutional | | | Service | | | Class IR | | | Class R | |
Bond | | | | | — | % | | | — | % | | | — | % | | | 100 | % | | | — | % | | | 20 | % |
World Bond | | | | | 6 | | | | 26 | | | | 100 | | | | N/A | | | | 100 | | | | 100 | |
158
GOLDMAN SACHS MULTI SECTOR FIXED INCOME FUNDS
|
| 6. PORTFOLIO SECURITIES TRANSACTIONS |
The cost of purchases and proceeds from sales and maturities of long-term securities for the six months ended September 30, 2014, were as follows:
| | | | | | | | | | | | | | | | | | |
| Fund | | | | Purchases of
U.S. Government and
Agency Obligations | | | Purchases (Excluding
U.S. Government and
Agency Obligations) | | | Sales and
Maturities of
U.S. Government and
Agency Obligations | | | Sales and
Maturities (Excluding
U.S. Government and
Agency Obligations) | |
Bond | | | | $ | 427,171,799 | | | $ | 38,187,072 | | | $ | 449,607,284 | | | $ | 44,094,731 | |
Core Fixed Income | | | | | 1,835,728,946 | | | | 145,726,034 | | | | 1,882,877,392 | | | | 139,656,548 | |
Global Income | | | | | 297,724,820 | | | | 173,651,684 | | | | 305,015,099 | | | | 242,717,985 | |
Strategic Income | | | | | 10,141,749,852 | | | | 10,300,541,521 | | | | 10,195,648,851 | | | | 7,599,246,946 | |
World Bond | | | | | 981,746 | | | | 7,336,770 | | | | 413,512 | | | | 7,164,153 | |
As of the Funds’ most recent fiscal year end, March 31, 2014, the Funds’ capital loss carryfowards on a tax basis were as follows:
| | | | | | | | | | | | | | | | | | | | |
| | | Bond | | | Core Fixed
Income | | | Global
Income | | | Strategic
Income | | | World
Bond | |
Capital loss carryovers:(1) | | | | | | | | | | | | | | | | | | | | |
Expiring 2018 | | $ | — | | | $ | (35,295,100 | ) | | $ | — | | | $ | — | | | $ | — | |
Perpetual Short-term | | | (1,849,007 | ) | | | (193,915 | ) | | | — | | | | — | | | | — | |
Perpetual Long-term | | | — | | | | (3,542,757 | ) | | | — | | | | (33,253,940 | ) | | | (9,851 | ) |
Total capital loss carryovers | | $ | (1,849,007 | ) | | $ | (39,031,772 | ) | | $ | — | | | $ | (33,253,940 | ) | | $ | (9,851 | ) |
Timing differences (Qualified Late Year Loss, Income Distribution Payable and Straddle Loss Deferrals) | | $ | (324,905 | ) | | $ | (444,600 | ) | | $ | (9,269,139 | ) | | $ | (96,060,521 | ) | | $ | (401,178 | ) |
| (1) | | With the exception of perpetual capital loss carryforwards, expiration occurs on March 31 of the year indicated. |
As of September 30, 2014, the Funds’ aggregate security unrealized gains and losses based on cost for U.S. federal income tax purposes were as follows:
| | | | | | | | | | | | | | | | | | | | |
| | | Bond | | | Core Fixed
Income | | | Global
Income | | | Strategic
Income | | | World
Bond | |
Tax Cost | | $ | 241,589,622 | | | $ | 1,130,491,883 | | | $ | 458,994,382 | | | $ | 25,498,832,564 | | | $ | 12,292,929 | |
Gross unrealized gain | | | 9,004,771 | | | | 26,421,543 | | | | 11,074,612 | | | | 373,899,314 | | | | 56,711 | |
Gross unrealized loss | | | (2,335,096 | ) | | | (8,307,525 | ) | | | (10,468,176 | ) | | | (390,289,369 | ) | | | (570,539 | ) |
Net unrealized gain (loss) | | $ | 6,669,675 | | | $ | 18,114,018 | | | $ | 606,436 | | | $ | (16,390,055 | ) | | $ | (513,828 | ) |
The differences between GAAP-basis and tax-basis unrealized gains (losses) is attributable primarily to wash sales, net mark-to market gains (losses) on regulated futures contracts, foreign currency contracts, premium amortization, swap contracts, and differences related to the tax treatment of swap transactions.
GSAM and GSAMI have reviewed the Funds’ tax positions for all open tax years (the current and prior three years, as applicable) and have concluded that no provision for income tax is required in the Funds’ financial statements. Such open tax years remain subject to examination and adjustment by tax authorities.
159
GOLDMAN SACHS MULTI SECTOR FIXED INCOME FUNDS
Notes to Financial Statements (continued)
September 30, 2014 (Unaudited)
The Funds’ risks include, but are not limited to, the following:
Foreign Custody Risk — A Fund that invests in foreign securities may hold such securities and foreign currency with foreign banks, agents, and securities depositories appointed by the Fund’s custodian (each a “Foreign Custodian”). Some foreign custodians may be recently organized or new to the foreign custody business. In some countries, Foreign Custodians may be subject to little or no regulatory oversight or independent evaluation of their operations. Further, the laws of certain countries may place limitations on a Fund’s ability to recover its assets if a Foreign Custodian enters bankruptcy. Investments in emerging markets may be subject to greater custody risks than investments in more developed markets. Custody services in emerging market countries are very often undeveloped and may be considerably less well regulated than in more developed countries, and thus may not afford the same level of investor protection as would apply in developed countries.
Large Shareholder Transactions Risk — A Fund may experience adverse effects when certain large shareholders, such as other funds, institutional investors (including those trading by use of non-discretionary mathematical formulas), financial intermediaries (who may make investment decisions on behalf of underlying clients and/or include a Fund in their investment model), individuals, accounts and Goldman Sachs affiliates, purchase or redeem large amounts of shares of a Fund. Such large shareholder redemptions may cause the Fund to sell portfolio securities at times when it would not otherwise do so, which may negatively impact a Fund’s NAV and liquidity. Similarly, large Fund share purchases may adversely affect a Fund’s performance to the extent that a Fund is delayed in investing new cash and is required to maintain a larger cash position than it ordinarily would. These transactions may also accelerate the realization of taxable income to shareholders if such sales of investments resulted in gains, and may also increase transaction costs. In addition, a large redemption could result in a Fund’s current expenses being allocated over a smaller asset base, leading to an increase in the Fund’s expense ratio.
Liquidity Risk — The Funds may make investments that are illiquid or that may become less liquid in response to market developments or adverse investor perceptions. Illiquid investments may be more difficult to value. Liquidity risk may also refer to the risk that a Fund will not be able to pay redemption proceeds within the allowable time period because of unusual market conditions, an unusually high volume of redemption requests, or other reasons. To meet redemption requests, a Fund may be forced to sell investments at an unfavorable time and/or under unfavorable conditions. Liquidity risk may be the result of, among other things, the reduced number and capacity of traditional market participants to make a market in fixed income securities or the lack of an active market. The potential for liquidity risk may be magnified by a rising interest rate environment or other circumstances where investor redemptions from fixed income mutual funds may be higher than normal, potentially causing increased supply in the market due to selling activity.
Market and Credit Risks — In the normal course of business, the Funds trade financial instruments and enter into financial transactions where risk of potential loss exists due to changes in the market (market risk). Additionally, the Funds may also be exposed to credit risk in the event that an issuer or guarantor fails to perform or that an institution or entity with which the Funds have unsettled or open transactions defaults.
Investing in foreign markets may involve special risks and considerations not typically associated with investing in the U.S. Foreign securities may be subject to risk of loss because of more or less foreign government regulation, less public information and less economic, political and social stability in the countries in which the Funds invest. Loss may also result from the imposition of exchange controls, confiscations and other government restrictions by the United States or other governments, or from problems in registration, settlement or custody. Foreign risk also involves the risk of negative foreign currency rate fluctuations, which may cause the value of securities denominated in such foreign currency (or other instruments through which the Funds have exposure to foreign currencies) to decline in value. Currency exchange rates may fluctuate significantly over short periods of time. To the extent that the Funds also invest in securities of issuers located in emerging markets, these risks may be more pronounced.
Non-Diversification Risk — The Global Income and World Bond Funds are non-diversified, meaning that they are permitted to invest a larger percentage of their assets in fewer issuers than diversified mutual funds. Thus, a Fund may be more susceptible to adverse developments affecting any single issuer held in its portfolio, and may be more susceptible to greater losses because of these developments.
160
GOLDMAN SACHS MULTI SECTOR FIXED INCOME FUNDS
|
| 8. OTHER RISKS (continued) |
Portfolio Concentration Risk — As a result of certain Funds’ ability to invest a large percentage of their assets in obligations of issuers within the same country, state, region, currency or economic sector, an adverse economic, business or political development may affect the value of the Funds’ investments more than if their investments were not so concentrated.
Under the Trust’s organizational documents, its Trustees, officers, employees and agents are indemnified, to the extent permitted by the Act and state law, against certain liabilities that may arise out of performance of their duties to the Funds. Additionally, in the course of business, the Funds enter into contracts that contain a variety of indemnification clauses. The Funds’ maximum exposure under these arrangements is unknown, as this would involve future claims that may be made against the Funds that have not yet occurred. However, GSAM and GSAMI believe the risk of loss under these arrangements to be remote.
At a meeting held on August 13-14, 2014, the Board of Trustees of the Goldman Sachs Trust approved the early conversion of each Fund’s Class B Shares into Class A Shares.
Accordingly, effective at the close of business on November 14, 2014 (the “Conversion Date”), Class B Shares of each Fund will convert to Class A Shares of the Fund, including Class B Shares that are scheduled to convert on a later date. No CDSCs will be assessed in connection with this early conversion. In addition, effective October 15, 2014, redemptions of a Fund’s Class B Shares before the Conversion Date will not be subject to a CDSC.
Effective December 1, 2014, GSAM implemented a management fee waiver for the Bond Fund in order to reduce the management fee by 0.04% as calculated as an annual percentage of the fund’s average daily net assets. Also effective December 1, 2014, GSAM decreased the Other Expense limitation of the Core Fixed Income Fund from 0.104% to 0.014% as calculated as an annual percentage rate of the fund’s average daily net assets.
161
GOLDMAN SACHS MULTI SECTOR FIXED INCOME FUNDS
Notes to Financial Statements (continued)
September 30, 2014 (Unaudited)
|
| 12. SUMMARY OF SHARE TRANSACTIONS |
Share activity is as follows:
| | | | | | | | | | | | | | | | |
| | | Bond Fund | |
| | | | |
| | | For the Six Months Ended
September 30, 2014
(Unaudited) | | | For the Fiscal Year Ended
March 31, 2014 | |
| | | | |
| | | Shares | | | Dollars | | | Shares | | | Dollars | |
| | | | |
| Class A Shares | | | | | | | | | | | | | | | | |
Shares sold | | | 710,631 | | | $ | 7,501,480 | | | | 673,150 | | | $ | 7,008,250 | |
Reinvestment of distributions | | | 35,434 | | | | 374,053 | | | | 88,873 | | | | 921,797 | |
Shares converted from Class B(a) | | | 12,808 | | | | 134,998 | | | | 37,789 | | | | 390,984 | |
Shares redeemed | | | (517,085 | ) | | | (5,450,239 | ) | | | (1,354,881 | ) | | | (14,045,948 | ) |
| | | | 241,788 | | | | 2,560,292 | | | | (555,069 | ) | | | (5,724,917 | ) |
| Class B Shares | | | | | | | | | | | | | | | | |
Shares sold | | | 3,393 | | | | 35,857 | | | | 10,280 | | | | 107,103 | |
Reinvestment of distributions | | | 1,235 | | | | 13,020 | | | | 4,667 | | | | 48,376 | |
Shares converted to Class A(a) | | | (12,820 | ) | | | (134,998 | ) | | | (37,808 | ) | | | (390,984 | ) |
Shares redeemed | | | (49,387 | ) | | | (520,205 | ) | | | (131,773 | ) | | | (1,365,923 | ) |
| | | | (57,579 | ) | | | (606,326 | ) | | | (154,634 | ) | | | (1,601,428 | ) |
| Class C Shares | | | | | | | | | | | | | | | | |
Shares sold | | | 104,173 | | | | 1,096,959 | | | | 94,070 | | | | 982,490 | |
Reinvestment of distributions | | | 4,308 | | | | 45,447 | | | | 12,578 | | | | 130,328 | |
Shares redeemed | | | (81,750 | ) | | | (860,979 | ) | | | (351,437 | ) | | | (3,640,507 | ) |
| | | | 26,731 | | | | 281,427 | | | | (244,789 | ) | | | (2,527,689 | ) |
| Institutional Shares | | | | | | | | | | | | | | | | |
Shares sold | | | 1,804,602 | | | | 19,026,729 | | | | 2,894,341 | | | | 30,210,185 | |
Reinvestment of distributions | | | 227,537 | | | | 2,400,331 | | | | 683,145 | | | | 7,088,035 | |
Shares redeemed | | | (5,232,736 | ) | | | (55,259,157 | ) | | | (12,142,228 | ) | | | (124,616,000 | ) |
| | | | (3,200,597 | ) | | | (33,832,097 | ) | | | (8,564,742 | ) | | | (87,317,780 | ) |
| Service Shares | | | | | | | | | | | | | | | | |
Reinvestment of distributions | | | 15 | | | | 150 | | | | 34 | | | | 359 | |
Shares redeemed | | | — | | | | — | | | | (1 | ) | | | (11 | ) |
| | | | 15 | | | | 150 | | | | 33 | | | | 348 | |
| Class IR Shares | | | | | | | | | | | | | | | | |
Shares sold | | | 100,527 | | | | 1,053,308 | | | | 96,501 | | | | 994,662 | |
Reinvestment of distributions | | | 5,281 | | | | 55,553 | | | | 8,369 | | | | 86,537 | |
Shares redeemed | | | (9,973 | ) | | | (104,762 | ) | | | (8,180 | ) | | | (84,562 | ) |
| | | | 95,835 | | | | 1,004,099 | | | | 96,690 | | | | 996,637 | |
| Class R Shares | | | | | | | | | | | | | | | | |
Shares sold | | | 344 | | | | 3,619 | | | | 7,725 | | | | 81,679 | |
Reinvestment of distributions | | | 25 | | | | 264 | | | | 258 | | | | 2,676 | |
Shares redeemed | | | (6,413 | ) | | | (67,304 | ) | | | (13,643 | ) | | | (139,669 | ) |
| | | | (6,044 | ) | | | (63,421 | ) | | | (5,660 | ) | | | (55,314 | ) |
NET DECREASE | | | (2,899,851 | ) | | $ | (30,655,876 | ) | | | (9,428,171 | ) | | $ | (96,230,143 | ) |
| (a) | | Class B Shares convert into Class A Shares on or about the fifteenth day of the last month of the calendar quarter that is eight years after the initial purchase date of either the Fund or another Goldman Sachs Fund. At a meeting held on August 13-14, 2014, the Board of Trustees of the Goldman Sachs Trust approved the early conversion of Class B Shares into Class A Shares. Accordingly, effective at the close of business on November 14, 2014, Class B shares will convert to Class A shares of the Fund, and no Contingent Deferred Sales Charges (“CSDCs”) will be assessed in connection with the redemptions of the Fund’s Class B Shares prior to this date. |
162
GOLDMAN SACHS MULTI SECTOR FIXED INCOME FUNDS
|
| 12. SUMMARY OF SHARE TRANSACTIONS (continued) |
Share activity is as follows:
| | | | | | | | | | | | | | | | |
| | | Core Fixed Income Fund | |
| | | | |
| | | For the Six Months Ended
September 30, 2014
(Unaudited) | | | For the Fiscal Year Ended
March 31, 2014 | |
| | | | |
| | | Shares | | | Dollars | | | Shares | | | Dollars | |
| | | | |
| Class A Shares | | | | | | | | | | | | | | | | |
Shares sold | | | 2,139,490 | | | $ | 22,451,070 | | | | 2,785,222 | | | $ | 28,856,506 | |
Reinvestment of distributions | | | 137,627 | | | | 1,446,112 | | | | 300,504 | | | | 3,112,538 | |
Shares converted from Class B(a) | | | 4,965 | | | | 52,035 | | | | 11,156 | | | | 115,426 | |
Shares redeemed | | | (1,655,483 | ) | | | (17,369,643 | ) | | | (5,188,060 | ) | | | (53,846,947 | ) |
| | | | 626,599 | | | | 6,579,574 | | | | (2,091,178 | ) | | | (21,762,477 | ) |
| Class B Shares | | | | | | | | | | | | | | | | |
Shares sold | | | 8,827 | | | | 93,136 | | | | 23,874 | | | | 250,589 | |
Reinvestment of distributions | | | 2,072 | | | | 21,865 | | | | 6,288 | | | | 65,399 | |
Shares converted to Class A(a) | | | (4,941 | ) | | | (52,035 | ) | | | (11,102 | ) | | | (115,426 | ) |
Shares redeemed | | | (92,361 | ) | | | (973,523 | ) | | | (282,968 | ) | | | (2,950,053 | ) |
| | | | (86,403 | ) | | | (910,557 | ) | | | (263,908 | ) | | | (2,749,491 | ) |
| Class C Shares | | | | | | | | | | | | | | | | |
Shares sold | | | 174,434 | | | | 1,838,876 | | | | 319,643 | | | | 3,330,085 | |
Reinvestment of distributions | | | 12,295 | | | | 129,895 | | | | 30,508 | | | | 317,257 | |
Shares redeemed | | | (286,725 | ) | | | (3,018,759 | ) | | | (819,762 | ) | | | (8,555,689 | ) |
| | | | (99,996 | ) | | | (1,049,988 | ) | | | (469,611 | ) | | | (4,908,347 | ) |
| Institutional Shares | | | | | | | | | | | | | | | | |
Shares sold | | | 6,466,324 | | | | 68,093,860 | | | | 17,097,328 | | | | 178,132,000 | |
Reinvestment of distributions | | | 997,233 | | | | 10,523,151 | | | | 2,404,153 | | | | 25,010,333 | |
Shares redeemed | | | (8,262,835 | ) | | | (86,965,341 | ) | | | (46,078,986 | ) | | | (479,042,934 | ) |
| | | | (799,278 | ) | | | (8,348,330 | ) | | | (26,577,505 | ) | | | (275,900,601 | ) |
| Service Shares | | | | | | | | | | | | | | | | |
Shares sold | | | 22,506 | | | | 236,969 | | | | 119,215 | | | | 1,267,798 | |
Reinvestment of distributions | | | 733 | | | | 7,734 | | | | 7,704 | | | | 80,993 | |
Shares redeemed | | | (43,598 | ) | | | (458,884 | ) | | | (1,594,760 | ) | | | (16,451,446 | ) |
| | | | (20,359 | ) | | | (214,181 | ) | | | (1,467,841 | ) | | | (15,102,655 | ) |
| Class IR Shares | | | | | | | | | | | | | | | | |
Shares sold | | | 20,769 | | | | 217,217 | | | | 69,352 | | | | 725,363 | |
Reinvestment of distributions | | | 1,721 | | | | 18,104 | | | | 3,347 | | | | 34,684 | |
Shares redeemed | | | (15,398 | ) | | | (162,057 | ) | | | (93,192 | ) | | | (967,665 | ) |
| | | | 7,092 | | | | 73,264 | | | | (20,493 | ) | | | (207,618 | ) |
| Class R Shares | | | | | | | | | | | | | | | | |
Shares sold | | | 7,388 | | | | 77,620 | | | | 12,930 | | | | 134,548 | |
Reinvestment of distributions | | | 480 | | | | 5,051 | | | | 1,126 | | | | 11,681 | |
Shares redeemed | | | (5,583 | ) | | | (58,687 | ) | | | (21,418 | ) | | | (220,257 | ) |
| | | | 2,285 | | | | 23,984 | | | | (7,362 | ) | | | (74,028 | ) |
NET DECREASE | | | (370,060 | ) | | $ | (3,846,234 | ) | | | (30,897,898 | ) | | $ | (320,705,217 | ) |
| (a) | | Class B Shares convert into Class A Shares on or about the fifteenth day of the last month of the calendar quarter that is eight years after the initial purchase date of either the Fund or another Goldman Sachs Fund. At a meeting held on August 13-14, 2014, the Board of Trustees of the Goldman Sachs Trust approved the early conversion of Class B Shares into Class A Shares. Accordingly, effective at the close of business on November 14, 2014, Class B shares will convert to Class A shares of the Fund, and no Contingent Deferred Sales Charges (“CSDCs”) will be assessed in connection with the redemptions of the Fund’s Class B Shares prior to this date. |
163
GOLDMAN SACHS MULTI SECTOR FIXED INCOME FUNDS
Notes to Financial Statements (continued)
September 30, 2014 (Unaudited)
|
| 12. SUMMARY OF SHARE TRANSACTIONS (continued) |
Share activity is as follows:
| | | | | | | | | | | | | | | | |
| | | Global Income Fund | |
| | | | |
| | | For the Six Months Ended
September 30, 2014
(Unaudited) | | | For the Fiscal Year Ended
March 31, 2014 | |
| | | | |
| | | Shares | | | Dollars | | | Shares | | | Dollars | |
| | | | |
| Class A Shares | | | | | | | | | | | | | | | | |
Shares sold | | | 489,746 | | | $ | 6,292,646 | | | | 1,256,050 | | | $ | 16,192,070 | |
Reinvestment of distributions | | | 40,014 | | | | 514,963 | | | | 290,430 | | | | 3,689,114 | |
Shares converted from Class B(a) | | | 1,347 | | | | 17,348 | | | | 2,177 | | | | 28,021 | |
Shares redeemed | | | (674,725 | ) | | | (8,654,211 | ) | | | (2,776,709 | ) | | | (36,099,908 | ) |
| | | | (143,618 | ) | | | (1,829,254 | ) | | | (1,228,052 | ) | | | (16,190,703 | ) |
| Class B Shares | | | | | | | | | | | | | | | | |
Shares sold | | | 731 | | | | 9,419 | | | | 6,345 | | | | 80,811 | |
Reinvestment of distributions | | | 337 | | | | 4,310 | | | | 4,583 | | | | 57,920 | |
Shares converted to Class A(a) | | | (1,352 | ) | | | (17,348 | ) | | | (2,186 | ) | | | (28,021 | ) |
Shares redeemed | | | (13,835 | ) | | | (177,177 | ) | | | (60,610 | ) | | | (780,656 | ) |
| | | | (14,119 | ) | | | (180,796 | ) | | | (51,868 | ) | | | (669,946 | ) |
| Class C Shares | | | | | | | | | | | | | | | | |
Shares sold | | | 66,402 | | | | 846,848 | | | | 71,705 | | | | 916,627 | |
Reinvestment of distributions | | | 1,781 | | | | 22,740 | | | | 18,636 | | | | 234,526 | |
Shares redeemed | | | (41,072 | ) | | | (524,396 | ) | | | (157,602 | ) | | | (2,021,855 | ) |
| | | | 27,111 | | | | 345,192 | | | | (67,261 | ) | | | (870,702 | ) |
| Institutional Shares | | | | | | | | | | | | | | | | |
Shares sold | | | 4,634,655 | | | | 59,496,229 | | | | 20,189,024 | | | | 260,329,764 | |
Reinvestment of distributions | | | 337,673 | | | | 4,338,895 | | | | 2,281,831 | | | | 28,936,451 | |
Shares redeemed | | | (8,716,267 | ) | | | (112,029,107 | ) | | | (18,240,934 | ) | | | (234,141,552 | ) |
| | | | (3,743,939 | ) | | | (48,193,983 | ) | | | 4,229,921 | | | | 55,124,663 | |
| Service Shares | | | | | | | | | | | | | | | | |
Shares sold | | | 10,358 | | | | 133,706 | | | | 9,195 | | | | 117,986 | |
Reinvestment of distributions | | | 69 | | | | 878 | | | | 409 | | | | 5,160 | |
Shares redeemed | | | (2,330 | ) | | | (29,828 | ) | | | (1,736 | ) | | | (22,371 | ) |
| | | | 8,097 | | | | 104,756 | | | | 7,868 | | | | 100,775 | |
| Class IR Shares | | | | | | | | | | | | | | | | |
Shares sold | | | 155,904 | | | | 2,013,417 | | | | 38,499 | | | | 495,858 | |
Reinvestment of distributions | | | 715 | | | | 9,179 | | | | 3,033 | | | | 38,442 | |
Shares redeemed | | | (2,978 | ) | | | (38,205 | ) | | | (23,131 | ) | | | (297,347 | ) |
| | | | 153,641 | | | | 1,984,391 | | | | 18,401 | | | | 236,953 | |
NET INCREASE (DECREASE) | | | (3,712,827 | ) | | $ | (47,769,694 | ) | | | 2,909,009 | | | $ | 37,731,040 | |
| (a) | | Class B Shares convert into Class A Shares on or about the fifteenth day of the last month of the calendar quarter that is eight years after the initial purchase date of either the Fund or another Goldman Sachs Fund. At a meeting held on August 13-14, 2014, the Board of Trustees of the Goldman Sachs Trust approved the early conversion of Class B Shares into Class A Shares. Accordingly, effective at the close of business on November 14, 2014, Class B shares will convert to Class A shares of the Fund, and no Contingent Deferred Sales Charges (“CSDCs”) will be assessed in connection with the redemptions of the Fund’s Class B Shares prior to this date. |
164
GOLDMAN SACHS MULTI SECTOR FIXED INCOME FUNDS
|
| 12. SUMMARY OF SHARE TRANSACTIONS (continued) |
Share activity is as follows:
| | | | | | | | | | | | | | | | |
| | | Strategic Income Fund | |
| | | | |
| | | For the Six Months Ended
September 30, 2014
(Unaudited) | | | For the Fiscal Year Ended
March 31, 2014 | |
| | | | |
| | | Shares | | | Dollars | | | Shares | | | Dollars | |
| | | | |
| Class A Shares | | | | | | | | | | | | | | | | |
Shares sold | | | 90,487,795 | | | $ | 959,328,155 | | | | 322,194,347 | | | $ | 3,403,126,196 | |
Reinvestment of distributions | | | 3,482,165 | | | | 36,854,565 | | | | 4,652,222 | | | | 49,226,533 | |
Shares redeemed | | | (141,153,409 | ) | | | (1,491,847,734 | ) | | | (47,483,395 | ) | | | (501,731,244 | ) |
| | | | (47,183,449 | ) | | | (495,665,014 | ) | | | 279,363,174 | | | | 2,950,621,485 | |
| Class C Shares | | | | | | | | | | | | | | | | |
Shares sold | | | 28,274,194 | | | | 299,874,236 | | | | 78,761,666 | | | | 832,427,995 | |
Reinvestment of distributions | | | 547,414 | | | | 5,795,995 | | | | 718,692 | | | | 7,608,168 | |
Shares redeemed | | | (9,197,914 | ) | | | (97,509,236 | ) | | | (6,797,147 | ) | | | (71,866,744 | ) |
| | | | 19,623,694 | | | | 208,160,995 | | | | 72,683,211 | | | | 768,169,419 | |
| Institutional Shares | | | | | | | | | | | | | | | | |
Shares sold | | | 676,722,763 | | | | 7,169,662,283 | | | | 1,354,175,002 | | | | 14,312,386,204 | |
Reinvestment of distributions | | | 16,264,536 | | | | 172,117,184 | | | | 15,331,342 | | | | 162,263,498 | |
Shares redeemed | | | (192,097,079 | ) | | | (2,034,896,771 | ) | | | (147,768,195 | ) | | | (1,562,144,611 | ) |
| | | | 500,890,220 | | | | 5,306,882,696 | | | | 1,221,738,149 | | | | 12,912,505,091 | |
| Class IR Shares | | | | | | | | | | | | | | | | |
Shares sold | | | 26,008,196 | | | | 275,632,219 | | | | 63,725,398 | | | | 672,837,499 | |
Reinvestment of distributions | | | 893,656 | | | | 9,452,886 | | | | 937,543 | | | | 9,917,406 | |
Shares redeemed | | | (10,803,633 | ) | | | (114,432,404 | ) | | | (7,630,689 | ) | | | (80,623,752 | ) |
| | | | 16,098,219 | | | | 170,652,701 | | | | 57,032,252 | | | | 602,131,153 | |
| Class R Shares | | | | | | | | | | | | | | | | |
Shares sold | | | 317,334 | | | | 3,363,743 | | | | 530,341 | | | | 5,621,913 | |
Reinvestment of distributions | | | 4,734 | | | | 50,072 | | | | 1,688 | | | | 17,893 | |
Shares redeemed | | | (86,372 | ) | | | (913,580 | ) | | | (20,230 | ) | | | (213,715 | ) |
| | | | 235,696 | | | | 2,500,235 | | | | 511,799 | | | | 5,426,091 | |
NET INCREASE | | | 489,664,380 | | | $ | 5,192,531,613 | | | | 1,631,328,585 | | | $ | 17,238,853,239 | |
165
GOLDMAN SACHS MULTI SECTOR FIXED INCOME FUNDS
Notes to Financial Statements (continued)
September 30, 2014 (Unaudited)
|
| 12. SUMMARY OF SHARE TRANSACTIONS (continued) |
Share activity is as follows:
| | | | | | | | | | | | | | | | |
| | | World Bond Fund | |
| | | | |
| | | For the Six Months Ended
September 30, 2014
(Unaudited) | | | For the Fiscal Year Ended
March 31, 2014 | |
| | | | |
| | | Shares | | | Dollars | | | Shares | | | Dollars | |
| | | | |
| Class A Shares | | | | | | | | | | | | | | | | |
Shares sold | | | 9,356 | | | $ | 91,041 | | | | 9,356 | | | $ | 92,614 | |
Reinvestment of distributions | | | 99 | | | | 952 | | | | 326 | | | | 3,092 | |
Shares redeemed | | | (1,233 | ) | | | (11,810 | ) | | | (1,475 | ) | | | (13,973 | ) |
| | | | 8,222 | | | | 80,183 | | | | 8,207 | | | | 81,733 | |
| Class C Shares | | | | | | | | | | | | | | | | |
Shares sold | | | 3,152 | | | | 30,246 | | | | — | | | | — | |
Reinvestment of distributions | | | 13 | | | | 128 | | | | 26 | | | | 248 | |
Shares redeemed | | | (258 | ) | | | (2,500 | ) | | | — | | | | — | |
| | | | 2,907 | | | | 27,874 | | | | 26 | | | | 248 | |
| Institutional Shares | | | | | | | | | | | | | | | | |
Shares sold | | | — | | | | — | | | | 106 | | | | 1,000 | |
Reinvestment of distributions | | | 11,590 | | | | 111,791 | | | | 44,287 | | | | 420,155 | |
Shares redeemed | | | (629 | ) | | | (6,046 | ) | | | (2,069 | ) | | | (19,471 | ) |
| | | | 10,961 | | | | 105,745 | | | | 42,324 | | | | 401,684 | |
| Class IR Shares | | | | | | | | | | | | | | | | |
Reinvestment of distributions | | | 9 | | | | 89 | | | | 37 | | | | 349 | |
| | | | 9 | | | | 89 | | | | 37 | | | | 349 | |
| Class R Shares | | | | | | | | | | | | | | | | |
Reinvestment of distributions | | | 6 | | | | 62 | | | | 30 | | | | 289 | |
| | | | 6 | | | | 62 | | | | 30 | | | | 289 | |
NET INCREASE | | | 22,105 | | | $ | 213,953 | | | | 50,624 | | | $ | 484,303 | |
166
GOLDMAN SACHS MULTI SECTOR FIXED INCOME FUNDS
Fund Expenses — Six Month Period Ended September 30, 2014 (Unaudited)
As a shareholder of Class A, Class B, Class C, Institutional, Service, Class IR or Class R Shares of a Fund, you incur two types of costs: (1) transaction costs, including sales charges on purchase payments (with respect to Class A Shares), contingent deferred sales charges on redemptions (with respect to Class B and Class C Shares), and (2) ongoing costs, including management fees; distribution and service (12b-1) fees (with respect to Class A, Class B, Class C and Class R Shares); and other Fund expenses. This Example is intended to help you understand your ongoing costs (in dollars) of investing in Class A, Class B, Class C, Institutional, Service, Class IR or Class R Shares of the Funds and to compare these costs with the ongoing costs of investing in other mutual funds.
The Example is based on an investment of $1,000 invested at the beginning of the period and held for the entire period from April 1, 2014 through September 30, 2014.
Actual Expenses — The first line under each share class in the table below provides information about actual account values and actual expenses. You may use the information in this line, together with the amount you invested, to estimate the expenses that you paid over the period. Simply divide your account value by $1,000 (for example, an $8,600 account value divided by $1,000=8.6), then multiply the result by the number in the first line under the heading entitled “Expenses Paid” to estimate the expenses you paid on your account during this period.
Hypothetical Example for Comparison Purposes — The second line under each share class in the table below provides information about hypothetical account values and hypothetical expenses based on the Funds’ actual net expense ratios and an assumed rate of return of 5% per year before expenses, which is not the Funds’ actual return. The hypothetical account values and expenses may not be used to estimate the actual ending account balance or expenses you paid for the period. You may use this information to compare the ongoing costs of investing in the Funds and other funds. To do so, compare this 5% hypothetical example with the 5% hypothetical examples that appear in the shareholder reports of the other funds.
Please note that the expenses shown in the table are meant to highlight your ongoing costs only and do not reflect any transactional costs, such as sales charges, redemption fees, or exchange fees. Therefore, the second line of the table is useful in comparing ongoing costs only, and will not help you determine the relative total costs of owning different funds. In addition, if these transactional costs were included, your costs would have been higher.
| | | | | | | | | | | | | | | | | | | | | | | | | | | | | | | | | | | | | | | | | | | | | | | | | | | | | | | | | | | | |
| | | Bond Fund | | | Core Fixed Income Fund | | | Global Income Fund | | | Strategic Income Fund | | | World Bond Fund | |
| Share Class | | Beginning
Account
Value
4/1/14 | | | Ending
Account
Value
9/30/14 | | | Expenses
Paid for the
6 months ended
9/30/14* | | | Beginning
Account
Value
4/1/14 | | | Ending
Account
Value
9/30/14 | | | Expenses
Paid for the
6 months ended
9/30/14* | | | Beginning
Account
Value
4/1/14 | | | Ending
Account
Value
9/30/14 | | | Expenses
Paid for the
6 months ended
9/30/14* | | | Beginning
Account
Value
4/1/14 | | | Ending
Account
Value
9/30/14 | | | Expenses
Paid for the
6 months ended
9/30/14* | | | Beginning
Account
Value
4/1/14 | | | Ending
Account
Value
9/30/14 | | | Expenses
Paid for the
6 months ended
9/30/14* | |
| Class A | | | | | | | | | | | | | | | | | | | | | | | | | | | | | | | | | | | | | | | | | | | | | | | | | | | | | | | | | | | | |
Actual | | $ | 1,000.00 | | | $ | 1,023.70 | | | $ | 4.26 | | | $ | 1,000.00 | | | $ | 1,021.50 | | | $ | 4.31 | | | $ | 1,000.00 | | | $ | 1,029.50 | | | $ | 5.29 | | | $ | 1,000.00 | | | $ | 1,005.80 | | | $ | 4.58 | | | $ | 1,000.00 | | | $ | 992.80 | | | $ | 5.30 | |
Hypothetical 5% return | | | 1,000.00 | | | | 1,020.86 | + | | | 4.26 | | | | 1,000.00 | | | | 1,020.81 | + | | | 4.31 | | | | 1,000.00 | | | | 1,019.85 | + | | | 5.27 | | | | 1,000.00 | | | | 1,020.51 | + | | | 4.61 | | | | 1,000.00 | | | | 1,019.75 | + | | | 5.37 | |
| Class B | | | | | | | | | | | | | | | | | | | | | | | | | | | | | | | | | | | | | | | | | | | | | | | | | | | | | | | | | | | | |
Actual | | | 1,000.00 | | | | 1,019.90 | | | | 8.05 | | | | 1,000.00 | | | | 1,017.70 | | | | 8.09 | | | | 1,000.00 | | | | 1,025.70 | | | | 9.09 | | | | N/A | | | | N/A | | | | N/A | | | | N/A | | | | N/A | | | | N/A | |
Hypothetical 5% return | | | 1,000.00 | | | | 1,017.10 | + | | | 8.04 | | | | 1,000.00 | | | | 1,017.05 | + | | | 8.09 | | | | 1,000.00 | | | | 1,016.09 | + | | | 9.05 | | | | N/A | | | | N/A | | | | N/A | | | | N/A | | | | N/A | | | | N/A | |
| Class C | | | | | | | | | | | | | | | | | | | | | | | | | | | | | | | | | | | | | | | | | | | | | | | | | | | | | | | | | | | | |
Actual | | | 1,000.00 | | | | 1,019.90 | | | | 8.05 | | | | 1,000.00 | | | | 1,018.60 | | | | 8.10 | | | | 1,000.00 | | | | 1,025.80 | | | | 9.04 | | | | 1,000.00 | | | | 1,002.00 | | | | 8.33 | | | | 1,000.00 | | | | 988.00 | | | | 9.02 | |
Hypothetical 5% return | | | 1,000.00 | | | | 1,017.10 | + | | | 8.04 | | | | 1,000.00 | | | | 1,017.05 | + | | | 8.09 | | | | 1,000.00 | | | | 1,016.14 | + | | | 9.00 | | | | 1,000.00 | | | | 1,016.75 | + | | | 8.39 | | | | 1,000.00 | | | | 1,015.99 | + | | | 9.15 | |
| Institutional | | | | | | | | | | | | | | | | | | | | | | | | | | | | | | | | | | | | | | | | | | | | | | | | | | | | | | | | | | | | |
Actual | | | 1,000.00 | | | | 1,025.40 | | | | 2.54 | | | | 1,000.00 | | | | 1,024.20 | | | | 2.59 | | | | 1,000.00 | | | | 1,031.30 | | | | 3.56 | | | | 1,000.00 | | | | 1,007.50 | | | | 2.87 | | | | 1,000.00 | | | | 993.50 | | | | 3.60 | |
Hypothetical 5% return | | | 1,000.00 | | | | 1,022.56 | + | | | 2.54 | | | | 1,000.00 | | | | 1,022.51 | + | | | 2.59 | | | | 1,000.00 | | | | 1,021.56 | + | | | 3.55 | | | | 1,000.00 | | | | 1,022.21 | + | | | 2.89 | | | | 1,000.00 | | | | 1,021.46 | + | | | 3.65 | |
| Service | | | | | | | | | | | | | | | | | | | | | | | | | | | | | | | | | | | | | | | | | | | | | | | | | | | | | | | | | | | | |
Actual | | | 1,000.00 | | | | 1,022.90 | | | | 5.02 | | | | 1,000.00 | | | | 1,020.70 | | | | 5.12 | | | | 1,000.00 | | | | 1,028.70 | | | | 6.05 | | | | N/A | | | | N/A | | | | N/A | | | | N/A | | | | N/A | | | | N/A | |
Hypothetical 5% return | | | 1,000.00 | | | | 1,020.10 | + | | | 5.01 | | | | 1,000.00 | | | | 1,020.00 | + | | | 5.11 | | | | 1,000.00 | | | | 1,019.10 | + | | | 6.02 | | | | N/A | | | | N/A | | | | N/A | | | | N/A | | | | N/A | | | | N/A | |
| Class IR | | | | | | | | | | | | | | | | | | | | | | | | | | | | | | | | | | | | | | | | | | | | | | | | | | | | | | | | | | | | |
Actual | | | 1,000.00 | | | | 1,025.00 | | | | 3.00 | | | | 1,000.00 | | | | 1,022.80 | | | | 2.99 | | | | 1,000.00 | | | | 1,031.60 | | | | 3.97 | | | | 1,000.00 | | | | 1,007.00 | | | | 3.32 | | | | 1,000.00 | | | | 990.40 | | | | 4.24 | |
Hypothetical 5% return | | | 1,000.00 | | | | 1,022.11 | + | | | 2.99 | | | | 1,000.00 | | | | 1,022.11 | + | | | 2.99 | | | | 1,000.00 | | | | 1,021.16 | + | | | 3.95 | | | | 1,000.00 | | | | 1,021.76 | + | | | 3.35 | | | | 1,000.00 | | | | 1,020.81 | + | | | 4.31 | |
| Class R | | | | | | | | | | | | | | | | | | | | | | | | | | | | | | | | | | | | | | | | | | | | | | | | | | | | | | | | | | | | |
Actual | | | 1,000.00 | | | | 1,022.40 | | | | 5.53 | | | | 1,000.00 | | | | 1,021.20 | | | | 5.57 | | | | N/A | | | | N/A | | | | N/A | | | | 1,000.00 | | | | 1,004.50 | | | | 5.83 | | | | 1,000.00 | | | | 993.00 | | | | 6.59 | |
Hypothetical 5% return | | | 1,000.00 | | | | 1,019.60 | + | | | 5.52 | | | | 1,000.00 | | | | 1,019.55 | + | | | 5.57 | | | | N/A | | | | N/A | | | | N/A | | | | 1,000.00 | | | | 1,019.25 | + | | | 5.87 | | | | 1,000.00 | | | | 1,018.45 | + | | | 6.68 | |
| * | | Expenses for each share class are calculated using each Fund’s annualized net expense ratio for each class, which represents the ongoing expenses as a percentage of net assets for the six months ended September 30, 2014. Expenses are calculated by multiplying the annualized net expense ratio by the average account value for the period; then multiplying the result by the number of days in the most recent fiscal half year; and then dividing that result by the number of days in the fiscal year. The annualized net expense ratios for the period were as follows: |
| | | | | | | | | | | | | | | | | | | | | | | | | | | | |
| Fund | | Class A | | | Class B | | | Class C | | | Institutional | | | Service | | | Class IR | | | Class R | |
Bond | | | 0.84 | % | | | 1.59 | % | | | 1.59 | % | | | 0.50 | % | | | 0.99 | % | | | 0.59 | % | | | 1.09 | % |
Core Fixed Income | | | 0.85 | | | | 1.60 | | | | 1.60 | | | | 0.51 | | | | 1.01 | | | | 0.59 | | | | 1.10 | |
Global Income | | | 1.04 | | | | 1.79 | | | | 1.78 | | | | 0.70 | | | | 1.19 | | | | 0.78 | | | | N/A | |
Strategic Income | | | 0.91 | | | | N/A | | | | 1.66 | | | | 0.57 | | | | N/A | | | | 0.66 | | | | 1.16 | |
World Bond | | | 1.06 | | | | N/A | | | | 1.81 | | | | 0.72 | | | | N/A | | | | 0.85 | | | | 1.32 | |
| + | | Hypothetical expenses are based on each Fund’s actual annualized net expense ratios and an assumed rate of return of 5% per year before expenses. |
167
GOLDMAN SACHS MULTI SECTOR FIXED INCOME FUNDS
Statement Regarding Basis for Approval of Management Agreements (Unaudited)
Background
The Goldman Sachs Core Fixed Income Fund, Goldman Sachs Bond Fund (formerly, Goldman Sachs Core Plus Fixed Income Fund), Goldman Sachs Global Income Fund, Goldman Sachs Strategic Income Fund, and Goldman Sachs World Bond Fund (the “Funds”) are investment portfolios of Goldman Sachs Trust (the “Trust”). The Board of Trustees oversees the management of the Trust and reviews the investment performance and expenses of the Funds at regularly scheduled meetings held during the year. In addition, the Board of Trustees determines annually whether to approve the continuance of the Trust’s investment management agreements (the “Management Agreements”) on behalf of the Core Fixed Income, Bond and Strategic Income Funds with Goldman Sachs Asset Management, L.P. (“GSAM”) and on behalf of the Global Income and World Bond Funds with Goldman Sachs Asset Management International (together with GSAM, the “Investment Advisers”).
The Management Agreements were most recently approved for continuation until June 30, 2015 by the Board of Trustees, including those Trustees who are not parties to the Management Agreements or “interested persons” (as defined in the Investment Company Act of 1940, as amended) of any party thereto (the “Independent Trustees”), at a meeting held on June 11-12, 2014 (the “Annual Meeting”).
The review process undertaken by the Trustees spans the course of the year and culminates with the Annual Meeting. To assist the Trustees in their deliberations, the Trustees have established a Contract Review Committee (the “Committee”), comprised of the Independent Trustees. The Committee held four meetings over the course of the year since the Management Agreements were last approved. At those Committee meetings, regularly scheduled Board or other committee meetings and/or the Annual Meeting, the Board, or the Independent Trustees, as applicable, considered matters relating to the Management Agreements, including:
| | (a) | | the nature and quality of the advisory, administrative and other services provided to the Funds by the Investment Advisers and their affiliates, including information about: |
| | (i) | | the structure, staff and capabilities of the Investment Advisers and their portfolio management teams; |
| | (ii) | | the groups within the Investment Advisers and their affiliates that support the portfolio management teams or provide other types of necessary services, including fund services groups (e.g., accounting and financial reporting, tax, shareholder services and operations), controls and risk management groups (e.g., legal, compliance, valuation oversight, credit risk management, internal audit, compliance testing, market risk analysis, finance and strategy and central funding), sales and distribution support groups and others (e.g., information technology and training); |
| | (iii) | | trends in headcount; |
| | (iv) | | the Investment Advisers’ financial resources and ability to hire and retain talented personnel and strengthen their operations; and |
| | (v) | | the parent company’s support of the Investment Advisers and their mutual fund business, as expressed by the firm’s senior management; |
| | (b) | | information on the investment performance of each Fund, including comparisons to the performance of similar mutual funds, as provided by a third party mutual fund data provider engaged as part of the contract review process (the “Outside Data Provider”), benchmark performance indices, and comparable institutional composites managed by the Investment Advisers (with the exception of the World Bond Fund), and general investment outlooks in the markets in which the Funds invest; |
| | (c) | | the terms of the Management Agreements and agreements with affiliated service providers entered into by the Trust on behalf of the Funds; |
| | (d) | | expense information for the Funds, including: |
| | (i) | | the relative management fee and expense levels of each Fund as compared to those of comparable funds managed by other advisers, as provided by the Outside Data Provider; |
| | (ii) | | each Fund’s expense trends over time; and |
| | (iii) | | to the extent the Investment Advisers manage institutional accounts or collective investment vehicles having investment objectives and policies similar to those of the Funds, comparative information on the advisory fees charged and services provided to those accounts by the Investment Advisers; |
| | (e) | | with respect to the extensive investment performance and expense comparison data provided by the Outside Data Provider, its processes in producing that data for the Funds; |
| | (f) | | the undertakings of the Investment Advisers to limit certain expenses of each Fund that exceed specified levels, and a summary of contractual fee reductions made by the Investment Advisers and/or their affiliates over the past several years with respect to the Funds; |
| | (g) | | information relating to the profitability of the Management Agreements and the transfer agency and distribution and service arrangements of each Fund and the Trust as a whole to the Investment Advisers and their affiliates; |
168
GOLDMAN SACHS MULTI SECTOR FIXED INCOME FUNDS
Statement Regarding Basis for Approval of Management Agreements (Unaudited) (continued)
| | (h) | | whether each Fund’s existing management fee schedule adequately addressed any economies of scale; |
| | (i) | | a summary of the “fall-out” benefits derived by the Investment Advisers and their affiliates from their relationships with the Funds, including the fees received by the Investment Advisers’ affiliates from the Funds for transfer agency, portfolio trading, distribution and other services; |
| | (j) | | a summary of potential benefits derived by the Funds as a result of their relationship with the Investment Advisers; |
| | (k) | | information regarding portfolio trading and how the Investment Advisers carry out their duty to seek best execution; |
| | (l) | | portfolio manager ownership of Fund shares; the manner in which portfolio manager compensation is determined; and the number and types of accounts managed by the portfolio managers; |
| | (m) | | the nature and quality of the services provided to the Funds by their unaffiliated service providers, and the Investment Advisers’ general oversight and evaluation (including reports on due diligence) of those service providers as part of the administration services provided under the Management Agreements; and |
| | (n) | | the Investment Advisers’ processes and policies addressing various types of potential conflicts of interest; their approach to risk management; the annual review of the effectiveness of the Funds’ compliance program; and periodic compliance reports. |
The Trustees also received an overview of the Funds’ distribution arrangements. They received information regarding the Funds’ assets, share purchase and redemption activity and the payment of Rule 12b-1 distribution and service fees by the Funds and the payment of non-Rule 12b-1 shareholder service and/or administration fees by the Core Fixed Income, Bond, and Global Income Funds’ Service Shares. Information was also provided to the Trustees relating to revenue sharing payments made by and services provided by the Investment Advisers and their affiliates to intermediaries that promote the sale, distribution and/or servicing of Fund shares.
The presentations made at the Board and Committee meetings and at the Annual Meeting encompassed the Funds and other mutual fund portfolios for which the Board of Trustees has responsibility. In evaluating the Management Agreements at the Annual Meeting, the Trustees relied upon their knowledge, resulting from their meetings and other interactions throughout the year, of the Investment Advisers, their affiliates, their services and the Funds. In conjunction with these meetings, the Trustees received written materials and oral presentations on the topics covered, and were advised by their independent legal counsel regarding their responsibilities and other regulatory requirements related to the approval and continuation of mutual fund investment management agreements under applicable law. In addition, the Investment Advisers and their affiliates provided the Independent Trustees with a written response to a formal request for information sent on behalf of the Independent Trustees by their independent legal counsel. During the course of their deliberations, the Independent Trustees met in executive sessions with their independent legal counsel, without representatives of the Investment Advisers or their affiliates present. The Independent Trustees also discussed the broad range of other investment choices that are available to Fund investors, including the availability of comparable funds managed by other advisers.
Nature, Extent and Quality of the Services Provided Under the Management Agreements
As part of their review, the Trustees considered the nature, extent and quality of the services provided by the Investment Advisers. In this regard, the Trustees considered both the investment advisory services and non-advisory services that are provided to the Funds by the Investment Advisers and their affiliates. The Trustees noted the transition in the leadership and changes in personnel of various of the Investment Advisers’ portfolio management teams that had occurred in recent periods, and the ongoing recruitment efforts aimed at bringing high quality investment talent to the Investment Advisers. They also noted the Investment Advisers’ commitment to maintaining high quality systems. The Trustees concluded that the Investment Advisers continued to commit substantial financial and operational resources to the Funds and expressed confidence that the Investment Advisers would continue to do so in the future. The Trustees also recognized that the Investment Advisers had made significant commitments to address regulatory compliance requirements applicable to the Funds and the Investment Advisers.
Investment Performance
The Trustees also considered the investment performance of the Funds. In this regard, they compared the investment performance of each Fund to its peers using rankings and ratings (rankings only for the World Bond Fund) compiled by the Outside Data Provider as of December 31, 2013, and updated performance information prepared by the Investment Advisers using the peer groups identified by the Outside Data Provider as of March 31, 2014. The information on each Fund’s investment performance was provided for the one-, three-, five- and ten-year periods ending on the applicable dates, to the extent that each Fund had been in existence for those periods. The Trustees also reviewed each Fund’s investment performance over time (including on a year-by-year basis) relative to its performance benchmark. As part of this review, they considered the investment performance trends of the Funds over time, and reviewed the investment performance of each Fund in light of its investment
169
GOLDMAN SACHS MULTI SECTOR FIXED INCOME FUNDS
Statement Regarding Basis for Approval of Management Agreements (Unaudited) (continued)
objective and policies and market conditions. The Trustees also received information comparing the performance of each Fund (other than the World Bond Fund) to that of a composite of institutional accounts managed by the Investment Advisers having comparable investment characteristics.
In addition, the Trustees considered materials prepared and presentations made by the Investment Advisers’ senior management and portfolio management personnel, in which Fund performance was assessed. The Trustees also considered the Investment Advisers’ periodic reports with respect to the Funds’ risk profiles, and how the Investment Advisers’ approach to risk monitoring and management influences portfolio management.
The Trustees observed that the Core Fixed Income Fund’s Class A Shares had placed in the second quartile of the Fund’s peer group for the one-, three-, and five-year periods and in the third quartile for the ten-year period, and had outperformed the Fund’s benchmark index for the one-, three-, and five-year periods and underperformed for the ten-year period ended March 31, 2014. They observed that the Bond Fund’s Class A Shares had placed in the top half of the Fund’s peer group and had outperformed the Fund’s benchmark index for the one-, three-, and five-year periods ended March 31, 2014. They noted that the Global Income Fund’s Class A Shares had placed in the first quartile of the Fund’s peer group for the one- and three-year periods and in the third quartile for the five- and ten-year periods, and had outperformed the Fund’s benchmark index for the one-, three-, and five-year periods and underperformed for the ten-year period ended March 31, 2014. They noted that the Global Income Fund had certain significant differences from its peer group that caused the peer group to be an imperfect basis for performance comparison. The Trustees noted that the Strategic Income Fund’s Class A Shares had placed in the first quartile of the Fund’s peer group and had outperformed the Fund’s LIBOR-based benchmark index by 3.87% and 5.09%, respectively, for the one- and three-year periods ended March 31, 2014. The Trustees noted that the Strategic Income Fund had certain significant differences from its benchmark index that caused the index to be an imperfect basis for performance comparison. They observed that the World Bond Fund’s Class A Shares had placed in the fourth quartile of the Fund’s peer group and had outperformed the Fund’s benchmark index for the one-year period ended March 31, 2014.
Costs of Services Provided and Competitive Information
The Trustees considered the contractual terms of the Management Agreements and the fee rates payable by each Fund thereunder. In this regard, the Trustees considered information on the services rendered by the Investment Advisers to the Funds, which included both advisory and administrative services that were directed to the needs and operations of the Funds as registered mutual funds.
In particular, the Trustees reviewed analyses prepared by the Outside Data Provider regarding the expense rankings of the Funds. The analyses provided a comparison of the Funds’ management fees and breakpoints to those of relevant peer groups and category universes; an expense analysis which compared each Fund’s overall net and gross expenses to a peer group and a category universe; and a five-year history (or, in the case of Funds that commenced investment operations within a shorter period, since the year in which it commenced operations) comparing each Fund’s net expenses to the peer and category medians. The analyses also compared each Fund’s transfer agency, custody, and distribution fees, other expenses and fee waivers/reimbursements to those of the peer group and category medians. The Trustees concluded that the comparisons provided by the Outside Data Provider were useful in evaluating the reasonableness of the management fees and total expenses paid by the Funds.
In addition, the Trustees considered the Investment Advisers’ undertakings to limit certain expenses of the Funds that exceed specified levels. They also considered, to the extent that the Investment Advisers manage institutional accounts or collective investment vehicles having investment objectives and policies similar to those of the Funds, comparative fee information for services provided by the Investment Advisers to those accounts, and information that indicated that services provided to the Funds differed in various significant respects from the services provided to institutional accounts, which generally operated under less stringent legal and regulatory structures, required fewer services from the Investment Advisers to a smaller number of client contact points, were less time-intensive and paid lower fees.
In addition, the Trustees noted that shareholders are able to redeem their Fund shares at any time if shareholders believe that the Fund fees and expenses are too high or if they are dissatisfied with the performance of the Fund.
Profitability
The Trustees reviewed the Investment Advisers’ revenues and pre-tax profit margins with respect to the Trust and each of the Funds. In this regard the Trustees noted that they had received, among other things, profitability analyses and summaries, revenue and expense schedules by Fund and by function (i.e., investment management, transfer agency and distribution and service) and information on the Investment Advisers’ expense allocation methodology. They observed that the profitability and expense figures are substantially similar to those used by the Investment Advisers for many internal purposes, including compensation decisions among various business groups, and are thus subject to a vigorous internal debate about how certain revenue and expenses should
170
GOLDMAN SACHS MULTI SECTOR FIXED INCOME FUNDS
Statement Regarding Basis for Approval of Management Agreements (Unaudited) (continued)
be allocated. The Trustees also noted that the internal audit group within the Goldman Sachs organization had audited the expense allocation methodology and was satisfied with the reasonableness, consistency, and accuracy of the Investment Advisers’ expense allocation methodology and profitability analysis calculations. Profitability data for the Trust and each Fund were provided for 2013 and 2012 (2013 only for the World Bond Fund), and the Trustees considered this information in relation to the Investment Advisers’ overall profitability. The Trustees considered the Investment Advisers’ revenues and pre-tax profit margins both in absolute terms and in comparison to information on the reported pre-tax profit margins earned by certain other asset management firms.
Economies of Scale
The Trustees considered the information that had been provided regarding the Investment Advisers’ profitability. The Trustees also considered the breakpoints in the fee rate payable under the Management Agreements for each of the Funds at the following annual percentage rates of the average daily net assets of the Funds:
| | | | | | | | | | | | | | | | | | | | |
Average Daily Net Assets | | Core Fixed
Income
Fund | | | Bond
Fund | | | Global
Income
Fund | | | Strategic
Income
Fund | | | World Bond
Fund | |
| First $1 billion | | | 0.40 | % | | | 0.45 | % | | | 0.65 | % | | | 0.60 | % | | | 0.65 | % |
| Next $1 billion | | | 0.36 | | | | 0.41 | | | | 0.59 | | | | 0.54 | | | | 0.59 | |
| Next $3 billion | | | 0.34 | | | | 0.39 | | | | 0.56 | | | | 0.51 | | | | 0.56 | |
| Next $3 billion | | | 0.33 | | | | 0.38 | | | | 0.55 | | | | 0.50 | | | | 0.54 | |
| Over $8 billion | | | 0.32 | | | | 0.37 | | | | 0.54 | | | | 0.49 | | | | 0.53 | |
The Trustees noted that the breakpoints were meant to share potential economies of scale, if any, with the Funds and their shareholders as assets under management reach those asset levels. The Trustees considered the amounts of assets in the Funds; the Funds’ recent share purchase and redemption activity; the information provided by the Investment Advisers relating to the costs of the services provided by the Investment Advisers and their affiliates and their realized profits; information comparing fee rates charged by the Investment Advisers with fee rates charged to other funds in the peer groups; and the Investment Advisers’ undertakings to limit certain expenses of the Funds that exceed specified levels. Upon reviewing these matters at the Annual Meeting, the Trustees concluded that the fee breakpoints represented a means of assuring that benefits of scalability, if any, would be passed along to shareholders at the specified asset levels. They also noted that GSAM had passed along savings to shareholders of the Core Fixed Income and Strategic Income Funds, which had asset levels above at least the first breakpoint during the prior fiscal year.
Other Benefits to the Investment Advisers and Their Affiliates
The Trustees also considered the other benefits derived by the Investment Advisers and their affiliates from their relationships with the Funds as stated above, including: (a) transfer agency fees received by Goldman, Sachs & Co. (“Goldman Sachs”); (b) futures commissions earned by Goldman Sachs for executing futures transactions on behalf of the Funds; (c) trading efficiencies resulting from aggregation of orders of the Funds with those for other funds or accounts managed by the Investment Advisers; (d) the Investment Advisers’ ability to leverage the infrastructure designed to service the Funds on behalf of their other clients; (e) the Investment Advisers’ ability to cross-market other products and services to Fund shareholders; (f) Goldman Sachs’ retention of certain fees as Fund Distributor; (g) the Investment Advisers’ ability to negotiate better pricing with custodians on behalf of their other clients, as a result of the relationship with the Funds; and (h) the possibility that the working relationship between the Investment Advisers and the Funds’ third party service providers may cause those service providers to be more likely to do business with other areas of Goldman Sachs. In the course of considering the foregoing, the Independent Trustees requested and received further information quantifying certain of these fall-out benefits.
Other Benefits to the Funds and Their Shareholders
The Trustees also noted that the Funds receive certain potential benefits as a result of their relationship with the Investment Advisers, including: (a) trading efficiencies resulting from aggregation of orders of the Funds with those of other funds or accounts managed by the Investment Advisers; (b) enhanced servicing from vendors because of the volume of business generated by the Investment Advisers and their affiliates; (c) enhanced servicing from broker-dealers because of the volume of business generated by the Investment Advisers and their affiliates; (d) the Investment Advisers’ ability to negotiate favorable terms with derivatives counterparties on behalf of the Funds as a result of the size and reputation of the Goldman Sachs organization; (e) the Investment Advisers’ knowledge and experience gained from managing other accounts and products; (f) the Investment Advisers’ ability to
171
GOLDMAN SACHS MULTI SECTOR FIXED INCOME FUNDS
Statement Regarding Basis for Approval of Management Agreements (Unaudited) (continued)
hire and retain qualified personnel to provide services to the Funds because of the reputation of the Goldman Sachs organization; (g) the Funds’ access, through the Investment Advisers, to certain firmwide resources (e.g., proprietary risk management systems and databases), subject to certain restrictions; and (h) the Funds’ access to certain affiliated distribution channels. In addition, the Trustees noted the competitive nature of the mutual fund marketplace, and considered that many of the Funds’ shareholders invested in the Funds in part because of the Funds’ relationship with the Investment Advisers and that those shareholders have a general expectation that the relationship will continue.
Conclusion
In connection with their consideration of the Management Agreements, the Trustees gave weight to each of the factors described above, but did not identify any particular factor as controlling their decision. After deliberation and consideration of all of the information provided, including the factors described above, the Trustees concluded, in the exercise of their business judgment, that the management fees paid by each of the Funds were reasonable in light of the services provided to it by its respective Investment Adviser, the Investment Advisers’ costs and each Fund’s current and reasonably foreseeable asset levels. The Trustees unanimously concluded that the Investment Advisers’ continued management likely would benefit each applicable Fund and its shareholders and that the Management Agreements should be approved and continued with respect to each applicable Fund until June 30, 2015.
172
FUNDS PROFILE
Goldman Sachs Funds

Goldman Sachs is a premier financial services firm, known since 1869 for creating thoughtful and customized investment solutions in complex global markets.
Today, the Investment Management Division of Goldman Sachs serves a diverse set of clients worldwide, including private institutions, public entities and individuals. With approximately $999.2 billion in assets under supervision as of September 30, 2014, Goldman Sachs Asset Management (“GSAM”) has portfolio management teams located around the world and our investment professionals bring firsthand knowledge of local markets to every investment decision. Assets under supervision includes assets under management and other client assets for which Goldman Sachs does not have full discretion. GSAM leverages the resources of Goldman, Sachs & Co. subject to legal, internal and regulatory restrictions.

Money Market1
Financial Square FundsSM
| n | | Financial Square Tax-Exempt Funds |
| n | | Financial Square Federal Fund |
| n | | Financial Square Government Fund |
| n | | Financial Square Money Market Fund |
| n | | Financial Square Prime Obligations Fund |
| n | | Financial Square Treasury Instruments Fund |
| n | | Financial Square Treasury Obligations Fund |
Fixed Income
Short Duration and Government
| n | | High Quality Floating Rate Fund |
| n | | Limited Maturity Obligations Fund |
| n | | Short Duration Government Fund |
| n | | Short Duration Income Fund |
| n | | Inflation Protected Securities Fund |
Multi-Sector
Municipal and Tax-Free
| n | | High Yield Municipal Fund |
| n | | Short Duration Tax-Free Fund |
Single Sector
| n | | Investment Grade Credit Fund |
| n | | High Yield Floating Rate Fund |
| n | | Emerging Markets Debt Fund |
| n | | Local Emerging Markets Debt Fund |
| n | | Dynamic Emerging Markets Debt Fund |
Fixed Income Alternatives
| n | | Long Short Credit Strategies Fund3 |
| n | | Fixed Income Macro Strategies Fund |
Fundamental Equity
| n | | Small/Mid Cap Value Fund |
| n | | Small/Mid Cap Growth Fund |
| n | | Flexible Cap Growth Fund |
| n | | Concentrated Growth Fund |
| n | | Technology Tollkeeper Fund |
| n | | Growth Opportunities Fund |
| n | | Rising Dividend Growth Fund |
Tax-Advantaged Equity
| n | | U.S. Tax-Managed Equity Fund4 |
| n | | International Tax-Managed Equity Fund4 |
| n | | U.S. Equity Dividend and Premium Fund |
| n | | International Equity Dividend and Premium Fund |
Equity Insights
| n | | Small Cap Equity Insights Fund |
| n | | U.S. Equity Insights Fund |
| n | | Small Cap Growth Insights Fund |
| n | | Large Cap Growth Insights Fund |
| n | | Large Cap Value Insights Fund |
| n | | Small Cap Value Insights Fund |
| n | | International Small Cap Insights Fund |
| n | | International Equity Insights Fund |
| n | | Emerging Markets Equity Insights Fund |
Fundamental Equity International
| n | | Strategic International Equity Fund |
| n | | Focused International Equity Fund5 |
| n | | International Small Cap Fund |
| n | | Emerging Markets Equity Fund |
| n | | BRIC Fund (Brazil, Russia, India, China) |
Select Satellite6
| n | | Real Estate Securities Fund |
| n | | International Real Estate Securities Fund |
| n | | Commodity Strategy Fund |
| n | | Dynamic Commodity Strategy Fund |
| n | | Dynamic Allocation Fund |
| n | | Absolute Return Tracker Fund |
| n | | Managed Futures Strategy Fund |
| n | | MLP Energy Infrastructure Fund |
| n | | Multi-Manager Alternatives Fund |
| n | | Multi-Asset Real Return Fund |
| n | | Retirement Portfolio Completion Fund |
| n | | Tactical Tilt Implementation Fund |
Total Portfolio Solutions6
| n | | Balanced Strategy Portfolio |
| n | | Growth and Income Strategy Portfolio |
| n | | Growth Strategy Portfolio |
| n | | Equity Growth Strategy Portfolio |
| n | | Satellite Strategies Portfolio |
| n | | Enhanced Dividend Global Equity Portfolio |
| n | | Tax Advantaged Global Equity Portfolio |
| 1 | | An investment in a money market fund is neither insured nor guaranteed by the Federal Deposit Insurance Corporation (“FDIC”) or any other government agency. Although the Funds seek to preserve the value of your investment at $1.00 per share, it is possible to lose money by investing in the Funds. |
| 2 | | Effective on October 1, 2014, the Goldman Sachs Core Plus Fixed Income Fund was renamed the Goldman Sachs Bond Fund. |
| 3 | | Effective at the close of business on March 21, 2014, the Goldman Sachs Credit Strategies Fund was reorganized with and into the Goldman Sachs Long Short Credit Strategies Fund. |
| 4 | | Effective on April 30, 2014, the Goldman Sachs Structured Tax-Managed Equity and Structured International Tax-Managed Equity Funds were renamed the Goldman Sachs U.S. Tax-Managed Equity and International Tax-Managed Equity Funds, respectively. |
| 5 | | Effective on February 28, 2014, the Goldman Sachs Concentrated International Equity Fund was renamed the Goldman Sachs Focused International Equity Fund. |
| 6 | | Individual Funds within the Total Portfolio Solutions and Select Satellite categories will have various placement on the risk/return spectrum and may have greater or lesser risk than that indicated by the placement of the general Total Portfolio Solutions or Select Satellite category. |
Financial Square FundsSM is a registered service mark of Goldman, Sachs & Co.
| * | | This list covers open-end funds only. Please visit our website at www.GSAMFUNDS.com to learn about our closed-end funds. |
| | |
TRUSTEES Ashok N. Bakhru, Chairman John P. Coblentz, Jr. Diana M. Daniels Joseph P. LoRusso Herbert J. Markley James A. McNamara Jessica Palmer Alan A. Shuch Richard P. Strubel Roy W. Templin | | OFFICERS James A. McNamara, President Scott M. McHugh, Principal Financial Officer and Treasurer Caroline Kraus, Secretary |
| |
GOLDMAN, SACHS & CO. Distributor and Transfer Agent | | GOLDMAN SACHS ASSET MANAGEMENT INTERNATIONAL Investment Adviser |
| | GOLDMAN SACHS ASSET MANAGEMENT, L.P. Investment Adviser |
Visit our web site at www.GSAMFUNDS.com to obtain the most recent month-end returns.
Goldman Sachs Asset Management, L.P., 200 West Street, New York, New York 10282
The reports concerning the Funds included in this shareholder report may contain certain forward-looking statements about the factors that may affect the performance of the Funds in the future. These statements are based on Fund management’s predictions and expectations concerning certain future events and their expected impact on the Funds, such as performance of the economy as a whole and of specific industry sectors, changes in the levels of interest rates, the impact of developing world events, and other factors that may influence the future performance of the Funds. Management believes these forward-looking statements to be reasonable, although they are inherently uncertain and difficult to predict. Actual events may cause adjustments in portfolio management strategies from those currently expected to be employed.
A description of the policies and procedures that the Funds use to determine how to vote proxies relating to portfolio securities and information regarding how a Fund voted proxies relating to portfolio securities during the most recent 12-month period ended June 30 is available (I) without charge, upon request by calling 1-800-526-7384 (for Retail Shareholders) or 1-800-621-2550 (for Institutional Shareholders); and (II) on the Securities and Exchange Commission (“SEC”) web site at http://www.sec.gov.
The Funds file their complete schedule of portfolio holdings with the SEC for the first and third quarters of each fiscal year on Form N-Q. The Funds’ Forms N-Q are available on the SEC’s web site at http://www.sec.gov within 60 days after the Funds’ first and third fiscal quarters. The Funds’ Forms N-Q may be reviewed and copied at the SEC’s Public Reference Room in Washington, D.C., and information on the operation of the Public Reference Room may be obtained by calling 1-800-SEC-0330. Forms N-Q may be obtained upon request and without charge by calling 1-800-526-7384 (for Retail Shareholders) or 1-800-621-2550 (for Institutional Shareholders).
Economic and market forecasts presented herein reflect our judgment as of the date of this presentation and are subject to change without notice. These forecasts do not take into account the specific investment objectives, restrictions, tax and financial situation or other needs of any specific client. Actual data will vary and may not be reflected here. These forecasts are subject to high levels of uncertainty that may affect actual performance. Accordingly, these forecasts should be viewed as merely representative of a broad range of possible outcomes. These forecasts are estimated, based on assumptions, and are subject to significant revision and may change materially as economic and market conditions change. Goldman Sachs has no obligation to provide updates or changes to these forecasts. Case studies and examples are for illustrative purposes only.
Fund holdings and allocations shown are as of September 30, 2014 and may not be representative of future investments. Fund holdings should not be relied on in making investment decisions and should not be construed as research or investment advice regarding particular securities.
This material is not authorized for distribution to prospective investors unless preceded or accompanied by a current Prospectus or summary prospectus, if applicable. Investors should consider a Fund’s objective, risks, and charges and expenses, and read the summary prospectus, if available, and/or the Prospectus carefully before investing or sending money. The summary prospectus, if available, and the Prospectus contain this and other information about a Fund and may be obtained from your authorized dealer or from Goldman, Sachs & Co. by calling (retail – 1-800-526-7384) (institutional – 1-800-621-2550).
Copyright 2014 Goldman, Sachs & Co. All rights reserved. 146165.MF.MED.TMPL/11/2014 MSFISAR-14/201K
The information required by this Item is only required in an annual report on this Form N-CSR.
| ITEM 3. | AUDIT COMMITTEE FINANCIAL EXPERT. |
The information required by this Item is only required in an annual report on this Form N-CSR.
| ITEM 4. | PRINCIPAL ACCOUNTANT FEES AND SERVICES. |
The information required by this Item is only required in an annual report on this Form N-CSR.
| ITEM 5. | AUDIT COMMITTEE OF LISTED REGISTRANTS. |
| ITEM 6. | SCHEDULE OF INVESTMENTS. |
| | Schedule of Investments is included as part of the Report to Stockholders filed under Item 1. |
| ITEM 7. | DISCLOSURE OF PROXY VOTING POLICIES AND PROCEDURES FOR CLOSED-END MANAGEMENT INVESTMENT COMPANIES. |
| ITEM 8. | PORTFOLIO MANAGERS OF CLOSED-END MANAGEMENT INVESTMENT COMPANIES. |
| ITEM 9. | PURCHASES OF EQUITY SECURITIES BY CLOSED-END MANAGEMENT INVESTMENT COMPANY AND AFFILIATED PURCHASERS. |
| ITEM 10. | SUBMISSION OF MATTERS TO A VOTE OF SECURITY HOLDERS. |
| | There have been no material changes to the procedures by which shareholders may recommend nominees to the registrant’s board of trustees. |
| ITEM 11. | CONTROLS AND PROCEDURES. |
| | (a) | The registrant’s principal executive and principal financial officers, or persons performing similar functions have concluded that the registrant’s disclosure controls and procedures (as defined in Rule 30a-3(c) under the Investment Company Act of 1940, as amended (the “1940 Act”)) are effective as of a date within 90 days of the filing of this report that includes the disclosure required by this paragraph, based on the evaluation of these controls and procedures required by Rule 30a-3(b) under the 1940 Act and 15d-15(b) under the Securities Exchange Act of 1934, as amended. |
| | (b) | There were no changes in the registrant’s internal control over financial reporting (as defined in Rule 30a-3(d) under the 1940 Act) that occurred during the registrant’s second fiscal quarter of the period covered by this report that have materially affected, or are reasonably likely to materially affect, the registrant’s internal control over financial reporting. |
| | | | |
| (a)(1) | | The information required by this Item is only required in connection with an annual report on this Form N-CSR. |
| | |
| (a)(2) | | Exhibit 99.CERT | | Certifications pursuant to Section 302 of the Sarbanes-Oxley Act of 2002 filed herewith. |
| | |
| (b) | | Exhibit 99.906CERT | | Certifications pursuant to Section 906 of the Sarbanes-Oxley Act of 2002 filed herewith. |
SIGNATURES
Pursuant to the requirements of the Securities Exchange Act of 1934 and the Investment Company Act of 1940, the registrant has duly caused this report to be signed on its behalf by the undersigned, thereunto duly authorized.
| | |
| | | Goldman Sachs Trust |
| |
| By: | | /s/ James A. McNamara |
| |
| | |
| | James A. McNamara |
| | President/Principal Executive Officer |
| | Goldman Sachs Trust |
| |
| Date: | | December 3, 2014 |
Pursuant to the requirements of the Securities Exchange Act of 1934 and the Investment Company Act of 1940, this report has been signed below by the following persons on behalf of the registrant and in the capacities and on the dates indicated.
| | |
| By: | | /s/ James A. McNamara |
| |
| | |
| | James A. McNamara |
| | President/Principal Executive Officer |
| | Goldman Sachs Trust |
| |
| Date: | | December 3, 2014 |
| |
| By: | | /s/ Scott McHugh |
| |
| | |
| | Scott McHugh |
| | Principal Financial Officer |
| | Goldman Sachs Trust |
| |
| Date: | | December 3, 2014 |