UNITED STATES
SECURITIES AND EXCHANGE COMMISSION
Washington, D.C. 20549
FORM N-CSR
CERTIFIED SHAREHOLDER REPORT OF REGISTERED
MANAGEMENT INVESTMENT COMPANIES
Investment Company Act file number 811-05349
Goldman Sachs Trust
(Exact name of registrant as specified in charter)
71 South Wacker Drive, Chicago, Illinois 60606
(Address of principal executive offices) (Zip code)
| | |
| Caroline Kraus, Esq. | | Copies to: |
| Goldman, Sachs & Co. | | Geoffrey R.T. Kenyon, Esq. |
| 200 West Street | | Dechert LLP |
| New York, New York 10282 | | 100 Oliver Street |
| | 40th Floor |
| | Boston, MA 02110-2605 |
(Name and address of agents for service)
Registrant’s telephone number, including area code: (312) 655-4400
Date of fiscal year end: December 31
Date of reporting period: June 30, 2014
Explanatory Note
The Registrant is filing this amendment to its Form N-CSR for the period ended June 30, 2014, originally filed with the Securities and Exchange Commission on September 3, 2014 (Accession Number 0001193125-14-330390), to amend Item 1, “Reports to Stockholders.” The purpose of the amendment to Item 1 is to supplement the Semi-Annual Shareholder Report for the Absolute Return Tracker, Commodity Strategy, Dynamic Allocation, Dynamic Commodity Strategy, Managed Futures Strategy, International Real Estate Securities, and Real Estate Securities Funds to include material inadvertently omitted.
| ITEM 1. | REPORTS TO STOCKHOLDERS. |
| | The Semi-Annual Report to Stockholders is filed herewith. |
GOLDMAN SACHS TRUST
Goldman Sachs Select Satellite Funds
Goldman Sachs Absolute Return Tracker Fund
Goldman Sachs Commodity Strategy Fund
Goldman Sachs Dynamic Allocation Fund
Goldman Sachs Dynamic Commodity Strategy Fund
Goldman Sachs International Real Estate Securities Fund
Goldman Sachs Managed Futures Strategy Fund
Goldman Sachs Real Estate Securities Fund (the “Funds”)
Supplement to the Semi-Annual Report for the period ended
June 30, 2014 (the “Semi-Annual Report”)
This Supplement updates certain information contained in the Funds’ Semi-Annual Report. You may obtain a copy of the Semi-Annual Report free of charge, upon request, by calling Goldman Sachs at 1-800-526-7384. You can also access and download the Funds’ annual and semi-annual reports at the Funds’ website: http://www.GSAMFUNDS.com.
The following disclosure regarding the basis for the Board’s approval of the Funds’ management agreement is hereby inserted after the text box labeled “Fund Expenses —Six Month Period Ended June 30, 2014 (Unaudited) (continued)” on page 124 of the Semi-Annual Report:
Statement Regarding Basis for Approval of Management Agreement (Unaudited)
Background
The Goldman Sachs Absolute Return Tracker Fund, Goldman Sachs Commodity Strategy Fund, Goldman Sachs Dynamic Allocation Fund, Goldman Sachs Dynamic Commodity Strategy Fund, Goldman Sachs International Real Estate Securities Fund, Goldman Sachs Managed Futures Strategy Fund and Goldman Sachs Real Estate Securities Fund (the “Funds”) are investment portfolios of Goldman Sachs Trust (the “Trust”). The Board of Trustees oversees the management of the Trust and reviews the investment performance and expenses of the Funds at regularly scheduled meetings held during the year. In addition, the Board of Trustees determines annually whether to approve the continuance of the Trust’s investment management agreement (the “Management Agreement”) with Goldman Sachs Asset Management, L.P. (the “Investment Adviser”) on behalf of the Funds.
The Management Agreement was most recently approved for continuation until June 30, 2015 by the Board of Trustees, including those Trustees who are not parties to the Management Agreement or “interested persons” (as defined in the Investment Company Act of 1940, as amended) of any party thereto (the “Independent Trustees”), at a meeting held on June 11-12, 2014 (the “Annual Meeting”).
The review process undertaken by the Trustees spans the course of the year and culminates with the Annual Meeting. To assist the Trustees in their deliberations, the Trustees have established a Contract Review Committee (the “Committee”), comprised of the Independent Trustees. The Committee held four meetings over the course of the year since the Management Agreement was last approved. At those Committee meetings, regularly scheduled Board or other committee meetings and/or the Annual Meeting, the Board, or the Independent Trustees, as applicable, considered matters relating to the Management Agreement, including:
(a) the nature and quality of the advisory, administrative and other services provided to the Funds by the Investment Adviser and its affiliates, including information about:
(i) the structure, staff and capabilities of the Investment Adviser and its portfolio management teams;
(ii) the groups within the Investment Adviser and its affiliates that support the portfolio management teams or provide other types of necessary services, including fund services groups (e.g., accounting and financial reporting, tax, shareholder services and operations), controls and risk management groups (e.g., legal, compliance, valuation oversight, credit risk management, internal audit, compliance testing, market risk analysis, finance and strategy and central funding), sales and distribution support groups and others (e.g., information technology and training);
(iii) trends in headcount;
(iv) the Investment Adviser’s financial resources and ability to hire and retain talented personnel and strengthen its operations; and
(v) the parent company’s support of the Investment Adviser and its mutual fund business, as expressed by the firm’s senior management;
(b) information on the investment performance of each Fund (except for the Dynamic Commodity Strategy Fund, which commenced operations in 2014), including comparisons to the performance of similar mutual funds, as provided by a third party mutual fund data provider engaged as part of the contract review process (the “Outside Data Provider”), and benchmark performance indices, and general investment outlooks in the markets in which the Funds invest;
(c) the terms of the Management Agreement and agreements with affiliated service providers entered into by the Trust on behalf of the Funds;
(d) expense information for the Funds, including:
(i) the relative management fee and expense levels of each Fund as compared to those of comparable funds managed by other advisers, as provided by the Outside Data Provider;
2
(ii) each Fund’s (except for the Dynamic Commodity Strategy Fund) expense trends over time; and
(iii) to the extent the Investment Adviser manages institutional accounts or collective investment vehicles having investment objectives and policies similar to those of the Funds, comparative information on the advisory fees charged and services provided to those accounts by the Investment Adviser;
(e) with respect to the extensive investment performance and expense comparison data provided by the Outside Data Provider, its processes in producing that data for the Funds;
(f) the undertakings of the Investment Adviser to waive certain fees (with respect to the Absolute Return Tracker, Dynamic Allocation, International Real Estate Securities, and Real Estate Securities Funds) and to limit certain expenses of each Fund that exceed specified levels, and a summary of contractual fee reductions made by the Investment Adviser and/or its affiliates over the past several years with respect to the Funds;
(g) information relating to the profitability of the Management Agreement and the transfer agency and distribution and service arrangements of each Fund (except the Dynamic Commodity Strategy Fund) and the Trust as a whole to the Investment Adviser and its affiliates;
(h) whether each Fund’s existing management fee schedule adequately addressed any economies of scale;
(i) a summary of the “fall-out” benefits derived by the Investment Adviser and its affiliates from their relationships with the Funds, including the fees received by the Investment Adviser’s affiliates from the Funds for transfer agency, portfolio trading, distribution and other services;
(j) a summary of potential benefits derived by the Funds as a result of their relationship with the Investment Adviser;
(k) information regarding commissions paid by the Funds and broker oversight, an update on the Investment Adviser’s soft dollars practices, other information regarding portfolio trading and how the Investment Adviser carries out its duty to seek best execution;
(l) portfolio manager ownership of Fund shares; the manner in which portfolio manager compensation is determined; and the number and types of accounts managed by the portfolio managers;
(m) the nature and quality of the services provided to the Funds by their unaffiliated service providers, and the Investment Adviser’s general oversight and evaluation (including reports on due diligence) of those service providers as part of the administration services provided under the Management Agreement; and
3
(n) the Investment Adviser’s processes and policies addressing various types of potential conflicts of interest; its approach to risk management; the annual review of the effectiveness of the Funds’ compliance program; and periodic compliance reports.
The Trustees also received an overview of the Funds’ distribution arrangements. They received information regarding the Funds’ assets, share purchase and redemption activity and the payment of Rule 12b-1 distribution and service fees by the Funds and the payment of non-Rule 12b-1 shareholder service and/or administration fees by the Real Estate Securities Fund’s Service Shares. Information was also provided to the Trustees relating to revenue sharing payments made by and services provided by the Investment Adviser and its affiliates to intermediaries that promote the sale, distribution and/or servicing of Fund shares.
The presentations made at the Board and Committee meetings and at the Annual Meeting encompassed the Funds and other mutual fund portfolios for which the Board of Trustees has responsibility. In evaluating the Management Agreement at the Annual Meeting, the Trustees relied upon their knowledge, resulting from their meetings and other interactions throughout the year, of the Investment Adviser, its affiliates, their services and the Funds. In conjunction with these meetings, the Trustees received written materials and oral presentations on the topics covered, and were advised by their independent legal counsel regarding their responsibilities and other regulatory requirements related to the approval and continuation of mutual fund investment management agreements under applicable law. In addition, the Investment Adviser and its affiliates provided the Independent Trustees with a written response to a formal request for information sent on behalf of the Independent Trustees by their independent legal counsel. During the course of their deliberations, the Independent Trustees met in executive sessions with their independent legal counsel, without representatives of the Investment Adviser or its affiliates present. The Independent Trustees also discussed the broad range of other investment choices that are available to Fund investors, including the availability of comparable funds managed by other advisers.
Nature, Extent and Quality of the Services Provided Under the Management Agreement
As part of their review, the Trustees considered the nature, extent and quality of the services provided by the Investment Adviser. In this regard, the Trustees considered both the investment advisory services and non-advisory services that are provided to the Funds by the Investment Adviser and its affiliates. The Trustees noted the transition in the leadership and changes in personnel of various of the Investment Adviser’s portfolio management teams that had occurred in recent periods, and the ongoing recruitment efforts aimed at bringing high quality investment talent to the Investment Adviser. They also noted the Investment Adviser’s commitment to maintaining high quality systems. The Trustees concluded that the Investment Adviser continued to commit substantial financial and operational resources to the Funds and expressed confidence that the Investment Adviser would continue to do so in the future. The Trustees also recognized that the Investment Adviser had made significant commitments to address regulatory compliance requirements applicable to the Funds and the Investment Adviser.
4
Investment Performance
The Trustees also considered the investment performance of the Funds. In this regard, they compared the investment performance of each Fund (with the exception of the Dynamic Commodity Strategy Fund, which commenced operations in 2014) to its peers using rankings and ratings compiled by the Outside Data Provider as of December 31, 2013, and updated performance information prepared by the Investment Adviser using the peer groups identified by the Outside Data Provider as of March 31, 2014. The information on each Fund’s investment performance was provided for the one-, three-, five- and ten-year periods ending on the applicable dates, to the extent that each Fund had been in existence for those periods. The Trustees also reviewed each Fund’s investment performance over time (including on a year-by-year basis) relative to its performance benchmark. As part of this review, they considered the investment performance trends of the Funds over time, and reviewed the investment performance of each Fund in light of its investment objective and policies and market conditions.
In addition, the Trustees considered materials prepared and presentations made by the Investment Adviser’s senior management and portfolio management personnel, in which Fund performance was assessed. The Trustees also considered the Investment Adviser’s periodic reports with respect to the Funds’ risk profiles, and how the Investment Adviser’s approach to risk monitoring and management influences portfolio management.
The Trustees observed that the Absolute Return Tracker Fund’s Class A Shares had placed in the first quartile of the Fund’s peer group for the one-year period, in the third quartile for the three-year period, and in the fourth quartile for the five-year period, and had outperformed the Fund’s benchmark index for the one- and three-year periods and underperformed for the five-year period ended March 31, 2014. They considered that the Absolute Return Tracker Fund had undergone certain investment process enhancements in July 2013, as well as changes to the Fund’s investment strategy in October 2013 that permit the Fund to gain exposure to the commodities markets by investing in a wholly-owned subsidiary. They also noted that the Absolute Return Tracker Fund’s peer group (Multialternative) provides an imperfect performance comparison. The Trustees observed that the Commodity Strategy Fund’s Class A Shares had placed in the top half of the Fund’s peer group and had underperformed the Fund’s benchmark index for the one-, three, and five-year periods ended March 31, 2014. They noted that the Commodity Strategy Fund’s peer group (Commodities Broad Basket) and benchmark index (S&P GSCI Total Return Index) provide imperfect performance comparisons. They noted that the Dynamic Allocation Fund’s Class A Shares had placed in the third quartile of the Fund’s peer group for the one-year period and in the fourth quartile for the three-year period, and had outperformed the Fund’s LIBOR-based benchmark index by 0.57% and 2.22%, respectively, for the one- and three-year periods ended March 31, 2014. The Trustees noted enhancements to the Dynamic Allocation Fund’s investment strategy in October 2013 designed to provide increased liquidity and diversity in the Fund’s U.S. equity investments, and to provide the Fund with exposure to master limited partnerships. They noted that the Managed Futures Strategy Fund’s Class A Shares had placed in the fourth quartile of the Fund’s peer group and had underperformed the Fund’s
5
LIBOR-based benchmark index by 8.13% for the one-year period ended March 31, 2014. The Trustees noted changes to the Managed Futures Strategy Fund’s investment strategy in December 2013 that permit the Fund to gain exposure to the commodities markets through investments in commodity-linked notes. They noted that the International Real Estate Securities Fund’s Class A Shares had placed in the third quartile of the Fund’s peer group for the one-year period and in the fourth quartile for the three- and five-year periods, and had outperformed the Fund’s benchmark index for the one-year period and underperformed the Fund’s benchmark index for the three- and five-year periods ended March 31, 2014. The Trustees noted that the International Real Estate Securities Fund’s peer group (Global Real Estate) provides an imperfect performance comparison because it is dominated by funds that invest in all countries (including the U.S.), while the Fund only invests outside of the U.S. They observed that the Real Estate Securities Fund’s Class A Shares had placed in the first quartile of the Fund’s peer group for the one- and three-year periods and in the third quartile for the five- and ten-year periods, and had outperformed the Fund’s benchmark index for the one- and three-year periods and underperformed the Fund’s benchmark for the five- and ten-year periods ended March 31, 2014.
The Trustees noted that the Dynamic Commodity Strategy Fund had launched on April 30, 2014 and did not yet have a meaningful performance history.
Costs of Services Provided and Competitive Information
The Trustees considered the contractual terms of the Management Agreement and the fee rates payable by each Fund thereunder. In this regard, the Trustees considered information on the services rendered by the Investment Adviser to the Funds, which included both advisory and administrative services that were directed to the needs and operations of the Funds as registered mutual funds.
In particular, the Trustees reviewed analyses prepared by the Outside Data Provider regarding the expense rankings of the Funds (except for the Dynamic Commodity Strategy Fund, which commenced operations in 2014). The analyses provided a comparison of the Funds’ management fees and breakpoints to those of relevant peer groups and category universes; an expense analysis which compared each Fund’s overall net and gross expenses to a peer group and a category universe; and a five-year history (or, in the case of Funds that commenced investment operations within a shorter period, since the year in which it commenced operations) comparing each Fund’s net expenses to the peer and category medians. The analyses also compared each Fund’s transfer agency, custody, and distribution fees, other expenses and fee waivers/reimbursements to those of the peer group and category medians. The Trustees concluded that the comparisons provided by the Outside Data Provider were useful in evaluating the reasonableness of the management fees and total expenses paid by the Funds.
In addition, the Trustees considered the Investment Adviser’s undertakings to waive a portion of its management fees (with respect to the Absolute Return Tracker, Dynamic Allocation, International Real Estate Securities, and Real Estate Securities Funds) and to limit
6
certain expenses of each Fund that exceed specified levels. The Trustees also noted that certain changes were being made to existing fee waiver or expense limitation arrangements that would have the effect of lowering (in the case of the International Real Estate Securities and Real Estate Securities Funds) or increasing (in the case of the Commodity Strategy and Managed Futures Strategy Funds) total Fund expenses, with such changes taking effect in connection with the Funds’ next annual registration statement update. They also considered, to the extent that the Investment Adviser manages institutional accounts or collective investment vehicles having investment objectives and policies similar to those of the Funds, comparative fee information for services provided by the Investment Adviser to those accounts, and information that indicated that services provided to the Funds differed in various significant respects from the services provided to institutional accounts, which generally operated under less stringent legal and regulatory structures, required fewer services from the Investment Adviser to a smaller number of client contact points, were less time-intensive and paid lower fees. They also noted that the Investment Adviser did not manage institutional accounts or collective investment vehicles having investment objectives and policies similar to those of the Funds, and therefore this type of fee comparison was not possible.
In addition, the Trustees noted that shareholders are able to redeem their Fund shares at any time if shareholders believe that the Fund fees and expenses are too high or if they are dissatisfied with the performance of the Fund.
Profitability
The Trustees reviewed the Investment Adviser’s revenues and pre-tax profit margins with respect to the Trust and each of the Funds (except for the Dynamic Commodity Strategy Fund, which commenced operations in 2014). In this regard the Trustees noted that they had received, among other things, profitability analyses and summaries, revenue and expense schedules by Fund and by function (i.e., investment management, transfer agency and distribution and service) and information on the Investment Adviser’s expense allocation methodology. They observed that the profitability and expense figures are substantially similar to those used by the Investment Adviser for many internal purposes, including compensation decisions among various business groups, and are thus subject to a vigorous internal debate about how certain revenue and expenses should be allocated. The Trustees also noted that the internal audit group within the Goldman Sachs organization had audited the expense allocation methodology and was satisfied with the reasonableness, consistency, and accuracy of the Investment Adviser’s expense allocation methodology and profitability analysis calculations. Profitability data for the Trust and each Fund (except for the Dynamic Commodity Strategy Fund) were provided for 2013 and 2012, and the Trustees considered this information in relation to the Investment Adviser’s overall profitability. The Trustees considered the Investment Adviser’s revenues and pre-tax profit margins both in absolute terms and in comparison to information on the reported pre-tax profit margins earned by certain other asset management firms.
7
Economies of Scale
The Trustees considered the information that had been provided regarding the Investment Adviser’s profitability. The Trustees also considered the breakpoints in the fee rate payable under the Management Agreement for each of the Funds at the following annual percentage rates of the average daily net assets of the Funds:
| | | | | | | | | | | | | | | | | | | | | | | | | | | | |
| | | Absolute
Return
Tracker
Fund | | | Commodity
Strategy
Fund | | | Dynamic
Allocation
Fund | | | Dynamic
Commodity
Strategy
Fund | | | International
Real Estate
Securities
Fund | | | Managed
Futures
Strategy
Fund | | | Real Estate
Securities
Fund | |
First $1 billion | | | 1.15 | % | | | 0.50 | % | | | 0.90 | % | | | 0.80 | % | | | 1.05 | % | | | 1.00 | % | | | 1.00 | % |
Next $1 billion | | | 1.04 | | | | 0.50 | | | | 0.81 | | | | 0.80 | | | | 1.05 | | | | 0.90 | | | | 0.90 | % |
Next $3 billion | | | 0.99 | | | | 0.45 | | | | 0.77 | | | | 0.72 | | | | 0.95 | | | | 0.86 | | | | 0.86 | % |
Next $3 billion | | | 0.97 | | | | 0.43 | | | | 0.75 | | | | 0.68 | | | | 0.90 | | | | 0.84 | | | | 0.84 | % |
Over $8 billion | | | 0.95 | | | | 0.42 | | | | 0.74 | | | | 0.67 | | | | 0.88 | | | | 0.82 | | | | 0.82 | % |
The Trustees noted that the breakpoints were meant to share potential economies of scale, if any, with the Funds and their shareholders as assets under management reach those asset levels. The Trustees considered the amounts of assets in the Funds; the Funds’ recent share purchase and redemption activity; the information provided by the Investment Adviser relating to the costs of the services provided by the Investment Adviser and its affiliates and their realized profits; information comparing fee rates charged by the Investment Adviser with fee rates charged to other funds in the peer groups; and the Investment Adviser’s undertakings to waive a portion of its management fees (with respect to the Absolute Return Tracker, Dynamic Allocation, International Real Estate Securities, and Real Estate Securities Funds) and to limit certain expenses of the Funds that exceed specified levels. Upon reviewing these matters at the Annual Meeting, the Trustees concluded that the fee breakpoints represented a means of assuring that benefits of scalability, if any, would be passed along to shareholders at the specified asset levels. They also noted that the Investment Adviser had passed along savings to shareholders of the Absolute Return Tracker and Dynamic Allocation Funds, which had asset levels above at least the first breakpoint during the prior fiscal year.
Other Benefits to the Investment Adviser and Its Affiliates
The Trustees also considered the other benefits derived by the Investment Adviser and its affiliates from their relationships with the Funds as stated above, including: (a) transfer agency fees received by Goldman, Sachs & Co. (“Goldman Sachs”); (b) brokerage and futures commissions earned by Goldman Sachs for executing securities and futures transactions on behalf of the Funds; (c) research received by the Investment Adviser from broker-dealers in exchange for executing certain transactions on behalf of the International Real Estate Securities and Real Estate Securities Funds; (d) trading efficiencies resulting from aggregation of orders of the Funds with those for other funds or accounts managed by the Investment Adviser; (e) the Investment Adviser’s ability to leverage the infrastructure designed to service the Funds on behalf of its other clients; (f) the Investment Adviser’s ability to cross-market other products and services to Fund shareholders; (g) Goldman Sachs’ retention of certain fees
8
as Fund Distributor; (h) the Investment Adviser’s ability to negotiate better pricing with custodians on behalf of its other clients, as a result of the relationship with the Funds; and (i) the possibility that the working relationship between the Investment Adviser and the Funds’ third party service providers may cause those service providers to be more likely to do business with other areas of Goldman Sachs. In the course of considering the foregoing, the Independent Trustees requested and received further information quantifying certain of these fall-out benefits.
Other Benefits to the Funds and Their Shareholders
The Trustees also noted that the Funds receive certain potential benefits as a result of their relationship with the Investment Adviser, including: (a) trading efficiencies resulting from aggregation of orders of the Funds with those of other funds or accounts managed by the Investment Adviser; (b) enhanced servicing from vendors because of the volume of business generated by the Investment Adviser and its affiliates; (c) enhanced servicing from broker-dealers because of the volume of business generated by the Investment Adviser and its affiliates; (d) the Investment Adviser’s ability to negotiate favorable terms with derivatives counterparties on behalf of the Funds as a result of the size and reputation of the Goldman Sachs organization; (e) the Investment Adviser’s knowledge and experience gained from managing other accounts and products; (f) the Investment Adviser’s ability to hire and retain qualified personnel to provide services to the Funds because of the reputation of the Goldman Sachs organization; (g) the Funds’ access, through the Investment Adviser, to certain firmwide resources (e.g., proprietary risk management systems and databases), subject to certain restrictions; and (h) the Funds’ access to certain affiliated distribution channels. In addition, the Trustees noted the competitive nature of the mutual fund marketplace, and considered that many of the Funds’ shareholders invested in the Funds in part because of the Funds’ relationship with the Investment Adviser and that those shareholders have a general expectation that the relationship will continue.
Dynamic Commodity Strategy Fund
The Dynamic Commodity Strategy Fund commenced investment operations on April 30, 2014, and the Trustees had considered, at a meeting held on April 9-10, 2014, (i) the initial appointment of the Investment Adviser to serve as the Fund’s investment adviser and (ii) the initial approval of the Management Agreement on behalf of the Fund. At that meeting, the Trustees considered, in addition to many of the above factors, the Investment Adviser’s (and its affiliates’) ability to provide services to the Fund. In this regard, the Trustees noted that, although the Fund was new, the Investment Adviser had experience managing other funds and accounts that seek to provide exposure to various commodities and commodity sectors by investing in commodity-linked instruments. The Trustees concluded that the Investment Adviser would be able to provide quality services to the Fund.
The Trustees considered the management fee to be paid by the Fund, and the Fund’s anticipated total expenses, along with the Fund’s anticipated assets under management. They also considered a comparison of the Fund’s proposed management fees and anticipated
9
expenses with those paid by other similar mutual funds and the Investment Adviser’s proposal to limit certain expenses of the Fund that exceed a specified level. They recognized that the Fund did not yet have profitability data to evaluate, but considered the Investment Adviser’s undertaking to provide such information after the Fund commenced operations. They reviewed the proposed breakpoints in the management fee schedule and concluded that the breakpoints represented a means of assuring that benefits of scalability, if any, would be passed along to shareholders at the specified asset levels. The Trustees also considered the fees to be paid to Goldman Sachs in its capacity as the Fund’s transfer agent and distributor, along with other fall-out benefits that would potentially be received by the Investment Adviser and its affiliates.
The Trustees concluded, in the exercise of their business judgment, that the proposed management fee to be paid by the Fund would be reasonable in light of the services provided to it by the Investment Adviser and the Fund’s reasonably foreseeable asset levels, and that the Management Agreement should be approved on behalf of the Fund.
Conclusion
In connection with their consideration of the Management Agreement, the Trustees gave weight to each of the factors described above, but did not identify any particular factor as controlling their decision. After deliberation and consideration of all of the information provided, including the factors described above, the Trustees concluded, in the exercise of their business judgment, that the management fees paid by each of the Funds were reasonable in light of the services provided to it by the Investment Adviser, the Investment Adviser’s costs and each Fund’s current and reasonably foreseeable asset levels. The Trustees unanimously concluded that the Investment Adviser’s continued management likely would benefit each Fund and its shareholders and that the Management Agreement should be approved and continued with respect to each Fund until June 30, 2015.
This Supplement should be retained with the Semi-Annual Report for future reference.
10
Goldman Sachs Funds

| | | | |
| | |
| Semi-Annual Report | | | | June 30, 2014 |
| | |
| | | | Select Satellite Funds |
| | | | Absolute Return Tracker |
| | | | Commodity Strategy |
| | | | Dynamic Allocation |
| | | | Dynamic Commodity Strategy |
| | | | Managed Futures Strategy |
| | | | International Real Estate Securities |
| | | | Real Estate Securities |

Goldman Sachs Select Satellite Funds
| n | | ABSOLUTE RETURN TRACKER |
| n | | DYNAMIC COMMODITY STRATEGY |
| n | | MANAGED FUTURES STRATEGY |
| n | | INTERNATIONAL REAL ESTATE SECURITIES |
| | | | |
TABLE OF CONTENTS | | | | |
| |
Principal Investment Strategies and Risks | | | 1 | |
| |
Portfolio Management Discussions and Performance Summaries | | | 6 | |
| |
Index Definitions | | | 45 | |
| |
Schedules of Investments | | | 47 | |
| |
Financial Statements | | | 68 | |
| |
Financial Highlights | | | 76 | |
| |
Notes to Financial Statements | | | 90 | |
| |
Other Information | | | 123 | |
| | | | |
| | | |
| NOT FDIC-INSURED | | May Lose Value | | No Bank Guarantee |
GOLDMAN SACHS SELECT SATELLITE FUNDS
Principal Investment Strategies and Risks
This is not a complete list of risks that may affect the Funds. For additional information concerning the risks applicable to the Funds, please see the Funds’ Prospectuses.
The Goldman Sachs Absolute Return Tracker Fund seeks to deliver long-term total return consistent with investment results that approximate the return and risk patterns of a diversified universe of hedge funds. The Fund’s Investment Adviser believes that hedge funds derive a large portion of their returns from exposure to sources of market risk (“Market Exposures”) and “Trading Strategies” involving long and/or short positions in Market Exposures and/or individual securities or baskets of securities. In seeking to meet its investment objective, the Fund uses a dynamic investment process to seek to identify the appropriate weights to Market Exposures and Trading Strategies that approximate the return and risk patterns of specific hedge fund sub-strategies. The Investment Adviser then applies a quantitative methodology, in combination with a qualitative overlay, to assess the appropriate weight to each Market Exposure and Trading Strategy. The Fund may seek to establish long and/or short positions in a multitude of Market Exposures. However, from time to time, regulatory constraints or other considerations may prevent the Fund from precisely replicating the returns of the Market Exposures and Trading Strategies. The Fund does not intend to outperform market returns, even during periods of sustained increases in the prices of stocks and bonds.
The Fund seeks to gain exposure to the commodities markets by investing in a wholly-owned subsidiary of the Fund organized as a company under the laws of the Cayman Islands (the “ART Subsidiary”). The ART Subsidiary primarily obtains its commodity exposure by investing in commodity-linked derivative instruments (which may include total return swaps on commodity indexes, sub-indexes and single commodities, as well as commodity (U.S. or foreign) futures, commodity options and commodity-linked notes). The ART Subsidiary will also invest in other instruments, including fixed income securities, either as investments or to serve as margin or collateral for its swap positions, and foreign currency transactions (including forward contracts). The Fund is subject to the risk that exposure to the commodities markets may subject the Fund to greater volatility than investments in traditional securities. Derivative instruments may involve a high degree of financial risk. These risks include the risk that a small movement in the price of the underlying security or benchmark may result in a disproportionately large movement, unfavorable or favorable, in the price of the derivative instrument; the risk of default by a counterparty; and liquidity risk. Over-the-counter transactions are subject to less government regulation and supervision. The Fund may also hold significant amounts of U.S. Treasury or short-term instruments. Foreign and emerging markets investments may be more volatile and less liquid than U.S. securities and are subject to the risks of currency fluctuations and adverse economic or political developments. At times, the Fund may be unable to sell certain of its illiquid investments without a substantial drop in price, if at all. The Fund is subject to the risks associated with short selling of securities, which involves leverage of the Fund’s assets and presents various other risks. The Fund may be obligated to cover its short position at a higher price than the short price, resulting in a loss. Losses on short sales are potentially unlimited as a loss occurs when the value of a security sold short increases. The Fund is not appropriate for all investors. The Investment Adviser’s use of quantitative models to execute the Fund’s investment strategy may fail to produce the intended result. Different investment styles (e.g., “quantitative”) tend to shift in and out of favor, and at times the Fund may underperform other funds that invest in similar asset classes.
The investment program of the Fund is speculative, entails substantial risks and includes alternative investment techniques not employed by traditional mutual funds. The Fund should not be relied upon as a complete investment program. The Fund’s investment techniques (if they do not perform as designed) may increase the volatility of performance and the risk of investment loss, including the loss of the entire amount that is invested, and there can be no assurance that the investment objective of the Fund will be achieved.
The Goldman Sachs Commodity Strategy Fund seeks to maintain substantial economic exposure to the performance of the commodities markets. The Fund primarily gains exposure to the commodities
1
GOLDMAN SACHS SELECT SATELLITE FUNDS
markets by investing in a wholly-owned subsidiary of the Fund organized as a company under the laws of the Cayman Islands (the “Subsidiary”). The Subsidiary primarily obtains its commodity exposure by investing in commodity-linked derivative instruments (which may include total return swaps). The Subsidiary also invests in other instruments, including fixed income securities, either as investments or to serve as margin or collateral for its swap positions, and foreign currency translations (including forward contracts). The Fund is subject to the risk that exposure to the commodities markets may subject the Fund to greater volatility than investments in traditional securities. Derivative instruments may involve a high degree of financial risk. These risks include the risk that a small movement in the price of the underlying security or benchmark may result in a disproportionately large movement, unfavorable or favorable, in the price of the derivative instrument; the risk of default by a counterparty; and liquidity risk. The Fund’s borrowing and use of derivatives result in leverage, which can make the Fund more volatile. Over-the-counter transactions are subject to less government regulation and supervision. The Fund may hold significant amounts of U.S. Treasury or short-term investments. Investments in fixed income securities are subject to the risks associated with debt securities generally, including credit, liquidity and interest rate risk. Investments in mortgage-backed securities are subject to prepayment risk, the risk that in a declining interest rate environment the Fund’s underlying mortgages may be prepaid, causing the Fund to have to reinvest at lower interest rates. Foreign investments may be more volatile and less liquid than U.S. securities and are subject to the risks of currency fluctuations and adverse economic or political developments. At times, the Fund may be unable to sell certain of its illiquid investments without a substantial drop in price, if at all. The Fund is “non-diversified” and may invest more of its assets in fewer issuers than “diversified” funds. Accordingly, the Fund may be more susceptible to adverse developments affecting any single issuer held in its portfolio and to greater losses resulting from these developments.
The investment program of the Fund is speculative, entails substantial risks and includes asset classes and investment techniques not employed by more traditional mutual funds. The Fund should not be relied upon as a complete investment program. There can be no assurance that the investment objective of the Fund will be achieved.
The Goldman Sachs Dynamic Allocation Fund invests primarily in exchange-traded funds (“ETFs”) stocks, and derivative instruments, including futures and swaps, that provide exposure to a broad spectrum of asset classes, including but not limited to equities (both in U.S. and non-U.S. companies), fixed income (U.S. and non-U.S., investment grade and high yield) and commodities. Derivative instruments may involve a high degree of financial risk. These risks include the risk that a small movement in the price of the underlying security or benchmark may result in a disproportionately large movement, unfavorable or favorable, in the price of the derivative instrument; risk of default by a counterparty; and liquidity risk. The Fund’s borrowing and use of derivatives result in leverage, which can make the Fund more volatile. Over-the-counter transactions are subject to less government regulation and supervision. The Fund may also hold significant amounts of U.S. Treasury or short-term instruments. The Fund’s equity investments are subject to market risk, which means that the value of its investments may go up or down in response to the prospects of individual companies, particular sectors and/or general economic conditions. The Fund’s fixed income investments are subject to the risks associated with debt securities generally, including credit, liquidity and interest rate risk. High yield, lower rated investments involve greater price volatility and present greater risks than higher rated fixed income securities. The Fund is subject to the risk that exposure to the commodities markets may subject the Fund to greater volatility than investments in traditional securities. Foreign and emerging markets investments may be more volatile and less liquid than investments in U.S. securities and are subject to the risks of currency fluctuations and adverse economic or political developments. At times, the Fund may be unable to sell certain of its illiquid investments without a substantial drop in price, if at all. The Fund’s investments in other investment companies (including ETFs) subject it to additional expenses. The Fund is “non-diversified” and may invest more of its assets in fewer issuers than
2
GOLDMAN SACHS SELECT SATELLITE FUNDS
“diversified” funds. Accordingly, the Fund may be more susceptible to adverse developments affecting any single issuer held in its portfolio and to greater losses resulting from these developments.
The investment program of the Fund is speculative, entails substantial risks and includes alternative investment techniques not employed by traditional mutual funds. The Fund should not be relied upon as a complete investment program. The Fund’s investment techniques (if they do not perform as designed) may increase the volatility of performance and the risk of investment loss, including the loss of the entire amount that is invested, and there can be no assurance that the investment objective of the Fund will be achieved.
The Goldman Sachs Dynamic Commodity Strategy Fund seeks to maintain substantial economic exposure to the performance of the commodities markets. The Fund primarily gains exposure to the commodities markets by investing in a wholly-owned subsidiary of the Fund organized as a company under the laws of the Cayman Islands (the “Subsidiary”) and in commodity index-linked structured notes. The Subsidiary primarily obtains its commodity exposure by investing in commodity-linked derivative instruments (which may include total return swaps). The Subsidiary also invests in other instruments, including fixed income securities, either as investments or to serve as margin or collateral for its swap positions. The Fund is subject to the risk that exposure to the commodities markets may subject the Fund to greater volatility than investments in traditional securities. The Fund is subject to tax risk as a result of its investments in the Subsidiary and in commodity index-linked structured notes, as the Fund has not received a private letter ruling from the Internal Revenue Service (“IRS”) concluding that income and gains from such investments are “qualifying income.” The IRS has suspended granting such private letter rulings, and the Fund cannot rely on private letter rulings granted to other taxpayers. The tax treatment of investments in the Subsidiary and in commodity index-linked structured notes may be adversely affected by future legislation and/or IRS guidance. While the Fund has obtained an opinion of counsel regarding such investments, if the IRS were to successfully assert that the Fund’s income from such investments was not “qualifying income,” in which case the Fund would fail to qualify as a regulated investment company, the Fund would be subject to federal and state income tax on all of its taxable income at regular corporate tax rates with no deduction for any distributions paid to shareholders, which would significantly adversely affect the returns to Fund shareholders.
Derivative instruments may involve a high degree of financial risk. These risks include the risk that a small movement in the price of the underlying security or benchmark may result in a disproportionately large movement, unfavorable or favorable, in the price of the derivative instrument; the risk of default by a counterparty; and liquidity risk. The Fund’s borrowing and use of derivatives may result in leverage, and may make the Fund more volatile. Over-the-counter transactions are subject to less governmental regulation and supervision. Any guarantee on U.S. government securities applies only to the underlying securities of the Fund if held to maturity and not to the value of the Fund’s shares. Investments in fixed income securities are subject to the risks associated with debt securities generally, including credit, liquidity and interest rate risk. Investments in mortgage-backed and other asset-backed securities are subject to prepayment risk, the risk that in a declining interest rate environment the Fund’s underlying mortgages may be prepaid, causing the Fund to have to reinvest at lower interest rates. At times, the Fund may be unable to sell certain of its illiquid investments without a substantial drop in price, if at all. The Fund may invest in non-investment grade securities, which involve greater price volatility and present greater risks than higher rated fixed income securities. The Fund is “non-diversified” and may invest more of its assets in fewer issuers than “diversified” funds. Accordingly, the Fund may be more susceptible to adverse developments affecting any single issuer held in its portfolio and to greater losses resulting from these developments.
The investment program of the Fund is speculative, entails substantial risks and includes asset classes and investment techniques not employed by more traditional mutual funds. The Fund should not be relied upon as a complete investment program. There can be no assurance that the investment objective of the Fund will be achieved.
3
GOLDMAN SACHS SELECT SATELLITE FUNDS
The Goldman Sachs Managed Futures Strategy Fund implements a trend-following strategy that takes long and/or short positions in a wide range of asset classes, including equities, fixed income, commodities and currencies, among others, to seek long-term absolute return. Investments in fixed income securities are subject to the risks associated with debt securities generally, including credit, liquidity, interest rate, call and extension risk. The Fund’s equity investments are subject to market risk, which means that the value of its investments may go up or down in response to the prospects of individual companies, particular industry sectors and/or general economic conditions. Different investment styles tend to shift in and out of favor, and at times the Fund may underperform other funds that invest in similar asset classes. Managed futures strategies have historically offered the potential for stronger performance in extreme bull and bear markets and weaker performance in range-bound and sharply reversing markets. Foreign and emerging market investments may be more volatile and less liquid than investments in U.S. securities and will be subject to the risks of currency fluctuation and adverse economic or political developments. The Fund is subject to the risk that exposure to the commodities markets may subject the Fund to greater volatility than investments in traditional securities. Derivative investments may involve a high degree of financial risk. These risks include the risk that a small movement in the price of the underlying security or benchmark may result in a disproportionately large movement, unfavorable or favorable, in the price of the derivative instrument; risk of default by a counterparty; and liquidity risk. At times, the Fund may be unable to sell certain of its illiquid investments without a substantial drop in price, if at all. Over-the-counter transactions are subject to less government regulation and supervision. The Fund’s borrowing and use of derivatives may result in leverage, which can make the Fund more volatile. The Fund is subject to tax risk as a result of its investments in commodity-linked structured notes, as the Fund has not received a private letter ruling from the Internal Revenue Service (“IRS”) concluding that income and gains from such investments are “qualifying income.” The IRS has suspended granting such private letter rulings, and the Fund cannot rely on private letter rulings granted to other taxpayers. The tax treatment of investments in commodity-linked structured notes may be adversely affected by future legislation and/or IRS guidance. While the Fund has obtained an opinion of counsel regarding such investments, if the IRS were to successfully assert that the Fund’s income from such investments was not “qualifying income,” in which case the Fund would fail to qualify as a regulated investment company, the Fund would be subject to federal and state income tax on all of its taxable income at regular corporate tax rates with no deduction for any distributions paid to shareholders, which would significantly adversely affect the returns to Fund shareholders. The Fund is “non-diversified” and may invest more of its assets in fewer issuers than “diversified” funds. Accordingly, the Fund may be more susceptible to adverse developments affecting any single issuer held in its portfolio and to greater losses resulting from these developments.
The investment program of the Fund is speculative, entails substantial risks and includes alternative investment techniques not employed by traditional mutual funds. The Fund should not be relied upon as a complete investment program. The Fund’s investment techniques (if they do not perform as designed) may increase the volatility of performance and the risk of investment loss, including the loss of the entire amount that is invested, and there can be no assurance that the investment objective of the Fund will be achieved.
The Goldman Sachs International Real Estate Securities Fund invests primarily in a portfolio of equity investments in issuers that are primarily engaged in or related to the real estate industry outside the United States, including real estate investment trusts (“REITs”). Investing in REITs involves certain unique risks in addition to those risks associated with investing in the real estate industry in general. REITs whose underlying properties are concentrated in a particular industry or geographic region are also subject to risks affecting such industries and regions. The securities of REITs involve greater risks than those associated with larger, more established companies and may be subject to more abrupt or erratic price movements because of interest rate changes, economic conditions and other factors. Foreign and emerging markets investments may be more volatile and less liquid than U.S. securities and are
4
GOLDMAN SACHS SELECT SATELLITE FUNDS
subject to the risks of currency fluctuations and adverse economic or political developments. Because the Fund concentrates its investments in the real estate industry, the Fund is subject to greater risk of loss as a result of adverse economic, business or other developments affecting this industry than if its investments were more diversified across different industries, and its performance may be substantially different from that of the broader stock market. The Fund is “non-diversified” and may invest more of its assets in fewer issuers than “diversified” funds. Accordingly, the Fund may be more susceptible to adverse developments affecting any single issuer held in its portfolio and to greater losses resulting from these developments.
The Goldman Sachs Real Estate Securities Fund invests primarily in a portfolio of equity investments in issuers that are primarily engaged in or related to the real estate industry, including real estate investment trusts (“REITs”). Investing in REITs involves certain unique risks in addition to those risks associated with investing in the real estate industry in general. REITs whose underlying properties are concentrated in a particular industry or geographic region are also subject to risks affecting such industries and regions. The securities of REITs involve greater risks than those associated with larger, more established companies and may be subject to more abrupt or erratic price movements because of interest rate changes, economic conditions and other factors. Because the Fund concentrates its investments in the real estate industry, the Fund is subject to greater risk of loss as a result of adverse economic, business or other developments affecting this industry than if its investments were more diversified across different industries, and its performance may be substantially different from that of the broader stock market. The Fund is “non-diversified” and may invest more of its assets in fewer issuers than “diversified” funds. Accordingly, the Fund may be more susceptible to adverse developments affecting any single issuer held in its portfolio and to greater losses resulting from these developments.
5
PORTFOLIO RESULTS
Goldman Sachs Absolute Return Tracker Fund
Investment Objective
The Fund seeks to deliver long-term total return consistent with investment results that approximate the return and risk patterns of a diversified universe of hedge funds.
Portfolio Management Discussion and Analysis
Below, the Goldman Sachs Quantitative Investment Strategies Team discusses the Goldman Sachs Absolute Return Tracker Fund’s (the “Fund”) performance and positioning for the six-month period ended June 30, 2014 (“the Reporting Period”).
| Q | | How did the Fund perform during the Reporting Period? |
| A | | During the Reporting Period, the Fund’s Class A, C, Institutional, IR and R Shares generated cumulative total returns, without sales charges, of 1.86%, 1.49%, 2.04%, 2.06% and 1.78%, respectively. These returns compare to the 1.77% cumulative total return of the Fund’s benchmark, the HFRX™ Global Hedge Fund Index (Gross, USD, Unhedged), during the same time period. |
| Q | | What economic and market factors most influenced the hedge fund asset class as a whole during the Reporting Period? |
| A | | Hedge funds, as measured by the HFRX Global Hedge Fund Index, overall generated positive absolute returns during the Reporting Period. Event driven hedge funds posted the strongest gains, with the HFRX Event Driven Index up 4.42% during the Reporting Period. These gains were largely driven by strong performance from distressed restructuring and credit arbitrage strategies. Relative value hedge funds also performed positively, with the HFRX Relative Value Arbitrage Index posting a gain of 1.59%, bolstered by solid performance among fixed income asset-backed and energy infrastructure constituents. Equity long/short hedge funds, as measured by the HFRX Equity Hedge Index, were up 1.27% during the Reporting Period, with gains from energy/ basic materials and technology/health care strategies buoying results most. Global macro hedge funds were slightly down for the Reporting Period, with the HFRX Macro/CTA Index posting a return of -0.73% . Within this segment, performance was weakest from commodity-agriculture and systematic diversified/CTA strategies. |
| | As the Reporting Period began in January 2014, global financial markets faced challenges, with nearly all equities losing ground and the VIX, a measure of financial disruption, trading at its highest level in more than a year. In turn, hedge funds had mixed performance in January 2014, with the HFRX Global Hedge Fund Index returning -0.24% . For the month, only event driven hedge funds posted gains, albeit modest ones. In a sharp turnaround, hedge funds had a strong February 2014, with the HFRX Global Hedge Fund Index up 1.59% . Equity long/short hedge funds, event driven hedge funds and relative value hedge funds each posted positive returns, though global macro hedge funds remained in negative territory. In what continued to be a choppy quarter in the global financial markets, hedge funds lost ground in March 2014, with the HFRX Global Hedge Fund Index returning -0.23% to close out the first calendar quarter with gains of 1.11% . Virtually all of the sub-strategies posted slightly negative performance for the month of March. |
| | Performance across global financial markets was mixed in April 2014, with drawdowns in information technology stocks and other growth sectors coinciding with ongoing |
6
PORTFOLIO RESULTS
| | geopolitical conflict in Ukraine and continued strong global merger and acquisition activity. Amidst such mixed performance, hedge funds, as measured by the -0.73% return of the HFRX Global Hedge Fund Index, lost ground for the month of April 2014. Each of the major sub-strategies lost ground as well. Global financial markets were then broadly up in May 2014, with relatively strong performance from developed market equities bolstered by positive economic data out of the U.S., increased market perception of geopolitical stability in Ukraine and continued merger and acquisition activity. In turn, hedge funds, as measured by the 0.45% return of the HFRX Global Hedge Fund Index, were up slightly for the month. Each of the sub-strategies were either up modestly or virtually flat for the month. Global financial markets continued to be broadly positive in June 2014, with relatively strong equity performance across most regions amid continued low implied volatility levels and signs of economic growth among developed nations. Reflecting such performance, hedge funds, as measured by the 0.93% gain in the HFRX Global Hedge Fund Index, were up for the month. Event driven, equity long/short and relative value hedge funds posted positive performance in June 2014, while macro hedge funds were flat for the month. |
| Q | | What key factors were responsible for the Fund’s performance during the Reporting Period? |
| A | | We believe hedge funds derive a large portion of their returns from exposure to sources of market risk and Trading Strategies, involving long and/or short positions in Market Exposures and/or individual securities or baskets of securities. In seeking to meet its investment objective, the Fund uses a dynamic investment process to seek to identify the appropriate weights to Market Exposures and Trading Strategies that approximate the return and risk patterns of specific hedge fund sub-strategies. The hedge fund sub-strategies whose returns the Fund seeks to approximate include, but are not limited to, Equity Long Short, Event Driven, Relative Value, and Macro sub-strategies (each a “Hedge Fund Sub-Strategy”). The Fund allocates to the relevant Market Exposures and Trading Strategies of each of the Hedge Fund Sub-Strategies based on the weights of these Hedge Fund Sub-Strategies in the industry. The Investment Adviser then applies a quantitative methodology, in combination with a qualitative overlay, to assess the appropriate weight to each Market Exposure and Trading Strategy. During the Reporting Period, all four Hedge Fund Sub-Strategies employed by the Fund contributed positively to performance on an absolute basis. |
| | The Fund’s Equity Long Short Hedge Fund Sub-Strategy contributed most to results, with strong performance from long positions in European and U.S. small-cap equities. Conversely, short positions in U.S. large-cap equities detracted from results. |
| | The Relative Value and Event Driven Hedge Fund Sub-Strategies also contributed positively to the Fund’s performance during the Reporting Period. Within each of these Hedge Fund Sub-Strategies, the equity volatility strategy in which the Fund was invested and long positions in high yield credit contributed most positively to results. There were no detractors from returns for either of these Hedge Fund Sub-Strategies. |
| | The Fund’s Macro Hedge Fund Sub-Strategy contributed positively to the Fund’s returns on an absolute basis as well, with positive performance from the trend and currency carry strategies. Within the trend strategy in which the Fund invests, long positions in German government bunds contributed positively to returns, while short positions in U.S. Treasury securities toward the start of the Reporting Period detracted most from results. For the currency carry strategy in which the Fund invests, long positions in the Brazilian real against the U.S. dollar contributed positively to results, while long positions in the Russian ruble against the U.S. dollar modestly detracted from results. |
| | In addition to the asset classes mentioned above, the Fund was invested in a variety of developed and emerging market equities, short-term interest rates, developed market government bonds, currencies and commodities during the Reporting Period. |
| Q | | How did the Fund use derivatives and similar instruments during the Reporting Period? |
| A | | The Fund used exchange-traded index futures contracts to gain exposure to U.S. large-cap and small-cap equities, non- |
7
PORTFOLIO RESULTS
| | U.S. developed market equities including those in Europe, the U.K. and Japan, commodities, government bonds and short-term interest rates. The Fund used currency forward contracts to gain exposure to select developed and emerging market currencies of non-U.S. markets. The Fund used exchange-traded total return swaps to gain exposure to U.S. large-cap and small-cap equities. We used over-the-counter swaps in the Fund’s equity long/short strategy to gain exposure to what we call our value-minus-growth factor, in which we gain long or short exposure to a basket of high value stocks versus a basket of high growth stocks. The Fund also used listed put options to gain exposure to U.S. large-cap equities. Lastly, the Fund used exchange-traded credit default swaps to gain exposure to North American high yield credit markets. |
| Q | | Were there any changes made in the Fund’s investment strategy during the Reporting Period? |
| A | | In June 2014, two asset classes — commodities and currencies — were added to the trend strategy within the Macro Hedge Fund Sub-Strategy employed by the Fund. |
| | The trend strategy trades across commodities, currencies, equities, government bonds and short-term interest rate contracts, bringing the overall number of instruments traded within the strategy to more than 90. There were no other major changes made in the Fund’s investment strategy during the Reporting Period. |
| Q | | How was the Fund positioned at the end of the Reporting Period? |
| A | | At the end of the Reporting Period, the Fund had a 46% allocation to the Equity Long Short Hedge Fund Sub-Strategy, 24% to the Macro Hedge Fund Sub-Strategy, 19% to the Relative Value Hedge Fund Sub-Strategy and 11% to the Event Driven Hedge Fund Sub-Strategy. |
| Q | | Were there any changes to the Fund’s portfolio management team during the Reporting Period? |
| A | | Alex Chung became a portfolio manager of the Fund in April 2014. Alex continues to focus on the responsibilities he has held since joining the portfolio management team in 2009, which include research and management. |
| Q | | What is the Fund’s tactical view and strategy going forward? |
| A | | In the coming months, we intend to remain focused on the Fund’s investment objective of seeking to deliver long-term total return consistent with investment results that approximate the return and risk patterns of a diversified universe of hedge funds. We understand that the hedge fund industry is dynamic, and to keep pace, we seek to understand trends in the hedge fund industry by digesting information from a number of sources, including hedge fund return databases, prime brokerage reports, hedge fund consultants, regulatory filings and other public sources. Additionally, we emphasize ongoing research and continued process and model enhancement, which we attempt to implement through our scalable, robust technological platform. |
8
FUND BASICS
Absolute Return Tracker Fund
as of June 30, 2014
| | | | | | | | | | |
| | PERFORMANCE REVIEW | |
| | | January 1, 2014– June 30, 2014 | | Fund Total Return
(based on NAV)1 | | | HFRX Global
Hedge Fund Index2 | |
| | Class A | | | 1.86 | % | | | 1.77 | % |
| | Class C | | | 1.49 | | | | 1.77 | |
| | Institutional | | | 2.04 | | | | 1.77 | |
| | Class IR | | | 2.06 | | | | 1.77 | |
| | | Class R | | | 1.78 | | | | 1.77 | |
| | 1 | | The net asset value (“NAV”) represents the net assets of the class of the Fund (ex-dividend) divided by the total number of shares of the class outstanding. The Fund’s performance reflects the reinvestment of dividends and other distributions. The Fund’s performance does not reflect the deduction of any applicable sales charges. |
| | 2 | | The HFRX Global Hedge Fund Index is designed to be representative of the overall composition of the hedge fund universe. It is comprised of all eligible hedge fund strategies, including but not limited to convertible arbitrage, distressed securities, equity hedge, equity market neutral, event driven, macro, merger arbitrage, and relative value arbitrage. The strategies are asset weighted based on the distribution of assets in the hedge fund industry. The index is investable through products managed by HFR Asset Management, LLC that track HFRX Indices. The HFRX Global Hedge Fund Index is a trademark of Hedge Fund Research, Inc. (“HFR”). HFR has not participated in the formation of the Fund. HFR does not endorse or approve the Fund or make any recommendation with respect to investing in the Fund. |
| | | | | | | | | | | | | | |
| | STANDARDIZED TOTAL RETURNS3 |
| | | For the period ended 6/30/14 | | One Year | | | Five Years | | Since Inception | | | Inception Date |
| | Class A | | | 2.47 | % | | 1.55% | | | -0.78 | % | | 5/30/08 |
| | Class C | | | 6.56 | | | 1.92 | | | -0.61 | | | 5/30/08 |
| | Institutional | | | 8.74 | | | 3.09 | | | 0.53 | | | 5/30/08 |
| | Class IR | | | 8.70 | | | 2.95 | | | 0.40 | | | 5/30/08 |
| | | Class R | | | 8.11 | | | 2.42 | | | -0.12 | | | 5/30/08 |
| | 3 | | The Standardized Total Returns are average annual total returns as of the most recent calendar quarter-end. They assume reinvestment of all distributions at NAV. These returns reflect a maximum initial sales charge of 5.5% for Class A Shares, and the assumed contingent deferred sales charge for Class C Shares (1% if redeemed within 12 months of purchase). Because Institutional, Class IR and Class R Shares do not involve a sales charge, such a charge is not applied to their Standardized Total Returns. |
The returns set forth in the tables above represent past performance. Past performance does not guarantee future results. The Fund’s investment return and principal value will fluctuate so that an investor’s shares, when redeemed, may be worth more or less than their original cost. Current performance may be lower or higher than the performance quoted above. Please visit our web site at www.GSAMFUNDS.com to obtain the most recent month-end returns. Performance reflects applicable fee waivers and/or expense limitations in effect during the periods shown. In their absence, performance would be reduced. Returns do not reflect the deduction of taxes that a shareholder would pay on Fund distributions or the redemption of Fund shares.
9
FUND BASICS
| | | | | | | | | | |
| | EXPENSE RATIOS4 | |
| | | | | Net Expense Ratio (Current) | | | Gross Expense Ratio (Before Waivers) | |
| | Class A | | | 1.16 | % | | | 1.68 | % |
| | Class C | | | 1.91 | | | | 2.43 | |
| | Institutional | | | 0.76 | | | | 1.28 | |
| | Class IR | | | 0.91 | | | | 1.43 | |
| | | Class R | | | 1.41 | | | | 1.93 | |
| | 4 | | The expense ratios of the Fund, both current (net of applicable fee waivers and/or expense limitations) and before waivers (gross of applicable fee waivers and/or expense limitations) are as set forth above according to the most recent publicly available Prospectus for the Fund and may differ from the expense ratios disclosed in the Financial Highlights in this report. The Fund’s waivers and/or expense limitations will remain in place through at least April 30, 2015, and prior to such date the Investment Adviser may not terminate the arrangements without the approval of the Fund’s Board of Trustees. If these arrangements are discontinued in the future, the expense ratios may change without shareholder approval. |
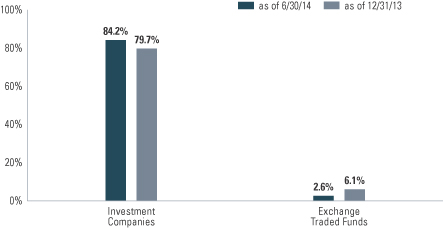
| | 5 | | The percentage shown for each investment category reflects the value of investments in that category as a percentage of net assets. Figures in the above graph may not sum to 100% due to the exclusion of other assets and liabilities. Underlying sector allocations of exchange traded funds (“ETFs”) held by the Fund are not reflected in the graph above. Consequently, the Fund’s overall sector allocations may differ from the percentages contained in the graph above. The above graph depicts the Fund’s investments but may not represent the Fund’s market exposure due to the exclusion of certain derivatives, if any, as listed in the Additional Investment Information section of the Schedule of Investments. |
10
GOLDMAN SACHS COMMODITY STRATEGY FUND
What Differentiates the Goldman Sachs Commodity Investment Process?
At Goldman Sachs Asset Management, L.P. (“GSAM”), the goal of our commodity investment process is to provide consistent, strong performance by actively managing our portfolios within a research-intensive, risk-managed framework.
Goldman Sachs’ Commodity Investment Process
Our commodity investment process emphasizes the importance of both short-term, tactical opportunities and long-term investment views. Our team-based approach to managing the Fund ensures continuity and idea sharing among some of the industry’s most experienced fixed income specialists. We pursue strong, consistent performance across commodity markets through:

The Goldman Sachs Commodity Strategy Fund primarily gains exposure to the performance of the commodity markets through investment in a wholly-owned subsidiary of the Fund organized as a company under the laws of the Cayman Islands (the “Subsidiary”). The Subsidiary invests primarily in commodity-linked swaps (which may include total return swaps), as well as other commodity-linked securities and derivative instruments that provide exposure to the performance of the commodities markets, and in fixed income and debt instruments. The Fund’s portfolio is designed to provide exposure that corresponds to the investment return of assets that trade in the commodity markets without direct investment in physical commodities.
The Fund implements enhanced cash strategies that capitalize on GSAM’s global fixed income expertise. The Fixed Income Team will employ the full spectrum of capabilities offered, including bottom-up strategies (credit, mortgages, governments /municipals, high yield, and emerging markets debt) and top-down strategies (duration, cross-sector, currency and country) in an attempt to enhance the return of the Fund.

A Commodity Fund that:
| n | | Provides exposure to the commodity markets without direct investment in physical commodities |
| n | | Utilizes commodity-linked swaps that provide economic exposure to movements in commodity prices |
11
PORTFOLIO RESULTS
Goldman Sachs Commodity Strategy Fund
Investment Objective
The Fund seeks long-term total return.
Portfolio Management Discussion and Analysis
Below, the Goldman Sachs Commodities Team discusses the Goldman Sachs Commodity Strategy Fund’s (the “Fund”) performance and positioning for the six-month period ended June 30, 2014 (the “Reporting Period”).
| Q | | How did the Fund perform during the Reporting Period? |
| A | | During the Reporting Period, the Fund’s Class A, C, Institutional, IR and R Shares generated cumulative total returns, without sales charges, of 5.14%, 4.95%, 5.33%, 5.30% and 5.02%, respectively. These returns compare to the 5.71% cumulative total return of the Fund’s benchmark, the S&P GSCI® (Goldman Sachs Commodity Index) (Gross, USD, Unhedged) (the “S&P GSCI®”), during the same period. |
| Q | | What economic and market factors most influenced the commodities markets as a whole during the Reporting Period? |
| A | | Commodities markets, as measured by the S&P GSCI®, gained during the Reporting Period overall, though there was great rotation in subsector performance within the Reporting Period. |
| | During the first quarter of 2014, agriculture was the best performing subsector, returning 15.91% . Despite a relatively healthy harvest in the United States in 2013 and benign global inventory balances across most markets, the subsector rallied on the potential for supply disruptions in Ukraine and Russia, exporters of grains, and on dry growing weather conditions in Brazil. Additionally, reports of lower than expected quarter-end inventories were bullish for agriculture commodity prices. Precious metals also performed well, up 6.10% for the first quarter of 2014, as the escalation of political conflict between Ukraine and Russia contributed to risk-averse sentiment and triggered a bid for gold and silver. An unexpected patch of softness in U.S. economic data also contributed to the appeal of the precious metals subsector. Energy moved 0.49% higher during the first quarter of 2014, with natural gas leading the way. The S&P GSCI Natural Gas Index was up 12.78% on extended forecasts of cold weather in the U.S. The S&P GSCI West Texas Intermediate (“WTI”) Crude Oil Index was up 3.92% supported by heightened geopolitical risks, with rising tensions in Ukraine, a key oil and gas transport hub, and ongoing supply outages in key oil producing regions globally, most notably in the Middle East and North Africa. However, seasonal refinery maintenance partly weighed on the demand for crude oil toward the end of the quarter. Industrial metals declined 5.35%, with wide dispersion among subsector components. Nickel, for example, was up 14.24%, while copper, aluminum and zinc were down 9.36%, 3.17% and 4.35%, respectively. Speculation around China’s economic growth prospects weighed on the subsector, but nickel outperformed other base metals due to the Indonesian export ban. |
| | The S&P GSCI® generated similar returns in the second quarter of 2014 as in the first quarter of 2014 but with much different subsector performance. During the second quarter of 2014, industrial metals was the strongest subsector, returning 8.49% . Nickel was up 19.22% on the back of the Indonesian export ban and concerns around its impact on nickel supply. Zinc also performed well, returning 11.29%, as inventories shrank and Chinese economic data proved supportive. Riding this tailwind, copper and aluminum followed suit, finishing the quarter up 6.41% and 4.72%, respectively. Energy returned 4.36% during the second quarter of 2014, driven by the petroleum complex. Escalation of the conflict in Iraq and the persistent and unplanned supply outages in key oil producing regions globally pressured prices higher. Brent and WTI crude oil were up 5.57% and 6.74%, respectively, as an extremist militant group gained control of parts of northern Iraq, raising the possibility of additional supply curtailment in global crude oil. The outperformance of WTI was driven by the timely start of a pipeline transporting large flows of Cushing, Oklahoma crude oil to the Gulf Coast, causing a significant drawdown of inventories at Cushing and acting as another catalyst for the domestic crude oil. (Cushing, Oklahoma is |
12
PORTFOLIO RESULTS
| | the physical delivery point for NYMEX WTI futures.) Unleaded gasoline was up 8.10%. The precious metals subsector was up 3.78%, with gold and silver gaining 2.95% and 6.19%, respectively. In spite of signs of improvement in the global economy, the precious metals subsector climbed higher based on heightened geopolitical risk and a dovish Federal Reserve (“Fed”), as the Fed signaled it intends to keep U.S. interest rates near record lows. Agriculture was the worst performing subsector during the second quarter of 2014, declining 9.98% . Corn, soybeans and wheat were down 16.89%, 5.26% and 19.74%, respectively, driven by favorable weather conditions in the U.S. and no further escalation in tensions between Russia and Ukraine, two grain-producing countries. |
| Q | | Which commodity subsectors were strongest during the Reporting Period? |
| A | | For the Reporting Period overall, all commodity subsectors, as measured by the S&P GSCI®, posted positive returns during the Reporting Period. The precious metals subsector of the S&P GSCI® was the best performer, posting a gain of 9.66% . The energy component of the S&P GSCI® also performed well, up 5.61% for the Reporting Period. The S&P GSCI® Livestock Index returned 20.92% during the Reporting Period. |
| Q | | Which commodity subsectors were weakest during the Reporting Period? |
| A | | The industrials metals subsector was the weakest during the Reporting Period, with the S&P GSCI® Industrial Metals Index up 1.25%. Agriculture also lagged for the Reporting Period as a whole, posting a modest gain of 1.66%. |
| Q | | What key factors were responsible for the Fund’s performance during the Reporting Period? |
| A | | During the Reporting Period, the Fund generated solid absolute returns but results underperformed the S&P GSCI®. Our enhanced roll-timing strategies via exposure to commodity index-linked swaps detracted from results, while our enhanced cash management strategy contributed positively to results during the Reporting Period. |
| Q | | How did the Fund’s enhanced roll-timing strategies impact performance during the Reporting Period? |
| A | | Our enhanced roll-timing strategies detracted from the Fund’s performance via exposure to commodity index swaps. We employ an approach whereby we do not take active views on individual commodities but rather gain Fund exposure to commodities through investments whose performance is linked to commodity indices. |
| | We often implement commodity roll-timing strategies by deviating from the S&P GSCI® roll convention, which typically calls for rolling forward exposure at the front, or near-month, end of the futures curve on a monthly basis. The roll occurs during business days 5 through 9. To the extent our team believes fundamental or technical developments will impact the futures roll-timing decision, we will incorporate those views into the portfolio by electing to roll positions earlier, later, forward or in different weights versus the S&P GSCI® roll. Roll-timing strategies employed may include 1) alternative roll date modifications, which avoid the market impact of plain vanilla S&P GSCI® rolls during business days 5 to 9; 2) forward exposure roll modifications, which avoid the market impact of plain vanilla S&P GSCI® rolls and move exposure out the curve to mitigate the returns impact often associated with persistent contango; and 3) seasonal roll modifications, which take advantage of seasonal relationships in commodity markets to seek to increase returns. (Contango is defined as a common market condition in which futures prices get progressively higher in the distant delivery months, often reflecting carrying costs. In other words, the nearby contract is trading at a lower price than the futures contract, such that one is rolling each month at a higher prices.) During most of the Reporting Period, we employed a forward roll-timing strategy that rolled commodity exposures underlying the S&P GSCI® a few months out on the futures curve instead of rolling at the very front of the futures curve. |
| | Our six-month deferred positioning within natural gas — in January and February 2014 — detracted from the Fund’s performance, as front-end, or nearby, futures outperformed longer-dated futures during the Reporting Period. Front-end futures’ outperformance early in the Reporting Period was supported by frigid temperatures across the U.S. and consequent expectations for substantial inventory draws as |
13
PORTFOLIO RESULTS
| | a result of increased heating demand. During the Reporting Period, the S&P GSCI® Natural Gas Subindex returned 14.61%. Most of this rally occurred in the first quarter of 2014, when the Subindex returned 15.69%. |
| | Conversely, our one-month deferred positioning within lean hogs contributed positively to the Fund’s performance during the Reporting Period. During the first quarter of 2014, lean hogs rallied as the porcine epidemic diarrhea (“PED”) virus swept through the U.S. killing millions of pigs. However, this trend reversed in the second quarter of 2014, and lean hogs gave back some of the gains from the prior quarter. Our one-month deferred positioning relative to the S&P GSCI®, which we had established in April 2014, gained as the front of the lean hogs futures curve underperformed the deferred part of the curve, driven in part by slaughter losses being offset by increases in hog weights. The Fund benefited, as it held a deferred position in lean hogs futures, while the S&P GSCI® held a position in the most nearby futures curve. |
| Q | | How did you implement the Fund’s enhanced cash management strategy? |
| A | | In addition to seeking value through management of the commodities portion of the Fund’s portfolio, we also seek to add a modest amount of excess return through thoughtful management of collateral held in the Fund. The cash portion of the Fund’s portfolio is typically allocated to high-grade collateral that includes U.S. Treasury securities, agency debentures, mortgage-backed securities and short-term fixed income instruments. During the Reporting Period, we favored high quality government and agency securities for the Fund’s collateral allocation. |
| Q | | How did the Fund use derivatives and similar instruments during the Reporting Period? |
| A | | As discussed, the Fund used commodity index-linked total return swaps in implementing our enhanced roll-timing strategies in order to gain exposure to the commodities markets. In implementing our enhanced cash management strategy, the Fund used futures, interest rate swaps and forward sales contracts, which are agency mortgage-backed derivatives used in purchasing a future issuance of agency mortgage-backed securities. |
| Q | | Did you make any changes in the Fund’s strategy or allocations during the Reporting Period? |
| A | | The Fund continued to hold exposure to the commodities markets primarily in the form of swaps linked to the S&P GSCI®. In the beginning of the Reporting Period, the Fund held exposure to customized swaps on the S&P GSCI®. Specifically, the Fund was positioned six months forward in the futures curves of WTI crude oil, natural gas and the grains (corn, soybeans and wheat), with the rest of the commodities in the same contract month as the S&P GSCI®. |
| | We then used customized swaps on the S&P GSCI® to move the Fund’s positioning to where all commodities in the S&P GSCI® were three months deferred, with the exception of Brent crude oil, Reformulated Gasoline, gasoil, Blendstock for Oxygen Blending (“RBOB”) gasoline and natural gas, which were in the same contract month as the S&P GSCI®. |
| | In April 2014, the Fund repositioned again by being one month forward in the futures curve across all commodities held in the S&P GSCI® via customized swaps on the S&P GSCI®. |
| Q | | How was the Fund positioned at the end of the Reporting Period? |
| A | | At the end of the Reporting Period, the Fund’s overall commodity position was generally in line with the weightings of the S&P GSCI®. As described earlier, the Fund held exposure to the commodities underlying the S&P GSCI® through customized swaps in the Subsidiary and held no deferred commodity exposure at the end of the Reporting Period. (The Subsidiary has the same objective as the Fund but unlike the Fund may invest without limitation in commodity index-linked securities, such as swaps and futures, that provide exposure to the performance of the commodity markets.) |
| | The cash portion of the Fund’s portfolio was allocated across various fixed income sectors, with an emphasis on the higher quality, lower volatility segments of the market, such as U.S. government and government-sponsored bonds. |
| Q | | Were there any changes to the Fund’s portfolio management team during the Reporting Period? |
| A | | During the Reporting Period, Steve Lucas, head of Commodities portfolio management, left Goldman Sachs Asset Management (“GSAM”). Michael Johnson became head of Commodities portfolio management. Michael has been with GSAM for 12 years and has been working side by side with Steve from the inception of active commodity strategies in 2005. |
14
PORTFOLIO RESULTS
| | Michael will continue to work with the current commodity portfolio managers, including John Calvaruso (12 years in GSAM) and Ayesha Parra (seven years in GSAM), as well as leverage the broad macro resources of the Fixed Income team, including the credit, emerging market and country teams. The members of the Commodities portfolio management team will now report to Michael, who will report to Sam Finkelstein, head of Macro Strategies within the broader Global Fixed Income team. Our Global Fixed Income team and our active commodity strategies continue to be led by Jonathan Bienner, Chief Investment Officer and co-head of Global Fixed Income, and Andrew Wilson, co-head of Global Fixed Income. Also, effective June 16, 2014, Ray Lim joined the Commodities portfolio management team as a portfolio manager. Ray has been with GSAM since 2011 working in the product management team for the Commodities strategy. Prior to joining the firm, Ray spent three years at Pacific Investment Management Company (“PIMCO”) with a focus on fixed income investments. |
| Q | | What is the Fund’s view and strategy going forward? |
| A | | In our view, the overall environment for commodity markets has been improving. On the supply side, we believe disruptions have increased in sectors ranging from energy to industrial metals, with production in a number of key commodities subject to heightened geopolitical risk. Weather has also played a role in recent commodities performance, but we believe it is likely a transient factor. On the demand side, we view a brighter economic outlook should translate into stronger demand for commodities. As the demand and supply balance has generally improved, in our view, correlations between commodities and other asset classes have additionally been decreasing, once again highlighting the portfolio diversification benefits of the asset class. We believe the most likely scenario remains one of mixed economic data, supporting a trading backdrop wherein fundamentals are the key drivers. Thus, we intend to continue to seek to develop relative value themes across the commodity spectrum, pursuing idiosyncratic themes. |
| | Further, whereas commodity prices have generally been range-bound in recent years, we welcome the return of volatility, as we view it as a harbinger of more opportunities to come. During the Reporting Period, for disparate reasons ranging from extreme weather in the U.S. and Brazil to the crisis in Ukraine, a variety of commodities broke through recent price ranges and marked highs. These commodities include natural gas, coffee and palladium — a diverse group. |
| | In energy, while we believe the global crude oil market was finely balanced at the end of the Reporting Period and prices should, in our view, remain range bound, crude oil curves may well continue to offer opportunities to the investor, including harvesting a roll yield from backwardation when available. (Backwardation is a market condition in which a futures price is lower in the distant delivery months than in the near delivery months.) |
| | We believe industrial metals prices should also be broadly range bound in the months ahead, as the earlier supply responses limit upside, but low prices, close or within the cost curve, offer downside support. Opportunities to trade industrial metals in a differentiated individual manner, then, should, in our view, continue. |
| | The agriculture subsector, in our view, is likely to remain well-supplied near term with some volatility driven by difficult to predict weather factors. Within agriculture, as within metals, we believe selection may be an important source of added-value opportunities. |
15
FUND BASICS
Commodity Strategy Fund
as of June 30, 2014
| | | | | | | | | | |
| | PERFORMANCE REVIEW | |
| | | January 1, 2014– June 30, 2014 | | Fund Total Return
(based on NAV)1 | | | S&P GSCI2 | |
| | Class A | | | 5.14 | % | | | 5.71 | % |
| | Class C | | | 4.95 | | | | 5.71 | |
| | Institutional | | | 5.33 | | | | 5.71 | |
| | Class IR | | | 5.30 | | | | 5.71 | |
| | | Class R | | | 5.02 | | | | 5.71 | |
| | 1 | | The net asset value (“NAV”) represents the net assets of the class of the Fund (ex-dividend) divided by the total number of shares of the class outstanding. The Fund’s performance reflects the reinvestment of dividends and other distributions. The Fund’s performance does not reflect the deduction of any applicable sales charges. |
| | 2 | | The S&P GSCI is an unmanaged composite index of commodity sector returns, representing an unleveraged, long-only investment in commodity futures that is broadly diversified across the spectrum of commodities. Individual components qualify for inclusion in the GSCI on the basis of liquidity and are weighted by their respective world production quantities. The figures for the Index do not include any deduction for fees, expenses or taxes. It is not possible to invest directly in an index. |
| | | | | | | | | | | | | | | | |
| | STANDARDIZED TOTAL RETURNS3 |
| | | For the period ended 6/30/14 | | One Year | | | Five Years | | | Since Inception | | | Inception Date |
| | Class A | | | 5.89 | % | | | 2.45 | % | | | -3.51 | % | | 3/30/07 |
| | Class C | | | 9.19 | | | | 2.67 | | | | -3.63 | | | 3/30/07 |
| | Institutional | | | 11.22 | | | | 3.59 | | | | -2.63 | | | 3/30/07 |
| | Class IR | | | 11.17 | | | | 3.68 | | | | -5.29 | | | 11/30/07 |
| | | Class R | | | 10.57 | | | | 3.15 | | | | -5.77 | | | 11/30/07 |
| | 3 | | The Standardized Total Returns are average annual total returns as of the most recent calendar quarter-end. They assume reinvestment of all distributions at NAV. These returns reflect a maximum initial sales charge of 4.5% for Class A Shares and the assumed contingent deferred sales charge for Class C Shares (1% if redeemed within 12 months of purchase). Because Institutional, Class IR and Class R Shares do not involve a sales charge, such a charge is not applied to their Standardized Total Returns. |
The returns set forth in the tables above represent past performance. Past performance does not guarantee future results. The Fund’s investment return and principal value will fluctuate so that an investor’s shares, when redeemed, may be worth more or less than their original cost. Current performance may be lower or higher than the performance quoted above. Please visit our web site at www.GSAMFUNDS.com to obtain the most recent month-end returns. Performance reflects applicable fee waivers and/or expense limitations in effect during the periods shown. In their absence, performance would be reduced. Returns do not reflect the deduction of taxes that a shareholder would pay on Fund distributions or the redemption of Fund shares.
16
FUND BASICS
| | | | | | | | | | |
| | EXPENSE RATIOS4 | |
| | | | | Net Expense Ratio (Current) | | | Gross Expense Ratio (Before Waivers) | |
| | Class A | | | 0.97 | % | | | 1.10 | % |
| | Class C | | | 1.72 | | | | 1.85 | |
| | Institutional | | | 0.63 | | | | 0.76 | |
| | Class IR | | | 0.72 | | | | 0.85 | |
| | | Class R | | | 1.22 | | | | 1.35 | |
| | 4 | | The expense ratios of the Fund, both current (net of applicable fee waivers and/or expense limitations) and before waivers (gross of applicable fee waivers and/or expense limitations) are as set forth above according to the most recent publicly available Prospectus for the Fund and may differ from the expense ratios disclosed in the Financial Highlights in this report. The Fund’s waivers and/or expense limitations will remain in place through at least April 30, 2015, and prior to such date the Investment Adviser may not terminate the arrangements without the approval of the Fund’s Board of Trustees. If these arrangements are discontinued in the future, the expense ratios may change without shareholder approval. |
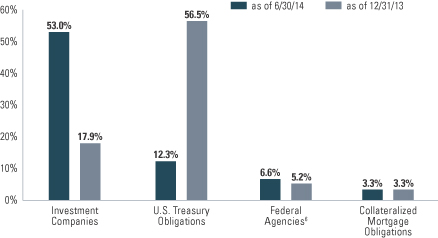
| | 5 | | The percentage shown for each investment category reflects the value of investments in that category as a percentage of net assets. Figures in the above graph may not sum to 100% due to the exclusion of other assets and liabilities. The above graph depicts the Fund’s investments but may not represent the Fund’s market exposure due to the exclusion of certain derivatives, if any, as listed in the Additional Investment Information section of the Schedule of Investments. |
| | 6 | | “Federal Agencies” are mortgage-backed securities guaranteed by the Government National Mortgage Association (“GNMA”), Federal National Mortgage Association and Federal Home Loan Mortgage Corp. GNMA instruments are backed by the full faith and credit of the United States Government. |
17
PORTFOLIO RESULTS
Goldman Sachs Dynamic Allocation Fund
Investment Objective
The Fund seeks long-term capital appreciation.
Portfolio Management Discussion and Analysis
Below, the Goldman Sachs Quantitative Investment Strategies Team discusses the Goldman Sachs Dynamic Allocation Fund’s (the “Fund”) performance and positioning for the six-month period ended June 30, 2014 (the “Reporting Period”).
| Q | | How did the Fund perform during the Reporting Period? |
| A | | During the Reporting Period, the Fund’s Class A, C, Institutional, IR and R Shares generated cumulative total returns, without sales charges, of 3.67%, 3.21%, 3.90%, 3.73% and 3.51%, respectively. These returns compare to the 0.05% cumulative total return of the Fund’s benchmark, the Bank of America Merrill Lynch USD LIBOR One-Month Constant Maturity Index (LUS1) (the “LIBOR 1-Month Index”). The Dynamic Allocation Fund Composite Index, comprised 60% of the MSCI All Country World Index Investable Market Index (Net, USD, Unhedged) (“MSCI ACWI IMI”) and 40% of the Barclays Global Aggregate Bond Index (USD, Hedged) (“Barclays Bond Index”), returned 5.43% during the same period. The MSCI ACWI IMI and Barclays Bond Index posted cumulative total returns of 6.23% and 4.08%, respectively, during the same period. |
| | The Fund’s overall annualized volatility was 6.06% during the Reporting Period, while the overall annualized volatility of the S&P® 500 Index during the same time period was 10.63%. |
| Q | | What were the primary contributors to and detractors from the Fund’s performance based on your team’s asset allocation decisions during the Reporting Period? |
| A | | The Fund seeks to achieve its investment objective by investing primarily in exchange-traded funds (“ETFs”) stocks, futures, swaps and other derivatives that provide exposure to a broad spectrum of asset classes, including but not limited to equities (both in U.S. and non-U.S. companies), fixed income (U.S. and non-U.S., investment grade and high yield) and commodities. Our team manages the Fund dynamically by changing its allocations to these asset classes based on our tactical views and in response to changing market conditions. Our team uses a disciplined, rigorous and quantitative approach, in combination with a qualitative overlay, in allocation to and within the asset classes in which the Fund invests. Allocations are adjusted within the Fund at least monthly based on continuous analysis to help determine which investments are relatively attractive and provide the best potential opportunities for growth in any given period of time. Since the markets represented by each investment are constantly changing, so are the Fund’s allocations. |
| | Overall, the Fund’s asset allocation decisions contributed positively to returns during the Reporting Period. The Fund’s allocations to U.S. large-cap equities, U.K. fixed income and commodities contributed most to its performance. These positive contributors were only partially offset by allocations to Japanese equities and Hong Kong equities, which detracted, as these asset classes retreated during the Reporting Period. Short exposure to European market debt also detracted from returns as the asset class rose during the Reporting Period. |
| | During the Reporting Period, we shifted the Fund’s allocations tactically across equities, credit/fixed income and commodities. We decreased its allocations to U.S. equities and commodities in January 2014, maintaining the reduced exposure through the remainder of the Reporting Period. Additionally, we decreased the Fund’s allocations to Japanese equities, U.S. Treasury inflation protected securities (“TIPS”) and emerging market credit, as those asset classes performed poorly during the Reporting Period. After a spike |
18
PORTFOLIO RESULTS
| | in volatility at the start of 2014, we reduced the Fund’s allocation to non-U.S. equities in January 2014, but quickly increased its allocation once again as equity volatility receded. |
| Q | | How did the Goldman Sachs Market Sentiment Indicator factor into risk allocation decisions that were made during the Reporting Period? |
| A | | The Goldman Sachs Market Sentiment Indicator (“MSI”) is a proprietary tool that analyzes how the markets will potentially respond to future global changes in financial, economic and sociopolitical events. With the help of the MSI, the Fund seeks to mitigate risk in unstable markets by reducing volatility. |
| | In January 2014, when equity markets sold off and volatility in global markets rose, the MSI detected heightened levels of overall market distress, leading us to pull back on the Fund’s overall volatility levels such that the Fund’s overall risk target at the end of January 2014 was approximately 13% lower than at the start of the year. As risk assets began to generate stronger returns, the MSI retreated to normal levels by the middle of February and remained at benign levels for the remainder of the Reporting Period, resulting in the Fund running at its full-risk target. |
| Q | | How did the Fund use derivatives and similar instruments during the Reporting Period? |
| A | | The Fund invested in futures and credit default swaps to achieve exposure to equities (both in U.S. and non-U.S. companies) and fixed income (U.S. and non-U.S., investment grade and high yield) during the Reporting Period. The Fund also used commodity index-linked structured notes to gain exposure to commodities. We used foreign exchange currency forward contracts for hedging purposes, i.e. to neutralize the currency impact of holding individual Japanese stocks selected based on value and quality factors. |
| Q | | What changes did you make within the Fund during the Reporting Period? |
| A | | As indicated earlier, in January 2014, when the MSI spiked and prompted an intra-month rebalance, the Fund reduced exposure to risky assets overall, particularly across allocations to U.S. and non-U.S. equities and to commodities, as these asset classes exhibited poor momentum and heightened risk. By the end of February, as volatility receded, the Fund increased exposure to non-U.S. equities as a result of strong momentum. As equity market volatility continued to recede through the remainder of the Reporting Period, the Fund increased exposure to risk assets that exhibited positive momentum. |
| Q | | Were there any changes to the Fund’s portfolio management team during the Reporting Period? |
| A | | There were no changes to the Fund’s portfolio management team during the Reporting Period. |
| Q | | What is the Fund’s asset allocation view and strategy for the months ahead? |
| A | | At the end of June 2014, the Fund had increased exposure to non-U.S. equities, which had exhibited strong momentum and relatively benign volatility. The Fund had decreased exposure to U.K. and German government bonds. The Fund maintained its modest positions in commodities and TIPS. |
| | We continue to believe the Fund’s dynamic allocation approach is important because it can adapt to changing markets, seeking what we believe are the best opportunities for investment and attempting to mitigate risk when the markets become unstable. There is no guarantee that the Fund’s dynamic management strategy will cause it to achieve its investment objective. |
19
FUND BASICS
Dynamic Allocation Fund
as of June 30, 2014
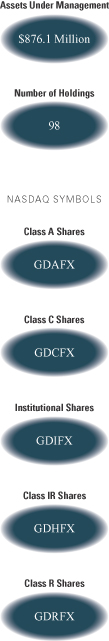
| | | | | | | | | | | | | | | | | | | | | | |
| | PERFORMANCE REVIEW | |
| | | January 1, 2014– June 30, 2014 | | Fund Total
Return
(based on NAV)1 | | | BofA Merrill
Lynch USD LIBOR One-Month Index2 | | | MSCI All Country
World Index
Investable
Market Index3 | | | Barclays Global
Aggregate
Bond Index4 | | | Dynamic
Allocation Fund
Composite
Index5 | |
| | Class A | | | 3.67 | % | | | 0.05 | % | | | 6.23 | % | | | 4.08 | % | | | 5.43 | % |
| | Class C | | | 3.21 | | | | 0.05 | | | | 6.23 | | | | 4.08 | | | | 5.43 | |
| | Institutional | | | 3.90 | | | | 0.05 | | | | 6.23 | | | | 4.08 | | | | 5.43 | |
| | Class IR | | | 3.73 | | | | 0.05 | | | | 6.23 | | | | 4.08 | | | | 5.43 | |
| | | Class R | | | 3.51 | | | | 0.05 | | | | 6.23 | | | | 4.08 | | | | 5.43 | |
| | 1 | | The net asset value (“NAV”) represents the net assets of the class of the Fund (ex-dividend) divided by the total number of shares of the class outstanding. The Fund’s performance reflects the reinvestment of dividends and other distributions. The Fund’s performance does not reflect the deduction of any applicable sales charges. |
| | 2 | | The Bank of America Merrill Lynch US Dollar One-Month LIBOR Constant Maturity Index tracks the performance of a synthetic asset paying Libor to a stated maturity. The Index is based on the assumed purchase at par of a synthetic instrument having exactly its stated maturity and with a coupon equal to that day’s fixing rate. That issue is assumed to be sold the following business day (priced at a yield equal to the current day fixing rate) and rolled into a new instrument. The Index figures do not reflect any deduction for fees, expenses or taxes. It is not possible to invest directly in an index. |
| | 3 | | The MSCI All Country World Index Investable Market Index (“MSCI ACWI IMI Index”) is a free float-adjusted market capitalization weighted index that is designed to measure the equity market performance of developed and emerging markets. The MSCI ACWI IMI Index consists of 45 country indices comprising 24 developed and 21 emerging market country indices. The developed market country indices included are: Australia, Austria, Belgium, Canada, Denmark, Finland, France, Germany, Greece, Hong Kong, Ireland, Israel, Italy, Japan, Netherlands, New Zealand, Norway, Portugal, Singapore, Spain, Sweden, Switzerland, the United Kingdom and the United States. The emerging market country indices included are: Brazil, Chile, China, Colombia, Czech Republic, Egypt, Hungary, India, Indonesia, Korea, Malaysia, Mexico, Morocco, Peru, Philippines, Poland, Russia, South Africa, Taiwan, Thailand, and Turkey. The Index figures do not reflect any deduction for fees, expenses or taxes. It is not possible to invest directly in an index. |
| | 4 | | The Barclays Global Aggregate Bond Index provides a broad-based measure of the global investment-grade fixed income markets. The three major components of this index are the U.S. Aggregate, the Pan-European Aggregate, and the Asian-Pacific Aggregate Indices. The index also includes Eurodollar and Euro-Yen corporate bonds, Canadian government, agency and corporate securities, and USD investment grade 144A securities. The Index figures do not reflect any deduction for fees, expenses or taxes. It is not possible to invest directly in an index. |
| | 5 | | The Dynamic Allocation Fund Composite Index is comprised 60% of the MSCI ACWI IMI Index and 40% of the Barclays Global Aggregate Bond Index. |
20
FUND BASICS
| | | | | | | | | | | | |
| | STANDARDIZED TOTAL RETURNS6 |
| | | For the period ended 6/30/14 | | One Year | | | Since Inception | | | Inception Date |
| | Class A | | | 3.55 | % | | | 3.57 | % | | 1/5/10 |
| | Class C | | | 7.70 | | | | 4.11 | | | 1/5/10 |
| | Institutional | | | 9.98 | | | | 5.31 | | | 1/5/10 |
| | Class IR | | | 9.80 | | | | 5.15 | | | 1/5/10 |
| | | Class R | | | 9.24 | | | | 4.63 | | | 1/5/10 |
| | 6 | | The Standardized Total Returns are average annual total returns as of the most recent calendar quarter-end. They assume reinvestment of all distributions at NAV. These returns reflect a maximum initial sales charge of 5.5% for Class A Shares and the assumed contingent deferred sales charge for Class C Shares (1% if redeemed within 12 months of purchase). Because Institutional, Class IR and Class R Shares do not involve a sales charge, such a charge is not applied to their Standardized Total Returns. |
The returns set forth in the tables above represent past performance. Past performance does not guarantee future results. The Fund’s investment return and principal value will fluctuate so that an investor’s shares, when redeemed, may be worth more or less than their original cost. Current performance may be lower or higher than the performance quoted above. Please visit our web site at www.GSAMFUNDS.com to obtain the most recent month-end returns. Performance reflects applicable fee waivers and/or expense limitations in effect during the periods shown. In their absence, performance would be reduced. Returns do not reflect the deduction of taxes that a shareholder would pay on Fund distributions or the redemption of Fund shares.
| | | | | | | | | | |
| | EXPENSE RATIOS7 | |
| | | | | Net Expense Ratio (Current) | | | Gross Expense Ratio (Before Waivers) | |
| | Class A | | | 1.36 | % | | | 1.53 | % |
| | Class C | | | 2.11 | | | | 2.28 | |
| | Institutional | | | 0.96 | | | | 1.13 | |
| | Class IR | | | 1.11 | | | | 1.28 | |
| | | Class R | | | 1.61 | | | | 1.78 | |
| | 7 | | The expense ratios of the Fund, both current (net of applicable fee waivers and/or expense limitations) and before waivers (gross of applicable fee waivers and/or expense limitations) are as set forth above according to the most recent publicly available Prospectus for the Fund and may differ from the expense ratios disclosed in the Financial Highlights in this report. The Fund’s waivers and/or expense limitations will remain in place through at least April 30, 2015, and prior to such date the Investment Adviser may not terminate the arrangements without the approval of the Fund’s Board of Trustees. If these arrangements are discontinued in the future, the expense ratios may change without shareholder approval. |
21
FUND BASICS
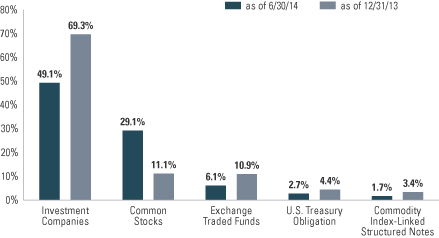
| | 8 | | The Fund is actively managed and, as such, its composition may differ over time. The percentage shown for each investment category reflects the value of investments in that category as a percentage of net assets. Figures in the above graph may not sum to 100% due to the exclusion of other assets and liabilities. Underlying sector allocations of exchange traded funds (“ETFs”) held by the Fund are not reflected in the graph above. Consequently, the Fund’s overall sector allocations may differ from the percentages contained in the graph above. The above graph depicts the Fund’s investments but may not represent the Fund’s market exposure due to the exclusion of certain derivatives, if any, as listed in the Additional Investment Information section of the Schedule of Investments. |
22
PORTFOLIO RESULTS
Goldman Sachs Dynamic Commodity
Strategy Fund
Investment Objective
The Fund seeks long-term total return.
Portfolio Management Discussion and Analysis
Below, the Goldman Sachs Commodities Team discusses the Goldman Sachs Dynamic Commodity Strategy Fund’s (the “Fund”) performance and positioning for the period from its inception on April 30, 2014 through June 30, 2014 (the “Reporting Period”).
| Q | | How did the Fund perform during the Reporting Period? |
| A | | During the Reporting Period, the Fund’s Class A, C, Institutional, IR and R Shares generated cumulative total returns, without sales charges, of 1.00%, 0.90%, 1.10%, 1.10% and 1.00%, respectively. These returns compare to the -2.30% cumulative total return of the Fund’s benchmark, the Dow Jones — UBS Commodity Index Total Return®1 (the “Commodity Index”) during the same period. |
| Q | | What economic and market factors most influenced the commodities markets as a whole during the Reporting Period? |
| A | | Commodities markets, as measured by the Commodity Index, faced a somewhat challenging Reporting Period, due primarily to headwinds in the agriculture subsector. |
| | Industrial metals was the strongest subsector in the Commodity Index, returning 5.35% during the Reporting Period. Nickel was up 3.55% on the back of the Indonesian export ban and concerns around its impact on nickel supply. Zinc also performed well, returning 8.07%, as inventories shrank and Chinese economic data was supportive. Riding this tailwind, copper and aluminum followed suit, finishing June 2014 up 5.93% and 4.32%, respectively. |
| | The livestock subsector gained 5.23% during the Reporting Period, with wide dispersion of performance within the subsector. Lean hogs were up just 0.52%, but live cattle rose 9.24%. |
| | The precious metals subsector of the Commodity Index was up 3.87% during the Reporting Period, with gold and silver returning 1.99% and 9.59%, respectively. In spite of signs of improvement in the global economy, the precious metals subsector climbed higher based on heightened geopolitical risk and a dovish Federal Reserve (“Fed”), as the Fed signaled it intends to keep U.S. interest rates near record lows. |
| | The energy subsector of the Commodity Index rose 1.34% during the Reporting Period, driven by the petroleum complex. Escalation of the conflict in Iraq and ongoing supply outages in key oil producing regions globally, most notably in the Middle East and North Africa, pressured prices higher. Brent and West Texas Intermediate (“WTI”) crude oil were up 5.44% and 7.47%, respectively. The outperformance of WTI was driven by the timely start of a pipeline transporting large flows of Cushing, Oklahoma crude oil to the Gulf Coast, causing a significant drawdown of inventories at Cushing and acting as another positive catalyst for the domestic crude oil. (Cushing, Oklahoma is the physical delivery point for NYMEX WTI futures.) Unleaded gasoline was up 5.31% during the Reporting Period. |
| | The softs subsector fell 10.08% during the Reporting Period, with coffee, cotton and sugar each down significantly — returning -16.24%, -14.13% and -2.95%, respectively. (The softs subsector is a subsector of the Commodity Index that measures the performance of only the soft commodities, inclusive of coffee, sugar, cocoa and cotton. The softs subsector may sometimes be considered a sub-category of the agriculture subsector.) |
| | Agriculture was the worst performing subsector in the Commodity Index during the Reporting Period, declining 13.01%. Corn, soybeans and wheat were down 18.66%, 9.39% and 21.52%, respectively, driven by favorable weather conditions in the U.S. and no further escalation in tensions between Russia and Ukraine, two grain-producing countries. |
23
| | 1 | | Effective July 1, 2014 the Dow Jones — UBS Commodity Index Total Return® was re-named the Bloomberg Commodity Index Total Return. |
PORTFOLIO RESULTS
| Q | | What key factors were responsible for the Fund’s performance during the Reporting Period? |
| A | | The Fund is a long-only, actively managed fund that seeks to generate alpha, or add value, principally through overweight and underweight positioning in individual commodities and commodity subsectors relative to the Commodity Index. In addition, the Fund’s portfolio may be positioned on commodity curves at different nodes, or segments, from the Commodity Index, and it may include allocations to out-of-benchmark commodities, all with the intention of seeking to capture active returns in excess of the Commodity Index. As such, we believe this strategy provides an efficient way to gain broad commodity exposure in a long-only, unlevered, actively managed portfolio by combining beta, or market, exposure with our ability to implement views on individual commodities and sectors. |
| | During the Reporting Period, the Fund generated returns that outperformed the Commodity Index. Our overweight and underweight positioning in individual commodities relative to the Commodity Index contributed positively to results during the Reporting Period. |
| Q | | Which positions contributed most positively to the Fund’s performance during the Reporting Period? |
| A | | An underweight position in grains relative to the Commodity Index contributed positively to the Fund’s performance during the Reporting Period. A combination of improved weather conditions in major growing and planting regions across the U.S. and receding geopolitical risk premiums concerning Russia and Ukraine pressured grain prices lower. Market participants assigned lower probability of further sanctions against Russia in light of the peaceful Ukrainian Presidential election and Russian President Putin’s willingness to respect the choice of the Ukrainians. |
| | The Fund’s overweight position in WTI crude oil also boosted the Fund’s relative performance during the Reporting Period, as inventory at Cushing, Oklahoma, the delivery point for the NYMEX WTI futures contract, declined to the lowest levels observed year-to-date through June 30, 2014. This was due in part to high and steady volume of crude oil being transported from the U.S. midcontinent to the Gulf Coast, buoying prices of WTI crude oil. |
| | Overweight positions in palladium and platinum versus an underweight in gold within the precious metals subsector also contributed positively to the Fund’s relative results. Palladium prices advanced in part on persistent concerns around the risk of supply disruptions from Russia as a result of sanctions against Russia over the Ukraine/Russia conflict. Russia is a major supplier of palladium. Similarly driving platinum prices were concerns about the protracted labor strike in South Africa, which took a substantial amount of supply off a market already in deficit. About 75% of platinum mine production originates from South Africa. |
| Q | | Which positions detracted significantly from the Fund’s performance during the Reporting Period? |
| A | | An underweight position in gold and silver detracted from Fund performance during the Reporting Period. Most of the negative impact came in June 2014 when gold and silver prices rallied based on rising tensions in Iraq. Investors increased demand for precious metals like gold and silver, which are traditionally perceived to benefit from a flight to quality, following their lackluster performance in May 2014. In May 2014, stronger than expected U.S. economic data, easing Russia/Ukraine concerns, and reports of lower physical demand in China had weighed on gold and silver prices. |
| | An underweight position in Brent crude oil also detracted from the Fund’s relative returns, as the broad petroleum complex climbed higher amid escalating conflicts in Iraq and the continued supply outages in key oil producing regions globally, keeping global crude oil finely balanced. |
| Q | | How did the Fund use derivatives and similar instruments during the Reporting Period? |
| A | | The Fund seeks to maintain substantial economic exposure to the performance of the commodities markets by investing in a wholly-owned subsidiary of the Fund organized as a company under the laws of the Cayman Islands (the “Subsidiary”) and in commodity index-linked notes. The Subsidiary primarily obtains its commodity exposure investing in commodity-linked derivative instruments, including total return swaps. The Subsidiary also invests in other instruments, including fixed income securities, either as investments or to serve as margin or collateral for its swap positions. |
| Q | | Did you make any changes in the Fund’s strategy or allocations during the Reporting Period? |
| A | | Given the Fund’s launch on April 30, 2014, it was not so much a matter of making changes during the Reporting Period but of building the portfolio in accordance with the Fund’s principal investment strategies. |
24
PORTFOLIO RESULTS
| Q | | Were there any changes to the Fund’s portfolio management team during the Reporting Period? |
| A | | During the Reporting Period, Steve Lucas, head of Commodities portfolio management, left Goldman Sachs Asset Management (“GSAM”). Michael Johnson became head of Commodities portfolio management. Michael has been with GSAM for 12 years and has been working side by side with Steve on the Commodities strategies since the inception of the active commodity strategies in 2005. Michael will continue to work with the current commodity portfolio managers, including John Calvaruso (12 years in GSAM) and Ayesha Parra (seven years in GSAM), as well as leverage the broad macro resources of the Fixed Income team, including the credit, emerging market and country teams. The members of the Commodities portfolio management team will now report to Michael, who will report to Sam Finkelstein, head of Macro Strategies within the broader Global Fixed Income team. Our Global Fixed Income team and our active commodity strategies continue to be led by Jonathan Bienner, Chief Investment Officer and co-head of Global Fixed Income, and Andrew Wilson, co-head of Global Fixed Income. Also, effective June 16, 2014, Ray Lim joined the Commodities portfolio management team as a portfolio manager. Ray has been with GSAM since 2011 working in the product management team on commodities strategies. Prior to joining the firm, Ray spent three years at Pacific Investment Management Company (“PIMCO”) with a focus on fixed income investments. |
| Q | | How was the Fund positioned at the end of the Reporting Period? |
| A | | At the end of the Reporting Period, the Fund was most overweight relative to the Commodity Index in the precious metals and energy subsectors. The Fund was underweight compared to the Commodity Index in the grains, softs and textiles subsectors and was rather neutrally weighted relative to the Commodity Index in the industrial metals subsector at the end of the Reporting Period. |
| Q | | What is the Fund’s view and strategy going forward? |
| A | | In our view, the overall market environment for active investing in commodity markets has been improving, as correlations between individual commodities has been decreasing. We believe the most likely scenario remains one of mixed economic data, supporting a trading backdrop wherein fundamentals are the key drivers. Thus, we intend to continue to seek to develop relative value themes across the commodity spectrum, pursuing idiosyncratic themes. |
| | Further, whereas commodity prices have generally been range-bound in recent years, we welcome the return of volatility, as we view it as a harbinger of more opportunities to come. During the Reporting Period, for disparate reasons ranging from extreme weather in the U.S. and Brazil to the crisis in Ukraine, a variety of commodities broke through recent price ranges and marked highs. These commodities include natural gas, coffee and palladium — a diverse group. |
| | In energy, while we believe the global crude oil market was finely balanced at the end of the Reporting Period and prices should, in our view, remain range bound, crude oil curves may well continue to offer opportunities to the investor, including harvesting a roll yield from backwardation when available. (Backwardation is a market condition in which a futures price is lower in the distant delivery months than in the near delivery months.) |
| | We believe industrial metals prices should also be broadly range bound in the months ahead, as the earlier supply responses limit upside, but low prices, close or within the cost curve, offer downside support. Opportunities to trade industrial metals in a differentiated individual manner, then, should, in our view, continue. |
| | The agriculture subsector, in our view, is likely to remain well-supplied near term with some volatility driven by difficult to predict weather factors. Within agriculture, as within metals, we believe selection may be an important source of added value opportunity. |
25
FUND BASICS
Dynamic Commodity Strategy Fund
as of June 30, 2014
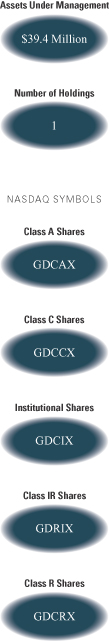
| | | | | | | | | | |
| | PERFORMANCE REVIEW | |
| | | April 30, 2014– June 30, 2014 | | Total Fund Return
(based on NAV)1 | | | Dow Jones – UBS Commodity
Index Total Return2 | |
| | Class A | | | 1.00 | % | | | -2.30 | % |
| | Class C | | | 0.90 | | | | -2.30 | |
| | Institutional | | | 1.10 | | | | -2.30 | |
| | Class IR | | | 1.10 | | | | -2.30 | |
| | | Class R | | | 1.00 | | | | -2.30 | |
| | 1 | | The net asset value (“NAV”) represents the net assets of the class of the Fund (ex-dividend) divided by the total number of shares of the class outstanding. The Fund’s performance reflects the reinvestment of dividends and other distributions. The Fund’s performance does not reflect the deduction of any applicable sales charges. |
| | 2 | | The Dow Jones-UBS Commodity Index Total Return (DJ-UBS)* is designed to be a highly liquid and diversified benchmark for the commodity futures market. It is rules based and composed of futures contracts on physical commodities. The index is unhedged and expressed in USD. The DJ-UBS is reweighted and rebalanced each year in January on a price-percentage basis. Rebalancing and reweighting means that, in general, the index may reallocate out of commodities that have appreciated in value and into commodities that have underperformed. To the extent that commodity markets exhibit mean-reverting characteristics over time, this approach may help enhance performance. All Dow Jones UBS Commodity Indices were rebranded from Dow Jones AIG Indices effective May 06, 2009. |
*Effective July 1, 2014, the Dow Jones-UBS Commodity Index Total Return was renamed the Bloomberg Commodity Index Total Return.
| | | | | | | | |
| | STANDARDIZED TOTAL RETURNS3 |
| | | For the period ended 6/30/14 | | Since Inception | | | Inception Date |
| | Class A | | | -3.53 | % | | 4/30/14 |
| | Class C | | | 0.90 | | | 4/30/14 |
| | Institutional | | | 1.10 | | | 4/30/14 |
| | Class IR | | | 1.10 | | | 4/30/14 |
| | | Class R | | | 1.00 | | | 4/30/14 |
| | 3 | | The Standardized Total Returns are cumulative total returns as of the most recent calendar quarter-end. They assume reinvestment of all distributions at NAV. These returns reflect a maximum initial sales charge of 4.5% for Class A Shares and the assumed contingent deferred sales charge for Class C Shares (1% if redeemed within 12 months of purchase). Because Institutional, Class IR and Class R Shares do not involve a sales charge, such a charge is not applied to their Standardized Total Returns. |
The returns set forth in the tables above represent past performance. Past performance does not guarantee future results. The Fund’s investment return and principal value will fluctuate so that an investor’s shares, when redeemed, may be worth more or less than their original cost. Current performance may be lower or higher than the performance quoted above. Please visit our web site at www.GSAMFUNDS.com to obtain the most recent month-end returns. Performance reflects applicable fee waivers and/or expense limitations in effect during the periods shown. In their absence, performance would be reduced. Returns do not reflect the deduction of taxes that a shareholder would pay on Fund distributions or the redemption of Fund shares.
26
FUND BASICS
| | | | | | | | | | |
| | EXPENSE RATIOS4 | |
| | | | | Net Expense Ratio (Current) | | | Gross Expense Ratio (Before Waivers) | |
| | Class A | | | 1.19 | % | | | 2.04 | % |
| | Class C | | | 1.94 | | | | 2.79 | |
| | Institutional | | | 0.85 | | | | 1.70 | |
| | Class IR | | | 0.94 | | | | 1.79 | |
| | | Class R | | | 1.44 | | | | 2.29 | |
| | 4 | | The expense ratios of the Fund, both current (net of applicable fee waivers and/or expense limitations) and before waivers (gross of applicable fee waivers and/or expense limitations) are as set forth above according to the most recent publicly available Prospectus for the Fund and may differ from the expense ratios disclosed in the Financial Highlights in this report. The Fund’s waivers and/or expense limitations will remain in place through at least April 30, 2015, and prior to such date the Investment Adviser may not terminate the arrangements without the approval of the Fund’s Board of Trustees. If these arrangements are discontinued in the future, the expense ratios may change without shareholder approval. |
As of June 30, 2014, the Fund has an investment in an investment company of approximately 80.5% of net assets. The Fund is actively managed and, as such, its composition may differ over time. This allocation may not sum to 100% due to the exclusion of other assets and liabilities. The allocation depicts the Fund’s investments but may not represent the Fund’s market exposure due to the exclusion of certain derivatives, if any, as listed in the Additional Investment Information section of the Schedule of Investments.
27
PORTFOLIO RESULTS
Goldman Sachs Managed Futures Strategy Fund
Investment Objective
The Fund seeks to generate long-term absolute return.
Portfolio Management Discussion and Analysis
Below, the Goldman Sachs Quantitative Investment Strategies Team discusses the Goldman Sachs Managed Futures Strategy Fund’s (the “Fund”) performance and positioning for the six-month period ended June 30, 2014 (the “Reporting Period”).
| Q | | How did the Fund perform during the Reporting Period? |
| A | | During the Reporting Period, the Fund’s Class A, C, Institutional, IR and R Shares generated cumulative total returns, without sales charges, of -3.78%, -4.15%, -3.66%, -3.67% and -4.00%, respectively. These returns compare to the 0.05% cumulative total return of the Fund’s benchmark, the Bank of America Merrill Lynch USD LIBOR One-Month Constant Maturity Index (LUS1) (the “LIBOR 1-Month Index”), during the same time period. |
| | The Fund’s overall annualized volatility was 5.59% during the Reporting Period, while the overall annualized volatility of the S&P® 500 Index during the same time period was 10.50%. |
| Q | | What were the primary contributors to and detractors from the Fund’s performance during the Reporting Period? |
| A | | The Fund implements a trend-following strategy that takes long and/or short positions in a wide range of asset classes, including equities, fixed income and currencies, among others, to seek long-term absolute return. The Fund seeks to achieve its investment objective by investing primarily in a portfolio of equities, equity index futures, bonds, bond futures, equity swaps, interest rate swaps, currency forwards and non-deliverable forwards, options, exchange-traded funds (“ETFs”) and structured securities. As a result of the Fund’s use of derivatives, the Fund may also hold significant amounts of U.S. Treasuries or short-term investments. The Fund’s investments are made without restriction as to issuer capitalization, country, currency, maturity or credit rating. |
| | Negative Fund performance for the Reporting Period overall can be attributed primarily to January and March 2014, but was partially offset by positive performance in February and June 2014. |
| | Overall, positions in developed market equities helped Fund performance. Long positions in Canada, Italy and Spain were among the largest contributors to performance. Conversely, long positions in Japanese equities during the first calendar quarter hurt Fund performance, as this market pulled back early in 2014. |
| | Developed market fixed income detracted from Fund returns, albeit only modestly. The Fund’s short position in U.K. debt particularly hampered results, as rates came down and the yield curve steepened in that nation. |
| | Emerging market currencies were challenged during the Reporting Period, as they tend to be sensitive to capital flows and concerns about the U.S. Federal Reserve’s (the “Fed”) policies. The Fund’s exposure to emerging market currencies detracted from its returns. The Fund’s short position during the first quarter of 2014 in the Indonesian rupiah was among the most significant detractors. Conversely, the Fund was long the Indian rupee and South Korean won, which appreciated throughout the Reporting Period, buoying Fund performance. |
| | Exposure to emerging market equities slightly detracted from Fund performance during the Reporting Period. In particular, the Fund’s short positions in Chinese equities hurt Fund results. However, long positions in South Africa and Taiwan equities, which were strong performers during the Reporting Period, helped to offset these results. |
28
PORTFOLIO RESULTS
| | The Fund maintained exposure to commodities during the Reporting Period. Long positions in soft commodities and short positions in precious metals hurt Fund returns during the Reporting Period, while long positions in livestock and petroleum boosted Fund performance. |
| Q | | How did the Fund use derivatives and similar instruments during the Reporting Period? |
| A | | The Fund used derivatives, including futures, swaps and forwards, to implement long and short positions. The Fund invested in futures and currency forwards to seek exposure to equities (both in U.S. and non-U.S. companies) and currencies (U.S. and non-U.S. currencies), respectively. The Fund used interest rate swaps and currency forwards to seek exposure to fixed income. We used sector based commodity-linked structured notes as a means of expressing momentum/trend views on various commodity assets. |
| Q | | What changes did you make within the Fund during the Reporting Period? |
| A | | At the start of the Reporting Period, the Fund held long positions overall in developed market equities. We held these positions into the second quarter of 2014, with the exception of Japanese equities, where the Fund moved to a net short position, as the Japanese equity market pulled back in March and April 2014. The Fund maintained net long positions throughout the Reporting Period in emerging market equities, increasing its exposure later in the Reporting Period. |
| | The Fund held mostly short positions in emerging market currencies early in the Reporting Period, particularly in the Colombian peso, Malaysian ringgit and Chilean peso. Later in the Reporting Period, we reversed the exposure, taking net long Fund positions in emerging market currencies. However, the Fund remained short the Czech koruna, Chilean peso and Russian ruble during the second calendar quarter. |
| | Within developed fixed income, the Fund was substantially short the U.K., and to a lesser extent, the U.S., but we neutralized its U.S. exposure and significantly trimmed its U.K. position as the Reporting Period progressed. Additionally, the Fund maintained a flattening view of the long-end of the yield curve throughout the Reporting Period, meaning a view that the differential in yields would narrow. |
| | The Fund maintained net long positions in commodities throughout the Reporting Period. The Fund held a slight long position in the precious metals sector early in the Reporting Period, but we moved to a short position later in the Reporting Period. |
| Q | | Were there any changes to the Fund’s portfolio management team during the Reporting Period? |
| A | | There were no changes to the Fund’s portfolio management team during the Reporting Period. |
| Q | | What is the Fund’s tactical asset allocation view and strategy for the months ahead? |
| A | | Going into the second half of 2014, we intend to continue to seek to identify price trends in various asset classes over short-, medium- and long-term horizons via a proprietary investment model. Upon identifying a trend in a given instrument or asset, the Fund will take a long or short position in the instrument or asset. Long positions benefit from an increase in price of the underlying instrument or asset, while short positions benefit from a decrease in price of the underlying instrument or asset. The size of the Fund’s position in an instrument or asset is primarily related to the strength of the overall trend identified by the investment model. We continue to believe that the Fund’s trend-following strategy is important because it can adapt to changing markets, seeking what we believe are the best opportunities for investment and seeking to mitigate risk when the markets become unstable. There is no guarantee that the Fund’s trend-following strategy will cause it to achieve its investment objective. |
29
FUND BASICS
Managed Futures Strategy Fund
as of June 30, 2014
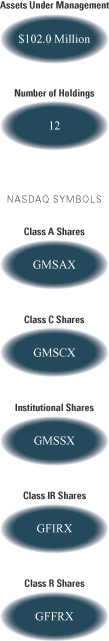
| | | | | | | | | | |
| | PERFORMANCE REVIEW | |
| | | January 1, 2014– June 30, 2014 | | Fund Total Return
(based on NAV)1 | | | BofA Merrill Lynch USD LIBOR
One-Month Index2 | |
| | Class A | | | -3.78 | % | | | 0.05 | % |
| | Class C | | | -4.15 | | | | 0.05 | |
| | Institutional | | | -3.66 | | | | 0.05 | |
| | Class IR | | | -3.67 | | | | 0.05 | |
| | | Class R | | | -4.00 | | | | 0.05 | |
| | 1 | | The net asset value (“NAV”) represents the net assets of the class of the Fund (ex-dividend) divided by the total number of shares of the class outstanding. The Fund’s performance reflects the reinvestment of dividends and other distributions. The Fund’s performance does not reflect the deduction of any applicable sales charges. |
| | 2 | | The Bank of America Merrill Lynch US Dollar One-Month LIBOR Constant Maturity Index tracks the performance of a synthetic asset paying Libor to a stated maturity. The Index is based on the assumed purchase at par of a synthetic instrument having exactly its stated maturity and with a coupon equal to that day’s fixing rate. That issue is assumed to be sold the following business day (priced at a yield equal to the current day fixing rate) and rolled into a new instrument. The Index figures do not reflect any deduction for fees, expenses or taxes. It is not possible to invest directly in an index. |
| | | | | | | | | | |
| | STANDARDIZED TOTAL RETURNS3 |
| | | For the period ended 6/30/14 | | One Year | | | Since Inception | | Inception Date |
| | Class A | | | -4.45 | % | | -3.82% | | 2/29/12 |
| | Class C | | | -0.68 | | | -2.26 | | 2/29/12 |
| | Institutional | | | 1.56 | | | -1.12 | | 2/29/12 |
| | Class IR | | | 1.36 | | | -1.25 | | 2/29/12 |
| | | Class R | | | 0.84 | | | -1.78 | | 2/29/12 |
| | 3 | | The Standardized Total Returns are average annual total returns as of the most recent calendar quarter-end. They assume reinvestment of all distributions at NAV. These returns reflect a maximum initial sales charge of 5.5% for Class A Shares and the assumed contingent deferred sales charge for Class C Shares (1% if redeemed within 12 months of purchase). Because Institutional, Class IR and Class R Shares do not involve a sales charge, such a charge is not applied to their Standardized Total Returns. |
The returns set forth in the tables above represent past performance. Past performance does not guarantee future results. The Fund’s investment return and principal value will fluctuate so that an investor’s shares, when redeemed, may be worth more or less than their original cost. Current performance may be lower or higher than the performance quoted above. Please visit our web site at www.GSAMFUNDS.com to obtain the most recent month-end returns. Performance reflects applicable fee waivers and/or expense limitations in effect during the periods shown. In their absence, performance would be reduced. Returns do not reflect the deduction of taxes that a shareholder would pay on Fund distributions or the redemption of Fund shares.
30
FUND BASICS
| | | | | | | | | | |
| | EXPENSE RATIOS4 | | | | | | | | |
| | | | | Net Expense Ratio (Current) | | | Gross Expense Ratio (Before Waivers) | |
| | Class A | | | 1.54 | % | | | 2.62 | % |
| | Class C | | | 2.29 | | | | 3.37 | |
| | Institutional | | | 1.14 | | | | 2.22 | |
| | Class IR | | | 1.29 | | | | 2.37 | |
| | | Class R | | | 1.79 | | | | 2.87 | |
| | 4 | | The expense ratios of the Fund, both current (net of applicable fee waivers and/or expense limitations) and before waivers (gross of applicable fee waivers and/or expense limitations) are as set forth above according to the most recent publicly available Prospectus for the Fund and may differ from the expense ratios disclosed in the Financial Highlights in this report. The Fund’s waivers and/or expense limitations will remain in place through at least April 30, 2015, and prior to such date the Investment Adviser may not terminate the arrangements without the approval of the Fund’s Board of Trustees. If these arrangements are discontinued in the future, the expense ratios may change without shareholder approval. |
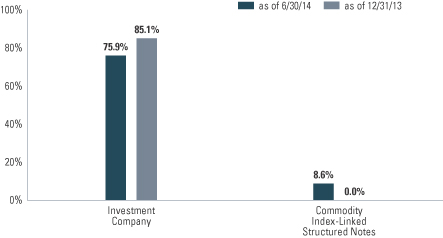
| | 8 | | The Fund is actively managed and, as such, its composition may differ over time. The percentage shown for each investment category reflects the value of investments in that category as a percentage of net assets. Figures in the above graph may not sum to 100% due to the exclusion of other assets and liabilities. The graph depicts the Fund’s investments but may not represent the Fund’s market exposure due to the exclusion of certain derivatives, if any, as listed in the Additional Investment Information section of the Schedule of Investments. |
31
GOLDMAN SACHS REAL ESTATE SECURITIES FUNDS
What Differentiates the Goldman Sachs
Real Estate Securities Investment Process?
The Goldman Sachs International Real Estate Securities and Real Estate Securities Funds seek to generate long-term growth of capital and dividend income by investing primarily in real estate industry companies, including REITs, on an international or domestic basis, respectively. REITs which offer daily liquidity have historically strong returns, low volatility and low correlation to traditional asset classes.
Goldman Sachs’ Real Estate Securities Investment Process

Buy high quality companies.
We seek to purchase those companies that combine attractive market exposures, management teams, capital structures and growth prospects.
Buy at a reasonable price.
We seek to consistently select securities that are trading at discounts to their intrinsic value.
Diversification reduces risk.
We seek to diversify the portfolio holdings based on property type and geographic markets to manage risk without compromising returns.

Team Based:
Portfolio decisions are made by the entire team.
Continuous Scrutiny:
Market, industry and company developments are reviewed daily.
Fundamental Analysis:
Portfolio holdings are determined by the risk/reward characteristics of an issuer and the team’s conviction in the overall business and management’s ability to create value.

Real estate securities portfolio that:
| n | | is a high quality portfolio that is strategically positioned for long-term growth potential |
| n | | is a result of bottom-up stock selection with a focus on long-term investing |
32
PORTFOLIO RESULTS
Goldman Sachs International Real Estate Securities Fund
Investment Objective
The Fund seeks total return comprised of long-term growth of capital and dividend income.
Portfolio Management Discussion and Analysis
Below, the Goldman Sachs Real Estate Securities Investment Team discusses the Goldman Sachs International Real Estate Securities Fund’s (the “Fund”) performance and positioning for the six-month period ended June 30, 2014 (the “Reporting Period”).
| Q | | How did the Fund perform during the Reporting Period? |
| A | | During the Reporting Period, the Fund’s Class A, C, Institutional and IR Shares generated cumulative total returns, without sales charges, of 5.36%, 5.14%, 5.76% and 5.56%, respectively. These returns compare to the 7.48% cumulative total return of the Fund’s benchmark, the FTSE EPRA/NAREIT Developed ex-US Real Estate Index (Gross, USD, Unhedged) (the “Real Estate Index”) during the same period. |
| Q | | What economic and market factors most influenced the international real estate securities market as a whole during the Reporting Period? |
| A | | For the Reporting Period overall, the international real estate securities market, as measured by the Real Estate Index, underperformed the U.S. real estate securities market, as measured by the Wilshire Real Estate Securities Index (with dividends reinvested), by approximately ten percentage points, but outperformed the broad international equity market, as measured by the MSCI EAFE® Index (net), by nearly three percentage points. |
| | The Australian real estate securities market led returns for the Reporting Period. The Australian market benefited from stable real estate occupancies, an improving housing market and investor expectations for increasingly accommodative monetary policy. Continental Europe performed well as the European Central Bank cut interest rates. The U.K. was a strong individual country performer within the Real Estate Index during the Reporting Period, primarily attributable to the first quarter of 2014 when the U.K. saw continued strength in its central London markets, driven by investment demand for both office and residential properties. China underperformed the Real Estate Index most due primarily to investor concerns about the trajectory of its broader economy, credit quality, tighter financial conditions and a potentially weaker property market. Japan also significantly underperformed the Real Estate Index following a disappointing fourth quarter of 2013 Gross Domestic Product (“GDP”) report. Japan also lagged, as equity market participants waited to gauge the impact of the country’s consumption tax increase, which went into effect on April 1, 2014. |
| Q | | What key factors were responsible for the Fund’s performance during the Reporting Period? |
| A | | The Fund produced solid absolute positive returns but underperformed the Real Estate Index during the Reporting Period. Detracting most from the Fund’s relative results was having an overweighted allocation to China, which was the weakest performing country in the Real Estate Index during the Reporting Period. Stock selection in Japan, China, Continental Europe and Singapore also hurt. Further, having an underweighted allocation to Continental Europe, which outpaced the Real Estate Index during the Reporting Period, dampened relative results. Partially offsetting these detractors was the positive contribution made by having exposure to India, which is not a component of the Real Estate Index but which performed strongly during the Reporting Period. Positioning in the U.K. and Australia, which were among the strongest performing countries in the Real Estate Index during the Reporting Period, also contributed positively to results. |
| Q | | Which positions detracted significantly from the Fund’s performance during the Reporting Period? |
| A | | Tokyu Fudosan Holdings, a diversified Japanese real estate developer, was the top detractor from the Fund’s results relative to the Real Estate Index during the Reporting Period. Its shares declined due to investor concerns about reports that Takashimaya was in negotiations to purchase a piece of |
33
PORTFOLIO RESULTS
| | Tokyu Fudosan Holdings’ stake in a large-scale commercial building at a price that could imply a capital loss. We believe there is no incentive for Tokyu Fudosan Holdings to sell its assets at a loss. We further believe the market was overemphasizing short-term news flow. At the end of the Reporting Period, we maintained our view that Tokyu Fudosan Holdings may potentially benefit from a stronger financial position and could experience increased earnings power following its 2013 merger with Tokyu Community and Tokyu Livable. |
| | Japan-based Mitsubishi Estate was also a top detractor from the Fund’s performance. Shares of Mitsubishi Estate weakened, as Marunouchi, the commercial district of Tokyo where the majority of the company’s office properties are located, has experienced a significant increase in rent prices. Such higher rents led to investor concerns about tenant retention as well as prospects for future high quality tenants. Despite short-term weakness, and should the Japanese economy continue to gradually improve, we believed at the end of the Reporting Period that the company could be well positioned to potentially take advantage of positive trends in both the Tokyo office and residential markets. |
| Q | | What were some of the Fund’s best-performing individual holdings? |
| A | | During the Reporting Period, a position in Sobha Developers, a real estate development and construction company based in India, was the best-performing individual holding for the Fund. Sobha Developers was a new purchase for the Fund during the Reporting Period. Shares of Sobha Developers rose following the election win by Prime Minster Narendra Modi, a candidate we believe will be supportive of both business and economic reform. In addition, the company’s operating results benefited from a favorable supply/demand imbalance in Bangalore, where the majority of the company’s properties are located. At the end of the Reporting Period, we remained confident in Sobha Developers’ management team and were positive on the company’s leverage to what has been — and what we expect to be a continuation of — an improving economy in India. |
| | Another top contributor to the Fund’s relative results during the Reporting Period was Hammerson, an owner and operator of shopping centers in the U.K. and France. Shares of Hammerson performed well given the business’ leverage to a strengthening economy in the U.K., a market that experienced an improvement in consumer confidence during the Reporting Period. At the end of the Reporting Period, we continued to believe Hammerson was well positioned to potentially benefit from an acceleration in U.K. retail trends. We were also constructive on the company’s plans to redevelop and upgrade its French shopping centers. Further, we were positive on Hammerson’s competitive positioning in the luxury outlet space and the company’s pipeline opportunities for potential earnings growth going forward. |
| Q | | How did the Fund use derivatives and similar instruments during the Reporting Period? |
| A | | The Fund did not use derivatives during the Reporting Period. |
| Q | | Did the Fund make any significant purchases or sales during the Reporting Period? |
| A | | In addition to the purchases already mentioned, we established a Fund position in Global Logistics Properties, a logistics warehouse landlord and developer with facilities in China, Japan and Brazil. Given China’s growing demand for logistics facilities and the company’s success in forging strategic alliances with domestic tenants, we anticipate that Global Logistic Properties may be able to accelerate its capital redeployment plans. We believe this would be a positive catalyst for the company as it expands its footprint, and we are encouraged by the possibility for potential market share gains in the years ahead. |
| | We initiated a Fund position in Ascendas India Trust, an owner of office properties across India with a concentration in Bangalore. Despite impressive tenancy and rental performance, the company’s distributions had been adversely impacted by the weak Indian rupee. As India’s economy appeared to be strengthening with sequentially improving export and inflation data, we believe pressures to increase interest rates have subsided and thus created a more favorable operating environment. Furthermore, we are optimistic in our view for the Bangalore office market, as we believe strong demand for space may continue given the city’s ample employment opportunities from both domestic and foreign firms. |
| | We sold the Fund’s position in Sapporo Holdings, a Japanese beverage company that also engages in the leasing and development of real estate properties. We had originally initiated the Fund’s position in Sapporo Holdings based on our belief that its shares were not fully reflecting the long-term value of the company’s office properties in Tokyo. Over the past two years, investors better recognized this value, as the company’s office portfolio benefited from a mix of new tenants, which drove higher rental income growth. Strict to our sell discipline, as the stock’s valuation appreciated and |
34
PORTFOLIO RESULTS
| | reached our price target, we exited the position and transitioned the capital into names where we saw higher upside potential. |
| | We exited the Fund’s position in Great Portland Estates, a U.K. office landlord with the majority of its portfolio concentrated in the West End of London. Following the recent strong performance of the Central London office market, we decided to transition capital into what we believed to be attractively valued names with more peripheral exposure to the positive trends we are seeing around the city of London. We believe rents in these surrounding locations are inexpensive and that we may see a continued increase in interest from small tenants finding the core London West End locations to be too expensive. |
| Q | | Were there any changes made in the Fund’s investment strategy during the Reporting Period? |
| A | | In constructing the Fund’s portfolio, we focus on picking securities rather than on making regional, country or subsector bets. We seek to outpace the benchmark index by overweighting stocks that we expect to outperform and underweighting those that we think may lag. Consequently, changes in its regional or subsector weights are generally the direct result of individual stock selection or of real estate securities’ appreciation or depreciation. That said, during the Reporting Period, the Fund’s exposure to China increased relative to the Real Estate Index, and its exposure to Hong Kong and the U.K. decreased relative to the Real Estate Index. We also established positions in India and Indonesia during the Reporting Period, neither of which is a component of the Real Estate Index. |
| Q | | How was the Fund positioned relative to its benchmark index at the end of the Reporting Period? |
| A | | From a regional perspective, the Fund was overweighted relative to the Real Estate Index in China and India and underweighted relative to the Real Estate Index in Hong Kong, Singapore and Continental Europe at the end of the Reporting Period. The Fund was rather neutrally weighted compared to the Real Estate Index in the other constituent countries of the Real Estate Index at the end of June 2014. |
| Q | | What is the Fund’s tactical view and strategy for the months ahead? |
| A | | We believe the macro environment progressively improved during the Reporting Period, with investors gaining further confidence in a U.S. economic recovery and European-related economic issues apparently calming. In the Asia-Pacific region, we continued to see positive follow-through of Abenomics onto business and consumer confidence, with small pockets of increasing real estate occupancy and rental trends in Tokyo. In Australia, while some retailers saw pressure, we continue to be optimistic about the likelihood of a rebound in the residential market, which appears to us to have some positive spill-over effects on consumer sentiment. In other property sub-sectors of Australia, tenancy remained subdued, but generally REITs’ income and balance sheets remained healthy and stable. As the Reporting Period progressed, we became less constructive on Hong Kong and Singapore. Hong Kong property developers in selective cases have begun to decrease home prices, and we believe that prices may see further deterioration before we see an increase in end-demand. That said, during the Reporting Period, retail sales were showing some signs of stability and growth in Hong Kong, and in Singapore, office rents rebounded slightly after several quarters of weakness. We intend to continue to pay close attention to Singapore’s business growth, especially among retailers and hotel companies, as a result of the country’s structurally tight labor policy and cost environment. As such, we expect to continue to focus the Fund’s investments in Singapore on REITs with quality assets and tenants, secured rental income growth and long-term tenancy. |
| | In the United Kingdom, we saw the Central London office market’s strength spread to more fringe locations like Paddington and Shoreditch. Housing demand in London continued to be strong as well, while trends in retail sales also started to improve. While this has not yet fed through to rents for retail properties, we believe these trends should lead to an acceleration in demand for retail property over the medium term ahead. We maintained a constructive view on the U.K. at the end of the Reporting Period should its economy continue to strengthen. |
| | In Continental Europe, we saw an increase in activity in the capital markets during the Reporting Period, with a number of companies raising equity. However, at the end of the Reporting Period, we remained cautious on the region and thus have been selective in participating in these capital raises. Even as the signs of stabilization we observed at the end of 2013 were still present at the end of June 2014, we do not foresee a strong recovery in the real estate market, as there is still significant vacancy in a number of markets. In addition, most of the occupational end markets remain in the |
35
PORTFOLIO RESULTS
| | early days of recovery, and re-leasing may lead to lower or flat rents. We maintained the view that the real estate market in Continental Europe may well lag in an economic recovery, though we maintain selective investments where we believe we may find internal and niche opportunities. |
| | In the second half of 2014, we believe that nearly all of the major and developed economies should undergo a synchronized recovery, with a gradual and protracted move away from an ultra-loose monetary policy already well-digested by fixed income and REIT investors alike. Although some international REIT markets could be more impacted by a withdrawal of U.S. dollar investors, forcing swifter structural realignment among some emerging markets, we remained optimistic at the end of the Reporting Period about the second half of 2014, as REITs’ valuations internationally had already adjusted to reflect a lower growth environment. We believe that as the developed economies improve, regional economies worldwide should quickly begin to benefit. In addition, we believe it is important to recognize that banks globally are willing and able to lend to the real estate sector at historically low interest rates. We believe this favorable backdrop should benefit REITs in securing financing and deploying capital towards high quality projects, which could have the potential to drive future growth. On a stock by stock basis, we believe opportunities abound around the world, as both listed and unlisted real estate may offer high and stable income for REITs to capture. |
| | As fundamental, bottom-up investors, we believe we are seeing opportunities that go beyond the headline risks associated with certain regions. We intend to continue to focus our approach on those companies that have well-capitalized balance sheets and that possess quality attributes, such as a robust business model, a high quality asset exposure and a strong management team with a sound reinvestment strategy. |
36
FUND BASICS
International Real Estate Securities Fund
as of June 30, 2014
| | | | | | | | | | |
| | PERFORMANCE REVIEW | |
| | | January 1, 2014– June 30, 2014 | | Fund Total Return
(based on NAV)1 | | | FTSE EPRA/NAREIT Developed
ex-US Real Estate Index (Gross)2 | |
| | Class A | | | 5.36 | % | | | 7.48 | % |
| | Class C | | | 5.14 | | | | 7.48 | |
| | Institutional | | | 5.76 | | | | 7.48 | |
| | | Class IR | | | 5.56 | | | | 7.48 | |
| | 1 | | The net asset value (“NAV”) represents the net assets of the class of the Fund (ex-dividend) divided by the total number of shares of the class outstanding. The Fund’s performance reflects the reinvestment of dividends and other distributions. The Fund’s performance does not reflect the deduction of any applicable sales charges. |
| | 2 | | The FTSE EPRA/NAREIT Developed ex-US Real Estate Index (gross, with dividends reinvested) is a market capitalization weighted index comprised of REITs and non-REITs within the international (global ex U.S.) real estate securities market. The market capitalization for each constituent is adjusted for free float. It is not possible to invest directly in an index. |
| | | | | | | | | | | | | | | | |
| | STANDARDIZED TOTAL RETURNS3 |
| | | For the period ended 6/30/14 | | One Year | | | Five Year | | | Since Inception | | | Inception Date |
| | Class A | | | 5.50 | % | | | 10.70 | % | | | 0.34 | % | | 7/31/06 |
| | Class C | | | 9.90 | | | | 11.13 | | | | 0.35 | | | 7/31/06 |
| | Institutional | | | 12.09 | | | | 12.33 | | | | 1.29 | | | 7/31/06 |
| | | Class IR | | | 11.95 | | | | 12.24 | | | | -1.90 | | | 11/30/07 |
| | 3 | | The Standardized Total Returns are average annual total returns as of the most recent calendar quarter-end. They assume reinvestment of all distributions at NAV. These returns reflect a maximum initial sales charge of 5.5% for Class A Shares and the assumed contingent deferred sales charge for Class C Shares (1% if redeemed within 12 months of purchase). Because Institutional and Class IR Shares do not involve a sales charge, such a charge is not applied to their Standardized Total Returns. |
The returns set forth in the tables above represent past performance. Past performance does not guarantee future results. The Fund’s investment return and principal value will fluctuate so that an investor’s shares, when redeemed, may be worth more or less than their original cost. Current performance may be lower or higher than the performance quoted above. Please visit our web site at www.GSAMFUNDS.com to obtain the most recent month-end returns. Performance reflects applicable fee waivers and/or expense limitations in effect during the periods shown. In their absence, performance would be reduced. Returns do not reflect the deduction of taxes that a shareholder would pay on Fund distributions or the redemption of Fund shares.
| | | | | | | | | | |
| | EXPENSE RATIOS4 | |
| | | | | Net Expense Ratio (Current) | | | Gross Expense Ratio (Before Waivers) | |
| | Class A | | | 1.45 | % | | | 1.60 | % |
| | Class C | | | 2.20 | | | | 2.35 | |
| | Institutional | | | 1.05 | | | | 1.20 | |
| | | Class IR | | | 1.20 | | | | 1.35 | |
| | 4 | | The expense ratios of the Fund, both current (net of applicable fee waivers and/or expense limitations) and before waivers (gross of applicable fee waivers and/or expense limitations) are as set forth above according to the most recent publicly available Prospectus for the Fund and may differ from the expense ratios disclosed in the Financial Highlights in this report. The Fund’s waivers and/or expense limitations will remain in place through at least April 30, 2015, and prior to such date the Investment Adviser may not terminate the arrangements without the approval of the Fund’s Board of Trustees. If these arrangements are discontinued in the future, the expense ratios may change without shareholder approval. |
37
FUND BASICS
| | | | | | | | | | |
| | TOP TEN HOLDINGS AS OF 6/30/145 |
| | | Holding | | % of Total
Net Assets | | | Line of Business | | Country |
| | Mitsubishi Estate Co. Ltd. | | | 8.2 | % | | Diversified | | Japan |
| | Unibail-Rodamco SE (REIT) | | | 5.4 | | | Diversified | | France |
| | Mitsui Fudosan Co. Ltd. | | | 4.9 | | | Office | | Japan |
| | Sun Hung Kai Properties Ltd. | | | 3.9 | | | Diversified | | Hong Kong |
| | Klepierre (REIT) | | | 3.1 | | | Retail | | France |
| | Mirvac Group (REIT) | | | 3.1 | | | Diversified | | Australia |
| | British Land Co. PLC (REIT) | | | 2.9 | | | Diversified | | United Kingdom |
| | Hammerson PLC (REIT) | | | 2.9 | | | Retail | | United Kingdom |
| | Westfield Corp. Trust (REIT) | | | 2.7 | | | Retail | | Australia |
| | | Tokyu Fudosan Holdings Corp. | | | 2.7 | | | Residential | | Japan |
| | 5 | | The top 10 holdings may not be representative of the Fund’s future investments. |
| | |
| FUND VS. BENCHMARK COUNTRY ALLOCATION6 | | |
| As of June 30, 2014 | | |
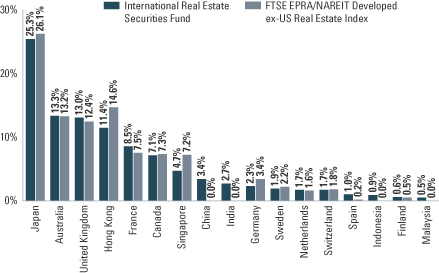
| | 6 | | The Fund is actively managed and, as such, its composition may differ over time. Consequently, the Fund’s overall country allocations may differ from percentages contained in the graph above. The percentage shown for each investment category reflects the value of investments in that category as a percentage of market value. The graph depicts the Fund’s investments but may not represent the Fund’s market exposure due to the exclusion of certain derivatives, if any, as listed in the Additional Investment Information section of the Schedule of Investments. |
38
PORTFOLIO RESULTS
Goldman Sachs Real Estate Securities Fund
Investment Objective
The Fund seeks total return comprised of long-term growth of capital and dividend income.
Portfolio Management Discussion and Analysis
Below, the Goldman Sachs Real Estate Securities Investment Team discusses the Goldman Sachs Real Estate Securities Fund’s (the “Fund”) performance and positioning for the six-month period ended June 30, 2014 (the “Reporting Period”).
| Q | | How did the Fund perform during the Reporting Period? |
| A | | During the Reporting Period, the Fund’s Class A, B, C, Institutional, Service, IR and R Shares generated cumulative total returns, without sales charges, of 17.49%, 17.07%, 17.02%, 17.67%, 17.45%, 17.65% and 17.29%, respectively. These returns compare to the 17.93% cumulative total return of the Fund’s benchmark, the Wilshire U.S. Real Estate Securities Index (the “Wilshire Index”) during the same period. |
| Q | | What economic and market factors most influenced the U.S. real estate securities market as a whole during the Reporting Period? |
| A | | The U.S. real estate securities market, as represented by the Wilshire Index, posted positive absolute returns during the Reporting Period and significantly outperformed the broad U.S. equity market, as represented by the S&P 500® Index, which was up 7.14% for the same period. |
| | In our view, momentum in the U.S. real estate securities market was supported by investors encouraged by positive earnings announcements. Such announcements were driven, in turn, by improving demand and still very low new supply. In addition to the yield plus growth potential of the asset class, what many considered to be attractive valuations relative to fixed income, a strengthening U.S. economic backdrop and a modest decline in the 10-year U.S. Treasury yield acted as tailwinds for the asset class during the Reporting Period. |
| | Within the Wilshire Index, the strongest subsectors during the Reporting Period were multifamily and self storage. Conversely, the industrial and retail subsectors were the weakest performers within the Wilshire Index during the Reporting Period, albeit still posting double-digit positive returns. |
| Q | | What key factors were responsible for the Fund’s performance during the Reporting Period? |
| A | | Effective individual stock selection in the leisure, retail, multifamily and office subsectors contributed positively to relative results. Partially offsetting such positive contributors was stock selection in the industrial and self storage subsectors, which detracted from relative results. Having exposure to what is termed as the “Other” subsector, which lagged the Wilshire Index during the Reporting Period, and a position in cash during months when the U.S. real estate securities market rallied also dampened results. |
| Q | | What were some of the Fund’s best-performing individual holdings? |
| A | | Emeritus, an operator of senior living facilities, was the top contributor to the Fund’s performance during the Reporting Period. In February 2014, its shares spiked after Emeritus agreed to be acquired by Brookdale Senior Living, as the merger potentially creates one of the largest senior living providers in the U.S. When we originally had initiated the Fund’s position in Emeritus, we believed an aging demographic and benign cost trends would act as tailwinds for the company and industry overall. Following the acquisition announcement and the stock’s strong performance, we exited the Fund’s position in Emeritus and redeployed capital into names where we saw more attractive upside potential. |
| | Another strong contributor during the Reporting Period was Camden Property Trust, a developer of multifamily apartment communities across the Southeast and Texas. Shares of Camden Property Trust had significantly underperformed in 2013 due to investor concerns over new apartment supply in the Sunbelt markets as well as over the recovery in the single family housing market and its related impact on Camden Property Trust’s apartment assets. We |
39
PORTFOLIO RESULTS
| | believed these concerns were unwarranted and, indeed, during the Reporting Period, its shares performed well, as investors better appreciated the company’s impressive historical growth and high quality management team. At the end of the Reporting Period, we continued to view Camden Property Trust’s valuation as reasonable compared to its peers. We also believed the company was well positioned to potentially benefit from employment growth in Texas driven by the energy industry. |
| Q | | What were some of the Fund’s weakest-performing individual holdings? |
| A | | Having an overweighted position in National Health Investors, a health care real estate investment trust (“REIT”), detracted most from the Fund’s results during the Reporting Period. We established a Fund position in its stock during the Reporting Period, and it had performed well before we initiated the position. Essentially, not owning the REIT in January 2014, when the stock rose, was the primary reason it detracted. |
| | LaSalle Hotel Properties, a REIT that owns and operates luxury full-service hotels, including Hilton, Hyatt and Westin as well as a chain of upscale boutique hotels, was a top detractor from the Fund’s results during the Reporting Period. We sold the Fund’s position in LaSalle Hotel Properties after a solid run-up in its stock and following concerns we had regarding increased competition in one of the company’s key markets. However, shares of LaSalle Hotel Properties kept climbing after we exited the Fund’s position, and as such, it detracted on relative basis. |
| Q | | How did the Fund use derivatives and similar instruments during the Reporting Period? |
| A | | The Fund did not use derivatives during the Reporting Period. |
| Q | | Did the Fund make any significant purchases or sales during the Reporting Period? |
| A | | As discussed earlier, we established a Fund position in National Health Investors during the Reporting Period. We were encouraged by the company’s energized management team and its execution in the recent purchase of 25 independent living facilities from Holiday Retirement, an operator of senior living communities. In addition, we believe National Health Investors is well positioned to potentially benefit from increased health care spending and that the company’s strong and unlevered balance sheet may allow for accretive acquisitions going forward. |
| | We also initiated a Fund position in Brixmor Property Group, an operator of grocery-anchored community shopping centers. Following the company’s Initial Public Offering (“IPO”) in 2013, we continued to see value in its shares given Brixmor Property Group’s potential prospects for future growth and our view that investors are underappreciating the quality of the company’s assets. Furthermore, we believe its shares, at the time of purchase, were trading at an undeserved discount to the company’s peers. We viewed its management as high quality in its stewardship of shareholder capital. |
| | In addition to those sales already mentioned, we exited the Fund’s position in Federal Realty Investment Trust, an owner of retail properties across the Northeast and Mid-Atlantic regions of the U.S. as well as in California. In our view, Federal Realty Investment Trust is a high quality company supported by a stable balance sheet and led by a shareholder-friendly management team. We had initiated the Fund’s position in the REIT when we believed shares were trading at an unwarranted discount given concerns related to a large development project the company had undertaken. Over time, investors became increasingly comfortable with this project, driving shares to trade higher and eventually meet our price target. Strict to our sell discipline, we sold the Fund’s position in Federal Realty Investment Trust and transitioned the capital into names where we saw greater upside potential. |
| | We eliminated the Fund’s position in Tanger Factory Outlet Centers (“Tanger”), an owner and operator of outlet shopping centers. While we still view Tanger as a quality company with a conservative balance sheet, we became concerned about the increasing supply of outlets in the U.S. We believe such increased supply may hinder Tanger’s future development pipeline and potentially lessen its opportunities to create shareholder value. Given this change in outlook, we chose to exit the position in favor of names where we had higher conviction. |
| Q | | Were there any changes made in the Fund’s investment strategy during the Reporting Period? |
| A | | In constructing the Fund’s portfolio, we focus on picking securities rather than on making real estate subsector bets. We seek to outpace the benchmark index by overweighting stocks that we think may outperform and underweighting those that we think may lag. Consequently, changes in its real estate subsector weights are generally the direct result of individual stock selection or of real estate securities’ |
40
PORTFOLIO RESULTS
| | appreciation or depreciation. That said, during the Reporting Period, the Fund’s exposure to the leisure subsector increased relative to the Wilshire Index and its exposure to the self storage and the “Other” subsector decreased relative to the Wilshire Index. |
| Q | | How was the Fund positioned relative to its benchmark index at the end of the Reporting Period? |
| A | | From a subsector perspective, the Fund had an overweighted exposure compared to the Wilshire Index in the leisure and industrial subsectors at the end of the Reporting Period. The Fund was underweighted compared to its benchmark index in the office, health care, self storage and multifamily subsectors and was rather neutrally weighted in the retail subsector within the Wilshire Index. |
| Q | | What is the Fund’s tactical view and strategy for the months ahead? |
| A | | From a fundamental perspective, we remained constructive on the asset class at the end of the Reporting Period, as rent growth has been positive across most subsectors and the high-level drivers of real estate demand — such as employment and household formation — have improved. Further, aggregate supply, or new construction, still remained muted in the majority of subsectors relative to historical averages at the end of the Reporting Period, and this supply/ demand imbalance has the potential, in our view, to drive rent increases and higher occupancy. While we do expect interest rates to gradually increase, they continue to be low by historical standards, and we believe investors are beginning to better appreciate the yield and growth attributes of the REIT asset class. Unlike bonds, which are static investments, most REITs operate dynamic businesses that have historically created value and growth even with rising interest rates. We believe a strengthening economy may create additional tailwinds, such as stronger rent and occupancy growth expectations as well as easing commercial lending standards. What we consider to be this positive fundamental backdrop — combined with the fact that payout ratios, or the percent of earnings that cover the dividend, are at record lows — gives us confidence that cash flows may continue to accelerate and therefore could potentially provide a hedge against inflation in a rising rate environment. We believe REITs may continue to offer attractive risk-adjusted returns, relative to fixed income in particular, given their potential yield, diversification, inflation hedge and valuation benefits. |
| | As fundamental, bottom-up investors, we intend to continue to focus our approach on those companies that have strong balance sheets and that possess quality attributes, such as a robust business model, a high quality asset exposure and a strong management team. |
41
FUND BASICS
Real Estate Securities Fund
as of June 30, 2014
| | | | | | | | | | |
| | PERFORMANCE REVIEW | |
| | | January 1, 2014– June 30, 2014 | | Fund Total Return
(based on NAV)1 | | | Wilshire U.S. Real Estate
Securities Index (Gross)2 | |
| | Class A | | | 17.49 | % | | | 17.93 | % |
| | Class B | | | 17.07 | | | | 17.93 | |
| | Class C | | | 17.02 | | | | 17.93 | |
| | Institutional | | | 17.67 | | | | 17.93 | |
| | Service | | | 17.45 | | | | 17.93 | |
| | Class IR | | | 17.65 | | | | 17.93 | |
| | | Class R | | | 17.29 | | | | 17.93 | |
| | 1 | | The net asset value (“NAV”) represents the net assets of the class of the Fund (ex-dividend) divided by the total number of shares of the class outstanding. The Fund’s performance reflects the reinvestment of dividends and other distributions. The Fund’s performance does not reflect the deduction of any applicable sales charges. |
| | 2 | | The Wilshire U.S. Real Estate Securities Index (gross, with dividends reinvested) is an unmanaged market capitalization-weighted index comprised of publicly traded REITs and real estate operating companies. The figures do not reflect any fees or expenses. It is not possible to invest directly in an index. |
| | | | | | | | | | | | | | |
| | STANDARDIZED TOTAL RETURNS3 |
| | | For the period ended 6/30/14 | | One Year | | | Five Years | | Ten Years | | Since Inception | | Inception Date |
| | Class A | | | 7.49 | % | | 21.73% | | 8.12% | | 9.63% | | 7/27/98 |
| | Class B | | | 7.82 | | | 21.98 | | 8.08 | | 9.61 | | 7/27/98 |
| | Class C | | | 11.86 | | | 22.19 | | 7.93 | | 9.23 | | 7/27/98 |
| | Institutional | | | 14.19 | | | 23.62 | | 9.20 | | 10.48 | | 7/27/98 |
| | Service | | | 13.65 | | | 22.96 | | 8.63 | | 9.94 | | 7/27/98 |
| | Class IR | | | 14.00 | | | 23.41 | | N/A | | 5.15 | | 11/30/07 |
| | | Class R | | | 13.43 | | | 22.81 | | N/A | | 4.64 | | 11/30/07 |
| | 3 | | The Standardized Total Returns are average annual total returns as of the most recent calendar quarter-end. They assume reinvestment of all distributions at NAV. These returns reflect a maximum initial sales charge of 5.5% for Class A Shares, the assumed contingent deferred sales charge for Class B Shares (5% maximum declining to 0% after six years) and the assumed contingent deferred sales charge for Class C Shares (1% if redeemed within 12 months of purchase). Class B Shares convert automatically to Class A Shares on or about the fifteenth day of the last month of the calendar year that is eight years after purchase. Returns for Class B Shares for the period after the conversion reflect the performance of Class A Shares. Because Institutional, Service, Class IR and Class R Shares do not involve a sales charge, such a charge is not applied to their Standardized Total Returns. The Fund’s Class B Shares are no longer available for purchase by new or existing shareholders (although current Class B shareholders may continue to reinvest income and capital gains distributions into Class B Shares, and Class B shareholders may continue to exchange their shares for Class B Shares of certain other Goldman Sachs Funds). |
The returns set forth in the tables above represent past performance. Past performance does not guarantee future results. The Fund’s investment return and principal value will fluctuate so that an investor’s shares, when redeemed, may be worth more or less than their original cost. Current performance may be lower or higher than the performance quoted above. Please visit our web site at www.GSAMFUNDS.com to obtain the most recent month-end returns. Performance reflects applicable fee waivers and/or expense limitations in effect during the periods shown. In their absence, performance would be reduced. Returns do not reflect the deduction of taxes that a shareholder would pay on Fund distributions or the redemption of Fund shares.
42
FUND BASICS
| | | | | | | | | | |
| | EXPENSE RATIOS4 | |
| | | | | Net Expense Ratio (Current) | | | Gross Expense Ratio (Before Waivers) | |
| | Class A | | | 1.31 | % | | | 1.51 | % |
| | Class B | | | 2.06 | | | | 2.26 | |
| | Class C | | | 2.06 | | | | 2.26 | |
| | Institutional | | | 0.91 | | | | 1.11 | |
| | Service | | | 1.41 | | | | 1.61 | |
| | Class IR | | | 1.06 | | | | 1.26 | |
| | | Class R | | | 1.56 | | | | 1.76 | |
| | 4 | | The expense ratios of the Fund, both current (net of applicable fee waivers and/or expense limitations) and before waivers (gross of applicable fee waivers and/or expense limitations) are as set forth above according to the most recent publicly available Prospectus for the Fund and may differ from the expense ratios disclosed in the Financial Highlights in this report. The Fund’s waivers and/or expense limitations will remain in place through at least April 30, 2015, and prior to such date the Investment Adviser may not terminate the arrangements without the approval of the Fund’s Board of Trustees. If these arrangements are discontinued in the future, the expense ratios may change without shareholder approval. |
| | | | | | | | |
| | TOP TEN HOLDINGS AS OF 6/30/145 |
| | | Holding | | % of Total Net Assets | | | Subsectors |
| | Simon Property Group, Inc. (REIT) | | | 11.40 | % | | Retail |
| | AvalonBay Communities, Inc. (REIT) | | | 5.4 | | | Multifamily |
| | Boston Properties, Inc. (REIT) | | | 5.0 | | | Commercial |
| | Prologis, Inc. (REIT) | | | 4.4 | | | Commercial |
| | Ventas, Inc. (REIT) | | | 3.9 | | | Health Care |
| | DDR Corp. (REIT) | | | 3.0 | | | Retail |
| | Chesapeake Lodging Trust (REIT) | | | 2.8 | | | Leisure |
| | RLJ Lodging Trust (REIT) | | | 2.7 | | | Leisure |
| | Public Storage (REIT) | | | 2.7 | | | Self Storage |
| | | Brixmor Property Group, Inc. (REIT) | | | 2.6 | | | Retail |
| | 5 | | The top 10 holdings may not be representative of the Fund’s future investments. |
43
FUND BASICS
|
| FUND VS. BENCHMARK SECTOR ALLOCATIONS6 |
| As of June 30, 2014 |
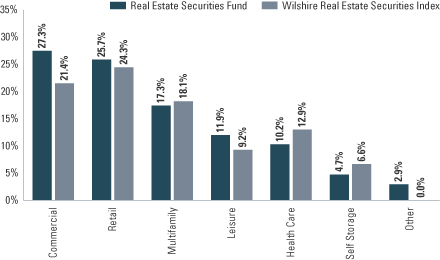
| | 6 | | The Fund is actively managed and, as such, its composition may differ over time. Consequently, the Fund’s overall industry sector allocations may differ from percentages contained in the graph above. The graph categorizes investments using Global Industry Classification Standard (“GICS”), however, the sector classifications used by the portfolio management team may differ from GICS. The percentage shown for each investment category reflects the value of investments in that category as a percentage of market value. The graph depicts the Fund’s investments but may not represent the Fund’s market exposure due to the exclusion of certain derivatives, if any, as listed in the Additional Investment Information section of the Schedule of Investments. |
44
INDEX DEFINITIONS
Index Definitions:
HFRX Event Driven Index: Event Driven Managers maintain positions in companies currently or prospectively involved in corporate transactions of a wide variety including but not limited to mergers, restructurings, financial distress, tender offers, shareholder buybacks, debt exchanges, security issuance or other capital structure adjustments. Security types can range from most senior in the capital structure to most junior or subordinated, and frequently involve additional derivative securities. Event Driven exposure includes a combination of sensitivities to equity markets, credit markets and idiosyncratic, company specific developments. Investment theses are typically predicated on fundamental characteristics (as opposed to quantitative), with the realization of the thesis predicated on a specific development exogenous to the existing capital structure.*
HFRX Relative Value Arbitrage Index: Relative Value investment managers maintain positions in which the investment thesis is predicated on realization of a valuation discrepancy in the relationship between multiple securities. Managers employ a variety of fundamental and quantitative techniques to establish investment theses, and security types range broadly across equity, fixed income, derivative or other security types. Fixed income strategies are typically quantitatively driven to measure the existing relationship between instruments and, in some cases, identify attractive positions in which the risk adjusted spread between these instruments represents an attractive opportunity for the investment manager. RV position may be involved in corporate transactions also, but as opposed to ED exposures, the investment thesis is predicated on realization of a pricing discrepancy between related securities, as opposed to the outcome of the corporate transaction.*
HFRX Equity Hedge Index: Equity Hedge strategies maintain positions both long and short in primarily equity and equity derivative securities. A wide variety of investment processes can be employed to arrive at an investment decision, including both quantitative and fundamental techniques; strategies can be broadly diversified or narrowly focused on specific sectors and can range broadly in terms of levels of net exposure, leverage employed, holding period, concentrations of market capitalizations and valuation ranges of typical portfolios. Equity Hedge managers would typically maintain at least 50%, and may in some cases be substantially entirely invested in equities, both long and short.*
HFRX Macro/ CTA Index: Active Trading strategies utilize active trading methods, typically with high frequency position turnover or leverage; these may employ components of both Discretionary and Systematic Macro strategies. Strategies may contain distinct, identifiable sub-strategies, such as equity hedge or equity market neutral, or in some cases a number of sub-strategies are blended together without the capacity for portfolio level disaggregation. Strategies employ an investment process based on systematic, quantitative evaluation of macroeconomic variables in which the portfolio positioning is predicated on convergence of differentials between markets, not necessarily highly correlated with each other, but currently diverging from their historical levels of correlation. Strategies focus on fundamental relationships across geographic areas both inter and intra-asset classes, and typical holding periods are shorter than trend following or discretionary strategies. Active Trading strategies are distinct from other macro in that they characteristically emphasize rapid market response to new information and high volume of turnover in liquid but frequently volatile and unstable market positions.*
*Indicates index definition was sourced from Hedge Fund Research (HFR). The indexes are trademarks of HFR. HFR has not participated in the formation of the Funds. HFR does not endorse or approve the Funds or make any recommendation with respect to investing in the Funds.
S&P® 500 Index: The S&P 500 Index is the Standard & Poor’s 500 Composite Index of 500 stocks, an unmanaged index of common stock prices.
45
INDEX DEFINITIONS
MSCI EAFE® Index: The MSCI EAFE Index (Europe, Australasia, Far East) is a free float-adjusted market capitalization index that is designed to measure the equity market performance of developed markets, excluding the US & Canada. As of June 2, 2014, the MSCI EAFE Index consists of the following 21 developed market country indexes: Australia, Austria, Belgium, Denmark, Finland, France, Germany, Hong Kong, Ireland, Israel, Italy, Japan, the Netherlands, New Zealand, Norway, Portugal, Singapore, Spain, Sweden, Switzerland, and the United Kingdom.
All Index figures do not reflect any deduction for fees, expenses or taxes. It is not possible to invest directly in an unmanaged index.
46
GOLDMAN SACHS ABSOLUTE RETURN TRACKER FUND
Consolidated Schedule of Investments
June 30, 2014 (Unaudited)
| | | | | | | | |
Shares | | | Distribution Rate | | Value | |
| | Investment Company(a)(b) – 84.2% | |
| Goldman Sachs Financial Square Government
Fund – FST Shares | | | | |
| | 1,635,133,763 | | | 0.006% | | $ | 1,635,133,763 | |
| | (Cost $1,635,133,763) | | | | |
| | |
| | | | | | | | |
| Shares | | | Description | | Value | |
| | | | | | | | |
| | Exchange Traded Funds – 2.6% | |
| | 186,483 | | | Energy Select Sector SPDR Fund | | $ | 18,666,948 | |
| | 496,815 | | | Health Care Select Sector SPDR Fund | | | 30,221,257 | |
| | |
| | TOTAL EXCHANGE TRADED FUNDS | | | | |
| | (Cost $43,522,442) | | $ | 48,888,205 | |
| | |
| | TOTAL INVESTMENTS – 86.8% | | | | |
| | (Cost $1,678,656,205) | | $ | 1,684,021,968 | |
| | |
| OTHER ASSETS IN EXCESS OF
LIABILITIES – 13.2% | | | 256,829,087 | |
| | |
| | NET ASSETS – 100.0% | | $ | 1,940,851,055 | |
| | |
| | |
| The percentage shown for each investment category reflects the value of investments in that category as a percentage of net assets. |
(a) | | Represents an affiliated issuer. |
(b) | | Variable rate security. Interest rate or distribution rate disclosed is that which is in effect at June 30, 2014. |
| | |
|
Investment Abbreviations: |
EURIBOR | | —Euro Interbank Offered Rate |
SPDR | | —Standard and Poor’s Depositary Receipts |
| | |
Currency Abbreviations: |
AUD | | —Australian Dollar |
BRL | | —Brazilian Real |
CAD | | —Canadian Dollar |
CHF | | —Swiss Franc |
CLP | | —Chilean Peso |
CNY | | —Chinese Yuan |
CZK | | —Czech Koruna |
EUR | | —Euro |
GBP | | —British Pound |
HUF | | —Hungarian Forint |
INR | | —Indian Rupee |
JPY | | —Japanese Yen |
KRW | | —South Korean Won |
MXN | | —Mexican Peso |
MYR | | —Malaysian Ringgit |
NOK | | —Norwegian Krone |
NZD | | —New Zealand Dollar |
PLN | | —Polish Zloty |
RUB | | —Russian Ruble |
SEK | | —Swedish Krona |
SGD | | —Singapore Dollar |
TRY | | —Turkish Lira |
TWD | | —Taiwan Dollar |
USD | | —United States Dollar |
ZAR | | —South African Rand |
|
| | |
| The accompanying notes are an integral part of these financial statements. | | 47 |
GOLDMAN SACHS ABSOLUTE RETURN TRACKER FUND
Consolidated Schedule of Investments (continued)
June 30, 2014 (Unaudited)
|
| ADDITIONAL INVESTMENT INFORMATION |
FORWARD FOREIGN CURRENCY EXCHANGE CONTRACTS — At June 30, 2014, the Fund had the following forward foreign currency exchange contracts:
FORWARD FOREIGN CURRENCY EXCHANGE CONTRACTS WITH UNREALIZED GAIN
| | | | | | | | | | | | | | |
| Counterparty | | Contracts to
Buy/Sell | | Settlement
Date | | | Current Value | | | Unrealized
Gain | |
UBS AG | | AUD/USD | | | 07/23/14 | | | $ | 16,229,173 | | | $ | 76,666 | |
| | BRL/USD | | | 07/24/14 | | | | 8,900,334 | | | | 105,025 | |
| | CAD/USD | | | 07/23/14 | | | | 4,851,764 | | | | 16,136 | |
| | CHF/USD | | | 07/23/14 | | | | 7,500,231 | | | | 31,099 | |
| | CLP/USD | | | 07/24/14 | | | | 1,190,493 | | | | 5,574 | |
| | CNY/USD | | | 07/24/14 | | | | 1,477,808 | | | | 2,212 | |
| | CZK/USD | | | 07/23/14 | | | | 1,417,321 | | | | 5,065 | |
| | EUR/USD | | | 07/23/14 | | | | 10,380,189 | | | | 60,534 | |
| | GBP/USD | | | 07/23/14 | | | | 21,440,058 | | | | 126,975 | |
| | INR/USD | | | 07/24/14 | | | | 1,956,994 | | | | 4,722 | |
| | JPY/USD | | | 07/23/14 | | | | 5,805,266 | | | | 13,587 | |
| | KRW/USD | | | 07/24/14 | | | | 11,278,426 | | | | 92,598 | |
| | MXN/USD | | | 07/23/14 | | | | 6,175,629 | | | | 7,783 | |
| | MYR/USD | | | 07/24/14 | | | | 710,020 | | | | 2,345 | |
| | NZD/USD | | | 07/23/14 | | | | 14,766,289 | | | | 99,244 | |
| | PLN/USD | | | 07/23/14 | | | | 7,654,364 | | | | 60,934 | |
| | RUB/USD | | | 07/24/14 | | | | 3,308,607 | | | | 49,275 | |
| | SEK/USD | | | 07/23/14 | | | | 89,774 | | | | 520 | |
| | SGD/USD | | | 07/23/14 | | | | 10,686,512 | | | | 24,323 | |
| | TRY/USD | | | 07/23/14 | | | | 2,715,897 | | | | 30,180 | |
| | TWD/USD | | | 07/24/14 | | | | 20,102 | | | | 55 | |
| | USD/HUF | | | 07/23/14 | | | | 1,484,223 | | | | 8,035 | |
| | USD/NOK | | | 07/23/14 | | | | 1,091,384 | | | | 2,919 | |
| | USD/NZD | | | 07/23/14 | | | | 34,949 | | | | 5 | |
| | | USD/ZAR | | | 07/23/14 | | | | 419,664 | | | | 1,201 | |
| TOTAL | | | | | | | | | | | | $ | 827,012 | |
FORWARD FOREIGN CURRENCY EXCHANGE CONTRACTS WITH UNREALIZED LOSS
| | | | | | | | | | | | | | |
| Counterparty | | Contracts to
Buy/Sell | | Settlement
Date | | | Current Value | | | Unrealized
Loss | |
UBS AG | | AUD/USD | | | 07/23/14 | | | $ | 112,964 | | | $ | (128 | ) |
| | BRL/USD | | | 07/24/14 | | | | 485,473 | | | | (534 | ) |
| | CAD/USD | | | 07/23/14 | | | | 1,629,743 | | | | (3,010 | ) |
| | HUF/USD | | | 07/23/14 | | | | 247,370 | | | | (1,143 | ) |
| | MXN/USD | | | 07/23/14 | | | | 692,594 | | | | (194 | ) |
| | NOK/USD | | | 07/23/14 | | | | 3,616,225 | | | | (7,081 | ) |
| | NZD/USD | | | 07/23/14 | | | | 209,699 | | | | (183 | ) |
| | PLN/USD | | | 07/23/14 | | | | 611,560 | | | | (116 | ) |
| | RUB/USD | | | 07/24/14 | | | | 14,640 | | | | (109 | ) |
| | USD/AUD | | | 07/23/14 | | | | 37,655 | | | | (222 | ) |
| | USD/BRL | | | 07/24/14 | | | | 35,961 | | | | (255 | ) |
| | USD/CAD | | | 07/23/14 | | | | 3,652,873 | | | | (30,021 | ) |
| | USD/CHF | | | 07/23/14 | | | | 2,255,709 | | | | (22,472 | ) |
| | USD/CZK | | | 07/23/14 | | | | 8,763,437 | | | | (71,364 | ) |
| | USD/JPY | | | 07/23/14 | | | | 11,097,141 | | | | (92,721 | ) |
| | |
| 48 | | The accompanying notes are an integral part of these financial statements. |
GOLDMAN SACHS ABSOLUTE RETURN TRACKER FUND
|
| ADDITIONAL INVESTMENT INFORMATION (continued) |
FORWARD FOREIGN CURRENCY EXCHANGE CONTRACTS WITH UNREALIZED LOSS (continued)
| | | | | | | | | | | | | | |
| Counterparty | | Contracts to
Buy/Sell | | Settlement
Date | | | Current Value | | | Unrealized
Loss | |
UBS AG (continued) | | USD/KRW | | | 07/24/14 | | | $ | 79,008 | | | $ | (264 | ) |
| | USD/NOK | | | 07/23/14 | | | | 6,874,086 | | | | (9,839 | ) |
| | USD/PLN | | | 07/23/14 | | | | 1,440,125 | | | | (8,384 | ) |
| | USD/SEK | | | 07/23/14 | | | | 7,518,534 | | | | (53,838 | ) |
| | USD/SGD | | | 07/23/14 | | | | 40,100 | | | | (81 | ) |
| | USD/TWD | | | 07/24/14 | | | | 2,150,923 | | | | (11,022 | ) |
| | USD/ZAR | | | 07/23/14 | | | | 3,003,219 | | | | (19,228 | ) |
| | | ZAR/USD | | | 07/23/14 | | | | 4,498,271 | | | | (5,211 | ) |
| TOTAL | | | | | | | | | | | | $ | (337,420 | ) |
FUTURES CONTRACTS — At June 30, 2014, the Fund had the following futures contracts:
| | | | | | | | | | | | | | |
| Type | | Number of
Contracts
Long (Short) | | | Expiration Date | | Current Value | | | Unrealized Gain (Loss) | |
90 Day Bank Bill | | | (61 | ) | | September 2014 | | $ | (57,146,539 | ) | | $ | (2,312 | ) |
90 Day Bank Bill | | | 90 | | | December 2014 | | | 84,324,895 | | | | 8,833 | |
90 Day Bank Bill | | | 90 | | | March 2015 | | | 84,322,829 | | | | 21,033 | |
90 Day Euro EURIBOR | | | 3 | | | March 2016 | | | 1,024,408 | | | | 2,852 | |
90 Day Euro EURIBOR | | | 11 | | | June 2016 | | | 3,754,278 | | | | 6,583 | |
90 Day Euro Swiss Franc | | | (73 | ) | | September 2014 | | | (20,581,670 | ) | | | 1,808 | |
90 Day Eurodollar | | | 8 | | | December 2014 | | | 1,994,500 | | | | 157 | |
90 Day Eurodollar | | | 33 | | | March 2015 | | | 8,220,713 | | | | 5,626 | |
90 Day Eurodollar | | | 81 | | | June 2015 | | | 20,145,713 | | | | 15,468 | |
90 Day Eurodollar | | | 103 | | | September 2015 | | | 25,567,175 | | | | 9,668 | |
90 Day Eurodollar | | | 86 | | | December 2015 | | | 21,298,975 | | | | 12,631 | |
90 Day Eurodollar | | | 99 | | | March 2016 | | | 24,459,188 | | | | 23,015 | |
90 Day Eurodollar | | | 99 | | | June 2016 | | | 24,393,600 | | | | 16,202 | |
90 Day Sterling | | | (19 | ) | | September 2014 | | | (4,037,952 | ) | | | (346 | ) |
90 Day Sterling | | | (50 | ) | | December 2014 | | | (10,604,262 | ) | | | (1,306 | ) |
90 Day Sterling | | | (89 | ) | | March 2015 | | | (18,830,844 | ) | | | (4,995 | ) |
90 Day Sterling | | | (97 | ) | | June 2015 | | | (20,472,665 | ) | | | (10,719 | ) |
90 Day Sterling | | | (98 | ) | | September 2015 | | | (20,635,505 | ) | | | (9,029 | ) |
90 Day Sterling | | | (98 | ) | | December 2015 | | | (20,589,383 | ) | | | (2,462 | ) |
90 Day Sterling | | | (98 | ) | | March 2016 | | | (20,549,550 | ) | | | (6,185 | ) |
90 Day Sterling | | | (98 | ) | | June 2016 | | | (20,511,813 | ) | | | (6,950 | ) |
Brent Crude Futures | | | 59 | | | September 2014 | | | 6,589,120 | | | | (93,998 | ) |
CAC 40 Index | | | 75 | | | July 2014 | | | 4,541,283 | | | | (103,784 | ) |
Copper Futures | | | (17 | ) | | September 2014 | | | (1,361,488 | ) | | | (39,327 | ) |
Corn Futures | | | (204 | ) | | December 2014 | | | (4,337,550 | ) | | | 265,401 | |
DAX Index | | | 20 | | | September 2014 | | | 6,750,307 | | | | (54,361 | ) |
EURO STOXX 50 Index | | | 4,529 | | | September 2014 | | | 200,434,410 | | | | (2,621,032 | ) |
Euro-Bobl | | | 200 | | | September 2014 | | | 35,089,682 | | | | 209,305 | |
Euro-Bund | | | 182 | | | September 2014 | | | 36,636,744 | | | | 508,019 | |
Euro-Schatz | | | 214 | | | September 2014 | | | 32,426,722 | | | | 14,137 | |
FTSE 100 Index | | | 584 | | | September 2014 | | | 67,073,599 | | | | (184,604 | ) |
FTSE/MIB Index | | | 19 | | | September 2014 | | | 2,771,169 | | | | (85,321 | ) |
Gas Oil Futures | | | 48 | | | September 2014 | | | 4,428,000 | | | | (75,946 | ) |
Gasoline RBOB Futures | | | 35 | | | August 2014 | | | 4,418,085 | | | | (44,805 | ) |
Gold 100 oz. Futures | | | (14 | ) | | December 2014 | | | (1,851,920 | ) | | | (5,218 | ) |
Hang Seng Index | | | 33 | | | July 2014 | | | 4,918,662 | | | | 52,471 | |
| | |
| The accompanying notes are an integral part of these financial statements. | | 49 |
GOLDMAN SACHS ABSOLUTE RETURN TRACKER FUND
Consolidated Schedule of Investments (continued)
June 30, 2014 (Unaudited)
|
| ADDITIONAL INVESTMENT INFORMATION (continued) |
FUTURES CONTRACTS (continued)
| | | | | | | | | | | | | | |
| Type | | Number of
Contracts
Long (Short) | | | Expiration Date | | Current Value | | | Unrealized Gain (Loss) | |
IBEX 35 Index | | | 32 | | | July 2014 | | $ | 4,756,620 | | | $ | (61,621 | ) |
KOSPI 200 Index | | | (39 | ) | | September 2014 | | | (5,022,435 | ) | | | (932 | ) |
LME Lead Futures | | | 79 | | | August 2014 | | | 4,267,481 | | | | (41,129 | ) |
LME Lead Futures | | | (79 | ) | | August 2014 | | | (4,267,481 | ) | | | (3,604 | ) |
LME Lead Futures | | | 55 | | | September 2014 | | | 2,983,063 | | | | (434 | ) |
LME Lead Futures | | | (72 | ) | | September 2014 | | | (3,905,100 | ) | | | 36,765 | |
LME Nickel Futures | | | 15 | | | September 2014 | | | 1,713,330 | | | | 36,596 | |
LME Nickel Futures | | | (1 | ) | | September 2014 | | | (114,222 | ) | | | (2,792 | ) |
LME Zinc Futures | | | 85 | | | September 2014 | | | 4,717,500 | | | | 48,278 | |
LME Zinc Futures | | | (1 | ) | | September 2014 | | | (55,500 | ) | | | (602 | ) |
Long Gilt | | | 62 | | | September 2014 | | | 11,663,259 | | | | 22,425 | |
NASDAQ 100 E-mini Index | | | 351 | | | September 2014 | | | 26,960,310 | | | | 475,452 | |
Natural Gas Futures | | | 43 | | | August 2014 | | | 1,909,200 | | | | (6,568 | ) |
NY Harbor ULSD Futures | | | 35 | | | August 2014 | | | 4,388,685 | | | | (90,010 | ) |
Primary Aluminum Futures | | | 19 | | | September 2014 | | | 898,106 | | | | 246 | |
Russell 2000 Mini Index | | | 2,033 | | | September 2014 | | | 241,987,990 | | | | 5,720,247 | |
S&P 500 E-mini Index | | | 480 | | | September 2014 | | | 46,857,600 | | | | 219,913 | |
S&P MidCap 400 E-mini Index | | | 41 | | | September 2014 | | | 5,860,130 | | | | 122,571 | |
S&P/TSX 60 Index | | | 42 | | | September 2014 | | | 6,799,194 | | | | 66,485 | |
Silver Futures | | | (6 | ) | | September 2014 | | | (631,680 | ) | | | (3,347 | ) |
Soybean Futures | | | 80 | | | November 2014 | | | 4,629,000 | | | | (288,863 | ) |
Sugar #11 (World) Futures | | | (42 | ) | | September 2014 | | | (847,190 | ) | | | 27,885 | |
TSE TOPIX Index | | | 514 | | | September 2014 | | | 64,056,562 | | | | 1,642,546 | |
U.S. Long Bond | | | 151 | | | September 2014 | | | 20,715,313 | | | | 162,482 | |
2 Year U.S. Treasury Notes | | | 93 | | | September 2014 | | | 20,422,219 | | | | 5,812 | |
WTI Crude Oil Futures | | | 84 | | | August 2014 | | | 8,797,320 | | | | (58,571 | ) |
5 Year U.S. Treasury Notes | | | 212 | | | September 2014 | | | 25,325,719 | | | | 1,415 | |
10 Year Canadian Government Bonds | | | 137 | | | September 2014 | | | 17,458,657 | | | | 151,171 | |
10 Year Japanese Government Bonds | | | 17 | | | September 2014 | | | 24,441,538 | | | | 33,372 | |
10 Year U.S. Treasury Notes | | | 277 | | | September 2014 | | | 34,672,609 | | | | 62,157 | |
| TOTAL | | | | | | | | | | | | $ | 6,097,854 | |
SWAP CONTRACTS — At June 30, 2014, the Fund had the following swap contracts:
CENTRALLY CLEARED CREDIT DEFAULT SWAP CONTRACT
| | | | | | | | | | | | |
| | | | | | | | | | | Market Value |
Referenced Obligation | | Notional Amount
(000’s) | | Rates
Received
(Paid) | | Termination
Date | | Credit
Spread at
June 30,
2014(a) | | Upfront Payments Made (Received) | | Unrealized Gain (Loss) |
| Protection Sold: | | | | | | | | | | | | |
| CDX North America High Yield Index | | $191,590 | | 5.000% | | 06/20/19 | | 3.030% | | $13,191,872 | | $3,567,216 |
| | (a) | | Credit spread on the Referenced Obligation, together with the period of expiration, is indicator of payment/performance risk. The likelihood of a credit event occurring which would require a fund to make a payment or otherwise be required to perform under the swap contract is generally greater as the credit spread and term of the swap contract increase. |
| | |
| 50 | | The accompanying notes are an integral part of these financial statements. |
GOLDMAN SACHS ABSOLUTE RETURN TRACKER FUND
|
| ADDITIONAL INVESTMENT INFORMATION (continued) |
OVER THE COUNTER TOTAL RETURN SWAP CONTRACTS(a)
| | | | | | | | | | | | | | | | | | | | |
| Counterparty | | | Referenced Obligation | | Notional
Amount
(000’s) | | | Rate Received
(Paid) | | | Termination
Date | | | Unrealized
Gain (Loss)(b) | |
| | Deutsche Bank AG | | | Russell Top 200 Growth Index Total Return | | $ | 13,423 | | | | (0.123 | )% | | | 09/29/14 | | | $ | (7,064 | ) |
| | | | | Russell Top 200 Value Index Total Return | | | 13,423 | | | | 0.123 | | | | 09/29/14 | | | | 16,313 | |
| | TOTAL | | | | | | | | | | | | | | | | | $ | 9,249 | |
| | (a) | | The Fund receives weekly payments based on any positive weekly return of the Referenced Obligation. The Fund makes payments on any negative weekly return of such Referenced Obligation. |
| | (b) | | There are no upfront payments on the swap contracts listed above, therefore the unrealized gains (losses) on the swap contracts are equal to their market value. |
WRITTEN OPTIONS CONTRACTS — At June 30, 2014, the Fund had the following written options:
| | | | | | | | | | | | | | |
| Put Options | | Number of
Contracts | | | Exercise
Rate | | | Expiration Month | | Value | |
S&P 500 Index | | | 91 | | | $ | 1,675 | | | July 2014 | | $ | (4,095 | ) |
| | | 88 | | | | 1,700 | | | July 2014 | | | (4,840 | ) |
| | | 85 | | | | 1,725 | | | July 2014 | | | (6,375 | ) |
| | | 83 | | | | 1,750 | | | July 2014 | | | (6,225 | ) |
| | | 81 | | | | 1,775 | | | July 2014 | | | (6,885 | ) |
| | | 78 | | | | 1,800 | | | July 2014 | | | (8,970 | ) |
| | | 76 | | | | 1,825 | | | July 2014 | | | (10,260 | ) |
| | | 74 | | | | 1,850 | | | July 2014 | | | (13,320 | ) |
| | | 87 | | | | 1,675 | | | August 2014 | | | (11,310 | ) |
| | | 84 | | | | 1,700 | | | August 2014 | | | (16,800 | ) |
| | | 82 | | | | 1,725 | | | August 2014 | | | (17,548 | ) |
| | | 80 | | | | 1,750 | | | August 2014 | | | (20,720 | ) |
| | | 77 | | | | 1,775 | | | August 2014 | | | (24,871 | ) |
| | | 75 | | | | 1,800 | | | August 2014 | | | (30,000 | ) |
| | | 73 | | | | 1,825 | | | August 2014 | | | (38,544 | ) |
| | | 71 | | | | 1,850 | | | August 2014 | | | (48,280 | ) |
| | | 70 | | | | 1,875 | | | August 2014 | | | (64,050 | ) |
| | | 119 | | | | 1,775 | | | September 2014 | | | (95,200 | ) |
| | | 116 | | | | 1,800 | | | September 2014 | | | (112,520 | ) |
| | | 113 | | | | 1,825 | | | September 2014 | | | (137,860 | ) |
| | | 110 | | | | 1,850 | | | September 2014 | | | (159,500 | ) |
| | | 107 | | | | 1,875 | | | September 2014 | | | (201,160 | ) |
| | | 104 | | | | 1,900 | | | September 2014 | | | (244,400 | ) |
| | | 101 | | | | 1,925 | | | September 2014 | | | (302,697 | ) |
| | | | 99 | | | | 1,950 | | | September 2014 | | | (384,120 | ) |
| TOTAL (Premiums Received $4,842,111) | | | 2,224 | | | | | | | | | $ | (1,970,550 | ) |
For the six months ended June 30, 2014, the Fund had the following written options activity:
| | | | | | | | |
| | | Number of
Contracts | | | Premiums Received | |
Contracts Outstanding December 31, 2013 | | | 5,984 | | | $ | 11,186,050 | |
Contracts written | | | 8,619 | | | | 20,228,322 | |
Contracts expired | | | (3,897 | ) | | | (8,771,423 | ) |
Contracts bought to close | | | (8,482 | ) | | | (17,800,838 | ) |
Contracts Outstanding June 30, 2014 | | | 2,224 | | | $ | 4,842,111 | |
| | |
| The accompanying notes are an integral part of these financial statements. | | 51 |
GOLDMAN SACHS COMMODITY STRATEGY FUND
Consolidated Schedule of Investments
June 30, 2014 (Unaudited)
| | | | | | | | | | | | | | |
Principal Amount | | | Interest
Rate | | | Maturity
Date | | | Value | |
| | | | | | | | | | | | | | |
| | Mortgage-Backed Obligations – 9.9% | |
| | Collateralized Mortgage Obligations – 3.3% | |
| | Agency Multi-Family(a) – 1.8% | |
| FHLMC Multifamily Structured Pass-Through Certificates
Series K011, Class A2 |
|
| $ | 5,500,000 | | | | 4.084 | % | | | 11/25/20 | | | $ | 6,070,593 | |
| FHLMC Multifamily Structured Pass-Through Certificates
Series K714, Class A2 |
|
| | 16,400,000 | | | | 3.034 | | | | 10/25/20 | | | | 17,153,006 | |
| FHLMC Multifamily Structured Pass-Through Certificates
Series KF01, Class A |
|
| | 2,660,169 | | | | 0.502 | | | | 04/25/19 | | | | 2,664,988 | |
| | | | | | | | | | | | | | |
| | | | | | | | | | | | | 25,888,587 | |
| | |
| | Regular Floater(a)(c) – 0.7% | |
| FDIC Guaranteed Notes Trust Series 2010-S1, Class 1A(b) | |
| | 221,366 | | | | 0.702 | | | | 02/25/48 | | | | 221,814 | |
| FHLMC REMIC Series 3371, Class FA | |
| | 566,005 | | | | 0.752 | | | | 09/15/37 | | | | 572,340 | |
| National Credit Union Administration Guaranteed Notes
Series 2010-A1, Class A |
|
| | 606,369 | | | | 0.501 | | | | 12/07/20 | | | | 607,540 | |
| National Credit Union Administration Guaranteed Notes
Series 2010-R1, Class 1A |
|
| | 768,716 | | | | 0.602 | | | | 10/07/20 | | | | 772,169 | |
| National Credit Union Administration Guaranteed Notes
Series 2010-R2, Class 1A |
|
| | 1,099,005 | | | | 0.522 | | | | 11/06/17 | | | | 1,100,679 | |
| National Credit Union Administration Guaranteed Notes
Series 2011-R2, Class 1A |
|
| | 2,298,266 | | | | 0.552 | | | | 02/06/20 | | | | 2,304,999 | |
| National Credit Union Administration Guaranteed Notes
Series 2011-R3, Class 1A |
|
| | 1,592,551 | | | | 0.552 | | | | 03/11/20 | | | | 1,596,906 | |
| National Credit Union Administration Guaranteed Notes
Series 2011-R4, Class 1A |
|
| | 1,437,240 | | | | 0.532 | | | | 03/06/20 | | | | 1,439,429 | |
| National Credit Union Administration Guaranteed Notes
Series 2011-R5, Class 1A |
|
| | 1,119,511 | | | | 0.532 | | | | 04/06/20 | | | | 1,121,348 | |
| National Credit Union Administration Guaranteed Notes
Series 2011-R6, Class 1A |
|
| | 620,912 | | | | 0.532 | | | | 05/07/20 | | | | 621,397 | |
| | | | | | | | | | | | | | |
| | | | | | | | | | | | | 10,358,621 | |
| | |
| | Sequential Fixed Rate – 0.8% | |
| FHLMC REMIC Series 2755, Class ZA | |
| | 1,017,834 | | | | 5.000 | | | | 02/15/34 | | | | 1,119,300 | |
| FHLMC REMIC Series 4273, Class PD | |
| | 3,736,521 | | | | 6.500 | | | | 11/15/43 | | | | 4,204,072 | |
| FNMA REMIC Series 2012-111, Class B | |
| | 1,465,261 | | | | 7.000 | | | | 10/25/42 | | | | 1,665,689 | |
| FNMA REMIC Series 2012-153, Class B | |
| | 4,169,127 | | | | 7.000 | | | | 07/25/42 | | | | 4,737,765 | |
| | |
| | | | | | | | | | | | | | |
| | Mortgage-Backed Obligations – (continued) | |
| | Sequential Fixed Rate – (continued) | |
| National Credit Union Administration Guaranteed Notes
Series 2010-R1, Class 2A(c) |
|
| $ | 91,870 | | | | 1.840 | % | | | 10/07/20 | | | $ | 92,498 | |
| | | | | | | | | | | | | | |
| | | | | | | | | | | | | 11,819,324 | |
| | |
| TOTAL COLLATERALIZED
MORTGAGE OBLIGATIONS |
| | $ | 48,066,532 | |
| | |
| | Federal Agencies – 6.6% | |
| | Adjustable Rate FNMA(a) – 0.2% | |
| $ | 1,512,137 | | | | 2.425 | % | | | 05/01/33 | | | $ | 1,595,916 | |
| | 896,840 | | | | 2.410 | | | | 10/01/36 | | | | 949,907 | |
| | | | | | | | | | | | | | |
| | | | | | | | | | | | | 2,545,823 | |
| | |
| | FHLMC – 1.4% | |
| | 536 | | | | 5.000 | | | | 09/01/16 | | | | 569 | |
| | 5,218 | | | | 5.000 | | | | 11/01/16 | | | | 5,539 | |
| | 967 | | | | 5.000 | | | | 12/01/16 | | | | 1,027 | |
| | 9,615 | | | | 5.000 | | | | 01/01/17 | | | | 10,204 | |
| | 8,485 | | | | 5.000 | | | | 01/01/18 | | | | 8,927 | |
| | 90,273 | | | | 5.000 | | | | 02/01/18 | | | | 95,121 | |
| | 64,110 | | | | 5.000 | | | | 03/01/18 | | | | 67,640 | |
| | 43,018 | | | | 5.000 | | | | 04/01/18 | | | | 45,410 | |
| | 27,460 | | | | 5.000 | | | | 05/01/18 | | | | 29,008 | |
| | 20,500 | | | | 5.000 | | | | 06/01/18 | | | | 21,665 | |
| | 43,263 | | | | 5.000 | | | | 07/01/18 | | | | 45,788 | |
| | 12,734 | | | | 5.000 | | | | 08/01/18 | | | | 13,461 | |
| | 5,603 | | | | 5.000 | | | | 10/01/18 | | | | 5,940 | |
| | 11,226 | | | | 5.000 | | | | 11/01/18 | | | | 11,903 | |
| | 799 | | | | 5.000 | | | | 02/01/19 | | | | 848 | |
| | 211,023 | | | | 5.500 | | | | 01/01/20 | | | | 226,683 | |
| | 126,498 | | | | 5.000 | | | | 11/01/25 | | | | 139,989 | |
| | 351,646 | | | | 5.000 | | | | 08/01/28 | | | | 391,253 | |
| | 17,934 | | | | 5.000 | | | | 01/01/33 | | | | 19,846 | |
| | 2,848 | | | | 5.000 | | | | 03/01/33 | | | | 3,162 | |
| | 14,111 | | | | 5.000 | | | | 04/01/33 | | | | 15,668 | |
| | 6,897 | | | | 5.000 | | | | 05/01/33 | | | | 7,657 | |
| | 12,748 | | | | 5.000 | | | | 06/01/33 | | | | 14,154 | |
| | 68,923 | | | | 5.000 | | | | 07/01/33 | | | | 76,527 | |
| | 99,601 | | | | 5.000 | | | | 08/01/33 | | | | 110,589 | |
| | 8,899 | | | | 5.000 | | | | 09/01/33 | | | | 9,881 | |
| | 19,684 | | | | 5.000 | | | | 10/01/33 | | | | 21,856 | |
| | 61,821 | | | | 5.000 | | | | 11/01/33 | | | | 68,641 | |
| | 20,732 | | | | 5.000 | | | | 12/01/33 | | | | 23,020 | |
| | 20,516 | | | | 5.000 | | | | 01/01/34 | | | | 22,779 | |
| | 73,439 | | | | 5.000 | | | | 02/01/34 | | | | 81,556 | |
| | 28,912 | | | | 5.000 | | | | 03/01/34 | | | | 32,120 | |
| | 58,794 | | | | 5.000 | | | | 04/01/34 | | | | 65,317 | |
| | 76,577 | | | | 5.000 | | | | 05/01/34 | | | | 85,028 | |
| | 852,574 | | | | 5.000 | | | | 06/01/34 | | | | 946,717 | |
| | 12,334 | | | | 5.000 | | | | 11/01/34 | | | | 13,702 | |
| | 277,626 | | | | 5.000 | | | | 04/01/35 | | | | 308,254 | |
| | 5,036,316 | | | | 5.000 | | | | 07/01/35 | | | | 5,595,090 | |
| | 46,662 | | | | 5.000 | | | | 11/01/35 | | | | 51,810 | |
| | 163,037 | | | | 5.000 | | | | 03/01/36 | | | | 180,874 | |
| | 107,221 | | | | 5.000 | | | | 03/01/37 | | | | 118,569 | |
| | 180,608 | | | | 5.000 | | | | 12/01/37 | | | | 199,722 | |
| | |
| | |
| 52 | | The accompanying notes are an integral part of these financial statements. |
GOLDMAN SACHS COMMODITY STRATEGY FUND
| | | | | | | | | | | | | | |
Principal Amount | | | Interest
Rate | | | Maturity
Date | | | Value | |
| | | | | | | | | | | | | | |
| | Mortgage-Backed Obligations – (continued) | |
| | FHLMC – (continued) | |
| $ | 444,142 | | | | 5.000 | % | | | 02/01/38 | | | $ | 491,253 | |
| | 1,160,864 | | | | 5.000 | | | | 03/01/38 | | | | 1,283,998 | |
| | 562,197 | | | | 5.000 | | | | 07/01/38 | | | | 621,830 | |
| | 637,584 | | | | 5.000 | | | | 11/01/38 | | | | 705,213 | |
| | 1,337,248 | | | | 5.000 | | | | 12/01/38 | | | | 1,478,776 | |
| | 726,949 | | | | 5.000 | | | | 01/01/39 | | | | 804,057 | |
| | 172,623 | | | | 5.000 | | | | 02/01/39 | | | | 190,934 | |
| | 4,025,991 | | | | 7.000 | | | | 02/01/39 | | | | 4,585,258 | |
| | 1,195,423 | | | | 5.000 | | | | 06/01/41 | | | | 1,321,941 | |
| | | | | | | | | | | | | | |
| | | | | | | | | | | | | 20,676,774 | |
| | |
| | FNMA – 5.0% | |
| | 99 | | | | 6.000 | | | | 02/01/18 | | | | 112 | |
| | 45,973 | | | | 5.000 | | | | 03/01/18 | | | | 48,514 | |
| | 169,517 | | | | 5.000 | | | | 04/01/18 | | | | 179,061 | |
| | 19,345 | | | | 6.000 | | | | 05/01/18 | | | | 21,768 | |
| | 3,192 | | | | 5.500 | | | | 01/01/19 | | | | 3,392 | |
| | 15,862 | | | | 6.000 | | | | 01/01/19 | | | | 17,849 | |
| | 49,865 | | | | 5.500 | | | | 02/01/19 | | | | 53,172 | |
| | 19,023 | | | | 6.000 | | | | 02/01/19 | | | | 21,406 | |
| | 44,063 | | | | 5.500 | | | | 03/01/19 | | | | 47,216 | |
| | 33,955 | | | | 5.500 | | | | 04/01/19 | | | | 36,153 | |
| | 19,718 | | | | 5.500 | | | | 05/01/19 | | | | 21,005 | |
| | 9,359 | | | | 6.000 | | | | 05/01/19 | | | | 10,532 | |
| | 86,002 | | | | 5.500 | | | | 06/01/19 | | | | 91,818 | |
| | 29,577 | | | | 6.000 | | | | 06/01/19 | | | | 33,282 | |
| | 273,417 | | | | 5.500 | | | | 07/01/19 | | | | 291,971 | |
| | 241,074 | | | | 5.500 | | | | 08/01/19 | | | | 257,890 | |
| | 214,281 | | | | 5.500 | | | | 09/01/19 | | | | 229,285 | |
| | 53,492 | | | | 5.500 | | | | 10/01/19 | | | | 57,100 | |
| | 64,979 | | | | 5.500 | | | | 11/01/19 | | | | 69,655 | |
| | 121,366 | | | | 5.500 | | | | 12/01/19 | | | | 130,350 | |
| | 7,651 | | | | 5.500 | | | | 01/01/20 | | | | 8,303 | |
| | 5,056 | | | | 5.500 | | | | 06/01/20 | | | | 5,421 | |
| | 1,336,165 | | | | 5.500 | | | | 07/01/20 | | | | 1,434,653 | |
| | 21,651 | | | | 6.000 | | | | 07/01/21 | | | | 24,363 | |
| | 34,058 | | | | 6.000 | | | | 07/01/22 | | | | 38,324 | |
| �� | 29,899 | | | | 6.000 | | | | 01/01/23 | | | | 33,644 | |
| | 50,426 | | | | 6.000 | | | | 10/01/26 | | | | 56,876 | |
| | 911,424 | | | | 6.000 | | | | 08/01/27 | | | | 1,031,403 | |
| | 194,211 | | | | 6.000 | | | | 01/01/28 | | | | 221,155 | |
| | 38,307 | | | | 6.000 | | | | 02/01/28 | | | | 43,321 | |
| | 502,828 | | | | 4.500 | | | | 08/01/33 | | | | 547,095 | |
| | 369,285 | | | | 4.500 | | | | 09/01/33 | | | | 401,796 | |
| | 139,604 | | | | 4.500 | | | | 10/01/33 | | | | 151,894 | |
| | 520,911 | | | | 4.500 | | | | 11/01/33 | | | | 566,771 | |
| | 28,473 | | | | 4.500 | | | | 12/01/33 | | | | 30,980 | |
| | 8,222 | | | | 4.500 | | | | 01/01/34 | | | | 8,945 | |
| | 28,214 | | | | 4.500 | | | | 03/01/34 | | | | 30,698 | |
| | 144,084 | | | | 4.500 | | | | 05/01/34 | | | | 156,635 | |
| | 90,847 | | | | 4.500 | | | | 06/01/34 | | | | 98,824 | |
| | 248,480 | | | | 5.000 | | | | 07/01/34 | | | | 276,730 | |
| | 52,821 | | | | 6.000 | | | | 08/01/34 | | | | 60,167 | |
| | 78,972 | | | | 4.500 | | | | 09/01/34 | | | | 85,821 | |
| | 3,300 | | | | 4.500 | | | | 12/01/34 | | | | 3,586 | |
| | 170,835 | | | | 4.500 | | | | 01/01/35 | | | | 185,652 | |
| | |
| | | | | | | | | | | | | | |
| | Mortgage-Backed Obligations – (continued) | |
| | FNMA – (continued) | |
| $ | 214,972 | | | | 4.500 | % | | | 02/01/35 | | | $ | 233,487 | |
| | 9,673 | | | | 4.500 | | | | 03/01/35 | | | | 10,497 | |
| | 9,390 | | | | 4.500 | | | | 04/01/35 | | | | 10,217 | |
| | 189,561 | | | | 4.500 | | | | 05/01/35 | | | | 206,032 | |
| | 61,006 | | | | 4.500 | | | | 08/01/35 | | | | 66,205 | |
| | 537,029 | | | | 6.000 | | | | 08/01/35 | | | | 605,497 | |
| | 38,445 | | | | 4.500 | | | | 09/01/35 | | | | 41,830 | |
| | 222,322 | | | | 6.000 | | | | 09/01/35 | | | | 250,667 | |
| | 34,912 | | | | 4.500 | | | | 10/01/35 | | | | 37,940 | |
| | 189,547 | | | | 6.000 | | | | 10/01/35 | | | | 213,714 | |
| | 220,074 | | | | 6.000 | | | | 11/01/35 | | | | 248,132 | |
| | 519,463 | | | | 6.000 | | | | 03/01/36 | | | | 585,692 | |
| | 6,264 | | | | 6.000 | | | | 06/01/36 | | | | 7,047 | |
| | 24,168 | | | | 6.000 | | | | 07/01/36 | | | | 27,190 | |
| | 27,926 | | | | 6.000 | | | | 08/01/36 | | | | 31,418 | |
| | 622,980 | | | | 6.000 | | | | 12/01/36 | | | | 700,873 | |
| | 2,107,337 | | | | 6.000 | | | | 01/01/37 | | | | 2,370,816 | |
| | 1,147,743 | | | | 6.000 | | | | 02/01/37 | | | | 1,290,927 | |
| | 5,151 | | | | 6.000 | | | | 04/01/37 | | | | 5,793 | |
| | 975,642 | | | | 6.000 | | | | 05/01/37 | | | | 1,097,358 | |
| | 1,012,685 | | | | 6.000 | | | | 06/01/37 | | | | 1,139,016 | |
| | 205,534 | | | | 6.000 | | | | 07/01/37 | | | | 231,169 | |
| | 991,588 | | | | 6.000 | | | | 08/01/37 | | | | 1,115,288 | |
| | 8,460,387 | | | | 6.000 | | | | 09/01/37 | | | | 9,515,810 | |
| | 954,693 | | | | 6.000 | | | | 10/01/37 | | | | 1,073,940 | |
| | 225,990 | | | | 5.000 | | | | 11/01/37 | | | | 250,813 | |
| | 1,681,219 | | | | 6.000 | | | | 11/01/37 | | | | 1,890,948 | |
| | 811,126 | | | | 6.000 | | | | 12/01/37 | | | | 912,313 | |
| | 1,713,910 | | | | 6.000 | | | | 01/01/38 | | | | 1,927,876 | |
| | 967,020 | | | | 6.000 | | | | 02/01/38 | | | | 1,087,818 | |
| | 1,858,113 | | | | 6.000 | | | | 03/01/38 | | | | 2,090,072 | |
| | 54,627 | | | | 6.000 | | | | 04/01/38 | | | | 61,451 | |
| | 2,699,112 | | | | 6.000 | | | | 05/01/38 | | | | 3,036,256 | |
| | 99,007 | | | | 4.500 | | | | 06/01/38 | | | | 107,446 | |
| | 1,089,074 | | | | 6.000 | | | | 08/01/38 | | | | 1,225,119 | |
| | 10,984 | | | | 6.000 | | | | 09/01/38 | | | | 12,356 | |
| | 5,051,123 | | | | 6.000 | | | | 10/01/38 | | | | 5,682,610 | |
| | 672,340 | | | | 6.000 | | | | 11/01/38 | | | | 756,214 | |
| | 526,417 | | | | 6.000 | | | | 12/01/38 | | | | 592,176 | |
| | 16,593 | | | | 6.000 | | | | 01/01/39 | | | | 18,663 | |
| | 2,443,760 | | | | 7.000 | | | | 03/01/39 | | | | 2,781,754 | |
| | 571,428 | | | | 6.000 | | | | 07/01/39 | | | | 642,713 | |
| | 25,017 | | | | 4.000 | | | | 08/01/39 | | | | 26,560 | |
| | 1,452,900 | | | | 6.000 | | | | 09/01/39 | | | | 1,634,147 | |
| | 371,566 | | | | 6.000 | | | | 10/01/39 | | | | 418,024 | |
| | 42,148 | | | | 4.500 | | | | 02/01/40 | | | | 45,665 | |
| | 2,257,245 | | | | 6.000 | | | | 07/01/40 | | | | 2,538,833 | |
| | 1,244,950 | | | | 6.000 | | | | 10/01/40 | | | | 1,400,256 | |
| | 1,697,471 | | | | 6.000 | | | | 04/01/41 | | | | 1,909,228 | |
| | 401,674 | | | | 6.000 | | | | 05/01/41 | | | | 451,782 | |
| | 498,995 | | | | 5.000 | | | | 07/01/41 | | | | 556,363 | |
| | 332,794 | | | | 4.500 | | | | 08/01/41 | | | | 360,821 | |
| | |
| | |
| The accompanying notes are an integral part of these financial statements. | | 53 |
GOLDMAN SACHS COMMODITY STRATEGY FUND
Consolidated Schedule of Investments (continued)
June 30, 2014 (Unaudited)
| | | | | | | | | | | | | | |
Principal Amount | | | Interest
Rate | | | Maturity Date | | | Value | |
| | | | | | | | | | | | | | |
| | Mortgage-Backed Obligations – (continued) | |
| | FNMA – (continued) | |
| $ | 84,789 | | | | 4.500 | % | | | 10/01/41 | | | $ | 91,850 | |
| | 11,000,000 | | | | 6.000 | | | | TBA-30yr | (d) | | | 12,393,047 | |
| | | | | | | | | | | | | | |
| | | | | | | | | | | | | 73,144,317 | |
| | |
| | TOTAL FEDERAL AGENCIES | | | $ | 96,366,914 | |
| | |
| | TOTAL MORTGAGE-BACKED OBLIGATIONS | |
| | (Cost $142,656,467) | | | $ | 144,433,446 | |
| | |
| | | | | | | | | | | | | | |
| | Asset-Backed Securities(c) – 0.0% | |
| | Home Equity – 0.0% | |
| GMAC Mortgage Corp. Loan Trust Series 2007-HE3, Class 1A1 | |
| $ | 95,321 | | | | 7.000 | % | | | 09/25/37 | | | $ | 94,748 | |
| GMAC Mortgage Corp. Loan Trust Series 2007-HE3, Class 2A1 | |
| | 144,048 | | | | 6.858 | | | | 09/25/37 | | | | 142,992 | |
| | |
| | TOTAL ASSET-BACKED SECURITIES | | | | | |
| | (Cost $239,818) | | | $ | 237,740 | |
| | |
| | | | | | | | | | | | | | |
| | U.S. Treasury Obligations – 12.3% | |
| United States Treasury Bonds | |
| $ | 11,800,000 | | | | 3.625 | %(e) | | | 08/15/43 | | | $ | 12,465,284 | |
| | 1,500,000 | | | | 3.750 | | | | 11/15/43 | | | | 1,620,150 | |
| | 7,200,000 | | | | 3.625 | (e) | | | 02/15/44 | | | | 7,599,240 | |
| | 4,900,000 | | | | 3.375 | | | | 05/15/44 | | | | 4,933,124 | |
| United States Treasury Inflation-Protected Securities | |
| | 41,378,330 | | | | 2.000 | | | | 07/15/14 | | | | 41,475,155 | |
| | 20,485,905 | | | | 1.625 | | | | 01/15/15 | | | | 20,825,152 | |
| | 38,027,184 | | | | 1.875 | | | | 07/15/15 | | | | 39,500,737 | |
| | 7,160,790 | | | | 2.500 | | | | 07/15/16 | | | | 7,775,043 | |
| United States Treasury Notes | |
| | 3,700,000 | | | | 1.625 | | | | 04/30/19 | | | | 3,706,956 | |
| | 8,000,000 | | | | 1.500 | | | | 05/31/19 | | | | 7,959,360 | |
| | 5,900,000 | | | | 1.625 | | | | 06/30/19 | | | | 5,899,764 | |
| | 7,200,000 | | | | 2.125 | | | | 01/31/21 | | | | 7,235,785 | |
| | 11,600,000 | | | | 2.250 | | | | 04/30/21 | | | | 11,714,144 | |
| | 8,000,000 | | | | 2.125 | | | | 06/30/21 | | | | 7,998,160 | |
| | |
| | TOTAL U.S. TREASURY OBLIGATIONS | |
| | (Cost $178,609,129) | | | $ | 180,708,054 | |
| | |
| | | | | | | | |
| Shares | | Distribution Rate | | | Value | |
| Investment Company (a)(f) – 53.0% | |
Goldman Sachs Financial Square Government Fund – FST Shares | |
| 776,026,076 | | | 0.006 | % | | $ | 776,026,076 | |
| (Cost $776,026,076) | | | | | |
| |
| TOTAL INVESTMENTS – 75.2% | |
| (Cost $1,097,531,490) | | | $ | 1,101,405,316 | |
| |
OTHER ASSETS IN EXCESS OF LIABILITIES – 24.8% | | | | 363,774,371 | |
| |
| NET ASSETS – 100.0% | | | $ | 1,465,179,687 | |
| |
| | |
| The percentage shown for each investment category reflects the value of investments in that category as a percentage of net assets. |
(a) | | Variable rate security. Interest rate or distribution rate disclosed is that which is in effect at June 30, 2014. |
(b) | | Exempt from registration under Rule 144A of the Securities Act of 1933. Under procedures approved by the Board of Trustees, such securities have been determined to be liquid by the Investment Adviser and may be resold, normally to qualified institutional buyers in transactions exempt from registration. Total market value of Rule 144A securities amounts to $221,814, which represents approximately 0.0% of net assets as of June 30, 2014. |
(c) | | Securities with “Call” features with resetting interest rates. Maturity dates disclosed are the final maturity dates. |
(d) | | TBA (To Be Announced) Securities are purchased/sold on a forward commitment basis with an approximate principal amount and no defined maturity date. The actual principal and maturity date will be determined upon settlement when the specific mortgage pools are assigned. Total market value of TBA securities (excluding forward sales contracts, if any) amounts to $12,393,047 which represents approximately 0.8% of net assets as of June 30, 2014. |
(e) | | All or a portion of security is segregated as collateral for initial margin requirements on futures transactions. |
(f) | | Represents an affiliated issuer. |
| | |
|
Investment Abbreviations: |
FDIC | | —Federal Deposit Insurance Corp. |
FHLMC | | —Federal Home Loan Mortgage Corp. |
FNMA | | —Federal National Mortgage Association |
LIBOR | | —London Interbank Offered Rate |
REMIC | | —Real Estate Mortgage Investment Conduit |
|
| | |
| 54 | | The accompanying notes are an integral part of these financial statements. |
GOLDMAN SACHS COMMODITY STRATEGY FUND
|
| ADDITIONAL INVESTMENT INFORMATION |
FUTURES CONTRACTS — At June 30, 2014, the Fund had the following futures contracts:
| | | | | | | | | | | | | | |
| Type | | Number of
Contracts
Long (Short) | | | Expiration Date | | Current Value | | | Unrealized
Gain (Loss) | |
90 Day Eurodollar | | | (239 | ) | | September 2016 | | $ | (58,725,288 | ) | | $ | (98,542 | ) |
90 Day Eurodollar | | | (504 | ) | | December 2016 | | | (123,511,500 | ) | | | (334,821 | ) |
90 Day Eurodollar | | | (232 | ) | | March 2017 | | | (56,732,700 | ) | | | (94,742 | ) |
90 Day Eurodollar | | | (247 | ) | | June 2017 | | | (60,277,263 | ) | | | (54,673 | ) |
U.S. Long Bond | | | (124 | ) | | September 2014 | | | (17,011,250 | ) | | | (52,259 | ) |
U.S. Ultra Long Treasury Bonds | | | (35 | ) | | September 2014 | | | (5,247,813 | ) | | | (13,883 | ) |
2 Year U.S. Treasury Notes | | | (353 | ) | | September 2014 | | | (77,516,594 | ) | | | 54,744 | |
5 Year U.S. Treasury Notes | | | (318 | ) | | September 2014 | | | (37,988,578 | ) | | | 57,175 | |
10 Year U.S. Treasury Notes | | | 20 | | | September 2014 | | | 2,503,438 | | | | 445 | |
| TOTAL | | | | | | | | | | | | $ | (536,556 | ) |
SWAP CONTRACTS — At June 30, 2014, the Fund had the following swap contracts:
CENTRALLY CLEARED INTEREST RATE SWAP CONTRACTS
| | | | | | | | | | | | | | | | |
| | | | | | Rates Exchanged | | Market Value | |
Notional Amount
(000’s) | | | Termination Date | | Payments Received | | Payments Made | | Upfront Payments Made (Received) | | | Unrealized
Gain (Loss) | |
| $ | 17,100 | (a) | | 09/17/16 | | 3 Month LIBOR | | 1.000% | | $ | (83,357 | ) | | $ | (16,011 | ) |
| | 21,700 | (a) | | 09/17/19 | | 3 Month LIBOR | | 2.250 | | | (331,344 | ) | | | (120,031 | ) |
| | 30,100 | (a) | | 09/17/21 | | 3 Month LIBOR | | 2.750 | | | (680,902 | ) | | | (271,275 | ) |
| | 100 | | | 06/19/43 | | 2.750% | | 3 Month LIBOR | | | (9,852 | ) | | | (818 | ) |
| | TOTAL | | | | | | | | | $ | (1,105,455 | ) | | $ | (408,135 | ) |
| | (a) | | Represents forward starting interest rate swaps whose effective dates of commencement of accruals and cash flows occur subsequent to June 30, 2014. |
OVER THE COUNTER TOTAL RETURN SWAP CONTRACTS(a)
| | | | | | | | | | | | | | | | | | |
| Counterparty | | Referenced Obligation | | Notional
Amount
(000’s) | | | Rate Received
(Paid) | | | Termination
Date | | | Unrealized
Gain (Loss)(b) | |
Deutsche Bank AG | | S&P GSCI 1 Month Forward Index | | $ | 319,912 | | | | (0.100 | )% | | | 07/31/14 | | | $ | 7,827,273 | |
Macquarie Bank Ltd. | | S&P GSCI 1 Month Forward Index | | | 201,486 | | | | (0.150 | ) | | | 07/31/14 | | | | 4,921,182 | |
| | | | | 15,000 | | | | (0.150 | ) | | | 07/31/14 | | | | 439,586 | |
Merrill Lynch International | | S&P GSCI 1 Month Forward Index | | | 270,720 | | | | (0.160 | ) | | | 07/31/14 | | | | 6,609,856 | |
| | | | | 154,114 | | | | (0.160 | ) | | | 07/31/14 | | | | 3,762,822 | |
Societe Generale SA | | S&P GSCI 1 Month Forward Index | | | 14,900 | | | | (0.150 | ) | | | 07/31/14 | | | | 363,915 | |
UBS AG | | S&P GSCI 1 Month Forward Index | | | 294,251 | | | | (0.170 | ) | | | 07/31/14 | | | | 7,181,939 | |
| | | | | | 158,347 | | | | (0.170 | ) | | | 07/31/14 | | | | 3,864,853 | |
| TOTAL | | | | | | | | | | | | | | | | $ | 34,971,426 | |
| | (a) | | The Fund receives quarterly payments based on any positive monthly return of the Referenced Obligation. The Fund makes payments on any negative monthly return of such Referenced Obligation. |
| | (b) | | There are no upfront payments on the swap contracts listed above, therefore the unrealized gains (losses) on the swap contracts are equal to their market value. |
| | |
| The accompanying notes are an integral part of these financial statements. | | 55 |
GOLDMAN SACHS DYNAMIC ALLOCATION FUND
Schedule of Investments
June 30, 2014 (Unaudited)
| | | | | | | | |
Shares | | | Description | | Value | |
| | | | | | | | |
| | Common Stocks – 29.1% | |
| | Automobiles & Components – 0.6% | |
| | 22,300 | | | Aisin Seiki Co. Ltd. | | $ | 887,673 | |
| | 24,600 | | | Bridgestone Corp. | | | 861,577 | |
| | 49,800 | | | Daihatsu Motor Co. Ltd. | | | 886,256 | |
| | 31,500 | | | Fuji Heavy Industries Ltd. | | | 873,456 | |
| | 58,100 | | | Sumitomo Rubber Industries Ltd. | | | 839,749 | |
| | 28,000 | | | Suzuki Motor Corp. | | | 878,404 | |
| | | | | | | | |
| | | | | | | 5,227,115 | |
| | |
| | Banks – 0.3% | |
| | 142,100 | | | Mitsubishi UFJ Financial Group, Inc. | | | 872,312 | |
| | 429,000 | | | Mizuho Financial Group, Inc. | | | 881,812 | |
| | 151,800 | | | Resona Holdings, Inc. | | | 884,589 | |
| | | | | | | | |
| | | | | | | 2,638,713 | |
| | |
| | Capital Goods – 4.8% | |
| | 78,398 | | | AGCO Corp. | | | 4,407,535 | |
| | 243,290 | | | Exelis, Inc. | | | 4,131,064 | |
| | 62,700 | | | Hino Motors Ltd. | | | 865,031 | |
| | 71,342 | | | Joy Global, Inc. | | | 4,393,240 | |
| | 91,000 | | | Kinden Corp. | | | 885,507 | |
| | 63,427 | | | Lincoln Electric Holdings, Inc. | | | 4,432,279 | |
| | 80,257 | | | Oshkosh Corp. | | | 4,456,671 | |
| | 37,253 | | | Snap-on, Inc. | | | 4,415,226 | |
| | 136,189 | | | The Babcock & Wilcox Co. | | | 4,420,695 | |
| | 64,000 | | | TOTO Ltd. | | | 863,106 | |
| | 27,247 | | | Valmont Industries, Inc. | | | 4,140,182 | |
| | 49,807 | | | WESCO International, Inc.* | | | 4,302,329 | |
| | | | | | | | |
| | | | | | | 41,712,865 | |
| | |
| | Commercial & Professional Services – 0.5% | |
| | 52,200 | | | Manpowergroup, Inc. | | | 4,429,170 | |
| | |
| | Consumer Durables & Apparel – 0.8% | |
| | 36,900 | | | Bandai Namco Holdings, Inc. | | | 865,144 | |
| | 128,119 | | | Coach, Inc. | | | 4,380,389 | |
| | 56,000 | | | Nikon Corp. | | | 882,227 | |
| | 76,000 | | | Sekisui Chemical Co. Ltd. | | | 881,115 | |
| | | | | | | | |
| | | | | | | 7,008,875 | |
| | |
| | Consumer Services – 1.1% | |
| | 149,166 | | | Apollo Education Group, Inc. Class A* | | | 4,661,437 | |
| | 103,326 | | | DeVry Education Group, Inc. | | | 4,374,823 | |
| | | | | | | | |
| | | | | | | 9,036,260 | |
| | |
| | Diversified Financials – 0.5% | |
| | 115,789 | | | The NASDAQ OMX Group, Inc. | | | 4,471,771 | |
| | |
| | Energy – 0.7% | |
| | 56,800 | | | Inpex Corp. | | | 864,053 | |
| | 20,800 | | | Japan Petroleum Exploration Co. | | | 867,728 | |
| | 111,903 | | | Marathon Oil Corp. | | | 4,467,168 | |
| | | | | | | | |
| | | | | | | 6,198,949 | |
| | |
| | Food & Staples Retailing – 0.5% | |
| | 57,864 | | | CVS Caremark Corp. | | | 4,361,210 | |
| | |
| | | | | | | | |
| | Common Stocks – (continued) | |
| | Food, Beverage & Tobacco – 0.2% | |
| | 51,200 | | | Coca-Cola West Co. Ltd. | | $ | 882,934 | |
| | 29,000 | | | Toyo Suisan Kaisha Ltd. | | | 893,913 | |
| | | | | | | | |
| | | | | | | 1,776,847 | |
| | |
| | Health Care Equipment & Services – 3.5% | |
| | 109,656 | | | Health Net, Inc.* | | | 4,555,110 | |
| | 108,619 | | | Hill-Rom Holdings, Inc. | | | 4,508,775 | |
| | 34,447 | | | Humana, Inc. | | | 4,399,571 | |
| | 108,917 | | | Patterson Companies, Inc. | | | 4,303,311 | |
| | 74,090 | | | Quest Diagnostics, Inc. | | | 4,348,342 | |
| | 40,474 | | | WellPoint, Inc. | | | 4,355,407 | |
| | 42,020 | | | Zimmer Holdings, Inc. | | | 4,364,197 | |
| | | | | | | | |
| | | | | | | 30,834,713 | |
| | |
| | Household & Personal Products – 0.5% | |
| | 59,117 | | | Nu Skin Enterprises, Inc. Class A | | | 4,372,293 | |
| | |
| | Materials – 0.3% | |
| | 114,000 | | | Asahi Kasei Corp. | | | 872,729 | |
| | 53,500 | | | Hitachi Chemical Co. Ltd. | | | 885,762 | |
| | 87,000 | | | Zeon Corp. | | | 930,626 | |
| | | | | | | | |
| | | | | | | 2,689,117 | |
| | |
| | Pharmaceuticals, Biotechnology & Life Sciences – 2.0% | |
| | 47,500 | | | Daiichi Sankyo Co. Ltd. | | | 887,858 | |
| | 70,570 | | | Eli Lilly & Co. | | | 4,387,337 | |
| | 117,629 | | | Myriad Genetics, Inc.* | | | 4,578,121 | |
| | 29,200 | | | Otsuka Holdings Co. Ltd. | | | 905,496 | |
| | 41,300 | | | Shionogi & Co. Ltd. | | | 862,617 | |
| | 75,600 | | | Sumitomo Dainippon Pharma Co. Ltd. | | | 870,045 | |
| | 38,300 | | | Tsumura & Co. | | | 903,729 | |
| | 49,779 | | | United Therapeutics Corp.* | | | 4,404,944 | |
| | | | | | | | |
| | | | | | | 17,800,147 | |
| | |
| | Retailing – 4.3% | |
| | 252,753 | | | Ascena Retail Group, Inc.* | | | 4,322,076 | |
| | 72,025 | | | Bed Bath & Beyond, Inc.* | | | 4,132,794 | |
| | 265,506 | | | Chico’s FAS, Inc. | | | 4,502,982 | |
| | 99,083 | | | Dick’s Sporting Goods, Inc. | | | 4,613,304 | |
| | 88,287 | | | Foot Locker, Inc. | | | 4,477,917 | |
| | 108,538 | | | GameStop Corp. Class A | | | 4,392,533 | |
| | 82,283 | | | Kohl’s Corp. | | | 4,334,668 | |
| | 17,800 | | | Nitori Holdings Co. Ltd. | | | 973,872 | |
| | 7,900 | | | Ryohin Keikaku Co. Ltd. | | | 897,026 | |
| | 8,900 | | | Shimamura Co. Ltd. | | | 876,059 | |
| | 398,865 | | | Staples, Inc. | | | 4,323,697 | |
| | | | | | | | |
| | | | | | | 37,846,928 | |
| | |
| | Semiconductors & Semiconductor Equipment – 0.5% | |
| | 143,199 | | | Intel Corp. | | | 4,424,849 | |
| | |
| | Software & Services – 3.7% | |
| | 112,683 | | | AOL, Inc.* | | | 4,483,657 | |
| | 152,393 | | | CA, Inc. | | | 4,379,775 | |
| | 65,100 | | | Dena Co. Ltd. | | | 880,859 | |
| | 96,100 | | | Gree, Inc. | | | 842,698 | |
| | |
| | |
| 56 | | The accompanying notes are an integral part of these financial statements. |
GOLDMAN SACHS DYNAMIC ALLOCATION FUND
| | | | | | | | |
Shares | | | Description | | Value | |
| | | | | | | | |
| | Common Stocks – (continued) | |
| | Software & Services – (continued) | |
| | 104,625 | | | Microsoft Corp. | | $ | 4,362,862 | |
| | 171,278 | | | NeuStar, Inc. Class A* | | | 4,456,654 | |
| | 195,068 | | | Symantec Corp. | | | 4,467,057 | |
| | 103,522 | | | Teradata Corp.* | | | 4,161,584 | |
| | 354,871 | | | Xerox Corp. | | | 4,414,595 | |
| | | | | | | | |
| | | | | | | 32,449,741 | |
| | |
| | Technology Hardware & Equipment – 3.5% | |
| | 484,210 | | | Brocade Communications Systems, Inc. | | | 4,454,732 | |
| | 26,000 | | | Canon, Inc. | | | 849,732 | |
| | 178,050 | | | Cisco Systems, Inc. | | | 4,424,542 | |
| | 167,276 | | | EMC Corp. | | | 4,406,050 | |
| | 31,700 | | | FUJIFILM Holdings Corp. | | | 884,766 | |
| | 128,647 | | | Hewlett-Packard Co. | | | 4,332,831 | |
| | 411,000 | | | Oki Electric Industry Co. Ltd. | | | 913,904 | |
| | 73,100 | | | Ricoh Co. Ltd. | | | 871,253 | |
| | 42,765 | | | SanDisk Corp. | | | 4,465,949 | |
| | 154,900 | | | Wacom Co. Ltd. | | | 884,078 | |
| | 48,410 | | | Western Digital Corp. | | | 4,468,243 | |
| | | | | | | | |
| | | | | | | 30,956,080 | |
| | |
| | Telecommunication Services – 0.7% | |
| | 123,762 | | | AT&T, Inc. | | | 4,376,224 | |
| | 14,200 | | | Nippon Telegraph & Telephone Corp. | | | 885,056 | |
| | 51,400 | | | NTT DoCoMo, Inc. | | | 877,440 | |
| | | | | | | | |
| | | | | | | 6,138,720 | |
| | |
| | Transportation – 0.1% | |
| | 16,300 | | | Japan Airlines Co. Ltd. | | | 901,219 | |
| | |
| | TOTAL COMMON STOCKS | |
| | (Cost $245,217,277) | | $ | 255,275,582 | |
| | |
| | | | | | | | | | | | | | |
Principal Amount | | | Interest
Rate | | | Maturity
Date | | | Value | |
| | | | | | | | | | | | | | |
| | Commodity Index Linked Structured Notes(a)(b)(c)(d)(e) – 1.70% | |
| Canadian Imperial Bank of Commerce | |
| $ | 7,470,000 | | | | 0.219 | % | | | 12/04/14 | | | $ | 8,696,574 | |
| UBS AG | |
| | 310,000 | | | | 0.148 | | | | 12/08/14 | | | | 396,949 | |
| | 6,210,000 | | | | 0.048 | | | | 05/28/15 | | | | 5,775,026 | |
| | 340,000 | | | | 0.148 | | | | 06/30/15 | | | | 345,923 | |
| | |
| TOTAL COMMODITY INDEX LINKED
STRUCTURED NOTES |
| | | | |
| | (Cost $14,330,000) | | | $ | 15,214,472 | |
| | |
| | | | | | | | |
| Shares | | Distribution Rate | | | Value | |
| Investment Company(a)(f) – 49.1% | |
Goldman Sachs Financial Square Government Fund – FST Shares | |
| 429,893,629 | | | 0.006 | % | | $ | 429,893,629 | |
| (Cost $429,893,629) | |
| |
| | | | | | | | |
Shares | | | Description | | Value | |
| | Exchange Traded Funds – 6.1% | |
| | 201,025 | | | iShares MSCI Emerging Markets ETF | | $ | 8,690,311 | |
| | 374,062 | | | iShares Russell 2000 ETF | | | 44,442,306 | |
| | |
| | TOTAL EXCHANGE TRADED FUNDS | |
| | (Cost $36,442,917) | | $ | 53,132,617 | |
| | |
| | | | | | | | | | | | | | |
Principal Amount | | | Interest
Rate | | | Maturity
Date | | | Value | |
| | U.S. Treasury Obligations(g) – 2.7% | |
| United States Treasury Inflation Index Notes | |
| $ | 22,440,039 | | | | 0.625 | %(g) | | | 01/15/24 | | | $ | 23,264,037 | |
| | (Cost $22,670,737) | |
| | |
| | TOTAL INVESTMENTS – 88.7% | |
| | (Cost $748,554,560) | | | $ | 776,780,337 | |
| | |
| OTHER ASSETS IN EXCESS OF
LIABILITIES – 11.3% |
| | | 99,330,807 | |
| | |
| | NET ASSETS – 100.0% | | | $ | 876,111,144 | |
| | |
| | |
| The percentage shown for each investment category reflects the value of investments in that category as a percentage of net assets. |
* | | Non-income producing security. |
(a) | | Variable rate security. Interest rate or distribution rate disclosed is that which is in effect at June 30, 2014. |
(b) | | These Structured Notes take into consideration a leverage factor of 300% on the return of the underlying linked index. |
(c) | | Security is linked to the Dow Jones-UBS Commodity Index Total Return (the “DJ-UBSCI Total Return”). The DJ-UBSCI Total Return is a composite of commodity sector returns, representing an unleveraged, long-only investment in commodity futures that is diversified across the spectrum of commodities. The DJUBSCI Total Return is composed of nineteen commodities in eight diverse sectors: energy, petroleum, precious metals, industrial metals, grains, livestock, softs, and agriculture. |
(d) | | Interest rate disclosed is contingent upon LIBOR as of June 30, 2014 minus a spread. |
(e) | | Exempt from registration under Rule 144A of the Securities Act of 1933. Under procedures approved by the Board of Trustees, such securities have been determined to be liquid by the Investment Adviser and may be resold, normally to qualified institutional buyers in transactions exempt from registration. Total market value of Rule 144A securities amounts to $15,214,472, which represents approximately 1.7% of net assets as of June 30, 2014. |
(f) | | Represents an affiliated issuer. |
(g) | | All or a portion of security is segregated as collateral for initial margin requirements on futures transactions. |
| | |
|
Currency Abbreviations: |
JPY | | —Japanese Yen |
USD | | —United States Dollar |
|
| | |
| The accompanying notes are an integral part of these financial statements. | | 57 |
GOLDMAN SACHS DYNAMIC ALLOCATION FUND
Schedule of Investments (continued)
June 30, 2014 (Unaudited)
|
| ADDITIONAL INVESTMENT INFORMATION |
FUTURES CONTRACTS — At June 30, 2014, the Fund had the following futures contracts:
| | | | | | | | | | | | | | |
| Type | | Number of
Contracts
Long (Short) | | | Expiration Date | | Current Value | | | Unrealized
Gain (Loss) | |
Amsterdam Index | | | 134 | | | July 2014 | | $ | 15,165,135 | | | $ | (56,699 | ) |
CAC 40 Index | | | 193 | | | July 2014 | | | 11,686,236 | | | | (157,716 | ) |
CBOE Volatility Index | | | (667 | ) | | July 2014 | | | (8,304,150 | ) | | | 853,546 | |
DAX Index | | | 124 | | | September 2014 | | | 41,851,902 | | | | (329,840 | ) |
Euro-Bund | | | 62 | | | September 2014 | | | 12,480,649 | | | | 138,675 | |
FTSE 100 Index | | | 156 | | | September 2014 | | | 17,916,920 | | | | (3,262 | ) |
FTSE/MIB Index | | | 126 | | | September 2014 | | | 18,377,225 | | | | (526,903 | ) |
Hang Seng Index | | | 150 | | | July 2014 | | | 22,357,556 | | | | 285,367 | |
IBEX 35 Index | | | (39 | ) | | July 2014 | | | (5,797,130 | ) | | | 25,456 | |
Long Gilt | | | 72 | | | September 2014 | | | 13,544,430 | | | | (7,306 | ) |
OMX Stockholm 30 Index | | | (304 | ) | | July 2014 | | | (6,276,508 | ) | | | 13,473 | |
S&P 500 E-mini Index | | | 31 | | | September 2014 | | | 3,026,220 | | | | 45,205 | |
S&P/TSX 60 Index | | | 179 | | | September 2014 | | | 28,977,517 | | | | 333,396 | |
SPI 200 Index | | | (188 | ) | | September 2014 | | | (23,728,205 | ) | | | 102,853 | |
TSE TOPIX Index | | | 387 | | | September 2014 | | | 48,229,357 | | | | 158,721 | |
10 Year Australian Bonds | | | 22 | | | September 2014 | | | 2,499,186 | | | | 50,975 | |
10 Year Canadian Government Bonds | | | 24 | | | September 2014 | | | 3,058,451 | | | | 23,161 | |
10 Year Japanese Government Bonds | | | 44 | | | September 2014 | | | 63,260,451 | | | | 34,493 | |
10 Year U.S. Treasury Notes | | | 787 | | | September 2014 | | | 98,510,266 | | | | 154,804 | |
| TOTAL | | | | | | | | | | | | $ | 1,138,399 | |
FORWARD FOREIGN CURRENCY EXCHANGE CONTRACTS — At June 30, 2014, the Fund had the following forward foreign currency exchange contracts:
FORWARD FOREIGN CURRENCY EXCHANGE CONTRACT WITH UNREALIZED GAIN
| | | | | | | | | | |
| Counterparty | | Contracts to
Buy/Sell | | Settlement
Date | | Current
Value | | Unrealized
Gain | |
Morgan Stanley Co., Inc. | | JPY/USD | | 09/17/14 | | $98,768 | | $ | 438 | |
FORWARD FOREIGN CURRENCY EXCHANGE CONTRACT WITH UNREALIZED LOSS
| | | | | | | | | | |
| Counterparty | | Contracts to
Buy/Sell | | Settlement
Date | | Current Value | | Unrealized
Loss | |
Morgan Stanley Co., Inc. | | USD/JPY | | 09/17/14 | | $44,168,920 | | $ | (548,376 | ) |
| | |
| 58 | | The accompanying notes are an integral part of these financial statements. |
GOLDMAN SACHS DYNAMIC ALLOCATION FUND
|
| ADDITIONAL INVESTMENT INFORMATION (continued) |
SWAP CONTRACTS — At June 30, 2014, the Fund had the following swap contracts:
CENTRALLY CLEARED CREDIT DEFAULT SWAP CONTRACTS
| | | | | | | | | | | | | | | | | | | | | | |
| | | | | | | | | | | | | | Market Value | |
| Referenced Obligation | | Notional
Amount
(000’s) | | Rates
Received
(Paid) | | | Termination
Date | | | Credit
Spread at
June 30,
2014(a) | | | Upfront
Payments
Made (Received) | | | Unrealized
Gain (Loss) | |
Protection Sold: | | | | | | | | | | | | | | | | | | | | | | |
CDX Emerging Markets Index | | $17,440 | | | 5.000 | % | | | 06/20/19 | | | | 2.370 | % | | $ | 1,656,168 | | | $ | 434,870 | |
CDX North America High Yield Index | | 43,670 | | | 5.000 | | | | 06/20/19 | | | | 3.030 | | | | 2,933,258 | | | | 886,719 | |
CDX North America Investment Grade Index | | 43,670 | | | 1.000 | | | | 06/20/19 | | | | 0.580 | | | | 605,660 | | | | 272,827 | |
| TOTAL | | | | | | | | | | | | | | | | $ | 5,195,086 | | | $ | 1,594,416 | |
| | (a) | | Credit spread on the Referenced Obligation, together with the period of expiration, are indicators of payment/performance risk. The likelihood of a credit event occurring which would require a fund to make a payment or otherwise be required to perform under the swap contract is generally greater as the credit spread and term of the swap contract increase. |
OVER THE COUNTER TOTAL RETURN SWAP CONTRACTS(a)
| | | | | | | | | | | | | | | | | | |
| Counterparty | | Referenced Obligation | | Notional
Amount
(000’s) | | | Rate Received (Paid) | | | Termination
Date | | | Unrealized
Gain (Loss)(b) | |
Deutsche Bank AG | | Alerian MLP Infrastructure Index | | $ | 2,713 | | | | (0.224 | )% | | | 12/31/14 | | | $ | 226,012 | |
| | | | | 7,831 | | | | (0.224 | ) | | | 12/31/14 | | | | 624,025 | |
| | | | | 23,430 | | | | (0.224 | ) | | | 12/31/14 | | | | 1,874,041 | |
| | | FTSE NAREIT Mortgage Index | | | 37,327 | | | | (0.228 | ) | | | 03/25/15 | | | | 2,126,005 | |
| TOTAL | | | | | | | | | | | | | | | | $ | 4,850,083 | |
| | (a) | | The Fund receives quarterly payments based on any positive monthly return of the Referenced Obligation. The Fund makes payments on any negative monthly return of such Referenced Obligation. |
| | (b) | | There are no upfront payments on the swap contracts listed above, therefore the unrealized gains (losses) on the swap contracts are equal to their market value. |
| | |
| The accompanying notes are an integral part of these financial statements. | | 59 |
GOLDMAN SACHS DYNAMIC COMMODITY STRATEGY FUND
Consolidated Schedule of Investments
June 30, 2014 (Unaudited)
| | | | | | | | |
Shares | | | Distribution
Rate | | Value | |
| | Investment Company(a)(b) – 80.5% | |
| Goldman Sachs Financial Square Government Fund – FST Shares | |
| | 31,726,306 | | | 0.006% | | $ | 31,726,306 | |
| | (Cost $31,726,306) | | | | |
| | |
| | TOTAL INVESTMENTS – 80.5% | | | | |
| | (Cost $31,726,306) | | $ | 31,726,306 | |
| | |
| OTHER ASSETS IN EXCESS OF
LIABILITIES – 19.5% | | | 7,699,043 | |
| | |
| | NET ASSETS – 100.0% | | $ | 39,425,349 | |
| | |
| | |
| The percentage shown for each investment category reflects the value of investments in that category as a percentage of net assets. |
(a) | | Variable rate security. Interest rate or distribution rate disclosed is that which is in effect at June 30, 2014. |
(b) | | Represents an affiliated issuer. |
| | |
| 60 | | The accompanying notes are an integral part of these financial statements. |
GOLDMAN SACHS DYNAMIC COMMODITY STRATEGY FUND
|
| ADDITIONAL INVESTMENT INFORMATION |
SWAP CONTRACTS — At June 30, 2014, the Fund had the following swap contracts:
OVER THE COUNTER TOTAL RETURN SWAP CONTRACTS(a)
| | | | | | | | | | | | | | | | | | |
| Counterparty | | Referenced Obligation | | Notional Amount (000’s) | | | Rates Received (Paid) | | | Termination Date | | | Unrealized Gain (Loss)(b) | |
Merrill Lynch International | | Bloomberg Aluminum Subindex | | $ | 774 | | | | (0.180 | )% | | | 07/31/14 | | | $ | 18,259 | |
| | Bloomberg Coffee Subindex | | | 1,293 | | | | (0.180 | ) | | | 07/31/14 | | | | (37,346 | ) |
| | Bloomberg Copper Subindex | | | 1,880 | | | | (0.180 | ) | | | 07/31/14 | | | | 49,968 | |
| | Bloomberg Corn Subindex | | | 150 | | | | (0.180 | ) | | | 07/31/14 | | | | (6,187 | ) |
| | | | | 432 | | | | (0.180 | ) | | | 07/31/14 | | | | (40,477 | ) |
| | Bloomberg Gold Subindex | | | 3,028 | | | | (0.180 | ) | | | 07/31/14 | | | | 184,227 | |
| | Bloomberg Heating Oil Subindex | | | 1,284 | | | | (0.150 | ) | | | 07/31/14 | | | | 37,220 | |
| | Bloomberg Kansas Wheat Subindex | | | 489 | | | | (0.180 | ) | | | 07/31/14 | | | | (18,193 | ) |
| | Bloomberg Lead Subindex | | | 218 | | | | (0.180 | ) | | | 07/31/14 | | | | 7,213 | |
| | Bloomberg Lean Hogs Subindex | | | 425 | | | | (0.200 | ) | | | 07/31/14 | | | | 27,034 | |
| | Bloomberg Natural Gas Subindex | | | 700 | | | | (0.150 | ) | | | 07/31/14 | | | | 8,114 | |
| | | | | 3,658 | | | | (0.150 | ) | | | 07/31/14 | | | | (63,893 | ) |
| | Bloomberg Nickel Subindex | | | 1,327 | | | | (0.180 | ) | | | 07/31/14 | | | | (17,755 | ) |
| | Bloomberg Platinum Subindex | | | 178 | | | | (0.180 | ) | | | 07/31/14 | | | | 3,591 | |
| | | | | 204 | | | | (0.180 | ) | | | 07/31/15 | | | | 4,109 | |
| | | | | 541 | | | | (0.180 | ) | | | 07/31/14 | | | | 10,928 | |
| | | | | 3,459 | | | | (0.180 | ) | | | 07/31/14 | | | | 69,837 | |
| | Bloomberg Soybean Meal Subindex | | | 329 | | | | (0.180 | ) | | | 07/31/14 | | | | (37,538 | ) |
| | | | | 861 | | | | (0.180 | ) | | | 07/31/14 | | | | (98,215 | ) |
| | Bloomberg Soybean Oil Subindex | | | 394 | | | | (0.180 | ) | | | 07/31/14 | | | | 4,171 | |
| | | | | 537 | | | | (0.180 | ) | | | 07/31/14 | | | | 5,690 | |
| | Bloomberg Sugar Subindex | | | 961 | | | | (0.180 | ) | | | 07/31/14 | | | | (10,266 | ) |
| | Bloomberg Unleaded Gasoline Subindex | | | 5,307 | | | | (0.150 | ) | | | 07/31/14 | | | | 199,283 | |
| | Bloomberg WTI Crude Oil Subindex | | | 5,596 | | | | (0.150 | ) | | | 07/31/14 | | | | 205,991 | |
| | Bloomberg Zinc Subindex | | | 356 | | | | (0.180 | ) | | | 07/31/14 | | | | 27,224 | |
| | | | | 390 | | | | (0.180 | ) | | | 07/31/14 | | | | 29,816 | |
| | | | | 1,456 | | | | (0.180 | ) | | | 07/31/14 | | | | 111,178 | |
| | | Merrill Lynch Commodities Index | | | 3,370 | | | | (0.180 | ) | | | 07/31/14 | | | | 26,889 | |
| TOTAL | | | | | | | | | | | | | | | | $ | 700,872 | |
| | (a) | | The Fund receives quarterly payments based on any positive monthly return of the Referenced Obligation. The Fund makes payments on any negative monthly return of such Referenced Obligation. |
| | (b) | | There are no upfront payments on the swap contracts listed above, therefore the unrealized gains (losses) on the swap contracts are equal to their market value. |
| | |
| The accompanying notes are an integral part of these financial statements. | | 61 |
GOLDMAN SACHS MANAGED FUTURES STRATEGY FUND
Schedule of Investments
June 30, 2014 (Unaudited)
| | | | | | | | | | | | | | |
Principal Amount | | | Interest
Rate | | | Maturity
Date | | | Value | |
| | | | | | | | | | | | | | |
| | Commodity Index Linked Structured Notes(a)(b)(c)(d)(e) – 8.6% | |
| JPMorgan Chase Bank, NA | |
| $ | 1,758,000 | | | | 0.098 | % | | | 04/09/15 | | | $ | 2,081,999 | |
| | 370,000 | | | | 0.198 | | | | 05/11/15 | | | | 342,435 | |
| | 49,000 | | | | 0.198 | | | | 05/14/15 | | | | 47,643 | |
| | 760,000 | | | | 0.199 | | | | 05/26/15 | | | | 680,200 | |
| | 500,000 | | | | 0.198 | | | | 06/15/15 | | | | 556,300 | |
| | 740,000 | | | | 0.200 | | | | 07/27/15 | | | | 760,202 | |
| UBS AG | |
| | 1,858,000 | | | | 0.148 | | | | 04/10/15 | | | | 2,092,289 | |
| | 360,000 | | | | 0.148 | | | | 05/11/15 | | | | 264,535 | |
| | 890,000 | | | | 0.148 | | | | 07/13/15 | | | | 938,595 | |
| | 950,000 | | | | 0.148 | | | | 07/27/15 | | | | 1,059,402 | |
| | |
| TOTAL COMMODITY INDEX LINKED
STRUCTURED NOTES |
| | | | |
| | (Cost $8,235,000) | | | $ | 8,823,600 | |
| | |
| | | | | | | | |
| Shares | | Distribution Rate | | | Value | |
| Investment Company(e)(f) – 75.9% | |
Goldman Sachs Financial Square Government Fund – FST Shares | |
| 77,340,523 | | | 0.006 | % | | $ | 77,340,523 | |
| (Cost $77,340,523) | |
| |
| TOTAL INVESTMENTS – 84.5% | |
| (Cost $85,575,523) | | | $ | 86,164,123 | |
| |
OTHER ASSETS IN EXCESS OF LIABILITIES – 15.5% | | | | 15,789,170 | |
| |
| NET ASSETS – 100.0% | | | $ | 101,953,293 | |
| |
| | |
| The percentage shown for each investment category reflects the value of investments in that category as a percentage of net assets. |
(a) | | Security is linked to the Dow Jones-UBS Commodity Index Total Return (the “DJ-UBSCI Total Return”). The DJ-UBSCI Total Return is a composite of commodity sector returns, representing an unleveraged, long-only investment in commodity futures that is diversified across the spectrum of commodities. The DJUBSCI Total Return is composed of nineteen commodities in eight diverse sectors: energy, petroleum, precious metals, industrial metals, grains, livestock, softs, and agriculture. |
(b) | | Exempt from registration under Rule 144A of the Securities Act of 1933. Under procedures approved by the Board of Trustees, such securities have been determined to be liquid by the Investment Adviser and may be resold, normally to qualified institutional buyers in transactions exempt from registration. Total market value of Rule 144A securities amounts to $8,823,600, which represents approximately 8.6% of net assets as of June 30, 2014. |
(c) | | These Structured Notes take into consideration a leverage factor of 300% on the return of the underlying linked index. |
(d) | | Interest rate disclosed is contingent upon LIBOR as of June 30, 2014 minus a spread. |
(e) | | Variable rate security. Interest rate or distribution rate disclosed is that which is in effect at June 30, 2014. |
(f) | | Represents an affiliated issuer. |
| | |
|
Investment Abbreviation: |
LIBOR | | —London Interbank Offered Rate |
| | |
Currency Abbreviations: |
BRL | | —Brazilian Real |
CAD | | —Canadian Dollar |
CHF | | —Swiss Franc |
CLP | | —Chilean Peso |
COP | | —Colombian Peso |
CZK | | —Czech Koruna |
EUR | | —Euro |
GBP | | —British Pound |
HUF | | —Hungarian Forint |
IDR | | —Indonesian Rupiah |
INR | | —Indian Rupee |
JPY | | —Japanese Yen |
KRW | | —South Korean Won |
MXN | | —Mexican Peso |
MYR | | —Malaysian Ringgit |
PLN | | —Polish Zloty |
RUB | | —Russian Ruble |
SEK | | —Swedish Krona |
TRY | | —Turkish Lira |
USD | | —United States Dollar |
ZAR | | —South African Rand |
|
| | |
| 62 | | The accompanying notes are an integral part of these financial statements. |
GOLDMAN SACHS MANAGED FUTURES STRATEGY FUND
|
| ADDITIONAL INVESTMENT INFORMATION |
FORWARD FOREIGN CURRENCY EXCHANGE CONTRACTS — At June 30, 2014, the Fund had the following forward foreign currency exchange contracts:
FORWARD FOREIGN CURRENCY EXCHANGE CONTRACTS WITH UNREALIZED GAIN
| | | | | | | | | | | | | | |
| Counterparty | | Contracts to
Buy/Sell | | Settlement
Date | | | Current
Value | | | Unrealized
Gain | |
Morgan Stanley Co., Inc. | | BRL/USD | | | 08/04/14 | | | $ | 2,965,742 | | | $ | 19,853 | |
| | BRL/USD | | | 07/02/14 | | | | 2,996,153 | | | | 70,574 | |
| | CAD/USD | | | 09/17/14 | | | | 1,871 | | | | 46 | |
| | CLP/USD | | | 09/17/14 | | | | 1,596,192 | | | | 2,638 | |
| | COP/USD | | | 09/17/14 | | | | 5,885,200 | | | | 79,844 | |
| | EUR/USD | | | 09/17/14 | | | | 99,988 | | | | 430 | |
| | GBP/USD | | | 09/17/14 | | | | 944,084 | | | | 9,651 | |
| | IDR/USD | | | 09/17/14 | | | | 6,109,518 | | | | 39,924 | |
| | KRW/USD | | | 09/17/14 | | | | 3,014,969 | | | | 39,328 | |
| | MXN/USD | | | 09/17/14 | | | | 2,951,733 | | | | 2,559 | |
| | MYR/USD | | | 09/17/14 | | | | 4,414,800 | | | | 41,165 | |
| | PLN/USD | | | 09/17/14 | | | | 4,669,417 | | | | 3,405 | |
| | RUB/USD | | | 09/17/14 | | | | 2,155,304 | | | | 35,213 | |
| | TRY/USD | | | 09/17/14 | | | | 2,252,890 | | | | 8,975 | |
| | USD/HUF | | | 09/17/14 | | | | 2,556,908 | | | | 13,793 | |
| | USD/IDR | | | 09/17/14 | | | | 2,521,865 | | | | 18,244 | |
| | USD/SEK | | | 09/17/14 | | | | 91,074 | | | | 649 | |
| | USD/ZAR | | | 09/17/14 | | | | 922,521 | | | | 31 | |
| | | ZAR/USD | | | 09/17/14 | | | | 1,767,083 | | | | 26,394 | |
| TOTAL | | | | | | | | | | | | $ | 412,716 | |
FORWARD FOREIGN CURRENCY EXCHANGE CONTRACTS WITH UNREALIZED LOSS
| | | | | | | | | | | | | | |
| Counterparty | | Contracts to
Buy/Sell | | Settlement
Date | | | Current
Value | | | Unrealized
Loss | |
Morgan Stanley Co., Inc. | | HUF/USD | | | 09/17/14 | | | $ | 2,927,219 | | | $ | (22,385 | ) |
| | INR/USD | | | 09/17/14 | | | | 6,344,642 | | | | (47,145 | ) |
| | RUB/USD | | | 09/17/14 | | | | 882,373 | | | | (5,934 | ) |
| | SEK/USD | | | 09/17/14 | | | | 2,602 | | | | (19 | ) |
| | USD/CHF | | | 09/17/14 | | | | 51,906 | | | | (403 | ) |
| | USD/CLP | | | 09/17/14 | | | | 3,443,470 | | | | (9,994 | ) |
| | USD/CZK | | | 09/17/14 | | | | 8,148,929 | | | | (51,705 | ) |
| | USD/EUR | | | 09/17/14 | | | | 45,201 | | | | (182 | ) |
| | USD/GBP | | | 09/17/14 | | | | 2,080,148 | | | | (28,680 | ) |
| | USD/IDR | | | 09/17/14 | | | | 1,966,454 | | | | (31,288 | ) |
| | USD/JPY | | | 09/17/14 | | | | 132,329 | | | | (1,643 | ) |
| | USD/RUB | | | 09/17/14 | | | | 303,767 | | | | (11,288 | ) |
| | | USD/ZAR | | | 09/17/14 | | | | 1,767,082 | | | | (17,614 | ) |
| TOTAL | | | | | | | | | | | | $ | (228,280 | ) |
| | |
| The accompanying notes are an integral part of these financial statements. | | 63 |
GOLDMAN SACHS MANAGED FUTURES STRATEGY FUND
Schedule of Investments (continued)
June 30, 2014 (Unaudited)
|
| ADDITIONAL INVESTMENT INFORMATION (continued) |
FUTURES CONTRACTS — At June 30, 2014, the Fund had the following futures contracts:
| | | | | | | | | | | | | | |
| Type | | Number of
Contracts
Long (Short) | | | Expiration Date | | Current Value | | | Unrealized
Gain (Loss) | |
Amsterdam Index | | | 37 | | | July 2014 | | $ | 4,187,388 | | | $ | (15,656 | ) |
BIST 30 Index | | | 215 | | | August 2014 | | | 993,256 | | | | 3,375 | |
CAC 40 Index | | | 70 | | | July 2014 | | | 4,238,531 | | | | (83,436 | ) |
DAX Index | | | 10 | | | September 2014 | | | 3,375,153 | | | | (38,899 | ) |
DJIA Mini-e-CBOT | | | 36 | | | September 2014 | | | 3,013,200 | | | | 11,097 | |
FTSE 100 Index | | | 46 | | | September 2014 | | | 5,283,194 | | | | (1,755 | ) |
FTSE/JSE Top 40 Index | | | 69 | | | September 2014 | | | 2,989,027 | | | | 2,618 | |
FTSE/MIB Index | | | 12 | | | September 2014 | | | 1,750,212 | | | | (62,477 | ) |
Hang Seng Index | | | 21 | | | July 2014 | | | 3,130,058 | | | | 43,567 | |
IBEX 35 Index | | | 21 | | | July 2014 | | | 3,121,532 | | | | (35,454 | ) |
KOSPI 200 Index | | | (6 | ) | | September 2014 | | | (772,682 | ) | | | 409 | |
MSCI Taiwan Index | | | 112 | | | July 2014 | | | 3,722,880 | | | | 66,388 | |
NASDAQ 100 E-mini Index | | | 41 | | | September 2014 | | | 3,149,210 | | | | 62,248 | |
Nikkei 225 Index | | | 16 | | | September 2014 | | | 2,394,354 | | | | (20,584 | ) |
OMX Stockholm 30 Index | | | 197 | | | July 2014 | | | 4,067,342 | | | | (23,220 | ) |
Russell 2000 Mini Index | | | 24 | | | September 2014 | | | 2,856,720 | | | | 70,644 | |
S&P 500 E-mini Index | | | 258 | | | September 2014 | | | 25,185,960 | | | | 47,961 | |
S&P/TSX 60 Index | | | 19 | | | September 2014 | | | 3,075,826 | | | | 35,388 | |
SET50 Index | | | 541 | | | September 2014 | | | 3,303,842 | | | | 24,632 | |
SGX S&P CNX Nifty Index | | | 195 | | | July 2014 | | | 2,974,335 | | | | 32,240 | |
SPI 200 Index | | | 36 | | | September 2014 | | | 4,543,699 | | | | 2,445 | |
| TOTAL | | | | | | | | | | | | $ | 121,531 | |
SWAP CONTRACTS — At June 30, 2014, the Fund had the following swap contracts:
CENTRALLY CLEARED INTEREST RATE SWAP CONTRACTS
| | | | | | | | | | | | | | | | |
| | | | | | Rates Exchanged | | Market Value | |
Notional Amount
(000’s)(a) | | | Termination Date | | Payments Received | | Payments
Made | | Upfront
Payments Made (Received) | | | Unrealized
Gain (Loss) | |
| | GBP 37,580 | | | 09/17/24 | | 6 Month LIBOR | | 3.000% | | $ | 177,712 | | | $ | (1,043,512 | ) |
| | $ 20,440 | | | 09/17/24 | | 3 Month LIBOR | | 3.000 | | | (561,942 | ) | | | (4,526 | ) |
| | GBP 27,900 | | | 09/17/44 | | 3.500% | | 6 Month LIBOR | | | 659,048 | | | | 1,453,082 | |
| | $ 9,520 | | | 09/17/44 | | 3.500 | | 3 Month LIBOR | | | (141,218 | ) | | | 444,500 | |
| | TOTAL | | | | | | | | | $ | 133,600 | | | $ | 849,544 | |
| | (a) | | Represents forward starting interest rate swaps whose effective dates of commencement of accruals and cash flows occur subsequent to June 30, 2014. |
| | |
| 64 | | The accompanying notes are an integral part of these financial statements. |
GOLDMAN SACHS INTERNATIONAL REAL ESTATE SECURITIES FUND
Schedule of Investments
June 30, 2014 (Unaudited)
| | | | | | | | |
Shares | | | Description | | Value | |
| | Common Stocks – 100.0% | |
| | Australia – 13.3% | |
| | 588,818 | | | Charter Hall Group (REIT) (Diversified) | | $ | 2,366,502 | |
| | 2,462,460 | | | GPT Group (REIT) (Diversified) | | | 8,917,978 | |
| | 7,572,280 | | | Mirvac Group (REIT) (Diversified) | | | 12,742,775 | |
| | 3,224,323 | | | Scentre Group (REIT) (Retail)* | | | 9,729,201 | |
| | 2,791,701 | | | Stockland (REIT) (Diversified) | | | 10,210,539 | |
| | 1,656,521 | | | Westfield Corp. Trust (REIT) (Retail) | | | 11,168,418 | |
| | | | | | | | |
| | | | | | | 55,135,413 | |
| | |
| | Canada – 7.1% | |
| | 97,800 | | | Allied Properties Real Estate Investment Trust (REIT) (Office) | | | 3,239,989 | |
| | 119,000 | | | Artis Real Estate Investment Trust (REIT) (Retail) | | | 1,756,478 | |
| | 132,100 | | | Calloway Real Estate Investment Trust (REIT) (Retail) | | | 3,288,108 | |
| | 88,900 | | | Canadian Apartment Properties Real Estate Investment Trust (REIT) (Residential) | | | 1,904,554 | |
| | 60,600 | | | Canadian Real Estate Investment Trust (REIT) (Diversified) | | | 2,611,868 | |
| | 109,400 | | | Dream Office Real Estate Investment Trust (REIT) (Office) | | | 3,002,977 | |
| | 45,700 | | | Granite Real Estate Investment Trust (REIT) (Industrial) | | | 1,691,720 | |
| | 220,400 | | | H&R Real Estate Investment Trust (REIT) (Diversified) | | | 4,783,716 | |
| | 275,300 | | | RioCan Real Estate Investment Trust (REIT) (Retail) | | | 7,046,008 | |
| | | | | | | | |
| | | | | | | 29,325,418 | |
| | |
| | China – 3.4% | |
| | 7,596,000 | | | Fu Shou Yuan International Group Ltd. (Diversified)* | | | 4,143,831 | |
| | 5,451,500 | | | Shimao Property Holdings Ltd. (Diversified)* | | | 10,015,332 | |
| | | | | | | | |
| | | | | | | 14,159,163 | |
| | |
| | Finland – 0.6% | |
| | 713,587 | | | Citycon Oyj (Retail) | | | 2,618,053 | |
| | |
| | France – 8.5% | |
| | 251,754 | | | Klepierre (REIT) (Retail) | | | 12,827,751 | |
| | 76,288 | | | Unibail-Rodamco SE (REIT) (Diversified) | | | 22,200,603 | |
| | | | | | | | |
| | | | | | | 35,028,354 | |
| | |
| | Germany – 2.3% | |
| | 445,995 | | | Deutsche Wohnen AG (Residential) | | | 9,607,013 | |
| | |
| | Hong Kong – 11.4% | |
| | 4,863,000 | | | Fortune Real Estate Investment Trust (REIT) (Retail) | | | 4,268,385 | |
| | 721,050 | | | Henderson Land Development Co. Ltd. (Diversified) | | | 4,220,007 | |
| | |
| | Common Stocks – (continued) | |
| | Hong Kong – (continued) | |
| | 2,358,500 | | | Kerry Logistics Network Ltd. (Industrial) | | $ | 3,724,585 | |
| | 2,933,000 | | | Kerry Properties Ltd. (Diversified) | | | 10,251,978 | |
| | 1,182,475 | | | Sun Hung Kai Properties Ltd. (Diversified) | | | 16,225,932 | |
| | 1,614,624 | | | The Link Real Estate Investment Trust (REIT) (Retail) | | | 8,692,767 | |
| | | | | | | | |
| | | | | | | 47,383,654 | |
| | |
| | India – 2.7% | |
| | 8,774,000 | | | Ascendas India Trust (Office) | | | 5,886,222 | |
| | 619,896 | | | Sobha Developers Ltd. (Diversified)* | | | 5,133,384 | |
| | | | | | | | |
| | | | | | | 11,019,606 | |
| | |
| | Indonesia – 0.9% | |
| | 39,051,200 | | | PT Summarecon Agung Tbk (Diversified)* | | | 3,739,799 | |
| | |
| | Japan – 25.3% | |
| | 3,144 | | | Advance Residence Investment Corp. (REIT) (Residential) | | | 7,949,033 | |
| | 1,378,000 | | | Mitsubishi Estate Co. Ltd. (Diversified) | | | 34,044,196 | |
| | 603,000 | | | Mitsui Fudosan Co. Ltd. (Office) | | | 20,350,810 | |
| | 910 | | | Nippon Building Fund, Inc. (REIT) (Office) | | | 5,320,676 | |
| | 2,413 | | | Nippon Prologis Real Estate Investment Trust, Inc. (REIT) (Industrial) | | | 5,627,451 | |
| | 2,211 | | | Nomura Real Estate Office Fund, Inc. (REIT) (Office) | | | 10,444,397 | |
| | 3,879 | | | Orix JREIT, Inc. (REIT) (Office) | | | 5,440,921 | |
| | 1,397,900 | | | Tokyu Fudosan Holdings Corp. (Residential) | | | 11,033,656 | |
| | 1,032 | | | Top Real Estate Investment Trust, Inc. (REIT) (Diversified) | | | 4,616,050 | |
| | | | | | | | |
| | | | | | | 104,827,190 | |
| | |
| | Malaysia – 0.5% | |
| | 3,185,400 | | | UEM Sunrise Bhd (Diversified) | | | 2,014,773 | |
| | |
| | Netherlands – 1.7% | |
| | 137,498 | | | Corio NV (REIT) (Retail) | | | 7,017,809 | |
| | |
| | Singapore – 4.7% | |
| | 1,282,000 | | | Cache Logistics Trust (REIT) (Industrial) | | | 1,229,403 | |
| | 3,218,000 | | | Global Logistic Properties Ltd. (Industrial) | | | 6,974,182 | |
| | 8,097,000 | | | Keppel Real Estate Investment Trust (REIT) (Office) | | | 8,320,383 | |
| | 2,086,000 | | | Keppel Telecommunications & Transportation Ltd. (Other) | | | 2,986,763 | |
| | | | | | | | |
| | | | | | | 19,510,731 | |
| | |
| | |
| The accompanying notes are an integral part of these financial statements. | | 65 |
GOLDMAN SACHS INTERNATIONAL REAL ESTATE SECURITIES FUND
Schedule of Investments (continued)
June 30, 2014 (Unaudited)
| | | | | | | | |
Shares | | | Description | | Value | |
| | Common Stocks – (continued) | |
| | Spain – 1.0% | |
| | 303,340 | | | Merlin Properties Socimi SA (REIT) (Diversified)* | | $ | 4,008,257 | |
| | |
| | Sweden – 1.9% | |
| | 313,234 | | | Fabege AB (Diversified) | | | 4,431,881 | |
| | 239,041 | | | Hufvudstaden AB Class A (Diversified) | | | 3,353,413 | |
| | | | | | | | |
| | | | | | | 7,785,294 | |
| | |
| | Switzerland – 1.7% | |
| | 72,964 | | | PSP Swiss Property AG (Registered) (Office)* | | | 6,861,764 | |
| | |
| | United Kingdom – 13.0% | |
| | 554,867 | | | Big Yellow Group PLC (REIT) (Industrial) | | | 4,709,250 | |
| | 1,001,370 | | | British Land Co. PLC (REIT) (Diversified) | | | 12,032,086 | |
| | 884,778 | | | Capital & Counties Properties PLC (Retail) | | | 4,929,608 | |
| | 158,445 | | | Derwent London PLC (REIT) (Office) | | | 7,257,077 | |
| | 1,208,318 | | | Hammerson PLC (REIT) (Retail) | | | 11,989,871 | |
| | 326,970 | | | Helical Bar PLC (Diversified) | | | 1,961,213 | |
| | 245,790 | | | Kennedy Wilson Europe Real Estate PLC (Other)* | | | 4,627,095 | |
| | 1,505,969 | | | Quintain Estates & Development PLC (Diversified)* | | | 2,280,924 | |
| | 607,958 | | | Unite Group PLC (Residential) | | | 4,098,756 | |
| | | | | | | | |
| | | | | | | 53,885,880 | |
| | |
| | TOTAL COMMON STOCKS | | | | |
| | (Cost $356,594,962) | | $ | 413,928,171 | |
| | |
| | | | | | | | | | |
| Units | | Description | | Expiration
Month | | | Value | |
| Right – 0.0% | |
| Finland – 0.0% | |
| 713,587 | | Citycon Oyj (Retail)* | | | 07/14 | | | $ | 4,100 | |
| (Cost $0) | | | | | | | | |
| |
| TOTAL INVESTMENTS – 100.0% | | | | | |
| (Cost $356,594,962) | | | $ | 413,932,271 | |
| |
| OTHER ASSETS IN EXCESS OF LIABILITIES – 0.0% | | | | 90,450 | |
| |
| NET ASSETS – 100.0% | | | $ | 414,022,721 | |
| |
| | |
| The percentage shown for each investment category reflects the value of investments in that category as a percentage of net assets. |
* | | Non-income producing security. |
| | |
|
Investment Abbreviation: |
REIT | | —Real Estate Investment Trust |
|
| | |
| 66 | | The accompanying notes are an integral part of these financial statements. |
GOLDMAN SACHS REAL ESTATE SECURITIES FUND
Schedule of Investments
June 30, 2014 (Unaudited)
| | | | | | | | |
Shares | | | Description | | Value | |
| | | | | | | | |
| | Common Stocks – 96.7% | |
| | Commercial – 26.4% | |
| | 251,264 | | | Boston Properties, Inc. (REIT) | | $ | 29,694,380 | |
| | 391,446 | | | Corporate Office Properties Trust (REIT) | | | 10,886,113 | |
| | 1,296,601 | | | DCT Industrial Trust, Inc. (REIT) | | | 10,645,094 | |
| | 505,504 | | | Douglas Emmett, Inc. (REIT) | | | 14,265,323 | |
| | 330,747 | | | Highwoods Properties, Inc. (REIT) | | | 13,874,837 | |
| | 119,632 | | | Mack-Cali Realty Corp. (REIT) | | | 2,569,695 | |
| | 567,079 | | | Parkway Properties, Inc. (REIT) | | | 11,710,181 | |
| | 636,278 | | | Prologis, Inc. (REIT) | | | 26,144,663 | |
| | 115,220 | | | PS Business Parks, Inc. (REIT) | | | 9,619,718 | |
| | 50,250 | | | SL Green Realty Corp. (REIT) | | | 5,497,853 | |
| | 368,279 | | | Terreno Realty Corp. (REIT) | | | 7,118,833 | |
| | 125,718 | | | Vornado Realty Trust (REIT) | | | 13,417,882 | |
| | | | | | | | |
| | | | | | | 155,444,572 | |
| | |
| | Health Care – 9.9% | |
| | 179,743 | | | Brookdale Senior Living, Inc.* | | | 5,992,631 | |
| | 218,739 | | | HCP, Inc. (REIT) | | | 9,051,420 | |
| | 134,292 | | | Health Care REIT, Inc. (REIT) | | | 8,416,080 | |
| | 185,312 | | | National Health Investors, Inc. (REIT) | | | 11,593,119 | |
| | 361,214 | | | Ventas, Inc. (REIT) | | | 23,153,817 | |
| | | | | | | | |
| | | | | | | 58,207,067 | |
| | |
| | Leisure – 11.5% | |
| | 550,993 | | | Chesapeake Lodging Trust (REIT) | | | 16,656,518 | |
| | 194,108 | | | Hyatt Hotels Corp. Class A* | | | 11,836,706 | |
| | 273,277 | | | Pebblebrook Hotel Trust (REIT) | | | 10,100,318 | |
| | 545,028 | | | RLJ Lodging Trust (REIT) | | | 15,745,859 | |
| | 1,134,048 | | | Strategic Hotels & Resorts, Inc. (REIT)* | | | 13,279,702 | |
| | | | | | | | |
| | | | | | | 67,619,103 | |
| | |
| | Multifamily – 16.7% | |
| | 267,412 | | | American Campus Communities, Inc. (REIT) | | | 10,225,835 | |
| | 223,866 | | | AvalonBay Communities, Inc. (REIT) | | | 31,831,507 | |
| | 195,043 | | | Camden Property Trust (REIT) | | | 13,877,309 | |
| | 227,535 | | | Equity Residential (REIT) | | | 14,334,705 | |
| | 73,206 | | | Essex Property Trust, Inc. (REIT) | | | 13,536,522 | |
| | 281,487 | | | Post Properties, Inc. (REIT) | | | 15,048,295 | |
| | | | | | | | |
| | | | | | | 98,854,173 | |
| | |
| | Other – 2.8% | |
| | 115,527 | | | American Tower Corp. (REIT) | | | 10,395,120 | |
| | 320,536 | | | Kennedy Wilson Europe Real Estate PLC* | | | 6,034,218 | |
| | | | | | | | |
| | | | | | | 16,429,338 | |
| | |
| | Retail – 24.8% | |
| | 429,268 | | | Acadia Realty Trust (REIT) | | | 12,058,138 | |
| | 658,367 | | | Brixmor Property Group, Inc. (REIT) | | | 15,109,523 | |
| | 656,217 | | | CBL & Associates Properties, Inc. (REIT) | | | 12,468,123 | |
| | 1,008,516 | | | DDR Corp. (REIT) | | | 17,780,137 | |
| | |
| | | | | | | | |
| | Common Stocks – (continued) | |
| | Retail – (continued) | |
| | 405,224 | | | Simon Property Group, Inc. (REIT) | | $ | 67,380,647 | |
| | 191,763 | | | Taubman Centers, Inc. (REIT) | | | 14,537,553 | |
| | 377,917 | | | Washington Prime Group, Inc. (REIT)* | | | 7,082,164 | |
| | | | | | | | |
| | | | | | | 146,416,285 | |
| | |
| | Self Storage – 4.6% | |
| | 624,550 | | | CubeSmart (REIT) | | | 11,441,756 | |
| | 91,483 | | | Public Storage (REIT) | | | 15,675,612 | |
| | | | | | | | |
| | | | | | | 27,117,368 | |
| | |
| | TOTAL INVESTMENTS – 96.7% | |
| | (Cost $426,326,655) | | $ | 570,087,906 | |
| | |
| OTHER ASSETS IN EXCESS OF
LIABILITIES – 3.3% | | | 19,321,327 | |
| | |
| | NET ASSETS – 100.0% | | $ | 589,409,233 | |
| | |
| | |
| The percentage shown for each investment category reflects the value of investments in that category as a percentage of net assets. |
* | | Non-income producing security. |
| | |
|
Investment Abbreviation: |
REIT | | —Real Estate Investment Trust |
|
| | |
| The accompanying notes are an integral part of these financial statements. | | 67 |
GOLDMAN SACHS SELECT SATELLITE FUNDS
Statements of Assets and Liabilities
June 30, 2014 (Unaudited)
| | | | | | | | | | |
| | | | |
Absolute Return
Tracker Fund(a) | | | Commodity
Strategy Fund(a) | |
| | Assets: | | | | | | | | |
| | Investments in unaffiliated issuers, at value (cost $43,522,442, $321,505,414, $318,660,931, $—, $8,235,000, $356,594,962 and $426,326,655) | | $ | 48,888,205 | | | $ | 325,379,240 | |
| | Investments in affiliated issuers, at value (cost $1,635,133,763, $776,026,076, $429,893,629, $31,726,306, $77,340,523, $0 and $0) | | | 1,635,133,763 | | | | 776,026,076 | |
| | Cash | | | 157,758,326 | | | | 268,562,285 | |
| | Foreign currencies, at value (cost $169,272, $5,255,716, $1,130,314 and $238,999 for Absolute Return Tracker, Dynamic Allocation, Managed Futures Strategy and International Real Estate Securities Funds) | | | 170,373 | | | | — | |
| | Receivables: | | | | | | | | |
| | Collateral on certain derivative contracts(b) | | | 100,023,454 | | | | 51,257,796 | |
| | Fund shares sold | | | 3,928,917 | | | | 5,099,444 | |
| | Variation margin on certain derivative contracts | | | 2,409,485 | | | | — | |
| | Unrealized gain on forward foreign currency exchange contracts | | | 827,012 | | | | — | |
| | Reimbursement from investment adviser | | | 446,921 | | | | 154,508 | |
| | Unrealized gain on swap contracts | | | 16,313 | | | | 34,971,426 | |
| | Dividends | | | 8,290 | | | | 1,917,807 | |
| | Investments sold | | | 888 | | | | — | |
| | Investments sold on an extended-settlement basis | | | — | | | | 26,412,956 | |
| | Due from broker | | | — | | | | — | |
| | Foreign tax reclaims | | | — | | | | — | |
| | Deferred offering costs | | | — | | | | — | |
| | Other assets | | | 20,022 | | | | 25,873 | |
| | Total assets | | | 1,949,631,969 | | | | 1,489,807,411 | |
| | | | | | | | | | |
| | Liabilities: | | | | | | | | |
| | Payables: | | | | | | | | |
| | Fund shares redeemed | | | 4,553,440 | | | | 1,161,415 | |
| | Written options, at value (premiums received $4,842,111 for the Absolute Return Tracker Fund) | | | 1,970,550 | | | | — | |
| | Amounts owed to affiliates | | | 1,233,215 | | | | 703,481 | |
| | Unrealized loss on forward foreign currency exchange contracts | | | 337,420 | | | | — | |
| | Variation margin on certain derivative contracts | | | 219,424 | | | | 212,108 | |
| | Investments purchased | | | 206,652 | | | | — | |
| | Unrealized loss on swap contracts | | | 7,064 | | | | — | |
| | Investments purchased on an extended-settlement basis | | | — | | | | 22,245,313 | |
| | Foreign capital gains taxes | | | — | | | | — | |
| | Accrued expenses and other liabilities | | | 253,149 | | | | 305,407 | |
| | Total liabilities | | | 8,780,914 | | | | 24,627,724 | |
| | | | | | | | | | |
| | Net Assets: | | | | | | | | |
| | Paid-in capital | | | 1,858,338,774 | | | | 1,456,773,421 | |
| | Undistributed (distributions in excess of) net investment income (loss) | | | (5,618,285 | ) | | | (3,702,645 | ) |
| | Accumulated net realized gain (loss) | | | 69,694,188 | | | | (25,791,650 | ) |
| | Net unrealized gain | | | 18,436,378 | | | | 37,900,561 | |
| | | NET ASSETS | | $ | 1,940,851,055 | | | $ | 1,465,179,687 | |
| | | Net Assets: | | | | |
| | | Class A | | $ | 101,030,649 | | | $ | 165,317,975 | |
| | | Class B | | | — | | | | — | |
| | | Class C | | | 29,681,067 | | | | 12,832,439 | |
| | | Institutional | | | 1,786,577,042 | | | | 1,271,034,986 | |
| | | Service | | | — | | | | — | |
| | | Class IR | | | 21,582,577 | | | | 14,243,493 | |
| | | Class R | | | 1,979,720 | | | | 1,750,794 | |
| | | Total Net Assets | | $ | 1,940,851,055 | | | $ | 1,465,179,687 | |
| | | Shares outstanding $0.001 par value (unlimited shares authorized): | | | | |
| | | Class A | | | 10,877,477 | | | | 27,880,088 | |
| | | Class B | | | — | | | | — | |
| | | Class C | | | 3,353,115 | | | | 2,240,502 | |
| | | Institutional | | | 187,764,034 | | | | 212,676,849 | |
| | | Service | | | — | | | | — | |
| | | Class IR | | | 2,289,415 | | | | 2,380,742 | |
| | | Class R | | | 216,555 | | | | 298,673 | |
| | | Net asset value, offering and redemption price per share:(c) | | | | |
| | | Class A | | | $9.29 | | | | $5.93 | |
| | | Class B | | | — | | | | — | |
| | | Class C | | | 8.85 | | | | 5.73 | |
| | | Institutional | | | 9.52 | | | | 5.98 | |
| | | Service | | | — | | | | — | |
| | | Class IR | | | 9.43 | | | | 5.98 | |
| | | Class R | | | 9.14 | | | | 5.86 | |
| | (a) | | Statements of Assets and Liabilities for Absolute Return Tracker, Commodity Strategy and Dynamic Commodity Strategy Funds are consolidated and include the balances of Goldman Sachs Cayman Commodity-ART Fund, Ltd., Goldman Sachs Cayman Commodity Fund, Ltd. and Goldman Sachs DCS Cayman Commodity Fund, Ltd. (wholly-owned subsidiaries), respectively. Accordingly, all interfund balances and transactions have been eliminated. |
| | (b) | | Segregated for initial margin on transactions as follows: |
| | | | | | | | | | | | | | | | |
Fund | | Forwards | | | Futures | | | Options | | | Swaps | |
Absolute Return Tracker | | $ | — | | | $ | 44,489,968 | | | $ | 46,000,000 | | | $ | 9,533,486 | |
Commodity Strategy | | | — | | | | — | | | | — | | | | 51,257,796 | |
Dynamic Allocation | | | 190,000 | | | | 1,710,000 | | | | — | | | | 32,597,040 | |
Dynamic Commodity Strategy | | | — | | | | — | | | | — | | | | 2,640,000 | |
Managed Futures Strategy | | | — | | | | 4,576,419 | | | | — | | | | 2,472,262 | |
| | (c) | | Maximum public offering price per share for Class A shares of the Absolute Return Tracker, Commodity Strategy, Dynamic Allocation, Dynamic Commodity Strategy, Managed Futures Strategy, International Real Estate Securities and Real Estate Securities Funds is $9.83, $6.21, $11.95, $10.58, $10.22, $7.20 and $19.10, respectively. At redemption, Class B and Class C Shares may be subject to a contingent deferred sales charge assessed on the amount equal to the lesser of the current NAV or the original purchase price of the shares. |
| | |
| 68 | | The accompanying notes are an integral part of these financial statements. |
GOLDMAN SACHS SELECT SATELLITE FUNDS
| | | | | | | | | | | | | | | | | | | | | | | | | | | | |
| | | Dynamic Allocation
Fund | | | | | Dynamic
Commodity
Strategy Fund(a) | | | | | Managed Futures
Strategy Fund | | | | | International Real
Estate Securities
Fund | | | | | Real Estate
Securities Fund | |
| | | | | | | | | | | | | | | | | | | | | | | | | | | | |
| | $ | 346,886,708 | | | | | $ | — | | | | | $ | 8,823,600 | | | | | $ | 413,932,271 | | | | | $ | 570,087,906 | |
| | | 429,893,629 | | | | | | 31,726,306 | | | | | | 77,340,523 | | | | | | — | | | | | | — | |
| | | 44,244,267 | | | | | | 4,464,692 | | | | | | 4,950,291 | | | | | | 1,269,439 | | | | | | 22,620,898 | |
| | | 5,289,438 | | | | | | — | | | | | | 1,140,021 | | | | | | 239,253 | | | | | | — | |
| | | | | | | | | | | | | | | | | | | | | | | | | | | | |
| | | 34,497,040 | | | | | | 2,640,000 | | | | | | 7,048,681 | | | | | | — | | | | | | — | |
| | | 1,052,357 | | | | | | — | | | | | | 3,900,834 | | | | | | 151,626 | | | | | | 466,187 | |
| | | 934,141 | | | | | | — | | | | | | 11,706 | | | | | | — | | | | | | — | |
| | | 438 | | | | | | — | | | | | | 412,716 | | | | | | — | | | | | | — | |
| | | 95,153 | | | | | | 53,372 | | | | | | 128,917 | | | | | | 102,456 | | | | | | 100,294 | |
| | | 4,850,083 | | | | | | 1,030,742 | | | | | | — | | | | | | — | | | | | | — | |
| | | 360,632 | | | | | | 158 | | | | | | 397 | | | | | | 2,018,612 | | | | | | 2,165,389 | |
| | | 41,061,539 | | | | | | — | | | | | | — | | | | | | 2,676,657 | | | | | | — | |
| | | — | | | | | | — | | | | | | 1,356,138 | | | | | | — | | | | | | — | |
| | | — | | | | | | 25,259 | | | | | | — | | | | | | — | | | | | | — | |
| | | — | | | | | | — | | | | | | — | | | | | | 35,369 | | | | | | — | |
| | | — | | | | | | 197,677 | | | | | | 1,419 | | | | | | — | | | | | | — | |
| | | 13,133 | | | | | | — | | | | | | 1,037 | | | | | | 3,616 | | | | | | 4,392 | |
| | | 909,178,558 | | | | | | 40,138,206 | | | | | | 105,116,280 | | | | | | 420,429,299 | | | | | | 595,445,066 | |
| | | | | | | | | | | | | | | | | | | | | | | | | | | | |
| | | | | | | | | | | | | | | | | | | | | | | | | | | | |
| | | | | | | | | | | | | | | | | | | | | | | | | | | | |
| | | 997,854 | | | | | | — | | | | | | 66,984 | | | | | | 1,502,787 | | | | | | 3,367,404 | |
| | | — | | | | | | — | | | | | | — | | | | | | — | | | | | | — | |
| | | 678,625 | | | | | | 24,477 | | | | | | 79,021 | | | | | | 367,212 | | | | | | 518,696 | |
| | | 548,376 | | | | | | — | | | | | | 228,280 | | | | | | — | | | | | | — | |
| | | 84,839 | | | | | | — | | | | | | 980,348 | | | | | | — | | | | | | — | |
| | | 30,574,522 | | | | | | — | | | | | | 23,544 | | | | | | 4,154,694 | | | | | | 2,027,588 | |
| | | — | | | | | | 329,870 | | | | | | — | | | | | | — | | | | | | — | |
| | | — | | | | | | — | | | | | | 1,690,000 | | | | | | — | | | | | | — | |
| | | — | | | | | | — | | | | | | — | | | | | | 250,524 | | | | | | — | |
| | | 183,198 | | | | | | 358,510 | | | | | | 94,810 | | | | | | 131,361 | | | | | | 122,145 | |
| | | 33,067,414 | | | | | | 712,857 | | | | | | 3,162,987 | | | | | | 6,406,578 | | | | | | 6,035,833 | |
| | | | | | | | | | | | | | | | | | | | | | | | | | | | |
| | | | | | | | | | | | | | | | | | | | | | | | | | | | |
| | | 796,681,440 | | | | | | 39,000,005 | | | | | | 102,595,971 | | | | | | 961,965,614 | | | | | | 489,898,732 | |
| | | (1,878,218 | ) | | | | | (49,893 | ) | | | | | (779,079 | ) | | | | | (20,822,024 | ) | | | | | (669,758 | ) |
| | | 45,988,058 | | | | | | (225,635 | ) | | | | | (1,581,396 | ) | | | | | (584,218,477 | ) | | | | | (43,580,992 | ) |
| | | 35,319,864 | | | | | | 700,872 | | | | | | 1,717,797 | | | | | | 57,097,608 | | | | | | 143,761,251 | |
| | | $ | 876,111,144 | | | | | $ | 39,425,349 | | | | | $ | 101,953,293 | | | | | $ | 414,022,721 | | | | | $ | 589,409,233 | |
| | | | | | | | | | | | | | | | | | | | | | | | | | | | | |
| | | | $103,958,567 | | | | | $ | 10,109 | | | | | $ | 2,888,479 | | | | | $ | 12,094,471 | | | | | $ | 68,039,973 | |
| | | | — | | | | | | — | | | | | | — | | | | | | — | | | | | | 747,555 | |
| | | | 50,496,902 | | | | | | 10,090 | | | | | | 1,426,962 | | | | | | 2,196,446 | | | | | | 14,185,125 | |
| | | | 687,941,417 | | | | | | 39,354,634 | | | | | | 97,218,894 | | | | | | 398,815,068 | | | | | | 497,525,626 | |
| | | | — | | | | | | — | | | | | | — | | | | | | — | | | | | | 3,653,345 | |
| | | | 33,702,010 | | | | | | 25,269 | | | | | | 340,215 | | | | | | 916,736 | | | | | | 4,009,720 | |
| | | | 12,248 | | | | | | 25,247 | | | | | | 78,743 | | | | | | — | | | | | | 1,247,889 | |
| | | | $876,111,144 | | | | | $ | 39,425,349 | | | | | $ | 101,953,293 | | | | | $ | 414,022,721 | | | | | $ | 589,409,233 | |
| | | | | | | | | | | | | | | | | | | | | | | | | | | | | |
| | | | 9,207,911 | | | | | | 1,001 | | | | | | 299,100 | | | | | | 1,777,442 | | | | | | 3,769,825 | |
| | | | — | | | | | | — | | | | | | — | | | | | | — | | | | | | 41,674 | |
| | | | 4,615,954 | | | | | | 1,000 | | | | | | 150,515 | | | | | | 322,949 | | | | | | 805,059 | |
| | | | 60,102,963 | | | | | | 3,893,000 | | | | | | 9,980,846 | | | | | | 60,312,233 | | | | | | 27,109,846 | |
| | | | — | | | | | | — | | | | | | — | | | | | | — | | | | | | 201,212 | |
| | | | 2,956,633 | | | | | | 2,500 | | | | | | 35,047 | | | | | | 135,915 | | | | | | 221,413 | |
| | | | 1,093 | | | | | | 2,500 | | | | | | 8,208 | | | | | | — | | | | | | 69,434 | |
| | | | | | | | | | | | | | | | | | | | | | | | | | | | | |
| | | | $11.29 | | | | | | $10.10 | | | | | | $9.66 | | | | | | $6.80 | | | | | | $18.05 | |
| | | | — | | | | | | — | | | | | | — | | | | | | — | | | | | | 17.94 | |
| | | | 10.94 | | | | | | 10.09 | | | | | | 9.48 | | | | | | 6.80 | | | | | | 17.62 | |
| | | | 11.45 | | | | | | 10.11 | | | | | | 9.74 | | | | | | 6.61 | | | | | | 18.35 | |
| | | | — | | | | | | — | | | | | | — | | | | | | — | | | | | | 18.16 | |
| | | | 11.40 | | | | | | 10.11 | | | | | | 9.71 | | | | | | 6.74 | | | | | | 18.11 | |
| | | | 11.21 | | | | | | 10.10 | | | | | | 9.59 | | | | | | — | | | | | | 17.97 | |
| | |
| The accompanying notes are an integral part of these financial statements. | | 69 |
GOLDMAN SACHS SELECT SATELLITE FUNDS
Statements of Operations
For the Six Months Ended June 30, 2014 (Unaudited)
| | | | | | | | | | |
| | | | |
Absolute Return
Tracker Fund(a) | | | Commodity
Strategy Fund(a) | |
| | Investment income: | | | | | | | | |
| | Dividends — unaffiliated issuers (net of foreign taxes withheld of $0, $0, $4,814, $0, $0, $796,070 and $0) | | $ | 451,843 | | | $ | 2,076 | |
| | Dividends — affiliated issuers | | | 38,473 | | | | 15,691 | |
| | Interest | | | — | | | | 2,669,105 | |
| | Total investment income | | | 490,316 | | | | 2,686,872 | |
| | | | | | | | | | |
| | Expenses: | | | | | | | | |
| | Management fees | | | 9,969,774 | | | | 3,696,326 | |
| | Transfer Agent fees(c) | | | 478,508 | | | | 444,224 | |
| | Distribution and Service fees(c) | | | 278,228 | | | | 445,366 | |
| | Printing and mailing costs | | | 184,802 | | | | 122,156 | |
| | Professional fees | | | 165,465 | | | | 121,528 | |
| | Amortization of offering costs | | | — | | | | — | |
| | Custody, accounting and administrative services | | | 41,069 | | | | 81,702 | |
| | Registration fees | | | 41,004 | | | | 96,815 | |
| | Trustee fees | | | 12,782 | | | | 12,255 | |
| | Organization costs | | | 50,000 | | | | — | |
| | Service share fees — Service Plan | | | — | | | | — | |
| | Service share fees — Shareholder Administration Plan | | | — | | | | — | |
| | Other | | | 46,662 | | | | 107,143 | |
| | Total expenses | | | 11,268,294 | | | | 5,127,515 | |
| | Less — expense reductions | | | (5,115,156 | ) | | | (591,974 | ) |
| | Net expenses | | | 6,153,138 | | | | 4,535,541 | |
| | NET INVESTMENT INCOME (LOSS) | | | (5,662,822 | ) | | | (1,848,669 | ) |
| | | | | | | | | | |
| | Realized and unrealized gain (loss): | | | | | | | | |
| | Net realized gain (loss) from: | | | | | | | | |
| | Investments | | | 5,530,697 | | | | 1,312,334 | |
| | Futures contracts | | | 31,743,936 | | | | (1,767,091 | ) |
| | Swap contracts | | | 8,818,231 | | | | 65,374,499 | |
| | Forward foreign currency exchange contracts | | | 1,038,125 | | | | — | |
| | Foreign currency transactions | | | 191,326 | | | | — | |
| | Written options | | | 21,622,423 | | | | — | |
| | Net change in unrealized gain (loss) on: | | | | | | | | |
| | Investments (including the effects of the net change in the foreign capital gains tax liability of $250,524 for International Real Estate Fund) | | | (813,948 | ) | | | 4,733,718 | |
| | Futures contracts | | | (16,359,261 | ) | | | (1,978,710 | ) |
| | Swap contracts | | | (3,234,400 | ) | | | 16,807,890 | |
| | Forward foreign currency exchange contracts | | | 548,542 | | | | — | |
| | Foreign currency translation | | | (5,656 | ) | | | — | |
| | Written options | | | (3,898,734 | ) | | | — | |
| | Net realized and unrealized gain (loss) | | | 45,181,281 | | | | 84,482,640 | |
| | NET INCREASE (DECREASE) IN NET ASSETS RESULTING FROM OPERATIONS | | $ | 39,518,459 | | | $ | 82,633,971 | |
| | (a) | | Statements of Operations for Absolute Return Tracker, Commodity Strategy and Dynamic Commodity Strategy Funds are consolidated and include the balances of Goldman Sachs Cayman Commodity-ART Fund, Ltd., Goldman Sachs Cayman Commodity Fund, Ltd. and Goldman Sachs DCS Cayman Commodity Fund, Ltd. (wholly-owned subsidiaries), respectively. Accordingly, all interfund balances and transactions have been eliminated. |
| | (b) | | Fund commenced operations on April 30, 2014. |
| | (c) | | Class specific Distribution and Service and Transfer Agent fees were as follows: |
| | | | | | | | | | | | | | | | | | | | | | | | | | | | | | | | | | | | | | | | | | | | |
| | | Distribution and Service Fees | | | Transfer Agent Fees | |
Fund | | Class A | | | Class B | | | Class C | | | Class R | | | Class A | | | Class B | | | Class C | | | Institutional | | | Service | | | Class IR | | | Class R | |
Absolute Return Tracker | | $ | 128,127 | | | $ | — | | | $ | 145,413 | | | $ | 4,688 | | | $ | 97,377 | | | $ | — | | | $ | 27,628 | | | $ | 331,534 | | | $ | — | | | $ | 20,187 | | | $ | 1,782 | |
Commodity Strategy | | | 381,567 | | | | — | | | | 59,744 | | | | 4,055 | | | | 198,413 | | | | — | | | | 7,767 | | | | 229,701 | | | | — | | | | 7,289 | | | | 1,054 | |
Dynamic Allocation | | | 154,800 | | | | — | | | | 278,017 | | | | 29 | | | | 117,649 | | | | — | | | | 52,823 | | | | 137,908 | | | | — | | | | 36,500 | | | | 11 | |
Dynamic Commodity Strategy | | | 4 | | | | — | | | | 17 | | | | 21 | | | | 2 | | | | — | | | | 2 | | | | 2,649 | | | | — | | | | 6 | | | | 5 | |
Managed Futures Strategy | | | 3,426 | | | | — | | | | 7,017 | | | | 197 | | | | 2,603 | | | | — | | | | 1,333 | | | | 19,162 | | | | — | | | | 336 | | | | 75 | |
International Real Estate Securities | | | 16,211 | | | | — | | | | 11,240 | | | | — | | | | 12,321 | | | | — | | | | 2,135 | | | | 76,749 | | | | — | | | | 848 | | | | — | |
Real Estate Securities | | | 72,578 | | | | 3,978 | | | | 66,468 | | | | 2,355 | | | | 55,159 | | | | 756 | | | | 12,629 | | | | 91,452 | | | | 667 | | | | 1,643 | | | | 895 | |
| | |
| 70 | | The accompanying notes are an integral part of these financial statements. |
GOLDMAN SACHS SELECT SATELLITE FUNDS
| | | | | | | | | | | | | | | | | | | | | | | | | | | | |
| | | Dynamic Allocation
Fund | | | | | Dynamic
Commodity
Strategy Fund(a)(b) | | | | | Managed Futures
Strategy Fund | | | | | International Real
Estate Securities
Fund | | | | | Real Estate
Securities Fund | |
| | | | | | | | | | | | | | | | | | | | | | | | | | | | |
| | $ | 1,805,992 | | | | | $ | — | | | | | $ | — | | | | | $ | 9,011,358 | | | | | $ | 8,589,610 | |
| | | 11,481 | | | | | | 323 | | | | | | 2,392 | | | | | | — | | | | | | — | |
| | | 484,766 | | | | | | — | | | | | | 124 | | | | | | — | | | | | | — | |
| | | 2,302,239 | | | | | | 323 | | | | | | 2,516 | | | | | | 9,011,358 | | | | | | 8,589,610 | |
| | | | | | | | | | | | | | | | | | | | | | | | | | | | |
| | | | | | | | | | | | | | | | | | | | | | | | | | | | |
| | | 4,082,244 | | | | | | 53,063 | | | | | | 501,919 | | | | | | 2,099,230 | | | | | | 2,677,082 | |
| | | 344,891 | | | | | | 2,664 | | | | | | 23,509 | | | | | | 92,053 | | | | | | 163,201 | |
| | | 432,846 | | | | | | 42 | | | | | | 10,640 | | | | | | 27,451 | | | | | | 145,379 | |
| | | 85,810 | | | | | | 5,380 | | | | | | 16,862 | | | | | | 18,723 | | | | | | 27,509 | |
| | | 63,518 | | | | | | 33,388 | | | | | | 107,927 | | | | | | 50,246 | | | | | | 49,624 | |
| | | — | | | | | | 39,665 | | | | | | — | | | | | | — | | | | | | — | |
| | | 40,390 | | | | | | 13,263 | | | | | | 26,155 | | | | | | 96,750 | | | | | | 41,977 | |
| | | 30,282 | | | | | | 6,037 | | | | | | 53,935 | | | | | | 35,749 | | | | | | 62,789 | |
| | | 11,509 | | | | | | 3,884 | | | | | | 12,323 | | | | | | 12,807 | | | | | | 13,135 | |
| | | — | | | | | | 62,000 | | | | | | — | | | | | | — | | | | | | — | |
| | | — | | | | | | — | | | | | | — | | | | | | — | | | | | | 4,169 | |
| | | — | | | | | | — | | | | | | — | | | | | | — | | | | | | 4,169 | |
| | | 55,269 | | | | | | 1,859 | | | | | | 38,166 | | | | | | 14,321 | | | | | | 18,991 | |
| | | 5,146,759 | | | | | | 221,245 | | | | | | 791,436 | | | | | | 2,447,330 | | | | | | 3,208,025 | |
| | | (942,996 | ) | | | | | (171,029 | ) | | | | | (229,905 | ) | | | | | (295,095 | ) | | | | | (330,385 | ) |
| | | 4,203,763 | | | | | | 50,216 | | | | | | 561,531 | | | | | | 2,152,235 | | | | | | 2,877,640 | |
| | | (1,901,524 | ) | | | | | (49,893 | ) | | | | | (559,015 | ) | | | | | 6,859,123 | | | | | | 5,711,970 | |
| | | | | | | | | | | | | | | | | | | | | | | | | | | | |
| | | | | | | | | | | | | | | | | | | | | | | | | | | | |
| | | | | | | | | | | | | | | | | | | | | | | | | | | | |
| | | 16,703,736 | | | | | | — | | | | | | (884,173 | ) | | | | | 14,338,691 | | | | | | 19,208,898 | |
| | | 12,878,598 | | | | | | — | | | | | | 1,913,531 | | | | | | — | | | | | | — | |
| | | 5,363,759 | | | | | | (225,635 | ) | | | | | (1,677,319 | ) | | | | | — | | | | | | — | |
| | | 421,660 | | | | | | — | | | | | | (907,972 | ) | | | | | — | | | | | | — | |
| | | (53,120 | ) | | | | | — | | | | | | (5,365 | ) | | | | | (193,901 | ) | | | | | 1,269 | |
| | | — | | | | | | — | | | | | | — | | | | | | — | | | | | | — | |
| | | 6,689,708 | | | | | | — | | | | | | 588,600 | | | | | | 1,697,480 | | | | | | 61,694,699 | |
| | | (13,033,837 | ) | | | | | — | | | | | | (2,866,892 | ) | | | | | — | | | | | | — | |
| | | 3,903,210 | | | | | | 700,872 | | | | | | 406,066 | | | | | | — | | | | | | — | |
| | | (547,938 | ) | | | | | — | | | | | | 55,647 | | | | | | — | | | | | | — | |
| | | 209,107 | | | | | | — | | | | | | (30,127 | ) | | | | | 235,902 | | | | | | — | |
| | | — | | | | | | — | | | | | | — | | | | | | — | | | | | | — | |
| | | 32,534,883 | | | | | | 475,237 | | | | | | (3,408,004 | ) | | | | | 16,078,172 | | | | | | 80,904,866 | |
| | $ | 30,633,359 | | | | | $ | 425,344 | | | | | $ | (3,967,019 | ) | | | | $ | 22,937,295 | | | | | $ | 86,616,836 | |
| | |
| The accompanying notes are an integral part of these financial statements. | | 71 |
GOLDMAN SACHS SELECT SATELLITE FUNDS
Statements of Changes in Net Assets
| | | | | | | | | | |
| | | | |
Absolute Return Tracker Fund(a) | |
| | | | | For the
Six Months Ended
June 30, 2014
(Unaudited) | | | For the Fiscal Year Ended
December 31, 2013 | |
| | From operations: | | | | | | | | |
| | Net investment loss | | $ | (5,662,822 | ) | | $ | (15,572,211 | ) |
| | Net realized gain (loss) | | | 68,944,738 | | | | 110,550,231 | |
| | Net change in unrealized gain (loss) | | | (23,763,457 | ) | | | 33,458,777 | |
| | Net increase (decrease) in net assets resulting from operations | | | 39,518,459 | | | | 128,436,797 | |
| | | | | | | | | | |
| | Distributions to shareholders: | | | | | | | | |
| | From net investment income | | | | | | | | |
| | Institutional Shares | | | — | | | | — | |
| | Class IR Shares | | | — | | | | — | |
| | From net realized gains | | | | | | | | |
| | Class A | | | — | | | | (5,863,960 | ) |
| | Class C | | | — | | | | (1,717,837 | ) |
| | Institutional Shares | | | — | | | | (84,082,168 | ) |
| | Class IR | | | — | | | | (1,126,965 | ) |
| | Class R | | | — | | | | (101,796 | ) |
| | Total distributions to shareholders | | | — | | | | (92,892,726 | ) |
| | | | | | | | | | |
| | From share transactions: | | | | | | | | |
| | Proceeds from sales of shares | | | 373,617,269 | | | | 731,911,231 | |
| | Reinvestment of distributions | | | — | | | | 75,711,649 | |
| | Cost of shares redeemed | | | (220,428,176 | ) | | | (640,468,804 | ) |
| | Net increase (decrease) in net assets resulting from share transactions | | | 153,189,093 | | | | 167,154,076 | |
| | TOTAL INCREASE (DECREASE) | | | 192,707,552 | | | | 202,698,147 | |
| | | | | | | | | | |
| | Net assets: | | | | | | | | |
| | Beginning of period | | | 1,748,143,503 | | | | 1,545,445,356 | |
| | End of period | | $ | 1,940,851,055 | | | $ | 1,748,143,503 | |
| | Undistributed (distributions in excess of) net investment income (loss) | | $ | (5,618,285 | ) | | $ | 44,537 | |
| | (a) | | Statements of Changes in Net Assets for Absolute Return Tracker, Commodity Strategy and Dynamic Commodity Strategy Funds are consolidated and include the balances of Goldman Sachs Cayman Commodity-ART Fund, Ltd., Goldman Sachs Cayman Commodity Fund, Ltd. and Goldman Sachs DCS Cayman Commodity Fund, Ltd. (wholly-owned subsidiaries), respectively. Accordingly, all interfund balances and transactions have been eliminated. |
| | (b) | | Commenced operations on April 30, 2014. |
| | |
| 72 | | The accompanying notes are an integral part of these financial statements. |
GOLDMAN SACHS SELECT SATELLITE FUNDS
| | | | | | | | | | | | | | | | | | | | | | | | | | | | | | | | | | | | | | | | |
| | | Commodity Strategy Fund(a) | | | | | Dynamic Allocation Fund | | | | | Dynamic Commodity
Strategy Fund(a) | | | | | Managed Futures Strategy Fund | |
| | | For the
Six Months Ended
June 30, 2014
(Unaudited) | | | | | For the Fiscal Year Ended
December 31, 2013 | | | | | For the Six Months Ended
June 30, 2014
(Unaudited) | | | | | For the Fiscal Year Ended
December 31, 2013 | | | | | For the Period Ended
June 30, 2014(b)
(Unaudited) | | | | | For the Six Months Ended
June 30, 2014 (Unaudited) | | | | | For the Fiscal Year Ended
December 31, 2013 | |
| | | | | | | | | | | | | | | | | | | | | | | | | | | | | | | | | | | | | | | | |
| | $ | (1,848,669 | ) | | | | $ | (7,980,657 | ) | | | | $ | (1,901,524 | ) | | | | $ | (11,324,326 | ) | | | | $ | (49,893 | ) | | | | $ | (559,015 | ) | | | | $ | (354,036 | ) |
| | | 64,919,742 | | | | | | (31,539,128 | ) | | | | | 35,314,633 | | | | | | 59,588,793 | | | | | | (225,635 | ) | | | | | (1,561,298 | ) | | | | | (1,890,835 | ) |
| | | 19,562,898 | | | | | | 22,783,064 | | | | | | (2,779,750 | ) | | | | | 13,105,061 | | | | | | 700,872 | | | | | | (1,846,706 | ) | | | | | 2,505,183 | |
| | | 82,633,971 | | | | | | (16,736,721 | ) | | | | | 30,633,359 | | | | | | 61,369,528 | | | | | | 425,344 | | | | | | (3,967,019 | ) | | | | | 260,312 | |
| | | | | | | | | | | | | | | | | | | | | | | | | | | | | | | | | | | | | | | | |
| | | | | | | | | | | | | | | | | | | | | | | | | | | | | | | | | | | | | | | | |
| | | | | | | | | | | | | | | | | | | | | | | | | | | | | | | | | | | | | | | | |
| | | (487,599 | ) | | | | | — | | | | | | — | | | | | | (123,518 | ) | | | | | — | | | | | | — | | | | | | — | |
| | | (2,606 | ) | | | | | — | | | | | | — | | | | | | — | | | | | | — | | | | | | — | | | | | | — | |
| | | | | | | | | | | | | | | | | | | | | | | | | | | | | | | | | | | | | | | | |
| | | — | | | | | | — | | | | | | — | | | | | | (5,914,684 | ) | | | | | — | | | | | | — | | | | | | — | |
| | | — | | | | | | — | | | | | | — | | | | | | (2,279,831 | ) | | | | | — | | | | | | — | | | | | | — | |
| | | — | | | | | | — | | | | | | — | | | | | | (26,089,608 | ) | | | | | — | | | | | | — | | | | | | — | |
| | | — | | | | | | — | | | | | | — | | | | | | (1,833,404 | ) | | | | | — | | | | | | — | | | | | | — | |
| | | — | | | | | | — | | | | | | — | | | | | | (379 | ) | | | | | — | | | | | | — | | | | | | — | |
| | | (490,205 | ) | | | | | — | | | | | | — | | | | | | (36,241,424 | ) | | | | | — | | | | | | — | | | | | | — | |
| | | | | | | | | | | | | | | | | | | | | | | | | | | | | | | | | | | | | | | | |
| | | | | | | | | | | | | | | | | | | | | | | | | | | | | | | | | | | | | | | | |
| | | 390,406,737 | | | | | | 777,604,450 | | | | | | 79,021,273 | | | | | | 353,297,405 | | | | | | 40,000,005 | | | | | | 12,315,042 | | | | | | 115,661,480 | |
| | | 417,671 | | | | | | — | | | | | | — | | | | | | 35,543,733 | | | | | | — | | | | | | — | | | | | | — | |
| | | (469,008,282 | ) | | | | | (418,193,811 | ) | | | | | (272,413,181 | ) | | | | | (656,330,760 | ) | | | | | (1,000,000 | ) | | | | | (16,382,233 | ) | | | | | (26,366,759 | ) |
| | | (78,183,874 | ) | | | | | 359,410,639 | | | | | | (193,391,908 | ) | | | | | (267,489,622 | ) | | | | | 39,000,005 | | | | | | (4,067,191 | ) | | | | | 89,294,721 | |
| | | 3,959,892 | | | | | | 342,673,918 | | | | | | (162,758,549 | ) | | | | | (242,361,518 | ) | | | | | 39,425,349 | | | | | | (8,034,210 | ) | | | | | 89,555,033 | |
| | | | | | | | | | | | | | | | | | | | | | | | | | | | | | | | | | | | | | | | |
| | | | | | | | | | | | | | | | | | | | | | | | | | | | | | | | | | | | | | | | |
| | | 1,461,219,795 | | | | | | 1,118,545,877 | | | | | | 1,038,869,693 | | | | | | 1,281,231,211 | | | | | | — | | | | | | 109,987,503 | | | | | | 20,432,470 | |
| | $ | 1,465,179,687 | | | | | $ | 1,461,219,795 | | | | | $ | 876,111,144 | | | | | $ | 1,038,869,693 | | | | | $ | 39,425,349 | | | | | $ | 101,953,293 | | | | | $ | 109,987,503 | |
| | $ | (3,702,645 | ) | | | | $ | (1,363,771 | ) | | | | $ | (1,878,218 | ) | | | | $ | 23,306 | | | | | $ | (49,893 | ) | | | | $ | (779,079 | ) | | | | $ | (220,064 | ) |
| | |
| The accompanying notes are an integral part of these financial statements. | | 73 |
GOLDMAN SACHS SELECT SATELLITE FUNDS
Statements of Changes in Net Assets (continued)
| | | | | | | | | | |
| | | | |
International Real Estate Securities Fund | |
| | | | | For the Six Months Ended
June 30, 2014
(Unaudited) | | | For the Fiscal Year Ended
December 31, 2013 | |
| | From operations: | | | | | | | | |
| | Net investment income | | $ | 6,859,123 | | | $ | 10,553,459 | |
| | Net realized gain | | | 14,144,790 | | | | 35,564,500 | |
| | Net change in unrealized gain (loss) | | | 1,933,382 | | | | (23,807,736 | ) |
| | Net increase in net assets resulting from operations | | | 22,937,295 | | | | 22,310,223 | |
| | | | | | | | | | |
| | Distributions to shareholders: | | | | | | | | |
| | From net investment income | | | | | | | | |
| | Class A Shares | | | (160,201 | ) | | | (626,315 | ) |
| | Class B Shares | | | — | | | | — | |
| | Class C Shares | | | (20,972 | ) | | | (93,251 | ) |
| | Institutional Shares | | | (6,310,414 | ) | | | (18,260,616 | ) |
| | Service Shares | | | — | | | | — | |
| | Class IR Shares | | | (13,497 | ) | | | (66,565 | ) |
| | Class R Shares | | | — | | | | — | |
| | Total distributions to shareholders | | | (6,505,084 | ) | | | (19,046,747 | ) |
| | | | | | | | | | |
| | From share transactions: | | | | | | | | |
| | Proceeds from sales of shares | | | 33,854,519 | | | | 120,344,236 | |
| | Reinvestment of distributions | | | 6,148,846 | | | | 17,931,523 | |
| | Cost of shares redeemed | | | (47,591,024 | ) | | | (78,193,507 | ) |
| | Net increase (decrease) in net assets resulting from share transactions | | | (7,587,659 | ) | | | 60,082,252 | |
| | TOTAL INCREASE | | | 8,844,552 | | | | 63,345,728 | |
| | | | | | | | | | |
| | Net assets: | | | | | | | | |
| | Beginning of period | | | 405,178,169 | | | | 341,832,441 | |
| | End of period | | $ | 414,022,721 | | | $ | 405,178,169 | |
| | Undistributed (distributions in excess of) net investment income | | $ | (20,822,024 | ) | | $ | (21,176,063 | ) |
| | |
| 74 | | The accompanying notes are an integral part of these financial statements. |
GOLDMAN SACHS SELECT SATELLITE FUNDS
| | | | | | | | | | |
| | |
Real Estate Securities Fund | |
| | | For the Six Months Ended
June 30, 2014
(Unaudited) | | | | | For the Fiscal Year Ended
December 31, 2013 | |
| | | | | | | | | | |
| | $ | 5,711,970 | | | | | $ | 6,979,737 | |
| | | 19,210,167 | | | | | | 33,417,940 | |
| | | 61,694,699 | | | | | | (31,250,043 | ) |
| | | 86,616,836 | | | | | | 9,147,634 | |
| | | | | | | | | | |
| | | | | | | | | | |
| | | | | | | | | | |
| | | (699,559 | ) | | | | | (895,359 | ) |
| | | (5,839 | ) | | | | | (9,319 | ) |
| | | (110,881 | ) | | | | | (121,367 | ) |
| | | (6,219,944 | ) | | | | | (7,494,091 | ) |
| | | (37,075 | ) | | | | | (58,033 | ) |
| | | (29,526 | ) | | | | | (12,782 | ) |
| | | (11,187 | ) | | | | | (7,946 | ) |
| | | (7,114,011 | ) | | | | | (8,598,897 | ) |
| | | | | | | | | | |
| | | | | | | | | | |
| | | 82,700,071 | | | | | | 179,269,692 | |
| | | 6,783,361 | | | | | | 8,115,358 | |
| | | (68,852,619 | ) | | | | | (163,060,641 | ) |
| | | 20,630,813 | | | | | | 24,324,409 | |
| | | 100,133,638 | | | | | | 24,873,146 | |
| | | | | | | | | | |
| | | | | | | | | | |
| | | 489,275,595 | | | | | | 464,402,449 | |
| | $ | 589,409,233 | | | | | $ | 489,275,595 | |
| | $ | (669,758 | ) | | | | $ | 732,283 | |
| | |
| The accompanying notes are an integral part of these financial statements. | | 75 |
GOLDMAN SACHS ABSOLUTE RETURN TRACKER FUND
Financial Highlights
Selected Data for a Share Outstanding Throughout Each Period
| | | | | | | | | | | | | | | | | | | | | | | | | | | | | | |
| | | | | | | | Income (loss) from
investment operations | | | Distributions
to shareholders | |
| | | Year - Share Class | |
Net asset
value,
beginning
of period | | | Net
investment
loss(a) | | | Net realized
and unrealized
gain (loss) | | | Total from
investment
operations | | | From net
investment
income | | | From net
realized
gains | | | Total
distributions | |
| | FOR THE SIX MONTHS ENDED JUNE 30, (UNAUDITED) | |
| | 2014 - A | | $ | 9.12 | | | $ | (0.04 | ) | | $ | 0.21 | | | $ | 0.17 | | | $ | — | | | $ | — | | | $ | — | |
| | 2014 - C | | | 8.72 | | | | (0.07 | ) | | | 0.20 | | | | 0.13 | | | | — | | | | — | | | | — | |
| | 2014 - Institutional | | | 9.32 | | | | (0.03 | ) | | | 0.23 | | | | 0.20 | | | | — | | | | — | | | | — | |
| | 2014 - IR | | | 9.24 | | | | (0.03 | ) | | | 0.22 | | | | 0.19 | | | | — | | | | — | | | | — | |
| | 2014 - R | | | 8.98 | | | | (0.05 | ) | | | 0.21 | | | | 0.16 | | | | — | | | | — | | | | — | |
| | | | | | | | | | | | | | | | | | | | | | | | | | | | | | |
| | FOR THE FISCAL YEARS ENDED DECEMBER 31, | |
| | 2013 - A | | | 8.95 | | | | (0.12 | ) | | | 0.82 | | | | 0.70 | | | | — | | | | (0.53 | ) | | | (0.53 | ) |
| | 2013 - C | | | 8.65 | | | | (0.18 | ) | | | 0.78 | | | | 0.60 | | | | — | | | | (0.53 | ) | | | (0.53 | ) |
| | 2013 - Institutional | | | 9.10 | | | | (0.09 | ) | | | 0.84 | | | | 0.75 | | | | — | | | | (0.53 | ) | | | (0.53 | ) |
| | 2013 - IR | | | 9.04 | | | | (0.10 | ) | | | 0.83 | | | | 0.73 | | | | — | | | | (0.53 | ) | | | (0.53 | ) |
| | 2013 - R | | | 8.85 | | | | (0.14 | ) | | | 0.80 | | | | 0.66 | | | | — | | | | (0.53 | ) | | | (0.53 | ) |
| | 2012 - A | | | 8.79 | | | | (0.13 | ) | | | 0.33 | | | | 0.20 | | | | — | | | | (0.04 | ) | | | (0.04 | ) |
| | 2012 - C | | | 8.56 | | | | (0.19 | ) | | | 0.32 | | | | 0.13 | | | | — | | | | (0.04 | ) | | | (0.04 | ) |
| | 2012 - Institutional | | | 8.90 | | | | (0.09 | ) | | | 0.33 | | | | 0.24 | | | | — | | | | (0.04 | ) | | | (0.04 | ) |
| | 2012 - IR | | | 8.86 | | | | (0.11 | ) | | | 0.33 | | | | 0.22 | | | | — | | | | (0.04 | ) | | | (0.04 | ) |
| | 2012 - R | | | 8.72 | | | | (0.15 | ) | | | 0.32 | | | | 0.17 | | | | — | | | | (0.04 | ) | | | (0.04 | ) |
| | 2011 - A | | | 9.25 | | | | (0.12 | ) | | | (0.23 | ) | | | (0.35 | ) | | | — | | | | (0.11 | ) | | | (0.11 | ) |
| | 2011 - C | | | 9.08 | | | | (0.18 | ) | | | (0.23 | ) | | | (0.41 | ) | | | — | | | | (0.11 | ) | | | (0.11 | ) |
| | 2011 - Institutional | | | 9.34 | | | | (0.08 | ) | | | (0.25 | ) | | | (0.33 | ) | | | — | | | | (0.11 | ) | | | (0.11 | ) |
| | 2011 - IR | | | 9.31 | | | | (0.09 | ) | | | (0.25 | ) | | | (0.34 | ) | | | — | | | | (0.11 | ) | | | (0.11 | ) |
| | 2011 - R | | | 9.20 | | | | (0.14 | ) | | | (0.23 | ) | | | (0.37 | ) | | | — | | | | (0.11 | ) | | | (0.11 | ) |
| | 2010 - A | | | 9.06 | | | | (0.13 | ) | | | 0.38 | | | | 0.25 | | | | — | | | | (0.06 | ) | | | (0.06 | ) |
| | 2010 - C | | | 8.96 | | | | (0.19 | ) | | | 0.37 | | | | 0.18 | | | | — | | | | (0.06 | ) | | | (0.06 | ) |
| | 2010 - Institutional | | | 9.11 | | | | (0.09 | ) | | | 0.38 | | | | 0.29 | | | | — | | | | (0.06 | ) | | | (0.06 | ) |
| | 2010 - IR | | | 9.09 | | | | (0.10 | ) | | | 0.38 | | | | 0.28 | | | | — | | | | (0.06 | ) | | | (0.06 | ) |
| | 2010 - R | | | 9.03 | | | | (0.14 | ) | | | 0.37 | | | | 0.23 | | | | — | | | | (0.06 | ) | | | (0.06 | ) |
| | 2009 - A | | | 8.58 | | | | (0.12 | ) | | | 0.62 | | | | 0.50 | | | | (0.01 | ) | | | (0.01 | ) | | | (0.02 | ) |
| | 2009 - C | | | 8.54 | | | | (0.19 | ) | | | 0.62 | | | | 0.43 | | | | — | | | | (0.01 | ) | | | (0.01 | ) |
| | 2009 - Institutional | | | 8.60 | | | | (0.08 | ) | | | 0.62 | | | | 0.54 | | | | (0.02 | ) | | | (0.01 | ) | | | (0.03 | ) |
| | 2009 - IR | | | 8.59 | | | | (0.11 | ) | | | 0.64 | | | | 0.53 | | | | (0.02 | ) | | | (0.01 | ) | | | (0.03 | ) |
| | 2009 - R | | | 8.57 | | | | (0.14 | ) | | | 0.61 | | | | 0.47 | | | | — | | | | (0.01 | ) | | | (0.01 | ) |
| | (a) | | Calculated based on the average shares outstanding methodology. |
| | (b) | | Assumes investment at the net asset value at the beginning of the period, reinvestment of all distributions, a complete redemption of the investment at the net asset value at the end of the period and no sales or redemption charges. Total returns would be reduced if a sales or redemption charge was taken into account. Returns do not reflect the deduction of taxes that a shareholder would pay on Fund distributions or the redemption of Fund shares. Total returns for periods less than one full year are not annualized. |
| | (c) | | The Fund’s portfolio turnover rate is calculated in accordance with regulatory requirements, without regard to transactions involving short term investments and certain derivatives. If such transactions were included, the Fund’s portfolio turnover rate may be higher. |
| | |
| 76 | | The accompanying notes are an integral part of these financial statements. |
GOLDMAN SACHS ABSOLUTE RETURN TRACKER FUND
| | | | | | | | | | | | | | | | | | | | | | | | | | | | | | | | | | | | | | | | |
| | | | | | | | | | | | | |
| | | | | | | | | | | | | | | | | | | | | | | | | | | | | | | | | | |
| | | Net asset
value, end
of period | | | | | Total
return(b) | | | | | Net assets,
end of
period (in 000s) | | | | | Ratio of
net expenses
to average
net assets | | | | | Ratio of
total expenses
to average
net assets | | | | | Ratio of
net investment
loss to average net assets | | | | | Portfolio
turnover
rate(c) | |
| | | | | | | | | | | | | | | | | | | | | | | | | | | | | | | | | | | | | | | | |
| | $ | 9.29 | | | | | | 1.86 | % | | | | $ | 101,031 | | | | | | 1.04 | %(d) | | | | | 1.60 | %(d) | | | | | (0.98 | )%(d) | | | | | 41 | % |
| | | 8.85 | | | | | | 1.49 | | | | | | 29,681 | | | | | | 1.79 | (d) | | | | | 2.35 | (d) | | | | | (1.73 | )(d) | | | | | 41 | |
| | | 9.52 | | | | | | 2.04 | | | | | | 1,786,577 | | | | | | 0.64 | (d) | | | | | 1.20 | (d) | | | | | (0.58 | )(d) | | | | | 41 | |
| | | 9.43 | | | | | | 2.06 | | | | | | 21,583 | | | | | | 0.79 | (d) | | | | | 1.35 | (d) | | | | | (0.73 | )(d) | | | | | 41 | |
| | | 9.14 | | | | | | 1.78 | | | | | | 1,980 | | | | | | 1.29 | (d) | | | | | 1.85 | (d) | | | | | (1.23 | )(d) | | | | | 41 | |
| | | | | | | | | | | | | | | | | | | | | | | | | | | | | | | | | | | | | | | | |
| | | | | | | | | | | | | | | | | | | | | | | | | | | | | | | | | | | | | | | | |
| | | 9.12 | | | | | | 7.90 | | | | | | 105,432 | | | | | | 1.55 | | | | | | 1.59 | | | | | | (1.33 | ) | | | | | 163 | |
| | | 8.72 | | | | | | 7.02 | | | | | | 29,942 | | | | | | 2.30 | | | | | | 2.34 | | | | | | (2.08 | ) | | | | | 163 | |
| | | 9.32 | | | | | | 8.33 | | | | | | 1,589,475 | | | | | | 1.15 | | | | | | 1.19 | | | | | | (0.92 | ) | | | | | 163 | |
| | | 9.24 | | | | | | 8.15 | | | | | | 21,565 | | | | | | 1.30 | | | | | | 1.34 | | | | | | (1.08 | ) | | | | | 163 | |
| | | 8.98 | | | | | | 7.54 | | | | | | 1,729 | | | | | | 1.80 | | | | | | 1.84 | | | | | | (1.57 | ) | | | | | 163 | |
| | | 8.95 | | | | | | 2.30 | | | | | | 133,654 | | | | | | 1.55 | | | | | | 1.59 | | | | | | (1.44 | ) | | | | | 79 | |
| | | 8.65 | | | | | | 1.55 | | | | | | 37,525 | | | | | | 2.30 | | | | | | 2.34 | | | | | | (2.19 | ) | | | | | 79 | |
| | | 9.10 | | | | | | 2.72 | | | | | | 1,355,193 | | | | | | 1.15 | | | | | | 1.19 | | | | | | (1.04 | ) | | | | | 79 | |
| | | 9.04 | | | | | | 2.51 | | | | | | 17,085 | | | | | | 1.30 | | | | | | 1.34 | | | | | | (1.19 | ) | | | | | 79 | |
| | | 8.85 | | | | | | 1.98 | | | | | | 1,988 | | | | | | 1.80 | | | | | | 1.84 | | | | | | (1.69 | ) | | | | | 79 | |
| | | 8.79 | | | | | | (3.77 | ) | | | | | 493,429 | | | | | | 1.56 | | | | | | 1.59 | | | | | | (1.31 | ) | | | | | 105 | |
| | | 8.56 | | | | | | (4.50 | ) | | | | | 60,598 | | | | | | 2.31 | | | | | | 2.34 | | | | | | (2.06 | ) | | | | | 105 | |
| | | 8.90 | | | | | | (3.51 | ) | | | | | 1,314,751 | | | | | | 1.16 | | | | | | 1.19 | | | | | | (0.88 | ) | | | | | 105 | |
| | | 8.86 | | | | | | (3.63 | ) | | | | | 16,341 | | | | | | 1.31 | | | | | | 1.34 | | | | | | (1.02 | ) | | | | | 105 | |
| | | 8.72 | | | | | | (4.00 | ) | | | | | 1,258 | | | | | | 1.81 | | | | | | 1.84 | | | | | | (1.54 | ) | | | | | 105 | |
| | | 9.25 | | | | | | 2.73 | | | | | | 490,567 | | | | | | 1.59 | | | | | | 1.63 | | | | | | (1.39 | ) | | | | | 132 | |
| | | 9.08 | | | | | | 1.98 | | | | | | 78,423 | | | | | | 2.34 | | | | | | 2.38 | | | | | | (2.13 | ) | | | | | 132 | |
| | | 9.34 | | | | | | 3.16 | | | | | | 786,120 | | | | | | 1.19 | | | | | | 1.23 | | | | | | (0.97 | ) | | | | | 132 | |
| | | 9.31 | | | | | | 3.05 | | | | | | 5,206 | | | | | | 1.34 | | | | | | 1.38 | | | | | | (1.12 | ) | | | | | 132 | |
| | | 9.20 | | | | | | 2.52 | | | | | | 895 | | | | | | 1.84 | | | | | | 1.88 | | | | | | (1.60 | ) | | | | | 132 | |
| | | 9.06 | | | | | | 5.75 | | | | | | 322,502 | | | | | | 1.60 | | | | | | 1.86 | | | | | | (1.36 | ) | | | | | 126 | |
| | | 8.96 | | | | | | 5.01 | | | | | | 47,012 | | | | | | 2.35 | | | | | | 2.61 | | | | | | (2.13 | ) | | | | | 126 | |
| | | 9.11 | | | | | | 6.28 | | | | | | 305,992 | | | | | | 1.20 | | | | | | 1.46 | | | | | | (0.93 | ) | | | | | 126 | |
| | | 9.09 | | | | | | 6.15 | | | | | | 1,642 | | | | | | 1.35 | | | | | | 1.61 | | | | | | (1.18 | ) | | | | | 126 | |
| | | 9.03 | | | | | | 5.46 | | | | | | 31 | | | | | | 1.85 | | | | | | 2.11 | | | | | | (1.60 | ) | | | | | 126 | |
| | |
| The accompanying notes are an integral part of these financial statements. | | 77 |
GOLDMAN SACHS COMMODITY STRATEGY FUND
Financial Highlights
Selected Data for a Share Outstanding Throughout Each Period
| | | | | | | | | | | | | | | | | | | | | | |
| | | | | | | | Income (loss) from
investment operations | | | | |
| | | Year - Share Class | | Net asset
value,
beginning
of period | | | Net
investment
income (loss)(a) | | | Net realized
and unrealized
gain (loss) | | | Total from
investment
operations | | | Distributions
to shareholders
from net
investment
income | |
| | FOR THE SIX MONTHS ENDED JUNE 30, (UNAUDITED) | |
| | 2014 - A | | $ | 5.64 | | | $ | (0.02 | ) | | $ | 0.31 | | | $ | 0.29 | | | $ | — | |
| | 2014 - C | | | 5.46 | | | | (0.03 | ) | | | 0.30 | | | | 0.27 | | | | — | |
| | 2014 - Institutional | | | 5.67 | | | | — | (e) | | | 0.31 | | | | 0.31 | | | | — | (e) |
| | 2014 - IR | | | 5.68 | | | | (0.01 | ) | | | 0.31 | | | | 0.30 | | | | — | (e) |
| | 2014 - R | | | 5.58 | | | | (0.02 | ) | | | 0.30 | | | | 0.28 | | | | — | |
| | | | | | | | | | | | | | | | | | | | | | |
| | FOR THE FISCAL YEARS ENDED DECEMBER 31, | |
| | 2013 - A | | | 5.73 | | | | (0.05 | ) | | | (0.04 | ) | | | (0.09 | ) | | | — | |
| | 2013 - C | | | 5.60 | | | | (0.09 | ) | | | (0.05 | ) | | | (0.14 | ) | | | — | |
| | 2013 - Institutional | | | 5.75 | | | | (0.03 | ) | | | (0.05 | ) | | | (0.08 | ) | | | — | |
| | 2013 - IR | | | 5.76 | | | | (0.04 | ) | | | (0.04 | ) | | | (0.08 | ) | | | — | |
| | 2013 - R | | | 5.69 | | | | (0.06 | ) | | | (0.05 | ) | | | (0.11 | ) | | | — | |
| | 2012 - A | | | 5.88 | | | | (0.03 | ) | | | (0.08 | ) | | | (0.11 | ) | | | (0.04 | ) |
| | 2012 - C | | | 5.78 | | | | (0.08 | ) | | | (0.07 | ) | | | (0.15 | ) | | | (0.03 | ) |
| | 2012 - Institutional | | | 5.89 | | | | (0.02 | ) | | | (0.07 | ) | | | (0.09 | ) | | | (0.05 | ) |
| | 2012 - IR | | | 5.91 | | | | (0.03 | ) | | | (0.07 | ) | | | (0.10 | ) | | | (0.05 | ) |
| | 2012 - R | | | 5.85 | | | | (0.05 | ) | | | (0.07 | ) | | | (0.12 | ) | | | (0.04 | ) |
| | 2011 - A | | | 6.03 | | | | (0.04 | ) | | | 0.01 | | | | (0.03 | ) | | | (0.12 | ) |
| | 2011 - C | | | 5.95 | | | | (0.08 | ) | | | 0.01 | | | | (0.07 | ) | | | (0.10 | ) |
| | 2011 - Institutional | | | 6.04 | | | | (0.02 | ) | | | — | (e) | | | (0.02 | ) | | | (0.13 | ) |
| | 2011 - IR | | | 6.05 | | | | (0.02 | ) | | | 0.01 | | | | (0.01 | ) | | | (0.13 | ) |
| | 2011 - R | | | 6.01 | | | | (0.05 | ) | | | 0.01 | | | | (0.04 | ) | | | (0.12 | ) |
| | 2010 - A | | | 6.19 | | | | (0.02 | ) | | | 0.52 | | | | 0.50 | | | | (0.66 | ) |
| | 2010 - C | | | 6.14 | | | | (0.06 | ) | | | 0.51 | | | | 0.45 | | | | (0.64 | ) |
| | 2010 - Institutional | | | 6.19 | | | | — | (e) | | | 0.52 | | | | 0.52 | | | | (0.67 | ) |
| | 2010 - IR | | | 6.20 | | | | (0.01 | ) | | | 0.53 | | | | 0.52 | | | | (0.67 | ) |
| | 2010 - R | | | 6.18 | | | | (0.04 | ) | | | 0.52 | | | | 0.48 | | | | (0.65 | ) |
| | 2009 - A | | | 5.40 | | | | 0.02 | | | | 0.91 | | | | 0.93 | | | | (0.14 | ) |
| | 2009 - C | | | 5.38 | | | | (0.02 | ) | | | 0.90 | | | | 0.88 | | | | (0.12 | ) |
| | 2009 - Institutional | | | 5.43 | | | | 0.04 | | | | 0.88 | | | | 0.92 | | | | (0.16 | ) |
| | 2009 - IR | | | 5.40 | | | | 0.05 | | | | 0.90 | | | | 0.95 | | | | (0.15 | ) |
| | 2009 - R | | | 5.40 | | | | — | (e) | | | 0.92 | | | | 0.92 | | | | (0.14 | ) |
| | (a) | | Calculated based on the average shares outstanding methodology. |
| | (b) | | Assumes investment at the net asset value at the beginning of the period, reinvestment of all distributions, a complete redemption of the investment at the net asset value at the end of the period and no sales or redemption charges. Total returns would be reduced if a sales or redemption charge was taken into account. Returns do not reflect the deduction of taxes that a shareholder would pay on Fund distributions or the redemption of Fund shares. Total returns for periods less than one full year are not annualized. |
| | (c) | | The Fund’s portfolio turnover rate is calculated in accordance with regulatory requirements, without regard to transactions involving short term investments and certain derivatives. If such transactions were included, the Fund’s portfolio turnover rate may be higher. |
| | (e) | | Amount is less than $0.005 per share. |
| | |
| 78 | | The accompanying notes are an integral part of these financial statements. |
GOLDMAN SACHS COMMODITY STRATEGY FUND
| | | | | | | | | | | | | | | | | | | | | | | | | | | | | | | | | | | | | | | | |
| | | | | | | | | | | | | |
| | | | | | | | | | | | | | | | | | | | | | | | | | | | | | | | | | |
| | | Net asset
value, end
of period | | | | | Total
return(b) | | | | | Net assets,
end of
period (in 000s) | | | | | Ratio of
net expenses
to average
net assets | | | | | Ratio of
total expenses
to average
net assets | | | | | Ratio of
net investment
income (loss)
to average net assets | | | | | Portfolio
turnover
rate(c) | |
| | | | | | | | | | | | | | | | | | | | | | | | | | | | | | | | | | | | | | | | |
| | $ | 5.93 | | | | | | 5.14 | % | | | | $ | 165,318 | | | | | | 0.88 | %(d) | | | | | 0.95 | %(d) | | | | | (0.61 | )%(d) | | | | | 134 | % |
| | | 5.73 | | | | | | 4.95 | | | | | | 12,832 | | | | | | 1.62 | (d) | | | | | 1.70 | (d) | | | | | (1.24 | )(d) | | | | | 134 | |
| | | 5.98 | | | | | | 5.33 | | | | | | 1,271,035 | | | | | | 0.53 | (d) | | | | | 0.61 | (d) | | | | | (0.14 | )(d) | | | | | 134 | |
| | | 5.98 | | | | | | 5.30 | | | | | | 14,243 | | | | | | 0.62 | (d) | | | | | 0.71 | (d) | | | | | (0.18 | )(d) | | | | | 134 | |
| | | 5.86 | | | | | | 5.02 | | | | | | 1,751 | | | | | | 1.12 | (d) | | | | | 1.20 | (d) | | | | | (0.74 | )(d) | | | | | 134 | |
| | | | | | | | | | | | | | | | | | | | | | | | | | | | | | | | | | | | | | | | |
| | | | | | | | | | | | | | | | | | | | | | | | | | | | | | | | | | | | | | | | |
| | | 5.64 | | | | | | (1.57 | ) | | | | | 401,248 | | | | | | 0.92 | | | | | | 0.95 | | | | | | (0.91 | ) | | | | | 266 | |
| | | 5.46 | | | | | | (2.50 | ) | | | | | 11,444 | | | | | | 1.67 | | | | | | 1.70 | | | | | | (1.64 | ) | | | | | 266 | |
| | | 5.67 | | | | | | (1.39 | ) | | | | | 1,039,008 | | | | | | 0.58 | | | | | | 0.61 | | | | | | (0.56 | ) | | | | | 266 | |
| | | 5.68 | | | | | | (1.39 | ) | | | | | 7,991 | | | | | | 0.67 | | | | | | 0.70 | | | | | | (0.64 | ) | | | | | 266 | |
| | | 5.58 | | | | | | (1.93 | ) | | | | | 1,528 | | | | | | 1.17 | | | | | | 1.20 | | | | | | (1.13 | ) | | | | | 266 | |
| | | 5.73 | | | | | | (1.91 | ) | | | | | 353,082 | | | | | | 0.92 | | | | | | 0.96 | | | | | | (0.59 | ) | | | | | 690 | |
| | | 5.60 | | | | | | (2.64 | ) | | | | | 13,994 | | | | | | 1.67 | | | | | | 1.71 | | | | | | (1.39 | ) | | | | | 690 | |
| | | 5.75 | | | | | | (1.57 | ) | | | | | 742,974 | | | | | | 0.58 | | | | | | 0.62 | | | | | | (0.29 | ) | | | | | 690 | |
| | | 5.76 | | | | | | (1.81 | ) | | | | | 7,045 | | | | | | 0.67 | | | | | | 0.71 | | | | | | (0.45 | ) | | | | | 690 | |
| | | 5.69 | | | | | | (2.14 | ) | | | | | 1,450 | | | | | | 1.17 | | | | | | 1.21 | | | | | | (0.86 | ) | | | | | 690 | |
| | | 5.88 | | | | | | (0.56 | ) | | | | | 205,561 | | | | | | 0.92 | | | | | | 0.95 | | | | | | (0.61 | ) | | | | | 581 | |
| | | 5.78 | | | | | | (1.26 | ) | | | | | 15,273 | | | | | | 1.67 | | | | | | 1.70 | | | | | | (1.36 | ) | | | | | 581 | |
| | | 5.89 | | | | | | (0.41 | ) | | | | | 668,618 | | | | | | 0.58 | | | | | | 0.61 | | | | | | (0.27 | ) | | | | | 581 | |
| | | 5.91 | | | | | | (0.28 | ) | | | | | 19,007 | | | | | | 0.67 | | | | | | 0.70 | | | | | | (0.37 | ) | | | | | 581 | |
| | | 5.85 | | | | | | (0.83 | ) | | | | | 1,063 | | | | | | 1.17 | | | | | | 1.20 | | | | | | (0.87 | ) | | | | | 581 | |
| | | 6.03 | | | | | | 8.46 | | | | | | 145,288 | | | | | | 0.92 | | | | | | 0.96 | | | | | | (0.34 | ) | | | | | 162 | |
| | | 5.95 | | | | | | 7.70 | | | | | | 11,455 | | | | | | 1.67 | | | | | | 1.71 | | | | | | (1.10 | ) | | | | | 162 | |
| | | 6.04 | | | | | | 8.85 | | | | | | 641,978 | | | | | | 0.58 | | | | | | 0.62 | | | | | | (0.02 | ) | | | | | 162 | |
| | | 6.05 | | | | | | 8.79 | | | | | | 6,957 | | | | | | 0.67 | | | | | | 0.71 | | | | | | (0.23 | ) | | | | | 162 | |
| | | 6.01 | | | | | | 8.20 | | | | | | 459 | | | | | | 1.17 | | | | | | 1.21 | | | | | | (0.63 | ) | | | | | 162 | |
| | | 6.19 | | | | | | 17.12 | | | | | | 111,685 | | | | | | 0.92 | | | | | | 1.04 | | | | | | 0.37 | | | | | | 104 | |
| | | 6.14 | | | | | | 16.15 | | | | | | 5,669 | | | | | | 1.67 | | | | | | 1.79 | | | | | | (0.35 | ) | | | | | 104 | |
| | | 6.19 | | | | | | 16.84 | | | | | | 475,318 | | | | | | 0.58 | | | | | | 0.70 | | | | | | 0.65 | | | | | | 104 | |
| | | 6.20 | | | | | | 17.76 | | | | | | 67 | | | | | | 0.68 | | | | | | 0.79 | | | | | | 0.81 | | | | | | 104 | |
| | | 6.18 | | | | | | 17.07 | | | | | | 109 | | | | | | 1.17 | | | | | | 1.29 | | | | | | 0.01 | | | | | | 104 | |
| | |
| The accompanying notes are an integral part of these financial statements. | | 79 |
GOLDMAN SACHS DYNAMIC ALLOCATION FUND
Financial Highlights
Selected Data for a Share Outstanding Throughout Each Period
| | | | | | | | | | | | | | | | | | | | | | | | | | | | | | |
| | | | | | | | Income (loss) from
investment operations | | | Distributions
to shareholders | |
| | | Year - Share Class | |
Net asset
value,
beginning
of period | | | Net
investment
income (loss)(a) | | | Net realized
and unrealized
gain (loss) | | | Total from
investment
operations | | | From net
investment
income | | | From net
realized
gains | | | Total
distributions | |
| | FOR THE SIX MONTHS ENDED JUNE 30, (UNAUDITED) | |
| | 2014 - A | | $ | 10.89 | | | $ | (0.04 | ) | | $ | 0.44 | | | $ | 0.40 | | | $ | — | | | $ | �� | | | $ | — | |
| | 2014 - C | | | 10.60 | | | | (0.08 | ) | | | 0.42 | | | | 0.34 | | | | — | | | | — | | | | — | |
| | 2014 - Institutional | | | 11.02 | | | | (0.02 | ) | | | 0.45 | | | | 0.43 | | | | — | | | | — | | | | — | |
| | 2014 - IR | | | 10.99 | | | | (0.02 | ) | | | 0.43 | | | | 0.41 | | | | — | | | | — | | | | — | |
| | 2014 - R | | | 10.83 | | | | (0.05 | ) | | | 0.43 | | | | 0.38 | | | | — | | | | — | | | | — | |
| | | | | | | | | | | | | | | | | | | | | | | | | | | | | | |
| | FOR THE FISCAL YEARS ENDED DECEMBER 31, | |
| | 2013 - A | | | 10.70 | | | | (0.13 | ) | | | 0.68 | | | | 0.55 | | | | — | | | | (0.36 | ) | | | (0.36 | ) |
| | 2013 - C | | | 10.50 | | | | (0.20 | ) | | | 0.66 | | | | 0.46 | | | | — | | | | (0.36 | ) | | | (0.36 | ) |
| | 2013 - Institutional | | | 10.78 | | | | (0.08 | ) | | | 0.68 | | | | 0.60 | | | | — | (e) | | | (0.36 | ) | | | (0.36 | ) |
| | 2013 - IR | | | 10.76 | | | | (0.10 | ) | | | 0.69 | | | | 0.59 | | | | — | | | | (0.36 | ) | | | (0.36 | ) |
| | 2013 - R | | | 10.67 | | | | (0.15 | ) | | | 0.67 | | | | 0.52 | | | | — | | | | (0.36 | ) | | | (0.36 | ) |
| | 2012 - A | | | 10.29 | | | | (0.07 | ) | | | 0.86 | | | | 0.79 | | | | — | | | | (0.38 | ) | | | (0.38 | ) |
| | 2012 - C | | | 10.18 | | | | (0.14 | ) | | | 0.84 | | | | 0.70 | | | | — | | | | (0.38 | ) | | | (0.38 | ) |
| | 2012 - Institutional | | | 10.35 | | | | (0.04 | ) | | | 0.88 | | | | 0.84 | | | | (0.03 | ) | | | (0.38 | ) | | | (0.41 | ) |
| | 2012 - IR | | | 10.33 | | | | (0.03 | ) | | | 0.85 | | | | 0.82 | | | | (0.01 | ) | | | (0.38 | ) | | | (0.39 | ) |
| | 2012 - R | | | 10.28 | | | | (0.09 | ) | | | 0.86 | | | | 0.77 | | | | — | | | | (0.38 | ) | | | (0.38 | ) |
| | 2011 - A | | | 10.54 | | | | (0.03 | ) | | | (0.15 | ) | | | (0.18 | ) | | | (0.04 | ) | | | (0.03 | ) | | | (0.07 | ) |
| | 2011 - C | | | 10.47 | | | | (0.13 | ) | | | (0.12 | ) | | | (0.25 | ) | | | (0.01 | ) | | | (0.03 | ) | | | (0.04 | ) |
| | 2011 - Institutional | | | 10.59 | | | | 0.01 | | | | (0.16 | ) | | | (0.15 | ) | | | (0.06 | ) | | | (0.03 | ) | | | (0.09 | ) |
| | 2011 - IR | | | 10.57 | | | | (0.02 | ) | | | (0.14 | ) | | | (0.16 | ) | | | (0.05 | ) | | | (0.03 | ) | | | (0.08 | ) |
| | 2011 - R | | | 10.52 | | | | (0.05 | ) | | | (0.16 | ) | | | (0.21 | ) | | | — | | | | (0.03 | ) | | | (0.03 | ) |
| | | | | | | | | | | | | | | | | | | | | | | | | | | | | | |
| | FOR THE PERIOD ENDED DECEMBER 31, | | | | | |
| | 2010 - A (Commenced January 5, 2010) | | | 10.00 | | | | (0.04 | ) | | | 0.77 | | | | 0.73 | | | | — | | | | (0.19 | ) | | | (0.19 | ) |
| | 2010 - C (Commenced January 5, 2010) | | | 10.00 | | | | (0.11 | ) | | | 0.77 | | | | 0.66 | | | | — | | | | (0.19 | ) | | | (0.19 | ) |
| | 2010 - Institutional (Commenced January 5, 2010) | | | 10.00 | | | | (0.01 | ) | | | 0.79 | | | | 0.78 | | | | — | | | | (0.19 | ) | | | (0.19 | ) |
| | 2010 - IR (Commenced January 5, 2010) | | | 10.00 | | | | (0.04 | ) | | | 0.80 | | | | 0.76 | | | | — | | | | (0.19 | ) | | | (0.19 | ) |
| | 2010 - R (Commenced January 5, 2010) | | | 10.00 | | | | (0.07 | ) | | | 0.78 | | | | 0.71 | | | | — | | | | (0.19 | ) | | | (0.19 | ) |
| | (a) | | Calculated based on the average shares outstanding methodology. |
| | (b) | | Assumes investment at the net asset value at the beginning of the period, reinvestment of all distributions, a complete redemption of the investment at the net asset value at the end of the period and no sales or redemption charges. Total returns would be reduced if a sales or redemption charge was taken into account. Returns do not reflect the deduction of taxes that a shareholder would pay on Fund distributions or the redemption of Fund shares. Total returns for periods less than one full year are not annualized. |
| | (c) | | The Fund’s portfolio turnover rate is calculated in accordance with regulatory requirements, without regard to transactions involving short term investments and certain derivatives. If such transactions were included, the Fund’s portfolio turnover rate may be higher. |
| | (e) | | Amount is less than $0.005 per share. |
| | (f) | | The ratios of net and total expenses reflects the inclusion of interest and dividend expense for securities sold short during the period. Excluding these expenses, the expense ratios would have been: |
| | | | | | | | | | | | | | | | | | | | |
| | | Class A | | | Class C | | | Institutional | | | Class IR | | | Class R | |
Ratio of net expenses to average net assets | | | 1.39 | % | | | 2.14 | % | | | 0.99 | % | | | 1.14 | % | | | 1.64 | % |
Ratio of total expenses to average net assets | | | 2.11 | | | | 2.86 | | | | 1.71 | | | | 1.86 | | | | 2.36 | |
| | (g) | | The portfolio turnover rate reflects the inclusion of securities sold short during the period. Excluding these securities, the portfolio turnover for each class would have been 175%. |
| | |
| 80 | | The accompanying notes are an integral part of these financial statements. |
GOLDMAN SACHS DYNAMIC ALLOCATION FUND
| | | | | | | | | | | | | | | | | | | | | | | | | | | | | | | | | | | | | | | | |
| | | | | | | | | | | | | |
| | | | | | | | | | | | | | | | | | | | | | | | | | | | | | | | | | |
| | | Net asset
value, end
of period | | | | | Total
return(b) | | | | | Net assets,
end of
period (in 000s) | | | | | Ratio of
net expenses
to average
net assets | | | | | Ratio of
total expenses
to average
net assets | | | | | Ratio of
net investment
income (loss) to average net assets | | | | | Portfolio
turnover
rate(c) | |
| | | | | | | | | | | | | | | | | | | | | | | | | | | | | | | | | | | | | | | | |
| | $ | 11.29 | | | | | | 3.67 | % | | | | $ | 103,959 | | | | | | 1.20 | %(d) | | | | | 1.40 | %(d) | | | | | (0.73 | )%(d) | | | | | 131 | % |
| | | 10.94 | | | | | | 3.21 | | | | | | 50,497 | | | | | | 1.95 | (d) | | | | | 2.15 | (d) | | | | | (1.45 | )(d) | | | | | 131 | |
| | | 11.45 | | | | | | 3.90 | | | | | | 687,941 | | | | | | 0.79 | (d) | | | | | 1.00 | (d) | | | | | (0.28 | )(d) | | | | | 131 | |
| | | 11.40 | | | | | | 3.73 | | | | | | 33,702 | | | | | | 0.94 | (d) | | | | | 1.15 | (d) | | | | | (0.44 | )(d) | | | | | 131 | |
| | | 11.21 | | | | | | 3.51 | | | | | | 12 | | | | | | 1.44 | (d) | | | | | 1.60 | (d) | | | | | (0.92 | )(d) | | | | | 131 | |
| | | | | | | | | | | | | | | | | | | | | | | | | | | | | | | | | | | | | | | | |
| | | | | | | | | | | | | | | | | | | | | | | | | | | | | | | | | | | | | | | | |
| | | 10.89 | | | | | | 5.21 | | | | | | 169,197 | | | | | | 1.30 | | | | | | 1.37 | | | | | | (1.18 | ) | | | | | 311 | |
| | | 10.60 | | | | | | 4.45 | | | | | | 66,543 | | | | | | 2.05 | | | | | | 2.12 | | | | | | (1.89 | ) | | | | | 311 | |
| | | 11.02 | | | | | | 5.65 | | | | | | 756,409 | | | | | | 0.90 | | | | | | 0.97 | | | | | | (0.74 | ) | | | | | 311 | |
| | | 10.99 | | | | | | 5.55 | | | | | | 46,709 | | | | | | 1.05 | | | | | | 1.12 | | | | | | (0.88 | ) | | | | | 311 | |
| | | 10.83 | | | | | | 4.94 | | | | | | 12 | | | | | | 1.55 | | | | | | 1.59 | | | | | | (1.40 | ) | | | | | 311 | |
| | | 10.70 | | | | | | 7.66 | | | | | | 291,432 | | | | | | 1.38 | | | | | | 1.38 | | | | | | (0.61 | ) | | | | | 177 | |
| | | 10.50 | | | | | | 6.86 | | | | | | 76,580 | | | | | | 2.13 | | | | | | 2.13 | | | | | | (1.32 | ) | | | | | 177 | |
| | | 10.78 | | | | | | 8.06 | | | | | | 853,273 | | | | | | 0.97 | | | | | | 0.97 | | | | | | (0.37 | ) | | | | | 177 | |
| | | 10.76 | | | | | | 7.89 | | | | | | 59,935 | | | | | | 1.13 | | | | | | 1.14 | | | | | | (0.31 | ) | | | | | 177 | |
| | | 10.67 | | | | | | 7.48 | | | | | | 11 | | | | | | 1.63 | | | | | | 1.64 | | | | | | (0.84 | ) | | | | | 177 | |
| | | 10.29 | | | | | | (1.72 | ) | | | | | 165,877 | | | | | | 1.39 | | | | | | 1.47 | | | | | | (0.32 | ) | | | | | 297 | |
| | | 10.18 | | | | | | (2.43 | ) | | | | | 56,025 | | | | | | 2.14 | | | | | | 2.22 | | | | | | (1.22 | ) | | | | | 297 | |
| | | 10.35 | | | | | | (1.38 | ) | | | | | 199,083 | | | | | | 0.99 | | | | | | 1.07 | | | | | | 0.08 | | | | | | 297 | |
| | | 10.33 | | | | | | (1.47 | ) | | | | | 56,972 | | | | | | 1.14 | | | | | | 1.22 | | | | | | (0.22 | ) | | | | | 297 | |
| | | 10.28 | | | | | | (2.04 | ) | | | | | 10 | | | | | | 1.64 | | | | | | 1.72 | | | | | | (0.49 | ) | | | | | 297 | |
| | | | | | | | | | | | | | | | | | | | | | | | | | | | | | | | | | | | | | | | |
| | | | | | | | | | | | | | | | | | | | | | | | | | | | | | | | | | | | | | | | |
| | | 10.54 | | | | | | 7.29 | | | | | | 43,222 | | | | | | 1.41 | (d)(f) | | | | | 2.13 | (d)(f) | | | | | (0.39 | )(d) | | | | | 180 | (g) |
| | | 10.47 | | | | | | 6.59 | | | | | | 8,567 | | | | | | 2.16 | (d)(f) | | | | | 2.88 | (d)(f) | | | | | (1.06 | )(d) | | | | | 180 | (g) |
| | | 10.59 | | | | | | 7.80 | | | | | | 84,928 | | | | | | 1.01 | (d)(f) | | | | | 1.73 | (d)(f) | | | | | (0.14 | )(d) | | | | | 180 | (g) |
| | | 10.57 | | | | | | 7.60 | | | | | | 23,477 | | | | | | 1.16 | (d)(f) | | | | | 1.88 | (d)(f) | | | | | (0.38 | )(d) | | | | | 180 | (g) |
| | | 10.52 | | | | | | 7.10 | | | | | | 11 | | | | | | 1.66 | (d)(f) | | | | | 2.38 | (d)(f) | | | | | (0.66 | )(d) | | | | | 180 | (g) |
| | |
| The accompanying notes are an integral part of these financial statements. | | 81 |
GOLDMAN SACHS DYNAMIC COMMODITY STRATEGY FUND
Financial Highlights
Selected Data for a Share Outstanding Throughout the Period
| | | | | | | | | | | | | | | | | | |
| | | | | | | | Income (loss) from
investment operations | |
| | | Year - Share Class | | Net asset
value,
beginning
of period | | | Net
investment
loss(a) | | | Net realized
and unrealized
gain | | | Total from
investment
operations | |
| | FOR THE PERIOD ENDED JUNE 30, (UNAUDITED) | |
| | 2014 - A (Commenced April 30, 2014) | | $ | 10.00 | | | $ | (0.02 | ) | | $ | 0.12 | | | $ | 0.10 | |
| | 2014 - C (Commenced April 30, 2014) | | | 10.00 | | | | (0.03 | ) | | | 0.12 | | | | 0.09 | |
| | 2014 - Institutional (Commenced April 30, 2014) | | | 10.00 | | | | (0.01 | ) | | | 0.12 | | | | 0.11 | |
| | 2014 - IR (Commenced April 30, 2014) | | | 10.00 | | | | (0.01 | ) | | | 0.12 | | | | 0.11 | |
| | 2014 - R (Commenced April 30, 2014) | | | 10.00 | | | | (0.02 | ) | | | 0.12 | | | | 0.10 | |
| | (a) | | Calculated based on the average shares outstanding methodology. |
| | (b) | | Assumes investment at the net asset value at the beginning of the period, reinvestment of all distributions, a complete redemption of the investment at the net asset value at the end of the period and no sales or redemption charges. Total returns would be reduced if a sales or redemption charge was taken into account. Returns do not reflect the deduction of taxes that a shareholder would pay on Fund distributions or the redemption of Fund shares. Total returns for periods less than one full year are not annualized. |
| | (c) | | The Fund’s portfolio turnover rate is calculated in accordance with regulatory requirements, without regard to transactions involving short term investments and certain derivatives. If such transactions were included, the Fund’s portfolio turnover rate may be higher. |
| | |
| 82 | | The accompanying notes are an integral part of these financial statements. |
GOLDMAN SACHS DYNAMIC COMMODITY STRATEGY FUND
| | | | | | | | | | | | | | | | | | | | | | | | | | | | | | | | | | | | | | | | |
| | | | | | | | | | | | | |
| | | | | | | | | | | | | | | | | | | | | | | | | | | | | | | | | | |
| | | Net asset
value, end
of period | | | | | Total
return(b) | | | | | Net assets,
end of
period (in 000s) | | | | | Ratio of
net expenses
to average
net assets(d) | | | | | Ratio of
total expenses
to average
net assets(d) | | | | | Ratio of
net investment
loss to average net assets(d) | | | | | Portfolio
turnover
rate(c) | |
| | | | | | | | | | | | | | | | | | | | | | | | | | | | | | | | | | | | | | | | |
| | $ | 10.10 | | | | | | 1.00 | % | | | | $ | 10 | | | | | | 1.09 | % | | | | | 2.63 | % | | | | | (1.06 | )% | | | | | — | % |
| | | 10.09 | | | | | | 0.90 | | | | | | 10 | | | | | | 1.88 | | | | | | 3.40 | | | | | | (1.88 | ) | | | | | — | |
| | | 10.11 | | | | | | 1.10 | | | | | | 39,355 | | | | | | 0.76 | | | | | | 2.28 | | | | | | (0.75 | ) | | | | | — | |
| | | 10.11 | | | | | | 1.10 | | | | | | 25 | | | | | | 0.85 | | | | | | 2.37 | | | | | | (0.85 | ) | | | | | — | |
| | | 10.10 | | | | | | 1.00 | | | | | | 25 | | | | | | 1.35 | | | | | | 2.87 | | | | | | (1.35 | ) | | | | | — | |
| | |
| The accompanying notes are an integral part of these financial statements. | | 83 |
GOLDMAN SACHS MANAGED FUTURES STRATEGY FUND
Financial Highlights
Selected Data for a Share Outstanding Throughout Each Period
| | | | | | | | | | | | | | | | | | |
| | | | | | | | Income (loss) from
investment operations | |
| | | Year - Share Class | | Net asset
value,
beginning
of period | | | Net
investment
loss(a) | | | Net realized
and unrealized
gain (loss) | | | Total from
investment
operations | |
| | FOR THE SIX MONTHS ENDED JUNE 30, (UNAUDITED) | |
| | 2014 - A | | $ | 10.04 | | | $ | (0.07 | ) | | $ | (0.31 | ) | | $ | (0.38 | ) |
| | 2014 - C | | | 9.89 | | | | (0.10 | ) | | | (0.31 | ) | | | (0.41 | ) |
| | 2014 - Institutional | | | 10.11 | | | | (0.05 | ) | | | (0.32 | ) | | | (0.37 | ) |
| | 2014 - IR | | | 10.08 | | | | (0.06 | ) | | | (0.31 | ) | | | (0.37 | ) |
| | 2014 - R | | | 9.99 | | | | (0.08 | ) | | | (0.32 | ) | | | (0.40 | ) |
| | | | | | | | | | | | | | | | | | |
| | FOR THE FISCAL YEAR ENDED DECEMBER 31, | |
| | 2013 - A | | | 10.56 | | | | (0.15 | ) | | | (0.37 | ) | | | (0.52 | ) |
| | 2013 - C | | | 10.48 | | | | (0.22 | ) | | | (0.37 | ) | | | (0.59 | ) |
| | 2013 - Institutional | | | 10.59 | | | | (0.11 | ) | | | (0.37 | ) | | | (0.48 | ) |
| | 2013 - IR | | | 10.58 | | | | (0.13 | ) | | | (0.37 | ) | | | (0.50 | ) |
| | 2013 - R | | | 10.53 | | | | (0.17 | ) | | | (0.37 | ) | | | (0.54 | ) |
| | | | | | | | | | | | | | | | | | |
| | FOR THE PERIOD ENDED DECEMBER 31, | | | | | | | | | | | | | | | | |
| | 2012 - A (Commenced February 29, 2012) | | | 10.00 | | | | (0.12 | ) | | | 0.68 | | | | 0.56 | |
| | 2012 - C (Commenced February 29, 2012) | | | 10.00 | | | | (0.19 | ) | | | 0.67 | | | | 0.48 | |
| | 2012 - Institutional (Commenced February 29, 2012) | | | 10.00 | | | | (0.09 | ) | | | 0.68 | | | | 0.59 | |
| | 2012 - IR (Commenced February 29, 2012) | | | 10.00 | | | | (0.10 | ) | | | 0.68 | | | | 0.58 | |
| | 2012 - R (Commenced February 29, 2012) | | | 10.00 | | | | (0.15 | ) | | | 0.68 | | | | 0.53 | |
| | (a) | | Calculated based on the average shares outstanding methodology. |
| | (b) | | Assumes investment at the net asset value at the beginning of the period, reinvestment of all distributions, a complete redemption of the investment at the net asset value at the end of the period and no sales or redemption charges. Total returns would be reduced if a sales or redemption charge was taken into account. Returns do not reflect the deduction of taxes that a shareholder would pay on Fund distributions or the redemption of Fund shares. Total returns for periods less than one full year are not annualized. |
| | (c) | | The Fund’s portfolio turnover rate is calculated in accordance with regulatory requirements, without regard to transactions involving short term investments and certain derivatives. If such transactions were included, the Fund’s portfolio turnover rate may be higher. |
| | |
| 84 | | The accompanying notes are an integral part of these financial statements. |
GOLDMAN SACHS MANAGED FUTURES STRATEGY FUND
| | | | | | | | | | | | | | | | | | | | | | | | | | | | | | | | | | | | | | | | |
| | | | | | | | | | | | | |
| | | | | | | | | | | | | | | | | | | | | | | | | | | | | | | | | | |
| | | Net asset
value, end
of period | | | | | Total
return(b) | | | | | Net assets,
end of
period (in 000s) | | | | | Ratio of
net expenses
to average
net assets | | | | | Ratio of
total expenses
to average
net assets | | | | | Ratio of
net investment
loss to average net assets | | | | | Portfolio
turnover
rate(c) | |
| | | | | | | | | | | | | | | | | | | | | | | | | | | | | | | | | | | | | | | | |
| | $ | 9.66 | | | | | | (3.78 | )% | | | | $ | 2,888 | | | | | | 1.43 | %(d) | | | | | 1.92 | %(d) | | | | | (1.48 | )%(d) | | | | | 125 | % |
| | | 9.48 | | | | | | (4.15 | ) | | | | | 1,427 | | | | | | 2.18 | (d) | | | | | 2.65 | (d) | | | | | (2.23 | )(d) | | | | | 125 | |
| | | 9.74 | | | | | | (3.66 | ) | | | | | 97,219 | | | | | | 1.04 | (d) | | | | | 1.49 | (d) | | | | | (1.09 | )(d) | | | | | 125 | |
| | | 9.71 | | | | | | (3.67 | ) | | | | | 340 | | | | | | 1.18 | (d) | | | | | 1.64 | (d) | | | | | (1.24 | )(d) | | | | | 125 | |
| | | 9.59 | | | | | | (4.00 | ) | | | | | 79 | | | | | | 1.69 | (d) | | | | | 2.15 | (d) | | | | | (1.74 | )(d) | | | | | 125 | |
| | | | | | | | | | | | | | | | | | | | | | | | | | | | | | | | | | | | | | | | |
| | | | | | | | | | | | | | | | | | | | | | | | | | | | | | | | | | | | | | | | |
| | | 10.04 | | | | | | (4.83 | ) | | | | | 1,344 | | | | | | 1.46 | | | | | | 2.64 | | | | | | (1.54 | ) | | | | | — | |
| | | 9.89 | | | | | | (5.63 | ) | | | | | 1,536 | | | | | | 2.21 | | | | | | 3.34 | | | | | | (2.28 | ) | | | | | — | |
| | | 10.11 | | | | | | (4.44 | ) | | | | | 106,635 | | | | | | 1.07 | | | | | | 2.18 | | | | | | (1.12 | ) | | | | | — | |
| | | 10.08 | | | | | | (4.64 | ) | | | | | 384 | | | | | | 1.21 | | | | | | 2.32 | | | | | | (1.27 | ) | | | | | — | |
| | | 9.99 | | | | | | (5.13 | ) | | | | | 89 | | | | | | 1.69 | | | | | | 2.82 | | | | | | (1.79 | ) | | | | | — | |
| | | | | | | | | | | | | | | | | | | | | | | | | | | | | | | | | | | | | | | | |
| | | | | | | | | | | | | | | | | | | | | | | | | | | | | | | | | | | | | | | | |
| | | 10.56 | | | | | | 5.50 | | | | | | 272 | | | | | | 1.44 | (d) | | | | | 8.63 | (d) | | | | | (1.47 | )(d) | | | | | — | |
| | | 10.48 | | | | | | 4.80 | | | | | | 339 | | | | | | 2.15 | (d) | | | | | 7.43 | (d) | | | | | (2.18 | )(d) | | | | | — | |
| | | 10.59 | | | | | | 5.80 | | | | | | 19,401 | | | | | | 1.06 | (d) | | | | | 8.04 | (d) | | | | | (1.09 | )(d) | | | | | — | |
| | | 10.58 | | | | | | 5.70 | | | | | | 410 | | | | | | 1.20 | (d) | | | | | 5.65 | (d) | | | | | (1.21 | )(d) | | | | | — | |
| | | 10.53 | | | | | | 5.30 | | | | | | 11 | | | | | | 1.72 | (d) | | | | | 8.98 | (d) | | | | | (1.75 | )(d) | | | | | — | |
| | |
| The accompanying notes are an integral part of these financial statements. | | 85 |
GOLDMAN SACHS INTERNATIONAL REAL ESTATE SECURITIES FUND
Financial Highlights
Selected Data for a Share Outstanding Throughout Each Period
| | | | | | | | | | | | | | | | | | | | | | | | | | | | | | |
| | | | | | | | Income (loss) from
investment operations | | | Distributions
to shareholders | |
| | | Year - Share Class | | Net asset
value,
beginning
of period | | | Net
investment
income(a) | | | Net realized
and unrealized
gain (loss) | | | Total from
investment
operations | | | From net
investment
income | | | From
capital | | | Total
distributions | |
| | FOR THE SIX MONTHS ENDED JUNE 30, (UNAUDITED) | |
| | 2014 - A | | $ | 6.54 | | | $ | 0.10 | | | $ | 0.25 | | | $ | 0.35 | | | $ | (0.09 | ) | | $ | — | | | $ | (0.09 | ) |
| | 2014 - C | | | 6.53 | | | | 0.07 | | | | 0.27 | | | | 0.34 | | | | (0.07 | ) | | | — | | | | (0.07 | ) |
| | 2014 - Institutional | | | 6.35 | | | | 0.11 | | | | 0.26 | | | | 0.37 | | | | (0.11 | ) | | | — | | | | (0.11 | ) |
| | 2014 - IR | | | 6.48 | | | | 0.11 | | | | 0.25 | | | | 0.36 | | | | (0.10 | ) | | | — | | | | (0.10 | ) |
| | | | | | | | | | | | | | | | | | | | | | | | | | | | | | |
| | FOR THE FISCAL YEARS ENDED DECEMBER 31, | |
| | 2013 - A | | | 6.46 | | | | 0.15 | (e) | | | 0.22 | | | | 0.37 | | | | (0.29 | ) | | | — | | | | (0.29 | ) |
| | 2013 - C | | | 6.46 | | | | 0.11 | (e) | | | 0.20 | | | | 0.31 | | | | (0.24 | ) | | | — | | | | (0.24 | ) |
| | 2013 - Institutional | | | 6.29 | | | | 0.18 | (e) | | | 0.20 | | | | 0.38 | | | | (0.32 | ) | | | — | | | | (0.32 | ) |
| | 2013 - IR | | | 6.40 | | | | 0.18 | (e) | | | 0.20 | | | | 0.38 | | | | (0.30 | ) | | | — | | | | (0.30 | ) |
| | 2012 - A | | | 4.94 | | | | 0.12 | | | | 1.95 | | | | 2.07 | | | | (0.55 | ) | | | — | | | | (0.55 | ) |
| | 2012 - C | | | 4.95 | | | | 0.07 | | | | 1.96 | | | | 2.03 | | | | (0.52 | ) | | | — | | | | (0.52 | ) |
| | 2012 - Institutional | | | 4.84 | | | | 0.14 | | | | 1.91 | | | | 2.05 | | | | (0.60 | ) | | | — | | | | (0.60 | ) |
| | 2012 - IR | | | 4.92 | | | | 0.14 | | | | 1.93 | | | | 2.07 | | | | (0.59 | ) | | | — | | | | (0.59 | ) |
| | 2011 - A | | | 6.32 | | | | 0.13 | | | | (1.34 | ) | | | (1.21 | ) | | | (0.17 | ) | | | — | | | | (0.17 | ) |
| | 2011 - C | | | 6.34 | | | | 0.08 | | | | (1.35 | ) | | | (1.27 | ) | | | (0.12 | ) | | | — | | | | (0.12 | ) |
| | 2011 - Institutional | | | 6.20 | | | | 0.15 | | | | (1.32 | ) | | | (1.17 | ) | | | (0.19 | ) | | | — | | | | (0.19 | ) |
| | 2011 - IR | | | 6.30 | | | | 0.15 | | | | (1.35 | ) | | | (1.20 | ) | | | (0.18 | ) | | | — | | | | (0.18 | ) |
| | 2010 - A | | | 6.01 | | | | 0.22 | | | | 0.51 | | | | 0.73 | | | | (0.42 | ) | | | — | | | | (0.42 | ) |
| | 2010 - C | | | 5.98 | | | | 0.16 | | | | 0.54 | | | | 0.70 | | | | (0.34 | ) | | | — | | | | (0.34 | ) |
| | 2010 - Institutional | | | 5.92 | | | | 0.25 | | | | 0.49 | | | | 0.74 | | | | (0.46 | ) | | | — | | | | (0.46 | ) |
| | 2010 - IR | | | 6.00 | | | | 0.27 | | | | 0.48 | | | | 0.75 | | | | (0.45 | ) | | | — | | | | (0.45 | ) |
| | 2009 - A | | | 5.14 | | | | 0.14 | (f) | | | 1.56 | | | | 1.70 | | | | (0.81 | ) | | | (0.02 | ) | | | (0.83 | ) |
| | 2009 - C | | | 5.10 | | | | 0.10 | (f) | | | 1.54 | | | | 1.64 | | | | (0.74 | ) | | | (0.02 | ) | | | (0.76 | ) |
| | 2009 - Institutional | | | 5.10 | | | | 0.16 | (f) | | | 1.53 | | | | 1.69 | | | | (0.85 | ) | | | (0.02 | ) | | | (0.87 | ) |
| | 2009 - IR | | | 5.14 | | | | 0.15 | (f) | | | 1.56 | | | | 1.71 | | | | (0.83 | ) | | | (0.02 | ) | | | (0.85 | ) |
| | (a) | | Calculated based on the average shares outstanding methodology. |
| | (b) | | Assumes investment at the net asset value at the beginning of the period, reinvestment of all distributions, a complete redemption of the investment at the net asset value at the end of the period and no sales or redemption charges. Total returns would be reduced if a sales or redemption charge was taken into account. Returns do not reflect the deduction of taxes that a shareholder would pay on Fund distributions or the redemption of Fund shares. Total returns for periods less than one full year are not annualized. |
| | (c) | | The Fund’s portfolio turnover rate is calculated in accordance with regulatory requirements, without regard to transactions involving short term investments and certain derivatives. If such transactions were included, the Fund’s portfolio turnover rate may be higher. |
| | (e) | | Reflects income recognized from special dividends which amounted to $0.04 per share and 0.65% of average net assets. |
| | (f) | | Reflects income recognized from special dividends which amounted to $0.01 per share and 0.15% of average net assets. |
| | |
| 86 | | The accompanying notes are an integral part of these financial statements. |
GOLDMAN SACHS INTERNATIONAL REAL ESTATE SECURITIES FUND
| | | | | | | | | | | | | | | | | | | | | | | | | | | | | | | | | | | | | | | | |
| | | | | | | | | | | | | | | | | | | | | | | | | | | | | | | | | | |
| | | Net asset
value, end
of period | | | | | Total
return(b) | | | | | Net assets,
end of
period
(in 000s) | | | | | Ratio of
net expenses
to average
net assets | | | | | Ratio of
total expenses
to average
net assets | | | | | Ratio of
net investment
income to average net assets | | | | | Portfolio
turnover
rate(c) | |
| | | | | | | | | | | | | | | | | | | | | | | | | | | | | | | | | | | | | | | | |
| | $ | 6.80 | | | | | | 5.36 | % | | | | $ | 12,094 | | | | | | 1.46 | %(d) | | | | | 1.60 | %(d) | | | | | 3.04 | %(d) | | | | | 23 | % |
| | | 6.80 | | | | | | 5.14 | | | | | | 2,196 | | | | | | 2.21 | (d) | | | | | 2.35 | (d) | | | | | 2.31 | (d) | | | | | 23 | |
| | | 6.61 | | | | | | 5.76 | | | | | | 398,815 | | | | | | 1.06 | (d) | | | | | 1.20 | (d) | | | | | 3.45 | (d) | | | | | 23 | |
| | | 6.74 | | | | | | 5.56 | | | | | | 917 | | | | | | 1.21 | (d) | | | | | 1.35 | (d) | | | | | 3.31 | (d) | | | | | 23 | |
| | | | | | | | | | | | | | | | | | | | | | | | | | | | | | | | | | | | | | | | |
| | | | | | | | | | | | | | | | | | | | | | | | | | | | | | | | | | | | | | | | |
| | | 6.54 | | | | | | 5.81 | | | | | | 14,542 | | | | | | 1.48 | | | | | | 1.60 | | | | | | 2.24 | (e) | | | | | 45 | |
| | | 6.53 | | | | | | 4.90 | | | | | | 2,514 | | | | | | 2.23 | | | | | | 2.35 | | | | | | 1.65 | (e) | | | | | 45 | |
| | | 6.35 | | | | | | 6.15 | | | | | | 387,178 | | | | | | 1.08 | | | | | | 1.20 | | | | | | 2.79 | (e) | | | | | 45 | |
| | | 6.48 | | | | | | 6.11 | | | | | | 944 | | | | | | 1.23 | | | | | | 1.35 | | | | | | 2.70 | (e) | | | | | 45 | |
| | | 6.46 | | | | | | 42.31 | | | | | | 23,019 | | | | | | 1.52 | | | | | | 1.63 | | | | | | 2.01 | | | | | | 55 | |
| | | 6.46 | | | | | | 41.43 | | | | | | 2,253 | | | | | | 2.27 | | | | | | 2.37 | | | | | | 1.23 | | | | | | 55 | |
| | | 6.29 | | | | | | 42.78 | | | | | | 314,518 | | | | | | 1.12 | | | | | | 1.22 | | | | | | 2.35 | | | | | | 55 | |
| | | 6.40 | | | | | | 42.62 | | | | | | 2,043 | | | | | | 1.27 | | | | | | 1.36 | | | | | | 2.25 | | | | | | 55 | |
| | | 4.94 | | | | | | (19.46 | ) | | | | | 83,295 | | | | | | 1.53 | | | | | | 1.64 | | | | | | 2.15 | | | | | | 67 | |
| | | 4.95 | | | | | | (20.20 | ) | | | | | 1,980 | | | | | | 2.28 | | | | | | 2.39 | | | | | | 1.37 | | | | | | 67 | |
| | | 4.84 | | | | | | (19.14 | ) | | | | | 183,167 | | | | | | 1.13 | | | | | | 1.24 | | | | | | 2.56 | | | | | | 67 | |
| | | 4.92 | | | | | | (19.26 | ) | | | | | 16 | | | | | | 1.28 | | | | | | 1.39 | | | | | | 2.59 | | | | | | 67 | |
| | | 6.32 | | | | | | 12.73 | | | | | | 140,955 | | | | | | 1.53 | | | | | | 1.62 | | | | | | 3.74 | | | | | | 69 | |
| | | 6.34 | | | | | | 12.08 | | | | | | 3,157 | | | | | | 2.28 | | | | | | 2.37 | | | | | | 2.78 | | | | | | 69 | |
| | | 6.20 | | | | | | 13.10 | | | | | | 238,149 | | | | | | 1.13 | | | | | | 1.22 | | | | | | 4.19 | | | | | | 69 | |
| | | 6.30 | | | | | | 13.07 | | | | | | 10 | | | | | | 1.28 | | | | | | 1.37 | | | | | | 4.46 | | | | | | 69 | |
| | | 6.01 | | | | | | 33.46 | | | | | | 128,398 | | | | | | 1.53 | | | | | | 1.62 | | | | | | 2.48 | (f) | | | | | 115 | |
| | | 5.98 | | | | | | 32.47 | | | | | | 4,370 | | | | | | 2.28 | | | | | | 2.37 | | | | | | 1.79 | (f) | | | | | 115 | |
| | | 5.92 | | | | | | 33.46 | | | | | | 206,999 | | | | | | 1.13 | | | | | | 1.22 | | | | | | 2.82 | (f) | | | | | 115 | |
| | | 6.00 | | | | | | 33.74 | | | | | | 6 | | | | | | 1.28 | | | | | | 1.37 | | | | | | 2.70 | (f) | | | | | 115 | |
| | |
| The accompanying notes are an integral part of these financial statements. | | 87 |
GOLDMAN SACHS REAL ESTATE SECURITIES FUND
Financial Highlights
Selected Data for a Share Outstanding Throughout Each Period
| | | | | | | | | | | | | | | | | | | | | | |
| | | | | | | | Income (loss) from
investment operations | | | | |
| | | Year - Share Class | | Net asset
value,
beginning
of period | | | Net
investment
income(a) | | | Net realized
and unrealized
gain (loss) | | | Total from
investment
operations | | | Distributions to shareholders from net
investment
income | |
| | FOR THE SIX MONTHS ENDED JUNE 30, (UNAUDITED) | |
| | 2014 - A | | $ | 15.54 | | | $ | 0.16 | | | $ | 2.55 | | | $ | 2.71 | | | $ | (0.20 | ) |
| | 2014 - B | | | 15.44 | | | | 0.08 | | | | 2.55 | | | | 2.63 | | | | (0.13 | ) |
| | 2014 - C | | | 15.18 | | | | 0.09 | | | | 2.49 | | | | 2.58 | | | | (0.14 | ) |
| | 2014 - Institutional | | | 15.80 | | | | 0.19 | | | | 2.59 | | | | 2.78 | | | | (0.23 | ) |
| | 2014 - Service | | | 15.63 | | | | 0.14 | | | | 2.58 | | | | 2.72 | | | | (0.19 | ) |
| | 2014 - IR | | | 15.59 | | | | 0.22 | | | | 2.52 | | | | 2.74 | | | | (0.22 | ) |
| | 2014 - R | | | 15.48 | | | | 0.14 | | | | 2.53 | | | | 2.67 | | | | (0.18 | ) |
| | | | | | | | | | | | | | | | | | | | | | |
| | FOR THE FISCAL YEARS ENDED DECEMBER 31, | |
| | 2013 - A | | | 15.44 | | | | 0.16 | | | | 0.18 | | | | 0.34 | | | | (0.24 | ) |
| | 2013 - B | | | 15.36 | | | | 0.02 | | | | 0.19 | | | | 0.21 | | | | (0.13 | ) |
| | 2013 - C | | | 15.12 | | | | 0.05 | | | | 0.16 | | | | 0.21 | | | | (0.15 | ) |
| | 2013 - Institutional | | | 15.68 | | | | 0.24 | | | | 0.17 | | | | 0.41 | | | | (0.29 | ) |
| | 2013 - Service | | | 15.53 | | | | 0.14 | | | | 0.18 | | | | 0.32 | | | | (0.22 | ) |
| | 2013 - IR | | | 15.49 | | | | 0.22 | | | | 0.15 | | | | 0.37 | | | | (0.27 | ) |
| | 2013 - R | | | 15.39 | | | | 0.14 | | | | 0.16 | | | | 0.30 | | | | (0.21 | ) |
| | 2012 - A | | | 13.48 | | | | 0.12 | | | | 2.05 | | | | 2.17 | | | | (0.21 | ) |
| | 2012 - B | | | 13.43 | | | | 0.03 | | | | 2.02 | | | | 2.05 | | | | (0.12 | ) |
| | 2012 - C | | | 13.22 | | | | 0.04 | | | | 1.99 | | | | 2.03 | | | | (0.13 | ) |
| | 2012 - Institutional | | | 13.67 | | | | 0.21 | | | | 2.05 | | | | 2.26 | | | | (0.25 | ) |
| | 2012 - Service | | | 13.57 | | | | 0.14 | | | | 2.02 | | | | 2.16 | | | | (0.20 | ) |
| | 2012 - IR | | | 13.51 | | | | 0.19 | | | | 2.03 | | | | 2.22 | | | | (0.24 | ) |
| | 2012 - R | | | 13.45 | | | | 0.13 | | | | 2.00 | | | | 2.13 | | | | (0.19 | ) |
| | 2011 - A | | | 12.47 | | | | 0.13 | | | | 1.08 | | | | 1.21 | | | | (0.20 | ) |
| | 2011 - B | | | 12.45 | | | | 0.02 | | | | 1.08 | | | | 1.10 | | | | (0.12 | ) |
| | 2011 - C | | | 12.26 | | | | 0.03 | | | | 1.06 | | | | 1.09 | | | | (0.13 | ) |
| | 2011 - Institutional | | | 12.62 | | | | 0.18 | | | | 1.11 | | | | 1.29 | | | | (0.24 | ) |
| | 2011 - Service | | | 12.55 | | | | 0.11 | | | | 1.10 | | | | 1.21 | | | | (0.19 | ) |
| | 2011 - IR | | | 12.50 | | | | 0.20 | | | | 1.04 | | | | 1.24 | | | | (0.23 | ) |
| | 2011 - R | | | 12.44 | | | | 0.10 | | | | 1.08 | | | | 1.18 | | | | (0.17 | ) |
| | 2010 - A | | | 9.99 | | | | 0.10 | | | | 2.58 | | | | 2.68 | | | | (0.20 | ) |
| | 2010 - B | | | 9.98 | | | | 0.01 | | | | 2.59 | | | | 2.60 | | | | (0.13 | ) |
| | 2010 - C | | | 9.84 | | | | 0.02 | | | | 2.54 | | | | 2.56 | | | | (0.14 | ) |
| | 2010 - Institutional | | | 10.09 | | | | 0.15 | | | | 2.61 | | | | 2.76 | | | | (0.23 | ) |
| | 2010 - Service | | | 10.05 | | | | 0.09 | | | | 2.60 | | | | 2.69 | | | | (0.19 | ) |
| | 2010 - IR | | | 10.00 | | | | 0.18 | | | | 2.54 | | | | 2.72 | | | | (0.22 | ) |
| | 2010 - R | | | 9.97 | | | | 0.08 | | | | 2.57 | | | | 2.65 | | | | (0.18 | ) |
| | 2009 - A | | | 8.25 | | | | 0.21 | | | | 1.75 | | | | 1.96 | | | | (0.22 | ) |
| | 2009 - B | | | 8.25 | | | | 0.16 | | | | 1.74 | | | | 1.90 | | | | (0.17 | ) |
| | 2009 - C | | | 8.15 | | | | 0.16 | | | | 1.71 | | | | 1.87 | | | | (0.18 | ) |
| | 2009 - Institutional | | | 8.34 | | | | 0.25 | | | | 1.75 | | | | 2.00 | | | | (0.25 | ) |
| | 2009 - Service | | | 8.31 | | | | 0.21 | | | | 1.74 | | | | 1.95 | | | | (0.21 | ) |
| | 2009 - IR | | | 8.27 | | | | 0.24 | | | | 1.73 | | | | 1.97 | | | | (0.24 | ) |
| | 2009 - R | | | 8.25 | | | | 0.20 | | | | 1.73 | | | | 1.93 | | | | (0.21 | ) |
| | (a) | | Calculated based on the average shares outstanding methodology. |
| | (b) | | Assumes investment at the net asset value at the beginning of the period, reinvestment of all distributions, a complete redemption of the investment at the net asset value at the end of the period and no sales or redemption charges. Total returns would be reduced if a sales or redemption charge was taken into account. Returns do not reflect the deduction of taxes that a shareholder would pay on Fund distributions or the redemption of Fund shares. Total returns for periods less than one full year are not annualized. |
| | (c) | | The Fund’s portfolio turnover rate is calculated in accordance with regulatory requirements, without regard to transactions involving short term investments and certain derivatives. If such transactions were included, the Fund’s portfolio turnover rate may be higher. |
| | |
| 88 | | The accompanying notes are an integral part of these financial statements. |
GOLDMAN SACHS REAL ESTATE SECURITIES FUND
| | | | | | | | | | | | | | | | | | | | | | | | | | | | | | | | | | | | | | | | |
| | | | | | | | | | | | | |
| | | | | | | | | | | | | | | | | | | | | | | | | | | | | | | | | | |
| | | Net asset
value, end
of period | | | | | Total
return(b) | | | | | Net assets,
end of
period (in 000s) | | | | | Ratio of
net expenses
to average
net assets | | | | | Ratio of
total expenses
to average
net assets | | | | | Ratio of
net investment
income to average net assets | | | | | Portfolio
turnover
rate(c) | |
| | | | | | | | | | | | | | | | | | | | | | | | | | | | | | | | | | | | | | | | |
| | $ | 18.05 | | | | | | 17.49 | % | | | | $ | 68,040 | | | | | | 1.40 | %(d) | | | | | 1.52 | %(d) | | | | | 1.84 | %(d) | | | | | 26 | % |
| | | 17.94 | | | | | | 17.07 | | | | | | 748 | | | | | | 2.14 | (d) | | | | | 2.26 | (d) | | | | | 0.98 | (d) | | | | | 26 | |
| | | 17.62 | | | | | | 17.02 | | | | | | 14,185 | | | | | | 2.14 | (d) | | | | | 2.27 | (d) | | | | | 1.04 | (d) | | | | | 26 | |
| | | 18.35 | | | | | | 17.67 | | | | | | 497,526 | | | | | | 1.00 | (d) | | | | | 1.12 | (d) | | | | | 2.21 | (d) | | | | | 26 | |
| | | 18.16 | | | | | | 17.45 | | | | | | 3,653 | | | | | | 1.50 | (d) | | | | | 1.62 | (d) | | | | | 1.67 | (d) | | | | | 26 | |
| | | 18.11 | | | | | | 17.65 | | | | | | 4,010 | | | | | | 1.15 | (d) | | | | | 1.30 | (d) | | | | | 2.51 | (d) | | | | | 26 | |
| | | 17.97 | | | | | | 17.29 | | | | | | 1,248 | | | | | | 1.65 | (d) | | | | | 1.78 | (d) | | | | | 1.68 | (d) | | | | | 26 | |
| | | | | | | | | | | | | | | | | | | | | | | | | | | | | | | | | | | | | | | | |
| | | | | | | | | | | | | | | | | | | | | | | | | | | | | | | | | | | | | | | | |
| | | 15.54 | | | | | | 2.13 | | | | | | 51,599 | | | | | | 1.41 | | | | | | 1.51 | | | | | | 0.99 | | | | | | 61 | |
| | | 15.44 | | | | | | 1.36 | | | | | | 786 | | | | | | 2.16 | | | | | | 2.26 | | | | | | 0.15 | | | | | | 61 | |
| | | 15.18 | | | | | | 1.35 | | | | | | 12,375 | | | | | | 2.16 | | | | | | 2.26 | | | | | | 0.29 | | | | | | 61 | |
| | | 15.80 | | | | | | 2.54 | | | | | | 419,564 | | | | | | 1.01 | | | | | | 1.11 | | | | | | 1.46 | | | | | | 61 | |
| | | 15.63 | | | | | | 2.03 | | | | | | 3,342 | | | | | | 1.51 | | | | | | 1.61 | | | | | | 0.88 | | | | | | 61 | |
| | | 15.59 | | | | | | 2.33 | | | | | | 808 | | | | | | 1.16 | | | | | | 1.26 | | | | | | 1.33 | | | | | | 61 | |
| | | 15.48 | | | | | | 1.90 | | | | | | 802 | | | | | | 1.66 | | | | | | 1.76 | | | | | | 0.90 | | | | | | 61 | |
| | | 15.44 | | | | | | 16.11 | | | | | | 63,171 | | | | | | 1.44 | | | | | | 1.51 | | | | | | 0.80 | | | | | | 40 | |
| | | 15.36 | | | | | | 15.26 | | | | | | 1,434 | | | | | | 2.19 | | | | | | 2.26 | | | | | | 0.19 | | | | | | 40 | |
| | | 15.12 | | | | | | 15.34 | | | | | | 12,403 | | | | | | 2.19 | | | | | | 2.26 | | | | | | 0.25 | | | | | | 40 | |
| | | 15.68 | | | | | | 16.59 | | | | | | 381,641 | | | | | | 1.04 | | | | | | 1.11 | | | | | | 1.40 | | | | | | 40 | |
| | | 15.53 | | | | | | 15.93 | | | | | | 4,694 | | | | | | 1.54 | | | | | | 1.61 | | | | | | 0.91 | | | | | | 40 | |
| | | 15.49 | | | | | | 16.45 | | | | | | 540 | | | | | | 1.19 | | | | | | 1.26 | | | | | | 1.26 | | | | | | 40 | |
| | | 15.39 | | | | | | 15.90 | | | | | | 521 | | | | | | 1.69 | | | | | | 1.76 | | | | | | 0.88 | | | | | | 40 | |
| | | 13.48 | | | | | | 9.79 | | | | | | 166,917 | | | | | | 1.44 | | | | | | 1.51 | | | | | | 0.98 | | | | | | 46 | |
| | | 13.43 | | | | | | 8.89 | | | | | | 1,850 | | | | | | 2.19 | | | | | | 2.26 | | | | | | 0.13 | | | | | | 46 | |
| | | 13.22 | | | | | | 8.91 | | | | | | 10,954 | | | | | | 2.19 | | | | | | 2.26 | | | | | | 0.22 | | | | | | 46 | |
| | | 13.67 | | | | | | 10.32 | | | | | | 402,103 | | | | | | 1.04 | | | | | | 1.11 | | | | | | 1.38 | | | | | | 46 | |
| | | 13.57 | | | | | | 9.71 | | | | | | 4,670 | | | | | | 1.54 | | | | | | 1.61 | | | | | | 0.83 | | | | | | 46 | |
| | | 13.51 | | | | | | 9.99 | | | | | | 443 | | | | | | 1.19 | | | | | | 1.26 | | | | | | 1.57 | | | | | | 46 | |
| | | 13.45 | | | | | | 9.51 | | | | | | 245 | | | | | | 1.69 | | | | | | 1.76 | | | | | | 0.74 | | | | | | 46 | |
| | | 12.47 | | | | | | 27.07 | | | | | | 161,065 | | | | | | 1.44 | | | | | | 1.50 | | | | | | 0.95 | | | | | | 59 | |
| | | 12.45 | | | | | | 26.18 | | | | | | 2,923 | | | | | | 2.19 | | | | | | 2.25 | | | | | | 0.13 | | | | | | 59 | |
| | | 12.26 | | | | | | 26.18 | | | | | | 10,907 | | | | | | 2.19 | | | | | | 2.25 | | | | | | 0.21 | | | | | | 59 | |
| | | 12.62 | | | | | | 27.67 | | | | | | 373,776 | | | | | | 1.04 | | | | | | 1.10 | | | | | | 1.33 | | | | | | 59 | |
| | | 12.55 | | | | | | 26.99 | | | | | | 5,345 | | | | | | 1.54 | | | | | | 1.60 | | | | | | 0.83 | | | | | | 59 | |
| | | 12.50 | | | | | | 27.39 | | | | | | 90 | | | | | | 1.19 | | | | | | 1.25 | | | | | | 1.50 | | | | | | 59 | |
| | | 12.44 | | | | | | 26.80 | | | | | | 237 | | | | | | 1.69 | | | | | | 1.75 | | | | | | 0.78 | | | | | | 59 | |
| | | 9.99 | | | | | | 25.12 | | | | | | 138,409 | | | | | | 1.44 | | | | | | 1.55 | | | | | | 2.76 | | | | | | 114 | |
| | | 9.98 | | | | | | 24.20 | | | | | | 4,058 | | | | | | 2.19 | | | | | | 2.30 | | | | | | 2.08 | | | | | | 114 | |
| | | 9.84 | | | | | | 24.09 | | | | | | 8,192 | | | | | | 2.19 | | | | | | 2.30 | | | | | | 2.08 | | | | | | 114 | |
| | | 10.09 | | | | | | 25.48 | | | | | | 356,025 | | | | | | 1.04 | | | | | | 1.15 | | | | | | 3.18 | | | | | | 114 | |
| | | 10.05 | | | | | | 24.84 | | | | | | 5,589 | | | | | | 1.54 | | | | | | 1.65 | | | | | | 2.73 | | | | | | 114 | |
| | | 10.00 | | | | | | 25.39 | | | | | | 7 | | | | | | 1.19 | | | | | | 1.30 | | | | | | 3.07 | | | | | | 114 | |
| | | 9.97 | | | | | | 24.81 | | | | | | 116 | | | | | | 1.69 | | | | | | 1.80 | | | | | | 2.44 | | | | | | 114 | |
| | |
| The accompanying notes are an integral part of these financial statements. | | 89 |
GOLDMAN SACHS SELECT SATELLITE FUNDS
Notes to Financial Statements
June 30, 2014 (Unaudited)
Goldman Sachs Trust (the “Trust”) is a Delaware statutory trust registered under the Investment Company Act of 1940, as amended (the “Act”), as an open-end management investment company. The following table lists those series of the Trust that are included in this report (collectively, the “Funds” or individually a “Fund”), along with their corresponding share classes and respective diversification status under the Act:
| | | | |
| Fund | | Share Classes Offered* | | Diversified/ Non-diversified |
Absolute Return Tracker | | A, C, Institutional, IR and R | | Diversified |
Commodity Strategy, Dynamic Allocation, Dynamic Commodity Strategy(a) and Managed Futures Strategy | | A, C, Institutional, IR and R | | Non-diversified |
International Real Estate Securities | | A, C, Institutional and IR | | Non-diversified |
Real Estate Securities | | A, B, C, Institutional, Service, IR and R | | Non-diversified |
| * | | Class B Shares are generally no longer available for purchase by current or prospective investors. |
| (a) | | Commenced operations on April 30, 2014. |
Class A Shares of the Absolute Return Tracker, Dynamic Allocation, Managed Futures Strategy, International Real Estate Securities, and Real Estate Securities Funds are sold with a front-end sales charge of up to 5.50%. Class A Shares of the Commodity Strategy and Dynamic Commodity Strategy Funds are sold with a front-end sales charge of up to 4.50%. Class B Shares were sold with a contingent deferred sales charge (“CDSC”) that declines from 5.00% to zero, depending upon the period of time the shares are held. Class C Shares are sold with a CDSC of 1.00%, which is imposed on redemptions made within 12 months of purchase. Institutional, Service, Class IR and Class R Shares are not subject to a sales charge.
Goldman Sachs Asset Management, L.P. (“GSAM”), an affiliate of Goldman, Sachs & Co. (“Goldman Sachs”), serves as Investment Adviser to the Funds pursuant to management agreements (the “Agreements”) with the Trust.
|
| 2. SIGNIFICANT ACCOUNTING POLICIES |
The financial statements have been prepared in accordance with accounting principles generally accepted in the United States of America (“GAAP”) and require management to make estimates and assumptions that may affect the reported amounts and disclosures. Actual results may differ from those estimates and assumptions.
A. Basis for Consolidation for Absolute Return Tracker, Commodity Strategy and Dynamic Commodity Strategy Funds — Goldman Sachs Cayman Commodity-ART Fund, Ltd., Goldman Sachs Cayman Commodity Fund, Ltd. and Goldman Sachs DCS Cayman Commodity Fund, Ltd. (each, a “Subsidiary” and collectively, the “Subsidiaries”), Cayman Islands exempted companies, were incorporated on September 11, 2013, April 2, 2009 and March 10, 2014, respectively, and are currently wholly-owned subsidiaries of the Absolute Return Tracker, Commodity Strategy and Dynamic Commodity Strategy Funds, respectively. The Subsidiaries act as an investment vehicle for the Funds to enable the Funds to gain exposure to certain types of commodity-linked derivative instruments. Each Fund is the sole shareholder of its respective Subsidiary pursuant to a subscription agreement, and it is intended that each Fund will remain the sole shareholder and will continue to control its respective Subsidiary. Under the Articles of Association of each Subsidiary, shares issued by the Subsidiary confer upon a shareholder the right to vote at general meetings of the Subsidiary and certain rights in connection with any winding-up or repayment of capital, as well as the right to participate in the profits or assets of the Subsidiary. All inter-fund balances and transactions have been eliminated in consolidation.
90
GOLDMAN SACHS SELECT SATELLITE FUNDS
|
| 2. SIGNIFICANT ACCOUNTING POLICIES (continued) |
As of June 30, 2014, the Fund and Subsidiary net assets were as follows:
| | | | | | | | | | | | |
| Fund | | | | Fund Net Assets | | Subsidiary Net
Assets | | | % Represented by
Subsidiary’s Net Assets | |
Absolute Return Tracker | | | | $1,940,851,055 | | $ | 58,665,352 | | | | 3 | % |
Commodity Strategy | | | | 1,465,179,687 | | | 293,364,751 | | | | 20 | |
Dynamic Commodity Strategy | | | | 39,425,349 | | | 7,664,554 | | | | 19 | |
B. Investment Valuation — The Funds’ valuation policy is to value investments at fair value.
C. Investment Income and Investments — Investment income includes interest income and dividend income, net of any foreign withholding taxes, less any amounts reclaimable. Interest income is accrued daily and adjusted for amortization of premiums and accretion of discounts. Dividend income is recognized on ex-dividend date or, for certain foreign securities, as soon as such information is obtained subsequent to the ex-dividend date. Investment transactions are reflected on trade date. Realized gains and losses are calculated using identified cost. Investment transactions are recorded on the following business day for daily net asset value (“NAV”) calculations. Any foreign capital gains tax is accrued daily based upon net unrealized gains, and is payable upon sale of such investments. Distributions received from the Funds’ investments in United States (“U.S.”) real estate investment trusts (“REITs”) may be characterized as ordinary income, net capital gain or a return of capital. A return of capital is recorded by the Funds as a reduction to the cost basis of the REIT.
For derivative contracts, realized gains and losses are recorded upon settlement of the contract. Upfront payments are made or received upon entering into a swap agreement and are reflected in the Statement of Assets and Liabilities. Upfront payments are recognized over the contract’s term/event as realized gains or losses, with the exception of forward starting interest rate swaps whose realized gains or losses are recognized from the effective start date. For securities with paydown provisions, principal payments received are treated as a proportionate reduction to the cost basis of the securities, and excess or shortfall amounts are recorded as gains or losses. For treasury inflation protected securities (“TIPS”), adjustments to principal due to inflation/deflation are reflected as increases/decreases to interest income with a corresponding adjustment to cost.
D. Class Allocations and Expenses — Investment income, realized and unrealized gain (loss), and non-class specific expenses of each Fund are allocated daily based upon the proportion of net assets of each class. Class specific expenses, where applicable, are borne by the respective share classes and include Distribution and Service, Transfer Agent and Service and Shareholder Administration fees. Non-class specific expenses directly incurred by a Fund are charged to that Fund, while such expenses incurred by the Trust are allocated across the respective Funds on a straight-line and/or pro-rata basis depending upon the nature of the expenses.
E. Offering and Organization Costs — Offering costs paid in connection with the offering of shares of the Dynamic Commodity Strategy Fund are being amortized on a straight-line basis over 12 months from the date of commencement of operations. Organization costs paid in connection with the organization of Dynamic Commodity Strategy Fund, DCS Cayman Commodity Fund, Ltd., and Cayman Commodity ART Fund, Ltd., were expensed on the first day of operations.
F. Federal Taxes and Distributions to Shareholders — It is each Fund’s policy to comply with the requirements of the Internal Revenue Code of 1986, as amended (the “Code”), applicable to regulated investment companies (mutual funds) and to distribute each year substantially all of its investment company taxable income and capital gains to its shareholders. Accordingly,
91
GOLDMAN SACHS SELECT SATELLITE FUNDS
Notes to Financial Statements (continued)
June 30, 2014 (Unaudited)
|
| 2. SIGNIFICANT ACCOUNTING POLICIES (continued) |
the Funds are not required to make any provisions for the payment of federal income tax. Distributions to shareholders are recorded on the ex-dividend date. Income and capital gains distributions, if any, are declared and paid according to the following schedule:
| | | | | | |
| Fund | | | | Income Distributions Declared/Paid | | Capital Gains Distributions
Declared/Paid |
Absolute Return Tracker, Dynamic Allocation and Managed Futures Strategy | | | | Annually | | Annually |
Real Estate Securities | | | | Quarterly | | Annually |
Commodity Strategy, Dynamic Commodity Strategy and International Real Estate Securities | | | | Semi-Annually | | Annually |
Net capital losses are carried forward to future fiscal years and may be used to the extent allowed by the Code to offset any future capital gains. Utilization of capital loss carryforwards will reduce the requirement of future capital gains distributions.
The Subsidiaries are classified as controlled foreign corporations under the Code. Therefore, the Absolute Return Tracker, Commodity Strategy and Dynamic Commodity Strategy Funds are required to increase their taxable income by their share of their Subsidiary’s income. Net losses of a Subsidiary cannot be deducted by the Funds in the current period nor carried forward to offset taxable income in future periods.
Under the Regulated Investment Company Modernization Act of 2010, the Funds are permitted to carry forward capital losses incurred in taxable years beginning after December 22, 2010 for an unlimited period. However, any losses incurred during those future taxable years will be required to be utilized prior to the losses incurred in pre-enactment taxable years. As a result of this ordering rule, pre-enactment capital loss carryforwards may be more likely to expire unused. Additionally, post-enactment capital losses that are carried forward will retain their character as either short-term or long-term capital losses rather than being considered all short-term as under previous law.
The characterization of distributions to shareholders for financial reporting purposes is determined in accordance with federal income tax rules, which may differ from GAAP. The source of each Fund’s distributions may be shown in the accompanying financial statements as either from net investment income, net realized gain or capital. Certain components of the Funds’ net assets on the Statements of Assets and Liabilities reflect permanent GAAP/tax differences based on the appropriate tax character.
G. Foreign Currency Translation — The accounting records and reporting currency of the Funds are maintained in U.S. dollars. Assets and liabilities denominated in foreign currencies are translated into U.S. dollars using the current exchange rates at the close of each business day. The effect of changes in foreign currency exchange rates on investments is included within net realized and unrealized gain (loss) on investments. Changes in the value of other assets and liabilities as a result of fluctuations in foreign exchange rates are included in the Statements of Operations within net change in unrealized gain (loss) on foreign currency transactions. Transactions denominated in foreign currencies are translated into U.S. dollars on the date the transaction occurred, the effects of which are included within net realized gain (loss) on foreign currency transactions.
|
| 3. INVESTMENTS AND FAIR VALUE MEASUREMENTS |
The fair value of a financial instrument is the amount that would be received to sell an asset or paid to transfer a liability in an orderly transaction between market participants at the measurement date (i.e., the exit price). GAAP establishes a fair value hierarchy that prioritizes the inputs to valuation techniques used to measure fair value. The hierarchy gives the highest priority to unadjusted quoted prices in active markets for identical assets or liabilities (Level 1 measurements) and the lowest priority to
92
GOLDMAN SACHS SELECT SATELLITE FUNDS
|
| 3. INVESTMENTS AND FAIR VALUE MEASUREMENTS (continued) |
unobservable inputs (Level 3 measurements). The levels used for classifying investments are not necessarily an indication of the risk associated with investing in these investments. The three levels of the fair value hierarchy are described below:
Level 1 — Unadjusted quoted prices in active markets that are accessible at the measurement date for identical, unrestricted assets or liabilities;
Level 2 — Quoted prices in markets that are not active or financial instruments for which significant inputs are observable (including, but not limited to, quoted prices for similar investments, interest rates, foreign exchange rates, volatility and credit spreads), either directly or indirectly;
Level 3 — Prices or valuations that require significant unobservable inputs (including GSAM’s assumptions in determining fair value measurement).
The Trustees have adopted Valuation Procedures that govern the valuation of the portfolio investments held by the Funds, including investments for which market quotations are not readily available. The Trustees have delegated to GSAM day-to-day responsibility for implementing and maintaining internal controls and procedures related to the valuation of the Funds’ portfolio investments. To assess the continuing appropriateness of pricing sources and methodologies, GSAM regularly performs price verification procedures and issues challenges as necessary to third party pricing vendors or brokers, and any differences are reviewed in accordance with the Valuation Procedures.
A. Level 1 and Level 2 Fair Value Investments — The valuation techniques and significant inputs used in determining the fair values for investments classified as Level 1 and Level 2 are as follows:
Equity Securities — Equity securities and investment companies traded on a U.S. securities exchange or the NASDAQ system, or those located on certain foreign exchanges, including but not limited to the Americas, are valued daily at their last sale price or official closing price on the principal exchange or system on which they are traded. If no sale occurs, equity securities and exchange traded investment companies are valued at the last bid price for long positions and at the last ask price for short positions. Investments in investment companies (other than those that are exchange traded) are valued at the NAV on the valuation date. To the extent these investments are actively traded, they are classified as Level 1 of the fair value hierarchy, otherwise they are generally classified as Level 2.
Unlisted equity securities for which market quotations are available are valued at the last sale price on the valuation date, or if no sale occurs, at the last bid price. Securities traded on certain foreign securities exchanges are valued daily at fair value determined by an independent fair value service (if available) under Valuation Procedures approved by the Trustees and consistent with applicable regulatory guidance. The independent fair value service takes into account multiple factors including, but not limited to, movements in the securities markets, certain depositary receipts, futures contracts and foreign currency exchange rates that have occurred subsequent to the close of the foreign securities exchange. These investments are generally classified as Level 2 of the fair value hierarchy.
Debt Securities — Debt securities for which market quotations are readily available are valued daily on the basis of quotations supplied by dealers or an independent pricing service approved by the Trustees. The pricing services may use valuation models or matrix pricing, which consider: (i) yield or price with respect to bonds that are considered comparable in characteristics such as rating, interest rate and maturity date or (ii) quotations from securities dealers to determine current value. Short-term debt obligations that mature in sixty days or less and that do not exhibit signs of credit deterioration are valued at amortized cost, which approximates fair value. With the exception of treasury securities of G8 countries (not held in money market funds), which are generally classified as Level 1, these investments are generally classified as Level 2 of the fair value hierarchy.
i. Commodity Index-Linked Structured Notes — The value of a commodity index-linked structured note is based on the price movements of a commodity index. The value of these notes will rise and fall in response to changes in the underlying commodity index. These notes are often leveraged, increasing the volatility of each note’s value relative to the change in the underlying linked index. Commodity index-linked investments may be more volatile and less liquid than the underlying index, and their value may be affected by the performance of commodities as well as other factors including liquidity, quality, maturity and other economic variables. These notes are subject to prepayment, credit and interest rate risks.
93
GOLDMAN SACHS SELECT SATELLITE FUNDS
Notes to Financial Statements (continued)
June 30, 2014 (Unaudited)
|
| 3. INVESTMENTS AND FAIR VALUE MEASUREMENTS (continued) |
These notes have an automatic redemption feature if the underlying index declines from the purchase date by the amount specified in the agreement. A Fund has the option to request prepayment from the issuer at any time. Interim payments received (paid) are recorded as net realized gains (losses), and at maturity, or when a structured note is sold, a Fund records a realized gain or loss.
ii. Mortgage-Backed and Asset-Backed Securities — Mortgage-backed securities represent direct or indirect participations in, or are collateralized by and payable from, mortgage loans secured by residential and/or commercial real estate property. Asset-backed securities include securities whose principal and interest payments are collateralized by pools of other assets or receivables. The value of certain mortgage-backed and asset-backed securities (including adjustable rate mortgage loans) may be particularly sensitive to changes in prevailing interest rates. The value of these securities may also fluctuate in response to the market’s perception of the creditworthiness of the issuers.
Asset-backed securities may present credit risks that are not presented by mortgage-backed securities because they generally do not have the benefit of a security interest in collateral that is comparable to mortgage assets. Some asset-backed securities may only have a subordinated claim on collateral.
Stripped mortgage-backed securities are usually structured with two different classes: one that receives substantially all interest payments (interest-only, or “IO” and/or high coupon rate with relatively low principal amount, or “IOette”), and the other that receives substantially all principal payments (principal-only, or “PO”) from a pool of mortgage loans. Little to no principal will be received at the maturity of an IO; as a result, periodic adjustments are recorded to reduce the cost of the security until maturity. These adjustments are included in interest income.
iii. Mortgage Dollar Rolls — Mortgage dollar rolls are transactions whereby a Fund sells mortgage-backed securities and simultaneously contracts with the same counterparty to repurchase similar securities on a specified future date. During the settlement period, a Fund will not be entitled to accrue interest and receive principal payments on the securities sold.
iv. Treasury Inflation Protected Securities — TIPS are treasury securities in which the principal amount is adjusted daily to keep pace with inflation, as measured by the U.S. Consumer Pricing Index for Urban Consumers. The repayment of the original bond principal upon maturity is guaranteed by the full faith and credit of the U.S. Government.
v. When-Issued Securities and Forward Commitments — When-issued securities, including TBA (“To Be Announced”) securities, are securities that are authorized but not yet issued in the market and purchased in order to secure what is considered to be an advantageous price or yield to a Fund. A forward commitment involves entering into a contract to purchase or sell securities, typically on an extended settlement basis, for a fixed price at a future date. The purchase of securities on a when-issued or forward commitment basis involves a risk of loss if the value of the security to be purchased declines before the settlement date. Conversely, the sale of securities on a forward commitment basis involves the risk that the value of the securities sold may increase before the settlement date. Although a Fund will generally purchase securities on a when-issued or forward commitment basis with the intention of acquiring the securities for its portfolio, the Fund may dispose of when-issued securities or forward commitments prior to settlement which may result in a realized gain or loss.
Derivative Contracts — A derivative is an instrument whose value is derived from underlying assets, indices, reference rates or a combination of these factors.
Exchange-traded derivatives, including futures contracts, typically fall within Level 1 of the fair value hierarchy. Over-the-counter (“OTC”) and centrally cleared derivatives are valued using market transactions and other market evidence, including market-based inputs to models, calibration to market-clearing transactions, broker or dealer quotations, or other alternative pricing sources. Where models are used, the selection of a particular model to value OTC and centrally cleared derivatives depends upon the contractual terms of, and specific risks inherent in, the instrument, as well as the availability of pricing information in the market. Valuation models require a variety of inputs, including contractual terms, market prices, yield curves, credit curves, measures of volatility, voluntary and involuntary prepayment rates, loss severity rates and correlations of such inputs. For OTC and centrally cleared derivatives that trade in liquid markets, model inputs can generally be verified and model selection does not
94
GOLDMAN SACHS SELECT SATELLITE FUNDS
|
| 3. INVESTMENTS AND FAIR VALUE MEASUREMENTS (continued) |
involve significant management judgment. OTC and centrally cleared derivatives are classified within Level 2 of the fair value hierarchy when significant inputs are corroborated by market evidence.
i. Forward Foreign Currency Exchange Contracts — In a forward foreign currency contract, a Fund agrees to receive or deliver a fixed quantity of one currency for another, at a pre-determined price at a future date. All forward foreign currency exchange contracts are marked-to-market daily at the applicable forward rate. Non-deliverable forward foreign currency exchange contracts are settled with the counterparty in cash without the delivery of foreign currency.
ii. Futures Contracts — Futures contracts are contracts to buy or sell a standardized quantity of a specified commodity or security and are valued based on exchanged settlement prices or independent market quotes. Futures contracts are valued at the last settlement price, or in the absence of a sale, the last bid price for long positions and at the last ask price for short positions, at the end of each day on the board of trade or exchange upon which they are traded. Upon entering into a futures contract, a Fund deposits cash or securities in an account on behalf of the broker in an amount sufficient to meet the initial margin requirement. Subsequent payments are made or received by a Fund equal to the daily change in the contract value and are recorded as variation margin receivable or payable with a corresponding offset to unrealized gains or losses.
iii. Options — When a Fund writes call or put options, an amount equal to the premium received is recorded as a liability and is subsequently marked-to-market to reflect the current value of the option written. Swaptions are options on interest rate swap contracts.
Upon the purchase of a call option or a put option by a Fund, the premium paid is recorded as an investment and subsequently marked-to-market to reflect the current value of the option. Certain options may be purchased with premiums to be determined on a future date. The premiums for these options are based upon implied volatility parameters at specified terms.
iv. Swap Contracts — Bilateral swap contracts are agreements in which a Fund and a counterparty agree to exchange periodic payments on a specified notional amount or make a net payment upon termination. Bilateral swap transactions are privately negotiated in the OTC market and payments are settled through direct payments between a Fund and the counterparty. By contrast, certain swap transactions are subject to mandatory central clearing. These swaps are executed through a derivatives clearing member (“DCM”), acting in an agency capacity, and submitted to a central counterparty (“CCP”)(“centrally cleared swaps”), in which case all payments are settled with the CCP through the DCM. Swaps are marked-to-market daily using pricing vendor quotations, counterparty or clearinghouse prices or model prices, and the change in value, if any, is recorded as an unrealized gain or loss. Upon entering into a swap contract, a Fund is required to satisfy an initial margin requirement by delivering cash or securities to the counterparty (or in some cases, segregated in a triparty account on behalf of the counterparty), which can be adjusted by any mark-to-market gains or losses pursuant to bilateral or centrally cleared arrangements. For centrally cleared swaps the daily change in valuation, if any, is recorded as a receivable or payable for variation margin.
An interest rate swap is an agreement that obligates two parties to exchange a series of cash flows at specified intervals, based upon or calculated by reference to changes in interest rates on a specified notional principal amount. The payment flows are usually netted against each other, with the difference being paid by one party to the other.
A credit default swap is an agreement that involves one party (the buyer of protection) making a stream of payments to another party (the seller of protection) in exchange for the right to receive protection on a reference security or obligation, including a group of assets or exposure to the performance of an index. A Fund’s investment in credit default swaps may involve greater risks than if the Fund had invested in the referenced obligation directly. Credit events are contract specific but may include bankruptcy, failure to pay, restructuring and obligation acceleration. If a Fund buys protection through a credit default swap and no credit event occurs, its payments are limited to the periodic payments previously made to the counterparty. Upon the occurrence of a specified credit event, a Fund, as a buyer of credit protection, is entitled to receive an amount equal to the notional amount of the swap and deliver to the seller the defaulted reference obligation in a physically settled trade. A Fund may also receive a net settlement amount in the form of cash or securities equal to the notional amount of the swap reduced by the recovery value of the reference obligation in cash settled trade.
95
GOLDMAN SACHS SELECT SATELLITE FUNDS
Notes to Financial Statements (continued)
June 30, 2014 (Unaudited)
|
| 3. INVESTMENTS AND FAIR VALUE MEASUREMENTS (continued) |
As a seller of protection, a Fund generally receives a payment stream throughout the term of the swap, provided that there is no credit event. In addition, if a Fund sells protection through a credit default swap, a Fund could suffer a loss because the value of the referenced obligation and the premium payments received may be less than the notional amount of the swap paid to the buyer of protection. Upon the occurrence of a specified credit event, a Fund, as a seller of credit protection, may be required to take possession of the defaulted reference obligation and pay the buyer an amount equal to the notional amount of the swap in a physically settled trade. A Fund may also pay a net settlement amount in the form of cash or securities equal to the notional amount of the swap reduced by the recovery value of the reference obligation in cash settled trade. Recovery values are at times established through the credit event auction process in which market participants are ensured that a transparent price has been set for the defaulted security or obligation. In addition, a Fund is entitled to a return of any assets, which have been pledged as collateral to the counterparty.
The maximum potential amount of future payments (undiscounted) that a Fund as seller of protection could be required to make under a credit default swap would be an amount equal to the notional amount of the agreement. These potential amounts would be partially offset by any recovery values of the respective referenced obligations or net amounts received from a settlement of a credit default swap for the same reference security or obligation where a Fund bought credit protection.
A total return swap is an agreement that gives a Fund the right to receive the appreciation in the value of a specified security, index or other instrument in return for a fee paid to the counterparty, which will typically be an agreed upon interest rate. If the underlying asset declines in value over the term of the swap, a Fund may also be required to pay the dollar value of that decline to the counterparty.
Short Term Investments — Short-term investments having a maturity of 60 days or less are generally valued at amortized cost which approximates fair market value. These investments are classified as Level 2 of the fair value hierarchy.
B. Level 3 Fair Value Investments — To the extent that the aforementioned significant inputs are unobservable, or if quotations are not readily available, or if GSAM believes that such quotations do not accurately reflect fair value, the fair value of the Funds’ investments may be determined under Valuation Procedures approved by the Trustees. GSAM, consistent with its procedures and applicable regulatory guidance, may make an adjustment to the most recent valuation prices of either domestic or foreign securities in light of significant events to reflect what it believes to be the fair value of the securities at the time of determining a Fund’s NAV. Significant events which could affect a large number of securities in a particular market may include, but are not limited to: significant fluctuations in U.S. or foreign markets; market dislocations; market disruptions; or unscheduled market closings. Significant events which could also affect a single issuer may include, but are not limited to: corporate actions such as reorganizations, mergers and buy-outs; ratings downgrades; and bankruptcies.
C. Fair Value Hierarchy — The following is a summary of the Funds’ investments and derivatives classified in the fair value hierarchy as of June 30, 2014:
| | | | | | | | | | | | |
|
| ABSOLUTE RETURN TRACKER | |
| | | |
| Investment Type | | Level 1 | | | Level 2 | | | Level 3 | |
| Assets | | | | | | | | | | | | |
Investment Company | | $ | 1,635,133,763 | | | $ | — | | | $ | — | |
Exchange Traded Funds | | | 48,888,205 | | | | — | | | | — | |
| Total | | $ | 1,684,021,968 | | | $ | — | | | $ | — | |
96
GOLDMAN SACHS SELECT SATELLITE FUNDS
|
| 3. INVESTMENTS AND FAIR VALUE MEASUREMENTS (continued) |
| | | | | | | | | | | | |
|
| ABSOLUTE RETURN TRACKER (continued) | |
| | | |
| Derivative Type | | Level 1 | | | Level 2 | | | Level 3 | |
| Assets(a) | | | | | | | | | | | | |
Futures Contracts | | $ | 10,009,027 | | | $ | — | | | $ | — | |
Forward Foreign Currency Exchange Contracts | | | — | | | | 827,012 | | | | — | |
Credit Default Swap Contracts | | | — | | | | 3,567,216 | | | | — | |
Total Return Swap Contracts | | | — | | | | 16,313 | | | | — | |
| Total | | $ | 10,009,027 | | | $ | 4,410,541 | | | $ | — | |
| Liabilities | | | | | | | | | | | | |
Futures Contracts(a) | | $ | (3,911,173 | ) | | $ | — | | | $ | — | |
Forward Foreign Currency Exchange Contracts(a) | | | — | | | | (337,420 | ) | | | — | |
Total Return Swap Contracts(a) | | | — | | | | (7,064 | ) | | | — | |
Written Options Contracts | | | — | | | | (1,970,550 | ) | | | — | |
| Total | | $ | (3,911,173 | ) | | $ | (2,315,034 | ) | | $ | — | |
| | | |
| COMMODITY STRATEGY | | | | | | | | | | | | |
| | | |
| Investment Type | | Level 1 | | | Level 2 | | | Level 3 | |
| Assets | | | | | | | | | | | | |
Fixed Income | | | | | | | | | | | | |
Mortgage-Backed Obligations | | $ | — | | | $ | 144,433,446 | | | $ | — | |
U.S. Treasury Obligations and/or Other U.S. Government Agencies | | | 180,708,054 | | | | — | | | | — | |
Asset-Backed Securities | | | — | | | | 237,740 | | | | — | |
Investment Company | | | 776,026,076 | | | | — | | | | — | |
| Total | | $ | 956,734,130 | | | $ | 144,671,186 | | | $ | — | |
| | | |
| Derivative Type | | | | | | | | | |
| Assets(a) | | | | | | | | | | | | |
Futures Contracts | | $ | 112,364 | | | $ | — | | | $ | — | |
Total Return Swap Contracts | | | — | | | | 34,971,426 | | | | — | |
| Total | | $ | 112,364 | | | $ | 34,971,426 | | | $ | — | |
| Liabilities(a) | | | | | | | | | | | | |
Futures Contracts | | $ | (648,920 | ) | | $ | — | | | $ | — | |
Interest Rate Swap Contracts | | | — | | | | (408,135 | ) | | | — | |
| Total | | $ | (648,920 | ) | | $ | (408,135 | ) | | $ | — | |
97
GOLDMAN SACHS SELECT SATELLITE FUNDS
Notes to Financial Statements (continued)
June 30, 2014 (Unaudited)
|
| 3. INVESTMENTS AND FAIR VALUE MEASUREMENTS (continued) |
| | | | | | | | | | | | |
| | | |
| DYNAMIC ALLOCATION | | | | | | | | | | | | |
| | | |
| Investment Type | | Level 1 | | | Level 2 | | | Level 3 | |
| Assets | | | | | | | | | | | | |
Fixed Income | | | | | | | | | | | | |
Commodity Index-Linked Structured Notes | | $ | — | | | $ | 15,214,472 | | | $ | — | |
U.S. Treasury Obligations and/or Other U.S. Government Agencies | | | 23,264,037 | | | | — | | | | — | |
Common Stock and/or Other Equity Investments(b) | | | | | | | | | | | | |
North America | | | 255,275,582 | | | | — | | | | — | |
Investment Company | | | 429,893,629 | | | | | | | | | |
Exchange Traded Funds | | | 53,132,617 | | | | | | | | | |
| Total | | $ | 761,565,865 | | | $ | 15,214,472 | | | $ | — | |
| | | |
| Derivative Type | | | | | | | | | |
| Assets(a) | | | | | | | | | | | | |
Futures Contracts | | $ | 2,213,601 | | | $ | — | | | $ | — | |
Forward Foreign Currency Exchange Contracts | | | — | | | | 438 | | | | — | |
Credit Default Swap Contracts | | | — | | | | 1,594,416 | | | | — | |
Total Return Swap Contracts | | | — | | | | 4,850,083 | | | | — | |
| Total | | $ | 2,213,601 | | | $ | 6,444,937 | | | $ | — | |
| Liabilities(a) | | | | | | | | | | | | |
Futures Contracts | | $ | (1,075,202 | ) | | $ | — | | | $ | — | |
Forward Foreign Currency Exchange Contracts | | | — | | | | (548,376 | ) | | | — | |
| | | $ | (1,075,202 | ) | | $ | (548,376 | ) | | $ | — | |
| | | |
| DYNAMIC COMMODITY STRATEGY | | | | | | | | | | | | |
| | | |
| Investment Type | | Level 1 | | | Level 2 | | | Level 3 | |
| Assets | | | | | | | | | | | | |
Investment Company | | $ | 31,726,306 | | | $ | — | | | $ | — | |
| | | |
| Derivative Type | | | | | | | | | |
| Assets(a) | | | | | | | | | | | | |
Total Return Swap Contracts | | $ | — | | | $ | 1,030,742 | | | $ | — | |
| Liabilities(a) | | | | | | | | | | | | |
Total Return Swap Contracts | | $ | — | | | $ | (329,870 | ) | | $ | — | |
98
GOLDMAN SACHS SELECT SATELLITE FUNDS
|
| 3. INVESTMENTS AND FAIR VALUE MEASUREMENTS (continued) |
| | | | | | | | | | | | |
| | | |
| MANAGED FUTURES STRATEGY | | | | | | | | | | | | |
| | | |
| Investment Type | | Level 1 | | | Level 2 | | | Level 3 | |
| Assets | | | | | | | | | | | | |
Fixed Income | | | | | | | | | | | | |
Commodity Index-Linked Structured Notes | | $ | — | | | $ | 8,823,600 | | | $ | — | |
Investment Company | | | 77,340,523 | | | | — | | | | — | |
| Total | | $ | 77,340,523 | | | $ | 8,823,600 | | | $ | — | |
| | | |
| Derivative Type | | | | | | | | | |
| Assets(a) | | | | | | | | | | | | |
Futures Contracts | | $ | 403,012 | | | $ | — | | | $ | — | |
Forward Foreign Currency Exchange Contracts | | | — | | | | 412,716 | | | | — | |
Interest Rate Swap Contracts | | | — | | | | 1,897,582 | | | | — | |
| Total | | $ | 403,012 | | | $ | 2,310,298 | | | $ | — | |
| Liabilities(a) | | | | | | | | | | | | |
Futures Contracts | | $ | (281,481 | ) | | $ | — | | | $ | — | |
Forward Foreign Currency Exchange Contracts | | | — | | | | (228,280 | ) | | | — | |
Interest Rate Swap Contracts | | | — | | | | (1,048,038 | ) | | | — | |
| Total | | $ | (281,481 | ) | | $ | (1,276,318 | ) | | $ | — | |
| | | |
| INTERNATIONAL REAL ESTATE SECURITIES | | | | | | | | | | | | |
| | | |
| Investment Type | | Level 1 | | | Level 2 | | | Level 3 | |
| Assets | | | | | | | | | | | | |
Common Stock and/or Other Equity Investments(b) | | | | | | | | | | | | |
North America | | $ | 29,325,418 | | | $ | — | | | $ | — | |
Asia | | | — | | | | 202,654,916 | | | | — | |
Australia | | | — | | | | 55,135,413 | | | | — | |
Europe | | | — | | | | 126,816,524 | | | | — | |
| Total | | $ | 29,325,418 | | | $ | 384,606,853 | | | $ | — | |
| | | |
| REAL ESTATE SECURITIES | | | | | | | | | | | | |
| | | |
| Investment Type | | Level 1 | | | Level 2 | | | Level 3 | |
| Assets | | | | | | | | | | | | |
Common Stock and/or Other Equity Investments(b) | | | | | | | | | | | | |
Europe | | $ | — | | | $ | 6,034,218 | | | $ | — | |
North America | | | 564,053,688 | | | | — | | | | — | |
| Total | | $ | 564,053,688 | | | $ | 6,034,218 | | | $ | — | |
| (a) | | Amount shown represents unrealized gain (loss) at period end. |
| (b) | | Amounts are disclosed by continent to highlight the impact of time zone differences between local market close and the calculation of net asset value. Security valuations are based on the principal exchange or system on which they are traded, which may differ from country of domicile. The Funds utilize fair value model prices provided by an independent fair value service for international equities, resulting in a Level 2 classification. |
For further information regarding security characteristics, see the Schedules of Investments.
99
GOLDMAN SACHS SELECT SATELLITE FUNDS
Notes to Financial Statements (continued)
June 30, 2014 (Unaudited)
|
| 4. INVESTMENTS IN DERIVATIVES |
The following tables set forth, by certain risk types, the gross value of derivative contracts as of June 30, 2014. These instruments were used to meet the Funds’ investment objectives and to obtain and/or manage exposure related to the risks below. The values in the tables below exclude the effects of cash collateral received or posted pursuant to these derivative contracts, and therefore are not representative of the Funds’ net exposure.
| | | | | | | | | | | | |
| | | |
| ABSOLUTE RETURN TRACKER | | | | | | | | | | |
| Risk | | Statements of Assets
and Liabilities | | Assets | | | Statements of Assets
and Liabilities | | Liabilities | |
Commodity | | Variation margin on certain
derivative contracts | | $ | 415,171 | (a) | | Variation margin on certain
derivative contracts | | $ | (755,214) | (a) |
Credit | | Variation margin on certain
derivative contracts | | | 3,567,216 | (a) | | — | | | — | |
Currency | | Receivable for unrealized gain
on forward foreign currency
exchange contracts | | | 827,012 | | | Payable for unrealized loss on
forward foreign currency
exchange contracts | | | (337,420) | |
Equity | | Receivable for unrealized gain
on swap contracts and
variation margin on certain
derivative contracts | | | 8,315,998 | (a) | | Payable for unrealized loss on
swap contracts, Written options,
at value, Variation margin on
certain derivative contracts | | | (5,089,269) | (a)(b) |
Interest Rate | | Variation margin on certain
derivative contracts | | | 1,294,171 | (a) | | Variation margin on certain
derivative contracts | | | (44,304) | (a) |
| Total | | | | $ | 14,419,568 | | | | | $ | (6,226,207) | |
| | | |
| COMMODITY STRATEGY | | | | | | | | | | |
| Risk | | Statements of Assets
and Liabilities | | Assets | | | Statements of Assets
and Liabilities | | Liabilities | |
Commodity | | Receivable for unrealized gain
on swap contracts | | $ | 34,971,426 | | | — | | $ | — | |
Interest Rate | | Variation margin on certain
derivative contracts | | | 112,364 | (a) | | Variation margin on certain
derivative contracts | | | (1,057,055) | (a) |
| Total | | | | $ | 35,083,790 | | | | | $ | (1,057,055) | |
100
GOLDMAN SACHS SELECT SATELLITE FUNDS
|
| 4. INVESTMENTS IN DERIVATIVES (continued) |
| | | | | | | | | | | | |
| | | |
| DYNAMIC ALLOCATION | | | | | | | | | | |
| Risk | | Statements of Assets
and Liabilities | | Assets | | | Statements of Assets
and Liabilities | | Liabilities | |
Credit | | Variation margin on certain
derivative contracts | | $ | 1,594,416 | (a) | | — | | $ | — | |
Currency | | Receivable for unrealized gain
on forward foreign currency exchange contracts | | | 438 | | | Payable for unrealized loss on
forward foreign currency
exchange contracts | | | (548,376) | |
Equity | | Receivable for unrealized gain
on swap contracts, Variation
margin on certain derivative
contracts | | | 6,668,100 | (a) | | Variation margin on certain
derivative contracts | | | (1,074,420) | (a) |
Interest Rate | | Variation margin on certain
derivative contracts | | | 402,108 | (a) | | Variation margin on certain
derivative contracts | | | (7,306) | (a) |
| Total | | | | $ | 8,665,062 | | | | | $ | (1,630,102) | |
| | | |
| DYNAMIC COMMODITY STRATEGY | | | | | | | | | | |
| Risk | | Statements of Assets
and Liabilities | | Assets | | | Statements of Assets
and Liabilities | | Liabilities | |
Commodity | | Receivable for unrealized gain
on swap contracts | | $ | 1,030,741 | | | Payment for unrealized loss
on swap contracts | | $ | (329,869) | (b) |
| | | |
| MANAGED FUTURES STRATEGY | | | | | | | | | | |
| Risk | | Statements of Assets
and Liabilities | | Assets | | | Statements of Assets
and Liabilities | | Liabilities | |
Currency | | Receivable for unrealized gain
on forward foreign currency
exchange contracts | | $ | 412,716 | | | Payable for unrealized loss on forward foreign currency
exchange contracts | | $ | (228,280) | |
Equity | | Variation margin on certain
derivative contracts | | | 403,012 | (a) | | Variation margin on certain
derivative contracts | | | (281,481) | (a) |
Interest Rate | | Variation margin on certain
derivative contracts | | | 1,897,582 | (a) | | Variation margin on certain
derivative contracts | | | (1,048,038) | (a) |
| Total | | | | $ | 2,713,310 | | | | | $ | (1,557,799) | |
| (a) | | Includes unrealized gain (loss) on futures contracts and centrally cleared swap contracts described in the Additional Investment Information sections of the Schedules of Investments. Only current day's variation margin is reported within the Statements of Assets and Liabilities. |
| (b) | | Aggregate of amounts include $7,064 and $329,869 for the Absolute Return Tracker and Dynamic Commodity Strategy Funds, respectively, which represent the payments to be made pursuant to bilateral agreements should counterparties exercise their "right to terminate" provisions based on, among others, the Funds' performance, their failure to pay on its obligations or failure to pledge collateral. Such amounts do not include incremental charges directly associated with the close-out of the agreements. They also do not reflect the fair value of any assets pledged as collateral which, through the daily margining process, substantially offsets the aforementioned amounts and for which the Funds are entitled to a full return. |
101
GOLDMAN SACHS SELECT SATELLITE FUNDS
Notes to Financial Statements (continued)
June 30, 2014 (Unaudited)
|
| 4. INVESTMENTS IN DERIVATIVES (continued) |
The following tables set forth by certain risk types, the Funds’ gain (losses) related to these derivatives and their indicative volumes for the six months ended June 30, 2014. These gains (losses) should be considered in the context that these derivative contracts may have been executed to create investment opportunities and/or economically hedge certain investments, and accordingly, certain gains (losses) on such derivative contracts may offset certain (losses) gains attributable to investments. These gains (losses) are included in “Net realized gain (loss)” or “Net change in unrealized gain (loss)” on the Statements of Operations:
| | | | | | | | | | | | | | |
|
| ABSOLUTE RETURN TRACKER | |
| Risk | | Statements of Operations | | Net
Realized
Gain (Loss) | | | Net Change in
Unrealized
Gain (Loss) | | | Average
Number of
Contracts(a) | |
| Commodity | | Net realized gain (loss) from futures contracts/Net change in unrealized gain (loss) on futures contracts | | $ | (290,041 | ) | | $ | (340,043 | ) | | | 1,073 | |
| Currency | | Net realized gain (loss) from forward foreign currency exchange contracts/Net change in unrealized gain (loss) on forward foreign currency exchange contracts | | | 1,038,125 | | | | 548,542 | | | | 41 | |
| Credit | | Net realized gain (loss) from swap contracts/Net change in unrealized gain (loss) on swap contracts | | | 7,447,360 | | | | (3,285,412 | ) | | | 1 | |
| Equity | | Net realized gain (loss) from futures contracts, swap contracts and written options/Net change in unrealized gain (loss) on futures contracts, swap contracts and written options | | | 53,055,153 | | | | (19,246,849 | ) | | | 11,622 | |
| Interest rate | | Net realized gain (loss) from futures contracts/Net change in unrealized gain (loss) on futures contracts | | | 1,972,118 | | | | (620,093 | ) | | | 2,829 | |
| Total | | | | $ | 63,222,715 | | | $ | (22,943,855 | ) | | | 15,566 | |
| | | |
| COMMODITY STRATEGY | | | | | | | | | | | | |
| Risk | | Statements of Operations | | Net
Realized
Gain (Loss) | | | Net Change in
Unrealized
Gain (Loss) | | | Average
Number of
Contracts(a) | |
| Commodity | | Net realized gain (loss) from swap contracts/Net change in unrealized gain (loss) on swap contracts | | $ | 67,184,313 | | | $ | 16,809,809 | | | | 8 | |
| Interest rate | | Net realized gain (loss) from futures contracts and swap contracts/Net change in unrealized gain (loss) on futures contracts and swap contracts | | | (3,576,905 | ) | | | (1,980,629 | ) | | | 1,792 | |
| Total | | | | $ | 63,607,408 | | | $ | 14,829,180 | | | | 1,800 | |
102
GOLDMAN SACHS SELECT SATELLITE FUNDS
|
| 4. INVESTMENTS IN DERIVATIVES (continued) |
| | | | | | | | | | | | | | |
|
| DYNAMIC ALLOCATION | |
| Risk | | Statements of Operations | | Net
Realized
Gain (Loss) | | | Net Change in
Unrealized
Gain (Loss) | | | Average
Number of
Contracts(a) | |
| Credit | | Net realized gain (loss) from swap contracts/Net change in unrealized gain (loss) on swap contracts | | $ | 1,639,017 | | | $ | (378,424 | ) | | | 3 | |
| Currency | | Net realized gain (loss) from forward foreign currency exchange contracts/Net change in unrealized gain (loss) on forward foreign currency exchange contracts | | | 421,660 | | | | (547,938 | ) | | | 2 | |
| Equity | | Net realized gain (loss) from futures contracts and swap contracts/Net change in unrealized gain (loss) on futures contracts and swap contracts | | | 13,566,184 | | | | (11,597,341 | ) | | | 2,945 | |
| Interest rate | | Net realized gain (loss) from futures contracts/Net change in unrealized gain (loss) on futures contracts | | | 3,037,156 | | | | 2,845,138 | | | | 1,284 | |
| Total | | | | $ | 18,664,017 | | | $ | (9,678,565 | ) | | | 4,234 | |
| | | |
| DYNAMIC COMMODITY STRATEGY | | | | | | | | | | | | |
| Risk | | Statements of Operations | | Net
Realized
Gain (Loss) | | | Net Change in
Unrealized
Gain (Loss) | | | Average
Number of
Contracts(a) | |
| Commodity | | Net realized gain (loss) from swap contracts/Net change in unrealized gain (loss) on swap contracts | | $ | (225,635 | ) | | $ | 700,872 | | | | 28 | |
|
| MANAGED FUTURES STRATEGY | |
| Risk | | Statements of Operations | | Net
Realized
Gain (Loss) | | | Net Change in
Unrealized
Gain (Loss) | | | Average
Number of
Contracts(a) | |
| Currency | | Net realized gain (loss) from forward foreign currency exchange contracts/Net change in unrealized gain (loss) on forward foreign currency exchange contracts | | $ | (907,972 | ) | | $ | 55,647 | | | | 97 | |
| Equity | | Net realized gain (loss) from futures contracts/Net change in unrealized gain (loss) on futures contracts | | | 3,391,356 | | | | (2,866,892 | ) | | | 1,744 | |
| Interest rate | | Net realized gain (loss) from swap contracts/Net change in unrealized gain (loss) on swap contracts | | | (3,155,144 | ) | | | 406,066 | | | | 167 | |
| Total | | | | $ | (671,760 | ) | | $ | (2,405,179 | ) | | | 2,008 | |
| (a) | | Average number of contracts is based on the average of month end balances at period end. |
103
GOLDMAN SACHS SELECT SATELLITE FUNDS
Notes to Financial Statements (continued)
June 30, 2014 (Unaudited)
|
| 4. INVESTMENTS IN DERIVATIVES (continued) |
In order to better define its contractual rights and to secure rights that will help a Fund mitigate its counterparty risk, a Fund may enter into an International Swaps and Derivatives Association, Inc. Master Agreement (“ISDA Master Agreement”) or similar agreement with its derivatives counterparties. An ISDA Master Agreement is a bilateral agreement between a Fund and a counterparty that governs OTC derivatives, including foreign exchange contracts, and typically contains, among other things, collateral posting terms and netting provisions in the event of a default and/or termination event. The provisions of the ISDA Master Agreement typically permit a single net payment in the event of a default (close-out netting) or similar event, including the bankruptcy or insolvency of the counterparty.
Collateral and margin requirements differ between exchange traded derivatives and OTC derivatives. Margin requirements are established by the broker or clearing house for exchange-traded and centrally cleared derivatives (financial futures contracts, options and centrally cleared swaps) pursuant to governing agreements for those instrument types. Brokers can ask for margin in excess of the minimum in certain circumstances. Collateral terms are contract-specific for OTC derivatives (foreign currency exchange contracts, and certain options and swaps). For derivatives traded under an ISDA Master Agreement, the collateral requirements are typically calculated by netting the marked to market amount for each transaction under such agreement and comparing that amount to the value of any collateral currently pledged by a Fund and the counterparty. Additionally, a Fund may be required to post initial margin to the counterparty, the terms of which would be outlined in the confirmation of the OTC transaction.
For financial reporting purposes, cash collateral that has been pledged to cover obligations of a Fund and cash collateral received from the counterparty, if any, is reported separately on the Statements of Assets and Liabilities as receivables/payables for collateral on certain derivative contracts. Non-cash collateral pledged by a Fund, if any, is noted in the Schedules of Investments. Generally, the amount of collateral due from or to a counterparty must exceed a minimum transfer amount threshold before a transfer is required to be made. To the extent amounts due to a Fund from its counterparties are not fully collateralized, contractually or otherwise, the Fund bears the risk of loss from counterparty nonperformance. A Fund attempts to mitigate counterparty risk by only entering into agreements with counterparties that it believes to be of good standing and by monitoring the financial stability of those counterparties.
Additionally, the netting of assets and liabilities and the offsetting of collateral pledged or received are based on contractual netting/set-off provisions in the ISDA Master Agreement or similar agreements. However, in the event of a default or insolvency of a counterparty, a court could determine that such rights are not enforceable due the restrictions or prohibitions against the right of setoff that may be imposed due to a particular jurisdiction’s bankruptcy or insolvency laws.
104
GOLDMAN SACHS SELECT SATELLITE FUNDS
|
| 4. INVESTMENTS IN DERIVATIVES (continued) |
The following tables set forth the Funds with significant exposure for derivative instruments that are subject to enforceable master netting arrangements or similar agreements as of June 30, 2014:
| | | | | | | | | | | | | | | | |
|
| COMMODITY STRATEGY | |
| | | Derivative Assets(1) | | | Net Derivative Assets
(Liabilities) | | | Collateral
(Received) Pledged(1) | | | Net Amount(2) | |
| Counterparty | | Swaps | | | | |
Deutsche Bank AG | | $ | 7,827,273 | | | $ | 7,827,273 | | | $ | — | | | $ | 7,827,273 | |
Macquarie Bank Ltd. | | | 5,360,768 | | | | 5,360,768 | | | | — | | | | 5,360,768 | |
Merrill Lynch International | | | 10,372,678 | | | | 10,372,678 | | | | — | | | | 10,372,678 | |
Societe Generale SA | | | 363,915 | | | | 363,915 | | | | — | | | | 363,915 | |
UBS AG | | | 11,046,792 | | | | 11,046,792 | | | | — | | | | 11,046,792 | |
Total | | $ | 34,971,426 | | | $ | 34,971,426 | | | $ | — | | | $ | 34,971,426 | |
| (1) | | Gross amounts available for offset but not netted in the Statement of Assets and Liabilities. |
| (2) | | Net amount represents the net amount due (to) from counterparty in the event of a default based on the contractual set-off rights under the agreement. |
| | | | | | | | | | | | | | | | | | | | |
| | | | |
| DYNAMIC COMMODITY STRATEGY | | | | | | | | | | | | | | | | | |
| | | Derivative Assets(1) | | | Derivative Liabilities(1) | | | Net Derivative Assets
(Liabilities) | | | Collateral
(Received) Pledged(1) | | | Net Amount(2) | |
| Counterparty | | Swaps | | | Swaps | | | | |
Merrill Lynch International | | $ | 1,030,742 | | | $ | (329,870 | ) | | $ | 700,872 | | | $ | — | | | $ | 700,872 | |
| (1) | | Gross amounts available for offset but not netted in the Statement of Assets and Liabilities. |
| (2) | | Net amount represents the net amount due (to) from counterparty in the event of a default based on the contractual set-off rights under the agreement. |
|
| 5. AGREEMENTS AND AFFILIATED TRANSACTIONS |
A. Management Agreement — Under the Agreement, GSAM manages the Funds, subject to the general supervision of the Trustees.
As compensation for the services rendered pursuant to the Agreement, the assumption of the expenses related thereto and administration of the Funds’ business affairs, including providing facilities, GSAM is entitled to a management fee, accrued daily and paid monthly, equal to an annual percentage rate of each Fund’s average daily net assets.
105
GOLDMAN SACHS SELECT SATELLITE FUNDS
Notes to Financial Statements (continued)
June 30, 2014 (Unaudited)
|
| 5. AGREEMENTS AND AFFILIATED TRANSACTIONS (continued) |
For the six months ended June 30, 2014, contractual and effective net management fees with GSAM were at the following rates:
| | | | | | | | | | | | | | | | | | | | | | | | | | | | | | |
| | | | | Contractual Management Fee Rate | | | Effective Net
Management
Fee Rate | |
| Fund | | | | First
$1 billion | | | Next
$1 billion | | | Next
$3 billion | | | Next
$3 billion | | | Over
$8 billion | | | Effective
Rate | | |
Absolute Return Tracker | | | | | 1.15 | % | | | 1.04 | % | | | 0.99 | % | | | 0.97 | % | | | 0.95 | % | | | 1.10 | % | | | 0.58 | %(1)(2) |
Commodity Strategy | | | | | 0.50 | | | | 0.50 | | | | 0.45 | | | | 0.43 | | | | 0.42 | | | | 0.50 | | | | 0.44 | (1)(2) |
Dynamic Allocation | | | | | 0.90 | | | | 0.81 | | | | 0.77 | | | | 0.75 | | | | 0.74 | | | | 0.90 | | | | 0.74 | (1)(3) |
Dynamic Commodity Strategy | | | | | 0.80 | | | | 0.80 | | | | 0.72 | | | | 0.68 | | | | 0.67 | | | | 0.80 | | | | 0.71 | (1)(2) |
Managed Futures Strategy | | | | | 1.00 | | | | 0.90 | | | | 0.86 | | | | 0.84 | | | | 0.82 | | | | 1.00 | | | | 0.89 | (1)(3) |
International Real Estate Securities | | | | | 1.05 | | | | 1.05 | | | | 0.95 | | | | 0.90 | | | | 0.88 | | | | 1.05 | | | | 1.01 | (3) |
Real Estate Securities | | | | | 1.00 | | | | 0.90 | | | | 0.86 | | | | 0.84 | | | | 0.82 | | | | 1.00 | | | | 0.95 | (3) |
| (1) | | GSAM has agreed to waive a portion of its management fee payable by the Funds in an amount equal to any management fees they earn as an investment adviser to any of the affiliated funds in which they invest through at least April 30, 2015. Prior to such date GSAM may not terminate the arrangement without the approval of the Trustees. For the period ended June 30, 2014, GSAM waived $1,069,208, $455,244, $439,581, $6,114 and $54,585 of its management fee for the Absolute Return Tracker, Commodity Strategy, Dynamic Allocation, Dynamic Commodity Strategy and Managed Futures Strategy Funds, respectively. |
| (2) | | Reflects combined management fees paid to GSAM under the Agreement and the Subsidiary Agreement (as defined below) after the waivers. |
| (3) | | GSAM has agreed to waive a portion of its management fee in order to achieve net management rates, as defined in the Fund’s most recent prospectus. These waivers will be effective through at least April 30, 2015 and prior to such date GSAM may not terminate the arrangement without approval of the Trustees. The Effective Net Management Rates above are calculated based on management rates before and after the waivers had been adjusted, if applicable. |
GSAM also provides management services to each Subsidiary pursuant to a Subsidiary Management Agreement (each, a “Subsidiary Agreement”) and is entitled to a management fee accrued daily and paid monthly, equal to an annual percentage rate of 0.42% of each Subsidiary’s average daily net assets. The Investment Adviser has contractually agreed to waive the advisory fees it receives from the Absolute Return Tracker, Commodity Strategy and Dynamic Commodity Strategy Funds, respectively, in an amount equal to the advisory fee paid to the Investment Adviser by each applicable Subsidiary. These waivers may not be discontinued by the Investment Adviser as long as its contract with each Subsidiary is in place. In this regard, for the six months ended June 30, 2014, GSAM waived $5,896, $688,296, and $5,546 of management fees for the Absolute Return Tracker, Commodity Strategy, and Dynamic Commodity Strategy Funds, respectively.
106
GOLDMAN SACHS SELECT SATELLITE FUNDS
|
| 5. AGREEMENTS AND AFFILIATED TRANSACTIONS (continued) |
For the six months ended June 30, 2014, GSAM waived $3,626,510, $271,486 and $1,942 of its management fee for the Absolute Return Tracker, Dynamic Allocation and Managed Futures Strategy Funds, respectively.
B. Distribution and Service Plans — The Trust, on behalf of each Fund, has adopted Distribution and Service Plans (the “Plans”). Under the Plans, Goldman Sachs, which serves as distributor (the “Distributor”), is entitled to a fee accrued daily and paid monthly, for distribution services and personal and account maintenance services, which may then be paid by Goldman Sachs to authorized dealers, at the following annual rates calculated on a Fund’s average daily net assets of each respective share class:
| | | | | | | | | | | | | | | | |
| | | Distribution and Service Plan Rates | |
| | | Class A* | | | Class B | | | Class C | | | Class R* | |
Distribution Plan | | | 0.25 | % | | | 0.75 | % | | | 0.75 | % | | | 0.50 | % |
Service Plan | | | — | | | | 0.25 | | | | 0.25 | | | | — | |
| * | | With respect to Class A and Class R Shares, the Distributor at its discretion may use compensation for distribution services paid under the Distribution Plan to compensate service organizations for personal and account maintenance services and expenses as long as such total compensation does not exceed the maximum cap on “service fees” imposed by the Financial Industry Regulatory Authority. |
C. Distribution Agreement — Goldman Sachs, as Distributor of the shares of the Funds pursuant to a Distribution Agreement, may retain a portion of the Class A front end sales charge and Class B and Class C Shares’ CDSC. During the six months ended June 30, 2014, Goldman Sachs advised that it retained front end sales charges of $4,049, $22,743, $1,555, $374, $45, and $4,536 for the Absolute Return Tracker, Commodity Strategy, Dynamic Allocation, Managed Futures Strategy, International Real Estate Securities and Real Estate Securities Funds, respectively.
D. Service Plan and Shareholder Administration Plan — The Trust, on behalf of each Fund that offers Service Shares, has adopted a Service Plan and a Shareholder Administration Plan. These plans allow for service organizations to provide varying levels of personal and account maintenance and shareholder administration services to their customers who are beneficial owners of such shares. The Service Plan and Shareholder Administration Plan each provide for compensation to the service organizations which is accrued daily and paid monthly at an annual rate of 0.25% (0.50% in aggregate) of the average daily net assets of the Service Shares.
E. Transfer Agency Agreement — Goldman Sachs also serves as the transfer agent of the Funds for a fee pursuant to a Transfer Agency Agreement. The fees charged for such transfer agency services are accrued daily and paid monthly at annual rates as follows: 0.19% (except for the Commodity Strategy and Dynamic Commodity Strategy Funds, which charge at an annual rate of 0.13%) of the average daily net assets of Class A, Class B, Class C, Class IR and Class R Shares; and 0.04% of the average daily net assets of Institutional and Service Shares.
107
GOLDMAN SACHS SELECT SATELLITE FUNDS
Notes to Financial Statements (continued)
June 30, 2014 (Unaudited)
|
| 5. AGREEMENTS AND AFFILIATED TRANSACTIONS (continued) |
F. Other Expense Agreements and Affiliated Transactions — GSAM has agreed to limit certain “Other Expense” of the Funds (excluding transfer agent fees and expenses, service fees and shareholder administration fees (as applicable), taxes, dividend and interest expense on short sales interest, brokerage fees, shareholder meeting, litigation, indemnification and extraordinary expenses) to the extent such expenses exceed, on an annual basis, a percentage rate of the average daily net assets of each Fund. Such Other Expense reimbursements, if any, are accrued daily and paid monthly. In addition, the Funds are not obligated to reimburse GSAM for prior fiscal year expense reimbursements, if any. The Other Expense limitations as an annual percentage rate of average daily net assets for the Absolute Return Tracker, Commodity Strategy, Dynamic Allocation, Dynamic Commodity Strategy, Managed Futures Strategy, International Real Estate Securities and Real Estate Securities Funds are 0.014%, 0.044%, 0.004%, 0.014%, 0.104%, 0.004% and 0.004%, respectively. These Other Expense limitations will remain in place through at least April 30, 2015, and prior to such date GSAM may not terminate the arrangements without the approval of the Trustees. The Funds bear their respective share of costs related to proxy and shareholder meetings, and GSAM has agreed to reimburse each Fund to the extent such expenses exceed a specified percentage of the Fund’s net assets. The Subsidiaries also pay certain other expenses, including service and custody fees. GSAM has agreed to reduce or limit each Subsidiary’s expenses (excluding management fees) to 0.004% of the Subsidiary’s average daily net assets for the Absolute Return Tracker, Commodity Strategy, and Dynamic Commodity Strategy Funds, respectively. In addition, the Funds have entered into certain offset arrangements with the custodian and the transfer agent, which may result in a reduction of the Funds’ expenses and are received irrespective of the application of the “Other Expense” limitations described above.
For the six months ended June 30, 2014, these expense reductions, including any fee waivers and Other Expense reimbursements, were as follows:
| | | | | | | | | | | | | | | | | | |
| Fund | | | | Management
Fee Waiver | | | Other
Expense
Reimbursement | | | Custody Fee
Credits | | | Total
Expense
Reductions | |
Absolute Return Tracker | | | | $ | 4,695,718 | | | $ | 372,138 | | | $ | 47,300 | | | $ | 5,115,156 | |
Commodity Strategy | | | | | 455,244 | | | | 112,706 | | | | 24,024 | | | | 591,974 | |
Dynamic Allocation | | | | | 711,067 | | | | 231,929 | | | | — | | | | 942,996 | |
Dynamic Commodity Strategy | | | | | 6,114 | | | | 164,495 | | | | 420 | | | | 171,029 | |
Managed Futures Strategy | | | | | 56,527 | | | | 171,035 | | | | 2,343 | | | | 229,905 | |
International Real Estate Securities | | | | | 79,971 | | | | 213,340 | | | | 1,784 | | | | 295,095 | |
Real Estate Securities | | | | | 133,858 | | | | 191,996 | | | | 4,531 | | | | 330,385 | |
108
GOLDMAN SACHS SELECT SATELLITE FUNDS
|
| 5. AGREEMENTS AND AFFILIATED TRANSACTIONS (continued) |
As of June 30, 2014, the amounts owed to affiliates of the Funds were as follows:
| | | | | | | | | | | | | | | | | | |
| Fund | | | | Management
Fees | | | Distribution
and Service
Fees | | | Transfer
Agent
Fees | | | Total | |
Absolute Return Tracker | | | | $ | 1,104,593 | | | $ | 46,267 | | | $ | 82,355 | | | $ | 1,233,215 | |
Commodity Strategy | | | | | 596,988 | | | | 44,606 | | | | 61,887 | | | | 703,481 | |
Dynamic Allocation | | | | | 604,033 | | | | 22,458 | | | | 52,134 | | | | 678,625 | |
Dynamic Commodity Strategy | | | | | 23,179 | | | | 23 | | | | 1,275 | | | | 24,477 | |
Managed Futures Strategy | | | | | 73,381 | | | | 1,815 | | | | (3,825 | ) | | | 79,021 | |
International Real Estate Securities | | | | | 347,206 | | | | 4,349 | | | | 15,657 | | | | 367,212 | |
Real Estate Securities | | | | | 460,123 | | | | 28,359 | | | | 30,214 | | | | 518,696 | |
G. Line of Credit Facility — As of June 30, 2014, the Funds (except for Dynamic Commodity Strategy Fund) participated in a $1,080,000,000 committed, unsecured revolving line of credit facility (the “facility”) together with other funds of the Trust and registered investment companies having management agreements with GSAM or its affiliates (“Other Borrowers”). Pursuant to the terms of the facility, the Funds and Other Borrowers could increase the credit amount by an additional $120,000,000, for a total of up to $1,200,000,000. This facility is to be used solely for temporary or emergency purposes, which may include the funding of redemptions. The interest rate on borrowings is based on the federal funds rate. The facility also requires a fee to be paid by the Funds based on the amount of the commitment that has not been utilized. For the six months ended June 30, 2014, the Funds did not have any borrowings under the facility.
H. Other Transactions with Affiliates — For the six months ended June 30, 2014, Goldman Sachs earned $21,122, $55,599 and $179 in brokerage commissions from portfolio transactions, including futures transactions executed with Goldman Sachs as the Futures Commission Merchant, on behalf of the Absolute Return Tracker, Dynamic Allocation and Real Estate Securities Funds, respectively.
109
GOLDMAN SACHS SELECT SATELLITE FUNDS
Notes to Financial Statements (continued)
June 30, 2014 (Unaudited)
|
| 5. AGREEMENTS AND AFFILIATED TRANSACTIONS (continued) |
The following table provides information about the Funds’ investment in the Financial Square Government Fund for the six months period ended June 30, 2014:
| | | | | | | | | | | | | | | | | | | | | | | | | | |
| Fund | | | | Number of
Shares Held
Beginning
of Period | | | Shares Bought | | | Shares Sold | | | Number of
Shares Held End of Period | | | Value at End of Period | | | Interest
Income | |
Absolute Return Tracker | | | | | 1,394,058,738 | | | | 487,936,252 | | | | (246,861,227 | ) | | | 1,635,133,763 | | | $ | 1,635,133,763 | | | $ | 38,473 | |
Commodity Strategy | | | | | 193,899,304 | | | | 1,071,174,791 | | | | (489,048,019 | ) | | | 776,026,076 | | | | 776,026,076 | | | | 15,691 | |
Dynamic Allocation | | | | | 666,690,186 | | | | 153,213,295 | | | | (390,009,852 | ) | | | 429,893,629 | | | | 429,893,629 | | | | 11,481 | |
Dynamic Commodity | | | | | — | | | | 32,755,778 | | | | (1,029,472 | ) | | | 31,726,306 | | | | 31,726,306 | | | | 323 | |
Managed Futures Strategy | | | | | 93,637,641 | | | | 32,671,654 | | | | (48,968,772 | ) | | | 77,340,523 | | | | 77,340,523 | | | | 2,392 | |
As of June 30, 2014, the following Goldman Sachs Fund of Funds Portfolios were beneficial owners of 5% or more of total outstanding shares of the following Funds:
| | | | | | | | | | | | | | | | | | |
| Fund | | | | Goldman Sachs
Balanced Strategy
Portfolio | | | Goldman Sachs
Growth and Income
Strategy Portfolio | | | Goldman Sachs
Growth Strategy
Portfolio | | | Goldman Sachs
Satellite Strategies
Portfolio | |
Commodity Strategy | | | | | — | % | | | — | % | | | — | % | | | 10 | % |
Dynamic Allocation | | | | | 7 | | | | 15 | | | | 13 | | | | — | |
Managed Futures Strategy | | | | | 18 | | | | 36 | | | | 31 | | | | — | |
International Real Estate Securities | | | | | — | | | | — | | | | — | | | | 39 | |
Real Estate Securities | | | | | — | | | | — | | | | — | | | | 33 | |
As of June 30, 2014, the Goldman Sachs Group, Inc. was the beneficial owner of approximately 100% of the Class R Shares of the Dynamic Allocation Fund and 100% of the Class A, Class C, Institutional, Class IR and Class R Shares of the Dynamic Commodity Strategy Fund.
110
GOLDMAN SACHS SELECT SATELLITE FUNDS
|
| 6. PORTFOLIO SECURITIES TRANSACTIONS |
The cost of purchases and proceeds from sales and maturities of long-term securities for the six months ended June 30, 2014, were as follows:
| | | | | | | | | | | | | | | | | | |
| Fund | | | | Purchases of
U.S. Government and
Agency Obligations | | | Purchases (Excluding
U.S. Government and
Agency Obligations) | | | Sales and
Maturities of
U.S. Government and
Agency Obligations | | | Sales and
Maturities (Excluding
U.S. Government and
Agency Obligations) | |
Absolute Return Tracker | | | | $ | — | | | $ | 32,165,946 | | | $ | — | | | $ | 94,263,958 | |
Commodity Strategy | | | | | 461,452,946 | | | | 16,727,652 | | | | 514,977,397 | | | | 17,780,778 | |
Dynamic Allocation | | | | | 39,476,582 | | | | 408,754,120 | | | | 63,817,478 | | | | 369,927,202 | |
Managed Futures Strategy | | | | | — | | | | 15,460,000 | | | | — | | | | 6,295,967 | |
International Real Estate Securities | | | | | — | | | | 93,131,512 | | | | — | | | | 92,219,846 | |
Real Estate Securities | | | | | — | | | | 150,618,694 | | | | — | | | | 138,722,280 | |
As of the Funds’ most recent fiscal year end, December 31, 2013 the Funds’ capital loss carryforwards and certain timing differences on a tax-basis were as follows:
| | | | | | | | | | | | | | | | | | | | |
| | | Absolute
Return Tracker | | | Commodity
Strategy | | | Dynamic
Allocation | | | International
Real Estate
Securities | | | Real Estate
Securities | |
Capital loss carryforwards:(1) | | | | | | | | | | | | | | | | | | | | |
Expiring 2016 | | $ | — | | | $ | (16,303,834 | ) | | $ | — | | | $ | (327,907,510 | ) | | $ | — | |
Expiring 2017 | | | — | | | | (67,560,179 | ) | | | — | | | | (239,206,981 | ) | | | (61,235,543 | ) |
Expiring 2018 | | | — | | | | — | | | | — | | | | (18,621,372 | ) | | | — | |
Perpetual short-term | | | — | | | | (1,431,212 | ) | | | — | | | | — | | | | — | |
Perpetual long-term | | | — | | | | (3,613,208 | ) | | | — | | | | — | | | | — | |
Total capital loss carryforwards | | $ | — | | | $ | (88,908,433 | ) | | $ | — | | | $ | (585,735,863 | ) | | $ | (61,235,543 | ) |
Timing differences (Qualified Late Year Loss Deferral/certain REIT dividends/straddle loss deferral) | | $ | (1,591,241 | ) | | $ | (346,581 | ) | | $ | (82,080 | ) | | $ | (5,331,852 | ) | | $ | 536,313 | |
| (1) | | Expiration occurs on December 31 of the year indicated. |
111
GOLDMAN SACHS SELECT SATELLITE FUNDS
Notes to Financial Statements (continued)
June 30, 2014 (Unaudited)
|
| 7. TAX INFORMATION (continued) |
As of June 30, 2014, the Funds’ aggregate security unrealized gains and losses based on cost for U.S. federal income tax purposes were as follows:
| | | | | | | | | | | | | | | | | | | | | | | | | | | | |
| | | Absolute
Return Tracker | | | Commodity
Strategy | | | Dynamic
Allocation | | | Dynamic
Commodity
Strategy | | | Managed
Futures | | | International
Real Estate
Securities | | | Real Estate
Securities | |
Tax cost | | $ | 1,678,841,318 | | | $ | 1,097,545,714 | | | $ | 751,927,307 | | | $ | 31,726,306 | | | $ | 85,575,523 | | | $ | 385,066,577 | | | $ | 427,643,868 | |
Gross unrealized gain | | | 5,365,763 | | | | 4,209,601 | | | | 34,514,464 | | | | — | | | | 830,629 | | | | 66,438,605 | | | | 144,274,140 | |
Gross unrealized loss | | | (185,113 | ) | | | (349,999 | ) | | | (9,661,434 | ) | | | — | | | | (242,029 | ) | | | (37,572,911 | ) | | | (1,830,102 | ) |
Net unrealized security gain | | $ | 5,180,650 | | | $ | 3,859,602 | | | $ | 24,853,030 | | | $ | — | | | $ | 588,600 | | | $ | 28,865,694 | | | $ | 142,444,038 | |
The difference between GAAP-basis and tax-basis unrealized gains (losses) is attributable primarily to wash sales, net mark to market gains (losses) on regulated futures, options and foreign currency contracts, and differences related to the tax treatment of swap transactions, inflation protected securities, underlying fund investments, passive foreign investment companies and real estate investment trust investments.
GSAM has reviewed the Funds’ tax positions for all open tax years (the current and prior three years, as applicable) and has concluded that no provision for income tax is required in the Funds’ financial statements. Such open tax years remain subject to examination and adjustment by tax authorities.
The Funds’ risks include, but are not limited to, the following:
Foreign Custody Risk — A Fund that invests in foreign securities may hold such securities and foreign currency with foreign banks, agents, and securities depositories appointed by the Fund’s custodian (each a “Foreign Custodian”). In some countries, Foreign Custodians may be subject to little or no regulatory oversight or independent evaluation of their operations. Further, the laws of certain countries may place limitations on a Fund’s ability to recover its assets if a Foreign Custodian enters into bankruptcy. Investments in emerging markets may be subject to greater custody risks than investments in more developed markets. Custody services in emerging market countries are often undeveloped and may be less regulated than in more developed countries, and thus may not afford the same level of investor protection as would apply in developed countries.
112
GOLDMAN SACHS SELECT SATELLITE FUNDS
|
| 8. OTHER RISKS (continued) |
Large Shareholder Redemptions Risk — The Fund may experience adverse effects when certain large shareholders, such as other funds, institutional investors (including those trading by use of non-discretionary mathematical formulas), financial intermediaries (who may make investment decisions on behalf of underlying clients and/or include the Fund in their investment model), individuals, accounts and Goldman Sachs affiliates, purchase or redeem large amounts of shares of the Fund. Such large shareholder redemptions may cause the Fund to sell portfolio securities at times when it would not otherwise do so, which may negatively impact the Fund’s NAV and liquidity. Similarly, large Fund share purchases may adversely affect the Fund’s performance to the extent that the Fund is delayed in investing new cash and is required to maintain a larger cash position than it ordinarily would. These transactions may also accelerate the realization of taxable income to shareholders if such sales of investments resulted in gains, and may also increase transaction costs. In addition, a large redemption could result in the Fund’s current expenses being allocated over a smaller asset base, leading to an increase in the Fund’s expense ratio.
Investments in Other Investment Companies — As a shareholder of another investment company, including an exchange traded fund (“ETF”), a Fund will directly bear its proportionate share of any management fees and other expenses paid by such other investment companies, in addition to the fees and expenses regularly borne by the Fund. ETFs are subject to risks that do not apply to conventional mutual funds, including but not limited to the following: (i) the market price of the ETF’s shares may trade at a premium or a discount to their NAV; and (ii) an active trading market for an ETF’s shares may not develop or be maintained.
Liquidity Risk — The Funds may make investments that are illiquid or that may become less liquid in response to market developments or adverse investor perceptions. Illiquid investments may be more difficult to value. Liquidity risk may also refer to the risk that a Fund will not be able to pay redemption proceeds within the allowable time period because of unusual market conditions, an unusually high volume of redemption requests, or other reasons. To meet redemption requests, a Fund may be forced to sell investments at an unfavorable time and/or under unfavorable conditions.
Market and Credit Risks — In the normal course of business, the Funds trade financial instruments and enter into financial transactions where risk of potential loss exists due to changes in the market (market risk). Additionally, the Funds may also be exposed to credit risk in the event that an issuer or guarantor fails to perform or that an institution or entity with which the Funds have unsettled or open transactions defaults.
Investing in foreign markets may involve special risks and considerations not typically associated with investing in the U.S. Foreign securities may be subject to risk of loss because of more or less foreign government regulation, less public information and less economic, political and social stability in the countries in which the Fund invests. Loss may also result from the imposition of exchange controls, confiscations and other government restrictions by the United States or other governments, or from problems in registration, settlement or custody. Foreign risk also involves the risk of negative foreign currency rate fluctuations, which may cause the value of securities denominated in such foreign currency (or other instruments through which the Fund has exposure to foreign currencies) to decline in value. Currency exchange rates may fluctuate significantly over short periods of time. To the extent that the Fund also invests in securities of issuers located in emerging markets, these risks may be more pronounced.
113
GOLDMAN SACHS SELECT SATELLITE FUNDS
Notes to Financial Statements (continued)
June 30, 2014 (Unaudited)
|
| 8. OTHER RISKS (continued) |
Non-Diversification Risk — The Funds (except for the Absolute Return Tracker Fund) are non-diversified, meaning that they are permitted to invest a larger percentage of their assets in fewer issuers than diversified mutual funds. Thus, each Fund (except for the Absolute Return Tracker Fund) may be more susceptible to adverse developments affecting any single issuer held in its portfolio, and may be more susceptible to greater losses because of these developments.
Portfolio Concentration Risk — The International Real Estate Securities Fund and the Real Estate Securities Fund invest primarily in securities of issuers (non-U.S. issuers, in the case of International Real Estate Securities Fund) that are primarily engaged in or related to the real estate industry, and each Fund has a policy of concentrating its investments in the real estate industry. Therefore, investments in the Funds are subject to certain risks associated with the real estate industry in general. Such risks include, but are not limited to, declines in property values, increases in property taxes, operating expenses, interest rates or competition, zoning changes, and losses from casualty and condemnation.
Tax Risk — The Absolute Return Tracker, Commodity Strategy, Dynamic Allocation, Dynamic Commodity Strategy and Managed Futures Strategy Funds will seek to gain exposure to the commodity markets primarily through investments in the Subsidiaries and/or commodity index-linked structured notes, as applicable. Historically, the IRS has issued private letter rulings in which the IRS specifically concluded that income and gains from investments in commodity index-linked structured notes or a wholly-owned foreign subsidiary that invests in commodity-linked instruments are “qualifying income” for purposes of compliance with Subchapter M of the Code. The IRS has issued such private letter rulings to the Absolute Return Tracker, Commodity Strategy and Dynamic Allocation Funds. Based on such rulings, those Funds may seek to gain exposure to the commodity markets through investments in commodity-linked notes and/or subsidiaries (currently, only the Absolute Return Tracker and Commodity Strategy Funds invest in subsidiaries). However, the Dynamic Commodity Strategy and Managed Futures Strategy Funds have not received such a private letter ruling, and are not able to rely on private letter rulings issued to other taxpayers. Additionally, the IRS has suspended the granting of such private letter rulings, pending review of its position on this matter. The tax treatment of a Fund’s investments in a wholly owned subsidiary or commodity-linked instruments may be adversely affected by future legislation, Treasury Regulations and/or guidance issued by the IRS (which may be retroactive) that could affect whether income derived from such investments is “qualifying income” under Subchapter M of Code, or otherwise affect the character, timing and/or amount of the Fund’s taxable income or any gains and distributions made by the Fund. The Dynamic Commodity Strategy and Managed Futures Strategy Funds have obtained an opinion of counsel that their income from such investments should constitute “qualifying income.” However, no assurances can be provided that the IRS would not be able to successfully assert that the Dynamic Commodity Strategy or Managed Futures Strategy Fund’s income from such investments was not “qualifying income,” in which case the Fund would fail to qualify as a regulated investment company (RIC) under Subchapter M of the Code if over 10% of its gross income was derived from these investments. If a Fund failed to qualify as a RIC, it would be subject to federal and state income tax on all of its taxable income at regular corporate tax rates with no deduction for any distributions paid to shareholders, which would significantly adversely affect the returns to, and could cause substantial losses for, Fund shareholders.
114
GOLDMAN SACHS SELECT SATELLITE FUNDS
Under the Trust’s organizational documents, its Trustees, officers, employees and agents are indemnified, to the extent permitted by the Act and state law, against certain liabilities that may arise out of performance of their duties to the Funds. Additionally, in the course of business, the Funds enter into contracts that contain a variety of indemnification clauses. The Funds’ maximum exposure under these arrangements is unknown, as this would involve future claims that may be made against the Funds that have not yet occurred. However, GSAM believes the risk of loss under these arrangements to be remote.
Subsequent events after the Statements of Assets and Liabilities date have been evaluated through the date the financial statements were issued. GSAM has concluded that there is no impact requiring adjustment or disclosure in the financial statements.
115
GOLDMAN SACHS SELECT SATELLITE FUNDS
Notes to Financial Statements (continued)
June 30, 2014 (Unaudited)
|
| 11. SUMMARY OF SHARE TRANSACTIONS |
Share activity is as follows:
| | | | | | | | | | | | | | | | |
| | | Absolute Return Tracker Fund | |
| | | | |
| | | For the Six Months Ended
June 30, 2014
(Unaudited) | | | For the Fiscal Year Ended
December 31, 2013 | |
| | | | |
| | | Shares | | | Dollars | | | Shares | | | Dollars | |
| | | | |
| Class A Shares | | | | | | | | | | | | | | | | |
Shares sold | | | 1,413,284 | | | $ | 12,834,321 | | | | 3,113,867 | | | $ | 28,615,462 | |
Reinvestment of distributions | | | — | | | | — | | | | 624,619 | | | | 5,590,340 | |
Shares redeemed | | | (2,099,633 | ) | | | (19,142,038 | ) | | | (7,111,308 | ) | | | (65,162,712 | ) |
| | | | (686,349 | ) | | | (6,307,717 | ) | | | (3,372,822 | ) | | | (30,956,910 | ) |
| Class C Shares | | | | | | | | | | | | | | | | |
Shares sold | | | 444,704 | | | | 3,858,832 | | | | 664,468 | | | | 5,880,099 | |
Reinvestment of distributions | | | — | | | | — | | | | 148,039 | | | | 1,267,210 | |
Shares redeemed | | | (524,757 | ) | | | (4,547,990 | ) | | | (1,719,647 | ) | | | (15,169,525 | ) |
| | | | (80,053 | ) | | | (689,158 | ) | | | (907,140 | ) | | | (8,022,216 | ) |
| Institutional Shares | | | | | | | | | | | | | | | | |
Shares sold | | | 38,064,697 | | | | 353,794,170 | | | | 73,254,973 | | | | 685,966,800 | |
Reinvestment of distributions | | | — | | | | — | | | | 7,398,833 | | | | 67,625,338 | |
Shares redeemed | | | (20,814,854 | ) | | | (193,407,061 | ) | | | (59,043,331 | ) | | | (551,289,102 | ) |
| | | | 17,249,843 | | | | 160,387,109 | | | | 21,610,475 | | | | 202,303,036 | |
| Class IR Shares | | | | | | | | | | | | | | | | |
Shares sold | | | 282,477 | | | | 2,593,837 | | | | 1,178,635 | | | | 10,963,049 | |
Reinvestment of distributions | | | — | | | | — | | | | 124,252 | | | | 1,126,965 | |
Shares redeemed | | | (326,379 | ) | | | (3,011,108 | ) | | | (859,396 | ) | | | (7,970,790 | ) |
| | | | (43,902 | ) | | | (417,271 | ) | | | 443,491 | | | | 4,119,224 | |
| Class R Shares | | | | | | | | | | | | | | | | |
Shares sold | | | 59,746 | | | | 536,109 | | | | 53,561 | | | | 485,821 | |
Reinvestment of distributions | | | — | | | | — | | | | 11,542 | | | | 101,796 | |
Shares redeemed | | | (35,669 | ) | | | (319,979 | ) | | | (97,289 | ) | | | (876,675 | ) |
| | | | 24,077 | | | | 216,130 | | | | (32,186 | ) | | | (289,058 | ) |
NET INCREASE | | | 16,463,616 | | | $ | 153,189,093 | | | | 17,741,818 | | | $ | 167,154,076 | |
116
GOLDMAN SACHS SELECT SATELLITE FUNDS
|
| 11. SUMMARY OF SHARE TRANSACTIONS (continued) |
Share activity is as follows:
| | | | | | | | | | | | | | | | |
| | | Commodity Strategy Fund | |
| | | | |
| | | For the Six Months Ended
June 30, 2014 (Unaudited) | | | For the Fiscal Year Ended
December 31, 2013 | |
| | | | |
| | | Shares | | | Dollars | | | Shares | | | Dollars | |
| | | | |
| Class A Shares | | | | | | | | | | | | | | | | |
Shares sold | | | 12,503,554 | | | $ | 70,873,785 | | | | 41,130,438 | | | $ | 230,911,570 | |
Shares redeemed | | | (55,817,000 | ) | | | (324,760,655 | ) | | | (31,514,065 | ) | | | (175,982,642 | ) |
| | | | (43,313,446 | ) | | | (253,886,870 | ) | | | 9,616,373 | | | | 54,928,928 | |
| Class C Shares | | | | | | | | | | | | | | | | |
Shares sold | | | 469,439 | | | | 2,592,019 | | | | 588,786 | | | | 3,232,466 | |
Shares redeemed | | | (323,582 | ) | | | (1,785,143 | ) | | | (993,047 | ) | | | (5,403,468 | ) |
| | | | 145,857 | | | | 806,876 | | | | (404,261 | ) | | | (2,171,002 | ) |
| Institutional Shares | | | | | | | | | | | | | | | | |
Shares sold | | | 53,885,971 | | | | 309,750,594 | | | | 95,413,012 | | | | 537,858,923 | |
Reinvestment of distributions | | | 68,958 | | | | 415,131 | | | | — | | | | — | |
Shares redeemed | | | (24,455,926 | ) | | | (141,030,297 | ) | | | (41,419,256 | ) | | | (232,435,465 | ) |
| | | | 29,499,003 | | | | 169,135,428 | | | | 53,993,756 | | | | 305,423,458 | |
| Class IR Shares | | | | | | | | | | | | | | | | |
Shares sold | | | 1,171,920 | | | | 6,761,510 | | | | 821,873 | | | | 4,688,486 | |
Reinvestment of distributions | | | 422 | | | | 2,540 | | | | — | | | | — | |
Shares redeemed | | | (198,638 | ) | | | (1,143,020 | ) | | | (636,943 | ) | | | (3,566,836 | ) |
| | | | 973,704 | | | | 5,621,030 | | | | 184,930 | | | | 1,121,650 | |
| Class R Shares | | | | | | | | | | | | | | | | |
Shares sold | | | 75,934 | | | | 428,829 | | | | 163,268 | | | | 913,005 | |
Shares redeemed | | | (51,279 | ) | | | (289,167 | ) | | | (144,208 | ) | | | (805,400 | ) |
| | | | 24,655 | | | | 139,662 | | | | 19,060 | | | | 107,605 | |
NET INCREASE (DECREASE) | | | (12,670,227 | ) | | $ | (78,183,874 | ) | | | 63,409,858 | | | $ | 359,410,639 | |
117
GOLDMAN SACHS SELECT SATELLITE FUNDS
Notes to Financial Statements (continued)
June 30, 2014 (Unaudited)
|
| 11. SUMMARY OF SHARE TRANSACTIONS (continued) |
Share activity is as follows:
| | | | | | | | | | | | | | | | |
| | | Dynamic Allocation Fund | |
| | | | |
| | | For the Six Months Ended
June 30, 2014 (Unaudited) | | | For the Fiscal Year Ended December 31, 2013 | |
| | | | |
| | | Shares | | | Dollars | | | Shares | | | Dollars | |
| | | | |
| Class A Shares | | | | | | | | | | | | | | | | |
Shares sold | | | 671,150 | | | $ | 7,281,799 | | | | 6,357,530 | | | $ | 69,696,698 | |
Reinvestment of distributions | | | — | | | | — | | | | 551,119 | | | | 5,863,905 | |
Shares redeemed | | | (6,993,908 | ) | | | (75,515,028 | ) | | | (18,611,390 | ) | | | (203,449,197 | ) |
| | | | (6,322,758 | ) | | | (68,233,229 | ) | | | (11,702,741 | ) | | | (127,888,594 | ) |
| Class C Shares | | | | | | | | | | | | | | | | |
Shares sold | | | 117,692 | | | | 1,238,927 | | | | 1,614,724 | | | | 17,399,807 | |
Reinvestment of distributions | | | — | | | | — | | | | 208,657 | | | | 2,159,600 | |
Shares redeemed | | | (1,781,876 | ) | | | (18,705,739 | ) | | | (2,839,327 | ) | | | (30,192,044 | ) |
| | | | (1,664,184 | ) | | | (17,466,812 | ) | | | (1,015,946 | ) | | | (10,632,637 | ) |
| Institutional Shares | | | | | | | | | | | | | | | | |
Shares sold | | | 5,772,411 | | | | 63,419,888 | | | | 21,645,978 | | | | 239,411,751 | |
Reinvestment of distributions | | | — | | | | — | | | | 2,386,994 | | | | 25,686,906 | |
Shares redeemed | | | (14,288,328 | ) | | | (156,904,334 | ) | | | (34,550,307 | ) | | | (379,708,953 | ) |
| | | | (8,515,917 | ) | | | (93,484,446 | ) | | | (10,517,335 | ) | | | (114,610,296 | ) |
| Class IR Shares | | | | | | | | | | | | | | | | |
Shares sold | | | 651,322 | | | | 7,080,659 | | | | 2,425,682 | | | | 26,789,149 | |
Reinvestment of distributions | | | — | | | | — | | | | 170,824 | | | | 1,832,943 | |
Shares redeemed | | | (1,946,256 | ) | | | (21,288,080 | ) | | | (3,913,928 | ) | | | (42,980,566 | ) |
| | | | (1,294,934 | ) | | | (14,207,421 | ) | | | (1,317,422 | ) | | | (14,358,474 | ) |
| Class R Shares | | | | | | | | | | | | | | | | |
Reinvestment of distributions | | | — | | | | — | | | | 36 | | | | 379 | |
| | | | — | | | | — | | | | 36 | | | | 379 | |
NET DECREASE | | | (17,797,793 | ) | | $ | (193,391,908 | ) | | | (24,553,408 | ) | | $ | (267,489,622 | ) |
118
GOLDMAN SACHS SELECT SATELLITE FUNDS
|
| 11. SUMMARY OF SHARE TRANSACTIONS (continued) |
Share activity is as follows:
| | | | | | | | |
| | | Dynamic Commodity
Strategy Fund | |
| | | | |
| | | For the Period Ended June 30, 2014(a) (Unaudited) | |
| | | | |
| | | Shares | | | Dollars | |
| | | | |
| Class A Shares | | | | | | | | |
Shares sold | | | 1,001 | | | $ | 10,005 | |
| | | | 1,001 | | | | 10,005 | |
| Class C Shares | | | | | | | | |
Shares sold | | | 1,000 | | | | 10,000 | |
| | | | 1,000 | | | | 10,000 | |
| Institutional Shares | | | | | | | | |
Shares sold | | | 3,993,000 | | | | 39,930,000 | |
Shares redeemed | | | (100,000 | ) | | | (1,000,000 | ) |
| | | | 3,893,000 | | | | 38,930,000 | |
| Class IR Shares | | | | | | | | |
Shares sold | | | 2,500 | | | | 25,000 | |
| | | | 2,500 | | | | 25,000 | |
| Class R Shares | | | | | | | | |
Shares sold | | | 2,500 | | | | 25,000 | |
| | | | 2,500 | | | | 25,000 | |
NET INCREASE | | | 3,900,001 | | | $ | 39,000,005 | |
| (a) | | Commenced operations on April 30, 2014. |
119
GOLDMAN SACHS SELECT SATELLITE FUNDS
Notes to Financial Statements (continued)
June 30, 2014 (Unaudited)
|
| 11. SUMMARY OF SHARE TRANSACTIONS (continued) |
Share activity is as follows:
| | | | | | | | | | | | | | | | |
| | | Managed Futures Strategy Fund | |
| | | | |
| | | For the Six Months Ended
June 30, 2014
(Unaudited) | | | For the Fiscal Year Ended
December 31, 2013 | |
| | | | |
| | | Shares | | | Dollars | | | Shares | | | Dollars | |
| | | | |
| Class A Shares | | | | | | | | | | | | | | | | |
Shares sold | | | 204,502 | | | $ | 2,042,348 | | | | 177,174 | | | $ | 1,778,085 | |
Shares redeemed | | | (39,262 | ) | | | (380,100 | ) | | | (69,062 | ) | | | (684,185 | ) |
| | | | 165,240 | | | | 1,662,248 | | | | 108,112 | | | | 1,093,900 | |
| Class C Shares | | | | | | | | | | | | | | | | |
Shares sold | | | 12,609 | | | | 119,049 | | | | 158,949 | | | | 1,551,528 | |
Shares redeemed | | | (17,371 | ) | | | (164,744 | ) | | | (35,985 | ) | | | (350,922 | ) |
| | | | (4,762 | ) | | | (45,695 | ) | | | 122,964 | | | | 1,200,606 | |
| Institutional Shares | | | | | | | | | | | | | | | | |
Shares sold | | | 1,040,656 | | | | 10,137,426 | | | | 11,167,665 | | | | 110,870,528 | |
Shares redeemed | | | (1,610,069 | ) | | | (15,785,456 | ) | | | (2,450,002 | ) | | | (24,016,051 | ) |
| | | | (569,413 | ) | | | (5,648,030 | ) | | | 8,717,663 | | | | 86,854,477 | |
| Class IR Shares | | | | | | | | | | | | | | | | |
Shares sold | | | 1,258 | | | | 12,273 | | | | 108,134 | | | | 1,116,315 | |
Shares redeemed | | | (4,297 | ) | | | (41,713 | ) | | | (108,857 | ) | | | (1,050,231 | ) |
| | | | (3,039 | ) | | | (29,440 | ) | | | (723 | ) | | | 66,084 | |
| Class R Shares | | | | | | | | | | | | | | | | |
Shares sold | | | 408 | | | | 3,946 | | | | 35,569 | | | | 345,024 | |
Shares redeemed | | | (1,065 | ) | | | (10,220 | ) | | | (27,704 | ) | | | (265,370 | ) |
| | | | (657 | ) | | | (6,274 | ) | | | 7,865 | | | | 79,654 | |
NET INCREASE (DECREASE) | | | (412,631 | ) | | $ | (4,067,191 | ) | | | 8,955,881 | | | $ | 89,294,721 | |
120
GOLDMAN SACHS SELECT SATELLITE FUNDS
|
| 11. SUMMARY OF SHARE TRANSACTIONS (continued) |
Share activity is as follows:
| | | | | | | | | | | | | | | | |
| | | International Real Estate Securities Fund | |
| | | | |
| | | For the Six Months Ended
June 30, 2014
(Unaudited) | | | For the Fiscal Year Ended
December 31, 2013 | |
| | | | |
| | | Shares | | | Dollars | | | Shares | | | Dollars | |
| | | | |
| Class A Shares | | | | | | | | | | | | | | | | |
Shares sold | | | 111,280 | | | $ | 734,279 | | | | 476,561 | | | $ | 3,199,759 | |
Reinvestment of distributions | | | 22,660 | | | | 154,315 | | | | 95,056 | | | | 607,097 | |
Shares redeemed | | | (581,742 | ) | | | (3,807,944 | ) | | | (1,909,765 | ) | | | (12,656,510 | ) |
| | | | (447,802 | ) | | | (2,919,350 | ) | | | (1,338,148 | ) | | | (8,849,654 | ) |
| Class C Shares | | | | | | | | | | | | | | | | |
Shares sold | | | 7,708 | | | | 50,450 | | | | 139,120 | | | | 926,263 | |
Reinvestment of distributions | | | 2,739 | | | | 18,624 | | | | 12,638 | | | | 80,762 | |
Shares redeemed | | | (72,343 | ) | | | (469,270 | ) | | | (115,679 | ) | | | (770,199 | ) |
| | | | (61,896 | ) | | | (400,196 | ) | | | 36,079 | | | | 236,826 | |
| Institutional Shares | | | | | | | | | | | | | | | | |
Shares sold | | | 5,231,053 | | | | 33,067,001 | | | | 17,731,696 | | | | 114,220,589 | |
Reinvestment of distributions | | | 900,666 | | | | 5,962,410 | | | | 2,766,651 | | | | 17,177,099 | |
Shares redeemed | | | (6,747,551 | ) | | | (43,235,669 | ) | | | (9,542,456 | ) | | | (61,482,417 | ) |
| | | | (615,832 | ) | | | (4,206,258 | ) | | | 10,955,891 | | | | 69,915,271 | |
| Class IR Shares | | | | | | | | | | | | | | | | |
Shares sold | | | 431 | | | | 2,789 | | | | 304,073 | | | | 1,997,625 | |
Reinvestment of distributions | | | 1,999 | | | | 13,497 | | | | 10,564 | | | | 66,565 | |
Shares redeemed | | | (12,155 | ) | | | (78,141 | ) | | | (488,069 | ) | | | (3,284,381 | ) |
| | | | (9,725 | ) | | | (61,855 | ) | | | (173,432 | ) | | | (1,220,191 | ) |
NET INCREASE (DECREASE) | | | (1,135,255 | ) | | $ | (7,587,659 | ) | | | 9,480,390 | | | $ | 60,082,252 | |
121
GOLDMAN SACHS SELECT SATELLITE FUNDS
Notes to Financial Statements (continued)
June 30, 2014 (Unaudited)
|
| 11. SUMMARY OF SHARE TRANSACTIONS (continued) |
Share activity is as follows:
| | | | | | | | | | | | | | | | |
| | | Real Estate Securities Fund | |
| | | | |
| | | For the Six Months Ended
June 30, 2014
(Unaudited) | | | For the Fiscal Year Ended
December 31, 2013 | |
| | | | |
| | | Shares | | | Dollars | | | Shares | | | Dollars | |
| | | | |
| Class A Shares | | | | | | | | | | | | | | | | |
Shares sold | | | 1,093,235 | | | $ | 18,984,889 | | | | 1,177,766 | | | $ | 19,177,100 | |
Shares converted from Class B(a) | | | 1,633 | | | | 28,003 | | | | 1,419 | | | | 22,562 | |
Reinvestment of distributions | | | 36,389 | | | | 634,501 | | | | 50,240 | | | | 809,858 | |
Shares redeemed | | | (682,081 | ) | | | (11,669,902 | ) | | | (1,999,846 | ) | | | (32,248,168 | ) |
| | | | 449,176 | | | | 7,977,491 | | | | (770,421 | ) | | | (12,238,648 | ) |
| Class B Shares | | | | | | | | | | | | | | | | |
Shares sold | | | 458 | | | | 7,789 | | | | 2,490 | | | | 40,012 | |
Shares converted to Class A(a) | | | (1,646 | ) | | | (28,003 | ) | | | (1,428 | ) | | | (22,562 | ) |
Reinvestment of distributions | | | 310 | | | | 5,327 | | | | 523 | | | | 8,412 | |
Shares redeemed | | | (8,383 | ) | | | (143,990 | ) | | | (44,002 | ) | | | (706,298 | ) |
| | | | (9,261 | ) | | | (158,877 | ) | | | (42,417 | ) | | | (680,436 | ) |
| Class C Shares | | | | | | | | | | | | | | | | |
Shares sold | | | 80,761 | | | | 1,361,580 | | | | 193,935 | | | | 3,076,849 | |
Reinvestment of distributions | | | 5,424 | | | | 91,950 | | | | 6,506 | | | | 102,611 | |
Shares redeemed | | | (96,567 | ) | | | (1,616,282 | ) | | | (205,543 | ) | | | (3,260,108 | ) |
| | | | (10,382 | ) | | | (162,752 | ) | | | (5,102 | ) | | | (80,648 | ) |
| Institutional Shares | | | | | | | | | | | | | | | | |
Shares sold | | | 3,371,246 | | | | 58,343,386 | | | | 9,352,608 | | | | 154,377,399 | |
Reinvestment of distributions | | | 339,167 | | | | 6,002,221 | | | | 438,055 | | | | 7,157,530 | |
Shares redeemed | | | (3,162,631 | ) | | | (54,493,777 | ) | | | (7,570,762 | ) | | | (123,303,543 | ) |
| | | | 547,782 | | | | 9,851,830 | | | | 2,219,901 | | | | 38,231,386 | |
| Service Shares | | | | | | | | | | | | | | | | |
Shares sold | | | 26,305 | | | | 454,713 | | | | 85,935 | | | | 1,400,264 | |
Reinvestment of distributions | | | 600 | | | | 10,505 | | | | 1,016 | | | | 16,479 | |
Shares redeemed | | | (39,479 | ) | | | (652,265 | ) | | | (175,350 | ) | | | (2,902,896 | ) |
| | | | (12,574 | ) | | | (187,047 | ) | | | (88,399 | ) | | | (1,486,153 | ) |
| Class IR Shares | | | | | | | | | | | | | | | | |
Shares sold | | | 172,216 | | | | 3,040,329 | | | | 40,122 | | | | 661,161 | |
Reinvestment of distributions | | | 1,651 | | | | 29,526 | | | | 793 | | | | 12,782 | |
Shares redeemed | | | (4,270 | ) | | | (71,004 | ) | | | (23,943 | ) | | | (380,824 | ) |
| | | | 169,597 | | | | 2,998,851 | | | | 16,972 | | | | 293,119 | |
| Class R Shares | | | | | | | | | | | | | | | | |
Shares sold | | | 29,352 | | | | 507,385 | | | | 33,792 | | | | 536,907 | |
Reinvestment of distributions | | | 536 | | | | 9,331 | | | | 479 | | | | 7,686 | |
Shares redeemed | | | (12,250 | ) | | | (205,399 | ) | | | (16,304 | ) | | | (258,804 | ) |
| | | | 17,638 | | | | 311,317 | | | | 17,967 | | | | 285,789 | |
NET INCREASE | | | 1,151,976 | | | $ | 20,630,813 | | | | 1,348,501 | | | $ | 24,324,409 | |
| (a) | | Class B Shares automatically convert into Class A Shares on or about the fifteenth day of the last month of the calendar quarter that is eight years after the initial purchase date of either the Fund or another Goldman Sachs Fund. |
122
GOLDMAN SACHS SELECT SATELLITE FUNDS
Fund Expenses — Six Month Period Ended June 30, 2014 (Unaudited)
As a shareholder of Class A, Class B, Class C, Institutional, Service, Class IR or Class R Shares of a Fund you incur two types of costs: (1) transaction costs, including sales charges on purchase payments (with respect to Class A Shares) and contingent deferred sales charges on redemptions (with respect to Class B and Class C Shares); and (2) ongoing costs, including management fees; distribution and service (12b-1) fees (with respect to Class A, Class B, Class C and Class R Shares); and other Fund expenses. This example is intended to help you understand your ongoing costs (in dollars) of investing in Class A, Class B, Class C, Institutional, Service, Class IR and Class R Shares of the Funds and to compare these costs with the ongoing costs of investing in other mutual funds.
The example is based on an investment of $1,000 invested at the beginning of the period and held for the entire period from January 1, 2014 through June 30, 2014.
Actual Expenses — The first line under each share class in the table below provides information about actual account values and actual expenses. You may use the information in this line, together with the amount you invested, to estimate the expenses that you paid over the period. Simply divide your account value by $1,000 (for example, an $8,600 account value divided by $1,000=8.6), then multiply the result by the number in the first line under the heading entitled “Expenses Paid” to estimate the expenses you paid on your account during this period.
Hypothetical Example for Comparison Purposes — The second line under each share class in the table below provides information about hypothetical account values and hypothetical expenses based on the Funds’ actual net expense ratio and an assumed rate of return of 5% per year before expenses, which is not the Funds’ actual return. The hypothetical account values and expenses may not be used to estimate the actual ending account balance or expenses you paid for the period. You may use this information to compare the ongoing costs of investing in the Funds and other funds. To do so, compare this 5% hypothetical example with the 5% hypothetical examples that appear in the shareholder reports of the other funds.
Please note that the expenses shown in the table are meant to highlight your ongoing costs only and do not reflect any transactional costs, such as sales charges, redemption fees, or exchange fees. Therefore, the second line of the table is useful in comparing ongoing costs only, and will not help you determine the relative total costs of owning different funds. In addition, if these transactional costs were included, your costs would have been higher.
| | | | | | | | | | | | | | | | | | | | | | | | | | | | | | | | | | | | | | | | | | | | | | | | |
| | | Absolute Return Tracker Fund | | | Commodity Strategy Fund | | | Dynamic Allocation Fund | | | Dynamic Commodity Strategy Fund(a) | |
| Share Class | | Beginning
Account
Value 1/1/14 | | | Ending
Account
Value
6/30/14 | | | Expenses Paid for the 6 Months Ended
6/30/14* | | | Beginning
Account
Value 1/1/14 | | | Ending
Account
Value
6/30/14 | | | Expenses Paid for the
6 Months Ended
6/30/14* | | | Beginning
Account
Value 1/1/14 | | | Ending
Account
Value
6/30/14 | | | Expenses Paid for the 6 Months Ended
6/30/14* | | | Beginning
Account
Value
4/30/14 | | | Ending
Account
Value
6/30/14 | | | Expenses Paid for the 6 Months Ended
6/30/14* | |
| Class A | | | | | | | | | | | | | | | | | | | | | | | | | | | | | | | | | | | | | | | | | | | | | | | | |
Actual | | $ | 1,000.00 | | | $ | 1,018.60 | | | $ | 5.21 | | | $ | 1,000.00 | | | $ | 1,051.40 | | | $ | 4.48 | | | $ | 1,000.00 | | | $ | 1,036.70 | | | $ | 6.06 | | | $ | 1,000.00 | | | $ | 1,010.00 | | | $ | 1.83 | |
Hypothetical 5% return | | | 1,000.00 | | | | 1,019.64 | + | | | 5.21 | | | | 1,000.00 | | | | 1,020.43 | + | | | 4.41 | | | | 1,000.00 | | | | 1,018.84 | + | | | 6.01 | | | | 1,000.00 | | | | 1,019.39 | + | | | 5.46 | |
| Class B | | | | | | | | | | | | | | | | | | | | | | | | | | | | | | | | | | | | | | | | | | | | | | | | |
Actual | | | N/A | | | | N/A | | | | N/A | | | | N/A | | | | N/A | | | | N/A | | | | N/A | | | | N/A | | | | N/A | | | | N/A | | | | N/A | | | | N/A | |
Hypothetical 5% return | | | N/A | | | | N/A | | | | N/A | | | | N/A | | | | N/A | | | | N/A | | | | N/A | | | | N/A | | | | N/A | | | | N/A | | | | N/A | | | | N/A | |
| Class C | | | | | | | | | | | | | | | | | | | | | | | | | | | | | | | | | | | | | | | | | | | | | | | | |
Actual | | | 1,000.00 | | | | 1,014.90 | | | | 8.94 | | | | 1,000.00 | | | | 1,049.50 | | | | 8.23 | | | | 1,000.00 | | | | 1,032.10 | | | | 9.83 | | | | 1,000.00 | | | | 1,009.00 | | | | 3.16 | |
Hypothetical 5% return | | | 1,000.00 | | | | 1,015.92 | + | | | 8.95 | | | | 1,000.00 | | | | 1,016.76 | + | | | 8.10 | | | | 1,000.00 | | | | 1,015.12 | + | | | 9.74 | | | | 1,000.00 | | | | 1,015.47 | + | | | 9.39 | |
| Institutional | | | | | | | | | | | | | | | | | | | | | | | | | | | | | | | | | | | | | | | | | | | | | | | | |
Actual | | | 1,000.00 | | | | 1,020.40 | | | | 3.21 | | | | 1,000.00 | | | | 1,053.30 | | | | 2.70 | | | | 1,000.00 | | | | 1,039.00 | | | | 3.99 | | | | 1,000.00 | | | | 1,011.00 | | | | 1.28 | |
Hypothetical 5% return | | | 1,000.00 | | | | 1,021.62 | + | | | 3.21 | | | | 1,000.00 | | | | 1,022.17 | + | | | 2.66 | | | | 1,000.00 | | | | 1,020.88 | + | | | 3.96 | | | | 1,000.00 | | | | 1,021.03 | + | | | 3.81 | |
| Service | | | | | | | | | | | | | | | | | | | | | | | | | | | | | | | | | | | | | | | | | | | | | | | | |
Actual | | | N/A | | | | N/A | | | | N/A | | | | N/A | | | | N/A | | | | N/A | | | | N/A | | | | N/A | | | | N/A | | | | N/A | | | | N/A | | | | N/A | |
Hypothetical 5% return | | | N/A | | | | N/A | | | | N/A | | | | N/A | | | | N/A | | | | N/A | | | | N/A | | | | N/A | | | | N/A | | | | N/A | | | | N/A | | | | N/A | |
| Class IR | | | | | | | | | | | | | | | | | | | | | | | | | | | | | | | | | | | | | | | | | | | | | | | | |
Actual | | | 1,000.00 | | | | 1,020.60 | | | | 3.96 | | | | 1,000.00 | | | | 1,053.00 | | | | 3.16 | | | | 1,000.00 | | | | 1,037.30 | | | | 4.75 | | | | 1,000.00 | | | | 1,011.00 | | | | 1.43 | |
Hypothetical 5% return | | | 1,000.00 | | | | 1,020.88 | + | | | 3.96 | | | | 1,000.00 | | | | 1,021.72 | + | | | 3.11 | | | | 1,000.00 | | | | 1,020.13 | + | | | 4.71 | | | | 1,000.00 | | | | 1,020.58 | + | | | 4.26 | |
| Class R | | | | | | | | | | | | | | | | | | | | | | | | | | | | | | | | | | | | | | | | | | | | | | | | |
Actual | | | 1,000.00 | | | | 1,017.80 | | | | 6.45 | | | | 1,000.00 | | | | 1,050.20 | | | | 5.69 | | | | 1,000.00 | | | | 1,035.10 | | | | 7.27 | | | | 1,000.00 | | | | 1,010.00 | | | | 2.27 | |
Hypothetical 5% return | | | 1,000.00 | | | | 1,018.40 | + | | | 6.46 | | | | 1,000.00 | | | | 1,019.24 | + | | | 5.61 | | | | 1,000.00 | | | | 1,017.65 | + | | | 7.20 | | | | 1,000.00 | | | | 1,018.10 | + | | | 6.76 | |
123
GOLDMAN SACHS SELECT SATELLITE FUNDS
Fund Expenses — Six Month Period Ended June 30, 2014 (Unaudited) (continued)
| | | | | | | | | | | | | | | | | | | | | | | | | | | | | | | | | | | | |
| | | Managed Futures Strategy Fund | | | International Real Estate Securities Fund | | | Real Estate Securities Fund | |
| Share Class | | Beginning
Account
Value 1/1/14 | | | Ending
Account
Value
6/30/14 | | | Expenses Paid for the 6 Months Ended
6/30/14* | | | Beginning
Account
Value 1/1/14 | | | Ending
Account
Value
6/30/14 | | | Expenses Paid for the 6 Months Ended
6/30/14* | | | Beginning
Account
Value 1/1/14 | | | Ending
Account
Value
6/30/14 | | | Expenses Paid for the 6 Months Ended
6/30/14* | |
| Class A | | | | | | | | | | | | | | | | | | | | | | | | | | | | | | | | | | | | |
Actual | | $ | 1,000.00 | | | $ | 962.20 | | | $ | 6.96 | | | $ | 1,000.00 | | | $ | 1,053.60 | | | $ | 7.43 | | | $ | 1,000.00 | | | $ | 1,174.90 | | | $ | 7.55 | |
Hypothetical 5% return | | | 1,000.00 | | | | 1,017.70 | + | | | 7.15 | | | | 1,000.00 | | | | 1,017.55 | + | | | 7.30 | | | | 1,000.00 | | | | 1,017.85 | + | | | 7.00 | |
| Class B | | | | | | | | | | | | | | | | | | | | | | | | | | | | | | | | | | | | |
Actual | | | N/A | | | | N/A | | | | N/A | | | | N/A | | | | N/A | | | | N/A | | | | 1,000.00 | | | | 1,170.70 | | | | 11.52 | |
Hypothetical 5% return | | | N/A | | | | N/A | | | | N/A | | | | N/A | | | | N/A | | | | N/A | | | | 1,000.00 | | | | 1,014.18 | + | | | 10.69 | |
| Class C | | | | | | | | | | | | | | | | | | | | | | | | | | | | | | | | | | | | |
Actual | | | 1,000.00 | | | | 958.50 | | | | 10.59 | | | | 1,000.00 | | | | 1,051.40 | | | | 11.24 | | | | 1,000.00 | | | | 1,170.20 | | | | 11.52 | |
Hypothetical 5% return | | | 1,000.00 | | | | 1,013.98 | + | | | 10.89 | | | | 1,000.00 | | | | 1,013.84 | + | | | 11.04 | | | | 1,000.00 | | | | 1,014.18 | + | | | 10.69 | |
| Institutional | | | | | | | | | | | | | | | | | | | | | | | | | | | | | | | | | | | | |
Actual | | | 1,000.00 | | | | 963.40 | | | | 5.06 | | | | 1,000.00 | | | | 1,057.60 | | | | 5.41 | | | | 1,000.00 | | | | 1,176.70 | | | | 5.40 | |
Hypothetical 5% return | | | 1,000.00 | | | | 1,019.64 | + | | | 5.21 | | | | 1,000.00 | | | | 1,019.54 | + | | | 5.31 | | | | 1,000.00 | | | | 1,019.84 | + | | | 5.01 | |
| Service | | | | | | | | | | | | | | | | | | | | | | | | | | | | | | | | | | | | |
Actual | | | N/A | | | | N/A | | | | N/A | | | | N/A | | | | N/A | | | | N/A | | | | 1,000.00 | | | | 1,174.50 | | | | 8.09 | |
Hypothetical 5% return | | | N/A | | | | N/A | | | | N/A | | | | N/A | | | | N/A | | | | N/A | | | | 1,000.00 | | | | 1,017.36 | + | | | 7.50 | |
| Class IR | | | | | | | | | | | | | | | | | | | | | | | | | | | | | | | | | | | | |
Actual | | | 1,000.00 | | | | 963.30 | | | | 5.74 | | | | 1,000.00 | | | | 1,055.60 | | | | 6.17 | | | | 1,000.00 | | | | 1,176.50 | | | | 6.21 | |
Hypothetical 5% return | | | 1,000.00 | | | | 1,018.94 | + | | | 5.91 | | | | 1,000.00 | | | | 1,018.79 | + | | | 6.06 | | | | 1,000.00 | | | | 1,019.09 | + | | | 5.76 | |
| Class R | | | | | | | | | | | | | | | | | | | | | | | | | | | | | | | | | | | | |
Actual | | | 1,000.00 | | | | 960.00 | | | | 8.21 | | | | N/A | | | | N/A | | | | N/A | | | | 1,000.00 | | | | 1,172.90 | | | | 8.89 | |
Hypothetical 5% return | | | 1,000.00 | | | | 1,016.41 | + | | | 8.45 | | | | N/A | | | | N/A | | | | N/A | | | | 1,000.00 | | | | 1,016.61 | + | | | 8.25 | |
| (a) | | Commenced operations on April 30, 2014. |
| * | | Expenses are calculated using each Fund’s annualized net expense ratio for each class, which represents the ongoing expenses as a percentage of net assets for the six months ended June 30, 2014. Expenses are calculated by multiplying the annualized net expense ratio by the average account value for the period; then multiplying the result by the number of days in the most recent fiscal half year; and then dividing that result by the number of days in the fiscal year. The annualized net expense ratios for the period were as follows: |
| | | | | | | | | | | | | | | | | | | | | | | | | | | | |
| Fund | | Class A | | | Class B | | | Class C | | | Institutional | | | Service | | | Class IR | | | Class R | |
Absolute Return Tracker | | | 1.04 | % | | | N/A | | | | 1.79 | % | | | 0.64 | % | | | N/A | | | | 0.79 | % | | | 1.29 | % |
Commodity Strategy | | | 0.88 | | | | N/A | | | | 1.62 | | | | 0.53 | | | | N/A | | | | 0.62 | | | | 1.12 | |
Dynamic Allocation | | | 1.20 | | | | N/A | | | | 1.95 | | | | 0.79 | | | | N/A | | | | 0.94 | | | | 1.44 | |
Dynamic Commodity Strategy | | | 1.09 | | | | N/A | | | | 1.88 | | | | 0.76 | | | | N/A | | | | 0.85 | | | | 1.35 | |
Managed Futures Strategy | | | 1.43 | | | | N/A | | | | 2.18 | | | | 1.04 | | | | N/A | | | | 1.18 | | | | 1.69 | |
International Real Estate Securities | | | 1.46 | | | | N/A | | | | 2.21 | | | | 1.06 | | | | N/A | | | | 1.21 | | | | N/A | |
Real Estate Securities | | | 1.40 | | | | 2.14 | % | | | 2.14 | | | | 1.00 | | | | 1.50 | % | | | 1.15 | | | | 1.65 | |
| + | | Hypothetical expenses are based on each Fund’s actual annualized net expense ratios and an assumed rate of return of 5% per year before expenses. |
124
FUNDS PROFILE
Goldman Sachs Funds

Goldman Sachs is a premier financial services firm, known since 1869 for creating thoughtful and customized investment solutions in complex global markets.
Today, the Investment Management Division of Goldman Sachs serves a diverse set of clients worldwide, including private institutions, public entities and individuals. With approximately $992.3 billion in assets under supervision as of June 30, 2014, Goldman Sachs Asset Management (“GSAM”) has portfolio management teams located around the world and our investment professionals bring firsthand knowledge of local markets to every investment decision. Assets under supervision includes assets under management and other client assets for which Goldman Sachs does not have full discretion. GSAM leverages the resources of Goldman, Sachs & Co. subject to legal, internal and regulatory restrictions.

Money Market1
Financial Square FundsSM
| n | | Financial Square Tax-Exempt Funds |
| n | | Financial Square Federal Fund |
| n | | Financial Square Government Fund |
| n | | Financial Square Money Market Fund |
| n | | Financial Square Prime Obligations Fund |
| n | | Financial Square Treasury Instruments Fund |
| n | | Financial Square Treasury Obligations Fund |
Fixed Income
Short Duration and Government
| n | | High Quality Floating Rate Fund |
| n | | Limited Maturity Obligations Fund |
| n | | Short Duration Government Fund |
| n | | Short Duration Income Fund |
| n | | Inflation Protected Securities Fund |
Multi-Sector
| n | | Core Plus Fixed Income Fund |
Municipal and Tax-Free
| n | | High Yield Municipal Fund |
| n | | Short Duration Tax-Free Fund |
Single Sector
| n | | Investment Grade Credit Fund |
| n | | High Yield Floating Rate Fund |
| n | | Emerging Markets Debt Fund |
| n | | Local Emerging Markets Debt Fund |
| n | | Dynamic Emerging Markets Debt Fund |
Corporate Credit
| n | | Long Short Credit Strategies Fund2 |
Fundamental Equity
| n | | Small/Mid Cap Value Fund |
| n | | Small/Mid Cap Growth Fund |
| n | | Flexible Cap Growth Fund |
| n | | Concentrated Growth Fund |
| n | | Technology Tollkeeper Fund |
| n | | Growth Opportunities Fund |
| n | | Rising Dividend Growth Fund |
Tax-Advantaged Equity
| n | | U.S. Tax-Managed Equity Fund3 |
| n | | International Tax-Managed Equity Fund3 |
| n | | U.S. Equity Dividend and Premium Fund |
| n | | International Equity Dividend and Premium Fund |
Equity Insights
| n | | Small Cap Equity Insights Fund |
| n | | U.S. Equity Insights Fund |
| n | | Small Cap Growth Insights Fund |
| n | | Large Cap Growth Insights Fund |
| n | | Large Cap Value Insights Fund |
| n | | Small Cap Value Insights Fund |
| n | | International Small Cap Insights Fund |
| n | | International Equity Insights Fund |
| n | | Emerging Markets Equity Insights Fund |
Fundamental Equity International
| n | | Strategic International Equity Fund |
| n | | Focused International Equity Fund4 |
| n | | International Small Cap Fund |
| n | | Emerging Markets Equity Fund |
| n | | BRIC Fund (Brazil, Russia, India, China) |
Select Satellite5
| n | | Real Estate Securities Fund |
| n | | International Real Estate Securities Fund |
| n | | Commodity Strategy Fund |
| n | | Dynamic Commodity Strategy Fund |
| n | | Dynamic Allocation Fund |
| n | | Absolute Return Tracker Fund |
| n | | Managed Futures Strategy Fund |
| n | | MLP Energy Infrastructure Fund |
| n | | Multi-Manager Alternatives Fund |
| n | | Multi-Asset Real Return Fund |
| n | | Retirement Portfolio Completion Fund |
| n | | Fixed Income Macro Strategies Fund |
Total Portfolio Solutions5
| n | | Balanced Strategy Portfolio |
| n | | Growth and Income Strategy Portfolio |
| n | | Growth Strategy Portfolio |
| n | | Equity Growth Strategy Portfolio |
| n | | Satellite Strategies Portfolio |
| n | | Enhanced Dividend Global Equity Portfolio |
| n | | Tax Advantaged Global Equity Portfolio |
| 1 | | An investment in a money market fund is neither insured nor guaranteed by the Federal Deposit Insurance Corporation (“FDIC”) or any other government agency. Although the Funds seek to preserve the value of your investment at $1.00 per share, it is possible to lose money by investing in the Funds. |
| 2 | | Effective at the close of business on March 21, 2014, the Goldman Sachs Credit Strategies Fund was reorganized with and into the Goldman Sachs Long Short Credit Strategies Fund. |
| 3 | | Effective on April 30, 2014, the Goldman Sachs Structured Tax-Managed Equity and Structured International Tax-Managed Equity Funds were renamed the Goldman Sachs U.S. Tax-Managed Equity and International Tax-Managed Equity Funds respectively. |
| 4 | | Effective at the close of business on February 28, 2014, the Goldman Sachs Concentrated International Equity Fund was renamed the Goldman Sachs Focused International Equity Fund. |
| 5 | | Individual Funds within the Total Portfolio Solutions and Select Satellite categories will have various placement on the risk/return spectrum and may have greater or lesser risk than that indicated by the placement of the general Total Portfolio Solutions or Select Satellite category. |
Financial Square FundsSM is a registered service mark of Goldman, Sachs & Co.
| * | | This list covers open-end funds only. Please visit our website at www.GSAMFUNDS.com to learn about our closed-end fund. |
| | |
TRUSTEES Ashok N. Bakhru, Chairman John P. Coblentz, Jr. Diana M. Daniels Joseph P. LoRusso Herbert J. Markley James A. McNamara Jessica Palmer Alan A. Shuch Richard P. Strubel Roy W. Templin | | OFFICERS James A. McNamara, President Scott M. McHugh, Principal Financial Officer and Treasurer Caroline Kraus, Secretary |
| |
GOLDMAN, SACHS & CO. Distributor and Transfer Agent | | GOLDMAN SACHS ASSET MANAGEMENT, L.P. Investment Adviser |
Visit our web site at www.GSAMFUNDS.com to obtain the most recent month-end returns.
Goldman Sachs Asset Management, L.P. 200 West Street, New York, New York 10282
Economic and market forecasts presented herein reflect our judgment as of the date of this presentation and are subject to change without notice. These forecasts do not take into account the specific investment objectives, restrictions, tax and financial situation or other needs of any specific client. Actual data will vary and may not be reflected here. These forecasts are subject to high levels of uncertainty that may affect actual performance. Accordingly, these forecasts should be viewed as merely representative of a broad range of possible outcomes. These forecasts are estimated, based on assumptions, and are subject to significant revision and may change materially as economic and market conditions change. Goldman Sachs has no obligation to provide updates or changes to these forecasts. Case studies and examples are for illustrative purposes only.
The portfolio risk management process includes an effort to monitor and manage risk, but does not imply low risk.
The reports concerning the Funds included in this shareholder report may contain certain forward-looking statements about the factors that may affect the performance of the Funds in the future. These statements are based on Fund management’s predictions and expectations concerning certain future events and their expected impact on the Funds, such as performance of the economy as a whole and of specific industry sectors, changes in the levels of interest rates, the impact of developing world events, and other factors that may influence the future performance of the Funds. Management believes these forward-looking statements to be reasonable, although they are inherently uncertain and difficult to predict. Actual events may cause adjustments in portfolio management strategies from those currently expected to be employed.
A description of the policies and procedures that the Funds use to determine how to vote proxies relating to portfolio securities and information regarding how a Fund voted proxies relating to portfolio securities during the most recent 12-month period ended June 30 is available (i) without charge, upon request by calling 1-800-526-7384 (for Retail Shareholders) or 1-800-621-2550 (for Institutional Shareholders); and (ii) on the Securities and Exchange Commission (“SEC”) web site at http://www. sec.gov.
The Global Industry Classification Standard (GICS) was developed by and is the exclusive property and a service mark of Morgan Stanley Capital International Inc. (MSCI) and Standard & Poor’s, a division of The McGraw-Hill Companies, Inc. (S&P) and is licensed for use by Goldman Sachs. Neither MSCI, S&P nor any other party involved in making or compiling the GICS or any GICS classifications makes any express or implied warranties or representations with respect to such standard or classification (or the results to be obtained by the use thereof), and all such parties hereby expressly disclaim all warranties of originality, accuracy, completeness, merchantability or fitness for a particular purpose with respect to any of such standard or classification. Without limiting any of the foregoing, in no event shall MSCI, S&P, any of their affiliates or any third party involved in making or compiling the GICS or any GICS classifications have any liability for any direct, indirect, special, punitive, consequential or any other damages (including lost profits) even if notified of the possibility of such damages.
The Funds file their complete schedule of portfolio holdings with the SEC for the first and third quarters of each fiscal year on Form N-Q. The Funds’ Form N-Q are available on the SEC’s web site at http://www.sec.gov within 60 days after the Funds’ first and third fiscal quarters. The Funds’ Forms N-Q may be reviewed and copied at the SEC’s Public Reference Room in Washington, D.C. and information on the operation of the Public Reference Room may also be obtained by calling 1-800-SEC-0330. Form N-Q may be obtained upon request and without charge by calling 1-800-526-7384 (for Retail Shareholders) or 1-800-621-2550 (for Institutional Shareholders).
Fund holdings and allocations shown are as of June 30, 2014 and may not be representative of future investments. Fund holdings should not be relied on in making investment decisions and should not be construed as research or investment advice regarding particular securities. Current and future holdings are subject to risk.
References to indices, benchmarks or other measures of relative market performance over a specified period of time are provided for your information only and do not imply that the portfolio will achieve similar results. The index composition may not reflect the manner in which a portfolio is constructed. While an adviser seeks to design a portfolio which reflects appropriate risk and return features, portfolio characteristics may deviate from those of the benchmark.
This material is not authorized for distribution to prospective investors unless preceded or accompanied by a current Prospectus or summary prospectus, if applicable. Investors should consider a Fund’s objective, risks, and charges and expenses, and read the summary prospectus, if available, and/or the Prospectus carefully before investing or sending money. The summary prospectus, if available, and the Prospectus contain this and other information about a Fund and may be obtained from your Authorized Institution or from Goldman, Sachs & Co. by calling (retail – 1-800-526-7384) (institutional – 1-800-621-2550).
© 2014 Goldman Sachs. All rights reserved. 137178.MF.MED.TMPL/8/2014 SELSATSAR-14/88K
The information required by this Item is only required in an annual report on this Form N-CSR.
| ITEM 3. | AUDIT COMMITTEE FINANCIAL EXPERT. |
The information required by this Item is only required in an annual report on this Form N-CSR.
| ITEM 4. | PRINCIPAL ACCOUNTANT FEES AND SERVICES. |
The information required by this Item is only required in an annual report on this Form N-CSR.
| ITEM 5. | AUDIT COMMITTEE OF LISTED REGISTRANTS. |
| ITEM 6. | SCHEDULE OF INVESTMENTS. |
| | Schedule of Investments is included as part of the Report to Stockholders filed under Item 1. |
| ITEM 7. | DISCLOSURE OF PROXY VOTING POLICIES AND PROCEDURES FOR CLOSED-END MANAGEMENT INVESTMENT COMPANIES. |
| ITEM 8. | PORTFOLIO MANAGERS OF CLOSED-END MANAGEMENT INVESTMENT COMPANIES. |
| ITEM 9. | PURCHASES OF EQUITY SECURITIES BY CLOSED-END MANAGEMENT INVESTMENT COMPANY AND AFFILIATED PURCHASERS. |
| ITEM 10. | SUBMISSION OF MATTERS TO A VOTE OF SECURITY HOLDERS. |
| | There have been no material changes to the procedures by which shareholders may recommend nominees to the registrant’s board of trustees. |
| ITEM 11. | CONTROLS AND PROCEDURES. |
| | (a) | The registrant’s principal executive and principal financial officers, or persons performing similar functions have concluded that the registrant’s disclosure controls and procedures (as defined in Rule 30a-3(c) under the Investment Company Act of 1940, as amended (the “1940 Act”)) are effective as of a date within 90 days of the filing of this report that includes the disclosure required by this paragraph, based on the evaluation of these controls and procedures required by Rule 30a-3(b) under the 1940 Act and 15d-15(b) under the Securities Exchange Act of 1934, as amended. |
| | (b) | There were no changes in the registrant’s internal control over financial reporting (as defined in Rule 30a-3(d) under the 1940 Act) that occurred during the registrant’s second fiscal quarter of the period covered by this report that have materially affected, or are reasonably likely to materially affect, the registrant’s internal control over financial reporting. |
| | | | |
| (a)(1) | | The information required by this Item is only required in connection with an annual report on this Form N-CSR. |
| | |
| (a)(2) | | Exhibit 99.CERT | | Certifications pursuant to Section 302 of the Sarbanes-Oxley Act of 2002 filed herewith. |
| | |
| (b) | | Exhibit 99.906CERT | | Certifications pursuant to Section 906 of the Sarbanes-Oxley Act of 2002 filed herewith. |
SIGNATURES
Pursuant to the requirements of the Securities Exchange Act of 1934 and the Investment Company Act of 1940, the registrant has duly caused this report to be signed on its behalf by the undersigned, thereunto duly authorized.
| | |
| | | Goldman Sachs Trust |
| |
| By: | | /s/ James A. McNamara |
| |
| | |
| | James A. McNamara |
| | President/Principal Executive Officer |
| | Goldman Sachs Trust |
| |
| Date: | | February 27, 2015 |
Pursuant to the requirements of the Securities Exchange Act of 1934 and the Investment Company Act of 1940, this report has been signed below by the following persons on behalf of the registrant and in the capacities and on the dates indicated.
| | |
| By: | | /s/ James A. McNamara |
| |
| | |
| | James A. McNamara |
| | President/Principal Executive Officer |
| | Goldman Sachs Trust |
| |
| Date: | | February 27, 2015 |
| |
| By: | | /s/ Scott McHugh |
| |
| | |
| | Scott McHugh |
| | Principal Financial Officer |
| | Goldman Sachs Trust |
| |
| Date: | | February 27, 2015 |