UNITED STATES
SECURITIES AND EXCHANGE COMMISSION
Washington, D.C. 20549
FORM N-CSR
CERTIFIED SHAREHOLDER REPORT OF REGISTERED
MANAGEMENT INVESTMENT COMPANIES
Investment Company Act file number 811-05349
Goldman Sachs Trust
(Exact name of registrant as specified in charter)
71 South Wacker Drive, Chicago, Illinois 60606
(Address of principal executive offices) (Zip code)
| | |
| Caroline Kraus, Esq. | | Copies to: |
| Goldman, Sachs & Co. | | Geoffrey R.T. Kenyon, Esq. |
| 200 West Street | | Dechert LLP |
| New York, New York 10282 | | 100 Oliver Street |
| | 40th Floor |
| | Boston, MA 02110-2605 |
(Name and address of agents for service)
Registrant’s telephone number, including area code: (312) 655-4400
Date of fiscal year end: August 31
Date of reporting period: February 28, 2015
| ITEM 1. | REPORTS TO STOCKHOLDERS. |
| | The Semi-Annual Report to Stockholders is filed herewith. |
Goldman Sachs Funds

| | | | |
| | |
| Semi-Annual Report | | | | February 28, 2015 |
| | |
| | | | Fundamental Equity Growth Funds |
| | | | Capital Growth |
| | | | Concentrated Growth |
| | | | Flexible Cap Growth |
| | | | Focused Growth |
| | | | Growth Opportunities |
| | | | Small/Mid Cap Growth |
| | | | Strategic Growth |
| | | | Technology Tollkeeper |
| | | | U.S. Equity* |
*Effective after the close of business on April 30, 2015, the Goldman Sachs U.S Equity Fund will be renamed the Goldman Sachs Dynamic U.S. Equity Fund.

Goldman Sachs Fundamental Equity Growth Funds
| | | | |
TABLE OF CONTENTS | | | | |
| |
Principal Investment Strategies and Risks | | | 1 | |
| |
Investment Process | | | 3 | |
| |
Market Review | | | 4 | |
| |
Portfolio Management Discussions and Performance Summaries | | | 7 | |
| |
Schedules of Investments | | | 61 | |
| |
Financial Statements | | | 80 | |
| |
Financial Highlights | | | 90 | |
| |
Notes to Financial Statements | | | 108 | |
| |
Other Information | | | 131 | |
| | | | |
| | | |
| NOT FDIC-INSURED | | May Lose Value | | No Bank Guarantee |
GOLDMAN SACHS FUNDAMENTAL EQUITY GROWTH FUNDS
Principal Investment Strategies and Risks
This is not a complete list of risks that may affect the Funds. For additional information concerning the risks applicable to the Funds, please see the Funds’ Prospectuses.
The Goldman Sachs Capital Growth Fund invests primarily in U.S. equity investments. The Fund’s equity investments are subject to market risk, which means that the value of the securities in which it invests may go up or down in response to the prospects of individual companies, particular sectors and/or general economic conditions. Different investment styles (e.g., “growth”) tend to shift in and out of favor, and at times the Fund may underperform other funds that invest in similar asset classes.
The Goldman Sachs Concentrated Growth Fund invests primarily in U.S. equity investments and invests, under normal circumstances, in approximately 30-45 companies. The Fund’s equity investments are subject to market risk, which means that the value of the securities in which it invests may go up or down in response to the prospects of individual companies, particular sectors and/or general economic conditions. The securities of mid- and small-capitalization companies involve greater risks than those associated with larger, more established companies and may be subject to more abrupt or erratic price movements. Different investment styles (e.g., “growth”) tend to shift in and out of favor, and at times the Fund may underperform other funds that invest in similar asset classes. The Fund is “non-diversified” and may invest more of its assets in fewer issuers than “diversified” funds. Accordingly, the Fund may be more susceptible to adverse developments affecting any single issuer held in its portfolio and to greater losses resulting from these developments.
The Goldman Sachs Flexible Cap Growth Fund invests primarily in U.S. equity investments in small-, mid- and large-capitalization issuers. The Fund’s equity investments are subject to market risk, which means that the value of the securities in which it invests may go up or down in response to the prospects of individual companies, particular sectors and/or general economic conditions. The securities of mid- and small-capitalization companies involve greater risks than those associated with larger, more established companies and may be subject to more abrupt or erratic price movements. Different investment styles (e.g., “growth”) tend to shift in and out of favor, and at times the Fund may underperform other funds that invest in similar asset classes.
The Goldman Sachs Focused Growth Fund invests primarily in U.S. equity investments and invests, under normal circumstances, in approximately 20-25 companies. The Fund’s equity investments are subject to market risk, which means that the value of the securities in which it invests may go up or down in response to the prospects of individual companies, particular industry sectors and/or general economic conditions. The securities of mid- and small-capitalization companies involve greater risks than those associated with larger, more established companies and may be subject to more abrupt or erratic price movements. Different investment styles (e.g., “growth”) tend to shift in and out of favor, and at times the Fund may underperform other funds that invest in similar asset classes. The Fund is “non-diversified” and may invest more of its assets in fewer issuers than “diversified” funds. Accordingly, the Fund may be more susceptible to adverse developments affecting any single issuer held in its portfolio and to greater losses resulting from these developments.
The Goldman Sachs Growth Opportunities Fund invests primarily in U.S. equity investments with a primary focus on mid-capitalization companies. The Fund’s equity investments are subject to market risk, which means that the value of the securities in which it invests may go up or down in response to the prospects of individual companies, particular sectors and/or general economic conditions. The securities of mid- and small-capitalization companies involve greater risks than those associated with larger, more established companies and may be subject to more abrupt or erratic price movements. Different investment styles (e.g., “growth”) tend to shift in and out of favor, and at times the Fund may underperform other funds that invest in similar asset classes.
1
GOLDMAN SACHS FUNDAMENTAL EQUITY GROWTH FUNDS
The Goldman Sachs Small/Mid Cap Growth Fund invests primarily in equity investments with a primary focus on mid- and small-capitalization companies. The Fund’s equity investments are subject to market risk, which means that the value of the securities in which it invests may go up or down in response to the prospects of individual companies, particular sectors and/or general economic conditions. The securities of mid- and small-capitalization companies involve greater risks than those associated with larger, more established companies and may be subject to more abrupt or erratic price movements. Different investment styles (e.g., “growth”) tend to shift in and out of favor, and at times the Fund may underperform other funds that invest in similar asset classes.
The Goldman Sachs Strategic Growth Fund invests primarily in U.S. equity investments. The Fund’s equity investments are subject to market risk, which means that the value of the securities in which it invests may go up or down in response to the prospects of individual companies, particular sectors and/or general economic conditions. Different investment styles (e.g., “growth”) tend to shift in and out of favor, and at times the Fund may underperform other funds that invest in similar asset classes.
The Goldman Sachs Technology Tollkeeper Fund invests primarily in equity securities of high quality technology, media or service companies that adopt or use technology to improve their cost structure, revenue opportunities or competitive advantage (“Technology Tollkeeper” companies). Because the Fund concentrates its investments in certain specific industries, the Fund is subject to greater risk of loss as a result of adverse economic, business or other developments affecting those industries than if its investments were more diversified across different industries. Stock prices of internet and internet-related companies in particular may be especially volatile. The securities of mid- and small-capitalization companies involve greater risks than those associated with larger, more established companies and may be subject to more abrupt or erratic price movements. Different investment styles (e.g., “growth”) tend to shift in and out of favor, and at times the Fund may underperform other funds that invest in similar asset classes.
The Goldman Sachs U.S. Equity Fund invests primarily in large-capitalization U.S. equity investments. The Fund’s equity investments are subject to market risk, which means that the value of the securities in which it invests may go up or down in response to the prospects of individual companies, particular sectors and/or general economic conditions. Different investment styles (e.g., “growth” and “value”) tend to shift in and out of favor, and at times the Fund may underperform other funds that invest in similar asset classes.
2
GOLDMAN SACHS FUNDAMENTAL EQUITY GROWTH FUNDS
What Differentiates the Goldman Sachs Growth Team’s Investment Process?
For over 30 years, the Goldman Sachs Growth Team has consistently applied a three-step investment process based on our belief that wealth is created through the long-term ownership of growing businesses.


| n | | Make decisions as long-term business owners rather than as stock traders |
| n | | Perform in-depth, fundamental research |
| n | | Focus on long-term structural and competitive advantages |
Result
Performance driven by the compounding growth of businesses over time — not short-term market movements
Long-term participation in growing businesses — less reliance on macroeconomic predictions, market timing, sector rotation or momentum

Identify high quality growth businesses. Some required investment criteria include:
| n | | Established brand names |
| n | | Recurring revenue streams |
| n | | Long product life cycles |
| n | | Favorable long-term growth prospects |
Result
Investments in businesses that we believe are strategically positioned for consistent, sustainable long-term growth

| n | | Perform rigorous valuation analysis of every potential investment |
| n | | Use valuation tools and analytics to ensure that the high-quality business franchises we have identified also represent sound investments |
Result
Good investment decisions based on solid understanding of what each business is worth
Attractive buying opportunities as the stock prices of quality growth businesses fluctuate over time
3
MARKET REVIEW
Goldman Sachs Fundamental Equity Growth Funds
Market Review
Overall, U.S. equities advanced for the six months ended February 28, 2015 (the “Reporting Period”) with broad sector participation. The Standard & Poor’s 500® Index (the “S&P 500 Index”) ended the Reporting Period with a gain of 6.12% . The Russell 3000® Index generated a return of 5.98% . By the end of the Reporting Period, the S&P 500 Index and Dow Jones Industrial Average each rose to new record highs, and the NASDAQ Composite neared its dot-com era high seen in 2000.
Several macroeconomic themes influenced U.S. equity market performance during the Reporting Period, including the improving domestic economy, the expectation the Federal Reserve (the “Fed”) would increase interest rates soon, and sharply falling oil prices. More specifically, the U.S. reported Gross Domestic Product (“GDP”) growth well ahead of that of Europe and Japan during the Reporting Period. In addition, the U.S. labor market continued to improve, with unemployment falling to 5.6%, its lowest level since June 2008. In turn, financial markets increasingly focused on the potential that the Fed would increase interest rates, which led to an appreciation of the U.S. dollar against many currencies. At the same time, the price of West Texas Intermediate (“WTI”) crude oil fell from more than $90 per barrel at the beginning of the Reporting Period to less than $50 per barrel in January 2015, before recovering modestly in February 2015.
Given this backdrop, the energy sector declined significantly, the only sector in the S&P 500 Index to post a negative return during the Reporting Period. In contrast, both the consumer discretionary and consumer staples sectors significantly outperformed the S&P 500 Index during the Reporting Period, as the U.S. equity markets reflected investor sentiment that the combination of an improving economy, healthier job market, strong U.S. dollar and low oil prices would be positive for U.S. consumers. Health care was the best performing sector in the S&P 500 Index during the Reporting Period, as robust merger and acquisition activity pushed stock prices higher.
For the Reporting Period overall, mid-cap companies performed best, but only modestly ahead of both large-cap and small-cap companies. Growth stocks outpaced value stocks across the capitalization spectrum of the U.S. equity market. (All as measured by Russell Investments indices.)
Looking Ahead
We believe many of the trends that drove equities higher in 2014 — a slowly improving global economy, increased growth spending and rising corporate earnings — may well continue to influence equity returns as 2015 further unfolds. In addition, diverging central bank policies, U.S. dollar strength and a dramatic drop in commodity prices, notably oil, appear to be shaping up as macro themes that may also continue to drive equities in the months ahead. We believe that equity returns will once again look attractive when compared to the low expected returns for bonds, cash and commodities.
Indeed, in our view, improving global economic growth, led by the U.S., should be a tailwind for equities and support further earnings growth, which we expect to be the main driver of higher prices. While there is a case for possible multiple expansion, we are not counting on re-rating to drive stocks higher. (Re-rating is when the market changes its view of a company sufficiently to make calculation ratios, such as its price/earnings ratio, substantially higher or
4
MARKET REVIEW
lower.) We believe positive investor sentiment will continue to drive the bull market, supported by healthy merger and acquisition activity and capital expenditure expansion. Companies in the information technology and health care sectors may still benefit from these trends, but stock prices have already risen in these sectors, which may limit upside and compel us to look to other areas of the market, such as financials.
U.S. shale oil production has increased to the point where a dip in global demand has sent oil prices sharply lower. While energy stocks were hard hit during 2014, we are beginning to look for opportunities to invest, given the wide range of individual company prospects. Similarly, we are actively considering which other industries and economies may benefit from lower oil prices and which ones might be negatively impacted.
For much of 2014, there were a number of factors hindering global consumption, despite our bullish long-term view on the consumer. At the end of the Reporting Period, however, we saw lower oil prices as a possible, if not probable, catalyst to spur consumption. A consumer comeback in the U.S. is particularly meaningful to U.S. GDP and could therefore have global implications because of the size of the U.S. economy. Yet, at the end of the Reporting Period, the U.S. stock market appeared to already reflect some of this positive scenario, while European stock markets appeared to reflect dire sentiment on Europe. We believe European corporate earnings could benefit from improving U.S. consumption and therein may lie the investment opportunity. In addition, both the euro and yen depreciated meaningfully against the U.S. dollar in 2014 and early 2015, and we believe these currencies will remain relatively weak, which we believe should benefit exports in both countries and contribute to corporate earnings growth.
As always, we maintain our focus on seeking companies that we believe will generate long-term growth in today’s ever-changing market conditions.
5
MARKET REVIEW
|
| |
| Changes to the Funds’ Portfolio Management Team during the Reporting Period |
| |
| On February 11, 2015, Craig Glassner, a managing director and portfolio manager on the Growth Equity Investment Team, left the firm to pursue another opportunity. Craig shared portfolio management responsibility for the Mid Cap Growth strategy with Steve Barry and Ashley Woodruff. In addition, he also shared portfolio management responsibility for the Small/Mid Cap Growth strategy with Steve Barry and Dan Zimmerman. Steve Barry, as the architect of the Mid Cap Growth and Small/Mid Cap Growth strategies, has consistently managed these strategies since their respective inception dates in 1999 and 2005. Ashley Woodruff will continue to manage our Mid Cap Growth strategy with Steve Barry. Ashley is a consumer sector portfolio manager and holds primary research responsibility for the consumer sector. Ashley joined the Growth Equity Investment Team in 2013 as a managing director and has 13 years of investment experience. Dan Zimmerman, along with Steve Barry, will continue to manage our Small/Mid Cap Growth strategy. Dan is a financials sector portfolio manager and holds primary research responsibility for the financial services and agricultural industries. Dan has been with the Growth Equity Investment Team since 2008 and has 13 years of investment experience. Craig’s research responsibilities for the health care sector have been absorbed by Tim Leahy and Anant Padmanabhan. Tim has 16 years of investment experience, approximately 10 of which are with the Growth Equity Investment Team. Anant has 10 years of research experience. Both Tim and Anant are members of the health care research team. The Growth Equity Investment Team continues to be led by Steve Barry, Chief Investment Officer and Head of Fundamental Equity. Steve has 29 years of investment experience and has been with the Growth Equity Investment Team since 1999. The Growth Equity Investment Team consists of 14 investment professionals and three risk professionals, with the senior leaders of the Team averaging 17 years of investment experience. Our 34-year time-tested investment philosophy remains the same. We seek to buy high quality growth businesses at what we believe are attractive valuations and drive investment performance through stock selection. |
6
PORTFOLIO RESULTS
Goldman Sachs Capital Growth Fund
Portfolio Composition
The Fund invests primarily in U.S. equity investments. Since the Fund’s inception, the Goldman Sachs Growth Equity Investment Team has focused on several key investment criteria that it believes can drive a company’s growth over the long term. These characteristics are: dominant market share, established brand name, pricing power, recurring revenue stream, free cash flow, high returns on invested capital, predictable growth, sustainable growth, long product life cycle, enduring competitive advantage, favorable demographic trends and excellent management. The Team strives to purchase these companies at reasonable valuations in order to capture the full benefits of their growth.
Portfolio Management Discussion and Analysis
Below, the Goldman Sachs Growth Equity Investment Team discusses the Goldman Sachs Capital Growth Fund’s (the “Fund”) performance and positioning for the six-month period ended February 28, 2015 (the “Reporting Period”).
| Q | | How did the Fund perform during the Reporting Period? |
| A | | During the Reporting Period, the Fund’s Class A, C, Institutional, Service, IR and R Shares generated cumulative total returns, without sales charges, of 9.72%, 9.30%, 9.90%, 9.61%, 9.83% and 9.53%, respectively. These returns compare to the 8.46% cumulative total return of the Fund’s benchmark, the Russell 1000® Growth Index (with dividends reinvested) (the “Russell Index”), during the same period. |
| Q | | What key factors were responsible for the Fund’s performance during the Reporting Period? |
| A | | Stock selection overall contributed most to the Fund’s performance relative to the Russell Index during the Reporting Period. |
| Q | | Which equity market sectors most significantly affected Fund performance? |
| A | | Effective stock selection in the health care, information technology and materials sectors helped the Fund’s performance most relative to the Russell Index. Detracting from the Fund’s relative results most were weak stock selection in the industrials and consumer discretionary sectors and having no exposure at all to the utilities sector. |
| Q | | What were some of the Fund’s best-performing individual stocks? |
| A | | The Fund benefited most relative to the Russell Index from positions in natural food supermarket owner and operator Whole Foods Market, international technology stalwart International Business Machines (“IBM”) and specialty retailer L Brands. |
| | Whole Foods Market was a strong contributor to the Fund’s performance during the Reporting Period, as investors gained confidence in several of the company’s strategic initiatives. More specifically, the company began to see positive results from initiatives aimed at cutting costs, improving profitability and reaccelerating top-line growth. Whole Foods Market also rolled out a national advertising campaign to emphasize its high quality food standards in the fall of 2014 and began testing a customer loyalty program, both of which we believe could drive traffic and comparable store sales growth. In our view, Whole Foods Market was well positioned at the end of the Reporting Period as a market leader. |
| | Shares of IBM rose during the Reporting Period based in part on the company’s reports of fourth quarter 2014 earnings that were ahead of expectations. We believe these results reflected the multinational company’s resilience during a Reporting Period replete with currency headwinds. More important perhaps, the company announced major initiatives during the Reporting Period in the mobility, security and cloud spaces, which we believe may provide strong upside potential. At the end of the Reporting Period, we felt confident that IBM should continue to be well received by the markets, as it improves its gross margins and maintains dominant market share in a high barrier industry. Moreover, we viewed recent acquisitions by the company as new opportunities to further unlock value for its shareholders. |
| | L Brands was a top contributor to the Fund’s results, as the company reported strong third quarter 2014 results and raised its fiscal year earnings guidance in November 2014. Strong comparable store sales growth at both its Victoria’s Secret and Bath & Body Works chains, combined with margin expansion, drove upside performance. At the end of the |
7
PORTFOLIO RESULTS
| | Reporting Period, we believe L Brands was well positioned for long-term growth based upon three key initiatives: Victoria’s Secret’s U.S. square footage growth; international expansion; and operating margin expansion through supply chain improvements that should reduce lead times, in our view, and allow stores to stay lean and reduce markdowns. |
| Q | | Which stocks detracted significantly from the Fund’s performance during the Reporting Period? |
| A | | Detracting most from the Fund’s results relative to its benchmark index were positions in global clothing manufacturer PVH, metal component manufacturer Precision Castparts and energy services company Halliburton. |
| | PVH detracted from the Fund’s results, as the consumer environment and potential currency headwinds to earnings were an overhang on the stock. Still, at the end of the Reporting Period, underlying trends were on track, and PVH remained a high quality growth company, in our view. Importantly, its Calvin Klein business was beginning to inflect, or tilt, positively after recent product re-launches. Despite what we believe were some short-term currency-related challenges to the stock, we believe PVH’s global expansion opportunity should lead to steady earnings growth ahead. |
| | Shares of Precision Castparts declined, as the company reported fiscal first quarter earnings that were slightly below consensus expectations, despite delivering year-over-year earnings and revenue growth. Also, volatility in energy prices negatively impacted the outlook for the company, causing further uncertainty about its stock. At the end of the Reporting Period, we continued to believe the company has leading global positions in diverse end markets, including aerospace forgings, castings and aero structures, as well as strong and growing businesses serving gas power generation and the oil industry. In our view, these end markets should provide attractive cyclical and secular growth tailwinds to the company. |
| | The sell-off in oil prices weighed on the energy sector broadly, and shares of Halliburton were no exception. During the Reporting Period, Halliburton announced its intention to purchase oilfield services competitor Baker Hughes. This transaction, if completed, would create the second largest oilfield services company globally. Indeed, we believe the deal would be accretive for Halliburton, which should primarily benefit from Baker Hughes’ strong technology presence in North America and from an estimated $2 billion in cost synergies by the end of 2017. While we acknowledge the near-term volatility of oil prices, we continued to believe at the end of the Reporting Period that Halliburton is a high quality company, well positioned to be a strong performer over the long term. We also continued to believe shares of Halliburton were attractively valued and that the company was well positioned to benefit from its leadership position in North America. Additionally, we remained positive on Halliburton’s efficiency program in North America, which supports better margin improvement, in our view. |
| Q | | How did the Fund use derivatives and similar instruments during the Reporting Period? |
| A | | During the Reporting Period, we did not use derivatives as part of an active management strategy. |
| Q | | Did the Fund make any significant purchases or sales during the Reporting Period? |
| A | | We initiated a Fund position in Philip Morris International, the largest tobacco product manufacturer in the world, distributing solely outside of the U.S. We believe the company is a high quality, durable franchise with what we consider to be its leading market share, favorable geographic mix of both highly developed and emerging market exposure, strong free cash flow generation and fairly inelastic demand. In addition, we believe organic revenue has reached an inflection point given the company’s continued pricing power and increased stability in key markets. We believe Philip Morris International is well positioned to deliver better than expected revenue growth with new lower health risk products paired with abating foreign exchange headwinds. Finally, in our view, the company’s stock was trading at a favorable valuation relative to its peers at the time of our purchase, thus presenting what we believed to be a compelling risk/reward opportunity. |
| | We established a Fund position in specialty pharmaceuticals company Shire. Shares of the company had pulled back after potential acquirer AbbVie announced plans to terminate the deal due to developments around inversion policy (related to the practice of relocating businesses for tax purposes), which lowered the tax incentives of future deals. We believe the market overreacted to this news, and we viewed this event as a buying opportunity. In our opinion, at the time of our purchase Shire was trading at an attractive valuation given the strong fundamentals of the company and what we consider to be the potential upside in its product pipeline. |
8
PORTFOLIO RESULTS
| | Conversely, we exited the Fund’s position in Regeneron Pharmaceuticals during the Reporting Period. The company reported earnings shy of consensus estimates, implying disappointing sales from its flagship drug Eylea. While we remained constructive on the company’s growth outlook and its products’ potential, we decided to reallocate the capital from its sale to companies we believe offer a more favorable risk/reward opportunity. |
| | We sold the Fund’s position in beverage giant Coca-Cola. While the company executed well over the past few years, we believed it was prudent to exit the Fund’s position in favor of higher conviction consumer ideas. |
| Q | | Were there any notable changes in the Fund’s weightings during the Reporting Period? |
| A | | In constructing the Fund’s portfolio, we focus on picking stocks rather than on making industry or sector bets. We seek to outpace the benchmark index by overweighting stocks that we expect to outperform and underweighting those that we think may lag. Consequently, changes in its sector weights are generally the direct result of individual stock selection or of stock appreciation or depreciation. That said, during the Reporting Period, the Fund’s exposure to the consumer staples sector increased and its allocations to the health care and telecommunication services sectors decreased relative to the Russell Index. |
| Q | | How was the Fund positioned relative to its benchmark index at the end of February 2015? |
| A | | At the end of February 2015, the Fund had overweighted positions relative to the Russell Index in the consumer discretionary and financials sectors. On the same date, the Fund had underweighted positions compared to the Russell Index in the industrials and health care sectors. The Fund was rather neutrally weighted to the Russell Index in the materials, energy, consumer staples and information technology sectors and had no position at all in the utilities or telecommunication services sectors on February 28, 2015. |
9
FUND BASICS
Capital Growth Fund
as of February 28, 2015
| | | | | | | | | | |
| | PERFORMANCE REVIEW | |
| | | September 1, 2014–February 28, 2015 | | Fund Total Return
(based on NAV)1 | | | Russell 1000®
Growth Index2 | |
| | Class A | | | 9.72 | % | | | 8.46 | % |
| | Class C | | | 9.30 | | | | 8.46 | |
| | Institutional | | | 9.90 | | | | 8.46 | |
| | Service | | | 9.61 | | | | 8.46 | |
| | Class IR | | | 9.83 | | | | 8.46 | |
| | | Class R | | | 9.53 | | | | 8.46 | |
| | 1 | | The net asset value (“NAV”) represents the net assets of the class of the Fund (ex-dividend) divided by the total number of shares of the class outstanding. The Fund’s performance reflects the reinvestment of dividends and other distributions. The Fund’s performance does not reflect the deduction of any applicable sales charges. |
| | 2 | | The Russell 1000® Growth Index (with dividends reinvested) is an unmanaged index that measures the performance of those Russell 1000 companies with higher price-to-book ratios and higher forecasted growth values. The Index figures do not reflect any deduction for fees, expenses or taxes. It is not possible to invest directly in an index. |
| | | | | | | | | | | | | | | | | | |
| | STANDARDIZED TOTAL RETURNS3 |
| | | For the period ended 12/31/14 | | One Year | | | Five Years | | | Ten Years | | | Since Inception | | Inception Date |
| | Class A | | | 7.42 | % | | | 12.86 | % | | | 6.53 | % | | 9.34% | | 4/20/90 |
| | Class C | | | 11.71 | | | | 13.30 | | | | 6.34 | | | 5.45 | | 8/15/97 |
| | Institutional | | | 14.11 | | | | 14.59 | | | | 7.56 | | | 6.65 | | 8/15/97 |
| | Service | | | 13.60 | | | | 14.03 | | | | 7.03 | | | 9.52 | | 8/15/97 |
| | Class IR | | | 13.95 | | | | 14.43 | | | | N/A | | | 7.61 | | 11/30/07 |
| | | Class R | | | 13.40 | | | | 13.86 | | | | N/A | | | 7.08 | | 11/30/07 |
| | 3 | | The Standardized Total Returns are average annual total returns as of the most recent calendar quarter-end. They assume reinvestment of all distributions at NAV. These returns reflect a maximum initial sales charge of 5.5% for Class A Shares and the assumed contingent deferred sales charge for Class C Shares (1% if redeemed within 12 months of purchase). Because Institutional, Service, Class IR and Class R Shares do not involve a sales charge, such a charge is not applied to their Standardized Total Returns. |
The returns set forth in the tables above represent past performance. Past performance does not guarantee future results. The Fund’s investment return and principal value will fluctuate so that an investor’s shares, when redeemed, may be worth more or less than their original cost. Current performance may be lower or higher than the performance quoted above. Please visit our web site at www.GSAMFUNDS.com to obtain the most recent month-end returns. Performance reflects applicable fee waivers and/or expense limitations in effect during the periods shown. In their absence, performance would be reduced. Returns do not reflect the deduction of taxes that a shareholder would pay on Fund distributions or the redemption of Fund shares.
10
FUND BASICS
| | | | | | | | | | |
| | EXPENSE RATIOS4 | |
| | | | | Net Expense Ratio (Current) | | | Gross Expense Ratio (Before Waivers) | |
| | Class A | | | 1.16 | % | | | 1.51 | % |
| | Class C | | | 1.91 | | | | 2.26 | |
| | Institutional | | | 0.76 | | | | 1.11 | |
| | Service | | | 1.26 | | | | 1.61 | |
| | Class IR | | | 0.91 | | | | 1.26 | |
| | | Class R | | | 1.41 | | | | 1.76 | |
| | 4 | | The expense ratios of the Fund, both current (net of applicable fee waivers and/or expense limitations) and before waivers (gross of applicable fee waivers and/or expense limitations) are as set forth above according to the most recent publicly available Prospectus for the Fund and may differ from the expense ratios disclosed in the Financial Highlights in this report. Pursuant to a contractual arrangement, the Fund’s waivers and/or expense limitations will remain in place through at least December 29, 2015, and prior to such date the investment adviser may not terminate the arrangements without the approval of the Fund’s Board of Trustees. If these arrangements are discontinued in the future, the expense ratios may change without shareholder approval. |
| | | | | | | | |
| | TOP TEN HOLDINGS AS OF 2/28/155 |
| | | Holding | | % of Net Assets | | | Line of Business |
| | Apple, Inc. | | | 7.0 | % | | Computers & Peripherals |
| | Oracle Corp. | | | 2.2 | | | Software |
| | Comcast Corp. Class A | | | 2.1 | | | Media |
| | Yum! Brands, Inc. | | | 1.7 | | | Hotels, Restaurants & Leisure |
| | The Home Depot, Inc. | | | 1.7 | | | Specialty Retail |
| | QUALCOMM, Inc. | | | 1.6 | | | Communications Equipment |
| | Facebook, Inc. Class A | | | 1.6 | | | Internet Software & Services |
| | Amazon.com, Inc. | | | 1.6 | | | Internet & Catalog Retail |
| | Celgene Corp. | | | 1.5 | | | Biotechnology |
| | | Google, Inc. Class C | | | 1.5 | | | Internet Software & Services |
| | 5 | | The top 10 holdings may not be representative of the Fund’s future investments. |
11
FUND BASICS
| | |
| FUND VS . BENCHMARK SECTOR ALLOCATION6 |
| As of February 28, 2015 | | |
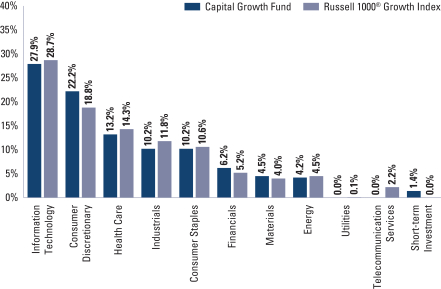
| | 6 | | The Fund is actively managed and, as such, its composition may differ over time. Consequently, the Fund’s overall sector allocations may differ from percentages contained in the graph above. The above graph categorizes investments using Global Industry Classification Standard (“GICS”), however, the sector classifications used by the portfolio management team may differ from GICS. The percentage shown for each investment category reflects the value of investments in that category as a percentage of market value. Short-term investments represent repurchase agreements. The above graph depicts the Fund’s investments but may not represent the Fund’s market exposure due to the exclusion of certain derivatives, if any, as listed in the Additional Investment Information section of the Schedule of Investments. |
12
PORTFOLIO RESULTS
Goldman Sachs Concentrated Growth Fund
Portfolio Composition
The Fund invests primarily in U.S. equity investments. The Fund typically holds 30-40 high quality growth companies and tends to be more concentrated in individual holdings, industries and sectors than the typical broadly diversified large-cap growth fund. Since the Fund’s inception, the Goldman Sachs Growth Equity Investment Team has focused on several key investment criteria that it believes can drive a company’s growth over the long term. These characteristics are: dominant market share, established brand name, pricing power, recurring revenue stream, free cash flow, high returns on invested capital, predictable growth, sustainable growth, long product life cycle, enduring competitive advantage, favorable demographic trends and excellent management. The Team strives to purchase these companies at reasonable valuations in order to capture the full benefits of their growth.
Portfolio Management Discussion and Analysis
Below, the Goldman Sachs Growth Equity Investment Team discusses the Goldman Sachs Concentrated Growth Fund’s (the “Fund”) performance and positioning for the six-month period ended February 28, 2015 (the “Reporting Period”).
| Q | | How did the Fund perform during the Reporting Period? |
| A | | During the Reporting Period, the Fund’s Class A, C, Institutional, IR and R Shares generated cumulative total returns, without sales charges, of 9.43%, 9.02%, 9.68%, 9.60% and 9.31%, respectively. These returns compare to the 8.46% cumulative total return of the Fund’s benchmark, the Russell 1000® Growth Index (with dividends reinvested) (the “Russell Index”), during the same period. |
| Q | | What key factors were responsible for the Fund’s performance during the Reporting Period? |
| A | | Stock selection overall contributed most to the Fund’s performance relative to the Russell Index during the Reporting Period. |
| Q | | Which equity market sectors most significantly affected Fund performance? |
| A | | Effective stock selection in the consumer staples, health care and materials sectors helped the Fund’s performance most relative to the Russell Index. Challenging stock selection in the industrials, consumer discretionary and energy sectors detracted from the Fund’s relative results most during the Reporting Period. |
| Q | | What were some of the Fund’s best-performing individual stocks? |
| A | | The Fund benefited most relative to the Russell Index from positions in natural food supermarket owner and operator Whole Foods Market, specialty retailer L Brands and wholesale club retailer Costco Wholesale. |
| | | Whole Foods Market was a strong contributor to the Fund’s performance during the Reporting Period, as investors gained confidence in several of the company’s strategic initiatives. More specifically, the company began to see positive results from initiatives aimed at cutting costs, improving profitability and reaccelerating top-line growth. Whole Foods Market also rolled out a national advertising campaign to emphasize its high quality food standards in the fall of 2014 and began testing a customer loyalty program, both of which we believe could drive traffic and comparable store sales growth. In our view, Whole Foods Market was well positioned at the end of the Reporting Period as a market leader. |
| | | L Brands was a top contributor to the Fund’s results, as the company reported strong third quarter 2014 results and raised its fiscal year earnings guidance in November 2014. Strong comparable store sales growth at both its Victoria’s Secret and Bath & Body Works chains, combined with margin expansion, drove upside performance. At the end of the Reporting Period, we believe L Brands was well positioned for long-term growth based upon three key initiatives: Victoria’s Secret’s U.S. square footage growth; international expansion; and operating margin expansion through supply |
13
PORTFOLIO RESULTS
| | chain improvements that should reduce lead times, in our view, and allow stores to stay lean and reduce markdowns. |
| | | In October 2014, Costco Wholesale announced fiscal third quarter earnings that exceeded consensus estimates. Improved same store sales, operating margins and inventory management were the key drivers to the successful quarter. The company carried this momentum into February 2015, when it announced a $5 per share special dividend, reflecting strong cash flow generation and health of its business as well as an attractive return of capital to shareholders. In our view, Costco Wholesale should continue to be well received by the market thanks to what we consider to be a strong management team committed to improving its business model and gaining market share. |
| Q | | Which stocks detracted significantly from the Fund’s performance during the Reporting Period? |
| A | | Detracting most from the Fund’s results relative to its benchmark index were positions in metal component manufacturer Precision Castparts, oil and gas exploration and production company Anadarko Petroleum and energy services company Halliburton. |
| | | Shares of Precision Castparts declined, as the company reported fiscal first quarter earnings that were slightly below consensus expectations, despite delivering year-over-year earnings and revenue growth. Also, volatility in energy prices negatively impacted the outlook for the company, causing further uncertainty about its stock. At the end of the Reporting Period, we continued to believe the company has leading global positions in diverse end markets, including aerospace forgings, castings and aero structures, as well as strong and growing businesses serving gas power generation and the oil industry. In our view, these end markets should provide attractive cyclical and secular growth tailwinds to the company. |
| | | Anadarko Petroleum detracted from the Fund’s returns during the Reporting Period due to persistent concerns regarding lower oil prices and the potential negative impact of such on the company’s long-term profitability. In our view, the market was undervaluing the company’s ability to expand margins and generate meaningful cash flows. Further supporting this view was the report that Anadarko Petroleum had a strong third quarter of 2014 and raised production guidance despite the broader outlook for the energy sector. |
| | | At the end of the Reporting Period, we continued to believe Anadarko Petroleum has a solid core business with strong market share that is sustainable given the company’s improved drilling efficiencies. |
| | | The sell-off in oil prices weighed on the energy sector broadly, and shares of Halliburton were no exception. During the Reporting Period, Halliburton announced its intention to purchase oilfield services competitor Baker Hughes. This transaction, if completed, would create the second largest oilfield services company globally. Indeed, we believe the deal would be accretive for Halliburton, which should primarily benefit from Baker Hughes’ strong technology presence in North America and from an estimated $2 billion in cost synergies by the end of 2017. While we acknowledge the near-term volatility of oil prices, we continued to believe at the end of the Reporting Period that Halliburton is a high quality company, well positioned to be a strong performer over the long term. We also continued to believe shares of Halliburton were attractively valued and that the company was well positioned to benefit from its leadership position in North America. Additionally, we remained positive on Halliburton’s efficiency program in North America, which supports better margin improvement, in our view. |
| Q | | How did the Fund use derivatives and similar instruments during the Reporting Period? |
| A | | During the Reporting Period, we did not use derivatives as part of an active management strategy. |
| Q | | Did the Fund make any significant purchases or sales during the Reporting Period? |
| A | | We initiated a Fund position in The Priceline Group, an online travel company that offers customers travel reservations and services through its Booking.com, priceline. com and Agoda brands. Its shares declined during the Reporting Period due to concerns about weak fourth quarter 2014 earnings guidance. However, we believe the guidance could prove overly conservative and viewed the stock’s sell-off as an attractive entry point. We believe The Priceline Group is a high quality franchise with a dominant market position. While we expect its growth rate to decelerate, we believe the company should grow earnings and free cash flow above market expectations while generating strong returns on invested capital. The Priceline Group has gained market share in all geographies and, in our view, should benefit from secular tailwinds driving growth in online travel. |
14
PORTFOLIO RESULTS
| | | We established a Fund position in global biotechnology company Biogen Idec. Following a share price pullback in October 2014 on concerns about its leading multiple sclerosis treatment, Tecfidera, we initiated a Fund position in the company’s stock. We believe that concerns over Tecfidera were overblown and strength in this treatment and in its treatment of hemophilia may well continue to drive top and bottom line growth. Additionally, Biogen Idec has one of the best product pipelines in the biotechnology industry, in our view, with highly innovative programs in multiple sclerosis and various Alzheimer’s products that, while early stage, have the potential to produce high profile data in 2015. We believe the share price pullback provided an opportunity to buy a company with what we consider to be an attractive risk/reward profile. |
| | | Conversely, we eliminated the Fund’s position in Celgene, a global biopharmaceutical company focused on the treatment of cancer and immune-inflammatory related diseases. While we remained confident in the company’s outlook and the potential upside of its pipeline developments, we decided to allocate the sales proceeds to positions based on higher conviction. |
| | | We sold the Fund’s position in leading online retailer eBay. Our concern about eBay is that the recovery in its Marketplaces business may take longer than originally anticipated and pressure its margins. While the pending spinoff of PayPal could be a catalyst for the stock, we believe there is also risk, as the structure of the operating agreements between the two businesses could impact future investment plans and margins for the company. Although the company’s risk/reward profile is still relatively attractive, in our view, we believe our upside scenario for the company became less probable. Therefore, we exited the position to fund higher conviction ideas. |
| Q | | Were there any notable changes in the Fund’s weightings during the Reporting Period? |
| A | | In constructing the Fund’s portfolio, we focus on picking stocks rather than on making industry or sector bets. We seek to outpace the benchmark index by overweighting stocks that we expect to outperform and underweighting those that we think may lag. Consequently, changes in its sector weights are generally the direct result of individual stock selection or of stock appreciation or depreciation. That said, during the Reporting Period, the Fund’s exposure to the consumer discretionary and consumer staples sectors increased and its allocations to the information technology, industrials and financials sectors decreased relative to the Russell Index. |
| Q | | How was the Fund positioned relative to its benchmark index at the end of February 2015? |
| A | | At the end of February 2015, the Fund had overweighted positions relative to the Russell Index in the financials and consumer discretionary sectors. On the same date, the Fund had underweighted positions compared to the Russell Index in the industrials and materials sectors. The Fund was rather neutrally weighted to the Russell Index in the consumer staples, information technology, health care and energy sectors and had no position at all in the utilities and telecommunication services sectors on February 28, 2015. |
15
FUND BASICS
Concentrated Growth Fund
as of February 28, 2015
| | | | | | | | | | |
| | PERFORMANCE REVIEW | |
| | | September 1, 2014–February 28, 2015 | | Fund Total Return
(based on NAV)1 | | | Russell 1000®
Growth Index2 | |
| | Class A | | | 9.43 | % | | | 8.46 | % |
| | Class C | | | 9.02 | | | | 8.46 | |
| | Institutional | | | 9.68 | | | | 8.46 | |
| | Class IR | | | 9.60 | | | | 8.46 | |
| | | Class R | | | 9.31 | | | | 8.46 | |
| | 1 | | The net asset value (“NAV”) represents the net assets of the class of the Fund (ex-dividend) divided by the total number of shares of the class outstanding. The Fund’s performance reflects the reinvestment of dividends and other distributions. The Fund’s performance does not reflect the deduction of any applicable sales charges. |
| | 2 | | The Russell 1000® Growth Index (with dividends reinvested) is an unmanaged index that measures the performance of those Russell 1000 companies with higher price-to-book ratios and higher forecasted growth values. The Index figures do not reflect any deduction for fees, expenses or taxes. It is not possible to invest directly in an index. |
| | | | | | | | | | | | | | | | | | | | |
| | STANDARDIZED TOTAL RETURNS3 |
| | | For the period ended 12/31/14 | | One Year | | | Five Years | | | Ten Years | | | Since Inception | | | Inception Date |
| | Class A | | | 5.58 | % | | | 11.82 | % | | | 6.35 | % | | | 7.39 | % | | 9/03/02 |
| | Class C | | | 9.82 | | | | 12.25 | | | | 6.15 | | | | 7.07 | | | 9/03/02 |
| | Institutional | | | 12.19 | | | | 13.55 | | | | 7.38 | | | | 8.31 | | | 9/03/02 |
| | Class IR | | | 12.00 | | | | 13.36 | | | | N/A | | | | 6.49 | | | 11/30/07 |
| | | Class R | | | 11.49 | | | | 12.82 | | | | N/A | | | | 5.99 | | | 11/30/07 |
| | 3 | | The Standardized Total Returns are average annual total returns as of the most recent calendar quarter-end. They assume reinvestment of all distributions at NAV. These returns reflect a maximum initial sales charge of 5.5% for Class A Shares and the assumed contingent deferred sales charge for Class C Shares (1% if redeemed within 12 months of purchase). Because Institutional, Class IR and Class R Shares do not involve a sales charge, such a charge is not applied to their Standardized Total Returns. |
The returns represent past performance. Past performance does not guarantee future results. The Fund’s investment return and principal value will fluctuate so that an investor’s shares, when redeemed, may be worth more or less than their original cost. Current performance may be lower or higher than the performance quoted above. Please visit our web site at www.GSAMFUNDS.com to obtain the most recent month-end returns. Performance reflects applicable fee waivers and/or expense limitations in effect during the periods shown. In their absence, performance would be reduced. Returns do not reflect the deduction of taxes that a shareholder would pay on Fund distributions or the redemption of Fund shares.
16
FUND BASICS
| | | | | | | | | | |
| | EXPENSE RATIOS4 | |
| | | | | Net Expense Ratio (Current) | | | Gross Expense Ratio (Before Waivers) | |
| | Class A | | | 1.22 | % | | | 1.59 | % |
| | Class C | | | 1.97 | | | | 2.34 | |
| | Institutional | | | 0.82 | | | | 1.19 | |
| | Class IR | | | 0.97 | | | | 1.34 | |
| | | Class R | | | 1.45 | | | | 1.83 | |
| | 4 | | The expense ratios of the Fund, both current (net of applicable fee waivers and/or expense limitations) and before waivers (gross of applicable fee waivers and/or expense limitations) are as set forth above according to the most recent publicly available Prospectus for the Fund and may differ from the expense ratios disclosed in the Financial Highlights in this report. Pursuant to a contractual arrangement, the Fund’s waivers and/or expense limitations will remain in place through at least December 29, 2015, and prior to such date the investment adviser may not terminate the arrangements without the approval of the Fund’s Board of Trustees. If these arrangements are discontinued in the future, the expense ratios may change without shareholder approval. |
| | | | | | | | |
| | TOP TEN HOLDINGS AS OF 2/28/155 |
| | | Holding | | % of Net Assets | | | Line of Business |
| | Apple, Inc. | | | 7.0 | % | | Computers & Peripherals |
| | American Tower Corp. | | | 3.5 | | | Real Estate Investment Trusts |
| | Costco Wholesale Corp. | | | 3.5 | | | Food & Staples Retailing |
| | Amazon.com, Inc. | | | 3.4 | | | Internet & Catalog Retail |
| | Intercontinental Exchange, Inc. | | | 2.9 | | | Diversified Financial Services |
| | Google, Inc. Class A | | | 2.9 | | | Internet Software & Services |
| | The Priceline Group, Inc. | | | 2.9 | | | Internet & Catalog Retail |
| | Equinix, Inc. | | | 2.8 | | | Internet Software & Services |
| | McKesson Corp. | | | 2.8 | | | Health Care Providers & Services |
| | | EMC Corp. | | | 2.7 | | | Computers & Peripherals |
| | 5 | | The top 10 holdings may not be representative of the Fund’s future investments. |
17
FUND BASICS
|
| FUND VS. BENCHMARK SECTOR ALLOCATION6 |
| As of February 28, 2015 |
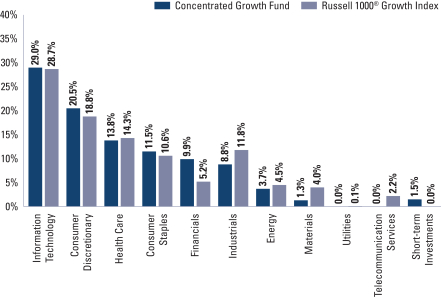
| | 6 | | The Fund is actively managed and, as such, its composition may differ over time. Consequently, the Fund’s overall sector allocations may differ from the percentages contained in the graph above. The graph categorizes investments using Global Industry Classification Standard (“GICS”), however, the sector classifications used by the portfolio management team may differ from GICS. The percentage shown for each investment category reflects the value of investments in that category as a percentage of market value. Short-term investments represent repurchase agreements. The graph depicts the Fund’s investments but may not represent the Fund’s market exposure due to the exclusion of certain derivatives, if any, as listed in the Additional Investment Information section of the Schedule of Investments. |
18
PORTFOLIO RESULTS
Goldman Sachs Flexible Cap Growth Fund
Portfolio Composition
The Fund invests primarily in U.S. equity investments in small-, mid- and large-capitalization issuers. Since the Fund’s inception, the Goldman Sachs Growth Equity Investment Team has focused on several key investment criteria that it believes can drive a company’s growth over the long term. These characteristics are: dominant market share, established brand name, pricing power, recurring revenue stream, free cash flow, high returns on invested capital, predictable growth, sustainable growth, long product life cycle, enduring competitive advantage, favorable demographic trends and excellent management. The Team strives to purchase these companies at reasonable valuations in order to capture the full benefits of their growth.
Portfolio Management Discussion and Analysis
Below, the Goldman Sachs Growth Equity Investment Team discusses the Goldman Sachs Flexible Cap Growth Fund’s (the “Fund”) performance and positioning for the six-month period ended February 28, 2015 (the “Reporting Period”).
| Q | | How did the Fund perform during the Reporting Period? |
| A | | During the Reporting Period, the Fund’s Class A, C, Institutional, IR and R Shares generated cumulative total returns, without sales charges, of 9.24%, 8.84%, 9.38%, 9.41% and 9.10%, respectively. These returns compare to the 8.51% cumulative total return of the Fund’s benchmark, the Russell 3000® Growth Index (with dividends reinvested) (the “Russell Index”), during the same period. |
| Q | | What key factors were responsible for the Fund’s performance during the Reporting Period? |
| A | | Stock selection overall contributed most to the Fund’s performance relative to the Russell Index during the Reporting Period. |
| Q | | Which equity market sectors most significantly affected Fund performance? |
| A | | Effective stock selection in the financials, materials and health care sectors helped the Fund’s performance most relative to the Russell Index. The only two sectors that detracted from the Fund’s relative results during the Reporting Period were industrials and energy, wherein stock selection proved challenging. |
| Q | | What were some of the Fund’s best-performing individual stocks? |
| A | | The Fund benefited most relative to the Russell Index from positions in natural food supermarket owner and operator Whole Foods Market, specialty retailer L Brands and wholesale club retailer Costco Wholesale. |
| | Whole Foods Market was a strong contributor to the Fund’s performance during the Reporting Period, as investors gained confidence in several of the company’s strategic initiatives. More specifically, the company began to see positive results from initiatives aimed at cutting costs, improving profitability and reaccelerating top-line growth. Whole Foods Market also rolled out a national advertising campaign to emphasize its high quality food standards in the fall of 2014 and began testing a customer loyalty program, both of which we believe could drive traffic and comparable store sales growth. In our view, Whole Foods Market was well positioned at the end of the Reporting Period as a market leader. |
| | L Brands was a top contributor to the Fund’s results, as the company reported strong third quarter 2014 results and raised its fiscal year earnings guidance in November 2014. Strong comparable store sales growth at both its Victoria’s Secret and Bath & Body Works chains, combined with margin expansion, drove upside performance. At the end of the Reporting Period, we believe L Brands was well positioned for long-term growth based upon three key initiatives: Victoria’s Secret’s U.S. square footage growth; international expansion; and operating margin expansion through supply chain improvements that should reduce lead times, in our view, and allow stores to stay lean and reduce markdowns. |
| | In October 2014, Costco Wholesale announced fiscal third quarter earnings that exceeded consensus estimates. Improved same store sales, operating margins and inventory management were the key drivers to the successful quarter. The company carried this momentum into February 2015, |
19
PORTFOLIO RESULTS
| | when it announced a $5 per share special dividend, reflecting strong cash flow generation and health of its business as well as an attractive return of capital to shareholders. In our view, Costco Wholesale should continue to be well received by the market thanks to what we consider to be a strong management team committed to improving its business model and gaining market share. |
| Q | | Which stocks detracted significantly from the Fund’s performance during the Reporting Period? |
| A | | Detracting most from the Fund’s results relative to its benchmark index were positions in oil and gas exploration and production companies Whiting Petroleum and Anadarko Petroleum, and multinational oilfield services company Weatherford International. |
| | Whiting Petroleum detracted most from the Fund’s relative returns during the Reporting Period. The company reported strong fiscal third quarter results. However, its capital efficiency and production guidance fell short of consensus estimates. At the end of the Reporting Period, we remained confident in Whiting Petroleum’s ongoing efforts to develop new completion designs and de-risk acquired acreage, but we decided to exit the Fund’s position in the company in favor of other high conviction opportunities. |
| | Anadarko Petroleum detracted from the Fund’s returns during the Reporting Period due to persistent concerns regarding lower oil prices and the potential negative impact of such on the company’s long-term profitability. In our view, the market was undervaluing the company’s ability to expand margins and generate meaningful cash flows. Further supporting this view was the report that Anadarko Petroleum had a strong third quarter of 2014 and raised production guidance despite the broader outlook for the energy sector. At the end of the Reporting Period, we continued to believe Anadarko Petroleum has a solid core business with strong market share that is sustainable given the company’s improved drilling efficiencies. |
| | Shares of Weatherford International declined sharply in connection with the sell-off in oil prices during the Reporting Period. We believe the company has a solid core business and is well positioned to increase its market share for the foreseeable future. In addition, we believe Weatherford International is well positioned to drive improved profitability and free cash flow generation through its restructuring process. At the end of the Reporting Period, we believed the company’s shares were attractively valued and that its stock multiple should re-rate as it begins to execute on its turnaround initiatives. (Re-rating is when the market changes its view of a company sufficiently to make calculation ratios, such as its price/earnings ratio, substantially higher or lower.) |
| Q | | How did the Fund use derivatives and similar instruments during the Reporting Period? |
| A | | During the Reporting Period, we did not use derivatives as part of an active management strategy. |
| Q | | Did the Fund make any significant purchases or sales during the Reporting Period? |
| A | | We established a Fund position in Walgreens Boots Alliance during the Reporting Period. Walgreens Boots Alliance is the result of a merger between Walgreens and Boots Alliance, which specializes in both retail and wholesale pharmacy. In our view, Walgreens Boots Alliance should be a formidable player in the pharmacy space, and we see meaningful revenue and cost synergies with the combined company. Boots Alliance’s management is now in charge of running the business and appears to us to be squarely focused on improving execution, profitability and creating value for shareholders. We are optimistic about the new management team’s ability to deliver. We also believe the earnings power of this franchise is underappreciated by the market, and we see significant upside potential to shares over a multi-year period if its management can indeed execute on its initiatives. |
| | We initiated a Fund position in Amgen, the world’s largest independent biotechnology firm. After several years of weaker pipeline productivity, Amgen now has 10 Phase III assets, at least half of which we believe may be introduced to the market. (Phase III is when a drug or treatment is given to large groups of people to confirm its effectiveness, monitor side effects, compare it to commonly used treatments and collect information that will allow the drug or treatment to be used safely.) In our view, the strength of Amgen’s pipeline provides a solid foundation for longer-term growth and earnings potential. At the time of purchase, Amgen was trading at a discount to its large-cap biotechnology peers. We believe that recent concerns regarding competition to Amgen’s key franchise have been exaggerated, and, as a result, we viewed its shares as attractively valued at the end of the Reporting Period. |
20
PORTFOLIO RESULTS
| | Conversely, in addition to the previously mentioned sale of Whiting Petroleum, we exited the Fund’s position in oilfield services company Schlumberger during the Reporting Period. The stock had detracted from returns during the Reporting Period due to persistent concerns about lower oil prices and the potential negative impact of such on the company’s long-term profitability. While we continue to believe Schlumberger has a solid core business with strong market share, we decided to sell the position in favor of other higher conviction opportunities. |
| | We sold the Fund’s position in Canadian coffee and doughnut chain Tim Hortons. Its shares surged on the announcement that Burger King intended to acquire Tim Hortons at a 30% premium. The merger makes strategic sense in our view and validates our investment thesis that Tim Hortons was an attractive growth story and an undervalued company. |
| Q | | Were there any notable changes in the Fund’s weightings during the Reporting Period? |
| A | | In constructing the Fund’s portfolio, we focus on picking stocks rather than on making industry or sector bets. We seek to outpace the benchmark index by overweighting stocks that we expect to outperform and underweighting those that we think may lag. Consequently, changes in its sector weights are generally the direct result of individual stock selection or of stock appreciation or depreciation. That said, during the Reporting Period, the Fund’s exposure to the information technology and consumer staples sectors increased and its allocations to the consumer discretionary, industrials and financials sectors decreased relative to the Russell Index. |
| Q | | How was the Fund positioned relative to its benchmark index at the end of February 2015? |
| A | | At the end of February 2015, the Fund had an overweighted position relative to the Russell Index in the consumer discretionary sector. On the same date, the Fund had underweighted positions compared to the Russell Index in the energy, industrials and materials sectors and was rather neutrally weighted to the Russell Index in the financials, information technology, consumer staples, telecommunication services and health care sectors. The Fund had no position at all in the utilities sector on February 28, 2015. |
21
FUND BASICS
Flexible Cap Growth Fund
as of February 28, 2015
| | | | | | | | | | |
| | PERFORMANCE REVIEW | |
| | | September 1, 2014–February 28, 2015 | | Fund Total Return
(based on NAV)1 | | | Russell 3000®
Growth Index2 | |
| | Class A | | | 9.24 | % | | | 8.51 | % |
| | Class C | | | 8.84 | | | | 8.51 | |
| | Institutional | | | 9.38 | | | | 8.51 | |
| | Class IR | | | 9.41 | | | | 8.51 | |
| | | Class R | | | 9.10 | | | | 8.51 | |
| | 1 | | The net asset value (“NAV”) represents the net assets of the class of the Fund (ex-dividend) divided by the total number of shares of the class outstanding. The Fund’s performance reflects the reinvestment of dividends and other distributions. The Fund’s performance does not reflect the deduction of any applicable sales charges. |
| | 2 | | The unmanaged Russell 3000® Growth Index (with dividends reinvested) measures the performance of the 3,000 largest U.S. companies based on total market capitalization. The Index figures do not reflect any deduction for fees, expenses or taxes. It is not possible to invest directly in an index. |
| | | | | | | | | | | | | | | | | | |
| | STANDARDIZED TOTAL RETURNS3 | |
| | | For the period ended 12/31/14 | | One Year | | | Five Years | | | Since Inception | | | Inception Date | |
| | Class A | | | 6.97 | % | | | 12.90 | % | | | 9.49 | % | | | 1/31/08 | |
| | Class C | | | 11.30 | | | | 13.36 | | | | 9.60 | | | | 1/31/08 | |
| | Institutional | | | 13.71 | | | | 14.68 | | | | 10.86 | | | | 1/31/08 | |
| | Class IR | | | 13.51 | | | | 14.51 | | | | 10.69 | | | | 1/31/08 | |
| | | Class R | | | 13.05 | | | | 13.97 | | | | 10.16 | | | | 1/31/08 | |
| | 3 | | The Standardized Total Returns are average annual total returns as of the most recent calendar quarter-end. They assume reinvestment of all distributions at NAV. These returns reflect a maximum initial sales charge of 5.5% for Class A Shares and the assumed contingent deferred sales charge for Class C Shares (1% if redeemed within 12 months of purchase). Because Institutional, Class IR and Class R Shares do not involve a sales charge, such a charge is not applied to their Standardized Total Returns. |
The returns set forth in the tables above represent past performance. Past performance does not guarantee future results. The Fund’s investment return and principal value will fluctuate so that an investor’s shares, when redeemed, may be worth more or less than their original cost. Current performance may be lower or higher than the performance quoted above. Please visit our web site at www.GSAMFUNDS.com to obtain the most recent month-end returns. Performance reflects applicable fee waivers and/or expense limitations in effect during the periods shown. In their absence, performance would be reduced. Returns do not reflect the deduction of taxes that a shareholder would pay on Fund distributions or the redemption of Fund shares.
22
FUND BASICS
| | | | | | | | | | |
| | EXPENSE RATIOS4 | |
| | | | | Net Expense Ratio (Current) | | | Gross Expense Ratio (Before Waivers) | |
| | Class A | | | 1.22 | % | | | 3.28 | % |
| | Class C | | | 1.97 | | | | 4.05 | |
| | Institutional | | | 0.82 | | | | 2.88 | |
| | Class IR | | | 0.97 | | | | 3.00 | |
| | | Class R | | | 1.47 | | | | 3.52 | |
| | 4 | | The expense ratios of the Fund, both current (net of applicable fee waivers and/or expense limitations) and before waivers (gross of applicable fee waivers and/or expense limitations) are as set forth above according to the most recent publicly available Prospectus for the Fund and may differ from the expense ratios disclosed in the Financial Highlights in this report. Pursuant to a contractual arrangement, the Fund’s waivers and/or expense limitations will remain in place through at least December 29, 2015, and prior to such date the investment adviser may not terminate the arrangements without the approval of the Fund’s Board of Trustees. If these arrangements are discontinued in the future, the expense ratios may change without shareholder approval. |
| | | | | | | | |
| | TOP TEN HOLDINGS AS OF 2/28/155 |
| | | Holding | | % of Net Assets | | | Line of Business |
| | Apple, Inc. | | | 6.5 | % | | Computers & Peripherals |
| | Google, Inc. Class A | | | 1.8 | | | Internet Software & Services |
| | Google, Inc. Class C | | | 1.8 | | | Internet Software & Services |
| | Costco Wholesale Corp. | | | 1.8 | | | Food & Staples Retailing |
| | Amazon.com, Inc. | | | 1.7 | | | Internet & Catalog Retail |
| | NIKE, Inc. Class B | | | 1.7 | | | Textiles, Apparel & Luxury Goods |
| | Oracle Corp. | | | 1.7 | | | Software |
| | Walgreens Boots Alliance, Inc. | | | 1.6 | | | Food & Staples Retailing |
| | QUALCOMM, Inc. | | | 1.6 | | | Communications Equipment |
| | | Whole Foods Market, Inc. | | | 1.5 | | | Food & Staples Retailing |
| | 5 | | The top 10 holdings may not be representative of the Fund’s future investments. |
23
FUND BASICS
|
| FUND VS. BENCHMARK SECTOR ALLOCATION6 |
| As of February 28, 2015 |
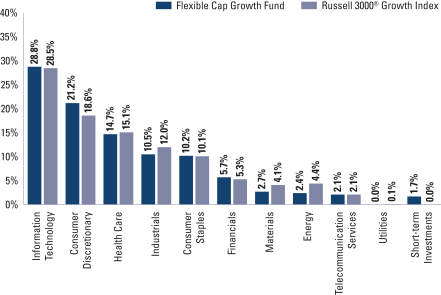
| | 6 | | The Fund is actively managed and, as such, its composition may differ over time. Consequently, the Fund’s overall sector allocations may differ from the percentages contained in the graph above. The graph categorizes investments using Global Industry Classification Standard (“GICS”), however, the sector classifications used by the portfolio management team may differ from GICS. The percentage shown for each investment category reflects the value of investments in that category as a percentage of market value. Short-term investments represent repurchase agreements. The graph depicts the Fund’s investments but may not represent the Fund’s market exposure due to the exclusion of certain derivatives, if any, as listed in the Additional Investment Information section of the Schedule of Investments. |
24
PORTFOLIO RESULTS
Goldman Sachs Focused Growth Fund
Portfolio Composition
The Fund invests primarily in U.S. equity investments. Since the Fund’s inception, the Goldman Sachs Growth Equity Investment Team has focused on several key investment criteria that it believes can drive a company’s growth over the long term. These characteristics are: dominant market share, established brand name, pricing power, recurring revenue stream, free cash flow, high returns on invested capital, predictable growth, sustainable growth, long product life cycle, enduring competitive advantage, favorable demographic trends and excellent management. The Team strives to purchase these companies at reasonable valuations in order to capture the full benefits of their growth.
Portfolio Management Discussion and Analysis
Below, the Goldman Sachs Growth Equity Investment Team discusses the Goldman Sachs Focused Growth Fund’s (the “Fund”) performance and positioning for the six-month period ended February 28, 2015 (the “Reporting Period”).
| Q | | How did the Fund perform during the Reporting Period? |
| A | | During the Reporting Period, the Fund’s Class A, C, Institutional, IR and R Shares generated cumulative total returns, without sales charges, of 10.00%, 9.60%, 10.28%, 10.13% and 9.89%, respectively. These returns compare to the 8.46% cumulative total return of the Fund’s benchmark, the Russell 1000® Growth Index (with dividends reinvested) (the “Russell Index”), during the same period. |
| Q | | What key factors were responsible for the Fund’s performance during the Reporting Period? |
| A | | Stock selection overall contributed most to the Fund’s performance relative to the Russell Index during the Reporting Period. |
| Q | | Which equity market sectors most significantly affected Fund performance? |
| A | | Effective stock selection in the consumer staples, financials and health care sectors helped the Fund’s performance most relative to the Russell Index. Challenging stock selection in the industrials, information technology and energy sectors detracted from the Fund’s relative results most. |
| Q | | What were some of the Fund’s best-performing individual stocks? |
| A | | The Fund benefited most relative to the Russell Index from positions in natural food supermarket owner and operator Whole Foods Market, wholesale club retailer Costco Wholesale and regulated exchanges and clearing houses global operator Intercontinental Exchange. |
| | Whole Foods Market was a strong contributor to the Fund’s performance during the Reporting Period, as investors gained confidence in several of the company’s strategic initiatives. More specifically, the company began to see positive results from initiatives aimed at cutting costs, improving profitability and reaccelerating top-line growth. Whole Foods Market also rolled out a national advertising campaign to emphasize its high quality food standards in the fall of 2014 and began testing a customer loyalty program, both of which we believe could drive traffic and comparable store sales growth. In our view, Whole Foods Market was well positioned at the end of the Reporting Period as a market leader. |
| | In October 2014, Costco Wholesale announced fiscal third quarter earnings that exceeded consensus estimates. Improved same store sales, operating margins and inventory management were the key drivers to the successful quarter. The company carried this momentum into February 2015, when it announced a $5 per share special dividend, reflecting strong cash flow generation and health of its business as well as an attractive return of capital to shareholders. In our view, Costco Wholesale should continue to be well received by the market thanks to what we consider to be a strong management team committed to improving its business model and gaining market share. |
| | Intercontinental Exchange reported two consecutive quarters of better than expected earnings, which was well received by the markets. Also, the company announced an increase in projected share buybacks, which we believe reflects the underappreciated value of its stock. At the end of the Reporting Period, we remained confident in Intercontinental |
25
PORTFOLIO RESULTS
| | Exchange’s long-term growth trajectory, as the company has a leading market share position in the over-the-counter market and should benefit, in our view, from the globalization of markets and migration toward clearing and post-trade automation. We also believe the company has a strong management team committed to execution and delivering results. It is our view that the company is a reasonably valued, high quality growth franchise with the potential to outperform its peers over the long term. |
| Q | | Which stocks detracted significantly from the Fund’s performance during the Reporting Period? |
| A | | Detracting most from the Fund’s results relative to its benchmark index were positions in global clothing manufacturer PVH, oil and gas exploration and production company Anadarko Petroleum and energy services company Halliburton. |
| | PVH detracted from the Fund’s results, as the consumer environment and potential currency headwinds to earnings were an overhang on the stock. Still, at the end of the Reporting Period, underlying trends were on track, and PVH remained a high quality growth company, in our view. Importantly, its Calvin Klein business was beginning to inflect, or tilt, positively after recent product re-launches. Despite what we believe was some short-term currency-related challenges to the stock, we believe PVH’s global expansion opportunity should lead to steady earnings growth ahead. |
| | Anadarko Petroleum detracted from the Fund’s returns during the Reporting Period due to persistent concerns regarding lower oil prices and the potential negative impact of such on the company’s long-term profitability. In our view, the market was undervaluing the company’s ability to expand margins and generate meaningful cash flows. Further supporting this view was the report that Anadarko Petroleum had a strong third quarter of 2014 and raised production guidance despite the broader outlook for the energy sector. At the end of the Reporting Period, we continued to believe Anadarko Petroleum has a solid core business with strong market share that is sustainable given the company’s improved drilling efficiencies. |
| | The sell-off in oil prices weighed on the energy sector broadly, and shares of Halliburton were no exception. During the Reporting Period, Halliburton announced its intention to purchase oilfield services competitor Baker Hughes. This transaction, if completed, would create the second largest oilfield services company globally. Indeed, we believe the deal would be accretive for Halliburton, which should primarily benefit from Baker Hughes’ strong technology presence in North America and from an estimated $2 billion in cost synergies by the end of 2017. While we acknowledge the near-term volatility of oil prices, we continued to believe at the end of the Reporting Period that Halliburton is a high quality company, well positioned to be a strong performer over the long term. We also continued to believe shares of Halliburton were attractively valued and that the company was well positioned to benefit from its leadership position in North America. Additionally, we remained positive on Halliburton’s efficiency program in North America, which supports better margin improvement, in our view. All that said, we opted to sell the Fund’s position in Halliburton by the end of the Reporting Period in favor of higher conviction opportunities. |
| Q | | How did the Fund use derivatives and similar instruments during the Reporting Period? |
| A | | During the Reporting Period, we did not use derivatives as part of an active management strategy. |
| Q | | Did the Fund make any significant purchases or sales during the Reporting Period? |
| A | | We initiated a Fund position in The Priceline Group, an online travel company that offers customers travel reservations and services through its Booking.com, priceline. com and Agoda brands. Its shares declined during the Reporting Period due to concerns about weak fourth quarter 2014 earnings guidance. However, we believe the guidance could prove overly conservative and viewed the stock’s sell-off as an attractive entry point. We believe The Priceline |
26
PORTFOLIO RESULTS
| | Group is a high quality franchise with a dominant market position. While we expect its growth rate to decelerate, we believe the company should grow earnings and free cash flow above market expectations while generating strong returns on invested capital. The Priceline Group has gained market share in all geographies and, in our view, should benefit from secular tailwinds driving growth in online travel. |
| | We established a Fund position in Kansas City Southern, a transportation holding company with domestic and international rail operations in North America. We believe the company is a high quality growth business with a favorable market structure, high barriers to entry and strong underlying fundamentals. We are positive on Kansas City Southern’s long-term growth trajectory and believe it is further reinforced by the significant track and locomotive investments the company has made over the past 15 years. Furthermore, Kansas City Southern has significant exposure to cross-border trade with Mexico, which has been growing volumes. In our view, the company has the potential for significant margin improvement should it better its efficiencies as we anticipate. At the time of purchase, we viewed Kansas City Southern as a compelling growth company trading at an attractive valuation. |
| | Conversely, we sold the Fund’s position in leading online retailer eBay. Our concern about eBay is that the recovery in its Marketplaces business may take longer than originally anticipated and pressure its margins. While the pending spinoff of PayPal could be a catalyst for the stock, we believe there is also risk, as the structure of the operating agreements between the two businesses could impact future investment plans and margins for the company. Although the company’s risk/reward profile is still relatively attractive, in our view, we believe our upside scenario for the company became less probable. Therefore, we exited the position to fund higher conviction ideas. |
| | We exited the Fund’s position in commercial real estate services firm CBRE Group. Its stock had performed well, and we believed its underlying earnings power relative to where we are in the commercial real estate cycle had narrowed. We believe CBRE Group’s management has done a notable job expanding the firm to a more recurring revenue business model. However, while underlying trends appear to continue to improve and the business is not as economically sensitive as it used to be, it is still exposed to commercial real estate trends. As a result, we decided to sell the position in favor of higher conviction names, specifically within the information technology sector. This sale narrowed the Fund’s overweight within the financials sector as well. |
| Q | | Were there any notable changes in the Fund’s weightings during the Reporting Period? |
| A | | In constructing the Fund’s portfolio, we focus on picking stocks rather than on making industry or sector bets. We seek to outpace the benchmark index by overweighting stocks that we expect to outperform and underweighting those that we think may lag. Consequently, changes in its sector weights are generally the direct result of individual stock selection or of stock appreciation or depreciation. That said, during the Reporting Period, the Fund’s exposure to the consumer discretionary, health care and industrials sectors increased and its allocations to financials and health care decreased relative to the Russell Index. |
| Q | | How was the Fund positioned relative to its benchmark index at the end of February 2015? |
| A | | At the end of February 2015, the Fund had overweighted positions relative to the Russell Index in the financials, consumer discretionary, consumer staples and information technology sectors. On the same date, the Fund had underweighted positions compared to the Russell Index in the industrials, health care and energy sectors. The Fund had no positions at all in the utilities, telecommunication services or materials sectors on February 28, 2015. |
27
FUND BASICS
Focused Growth Fund
as of February 28, 2015
| | | | | | | | | | |
| | PERFORMANCE REVIEW | |
| | | September 1, 2014–February 28, 2015 | | Fund Total Return
(based on NAV)1 | | | Russell 1000®
Growth Index2 | |
| | Class A | | | 10.00 | % | | | 8.46 | % |
| | Class C | | | 9.60 | | | | 8.46 | |
| | Institutional | | | 10.28 | | | | 8.46 | |
| | Class IR | | | 10.13 | | | | 8.46 | |
| | | Class R | | | 9.89 | | | | 8.46 | |
| | 1 | | The net asset value (“NAV”) represents the net assets of the class of the Fund (ex-dividend) divided by the total number of shares of the class outstanding. The Fund’s performance reflects the reinvestment of dividends and other distributions. The Fund’s performance does not reflect the deduction of any applicable sales charges. |
| | 2 | | The Russell 1000® Growth Index (with dividends reinvested) is an unmanaged market capitalization weighted index of the 1000 largest U.S. companies with higher price-to-book ratios and higher forecasted growth values. The Index figures do not include any deduction for fees, expenses or taxes. It is not possible to invest directly in an unmanaged index. |
| | | | | | | | | | | | | | |
| | STANDARDIZED TOTAL RETURNS3 | |
| | | For the period ended 12/31/14 | | One Year | | | Since Inception | | | Inception Date | |
| | Class A | | | 5.36 | % | | | 16.92 | % | | | 1/31/12 | |
| | Class C | | | 9.66 | | | | 18.36 | | | | 1/31/12 | |
| | Institutional | | | 11.99 | | | | 19.73 | | | | 1/31/12 | |
| | Class IR | | | 11.84 | | | | 19.55 | | | | 1/31/12 | |
| | | Class R | | | 11.28 | | | | 18.94 | | | | 1/31/12 | |
| | 3 | | The Standardized Total Returns are average annual total returns as of the most recent calendar quarter-end. They assume reinvestment of all distributions at NAV. These returns reflect a maximum initial sales charge of 5.5% for Class A Shares and the assumed contingent deferred sales charge for Class C Shares (1% if redeemed within 12 months of purchase). Because Institutional, Class IR and Class R Shares do not involve a sales charge, such a charge is not applied to their Standardized Total Returns. |
The returns set forth in the tables above represent past performance. Past performance does not guarantee future results. The Fund’s investment return and principal value will fluctuate so that an investor’s shares, when redeemed, may be worth more or less than their original cost. Current performance may be lower or higher than the performance quoted above. Please visit our web site at www.GSAMFUNDS.com to obtain the most recent month-end returns. Performance reflects applicable fee waivers and/or expense limitations in effect during the periods shown. In their absence, performance would be reduced. Returns do not reflect the deduction of taxes that a shareholder would pay on Fund distributions or the redemption of Fund shares.
28
FUND BASICS
| | | | | | | | | | |
| | EXPENSE RATIOS4 | |
| | | | | Net Expense Ratio (Current) | | | Gross Expense Ratio (Before Waivers) | |
| | Class A | | | 1.25 | % | | | 2.81 | % |
| | Class C | | | 2.00 | | | | 3.47 | |
| | Institutional | | | 0.85 | | | | 2.29 | |
| | Class IR | | | 1.00 | | | | 2.49 | |
| | | Class R | | | 1.50 | | | | 2.99 | |
| | 4 | | The expense ratios of the Fund, both current (net of applicable fee waivers and/or expense limitations) and before waivers (gross of applicable fee waivers and/or expense limitations) are as set forth above according to the most recent publicly available Prospectus for the Fund and may differ from the expense ratios disclosed in the Financial Highlights in this report. Pursuant to a contractual arrangement, the Fund’s waivers and/or expense limitations will remain in place through at least December 29, 2015, and prior to such date the investment adviser may not terminate the arrangements without the approval of the Fund’s Board of Trustees. If these arrangements are discontinued in the future, the expense ratios may change without shareholder approval. |
| | | | | | | | |
| | TOP TEN HOLDINGS AS OF 2/28/155 |
| | | Holding | | % of Net Assets | | | Line of Business |
| | Apple, Inc. | | | 8.3 | % | | Computers & Peripherals |
| | Google, Inc. Class A | | | 5.6 | | | Internet Software & Services |
| | EMC Corp. | | | 4.9 | | | Computers & Peripherals |
| | American Tower Corp. | | | 4.8 | | | Real Estate Investment Trusts |
| | Intercontinental Exchange, Inc. | | | 4.8 | | | Diversified Financial Services |
| | Whole Foods Market, Inc. | | | 4.8 | | | Food & Staples Retailing |
| | Costco Wholesale Corp. | | | 4.7 | | | Food & Staples Retailing |
| | Amazon.com, Inc. | | | 4.6 | | | Internet & Catalog Retail |
| | Equinix, Inc. | | | 4.6 | | | Internet Software & Services |
| | | The Priceline Group, Inc. | | | 4.5 | | | Internet & Catalog Retail |
| | 5 | | The top 10 holdings may not be representative of the Fund’s future investments. |
29
FUND BASICS
|
| FUND VS. BENCHMARK SECTOR ALLOCATION6 |
| As of February 28, 2015 |
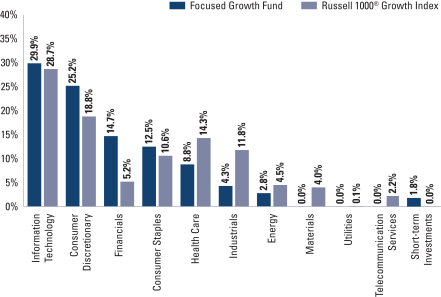
| | 6 | | The Fund is actively managed and, as such, its composition may differ over time. Consequently, the Fund’s overall sector allocations may differ from the percentages contained in the graph above. The graph categorizes investments using the Global Industry Classification Standard (“GICS”), however, the sector classifications used by the portfolio management team may differ from GICS. The percentage shown for each investment category reflects the value of investments in that category as a percentage of market value. Short-term investments represent repurchase agreements. The graph depicts the Fund’s investments but may not represent the Fund’s market exposure due to the exclusion of certain derivatives, if any, as listed in the Additional Investment Information section of the Schedule of Investments. |
30
PORTFOLIO RESULTS
Goldman Sachs Growth Opportunities Fund
Portfolio Composition
The Fund invests primarily in medium-sized growth companies with a market capitalization between $1 and $10 billion. Since the Fund’s inception, the Goldman Sachs Growth Equity Investment Team has focused on several key investment criteria that it believes can drive a company’s growth over the long term. These characteristics are: dominant market share, established brand name, pricing power, recurring revenue stream, free cash flow, high returns on invested capital, predictable growth, sustainable growth, long product life cycle, enduring competitive advantage, favorable demographic trends and excellent management. The Team strives to purchase these companies at reasonable valuations in order to capture the full benefits of their growth.
Portfolio Management Discussion and Analysis
Below, the Goldman Sachs Growth Equity Investment Team discusses the Goldman Sachs Growth Opportunities Fund’s (the “Fund”) performance and positioning for the six-month period ended February 28, 2015 (the “Reporting Period”).
| Q | | How did the Fund perform during the Reporting Period? |
| A | | During the Reporting Period, the Fund’s Class A, C, Institutional, Service, IR and R Shares generated cumulative total returns, without sales charges, of 5.59%, 5.20%, 5.80%, 5.56%, 5.72% and 5.46%, respectively. These returns compare to the 7.99% cumulative total return of the Fund’s benchmark, the Russell Midcap® Growth Index (with dividends reinvested) (the “Russell Index”), during the same period. |
| Q | | What key factors were responsible for the Fund’s performance during the Reporting Period? |
| A | | The Fund generated solid absolute gains, but stock selection overall detracted from its performance relative to the Russell Index during the Reporting Period. Sector allocation as a whole contributed positively during the Reporting Period. |
| Q | | Which equity market sectors most significantly affected Fund performance? |
| A | | Detracting most from the Fund’s relative results was challenging stock selection in the industrials, consumer discretionary and energy sectors. Effective stock selection in the financials, materials and telecommunication services sectors helped the Fund’s performance most relative to the Russell Index. |
| Q | | Which stocks detracted significantly from the Fund’s performance during the Reporting Period? |
| A | | Detracting most from the Fund’s results relative to its benchmark index were positions in offshore drilling and production equipment manufacturer Dril-Quip, multinational oilfield services company Weatherford International and oil and gas exploration and production company Whiting Petroleum. |
| | Dril-Quip detracted from the Fund’s relative returns during the Reporting Period due to persistent concerns regarding lower oil prices and the potential negative impact of such on the company’s profitability. In our view, markets were undervaluing the company’s strong fundamentals and its ability to generate meaningful cash flow. Dril-Quip’s quarterly earnings during the Reporting Period were well above consensus estimates, which we believe supports this view. At the end of the Reporting Period, we continued to believe Dril-Quip has a profitable core business with strong market share that is sustainable over the long term. |
| | Shares of Weatherford International declined sharply in connection with the sell-off in oil prices during the Reporting Period. We believe the company has a solid core business and is well positioned to increase its market share for the foreseeable future. We additionally believe Weatherford International is well positioned to drive improved profitability and free cash flow generation through its restructuring process. At the end of the Reporting Period, we believed the company’s shares were attractively valued and that its stock multiple should re-rate as it begins to execute |
31
PORTFOLIO RESULTS
| | on its turnaround initiatives. (Re-rating is when the market changes its view of a company sufficiently to make calculation ratios, such as its price/earnings ratio, substantially higher or lower.) |
| | Whiting Petroleum detracted most from the Fund’s relative results during the Reporting Period. The company reported strong fiscal third quarter results. However, its capital efficiency and production guidance fell short of consensus estimates. At the end of the Reporting Period, we remained confident in Whiting Petroleum’s ongoing efforts to develop new completion designs and de-risk acquired acreage, but we decided to exit the Fund’s position in the company in favor of other high conviction opportunities. |
| Q | | What were some of the Fund’s best-performing individual stocks? |
| A | | The Fund benefited most relative to the Russell Index from positions in natural food supermarket owner and operator Whole Foods Market, television show and movie Internet subscription service Netflix and specialty retailer L Brands. |
| | Whole Foods Market was a strong contributor to the Fund’s performance during the Reporting Period, as investors gained confidence in several of the company’s strategic initiatives. More specifically, the company began to see positive results from initiatives aimed at cutting costs, improving profitability and reaccelerating top-line growth. Whole Foods Market also rolled out a national advertising campaign to emphasize its high quality food standards in the fall of 2014 and began testing a customer loyalty program, both of which we believe could drive traffic and comparable store sales growth. In our view, Whole Foods Market was well positioned at the end of the Reporting Period as a market leader. |
| | Netflix exceeded market expectations during the Reporting Period, reporting strong fiscal fourth quarter results across key subscriber metrics. We believe sentiment around subscriber growth and pricing improved, reflecting Netflix’s ability to execute and deliver unique, high quality content. At the end of the Reporting Period, we maintained our conviction in the strength of Netflix’s franchise and believe the company’s international expansion opportunity and secular tailwinds may well be key drivers of growth over time. |
| | L Brands was a top contributor to the Fund’s results, as the company reported strong third quarter 2014 results and raised its fiscal year earnings guidance in November 2014. Strong comparable store sales growth at both its Victoria’s Secret and Bath & Body Works chains, combined with margin expansion, drove upside performance. At the end of the Reporting Period, we believe L Brands was well positioned for long-term growth based upon three key initiatives: Victoria’s Secret’s U.S. square footage growth; international expansion; and operating margin expansion through supply chain improvements that should reduce lead times, in our view, and allow stores to stay lean and reduce markdowns. |
| Q | | How did the Fund use derivatives and similar instruments during the Reporting Period? |
| A | | During the Reporting Period, we did not use derivatives as part of an active management strategy. |
| Q | | Did the Fund make any significant purchases or sales during the Reporting Period? |
| A | | We initiated a Fund position in oil and gas exploration and production company Pioneer Natural Resources during the Reporting Period. Shares of Pioneer Natural Resources were weak due to the negative outlook for the energy sector. In our view, will not have a long-term impact on Pioneer Natural Resources’ cash flow growth and that investors overreacted to this trend. Rather, we believe the fundamentals of the company are strong and supported by what we consider to be its strong management team and recent infrastructure investments. As a result, we believe the sell-off created an opportunity to buy a high quality franchise with significant growth potential at an attractive valuation. |
| | We established a Fund position in auto parts company Advance Auto Parts. Its stock had experienced a downturn due to lower than expected earnings guidance. However, we believe the guidance was conservative and saw the pullback as an attractive opportunity to initiate a position. In our view, Advance Auto Parts is well positioned for long-term earnings growth, specifically through potential acquisition targets that could help create synergies within the company. Furthermore, we believe the company is well positioned for potential long-term multiple expansion as it grows its daily delivery program. |
| | Conversely, in addition to the previously mentioned sale of Whiting Petroleum, we sold the Fund’s position in Canadian coffee and doughnut chain Tim Hortons. Its shares surged on the announcement that Burger King intended to acquire Tim Hortons at a 30% premium. The merger makes strategic sense in our view and validates our investment thesis that Tim Hortons was an attractive growth story and an undervalued company. |
| | We exited the Fund’s position in Xilinx, a leading programmable logic devices (“PLDs”) company. During |
32
PORTFOLIO RESULTS
| | 2014, shares of Xilinx were volatile, as the pace of wireless network build-outs in China were slower than expected and wireline capital spending in the U.S. was impacted by regulatory uncertainty. During the last months of 2014, however, the stock rallied strongly off of its lows, and we used that as an opportunity to exit the position for another semiconductor company. |
| Q | | Were there any notable changes in the Fund’s weightings during the Reporting Period? |
| A | | In constructing the Fund’s portfolio, we focus on picking stocks rather than on making industry or sector bets. We seek to outpace the benchmark index by overweighting stocks that we expect to outperform and underweighting those that we think may lag. Consequently, changes in its sector weights are generally the direct result of individual stock selection or of stock appreciation or depreciation. That said, during the Reporting Period, the Fund’s exposure to the information technology sector increased and its allocation to financials decreased relative to the Russell Index. |
| Q | | How was the Fund positioned relative to its benchmark index at the end of February 2015? |
| A | | At the end of February 2015, the Fund had overweighted positions relative to the Russell Index in the telecommunication services and consumer staples sectors. On the same date, the Fund had underweighted positions compared to the Russell Index in the industrials and information technology sectors. The Fund was rather neutrally weighted to the Index in the consumer discretionary, health care, materials, energy and financials sectors and had no position at all in the utilities sector on February 28, 2015. |
33
FUND BASICS
Growth Opportunities Fund
as of February 28, 2015
| | | | | | | | | | |
| | PERFORMANCE REVIEW | |
| | | September 1, 2014–February 28, 2015 | | Fund Total Return
(based on NAV)1 | | | Russell Midcap®
Growth Index2 | |
| | Class A | | | 5.59 | % | | | 7.99 | % |
| | Class C | | | 5.20 | | | | 7.99 | |
| | Institutional | | | 5.80 | | | | 7.99 | |
| | Service | | | 5.56 | | | | 7.99 | |
| | Class IR | | | 5.72 | | | | 7.99 | |
| | | Class R | | | 5.46 | | | | 7.99 | |
| | 1 | | The net asset value (“NAV”) represents the net assets of the class of the Fund (ex-dividend) divided by the total number of shares of the class outstanding. The Fund’s performance reflects the reinvestment of dividends and other distributions. The Fund’s performance does not reflect the deduction of any applicable sales charges. |
| | 2 | | The Russell Midcap® Growth Index (with dividends reinvested) is an unmanaged market capitalization weighted index that measures the performance of those Russell Midcap companies with higher price-to-book ratios and higher forecasted growth values. The Index figures do not reflect any deduction for fees, expenses or taxes. It is not possible to invest directly in an index. |
| | | | | | | | | | | | | | | | | | | | |
| | STANDARDIZED TOTAL RETURNS3 |
| | | For the period ended 12/31/14 | | One Year | | | Five Years | | | Ten Years | | | Since Inception | | | Inception Date |
| | Class A | | | 4.87 | % | | | 13.37 | % | | | 8.85 | % | | | 11.29 | % | | 5/24/99 |
| | Class C | | | 9.06 | | | | 13.81 | | | | 8.65 | | | | 10.87 | | | 5/24/99 |
| | Institutional | | | 11.44 | | | | 15.13 | | | | 9.90 | | | | 12.14 | | | 5/24/99 |
| | Service | | | 10.89 | | | | 14.56 | | | | 9.35 | | | | 11.58 | | | 5/24/99 |
| | Class IR | | | 11.29 | | | | 14.96 | | | | N/A | | | | 9.79 | | | 11/30/07 |
| | | Class R | | | 10.71 | | | | 14.38 | | | | N/A | | | | 9.25 | | | 11/30/07 |
| | 3 | | The Standardized Total Returns are average annual total returns as of the most recent calendar quarter-end. They assume reinvestment of all distributions at NAV. These returns reflect a maximum initial sales charge of 5.5% for Class A Shares and the assumed contingent deferred sales charge for Class C Shares (1% if redeemed within 12 months of purchase). Because Institutional, Service, Class IR and Class R Shares do not involve a sales charge, such a charge is not applied to their Standardized Total Returns. |
The returns set forth in the tables above represent past performance. Past performance does not guarantee future results. The Fund’s investment return and principal value will fluctuate so that an investor’s shares, when redeemed, may be worth more or less than their original cost. Current performance may be lower or higher than the performance quoted above. Please visit our web site at www.GSAMFUNDS.com to obtain the most recent month-end returns. Performance reflects applicable fee waivers and/or expense limitations in effect during the periods shown. In their absence, performance would be reduced. Returns do not reflect the deduction of taxes that a shareholder would pay on Fund distributions or the redemption of Fund shares.
34
FUND BASICS
| | | | | | | | | | |
| | EXPENSE RATIOS4 | |
| | | | | Net Expense Ratio (Current) | | | Gross Expense Ratio (Before Waivers) | |
| | Class A | | | 1.36 | % | | | 1.40 | % |
| | Class C | | | 2.11 | | | | 2.15 | |
| | Institutional | | | 0.96 | | | | 1.00 | |
| | Service | | | 1.46 | | | | 1.50 | |
| | Class IR | | | 1.11 | | | | 1.15 | |
| | | Class R | | | 1.61 | | | | 1.65 | |
| | 4 | | The expense ratios of the Fund, both current (net of applicable fee waivers and/or expense limitations) and before waivers (gross of applicable fee waivers and/or expense limitations) are as set forth above according to the most recent publicly available Prospectus for the Fund and may differ from the expense ratios disclosed in the Financial Highlights in this report. Pursuant to a contractual arrangement, the Fund’s waivers and/or expense limitations will remain in place through at least December 29, 2015, and prior to such date the investment adviser may not terminate the arrangements without the approval of the Fund’s Board of Trustees. If these arrangements are discontinued in the future, the expense ratios may change without shareholder approval. |
| | | | | | | | |
| | TOP TEN HOLDINGS AS OF 2/28/155 |
| | | Holding | | % of Net Assets | | | Line of Business |
| | Goldman Sachs Financial Square Funds – Government Fund | | | 2.7 | % | | Investment Company |
| | Intercontinental Exchange, Inc. | | | 2.6 | | | Diversified Financial Services |
| | Mylan, Inc. | | | 2.4 | | | Pharmaceuticals |
| | W.W. Grainger, Inc. | | | 2.2 | | | Trading Companies & Distributors |
| | Kate Spade & Co. | | | 2.2 | | | Textiles, Apparel & Luxury Goods |
| | First Republic Bank | | | 2.1 | | | Commercial Banks |
| | LinkedIn Corp. Class A | | | 2.1 | | | Internet Software & Services |
| | SBA Communications Corp. Class A | | | 2.1 | | | Wireless Telecommunication Services |
| | Whole Foods Market, Inc. | | | 2.0 | | | Food & Staples Retailing |
| | | Equinix, Inc. | | | 2.0 | | | Internet Software & Services |
| | 5 | | The top 10 holdings may not be representative of the Fund’s future investments. |
35
FUND BASICS
|
| FUND VS. BENCHMARK SECTOR ALLOCATION6 |
| As of February 28, 2015 |
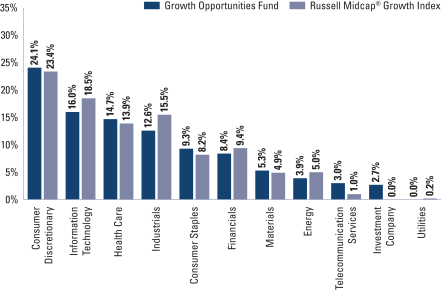
| | 6 | | The Fund is actively managed and, as such, its composition may differ over time. Consequently, the Fund’s overall sector allocations may differ from the percentages contained in the graph above. The graph categorizes investments using the Global Industry Classification Standard (“GICS”), however, the sector classifications used by the portfolio management team may differ from GICS. The percentage shown for each investment category reflects the value of investments in that category as a percentage of market value. The graph depicts the Fund’s investments but may not represent the Fund’s market exposure due to the exclusion of certain derivatives, if any, as listed in the Additional Investment Information section of the Schedule of Investments. |
36
PORTFOLIO RESULTS
Goldman Sachs Small/Mid Cap Growth Fund
Portfolio Composition
The Fund invests primarily in small and medium-sized growth companies with a market capitalization between $200 million and $10 billion. Since the Fund’s inception, the Goldman Sachs Growth Equity Investment Team has focused on several key investment criteria that it believes can drive a company’s growth over the long term. These characteristics are: dominant market share, established brand name, pricing power, recurring revenue stream, free cash flow, high returns on invested capital, predictable growth, sustainable growth, long product life cycle, enduring competitive advantage, favorable demographic trends and excellent management. The Team strives to purchase these companies at reasonable valuations in order to capture the full benefits of their growth.
Portfolio Management Discussion and Analysis
Below, the Goldman Sachs Growth Equity Investment Team discusses the Goldman Sachs Small/Mid Cap Growth Fund’s (the “Fund”) performance and positioning for the six-month period ended February 28, 2015 (the “Reporting Period”).
| Q | | How did the Fund perform during the Reporting Period? |
| A | | During the Reporting Period, the Fund’s Class A, C, Institutional, Service, IR and R Shares generated cumulative total returns, without sales charges, of 9.44%, 9.01%, 9.70%, 9.39%, 9.60% and 9.32%, respectively. These returns compare to the 8.64% cumulative total return of the Fund’s benchmark, the Russell 2500® Growth Index (with dividends reinvested) (the “Russell Index”), during the same period. |
| Q | | What key factors were responsible for the Fund’s performance during the Reporting Period? |
| A | | Stock selection overall contributed most to the Fund’s performance relative to the Russell Index during the Reporting Period. |
| Q | | Which equity market sectors most significantly affected Fund performance? |
| A | | Effective stock selection in the health care, consumer staples and materials sectors helped the Fund’s performance most relative to the Russell Index. Challenging stock selection in the energy, information technology and consumer discretionary sectors detracted from the Fund’s relative results most during the Reporting Period. Having an overweighted exposure relative to the Russell Index in the weakly performing energy sector for much of the Reporting Period also hurt performance. |
| Q | | What were some of the Fund’s best-performing individual stocks? |
| A | | The Fund benefited most relative to the Russell Index from positions in clinical stage pharmaceutical company Cempra, clothing retailer Burlington Stores and clinical stage biotechnology company Bluebird Bio. |
| | Cempra reported better than expected fourth quarter 2014 earnings in February 2015. Its shares also rose in early 2015 after the company announced positive Phase III results for a drug it is developing — solithromycin — to treat community acquired bacterial pneumonia. (Phase III is when a drug or treatment is given to large groups of people to confirm its effectiveness, monitor side effects, compare it to commonly used treatments and collect information that will allow the drug or treatment to be used safely.) At the end of the Reporting Period, we believed the company was well positioned to benefit from its pipeline of upcoming products and was trading at what we considered to be an attractive valuation. |
| | Burlington Stores reported strong fiscal second quarter results in September 2014. Same store sales beat its management’s guidance as well as market consensus. The company followed that up with fiscal third quarter earnings in December 2014, announcing earnings per share and revenue that exceeded expectations and raising its full year outlook. At the end of the Reporting Period, we believed the company was building momentum and was trading at what we considered to be a reasonable valuation. |
37
PORTFOLIO RESULTS
| | Shares of Bluebird Bio soared after the company reported encouraging results from its experimental gene therapy for an inherited blood disorder. As a result, its management has been in discussion with U.S. and European Union regulatory bodies regarding accelerated development efforts for the drug. In our view, the company is well positioned for growth given its seeming momentum and progress in a rare market niche. |
| Q | | Which stocks detracted significantly from the Fund’s performance during the Reporting Period? |
| A | | Detracting most from the Fund’s results relative to its benchmark index were positions in oil and gas exploration and production company Whiting Petroleum, offshore drilling and production equipment manufacturer Dril-Quip and discount retailer Five Below. |
| | Whiting Petroleum detracted most from the Fund’s relative results during the Reporting Period. The company reported strong fiscal third quarter results. However, its capital efficiency and production guidance fell short of consensus estimates. At the end of the Reporting Period, we remained confident in Whiting Petroleum’s ongoing efforts to develop new completion designs and de-risk acquired acreage, but we decided to exit the Fund’s position in the company in favor of other high conviction opportunities. |
| | Dril-Quip detracted from the Fund’s relative returns during the Reporting Period due to persistent concerns regarding lower oil prices and the potential negative impact of such on the company’s profitability. In our view, markets were undervaluing the company’s strong fundamentals and its ability to generate meaningful cash flow. Dril-Quip’s quarterly earnings during the Reporting Period were well above consensus estimates, which we believe supports this view. At the end of the Reporting Period, we continued to believe Dril-Quip has a profitable core business with strong market share that is sustainable over the long term. |
| | Shares of Five Below declined after the company lowered its fiscal fourth quarter earnings guidance as a result of weaker than expected holiday sales. In our view, markets were undervaluing the company’s strong fundamentals and its ability to generate meaningful cash flow. This view is supported, we believe, by Five Below’s new store productivity and earnings growth, which could improve further as the company builds out its distribution facilities. At the end of the Reporting Period, we believed Five Below was an attractive business with strong market share that is sustainable over the long term. |
| Q | | How did the Fund use derivatives and similar instruments during the Reporting Period? |
| A | | During the Reporting Period, we did not use derivatives as part of an active management strategy. |
| Q | | Did the Fund make any significant purchases or sales during the Reporting Period? |
| A | | During the Reporting Period, we initiated a Fund position in biopharmaceutical company Alkermes. The company announced encouraging results from a Phase II clinical trial of its schizophrenia treatment—a sizable market that has not seen meaningful innovation in years. (Phase II is when a drug or treatment is given to a larger group of people to see if it is effective and to further evaluate its safety.) As a result, Alkermes has engaged in formal discussions with the U.S. Food and Drug Administration (“FDA”) to advance the drug into a critical development program. In our view, Alkermes is well positioned for growth, as it has several pipeline candidates in schizophrenia, depression and multiple sclerosis that investors should get more clarity on during the next six to 18 months. We believe these are all rare and significant market opportunities on which Alkermes may well be able to capitalize. |
| | We established a Fund position in auto parts company Advance Auto Parts. Its stock had experienced a downturn due to lower than expected earnings guidance. However, we believe the guidance was conservative and saw the pullback as an attractive opportunity to initiate a position. In our view, Advance Auto Parts is well positioned for long-term earnings growth, specifically through potential acquisition targets that could help create synergies within the company. Furthermore, we believe the company is well positioned for potential long-term multiple expansion as it grows its daily delivery program. |
| | Conversely, in addition to the previously mentioned sale of Whiting Petroleum, we sold the Fund’s position in Canadian coffee and doughnut chain Tim Hortons. Its shares surged on the announcement that Burger King intended to acquire Tim Hortons at a 30% premium. The merger makes strategic sense in our view and validates our investment thesis that |
38
PORTFOLIO RESULTS
| | Tim Hortons was an attractive growth story and an undervalued company. |
| Q | | Were there any notable changes in the Fund’s weightings during the Reporting Period? |
| A | | In constructing the Fund’s portfolio, we focus on picking stocks rather than on making industry or sector bets. We seek to outpace the benchmark index by overweighting stocks that we expect to outperform and underweighting those that we think may lag. Consequently, changes in its sector weights are generally the direct result of individual stock selection or of stock appreciation or depreciation. That said, during the Reporting Period, the Fund’s exposure to the industrials, information technology and materials sectors increased and its allocations to the consumer discretionary, health care, financials and energy sectors decreased relative to the Russell Index. |
| Q | | How was the Fund positioned relative to its benchmark index at the end of February 2015? |
| A | | At the end of February 2015, the Fund had overweighted positions relative to the Russell Index in the consumer staples, telecommunication services and consumer discretionary sectors. On the same date, the Fund had underweighted positions compared to the Russell Index in the information technology, materials and energy sectors. The Fund was rather neutrally weighted to the Index in the industrials, financials and health care sectors and had no position at all in the utilities sector on February 28, 2015. |
39
FUND BASICS
Small/Mid Cap Growth Fund
as of February 28, 2015
| | | | | | | | | | |
| | PERFORMANCE REVIEW | |
| | | September 1, 2014–February 28, 2015 | | Fund Total Return
(based on NAV)1 | | | Russell 2500®
Growth Index2 | |
| | Class A | | | 9.44 | % | | | 8.64 | % |
| | Class C | | | 9.01 | | | | 8.64 | |
| | Institutional | | | 9.70 | | | | 8.64 | |
| | Service | | | 9.39 | | | | 8.64 | |
| | Class IR | | | 9.60 | | | | 8.64 | |
| | | Class R | | | 9.32 | | | | 8.64 | |
| | 1 | | The net asset value (“NAV”) represents the net assets of the class of the Fund (ex-dividend) divided by the total number of shares of the class outstanding. The Fund’s performance reflects the reinvestment of dividends and other distributions. The Fund’s performance does not reflect the deduction of any applicable sales charges. |
| | 2 | | The Russell 2500® Growth Index (with dividends reinvested) is an unmanaged index that measures the performance of the small- to mid-cap growth segment of the US equity universe. The Russell 2500® Growth Index is constructed to provide a comprehensive and unbiased barometer of the small- to mid-cap growth market. Based on ongoing empirical research of investment manager behavior, the methodology used to determine growth probability approximates the aggregate small- to mid-cap growth manager’s opportunity set. The Index figures do not reflect any deduction for fees, expenses or taxes. It is not possible to invest directly in an index. |
| | | | | | | | | | | | | | | | |
| | STANDARDIZED TOTAL RETURNS3 |
| | | For the period ended 12/31/14 | | One Year | | | Five Years | | | Since Inception | | | Inception Date |
| | Class A | | | 4.54 | % | | | 14.69 | % | | | 10.85 | % | | 6/30/05 |
| | Class C | | | 8.73 | | | | 15.13 | | | | 10.64 | | | 6/30/05 |
| | Institutional | | | 11.08 | | | | 16.45 | | | | 11.92 | | | 6/30/05 |
| | Service | | | 10.53 | | | | 15.89 | | | | 11.36 | | | 6/30/05 |
| | Class IR | | | 10.94 | | | | 16.28 | | | | 10.73 | | | 11/30/07 |
| | | Class R | | | 10.34 | | | | 15.71 | | | | 10.18 | | | 11/30/07 |
| | 3 | | The Standardized Total Returns are average annual total returns as of the most recent calendar quarter-end. They assume reinvestment of all distributions at NAV. These returns reflect a maximum initial sales charge of 5.5% for Class A Shares and the assumed contingent deferred sales charge for Class C Shares (1% if redeemed within 12 months of purchase). Because Institutional, Service, Class IR and Class R Shares do not involve a sales charge, such a charge is not applied to their Standardized Total Returns. |
The returns set forth in the tables above represent past performance. Past performance does not guarantee future results. The Fund’s investment return and principal value will fluctuate so that an investor’s shares, when redeemed, may be worth more or less than their original cost. Current performance may be lower or higher than the performance quoted above. Please visit our web site at www.GSAMFUNDS.com to obtain the most recent month-end returns. Performance reflects applicable fee waivers and/or expense limitations in effect during the periods shown. In their absence, performance would be reduced. Returns do not reflect the deduction of taxes that a shareholder would pay on Fund distributions or the redemption of Fund shares.
40
FUND BASICS
| | | | | | | | | | |
| | EXPENSE RATIOS4 | |
| | | | | Net Expense Ratio (Current) | | | Gross Expense Ratio (Before Waivers) | |
| | Class A | | | 1.33 | % | | | 1.47 | % |
| | Class C | | | 2.08 | | | | 2.22 | |
| | Institutional | | | 0.93 | | | | 1.07 | |
| | Service | | | 1.43 | | | | 1.57 | |
| | Class IR | | | 1.08 | | | | 1.22 | |
| | | Class R | | | 1.58 | | | | 1.72 | |
| | 4 | | The expense ratios of the Fund, both current (net of applicable fee waivers and/or expense limitations) and before waivers (gross of applicable fee waivers and/or expense limitations) are as set forth above according to the most recent publicly available Prospectus for the Fund and may differ from the expense ratios disclosed in the Financial Highlights in this report. Pursuant to a contractual arrangement, the Fund’s waivers and/or expense limitations will remain in place through at least December 29, 2015, and prior to such date the investment adviser may not terminate the arrangements without the approval of the Fund’s Board of Trustees. If these arrangements are discontinued in the future, the expense ratios may change without shareholder approval. |
| | | | | | | | |
| | TOP TEN HOLDINGS AS OF 2/28/155 |
| | | Holding | | % of
Net Assets | | | Line of Business |
| | Kate Spade & Co. | | | 2.1 | % | | Textiles, Apparel & Luxury Goods |
| | First Republic Bank | | | 2.0 | | | Commercial Banks |
| | Healthcare Services Group, Inc. | | | 2.0 | | | Commercial Services & Supplies |
| | SBA Communications Corp. Class A | | | 1.7 | | | Wireless Telecommunication Services |
| | Navient Corp. | | | 1.7 | | | Consumer Finance |
| | Equinix, Inc. | | | 1.6 | | | Internet Software & Services |
| | Graco, Inc. | | | 1.6 | | | Machinery |
| | Electronics for Imaging, Inc. | | | 1.6 | | | Computers & Peripherals |
| | Ulta Salon, Cosmetics & Fragrance, Inc. | | | 1.6 | | | Specialty Retail |
| | | Burlington Stores, Inc. | | | 1.6 | | | Multiline Retail |
| | 5 | | The top 10 holdings may not be representative of the Fund’s future investments. |
41
FUND BASICS
|
| FUND VS. BENCHMARK SECTOR ALLOCATION6 |
| As of February 28, 2015 |
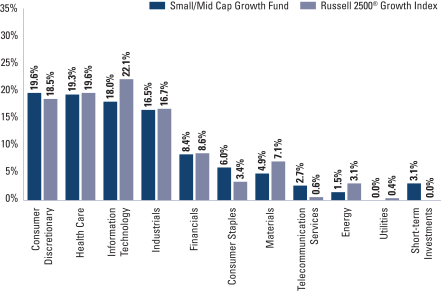
| | 6 | | The Fund is actively managed and, as such, its composition may differ over time. Consequently, the Fund’s overall sector allocations may differ from the percentages contained in the graph above. The graph categorizes investments using the Global Industry Classification Standard (“GICS”), however, the sector classifications used by the portfolio management team may differ from GICS. The percentage shown for each investment category reflects the value of investments in that category as a percentage of market value. Short-term investments represent repurchase agreements. The graph depicts the Fund’s investments but may not represent the Fund’s market exposure due to the exclusion of certain derivatives, if any, as listed in the Additional Investment Information section of the Schedule of Investments. |
42
PORTFOLIO RESULTS
Goldman Sachs Strategic Growth Fund
Portfolio Composition
The Fund invests primarily in U.S. equity investments. The Fund is more selective and focused than many mutual funds and there are typically 50 to 70 holdings in the portfolio. Since the Fund’s inception, the Goldman Sachs Growth Equity Investment Team has focused on several key investment criteria that it believes can drive a company’s growth over the long term. These characteristics are: dominant market share, established brand name, pricing power, recurring revenue stream, free cash flow, high returns on invested capital, predictable growth, sustainable growth, long product life cycle, enduring competitive advantage, favorable demographic trends and excellent management. The Team strives to purchase these companies at reasonable valuations in order to capture the full benefits of their growth.
Portfolio Management Discussion and Analysis
Below, the Goldman Sachs Growth Equity Investment Team discusses the Goldman Sachs Strategic Growth Fund’s (the “Fund”) performance and positioning for the six-month period ended February 28, 2015 (the “Reporting Period”).
| Q | | How did the Fund perform during the Reporting Period? |
| A | | During the Reporting Period, the Fund’s Class A, C, Institutional, Service, IR and R Shares generated cumulative total returns, without sales charges, of 8.74%, 8.29%, 8.88%, 8.69%, 8.87% and 8.56%, respectively. These returns compare to the 8.46% cumulative total return of the Fund’s benchmark, the Russell 1000® Growth Index (with dividends reinvested) (the “Russell Index”), during the same period. |
| Q | | What key factors were responsible for the Fund’s performance during the Reporting Period? |
| A | | Stock selection overall contributed most to the Fund’s performance relative to the Russell Index during the Reporting Period. |
| Q | | Which equity market sectors most significantly affected Fund performance? |
| A | | Effective stock selection in the consumer staples, materials and health care sectors helped the Fund’s performance most relative to the Russell Index. Challenging stock selection in the industrials, energy and information technology sectors detracted most from the Fund’s relative results most during the Reporting Period. |
| Q | | What were some of the Fund’s best-performing individual stocks? |
| A | | The Fund benefited most relative to the Russell Index from positions in natural food supermarket owner and operator Whole Foods Market, specialty retailer L Brands and wholesale club retailer Costco Wholesale. |
| | Whole Foods Market was a strong contributor to the Fund’s performance during the Reporting Period, as investors gained confidence in several of the company’s strategic initiatives. More specifically, the company began to see positive results from initiatives aimed at cutting costs, improving profitability and reaccelerating top-line growth. Whole Foods Market also rolled out a national advertising campaign to emphasize its high quality food standards in the fall of 2014 and began testing a customer loyalty program, both of which we believe could drive traffic and comparable store sales growth. In our view, Whole Foods Market was well positioned at the end of the Reporting Period as a market leader. |
| | L Brands was a top contributor to the Fund’s results, as the company reported strong third quarter 2014 results and raised its fiscal year earnings guidance in November 2014. Strong comparable store sales growth at both its Victoria’s Secret and Bath & Body Works chains, combined with margin expansion, drove upside performance. At the end of the Reporting Period, we believe L Brands was well positioned for long-term growth based upon three key initiatives: Victoria’s Secret’s U.S. square footage growth; international expansion; and operating margin expansion through supply chain improvements that should reduce lead times, in our view, and allow stores to stay lean and reduce markdowns. |
| | In October 2014, Costco Wholesale announced fiscal third quarter earnings that exceeded consensus estimates. Improved same store sales, operating margins and inventory management were the key drivers to the successful quarter. The company carried this momentum into February 2015, when it announced a $5 per share special dividend, reflecting strong cash flow generation and health of its business as well |
43
PORTFOLIO RESULTS
| | as an attractive return of capital to shareholders. In our view, Costco Wholesale should continue to be well received by the market thanks to what we consider to be a strong management team committed to improving its business model and gaining market share. |
| Q | | Which stocks detracted significantly from the Fund’s performance during the Reporting Period? |
| A | | Detracting most from the Fund’s results relative to its benchmark index were positions in energy services company Halliburton, oil and gas exploration and production company Anadarko Petroleum and oil and gas equipment manufacturer Cameron International. The Fund exited its position in Cameron International during the reporting period. |
| | The sell-off in oil prices weighed on the energy sector broadly, and shares of Halliburton were no exception. During the Reporting Period, Halliburton announced its intention to purchase oilfield services competitor Baker Hughes. This transaction, if completed, would create the second largest oilfield services company globally. Indeed, we believe the deal would be accretive for Halliburton, which should primarily benefit from Baker Hughes’ strong technology presence in North America and from an estimated $2 billion in cost synergies by the end of 2017. While we acknowledge the near-term volatility of oil prices, we continued to believe at the end of the Reporting Period that Halliburton is a high quality company, well positioned to be a strong performer over the long term. We also continued to believe shares of Halliburton were attractively valued and that the company was well positioned to benefit from its leadership position in North America. Additionally, we remained positive on Halliburton’s efficiency program in North America, which supports better margin improvement, in our view. |
| | Anadarko Petroleum detracted from the Fund’s returns during the Reporting Period due to persistent concerns regarding lower oil prices and the potential negative impact of such on the company’s long-term profitability. In our view, the market was undervaluing the company’s ability to expand margins and generate meaningful cash flows. Further supporting this view was the report that Anadarko Petroleum had a strong third quarter of 2014 and raised production guidance despite the broader outlook for the energy sector. At the end of the Reporting Period, we continued to believe Anadarko Petroleum has a solid core business with strong market shares that is sustainable given the company’s improved drilling efficiencies. |
| | Similar to other companies in the energy sector, Cameron International struggled due to persistent concerns regarding lower oil prices and the potential negative impact of such on the company’s long-term profitability. Cameron International reported fourth quarter 2014 results during the Reporting Period, announcing better than expected earnings per share, driven by strong results in its drilling business. However, inbound orders were weak, leading to a decrease in earnings guidance. While we acknowledge the near-term volatility of oil prices, at the end of the Reporting Period, we continued to believe Cameron International is a high quality company, well positioned to be a strong performer over the long term. |
| Q | | How did the Fund use derivatives and similar instruments during the Reporting Period? |
| A | | During the Reporting Period, we did not use derivatives as part of an active management strategy. |
| Q | | Did the Fund make any significant purchases or sales during the Reporting Period? |
| A | | We initiated a Fund position in pharmaceutical company Actavis during the Reporting Period. With its pending acquisition of Allergan, Actavis is expected to become a $24 billion revenue, approximately $120 billion market-cap company, roughly in line with many large-cap pharmaceutical companies. We believe integration risk is manageable, and following the acquisition, we expect Actavis to be a faster grower than big pharmaceutical companies with a well diversified revenue growth trajectory for the next several years. In our view, faster growth with some visibility may well result in multiple expansion. At the end of the Reporting Period, Actavis was trading at a discount to its peers, a gap that we expect to close. |
| | We established a Fund position in Walgreens Boots Alliance during the Reporting Period. Walgreens Boots Alliance is the result of a merger between Walgreens and Boots Alliance, which specializes in both retail and wholesale pharmacy. In our view, Walgreens Boots Alliance should be a formidable player in the pharmacy space, and we see meaningful revenue and cost synergies with the combined company. Boots Alliance’s management is now in charge of running the business and appears to us to be squarely focused on improving execution, profitability and creating value for shareholders. We are optimistic about the new management team’s ability to deliver. We also believe the earnings power of this franchise is underappreciated by the market, and we |
44
PORTFOLIO RESULTS
| | expect significant upside to shares over a multi-year period if its management can indeed execute on its initiatives. |
| | Conversely, we exited the Fund’s position in electronic payment company Visa. While we are confident in the company’s global market share and its ability to capitalize on secular growth trends within technology, we decided to sell the Fund’s position and reallocate the capital to higher conviction ideas. |
| | We sold the Fund’s position in Sensata Technologies Holding, a sensor and control manufacturer. Its stock had been a weak performer, and we became increasingly concerned about the company’s ability to produce earnings per share upside potential. Therefore, we decided to exit the Fund’s position in favor of higher conviction opportunities. |
| Q | | Were there any notable changes in the Fund’s weightings during the Reporting Period? |
| A | | In constructing the Fund’s portfolio, we focus on picking stocks rather than on making industry or sector bets. We seek to outpace the benchmark index by overweighting stocks that we expect to outperform and underweighting those that we think may lag. Consequently, changes in its sector weights are generally the direct result of individual stock selection or of stock appreciation or depreciation. That said, during the Reporting Period, the Fund’s exposure to the consumer staples sector increased and its allocations to the consumer discretionary, industrials and materials sectors decreased relative to the Russell Index. |
| Q | | How was the Fund positioned relative to its benchmark index at the end of February 2015? |
| A | | At the end of February 2015, the Fund had overweighted positions relative to the Russell Index in the financials, consumer staples, consumer discretionary and information technology sectors. On the same date, the Fund had underweighted positions compared to the Russell Index in the industrials, materials and energy sectors. The Fund was rather neutrally weighted to the Russell Index in the health care sector and had no positions at all in the utilities and telecommunication services sectors on February 28, 2015. |
45
FUND BASICS
Strategic Growth Fund
as of February 28, 2015

| | | | | | | | | | |
| | PERFORMANCE REVIEW | |
| | | September 1, 2014–February 28, 2015 | | Fund Total Return
(based on NAV)1 | | | Russell 1000®
Growth Index2 | |
| | Class A | | | 8.74 | % | | | 8.46 | % |
| | Class C | | | 8.29 | | | | 8.46 | |
| | Institutional | | | 8.88 | | | | 8.46 | |
| | Service | | | 8.69 | | | | 8.46 | |
| | Class IR | | | 8.87 | | | | 8.46 | |
| | | Class R | | | 8.56 | | | | 8.46 | |
| | 1 | | The net asset value (“NAV”) represents the net assets of the class of the Fund (ex-dividend) divided by the total number of shares of the class outstanding. The Fund’s performance reflects the reinvestment of dividends and other distributions. The Fund’s performance does not reflect the deduction of any applicable sales charges. |
| | 2 | | The Russell 1000® Growth Index (with dividends reinvested) is an unmanaged market capitalization weighted index that measures the performance of those Russell 1000 companies with higher price-to-book ratios and higher forecasted growth values. The Index figures do not reflect any deduction for fees, expenses or taxes. It is not possible to invest directly in an index. |
| | | | | | | | | | | | | | | | | | | | |
| | STANDARDIZED TOTAL RETURNS3 |
| | | For the period ended 12/31/14 | | One Year | | | Five Years | | | Ten Years | | | Since Inception | | | Inception Date |
| | Class A | | | 6.86 | % | | | 12.55 | % | | | 6.53 | % | | | 3.33 | % | | 5/24/99 |
| | Class C | | | 11.29 | | | | 13.02 | | | | 6.33 | | | | 2.95 | | | 5/24/99 |
| | Institutional | | | 13.64 | | | | 14.31 | | | | 7.57 | | | | 4.13 | | | 5/24/99 |
| | Service | | | 13.03 | | | | 13.77 | | | | 7.10 | | | | 3.70 | | | 5/24/99 |
| | Class IR | | | 13.47 | | | | 14.13 | | | | N/A | | | | 17.45 | | | 01/06/09 |
| | | Class R | | | 12.91 | | | | 13.63 | | | | N/A | | | | 16.94 | | | 01/06/09 |
| | 3 | | The Standardized Total Returns are average annual total returns as of the most recent calendar quarter-end. They assume reinvestment of all distributions at NAV. These returns reflect a maximum initial sales charge of 5.5% for Class A Shares and the assumed contingent deferred sales charge for Class C Shares (1% if redeemed within 12 months of purchase). Because Institutional, Service, Class IR and Class R Shares do not involve a sales charge, such a charge is not applied to their Standardized Total Returns. |
The returns set forth in the tables above represent past performance. Past performance does not guarantee future results. The Fund’s investment return and principal value will fluctuate so that an investor’s shares, when redeemed, may be worth more or less than their original cost. Current performance may be lower or higher than the performance quoted above. Please visit our web site at www.GSAMFUNDS.com to obtain the most recent month-end returns. Performance reflects applicable fee waivers and/or expense limitations in effect during the periods shown. In their absence, performance would be reduced. Returns do not reflect the deduction of taxes that a shareholder would pay on Fund distributions or the redemption of Fund shares.
46
FUND BASICS
| | | | | | | | | | |
| | EXPENSE RATIOS4 | |
| | | | | Net Expense Ratio (Current) | | | Gross Expense Ratio (Before Waivers) | |
| | Class A | | | 1.16 | % | | | 1.53 | % |
| | Class C | | | 1.91 | | | | 2.28 | |
| | Institutional | | | 0.76 | | | | 1.13 | |
| | Service | | | 1.26 | | | | 1.63 | |
| | Class IR | | | 0.91 | | | | 1.28 | |
| | | Class R | | | 1.38 | | | | 1.75 | |
| | 4 | | The expense ratios of the Fund, both current (net of applicable fee waivers and/or expense limitations) and before waivers (gross of applicable fee waivers and/or expense limitations) are as set forth above according to the most recent publicly available Prospectus for the Fund and may differ from the expense ratios disclosed in the Financial Highlights in this report. Pursuant to a contractual arrangement, the Fund’s waivers and/or expense limitations will remain in place through at least December 29, 2015, and prior to such date the investment adviser may not terminate the arrangements without the approval of the Fund’s Board of Trustees. If these arrangements are discontinued in the future, the expense ratios may change without shareholder approval. |
| | | | | | | | |
| | TOP TEN HOLDINGS AS OF 2/28/155 |
| | | Holding | | % of Net Assets | | | Line of Business |
| | Apple, Inc. | | | 7.0 | % | | Computers & Peripherals |
| | Amazon.com, Inc. | | | 2.6 | | | Internet & Catalog Retail |
| | Costco Wholesale Corp. | | | 2.5 | | | Food & Staples Retailing |
| | American Tower Corp. | | | 2.3 | | | Real Estate Investment Trusts |
| | Google, Inc. Class A | | | 2.3 | | | Internet Software & Services |
| | Oracle Corp. | | | 2.1 | | | Software |
| | NIKE, Inc. Class B | | | 2.0 | | | Textiles, Apparel & Luxury Goods |
| | Honeywell International, Inc. | | | 2.0 | | | Aerospace & Defense |
| | Equinix, Inc. | | | 2.0 | | | Internet Software & Services |
| | | QUALCOMM, Inc. | | | 1.9 | | | Communications Equipment |
| | 5 | | The top 10 holdings may not be representative of the Fund’s future investments. |
47
FUND BASICS
| | |
| FUND VS. BENCHMARK SECTOR ALLOCATION6 |
| As of February 28, 2015 | | |
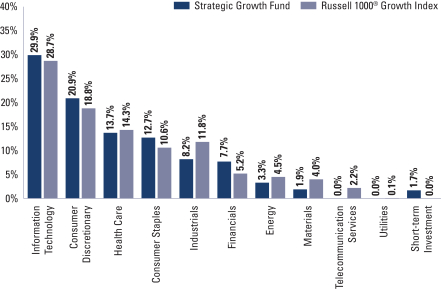
| | 6 | | The Fund is actively managed and, as such, its composition may differ over time. Consequently, the Fund’s overall sector allocations may differ from the percentages contained in the graph above. The graph categorizes investments using Global Industry Classification Standard (“GICS”), however, the sector classifications used by the portfolio management team may differ from GICS. The percentage shown for each investment category reflects the value of investments in that category as a percentage of market value. Short-term investments represent repurchase agreements. The graph depicts the Fund’s investments but may not represent the Fund’s market exposure due to the exclusion of certain derivatives, if any, as listed in the Additional Investment Information section of the Schedule of Investments. |
48
PORTFOLIO RESULTS
Goldman Sachs Technology Tollkeeper Fund
Portfolio Composition
The Fund invests primarily in equity securities of high quality technology, media or service companies that adopt or use technology to improve their cost structure, revenue opportunities or competitive advantage (“Technology Tollkeeper” companies). The Goldman Sachs Growth Equity Investment Team believes Technology Tollkeeper connotes a promising growth business. Like a toll collector for a highway or bridge, Technology Tollkeeper companies may grow revenue by increasing “traffic,” or customers and sales, and raising “tolls,” or prices, and margins. The Team believes that the characteristics of recurring revenue or the ability to generate free cash flow should enable them to consistently grow their business.
Portfolio Management Discussion and Analysis
Below, the Goldman Sachs Growth Equity Investment Team discusses the Goldman Sachs Technology Tollkeeper Fund’s (the “Fund”) performance and positioning for the six-month period ended February 28, 2015 (the “Reporting Period”).
| Q | | How did the Fund perform during the Reporting Period? |
| A | | During the Reporting Period, the Fund’s Class A, C, Institutional, Service and IR Shares generated cumulative total returns, without sales charges, of 7.55%, 7.16%, 7.81%, 7.48% and 7.71%, respectively. These returns compare to the 7.70% cumulative total return of the Fund’s benchmark, the S&P North American Technology Sector Index (the “S&P Technology Index”), during the same period. The Fund’s former benchmark, the NASDAQ Composite Index (the “NASDAQ Index”), returned 8.37% during the Reporting Period. |
| Q | | Were there any changes to the Fund during the Reporting Period? |
| A | | Effective December 29, 2014, the primary benchmark for the Fund was changed from the NASDAQ Index to the S&P Technology Index. |
| Q | | What key factors were responsible for the Fund’s performance during the Reporting Period? |
| A | | Stock selection overall contributed most to the Fund’s performance relative to the S&P Technology Index during the Reporting Period. |
| Q | | Which equity market sectors most significantly affected Fund performance? |
| A | | As both the Fund and the S&P Technology Index have the majority of their respective assets allocated to the information technology sector and our Team focuses on picking stocks that fit our definition of a Technology Tollkeeper company, broad equity market sector performance generally does not have a meaningful impact on relative performance. That said, effective stock selection in the information technology sector and having exposure to the telecommunication services and financials sectors, which are not components of the S&P Technology Index but which outpaced the S&P Technology Index, boosted the Fund’s relative results the most. Detracting most from the Fund’s relative results were weak stock selection in and having an overweighted allocation to the consumer discretionary sector. |
| Q | | What were some of the Fund’s best-performing individual stocks? |
| A | | The Fund benefited most relative to the S&P Technology Index from positions in leading personal computer and related personal computing and mobile communication device manufacturer Apple, cloud-based software-as-a-service (“SaaS”) provider ServiceNow and professional networking site LinkedIn. |
| | Apple’s earnings results exceeded analysts’ expectations during the Reporting Period and appeared to confirm that momentum is building in the business, particularly around the iPhone 6 product cycle. Apple’s sales were supported by first-time buyers, including those switching from Android, which we believe is important to the sustainability of results. We believe Apple should continue to improve its margin profile, strengthen its global market share and benefit from current business trends. As our views on Apple grew more |
49
PORTFOLIO RESULTS
| | favorable, we added to the Fund’s position in its stock, moving from an underweight to a modest overweight relative to the S&P Technology Index. |
| | ServiceNow reported strong fiscal fourth quarter earnings, which were driven by accelerated billings and profit growth. The company also raised its 2015 guidance. We believe the company’s results during the Reporting Period reflect the transformation in computing infrastructure toward cloud-based platforms and services. In our view, ServiceNow’s platform is beginning to gain traction, which should be a key driver of long-term growth. |
| | LinkedIn reported positive fourth quarter 2014 results, driven by better than expected revenue growth and strong margins. Internal engagement metrics, such as unique members and page views, accelerated as well. At the end of the Reporting Period, we believed LinkedIn was well positioned to capture an open-ended market opportunity, as it disrupts the recruiting industry, monetizes its rapidly growing global user base through new product launches and demonstrates pricing power. While the stock may not appear overly inexpensive on a number of valuation metrics, we believe it commands a premium, due to its dominant market position, strength of its global platform and what we consider to be its attractive growth profile. |
| Q | | Which stocks detracted significantly from the Fund’s performance during the Reporting Period? |
| A | | Detracting most from the Fund’s results relative to its benchmark index were positions in leading Internet radio company Pandora Media, infrastructure software company VMware and leading online travel review site TripAdvisor. |
| | Despite announcing positive third quarter 2014 results and strong fourth quarter 2014 guidance, Pandora Media’s shares fell on weaker than expected active listener growth. Its management also announced that growing active listeners may be more challenging in the future due to an increasingly competitive environment. However, the company continued to see solid advertising and subscription revenue growth. At the end of the Reporting Period, we remained positive on Pandora Media’s growing advertising opportunity due to its high user engagement and leading market position. |
| | VMware reported solid third quarter 2014 earnings, with revenue, margins and earnings coming in ahead of expectations. However, weak deferred revenue and operating cash flow numbers as well as lower than expected guidance weighed on VMware’s stock. At the end of the Reporting Period, we continued to like the company, as we believe VMware has a healthy pipeline of products that may help drive growth in the months ahead. Furthermore, we believe VMware was trading at an attractive valuation relative to its peers at the end of the Reporting Period. |
| | Shares of TripAdvisor fell after the company reported poor earnings and guidance for the third quarter of 2014, driven by lower than expected click-based revenue growth. TripAdvisor reported slightly better than expected fourth quarter 2014 results, but we became less comfortable with the company’s risk/reward profile and thus decided to sell the Fund’s position in favor of other higher conviction ideas we felt were trading at more attractive valuations. |
| Q | | How did the Fund use derivatives and similar instruments during the Reporting Period? |
| A | | During the Reporting Period, we did not use derivatives as part of an active management strategy. |
| Q | | Did the Fund make any significant purchases or sales during the Reporting Period? |
| A | | We initiated a Fund position in Broadcom, a company that provides semiconductor solutions for wired and wireless communications. Broadcom is a market leader in merchant silicon for Ethernet switches, which we believe should benefit both from leading network vendors choosing merchant silicon over custom application-specific integrated circuits and from the secular growth in white box switches, which typically use merchant silicon. We are also positive on its management’s recent decisions to take steps to maximize shareholder value, as demonstrated by the decisions to exit the baseband business and align management incentives with shareholders’ interests. Despite the stock’s strong performance during the Reporting Period, we believe its shares remained attractively valued at the end of February 2015. |
| | We established a Fund position in Intuit, whose products include QuickBooks, TurboTax and Quicken. We believe Intuit should see relatively stable pricing and demand for its core businesses over the long term. Furthermore, the company should be able to launch scalable new products, which can increase revenue with similar profit margins, in our view. Finally, we believe the company is well positioned |
50
PORTFOLIO RESULTS
| | to successfully make the transition from desktop and licensing to online subscription in the future. |
| | Conversely, we exited the Fund’s position in Xilinx, a leading programmable logic devices (“PLDs”) company. During 2014, shares of Xilinx were volatile, as the pace of wireless network build-outs in China were slower than expected and wireline capital spending in the U.S. was impacted by regulatory uncertainty. During the last months of 2014, however, the stock rallied strongly off of its lows, and we used that as an opportunity to exit the position for another semiconductor company. |
| | We sold the Fund’s position in Microsoft during the Reporting Period. While we continue to like the stock, we decided to exit the position to fund higher conviction opportunities within the industry. |
| Q | | Were there any notable changes in the Fund’s weightings during the Reporting Period? |
| A | | In constructing the Fund’s portfolio, we focus on picking stocks rather than on making industry or sector bets. We seek to outpace the benchmark index by overweighting stocks that we expect to outperform and underweighting those that we think may lag. Consequently, changes in its sector weights are generally the direct result of individual stock selection or of stock appreciation or depreciation. During this Reporting Period, some of the changes were due to the change in benchmark index. Thus, on an absolute basis, during the Reporting Period, the Fund’s exposure to the information technology sector increased somewhat and its exposure to the consumer discretionary sector decreased modestly. |
| Q | | How was the Fund positioned relative to its benchmark index at the end of February 2015? |
| A | | At the end of February 2015, the Fund’s was underweighted relative to the S&P Technology Index in the information technology sector and was rather neutrally weighted to the S&P Technology Index in the consumer discretionary sector, the only other component of the S&P Technology Index. On the same date, the Fund had exposure to the financials and telecommunication services sectors. |
51
FUND BASICS
Technology Tollkeeper Fund
as of February 28, 2015
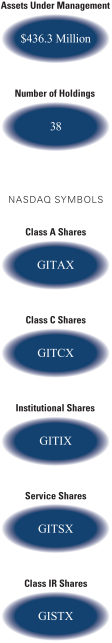
| | | | | | | | | | | | | | |
| | PERFORMANCE REVIEW | |
| | | September 1, 2014– February 28, 2015 | | Fund Total Return
(based on NAV)1 | | | S&P North American
Technology Sector
Index2 | | | NASDAQ
Composite Index3 | |
| | Class A | | | 7.55 | % | | | 7.70 | % | | | 8.37 | % |
| | Class C | | | 7.16 | | | | 7.70 | | | | 8.37 | |
| | Institutional | | | 7.81 | | | | 7.70 | | | | 8.37 | |
| | Service | | | 7.48 | | | | 7.70 | | | | 8.37 | |
| | | Class IR | | | 7.71 | | | | 7.70 | | | | 8.37 | |
| | 1 | | The net asset value (“NAV”) represents the net assets of the class of the Fund (ex-dividend) divided by the total number of shares of the class outstanding. The Fund’s performance reflects the reinvestment of dividends and other distributions. The Fund’s performance does not reflect the deduction of any applicable sales charges. |
| | 2 | | The S&P North American Technology Sector Index provides investors with a benchmark that represents U.S. securities classified under the GICS® technology sector and Internet retail sub-industry. |
| | 3 | | As of December 29, 2014, the Fund’s benchmark was changed from the NASDAQ Composite Index to the S&P North American Technology Sector Index. The Investment Adviser believes that the S&P North American Technology Sector Index is a more appropriate index against which to measure performance. In connection with this benchmark change, there was no change to the investment philosophy or strategy of the Fund. The Fund’s past performance, before and after taxes, is not necessarily an indication of how the Fund will perform in the future. The NASDAQ Composite Index is a broad-based capitalization-weighted index of all NASDAQ National Market and small-cap stocks. The Index figures do not reflect any deduction for fees, expenses or taxes. It is not possible to invest directly in an index. |
| | | | | | | | | | | | | | | | | | | | | | |
| | STANDARDIZED TOTAL RETURNS4 | |
| | | For the period ended 12/31/14 | | One Year | | | Five Years | | | Ten Years | | | Since Inception | | | Inception Date | |
| | Class A | | | 3.98 | % | | | 11.66 | % | | | 8.89 | % | | | 4.20 | % | | | 10/1/99 | |
| | Class C | | | 8.06 | | | | 12.08 | | | | 8.70 | | | | 3.80 | | | | 10/1/99 | |
| | Institutional | | | 10.43 | | | | 13.38 | | | | 9.95 | | | | 5.01 | | | | 10/1/99 | |
| | Service | | | 9.91 | | | | 12.84 | | | | 9.41 | | | | 4.51 | | | | 10/1/99 | |
| | | Class IR | | | 10.27 | | | | N/A | | | | N/A | | | | 12.92 | | | | 9/30/10 | |
| | 4 | | The Standardized Total Returns are average annual total returns as of the most recent calendar quarter-end. They assume reinvestment of all distributions at NAV. These returns reflect a maximum initial sales charge of 5.5% for Class A Shares and the assumed contingent deferred sales charge for Class C Shares (1% if redeemed within 12 months of purchase). Because Institutional, Service and Class IR Shares do not involve a sales charge, such a charge is not applied to their Standardized Total Returns. |
The returns set forth in the tables above represent past performance. Past performance does not guarantee future results. The Fund’s investment return and principal value will fluctuate so that an investor’s shares, when redeemed, may be worth more or less than their original cost. Current performance may be lower or higher than the performance quoted above. Please visit our web site at www.GSAMFUNDS.com to obtain the most recent month-end returns. Performance reflects applicable fee waivers and/or expense limitations in effect during the periods shown. In their absence, performance would be reduced. Returns do not reflect the deduction of taxes that a shareholder would pay on Fund distributions or the redemption of Fund shares.
52
FUND BASICS
| | | | | | | | | | |
| | EXPENSE RATIOS5 | |
| | | | | Net Expense Ratio (Current) | | | Gross Expense Ratio (Before Waivers) | |
| | Class A | | | 1.47 | % | | | 1.54 | % |
| | Class C | | | 2.22 | | | | 2.29 | |
| | Institutional | | | 1.07 | | | | 1.14 | |
| | Service | | | 1.57 | | | | 1.64 | |
| | | Class IR | | | 1.22 | | | | 1.29 | |
| | 5 | | The expense ratios of the Fund, both current (net of applicable fee waivers and/or expense limitations) and before waivers (gross of applicable fee waivers and/or expense limitations) are as set forth above according to the most recent publicly available Prospectus for the Fund and may differ from the expense ratios disclosed in the Financial Highlights in this report. Pursuant to a contractual arrangement, the Fund’s waivers and/or expense limitations will remain in place through at least December 29, 2015, and prior to such date the investment adviser may not terminate the arrangements without the approval of the Fund’s Board of Trustees. If these arrangements are discontinued in the future, the expense ratios may change without shareholder approval. |
| | | | | | | | |
| | TOP TEN HOLDINGS AS OF 2/28/156 |
| | | Holding | | % of Net Assets | | | Line of Business |
| | Apple, Inc. | | | 9.6 | % | | Computers & Peripherals |
| | QUALCOMM, Inc. | | | 5.1 | | | Communications Equipment |
| | LinkedIn Corp. Class A | | | 4.6 | | | Internet Software & Services |
| | EMC Corp. | | | 4.1 | | | Computers & Peripherals |
| | Oracle Corp. | | | 3.8 | | | Software |
| | Google, Inc. Class A | | | 3.7 | | | Internet Software & Services |
| | American Tower Corp. | | | 3.6 | | | Real Estate Investment Trusts |
| | Amazon.com, Inc. | | | 3.5 | | | Internet & Catalog Retail |
| | ServiceNow, Inc. | | | 3.5 | | | Software |
| | | SBA Communications Corp. Class A | | | 3.5 | | | Wireless Telecommunication Services |
| | 6 | | The top 10 holdings may not be representative of the Fund’s future investments. |
53
FUND BASICS
|
| FUND VS. BENCHMARK SECTOR ALLOCATION7 |
| As of February 28, 2015 |
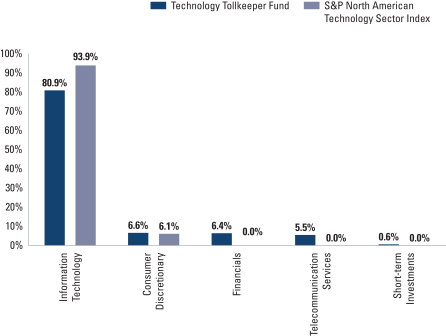
| | 7 | | The Fund is actively managed and, as such, its composition may differ over time. Consequently, the Fund’s overall sector allocations may differ from the percentages contained in the graph above. The graph categorizes investments using the Global Industry Classification Standard (“GICS”), however, the sector classifications used by the portfolio management team may differ from GICS. The percentage shown for each investment category reflects the value of investments in that category as a percentage of market value. Short-term investments represent repurchase agreements. The graph depicts the Fund’s investments but may not represent the Fund’s market exposure due to the exclusion of certain derivatives, if any, as listed in the Additional Investment Information section of the Schedule of Investments. |
54
PORTFOLIO RESULTS
Goldman Sachs U.S. Equity Fund
Portfolio Composition
The Fund invests primarily in large-capitalization U.S. equity investments. Since the Fund’s inception, the Goldman Sachs Growth Equity Investment Team and the Goldman Sachs Fundamental Equity Value Investment Team have focused on several key investment criteria that they believe can drive a company’s growth over the long term. These characteristics are: dominant market share, established brand name, pricing power, recurring revenue stream, free cash flow, high returns on invested capital, predictable growth, sustainable growth, long product life cycle, enduring competitive advantage, favorable demographic trends and excellent management. The Teams strive to purchase these companies at reasonable valuations in order to capture the full benefits of their growth.
Portfolio Management Discussion and Analysis
Below, the Goldman Sachs Growth Equity Investment Team and the Goldman Sachs Value Equity Investment Team discuss the Goldman Sachs U.S. Equity Fund’s (the “Fund”) performance and positioning for the six-month period ended February 28, 2015 (the “Reporting Period”).
| Q | | How did the Fund perform during the Reporting Period? |
| A | | During the Reporting Period, the Fund’s Class A, C, Institutional, IR and R Shares generated cumulative total returns, without sales charges, of 6.02%, 5.63%, 6.26%, 6.18% and 5.90%, respectively. These returns compare to the 6.12% cumulative total return of the Fund’s benchmark, the Standard & Poor’s 500® Index (the “S&P 500 Index”), during the same period. |
| Q | | Were there any changes to the Fund during the Reporting Period? |
| A | | There were no changes to the Fund during the Reporting Period. |
| Q | | What key factors were responsible for the Fund’s performance during the Reporting Period? |
| A | | The Fund’s performance relative to the S&P 500 Index was driven primarily by stock selection overall during the Reporting Period. |
| Q | | Which equity market sectors most significantly affected Fund performance? |
| A | | Effective stock selection in the health care and consumer staples sectors helped the Fund’s performance most relative to the S&P 500 Index. Having no exposure to the materials sector, which lagged the S&P 500 Index during the Reporting Period, also added value. Challenging stock selection in the energy, consumer discretionary and financials sectors detracted from the Fund’s relative results most during the Reporting Period. |
| Q | | What were some of the Fund’s best-performing individual stocks? |
| A | | The Fund benefited most relative to the S&P 500 Index from positions in natural food supermarket owner and operator Whole Foods Market, athletic footwear, apparel and equipment company Nike and wholesale club retailer Costco Wholesale. |
| | Whole Foods Market was a strong contributor to the Fund’s performance during the Reporting Period, as investors gained confidence in several of the company’s strategic initiatives. More specifically, the company began to see positive results from initiatives aimed at cutting costs, improving profitability and reaccelerating top-line growth. Whole Foods Market also rolled out a national advertising campaign to emphasize its high quality food standards in the fall of 2014 and began testing a customer loyalty program, both of which we believe could drive traffic and comparable store sales growth. In our view, Whole Foods Market was well positioned at the end of the Reporting Period as a market leader. |
| | Toward the end of the third quarter of 2014, Nike reported its fiscal first quarter 2015 revenues, earnings and profit margins, which were meaningfully ahead of consensus expectations. The company also raised its revenue and earnings outlook for its fiscal year 2015. Additionally, future orders growth accelerated in its three major regions — the |
55
PORTFOLIO RESULTS
| | U.S., Western Europe and China. At the end of the Reporting Period, we continued to believe in the strength and quality of Nike’s franchise and remained positive on the company’s outlook. |
| | In October 2014, Costco Wholesale announced fiscal third quarter earnings that exceeded consensus estimates. Improved same store sales, operating margins and inventory management were the key drivers to the successful quarter. The company carried this momentum into February 2015, when it announced a $5 per share special dividend, reflecting strong cash flow generation and health of its business as well as an attractive return of capital to shareholders. In our view, Costco Wholesale should continue to be well received by the market thanks to what we consider to be a strong management team committed to improving its business model and gaining market share. |
| Q | | Which stocks detracted significantly from the Fund’s performance during the Reporting Period? |
| A | | Detracting most from the Fund’s results relative to its benchmark index were positions in three oil and gas exploration and production companies—Southwestern Energy, Devon Energy and Apache. |
| | Southwestern Energy was a top detractor from the Fund’s relative performance, driven by weak natural gas prices. Despite the company’s underperformance, we believe its management has executed its strategy well and at the end of the Reporting Period, the company was attractively valued relative to its peers. Furthermore, at the end of the Reporting Period, we continued to believe that Southwestern Energy has an underappreciated resource base, specifically in the Marcellus and Fayetteville shales, and that its newly acquired assets enhance the company’s position and growth opportunities. Additionally, we remained positive on the company’s operational leverage to higher natural gas prices and encouraged by its management team’s commitment to disciplined growth, costs reductions and shareholder returns. |
| | Low oil prices weighed negatively on Devon Energy’s shares and overshadowed the company’s strong results. Indeed, despite its underperformance, we continued to believe at the end of the Reporting Period that the value of Devon Energy’s large North American asset base was not fully recognized at its then current market price. We also remained positive on a number of actions the company has taken to unlock shareholder value. Finally, we believe Devon Energy maintains a strong balance sheet, which could help expedite the development of its oil properties going forward. |
| | Similarly, Apache’s shares declined along with the drop in energy prices during the Reporting Period. Still, during 2014, Apache announced the sale of $1.4 billion of non-core assets and the exit of liquid natural gas projects, which consumed capital. We view these sales of non-core assets favorably, as we feel it demonstrates Apache’s commitment to focusing on its core business, which we believe has the potential to generate higher returns on investment and more predictable growth. Overall, at the end of the Reporting Period, we viewed its shares as attractively valued given Apache’s balance sheet strength, improving free cash flow generation and potential for increased shareholder distributions. |
| Q | | How did the Fund use derivatives and similar instruments during the Reporting Period? |
| A | | During the Reporting Period, we did not use derivatives as part of an active management strategy. |
| Q | | Did the Fund make any significant purchases or sales during the Reporting Period? |
| A | | We initiated a Fund position in Walgreens Boots Alliance during the Reporting Period. Walgreens Boots Alliance is the result of a merger between Walgreens and Boots Alliance, which specializes in both retail and wholesale pharmacy. In our view, Walgreens Boots Alliance should be a formidable player in the pharmacy space, and we see meaningful revenue and cost synergies with the combined company. Boots Alliance’s management is now in charge of running the business and appears to us to be squarely focused on improving execution, profitability and creating value for shareholders. We are optimistic about the new management team’s ability to deliver. We also believe the earnings power of this franchise is underappreciated by the market, and we expect significant upside to shares over a multi-year period if its management can indeed execute on its initiatives. |
| | We established a Fund position in media entertainment content producer Viacom. We find Viacom attractive for a number of reasons. First, Viacom is the largest cable network by viewership and has a strong position in the overall cable ecosystem. Second, Viacom has a large portion of its business that provides highly visible recurring revenues with long-term contracts and built-in escalators that bring some stability to the business and help manage the downside. Third, we believe new methods of viewership measurement rolling out in 2015 could positively benefit the company by capturing previously unmeasured viewers. Fourth, Viacom’s |
56
PORTFOLIO RESULTS
| | management team has a demonstrated history of returning capital through dividends and buybacks. Lastly, at the time of purchase, we found Viacom attractively valued relative to its peers and the broader market. |
| | Conversely, we exited the Fund’s position in pharmaceutical company Merck following strong performance. We continue to like the business but believe other ideas and peers provide a more attractive risk/reward opportunity. |
| | Similarly, we sold the Fund’s position in media content provider Twenty-First Century Fox in favor of other opportunities that we believe have more compelling upside. We continue to like the business but believe better opportunities exist elsewhere. |
| Q | | Were there any notable changes in the Fund’s weightings during the Reporting Period? |
| A | | In constructing the Fund’s portfolio, we focus on picking stocks rather than on making industry or sector bets. We seek to outpace the benchmark index by overweighting stocks that we expect to outperform and underweighting those that we think may lag. Consequently, changes in its sector weights are generally the direct result of individual stock selection or of stock appreciation or depreciation. That said, during the Reporting Period, the Fund’s exposure to the consumer staples, financials and telecommunication services sectors increased and its allocations to the health care, information technology and industrials sectors decreased compared to the S&P 500 Index. |
| Q | | How was the Fund positioned relative to its benchmark index at the end of February 2015? |
| A | | At the end of February 2015, the Fund had overweighted positions relative to the S&P 500 Index in financials, consumer discretionary and consumer staples. On the same date, the Fund had underweighted positions compared to the S&P 500 Index in the health care, utilities, information technology, energy and industrials sectors and was rather neutrally weighted to the S&P 500 Index in the telecommunication services sectors. The Fund had no position at all in the materials sector on February 28, 2015. |
57
FUND BASICS
U.S. Equity Fund
as of February 28, 2015
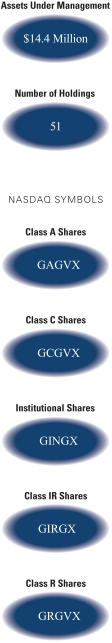
| | | | | | | | | | |
| | PERFORMANCE REVIEW | |
| | | September 1, 2014–February 28, 2015 | | Fund Total Return
(based on NAV)1 | | | S&P 500® Index2 | |
| | Class A | | | 6.02 | % | | | 6.12 | % |
| | Class C | | | 5.63 | | | | 6.12 | |
| | Institutional | | | 6.26 | | | | 6.12 | |
| | Class IR | | | 6.18 | | | | 6.12 | |
| | | Class R | | | 5.90 | | | | 6.12 | |
| | 1 | | The net asset value (“NAV”) represents the net assets of the class of the Fund (ex-dividend) divided by the total number of shares of the class outstanding. The Fund’s performance reflects the reinvestment of dividends and other distributions. The Fund’s performance does not reflect the deduction of any applicable sales charges. |
| | 2 | | The S&P 500® Index is the Standard & Poor’s 500 Composite Index of 500 stocks, an unmanaged index of common stock prices. The Index figures do not reflect any deduction for fees, expenses or taxes. It is not possible to invest directly in an index. |
| | | | | | | | | | | | | | | | |
| | STANDARDIZED TOTAL RETURNS3 |
| | | For the period ended 12/31/14 | | One Year | | | Five Years | | | Since Inception | | | Inception Date |
| | Class A | | | 6.21 | % | | | 12.35 | % | | | 12.67 | % | | 11/30/09 |
| | Class C | | | 10.39 | | | | 12.77 | | | | 13.07 | | | 11/30/09 |
| | Institutional | | | 12.80 | | | | 14.10 | | | | 14.39 | | | 11/30/09 |
| | Class IR | | | 12.66 | | | | 13.92 | | | | 14.21 | | | 11/30/09 |
| | | Class R | | | 12.12 | | | | 13.35 | | | | 13.65 | | | 11/30/09 |
| | 3 | | The Standardized Total Returns are average annual total returns as of the most recent calendar quarter-end. They assume reinvestment of all distributions at NAV. These returns reflect a maximum initial sales charge of 5.5% for Class A Shares and the assumed contingent deferred sales charge for Class C Shares (1% if redeemed within 12 months of purchase). Because Institutional, Class IR and Class R Shares do not involve a sales charge, such a charge is not applied to their Standardized Total Returns. |
The returns set forth in the tables above represent past performance. Past performance does not guarantee future results. The Fund’s investment return and principal value will fluctuate so that an investor’s shares, when redeemed, may be worth more or less than their original cost. Current performance may be lower or higher than the performance quoted above. Please visit our web site at www.GSAMFUNDS.com to obtain the most recent month-end returns. Performance reflects applicable fee waivers and/or expense limitations in effect during the periods shown. In their absence, performance would be reduced. Returns do not reflect the deduction of taxes that a shareholder would pay on Fund distributions or the redemption of Fund shares.
58
FUND BASICS
| | | | | | | | | | |
| | EXPENSE RATIOS4 | |
| | | | | Net Expense Ratio (Current) | | | Gross Expense Ratio (Before Waivers) | |
| | Class A | | | 1.22 | % | | | 3.00 | % |
| | Class C | | | 1.97 | | | | 3.74 | |
| | Institutional | | | 0.82 | | | | 2.61 | |
| | Class IR | | | 0.97 | | | | 2.76 | |
| | | Class R | | | 1.47 | | | | 3.26 | |
| | 4 | | The expense ratios of the Fund, both current (net of applicable fee waivers and/or expense limitations) and before waivers (gross of applicable fee waivers and/or expense limitations) are as set forth above according to the most recent publicly available Prospectus for the Fund and may differ from the expense ratios disclosed in the Financial Highlights in this report. Pursuant to a contractual arrangement, the Fund’s waivers and/or expense limitations will remain in place through at least December 29, 2015, and prior to such date the investment adviser may not terminate the arrangements without the approval of the Fund’s Board of Trustees. If these arrangements are discontinued in the future, the expense ratios may change without shareholder approval. |
| | | | | | | | |
| | TOP TEN HOLDINGS AS OF 2/28/155 |
| | | Holding | | % of Net Assets | | | Line of Business |
| | General Electric Co. | | | 5.2 | % | | Industrial Conglomerates |
| | Apple, Inc. | | | 4.0 | | | Computers & Peripherals |
| | JPMorgan Chase & Co. | | | 3.8 | | | Commercial Banks |
| | Pfizer, Inc. | | | 3.6 | | | Pharmaceuticals |
| | Bank of America Corp. | | | 3.5 | | | Commercial Banks |
| | Microsoft Corp. | | | 3.1 | | | Software |
| | Prudential Financial, Inc. | | | 2.6 | | | Insurance |
| | American International Group, Inc. | | | 2.5 | | | Insurance |
| | Whole Foods Market, Inc. | | | 2.5 | | | Food & Staples Retailing |
| | | NIKE, Inc. Class B | | | 2.5 | | | Textiles, Apparel & Luxury Goods |
| | 5 | | The top 10 holdings may not be representative of the Fund’s future investments. |
59
FUND BASICS
|
| FUND VS. BENCHMARK SECTOR ALLOCATION6 |
| As of February 28, 2015 |
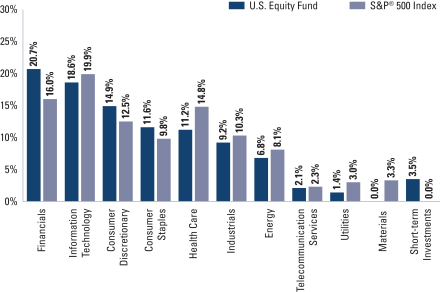
| | 6 | | The Fund is actively managed and, as such, its composition may differ over time. Consequently, the Fund’s overall sector allocations may differ from the percentages contained in the graph above. The graph categorizes investments using Global Industry Classification Standard (“GICS”), however, the sector classifications used by the portfolio management team may differ from GICS. The percentage shown for each investment category reflects the value of investments in that category as a percentage of market value. Short-term investments represent repurchase agreements. The graph depicts the Fund’s investments but may not represent the Fund’s market exposure due to the exclusion of certain derivatives, if any, as listed in the Additional Investment Information section of the Schedule of Investments. |
60
GOLDMAN SACHS CAPITAL GROWTH FUND
Schedule of Investments
February 28, 2015 (Unaudited)
| | | | | | | | |
Shares | | | Description | | Value | |
| | Common Stocks – 98.2% | |
| | Aerospace & Defense – 4.2% | |
| | 137,154 | | | Honeywell International, Inc. | | $ | 14,096,688 | |
| | 59,601 | | | Precision Castparts Corp. | | | 12,891,696 | |
| | 71,870 | | | The Boeing Co. | | | 10,841,590 | |
| | 38,071 | | | United Technologies Corp. | | | 4,641,236 | |
| | | | | | | | |
| | | | | | | 42,471,210 | |
| | |
| | Airlines* – 0.6% | |
| | 93,473 | | | United Continental Holdings, Inc. | | | 6,092,570 | |
| | |
| | Auto Components – 0.8% | |
| | 140,049 | | | BorgWarner, Inc. | | | 8,607,412 | |
| | |
| | Automobiles* – 0.5% | |
| | 27,240 | | | Tesla Motors, Inc. | | | 5,538,982 | |
| | |
| | Beverages – 0.7% | |
| | 166,154 | | | Coca-Cola Enterprises, Inc. | | | 7,676,315 | |
| | |
| | Biotechnology – 5.3% | |
| | 88,908 | | | Amgen, Inc. | | | 14,022,570 | |
| | 14,378 | | | Biogen Idec, Inc.* | | | 5,889,085 | |
| | 128,712 | | | Celgene Corp.* | | | 15,642,369 | |
| | 86,513 | | | Cepheid, Inc.* | | | 4,917,399 | |
| | 135,466 | | | Gilead Sciences, Inc.* | | | 14,024,795 | |
| | | | | | | | |
| | | | | | | 54,496,218 | |
| | |
| | Chemicals – 3.8% | |
| | 56,026 | | | Airgas, Inc. | | | 6,567,368 | |
| | 63,853 | | | Ashland, Inc. | | | 8,148,920 | |
| | 318,285 | | | Axalta Coating Systems Ltd.* | | | 9,039,294 | |
| | 41,903 | | | International Flavors & Fragrances, Inc. | | | 5,109,233 | |
| | 36,251 | | | The Sherwin-Williams Co. | | | 10,338,785 | |
| | | | | | | | |
| | | | | | | 39,203,600 | |
| | |
| | Commercial Banks – 0.9% | |
| | 161,533 | | | First Republic Bank | | | 9,207,381 | |
| | |
| | Communications Equipment – 1.6% | |
| | 228,624 | | | QUALCOMM, Inc. | | | 16,577,526 | |
| | |
| | Computers & Peripherals – 8.2% | |
| | 555,185 | | | Apple, Inc. | | | 71,319,065 | |
| | 438,218 | | | EMC Corp. | | | 12,682,029 | |
| | | | | | | | |
| | | | | | | 84,001,094 | |
| | |
| | Construction & Engineering* – 0.3% | |
| | 100,446 | | | Quanta Services, Inc. | | | 2,890,836 | |
| | |
| | Consumer Finance – 1.9% | |
| | 54,850 | | | American Express Co. | | | 4,475,212 | |
| | 335,308 | | | Navient Corp. | | | 7,175,591 | |
| | 800,157 | | | SLM Corp.* | | | 7,577,487 | |
| | | | | | | | |
| | | | | | | 19,228,290 | |
| | |
| | Containers & Packaging – 0.7% | |
| | 132,455 | | | Avery Dennison Corp. | | | 7,092,965 | |
| | |
| | Common Stocks – (continued) | |
| | Distributors* – 0.5% | |
| | 221,983 | | | LKQ Corp. | | $ | 5,455,232 | |
| | |
| | Diversified Financial Services – 1.4% | |
| | 59,376 | | | Intercontinental Exchange, Inc. | | | 13,974,735 | |
| | |
| | Electrical Equipment* – 1.0% | |
| | 81,451 | | | Generac Holdings, Inc. | | | 4,014,720 | |
| | 119,107 | | | Sensata Technologies Holding NV | | | 6,400,810 | |
| | | | | | | | |
| | | | | | | 10,415,530 | |
| | | | | | | | |
| | |
| | Electronic Equipment, Instruments & Components – 0.8% | |
| | 92,625 | | | Amphenol Corp. Class A | | | 5,229,608 | |
| | 29,078 | | | IPG Photonics Corp.* | | | 2,788,580 | |
| | | | | | | | |
| | | | | | | 8,018,188 | |
| | |
| | Energy Equipment & Services – 1.2% | |
| | 23,394 | | | Baker Hughes, Inc. | | | 1,462,359 | |
| | 10,708 | | | Cameron International Corp.* | | | 504,133 | |
| | 78,661 | | | Halliburton Co. | | | 3,377,703 | |
| | 88,028 | | | Schlumberger Ltd. | | | 7,408,436 | |
| | | | | | | | |
| | | | | | | 12,752,631 | |
| | |
| | Food & Staples Retailing – 3.6% | |
| | 95,808 | | | Costco Wholesale Corp. | | | 14,079,944 | |
| | 149,082 | | | Walgreens Boots Alliance, Inc. | | | 12,385,732 | |
| | 188,963 | | | Whole Foods Market, Inc. | | | 10,674,520 | |
| | | | | | | | |
| | | | | | | 37,140,196 | |
| | |
| | Food Products – 3.0% | |
| | 93,549 | | | Keurig Green Mountain, Inc. | | | 11,934,982 | |
| | 134,006 | | | McCormick & Co., Inc. | | | 10,101,372 | |
| | 131,704 | | | The Hain Celestial Group, Inc.* | | | 8,235,451 | |
| | | | | | | | |
| | | | | | | 30,271,805 | |
| | |
| | Health Care Equipment & Supplies – 1.1% | |
| | 141,389 | | | Abbott Laboratories | | | 6,697,597 | |
| | 10,121 | | | Intuitive Surgical, Inc.* | | | 5,060,500 | |
| | | | | | | | |
| | | | | | | 11,758,097 | |
| | |
| | Health Care Providers & Services – 1.1% | |
| | 49,280 | | | McKesson Corp. | | | 11,270,336 | |
| | |
| | Health Care Technology* – 0.8% | |
| | 120,468 | | | Cerner Corp. | | | 8,680,924 | |
| | |
| | Hotels, Restaurants & Leisure – 4.8% | |
| | 219,315 | | | Hilton Worldwide Holdings, Inc.* | | | 6,200,035 | |
| | 92,317 | | | Las Vegas Sands Corp. | | | 5,252,837 | |
| | 38,767 | | | Panera Bread Co. Class A* | | | 6,258,157 | |
| | 148,035 | | | Starbucks Corp. | | | 13,839,052 | |
| | 214,230 | | | Yum! Brands, Inc. | | | 17,376,195 | |
| | | | | | | | |
| | | | | | | 48,926,276 | |
| | |
| | Household Durables* – 0.6% | |
| | 148,426 | | | Toll Brothers, Inc. | | | 5,686,200 | |
| | |
| | |
| The accompanying notes are an integral part of these financial statements. | | 61 |
GOLDMAN SACHS CAPITAL GROWTH FUND
Schedule of Investments (continued)
February 28, 2015 (Unaudited)
| | | | | | | | |
Shares | | | Description | | Value | |
| | Common Stocks – (continued) | |
| | Household Products – 1.4% | |
| | 199,004 | | | Colgate-Palmolive Co. | | $ | 14,093,463 | |
| | |
| | Industrial Conglomerates – 0.7% | |
| | 82,090 | | | Danaher Corp. | | | 7,164,815 | |
| | |
| | Internet & Catalog Retail* – 3.0% | |
| | 42,943 | | | Amazon.com, Inc. | | | 16,325,211 | |
| | 14,865 | | | Netflix, Inc. | | | 7,059,537 | |
| | 6,113 | | | The Priceline Group, Inc. | | | 7,564,715 | |
| | | | | | | | |
| | | | | | | 30,949,463 | |
| | |
| | Internet Software & Services – 8.2% | |
| | 25,360 | | | Demandware, Inc.* | | | 1,602,498 | |
| | 122,743 | | | eBay, Inc.* | | | 7,108,047 | |
| | 47,398 | | | Equinix, Inc. | | | 10,625,447 | |
| | 209,323 | | | Facebook, Inc. Class A* | | | 16,530,237 | |
| | 26,461 | | | Google, Inc. Class A* | | | 14,887,753 | |
| | 27,666 | | | Google, Inc. Class C* | | | 15,448,694 | |
| | 41,026 | | | LinkedIn Corp. Class A* | | | 10,962,147 | |
| | 44,424 | | | Rackspace Hosting, Inc.* | | | 2,206,540 | |
| | 59,570 | | | Twitter, Inc.* | | | 2,864,126 | |
| | 29,173 | | | Yahoo!, Inc.* | | | 1,291,781 | |
| | | | | | | | |
| | | | | | | 83,527,270 | |
| | |
| | IT Services – 2.8% | |
| | 89,615 | | | Cognizant Technology Solutions Corp. Class A* | | | 5,599,593 | |
| | 25,911 | | | Fidelity National Information Services, Inc. | | | 1,751,325 | |
| | 33,585 | | | Fiserv, Inc.* | | | 2,621,981 | |
| | 17,638 | | | FleetCor Technologies, Inc.* | | | 2,706,198 | |
| | 29,212 | | | Global Payments, Inc. | | | 2,683,414 | |
| | 17,177 | | | International Business Machines Corp. | | | 2,781,644 | |
| | 88,089 | | | MasterCard, Inc. Class A | | | 7,939,462 | |
| | 10,959 | | | Visa, Inc. Class A | | | 2,973,286 | |
| | | | | | | | |
| | | | | | | 29,056,903 | |
| | |
| | Life Sciences Tools & Services – 0.4% | |
| | 107,723 | | | Agilent Technologies, Inc. | | | 4,546,988 | |
| | |
| | Machinery – 0.9% | |
| | 31,893 | | | Caterpillar, Inc. | | | 2,643,929 | |
| | 44,399 | | | Cummins, Inc. | | | 6,314,870 | |
| | | | | | | | |
| | | | | | | 8,958,799 | |
| | |
| | Media – 4.8% | |
| | 368,364 | | | Comcast Corp. Class A | | | 21,873,454 | |
| | 132,961 | | | The Walt Disney Co. | | | 13,838,581 | |
| | 378,896 | | | Twenty-First Century Fox, Inc. Class A | | | 13,261,360 | |
| | | | | | | | |
| | | | | | | 48,973,395 | |
| | |
| | Oil, Gas & Consumable Fuels – 3.0% | |
| | 50,679 | | | Anadarko Petroleum Corp. | | | 4,268,692 | |
| | 36,638 | | | Cimarex Energy Co. | | | 4,018,456 | |
| | 41,401 | | | Concho Resources, Inc.* | | | 4,509,397 | |
| | 50,481 | | | EOG Resources, Inc. | | | 4,529,155 | |
| | |
| | Common Stocks – (continued) | |
| | Oil, Gas & Consumable Fuels – (continued) | |
| | 27,353 | | | Marathon Petroleum Corp. | | $ | 2,872,065 | |
| | 42,332 | | | Pioneer Natural Resources Co. | | | 6,456,477 | |
| | 57,581 | | | Valero Energy Corp. | | | 3,552,172 | |
| | | | | | | | |
| | | | | | | 30,206,414 | |
| | |
| | Pharmaceuticals – 4.2% | |
| | 202,875 | | | AbbVie, Inc. | | | 12,273,938 | |
| | 22,007 | | | Actavis PLC* | | | 6,411,960 | |
| | 190,278 | | | Mylan, Inc.* | | | 10,907,686 | |
| | 56,864 | | | Shire PLC ADR | | | 13,755,970 | |
| | | | | | | | |
| | | | | | | 43,349,554 | |
| | |
| | Professional Services – 0.2% | |
| | 39,213 | | | Nielsen Holdings NV | | | 1,772,820 | |
| | |
| | Real Estate Investment Trusts – 1.3% | |
| | 132,513 | | | American Tower Corp. | | | 13,137,339 | |
| | |
| | Real Estate Management & Development* – 0.8% | |
| | 233,215 | | | CBRE Group, Inc. Class A | | | 7,989,946 | |
| | |
| | Road & Rail – 2.4% | |
| | 129,775 | | | Kansas City Southern | | | 15,033,136 | |
| | 320,475 | | | Swift Transportation Co.* | | | 9,063,033 | |
| | | | | | | | |
| | | | | | | 24,096,169 | |
| | |
| | Semiconductors & Semiconductor Equipment – 1.5% | |
| | 115,429 | | | Applied Materials, Inc. | | | 2,891,496 | |
| | 144,573 | | | Broadcom Corp. Class A | | | 6,539,037 | |
| | 92,614 | | | Texas Instruments, Inc. | | | 5,445,703 | |
| | | | | | | | |
| | | | | | | 14,876,236 | |
| | |
| | Software – 4.7% | |
| | 14,815 | | | Adobe Systems, Inc.* | | | 1,171,867 | |
| | 33,500 | | | Intuit, Inc. | | | 3,270,605 | |
| | 190,960 | | | Microsoft Corp. | | | 8,373,596 | |
| | 507,088 | | | Oracle Corp. | | | 22,220,596 | |
| | 58,846 | | | salesforce.com, Inc.* | | | 4,082,735 | |
| | 47,489 | | | ServiceNow, Inc.* | | | 3,621,511 | |
| | 16,519 | | | Splunk, Inc.* | | | 1,110,903 | |
| | 20,597 | | | Tableau Software, Inc. Class A* | | | 1,936,324 | |
| | 23,004 | | | VMware, Inc. Class A* | | | 1,956,950 | |
| | | | | | | | |
| | | | | | | 47,745,087 | |
| | |
| | Specialty Retail – 3.9% | |
| | 50,764 | | | Advance Auto Parts, Inc. | | | 7,864,866 | |
| | 82,752 | | | L Brands, Inc. | | | 7,601,599 | |
| | 148,449 | | | The Home Depot, Inc. | | | 17,034,523 | |
| | 50,657 | | | Ulta Salon, Cosmetics & Fragrance, Inc.* | | | 7,130,479 | |
| | | | | | | | |
| | | | | | | 39,631,467 | |
| | |
| | Textiles, Apparel & Luxury Goods – 3.2% | |
| | 378,549 | | | Kate Spade & Co.* | | | 13,041,013 | |
| | 105,718 | | | NIKE, Inc. Class B | | | 10,267,332 | |
| | 83,664 | | | PVH Corp. | | | 8,912,726 | |
| | | | | | | | |
| | | | | | | 32,221,071 | |
| | |
| | |
| 62 | | The accompanying notes are an integral part of these financial statements. |
GOLDMAN SACHS CAPITAL GROWTH FUND
| | | | | | | | |
Shares | | | Description | | Value | |
| | Common Stocks – (continued) | |
| | Tobacco – 1.4% | |
| | 170,441 | | | Philip Morris International, Inc. | | $ | 14,139,785 | |
| | |
| | TOTAL COMMON STOCKS | | | | |
| | (Cost $708,375,219) | | $ | 1,003,871,533 | |
| | |
| | | | | | | | | | | | | | |
Principal Amount | | | Interest
Rate | | | Maturity
Date | | | Value | |
| | Short-term Investment(a) – 1.4% | |
| | Repurchase Agreement – 1.4% | |
| Joint Repurchase Agreement Account II | |
| $ | 14,300,000 | | | | 0.081 | % | | | 03/02/15 | | | $ | 14,300,000 | |
| | (Cost $14,300,000) | | | | | |
| | |
| | TOTAL INVESTMENTS – 99.6% | | | | | |
| | (Cost $722,675,219) | | | $ | 1,018,171,533 | |
| | |
| OTHER ASSETS IN EXCESS OF
LIABILITIES – 0.4% |
| | | 4,334,410 | |
| | |
| | NET ASSETS – 100.0% | | | $ | 1,022,505,943 | |
| | |
| | |
| The percentage shown for each investment category reflects the value of investments in that category as a percentage of net assets. |
* | | Non-income producing security. |
(a) | | Joint repurchase agreement was entered into on February 27, 2015. Additional information appears on page 79. |
| | |
|
Investment Abbreviation: |
ADR | | —American Depositary Receipt |
|
| | |
| The accompanying notes are an integral part of these financial statements. | | 63 |
GOLDMAN SACHS CONCENTRATED GROWTH FUND
Schedule of Investments
February 28, 2015 (Unaudited)
| | | | | | | | |
Shares | | | Description | | Value | |
| | Common Stocks – 98.7% | |
| | Aerospace & Defense – 4.9% | |
| | 46,475 | | | Honeywell International, Inc. | | $ | 4,776,701 | |
| | 20,661 | | | Precision Castparts Corp. | | | 4,468,974 | |
| | | | | | | | |
| | | | | | | 9,245,675 | |
| | |
| | Auto Components – 1.5% | |
| | 46,250 | | | BorgWarner, Inc. | | | 2,842,525 | |
| | |
| | Biotechnology* – 2.5% | |
| | 11,338 | | | Biogen Idec, Inc. | | | 4,643,931 | |
| | |
| | Chemicals – 1.3% | |
| | 8,589 | | | The Sherwin-Williams Co. | | | 2,449,583 | |
| | |
| | Communications Equipment – 2.3% | |
| | 58,289 | | | QUALCOMM, Inc. | | | 4,226,535 | |
| | |
| | Computers & Peripherals – 9.7% | |
| | 101,897 | | | Apple, Inc. | | | 13,089,688 | |
| | 175,323 | | | EMC Corp. | | | 5,073,848 | |
| | | | | | | | |
| | | | | | | 18,163,536 | |
| | |
| | Consumer Finance* – 2.0% | |
| | 401,597 | | | SLM Corp. | | | 3,803,124 | |
| | |
| | Diversified Financial Services – 2.9% | |
| | 23,143 | | | Intercontinental Exchange, Inc. | | | 5,446,937 | |
| | |
| | Energy Equipment & Services – 1.7% | |
| | 72,492 | | | Halliburton Co. | | | 3,112,806 | |
| | |
| | Food & Staples Retailing – 8.2% | |
| | 43,618 | | | Costco Wholesale Corp. | | | 6,410,102 | |
| | 45,652 | | | Walgreens Boots Alliance, Inc. | | | 3,792,768 | |
| | 89,088 | | | Whole Foods Market, Inc. | | | 5,032,581 | |
| | | | | | | | |
| | | | | | | 15,235,451 | |
| | |
| | Food Products – 1.8% | |
| | 43,384 | | | McCormick & Co., Inc. | | | 3,270,286 | |
| | |
| | Health Care Equipment & Supplies – 2.3% | |
| | 90,032 | | | Abbott Laboratories | | | 4,264,816 | |
| | |
| | Health Care Providers & Services – 2.8% | |
| | 22,838 | | | McKesson Corp. | | | 5,223,051 | |
| | |
| | Health Care Technology* – 1.9% | |
| | 48,307 | | | Cerner Corp. | | | 3,481,002 | |
| | |
| | Hotels, Restaurants & Leisure – 2.6% | |
| | 60,912 | | | Yum! Brands, Inc. | | | 4,940,572 | |
| | |
| | Household Products – 1.6% | |
| | 42,553 | | | Colgate-Palmolive Co. | | | 3,013,603 | |
| | |
| | Industrial Conglomerates – 1.7% | |
| | 37,330 | | | Danaher Corp. | | | 3,258,162 | |
| | |
| | Common Stocks – (continued) | |
| | Internet & Catalog Retail* – 6.3% | |
| | 16,702 | | | Amazon.com, Inc. | | $ | 6,349,432 | |
| | 4,331 | | | The Priceline Group, Inc. | | | 5,359,526 | |
| | | | | | | | |
| | | | | | | 11,708,958 | |
| | |
| | Internet Software & Services – 10.0% | |
| | 23,528 | | | Equinix, Inc. | | | 5,274,389 | |
| | 9,611 | | | Google, Inc. Class A* | | | 5,407,437 | |
| | 5,678 | | | Google, Inc. Class C* | | | 3,170,595 | |
| | 17,779 | | | LinkedIn Corp. Class A* | | | 4,750,549 | |
| | | | | | | | |
| | | | | | | 18,602,970 | |
| | |
| | IT Services – 2.7% | |
| | 14,625 | | | FleetCor Technologies, Inc.* | | | 2,243,914 | |
| | 31,709 | | | MasterCard, Inc. Class A | | | 2,857,932 | |
| | | | | | | | |
| | | | | | | 5,101,846 | |
| | |
| | Media – 2.5% | |
| | 136,030 | | | Twenty-First Century Fox, Inc. Class A | | | 4,761,050 | |
| | |
| | Oil, Gas & Consumable Fuels – 2.0% | |
| | 43,887 | | | Anadarko Petroleum Corp. | | | 3,696,602 | |
| | |
| | Pharmaceuticals* – 4.4% | |
| | 12,880 | | | Actavis PLC | | | 3,752,717 | |
| | 78,907 | | | Mylan, Inc. | | | 4,523,344 | |
| | | | | | | | |
| | | | | | | 8,276,061 | |
| | |
| | Real Estate Investment Trusts – 3.5% | |
| | 65,377 | | | American Tower Corp. | | | 6,481,476 | |
| | |
| | Real Estate Management & Development* – 1.5% | |
| | 81,245 | | | CBRE Group, Inc. Class A | | | 2,783,454 | |
| | |
| | Road & Rail – 2.1% | |
| | 34,059 | | | Kansas City Southern | | | 3,945,395 | |
| | |
| | Software – 4.4% | |
| | 113,335 | | | Oracle Corp. | | | 4,966,340 | |
| | 42,387 | | | ServiceNow, Inc.* | | | 3,232,432 | |
| | | | | | | | |
| | | | | | | 8,198,772 | |
| | |
| | Specialty Retail – 1.8% | |
| | 36,012 | | | L Brands, Inc. | | | 3,308,062 | |
| | |
| | Textiles, Apparel & Luxury Goods – 5.8% | |
| | 65,152 | | | Kate Spade & Co.* | | | 2,244,487 | |
| | 49,934 | | | NIKE, Inc. Class B | | | 4,849,590 | |
| | 34,912 | | | PVH Corp. | | | 3,719,175 | |
| | | | | | | | |
| | | | | | | 10,813,252 | |
| | |
| | TOTAL COMMON STOCKS | | | | |
| | (Cost $135,889,015) | | $ | 184,299,493 | |
| | |
| | |
| 64 | | The accompanying notes are an integral part of these financial statements. |
GOLDMAN SACHS CONCENTRATED GROWTH FUND
| | | | | | | | | | | | | | |
Principal Amount | | | Interest
Rate | | | Maturity
Date | | | Value | |
| | Short-term Investment(a) – 1.5% | |
| | Repurchase Agreement – 1.5% | |
| Joint Repurchase Agreement Account II | |
| $ | 2,800,000 | | | | 0.081 | % | | | 03/02/15 | | | $ | 2,800,000 | |
| | (Cost $2,800,000) | | | | | |
| | |
| | TOTAL INVESTMENTS – 100.2% | | | | | |
| | (Cost $138,689,015) | | | $ | 187,099,493 | |
| | |
| LIABILITIES IN EXCESS OF
OTHER ASSETS – (0.2)% |
| | | (309,642 | ) |
| | |
| | NET ASSETS – 100.0% | | | $ | 186,789,851 | |
| | |
| | |
| The percentage shown for each investment category reflects the value of investments in that category as a percentage of net assets. |
* | | Non-income producing security. |
(a) | | Joint repurchase agreement was entered into on February 27, 2015. Additional information appears on page 79. |
| | |
| The accompanying notes are an integral part of these financial statements. | | 65 |
GOLDMAN SACHS FLEXIBLE CAP GROWTH FUND
Schedule of Investments
February 28, 2015 (Unaudited)
| | | | | | | | |
Shares | | | Description | | Value | |
| | Common Stocks – 98.7% | |
| | Aerospace & Defense – 1.9% | |
| | 1,763 | | | Honeywell International, Inc. | | $ | 181,201 | |
| | 769 | | | Precision Castparts Corp. | | | 166,335 | |
| | | | | | | | |
| | | | | | | 347,536 | |
| | |
| | Auto Components – 0.5% | |
| | 1,507 | | | BorgWarner, Inc. | | | 92,620 | |
| | |
| | Automobiles* – 0.2% | |
| | 208 | | | Tesla Motors, Inc. | | | 42,295 | |
| | |
| | Beverages – 0.8% | |
| | 3,173 | | | Coca-Cola Enterprises, Inc. | | | 146,593 | |
| | |
| | Biotechnology – 7.1% | |
| | 2,259 | | | Alder Biopharmaceuticals, Inc.* | | | 60,722 | |
| | 1,732 | | | Alkermes PLC* | | | 121,673 | |
| | 1,711 | | | Amgen, Inc. | | | 269,859 | |
| | 505 | | | Biogen Idec, Inc.* | | | 206,843 | |
| | 1,481 | | | Celgene Corp.* | | | 179,986 | |
| | 2,457 | | | Cepheid, Inc.* | | | 139,656 | |
| | 1,703 | | | Gilead Sciences, Inc.* | | | 176,311 | |
| | 1,028 | | | Medivation, Inc.* | | | 120,821 | |
| | | | | | | | |
| | | | | | | 1,275,871 | |
| | |
| | Chemicals – 2.7% | |
| | 1,422 | | | Airgas, Inc. | | | 166,687 | |
| | 4,600 | | | Axalta Coating Systems Ltd.* | | | 130,640 | |
| | 841 | | | International Flavors & Fragrances, Inc. | | | 102,543 | |
| | 296 | | | The Sherwin-Williams Co. | | | 84,419 | |
| | | | | | | | |
| | | | | | | 484,289 | |
| | |
| | Commercial Banks – 1.2% | |
| | 3,910 | | | First Republic Bank | | | 222,870 | |
| | |
| | Commercial Services & Supplies – 2.3% | |
| | 5,045 | | | Healthcare Services Group, Inc. | | | 169,361 | |
| | 3,696 | | | Interface, Inc. | | | 74,622 | |
| | 695 | | | Stericycle, Inc.* | | | 93,804 | |
| | 1,666 | | | Waste Connections, Inc. | | | 78,252 | |
| | | | | | | | |
| | | | | | | 416,039 | |
| | |
| | Communications Equipment – 1.6% | |
| | 3,912 | | | QUALCOMM, Inc. | | | 283,659 | |
| | |
| | Computers & Peripherals – 7.9% | |
| | 9,143 | | | Apple, Inc. | | | 1,174,510 | |
| | 8,488 | | | EMC Corp. | | | 245,642 | |
| | | | | | | | |
| | | | | | | 1,420,152 | |
| | |
| | Consumer Finance – 1.6% | |
| | 4,930 | | | Navient Corp. | | | 105,502 | |
| | 19,321 | | | SLM Corp.* | | | 182,970 | |
| | | | | | | | |
| | | | | | | 288,472 | |
| | |
| | Distributors* – 0.4% | |
| | 3,228 | | | LKQ Corp. | | | 79,328 | |
| | |
| | Common Stocks – (continued) | |
| | Diversified Financial Services – 1.4% | |
| | 1,035 | | | Intercontinental Exchange, Inc. | | $ | 243,598 | |
| | |
| | Diversified Telecommunication Services* – 0.8% | |
| | 2,693 | | | Level 3 Communications, Inc. | | | 145,045 | |
| | |
| | Electrical Equipment – 1.6% | |
| | 2,338 | | | Generac Holdings, Inc.* | | | 115,240 | |
| | 714 | | | Hubbell, Inc. Class B | | | 81,253 | |
| | 1,690 | | | Sensata Technologies Holding NV* | | | 90,821 | |
| | | | | | | | |
| | | | | | | 287,314 | |
| | |
| | Electronic Equipment, Instruments & Components – 0.9% | |
| | 3,031 | | | Amphenol Corp. Class A | | | 171,130 | |
| | |
| | Energy Equipment & Services – 1.9% | |
| | 1,141 | | | Dril-Quip, Inc.* | | | 82,905 | |
| | 4,022 | | | Halliburton Co. | | | 172,705 | |
| | 6,508 | | | Weatherford International PLC* | | | 82,586 | |
| | | | | | | | |
| | | | | | | 338,196 | |
| | |
| | Food & Staples Retailing – 4.9% | |
| | 2,121 | | | Costco Wholesale Corp. | | | 311,702 | |
| | 3,462 | | | Walgreens Boots Alliance, Inc. | | | 287,623 | |
| | 4,869 | | | Whole Foods Market, Inc. | | | 275,050 | |
| | | | | | | | |
| | | | | | | 874,375 | |
| | |
| | Food Products – 3.6% | |
| | 2,244 | | | Freshpet, Inc.* | | | 41,357 | |
| | 1,285 | | | Keurig Green Mountain, Inc. | | | 163,940 | |
| | 2,045 | | | McCormick & Co., Inc. | | | 154,152 | |
| | 1,860 | | | The Hain Celestial Group, Inc.* | | | 116,306 | |
| | 2,146 | | | TreeHouse Foods, Inc.* | | | 179,320 | |
| | | | | | | | |
| | | | | | | 655,075 | |
| | |
| | Health Care Equipment & Supplies – 1.4% | |
| | 3,339 | | | Abbott Laboratories | | | 158,169 | |
| | 709 | | | Teleflex, Inc. | | | 86,278 | |
| | | | | | | | |
| | | | | | | 244,447 | |
| | |
| | Health Care Providers & Services – 2.5% | |
| | 1,375 | | | Acadia Healthcare Co., Inc.* | | | 86,941 | |
| | 844 | | | Henry Schein, Inc.* | | | 118,202 | |
| | 829 | | | McKesson Corp. | | | 189,592 | |
| | 1,434 | | | Surgical Care Affiliates, Inc.* | | | 46,577 | |
| | | | | | | | |
| | | | | | | 441,312 | |
| | |
| | Health Care Technology* – 1.0% | |
| | 1,454 | | | Cerner Corp. | | | 104,775 | |
| | 3,830 | | | HMS Holdings Corp. | | | 67,178 | |
| | | | | | | | |
| | | | | | | 171,953 | |
| | |
| | Hotels, Restaurants & Leisure – 4.0% | |
| | 69 | | | Chipotle Mexican Grill, Inc.* | | | 45,883 | |
| | 839 | | | Panera Bread Co. Class A* | | | 135,440 | |
| | 2,433 | | | Starbucks Corp. | | | 227,449 | |
| | |
| | |
| 66 | | The accompanying notes are an integral part of these financial statements. |
GOLDMAN SACHS FLEXIBLE CAP GROWTH FUND
| | | | | | | | |
Shares | | | Description | | Value | |
| | Common Stocks – (continued) | |
| | Hotels, Restaurants & Leisure – (continued) | |
| | 2,669 | | | Yum! Brands, Inc. | | $ | 216,482 | |
| | 2,884 | | | Zoe’s Kitchen, Inc.* | | | 98,950 | |
| | | | | | | | |
| | | | | | | 724,204 | |
| | |
| | Household Durables* – 1.0% | |
| | 2,782 | | | M/I Homes, Inc. | | | 60,564 | |
| | 3,328 | | | Toll Brothers, Inc. | | | 127,496 | |
| | | | | | | | |
| | | | | | | 188,060 | |
| | |
| | Household Products – 0.9% | |
| | 2,216 | | | Colgate-Palmolive Co. | | | 156,937 | |
| | |
| | Industrial Conglomerates – 0.8% | |
| | 1,570 | | | Danaher Corp. | | | 137,030 | |
| | |
| | Internet & Catalog Retail* – 3.1% | |
| | 796 | | | Amazon.com, Inc. | | | 302,608 | |
| | 143 | | | Netflix, Inc. | | | 67,912 | |
| | 146 | | | The Priceline Group, Inc. | | | 180,672 | |
| | | | | | | | |
| | | | | | | 551,192 | |
| | |
| | Internet Software & Services – 9.0% | |
| | 1,873 | | | Demandware, Inc.* | | | 118,355 | |
| | 2,465 | | | eBay, Inc.* | | | 142,748 | |
| | 1,062 | | | Equinix, Inc. | | | 238,074 | |
| | 2,415 | | | Facebook, Inc. Class A* | | | 190,713 | |
| | 575 | | | Google, Inc. Class A* | | | 323,512 | |
| | 577 | | | Google, Inc. Class C* | | | 322,197 | |
| | 777 | | | LinkedIn Corp. Class A* | | | 207,614 | |
| | 3,203 | | | OPOWER, Inc.* | | | 48,109 | |
| | 2,166 | | | Pandora Media, Inc.* | | | 32,057 | |
| | | | | | | | |
| | | | | | | 1,623,379 | |
| | |
| | IT Services – 2.4% | |
| | 1,090 | | | Fidelity National Information Services, Inc. | | | 73,673 | |
| | 414 | | | FleetCor Technologies, Inc.* | | | 63,520 | |
| | 669 | | | Global Payments, Inc. | | | 61,454 | |
| | 2,493 | | | MasterCard, Inc. Class A | | | 224,694 | |
| | | | | | | | |
| | | | | | | 423,341 | |
| | |
| | Life Sciences Tools & Services – 0.5% | |
| | 2,121 | | | Agilent Technologies, Inc. | | | 89,527 | |
| | |
| | Machinery – 1.1% | |
| | 1,598 | | | Graco, Inc. | | | 121,096 | |
| | 1,025 | | | IDEX Corp. | | | 79,192 | |
| | | | | | | | |
| | | | | | | 200,288 | |
| | |
| | Media – 2.1% | |
| | 3,415 | | | Comcast Corp. Class A | | | 202,783 | |
| | 5,113 | | | Twenty-First Century Fox, Inc. Class A | | | 178,955 | |
| | | | | | | | |
| | | | | | | 381,738 | |
| | |
| | Multiline Retail* – 0.7% | |
| | 2,238 | | | Burlington Stores, Inc. | | | 124,366 | |
| | |
| | Common Stocks – (continued) | |
| | Oil, Gas & Consumable Fuels – 0.6% | |
| | 1,242 | | | Anadarko Petroleum Corp. | | $ | 104,614 | |
| | |
| | Pharmaceuticals – 2.4% | |
| | 1,509 | | | AbbVie, Inc. | | | 91,295 | |
| | 3,576 | | | Mylan, Inc.* | | | 204,994 | |
| | 563 | | | Shire PLC ADR | | | 136,195 | |
| | | | | | | | |
| | | | | | | 432,484 | |
| | |
| | Professional Services* – 0.5% | |
| | 2,512 | | | TriNet Group, Inc. | | | 91,286 | |
| | |
| | Real Estate Investment Trusts – 0.8% | |
| | 1,427 | | | American Tower Corp. | | | 141,473 | |
| | |
| | Real Estate Management & Development* – 0.8% | |
| | 4,038 | | | CBRE Group, Inc. Class A | | | 138,342 | |
| | |
| | Road & Rail – 1.9% | |
| | 1,358 | | | Kansas City Southern | | | 157,311 | |
| | 3,118 | | | Roadrunner Transportation Systems, Inc.* | | | 80,039 | |
| | 3,534 | | | Swift Transportation Co.* | | | 99,941 | |
| | | | | | | | |
| | | | | | | 337,291 | |
| | |
| | Semiconductors & Semiconductor Equipment – 0.7% | |
| | 3,000 | | | Broadcom Corp. Class A | | | 135,690 | |
| | |
| | Software – 6.4% | |
| | 2,480 | | | Guidewire Software, Inc.* | | | 138,037 | |
| | 780 | | | Intuit, Inc. | | | 76,151 | |
| | 8,426 | | | Mavenir Systems, Inc.* | | | 122,767 | |
| | 6,830 | | | Oracle Corp. | | | 299,291 | |
| | 2,626 | | | Red Hat, Inc.* | | | 181,509 | |
| | 1,708 | | | ServiceNow, Inc.* | | | 130,252 | |
| | 1,423 | | | Splunk, Inc.* | | | 95,697 | |
| | 1,033 | | | Tableau Software, Inc. Class A* | | | 97,112 | |
| | | | | | | | |
| | | | | | | 1,140,816 | |
| | |
| | Specialty Retail – 4.6% | |
| | 940 | | | Advance Auto Parts, Inc. | | | 145,634 | |
| | 3,209 | | | Five Below, Inc.* | | | 101,838 | |
| | 1,384 | | | L Brands, Inc. | | | 127,134 | |
| | 1,196 | | | Restoration Hardware Holdings, Inc.* | | | 105,368 | |
| | 2,037 | | | The Home Depot, Inc. | | | 233,746 | |
| | 806 | | | Ulta Salon, Cosmetics & Fragrance, Inc.* | | | 113,452 | |
| | | | | | | | |
| | | | | | | 827,172 | |
| | |
| | Textiles, Apparel & Luxury Goods – 4.5% | |
| | 6,999 | | | Kate Spade & Co.* | | | 241,116 | |
| | 3,102 | | | NIKE, Inc. Class B | | | 301,266 | |
| | 1,478 | | | PVH Corp. | | | 157,451 | |
| | 1,325 | | | Under Armour, Inc. Class A* | | | 102,038 | |
| | | | | | | | |
| | | | | | | 801,871 | |
| | |
| | Trading Companies & Distributors – 0.4% | |
| | 286 | | | W.W. Grainger, Inc. | | | 67,756 | |
| | |
| | |
| The accompanying notes are an integral part of these financial statements. | | 67 |
GOLDMAN SACHS FLEXIBLE CAP GROWTH FUND
Schedule of Investments (continued)
February 28, 2015 (Unaudited)
| | | | | | | | |
Shares | | | Description | | Value | |
| | Common Stocks – (continued) | |
| | Wireless Telecommunication Services* – 1.3% | |
| | 1,812 | | | SBA Communications Corp. Class A | | $ | 225,974 | |
| | |
| | TOTAL COMMON STOCKS | | | | |
| | (Cost $12,704,577) | | $ | 17,717,000 | |
| | |
| | | | | | | | | | | | | | |
Principal Amount | | | Interest
Rate | | | Maturity
Date | | | Value | |
| | Short-term Investment(a) – 1.7% | |
| | Repurchase Agreement – 1.7% | |
| Joint Repurchase Agreement Account II | |
| $ | 300,000 | | | | 0.081 | % | | | 03/02/15 | | | $ | 300,000 | |
| | (Cost $300,000) | | | | | |
| | |
| | TOTAL INVESTMENTS – 100.4% | | | | | |
| | (Cost $13,004,577) | | | $ | 18,017,000 | |
| | |
| LIABILITIES IN EXCESS OF
OTHER ASSETS – (0.4)% |
| | | (73,704 | ) |
| | |
| | NET ASSETS – 100.0% | | | $ | 17,943,296 | |
| | |
| | |
| The percentage shown for each investment category reflects the value of investments in that category as a percentage of net assets. |
* | | Non-income producing security. |
(a) | | Joint repurchase agreement was entered into on February 27, 2015. Additional information appears on page 79. |
| | |
|
Investment Abbreviation: |
ADR— | | -American Depositary Receipt |
|
| | |
| 68 | | The accompanying notes are an integral part of these financial statements. |
GOLDMAN SACHS FOCUSED GROWTH FUND
Schedule of Investments
February 28, 2015 (Unaudited)
| | | | | | | | |
Shares | | | Description | | Value | |
| | Common Stocks – 98.3% | |
| | Communications Equipment – 3.0% | |
| | 13,921 | | | QUALCOMM, Inc. | | $ | 1,009,412 | |
| | |
| | Computers & Peripherals – 13.1% | |
| | 21,398 | | | Apple, Inc. | | | 2,748,787 | |
| | 56,070 | | | EMC Corp. | | | 1,622,666 | |
| | | | | | | | |
| | | | | | | 4,371,453 | |
| | |
| | Consumer Finance – 5.1% | |
| | 31,278 | | | Navient Corp. | | | 669,349 | |
| | 109,007 | | | SLM Corp.* | | | 1,032,296 | |
| | | | | | | | |
| | | | | | | 1,701,645 | |
| | |
| | Diversified Financial Services – 4.8% | |
| | 6,809 | | | Intercontinental Exchange, Inc. | | | 1,602,566 | |
| | |
| | Food & Staples Retailing – 12.5% | |
| | 10,659 | | | Costco Wholesale Corp. | | | 1,566,447 | |
| | 12,170 | | | Walgreens Boots Alliance, Inc. | | | 1,011,084 | |
| | 28,001 | | | Whole Foods Market, Inc. | | | 1,581,776 | |
| | | | | | | | |
| | | | | | | 4,159,307 | |
| | |
| | Health Care Equipment & Supplies – 4.3% | |
| | 30,061 | | | Abbott Laboratories | | | 1,423,990 | |
| | |
| | Hotels, Restaurants & Leisure – 4.5% | |
| | 18,552 | | | Yum! Brands, Inc. | | | 1,504,753 | |
| | |
| | Internet & Catalog Retail* – 9.2% | |
| | 4,059 | | | Amazon.com, Inc. | | | 1,543,069 | |
| | 1,220 | | | The Priceline Group, Inc. | | | 1,509,726 | |
| | | | | | | | |
| | | | | | | 3,052,795 | |
| | |
| | Internet Software & Services – 13.8% | |
| | 6,836 | | | Equinix, Inc. | | | 1,532,460 | |
| | 3,307 | | | Google, Inc. Class A* | | | 1,860,618 | |
| | 4,440 | | | LinkedIn Corp. Class A* | | | 1,186,368 | |
| | | | | | | | |
| | | | | | | 4,579,446 | |
| | |
| | Oil, Gas & Consumable Fuels – 2.8% | |
| | 11,102 | | | Anadarko Petroleum Corp. | | | 935,121 | |
| | |
| | Pharmaceuticals* – 4.5% | |
| | 26,031 | | | Mylan, Inc. | | | 1,492,227 | |
| | |
| | Real Estate Investment Trusts – 4.8% | |
| | 16,223 | | | American Tower Corp. | | | 1,608,348 | |
| | |
| | Road & Rail – 4.3% | |
| | 12,354 | | | Kansas City Southern | | | 1,431,087 | |
| | |
| | Textiles, Apparel & Luxury Goods – 11.6% | |
| | 31,216 | | | Kate Spade & Co.* | | | 1,075,391 | |
| | 14,035 | | | NIKE, Inc. Class B | | | 1,363,079 | |
| | 13,259 | | | PVH Corp. | | | 1,412,482 | |
| | | | | | | | |
| | | | | | | 3,850,952 | |
| | |
| | TOTAL COMMON STOCKS | | | | |
| | (Cost $28,785,606) | | $ | 32,723,102 | |
| | |
| | | | | | | | | | | | | | |
Principal Amount | | | Interest
Rate | | | Maturity
Date | | | Value | |
| | Short-term Investment(a) – 1.8% | |
| | Repurchase Agreement – 1.8% | |
| Joint Repurchase Agreement Account II | |
| $ | 600,000 | | | | 0.081 | % | | | 03/02/15 | | | $ | 600,000 | |
| | (Cost $600,000) | | | | | |
| | |
| | TOTAL INVESTMENTS – 100.1% | | | | | |
| | (Cost $29,385,606) | | | $ | 33,323,102 | |
| | |
| LIABILITIES IN EXCESS OF
OTHER ASSETS – (0.1)% |
| | | (35,082 | ) |
| | |
| | NET ASSETS – 100.0% | | | $ | 33,288,020 | |
| | |
| | |
| The percentage shown for each investment category reflects the value of investments in that category as a percentage of net assets. |
* | | Non-income producing security. |
(a) | | Joint repurchase agreement was entered into on February 27, 2015. Additional information appears on page 79. |
| | |
| The accompanying notes are an integral part of these financial statements. | | 69 |
GOLDMAN SACHS GROWTH OPPORTUNITIES FUND
Schedule of Investments
February 28, 2015 (Unaudited)
| | | | | | | | |
Shares | | | Description | | Value | |
| | Common Stocks – 98.2% | |
| | Auto Components – 1.7% | |
| | 1,486,925 | | | BorgWarner, Inc. | | $ | 91,386,411 | |
| | |
| | Automobiles* – 0.9% | |
| | 231,257 | | | Tesla Motors, Inc. | | | 47,023,798 | |
| | |
| | Beverages – 1.1% | |
| | 1,298,279 | | | Coca-Cola Enterprises, Inc. | | | 59,980,490 | |
| | |
| | Biotechnology* – 4.5% | |
| | 894,947 | | | Alkermes PLC | | | 62,870,027 | |
| | 1,277,407 | | | Cepheid, Inc. | | | 72,607,814 | |
| | 512,312 | | | Medivation, Inc. | | | 60,212,029 | |
| | 356,482 | | | Vertex Pharmaceuticals, Inc. | | | 42,574,645 | |
| | | | | | | | |
| | | | | | | 238,264,515 | |
| | |
| | Chemicals – 5.4% | |
| | 632,797 | | | Airgas, Inc. | | | 74,176,464 | |
| | 313,580 | | | Ashland, Inc. | | | 40,019,080 | |
| | 1,837,929 | | | Axalta Coating Systems Ltd.* | | | 52,197,184 | |
| | 457,953 | | | International Flavors & Fragrances, Inc. | | | 55,838,209 | |
| | 218,161 | | | The Sherwin-Williams Co. | | | 62,219,517 | |
| | | | | | | | |
| | | | | | | 284,450,454 | |
| | |
| | Commercial Banks – 2.1% | |
| | 1,993,548 | | | First Republic Bank | | | 113,632,236 | |
| | |
| | Consumer Finance – 2.6% | |
| | 3,929,107 | | | Navient Corp. | | | 84,082,890 | |
| | 5,439,533 | | | SLM Corp.* | | | 51,512,377 | |
| | | | | | | | |
| | | | | | | 135,595,267 | |
| | |
| | Distributors* – 1.3% | |
| | 2,836,704 | | | LKQ Corp. | | | 69,712,001 | |
| | |
| | Diversified Financial Services – 2.6% | |
| | 579,271 | | | Intercontinental Exchange, Inc. | | | 136,337,223 | |
| | |
| | Diversified Telecommunication Services* – 0.9% | |
| | 843,630 | | | Level 3 Communications, Inc. | | | 45,437,912 | |
| | |
| | Electrical Equipment – 5.8% | |
| | 1,442,527 | | | AMETEK, Inc. | | | 76,655,885 | |
| | 1,512,110 | | | Generac Holdings, Inc.* | | | 74,531,902 | |
| | 611,657 | | | Hubbell, Inc. Class B | | | 69,606,566 | |
| | 1,584,965 | | | Sensata Technologies Holding NV* | | | 85,176,019 | |
| | | | | | | | |
| | | | | | | 305,970,372 | |
| | |
| | Electronic Equipment, Instruments & Components – 1.6% | |
| | 1,538,576 | | | Amphenol Corp. Class A | | | 86,868,001 | |
| | |
| | Energy Equipment & Services* – 2.2% | |
| | 714,275 | | | Dril-Quip, Inc. | | | 51,899,221 | |
| | 4,983,837 | | | Weatherford International PLC | | | 63,244,892 | |
| | | | | | | | |
| | | | | | | 115,144,113 | |
| | |
| | Food & Staples Retailing – 2.0% | |
| | 1,908,839 | | | Whole Foods Market, Inc. | | | 107,830,315 | |
| | |
| | Common Stocks – (continued) | |
| | Food Products – 6.3% | |
| | 777,988 | | | Keurig Green Mountain, Inc. | | $ | 99,255,709 | |
| | 1,195,712 | | | McCormick & Co., Inc. | | | 90,132,771 | |
| | 1,012,547 | | | The Hain Celestial Group, Inc.* | | | 63,314,564 | |
| | 941,693 | | | TreeHouse Foods, Inc.* | | | 78,687,867 | |
| | | | | | | | |
| | | | | | | 331,390,911 | |
| | |
| | Health Care Equipment & Supplies – 2.2% | |
| | 119,541 | | | Intuitive Surgical, Inc.* | | | 59,770,500 | |
| | 448,345 | | | Teleflex, Inc. | | | 54,559,103 | |
| | | | | | | | |
| | | | | | | 114,329,603 | |
| | |
| | Health Care Providers & Services – 1.8% | |
| | 300,050 | | | Cardinal Health, Inc. | | | 26,401,400 | |
| | 478,463 | | | Henry Schein, Inc.* | | | 67,008,743 | |
| | | | | | | | |
| | | | | | | 93,410,143 | |
| | |
| | Health Care Technology* – 2.1% | |
| | 884,072 | | | Cerner Corp. | | | 63,706,228 | |
| | 2,800,600 | | | HMS Holdings Corp. | | | 49,122,524 | |
| | | | | | | | |
| | | | | | | 112,828,752 | |
| | |
| | Hotels, Restaurants & Leisure* – 2.6% | |
| | 74,937 | | | Chipotle Mexican Grill, Inc. | | | 49,830,857 | |
| | 537,799 | | | Panera Bread Co. Class A | | | 86,816,893 | |
| | | | | | | | |
| | | | | | | 136,647,750 | |
| | |
| | Household Durables* – 1.1% | |
| | 1,556,800 | | | Toll Brothers, Inc. | | | 59,641,008 | |
| | |
| | Internet & Catalog Retail* – 2.2% | |
| | 173,694 | | | Netflix, Inc. | | | 82,489,017 | |
| | 391,715 | | | TripAdvisor, Inc. | | | 34,960,564 | |
| | | | | | | | |
| | | | | | | 117,449,581 | |
| | |
| | Internet Software & Services – 5.3% | |
| | 474,002 | | | Equinix, Inc. | | | 106,259,398 | |
| | 423,450 | | | LinkedIn Corp. Class A* | | | 113,145,840 | |
| | 1,334,880 | | | Pandora Media, Inc.* | | | 19,756,224 | |
| | 876,623 | | | Twitter, Inc.* | | | 42,148,034 | |
| | | | | | | | |
| | | | | | | 281,309,496 | |
| | |
| | IT Services – 2.9% | |
| | 832,925 | | | Fidelity National Information Services, Inc. | | | 56,297,401 | |
| | 457,276 | | | FleetCor Technologies, Inc.* | | | 70,159,856 | |
| | 286,038 | | | Global Payments, Inc. | | | 26,275,451 | |
| | | | | | | | |
| | | | | | | 152,732,708 | |
| | |
| | Life Sciences Tools & Services – 1.8% | |
| | 1,045,244 | | | Agilent Technologies, Inc. | | | 44,119,749 | |
| | 168,566 | | | Mettler-Toledo International, Inc.* | | | 52,958,380 | |
| | | | | | | | |
| | | | | | | 97,078,129 | |
| | |
| | |
| 70 | | The accompanying notes are an integral part of these financial statements. |
GOLDMAN SACHS GROWTH OPPORTUNITIES FUND
| | | | | | | | |
Shares | | | Description | | Value | |
| | Common Stocks – (continued) | |
| | Machinery – 2.8% | |
| | 955,298 | | | Flowserve Corp. | | $ | 59,352,665 | |
| | 1,145,179 | | | Graco, Inc. | | | 86,781,664 | |
| | | | | | | | |
| | | | | | | 146,134,329 | |
| | |
| | Multiline Retail* – 1.0% | |
| | 986,913 | | | Burlington Stores, Inc. | | | 54,842,755 | |
| | |
| | Oil, Gas & Consumable Fuels – 1.8% | |
| | 617,711 | | | Pioneer Natural Resources Co. | | | 94,213,282 | |
| | |
| | Pharmaceuticals* – 2.4% | |
| | 2,223,412 | | | Mylan, Inc. | | | 127,457,093 | |
| | |
| | Real Estate Management & Development* – 1.2% | |
| | 1,843,910 | | | CBRE Group, Inc. Class A | | | 63,172,357 | |
| | |
| | Road & Rail – 2.0% | |
| | 907,036 | | | Kansas City Southern | | | 105,071,050 | |
| | |
| | Semiconductors & Semiconductor Equipment – 1.0% | |
| | 1,192,458 | | | Broadcom Corp. Class A | | | 53,934,875 | |
| | |
| | Software – 5.3% | |
| | 1,157,475 | | | Guidewire Software, Inc.* | | | 64,425,059 | |
| | 580,661 | | | Intuit, Inc. | | | 56,689,934 | |
| | 1,148,319 | | | Red Hat, Inc.* | | | 79,371,809 | |
| | 1,014,913 | | | ServiceNow, Inc.* | | | 77,397,265 | |
| | | | | | | | |
| | | | | | | 277,884,067 | |
| | |
| | Specialty Retail – 6.5% | |
| | 607,532 | | | Advance Auto Parts, Inc. | | | 94,124,933 | |
| | 1,845,757 | | | Five Below, Inc.* | | | 58,575,098 | |
| | 574,948 | | | L Brands, Inc. | | | 52,814,723 | |
| | 506,118 | | | Restoration Hardware Holdings, Inc.* | | | 44,588,996 | |
| | 676,147 | | | Ulta Salon, Cosmetics & Fragrance, Inc.* | | | 95,174,452 | |
| | | | | | | | |
| | | | | | | 345,278,202 | |
| | |
| | Textiles, Apparel & Luxury Goods – 6.9% | |
| | 3,368,158 | | | Kate Spade & Co.* | | | 116,033,043 | |
| | 875,874 | | | PVH Corp. | | | 93,306,857 | |
| | 870,690 | | | Under Armour, Inc. Class A* | | | 67,051,837 | |
| | 1,173,112 | | | VF Corp. | | | 89,930,766 | |
| | | | | | | | |
| | | | | | | 366,322,503 | |
| | |
| | Trading Companies & Distributors – 2.2% | |
| | 498,655 | | | W.W. Grainger, Inc. | | | 118,136,356 | |
| | |
| | Wireless Telecommunication Services* – 2.1% | |
| | 902,211 | | | SBA Communications Corp. Class A | | | 112,514,734 | |
| | |
| | TOTAL COMMON STOCKS | | | | |
| | (Cost $4,002,595,954) | | $ | 5,199,412,792 | |
| | |
| | | | | | | | |
| | Investment Company(a) – 2.7% | |
| | 142,354,684 | | | Goldman Sachs Financial Square Government Fund – Instiutional Shares | | $ | 142,354,684 | |
| | (Cost $142,354,684) | | | | |
| | |
| | TOTAL INVESTMENTS – 100.9% | | | | |
| | (Cost $4,144,950,638) | | $ | 5,341,767,476 | |
| | |
| LIABILITIES IN EXCESS OF
OTHER ASSETS – (0.9)% | | | (46,514,945 | ) |
| | |
| | NET ASSETS – 100.0% | | $ | 5,295,252,531 | |
| | |
| | |
| The percentage shown for each investment category reflects the value of investments in that category as a percentage of net assets. |
* | | Non-income producing security. |
(a) | | Represents an Affiliated Fund. |
| | |
| The accompanying notes are an integral part of these financial statements. | | 71 |
GOLDMAN SACHS SMALL/MID CAP GROWTH FUND
Schedule of Investments
February 28, 2015 (Unaudited)
| | | | | | | | |
Shares | | | Description | | Value | |
| | Common Stocks – 98.2% | |
| | Aerospace & Defense* – 0.7% | |
| | 598,881 | | | Aerovironment, Inc. | | $ | 16,415,328 | |
| | |
| | Auto Components – 0.9% | |
| | 391,037 | | | BorgWarner, Inc. | | | 24,033,134 | |
| | |
| | Biotechnology* – 8.2% | |
| | 1,023,072 | | | Achillion Pharmaceuticals, Inc. | | | 12,420,094 | |
| | 326,655 | | | Alder Biopharmaceuticals, Inc. | | | 8,780,487 | |
| | 481,704 | | | Alkermes PLC | | | 33,839,706 | |
| | 887,465 | | | Amicus Therapeutics, Inc. | | | 7,774,193 | |
| | 170,014 | | | Bluebird Bio, Inc. | | | 16,205,735 | |
| | 575,983 | | | Cepheid, Inc. | | | 32,738,874 | |
| | 206,192 | | | Clovis Oncology, Inc. | | | 15,765,440 | |
| | 213,390 | | | Forward Pharma A/S ADR | | | 4,967,719 | |
| | 267,820 | | | Medivation, Inc. | | | 31,476,885 | |
| | 196,736 | | | Ophthotech Corp. | | | 10,571,609 | |
| | 207,088 | | | Otonomy, Inc. | | | 7,678,823 | |
| | 412,260 | | | Stemline Therapeutics, Inc. | | | 6,262,229 | |
| | 99,889 | | | Synageva BioPharma Corp. | | | 9,862,041 | |
| | 170,222 | | | Ultragenyx Pharmaceutical, Inc. | | | 9,237,948 | |
| | | | | | | | |
| | | | | | | 207,581,783 | |
| | |
| | Chemicals – 4.1% | |
| | 265,666 | | | Airgas, Inc. | | | 31,141,369 | |
| | 150,279 | | | Ashland, Inc. | | | 19,178,606 | |
| | 1,133,975 | | | Axalta Coating Systems Ltd.* | | | 32,204,890 | |
| | 183,013 | | | International Flavors & Fragrances, Inc. | | | 22,314,775 | |
| | | | | | | | |
| | | | | | | 104,839,640 | |
| | |
| | Commercial Banks – 4.3% | |
| | 1,053,229 | | | Eagle Bancorp, Inc.* | | | 39,127,458 | |
| | 906,431 | | | First Republic Bank | | | 51,666,567 | |
| | 519,933 | | | Independent Bank Group, Inc. | | | 18,753,983 | |
| | | | | | | | |
| | | | | | | 109,548,008 | |
| | |
| | Commercial Services & Supplies – 4.0% | |
| | 1,502,902 | | | Healthcare Services Group, Inc. | | | 50,452,420 | |
| | 1,208,786 | | | Interface, Inc. | | | 24,405,389 | |
| | 73,395 | | | Stericycle, Inc.* | | | 9,906,123 | |
| | 379,919 | | | Waste Connections, Inc. | | | 17,844,796 | |
| | | | | | | | |
| | | | | | | 102,608,728 | |
| | |
| | Computers & Peripherals* – 1.6% | |
| | 1,013,720 | | | Electronics for Imaging, Inc. | | | 41,157,032 | |
| | |
| | Consumer Finance – 2.8% | |
| | 1,961,927 | | | Navient Corp. | | | 41,985,238 | |
| | 3,001,125 | | | SLM Corp.* | | | 28,420,654 | |
| | | | | | | | |
| | | | | | | 70,405,892 | |
| | |
| | Containers & Packaging – 0.8% | |
| | 389,481 | | | Avery Dennison Corp. | | | 20,856,708 | |
| | |
| | Distributors* – 1.2% | |
| | 1,265,073 | | | LKQ Corp. | | | 31,089,169 | |
| | |
| | Diversified Telecommunication Services* – 1.0% | |
| | 475,361 | | | Level 3 Communications, Inc. | | | 25,602,943 | |
| | |
| | Common Stocks – (continued) | |
| | Electrical Equipment – 3.9% | |
| | 667,317 | | | Generac Holdings, Inc.* | | $ | 32,892,055 | |
| | 295,755 | | | Hubbell, Inc. Class B | | | 33,656,919 | |
| | 631,281 | | | Sensata Technologies Holding NV* | | | 33,925,041 | |
| | | | | | | | |
| | | | | | | 100,474,015 | |
| | |
| | Electronic Equipment, Instruments & Components – 2.2% | |
| | 572,249 | | | Amphenol Corp. Class A | | | 32,309,178 | |
| | 251,521 | | | IPG Photonics Corp.* | | | 24,120,864 | |
| | | | | | | | |
| | | | | | | 56,430,042 | |
| | |
| | Energy Equipment & Services* – 1.6% | |
| | 414,631 | | | Dril-Quip, Inc. | | | 30,127,089 | |
| | 736,070 | | | Weatherford International PLC | | | 9,340,728 | |
| | | | | | | | |
| | | | | | | 39,467,817 | |
| | |
| | Food & Staples Retailing* – 1.4% | |
| | 930,820 | | | Sprouts Farmers Market, Inc. | | | 34,263,484 | |
| | |
| | Food Products – 4.7% | |
| | 480,223 | | | Freshpet, Inc.* | | | 8,850,510 | |
| | 427,374 | | | McCormick & Co., Inc. | | | 32,215,452 | |
| | 647,697 | | | The Hain Celestial Group, Inc.* | | | 40,500,493 | |
| | 455,375 | | | TreeHouse Foods, Inc.* | | | 38,051,135 | |
| | | | | | | | |
| | | | | | | 119,617,590 | |
| | |
| | Health Care Equipment & Supplies – 2.7% | |
| | 421,625 | | | DexCom, Inc.* | | | 25,609,503 | |
| | 218,725 | | | Teleflex, Inc. | | | 26,616,645 | |
| | 671,585 | | | Tornier NV* | | | 16,413,537 | |
| | | | | | | | |
| | | | | | | 68,639,685 | |
| | |
| | Health Care Providers & Services* – 3.8% | |
| | 465,222 | | | Acadia Healthcare Co., Inc. | | | 29,415,987 | |
| | 336,039 | | | Adeptus Health, Inc. Class A | | | 14,903,330 | |
| | 168,326 | | | Henry Schein, Inc. | | | 23,574,056 | |
| | 160,680 | | | MEDNAX, Inc. | | | 11,483,800 | |
| | 565,551 | | | Surgical Care Affiliates, Inc. | | | 18,369,096 | |
| | | | | | | | |
| | | | | | | 97,746,269 | |
| | |
| | Health Care Technology* – 1.1% | |
| | 1,517,463 | | | HMS Holdings Corp. | | | 26,616,301 | |
| | |
| | Hotels, Restaurants & Leisure – 4.4% | |
| | 652,619 | | | Bloomin’ Brands, Inc.* | | | 16,811,465 | |
| | 646,613 | | | Chuy’s Holdings, Inc.* | | | 14,529,394 | |
| | 248,695 | | | Jack in the Box, Inc. | | | 24,046,320 | |
| | 244,985 | | | Panera Bread Co. Class A* | | | 39,547,929 | |
| | 10,915 | | | Shake Shack, Inc. Class A* | | | 470,982 | |
| | 474,671 | | | Zoe’s Kitchen, Inc.* | | | 16,285,962 | |
| | | | | | | | |
| | | | | | | 111,692,052 | |
| | |
| | Household Durables*(a) – 1.1% | |
| | 1,283,071 | | | M/I Homes, Inc. | | | 27,932,456 | |
| | |
| | Internet Software & Services – 3.3% | |
| | 355,756 | | | Demandware, Inc.* | | | 22,480,222 | |
| | 186,203 | | | Equinix, Inc. | | | 41,742,058 | |
| | |
| | |
| 72 | | The accompanying notes are an integral part of these financial statements. |
GOLDMAN SACHS SMALL/MID CAP GROWTH FUND
| | | | | | | | |
Shares | | | Description | | Value | |
| | Common Stocks – (continued) | |
| | Internet Software & Services – (continued) | |
| | 547,114 | | | OPOWER, Inc.* | | $ | 8,217,652 | |
| | 850,599 | | | Pandora Media, Inc.* | | | 12,588,865 | |
| | | | | | | | |
| | | | | | | 85,028,797 | |
| | |
| | IT Services – 3.6% | |
| | 887,781 | | | EVERTEC, Inc. | | | 18,510,234 | |
| | 189,655 | | | FleetCor Technologies, Inc.* | | | 29,098,767 | |
| | 133,145 | | | Global Payments, Inc. | | | 12,230,700 | |
| | 992,728 | | | InterXion Holding NV* | | | 31,638,241 | |
| | | | | | | | |
| | | | | | | 91,477,942 | |
| | |
| | Life Sciences Tools & Services – 2.2% | |
| | 628,812 | | | Bruker Corp.* | | | 11,966,292 | |
| | 63,398 | | | Mettler-Toledo International, Inc.* | | | 19,917,750 | |
| | 499,703 | | | PerkinElmer, Inc. | | | 23,486,041 | |
| | | | | | | | |
| | | | | | | 55,370,083 | |
| | |
| | Machinery – 3.6% | |
| | 415,698 | | | Flowserve Corp. | | | 25,827,317 | |
| | 546,526 | | | Graco, Inc. | | | 41,415,740 | |
| | 318,120 | | | IDEX Corp. | | | 24,577,951 | |
| | | | | | | | |
| | | | | | | 91,821,008 | |
| | |
| | Media* – 0.4% | |
| | 144,835 | | | AMC Networks, Inc. Class A | | | 10,431,017 | |
| | 356,277 | | | RLJ Entertainment, Inc. | | | 609,233 | |
| | | | | | | | |
| | | | | | | 11,040,250 | |
| | |
| | Multiline Retail* – 1.6% | |
| | 732,969 | | | Burlington Stores, Inc. | | | 40,731,087 | |
| | |
| | Pharmaceuticals* – 1.6% | |
| | 250,019 | | | Aerie Pharmaceuticals, Inc. | | | 7,030,534 | |
| | 663,544 | | | Cempra, Inc. | | | 21,976,577 | |
| | 885,667 | | | Corium International, Inc. | | | 6,075,676 | |
| | 391,713 | | | Revance Therapeutics, Inc. | | | 6,286,994 | |
| | | | | | | | |
| | | | | | | 41,369,781 | |
| | |
| | Professional Services* – 1.6% | |
| | 519,321 | | | The Advisory Board Co. | | | 28,105,652 | |
| | 375,414 | | | TriNet Group, Inc. | | | 13,642,545 | |
| | | | | | | | |
| | | | | | | 41,748,197 | |
| | |
| | Real Estate Management & Development* – 1.0% | |
| | 721,405 | | | CBRE Group, Inc. Class A | | | 24,715,335 | |
| | |
| | Road & Rail – 2.9% | |
| | 87,837 | | | Kansas City Southern | | | 10,175,038 | |
| | 1,330,408 | | | Roadrunner Transportation Systems, Inc.* | | | 34,151,574 | |
| | 1,024,951 | | | Swift Transportation Co.* | | | 28,985,614 | |
| | | | | | | | |
| | | | | | | 73,312,226 | |
| | |
| | Software* – 7.5% | |
| | 624,643 | | | Guidewire Software, Inc. | | | 34,767,629 | |
| | 1,632,920 | | | Mavenir Systems, Inc.(a) | | | 23,791,644 | |
| | 267,780 | | | NetSuite, Inc. | | | 25,819,348 | |
| | |
| | Common Stocks – (continued) | |
| | Software* – (continued) | |
| | 506,459 | | | Red Hat, Inc. | | $ | 35,006,446 | |
| | 497,115 | | | ServiceNow, Inc. | | | 37,909,990 | |
| | 311,561 | | | Splunk, Inc. | | | 20,952,477 | |
| | 148,688 | | | Tableau Software, Inc. Class A | | | 13,978,159 | |
| | | | | | | | |
| | | | | | | 192,225,693 | |
| | |
| | Specialty Retail – 5.4% | |
| | 212,666 | | | Advance Auto Parts, Inc. | | | 32,948,344 | |
| | 949,441 | | | Five Below, Inc.* | | | 30,130,510 | |
| | 378,381 | | | Restoration Hardware Holdings, Inc.* | | | 33,335,366 | |
| | 291,449 | | | Ulta Salon, Cosmetics & Fragrance, Inc.* | | | 41,024,361 | |
| | | | | | | | |
| | | | | | | 137,438,581 | |
| | |
| | Textiles, Apparel & Luxury Goods – 4.8% | |
| | 1,517,008 | | | Kate Spade & Co.* | | | 52,260,925 | |
| | 343,520 | | | PVH Corp. | | | 36,595,186 | |
| | 432,965 | | | Under Armour, Inc. Class A* | | | 33,342,635 | |
| | | | | | | | |
| | | | | | | 122,198,746 | |
| | |
| | Thrifts & Mortgage Finance* – 0.5% | |
| | 1,450,429 | | | MGIC Investment Corp. | | | 13,242,417 | |
| | |
| | Wireless Telecommunication Services* – 1.7% | |
| | 345,740 | | | SBA Communications Corp. Class A | | | 43,117,235 | |
| | |
| | TOTAL COMMON STOCKS | | | | |
| | (Cost $1,891,485,934) | | $ | 2,501,855,454 | |
| | |
| | | | | | | | | | | | | | |
Principal Amount | | | Interest
Rate | | | Maturity
Date | | | Value | |
| | Short-term Investment(b) – 3.2% | |
| | Repurchase Agreement – 3.2% | |
| Joint Repurchase Agreement Account II | |
| $ | 81,400,000 | | | | 0.081 | % | | | 03/02/15 | | | $ | 81,400,000 | |
| | (Cost $81,400,000) | |
| | |
| | TOTAL INVESTMENTS – 101.4% | | | | | |
| | (Cost $1,972,885,934) | | | $ | 2,583,255,454 | |
| | |
| LIABILITIES IN EXCESS OF
OTHER ASSETS – (1.4)% |
| | | (35,003,861 | ) |
| | |
| | NET ASSETS – 100.0% | | | $ | 2,548,251,593 | |
| | |
| | |
| The percentage shown for each investment category reflects the value of investments in that category as a percentage of net assets. |
* | | Non-income producing security. |
(a) | | Represents an Affiliated Issuer. |
(b) | | Joint repurchase agreement was entered into on February 27, 2015. Additional information appears on page 79. |
| | |
|
Investment Abbreviation: |
ADR | | —American Depositary Receipt |
|
| | |
| The accompanying notes are an integral part of these financial statements. | | 73 |
GOLDMAN SACHS STRATEGIC GROWTH FUND
Schedule of Investments
February 28, 2015 (Unaudited)
| | | | | | | | |
Shares | | | Description | | Value | |
| | Common Stocks – 98.2% | |
| | Aerospace & Defense – 3.7% | |
| | 80,915 | | | Honeywell International, Inc. | | $ | 8,316,444 | |
| | 32,876 | | | Precision Castparts Corp. | | | 7,111,079 | |
| | | | | | | | |
| | | | | | | 15,427,523 | |
| | |
| | Auto Components – 0.7% | |
| | 50,438 | | | BorgWarner, Inc. | | | 3,099,920 | |
| | |
| | Beverages – 2.0% | |
| | 38,780 | | | Coca-Cola Enterprises, Inc. | | | 1,791,636 | |
| | 148,371 | | | The Coca-Cola Co. | | | 6,424,464 | |
| | | | | | | | |
| | | | | | | 8,216,100 | |
| | |
| | Biotechnology – 4.4% | |
| | 22,380 | | | Amgen, Inc. | | | 3,529,774 | |
| | 15,239 | | | Biogen Idec, Inc.* | | | 6,241,742 | |
| | 39,267 | | | Celgene Corp.* | | | 4,772,118 | |
| | 38,611 | | | Gilead Sciences, Inc.* | | | 3,997,397 | |
| | | | | | | | |
| | | | | | | 18,541,031 | |
| | |
| | Chemicals – 1.9% | |
| | 29,615 | | | Airgas, Inc. | | | 3,471,471 | |
| | 15,231 | | | The Sherwin-Williams Co. | | | 4,343,881 | |
| | | | | | | | |
| | | | | | | 7,815,352 | |
| | |
| | Commercial Banks – 1.1% | |
| | 78,478 | | | First Republic Bank | | | 4,473,246 | |
| | |
| | Communications Equipment – 1.9% | |
| | 112,216 | | | QUALCOMM, Inc. | | | 8,136,782 | |
| | |
| | Computers & Peripherals – 8.8% | |
| | 228,498 | | | Apple, Inc. | | | 29,352,853 | |
| | 273,538 | | | EMC Corp. | | | 7,916,190 | |
| | | | | | | | |
| | | | | | | 37,269,043 | |
| | |
| | Consumer Finance – 1.5% | |
| | 34,667 | | | American Express Co. | | | 2,828,480 | |
| | 164,209 | | | Navient Corp. | | | 3,514,073 | |
| | | | | | | | |
| | | | | | | 6,342,553 | |
| | |
| | Diversified Financial Services – 1.9% | |
| | 33,138 | | | Intercontinental Exchange, Inc. | | | 7,799,360 | |
| | |
| | Energy Equipment & Services – 1.2% | |
| | 118,663 | | | Halliburton Co. | | | 5,095,389 | |
| | |
| | Food & Staples Retailing – 5.7% | |
| | 70,550 | | | Costco Wholesale Corp. | | | 10,368,028 | |
| | 77,054 | | | Walgreens Boots Alliance, Inc. | | | 6,401,646 | |
| | 131,353 | | | Whole Foods Market, Inc. | | | 7,420,131 | |
| | | | | | | | |
| | | | | | | 24,189,805 | |
| | |
| | Food Products – 3.8% | |
| | 26,672 | | | Keurig Green Mountain, Inc. | | | 3,402,814 | |
| | 48,039 | | | McCormick & Co., Inc. | | | 3,621,180 | |
| | |
| | Common Stocks – (continued) | |
| | Food Products – (continued) | |
| | 70,662 | | | The Hain Celestial Group, Inc.* | | $ | 4,418,495 | |
| | 46,015 | | | The Hershey Co. | | | 4,775,436 | |
| | | | | | | | |
| | | | | | | 16,217,925 | |
| | |
| | Health Care Equipment & Supplies – 1.2% | |
| | 109,011 | | | Abbott Laboratories | | | 5,163,851 | |
| | |
| | Health Care Providers & Services – 1.6% | |
| | 30,027 | | | McKesson Corp. | | | 6,867,175 | |
| | |
| | Health Care Technology* – 1.2% | |
| | 72,686 | | | Cerner Corp. | | | 5,237,753 | |
| | |
| | Hotels, Restaurants & Leisure – 4.0% | |
| | 60,766 | | | Las Vegas Sands Corp. | | | 3,457,585 | |
| | 64,871 | | | Starbucks Corp. | | | 6,064,466 | |
| | 88,075 | | | Yum! Brands, Inc. | | | 7,143,763 | |
| | | | | | | | |
| | | | | | | 16,665,814 | |
| | |
| | Household Durables* – 0.8% | |
| | 89,443 | | | Toll Brothers, Inc. | | | 3,426,561 | |
| | |
| | Household Products – 1.2% | |
| | 68,451 | | | Colgate-Palmolive Co. | | | 4,847,700 | |
| | |
| | Industrial Conglomerates – 1.1% | |
| | 51,282 | | | Danaher Corp. | | | 4,475,893 | |
| | |
| | Internet & Catalog Retail* – 5.2% | |
| | 28,977 | | | Amazon.com, Inc. | | | 11,015,897 | |
| | 8,154 | | | Netflix, Inc. | | | 3,872,416 | |
| | 5,717 | | | The Priceline Group, Inc. | | | 7,074,673 | |
| | | | | | | | |
| | | | | | | 21,962,986 | |
| | |
| | Internet Software & Services – 10.7% | |
| | 82,358 | | | eBay, Inc.* | | | 4,769,352 | |
| | 37,018 | | | Equinix, Inc. | | | 8,298,510 | |
| | 101,738 | | | Facebook, Inc. Class A* | | | 8,034,250 | |
| | 16,907 | | | Google, Inc. Class A* | | | 9,512,385 | |
| | 13,945 | | | Google, Inc. Class C* | | | 7,786,888 | |
| | 25,116 | | | LinkedIn Corp. Class A* | | | 6,710,995 | |
| | | | | | | | |
| | | | | | | 45,112,380 | |
| | |
| | IT Services – 3.0% | |
| | 26,822 | | | FleetCor Technologies, Inc.* | | | 4,115,299 | |
| | 19,456 | | | International Business Machines Corp. | | | 3,150,705 | |
| | 58,202 | | | MasterCard, Inc. Class A | | | 5,245,746 | |
| | | | | | | | |
| | | | | | | 12,511,750 | |
| | |
| | Life Sciences Tools & Services – 0.6% | |
| | 63,296 | | | Agilent Technologies, Inc. | | | 2,671,724 | |
| | |
| | Machinery – 1.3% | |
| | 16,551 | | | Cummins, Inc. | | | 2,354,049 | |
| | 44,441 | | | Ingersoll-Rand PLC | | | 2,985,991 | |
| | | | | | | | |
| | | | | | | 5,340,040 | |
| | |
| | |
| 74 | | The accompanying notes are an integral part of these financial statements. |
GOLDMAN SACHS STRATEGIC GROWTH FUND
| | | | | | | | |
Shares | | | Description | | Value | |
| | Common Stocks – (continued) | |
| | Media – 3.2% | |
| | 126,367 | | | Comcast Corp. Class A | | $ | 7,503,673 | |
| | 174,331 | | | Twenty-First Century Fox, Inc. Class A | | | 6,101,585 | |
| | | | | | | | |
| | | | | | | 13,605,258 | |
| | |
| | Oil, Gas & Consumable Fuels – 2.1% | |
| | 52,883 | | | Anadarko Petroleum Corp. | | | 4,454,335 | |
| | 29,727 | | | Pioneer Natural Resources Co. | | | 4,533,962 | |
| | | | | | | | |
| | | | | | | 8,988,297 | |
| | |
| | Pharmaceuticals – 4.6% | |
| | 48,939 | | | AbbVie, Inc. | | | 2,960,810 | |
| | 22,972 | | | Actavis PLC* | | | 6,693,122 | |
| | 121,887 | | | Mylan, Inc.* | | | 6,987,172 | |
| | 11,546 | | | Shire PLC ADR | | | 2,793,093 | |
| | | | | | | | |
| | | | | | | 19,434,197 | |
| | |
| | Real Estate Investment Trusts – 2.3% | |
| | 99,545 | | | American Tower Corp. | | | 9,868,891 | |
| | |
| | Real Estate Management & Development* – 1.0% | |
| | 121,531 | | | CBRE Group, Inc. Class A | | | 4,163,652 | |
| | |
| | Road & Rail – 1.2% | |
| | 43,016 | | | Kansas City Southern | | | 4,982,973 | |
| | |
| | Software – 5.4% | |
| | 35,231 | | | Intuit, Inc. | | | 3,439,603 | |
| | 123,799 | | | Microsoft Corp. | | | 5,428,586 | |
| | 206,550 | | | Oracle Corp. | | | 9,051,021 | |
| | 65,208 | | | ServiceNow, Inc.* | | | 4,972,762 | |
| | | | | | | | |
| | | | | | | 22,891,972 | |
| | |
| | Specialty Retail – 2.9% | |
| | 13,901 | | | Advance Auto Parts, Inc. | | | 2,153,682 | |
| | 47,533 | | | L Brands, Inc. | | | 4,366,381 | |
| | 51,057 | | | The Home Depot, Inc. | | | 5,858,791 | |
| | | | | | | | |
| | | | | | | 12,378,854 | |
| | |
| | Textiles, Apparel & Luxury Goods – 4.0% | |
| | 112,403 | | | Kate Spade & Co.* | | | 3,872,283 | |
| | 86,969 | | | NIKE, Inc. Class B | | | 8,446,429 | |
| | 43,897 | | | PVH Corp. | | | 4,676,348 | |
| | | | | | | | |
| | | | | | | 16,995,060 | |
| | |
| | Trading Companies & Distributors – 1.0% | |
| | 18,219 | | | W.W. Grainger, Inc. | | | 4,316,263 | |
| | |
| | TOTAL COMMON STOCKS | | | | |
| | (Cost $302,516,942) | | $ | 414,533,073 | |
| | |
| | | | | | | | | | | | | | |
Principal Amount | | | Interest
Rate | | | Maturity
Date | | | Value | |
| | Short-term Investment(a) – 1.7% | |
| | Repurchase Agreement – 1.7% | |
| Joint Repurchase Agreement Account II | |
| $ | 7,000,000 | | | | 0.081 | % | | | 03/02/15 | | | $ | 7,000,000 | |
| | (Cost $7,000,000) | | | | | |
| | |
| | TOTAL INVESTMENTS – 99.9% | | | | | |
| | (Cost $309,516,942) | | | $ | 421,533,073 | |
| | |
| OTHER ASSETS IN EXCESS OF
LIABILITIES – 0.1% |
| | | 553,593 | |
| | |
| | NET ASSETS – 100.0% | | | $ | 422,086,666 | |
| | |
| | |
| The percentage shown for each investment category reflects the value of investments in that category as a percentage of net assets. |
* | | Non-income producing security. |
(a) | | Joint repurchase agreement was entered into on February 27, 2015. Additional information appears on page 79. |
| | |
|
Investment Abbreviation: |
ADR | | —American Depositary Receipt |
|
| | |
| The accompanying notes are an integral part of these financial statements. | | 75 |
GOLDMAN SACHS TECHNOLOGY TOLLKEEPER FUND
Schedule of Investments
February 28, 2015 (Unaudited)
| | | | | | | | |
Shares | | | Description | | Value | |
| | | | | | | | |
| | Common Stocks – 98.7% | |
| | Automobiles* – 0.8% | |
| | 16,294 | | | Tesla Motors, Inc. | | $ | 3,313,222 | |
| | |
| | Communications Equipment – 5.0% | |
| | 303,283 | | | QUALCOMM, Inc. | | | 21,991,050 | |
| | |
| | Computers & Peripherals – 15.3% | |
| | 322,802 | | | Apple, Inc. | | | 41,467,145 | |
| | 177,375 | | | Electronics for Imaging, Inc.* | | | 7,201,425 | |
| | 621,507 | | | EMC Corp. | | | 17,986,412 | |
| | | | | | | | |
| | | | | | | 66,654,982 | |
| | |
| | Diversified Financial Services – 2.7% | |
| | 50,983 | | | Intercontinental Exchange, Inc. | | | 11,999,359 | |
| | |
| | Diversified Telecommunication Services* – 2.0% | |
| | 162,536 | | | Level 3 Communications, Inc. | | | 8,754,189 | |
| | |
| | Electronic Equipment, Instruments & Components – 3.0% | |
| | 235,423 | | | Amphenol Corp. Class A | | | 13,291,983 | |
| | |
| | Internet & Catalog Retail* – 5.8% | |
| | 40,072 | | | Amazon.com, Inc. | | | 15,233,771 | |
| | 8,156 | | | The Priceline Group, Inc. | | | 10,092,887 | |
| | | | | | | | |
| | | | | | | 25,326,658 | |
| | |
| | Internet Software & Services – 22.1% | |
| | 95,071 | | | Demandware, Inc.* | | | 6,007,537 | |
| | 114,015 | | | eBay, Inc.* | | | 6,602,609 | |
| | 55,240 | | | Equinix, Inc. | | | 12,383,427 | |
| | 150,757 | | | Facebook, Inc. Class A* | | | 11,905,280 | |
| | 28,808 | | | Google, Inc. Class A* | | | 16,208,245 | |
| | 25,725 | | | Google, Inc. Class C* | | | 14,364,840 | |
| | 75,206 | | | LinkedIn Corp. Class A* | | | 20,095,043 | |
| | 222,245 | | | Pandora Media, Inc.* | | | 3,289,226 | |
| | 126,632 | | | Yahoo!, Inc.* | | | 5,607,265 | |
| | | | | | | | |
| | | | | | | 96,463,472 | |
| | |
| | IT Services – 6.7% | |
| | 178,746 | | | Cognizant Technology Solutions Corp. Class A* | | | 11,168,944 | |
| | 87,738 | | | Fidelity National Information Services, Inc. | | | 5,930,212 | |
| | 44,868 | | | FleetCor Technologies, Inc.* | | | 6,884,097 | |
| | 59,526 | | | Global Payments, Inc. | | | 5,468,058 | |
| | | | | | | | |
| | | | | | | 29,451,311 | |
| | |
| | Real Estate Investment Trusts – 3.6% | |
| | 156,696 | | | American Tower Corp. | | | 15,534,841 | |
| | |
| | Semiconductors & Semiconductor Equipment – 4.5% | |
| | 345,294 | | | Applied Materials, Inc. | | | 8,649,615 | |
| | 242,234 | | | Broadcom Corp. Class A | | | 10,956,244 | |
| | | | | | | | |
| | | | | | | 19,605,859 | |
| | |
| | Software – 23.7% | |
| | 145,343 | | | Adobe Systems, Inc.* | | | 11,496,631 | |
| | 218,324 | | | Guidewire Software, Inc.* | | | 12,151,914 | |
| | 71,357 | | | Intuit, Inc. | | | 6,966,584 | |
| | |
| | Common Stocks – (continued) | |
| | Software – (continued) | |
| | 371,870 | | | Oracle Corp. | | $ | 16,295,344 | |
| | 134,557 | | | Red Hat, Inc.* | | | 9,300,580 | |
| | 189,187 | | | Salesforce.com, Inc.* | | | 13,125,794 | |
| | 197,755 | | | ServiceNow, Inc.* | | | 15,080,796 | |
| | 76,136 | | | Splunk, Inc.* | | | 5,120,146 | |
| | 96,233 | | | VMware, Inc. Class A* | | | 8,186,541 | |
| | 65,978 | | | Workday, Inc. Class A* | | | 5,641,119 | |
| | | | | | | | |
| | | | | | | 103,365,449 | |
| | |
| | Wireless Telecommunication Services* – 3.5% | |
| | 120,810 | | | SBA Communications Corp. Class A | | | 15,066,215 | |
| | |
| | TOTAL COMMON STOCKS | | | | |
| | (Cost $277,245,692) | | $ | 430,818,590 | |
| | |
| | | | | | | | | | | | | | |
Principal Amount | | | Interest
Rate | | | Maturity
Date | | | Value | |
| | Short-term Investment(a) – 0.6% | |
| | Repurchase Agreement – 0.6% | |
| Joint Repurchase Agreement Account II | |
| $ | 2,700,000 | | | | 0.081 | % | | | 03/02/15 | | | $ | 2,700,000 | |
| | (Cost $2,700,000) | | | | | |
| | |
| | TOTAL INVESTMENTS – 99.3% | | | | | |
| | (Cost $279,945,692) | | | $ | 433,518,590 | |
| | |
| OTHER ASSETS IN EXCESS OF
LIABILITIES – 0.7% |
| | | 2,865,138 | |
| | |
| | NET ASSETS – 100.0% | | | $ | 436,383,728 | |
| | |
| | |
| The percentage shown for each investment category reflects the value of investments in that category as a percentage of net assets. |
* | | Non-income producing security. |
(a) | | Joint repurchase agreement was entered into on February 27, 2015. Additional information appears on page 79. |
| | |
| 76 | | The accompanying notes are an integral part of these financial statements. |
GOLDMAN SACHS U.S. EQUITY FUND
Schedule of Investments
February 28, 2015 (Unaudited)
| | | | | | | | |
Shares | | | Description | | Value | |
| | Common Stocks – 95.8% | |
| | Aerospace & Defense – 1.5% | |
| | 1,413 | | | The Boeing Co. | | $ | 213,151 | |
| | |
| | Automobiles – 1.4% | |
| | 5,226 | | | General Motors Co. | | | 194,982 | |
| | |
| | Biotechnology* – 1.4% | |
| | 495 | | | Biogen Idec, Inc. | | | 202,747 | |
| | |
| | Commercial Banks – 9.1% | |
| | 31,692 | | | Bank of America Corp. | | | 501,051 | |
| | 4,158 | | | Citigroup, Inc. | | | 217,962 | |
| | 8,922 | | | JPMorgan Chase & Co. | | | 546,740 | |
| | 1,114 | | | SunTrust Banks, Inc. | | | 45,674 | |
| | | | | | | | |
| | | | | | | 1,311,427 | |
| | |
| | Communications Equipment – 1.6% | |
| | 3,176 | | | QUALCOMM, Inc. | | | 230,292 | |
| | |
| | Computers & Peripherals – 6.0% | |
| | 4,506 | | | Apple, Inc. | | | 578,841 | |
| | 9,962 | | | EMC Corp. | | | 288,300 | |
| | | | | | | | |
| | | | | | | 867,141 | |
| | |
| | Diversified Financial Services – 2.2% | |
| | 1,323 | | | Intercontinental Exchange, Inc. | | | 311,381 | |
| | |
| | Diversified Telecommunication Services – 2.1% | |
| | 5,991 | | | Verizon Communications, Inc. | | | 296,255 | |
| | |
| | Electric Utilities – 1.4% | |
| | 5,895 | | | FirstEnergy Corp. | | | 206,207 | |
| | |
| | Food & Staples Retailing – 7.3% | |
| | 1,958 | | | Costco Wholesale Corp. | | | 287,748 | |
| | 1,233 | | | Wal-Mart Stores, Inc. | | | 103,486 | |
| | 3,588 | | | Walgreens Boots Alliance, Inc. | | | 298,091 | |
| | 6,493 | | | Whole Foods Market, Inc. | | | 366,789 | |
| | | | | | | | |
| | | | | | | 1,056,114 | |
| | |
| | Food Products – 2.6% | |
| | 5,483 | | | ConAgra Foods, Inc. | | | 191,795 | |
| | 2,421 | | | McCormick & Co., Inc. | | | 182,495 | |
| | | | | | | | |
| | | | | | | 374,290 | |
| | |
| | Health Care Equipment & Supplies – 2.1% | |
| | 6,288 | | | Abbott Laboratories | | | 297,863 | |
| | |
| | Health Care Providers & Services – 1.8% | |
| | 1,124 | | | McKesson Corp. | | | 257,059 | |
| | |
| | Hotels, Restaurants & Leisure – 3.4% | |
| | 2,103 | | | Starbucks Corp. | | | 196,599 | |
| | 3,553 | | | Yum! Brands, Inc. | | | 288,184 | |
| | | | | | | | |
| | | | | | | 484,783 | |
| | |
| | Household Products – 1.6% | |
| | 3,251 | | | Colgate-Palmolive Co. | | | 230,236 | |
| | |
| | Industrial Conglomerates – 5.2% | |
| | 28,731 | | | General Electric Co. | | | 746,719 | |
| | |
| | Common Stocks – (continued) | |
| | Insurance – 7.2% | |
| | 2,242 | | | Aflac, Inc. | | $ | 139,564 | |
| | 6,633 | | | American International Group, Inc. | | | 367,004 | |
| | 4,675 | | | Prudential Financial, Inc. | | | 377,974 | |
| | 3,784 | | | The Hartford Financial Services Group, Inc. | | | 154,993 | |
| | | | | | | | |
| | | | | | | | |
| | | | | | | 1,039,535 | |
| | |
| | Internet & Catalog Retail* – 2.1% | |
| | 802 | | | Amazon.com, Inc. | | | 304,888 | |
| | |
| | Internet Software & Services – 6.8% | |
| | 3,724 | | | eBay, Inc.* | | | 215,657 | |
| | 682 | | | Equinix, Inc. | | | 152,887 | |
| | 444 | | | Google, Inc. Class A* | | | 249,808 | |
| | 308 | | | Google, Inc. Class C* | | | 171,987 | |
| | 721 | | | LinkedIn Corp. Class A* | | | 192,651 | |
| | | | | | | | |
| | | | | | | | |
| | | | | | | 982,990 | |
| | |
| | Media – 2.0% | |
| | 4,208 | | | Viacom, Inc. Class B | | | 294,307 | |
| | |
| | Oil, Gas & Consumable Fuels – 6.8% | |
| | 2,210 | | | Apache Corp. | | | 145,506 | |
| | 5,564 | | | Devon Energy Corp. | | | 342,687 | |
| | 1,637 | | | Exxon Mobil Corp. | | | 144,940 | |
| | 13,694 | | | Southwestern Energy Co.* | | | 343,446 | |
| | | | | | | | |
| | | | | | | | |
| | | | | | | 976,579 | |
| | |
| | Pharmaceuticals – 5.8% | |
| | 5,728 | | | Mylan, Inc.* | | | 328,358 | |
| | 14,894 | | | Pfizer, Inc. | | | 511,162 | |
| | | | | | | | |
| | | | | | | | |
| | | | | | | 839,520 | |
| | |
| | Real Estate Investment Trusts – 2.1% | |
| | 3,039 | | | American Tower Corp. | | | 301,286 | |
| | |
| | Road & Rail – 2.4% | |
| | 6,314 | | | Hertz Global Holdings, Inc.* | | | 145,664 | |
| | 1,761 | | | Kansas City Southern | | | 203,994 | |
| | | | | | | | |
| | | | | | | | |
| | | | | | | 349,658 | |
| | |
| | Software – 4.0% | |
| | 10,094 | | | Microsoft Corp. | | | 442,622 | |
| | 1,710 | | | ServiceNow, Inc.* | | | 130,404 | |
| | | | | | | | |
| | | | | | | 573,026 | |
| | |
| | Specialty Retail – 2.3% | |
| | 8,083 | | | The Gap, Inc. | | | 336,253 | |
| | |
| | Textiles, Apparel & Luxury Goods – 3.6% | |
| | 3,774 | | | NIKE, Inc. Class B | | | 366,531 | |
| | 1,417 | | | PVH Corp. | | | 150,953 | |
| | | | | | | | |
| | | | | | | | |
| | | | | | | 517,484 | |
| | |
| | TOTAL COMMON STOCKS | | | | |
| | (Cost $11,142,455) | | $ | 13,796,173 | |
| | |
| | |
| The accompanying notes are an integral part of these financial statements. | | 77 |
GOLDMAN SACHS U.S. EQUITY FUND
Schedule of Investments (continued)
February 28, 2015 (Unaudited)
| | | | | | | | | | | | | | |
Principal Amount | | | Interest
Rate | | | Maturity
Date | | | Value | |
| | Short-term Investment(a) – 3.5% | |
| | Repurchase Agreement – 3.5% | |
| Joint Repurchase Agreement Account II | |
| $ | 500,000 | | | | 0.081 | % | | | 03/02/15 | | | $ | 500,000 | |
| | (Cost $500,000) | | | | | |
| | |
| | TOTAL INVESTMENTS – 99.3% | | | | | |
| | (Cost $11,642,455) | | | $ | 14,296,173 | |
| | |
| OTHER ASSETS IN EXCESS OF
LIABILITIES – 0.7% |
| | | 100,182 | |
| | |
| | NET ASSETS – 100.0% | | | $ | 14,396,355 | |
| | |
| | |
| The percentage shown for each investment category reflects the value of investments in that category as a percentage of net assets. |
* | | Non-income producing security. |
(a) | | Joint repurchase agreement was entered into on February 27, 2015. Additional information appears on page 79. |
| | |
| 78 | | The accompanying notes are an integral part of these financial statements. |
GOLDMAN SACHS FUNDAMENTAL EQUITY GROWTH FUNDS
Schedule of Investments
February 28, 2015 (Unaudited)
|
| ADDITIONAL INVESTMENT INFORMATION |
JOINT REPURCHASE AGREEMENT ACCOUNT II — At February 28, 2015, certain Funds had undivided interests in the Joint Repurchase Agreement Account II, with a maturity date of March 2, 2015, as follows:
| | | | | | | | | | | | |
| Fund | | Principal
Amount | | | Maturity
Value | | | Collateral
Allocation
Value | |
Capital Growth | | $ | 14,300,000 | | | $ | 14,300,097 | | | $ | 14,586,001 | |
Concentrated Growth | | | 2,800,000 | | | | 2,800,019 | | | | 2,856,000 | |
Flexible Cap Growth | | | 300,000 | | | | 300,002 | | | | 306,000 | |
Focused Growth | | | 600,000 | | | | 600,004 | | | | 612,000 | |
Small/Mid Cap Growth | | | 81,400,000 | | | | 81,400,552 | | | | 83,028,008 | |
Strategic Growth | | | 7,000,000 | | | | 7,000,047 | | | | 7,140,001 | |
Technology Tollkeeper | | | 2,700,000 | | | | 2,700,018 | | | | 2,754,000 | |
U.S. Equity | | | 500,000 | | | | 500,003 | | | | 510,000 | |
REPURCHASE AGREEMENTS — At February 28, 2015, the Principal Amounts of certain Funds’ interest in the Joint Repurchase Agreement Account II were as follows:
| | | | | | | | | | | | | | | | | | | | | | | | | | | | | | | | | | | | |
| Counterparty | | Interest
Rate | | | Capital
Growth | | | Concentrated
Growth | | | Flexible Cap
Growth | | | Focused
Growth | | | Small/Mid Cap
Growth | | | Strategic
Growth | | | Technology
Tollkeeper | | | U.S. Equity | |
BNP Paribas Securities Co. | | | 0.090 | % | | $ | 5,760,709 | | | $ | 1,127,971 | | | $ | 120,854 | | | $ | 241,708 | | | $ | 32,791,728 | | | $ | 2,819,927 | | | $ | 1,087,687 | | | $ | 201,423 | |
Citigroup Global Markets, Inc. | | | 0.080 | | | | 4,800,591 | | | | 939,976 | | | | 100,712 | | | | 201,423 | | | | 27,326,440 | | | | 2,349,940 | | | | 906,405 | | | | 167,853 | |
Merrill Lynch & Co., Inc. | | | 0.070 | | | | 3,738,700 | | | | 732,053 | | | | 78,434 | | | | 156,869 | | | | 21,281,832 | | | | 1,830,133 | | | | 705,908 | | | | 130,724 | |
| TOTAL | | | | | | $ | 14,300,000 | | | $ | 2,800,000 | | | $ | 300,000 | | | $ | 600,000 | | | $ | 81,400,000 | | | $ | 7,000,000 | | | $ | 2,700,000 | | | $ | 500,000 | |
At February 28, 2015, the Joint Repurchase Agreement Account II was fully collateralized by:
| | | | | | | | |
| Issuer | | Interest Rates | | | Maturity Dates | |
Federal Home Loan Mortgage Corp. | | | 3.000% to 4.500% | | | | 11/01/29 to 06/01/43 | |
Federal National Mortgage Association | | | 3.000 to 5.000 | | | | 10/01/25 to 11/01/44 | |
Government National Mortgage Association | | | 3.000 to 6.000 | | | | 11/15/34 to 09/20/44 | |
United States Treasury Stripped Securities | | | 0.000 | | | | 02/15/35 to 11/15/41 | |
United States Treasury Note | | | 1.625 | | | | 03/31/19 | |
| | |
| The accompanying notes are an integral part of these financial statements. | | 79 |
GOLDMAN SACHS FUNDAMENTAL EQUITY GROWTH FUNDS
Statements of Assets and Liabilities
February 28, 2015 (Unaudited)
| | | | | | |
| | | | | Capital Growth
Fund | |
| | Assets: | |
| | Investments of unaffiliated issuers, at value (cost $722,675,219, $138,689,015, $13,004,577, $29,385,606, $4,002,595,954, $1,925,395,558, $309,516,942, $279,945,692 and $11,642,455) | | $ | 1,018,171,533 | |
| | Investments of affiliated issuers, at value (cost $0, $0, $0, $0, $142,354,684, $47,490,376, $0, $0 and $0) | | | — | |
| | Cash | | | 64,004 | |
| | Receivables: | | | | |
| | Investments sold | | | 17,654,931 | |
| | Dividends and interest | | | 804,537 | |
| | Fund shares sold | | | 414,985 | |
| | Foreign tax reclaims | | | 102,146 | |
| | Reimbursement from investment adviser | | | 7,633 | |
| | Other assets | | | 11,950 | |
| | Total assets | | | 1,037,231,719 | |
| | | | | | |
| | Liabilities: | |
| | Payables: | | | | |
| | Investments purchased | | | 13,031,990 | |
| | Fund shares redeemed | | | 650,249 | |
| | Management fees | | | 545,282 | |
| | Distribution and Service fees and Transfer Agent fee | | | 330,133 | |
| | Accrued expenses | | | 168,122 | |
| | Total liabilities | | | 14,725,776 | |
| | | | | | |
| | Net Assets: | |
| | Paid-in capital | | | 698,899,105 | |
| | Undistributed (distributions in excess of) net investment income (loss) | | | 490,410 | |
| | Accumulated net realized gain | | | 27,620,114 | |
| | Net unrealized gain | | | 295,496,314 | |
| | | NET ASSETS | | $ | 1,022,505,943 | |
| | | Net Assets: | | | | |
| | | Class A | | $ | 745,272,864 | |
| | | Class C | | | 84,997,018 | |
| | | Institutional | | | 184,147,615 | |
| | | Service | | | 1,121,557 | |
| | | Class IR | | | 3,336,352 | |
| | | Class R | | | 3,630,537 | |
| | | Total Net Assets | | $ | 1,022,505,943 | |
| | | Shares Outstanding $0.001 par value (unlimited shares authorized): | | | | |
| | | Class A | | | 28,308,958 | |
| | | Class C | | | 4,034,859 | |
| | | Institutional | | | 6,481,986 | |
| | | Service | | | 43,787 | |
| | | Class IR | | | 125,527 | |
| | | Class R | | | 141,184 | |
| | | Net asset value, offering and redemption price per share:(a) | | | | |
| | | Class A | | | $26.33 | |
| | | Class C | | | 21.07 | |
| | | Institutional | | | 28.41 | |
| | | Service | | | 25.61 | |
| | | Class IR | | | 26.58 | |
| | | Class R | | | 25.71 | |
| | (a) | | Maximum public offering price per share for Class A Shares of the Capital Growth, Concentrated Growth, Flexible Cap Growth, Focused Growth, Growth Opportunities, Small/Mid Cap Growth, Strategic Growth, Technology Tollkeeper and U.S. Equity Funds is $27.86, $18.14, $13.15, $16.03, $27.04, $22.29, $13.24, $19.95 and $15.81, respectively. At redemption, Class C Shares may be subject to a contingent deferred sales charge, assessed on the amount equal to the lesser of the current net asset value or the original purchase price of the shares. |
| | |
| 80 | | The accompanying notes are an integral part of these financial statements. |
GOLDMAN SACHS FUNDAMENTAL EQUITY GROWTH FUNDS
| | | | | | | | | | | | | | | | | | | | | | | | | | | | | | | | | | | | | | | | | | | | | | |
| | | Concentrated
Growth Fund | | | | | Flexible Cap
Growth Fund | | | | | Focused
Growth Fund | | | | | Growth Opportunities Fund | | | | | Small/Mid Cap Growth Fund | | | | | Strategic
Growth Fund | | | | | Technology
Tollkeeper Fund | | | | | U.S. Equity Fund | |
| | | | | | | | | | | | | | | | | | | | | | | | | | | | | | | | | | | | | | | | | | | | | | |
| | $ | 187,099,493 | | | | | $ | 18,017,000 | | | | | $ | 33,323,102 | | | | | $ | 5,199,412,792 | | | | | $ | 2,531,531,354 | | | | | $ | 421,533,073 | | | | | $ | 433,518,590 | | | | | $ | 14,296,173 | |
| | | — | | | | | | — | | | | | | — | | | | | | 142,354,684 | | | | | | 51,724,100 | | | | | | — | | | | | | — | | | | | | — | |
| | | 65,687 | | | | | | 19,040 | | | | | | 9,791 | | | | | | 1,412,968 | | | | | | 521,199 | | | | | | 33,027 | | | | | | 1,541 | | | | | | 89,222 | |
| | | | | | | | | | | | | | | | | | | | | | | | | | | | | | | | | | | | | | | | | | | | | | |
| | | 3,871,533 | | | | | | — | | | | | | — | | | | | | — | | | | | | 3,933,749 | | | | | | — | | | | | | 6,370,440 | | | | | | 670,578 | |
| | | 162,040 | | | | | | 13,271 | | | | | | 8,537 | | | | | | 3,009,571 | | | | | | 697,860 | | | | | | 389,646 | | | | | | 69,384 | | | | | | 28,508 | |
| | | 17,583 | | | | | | — | | | | | | — | | | | | | 7,855,999 | | | | | | 6,634,270 | | | | | | 1,288,643 | | | | | | 400,195 | | | | | | 40,000 | |
| | | 13,243 | | | | | | — | | | | | | — | | | | | | — | | | | | | — | | | | | | 31,343 | | | | | | — | | | | | | 233 | |
| | | 1,999 | | | | | | 1,892 | | | | | | 20,704 | | | | | | — | | | | | | — | | | | | | 945 | | | | | | 15,004 | | | | | | — | |
| | | 1,327 | | | | | | 3,560 | | | | | | 2,989 | | | | | | 24,559 | | | | | | 9,376 | | | | | | 1,991 | | | | | | 2,052 | | | | | | 3,296 | |
| | | 191,232,905 | | | | | | 18,054,763 | | | | | | 33,365,123 | | | | | | 5,354,070,573 | | | | | | 2,595,051,908 | | | | | | 423,278,668 | | | | | | 440,377,206 | | | | | | 15,128,010 | |
| | | | | | | | | | | | | | | | | | | | | | | | | | | | | | | | | | | | | | | | | | | | | | |
| | | | | | | | | | | | | | | | | | | | | | | | | | | | | | | | | | | | | | | | | | | | | | |
| | | | | | | | | | | | | | | | | | | | | | | | | | | | | | | | | | | | | | | | | | | | | | |
| | | 4,187,228 | | | | | | — | | | | | | — | | | | | | 46,053,717 | | | | | | 40,070,188 | | | | | | 569,376 | | | | | | 1,356,848 | | | | | | 618,668 | |
| | | 67,230 | | | | | | 49,013 | | | | | | — | | | | | | 8,092,915 | | | | | | 4,313,557 | | | | | | 247,508 | | | | | | 2,015,280 | | | | | | 25,548 | |
| | | 109,311 | | | | | | 10,444 | | | | | | 19,634 | | | | | | 3,566,419 | | | | | | 1,604,908 | | | | | | 228,213 | | | | | | 330,136 | | | | | | 7,633 | |
| | | 11,312 | | | | | | 4,237 | | | | | | 1,072 | | | | | | 709,497 | | | | | | 570,280 | | | | | | 40,259 | | | | | | 143,042 | | | | | | 2,410 | |
| | | 67,973 | | | | | | 47,773 | | | | | | 56,397 | | | | | | 395,494 | | | | | | 241,382 | | | | | | 106,646 | | | | | | 148,172 | | | | | | 77,396 | |
| | | 4,443,054 | | | | | | 111,467 | | | | | | 77,103 | | | | | | 58,818,042 | | | | | | 46,800,315 | | | | | | 1,192,002 | | | | | | 3,993,478 | | | | | | 731,655 | |
| | | | | | | | | | | | | | | | | | | | | | | | | | | | | | | | | | | | | | | | | | | | | | |
| | | | | | | | | | | | | | | | | | | | | | | | | | | | | | | | | | | | | | | | | | | | | | |
| | | 130,768,787 | | | | | | 12,490,952 | | | | | | 28,558,472 | | | | | | 3,906,549,011 | | | | | | 1,923,673,745 | | | | | | 296,970,141 | | | | | | 268,281,657 | | | | | | 11,068,778 | |
| | | 243,003 | | | | | | (25,236 | ) | | | | | 38,558 | | | | | | (7,945,815 | ) | | | | | (17,483,584 | ) | | | | | 818,872 | | | | | | (3,878,480 | ) | | | | | 33,217 | |
| | | 7,367,583 | | | | | | 465,157 | | | | | | 753,494 | | | | | | 199,832,497 | | | | | | 31,691,912 | | | | | | 12,281,522 | | | | | | 18,407,653 | | | | | | 640,642 | |
| | | 48,410,478 | | | | | | 5,012,423 | | | | | | 3,937,496 | | | | | | 1,196,816,838 | | | | | | 610,369,520 | | | | | | 112,016,131 | | | | | | 153,572,898 | | | | | | 2,653,718 | |
| | | $ | 186,789,851 | | | | | $ | 17,943,296 | | | | | $ | 33,288,020 | | | | | $ | 5,295,252,531 | | | | | $ | 2,548,251,593 | | | | | $ | 422,086,666 | | | | | $ | 436,383,728 | | | | | $ | 14,396,355 | |
| | | | | | | | | | | | | | | | | | | | | | | | | | | | | | | | | | | | | | | | | | | | | | | |
| | | $ | 8,017,806 | | | | | $ | 7,086,595 | | | | | $ | 62,146 | | | | | $ | 1,071,347,337 | | | | | $ | 827,786,509 | | | | | $ | 48,919,026 | | | | | $ | 263,247,570 | | | | | $ | 4,896,247 | |
| | | | 3,822,151 | | | | | | 1,729,281 | | | | | | 56,491 | | | | | | 189,379,666 | | | | | | 246,297,491 | | | | | | 12,209,846 | | | | | | 59,420,619 | | | | | | 446,827 | |
| | | | 174,511,182 | | | | | | 8,726,088 | | | | | | 33,134,504 | | | | | | 3,718,735,809 | | | | | | 1,236,388,787 | | | | | | 359,652,210 | | | | | | 98,594,961 | | | | | | 8,704,663 | |
| | | | — | | | | | | — | | | | | | — | | | | | | 57,016,933 | | | | | | 10,645,391 | | | | | | 197,310 | | | | | | 11,864,568 | | | | | | — | |
| | | | 422,908 | | | | | | 368,134 | | | | | | 17,575 | | | | | | 170,799,971 | | | | | | 190,965,145 | | | | | | 1,051,950 | | | | | | 3,256,010 | | | | | | 229,730 | |
| | | | 15,804 | | | | | | 33,198 | | | | | | 17,304 | | | | | | 87,972,815 | | | | | | 36,168,270 | | | | | | 56,324 | | | | | | — | | | | | | 118,888 | |
| | | $ | 186,789,851 | | | | | $ | 17,943,296 | | | | | $ | 33,288,020 | | | | | $ | 5,295,252,531 | | | | | $ | 2,548,251,593 | | | | | $ | 422,086,666 | | | | | $ | 436,383,728 | | | | | $ | 14,396,355 | |
| | | | | | | | | | | | | | | | | | | | | | | | | | | | | | | | | | | | | | | | | | | | | | | |
| | | | 467,721 | | | | | | 570,203 | | | | | | 4,102 | | | | | | 41,931,486 | | | | | | 39,305,733 | | | | | | 3,910,578 | | | | | | 13,961,896 | | | | | | 327,772 | |
| | | | 253,955 | | | | | | 150,009 | | | | | | 3,808 | | | | | | 9,288,336 | | | | | | 12,880,522 | | | | | | 1,139,340 | | | | | | 3,584,862 | | | | | | 30,583 | |
| | | | 9,707,086 | | | | | | 673,146 | | | | | | 2,170,542 | | | | | | 130,159,833 | | | | | | 56,204,470 | | | | | | 27,263,286 | | | | | | 4,886,525 | | | | | | 580,071 | |
| | | | — | | | | | | — | | | | | | — | | | | | | 2,300,415 | | | | | | 514,335 | | | | | | 15,826 | | | | | | 637,494 | | | | | | — | |
| | | | 24,401 | | | | | | 28,765 | | | | | | 1,152 | | | | | | 6,507,027 | | | | | | 8,869,305 | | | | | | 79,705 | | | | | | 162,551 | | | | | | 15,328 | |
| | | | 941 | | | | | | 2,732 | | | | | | 1,147 | | | | | | 3,532,091 | | | | | | 1,754,557 | | | | | | 4,541 | | | | | | — | | | | | | 7,970 | |
| | | | | | | | | | | | | | | | | | | | | | | | | | | | | | | | | | | | | | | | | | | | | | | |
| | | | $17.14 | | | | | | $12.43 | | | | | | $15.15 | | | | | | $25.55 | | | | | | $21.06 | | | | | | $12.51 | | | | | | $18.85 | | | | | | $14.94 | |
| | | | 15.05 | | | | | | 11.53 | | | | | | 14.84 | | | | | | 20.39 | | | | | | 19.12 | | | | | | 10.72 | | | | | | 16.58 | | | | | | 14.61 | |
| | | | 17.98 | | | | | | 12.96 | | | | | | 15.27 | | | | | | 28.57 | | | | | | 22.00 | | | | | | 13.19 | | | | | | 20.18 | | | | | | 15.01 | |
| | | | — | | | | | | — | | | | | | — | | | | | | 24.79 | | | | | | 20.70 | | | | | | 12.47 | | | | | | 18.61 | | | | | | — | |
| | | | 17.33 | | | | | | 12.80 | | | | | | 15.25 | | | | | | 26.25 | | | | | | 21.53 | | | | | | 13.20 | | | | | | 20.03 | | | | | | 14.99 | |
| | | | 16.79 | | | | | | 12.15 | | | | | | 15.09 | | | | | | 24.91 | | | | | | 20.61 | | | | | | 12.40 | | | | | | — | | | | | | 14.92 | |
| | |
| The accompanying notes are an integral part of these financial statements. | | 81 |
GOLDMAN SACHS FUNDAMENTAL EQUITY GROWTH FUNDS
Statements of Operations
For the Six Months Ended February 28, 2015 (Unaudited)
| | | | | | |
| | | | | Capital Growth
Fund | |
| | Investment income: | |
| | Dividends — unaffiliated issuers (net of foreign withholding taxes of $1,496, $0, $0, $0, $25,411, $10,810, $0, $0 and $0) | | $ | 6,085,927 | |
| | Dividends — affiliated issuers | | | — | |
| | Interest | | | 5,166 | |
| | Total investment income | | | 6,091,093 | |
| | | | | | |
| | Expenses: | |
| | Management fees | | | 4,778,598 | |
| | Distribution and Service fees(a) | | | 1,318,807 | |
| | Transfer Agent fees(a) | | | 787,806 | |
| | Printing and mailing costs | | | 94,947 | |
| | Custody, accounting and administrative services | | | 58,685 | |
| | Registration fees | | | 46,590 | |
| | Professional fees | | | 33,967 | |
| | Trustee fees | | | 12,366 | |
| | Service Share fees — Shareholder Administration Plan | | | 1,408 | |
| | Service Share fees — Service Plan | | | 1,408 | |
| | Other | | | 13,890 | |
| | Total expenses | | | 7,148,472 | |
| | Less — expense reductions | | | (1,626,609 | ) |
| | Net expenses | | | 5,521,863 | |
| | NET INVESTMENT INCOME (LOSS) | | | 569,230 | |
| | | | | | |
| | Realized and unrealized gain (loss): | |
| | Net realized gain (loss) from: | | | | |
| | Investments — unaffiliated issuers (including commission recapture of $19,300, $4,721, $135, $591, $164,264, $0, $814, $4,008 and $296) | | | 63,619,946 | |
| | Investments — affiliated issuers | | | — | |
| | Foreign currency transactions | | | (2,060 | ) |
| | Net change in unrealized gain (loss) on: | | | | |
| | Investments — unaffiliated issuers | | | 26,569,703 | |
| | Investments — affiliated issuers | | | — | |
| | Foreign currency translations | | | (105 | ) |
| | Net realized and unrealized gain | | | 90,187,484 | |
| | NET INCREASE IN NET ASSETS RESULTING FROM OPERATIONS | | $ | 90,756,714 | |
| | (a) | | Class specific Distribution and Service, and Transfer Agent fees were as follows: |
| | | | | | | | | | | | | | | | | | | | | | | | | | | | | | | | | | | | | | | | | | | | |
| | | Distribution and Service Fees | | | Transfer Agent Fees | |
Fund | | Class A | | | Class B(b) | | | Class C | | | Class R | | | Class A | | | Class B(b) | | | Class C | | | Institutional | | | Service | | | Class IR | | | Class R | |
Capital Growth | | $ | 878,386 | | | $ | 29,260 | | | $ | 402,313 | | | $ | 8,848 | | | $ | 667,573 | | | $ | 5,560 | | | $ | 76,439 | | | $ | 31,845 | | | $ | 225 | | | $ | 2,802 | | | $ | 3,362 | |
Concentrated Growth | | | 9,490 | | | | 569 | | | | 17,334 | | | | 37 | | | | 7,213 | | | | 108 | | | | 3,294 | | | | 33,269 | | | | — | | | | 365 | | | | 14 | |
Flexible Cap Growth | | | 7,778 | | | | — | | | | 6,571 | | | | 110 | | | | 5,912 | | | | — | | | | 1,248 | | | | 1,616 | | | | — | | | | 225 | | | | 42 | |
Focused Growth | | | 67 | | | | — | | | | 218 | | | | 40 | | | | 51 | | | | — | | | | 41 | | | | 5,570 | | | | — | | | | 15 | | | | 15 | |
Growth Opportunities | | | 1,301,502 | | | | 14,402 | | | | 925,229 | | | | 204,248 | | | | 989,142 | | | | 2,736 | | | | 175,794 | | | | 717,981 | | | | 11,144 | | | | 143,161 | | | | 77,614 | |
Small/Mid Cap Growth | | | 921,084 | | | | 6,856 | | | | 1,123,264 | | | | 83,886 | | | | 700,024 | | | | 1,303 | | | | 213,420 | | | | 223,680 | | | | 1,709 | | | | 166,346 | | | | 31,876 | |
Strategic Growth | | | 64,167 | | | | 1,568 | | | | 57,606 | | | | 58 | | | | 48,767 | | | | 298 | | | | 10,945 | | | | 66,473 | | | | 33 | | | | 942 | | | | 22 | |
Technology Tollkeeper | | | 312,543 | | | | 8,430 | | | | 283,252 | | | | — | | | | 237,533 | | | | 1,602 | | | | 53,818 | | | | 20,071 | | | | 2,168 | | | | 2,893 | | | | — | |
U.S. Equity | | | 5,894 | | | | — | | | | 1,551 | | | | 278 | | | | 4,480 | | | | — | | | | 294 | | | | 1,718 | | | | — | | | | 207 | | | | 106 | |
| | (b) | | Class B Shares were converted into Class A Shares at the close of business on November 14, 2014. |
| | |
| 82 | | The accompanying notes are an integral part of these financial statements. |
GOLDMAN SACHS FUNDAMENTAL EQUITY GROWTH FUNDS
| | | | | | | | | | | | | | | | | | | | | | | | | | | | | | | | | | | | | | | | | | | | | | |
| | | Concentrated
Growth Fund | | | | | Flexible Cap
Growth Fund | | | | | Focused
Growth Fund | | | | | Growth
Opportunities
Fund | | | | | Small/Mid Cap
Growth Fund | | | | | Strategic
Growth Fund | | | | | Technology
Tollkeeper Fund | | | | | U.S. Equity
Fund | |
| | | | | | | | | | | | | | | | | | | | | | | | | | | | | | | | | | | | | | | | | | | | | | |
| | $ | 1,330,490 | | | | | $ | 83,593 | | | | | $ | 214,831 | | | | | $ | 20,035,232 | | | | | $ | 5,854,454 | | | | | $ | 2,797,419 | | | | | $ | 1,630,070 | | | | | $ | 134,132 | |
| | | — | | | | | | — | | | | | | — | | | | | | 1,143 | | | | | | — | | | | | | — | | | | | | — | | | | | | — | |
| | | 892 | | | | | | 334 | | | | | | 403 | | | | | | 6,080 | | | | | | 15,439 | | | | | | 2,345 | | | | | | 2,688 | | | | | | 276 | |
| | | 1,331,382 | | | | | | 83,927 | | | | | | 215,234 | | | | | | 20,042,455 | | | | | | 5,869,893 | | | | | | 2,799,764 | | | | | | 1,632,758 | | | | | | 134,408 | |
| | | | | | | | | | | | | | | | | | | | | | | | | | | | | | | | | | | | | | | | | | | | | | |
| | | | | | | | | | | | | | | | | | | | | | | | | | | | | | | | | | | | | | | | | | | | | | |
| | | 889,584 | | | | | | 79,493 | | | | | | 139,886 | | | | | | 23,941,574 | | | | | | 11,334,992 | | | | | | 1,983,559 | | | | | | 2,113,069 | | | | | | 48,810 | |
| | | 27,430 | | | | | | 14,459 | | | | | | 325 | | | | | | 2,445,381 | | | | | | 2,135,090 | | | | | | 123,399 | | | | | | 604,225 | | | | | | 7,723 | |
| | | 44,263 | | | | | | 9,043 | | | | | | 5,692 | | | | | | 2,117,572 | | | | | | 1,338,358 | | | | | | 127,480 | | | | | | 318,085 | | | | | | 6,805 | |
| | | 15,403 | | | | | | 13,105 | | | | | | 16,805 | | | | | | 308,064 | | | | | | 197,299 | | | | | | 27,785 | | | | | | 77,803 | | | | | | 14,219 | |
| | | 25,060 | | | | | | 26,289 | | | | | | 22,382 | | | | | | 134,333 | | | | | | 84,207 | | | | | | 41,285 | | | | | | 38,382 | | | | | | 23,717 | |
| | | 29,718 | | | | | | 25,528 | | | | | | 31,359 | | | | | | 39,564 | | | | | | 65,876 | | | | | | 36,928 | | | | | | 40,710 | | | | | | 15,666 | |
| | | 28,594 | | | | | | 29,923 | | | | | | 31,136 | | | | | | 33,604 | | | | | | 78,268 | | | | | | 32,769 | | | | | | 33,672 | | | | | | 39,290 | |
| | | 10,124 | | | | | | 9,762 | | | | | | 9,724 | | | | | | 16,379 | | | | | | 12,540 | | | | | | 10,319 | | | | | | 10,367 | | | | | | 9,011 | |
| | | — | | | | | | — | | | | | | — | | | | | | 69,648 | | | | | | 10,681 | | | | | | 207 | | | | | | 13,553 | | | | | | — | |
| | | — | | | | | | — | | | | | | — | | | | | | 69,648 | | | | | | 10,681 | | | | | | 207 | | | | | | 13,553 | | | | | | — | |
| | | 6,267 | | | | | | 5,092 | | | | | | 3,443 | | | | | | 49,446 | | | | | | 13,385 | | | | | | 9,232 | | | | | | 8,316 | | | | | | 4,443 | |
| | | 1,076,443 | | | | | | 212,694 | | | | | | 260,752 | | | | | | 29,225,213 | | | | | | 15,281,377 | | | | | | 2,393,170 | | | | | | 3,271,735 | | | | | | 169,684 | |
| | | (283,898 | ) | | | | | (124,844 | ) | | | | | (142,267 | ) | | | | | (1,236,943 | ) | | | | | (1,566,404 | ) | | | | | (725,614 | ) | | | | | (95,734 | ) | | | | | (102,325 | ) |
| | | 792,545 | | | | | | 87,850 | | | | | | 118,485 | | | | | | 27,988,270 | | | | | | 13,714,973 | | | | | | 1,667,556 | | | | | | 3,176,001 | | | | | | 67,359 | |
| | | 538,837 | | | | | | (3,923 | ) | | | | | 96,749 | | | | | | (7,945,815 | ) | | | | | (7,845,080 | ) | | | | | 1,132,208 | | | | | | (1,543,243 | ) | | | | | 67,049 | |
| | | | | | | | | | | | | | | | | | | | | | | | | | | | | | | | | | | | | | | | | | | | | | |
| | | | | | | | | | | | | | | | | | | | | | | | | | | | | | | | | | | | | | | | | | | | | | |
| | | | | | | | | | | | | | | | | | | | | | | | | | | | | | | | | | | | | | | | | | | | | | |
| | | 10,100,398 | | | | | | 965,469 | | | | | | 861,614 | | | | | | 378,481,433 | | | | | | 67,281,025 | | | | | | 21,729,454 | | | | | | 26,892,450 | | | | | | 1,145,443 | |
| | | — | | | | | | — | | | | | | — | | | | | | — | | | | | | 33,238 | | | | | | — | | | | | | — | | | | | | — | |
| | | — | | | | | | — | | | | | | — | | | | | | (27,222 | ) | | | | | 158 | | | | | | (820 | ) | | | | | — | | | | | | — | |
| | | | | | | | | | | | | | | | | | | | | | | | | | | | | | | | | | | | | | | | | | | | | | |
| | | 6,286,339 | | | | | | 547,720 | | | | | | 1,883,259 | | | | | | (77,521,053 | ) | | | | | 152,799,252 | | | | | | 12,682,850 | | | | | | 5,177,620 | | | | | | (356,372 | ) |
| | | — | | | | | | — | | | | | | — | | | | | | — | | | | | | 3,897,226 | | | | | | — | | | | | | — | | | | | | — | |
| | | — | | | | | | — | | | | | | — | | | | | | (1,268 | ) | | | | | (322 | ) | | | | | — | | | | | | — | | | | | | — | |
| | | 16,386,737 | | | | | | 1,513,189 | | | | | | 2,744,873 | | | | | | 300,931,890 | | | | | | 224,010,577 | | | | | | 34,411,484 | | | | | | 32,070,070 | | | | | | 789,071 | |
| | $ | 16,925,574 | | | | | $ | 1,509,266 | | | | | $ | 2,841,622 | | | | | $ | 292,986,075 | | | | | $ | 216,165,497 | | | | | $ | 35,543,692 | | | | | $ | 30,526,827 | | | | | $ | 856,120 | |
| | |
| The accompanying notes are an integral part of these financial statements. | | 83 |
GOLDMAN SACHS FUNDAMENTAL EQUITY GROWTH FUNDS
Statements of Changes in Net Assets
| | | | | | | | | | |
| | | | | Capital Growth Fund | |
| | | | | For the Six Months Ended
February 28, 2015
(Unaudited) | | | For the Fiscal Year Ended
August 31, 2014 | |
| | From operations: | | | | | | | | |
| | Net investment income (loss) | | $ | 569,230 | | | $ | (635,153 | ) |
| | Net realized gain | | | 63,617,886 | | | | 192,105,537 | |
| | Net change in unrealized gain (loss) | | | 26,569,598 | | | | 15,554,210 | |
| | Net increase in net assets resulting from operations | | | 90,756,714 | | | | 207,024,594 | |
| | | | | | | | | | |
| | Distributions to shareholders: | | | | | | | | |
| | From net investment income | | | | | | | | |
| | Class A Shares | | | — | | | | (1,685,221 | ) |
| | Institutional Shares | | | — | | | | (651,899 | ) |
| | Service Shares | | | — | | | | (1,578 | ) |
| | Class IR Shares | | | — | | | | (11,151 | ) |
| | Class R Shares | | | — | | | | (4,233 | ) |
| | From net realized gains | | | | | | | | |
| | Class A Shares | | | (109,107,619 | ) | | | (137,514,229 | ) |
| | Class B Shares(a) | | | — | | | | (4,533,042 | ) |
| | Class C Shares | | | (14,781,808 | ) | | | (18,780,747 | ) |
| | Institutional Shares | | | (22,936,412 | ) | | | (26,252,486 | ) |
| | Service Shares | | | (181,082 | ) | | | (222,125 | ) |
| | Class IR Shares | | | (451,620 | ) | | | (539,137 | ) |
| | Class R Shares | | | (557,137 | ) | | | (562,868 | ) |
| | Total distributions to shareholders | | | (148,015,678 | ) | | | (190,758,716 | ) |
| | | | | | | | | | |
| | From share transactions: | | | | | | | | |
| | Proceeds from sales of shares | | | 60,763,503 | | | | 46,585,483 | |
| | Reinvestment of distributions | | | 140,089,222 | | | | 179,706,343 | |
| | Cost of shares redeemed | | | (75,996,623 | ) | | | (143,214,729 | ) |
| | Net increase in net assets resulting from share transactions | | | 124,856,102 | | | | 83,077,097 | |
| | TOTAL INCREASE | | | 67,597,138 | | | | 99,342,975 | |
| | | | | | | | | | |
| | Net assets: | | | | | | | | |
| | Beginning of period | | | 954,908,805 | | | | 855,565,830 | |
| | End of period | | $ | 1,022,505,943 | | | $ | 954,908,805 | |
| | Undistributed (distributions in excess of) net investment income (loss) | | $ | 490,410 | | | $ | (78,820 | ) |
| | (a) | | Class B Shares were converted into Class A Shares at the close of business on November 14, 2014. |
| | |
| 84 | | The accompanying notes are an integral part of these financial statements. |
GOLDMAN SACHS FUNDAMENTAL EQUITY GROWTH FUNDS
| | | | | | | | | | | | | | | | | | | | | | |
| | | Concentrated Growth Fund | | | | | Flexible Cap Growth Fund | |
| | | For the Six Months Ended
February 28, 2015
(Unaudited) | | | | | For the Fiscal Year Ended
August 31, 2014 | | | | | For the Six Months Ended
February 28, 2015
(Unaudited) | | | | | For the Fiscal
Year Ended
August 31, 2014 | |
| | | | | | | | | | | | | | | | | | | | | | |
| | $ | 538,837 | | | | | $ | 72,251 | | | | | $ | (3,923 | ) | | | | $ | (34,732 | ) |
| | | 10,100,398 | | | | | | 39,400,390 | | | | | | 965,469 | | | | | | 2,393,302 | |
| | | 6,286,339 | | | | | | (3,503,722 | ) | | | | | 547,720 | | | | | | 886,392 | |
| | | 16,925,574 | | | | | | 35,968,919 | | | | | | 1,509,266 | | | | | | 3,244,962 | |
| | | | | | | | | | | | | | | | | | | | | | |
| | | | | | | | | | | | | | | | | | | | | | |
| | | | | | | | | | | | | | | | | | | | | | |
| | | — | | | | | | — | | | | | | — | | | | | | — | |
| | | (366,604 | ) | | | | | (258,083 | ) | | | | | — | | | | | | (12,391 | ) |
| | | — | | | | | | — | | | | | | — | | | | | | — | |
| | | (283 | ) | | | | | (275 | ) | | | | | — | | | | | | — | |
| | | — | | | | | | — | | | | | | — | | | | | | — | |
| | | | | | | | | | | | | | | | | | | | | | |
| | | (1,407,056 | ) | | | | | (886,939 | ) | | | | | (897,010 | ) | | | | | (620,899 | ) |
| | | — | | | | | | (36,576 | ) | | | | | — | | | | | | — | |
| | | (700,153 | ) | | | | | (341,863 | ) | | | | | (182,809 | ) | | | | | (139,480 | ) |
| | | (28,939,818 | ) | | | | | (14,924,877 | ) | | | | | (1,118,730 | ) | | | | | (813,854 | ) |
| | | — | | | | | | — | | | | | | — | | | | | | — | |
| | | (67,917 | ) | | | | | (37,654 | ) | | | | | (32,793 | ) | | | | | (11,334 | ) |
| | | (2,664 | ) | | | | | (1,284 | ) | | | | | (8,089 | ) | | | | | (5,635 | ) |
| | | (31,484,495 | ) | | | | | (16,487,551 | ) | | | | | (2,239,431 | ) | | | | | (1,603,593 | ) |
| | | | | | | | | | | | | | | | | | | | | | |
| | | | | | | | | | | | | | | | | | | | | | |
| | | 5,933,712 | | | | | | 14,294,982 | | | | | | 2,857,173 | | | | | | 2,940,711 | |
| | | 30,851,757 | | | | | | 16,211,287 | | | | | | 2,237,814 | | | | | | 1,591,368 | |
| | | (16,549,837 | ) | | | | | (26,768,101 | ) | | | | | (1,648,072 | ) | | | | | (2,958,340 | ) |
| | | 20,235,632 | | | | | | 3,738,168 | | | | | | 3,446,915 | | | | | | 1,573,739 | |
| | | 5,676,711 | | | | | | 23,219,536 | | | | | | 2,716,750 | | | | | | 3,215,108 | |
| | | | | | | | | | | | | | | | | | | | | | |
| | | | | | | | | | | | | | | | | | | | | | |
| | | 181,113,140 | | | | | | 157,893,604 | | | | | | 15,226,546 | | | | | | 12,011,438 | |
| | $ | 186,789,851 | | | | | $ | 181,113,140 | | | | | $ | 17,943,296 | | | | | $ | 15,226,546 | |
| | $ | 243,003 | | | | | $ | 71,053 | | | | | $ | (25,236 | ) | | | | $ | (21,313 | ) |
| | |
| The accompanying notes are an integral part of these financial statements. | | 85 |
GOLDMAN SACHS FUNDAMENTAL EQUITY GROWTH FUNDS
Statements of Changes in Net Assets
| | | | | | | | | | |
| | | | | Focused Growth Fund | |
| | | | | For the Six Months Ended
February 28, 2015
(Unaudited) | | | For the Fiscal
Year Ended
August 31, 2014 | |
| | From operations: | | | | | | | | |
| | Net investment income (loss) | | $ | 96,749 | | | $ | 18,581 | |
| | Net realized gain | | | 861,614 | | | | 2,200,665 | |
| | Net change in unrealized gain (loss) | | | 1,883,259 | | | | 1,274,461 | |
| | Net increase in net assets resulting from operations | | | 2,841,622 | | | | 3,493,707 | |
| | | | | | | | | | |
| | Distributions to shareholders: | | | | | | | | |
| | From net investment income | | | | | | | | |
| | Class A Shares | | | — | | | | — | |
| | Institutional Shares | | | (76,654 | ) | | | (26,580 | ) |
| | Service Shares | | | — | | | | — | |
| | Class IR Shares | | | (18 | ) | | | (10 | ) |
| | Class R Shares | | | — | | | | — | |
| | From net realized gains | | | | | | | | |
| | Class A Shares | | | (3,858 | ) | | | (3,925 | ) |
| | Class B Shares(a) | | | — | | | | — | |
| | Class C Shares | | | (2,722 | ) | | | (2,323 | ) |
| | Institutional Shares | | | (1,977,313 | ) | | | (1,063,316 | ) |
| | Service Shares | | | — | | | | — | |
| | Class IR Shares | | | (1,099 | ) | | | (938 | ) |
| | Class R Shares | | | (1,094 | ) | | | (935 | ) |
| | Total distributions to shareholders | | | (2,062,758 | ) | | | (1,098,027 | ) |
| | | | | | | | | | |
| | From share transactions: | | | | | | | | |
| | Proceeds from sales of shares | | | 7,560,568 | | | | 14,218,517 | |
| | Reinvestment of distributions | | | 2,062,758 | | | | 1,098,027 | |
| | Cost of shares redeemed | | | (1,572,641 | ) | | | (6,197,098 | ) |
| | Net increase (decrease) in net assets resulting from share transactions | | | 8,050,685 | | | | 9,119,446 | |
| | TOTAL INCREASE (DECREASE) | | | 8,829,549 | | | | 11,515,126 | |
| | | | | | | | | | |
| | Net assets: | | | | | | | | |
| | Beginning of period | | | 24,458,471 | | | | 12,943,345 | |
| | End of period | | $ | 33,288,020 | | | $ | 24,458,471 | |
| | Undistributed net investment income (loss) | | $ | 38,558 | | | $ | 18,481 | |
| | (a) | | Class B Shares were converted into Class A Shares at the close of business on November 14, 2014. |
| | |
| 86 | | The accompanying notes are an integral part of these financial statements. |
GOLDMAN SACHS FUNDAMENTAL EQUITY GROWTH FUNDS
| | | | | | | | | | | | | | | | | | | | | | |
| | | Growth Opportunities Fund | | | | | Small/Mid Cap Growth Fund | |
| | | For the Six Months Ended
February 28, 2015
(Unaudited) | | | | | For the Fiscal Year Ended
August 31, 2014 | | | | | For the Six Months Ended
February 28, 2015
(Unaudited) | | | | | For the Fiscal
Year Ended
August 31, 2014 | |
| | | | | | | | | | | | | | | | | | | | | | |
| | $ | (7,945,815 | ) | | | | $ | (21,419,441 | ) | | | | $ | (7,845,080 | ) | | | | $ | (14,368,427 | ) |
| | | 378,454,211 | | | | | | 1,018,902,639 | | | | | | 67,314,421 | | | | | | 202,528,671 | |
| | | (77,522,321 | ) | | | | | 46,107,975 | | | | | | 156,696,156 | | | | | | 125,627,804 | |
| | | 292,986,075 | | | | | | 1,043,591,173 | | | | | | 216,165,497 | | | | | | 313,788,048 | |
| | | | | | | | | | | | | | | | | | | | | | |
| | | | | | | | | | | | | | | | | | | | | | |
| | | | | | | | | | | | | | | | | | | | | | |
| | | — | | | | | | — | | | | | | — | | | | | | — | |
| | | — | | | | | | — | | | | | | — | | | | | | — | |
| | | — | | | | | | — | | | | | | — | | | | | | — | |
| | | — | | | | | | — | | | | | | — | | | | | | — | |
| | | — | | | | | | — | | | | | | — | | | | | | — | |
| | | | | | | | | | | | | | | | | | | | | | |
| | | (213,956,510 | ) | | | | | (89,135,434 | ) | | | | | (59,422,373 | ) | | | | | (34,915,088 | ) |
| | | — | | | | | | (816,955 | ) | | | | | — | | | | | | (241,378 | ) |
| | | (45,806,967 | ) | | | | | (16,251,523 | ) | | | | | (19,729,913 | ) | | | | | (9,748,706 | ) |
| | | (674,995,963 | ) | | | | | (240,888,335 | ) | | | | | (89,205,827 | ) | | | | | (40,240,222 | ) |
| | | (11,651,811 | ) | | | | | (4,773,288 | ) | | | | | (662,911 | ) | | | | | (402,842 | ) |
| | | (30,389,606 | ) | | | | | (8,961,670 | ) | | | | | (13,778,175 | ) | | | | | (6,136,306 | ) |
| | | (17,292,249 | ) | | | | | (5,816,843 | ) | | | | | (2,780,547 | ) | | | | | (1,398,747 | ) |
| | | (994,093,106 | ) | | | | | (366,644,048 | ) | | | | | (185,579,746 | ) | | | | | (93,083,289 | ) |
| | | | | | | | | | | | | | | | | | | | | | |
| | | | | | | | | | | | | | | | | | | | | | |
| | | 832,855,256 | | | | | | 1,171,712,416 | | | | | | 481,663,966 | | | | | | 974,000,673 | |
| | | 802,333,312 | | | | | | 287,053,891 | | | | | | 164,354,585 | | | | | | 81,410,265 | |
| | | (979,790,575 | ) | | | | | (1,537,897,775 | ) | | | | | (386,923,236 | ) | | | | | (617,493,100 | ) |
| | | 655,397,993 | | | | | | (79,131,468 | ) | | | | | 259,095,315 | | | | | | 437,917,838 | |
| | | (45,709,038 | ) | | | | | 597,815,657 | | | | | | 289,681,066 | | | | | | 658,622,597 | |
| | | | | | | | | | | | | | | | | | | | | | |
| | | | | | | | | | | | | | | | | | | | | | |
| | | 5,340,961,569 | | | | | | 4,743,145,912 | | | | | | 2,258,570,527 | | | | | | 1,599,947,930 | |
| | $ | 5,295,252,531 | | | | | $ | 5,340,961,569 | | | | | $ | 2,548,251,593 | | | | | $ | 2,258,570,527 | |
| | $ | (7,945,815 | ) | | | | $ | — | | | | | $ | (17,483,584 | ) | | | | $ | (9,638,504 | ) |
| | |
| The accompanying notes are an integral part of these financial statements. | | 87 |
GOLDMAN SACHS FUNDAMENTAL EQUITY GROWTH FUNDS
Statements of Changes in Net Assets
| | | | | | | | | | |
| | | | | Strategic Growth Fund | |
| | | | | For the Six Months Ended
February 28, 2015
(Unaudited) | | | For the Fiscal
Year Ended
August 31, 2014 | |
| | From operations: | | | | | | | | |
| | Net investment income (loss) | | $ | 1,132,208 | | | $ | 681,949 | |
| | Net realized gain | | | 21,728,634 | | | | 60,456,322 | |
| | Net change in unrealized gain (loss) | | | 12,682,850 | | | | 30,319,366 | |
| | Net increase in net assets resulting from operations | | | 35,543,692 | | | | 91,457,637 | |
| | | | | | | | | | |
| | Distributions to shareholders: | | | | | | | | |
| | From net investment income | | | | | | | | |
| | Class A Shares | | | — | | | | (72,021 | ) |
| | Institutional Shares | | | (991,937 | ) | | | (1,083,692 | ) |
| | Service Shares | | | — | | | | (39 | ) |
| | Class IR Shares | | | (1,531 | ) | | | (2,932 | ) |
| | Class R Shares | | | — | | | | (14 | ) |
| | From net realized gains | | | | | | | | |
| | Class A Shares | | | (7,853,382 | ) | | | (12,687,895 | ) |
| | Class B Shares(a) | | | — | | | | (163,134 | ) |
| | Class C Shares | | | (2,031,017 | ) | | | (1,543,546 | ) |
| | Institutional Shares | | | (47,665,788 | ) | | | (36,102,729 | ) |
| | Service Shares | | | (26,879 | ) | | | (12,312 | ) |
| | Class IR Shares | | | (147,162 | ) | | | (120,720 | ) |
| | Class R Shares | | | (2,673 | ) | | | (1,136 | ) |
| | Total distributions to shareholders | | | (58,720,369 | ) | | | (51,790,170 | ) |
| | | | | | | | | | |
| | From share transactions: | | | | | | | | |
| | Proceeds from sales of shares | | | 48,947,624 | | | | 117,827,433 | |
| | Reinvestment of distributions | | | 56,900,752 | | | | 50,216,800 | |
| | Cost of shares redeemed | | | (58,328,439 | ) | | | (152,129,059 | ) |
| | Net increase (decrease) in net assets resulting from share transactions | | | 47,519,937 | | | | 15,915,174 | |
| | TOTAL INCREASE (DECREASE) | | | 24,343,260 | | | | 55,582,641 | |
| | | | | | | | | | |
| | Net assets: | | | | | | | | |
| | Beginning of period | | | 397,743,406 | | | | 342,160,765 | |
| | End of period | | $ | 422,086,666 | | | $ | 397,743,406 | |
| | Undistributed net investment income (loss) | | $ | 818,872 | | | $ | 680,132 | |
| | (a) | | Class B Shares were converted into Class A Shares at the close of business on November 14, 2014. |
| | |
| 88 | | The accompanying notes are an integral part of these financial statements. |
GOLDMAN SACHS FUNDAMENTAL EQUITY GROWTH FUNDS
| | | | | | | | | | | | | | | | | | | | | | |
| | | Technology Tollkeeper Fund | | | | | U.S. Equity Fund | |
| | | For the Six Months Ended
February 28, 2015
(Unaudited) | | | | | For the Fiscal
Year Ended
August 31, 2014 | | | | | For the Six Months Ended
February 28, 2015
(Unaudited) | | | | | For the Fiscal
Year Ended
August 31, 2014 | |
| | | | | | | | | | | | | | | | | | | | | | |
| | $ | (1,543,243 | ) | | | | $ | (3,605,725 | ) | | | | $ | 67,049 | | | | | $ | 84,945 | |
| | | 26,892,450 | | | | | | 31,713,725 | | | | | | 1,145,443 | | | | | | 2,092,727 | |
| | | 5,177,620 | | | | | | 66,023,829 | | | | | | (356,372 | ) | | | | | 625,983 | |
| | | 30,526,827 | | | | | | 94,131,829 | | | | | | 856,120 | | | | | | 2,803,655 | |
| | | | | | | | | | | | | | | | | | | | | | |
| | | | | | | | | | | | | | | | | | | | | | |
| | | | | | | | | | | | | | | | | | | | | | |
| | | — | | | | | | — | | | | | | (22,274 | ) | | | | | (14,081 | ) |
| | | — | | | | | | — | | | | | | (71,169 | ) | | | | | (59,761 | ) |
| | | — | | | | | | — | | | | | | — | | | | | | — | |
| | | — | | | | | | — | | | | | | (1,481 | ) | | | | | (978 | ) |
| | | — | | | | | | — | | | | | | (255 | ) | | | | | (207 | ) |
| | | | | | | | | | | | | | | | | | | | | | |
| | | (19,398,872 | ) | | | | | (3,390,217 | ) | | | | | (745,006 | ) | | | | | (342,004 | ) |
| | | — | | | | | | (91,485 | ) | | | | | — | | | | | | — | |
| | | (4,987,729 | ) | | | | | (836,560 | ) | | | | | (46,987 | ) | | | | | (14,635 | ) |
| | | (7,490,876 | ) | | | | | (1,086,772 | ) | | | | | (1,330,442 | ) | | | | | (780,489 | ) |
| | | (853,327 | ) | | | | | (169,169 | ) | | | | | — | | | | | | — | |
| | | (226,844 | ) | | | | | (53,596 | ) | | | | | (33,295 | ) | | | | | (16,071 | ) |
| | | — | | | | | | — | | | | | | (17,289 | ) | | | | | (7,485 | ) |
| | | (32,957,648 | ) | | | | | (5,627,799 | ) | | | | | (2,268,198 | ) | | | | | (1,235,711 | ) |
| | | | | | | | | | | | | | | | | | | | | | |
| | | | | | | | | | | | | | | | | | | | | | |
| | | 47,130,718 | | | | | | 109,317,850 | | | | | | 889,466 | | | | | | 2,933,540 | |
| | | 29,561,008 | | | | | | 5,055,014 | | | | | | 2,266,647 | | | | | | 1,079,150 | |
| | | (74,739,958 | ) | | | | | (133,803,184 | ) | | | | | (1,447,267 | ) | | | | | (3,348,013 | ) |
| | | 1,951,768 | | | | | | (19,430,320 | ) | | | | | 1,708,846 | | | | | | 664,677 | |
| | | (479,053 | ) | | | | | 69,073,710 | | | | | | 296,768 | | | | | | 2,232,621 | |
| | | | | | | | | | | | | | | | | | | | | | |
| | | | | | | | | | | | | | | | | | | | | | |
| | | 436,862,781 | | | | | | 367,789,071 | | | | | | 14,099,587 | | | | | | 11,866,966 | |
| | $ | 436,383,728 | | | | | $ | 436,862,781 | | | | | $ | 14,396,355 | | | | | $ | 14,099,587 | |
| | $ | (3,878,480 | ) | | | | $ | (2,335,237 | ) | | | | $ | 33,217 | | | | | $ | 61,347 | |
| | |
| The accompanying notes are an integral part of these financial statements. | | 89 |
GOLDMAN SACHS CAPITAL GROWTH FUND
Financial Highlights
Selected Data for a Share Outstanding Throughout Each Period
| | | | | | | | | | | | | | | | | | | | | | | | | | | | | | |
| | | | | | | | Income (loss) from
investment operations | | | Distributions
to shareholders | |
| | | Year - Share Class | |
Net asset
value,
beginning
of period | | | Net
investment
income (loss)(a) | | | Net realized
and unrealized
gain | | | Total from
investment
operations | | | From net
investment
income | | | From net
realized
gains | | | Total
distributions | |
| | FOR THE SIX MONTHS ENDED FEBRUARY 28, (UNAUDITED) | |
| | 2015 - A | | $ | 28.16 | | | $ | 0.02 | (d) | | $ | 2.52 | | | $ | 2.54 | | | $ | — | | | $ | (4.37 | ) | | $ | (4.37 | ) |
| | 2015 - C | | | 23.45 | | | | (0.07 | )(d) | | | 2.06 | | | | 1.99 | | | | — | | | | (4.37 | ) | | | (4.37 | ) |
| | 2015 - Institutional | | | 30.01 | | | | 0.07 | (d) | | | 2.70 | | | | 2.77 | | | | — | | | | (4.37 | ) | | | (4.37 | ) |
| | 2015 - Service | | | 27.53 | | | | — | (d)(f) | | | 2.45 | | | | 2.45 | | | | — | | | | (4.37 | ) | | | (4.37 | ) |
| | 2015 - IR | | | 28.36 | | | | 0.05 | (d) | | | 2.54 | | | | 2.59 | | | | — | | | | (4.37 | ) | | | (4.37 | ) |
| | 2015 - R | | | 27.64 | | | | (0.02 | )(d) | | | 2.46 | | | | 2.44 | | | | — | | | | (4.37 | ) | | | (4.37 | ) |
| | | | | | | | | | | | | | | | | | | | | | | | | | | | | | |
| | FOR THE FISCAL YEARS ENDED AUGUST 31, | |
| | 2014 - A | | | 28.13 | | | | (0.01 | ) | | | 6.41 | | | | 6.40 | | | | (0.08 | ) | | | (6.29 | ) | | | (6.37 | ) |
| | 2014 - C | | | 24.46 | | | | (0.18 | ) | | | 5.46 | | | | 5.28 | | | | — | | | | (6.29 | ) | | | (6.29 | ) |
| | 2014 - Institutional | | | 29.57 | | | | 0.10 | | | | 6.79 | | | | 6.89 | | | | (0.16 | ) | | | (6.29 | ) | | | (6.45 | ) |
| | 2014 - Service | | | 27.62 | | | | (0.04 | ) | | | 6.29 | | | | 6.25 | | | | (0.05 | ) | | | (6.29 | ) | | | (6.34 | ) |
| | 2014 - IR | | | 28.28 | | | | 0.06 | | | | 6.44 | | | | 6.50 | | | | (0.13 | ) | | | (6.29 | ) | | | (6.42 | ) |
| | 2014 - R | | | 27.75 | | | | (0.08 | ) | | | 6.31 | | | | 6.23 | | | | (0.05 | ) | | | (6.29 | ) | | | (6.34 | ) |
| | 2013 - A | | | 24.40 | | | | 0.10 | (g) | | | 3.66 | | | | 3.76 | | | | (0.03 | ) | | | — | | | | (0.03 | ) |
| | 2013 - C | | | 21.35 | | | | (0.08 | )(g) | | | 3.19 | | | | 3.11 | | | | — | | | | — | | | | — | |
| | 2013 - Institutional | | | 25.64 | | | | 0.21 | (g) | | | 3.84 | | | | 4.05 | | | | (0.12 | ) | | | — | | | | (0.12 | ) |
| | 2013 - Service | | | 23.96 | | | | 0.07 | (g) | | | 3.60 | | | | 3.67 | | | | (0.01 | ) | | | — | | | | (0.01 | ) |
| | 2013 - IR | | | 24.53 | | | | 0.18 | (g) | | | 3.67 | | | | 3.85 | | | | (0.10 | ) | | | — | | | | (0.10 | ) |
| | 2013 - R | | | 24.14 | | | | 0.03 | (g) | | | 3.62 | | | | 3.65 | | | | (0.04 | ) | | | — | | | | (0.04 | ) |
| | 2012 - A | | | 20.49 | | | | 0.02 | | | | 3.93 | | | | 3.95 | | | | (0.04 | ) | | | — | | | | (0.04 | ) |
| | 2012 - C | | | 18.03 | | | | (0.13 | ) | | | 3.45 | | | | 3.32 | | | | — | | | | — | | | | — | |
| | 2012 - Institutional | | | 21.54 | | | | 0.10 | | | | 4.12 | | | | 4.22 | | | | (0.12 | ) | | | — | | | | (0.12 | ) |
| | 2012 - Service | | | 20.13 | | | | — | (f) | | | 3.85 | | | | 3.85 | | | | (0.02 | ) | | | — | | | | (0.02 | ) |
| | 2012 - IR | | | 20.66 | | | | 0.08 | | | | 3.93 | | | | 4.01 | | | | (0.14 | ) | | | — | | | | (0.14 | ) |
| | 2012 - R | | | 20.31 | | | | (0.03 | ) | | | 3.88 | | | | 3.85 | | | | (0.02 | ) | | | — | | | | (0.02 | ) |
| | 2011 - A | | | 17.68 | | | | 0.03 | | | | 2.78 | | | | 2.81 | | | | — | | | | — | | | | — | |
| | 2011 - C | | | 15.68 | | | | (0.12 | ) | | | 2.47 | | | | 2.35 | | | | — | | | | — | | | | — | |
| | 2011 - Institutional | | | 18.57 | | | | 0.12 | | | | 2.91 | | | | 3.03 | | | | (0.06 | ) | | | — | | | | (0.06 | ) |
| | 2011 - Service | | | 17.39 | | | | 0.01 | | | | 2.73 | | | | 2.74 | | | | — | | | | — | | | | — | |
| | 2011 - IR | | | 17.81 | | | | 0.31 | | | | 2.58 | | | | 2.89 | | | | (0.04 | ) | | | — | | | | (0.04 | ) |
| | 2011 - R | | | 17.57 | | | | (0.03 | ) | | | 2.77 | | | | 2.74 | | | | — | | | | — | | | | — | |
| | 2010 - A | | | 16.95 | | | | 0.01 | | | | 0.72 | | | | 0.73 | | | | — | | | | — | | | | — | |
| | 2010 - C | | | 15.14 | | | | (0.11 | ) | | | 0.65 | | | | 0.54 | | | | — | | | | — | | | | — | |
| | 2010 - Institutional | | | 17.72 | | | | 0.10 | | | | 0.75 | | | | 0.85 | | | | — | | | | — | | | | — | |
| | 2010 - Service | | | 16.68 | | | | (0.01 | ) | | | 0.72 | | | | 0.71 | | | | — | | | | — | | | | — | |
| | 2010 - IR | | | 17.02 | | | | 0.07 | | | | 0.72 | | | | 0.79 | | | | — | | | | — | | | | — | |
| | 2010 - R | | | 16.88 | | | | (0.01 | ) | | | 0.70 | | | | 0.69 | | | | — | | | | — | | | | — | |
| | (a) | | Calculated based on the average shares outstanding methodology. |
| | (b) | | Assumes investment at the net asset value at the beginning of the period, reinvestment of all dividends and distributions, a complete redemption of the investment at the net asset value at the end of the period and no sales or redemption charges. Total returns would be reduced if a sales or redemption charge was taken into account. Returns do not reflect the deduction of taxes that a shareholder would pay on Fund distributions or the redemption of Fund shares. Total returns for periods less than one full year are not annualized. |
| | (c) | | The Fund’s portfolio turnover rate is calculated in accordance with regulatory requirements, without regard to transactions involving short term investments and certain derivatives. If such transactions were included, the Fund’s portfolio turnover rate may be higher. |
| | (d) | | Reflects income recognized from special dividends which amounted to $0.03 per share and 0.23% of average net assets. |
| | (f) | | Amount is less than $0.005 per share. |
| | (g) | | Reflects income recognized from special dividends which amounted to $0.06 per share and 0.21% of average net assets. |
| | |
| 90 | | The accompanying notes are an integral part of these financial statements. |
GOLDMAN SACHS CAPITAL GROWTH FUND
| | | | | | | | | | | | | | | | | | | | | | | | | | | | | | | | | | | | | | | | |
| | | | | | | | | | | | | | | | | | | | | | | | | | | | | | | | | | |
| | | Net asset
value, end
of period | | | | | Total
return(b) | | | | | Net assets,
end of
period
(in 000s) | | | | | Ratio of
net expenses
to average
net assets | | | | | Ratio of
total expenses
to average
net assets | | | | | Ratio of
net investment
income (loss)
to average
net assets | | | | | Portfolio
turnover
rate(c) | |
| | | | | | | | | | | | | | | | | | | | | | | | | | | | | | | | | | | | | | | | |
| | $ | 26.33 | | | | | | 9.72 | % | | | | $ | 745,273 | | | | | | 1.15 | %(e) | | | | | 1.49 | %(e) | | | | | 0.12 | %(d)(e) | | | | | 30 | % |
| | | 21.07 | | | | | | 9.30 | | | | | | 84,997 | | | | | | 1.90 | (e) | | | | | 2.24 | (e) | | | | | (0.63 | )(d)(e) | | | | | 30 | |
| | | 28.41 | | | | | | 9.90 | | | | | | 184,148 | | | | | | 0.75 | (e) | | | | | 1.09 | (e) | | | | | 0.52 | (d)(e) | | | | | 30 | |
| | | 25.61 | | | | | | 9.61 | | | | | | 1,122 | | | | | | 1.25 | (e) | | | | | 1.59 | (e) | | | | | 0.02 | (d)(e) | | | | | 30 | |
| | | 26.58 | | | | | | 9.83 | | | | | | 3,336 | | | | | | 0.90 | (e) | | | | | 1.24 | (e) | | | | | 0.37 | (d)(e) | | | | | 30 | |
| | | 25.71 | | | | | | 9.53 | | | | | | 3,631 | | | | | | 1.40 | (e) | | | | | 1.74 | (e) | | | | | (0.14 | )(d)(e) | | | | | 30 | |
| | | | | | | | | | | | | | | | | | | | | | | | | | | | | | | | | | | | | | | | |
| | | | | | | | | | | | | | | | | | | | | | | | | | | | | | | | | | | | | | | | |
| | | 28.16 | | | | | | 25.50 | | | | | | 702,534 | | | | | | 1.16 | | | | | | 1.51 | | | | | | (0.05 | ) | | | | | 75 | |
| | | 23.45 | | | | | | 24.57 | | | | | | 81,954 | | | | | | 1.91 | | | | | | 2.26 | | | | | | (0.80 | ) | | | | | 75 | |
| | | 30.01 | | | | | | 26.03 | | | | | | 147,642 | | | | | | 0.76 | | | | | | 1.11 | | | | | | 0.35 | | | | | | 75 | |
| | | 27.53 | | | | | | 25.39 | | | | | | 1,135 | | | | | | 1.26 | | | | | | 1.61 | | | | | | (0.15 | ) | | | | | 75 | |
| | | 28.36 | | | | | | 25.80 | | | | | | 2,951 | | | | | | 0.91 | | | | | | 1.26 | | | | | | 0.20 | | | | | | 75 | |
| | | 27.64 | | | | | | 25.18 | | | | | | 3,571 | | | | | | 1.41 | | | | | | 1.76 | | | | | | (0.30 | ) | | | | | 75 | |
| | | 28.13 | | | | | | 15.41 | | | | | | 630,495 | | | | | | 1.14 | | | | | | 1.50 | | | | | | 0.38 | (g) | | | | | 52 | |
| | | 24.46 | | | | | | 14.57 | | | | | | 75,375 | | | | | | 1.89 | | | | | | 2.25 | | | | | | (0.37 | )(g) | | | | | 52 | |
| | | 29.57 | | | | | | 15.89 | | | | | | 124,795 | | | | | | 0.74 | | | | | | 1.10 | | | | | | 0.75 | (g) | | | | | 52 | |
| | | 27.62 | | | | | | 15.32 | | | | | | 980 | | | | | | 1.24 | | | | | | 1.60 | | | | | | 0.27 | (g) | | | | | 52 | |
| | | 28.28 | | | | | | 15.75 | | | | | | 2,112 | | | | | | 0.89 | | | | | | 1.25 | | | | | | 0.67 | (g) | | | | | 52 | |
| | | 27.75 | | | | | | 15.15 | | | | | | 2,480 | | | | | | 1.39 | | | | | | 1.75 | | | | | | 0.13 | (g) | | | | | 52 | |
| | | 24.40 | | | | | | 19.24 | | | | | | 662,127 | | | | | | 1.14 | | | | | | 1.48 | | | | | | 0.09 | | | | | | 55 | |
| | | 21.35 | | | | | | 18.36 | | | | | | 73,162 | | | | | | 1.89 | | | | | | 2.23 | | | | | | (0.66 | ) | | | | | 55 | |
| | | 25.64 | | | | | | 19.64 | | | | | | 83,466 | | | | | | 0.74 | | | | | | 1.08 | | | | | | 0.42 | | | | | | 55 | �� |
| | | 23.96 | | | | | | 19.08 | | | | | | 1,072 | | | | | | 1.24 | | | | | | 1.58 | | | | | | (0.02 | ) | | | | | 55 | |
| | | 24.53 | | | | | | 19.48 | | | | | | 2,415 | | | | | | 0.89 | | | | | | 1.23 | | | | | | 0.36 | | | | | | 55 | |
| | | 24.14 | | | | | | 18.92 | | | | | | 1,475 | | | | | | 1.39 | | | | | | 1.73 | | | | | | (0.12 | ) | | | | | 55 | |
| | | 20.49 | | | | | | 15.89 | | | | | | 662,256 | | | | | | 1.14 | | | | | | 1.47 | | | | | | 0.13 | | | | | | 58 | |
| | | 18.03 | | | | | | 14.99 | | | | | | 72,314 | | | | | | 1.89 | | | | | | 2.22 | | | | | | (0.62 | ) | | | | | 58 | |
| | | 21.54 | | | | | | 16.33 | | | | | | 299,223 | | | | | | 0.74 | | | | | | 1.07 | | | | | | 0.53 | | | | | | 58 | |
| | | 20.13 | | | | | | 15.76 | | | | | | 953 | | | | | | 1.24 | | | | | | 1.57 | | | | | | 0.03 | | | | | | 58 | |
| | | 20.66 | | | | | | 16.20 | | | | | | 1,472 | | | | | | 0.89 | | | | | | 1.22 | | | | | | 1.64 | | | | | | 58 | |
| | | 20.31 | | | | | | 15.59 | | | | | | 567 | | | | | | 1.39 | | | | | | 1.72 | | | | | | (0.12 | ) | | | | | 58 | |
| | | 17.68 | | | | | | 4.31 | | | | | | 707,444 | | | | | | 1.14 | | | | | | 1.47 | | | | | | 0.07 | | | | | | 31 | |
| | | 15.68 | | | | | | 3.57 | | | | | | 75,203 | | | | | | 1.89 | | | | | | 2.22 | | | | | | (0.67 | ) | | | | | 31 | |
| | | 18.57 | | | | | | 4.80 | | | | | | 344,601 | | | | | | 0.74 | | | | | | 1.07 | | | | | | 0.52 | | | | | | 31 | |
| | | 17.39 | | | | | | 4.26 | | | | | | 988 | | | | | | 1.24 | | | | | | 1.57 | | | | | | (0.03 | ) | | | | | 31 | |
| | | 17.81 | | | | | | 4.64 | | | | | | 8 | | | | | | 0.89 | | | | | | 1.22 | | | | | | 0.36 | | | | | | 31 | |
| | | 17.57 | | | | | | 4.09 | | | | | | 412 | | | | | | 1.39 | | | | | | 1.72 | | | | | | (0.08 | ) | | | | | 31 | |
| | |
| The accompanying notes are an integral part of these financial statements. | | 91 |
GOLDMAN SACHS CONCENTRATED GROWTH FUND
Financial Highlights
Selected Data for a Share Outstanding Throughout Each Period
| | | | | | | | | | | | | | | | | | | | | | | | | | | | | | |
| | | | | | | | Income (loss) from
investment operations | | | Distributions
to shareholders | |
| | | Year - Share Class | | Net asset
value,
beginning
of period | | | Net
investment
income (loss)(a) | | | Net realized
and unrealized
gain | | | Total from
investment
operations | | | From net
investment
income | | | From net
realized
gains | | | Total
distributions | |
| | FOR THE SIX MONTHS ENDED FEBRUARY 28, (UNAUDITED) | |
| | 2015 - A | | $ | 18.94 | | | $ | 0.02 | (d) | | $ | 1.61 | | | $ | 1.63 | | | $ | — | | | $ | (3.43 | ) | | $ | (3.43 | ) |
| | 2015 - C | | | 17.09 | | | | (0.04 | )(d) | | | 1.43 | | | | 1.39 | | | | — | | | | (3.43 | ) | | | (3.43 | ) |
| | 2015 - Institutional | | | 19.71 | | | | 0.06 | (d) | | | 1.69 | | | | 1.75 | | | | (0.05 | ) | | | (3.43 | ) | | | (3.48 | ) |
| | 2015 - IR | | | 19.10 | | | | 0.04 | (d) | | | 1.64 | | | | 1.68 | | | | (0.02 | ) | | | (3.43 | ) | | | (3.45 | ) |
| | 2015 - R | | | 18.64 | | | | — | (d)(f) | | | 1.58 | | | | 1.58 | | | | — | | | | (3.43 | ) | | | (3.43 | ) |
| | | | | | | | | | | | | | | | | | | | | | | | | | | | | | |
| | FOR THE FISCAL YEARS ENDED AUGUST 31, | |
| | 2014 - A | | | 17.05 | | | | (0.06 | ) | | | 3.78 | | | | 3.72 | | | | — | | | | (1.83 | ) | | | (1.83 | ) |
| | 2014 - C | | | 15.65 | | | | (0.17 | ) | | | 3.44 | | | | 3.27 | | | | — | | | | (1.83 | ) | | | (1.83 | ) |
| | 2014 - Institutional | | | 17.63 | | | | 0.02 | | | | 3.92 | | | | 3.94 | | | | (0.03 | ) | | | (1.83 | ) | | | (1.86 | ) |
| | 2014 - IR | | | 17.15 | | | | (0.01 | ) | | | 3.81 | | | | 3.80 | | | | (0.02 | ) | | | (1.83 | ) | | | (1.85 | ) |
| | 2014 - R | | | 16.84 | | | | (0.10 | ) | | | 3.73 | | | | 3.63 | | | | — | | | | (1.83 | ) | | | (1.83 | ) |
| | 2013 - A | | | 14.97 | | | | 0.11 | (g) | | | 2.03 | | | | 2.14 | | | | (0.06 | ) | | | — | | | | (0.06 | ) |
| | 2013 - C | | | 13.79 | | | | (0.06 | )(g) | | | 1.93 | | | | 1.87 | | | | (0.01 | ) | | | — | | | | (0.01 | ) |
| | 2013 - Institutional | | | 15.48 | | | | 0.09 | (g) | | | 2.18 | | | | 2.27 | | | | (0.12 | ) | | | — | | | | (0.12 | ) |
| | 2013 - IR | | | 15.07 | | | | 0.12 | (g) | | | 2.07 | | | | 2.19 | | | | (0.11 | ) | | | — | | | | (0.11 | ) |
| | 2013 - R | | | 14.80 | | | | 0.01 | (g) | | | 2.06 | | | | 2.07 | | | | (0.03 | ) | | | — | | | | (0.03 | ) |
| | 2012 - A | | | 12.64 | | | | — | (f) | | | 2.33 | | | | 2.33 | | | | — | | | | — | | | | — | |
| | 2012 - C | | | 11.73 | | | | (0.09 | ) | | | 2.15 | | | | 2.06 | | | | — | | | | — | | | | — | |
| | 2012 - Institutional | | | 13.07 | | | | 0.05 | | | | 2.41 | | | | 2.46 | | | | (0.05 | ) | | | — | | | | (0.05 | ) |
| | 2012 - IR | | | 12.73 | | | | 0.04 | | | | 2.34 | | | | 2.38 | | | | (0.04 | ) | | | — | | | | (0.04 | ) |
| | 2012 - R | | | 12.52 | | | | (0.03 | ) | | | 2.31 | | | | 2.28 | | | | — | | | | — | | | | — | |
| | 2011 - A | | | 10.91 | | | | (0.01 | ) | | | 1.74 | | | | 1.73 | | | | — | | | | — | | | | — | |
| | 2011 - C | | | 10.20 | | | | (0.10 | ) | | | 1.63 | | | | 1.53 | | | | — | | | | — | | | | — | |
| | 2011 - Institutional | | | 11.25 | | | | 0.04 | | | | 1.80 | | | | 1.84 | | | | (0.02 | ) | | | — | | | | (0.02 | ) |
| | 2011 - IR | | | 10.97 | | | | 0.04 | | | | 1.73 | | | | 1.77 | | | | (0.01 | ) | | | — | | | | (0.01 | ) |
| | 2011 - R | | | 10.83 | | | | (0.04 | ) | | | 1.73 | | | | 1.69 | | | | — | | | | — | | | | — | |
| | 2010 - A | | | 10.51 | | | | (0.02 | ) | | | 0.42 | | | | 0.40 | | | | — | | | | — | | | | — | |
| | 2010 - C | | | 9.90 | | | | (0.11 | ) | | | 0.41 | | | | 0.30 | | | | — | | | | — | | | | — | |
| | 2010 - Institutional | | | 10.79 | | | | 0.02 | | | | 0.44 | | | | 0.46 | | | | — | | | | — | | | | — | |
| | 2010 - IR | | | 10.54 | | | | 0.03 | | | | 0.40 | | | | 0.43 | | | | — | | | | — | | | | — | |
| | 2010 - R | | | 10.46 | | | | (0.05 | ) | | | 0.42 | | | | 0.37 | | | | — | | | | — | | | | — | |
| | (a) | | Calculated based on the average shares outstanding methodology. |
| | (b) | | Assumes investment at the net asset value at the beginning of the period, reinvestment of all dividends and distributions, a complete redemption of the investment at the net asset value at the end of the period and no sales or redemption charges. Total returns would be reduced if a sales or redemption charge was taken into account. Returns do not reflect the deduction of taxes that a shareholder would pay on Fund distributions or the redemption of Fund shares. Total returns for periods less than one full year are not annualized. |
| | (c) | | The Fund’s portfolio turnover rate is calculated in accordance with regulatory requirements, without regard to transactions involving short term investments and certain derivatives. If such transactions were included, the Fund’s portfolio turnover rate may be higher. |
| | (d) | | Reflects income recognized from special dividends which amounted to $0.05 per share and 0.61% of average net assets. |
| | (f) | | Reflects income recognized from a special dividend which amounted to $0.06 per share and 0.35% of average net assets. |
| | (g) | | Amount is less than $0.005 per share. |
| | |
| 92 | | The accompanying notes are an integral part of these financial statements. |
GOLDMAN SACHS CONCENTRATED GROWTH FUND
| | | | | | | | | | | | | | | | | | | | | | | | | | | | | | | | | | | | | | | | |
| | | | | | | | | | | | | | | | | | | | | | | | | | | | | | | | | | |
| | | Net asset value, end of period | | | | | Total return(b) | | | | | Net assets, end of period (in 000s) | | | | | Ratio of net expenses to average net assets | | | | | Ratio of total expenses to average net assets | | | | | Ratio of net investment income (loss) to average net assets | | | | | Portfolio turnover rate(c) | |
| | | | | | | | | | | | | | | | | | | | | | | | | | | | | | | | | | | | | | | | |
| | $ | 17.14 | | | | | | 9.43 | % | | | | $ | 8,018 | | | | | | 1.25 | %(e) | | | | | 1.57 | %(e) | | | | | 0.25 | %(d)(e) | | | | | 25 | % |
| | | 15.05 | | | | | | 9.02 | | | | | | 3,822 | | | | | | 2.00 | (e) | | | | | 2.32 | (e) | | | | | (0.50 | )(d)(e) | | | | | 25 | |
| | | 17.98 | | | | | | 9.68 | | | | | | 174,511 | | | | | | 0.85 | (e) | | | | | 1.17 | (e) | | | | | 0.65 | (d)(e) | | | | | 25 | |
| | | 17.33 | | | | | | 9.60 | | | | | | 423 | | | | | | 1.00 | (e) | | | | | 1.32 | (e) | | | | | 0.50 | (d)(e) | | | | | 25 | |
| | | 16.79 | | | | | | 9.31 | | | | | | 16 | | | | | | 1.50 | (e) | | | | | 1.82 | (e) | | | | | (0.01 | )(d)(e) | | | | | 25 | |
| | | | | | | | | | | | | | | | | | | | | | | | | | | | | | | | | | | | | | | | |
| | | | | | | | | | | | | | | | | | | | | | | | | | | | | | | | | | | | | | | | |
| | | 18.94 | | | | | | 22.88 | | | | | | 7,564 | | | | | | 1.27 | | | | | | 1.60 | | | | | | (0.32 | ) | | | | | 60 | |
| | | 17.09 | | | | | | 21.98 | | | | | | 3,460 | | | | | | 2.02 | | | | | | 2.35 | | | | | | (1.06 | ) | | | | | 60 | |
| | | 19.71 | | | | | | 23.44 | | | | | | 169,387 | | | | | | 0.87 | | | | | | 1.20 | | | | | | 0.09 | | | | | | 60 | |
| | | 19.10 | | | | | | 23.20 | | | | | | 385 | | | | | | 1.02 | | | | | | 1.35 | | | | | | (0.06 | ) | | | | | 60 | |
| | | 18.64 | | | | | | 22.61 | | | | | | 14 | | | | | | 1.50 | | | | | | 1.84 | | | | | | (0.55 | ) | | | | | 60 | |
| | | 17.05 | | | | | | 14.36 | | | | | | 8,476 | | | | | | 1.26 | | | | | | 1.62 | | | | | | 0.69 | (g) | | | | | 57 | |
| | | 15.65 | | | | | | 13.57 | | | | | | 2,561 | | | | | | 2.01 | | | | | | 2.37 | | | | | | (0.39 | )(g) | | | | | 57 | |
| | | 17.63 | | | | | | 14.81 | | | | | | 146,183 | | | | | | 0.86 | | | | | | 1.23 | | | | | | 0.56 | (g) | | | | | 57 | |
| | | 17.15 | | | | | | 14.61 | | | | | | 346 | | | | | | 1.01 | | | | | | 1.38 | | | | | | 0.76 | (g) | | | | | 57 | |
| | | 16.84 | | | | | | 14.13 | | | | | | 12 | | | | | | 1.51 | | | | | | 1.87 | | | | | | 0.09 | (g) | | | | | 57 | |
| | | 14.97 | | | | | | 18.38 | | | | | | 92,207 | | | | | | 1.26 | | | | | | 1.57 | | | | | | 0.01 | | | | | | 33 | |
| | | 13.79 | | | | | | 17.51 | | | | | | 2,877 | | | | | | 2.01 | | | | | | 2.32 | | | | | | (0.72 | ) | | | | | 33 | |
| | | 15.48 | | | | | | 18.80 | | | | | | 56,118 | | | | | | 0.86 | | | | | | 1.17 | | | | | | 0.39 | | | | | | 33 | |
| | | 15.07 | | | | | | 18.69 | | | | | | 584 | | | | | | 1.01 | | | | | | 1.32 | | | | | | 0.28 | | | | | | 33 | |
| | | 14.80 | | | | | | 18.08 | | | | | | 10 | | | | | | 1.51 | | | | | | 1.82 | | | | | | (0.22 | ) | | | | | 33 | |
| | | 12.64 | | | | | | 15.86 | | | | | | 109,826 | | | | | | 1.30 | | | | | | 1.56 | | | | | | (0.08 | ) | | | | | 35 | |
| | | 11.73 | | | | | | 15.00 | | | | | | 2,000 | | | | | | 2.05 | | | | | | 2.31 | | | | | | (0.82 | ) | | | | | 35 | |
| | | 13.07 | | | | | | 16.35 | | | | | | 126,113 | | | | | | 0.90 | | | | | | 1.16 | | | | | | 0.33 | | | | | | 35 | |
| | | 12.73 | | | | | | 16.13 | | | | | | 437 | | | | | | 1.05 | | | | | | 1.31 | | | | | | 0.28 | | | | | | 35 | |
| | | 12.52 | | | | | | 15.60 | | | | | | 9 | | | | | | 1.55 | | | | | | 1.81 | | | | | | (0.29 | ) | | | | | 35 | |
| | | 10.91 | | | | | | 3.81 | | | | | | 108,338 | | | | | | 1.30 | | | | | | 1.56 | | | | | | (0.22 | ) | | | | | 45 | |
| | | 10.20 | | | | | | 3.03 | | | | | | 1,356 | | | | | | 2.05 | | | | | | 2.31 | | | | | | (0.97 | ) | | | | | 45 | |
| | | 11.25 | | | | | | 4.26 | | | | | | 124,258 | | | | | | 0.90 | | | | | | 1.16 | | | | | | 0.18 | | | | | | 45 | |
| | | 10.97 | | | | | | 4.08 | | | | | | 147 | | | | | | 1.05 | | | | | | 1.31 | | | | | | 0.27 | | | | | | 45 | |
| | | 10.83 | | | | | | 3.54 | | | | | | 8 | | | | | | 1.55 | | | | | | 1.81 | | | | | | (0.45 | ) | | | | | 45 | |
| | |
| The accompanying notes are an integral part of these financial statements. | | 93 |
GOLDMAN SACHS FLEXIBLE CAP GROWTH FUND
Financial Highlights
Selected Data for a Share Outstanding Throughout Each Period
| | | | | | | | | | | | | | | | | | | | | | | | | | | | | | |
| | | | | | | | Income (loss) from
investment operations | | | Distributions
to shareholders | |
| | | Year - Share Class | | Net asset
value,
beginning
of period | | | Net
investment
income (loss)(a) | | | Net realized
and unrealized
gain | | | Total from
investment
operations | | | From net
investment
income | | | From net
realized
gains | | | Total
distributions | |
| | FOR THE SIX MONTHS ENDED FEBRUARY 28, (UNAUDITED) | |
| | 2015 - A | | $ | 13.21 | | | $ | (0.01 | )(d) | | $ | 1.13 | | | $ | 1.12 | | | $ | — | | | $ | (1.90 | ) | | $ | (1.90 | ) |
| | 2015 - C | | | 12.43 | | | | (0.05 | )(d) | | | 1.05 | | | | 1.00 | | | | — | | | | (1.90 | ) | | | (1.90 | ) |
| | 2015 - Institutional | | | 13.68 | | | | 0.01 | (d) | | | 1.17 | | | | 1.18 | | | | — | | | | (1.90 | ) | | | (1.90 | ) |
| | 2015 - IR | | | 13.53 | | | | 0.01 | (d) | | | 1.16 | | | | 1.17 | | | | — | | | | (1.90 | ) | | | (1.90 | ) |
| | 2015 - R | | | 12.97 | | | | (0.03 | )(d) | | | 1.11 | | | | 1.08 | | | | — | | | | (1.90 | ) | | | (1.90 | ) |
| | | | | | | | | | | | | | | | | | | | | | | | | | | | | | |
| | FOR THE FISCAL YEARS ENDED AUGUST 31, | |
| | 2014 - A | | | 11.83 | | | | (0.05 | ) | | | 3.01 | | | | 2.96 | | | | — | | | | (1.58 | ) | | | (1.58 | ) |
| | 2014 - C | | | 11.29 | | | | (0.14 | ) | | | 2.86 | | | | 2.72 | | | | — | | | | (1.58 | ) | | | (1.58 | ) |
| | 2014 - Institutional | | | 12.17 | | | | — | (f) | | | 3.11 | | | | 3.11 | | | | (0.02 | ) | | | (1.58 | ) | | | (1.60 | ) |
| | 2014 - IR | | | 12.05 | | | | (0.02 | ) | | | 3.08 | | | | 3.06 | | | | — | | | | (1.58 | ) | | | (1.58 | ) |
| | 2014 - R | | | 11.66 | | | | (0.08 | ) | | | 2.97 | | | | 2.89 | | | | — | | | | (1.58 | ) | | | (1.58 | ) |
| | 2013 - A | | | 11.48 | | | | — | (f)(h) | | | 1.71 | | | | 1.71 | | | | — | | | | (1.36 | ) | | | (1.36 | ) |
| | 2013 - C | | | 11.09 | | | | (0.08 | )(h) | | | 1.64 | | | | 1.56 | | | | — | | | | (1.36 | ) | | | (1.36 | ) |
| | 2013 - Institutional | | | 11.73 | | | | 0.04 | (h) | | | 1.76 | | | | 1.80 | | | | — | | | | (1.36 | ) | | | (1.36 | ) |
| | 2013 - IR | | | 11.64 | | | | 0.03 | (h) | | | 1.74 | | | | 1.77 | | | | — | | | | (1.36 | ) | | | (1.36 | ) |
| | 2013 - R | | | 11.36 | | | | (0.02 | )(h) | | | 1.68 | | | | 1.66 | | | | — | | | | (1.36 | ) | | | (1.36 | ) |
| | 2012 - A | | | 10.38 | | | | (0.02 | ) | | | 1.71 | | | | 1.69 | | | | — | | | | (0.59 | ) | | | (0.59 | ) |
| | 2012 - C | | | 10.12 | | | | (0.10 | ) | | | 1.66 | | | | 1.56 | | | | — | | | | (0.59 | ) | | | (0.59 | ) |
| | 2012 - Institutional | | | 10.55 | | | | 0.02 | | | | 1.75 | | | | 1.77 | | | | — | | | | (0.59 | ) | | | (0.59 | ) |
| | 2012 - IR | | | 10.49 | | | | 0.01 | | | | 1.73 | | | | 1.74 | | | | — | | | | (0.59 | ) | | | (0.59 | ) |
| | 2012 - R | | | 10.30 | | | | (0.05 | ) | | | 1.70 | | | | 1.65 | | | | — | | | | (0.59 | ) | | | (0.59 | ) |
| | 2011 - A | | | 9.41 | | | | (0.04 | ) | | | 1.51 | | | | 1.47 | | | | — | | | | (0.50 | ) | | | (0.50 | ) |
| | 2011 - C | | | 9.25 | | | | (0.12 | ) | | | 1.49 | | | | 1.37 | | | | — | | | | (0.50 | ) | | | (0.50 | ) |
| | 2011 - Institutional | | | 9.53 | | | | — | (f) | | | 1.52 | | | | 1.52 | | | | — | | | | (0.50 | ) | | | (0.50 | ) |
| | 2011 - IR | | | 9.49 | | | | — | (f) | | | 1.50 | | | | 1.50 | | | | — | | | | (0.50 | ) | | | (0.50 | ) |
| | 2011 - R | | | 9.37 | | | | (0.07 | ) | | | 1.50 | | | | 1.43 | | | | — | | | | (0.50 | ) | | | (0.50 | ) |
| | 2010 - A | | | 8.83 | | | | (0.03 | ) | | | 0.61 | | | | 0.58 | | | | — | | | | — | | | | — | |
| | 2010 - C | | | 8.75 | | | | (0.11 | ) | | | 0.61 | | | | 0.50 | | | | — | | | | — | | | | — | |
| | 2010 - Institutional | | | 8.90 | | | | — | (f) | | | 0.63 | | | | 0.63 | | | | — | | | | — | | | | — | |
| | 2010 - IR | | | 8.88 | | | | (0.01 | ) | | | 0.62 | | | | 0.61 | | | | — | | | | — | | | | — | |
| | 2010 - R | | | 8.81 | | | | (0.06 | ) | | | 0.62 | | | | 0.56 | | | | — | | | | — | | | | — | |
| | (a) | | Calculated based on the average shares outstanding methodology. |
| | (b) | | Assumes investment at the net asset value at the beginning of the period, reinvestment of all dividends and distributions, a complete redemption of the investment at the net asset value at the end of the period and no sales or redemption charges. Total returns would be reduced if a sales or redemption charge was taken into account. Returns do not reflect the deduction of taxes that a shareholder would pay on Fund distributions or the redemption of Fund shares. Total returns for periods less than one full year are not annualized. |
| | (c) | | The Fund’s portfolio turnover rate is calculated in accordance with regulatory requirements, without regard to transactions involving short term investments and certain derivatives. If such transactions were included, the Fund’s portfolio turnover rate may be higher. |
| | (d) | | Reflects income recognized from special dividends which amounted to $0.02 per share and 0.29% of average net assets. |
| | (f) | | Amount is less than $0.005 per share. |
| | (g) | | Amount is less than 0.005% of average net assets. |
| | (h) | | Reflects income recognized from special dividends which amounted to $0.02 per share and 0.20% of average net assets. |
| | |
| 94 | | The accompanying notes are an integral part of these financial statements. |
GOLDMAN SACHS FLEXIBLE CAP GROWTH FUND
| | | | | | | | | | | | | | | | | | | | | | | | | | | | | | | | | | | | | | | | |
| | | | | | | | | | | | | | | | | | | | | | | | | | | | | | | | | | |
| | | Net asset
value, end
of period | | | | | Total
return(b) | | | | | Net assets,
end of
period
(in 000s) | | | | | Ratio of
net expenses
to average
net assets | | | | | Ratio of
total expenses
to average
net assets | | | | | Ratio of
net investment
income (loss)
to average
net assets | | | | | Portfolio
turnover
rate(c) | |
| | | | | | | | | | | | | | | | | | | | | | | | | | | | | | | | | | | | | | | | |
| | $ | 12.43 | | | | | | 9.24 | % | | | | $ | 7,087 | | | | | | 1.25 | %(e) | | | | | 2.81 | %(e) | | | | | (0.19 | )%(d)(e) | | | | | 25 | % |
| | | 11.53 | | | | | | 8.84 | | | | | | 1,729 | | | | | | 2.00 | (e) | | | | | 3.52 | (e) | | | | | (0.91 | )(d)(e) | | | | | 25 | |
| | | 12.96 | | | | | | 9.38 | | | | | | 8,726 | | | | | | 0.85 | (e) | | | | | 2.43 | (e) | | | | | 0.20 | (d)(e) | | | | | 25 | |
| | | 12.80 | | | | | | 9.41 | | | | | | 368 | | | | | | 0.99 | (e) | | | | | 2.46 | (e) | | | | | 0.09 | (d)(e) | | | | | 25 | |
| | | 12.15 | | | | | | 9.10 | | | | | | 33 | | | | | | 1.50 | (e) | | | | | 3.17 | (e) | | | | | (0.48 | )(d)(e) | | | | | 25 | |
| | | | | | | | | | | | | | | | | | | | | | | | | | | | | | | | | | | | | | | | |
| | | | | | | | | | | | | | | | | | | | | | | | | | | | | | | | | | | | | | | | |
| | | 13.21 | | | | | | 26.62 | | | | | | 5,665 | | | | | | 1.28 | | | | | | 3.32 | | | | | | (0.40 | ) | | | | | 56 | |
| | | 12.43 | | | | | | 25.68 | | | | | | 1,119 | | | | | | 2.03 | | | | | | 4.09 | | | | | | (1.15 | ) | | | | | 56 | |
| | | 13.68 | | | | | | 27.21 | | | | | | 8,262 | | | | | | 0.88 | | | | | | 2.92 | | | | | | — | (g) | | | | | 56 | |
| | | 13.53 | | | | | | 26.98 | | | | | | 126 | | | | | | 1.03 | | | | | | 3.04 | | | | | | (0.17 | ) | | | | | 56 | |
| | | 12.97 | | | | | | 26.38 | | | | | | 55 | | | | | | 1.53 | | | | | | 3.56 | | | | | | (0.65 | ) | | | | | 56 | |
| | | 11.83 | | | | | | 16.78 | | | | | | 4,584 | | | | | | 1.26 | | | | | | 3.62 | | | | | | 0.03 | (h) | | | | | 40 | |
| | | 11.29 | | | | | | 15.94 | | | | | | 1,005 | | | | | | 2.01 | | | | | | 4.32 | | | | | | (0.75 | )(h) | | | | | 40 | |
| | | 12.17 | | | | | | 17.23 | | | | | | 6,215 | | | | | | 0.86 | | | | | | 3.18 | | | | | | 0.37 | (h) | | | | | 40 | |
| | | 12.05 | | | | | | 17.08 | | | | | | 167 | | | | | | 1.01 | | | | | | 3.35 | | | | | | 0.26 | (h) | | | | | 40 | |
| | | 11.66 | | | | | | 16.50 | | | | | | 41 | | | | | | 1.51 | | | | | | 3.91 | | | | | | (0.19 | )(h) | | | | | 40 | |
| | | 11.48 | | | | | | 17.11 | | | | | | 7,423 | | | | | | 1.26 | | | | | | 3.14 | | | | | | (0.22 | ) | | | | | 32 | |
| | | 11.09 | | | | | | 16.23 | | | | | | 975 | | | | | | 2.01 | | | | | | 3.89 | | | | | | (0.95 | ) | | | | | 32 | |
| | | 11.73 | | | | | | 17.61 | | | | | | 4,640 | | | | | | 0.86 | | | | | | 2.74 | | | | | | 0.21 | | | | | | 32 | |
| | | 11.64 | | | | | | 17.41 | | | | | | 179 | | | | | | 1.01 | | | | | | 2.89 | | | | | | 0.06 | | | | | | 32 | |
| | | 11.36 | | | | | | 16.84 | | | | | | 63 | | | | | | 1.51 | | | | | | 3.39 | | | | | | (0.43 | ) | | | | | 32 | |
| | | 10.38 | | | | | | 15.42 | | | | | | 15,853 | | | | | | 1.34 | | | | | | 2.59 | | | | | | (0.37 | ) | | | | | 51 | |
| | | 10.12 | | | | | | 14.58 | | | | | | 974 | | | | | | 2.09 | | | | | | 3.34 | | | | | | (1.10 | ) | | | | | 51 | |
| | | 10.55 | | | | | | 15.77 | | | | | | 4,142 | | | | | | 0.94 | | | | | | 2.19 | | | | | | 0.04 | | | | | | 51 | |
| | | 10.49 | | | | | | 15.62 | | | | | | 116 | | | | | | 1.09 | | | | | | 2.34 | | | | | | (0.04 | ) | | | | | 51 | |
| | | 10.30 | | | | | | 15.05 | | | | | | 11 | | | | | | 1.59 | | | | | | 2.84 | | | | | | (0.61 | ) | | | | | 51 | |
| | | 9.41 | | | | | | 6.57 | | | | | | 14,952 | | | | | | 1.35 | | | | | | 2.91 | | | | | | (0.35 | ) | | | | | 61 | |
| | | 9.25 | | | | | | 5.71 | | | | | | 650 | | | | | | 2.10 | | | | | | 3.66 | | | | | | (1.10 | ) | | | | | 61 | |
| | | 9.53 | | | | | | 7.08 | | | | | | 3,145 | | | | | | 0.95 | | | | | | 2.51 | | | | | | 0.04 | | | | | | 61 | |
| | | 9.49 | | | | | | 6.87 | | | | | | 43 | | | | | | 1.10 | | | | | | 2.66 | | | | | | (0.10 | ) | | | | | 61 | |
| | | 9.37 | | | | | | 6.36 | | | | | | 10 | | | | | | 1.60 | | | | | | 3.16 | | | | | | (0.59 | ) | | | | | 61 | |
| | |
| The accompanying notes are an integral part of these financial statements. | | 95 |
GOLDMAN SACHS FOCUSED GROWTH FUND
Financial Highlights
Selected Data for a Share Outstanding Throughout Each Period
| | | | | | | | | | | | | | | | | | | | | | | | | | | | | | |
| | | | | | | | Income (loss) from
investment operations | | | Distributions
to shareholders | |
| | | Year - Share Class | | Net asset
value,
beginning
of period | | | Net
investment
income (loss)(a) | | | Net realized
and unrealized
gain | | | Total from
investment
operations | | | From net
investment
income | | | From net
realized
gains | | | Total
distributions | |
| | FOR THE SIX MONTHS ENDED FEBRUARY 28, (UNAUDITED) | |
| | 2015 - A | | $ | 14.74 | | | $ | 0.02 | (d) | | $ | 1.41 | | | $ | 1.43 | | | $ | — | | | $ | (1.02 | ) | | $ | (1.02 | ) |
| | 2015 - C | | | 14.51 | | | | (0.03 | )(d) | | | 1.38 | | | | 1.35 | | | | — | | | | (1.02 | ) | | | (1.02 | ) |
| | 2015 - Institutional | | | 14.85 | | | | 0.05 | (d) | | | 1.43 | | | | 1.48 | | | | (0.04 | ) | | | (1.02 | ) | | | (1.06 | ) |
| | 2015 - IR | | | 14.83 | | | | 0.04 | (d) | | | 1.42 | | | | 1.46 | | | | (0.02 | ) | | | (1.02 | ) | | | (1.04 | ) |
| | 2015 - R | | | 14.70 | | | | — | (d) | | | 1.41 | | | | 1.41 | | | | — | | | | (1.02 | ) | | | (1.02 | ) |
| | | | | | | | | | | | | | | | | | | | | | | | | | | | | | |
| | FOR THE FISCAL YEARS ENDED AUGUST 31, | |
| | 2014 - A | | | 12.95 | | | | (0.05 | ) | | | 2.77 | | | | 2.72 | | | | — | | | | (0.93 | ) | | | (0.93 | ) |
| | 2014 - C | | | 12.85 | | | | (0.15 | ) | | | 2.74 | | | | 2.59 | | | | — | | | | (0.93 | ) | | | (0.93 | ) |
| | 2014 - Institutional | | | 13.02 | | | | 0.01 | | | | 2.78 | | | | 2.79 | | | | (0.03 | ) | | | (0.93 | ) | | | (0.96 | ) |
| | 2014 - IR | | | 13.01 | | | | (0.01 | ) | | | 2.77 | | | | 2.76 | | | | (0.01 | ) | | | (0.93 | ) | | | (0.94 | ) |
| | 2014 - R | | | 12.95 | | | | (0.08 | ) | | | 2.76 | | | | 2.68 | | | | — | | | | (0.93 | ) | | | (0.93 | ) |
| | 2013 - A | | | 11.35 | | | | 0.01 | (f) | | | 1.66 | | | | 1.67 | | | | (0.05 | ) | | | (0.02 | ) | | | (0.07 | ) |
| | 2013 - C | | | 11.31 | | | | (0.06 | )(f) | | | 1.63 | | | | 1.57 | | | | (0.01 | ) | | | (0.02 | ) | | | (0.03 | ) |
| | 2013 - Institutional | | | 11.38 | | | | 0.07 | (f) | | | 1.66 | | | | 1.73 | | | | (0.07 | ) | | | (0.02 | ) | | | (0.09 | ) |
| | 2013 - IR | | | 11.38 | | | | 0.06 | (f) | | | 1.65 | | | | 1.71 | | | | (0.06 | ) | | | (0.02 | ) | | | (0.08 | ) |
| | 2013 - R | | | 11.34 | | | | — | (f)(g) | | | 1.64 | | | | 1.64 | | | | (0.01 | ) | | | (0.02 | ) | | | (0.03 | ) |
| | | | | | | | | | | | | | | | | | | | | | | | | | | | | | |
| | FOR THE PERIOD ENDED AUGUST 31, | |
| | 2012 - A (Commenced January 31, 2012) | | | 10.00 | | | | — | (g) | | | 1.35 | | | | 1.35 | | | | — | | | | — | | | | — | |
| | 2012 - C (Commenced January 31, 2012) | | | 10.00 | | | | (0.05 | ) | | | 1.36 | | | | 1.31 | | | | — | | | | — | | | | — | |
| | 2012 - Institutional (Commenced January 31, 2012) | | | 10.00 | | | | 0.02 | | | | 1.36 | | | | 1.38 | | | | — | | | | — | | | | — | |
| | 2012 - IR (Commenced January 31, 2012) | | | 10.00 | | | | 0.01 | | | | 1.37 | | | | 1.38 | | | | — | | | | — | | | | — | |
| | 2012 - R (Commenced January 31, 2012) | | | 10.00 | | | | (0.02 | ) | | | 1.36 | | | | 1.34 | | | | — | | | | — | | | | — | |
| | (a) | | Calculated based on the average shares outstanding methodology. |
| | (b) | | Assumes investment at the net asset value at the beginning of the period, reinvestment of all dividends and distributions, a complete redemption of the investment at the net asset value at the end of the period and no sales or redemption charges. Total returns would be reduced if a sales or redemption charge was taken into account. Returns do not reflect the deduction of taxes that a shareholder would pay on Fund distributions or the redemption of Fund shares. Total returns for periods less than one full year are not annualized. |
| | (c) | | The Fund’s portfolio turnover rate is calculated in accordance with regulatory requirements, without regard to transactions involving short term investments and certain derivatives. If such transactions were included, the Fund’s portfolio turnover rate may be higher. |
| | (d) | | Reflects income recognized from a special dividend which amounted to $0.05 per share and 0.68% of average net assets. |
| | (f) | | Reflects income recognized from special dividends which amounted to $0.02 per share and 0.18% of average net assets. |
| | (g) | | Amount is less than $0.005 per share. |
| | |
| 96 | | The accompanying notes are an integral part of these financial statements. |
GOLDMAN SACHS FOCUSED GROWTH FUND
| | | | | | | | | | | | | | | | | | | | | | | | | | | | | | | | | | | | | | | | |
| | | | | | | | | | | | | | | | | | | | | | | | | | | | | | | | | | |
| | | Net asset
value, end
of period | | | | | Total
return(b) | | | | | Net assets,
end of
period
(in 000s) | | | | | Ratio of
net expenses
to average
net assets | | | | | Ratio of
total expenses
to average
net assets | | | | | Ratio of
net investment
income (loss)
to average
net assets | | | | | Portfolio
turnover
rate(c) | |
| | | | | | | | | | | | | | | | | | | | | | | | | | | | | | | | | | | | | | | | |
| | $ | 15.15 | | | | | | 10.00 | % | | | | $ | 62 | | | | | | 1.24 | %(e) | | | | | 2.25 | %(e) | | | | | 0.25 | %(d)(e) | | | | | 33 | % |
| | | 14.84 | | | | | | 9.60 | | | | | | 56 | | | | | | 1.99 | (e) | | | | | 3.02 | (e) | | | | | (0.43 | )(d)(e) | | | | | 33 | |
| | | 15.27 | | | | | | 10.28 | | | | | | 33,135 | | | | | | 0.84 | (e) | | | | | 1.86 | (e) | | | | | 0.69 | (d)(e) | | | | | 33 | |
| | | 15.25 | | | | | | 10.13 | | | | | | 18 | | | | | | 1.01 | (e) | | | | | 2.04 | (e) | | | | | 0.54 | (d)(e) | | | | | 33 | |
| | | 15.09 | | | | | | 9.89 | | | | | | 17 | | | | | | 1.49 | (e) | | | | | 2.52 | (e) | | | | | 0.05 | (d)(e) | | | | | 33 | |
| | | | | | | | | | | | | | | | | | | | | | | | | | | | | | | | | | | | | | | | |
| | | | | | | | | | | | | | | | | | | | | | | | | | | | | | | | | | | | | | | | |
| | | 14.74 | | | | | | 21.60 | | | | | | 42 | | | | | | 1.26 | | | | | | 2.83 | | | | | | (0.37 | ) | | | | | 97 | |
| | | 14.51 | | | | | | 20.71 | | | | | | 39 | | | | | | 2.01 | | | | | | 3.49 | | | | | | (1.05 | ) | | | | | 97 | |
| | | 14.85 | | | | | | 22.00 | | | | | | 24,346 | | | | | | 0.86 | | | | | | 2.31 | | | | | | 0.10 | | | | | | 97 | |
| | | 14.83 | | | | | | 21.83 | | | | | | 16 | | | | | | 1.01 | | | | | | 2.51 | | | | | | (0.08 | ) | | | | | 97 | |
| | | 14.70 | | | | | | 21.28 | | | | | | 16 | | | | | | 1.51 | | | | | | 3.01 | | | | | | (0.58 | ) | | | | | 97 | |
| | | 12.95 | | | | | | 14.79 | | | | | | 56 | | | | | | 1.24 | | | | | | 6.12 | | | | | | 0.08 | (f) | | | | | 87 | |
| | | 12.85 | | | | | | 13.94 | | | | | | 23 | | | | | | 1.99 | | | | | | 6.91 | | | | | | (0.52 | )(f) | | | | | 87 | |
| | | 13.02 | | | | | | 15.33 | | | | | | 12,838 | | | | | | 0.84 | | | | | | 4.59 | | | | | | 0.53 | (f) | | | | | 87 | |
| | | 13.01 | | | | | | 15.08 | | | | | | 13 | | | | | | 1.00 | | | | | | 6.58 | | | | | | 0.52 | (f) | | | | | 87 | |
| | | 12.95 | | | | | | 14.53 | | | | | | 13 | | | | | | 1.49 | | | | | | 7.08 | | | | | | 0.02 | (f) | | | | | 87 | |
| | | | | | | | | | | | | | | | | | | | | | | | | | | | | | | | | | | | | | | | |
| | | | | | | | | | | | | | | | | | | | | | | | | | | | | | | | | | | | | | | | |
| | | 11.35 | | | | | | 13.50 | | | | | | 35 | | | | | | 1.24 | (e) | | | | | 17.07 | (e) | | | | | 0.04 | (e) | | | | | 23 | |
| | | 11.31 | | | | | | 13.10 | | | | | | 11 | | | | | | 1.99 | (e) | | | | | 17.82 | (e) | | | | | (0.81 | )(e) | | | | | 23 | |
| | | 11.38 | | | | | | 13.80 | | | | | | 3,417 | | | | | | 0.84 | (e) | | | | | 16.67 | (e) | | | | | 0.36 | (e) | | | | | 23 | |
| | | 11.38 | | | | | | 13.80 | | | | | | 11 | | | | | | 0.99 | (e) | | | | | 16.82 | (e) | | | | | 0.22 | (e) | | | | | 23 | |
| | | 11.34 | | | | | | 13.40 | | | | | | 11 | | | | | | 1.49 | (e) | | | | | 17.32 | (e) | | | | | (0.30 | )(e) | | | | | 23 | |
| | |
| The accompanying notes are an integral part of these financial statements. | | 97 |
GOLDMAN SACHS GROWTH OPPORTUNITIES FUND
Financial Highlights
Selected Data for a Share Outstanding Throughout Each Period
| | | | | | | | | | | | | | | | | | | | | | |
| | | | | | | | Income (loss) from
investment operations | | | | |
| | | Year - Share Class | | Net asset
value,
beginning
of period | | | Net
investment
loss(a) | | | Net realized
and unrealized
gain (loss) | | | Total from
investment
operations | | | Distributions
to shareholders
from net
realized gains | |
| | FOR THE SIX MONTHS ENDED FEBRUARY 28, (UNAUDITED) | |
| | 2015 - A | | $ | 30.22 | | | $ | (0.08 | )(d) | | $ | 1.57 | | | $ | 1.49 | | | $ | (6.16 | ) |
| | 2015 - C | | | 25.42 | | | | (0.15 | )(d) | | | 1.28 | | | | 1.13 | | | | (6.16 | ) |
| | 2015 - Institutional | | | 33.02 | | | | (0.02 | )(d) | | | 1.73 | | | | 1.71 | | | | (6.16 | ) |
| | 2015 - Service | | | 29.51 | | | | (0.09 | )(d) | | | 1.53 | | | | 1.44 | | | | (6.16 | ) |
| | 2015 - IR | | | 30.85 | | | | (0.04 | )(d) | | | 1.60 | | | | 1.56 | | | | (6.16 | ) |
| | 2015 - R | | | 29.65 | | | | (0.11 | )(d) | | | 1.53 | | | | 1.42 | | | | (6.16 | ) |
| | | | | | | | | | | | | | | | | | | | | | |
| | FOR THE FISCAL YEARS ENDED AUGUST 31, | |
| | 2014 - A | | | 26.65 | | | | (0.19 | ) | | | 5.95 | | | | 5.76 | | | | (2.19 | ) |
| | 2014 - C | | | 22.89 | | | | (0.34 | ) | | | 5.06 | | | | 4.72 | | | | (2.19 | ) |
| | 2014 - Institutional | | | 28.83 | | | | (0.08 | ) | | | 6.46 | | | | 6.38 | | | | (2.19 | ) |
| | 2014 - Service | | | 26.10 | | | | (0.21 | ) | | | 5.81 | | | | 5.60 | | | | (2.19 | ) |
| | 2014 - IR | | | 27.10 | | | | (0.12 | ) | | | 6.06 | | | | 5.94 | | | | (2.19 | ) |
| | 2014 - R | | | 26.25 | | | | (0.25 | ) | | | 5.84 | | | | 5.59 | | | | (2.19 | ) |
| | 2013 - A | | | 23.88 | | | | (0.11 | )(f) | | | 4.53 | | | | 4.42 | | | | (1.65 | ) |
| | 2013 - C | | | 20.89 | | | | (0.26 | )(f) | | | 3.91 | | | | 3.65 | | | | (1.65 | ) |
| | 2013 - Institutional | | | 25.59 | | | | (0.01 | )(f) | | | 4.90 | | | | 4.89 | | | | (1.65 | ) |
| | 2013 - Service | | | 23.44 | | | | (0.13 | )(f) | | | 4.44 | | | | 4.31 | | | | (1.65 | ) |
| | 2013 - IR | | | 24.19 | | | | (0.05 | )(f) | | | 4.61 | | | | 4.56 | | | | (1.65 | ) |
| | 2013 - R | | | 23.59 | | | | (0.17 | )(f) | | | 4.48 | | | | 4.31 | | | | (1.65 | ) |
| | 2012 - A | | | 21.36 | | | | (0.15 | ) | | | 4.06 | | | | 3.91 | | | | (1.39 | ) |
| | 2012 - C | | | 18.99 | | | | (0.28 | ) | | | 3.57 | | | | 3.29 | | | | (1.39 | ) |
| | 2012 - Institutional | | | 22.71 | | | | (0.06 | ) | | | 4.33 | | | | 4.27 | | | | (1.39 | ) |
| | 2012 - Service | | | 21.01 | | | | (0.17 | ) | | | 3.99 | | | | 3.82 | | | | (1.39 | ) |
| | 2012 - IR | | | 21.57 | | | | (0.09 | ) | | | 4.10 | | | | 4.01 | | | | (1.39 | ) |
| | 2012 - R | | | 21.17 | | | | (0.20 | ) | | | 4.01 | | | | 3.81 | | | | (1.39 | ) |
| | 2011 - A | | | 19.09 | | | | (0.16 | ) | | | 2.65 | | | | 2.49 | | | | (0.22 | ) |
| | 2011 - C | | | 17.11 | | | | (0.30 | ) | | | 2.40 | | | | 2.10 | | | | (0.22 | ) |
| | 2011 - Institutional | | | 20.21 | | | | (0.07 | ) | | | 2.79 | | | | 2.72 | | | | (0.22 | ) |
| | 2011 - Service | | | 18.80 | | | | (0.18 | ) | | | 2.61 | | | | 2.43 | | | | (0.22 | ) |
| | 2011 - IR | | | 19.23 | | | | (0.10 | ) | | | 2.66 | | | | 2.56 | | | | (0.22 | ) |
| | 2011 - R | | | 18.97 | | | | (0.22 | ) | | | 2.64 | | | | 2.42 | | | | (0.22 | ) |
| | 2010 - A | | | 16.91 | | | | (0.15 | ) | | | 2.33 | | | | 2.18 | | | | — | |
| | 2010 - C | | | 15.28 | | | | (0.26 | ) | | | 2.09 | | | | 1.83 | | | | — | |
| | 2010 - Institutional | | | 17.83 | | | | (0.07 | ) | | | 2.45 | | | | 2.38 | | | | — | |
| | 2010 - Service | | | 16.67 | | | | (0.16 | ) | | | 2.29 | | | | 2.13 | | | | — | |
| | 2010 - IR | | | 16.99 | | | | (0.10 | ) | | | 2.34 | | | | 2.24 | | | | — | |
| | 2010 - R | | | 16.85 | | | | (0.19 | ) | | | 2.31 | | | | 2.12 | | | | — | |
| | (a) | | Calculated based on the average shares outstanding methodology. |
| | (b) | | Assumes investment at the net asset value at the beginning of the period, reinvestment of all dividends and distributions, a complete redemption of the investment at the net asset value at the end of the period and no sales or redemption charges. Total returns would be reduced if a sales or redemption charge was taken into account. Returns do not reflect the deduction of taxes that a shareholder would pay on Fund distributions or the redemption of Fund shares. Total returns for periods less than one full year are not annualized. |
| | (c) | | The Fund’s portfolio turnover rate is calculated in accordance with regulatory requirements, without regard to transactions involving short term investments and certain derivatives. If such transactions were included, the Fund’s portfolio turnover rate may be higher. |
| | (d) | | Reflects income recognized from special dividends which amounted to $0.03 per share and 0.65% of average net assets. |
| | (f) | | Reflects income recognized from special dividends which amounted to $0.04 per share and 0.17% of average net assets. |
| | (g) | | Portfolio turnover rates exclude portfolio securities received as a result of in-kind redemptions. |
| | |
| 98 | | The accompanying notes are an integral part of these financial statements. |
GOLDMAN SACHS GROWTH OPPORTUNITIES FUND
| | | | | | | | | | | | | | | | | | | | | | | | | | | | | | | | | | | | | | | | |
| | | | | | | | | | | | | | | | | | | | | | | | | | | | | | | | | | |
| | | Net asset
value, end
of period | | | | | Total
return(b) | | | | | Net assets,
end of
period
(in 000s) | | | | | Ratio of
net expenses
to average
net assets | | | | | Ratio of
total expenses
to average
net assets | | | | | Ratio of
net investment
loss
to average
net assets | | | | | Portfolio
turnover
rate(c) | |
| | | | | | | | | | | | | | | | | | | | | | | | | | | | | | | | | | | | | | | | |
| | $ | 25.55 | | | | | | 5.59 | % | | | | $ | 1,071,347 | | | | | | 1.35 | %(e) | | | | | 1.40 | %(e) | | | | | (0.57 | )%(d)(e) | | | | | 27 | % |
| | | 20.39 | | | | | | 5.20 | | | | | | 189,380 | | | | | | 2.10 | (e) | | | | | 2.15 | (e) | | | | | (1.32 | )(d)(e) | | | | | 27 | |
| | | 28.57 | | | | | | 5.80 | | | | | | 3,718,736 | | | | | | 0.95 | (e) | | | | | 1.00 | (e) | | | | | (0.17 | )(d)(e) | | | | | 27 | |
| | | 24.79 | | | | | | 5.56 | | | | | | 57,017 | | | | | | 1.45 | (e) | | | | | 1.50 | (e) | | | | | (0.67 | )(d)(e) | | | | | 27 | |
| | | 26.25 | | | | | | 5.72 | | | | | | 170,800 | | | | | | 1.10 | (e) | | | | | 1.15 | (e) | | | | | (0.33 | )(d)(e) | | | | | 27 | |
| | | 24.91 | | | | | | 5.46 | | | | | | 87,973 | | | | | | 1.60 | (e) | | | | | 1.65 | (e) | | | | | (0.82 | )(d)(e) | | | | | 27 | |
| | | | | | | | | | | | | | | | | | | | | | | | | | | | | | | | | | | | | | | | |
| | | | | | | | | | | | | | | | | | | | | | | | | | | | | | | | | | | | | | | | |
| | | 30.22 | | | | | | 22.57 | | | | | | 1,110,320 | | | | | | 1.36 | | | | | | 1.40 | | | | | | (0.66 | ) | | | | | 59 | |
| | | 25.42 | | | | | | 21.67 | | | | | | 191,125 | | | | | | 2.11 | | | | | | 2.15 | | | | | | (1.41 | ) | | | | | 59 | |
| | | 33.02 | | | | | | 23.04 | | | | | | 3,750,790 | | | | | | 0.96 | | | | | | 1.00 | | | | | | (0.26 | ) | | | | | 59 | |
| | | 29.51 | | | | | | 22.42 | | | | | | 57,643 | | | | | | 1.46 | | | | | | 1.50 | | | | | | (0.76 | ) | | | | | 59 | |
| | | 30.85 | | | | | | 22.87 | | | | | | 143,249 | | | | | | 1.11 | | | | | | 1.15 | | | | | | (0.41 | ) | | | | | 59 | |
| | | 29.65 | | | | | | 22.25 | | | | | | 80,542 | | | | | | 1.61 | | | | | | 1.65 | | | | | | (0.91 | ) | | | | | 59 | |
| | | 26.65 | | | | | | 19.84 | | | | | | 1,130,449 | | | | | | 1.35 | | | | | | 1.41 | | | | | | (0.44 | )(f) | | | | | 41 | |
| | | 22.89 | | | | | | 18.94 | | | | | | 172,010 | | | | | | 2.10 | | | | | | 2.16 | | | | | | (1.19 | )(f) | | | | | 41 | |
| | | 28.83 | | | | | | 20.38 | | | | | | 3,207,925 | | | | | | 0.95 | | | | | | 1.01 | | | | | | (0.05 | )(f) | | | | | 41 | |
| | | 26.10 | | | | | | 19.74 | | | | | | 60,977 | | | | | | 1.45 | | | | | | 1.51 | | | | | | (0.54 | )(f) | | | | | 41 | |
| | | 27.10 | | | | | | 20.18 | | | | | | 91,093 | | | | | | 1.10 | | | | | | 1.16 | | | | | | (0.21 | )(f) | | | | | 41 | |
| | | 26.25 | | | | | | 19.61 | | | | | | 71,263 | | | | | | 1.60 | | | | | | 1.66 | | | | | | (0.71 | )(f) | | | | | 41 | |
| | | 23.88 | | | | | | 19.15 | | | | | | 1,068,187 | | | | | | 1.35 | | | | | | 1.41 | | | | | | (0.67 | ) | | | | | 59 | |
| | | 20.89 | | | | | | 18.24 | | | | | | 157,901 | | | | | | 2.10 | | | | | | 2.16 | | | | | | (1.42 | ) | | | | | 59 | |
| | | 25.59 | | | | | | 19.61 | | | | | | 2,710,810 | | | | | | 0.95 | | | | | | 1.01 | | | | | | (0.27 | ) | | | | | 59 | |
| | | 23.44 | | | | | | 19.03 | | | | | | 59,834 | | | | | | 1.45 | | | | | | 1.51 | | | | | | (0.77 | ) | | | | | 59 | |
| | | 24.19 | | | | | | 19.43 | | | | | | 75,702 | | | | | | 1.10 | | | | | | 1.16 | | | | | | (0.42 | ) | | | | | 59 | |
| | | 23.59 | | | | | | 18.83 | | | | | | 54,071 | | | | | | 1.60 | | | | | | 1.66 | | | | | | (0.91 | ) | | | | | 59 | |
| | | 21.36 | | | | | | 12.97 | | | | | | 1,060,320 | | | | | | 1.36 | | | | | | 1.41 | | | | | | (0.70 | ) | | | | | 71 | (g) |
| | | 18.99 | | | | | | 12.18 | | | | | | 158,371 | | | | | | 2.11 | | | | | | 2.16 | | | | | | (1.46 | ) | | | | | 71 | (g) |
| | | 22.71 | | | | | | 13.39 | | | | | | 2,843,584 | | | | | | 0.96 | | | | | | 1.01 | | | | | | (0.30 | ) | | | | | 71 | (g) |
| | | 21.01 | | | | | | 12.85 | | | | | | 57,002 | | | | | | 1.46 | | | | | | 1.51 | | | | | | (0.81 | ) | | | | | 71 | (g) |
| | | 21.57 | | | | | | 13.24 | | | | | | 54,912 | | | | | | 1.11 | | | | | | 1.16 | | | | | | (0.43 | ) | | | | | 71 | (g) |
| | | 21.17 | | | | | | 12.68 | | | | | | 33,931 | | | | | | 1.61 | | | | | | 1.66 | | | | | | (0.94 | ) | | | | | 71 | (g) |
| | | 19.09 | | | | | | 12.89 | | | | | | 799,256 | | | | | | 1.37 | | | | | | 1.44 | | | | | | (0.76 | ) | | | | | 57 | (g) |
| | | 17.11 | | | | | | 11.98 | | | | | | 129,009 | | | | | | 2.12 | | | | | | 2.19 | | | | | | (1.51 | ) | | | | | 57 | (g) |
| | | 20.21 | | | | | | 13.35 | | | | | | 2,216,786 | | | | | | 0.97 | | | | | | 1.04 | | | | | | (0.35 | ) | | | | | 57 | (g) |
| | | 18.80 | | | | | | 12.78 | | | | | | 60,893 | | | | | | 1.47 | | | | | | 1.54 | | | | | | (0.86 | ) | | | | | 57 | (g) |
| | | 19.23 | | | | | | 13.18 | | | | | | 12,823 | | | | | | 1.12 | | | | | | 1.19 | | | | | | (0.49 | ) | | | | | 57 | (g) |
| | | 18.97 | | | | | | 12.58 | | | | | | 7,954 | | | | | | 1.62 | | | | | | 1.69 | | | | | | (0.97 | ) | | | | | 57 | (g) |
| | |
| The accompanying notes are an integral part of these financial statements. | | 99 |
GOLDMAN SACHS SMALL/MID CAP GROWTH FUND
Financial Highlights
Selected Data for a Share Outstanding Throughout Each Period
| | | | | | | | | | | | | | | | | | | | | | |
| | | | | | | | Income (loss) from
investment operations | | | | |
| | | Year - Share Class | | Net asset
value,
beginning
of period | | | Net
investment
loss(a) | | | Net realized
and unrealized
gain (loss) | | | Total from
investment
operations | | | Distributions to shareholders from net realized gains | |
| | FOR THE SIX MONTHS ENDED FEBRUARY 28, (UNAUDITED) | |
| | 2015 - A | | $ | 20.90 | | | $ | (0.08 | ) | | $ | 1.95 | | | $ | 1.87 | | | $ | (1.71 | ) |
| | 2015 - C | | | 19.20 | | | | (0.15 | ) | | | 1.78 | | | | 1.63 | | | | (1.71 | ) |
| | 2015 - Institutional | | | 21.71 | | | | (0.04 | ) | | | 2.04 | | | | 2.00 | | | | (1.71 | ) |
| | 2015 - Service | | | 20.58 | | | | (0.09 | ) | | | 1.92 | | | | 1.83 | | | | (1.71 | ) |
| | 2015 - IR | | | 21.30 | | | | (0.06 | ) | | | 2.00 | | | | 1.94 | | | | (1.71 | ) |
| | 2015 - R | | | 20.51 | | | | (0.11 | ) | | | 1.92 | | | | 1.81 | | | | (1.71 | ) |
| | | | | | | | | | | | | | | | | | | | | | |
| | FOR THE FISCAL YEARS ENDED AUGUST 31, | |
| | 2014 - A | | | 18.63 | | | | (0.16 | )(d) | | | 3.43 | | | | 3.27 | | | | (1.00 | ) |
| | 2014 - C | | | 17.31 | | | | (0.29 | )(d) | | | 3.18 | | | | 2.89 | | | | (1.00 | ) |
| | 2014 - Institutional | | | 19.25 | | | | (0.09 | )(d) | | | 3.55 | | | | 3.46 | | | | (1.00 | ) |
| | 2014 - Service | | | 18.38 | | | | (0.18 | )(d) | | | 3.38 | | | | 3.20 | | | | (1.00 | ) |
| | 2014 - IR | | | 18.93 | | | | (0.12 | )(d) | | | 3.49 | | | | 3.37 | | | | (1.00 | ) |
| | 2014 - R | | | 18.35 | | | | (0.21 | )(d) | | | 3.37 | | | | 3.16 | | | | (1.00 | ) |
| | 2013 - A | | | 15.52 | | | | (0.11 | )(f) | | | 3.99 | | | | 3.88 | | | | (0.77 | ) |
| | 2013 - C | | | 14.58 | | | | (0.23 | )(f) | | | 3.73 | | | | 3.50 | | | | (0.77 | ) |
| | 2013 - Institutional | | | 15.95 | | | | (0.06 | )(f) | | | 4.13 | | | | 4.07 | | | | (0.77 | ) |
| | 2013 - Service | | | 15.34 | | | | (0.13 | )(f) | | | 3.94 | | | | 3.81 | | | | (0.77 | ) |
| | 2013 - IR | | | 15.72 | | | | (0.08 | )(f) | | | 4.06 | | | | 3.98 | | | | (0.77 | ) |
| | 2013 - R | | | 15.34 | | | | (0.15 | )(f) | | | 3.93 | | | | 3.78 | | | | (0.77 | ) |
| | 2012 - A | | | 13.67 | | | | (0.12 | ) | | | 2.63 | | | | 2.51 | | | | (0.66 | ) |
| | 2012 - C | | | 12.98 | | | | (0.21 | ) | | | 2.47 | | | | 2.26 | | | | (0.66 | ) |
| | 2012 - Institutional | | | 13.98 | | | | (0.06 | ) | | | 2.69 | | | | 2.63 | | | | (0.66 | ) |
| | 2012 - Service | | | 13.53 | | | | (0.13 | ) | | | 2.60 | | | | 2.47 | | | | (0.66 | ) |
| | 2012 - IR | | | 13.81 | | | | (0.08 | ) | | | 2.65 | | | | 2.57 | | | | (0.66 | ) |
| | 2012 - R | | | 13.55 | | | | (0.15 | ) | | | 2.60 | | | | 2.45 | | | | (0.66 | ) |
| | 2011 - A | | | 12.08 | | | | (0.15 | ) | | | 2.01 | | | | 1.86 | | | | (0.27 | ) |
| | 2011 - C | | | 11.56 | | | | (0.24 | ) | | | 1.93 | | | | 1.69 | | | | (0.27 | ) |
| | 2011 - Institutional | | | 12.30 | | | | (0.09 | ) | | | 2.04 | | | | 1.95 | | | | (0.27 | ) |
| | 2011 - Service | | | 11.97 | | | | (0.16 | ) | | | 1.99 | | | | 1.83 | | | | (0.27 | ) |
| | 2011 - IR | | | 12.17 | | | | (0.10 | ) | | | 2.01 | | | | 1.91 | | | | (0.27 | ) |
| | 2011 - R | | | 12.01 | | | | (0.18 | ) | | | 1.99 | | | | 1.81 | | | | (0.27 | ) |
| | 2010 - A | | | 10.63 | | | | (0.12 | ) | | | 1.57 | | | | 1.45 | | | | — | |
| | 2010 - C | | | 10.25 | | | | (0.21 | ) | | | 1.52 | | | | 1.31 | | | | — | |
| | 2010 - Institutional | | | 10.78 | | | | (0.07 | ) | | | 1.59 | | | | 1.52 | | | | — | |
| | 2010 - Service | | | 10.54 | | | | (0.13 | ) | | | 1.56 | | | | 1.43 | | | | — | |
| | 2010 - IR | | | 10.68 | | | | (0.09 | ) | | | 1.58 | | | | 1.49 | | | | — | |
| | 2010 - R | | | 10.59 | | | | (0.15 | ) | | | 1.57 | | | | 1.42 | | | | — | |
| | (a) | | Calculated based on the average shares outstanding methodology. |
| | (b) | | Assumes investment at the net asset value at the beginning of the period, reinvestment of all dividends and distributions, a complete redemption of the investment at the net asset value at the end of the period and no sales or redemption charges. Total returns would be reduced if a sales or redemption charge was taken into account. Returns do not reflect the deduction of taxes that a shareholder would pay on Fund distributions or the redemption of Fund shares. Total returns for periods less than one full year are not annualized. |
| | (c) | | The Fund’s portfolio turnover rate is calculated in accordance with regulatory requirements, without regard to transactions involving short term investments and certain derivatives. If such transactions were included, the Fund’s portfolio turnover rate may be higher. |
| | (d) | | Reflects income recognized from special dividends which amounted to $0.01 per share and 0.12% of average net assets. |
| | (f) | | Reflects income recognized from special dividends which amounted to $0.02 per share and 0.14% of average net assets. |
| | |
| 100 | | The accompanying notes are an integral part of these financial statements. |
GOLDMAN SACHS SMALL/MID CAP GROWTH FUND
| | | | | | | | | | | | | | | | | | | | | | | | | | | | | | | | | | | | | | | | |
| | | | | | | | | | | | | | | | | | | | | | | | | | | | | | | | | | |
| | | Net asset
value, end
of period | | | | | Total
return(b) | | | | | Net assets,
end of
period
(in 000s) | | | | | Ratio of
net expenses
to average
net assets | | | | | Ratio of
total expenses
to average
net assets | | | | | Ratio of
net investment
loss
to average
net assets | | | | | Portfolio
turnover
rate(c) | |
| | | | | | | | | | | | | | | | | | | | | | | | | | | | | | | | | | | | | | | | |
| | $ | 21.06 | | | | | | 9.44 | % | | | | $ | 827,787 | | | | | | 1.33 | %(e) | | | | | 1.46 | %(e) | | | | | (0.82 | )%(e) | | | | | 28 | % |
| | | 19.12 | | | | | | 9.01 | | | | | | 246,297 | | | | | | 2.08 | (e) | | | | | 2.22 | (e) | | | | | (1.57 | )(e) | | | | | 28 | |
| | | 22.00 | | | | | | 9.70 | | | | | | 1,236,389 | | | | | | 0.93 | (e) | | | | | 1.07 | (e) | | | | | (0.42 | )(e) | | | | | 28 | |
| | | 20.70 | | | | | | 9.39 | | | | | | 10,645 | | | | | | 1.43 | (e) | | | | | 1.56 | (e) | | | | | (0.92 | )(e) | | | | | 28 | |
| | | 21.53 | | | | | | 9.60 | | | | | | 190,965 | | | | | | 1.08 | (e) | | | | | 1.22 | (e) | | | | | (0.57 | )(e) | | | | | 28 | |
| | | 20.61 | | | | | | 9.32 | | | | | | 36,168 | | | | | | 1.58 | (e) | | | | | 1.72 | (e) | | | | | (1.07 | )(e) | | | | | 28 | |
| | | | | | | | | | | | | | | | | | | | | | | | | | | | | | | | | | | | | | | | |
| | | | | | | | | | | | | | | | | | | | | | | | | | | | | | | | | | | | | | | | |
| | | 20.90 | | | | | | 17.97 | | | | | | 741,254 | | | | | | 1.33 | | | | | | 1.48 | | | | | �� | (0.82 | )(d) | | | | | 43 | |
| | | 19.20 | | | | | | 17.11 | | | | | | 221,451 | | | | | | 2.08 | | | | | | 2.23 | | | | | | (1.57 | )(d) | | | | | 43 | |
| | | 21.71 | | | | | | 18.39 | | | | | | 1,077,769 | | | | | | 0.93 | | | | | | 1.08 | | | | | | (0.42 | )(d) | | | | | 43 | |
| | | 20.58 | | | | | | 17.83 | | | | | | 8,692 | | | | | | 1.43 | | | | | | 1.58 | | | | | | (0.92 | )(d) | | | | | 43 | |
| | | 21.30 | | | | | | 18.22 | | | | | | 171,779 | | | | | | 1.08 | | | | | | 1.23 | | | | | | (0.57 | )(d) | | | | | 43 | |
| | | 20.51 | | | | | | 17.63 | | | | | | 34,118 | | | | | | 1.58 | | | | | | 1.73 | | | | | | (1.07 | )(d) | | | | | 43 | |
| | | 18.63 | | | | | | 26.18 | | | | | | 592,798 | | | | | | 1.34 | | | | | | 1.49 | | | | | | (0.68 | )(f) | | | | | 37 | |
| | | 17.31 | | | | | | 25.23 | | | | | | 150,744 | | | | | | 2.09 | | | | | | 2.24 | | | | | | (1.44 | )(f) | | | | | 37 | |
| | | 19.25 | | | | | | 26.68 | | | | | | 725,662 | | | | | | 0.94 | | | | | | 1.09 | | | | | | (0.32 | )(f) | | | | | 37 | |
| | | 18.38 | | | | | | 26.02 | | | | | | 8,495 | | | | | | 1.44 | | | | | | 1.59 | | | | | | (0.77 | )(f) | | | | | 37 | |
| | | 18.93 | | | | | | 26.49 | | | | | | 93,255 | | | | | | 1.09 | | | | | | 1.24 | | | | | | (0.45 | )(f) | | | | | 37 | |
| | | 18.35 | | | | | | 25.82 | | | | | | 24,420 | | | | | | 1.59 | | | | | | 1.74 | | | | | | (0.93 | )(f) | | | | | 37 | |
| | | 15.52 | | | | | | 18.97 | | | | | | 393,284 | | | | | | 1.35 | | | | | | 1.50 | | | | | | (0.83 | ) | | | | | 51 | |
| | | 14.58 | | | | | | 18.03 | | | | | | 87,185 | | | | | | 2.10 | | | | | | 2.25 | | | | | | (1.58 | ) | | | | | 51 | |
| | | 15.95 | | | | | | 19.42 | | | | | | 291,636 | | | | | | 0.95 | | | | | | 1.10 | | | | | | (0.43 | ) | | | | | 51 | |
| | | 15.34 | | | | | | 18.87 | | | | | | 6,774 | | | | | | 1.45 | | | | | | 1.60 | | | | | | (0.92 | ) | | | | | 51 | |
| | | 15.72 | | | | | | 19.22 | | �� | | | | 46,777 | | | | | | 1.10 | | | | | | 1.25 | | | | | | (0.57 | ) | | | | | 51 | |
| | | 15.34 | | | | | | 18.69 | | | | | | 19,156 | | | | | | 1.60 | | | | | | 1.75 | | | | | | (1.07 | ) | | | | | 51 | |
| | | 13.67 | | | | | | 15.30 | | | | | | 403,960 | | | | | | 1.47 | | | | | | 1.50 | | | | | | (0.99 | ) | | | | | 53 | |
| | | 12.98 | | | | | | 14.51 | | | | | | 79,875 | | | | | | 2.22 | | | | | | 2.25 | | | | | | (1.74 | ) | | | | | 53 | |
| | | 13.98 | | | | | | 15.77 | | | | | | 340,712 | | | | | | 1.07 | | | | | | 1.10 | | | | | | (0.59 | ) | | | | | 53 | |
| | | 13.53 | | | | | | 15.19 | | | | | | 5,879 | | | | | | 1.57 | | | | | | 1.60 | | | | | | (1.08 | ) | | | | | 53 | |
| | | 13.81 | | | | | | 15.60 | | | | | | 30,858 | | | | | | 1.22 | | | | | | 1.25 | | | | | | (0.71 | ) | | | | | 53 | |
| | | 13.55 | | | | | | 14.97 | | | | | | 15,370 | | | | | | 1.72 | | | | | | 1.75 | | | | | | (1.24 | ) | | | | | 53 | |
| | | 12.08 | | | | | | 13.64 | | | | | | 267,826 | | | | | | 1.50 | | | | | | 1.54 | | | | | | (0.98 | ) | | | | | 48 | |
| | | 11.56 | | | | | | 12.78 | | | | | | 47,685 | | | | | | 2.25 | | | | | | 2.29 | | | | | | (1.73 | ) | | | | | 48 | |
| | | 12.30 | | | | | | 14.10 | | | | | | 222,616 | | | | | | 1.10 | | | | | | 1.14 | | | | | | (0.58 | ) | | | | | 48 | |
| | | 11.97 | | | | | | 13.57 | | | | | | 2,762 | | | | | | 1.60 | | | | | | 1.64 | | | | | | (1.07 | ) | | | | | 48 | |
| | | 12.17 | | | | | | 13.95 | | | | | | 15,059 | | | | | | 1.25 | | | | | | 1.29 | | | | | | (0.72 | ) | | | | | 48 | |
| | | 12.01 | | | | | | 13.41 | | | | | | 10,318 | | | | | | 1.75 | | | | | | 1.79 | | | | | | (1.23 | ) | | | | | 48 | |
| | |
| The accompanying notes are an integral part of these financial statements. | | 101 |
GOLDMAN SACHS STRATEGIC GROWTH FUND
Financial Highlights
Selected Data for a Share Outstanding Throughout Each Period
| | | | | | | | | | | | | | | | | | | | | | | | | | | | | | |
| | | | | | Income (loss) from
investment operations | | | Distributions
to shareholders | |
| | | Year - Share Class | |
Net asset
value,
beginning
of period | | | Net
investment
income (loss)(a) | | | Net realized
and unrealized
gain | | | Total from
investment
operations | | | From net
investment
income | | | From net
realized
gains | | | Total
distributions | |
| | FOR SIX MONTHS ENDED FEBRUARY 28, (UNAUDITED) | |
| | 2015 - A | | $ | 13.50 | | | $ | 0.02 | (d) | | $ | 1.07 | | | $ | 1.09 | | | $ | — | | | $ | (2.08 | ) | | $ | (2.08 | ) |
| | 2015 - C | | | 11.90 | | | | (0.03 | )(d) | | | 0.93 | | | | 0.90 | | | | — | | | | (2.08 | ) | | | (2.08 | ) |
| | 2015 - Institutional | | | 14.15 | | | | 0.04 | (d) | | | 1.12 | | | | 1.16 | | | | (0.04 | ) | | | (2.08 | ) | | | (2.12 | ) |
| | 2015 - Service | | | 13.47 | | | | 0.01 | (d) | | | 1.07 | | | | 1.08 | | | | — | | | | (2.08 | ) | | | (2.08 | ) |
| | 2015 - IR | | | 14.14 | | | | 0.03 | (d) | | | 1.13 | | | | 1.16 | | | | (0.02 | ) | | | (2.08 | ) | | | (2.10 | ) |
| | 2015 - R | | | 13.42 | | | | 0.02 | (d) | | | 1.04 | | | | 1.06 | | | | — | | | | (2.08 | ) | | | (2.08 | ) |
| | | | | | | | | | | | | | | | | | | | | | | | | | | | | | |
| | FOR THE FISCAL YEARS ENDED AUGUST 31, | |
| | 2014 - A | | | 12.29 | | | | (0.01 | ) | | | 3.06 | | | | 3.05 | | | | (0.01 | ) | | | (1.83 | ) | | | (1.84 | ) |
| | 2014 - C | | | 11.09 | | | | (0.10 | ) | | | 2.74 | | | | 2.64 | | | | — | | | | (1.83 | ) | | | (1.83 | ) |
| | 2014 - Institutional | | | 12.79 | | | | 0.04 | | | | 3.21 | | | | 3.25 | | | | (0.06 | ) | | | (1.83 | ) | | | (1.89 | ) |
| | 2014 - Service | | | 12.28 | | | | (0.02 | ) | | | 3.05 | | | | 3.03 | | | | (0.01 | ) | | | (1.83 | ) | | | (1.84 | ) |
| | 2014 - IR | | | 12.80 | | | | 0.02 | | | | 3.20 | | | | 3.22 | | | | (0.05 | ) | | | (1.83 | ) | | | (1.88 | ) |
| | 2014 - R | | | 12.26 | | | | (0.04 | ) | | | 3.05 | | | | 3.01 | | | | (0.02 | ) | | | (1.83 | ) | | | (1.85 | ) |
| | 2013 - A | | | 11.57 | | | | 0.06 | (f) | | | 1.58 | | | | 1.64 | | | | (0.05 | ) | | | (0.87 | ) | | | (0.92 | ) |
| | 2013 - C | | | 10.54 | | | | (0.04 | )(f) | | | 1.46 | | | | 1.42 | | | | — | | | | (0.87 | ) | | | (0.87 | ) |
| | 2013 - Institutional | | | 12.00 | | | | 0.10 | (f) | | | 1.66 | | | | 1.76 | | | | (0.10 | ) | | | (0.87 | ) | | | (0.97 | ) |
| | 2013 - Service | | | 11.59 | | | | 0.03 | (f) | | | 1.61 | | | | 1.64 | | | | (0.08 | ) | | | (0.87 | ) | | | (0.95 | ) |
| | 2013 - IR | | | 12.01 | | | | 0.07 | (f) | | | 1.68 | | | | 1.75 | | | | (0.09 | ) | | | (0.87 | ) | | | (0.96 | ) |
| | 2013 - R | | | 11.53 | | | | 0.03 | (f) | | | 1.60 | | | | 1.63 | | | | (0.03 | ) | | | (0.87 | ) | | | (0.90 | ) |
| | 2012 - A | | | 9.77 | | | | 0.01 | | | | 1.81 | | | | 1.82 | | | | (0.02 | ) | | | — | | | | (0.02 | ) |
| | 2012 - C | | | 8.95 | | | | (0.06 | ) | | | 1.65 | | | | 1.59 | | | | — | | | | — | | | | — | |
| | 2012 - Institutional | | | 10.14 | | | | 0.06 | | | | 1.86 | | | | 1.92 | | | | (0.06 | ) | | | — | | | | (0.06 | ) |
| | 2012 - Service | | | 9.80 | | | | 0.02 | | | | 1.79 | | | | 1.81 | | | | (0.02 | ) | | | — | | | | (0.02 | ) |
| | 2012 - IR | | | 10.10 | | | | 0.04 | | | | 1.87 | | | | 1.91 | | | | — | | | | — | | | | — | |
| | 2012 - R | | | 9.74 | | | | — | (g) | | | 1.79 | | | | 1.79 | | | | — | | | | — | | | | — | |
| | 2011 - A | | | 8.53 | | | | 0.02 | | | | 1.25 | | | | 1.27 | | | | (0.03 | ) | | | — | | | | (0.03 | ) |
| | 2011 - C | | | 7.86 | | | | (0.05 | ) | | | 1.14 | | | | 1.09 | | | | — | | | | — | | | | — | |
| | 2011 - Institutional | | | 8.85 | | | | 0.06 | | | | 1.30 | | | | 1.36 | | | | (0.07 | ) | | | — | | | | (0.07 | ) |
| | 2011 - Service | | | 8.55 | | | | 0.02 | | | | 1.25 | | | | 1.27 | | | | (0.02 | ) | | | — | | | | (0.02 | ) |
| | 2011 - IR | | | 8.84 | | | | 0.04 | | | | 1.29 | | | | 1.33 | | | | (0.07 | ) | | | — | | | | (0.07 | ) |
| | 2011 - R | | | 8.51 | | | | — | (g) | | | 1.24 | | | | 1.24 | | | | (0.01 | ) | | | — | | | | (0.01 | ) |
| | 2010 - A | | | 8.22 | | | | 0.02 | | | | 0.30 | | | | 0.32 | | | | (0.01 | ) | | | — | | | | (0.01 | ) |
| | 2010 - C | | | 7.62 | | | | (0.05 | ) | | | 0.29 | | | | 0.24 | | | | — | | | | — | | | | — | |
| | 2010 - Institutional | | | 8.52 | | | | 0.06 | | | | 0.30 | | | | 0.36 | | | | (0.03 | ) | | | — | | | | (0.03 | ) |
| | 2010 - Service | | | 8.24 | | | | 0.01 | | | | 0.30 | | | | 0.31 | | | | — | | | | — | | | | — | |
| | 2010 - IR | | | 8.51 | | | | 0.04 | | | | 0.32 | | | | 0.36 | | | | (0.03 | ) | | | — | | | | (0.03 | ) |
| | 2010 - R | | | 8.21 | | | | — | (g) | | | 0.30 | | | | 0.30 | | | | — | | | | — | | | | — | |
| | (a) | | Calculated based on the average shares outstanding methodology. |
| | (b) | | Assumes investment at the net asset value at the beginning of the period, reinvestment of all dividends and distributions, a complete redemption of the investment at the net asset value at the end of the period and no sales or redemption charges. Total returns would be reduced if a sales or redemption charge was taken into account. Returns do not reflect the deduction of taxes that a shareholder would pay on Fund distributions or the redemption of Fund shares. Total returns for periods less than one full year are not annualized. |
| | (c) | | The Fund’s portfolio turnover rate is calculated in accordance with regulatory requirements, without regard to transactions involving short term investments and certain derivatives. If such transactions were included, the Fund’s portfolio turnover rate may be higher. |
| | (d) | | Reflects income recognized from special dividends which amounted to $0.02 per share and 0.38% of average net assets. |
| | (f) | | Reflects income recognized from special dividends which amounted to $0.03 per share and 0.29% of average net assets. |
| | (g) | | Amount is less than $0.005 per share. |
| | (h) | | Amount is less than 0.005% of average net assets. |
| | |
| 102 | | The accompanying notes are an integral part of these financial statements. |
GOLDMAN SACHS STRATEGIC GROWTH FUND
| | | | | | | | | | | | | | | | | | | | | | | | | | | | | | | | | | | | | | | | |
| | | | | | | | | | | | | | | | | | | | | | | | | | | | | | | | | | |
| | | Net asset
value, end
of period | | | | | Total
return(b) | | | | | Net assets,
end of
period
(in 000s) | | | | | Ratio of
net expenses
to average
net assets | | | | | Ratio of
total expenses
to average
net assets | | | | | Ratio of
net investment
income (loss)
to average
net assets | | | | | Portfolio
turnover
rate(c) | |
| | | | | | | | | | | | | | | | | | | | | | | | | | | | | | | | | | | | | | | | |
| | $ | 12.51 | | | | | | 8.74 | % | | | | $ | 48,919 | | | | | | 1.15 | %(e) | | | | | 1.52 | %(e) | | | | | 0.26 | %(d)(e) | | | | | 29 | % |
| | | 10.72 | | | | | | 8.29 | | | | | | 12,210 | | | | | | 1.90 | (e) | | | | | 2.27 | (e) | | | | | (0.49 | )(d)(e) | | | | | 29 | |
| | | 13.19 | | | | | | 8.88 | | | | | | 359,652 | | | | | | 0.75 | (e) | | | | | 1.12 | (e) | | | | | 0.66 | (d)(e) | | | | | 29 | |
| | | 12.47 | | | | | | 8.69 | | | | | | 197 | | | | | | 1.25 | (e) | | | | | 1.62 | (e) | | | | | 0.14 | (d)(e) | | | | | 29 | |
| | | 13.20 | | | | | | 8.87 | | | | | | 1,052 | | | | | | 0.90 | (e) | | | | | 1.27 | (e) | | | | | 0.50 | (d)(e) | | | | | 29 | |
| | | 12.40 | | | | | | 8.56 | | | | | | 56 | | | | | | 1.39 | (e) | | | | | 1.74 | (e) | | | | | 0.32 | (d)(e) | | | | | 29 | |
| | | | | | | | | | | | | | | | | | | | | | | | | | | | | | | | | | | | | | | | |
| | | | | | | | | | | | | | | | | | | | | | | | | | | | | | | | | | | | | | | | |
| | | 13.50 | | | | | | 26.74 | | | | | | 51,626 | | | | | | 1.16 | | | | | | 1.53 | | | | | | (0.10 | ) | | | | | 64 | |
| | | 11.90 | | | | | | 25.83 | | | | | | 11,717 | | | | | | 1.91 | | | | | | 2.28 | | | | | | (0.85 | ) | | | | | 64 | |
| | | 14.15 | | | | | | 27.32 | | | | | | 332,401 | | | | | | 0.76 | | | | | | 1.13 | | | | | | 0.30 | | | | | | 64 | |
| | | 13.47 | | | | | | 26.55 | | | | | | 156 | | | | | | 1.26 | | | | | | 1.63 | | | | | | (0.20 | ) | | | | | 64 | |
| | | 14.14 | | | | | | 27.03 | | | | | | 994 | | | | | | 0.91 | | | | | | 1.28 | | | | | | 0.15 | | | | | | 64 | |
| | | 13.42 | | | | | | 26.49 | | | | | | 15 | | | | | | 1.38 | | | | | | 1.75 | | | | | | (0.30 | ) | | | | | 64 | |
| | | 12.29 | | | | | | 15.53 | | | | | | 87,987 | | | | | | 1.15 | | | | | | 1.54 | | | | | | 0.49 | (f) | | | | | 55 | |
| | | 11.09 | | | | | | 14.68 | | | | | | 9,314 | | | | | | 1.90 | | | | | | 2.29 | | | | | | (0.35 | )(f) | | | | | 55 | |
| | | 12.79 | | | | | | 15.98 | | | | | | 242,865 | | | | | | 0.75 | | | | | | 1.14 | | | | | | 0.81 | (f) | | | | | 55 | |
| | | 12.28 | | | | | | 15.45 | | | | | | 82 | | | | | | 1.25 | | | | | | 1.64 | | | | | | 0.24 | (f) | | | | | 55 | |
| | | 12.80 | | | | | | 15.80 | | | | | | 884 | | | | | | 0.90 | | | | | | 1.29 | | | | | | 0.57 | (f) | | | | | 55 | |
| | | 12.26 | | | | | | 15.36 | | | | | | 6 | | | | | | 1.34 | | | | | | 1.73 | | | | | | 0.22 | (f) | | | | | 55 | |
| | | 11.57 | | | | | | 18.45 | | | | | | 181,257 | | | | | | 1.15 | | | | | | 1.51 | | | | | | 0.14 | | | | | | 54 | |
| | | 10.54 | | | | | | 17.71 | | | | | | 8,279 | | | | | | 1.90 | | | | | | 2.26 | | | | | | (0.61 | ) | | | | | 54 | |
| | | 12.00 | | | | | | 18.97 | | | | | | 256,389 | | | | | | 0.75 | | | | | | 1.11 | | | | | | 0.54 | | | | | | 54 | |
| | | 11.59 | | | | | | 18.50 | | | | | | 52 | | | | | | 1.25 | | | | | | 1.61 | | | | | | 0.18 | | | | | | 54 | |
| | | 12.01 | | | | | | 18.85 | | | | | | 321 | | | | | | 0.90 | | | | | | 1.26 | | | | | | 0.38 | | | | | | 54 | |
| | | 11.53 | | | | | | 18.32 | | | | | | 4 | | | | | | 1.40 | | | | | | 1.76 | | | | | | (0.05 | ) | | | | | 54 | |
| | | 9.77 | | | | | | 14.89 | | | | | | 199,185 | | | | | | 1.15 | | | | | | 1.51 | | | | | | 0.19 | | | | | | 40 | |
| | | 8.95 | | | | | | 13.87 | | | | | | 8,828 | | | | | | 1.90 | | | | | | 2.26 | | | | | | (0.56 | ) | | | | | 40 | |
| | | 10.14 | | | | | | 15.33 | | | | | | 260,481 | | | | | | 0.75 | | | | | | 1.11 | | | | | | 0.58 | | | | | | 40 | |
| | | 9.80 | | | | | | 14.90 | | | | | | 2 | | | | | | 1.25 | | | | | | 1.61 | | | | | | 0.21 | | | | | | 40 | |
| | | 10.10 | | | | | | 14.99 | | | | | | 125 | | | | | | 0.90 | | | | | | 1.26 | | | | | | 0.42 | | | | | | 40 | |
| | | 9.74 | | | | | | 14.52 | | | | | | 4 | | | | | | 1.40 | | | | | | 1.76 | | | | | | — | (h) | | | | | 40 | |
| | | 8.53 | | | | | | 3.83 | | | | | | 192,744 | | | | | | 1.15 | | | | | | 1.53 | | | | | | 0.22 | | | | | | 60 | |
| | | 7.86 | | | | | | 3.15 | | | | | | 9,224 | | | | | | 1.90 | | | | | | 2.28 | | | | | | (0.55 | ) | | | | | 60 | |
| | | 8.85 | | | | | | 4.26 | | | | | | 264,902 | | | | | | 0.75 | | | | | | 1.13 | | | | | | 0.60 | | | | | | 60 | |
| | | 8.55 | | | | | | 3.76 | | | | | | 1 | | | | | | 1.25 | | | | | | 1.63 | | | | | | 0.11 | | | | | | 60 | |
| | | 8.84 | | | | | | 4.25 | | | | | | 10 | | | | | | 0.90 | | | | | | 1.28 | | | | | | 0.39 | | | | | | 60 | |
| | | 8.51 | | | | | | 3.65 | | | | | | 3 | | | | | | 1.40 | | | | | | 1.78 | | | | | | 0.01 | | | | | | 60 | |
| | |
| The accompanying notes are an integral part of these financial statements. | | 103 |
GOLDMAN SACHS TECHNOLOGY TOLLKEEPER FUND
Financial Highlights
Selected Data for a Share Outstanding Throughout Each Period
| | | | | | | | | | | | | | | | | | | | | | |
| | | | | | Income (loss) from
investment operations | | | | |
| | | Year - Share Class | | Net asset
value,
beginning
of period | | | Net
investment
loss(a) | | | Net realized
and unrealized
gain (loss) | | | Total from
investment
operations | | | Distributions
to shareholders
from net
realized gains | |
| | FOR THE SIX MONTHS ENDED FEBRUARY 28, (UNAUDITED) | |
| | 2015 - A | | $ | 18.97 | | | $ | (0.07 | )(d) | | $ | 1.42 | | | $ | 1.35 | | | $ | (1.47 | ) |
| | 2015 - C | | | 16.91 | | | | (0.12 | )(d) | | | 1.26 | | | | 1.14 | | | | (1.47 | ) |
| | 2015 - Institutional | | | 20.16 | | | | (0.03 | )(d) | | | 1.52 | | | | 1.49 | | | | (1.47 | ) |
| | 2015 - Service | | | 18.76 | | | | (0.07 | )(d) | | | 1.39 | | | | 1.32 | | | | (1.47 | ) |
| | 2015 - IR | | | 20.04 | | | | (0.05 | )(d) | | | 1.51 | | | | 1.46 | | | | (1.47 | ) |
| | | | | | | | | | | | | | | | | | | | | | |
| | FOR THE FISCAL YEARS ENDED AUGUST 31, | | | | | | | | | | | | | | | | | | | | |
| | 2014 - A | | | 15.20 | | | | (0.15 | ) | | | 4.16 | | | | 4.01 | | | | (0.24 | ) |
| | 2014 - C | | | 13.68 | | | | (0.25 | ) | | | 3.72 | | | | 3.47 | | | | (0.24 | ) |
| | 2014 - Institutional | | | 16.08 | | | | (0.08 | ) | | | 4.40 | | | | 4.32 | | | | (0.24 | ) |
| | 2014 - Service | | | 15.04 | | | | (0.16 | ) | | | 4.12 | | | | 3.96 | | | | (0.24 | ) |
| | 2014 - IR | | | 16.01 | | | | (0.11 | ) | | | 4.38 | | | | 4.27 | | | | (0.24 | ) |
| | 2013 - A | | | 13.62 | | | | (0.12 | ) | | | 1.70 | | | | 1.58 | | | | — | |
| | 2013 - C | | | 12.34 | | | | (0.20 | ) | | | 1.54 | | | | 1.34 | | | | — | |
| | 2013 - Institutional | | | 14.34 | | | | (0.06 | ) | | | 1.80 | | | | 1.74 | | | | — | |
| | 2013 - Service | | | 13.49 | | | | (0.13 | ) | | | 1.68 | | | | 1.55 | | | | — | |
| | 2013 - IR | | | 14.30 | | | | (0.09 | ) | | | 1.80 | | | | 1.71 | | | | — | |
| | 2012 - A | | | 11.51 | | | | (0.13 | ) | | | 2.24 | | | | 2.11 | | | | — | |
| | 2012 - C | | | 10.51 | | | | (0.21 | ) | | | 2.04 | | | | 1.83 | | | | — | |
| | 2012 - Institutional | | | 12.08 | | | | (0.09 | ) | | | 2.35 | | | | 2.26 | | | | — | |
| | 2012 - Service | | | 11.41 | | | | (0.14 | ) | | | 2.22 | | | | 2.08 | | | | — | |
| | 2012 - IR | | | 12.06 | | | | (0.11 | ) | | | 2.35 | | | | 2.24 | | | | — | |
| | 2011 - A | | | 10.43 | | | | (0.14 | ) | | | 1.22 | | | | 1.08 | | | | — | |
| | 2011 - C | | | 9.59 | | | | (0.21 | ) | | | 1.13 | | | | 0.92 | | | | — | |
| | 2011 - Institutional | | | 10.90 | | | | (0.09 | ) | | | 1.27 | | | | 1.18 | | | | — | |
| | 2011 - Service | | | 10.34 | | | | (0.15 | ) | | | 1.22 | | | | 1.07 | | | | — | |
| | 2011 - IR (Commenced September 30, 2010) | | | 12.30 | | | | (0.07 | ) | | | (0.17 | ) | | | (0.24 | ) | | | — | |
| | 2010 - A | | | 9.14 | | | | (0.11 | ) | | | 1.40 | | | | 1.29 | | | | — | |
| | 2010 - C | | | 8.47 | | | | (0.17 | ) | | | 1.29 | | | | 1.12 | | | | — | |
| | 2010 - Institutional | | | 9.52 | | | | (0.07 | ) | | | 1.45 | | | | 1.38 | | | | — | |
| | 2010 - Service | | | 9.08 | | | | (0.12 | ) | | | 1.38 | | | | 1.26 | | | | — | |
| | (a) | | Calculated based on the average shares outstanding methodology. |
| | (b) | | Assumes investment at the net asset value at the beginning of the period, reinvestment of all dividends and distributions, a complete redemption of the investment at the net asset value at the end of the period and no sales or redemption charges. Total returns would be reduced if a sales or redemption charge was taken into account. Returns do not reflect the deduction of taxes that a shareholder would pay on Fund distributions or the redemption of Fund shares. Total returns for periods less than one full year are not annualized. |
| | (c) | | The Fund’s portfolio turnover rate is calculated in accordance with regulatory requirements, without regard to transactions involving short term investments and certain derivatives. If such transactions were included, the Fund’s portfolio turnover rate may be higher. |
| | (d) | | Reflects income recognized from special dividends which amounted to $0.02 per share and 0.20% of average net assets. |
| | |
| 104 | | The accompanying notes are an integral part of these financial statements. |
GOLDMAN SACHS TECHNOLOGY TOLLKEEPER FUND
| | | | | | | | | | | | | | | | | | | | | | | | | | | | | | | | | | | | | | | | |
| | | | | | | | | | | | | | | | | | | | | | | | | | | | | | | | | | |
| | | Net asset
value, end
of period | | | | | Total
return(b) | | | | | Net assets,
end of
period
(in 000s) | | | | | Ratio of
net expenses
to average
net assets | | | | | Ratio of
total expenses
to average
net assets | | | | | Ratio of
net investment
loss
to average
net assets | | | | | Portfolio
turnover
rate(c) | |
| | | | | | | | | | | | | | | | | | | | | | | | | | | | | | | | | | | | | | | | |
| | $ | 18.85 | | | | | | 7.55 | % | | | | $ | 263,248 | | | | | | 1.49 | %(e) | | | | | 1.54 | %(e) | | | | | (0.72 | )%(d)(e) | | | | | 17 | % |
| | | 16.58 | | | | | | 7.16 | | | | | | 59,421 | | | | | | 2.24 | (e) | | | | | 2.29 | (e) | | | | | (1.47 | )(d)(e) | | | | | 17 | |
| | | 20.18 | | | | | | 7.81 | | | | | | 98,595 | | | | | | 1.09 | (e) | | | | | 1.14 | (e) | | | | | (0.32 | )(d)(e) | | | | | 17 | |
| | | 18.61 | | | | | | 7.48 | | | | | | 11,865 | | | | | | 1.59 | (e) | | | | | 1.64 | (e) | | | | | (0.82 | )(d)(e) | | | | | 17 | |
| | | 20.03 | | | | | | 7.71 | | | | | | 3,256 | | | | | | 1.24 | (e) | | | | | 1.29 | (e) | | | | | (0.48 | )(d)(e) | | | | | 17 | |
| | | | | | | | | | | | | | | | | | | | | | | | | | | | | | | | | | | | | | | | |
| | | | | | | | | | | | | | | | | | | | | | | | | | | | | | | | | | | | | | | | |
| | | 18.97 | | | | | | 26.55 | | | | | | 260,982 | | | | | | 1.51 | | | | | | 1.55 | | | | | | (0.85 | ) | | | | | 39 | |
| | | 16.91 | | | | | | 25.54 | | | | | | 58,602 | | | | | | 2.26 | | | | | | 2.30 | | | | | | (1.60 | ) | | | | | 39 | |
| | | 20.16 | | | | | | 27.03 | | | | | | 99,039 | | | | | | 1.11 | | | | | | 1.15 | | | | | | (0.45 | ) | | | | | 39 | |
| | | 18.76 | | | | | | 26.49 | | | | | | 10,712 | | | | | | 1.61 | | | | | | 1.65 | | | | | | (0.96 | ) | | | | | 39 | |
| | | 20.04 | | | | | | 26.83 | | | | | | 3,228 | | | | | | 1.26 | | | | | | 1.30 | | | | | | (0.59 | ) | | | | | 39 | |
| | | 15.20 | | | | | | 11.60 | | | | | | 228,424 | | | | | | 1.50 | | | | | | 1.55 | | | | | | (0.85 | ) | | | | | 33 | |
| | | 13.68 | | | | | | 10.86 | | | | | | 50,278 | | | | | | 2.25 | | | | | | 2.30 | | | | | | (1.59 | ) | | | | | 33 | |
| | | 16.08 | | | | | | 12.13 | | | | | | 70,416 | | | | | | 1.10 | | | | | | 1.15 | | | | | | (0.43 | ) | | | | | 33 | |
| | | 15.04 | | | | | | 11.49 | | | | | | 10,167 | | | | | | 1.60 | | | | | | 1.65 | | | | | | (0.95 | ) | | | | | 33 | |
| | | 16.01 | | | | | | 11.96 | | | | | | 2,651 | | | | | | 1.25 | | | | | | 1.30 | | | | | | (0.59 | ) | | | | | 33 | |
| | | 13.62 | | | | | | 18.28 | | | | | | 239,355 | | | | | | 1.50 | | | | | | 1.55 | | | | | | (1.06 | ) | | | | | 43 | |
| | | 12.34 | | | | | | 17.36 | | | | | | 50,682 | | | | | | 2.25 | | | | | | 2.30 | | | | | | (1.81 | ) | | | | | 43 | |
| | | 14.34 | | | | | | 18.65 | | | | | | 49,238 | | | | | | 1.10 | | | | | | 1.15 | | | | | | (0.66 | ) | | | | | 43 | |
| | | 13.49 | | | | | | 18.18 | | | | | | 10,977 | | | | | | 1.60 | | | | | | 1.65 | | | | | | (1.15 | ) | | | | | 43 | |
| | | 14.30 | | | | | | 18.52 | | | | | | 2,569 | | | | | | 1.25 | | | | | | 1.30 | | | | | | (0.81 | ) | | | | | 43 | |
| | | 11.51 | | | | | | 10.35 | | | | | | 244,288 | | | | | | 1.50 | | | | | | 1.52 | | | | | | (1.07 | ) | | | | | 64 | |
| | | 10.51 | | | | | | 9.59 | | | | | | 50,424 | | | | | | 2.25 | | | | | | 2.27 | | | | | | (1.82 | ) | | | | | 64 | |
| | | 12.08 | | | | | | 10.83 | | | | | | 54,356 | | | | | | 1.10 | | | | | | 1.12 | | | | | | (0.66 | ) | | | | | 64 | |
| | | 11.41 | | | | | | 10.35 | | | | | | 10,826 | | | | | | 1.60 | | | | | | 1.62 | | | | | | (1.18 | ) | | | | | 64 | |
| | | 12.06 | | | | | | (1.95 | ) | | | | | 2,449 | | | | | | 1.25 | (e) | | | | | 1.27 | (e) | | | | | (0.59 | )(e) | | | | | 64 | |
| | | 10.43 | | | | | | 14.11 | | | | | | 225,873 | | | | | | 1.50 | | | | | | 1.63 | | | | | | (1.03 | ) | | | | | 97 | |
| | | 9.59 | | | | | | 13.22 | | | | | | 47,001 | | | | | | 2.25 | | | | | | 2.38 | | | | | | (1.78 | ) | | | | | 97 | |
| | | 10.90 | | | | | | 14.50 | | | | | | 32,538 | | | | | | 1.10 | | | | | | 1.23 | | | | | | (0.63 | ) | | | | | 97 | |
| | | 10.34 | | | | | | 13.88 | | | | | | 11,324 | | | | | | 1.60 | | | | | | 1.73 | | | | | | (1.12 | ) | | | | | 97 | |
| | |
| The accompanying notes are an integral part of these financial statements. | | 105 |
GOLDMAN SACHS U.S. EQUITY FUND
Financial Highlights
Selected Data for a Share Outstanding Throughout Each Period
| | | | | | | | | | | | | | | | | | | | | | | | | | | | | | |
| | | | | | | | Income (loss) from
investment operations | | | Distributions
to shareholders | |
| | | Year - Share Class | | Net asset
value,
beginning
of period | | | Net
investment
income (loss)(a) | | | Net realized
and unrealized
gain (loss) | | | Total from
investment
operations | | | From net
investment
income | | | From net
realized
gains | | | Total
distributions | |
| | FOR THE SIX MONTHS ENDED FEBRUARY 28, (UNAUDITED) | |
| | 2015 - A | | $ | 16.66 | | | $ | 0.06 | | | $ | 0.88 | | | $ | 0.94 | | | $ | (0.07 | ) | | $ | (2.59 | ) | | $ | (2.66 | ) |
| | 2015 - C | | | 16.33 | | | | — | (e) | | | 0.87 | | | | 0.87 | | | | — | | | | (2.59 | ) | | | (2.59 | ) |
| | 2015 - Institutional | | | 16.75 | | | | 0.09 | | | | 0.89 | | | | 0.98 | | | | (0.13 | ) | | | (2.59 | ) | | | (2.72 | ) |
| | 2015 - IR | | | 16.72 | | | | 0.08 | | | | 0.89 | | | | 0.97 | | | | (0.11 | ) | | | (2.59 | ) | | | (2.70 | ) |
| | 2015 - R | | | 16.62 | | | | 0.04 | | | | 0.88 | | | | 0.92 | | | | (0.03 | ) | | | (2.59 | ) | | | (2.62 | ) |
| | | | | | | | | | | | | | | | | | | | | | | | | | | | | | |
| | FOR THE FISCAL YEARS ENDED AUGUST 31, | |
| | 2014 - A | | | 14.79 | | | | 0.06 | | | | 3.23 | | | | 3.29 | | | | (0.05 | ) | | | (1.37 | ) | | | (1.42 | ) |
| | 2014 - C | | | 14.58 | | | | (0.06 | ) | | | 3.18 | | | | 3.12 | | | | — | | | | (1.37 | ) | | | (1.37 | ) |
| | 2014 - Institutional | | | 14.85 | | | | 0.12 | | | | 3.25 | | | | 3.37 | | | | (0.10 | ) | | | (1.37 | ) | | | (1.47 | ) |
| | 2014 - IR | | | 14.83 | | | | 0.10 | | | | 3.24 | | | | 3.34 | | | | (0.08 | ) | | | (1.37 | ) | | | (1.45 | ) |
| | 2014 - R | | | 14.78 | | | | 0.02 | | | | 3.23 | | | | 3.25 | | | | (0.04 | ) | | | (1.37 | ) | | | (1.41 | ) |
| | 2013 - A | | | 12.30 | | | | 0.09 | | | | 2.48 | | | | 2.57 | | | | (0.08 | ) | | | — | | | | (0.08 | ) |
| | 2013 - C | | | 12.13 | | | | (0.01 | ) | | | 2.46 | | | | 2.45 | | | | — | | | | — | | | | — | |
| | 2013 - Institutional | | | 12.35 | | | | 0.14 | | | | 2.50 | | | | 2.64 | | | | (0.14 | ) | | | — | | | | (0.14 | ) |
| | 2013 - IR | | | 12.34 | | | | 0.12 | | | | 2.50 | | | | 2.62 | | | | (0.13 | ) | | | — | | | | (0.13 | ) |
| | 2013 - R | | | 12.29 | | | | 0.04 | | | | 2.51 | | | | 2.55 | | | | (0.06 | ) | | | — | | | | (0.06 | ) |
| | 2012 - A | | | 10.71 | | | | 0.08 | | | | 1.66 | | | | 1.74 | | | | (0.04 | ) | | | (0.11 | ) | | | (0.15 | ) |
| | 2012 - C | | | 10.61 | | | | (0.01 | ) | | | 1.64 | | | | 1.63 | | | | — | | | | (0.11 | ) | | | (0.11 | ) |
| | 2012 - Institutional | | | 10.76 | | | | 0.13 | | | | 1.65 | | | | 1.78 | | | | (0.08 | ) | | | (0.11 | ) | | | (0.19 | ) |
| | 2012 - IR | | | 10.73 | | | | 0.11 | | | | 1.65 | | | | 1.76 | | | | (0.04 | ) | | | (0.11 | ) | | | (0.15 | ) |
| | 2012 - R | | | 10.70 | | | | 0.05 | | | | 1.65 | | | | 1.70 | | | | — | (e) | | | (0.11 | ) | | | (0.11 | ) |
| | 2011 - A | | | 9.55 | | | | 0.03 | | | | 1.21 | | | | 1.24 | | | | (0.05 | ) | | | (0.03 | ) | | | (0.08 | ) |
| | 2011 - C | | | 9.49 | | | | (0.05 | ) | | | 1.21 | | | | 1.16 | | | | (0.01 | ) | | | (0.03 | ) | | | (0.04 | ) |
| | 2011 - Institutional | | | 9.57 | | | | 0.08 | | | | 1.22 | | | | 1.30 | | | | (0.08 | ) | | | (0.03 | ) | | | (0.11 | ) |
| | 2011 - IR | | | 9.56 | | | | 0.06 | | | | 1.22 | | | | 1.28 | | | | (0.08 | ) | | | (0.03 | ) | | | (0.11 | ) |
| | 2011 - R | | | 9.53 | | | | 0.01 | | | | 1.20 | | | | 1.21 | | | | (0.01 | ) | | | (0.03 | ) | | | (0.04 | ) |
| | 2010 - A (Commenced November 30, 2009) | | | 10.00 | | | | 0.03 | | | | (0.47 | ) | | | (0.44 | ) | | | (0.01 | ) | | | — | | | | (0.01 | ) |
| | 2010 - C (Commenced November 30, 2009) | | | 10.00 | | | | (0.02 | ) | | | (0.49 | ) | | | (0.51 | ) | | | — | (e) | | | — | | | | — | (e) |
| | 2010 - Institutional (Commenced November 30, 2009) | | | 10.00 | | | | 0.06 | | | | (0.48 | ) | | | (0.42 | ) | | | (0.01 | ) | | | — | | | | (0.01 | ) |
| | 2010 - IR (Commenced November 30, 2009) | | | 10.00 | | | | 0.05 | | | | (0.48 | ) | | | (0.43 | ) | | | (0.01 | ) | | | — | | | | (0.01 | ) |
| | 2010 - R (Commenced November 30, 2009) | | | 10.00 | | | | 0.01 | | | | (0.47 | ) | | | (0.46 | ) | | | (0.01 | ) | | | — | | | | (0.01 | ) |
| | (a) | | Calculated based on the average shares outstanding methodology. |
| | (b) | | Assumes investment at the net asset value at the beginning of the period, reinvestment of all dividends and distributions, a complete redemption of the investment at the net asset value at the end of the period and no sales or redemption charges. Total returns would be reduced if a sales or redemption charge was taken into account. Returns do not reflect the deduction of taxes that a shareholder would pay on Fund distributions or the redemption of Fund shares. Total returns for periods less than one full year are not annualized. |
| | (c) | | The Fund’s portfolio turnover rate is calculated in accordance with regulatory requirements, without regard to transactions involving short term investments and certain derivatives. If such transactions were included, the Fund’s portfolio turnover rate may be higher. |
| | (e) | | Amount is less than $0.005 per share. |
| | |
| 106 | | The accompanying notes are an integral part of these financial statements. |
GOLDMAN SACHS U.S. EQUITY FUND
| | | | | | | | | | | | | | | | | | | | | | | | | | | | | | | | | | | | | | | | |
| | | | | | | | | | | | | | | | | | | | | | | | | | | | | | | | | | |
| | | Net asset
value, end
of period | | | | | Total
return(b) | | | | | Net assets,
end of
period
(in 000s) | | | | | Ratio of
net expenses
to average
net assets | | | | | Ratio of
total expenses
to average
net assets | | | | | Ratio of
net investment
income (loss)
to average
net assets | | | | | Portfolio
turnover
rate(c) | |
| | | | | | | | | | | | | | | | | | | | | | | | | | | | | | | | | | | | | | | | |
| | $ | 14.94 | | | | | | 6.02 | % | | | | $ | 4,896 | | | | | | 1.20 | %(d) | | | | | 2.66 | %(d) | | | | | 0.73 | %(d) | | | | | 31 | % |
| | | 14.61 | | | | | | 5.63 | | | | | | 447 | | | | | | 1.95 | (d) | | | | | 3.30 | (d) | | | | | 0.06 | (d) | | | | | 31 | |
| | | 15.01 | | | | | | 6.26 | | | | | | 8,705 | | | | | | 0.80 | (d) | | | | | 2.27 | (d) | | | | | 1.13 | (d) | | | | | 31 | |
| | | 14.99 | | | | | | 6.18 | | | | | | 230 | | | | | | 0.95 | (d) | | | | | 2.41 | (d) | | | | | 0.98 | (d) | | | | | 31 | |
| | | 14.92 | | | | | | 5.90 | | | | | | 119 | | | | | | 1.45 | (d) | | | | | 2.90 | (d) | | | | | 0.49 | (d) | | | | | 31 | |
| | | | | | | | | | | | | | | | | | | | | | | | | | | | | | | | | | | | | | | | |
| | | | | | | | | | | | | | | | | | | | | | | | | | | | | | | | | | | | | | | | |
| | | 16.66 | | | | | | 23.41 | | | | | | 4,542 | | | | | | 1.20 | | | | | | 3.04 | | | | | | 0.37 | | | | | | 67 | |
| | | 16.33 | | | | | | 22.44 | | | | | | 247 | | | | | | 1.95 | | | | | | 3.78 | | | | | | (0.37 | ) | | | | | 67 | |
| | | 16.75 | | | | | | 23.92 | | | | | | 8,995 | | | | | | 0.80 | | | | | | 2.65 | | | | | | 0.76 | | | | | | 67 | |
| | | 16.72 | | | | | | 23.71 | | | | | | 205 | | | | | | 0.95 | | | | | | 2.80 | | | | | | 0.61 | | | | | | 67 | |
| | | 16.62 | | | | | | 23.06 | | | | | | 110 | | | | | | 1.45 | | | | | | 3.30 | | | | | | 0.11 | | | | | | 67 | |
| | | 14.79 | | | | | | 21.05 | | | | | | 2,869 | | | | | | 1.18 | | | | | | 3.66 | | | | | | 0.68 | | | | | | 61 | |
| | | 14.58 | | | | | | 20.20 | | | | | | 126 | | | | | | 1.93 | | | | | | 4.41 | | | | | | (0.09 | ) | | | | | 61 | |
| | | 14.85 | | | | | | 21.56 | | | | | | 8,646 | | | | | | 0.78 | | | | | | 3.24 | | | | | | 1.06 | | | | | | 61 | |
| | | 14.83 | | | | | | 21.39 | | | | | | 174 | | | | | | 0.93 | | | | | | 3.39 | | | | | | 0.90 | | | | | | 61 | |
| | | 14.78 | | | | | | 20.83 | | | | | | 51 | | | | | | 1.43 | | | | | | 3.80 | | | | | | 0.29 | | | | | | 61 | |
| | | 12.30 | | | | | | 16.37 | | | | | | 3,331 | | | | | | 1.18 | | | | | | 3.63 | | | | | | 0.69 | | | | | | 76 | |
| | | 12.13 | | | | | | 15.45 | | | | | | 158 | | | | | | 1.93 | | | | | | 4.38 | | | | | | (0.05 | ) | | | | | 76 | |
| | | 12.35 | | | | | | 16.71 | | | | | | 7,142 | | | | | | 0.78 | | | | | | 3.23 | | | | | | 1.11 | | | | | | 76 | |
| | | 12.34 | | | | | | 16.52 | | | | | | 70 | | | | | | 0.93 | | | | | | 3.38 | | | | | | 0.97 | | | | | | 76 | |
| | | 12.29 | | | | | | 16.02 | | | | | | 12 | | | | | | 1.43 | | | | | | 3.88 | | | | | | 0.45 | | | | | | 76 | |
| | | 10.71 | | | | | | 12.94 | | | | | | 3,110 | | | | | | 1.18 | | | | | | 4.88 | | | | | | 0.29 | | | | | | 51 | |
| | | 10.61 | | | | | | 12.19 | | | | | | 139 | | | | | | 1.93 | | | | | | 5.63 | | | | | | (0.42 | ) | | | | | 51 | |
| | | 10.76 | | | | | | 13.54 | | | | | | 5,945 | | | | | | 0.78 | | | | | | 4.48 | | | | | | 0.72 | | | | | | 51 | |
| | | 10.73 | | | | | | 13.32 | | | | | | 241 | | | | | | 0.93 | | | | | | 4.63 | | | | | | 0.56 | | | | | | 51 | |
| | | 10.70 | | | | | | 12.70 | | | | | | 11 | | | | | | 1.43 | | | | | | 5.13 | | | | | | 0.08 | | | | | | 51 | |
| | | 9.55 | | | | | | (4.44 | ) | | | | | 777 | | | | | | 1.18 | (d) | | | | | 11.67 | (d) | | | | | 0.37 | (d) | | | | | 63 | |
| | | 9.49 | | | | | | (5.10 | ) | | | | | 14 | | | | | | 1.93 | (d) | | | | | 12.42 | (d) | | | | | (0.29 | )(d) | | | | | 63 | |
| | | 9.57 | | | | | | (4.20 | ) | | | | | 4,351 | | | | | | 0.78 | (d) | | | | | 11.27 | (d) | | | | | 0.74 | (d) | | | | | 63 | |
| | | 9.56 | | | | | | (4.31 | ) | | | | | 20 | | | | | | 0.93 | (d) | | | | | 11.42 | (d) | | | | | 0.62 | (d) | | | | | 63 | |
| | | 9.53 | | | | | | (4.65 | ) | | | | | 10 | | | | | | 1.43 | (d) | | | | | 11.92 | (d) | | | | | 0.10 | (d) | | | | | 63 | |
| | |
| The accompanying notes are an integral part of these financial statements. | | 107 |
GOLDMAN SACHS FUNDAMENTAL EQUITY GROWTH FUNDS
Notes to Financial Statements
February 28, 2015 (Unaudited)
Goldman Sachs Trust (the “Trust”) is a Delaware statutory trust registered under the Investment Company Act of 1940, as amended (the “Act”), as an open-end management investment company. The following table lists those series of the Trust that are included in this report (collectively, the “Funds” or individually, a “Fund”), along with their corresponding share classes and respective diversification status under the Act:
| | | | |
| Fund | | Share Classes Offered* | | Diversified/
Non-diversified |
Capital Growth, Growth Opportunities, Small/Mid Cap Growth and Strategic Growth | | A, C, Institutional, Service, IR and R | | Diversified |
Concentrated Growth and Focused Growth | | A, C, Institutional, IR and R | | Non-diversified |
Flexible Cap Growth and U.S. Equity | | A, C, Institutional, IR and R | | Diversified |
Technology Tollkeeper | | A, C, Institutional, Service and IR | | Diversified |
Class A Shares are sold with a front-end sales charge of up to 5.50%. Class C Shares are sold with a contingent deferred sales charge (“CDSC”) of 1.00%, which is imposed on redemptions made within 12 months of purchase. Institutional, Service, Class IR and Class R Shares are not subject to a sales charge.
At the close of business on November 14, 2014, Class B Shares of the Capital Growth, Concentrated Growth, Growth Opportunities, Small/Mid Cap Growth, Strategic Growth and Technology Tollkeeper Funds were converted to Class A Shares of the Fund.
Goldman Sachs Asset Management, L.P. (“GSAM”), an affiliate of Goldman, Sachs & Co. (“Goldman Sachs”), serves as investment adviser to the Funds pursuant to a management agreement (the “Agreement”) with the Trust.
|
| 2. SIGNIFICANT ACCOUNTING POLICIES |
The financial statements have been prepared in accordance with accounting principles generally accepted in the United States of America (“GAAP”) and require management to make estimates and assumptions that may affect the reported amounts and disclosures. Actual results may differ from those estimates and assumptions.
A. Investment Valuation — The Funds’ valuation policy is to value investments at fair value.
B. Investment Income and Investments — Investment income includes interest income and dividend income, net of any foreign withholding taxes, less any amounts reclaimable. Interest income is accrued daily and adjusted for amortization of premiums and accretion of discounts. Dividend income is recognized on ex-dividend date or, for certain foreign securities, as soon as such information is obtained subsequent to the ex-dividend date. Investment transactions are reflected on trade date. Realized gains and losses are calculated using identified cost. Investment transactions are recorded on the following business day for daily net asset value (“NAV”) calculations. Any foreign capital gains tax is accrued daily based upon net unrealized gains, and is
108
GOLDMAN SACHS FUNDAMENTAL EQUITY GROWTH FUNDS
|
| 2. SIGNIFICANT ACCOUNTING POLICIES (continued) |
payable upon sale of such investments. Distributions received from the Funds’ investments in U.S. real estate investment trusts (“REITs”) may be characterized as ordinary income, net capital gain or a return of capital. A return of capital is recorded by the Funds as a reduction to the cost basis of the REIT.
C. Class Allocations and Expenses — Investment income, realized and unrealized gain (loss), and non-class specific expenses of each Fund are allocated daily based upon the proportion of net assets of each class. Class specific expenses, where applicable, are borne by the respective share classes and include Distribution and Service, Transfer Agent and Service and Shareholder Administration fees. Non-class specific expenses directly incurred by a Fund are charged to that Fund, while such expenses incurred by the Trust are allocated across the respective Funds on a straight-line and/or pro-rata basis depending upon the nature of the expenses.
D. Federal Taxes and Distributions to Shareholders — It is each Fund’s policy to comply with the requirements of the Internal Revenue Code of 1986, as amended (the “Code”), applicable to regulated investment companies (mutual funds) and to distribute each year substantially all of its investment company taxable income and capital gains to its shareholders. Accordingly, the Funds are not required to make any provisions for the payment of federal income tax. Distributions to shareholders are recorded on the ex-dividend date. Income and capital gains distributions, if any, are declared and paid annually.
Net capital losses are carried forward to future fiscal years and may be used to the extent allowed by the Code to offset any future capital gains. Utilization of capital loss carryforwards will reduce the requirement of future capital gains distributions.
Under the Regulated Investment Company Modernization Act of 2010, the Funds are permitted to carry forward capital losses incurred in taxable years beginning after December 22, 2010 for an unlimited period. However, any losses incurred during those future taxable years will be required to be utilized prior to the losses incurred in pre-enactment taxable years. As a result of this ordering rule, pre-enactment capital loss carryforwards may be more likely to expire unused. Additionally, post-enactment capital losses that are carried forward will retain their character as either short-term or long-term capital losses rather than being considered all short-term as under previous law.
The characterization of distributions to shareholders for financial reporting purposes is determined in accordance with federal income tax rules, which may differ from GAAP. The source of each Fund’s distributions may be shown in the accompanying financial statements as either from net investment income, net realized gain or capital. Certain components of the Funds’ net assets on the Statements of Assets and Liabilities reflect permanent GAAP/tax differences based on the appropriate tax character.
E. Commission Recapture — GSAM, on behalf of certain Funds, may direct portfolio trades, subject to seeking best execution, to various brokers who have agreed to rebate a portion of the commissions generated. Such rebates are made directly to a Fund as cash payments and are included in net realized gain (loss) from investments on the Statement of Operations.
| | |
| 3. INVESTMENTS AND FAIR VALUE MEASUREMENTS | | |
The fair value of a financial instrument is the amount that would be received to sell an asset or paid to transfer a liability in an orderly transaction between market participants at the measurement date (i.e., the exit price). GAAP establishes a fair value hierarchy that prioritizes the inputs to valuation techniques used to measure fair value. The hierarchy gives the highest priority to unadjusted quoted prices in active markets for identical assets or liabilities (Level 1 measurements) and the lowest priority to
109
GOLDMAN SACHS FUNDAMENTAL EQUITY GROWTH FUNDS
Notes to Financial Statements (continued)
February 28, 2015 (Unaudited)
|
| 3. INVESTMENTS AND FAIR VALUE MEASUREMENTS (continued) |
unobservable inputs (Level 3 measurements). The levels used for classifying investments are not necessarily an indication of the risk associated with investing in these investments. The three levels of the fair value hierarchy are described below:
Level 1 — Unadjusted quoted prices in active markets that are accessible at the measurement date for identical, unrestricted assets or liabilities;
Level 2 — Quoted prices in markets that are not active or financial instruments for which significant inputs are observable (including, but not limited to, quoted prices for similar investments, interest rates, foreign exchange rates, volatility and credit spreads), either directly or indirectly;
Level 3 — Prices or valuations that require significant unobservable inputs (including GSAM’s assumptions in determining fair value measurement).
The Trustees have adopted Valuation Procedures that govern the valuation of the portfolio investments held by the Funds, including investments for which market quotations are not readily available. The Trustees have delegated to GSAM day-to-day responsibility for implementing and maintaining internal controls and procedures related to the valuation of the Funds’ portfolio investments. To assess the continuing appropriateness of pricing sources and methodologies, GSAM regularly performs price verification procedures and issues challenges as necessary to third party pricing vendors or brokers, and any differences are reviewed in accordance with the Valuation Procedures.
A. Level 1 and Level 2 Fair Value Investments — The valuation techniques and significant inputs used in determining the fair values for investments classified as Level 1 and Level 2 are as follows:
Equity Securities — Equity securities and investment companies traded on a United States (“U.S.”) securities exchange or the NASDAQ system, or those located on certain foreign exchanges, including but not limited to the Americas, are valued daily at their last sale price or official closing price on the principal exchange or system on which they are traded. If there is no sale or official closing price or it is believed by the investment adviser to not represent fair value, equity securities and exchange traded investment companies are valued at the last bid price for long positions and at the last ask price for short positions. Investments in investment companies (other than those that are exchange traded) are valued at the NAV on the valuation date. To the extent these investments are actively traded, they are classified as Level 1 of the fair value hierarchy, otherwise they are generally classified as Level 2.
Unlisted equity securities for which market quotations are available are valued at the last sale price on the valuation date, or if no sale occurs, at the last bid price. Securities traded on certain foreign securities exchanges are valued daily at fair value determined by an independent fair value service (if available) under Valuation Procedures approved by the Trustees and consistent with applicable regulatory guidance. The independent fair value service takes into account multiple factors including, but not limited to, movements in the securities markets, certain depositary receipts, futures contracts and foreign currency exchange rates that have occurred subsequent to the close of the foreign securities exchange. These investments are generally classified as Level 2 of the fair value hierarchy.
Investments in Money Market Funds — Investments in the Goldman Sachs Financial Square Government Fund are valued at the NAV of the Institutional Share class on the day of valuation. These investments are generally classified as Level 1 of the fair value hierarchy.
110
GOLDMAN SACHS FUNDAMENTAL EQUITY GROWTH FUNDS
|
| 3. INVESTMENTS AND FAIR VALUE MEASUREMENTS (continued) |
The Goldman Sachs Financial Square Government Fund may invest in debt securities which are valued daily on the basis of quotations supplied by dealers, if market quotations are readily available, or an independent pricing service approved by the Trustees. The pricing services may use valuation models or matrix pricing, which consider: (i) yield or price with respect to bonds that are considered comparable in characteristics such as rating, interest rate and maturity date or (ii) quotations from securities dealers to determine current value. Short-term debt obligations that mature in sixty days or less and that do not exhibit signs of credit deterioration are valued at amortized cost, which approximates fair value. With the exception of treasury securities, which are generally classified as Level 1, these investments are generally classified as Level 2 of the fair value hierarchy.
Debt Securities — Debt securities for which market quotations are readily available are valued daily on the basis of quotations supplied by dealers or an independent pricing service approved by the Trustees. The pricing services may use valuation models or matrix pricing, which consider: (i) yield or price with respect to bonds that are considered comparable in characteristics such as rating, interest rate and maturity date or (ii) quotations from securities dealers to determine current value. Short-term debt obligations that mature in sixty days or less and that do not exhibit signs of credit deterioration are valued at amortized cost, which approximates fair value. With the exception of treasury securities of G8 countries (not held in money market funds), which are generally classified as Level 1, these investments are generally classified as Level 2 of the fair value hierarchy.
Short Term Investments — Short-term investments having a maturity of 60 days or less are generally valued at amortized cost, which approximates fair market value. These investments are classified as Level 2 of the fair value hierarchy.
Repurchase Agreements — Repurchase agreements involve the purchase of securities subject to the seller’s agreement to repurchase the securities at a mutually agreed upon date and price, under the terms of a Master Repurchase Agreement (“MRA”). During the term of a repurchase agreement, the value of the underlying securities held as collateral on behalf of a Fund, including accrued interest, is required to exceed the value of the repurchase agreement, including accrued interest. The gross value of repurchase agreements is included in the Statements of Assets and Liabilities for financial reporting purposes. The underlying securities for all repurchase agreements are held at the Funds’ custodian or designated sub-custodians under tri-party repurchase agreements.
An MRA governs transactions between a Fund and select counterparties. An MRA contains provisions for, among other things, initiation, income payments, events of default and maintenance of securities for repurchase agreements. An MRA also permits offsetting with collateral to create one single net payment in the event of default or similar events, including the bankruptcy or insolvency of a counterparty.
If the seller defaults, a Fund could suffer a loss to the extent that the proceeds from the sale of the underlying securities and other collateral held by the Fund are less than the repurchase price and the Fund’s costs associated with delay and enforcement of the repurchase agreement. In addition, in the event of default or insolvency of the seller, a court could determine that a Fund’s interest in the collateral is not enforceable, resulting in additional losses to the Fund.
Pursuant to exemptive relief granted by the Securities and Exchange Commission (“SEC”) and terms and conditions contained therein, the Funds, together with other funds of the Trust and registered investment companies having management agreements with GSAM or its affiliates, may transfer uninvested cash into joint accounts, the daily aggregate balance of which is invested in one or more repurchase agreements. Under these joint accounts, the Funds maintain pro-rata credit exposure to the underlying repurchase agreements’ counterparties. With the exception of certain transaction fees, the Funds are not subject to any expenses in relation to these investments.
111
GOLDMAN SACHS FUNDAMENTAL EQUITY GROWTH FUNDS
Notes to Financial Statements (continued)
February 28, 2015 (Unaudited)
|
| 3. INVESTMENTS AND FAIR VALUE MEASUREMENTS (continued) |
B. Level 3 Fair Value Investments — To the extent that the aforementioned significant inputs are unobservable, or if quotations are not readily available, or if GSAM believes that such quotations do not accurately reflect fair value, the fair value of the Funds’ investments may be determined under Valuation Procedures approved by the Trustees. GSAM, consistent with its procedures and applicable regulatory guidance, may make an adjustment to the most recent valuation prices of either domestic or foreign securities in light of significant events to reflect what it believes to be the fair value of the securities at the time of determining a Fund’s NAV. Significant events which could affect a large number of securities in a particular market may include, but are not limited to: significant fluctuations in U.S. or foreign markets; market dislocations; market disruptions; or unscheduled market closings. Significant events which could also affect a single issuer may include, but are not limited to: corporate actions such as reorganizations, mergers and buy-outs; ratings downgrades; and bankruptcies.
C. Fair Value Hierarchy — The following is a summary of the Funds’ investments and derivatives classified in the fair value hierarchy as of February 28, 2015:
| | | | | | | | | | | | |
|
| CAPITAL GROWTH | |
| | | |
| Investment Type | | Level 1 | | | Level 2 | | | Level 3 | |
| Assets | | | | | | | | | | | | |
Common Stock and/or Other Equity Investments(a) | | | | | | | | | | | | |
Europe | | $ | 20,156,780 | | | $ | — | | | $ | — | |
North America | | | 983,714,753 | | | | — | | | | — | |
Short-term Investment | | | — | | | | 14,300,000 | | | | — | |
| Total | | $ | 1,003,871,533 | | | $ | 14,300,000 | | | $ | — | |
| | | |
| CONCENTRATED GROWTH | | | | | | | | | | | | |
| | | |
| Investment Type | | Level 1 | | | Level 2 | | | Level 3 | |
| Assets | | | | | | | | | | | | |
Common Stock and/or Other Equity Investments(a) | | | | | | | | | | | | |
North America | | $ | 184,299,493 | | | $ | — | | | $ | — | |
Short-term Investment | | | — | | | | 2,800,000 | | | | — | |
| Total | | $ | 184,299,493 | | | $ | 2,800,000 | | | $ | — | |
|
| FLEXIBLE CAP GROWTH | |
| | | |
| Investment Type | | Level 1 | | | Level 2 | | | Level 3 | |
| Assets | | | | | | | | | | | | |
Common Stock and/or Other Equity Investments(a) | | | | | | | | | | | | |
Europe | | $ | 431,275 | | | $ | — | | | $ | — | |
North America | | | 17,285,725 | | | | — | | | | — | |
Short-term Investment | | | — | | | | 300,000 | | | | — | |
| Total | | $ | 17,717,000 | | | $ | 300,000 | | | $ | — | |
112
GOLDMAN SACHS FUNDAMENTAL EQUITY GROWTH FUNDS
|
| 3. INVESTMENTS AND FAIR VALUE MEASUREMENTS (continued) |
| | | | | | | | | | | | |
| | | |
| FOCUSED GROWTH | | | | | | | | | | | | |
| | | |
| Investment Type | | Level 1 | | | Level 2 | | | Level 3 | |
| Assets | | | | | | | | | | | | |
Common Stock and/or Other Equity Investments(a) | | | | | | | | | | | | |
North America | | $ | 32,723,102 | | | $ | — | | | $ | — | |
Short-term Investment | | | — | | | | 600,000 | | | | — | |
| Total | | $ | 32,723,102 | | | $ | 600,000 | | | $ | — | |
|
| GROWTH OPPORTUNITIES | |
| | | |
| Investment Type | | Level 1 | | | Level 2 | | | Level 3 | |
| Assets | | | | | | | | | | | | |
Common Stock and/or Other Equity Investments(a) | | | | | | | | | | | | |
Europe | | $ | 211,290,938 | | | $ | — | | | $ | — | |
North America | | | 4,988,121,854 | | | | — | | | | — | |
Investment Company | | | 142,354,684 | | | | — | | | | — | |
| Total | | $ | 5,341,767,476 | | | $ | — | | | $ | — | |
|
| SMALL/MID CAP GROWTH | |
| | | |
| Investment Type | | Level 1 | | | Level 2 | | | Level 3 | |
| Assets | | | | | | | | | | | | |
Common Stock and/or Other Equity Investments(a) | | | | | | | | | | | | |
Europe | | $ | 130,124,972 | | | $ | — | | | $ | — | |
North America | | | 2,371,730,482 | | | | — | | | | — | |
Short-term Investment | | | — | | | | 81,400,000 | | | | — | |
| Total | | $ | 2,501,855,454 | | | $ | 81,400,000 | | | $ | — | |
|
| STRATEGIC GROWTH | |
| | | |
| Investment Type | | Level 1 | | | Level 2 | | | Level 3 | |
| Assets | | | | | | | | | | | | |
Common Stock and/or Other Equity Investments(a) | | | | | | | | | | | | |
Europe | | $ | 2,793,093 | | | $ | — | | | $ | — | |
North America | | | 411,739,980 | | | | — | | | | — | |
Short-term Investment | | | — | | | | 7,000,000 | | | | — | |
| Total | | $ | 414,533,073 | | | $ | 7,000,000 | | | $ | — | |
113
GOLDMAN SACHS FUNDAMENTAL EQUITY GROWTH FUNDS
Notes to Financial Statements (continued)
February 28, 2015 (Unaudited)
|
| 3. INVESTMENTS AND FAIR VALUE MEASUREMENTS (continued) |
| | | | | | | | | | | | |
| | | |
| TECHNOLOGY TOLLKEEPER | | | | | | | | | | | | |
| | | |
| Investment Type | | Level 1 | | | Level 2 | | | Level 3 | |
| Assets | | | | | | | | | | | | |
Common Stock and/or Other Equity Investments(a) | | | | | | | | | | | | |
North America | | $ | 430,818,590 | | | $ | — | | | $ | — | |
Short-term Investment | | | — | | | | 2,700,000 | | | | — | |
| Total | | $ | 430,818,590 | | | $ | 2,700,000 | | | $ | — | |
| | | |
| U.S. EQUITY | | | | | | | | | | | | |
| | | |
| Investment Type | | Level 1 | | | Level 2 | | | Level 3 | |
| Assets | | | | | | | | | | | | |
Common Stock and/or Other Equity Investments(a) | | | | | | | | | | | | |
North America | | $ | 13,796,173 | | | $ | — | | | $ | — | |
Short-term Investment | | | — | | | | 500,000 | | | | — | |
| Total | | $ | 13,796,173 | | | $ | 500,000 | | | $ | — | |
| (a) | | Amounts are disclosed by continent to highlight the impact of time zone differences between local market close and the calculation of net asset value. Security valuations are based on the principle exchange or system on which they are traded, which may differ from country of domicile. |
For further information regarding security characteristics, see the Schedules of Investments.
| | |
| 4. AGREEMENTS AND AFFILIATED TRANSACTIONS |
A. Management Agreement — Under the Agreement, GSAM manages the Funds, subject to the general supervision of the Trustees.
As compensation for the services rendered pursuant to the Agreement, the assumption of the expenses related thereto and administration of the Funds’ business affairs, including providing facilities, GSAM is entitled to a management fee, accrued daily and paid monthly, equal to an annual percentage rate of each Fund’s average daily net assets.
114
GOLDMAN SACHS FUNDAMENTAL EQUITY GROWTH FUNDS
|
| 4. AGREEMENTS AND AFFILIATED TRANSACTIONS (continued) |
For the six months ended February 28, 2015, contractual and effective net management fees with GSAM were at the following rates:
| | | | | | | | | | | | | | | | | | | | | | | | | | | | | | |
| | | | | Contractual Management Rate | | | | |
| Fund | | | | First
$1 billion | | | Next
$1 billion | | | Next
$3 billion | | | Next
$3 billion | | | Over
$8 billion | | | Effective
Rate | | | Effective Net
Management
Rate | |
Capital Growth | | | | | 1.00 | % | | | 0.90 | % | | | 0.80 | % | | | 0.80 | % | | | 0.80 | % | | | 1.00 | % | | | 0.71 | %# |
Concentrated Growth | | | | | 1.00 | | | | 0.90 | | | | 0.86 | | | | 0.84 | | | | 0.82 | | | | 1.00 | | | | 0.80 | #^ |
Flexible Cap Growth | | | | | 1.00 | | | | 0.90 | | | | 0.86 | | | | 0.84 | | | | 0.82 | | | | 1.00 | | | | 0.80 | #^ |
Focused Growth | | | | | 1.00 | | | | 0.90 | | | | 0.86 | | | | 0.84 | | | | 0.82 | | | | 1.00 | | | | 0.79 | # |
Growth Opportunities | | | | | 1.00 | | | | 1.00 | | | | 0.90 | | | | 0.86 | | | | 0.84 | | | | 0.94 | | | | 0.90 | # |
Small/Mid Cap Growth | | | | | 1.00 | | | | 1.00 | | | | 0.90 | | | | 0.86 | | | | 0.84 | | | | 0.99 | | | | 0.85 | # |
Strategic Growth | | | | | 1.00 | | | | 0.90 | | | | 0.86 | | | | 0.84 | | | | 0.82 | | | | 1.00 | | | | 0.71 | # |
Technology Tollkeeper | | | | | 1.00 | | | | 0.90 | | | | 0.86 | | | | 0.84 | | | | 0.82 | | | | 1.00 | | | | 1.00 | |
U.S. Equity | | | | | 0.70 | | | | 0.63 | | | | 0.60 | | | | 0.59 | | | | 0.58 | | | | 0.70 | | | | 0.70 | |
| # | | GSAM agreed to waive a portion of its management fee rates, set forth in the Funds’ most recent prospectuses. In addition, the Effective Net Management Rate includes the impact of management fee waivers of affiliated underlying funds, if any. These waivers will be effective through at least December 29, 2015, and prior to such date GSAM may not terminate the arrangements without the approval of the Trustees. |
| ^ | | Effective December 29, 2014, GSAM agreed to waive a portion of it’s management fee in order to achieve an Effective Net Management Rate of 0.78% for both Concentrated Growth and Flexible Cap Growth Fund. Prior to December 29, 2014, the Effective Net Management Rate for both Concentrated Growth and Flexible Cap Growth Fund was 0.81%. |
B. Distribution and Service Plans — The Trust, on behalf of each Fund, has adopted Distribution and Service Plans (the “Plans”). Under the Plans, Goldman Sachs, which serves as distributor (the “Distributor”), is entitled to a fee accrued daily and paid monthly, for distribution services and personal and account maintenance services, which may then be paid by Goldman Sachs to authorized dealers, at the following annual rates calculated on a Fund’s average daily net assets of each respective share class:
| | | | | | | | | | | | |
| | | Distribution and Service Plan Rates | |
| | | Class A* | | | Class C | | | Class R* | |
Distribution Plan | | | 0.25 | % | | | 0.75 | % | | | 0.50 | % |
Service Plan | | | — | | | | 0.25 | | | | — | |
| * | | With respect to Class A and Class R Shares, the Distributor at its discretion may use compensation for distribution services paid under the Distribution Plan to compensate service organizations for personal and account maintenance services and expenses as long as such total compensation does not exceed the maximum cap on “service fees” imposed by the Financial Industry Regulatory Authority. |
115
GOLDMAN SACHS FUNDAMENTAL EQUITY GROWTH FUNDS
Notes to Financial Statements (continued)
February 28, 2015 (Unaudited)
|
| 4. AGREEMENTS AND AFFILIATED TRANSACTIONS (continued) |
C. Distribution Agreement — Goldman Sachs, as Distributor of the shares of the Funds pursuant to a Distribution Agreement, may retain a portion of the Class A front end sales charge and Class C Shares’ CDSC. During the six months ended February 28, 2015, Goldman Sachs advised that it retained the following amounts:
| | | | | | | | | | |
| | | | | Front End
Sales Charge | | | Contingent Deferred
Sales Charge | |
| Fund | | | | Class A | | | Class C | |
Capital Growth | | | | $ | 16,645 | | | $ | 313 | |
Concentrated Growth | | | | | 804 | | | | — | |
Flexible Cap Growth | | | | | 865 | | | | — | |
Focused Growth | | | | | 2 | | | | — | |
Growth Opportunities | | | | | 21,267 | | | | 398 | |
Small/Mid Cap Growth | | | | | 38,105 | | | | 10 | |
Strategic Growth | | | | | 3,370 | | | | — | |
Technology Tollkeeper | | | | | 6,915 | | | | 271 | |
U.S. Equity | | | | | 234 | | | | 7 | |
D. Service Plan and Shareholder Administration Plan — The Trust, on behalf of each Fund that offers Service Shares, has adopted a Service Plan and a Shareholder Administration Plan. These plans allow for service organizations to provide varying levels of personal and account maintenance and shareholder administration services to their customers who are beneficial owners of such shares. The Service Plan and Shareholder Administration Plan each provide for compensation to the service organizations which is accrued daily and paid monthly at an annual rate of 0.25% (0.50% in aggregate) of the average daily net assets of the Service Shares.
E. Transfer Agency Agreement — Goldman Sachs also serves as the transfer agent of the Funds for a fee pursuant to the Transfer Agency Agreement. The fees charged for such transfer agency services are accrued daily and paid monthly at annual rates as follows: 0.19% of the average daily net assets of Class A, Class C, Class IR and Class R Shares; and 0.04% of the average daily net assets of Institutional and Service Shares.
F. Other Expense Agreements and Affiliated Transactions — GSAM has agreed to limit certain “Other Expenses” of the Funds (excluding acquired fund fees and expenses, transfer agency fees and expenses, brokerage fees, shareholder meetings, litigation, indemnification and extraordinary expenses) to the extent such expenses exceed, on an annual basis, a percentage rate of the average daily net assets of each Fund. Such Other Expense reimbursements, if any, are accrued daily and paid monthly. In addition, the Funds are not obligated to reimburse GSAM for prior fiscal year expense reimbursements, if any. The Other Expense limitations as an annual percentage rate of average daily net assets for Capital Growth, Concentrated Growth, Flexible Cap
116
GOLDMAN SACHS FUNDAMENTAL EQUITY GROWTH FUNDS
|
| 4. AGREEMENTS AND AFFILIATED TRANSACTIONS (continued) |
Growth, Focused Growth, Growth Opportunities, Small/Mid Cap Growth, Strategic Growth, Technology Tollkeeper and U.S. Equity Funds are 0.004%, 0.004%, 0.004%, 0.014%, 0.014%, 0.064%, 0.004%, 0.034% and 0.084%, respectively. Prior to December 29, 2014, the Other Expense limitation for Concentrated Growth, Flexible Cap, Technology Tollkeeper and U.S. Equity Funds were 0.014%, 0.014%, 0.064%, and 0.044% respectively. These Other Expense limitations will remain in place through at least December 29, 2015, and prior to such date GSAM may not terminate the arrangements without the approval of the Trustees. The Funds bear their respective share of costs related to proxy and shareholder meetings, and GSAM has agreed to reimburse each Fund to the extent such expenses exceed a specified percentage of the Fund’s net assets. In addition, the Funds have entered into certain offset arrangements with the custodian and the transfer agent, which may result in a reduction of the Funds’ expenses and are received irrespective of the application of the “Other Expense” limitations described above.
For the six months ended February 28, 2015, these expense reductions, including any fee waivers and Other Expense reimbursements, were as follows:
| | | | | | | | | | | | | | |
| Fund | | | | Management
Fee Waiver | | | Other Expense
Reimbursements | | | Total Expense
Reductions | |
Capital Growth | | | | $ | 1,385,282 | | | $ | 241,327 | | | $ | 1,626,609 | |
Concentrated Growth | | | | | 178,145 | | | | 105,753 | | | | 283,898 | |
Flexible Cap Growth | | | | | 15,969 | | | | 108,875 | | | | 124,844 | |
Focused Growth | | | | | 29,376 | | | | 112,891 | | | | 142,267 | |
Growth Opportunities | | | | | 991,781 | | | | 245,162 | | | | 1,236,943 | |
Small/Mid Cap Growth | | | | | 1,566,404 | | | | — | | | | 1,566,404 | |
Strategic Growth | | | | | 575,232 | | | | 150,382 | | | | 725,614 | |
Technology Tollkeeper | | | | | — | | | | 95,734 | | | | 95,734 | |
U.S. Equity | | | | | — | | | | 102,325 | | | | 102,325 | |
G. Line of Credit Facility — As of February 28, 2015, the Funds participated in a $1,080,000,000 committed, unsecured revolving line of credit facility (the “facility”) together with other funds of the Trust and registered investment companies having management agreements with GSAM or its affiliates (“Other Borrowers”). Pursuant to the terms of the facility, the Funds and Other Borrowers could increase the credit amount by an additional $120,000,000, for a total of up to $1,200,000,000. This facility is to be used solely for temporary or emergency purposes, which may include the funding of redemptions. The interest rate on borrowings is based on the federal funds rate. The facility also requires a fee to be paid by the Funds based on the amount of the commitment that has not been utilized. For the six months ended February 28, 2015, the Funds did not have any borrowings under the facility.
H. Other Transactions with Affiliates — For the six months ended February 28, 2015, Goldman Sachs earned $2,523, $285, $9, $14,920, $3,791 and $2,940 in brokerage commissions from portfolio transactions, on behalf of the Capital Growth, Concentrated Growth, Flexible Cap Growth, Growth Opportunities, Small/Mid Cap Growth and Technology Tollkeeper Funds, respectively.
117
GOLDMAN SACHS FUNDAMENTAL EQUITY GROWTH FUNDS
Notes to Financial Statements (continued)
February 28, 2015 (Unaudited)
|
| 4. AGREEMENTS AND AFFILIATED TRANSACTIONS (continued) |
An investment by a Fund representing greater than 5% of the voting securities of an issuer makes that issuer an affiliated person (as defined by the Act) of such Fund. The following table provides information about the investment by the Small/Mid Cap Growth Fund in shares of issuers of which the Fund is an affiliate for the six months ended February 28, 2015:
| | | | | | | | | | | | | | | | | | | | | | |
| Name of Affiliated Issuer | | | | Number of
Shares Held
Beginning
of Period | | | Shares
Bought | | | Shares
Sold | | | Number of
Shares Held
End of Period | | | Value at
End of Period | |
M/I Homes, Inc. | | | | | 1,259,098 | | | | 28,307 | | | | (4,334 | ) | | | 1,283,071 | | | $ | 27,932,456 | |
Mavenir Systems, Inc. | | | | | 1,177,571 | | | | 493,005 | | | | (37,656 | ) | | | 1,632,920 | | | | 23,791,644 | |
The Growth Opportunities Fund invests in the Institutional Shares of the Goldman Sachs Financial Square Government Fund. This Underlying Fund is considered to be affiliated with the Fund. GSAM has contractually agreed to waive irrevocably a portion of any underlying fund’s management fee in an amount equal to the management fee paid to GSAM due to the Fund’s investment in an affiliated fund for which it also serves as investment advisor. For the six months ended February 28, 2015, GSAM waived $21,272 of such fund’s management fee. The table below shows the transactions in and earnings from investments in this affiliated Fund for the six months ended February 28, 2015:
| | | | | | | | | | | | | | | | | | |
| Underlying Fund | | | | Market
Value
8/31/14 | | | Purchases
at Cost | | | Proceeds
from Sales | | | Market
Value 2/28/15 | |
Goldman Sachs Financial Square Government Fund | | | | $ | — | | | $ | 416,035,977 | | | $ | (273,681,293 | ) | | $ | 142,354,684 | |
As of February 28, 2015, the Goldman Sachs Group, Inc. was the beneficial owner of 5% or more of outstanding Class C, Institutional, Class IR and Class R Shares of the following funds:
| | | | | | | | | | | | | | | | | | |
| Fund | | | | Class C | | | Institutional | | | Class IR | | | Class R | |
Concentrated Growth | | | | | — | % | | | — | % | | | — | % | | | 100 | % |
Flexible Cap Growth | | | | | — | | | | — | | | | 6 | | | | 60 | |
Focused Growth | | | | | 30 | | | | — | | | | 100 | | | | 100 | |
Strategic Growth | | | | | — | | | | — | | | | — | | | | 12 | |
U.S. Equity | | | | | — | | | | 38 | | | | 9 | | | | 17 | |
118
GOLDMAN SACHS FUNDAMENTAL EQUITY GROWTH FUNDS
|
| 5. PORTFOLIO SECURITIES TRANSACTIONS |
The cost of purchases and proceeds from sales and maturities of long-term securities for the six months ended February 28, 2015, were as follows:
| | | | | | | | | | |
| Fund | | | | Purchases | | | Sales and Maturities | |
Capital Growth | | | | $ | 287,303,309 | | | $ | 320,990,941 | |
Concentrated Growth | | | | | 44,273,606 | | | | 55,926,674 | |
Flexible Cap Growth | | | | | 5,084,823 | | | | 3,959,201 | |
Focused Growth | | | | | 15,072,938 | | | | 9,339,547 | |
Growth Opportunities | | | | | 1,376,060,962 | | | | 1,799,405,998 | |
Small/Mid Cap Growth | | | | | 684,215,236 | | | | 652,797,557 | |
Strategic Growth | | | | | 114,487,527 | | | | 125,818,957 | |
Technology Tollkeeper | | | | | 71,225,467 | | | | 103,963,906 | |
U.S. Equity | | | | | 4,292,378 | | | | 5,321,880 | |
As of the Funds’ most recent fiscal year end, August 31, 2014, the Funds had certain timing differences on a tax basis as follows:
| | | | | | | | | | | | | | | | |
| | | Capital Growth | | | Flexible
Cap Growth | | | Small/Mid Cap Growth | | | Technology Tollkeeper | |
Timing differences (Qualified Late Year Loss Deferrals) | | $ | (123,134 | ) | | $ | (21,313 | ) | | $ | (9,638,504 | ) | | $ | (2,335,237 | ) |
As of February 28, 2015, the Funds’ aggregate security unrealized gains and losses based on cost for U.S. federal income tax purposes were as follows:
| | | | | | | | | | | | | | | | | | | | | | | | | | | | | | | | | | | | |
| | | Capital
Growth | | | Concentrated
Growth | | | Flexible
Cap Growth | | | Focused
Growth | | | Growth
Opportunities | | | Small/Mid Cap
Growth | | | Strategic
Growth | | | Technology
Tollkeeper | | | U.S.
Equity | |
Tax Cost | | $ | 724,183,017 | | | $ | 138,958,313 | | | $ | 13,081,543 | | | $ | 29,464,275 | | | $ | 4,155,268,343 | | | $ | 1,974,947,118 | | | $ | 310,121,791 | | | $ | 280,146,665 | | | $ | 11,757,822 | |
Gross unrealized gain | | | 301,980,892 | | | | 50,486,725 | | | | 5,226,508 | | | | 4,185,136 | | | | 1,290,364,066 | | | | 653,342,748 | | | | 116,246,174 | | | | 156,226,649 | | | | 2,773,453 | |
Gross unrealized loss | | | (7,992,376 | ) | | | (2,345,545 | ) | | | (291,051 | ) | | | (326,309 | ) | | | (103,864,933 | ) | | | (45,034,412 | ) | | | (4,834,892 | ) | | | (2,854,724 | ) | | | (235,102 | ) |
Net unrealized gain | | $ | 293,988,516 | | | $ | 48,141,180 | | | $ | 4,935,457 | | | $ | 3,858,827 | | | $ | 1,186,499,133 | | | $ | 608,308,336 | | | $ | 111,411,282 | | | $ | 153,371,925 | | | $ | 2,538,351 | |
119
GOLDMAN SACHS FUNDAMENTAL EQUITY GROWTH FUNDS
Notes to Financial Statements (continued)
February 28, 2015 (Unaudited)
|
| 6. TAX INFORMATION (continued) |
The difference between GAAP-basis and tax-basis unrealized gains (losses) is attributable primarily to wash sales and differences in tax treatment of underlying fund investments.
GSAM has reviewed the Funds’ tax positions for all open tax years (the current and prior three years, as applicable) and has concluded that no provision for income tax is required in the Funds’ financial statements. Such open tax years remain subject to examination and adjustment by tax authorities.
The Funds’ risks include, but are not limited to, the following:
Large Shareholder Transactions Risk — A Fund may experience adverse effects when certain large shareholders, such as other funds, institutional investors (including those trading by use of non-discretionary mathematical formulas), financial intermediaries (who may make investment decisions on behalf of underlying clients and/or include a Fund in their investment model), individuals, accounts and Goldman Sachs affiliates, purchase or redeem large amounts of shares of a Fund. Such large shareholder redemptions may cause the Fund to sell portfolio securities at times when it would not otherwise do so, which may negatively impact a Fund’s NAV and liquidity. Similarly, large Fund share purchases may adversely affect a Fund’s performance to the extent that a Fund is delayed in investing new cash and is required to maintain a larger cash position than it ordinarily would. These transactions may also accelerate the realization of taxable income to shareholders if such sales of investments resulted in gains, and may also increase transaction costs. In addition, a large redemption could result in a Fund’s current expenses being allocated over a smaller asset base, leading to an increase in the Fund’s expense ratio.
Liquidity Risk — The Funds may make investments that are illiquid or that may become less liquid in response to market developments or adverse investor perceptions. Illiquid investments may be more difficult to value. Liquidity risk may also refer to the risk that a Fund will not be able to pay redemption proceeds within the allowable time period because of unusual market conditions, an unusually high volume of redemption requests, or other reasons. To meet redemption requests, a Fund may be forced to sell investments at an unfavorable time and/or under unfavorable conditions.
Market and Credit Risks — In the normal course of business, the Funds trade financial instruments and enter into financial transactions where risk of potential loss exists due to changes in the market (market risk). Additionally, the Funds may also be exposed to credit risk in the event that an issuer or guarantor fails to perform or that an institution or entity with which the Funds have unsettled or open transactions defaults.
Non-Diversification Risk — The Concentrated Growth and Focused Growth Funds are non-diversified, meaning that they are permitted to invest a larger percentage of their assets in fewer issuers than diversified mutual funds. Thus, a Fund may be more susceptible to adverse developments affecting any single issuer held in its portfolio, and may be more susceptible to greater losses because of these developments.
Portfolio Concentration Risk — The Technology Tollkeeper Fund invests primarily in equity investments in high-quality technology, media, or service companies that adopt or use technology to improve their cost structure, revenue opportunities or competitive advantage (“Technology Tollkeeper” companies). Because of its focus on technology, media and service companies, the Technology Tollkeeper Fund is subject to greater risk of loss as a result of adverse economic, business or other developments than if its investments were diversified across different industry sectors. The Technology Tollkeeper Fund may also invest in a relatively few number of issuers. Thus, the Technology Tollkeeper Fund may be more susceptible to adverse developments affecting any single issuer held in its portfolio and may be more susceptible to greater losses because of these developments.
120
GOLDMAN SACHS FUNDAMENTAL EQUITY GROWTH FUNDS
Under the Trust’s organizational documents, its Trustees, officers, employees and agents are indemnified, to the extent permitted by the Act and state law, against certain liabilities that may arise out of performance of their duties to the Funds. Additionally, in the course of business, the Funds enter into contracts that contain a variety of indemnification clauses. The Funds’ maximum exposure under these arrangements is unknown, as this would involve future claims that may be made against the Funds that have not yet occurred. However, GSAM believes the risk of loss under these arrangements to be remote.
Subsequent events after the Statement of Assets and Liabilities date have been evaluated through the date the financial statements were issued. GSAM has concluded that there is no impact requiring adjustment or disclosure in the financial statements.
At a meeting held on February 11-12, 2015, the Board of Trustees of the Goldman Sachs Trust approved a change in the Goldman Sachs U.S. Equity Fund’s name to the Goldman Sachs Dynamic U.S. Equity Fund, effective on April 30, 2015. In addition, effective as of that time, the Fund’s principal investment strategy will change. Under the Fund’s new principal strategy, the Fund may invest in securities of companies of any investment style (e.g., “growth”, “value”, or “core”) and of any market capitalization. Additionally, the Fund intends to take advantage of its flexibility to invest up to 20% of its net assets in equity securities of non-U.S. issuers.
121
GOLDMAN SACHS FUNDAMENTAL EQUITY GROWTH FUNDS
Notes to Financial Statements (continued)
February 28, 2015 (Unaudited)
|
| 10. SUMMARY OF SHARE TRANSACTIONS |
Share activity is as follows:
| | | | | | | | | | | | | | | | |
| | | Capital Growth Fund | |
| | | | |
| | | For the Six Months Ended
February 28, 2015
(Unaudited) | | | For the Fiscal Year Ended
August 31, 2014 | |
| | | | |
| | | Shares | | | Dollars | | | Shares | | | Dollars | |
| | | | |
| Class A Shares | | | | | | | | | | | | | | | | |
Shares sold | | | 666,820 | | | $ | 17,794,246 | | | | 817,672 | | | $ | 21,983,864 | |
Reinvestment of distributions | | | 4,123,424 | | | | 103,869,050 | | | | 5,245,662 | | | | 131,666,115 | |
Shares converted from Class B(a) | | | 414,688 | | | | 12,024,309 | | | | 162,015 | | | | 4,329,011 | |
Shares redeemed | | | (1,841,618 | ) | | | (48,497,158 | ) | | | (3,691,623 | ) | | | (99,881,853 | ) |
| | | | 3,363,314 | | | | 85,190,447 | | | | 2,533,726 | | | | 58,097,137 | |
| Class B Shares | | | | | | | | | | | | | | | | |
Shares sold | | | 47 | | | | 1,093 | | | | 13,241 | | | | 303,172 | |
Reinvestment of distributions | | | — | | | | — | | | | 207,751 | | | | 4,371,080 | |
Shares converted to Class A(a) | | | (498,183 | ) | | | (12,024,309 | ) | | | (192,166 | ) | | | (4,329,011 | ) |
Shares redeemed | | | (145,866 | ) | | | (3,510,428 | ) | | | (174,199 | ) | | | (3,978,897 | ) |
| | | | (644,002 | ) | | | (15,533,644 | ) | | | (145,373 | ) | | | (3,633,656 | ) |
| Class C Shares | | | | | | | | | | | | | | | | |
Shares sold | | | 217,005 | | | | 4,565,212 | | | | 220,352 | | | | 4,912,068 | |
Reinvestment of distributions | | | 662,843 | | | | 13,382,800 | | | | 807,423 | | | | 16,963,972 | |
Shares redeemed | | | (340,280 | ) | | | (7,380,291 | ) | | | (614,238 | ) | | | (13,922,721 | ) |
| | | | 539,568 | | | | 10,567,721 | | | | 413,537 | | | | 7,953,319 | |
| Institutional Shares | | | | | | | | | | | | | | | | |
Shares sold | | | 1,298,279 | | | | 37,160,336 | | | | 608,224 | | | | 17,589,113 | |
Reinvestment of distributions | | | 799,639 | | | | 21,718,191 | | | | 953,235 | | | | 25,413,240 | |
Shares redeemed | | | (536,435 | ) | | | (15,188,566 | ) | | | (861,169 | ) | | | (24,302,231 | ) |
| | | | 1,561,483 | | | | 43,689,961 | | | | 700,290 | | | | 18,700,122 | |
| Service Shares | | | | | | | | | | | | | | | | |
Shares sold | | | 19,292 | | | | 503,337 | | | | 5,856 | | | | 150,012 | |
Reinvestment of distributions | | | 4,638 | | | | 113,688 | | | | 7,946 | | | | 195,070 | |
Shares redeemed | | | (21,365 | ) | | | (538,254 | ) | | | (8,066 | ) | | | (214,810 | ) |
| | | | 2,565 | | | | 78,771 | | | | 5,736 | | | | 130,272 | |
| Class IR Shares | | | | | | | | | | | | | | | | |
Shares sold | | | 9,920 | | | | 266,079 | | | | 22,319 | | | | 663,769 | |
Reinvestment of distributions | | | 17,639 | | | | 448,370 | | | | 21,811 | | | | 550,288 | |
Shares redeemed | | | (6,074 | ) | | | (163,903 | ) | | | (14,792 | ) | | | (392,222 | ) |
| | | | 21,485 | | | | 550,546 | | | | 29,338 | | | | 821,835 | |
| Class R Shares | | | | | | | | | | | | | | | | |
Shares sold | | | 17,826 | | | | 473,200 | | | | 37,441 | | | | 983,485 | |
Reinvestment of distributions | | | 22,629 | | | | 557,123 | | | | 22,147 | | | | 546,578 | |
Shares redeemed | | | (28,491 | ) | | | (718,023 | ) | | | (19,750 | ) | | | (521,995 | ) |
| | | | 11,964 | | | | 312,300 | | | | 39,838 | | | | 1,008,068 | |
NET INCREASE | | | 4,856,377 | | | $ | 124,856,102 | | | | 3,577,092 | | | $ | 83,077,097 | |
| (a) | | Class B Shares were converted into Class A Shares at the close of business on November 14, 2014. |
122
GOLDMAN SACHS FUNDAMENTAL EQUITY GROWTH FUNDS
|
| 10. SUMMARY OF SHARE TRANSACTIONS (continued) |
Share activity is as follows:
| | | | | | | | | | | | | | | | |
| | | Concentrated Growth Fund | |
| | | | |
| | | For the Six Months Ended
February 28, 2015
(Unaudited) | | | For the Fiscal Year Ended
August 31, 2014 | |
| | | | |
| | | Shares | | | Dollars | | | Shares | | | Dollars | |
| | | | |
| Class A Shares | | | | | | | | | | | | | | | | |
Shares sold | | | 27,525 | | | $ | 497,540 | | | | 70,876 | | | $ | 1,263,347 | |
Reinvestment of distributions | | | 71,053 | | | | 1,165,979 | | | | 46,698 | | | | 806,000 | |
Shares converted from Class B(a) | | | 7,520 | | | | 147,183 | | | | 777 | | | | 13,556 | |
Shares redeemed | | | (37,729 | ) | | | (657,722 | ) | | | (216,261 | ) | | | (3,916,519 | ) |
| | | | 68,369 | | | | 1,152,980 | | | | (97,910 | ) | | | (1,833,616 | ) |
| Class B Shares | | | | | | | | | | | | | | | | |
Shares sold | | | 59 | | | | 1,022 | | | | 1,871 | | | | 30,647 | |
Reinvestment of distributions | | | — | | | | — | | | | 1,155 | | | | 18,124 | |
Shares converted to Class A(a) | | | (8,332 | ) | | | (147,183 | ) | | | (856 | ) | | | (13,556 | ) |
Shares redeemed | | | (9,429 | ) | | | (164,839 | ) | | | (4,608 | ) | | | (74,624 | ) |
| | | | (17,702 | ) | | | (311,000 | ) | | | (2,438 | ) | | | (39,409 | ) |
| Class C Shares | | | | | | | | | | | | | | | | |
Shares sold | | | 38,609 | | | | 577,404 | | | | 54,822 | | | | 891,916 | |
Reinvestment of distributions | | | 27,141 | | | | 391,651 | | | | 13,114 | | | | 205,364 | |
Shares redeemed | | | (14,306 | ) | | | (220,302 | ) | | | (29,125 | ) | | | (475,180 | ) |
| | | | 51,444 | | | | 748,753 | | | | 38,811 | | | | 622,100 | |
| Institutional Shares | | | | | | | | | | | | | | | | |
Shares sold | | | 276,071 | | | | 4,838,552 | | | | 645,154 | | | | 12,053,841 | |
Reinvestment of distributions | | | 1,700,015 | | | | 29,223,264 | | | | 845,482 | | | | 15,142,586 | |
Shares redeemed | | | (863,279 | ) | | | (15,489,037 | ) | | | (1,185,832 | ) | | | (22,208,510 | ) |
| | | | 1,112,807 | | | | 18,572,779 | | | | 304,804 | | | | 4,987,917 | |
| Service Shares | | | | | | | | | | | | | | | | |
Shares sold | | | — | | | | — | | | | — | | | | — | |
Reinvestment of distributions | | | — | | | | — | | | | — | | | | — | |
Shares redeemed | | | — | | | | — | | | | — | | | | — | |
| | | | — | | | | — | | | | — | | | | — | |
| Class IR Shares | | | | | | | | | | | | | | | | |
Shares sold | | | 1,186 | | | | 19,194 | | | | 2,911 | | | | 55,231 | |
Reinvestment of distributions | | | 4,113 | | | | 68,200 | | | | 2,182 | | | | 37,929 | |
Shares redeemed | | | (1,050 | ) | | | (17,937 | ) | | | (5,111 | ) | | | (93,268 | ) |
| | | | 4,249 | | | | 69,457 | | | | (18 | ) | | | (108 | ) |
| Class R Shares | | | | | | | | | | | | | | | | |
Shares sold | | | — | | | | — | | | | — | | | | — | |
Reinvestment of distributions | | | 165 | | | | 2,663 | | | | 76 | | | | 1,284 | |
Shares redeemed | | | — | | | | — | | | | — | | | | — | |
| | | | 165 | | | | 2,663 | | | | 76 | | | | 1,284 | |
NET INCREASE | | | 1,219,332 | | | $ | 20,235,632 | | | | 243,325 | | | $ | 3,738,168 | |
| (a) | | Class B Shares were converted into Class A Shares at the close of business on November 14, 2014. |
123
GOLDMAN SACHS FUNDAMENTAL EQUITY GROWTH FUNDS
Notes to Financial Statements (continued)
February 28, 2015 (Unaudited)
|
| 10. SUMMARY OF SHARE TRANSACTIONS (continued) |
Share activity is as follows:
| | | | | | | | | | | | | | | | |
| | | Flexible Cap Growth Fund | |
| | | | |
| | | For the Six Months Ended
February 28, 2015
(Unaudited) | | | For the Fiscal Year Ended
August 31, 2014 | |
| | | | |
| | | Shares | | | Dollars | | | Shares | | | Dollars | |
| | | | |
| Class A Shares | | | | | | | | | | | | | | | | |
Shares sold | | | 133,614 | | | $ | 1,662,541 | | | | 77,853 | | | $ | 969,663 | |
Reinvestment of distributions | | | 75,889 | | | | 897,010 | | | | 52,753 | | | | 620,899 | |
Shares converted from Class B(a) | | | — | | | | — | | | | — | | | | — | |
Shares redeemed | | | (68,078 | ) | | | (835,069 | ) | | | (89,405 | ) | | | (1,104,307 | ) |
| | | | 141,425 | | | | 1,724,482 | | | | 41,201 | | | | 486,255 | |
| Class B Shares | | | | | | | | | | | | | | | | |
Shares sold | | | — | | | | — | | | | — | | | | — | |
Reinvestment of distributions | | | — | | | | — | | | | — | | | | — | |
Shares converted to Class A(a) | | | — | | | | — | | | | — | | | | — | |
Shares redeemed | | | — | | | | — | | | | — | | | | — | |
| | | | — | | | | — | | | | — | | | | — | |
| Class C Shares | | | | | | | | | | | | | | | | |
Shares sold | | | 51,977 | | | | 570,209 | | | | 21,829 | | | | 254,183 | |
Reinvestment of distributions | | | 16,649 | | | | 182,809 | | | | 11,545 | | | | 128,615 | |
Shares redeemed | | | (8,638 | ) | | | (97,748 | ) | | | (32,358 | ) | | | (377,495 | ) |
| | | | 59,988 | | | | 655,270 | | | | 1,016 | | | | 5,303 | |
| Institutional Shares | | | | | | | | | | | | | | | | |
Shares sold | | | 30,777 | | | | 407,075 | | | | 132,857 | | | | 1,673,820 | |
Reinvestment of distributions | | | 90,748 | | | | 1,117,114 | | | | 67,892 | | | | 824,885 | |
Shares redeemed | | | (52,456 | ) | | | (688,861 | ) | | | (107,336 | ) | | | (1,365,164 | ) |
| | | | 69,069 | | | | 835,328 | | | | 93,413 | | | | 1,133,541 | |
| Service Shares | | | | | | | | | | | | | | | | |
Shares sold | | | — | | | | — | | | | — | | | | — | |
Reinvestment of distributions | | | — | | | | — | | | | — | | | | — | |
Shares redeemed | | | — | | | | — | | | | — | | | | — | |
| | | | — | | | | — | | | | — | | | | — | |
| Class IR Shares | | | | | | | | | | | | | | | | |
Shares sold | | | 16,803 | | | | 216,247 | | | | 3,150 | | | | 40,575 | |
Reinvestment of distributions | | | 2,697 | | | | 32,792 | | | | 941 | | | | 11,334 | |
Shares redeemed | | | (34 | ) | | | (443 | ) | | | (8,637 | ) | | | (111,298 | ) |
| | | | 19,466 | | | | 248,596 | | | | (4,546 | ) | | | (59,389 | ) |
| Class R Shares | | | | | | | | | | | | | | | | |
Shares sold | | | 90 | | | | 1,101 | | | | 201 | | | | 2,470 | |
Reinvestment of distributions | | | 700 | | | | 8,089 | | | | 487 | | | | 5,635 | |
Shares redeemed | | | (2,266 | ) | | | (25,951 | ) | | | (6 | ) | | | (76 | ) |
| | | | (1,476 | ) | | | (16,761 | ) | | | 682 | | | | 8,029 | |
NET INCREASE | | | 288,472 | | | $ | 3,446,915 | | | | 131,766 | | | $ | 1,573,739 | |
| (a) | | Class B Shares were converted into Class A Shares at the close of business on November 14, 2014. |
124
GOLDMAN SACHS FUNDAMENTAL EQUITY GROWTH FUNDS
|
| 10. SUMMARY OF SHARE TRANSACTIONS (continued) |
Share activity is as follows:
| | | | | | | | | | | | | | | | |
| | | Focused Growth Fund | |
| | | | |
| | | For the Six Months Ended
February 28, 2015
(Unaudited) | | | For the Fiscal Year Ended
August 31, 2014 | |
| | | | |
| | | Shares | | | Dollars | | | Shares | | | Dollars | |
| | | | |
| Class A Shares | | | | | | | | | | | | | | | | |
Shares sold | | | 1,880 | | | $ | 28,442 | | | | 2,067 | | | $ | 29,063 | |
Reinvestment of distributions | | | 265 | | | | 3,858 | | | | 288 | | | | 3,925 | |
Shares converted from Class B(a) | | | — | | | | — | | | | — | | | | — | |
Shares redeemed | | | (884 | ) | | | (13,715 | ) | | | (3,871 | ) | | | (54,793 | ) |
| | | | 1,261 | | | | 18,585 | | | | (1,516 | ) | | | (21,805 | ) |
| Class B Shares | | | | | | | | | | | | | | | | |
Shares sold | | | — | | | | — | | | | — | | | | — | |
Reinvestment of distributions | | | — | | | | — | | | | — | | | | — | |
Shares converted to Class A(a) | | | — | | | | — | | | | — | | | | — | |
Shares redeemed | | | — | | | | — | | | | — | | | | — | |
| | | | — | | | | — | | | | — | | | | — | |
| Class C Shares | | | | | | | | | | | | | | | | |
Shares sold | | | 952 | | | | 13,553 | | | | 705 | | | | 10,005 | |
Reinvestment of distributions | | | 191 | | | | 2,722 | | | | 172 | | | | 2,323 | |
Shares redeemed | | | — | | | | — | | | | — | | | | — | |
| | | | 1,143 | | | | 16,275 | | | | 877 | | | | 12,328 | |
| Institutional Shares | | | | | | | | | | | | | | | | |
Shares sold | | | 497,423 | | | | 7,518,573 | | | | 1,004,877 | | | | 14,179,449 | |
Reinvestment of distributions | | | 140,298 | | | | 2,053,966 | | | | 79,496 | | | | 1,089,896 | |
Shares redeemed | | | (106,373 | ) | | | (1,558,926 | ) | | | (431,484 | ) | | | (6,142,305 | ) |
| | | | 531,348 | | | | 8,013,613 | | | | 652,889 | | | | 9,127,040 | |
| Service Shares | | | | | | | | | | | | | | | | |
Shares sold | | | — | | | | — | | | | — | | | | — | |
Reinvestment of distributions | | | — | | | | — | | | | — | | | | — | |
Shares redeemed | | | — | | | | — | | | | — | | | | — | |
| | | | — | | | | — | | | | — | | | | — | |
| Class IR Shares | | | | | | | | | | | | | | | | |
Shares sold | | | — | | | | — | | | | — | | | | — | |
Reinvestment of distributions | | | 76 | | | | 1,117 | | | | 69 | | | | 948 | |
Shares redeemed | | | — | | | | — | | | | — | | | | — | |
| | | | 76 | | | | 1,117 | | | | 69 | | | | 948 | |
| Class R Shares | | | | | | | | | | | | | | | | |
Shares sold | | | — | | | | — | | | | — | | | | — | |
Reinvestment of distributions | | | 76 | | | | 1,095 | | | | 68 | | | | 935 | |
Shares redeemed | | | — | | | | — | | | | — | | | | — | |
| | | | 76 | | | | 1,095 | | | | 68 | | | | 935 | |
NET INCREASE (DECREASE) | | | 533,904 | | | $ | 8,050,685 | | | | 652,387 | | | $ | 9,119,446 | |
| (a) | | Class B Shares were converted into Class A Shares at the close of business on November 14, 2014. |
125
GOLDMAN SACHS FUNDAMENTAL EQUITY GROWTH FUNDS
Notes to Financial Statements (continued)
February 28, 2015 (Unaudited)
|
| 10. SUMMARY OF SHARE TRANSACTIONS (continued) |
Share activity is as follows:
| | | | | | | | | | | | | | | | |
| | | Growth Opportunities Fund | |
| | | | |
| | | For the Six Months Ended
February 28, 2015
(Unaudited) | | | For the Fiscal Year Ended
August 31, 2014 | |
| | | | |
| | | Shares | | | Dollars | | | Shares | | | Dollars | |
| | | | |
| Class A Shares | | | | | | | | | | | | | | | | |
Shares sold | | | 5,868,974 | | | $ | 156,307,350 | | | | 8,032,868 | | | $ | 226,986,472 | |
Reinvestment of distributions | | | 7,862,988 | | | | 194,608,943 | | | | 3,023,596 | | | | 81,878,972 | |
Shares converted from Class B(a) | | | 34,936 | | | | 1,073,724 | | | | 8,330 | | | | 235,984 | |
Shares redeemed | | | (8,573,404 | ) | | | (233,699,086 | ) | | | (16,739,369 | ) | | | (474,277,948 | ) |
| | | | 5,193,494 | | | | 118,290,931 | | | | (5,674,575 | ) | | | (165,176,520 | ) |
| Class B Shares | | | | | | | | | | | | | | | | |
Shares sold | | | 331 | | | | 8,625 | | | | 5,618 | | | | 136,443 | |
Reinvestment of distributions | | | — | | | | — | | | | 32,372 | | | | 750,045 | |
Shares converted to Class A(a) | | | (41,101 | ) | | | (1,073,724 | ) | | | (9,730 | ) | | | (235,984 | ) |
Shares redeemed | | | (242,765 | ) | | | (6,335,557 | ) | | | (152,113 | ) | | | (3,664,921 | ) |
| | | | (283,535 | ) | | | (7,400,656 | ) | | | (123,853 | ) | | | (3,014,417 | ) |
| Class C Shares | | | | | | | | | | | | | | | | |
Shares sold | | | 1,033,559 | | | | 21,482,753 | | | | 1,106,125 | | | | 26,356,127 | |
Reinvestment of distributions | | | 1,727,078 | | | | 34,161,609 | | | | 525,007 | | | | 12,022,662 | |
Shares redeemed | | | (991,063 | ) | | | (21,086,131 | ) | | | (1,625,462 | ) | | | (38,972,519 | ) |
| | | | 1,769,574 | | | | 34,558,231 | | | | 5,670 | | | | (593,730 | ) |
| Institutional Shares | | | | | | | | | | | | | | | | |
Shares sold | | | 20,120,247 | | | | 587,092,139 | | | | 26,488,122 | | | | 816,361,992 | |
Reinvestment of distributions | | | 18,723,667 | | | | 517,709,381 | | | | 5,904,682 | | | | 174,188,106 | |
Shares redeemed | | | (22,262,518 | ) | | | (671,298,051 | ) | | | (30,086,326 | ) | | | (926,283,442 | ) |
| | | | 16,581,396 | | | | 433,503,469 | | | | 2,306,478 | | | | 64,266,656 | |
| Service Shares | | | | | | | | | | | | | | | | |
Shares sold | | | 293,054 | | | | 7,403,695 | | | | 303,678 | | | | 8,322,118 | |
Reinvestment of distributions | | | 373,256 | | | | 8,961,890 | | | | 133,648 | | | | 3,536,321 | |
Shares redeemed | | | (319,041 | ) | | | (8,357,999 | ) | | | (820,546 | ) | | | (22,482,432 | ) |
| | | | 347,269 | | | | 8,007,586 | | | | (383,220 | ) | | | (10,623,993 | ) |
| Class IR Shares | | | | | | | | | | | | | | | | |
Shares sold | | | 1,693,768 | | | | 45,805,922 | | | | 2,493,334 | | | | 71,573,272 | |
Reinvestment of distributions | | | 1,195,970 | | | | 30,389,605 | | | | 324,816 | | | | 8,961,670 | |
Shares redeemed | | | (1,026,118 | ) | | | (27,976,125 | ) | | | (1,535,926 | ) | | | (44,199,453 | ) |
| | | | 1,863,620 | | | | 48,219,402 | | | | 1,282,224 | | | | 36,335,489 | |
| Class R Shares | | | | | | | | | | | | | | | | |
Shares sold | | | 568,774 | | | | 14,754,772 | | | | 791,843 | | | | 21,975,992 | |
Reinvestment of distributions | | | 683,591 | | | | 16,501,884 | | | | 214,811 | | | | 5,716,115 | |
Shares redeemed | | | (436,997 | ) | | | (11,037,626 | ) | | | (1,005,143 | ) | | | (28,017,060 | ) |
| | | | 815,368 | | | | 20,219,030 | | | | 1,511 | | | | (324,953 | ) |
NET INCREASE (DECREASE) | | | 26,287,186 | | | $ | 655,397,993 | | | | (2,585,765 | ) | | $ | (79,131,468 | ) |
| (a) | | Class B Shares were converted into Class A Shares at the close of business on November 14, 2014. |
126
GOLDMAN SACHS FUNDAMENTAL EQUITY GROWTH FUNDS
|
| 10. SUMMARY OF SHARE TRANSACTIONS (continued) |
Share activity is as follows:
| | | | | | | | | | | | | | | | |
| | | Small/Mid Cap Growth Fund | |
| | | | |
| | | For the Six Months Ended
February 28, 2015
(Unaudited) | | | For the Fiscal Year Ended
August 31, 2014 | |
| | | | |
| | | Shares | | | Dollars | | | Shares | | | Dollars | |
| | | | |
| Class A Shares | | | | | | | | | | | | | | | | |
Shares sold | | | 7,268,869 | | | $ | 148,941,871 | | | | 16,550,003 | | | $ | 331,130,563 | |
Reinvestment of distributions | | | 2,828,794 | | | | 56,179,848 | | | | 1,717,157 | | | | 33,226,981 | |
Shares converted from Class B(a) | | | 16,583 | | | | 355,101 | | | | 6,285 | | | | 127,122 | |
Shares redeemed | | | (6,278,455 | ) | | | (128,333,141 | ) | | | (14,624,797 | ) | | | (294,251,887 | ) |
| | | | 3,835,791 | | | | 77,143,679 | | | | 3,648,648 | | | | 70,232,779 | |
| Class B Shares | | | | | | | | | | | | | | | | |
Shares sold | | | 429 | | | | 8,145 | | | | 9,815 | | | | 178,788 | |
Reinvestment of distributions | | | — | | | | — | | | | 10,394 | | | | 185,838 | |
Shares converted to Class A(a) | | | (18,064 | ) | | | (355,101 | ) | | | (6,813 | ) | | | (127,122 | ) |
Shares redeemed | | | (165,032 | ) | | | (3,247,551 | ) | | | (94,754 | ) | | | (1,768,237 | ) |
| | | | (182,667 | ) | | | (3,594,507 | ) | | | (81,358 | ) | | | (1,530,733 | ) |
| Class C Shares | | | | | | | | | | | | | | | | |
Shares sold | | | 1,606,405 | | | | 29,881,204 | | | | 4,080,815 | | | | 75,333,355 | |
Reinvestment of distributions | | | 939,595 | | | | 16,969,080 | | | | 451,785 | | | | 8,073,399 | |
Shares redeemed | | | (1,201,990 | ) | | | (22,488,163 | ) | | | (1,704,492 | ) | | | (31,466,929 | ) |
| | | | 1,344,010 | | | | 24,362,121 | | | | 2,828,108 | | | | 51,939,825 | |
| Institutional Shares | | | | | | | | | | | | | | | | |
Shares sold | | | 12,412,617 | | | | 264,803,071 | | | | 21,521,263 | | | | 448,083,942 | |
Reinvestment of distributions | | | 3,594,511 | | | | 74,478,267 | | | | 1,609,625 | | | | 32,272,964 | |
Shares redeemed | | | (9,437,847 | ) | | | (198,207,622 | ) | | | (11,200,433 | ) | | | (232,698,654 | ) |
| | | | 6,569,281 | | | | 141,073,716 | | | | 11,930,455 | | | | 247,658,252 | |
| Service Shares | | | | | | | | | | | | | | | | |
Shares sold | | | 202,087 | | | | 4,010,053 | | | | 250,224 | | | | 4,972,415 | |
Reinvestment of distributions | | | 19,492 | | | | 380,479 | | | | 8,213 | | | | 156,610 | |
Shares redeemed | | | (129,625 | ) | | | (2,618,548 | ) | | | (298,366 | ) | | | (5,876,586 | ) |
| | | | 91,954 | | | | 1,771,984 | | | | (39,929 | ) | | | (747,561 | ) |
| Class IR Shares | | | | | | | | | | | | | | | | |
Shares sold | | | 1,326,839 | | | | 27,762,351 | | | | 4,929,199 | | | | 100,390,233 | |
Reinvestment of distributions | | | 679,062 | | | | 13,778,175 | | | | 311,646 | | | | 6,136,306 | |
Shares redeemed | | | (1,200,172 | ) | | | (24,905,583 | ) | | | (2,104,449 | ) | | | (42,676,478 | ) |
| | | | 805,729 | | | | 16,634,943 | | | | 3,136,396 | | | | 63,850,061 | |
| Class R Shares | | | | | | | | | | | | | | | | |
Shares sold | | | 314,216 | | | | 6,257,271 | | | | 702,974 | | | | 13,911,377 | |
Reinvestment of distributions | | | 132,069 | | | | 2,568,736 | | | | 71,370 | | | | 1,358,167 | |
Shares redeemed | | | (354,803 | ) | | | (7,122,628 | ) | | | (442,149 | ) | | | (8,754,329 | ) |
| | | | 91,482 | | | | 1,703,379 | | | | 332,195 | | | | 6,515,215 | |
NET INCREASE (DECREASE) | | | 12,555,580 | | | $ | 259,095,315 | | | | 21,754,515 | | | $ | 437,917,838 | |
| (a) | | Class B Shares were converted into Class A Shares at the close of business on November 14, 2014. |
127
GOLDMAN SACHS FUNDAMENTAL EQUITY GROWTH FUNDS
Notes to Financial Statements (continued)
February 28, 2015 (Unaudited)
|
| 10. SUMMARY OF SHARE TRANSACTIONS (continued) |
Share activity is as follows:
| | | | | | | | | | | | | | | | |
| | | Strategic Growth Fund | |
| | | | |
| | | For the Six Months Ended
February 28, 2015
(Unaudited) | | | For the Fiscal Year Ended
August 31, 2014 | |
| | | | |
| | | Shares | | | Dollars | | | Shares | | | Dollars | |
| | | | |
| Class A Shares | | | | | | | | | | | | | | | | |
Shares sold | | | 618,737 | | | $ | 7,772,032 | | | | 959,683 | | | $ | 12,190,924 | |
Reinvestment of distributions | | | 623,276 | | | | 7,460,611 | | | | 1,036,246 | | | | 12,414,221 | |
Shares converted from Class B(a) | | | 6,679 | | | | 92,424 | | | | 1,559 | | | | 19,533 | |
Shares redeemed | | | (1,161,145 | ) | | | (14,682,751 | ) | | | (5,331,240 | ) | | | (68,591,918 | ) |
| | | | 87,547 | | | | 642,316 | | | | (3,333,752 | ) | | | (43,967,240 | ) |
| Class B Shares | | | | | | | | | | | | | | | | |
Shares sold | | | — | | | | — | | | | 9,240 | | | | 100,954 | |
Reinvestment of distributions | | | — | | | | — | | | | 12,306 | | | | 130,328 | |
Shares converted to Class A(a) | | | (7,606 | ) | | | (92,424 | ) | | | (1,762 | ) | | | (19,533 | ) |
Shares redeemed | | | (62,687 | ) | | | (758,883 | ) | | | (41,839 | ) | | | (459,498 | ) |
| | | | (70,293 | ) | | | (851,307 | ) | | | (22,055 | ) | | | (247,749 | ) |
| Class C Shares | | | | | | | | | | | | | | | | |
Shares sold | | | 103,311 | | | | 1,107,699 | | | | 165,954 | | | | 1,825,903 | |
Reinvestment of distributions | | | 143,499 | | | | 1,473,731 | | | | 100,743 | | | | 1,068,877 | |
Shares redeemed | | | (92,426 | ) | | | (1,002,150 | ) | | | (121,789 | ) | | | (1,357,416 | ) |
| | | | 154,384 | | | | 1,579,280 | | | | 144,908 | | | | 1,537,364 | |
| Institutional Shares | | | | | | | | | | | | | | | | |
Shares sold | | | 3,143,364 | | | | 39,895,195 | | | | 7,759,535 | | | | 103,324,151 | |
Reinvestment of distributions | | | 3,789,883 | | | | 47,790,420 | | | | 2,915,104 | | | | 36,467,953 | |
Shares redeemed | | | (3,165,682 | ) | | | (41,753,659 | ) | | | (6,163,497 | ) | | | (81,267,515 | ) |
| | | | 3,767,565 | | | | 45,931,956 | | | | 4,511,142 | | | | 58,524,589 | |
| Service Shares | | | | | | | | | | | | | | | | |
Shares sold | | | 5,548 | | | | 70,596 | | | | 5,009 | | | | 63,893 | |
Reinvestment of distributions | | | 2,064 | | | | 24,623 | | | | 888 | | | | 10,619 | |
Shares redeemed | | | (3,339 | ) | | | (40,395 | ) | | | (1,060 | ) | | | (13,761 | ) |
| | | | 4,273 | | | | 54,824 | | | | 4,837 | | | | 60,751 | |
| Class IR Shares | | | | | | | | | | | | | | | | |
Shares sold | | | 4,509 | | | | 64,130 | | | | 23,906 | | | | 311,567 | |
Reinvestment of distributions | | | 11,782 | | | | 148,694 | | | | 9,876 | | | | 123,652 | |
Shares redeemed | | | (6,888 | ) | | | (90,478 | ) | | | (32,534 | ) | | | (436,175 | ) |
| | | | 9,403 | | | | 122,346 | | | | 1,248 | | | | (956 | ) |
| Class R Shares | | | | | | | | | | | | | | | | |
Shares sold | | | 3,195 | | | | 37,972 | | | | 782 | | | | 10,041 | |
Reinvestment of distributions | | | 225 | | | | 2,673 | | | | 97 | | | | 1,150 | |
Shares redeemed | | | (10 | ) | | | (123 | ) | | | (217 | ) | | | (2,776 | ) |
| | | | 3,410 | | | | 40,522 | | | | 662 | | | | 8,415 | |
NET INCREASE (DECREASE) | | | 3,956,289 | | | $ | 47,519,937 | | | | 1,306,990 | | | $ | 15,915,174 | |
| (a) | | Class B Shares were converted into Class A Shares at the close of business on November 14, 2014. |
128
GOLDMAN SACHS FUNDAMENTAL EQUITY GROWTH FUNDS
|
| 10. SUMMARY OF SHARE TRANSACTIONS (continued) |
Share activity is as follows:
| | | | | | | | | | | | | | | | |
| | | Technology Tollkeeper Fund | |
| | | | |
| | | For the Six Months Ended
February 28, 2015
(Unaudited) | | | For the Fiscal Year Ended
August 31, 2014 | |
| | | | |
| | | Shares | | | Dollars | | | Shares | | | Dollars | |
| | | | |
| Class A Shares | | | | | | | | | | | | | | | | |
Shares sold | | | 1,445,998 | | | $ | 26,481,817 | | | | 3,470,987 | | | $ | 60,962,111 | |
Reinvestment of distributions | | | 1,001,763 | | | | 17,841,403 | | | | 185,416 | | | | 3,133,535 | |
Shares converted from Class B(a) | | | 109,463 | | | | 2,114,732 | | | | 53,673 | | | | 909,103 | |
Shares redeemed | | | (2,351,245 | ) | | | (42,304,511 | ) | | | (4,980,250 | ) | | | (86,641,213 | ) |
| | | | 205,979 | | | | 4,133,441 | | | | (1,270,174 | ) | | | (21,636,464 | ) |
| Class B Shares | | | | | | | | | | | | | | | | |
Shares sold | | | 72 | | | | 406 | | | | 4,414 | | | | 69,798 | |
Reinvestment of distributions | | | — | | | | — | | | | 5,077 | | | | 76,914 | |
Shares converted to Class A(a) | | | (122,977 | ) | | | (2,114,732 | ) | | | (59,877 | ) | | | (909,103 | ) |
Shares redeemed | | | (131,293 | ) | | | (2,253,641 | ) | | | (123,378 | ) | | | (1,948,304 | ) |
| | | | (254,198 | ) | | | (4,367,967 | ) | | | (173,764 | ) | | | (2,710,695 | ) |
| Class C Shares | | | | | | | | | | | | | | | | |
Shares sold | | | 208,970 | | | | 3,345,846 | | | | 442,555 | | | | 6,903,734 | |
Reinvestment of distributions | | | 254,225 | | | | 3,986,258 | | | | 44,282 | | | | 670,880 | |
Shares redeemed | | | (343,040 | ) | | | (5,495,967 | ) | | | (698,408 | ) | | | (10,756,212 | ) |
| | | | 120,155 | | | | 1,836,137 | | | | (211,571 | ) | | | (3,181,598 | ) |
| Institutional Shares | | | | | | | | | | | | | | | | |
Shares sold | | | 727,809 | | | | 14,001,045 | | | | 1,829,512 | | | | 33,547,607 | |
Reinvestment of distributions | | | 354,531 | | | | 6,750,272 | | | | 53,912 | | | | 965,022 | |
Shares redeemed | | | (1,107,788 | ) | | | (21,611,374 | ) | | | (1,350,780 | ) | | | (24,508,192 | ) |
| | | | (25,448 | ) | | | (860,057 | ) | | | 532,644 | | | | 10,004,437 | |
| Service Shares | | | | | | | | | | | | | | | | |
Shares sold | | | 169,957 | | | | 3,034,958 | | | | 356,691 | | | | 6,160,990 | |
Reinvestment of distributions | | | 43,017 | | | | 756,231 | | | | 9,275 | | | | 155,067 | |
Shares redeemed | | | (146,614 | ) | | | (2,619,029 | ) | | | (470,614 | ) | | | (8,071,739 | ) |
| | | | 66,360 | | | | 1,172,160 | | | | (104,648 | ) | | | (1,755,682 | ) |
| Class IR Shares | | | | | | | | | | | | | | | | |
Shares sold | | | 13,653 | | | | 266,646 | | | | 95,097 | | | | 1,673,610 | |
Reinvestment of distributions | | | 11,996 | | | | 226,844 | | | | 3,008 | | | | 53,596 | |
Shares redeemed | | | (24,162 | ) | | | (455,436 | ) | | | (102,621 | ) | | | (1,877,524 | ) |
| | | | 1,487 | | | | 38,054 | | | | (4,516 | ) | | | (150,318 | ) |
| Class R Shares | | | | | | | | | | | | | | | | |
Shares sold | | | — | | | | — | | | | — | | | | — | |
Reinvestment of distributions | | | — | | | | — | | | | — | | | | — | |
Shares redeemed | | | — | | | | — | | | | — | | | | — | |
| | | | — | | | | — | | | | — | | | | — | |
NET INCREASE (DECREASE) | | | 114,335 | | | $ | 1,951,768 | | | | (1,232,029 | ) | | $ | (19,430,320 | ) |
| (a) | | Class B Shares were converted into Class A Shares at the close of business on November 14, 2014. |
129
GOLDMAN SACHS FUNDAMENTAL EQUITY GROWTH FUNDS
Notes to Financial Statements (continued)
February 28, 2015 (Unaudited)
|
| 10. SUMMARY OF SHARE TRANSACTIONS (continued) |
Share activity is as follows:
| | | | | | | | | | | | | | | | |
| | | U.S. Equity Fund | |
| | | | |
| | | For the Six Months Ended
February 28, 2015
(Unaudited) | | | For the Fiscal Year Ended
August 31, 2014 | |
| | | | |
| | | Shares | | | Dollars | | | Shares | | | Dollars | |
| | | | |
| Class A Shares | | | | | | | | | | | | | | | | |
Shares sold | | | 34,988 | | | $ | 555,953 | | | | 128,347 | | | $ | 2,026,089 | |
Reinvestment of distributions | | | 52,412 | | | | 765,728 | | | | 23,914 | | | | 356,084 | |
Shares converted from Class B(a) | | | — | | | | — | | | | — | | | | — | |
Shares redeemed | | | (32,260 | ) | | | (486,151 | ) | | | (73,652 | ) | | | (1,139,425 | ) |
| | | | 55,140 | | | | 835,530 | | | | 78,609 | | | | 1,242,748 | |
| Class B Shares | | | | | | | | | | | | | | | | |
Shares sold | | | — | | | | — | | | | — | | | | — | |
Reinvestment of distributions | | | — | | | | — | | | | — | | | | — | |
Shares converted to Class A(a) | | | — | | | | — | | | | — | | | | — | |
Shares redeemed | | | — | | | | — | | | | — | | | | — | |
| | | | — | | | | — | | | | — | | | | — | |
| Class C Shares | | | | | | | | | | | | | | | | |
Shares sold | | | 12,796 | | | | 188,834 | | | | 6,704 | | | | 102,411 | |
Reinvestment of distributions | | | 3,284 | | | | 46,988 | | | | 997 | | | | 14,635 | |
Shares redeemed | | | (645 | ) | | | (9,729 | ) | | | (1,192 | ) | | | (18,003 | ) |
| | | | 15,435 | | | | 226,093 | | | | 6,509 | | | | 99,043 | |
| Institutional Shares | | | | | | | | | | | | | | | | |
Shares sold | | | 7,997 | | | | 123,217 | | | | 48,848 | | | | 764,017 | |
Reinvestment of distributions | | | 95,608 | | | | 1,401,610 | | | | 45,793 | | | | 683,691 | |
Shares redeemed | | | (60,405 | ) | | | (943,262 | ) | | | (139,916 | ) | | | (2,180,461 | ) |
| | | | 43,200 | | | | 581,565 | | | | (45,275 | ) | | | (732,753 | ) |
| Service Shares | | | | | | | | | | | | | | | | |
Shares sold | | | — | | | | — | | | | — | | | | — | |
Reinvestment of distributions | | | — | | | | — | | | | — | | | | — | |
Shares redeemed | | | — | | | | — | | | | — | | | | — | |
| | | | — | | | | — | | | | — | | | | — | |
| Class IR Shares | | | | | | | | | | | | | | | | |
Shares sold | | | 1,230 | | | | 19,129 | | | | — | | | | — | |
Reinvestment of distributions | | | 2,373 | | | | 34,777 | | | | 1,143 | | | | 17,049 | |
Shares redeemed | | | (558 | ) | | | (8,088 | ) | | | (613 | ) | | | (10,058 | ) |
| | | | 3,045 | | | | 45,818 | | | | 530 | | | | 6,991 | |
| Class R Shares | | | | | | | | | | | | | | | | |
Shares sold | | | 152 | | | | 2,333 | | | | 2,623 | | | | 41,023 | |
Reinvestment of distributions | | | 1,201 | | | | 17,544 | | | | 517 | | | | 7,691 | |
Shares redeemed | | | (2 | ) | | | (37 | ) | | | (4 | ) | | | (66 | ) |
| | | | 1,351 | | | | 19,840 | | | | 3,136 | | | | 48,648 | |
NET INCREASE (DECREASE) | | | 118,171 | | | $ | 1,708,846 | | | | 43,509 | | | $ | 664,677 | |
| (a) | | Class B Shares were converted into Class A Shares at the close of business on November 14, 2014. |
130
GOLDMAN SACHS FUNDAMENTAL EQUITY GROWTH FUNDS
Fund Expenses — Six Month Period Ended February 28, 2015 (Unaudited)
As a shareholder of Class A, Class C, Institutional, Service, Class IR or Class R Shares of a Fund, you incur two types of costs: (1) transaction costs, including sales charges on purchase payments (with respect to Class A Shares), contingent deferred sales charges on redemptions (with respect to Class C Shares), and (2) ongoing costs, including management fees; distribution and service (12b-1) fees (with respect to Class A, Class C and Class R Shares); and other Fund expenses. This Example is intended to help you understand your ongoing costs (in dollars) of investing in Class A, Class C, Institutional, Service, Class IR or Class R Shares of the Funds and to compare these costs with the ongoing costs of investing in other mutual funds.
The Example is based on an investment of $1,000 invested at the beginning of the period and held for the entire period from September 1, 2014 through February 28, 2015.
Actual Expenses — The first line under each share class in the table below provides information about actual account values and actual expenses. You may use the information in this line, together with the amount you invested, to estimate the expenses that you paid over the period. Simply divide your account value by $1,000 (for example, an $8,600 account value divided by $1,000=8.6), then multiply the result by the number in the first line under the heading entitled “Expenses Paid” to estimate the expenses you paid on your account during this period.
Hypothetical Example for Comparison Purposes — The second line under each share class in the table below provides information about hypothetical account values and hypothetical expenses based on the Funds’ actual net expense ratios and an assumed rate of return of 5% per year before expenses, which is not the Funds’ actual return. The hypothetical account values and expenses may not be used to estimate the actual ending account balance or expenses you paid for the period. You may use this information to compare the ongoing costs of investing in the Funds and other funds. To do so, compare this 5% hypothetical example with the 5% hypothetical examples that appear in the shareholder reports of the other funds.
Please note that the expenses shown in the table are meant to highlight your ongoing costs only and do not reflect any transactional costs, such as sales charges, redemption fees, or exchange fees. Therefore, the second line of the table is useful in comparing ongoing costs only, and will not help you determine the relative total costs of owning different funds. In addition, if these transactional costs were included, your costs would have been higher.
| | | | | | | | | | | | | | | | | | | | | | | | | | | | | | | | | | | | | | | | | | | | | | | | | | | | | | | | | | | | |
| | | Capital Growth Fund | | | Concentrated Growth Fund | | | Flexible Cap Growth Fund | | | Focused Growth Fund | | | Growth Opportunities Fund | |
| Share Class | | Beginning
Account
Value
9/1/14 | | | Ending
Account
Value
2/28/15 | | | Expenses
Paid for the
6 months ended
2/28/15* | | | Beginning
Account
Value
9/1/14 | | | Ending
Account
Value
2/28/15 | | | Expenses
Paid for the
6 months ended
2/28/15* | | | Beginning
Account
Value
9/1/14 | | | Ending
Account
Value
2/28/15 | | | Expenses
Paid for the
6 months ended
2/28/15* | | | Beginning
Account
Value
9/1/14 | | | Ending
Account
Value
2/28/15 | | | Expenses
Paid for the
6 months ended
2/28/15* | | | Beginning
Account
Value
9/1/14 | | | Ending
Account
Value
2/28/15 | | | Expenses
Paid for the
6 months ended
2/28/15* | |
| Class A | | | | | | | | | | | | | | | | | | | | | | | | | | | | | | | | | | | | | | | | | | | | | | | | | | | | | | | | | | | | |
Actual | | $ | 1,000.00 | | | $ | 1,097.20 | | | $ | 5.98 | | | $ | 1,000.00 | | | $ | 1,094.30 | | | $ | 6.49 | | | $ | 1,000.00 | | | $ | 1,092.40 | | | $ | 6.49 | | | $ | 1,000.00 | | | $ | 1,100.00 | | | $ | 6.46 | | | $ | 1,000.00 | | | $ | 1,055.90 | | | $ | 6.88 | |
Hypothetical 5% return | | | 1,000.00 | | | | 1,019.09 | + | | | 5.76 | | | | 1,000.00 | | | | 1,018.60 | + | | | 6.26 | | | | 1,000.00 | | | | 1,018.60 | + | | | 6.26 | | | | 1,000.00 | | | | 1,018.65 | + | | | 6.21 | | | | 1,000.00 | | | | 1,018.10 | + | | | 6.76 | |
| Class C | | | | | | | | | | | | | | | | | | | | | | | | | | | | | | | | | | | | | | | | | | | | | | | | | | | | | | | | | | | | |
Actual | | | 1,000.00 | | | | 1,093.00 | | | | 9.86 | | | | 1,000.00 | | | | 1,090.20 | | | | 10.37 | | | | 1,000.00 | | | | 1,088.40 | | | | 10.36 | | | | 1,000.00 | | | | 1,096.00 | | | | 10.34 | | | | 1,000.00 | | | | 1,052.00 | | | | 10.68 | |
Hypothetical 5% return | | | 1,000.00 | | | | 1,015.37 | + | | | 9.49 | | | | 1,000.00 | | | | 1,014.88 | + | | | 9.99 | | | | 1,000.00 | | | | 1,014.88 | + | | | 9.99 | | | | 1,000.00 | | | | 1,014.93 | + | | | 9.94 | | | | 1,000.00 | | | | 1,014.38 | + | | | 10.49 | |
| Institutional | | | | | | | | | | | | | | | | | | | | | | | | | | | | | | | | | | | | | | | | | | | | | | | | | | | | | | | | | | | | |
Actual | | | 1,000.00 | | | | 1,099.00 | | | | 3.90 | | | | 1,000.00 | | | | 1,096.80 | | | | 4.42 | | | | 1,000.00 | | | | 1,093.80 | | | | 4.41 | | | | 1,000.00 | | | | 1,102.80 | | | | 4.38 | | | | 1,000.00 | | | | 1,058.00 | | | | 4.85 | |
Hypothetical 5% return | | | 1,000.00 | | | | 1,021.08 | + | | | 3.76 | | | | 1,000.00 | | | | 1,020.58 | + | | | 4.26 | | | | 1,000.00 | | | | 1,020.58 | + | | | 4.26 | | | | 1,000.00 | | | | 1,020.63 | + | | | 4.21 | | | | 1,000.00 | | | | 1,020.08 | + | | | 4.76 | |
| Service | | | | | | | | | | | | | | | | | | | | | | | | | | | | | | | | | | | | | | | | | | | | | | | | | | | | | | | | | | | | |
Actual | | | 1,000.00 | | | | 1,096.10 | | | | 6.50 | | | | N/A | | | | N/A | | | | N/A | | | | N/A | | | | N/A | | | | N/A | | | | N/A | | | | N/A | | | | N/A | | | | 1,000.00 | | | | 1,055.60 | | | | 7.39 | |
Hypothetical 5% return | | | 1,000.00 | | | | 1,018.60 | + | | | 6.26 | | | | N/A | | | | N/A | | | | N/A | | | | N/A | | | | N/A | | | | N/A | | | | N/A | | | | N/A | | | | N/A | | | | 1,000.00 | | | | 1,017.60 | + | | | 7.25 | |
| Class IR | | | | | | | | | | | | | | | | | | | | | | | | | | | | | | | | | | | | | | | | | | | | | | | | | | | | | | | | | | | | |
Actual | | | 1,000.00 | | | | 1,098.30 | | | | 4.68 | | | | 1,000.00 | | | | 1,096.00 | | | | 5.20 | | | | 1,000.00 | | | | 1,094.10 | | | | 5.14 | | | | 1,000.00 | | | | 1,101.30 | | | | 5.26 | | | | 1,000.00 | | | | 1,057.20 | | | | 5.61 | |
Hypothetical 5% return | | | 1,000.00 | | | | 1,020.33 | + | | | 4.51 | | | | 1,000.00 | | | | 1,019.84 | + | | | 5.01 | | | | 1,000.00 | | | | 1,019.89 | + | | | 4.96 | | | | 1,000.00 | | | | 1,019.79 | + | | | 5.06 | | | | 1,000.00 | | | | 1,019.34 | + | | | 5.51 | |
| Class R | | | | | | | | | | | | | | | | | | | | | | | | | | | | | | | | | | | | | | | | | | | | | | | | | | | | | | | | | | | | |
Actual | | | 1,000.00 | | | | 1,095.30 | | | | 7.27 | | | | 1,000.00 | | | | 1,093.10 | | | | 7.78 | | | | 1,000.00 | | | | 1,091.00 | | | | 7.78 | | | | 1,000.00 | | | | 1,098.90 | | | | 7.75 | | | | 1,000.00 | | | | 1,054.60 | | | | 8.15 | |
Hypothetical 5% return | | | 1,000.00 | | | | 1,017.85 | + | | | 7.00 | | | | 1,000.00 | | | | 1,017.36 | + | | | 7.50 | | | | 1,000.00 | | | | 1,017.36 | + | | | 7.50 | | | | 1,000.00 | | | | 1,017.41 | + | | | 7.45 | | | | 1,000.00 | | | | 1,016.86 | + | | | 8.00 | |
131
GOLDMAN SACHS FUNDAMENTAL EQUITY GROWTH FUNDS
Fund Expenses — Six Month Period Ended February 28, 2015 (Unaudited) (continued)
| | | | | | | | | | | | | | | | | | | | | | | | | | | | | | | | | | | | | | | | | | | | | | | | |
| | | Small/Mid Cap Growth Fund | | | Strategic Growth Fund | | | Technology Tollkeeper Fund | | | U.S. Equity Fund | |
| Share Class | | Beginning
Account
Value
9/1/14 | | | Ending
Account
Value
2/28/15 | | | Expenses
Paid for the
6 months ended
2/28/15* | | | Beginning
Account
Value
9/1/14 | | | Ending
Account
Value
2/28/15 | | | Expenses
Paid for the
6 months ended
2/28/15* | | | Beginning
Account
Value
9/1/14 | | | Ending
Account
Value
2/28/15 | | | Expenses
Paid for the
6 months ended
2/28/15* | | | Beginning
Account
Value
9/1/14 | | | Ending
Account
Value
2/28/15 | | | Expenses
Paid for the
6 months ended
2/28/15* | |
| Class A | | | | | | | | | | | | | | | | | | | | | | | | | | | | | | | | | | | | | | | | | | | | | | | | |
Actual | | $ | 1,000.00 | | | $ | 1,094.40 | | | $ | 6.91 | | | $ | 1,000.00 | | | $ | 1,087.40 | | | $ | 5.95 | | | $ | 1,000.00 | | | $ | 1,075.50 | | | $ | 7.67 | | | $ | 1,000.00 | | | $ | 1,060.20 | | | $ | 6.13 | |
Hypothetical 5% return | | | 1,000.00 | | | | 1,018.20 | + | | | 6.66 | | | | 1,000.00 | | | | 1,019.09 | + | | | 5.76 | | | | 1,000.00 | | | | 1,017.41 | + | | | 7.45 | | | | 1,000.00 | | | | 1,018.84 | + | | | 6.01 | |
| Class C | | | | | | | | | | | | | | | | | | | | | | | | | | | | | | | | | | | | | | | | | | | | | | | | |
Actual | | | 1,000.00 | | | | 1,090.10 | | | | 10.78 | | | | 1,000.00 | | | | 1,082.90 | | | | 9.81 | | | | 1,000.00 | | | | 1,071.60 | | | | 11.51 | | | | 1,000.00 | | | | 1,056.30 | | | | 9.94 | |
Hypothetical 5% return | | | 1,000.00 | | | | 1,014.48 | + | | | 10.39 | | | | 1,000.00 | | | | 1,015.37 | + | | | 9.49 | | | | 1,000.00 | | | | 1,013.69 | + | | | 11.18 | | | | 1,000.00 | | | | 1,015.13 | + | | | 9.74 | |
| Institutional | | | | | | | | | | | | | | | | | | | | | | | | | | | | | | | | | | | | | | | | | | | | | | | | |
Actual | | | 1,000.00 | | | | 1,097.00 | | | | 4.84 | | | | 1,000.00 | | | | 1,088.80 | | | | 3.88 | | | | 1,000.00 | | | | 1,078.10 | | | | 5.62 | | | | 1,000.00 | | | | 1,062.60 | | | | 4.09 | |
Hypothetical 5% return | | | 1,000.00 | | | | 1,020.18 | + | | | 4.66 | | | | 1,000.00 | | | | 1,021.08 | + | | | 3.76 | | | | 1,000.00 | | | | 1,019.39 | + | | | 5.46 | | | | 1,000.00 | | | | 1,020.83 | + | | | 4.01 | |
| Service | | | | | | | | | | | | | | | | | | | | | | | | | | | | | | | | | | | | | | | | | | | | | | | | |
Actual | | | 1,000.00 | | | | 1,093.90 | | | | 7.42 | | | | 1,000.00 | | | | 1,086.90 | | | | 6.47 | | | | 1,000.00 | | | | 1,074.80 | | | | 8.18 | | | | N/A | | | | N/A | | | | N/A | |
Hypothetical 5% return | | | 1,000.00 | | | | 1,017.70 | + | | | 7.15 | | | | 1,000.00 | | | | 1,018.60 | + | | | 6.26 | | | | 1,000.00 | | | | 1,016.91 | + | | | 7.95 | | | | N/A | | | | N/A | | | | N/A | |
| Class IR | | | | | | | | | | | | | | | | | | | | | | | | | | | | | | | | | | | | | | | | | | | | | | | | |
Actual | | | 1,000.00 | | | | 1,096.00 | | | | 5.61 | | | | 1,000.00 | | | | 1,088.70 | | | | 4.66 | | | | 1,000.00 | | | | 1,077.10 | | | | 6.39 | | | | 1,000.00 | | | | 1,061.80 | | | | 4.86 | |
Hypothetical 5% return | | | 1,000.00 | | | | 1,019.44 | + | | | 5.41 | | | | 1,000.00 | | | | 1,020.33 | + | | | 4.51 | | | | 1,000.00 | | | | 1,018.65 | + | | | 6.21 | | | | 1,000.00 | | | | 1,020.08 | + | | | 4.76 | |
| Class R | | | | | | | | | | | | | | | | | | | | | | | | | | | | | | | | | | | | | | | | | | | | | | | | |
Actual | | | 1,000.00 | | | | 1,093.20 | | | | 8.20 | | | | 1,000.00 | | | | 1,085.60 | | | | 7.19 | | | | N/A | | | | N/A | | | | N/A | | | | 1,000.00 | | | | 1,059.00 | | | | 7.40 | |
Hypothetical 5% return | | | 1,000.00 | | | | 1,016.96 | + | | | 7.90 | | | | 1,000.00 | | | | 1,017.90 | + | | | 6.95 | | | | N/A | | | | N/A | | | | N/A | | | | 1,000.00 | | | | 1,017.60 | + | | | 7.25 | |
| * | | Expenses for each share class are calculated using each Fund’s annualized net expense ratio for each class, which represents the ongoing expenses as a percentage of net assets for the six months ended February 28, 2015. Expenses are calculated by multiplying the annualized net expense ratio by the average account value for the period; then multiplying the result by the number of days in the most recent fiscal half year; and then dividing that result by the number of days in the fiscal year. The annualized net expense ratios for the period were as follows: |
| | | | | | | | | | | | | | | | | | | | | | | | |
| Fund | | Class A | | | Class C | | | Institutional | | | Service | | | Class IR | | | Class R | |
Capital Growth | | | 1.15 | % | | | 1.90 | % | | | 0.75 | % | | | 1.25 | % | | | 0.90 | % | | | 1.40 | % |
Concentrated Growth | | | 1.25 | | | | 2.00 | | | | 0.85 | | | | N/A | | | | 1.00 | | | | 1.50 | |
Flexible Cap Growth | | | 1.25 | | | | 2.00 | | | | 0.85 | | | | N/A | | | | 0.99 | | | | 1.50 | |
Focused Growth | | | 1.24 | | | | 1.99 | | | | 0.84 | | | | N/A | | | | 1.01 | | | | 1.49 | |
Growth Opportunities | | | 1.35 | | | | 2.10 | | | | 0.95 | | | | 1.45 | | | | 1.10 | | | | 1.60 | |
Small/Mid Cap Growth | | | 1.33 | | | | 2.08 | | | | 0.93 | | | | 1.43 | | | | 1.08 | | | | 1.58 | |
Strategic Growth | | | 1.15 | | | | 1.90 | | | | 0.75 | | | | 1.25 | | | | 0.90 | | | | 1.39 | |
Technology Tollkeeper | | | 1.49 | | | | 2.24 | | | | 1.09 | | | | 1.59 | | | | 1.24 | | | | N/A | |
U.S. Equity | | | 1.20 | | | | 1.95 | | | | 0.80 | | | | N/A | | | | 0.95 | | | | 1.45 | |
| + | | Hypothetical expenses are based on each Fund’s actual annualized net expense ratios and an assumed rate of return of 5% per year before expenses. |
132
FUNDS PROFILE
Goldman Sachs Funds

Goldman Sachs is a premier financial services firm, known since 1869 for creating thoughtful and customized investment solutions in complex global markets.
Today, the Investment Management Division of Goldman Sachs serves a diverse set of clients worldwide, including private institutions, public entities and individuals. With approximately $1.02 trillion in assets under supervision as of December 31, 2014, Goldman Sachs Asset Management (“GSAM”) has portfolio management teams located around the world and our investment professionals bring firsthand knowledge of local markets to every investment decision. Assets under supervision includes assets under management and other client assets for which Goldman Sachs does not have full discretion. GSAM leverages the resources of Goldman, Sachs & Co. subject to legal, internal and regulatory restrictions.

Money Market1
Financial Square FundsSM
| n | | Financial Square Tax-Exempt Funds |
| n | | Financial Square Federal Fund |
| n | | Financial Square Government Fund |
| n | | Financial Square Money Market Fund |
| n | | Financial Square Prime Obligations Fund |
| n | | Financial Square Treasury Instruments Fund |
| n | | Financial Square Treasury Obligations Fund |
Fixed Income
Short Duration and Government
| n | | High Quality Floating Rate Fund |
| n | | Limited Maturity Obligations Fund |
| n | | Short Duration Government Fund |
| n | | Short Duration Income Fund |
| n | | Inflation Protected Securities Fund |
Multi-Sector
Municipal and Tax-Free
| n | | High Yield Municipal Fund |
| n | | Dynamic Municipal Income Fund3 |
| n | | Short Duration Tax-Free Fund |
Single Sector
| n | | Investment Grade Credit Fund |
| n | | High Yield Floating Rate Fund |
| n | | Emerging Markets Debt Fund |
| n | | Local Emerging Markets Debt Fund |
| n | | Dynamic Emerging Markets Debt Fund |
Fixed Income Alternatives
| n | | Long Short Credit Strategies Fund |
| n | | Fixed Income Macro Strategies Fund |
Fundamental Equity
| n | | Small/Mid Cap Value Fund |
| n | | Small/Mid Cap Growth Fund |
| n | | Flexible Cap Growth Fund |
| n | | Concentrated Growth Fund |
| n | | Technology Tollkeeper Fund |
| n | | Growth Opportunities Fund |
| n | | Rising Dividend Growth Fund |
Tax-Advantaged Equity
| n | | U.S. Tax-Managed Equity Fund5 |
| n | | International Tax-Managed Equity Fund5 |
| n | | U.S. Equity Dividend and Premium Fund |
| n | | International Equity Dividend and Premium Fund |
Equity Insights
| n | | Small Cap Equity Insights Fund |
| n | | U.S. Equity Insights Fund |
| n | | Small Cap Growth Insights Fund |
| n | | Large Cap Growth Insights Fund |
| n | | Large Cap Value Insights Fund |
| n | | Small Cap Value Insights Fund |
| n | | International Small Cap Insights Fund |
| n | | International Equity Insights Fund |
| n | | Emerging Markets Equity Insights Fund |
Fundamental Equity International
| n | | Strategic International Equity Fund |
| n | | Focused International Equity Fund |
| n | | International Small Cap Fund |
| n | | Emerging Markets Equity Fund |
| n | | BRIC Fund (Brazil, Russia, India, China) |
Select Satellite6
| n | | Real Estate Securities Fund |
| n | | International Real Estate Securities Fund |
| n | | Commodity Strategy Fund |
| n | | Dynamic Commodity Strategy Fund |
| n | | Dynamic Allocation Fund |
| n | | Absolute Return Tracker Fund |
| n | | Managed Futures Strategy Fund |
| n | | MLP Energy Infrastructure Fund |
| n | | Multi-Manager Alternatives Fund |
| n | | Multi-Asset Real Return Fund |
| n | | Retirement Portfolio Completion Fund |
| n | | Tactical Tilt Implementation Fund |
Total Portfolio Solutions6
| n | | Balanced Strategy Portfolio |
| n | | Growth and Income Strategy Portfolio |
| n | | Growth Strategy Portfolio |
| n | | Equity Growth Strategy Portfolio |
| n | | Satellite Strategies Portfolio |
| n | | Enhanced Dividend Global Equity Portfolio |
| n | | Tax Advantaged Global Equity Portfolio |
| 1 | | An investment in a money market fund is neither insured nor guaranteed by the Federal Deposit Insurance Corporation (“FDIC”) or any other government agency. Although the Funds seek to preserve the value of your investment at $1.00 per share, it is possible to lose money by investing in the Funds. |
| 2 | | Effective on October 1, 2014, the Goldman Sachs Core Plus Fixed Income Fund was renamed the Goldman Sachs Bond Fund. |
| 3 | | Effective on December 18, 2014, the Goldman Sachs Municipal Income Fund was renamed the Goldman Sachs Dynamic Municipal Income Fund. |
| 4 | | Effective April 30, 2015, the Goldman Sachs U.S. Equity Fund will be renamed the Goldman Sachs Dynamic U.S. Equity Fund. |
| 5 | | Effective on April 30, 2014, the Goldman Sachs Structured Tax-Managed Equity and Structured International Tax-Managed Equity Funds were renamed the Goldman Sachs U.S. Tax-Managed Equity and International Tax-Managed Equity Funds, respectively. |
| 6 | | Individual Funds within the Total Portfolio Solutions and Select Satellite categories will have various placement on the risk/return spectrum and may have greater or lesser risk than that indicated by the placement of the general Total Portfolio Solutions or Select Satellite category. |
Financial Square FundsSM is a registered service mark of Goldman, Sachs & Co.
*This list covers open-end funds only. Please visit our web site at www.GSAMFUNDS.com to learn about our closed-end funds.
| | |
TRUSTEES Ashok N. Bakhru, Chairman Kathryn A. Cassidy John P. Coblentz, Jr. Diana M. Daniels Joseph P. LoRusso Herbert J. Markley James A. McNamara Jessica Palmer Alan A. Shuch Richard P. Strubel Roy W. Templin Gregory G. Weaver | | OFFICERS James A. McNamara, President Scott M. McHugh, Principal Financial Officer and Treasurer Caroline Kraus, Secretary |
| |
GOLDMAN, SACHS & CO. Distributor and Transfer Agent | | GOLDMAN SACHS ASSET MANAGEMENT, L.P. Investment Adviser |
Visit our web site at www.GSAMFUNDS.com to obtain the most recent month-end returns.
Goldman Sachs Asset Management, L.P. 200 West Street, New York, New York 10282
The reports concerning the Funds included in this shareholder report may contain certain forward-looking statements about the factors that may affect the performance of the Funds in the future. These statements are based on Fund management’s predictions and expectations concerning certain future events and their expected impact on the Funds, such as performance of the economy as a whole and of specific industry sectors, changes in the levels of interest rates, the impact of developing world events, and other factors that may influence the future performance of the Funds. Management believes these forward-looking statements to be reasonable, although they are inherently uncertain and difficult to predict. Actual events may cause adjustments in portfolio management strategies from those currently expected to be employed.
A description of the policies and procedures that the Funds use to determine how to vote proxies relating to portfolio securities and information regarding how a Fund voted proxies relating to portfolio securities during the most recent 12-month period ended June 30 is available (i) without charge, upon request by calling 1-800-526-7384 (for Retail Shareholders) or 1-800-621-2550 (for Institutional Shareholders); and (ii) on the Securities and Exchange Commission (“SEC”) web site at http://www.sec.gov.
The Funds file their complete schedule of portfolio holdings with the SEC for the first and third quarters of each fiscal year on Form N-Qs. The Funds’ Form N-Qs are available on the SEC’s web site at http://www.sec.gov within 60 days after the Funds’ first and third fiscal quarters. The Funds’ Form N-Qs may be reviewed and copied at the SEC’s Public Reference Room in Washington, D.C. and information on the operation of the Public Reference Room may also be obtained by calling 1-800-SEC-0330. Form N-Qs may be obtained upon request and without charge by calling 1-800-526-7384 (for Retail Shareholders) or 1-800-621-2550 (for Institutional Shareholders).
Goldman, Sachs & Co. (“Goldman Sachs”) does not provide legal, tax or accounting advice. Any statement contained in this communication (including any attachments) concerning U.S. tax matters was not intended or written to be used, and cannot be used, for the purpose of avoiding penalties under the Internal Revenue Code, and was written to support the promotion or marketing of the transaction(s) or matter(s) addressed. Clients of Goldman Sachs should obtain their own independent tax advice based on their particular circumstances.
Fund holdings and allocations shown are as of February 28, 2015 and may not be representative of future investments. Fund holdings should not be relied on in making investment decisions and should not be construed as research or investment advice regarding particular securities. Current and future holdings are subject to risk.
The Global Industry Classification Standard (GICS) was developed by and is the exclusive property and a service mark of Morgan Stanley Capital International Inc. (MSCI) and Standard & Poor’s, a division of The McGraw-Hill Companies, Inc. (S&P) and is licensed for use by Goldman Sachs. Neither MSCI, S&P nor any other party involved in making or compiling the GICS or any GICS classifications makes any express or implied warranties or representations with respect to such standard or classification (or the results to be obtained by the use thereof), and all such parties hereby expressly disclaim all warranties of originality, accuracy, completeness, merchantability or fitness for a particular purpose with respect to any of such standard or classification. Without limiting any of the foregoing, in no event shall MSCI, S&P, any of their affiliates or any third party involved in making or compiling the GICS or any GICS classifications have any liability for any direct, indirect, special, punitive, consequential or any other damages (including lost profits) even if notified of the possibility of such damages.
The portfolio risk management process includes an effort to monitor and manage risk, but does not imply low risk.
This material is not authorized for distribution to prospective investors unless preceded or accompanied by a current Prospectus or summary prospectus, if applicable. Investors should consider a Fund’s objective, risks, and charges and expenses, and read the summary prospectus, if available, and/or the Prospectus carefully before investing or sending money. The summary prospectus, if available, and the Prospectus contain this and other information about a Fund and may be obtained from your Authorized Institution or from Goldman, Sachs & Co. by calling (retail – 1-800-526-7384) (institutional – 1-800-621-2550).
© 2015 Goldman Sachs. All rights reserved. 159847.MF.MED.TMPL/4/2015 EQGRWSAR-15 / 193K
(a) As of the end of the period covered by this report, the registrant has adopted a code of ethics that applies to the registrant’s principal executive officer, principal financial officer, principal accounting officer or controller, or persons performing similar functions, regardless of whether these individuals are employed by the registrant or a third party (the “Code of Ethics”).
(b) During the period covered by this report, no amendments were made to the provisions of the Code of Ethics.
(c) During the period covered by this report, the registrant did not grant any waivers, including an implicit waiver, from any provision of the Code of Ethics.
(d) A copy of the Code of Ethics is available as provided in Item 12(a)(1) of this report.
| ITEM 3. | AUDIT COMMITTEE FINANCIAL EXPERT. |
The registrant’s board of trustees has determined that the registrant has at least one “audit committee financial expert” (as defined in Item 3 of Form N-CSR) serving on its audit committee. John P. Coblentz, Jr. is the “audit committee financial expert” and is “independent” (as each term is defined in Item 3 of Form N-CSR).
| ITEM 4. | PRINCIPAL ACCOUNTANT FEES AND SERVICES. |
Table 1 — Items 4(a) - 4(d). The accountant fees below reflect the aggregate fees billed by all of the Funds of the Goldman Sachs Trust and includes the Goldman Sachs Funds to which this certified shareholder report relates.
| | | | | | | | | | | | |
| | | 2014 | | �� 2013 | | Description of Services Rendered |
| | | |
| | | | | | | | | | | | |
| | | |
Audit Fees: | | | | | | | | | | | | |
| | | |
• PricewaterhouseCoopers LLP
(“PwC”) | | | $ | 4,269,524 | | | | $ | 3,372,161 | | | Financial Statement audits. |
| | | |
Audit-Related Fees: | | | | | | | | | | | | |
| | | |
• PwC | | | $ | 0 | | | | $ | 2,340 | | | Other attest services. |
| | | |
Tax Fees: | | | | | | | | | | | | |
| | | |
• PwC | | | $ | 939,217 | | | | $ | 816,858 | | | Tax compliance services provided in connection with the preparation and review of registrant’s tax returns. |
Table 2 — Items 4(b)(c) & (d). Non-Audit Services to the Goldman Sachs Trust’s service affiliates * that were pre-approved by the Audit Committee of the Goldman Sachs Trust pursuant to Rule 2-01(c)(7)(ii) of Regulation S-X.
| | | | | | | | | | | | |
| | | 2014 | | 2013 | | Description of Services Rendered |
| | | |
| | | | | | | | | | | | |
| | | |
Audit-Related Fees: | | | | | | | | | | | | |
| | | |
• PwC | | | $ | 1,486,420 | | | | $ | 1,516,680 | | | Internal control review performed in accordance with Statement on Standards for Attestation Engagements No. 16. These fees are borne by the Funds’ Adviser. |
| * | These include the advisor (excluding sub-advisors) and any entity controlling, controlled by or under common control with the advisor that provides ongoing services to the registrant (hereinafter referred to as “service affiliates”). |
Item 4(e)(1) — Audit Committee Pre-Approval Policies and Procedures
Pre-Approval of Audit and Non-Audit Services Provided to the Funds of the Goldman Sachs Trust. The Audit and Non-Audit Services Pre-Approval Policy (the “Policy”) adopted by the Audit Committee of Goldman Sachs Trust (“GST”) sets forth the procedures and the conditions pursuant to which services performed by an independent auditor for GST may be pre-approved. Services may be pre-approved specifically by the Audit Committee as a whole or, in certain circumstances, by the Audit Committee Chairman or the person designated as the Audit Committee Financial Expert. In addition, subject to specified cost limitations, certain services may be pre-approved under the provisions of the Policy. The Policy provides that the Audit Committee will consider whether the services provided by an independent auditor are consistent with the Securities and Exchange Commission’s rules on auditor independence. The Policy provides for periodic review and pre-approval by the Audit Committee of the services that may be provided by the independent auditor.
De Minimis Waiver. The pre-approval requirements of the Policy may be waived with respect to the provision of non-audit services that are permissible for an independent auditor to perform, provided (1) the aggregate amount of all such services provided constitutes no more than five percent of the total amount of revenues subject to pre-approval that was paid to the independent auditors during the fiscal year in which the services are provided; (2) such services were not recognized by GST at the time of the engagement to be non-audit services; and (3) such services are promptly brought to the attention of the Audit Committee and approved prior to the completion of the audit by the Audit Committee or by one or more members of the Audit Committee to whom authority to grant such approvals has been delegated by the Audit Committee, pursuant to the pre-approval provisions of the Policy.
Pre-Approval of Non-Audit Services Provided to GST’s Investment Advisers. The Policy provides that, in addition to requiring pre-approval of audit and non-audit services provided to GST, the Audit Committee will pre-approve those non-audit services provided to GST’s investment advisers (and entities controlling, controlled by or under common control with the investment advisers that provide ongoing services to GST) where the engagement relates directly to the operations or financial reporting of GST.
Item 4(e)(2) – 0% of the audit-related fees, tax fees and other fees listed in Table 1 were approved by GST’s Audit Committee pursuant to the “de minimis” exception of Rule 2-01(c)(7)(i)(C) of Regulation S-X. In addition, 0% of the non-audit services to the GST’s service affiliates listed in Table 2 were approved by GST’s Audit Committee pursuant to the “de minimis” exception of Rule 2-01(c)(7)(i)(C) of Regulation S-X.
Item 4(f) – Not applicable.
Item 4(g) Aggregate Non-Audit Fees Disclosure
The aggregate non-audit fees billed to GST by PwC for the twelve months ended August 31, 2014 and August 31, 2013 were approximately $939,217 and $819,198 respectively. The aggregate non-audit fees billed to GST’s adviser and service affiliates by PwC for non-audit services for the twelve months ended December 31, 2013 and December 31, 2012 $9.8 million and $9.8 million respectively. With regard to the aggregate non-audit fees billed to GST’s adviser and service affiliates, the 2012 and 2011 amounts include fees for non-audit services required to be pre-approved [see Table 2] and fees for non-audit services that did not require pre-approval since they did not directly relate to GST’s operations or financial reporting.
Item 4(h) — GST’s Audit Committee has considered whether the provision of non-audit services to GST’s investment adviser and service affiliates that did not require pre-approval pursuant to paragraph (c)(7)(ii) of Rule 2-01 of Regulation S-X is compatible with maintaining the auditors’ independence.
| ITEM 5. | AUDIT COMMITTEE OF LISTED REGISTRANTS. |
| ITEM 6. | SCHEDULE OF INVESTMENTS. |
| | Schedule of Investments is included as part of the Report to Stockholders filed under Item 1. |
| ITEM 7. | DISCLOSURE OF PROXY VOTING POLICIES AND PROCEDURES FOR CLOSED-END MANAGEMENT INVESTMENT COMPANIES. |
| ITEM 8. | PORTFOLIO MANAGERS OF CLOSED-END MANAGEMENT INVESTMENT COMPANIES. |
| ITEM 9. | PURCHASES OF EQUITY SECURITIES BY CLOSED-END MANAGEMENT INVESTMENT COMPANY AND AFFILIATED PURCHASERS. |
| ITEM 10. | SUBMISSION OF MATTERS TO A VOTE OF SECURITY HOLDERS. |
| | There have been no material changes to the procedures by which shareholders may recommend nominees to the registrant’s board of trustees. |
| ITEM 11. | CONTROLS AND PROCEDURES. |
| | (a) | The registrant’s principal executive and principal financial officers, or persons performing similar functions have concluded that the registrant’s disclosure controls and procedures (as defined in Rule 30a-3(c) under the Investment Company Act of 1940, as amended (the “1940 Act”)) are effective as of a date within 90 days of the filing of this report that includes the disclosure required by this paragraph, based on the evaluation of these controls and procedures required by Rule 30a-3(b) under the 1940 Act and 15d-15(b) under the Securities Exchange Act of 1934, as amended. |
| | (b) | There were no changes in the registrant’s internal control over financial reporting (as defined in Rule 30a-3(d) under the 1940 Act) that occurred during the registrant’s second fiscal quarter of the period covered by this report that have materially affected, or are reasonably likely to materially affect, the registrant’s internal control over financial reporting. |
| | | | |
| (a)(1) | | Goldman Sachs Trust’s Code of Ethics for Principal Executive and Senior Financial Officers is incorporated by reference to Exhibit 12(a)(1) of the registrant’s Form N-CSR filed on June 3, 2010 for its Short Duration and Government Fixed Income Funds. |
| | |
| (a)(2) | | Exhibit 99.CERT | | Certifications pursuant to Section 302 of the Sarbanes-Oxley Act of 2002 filed herewith. |
| | |
| (b) | | Exhibit 99.906CERT | | Certifications pursuant to Section 906 of the Sarbanes-Oxley Act of 2002 filed herewith. |
SIGNATURES
Pursuant to the requirements of the Securities Exchange Act of 1934 and the Investment Company Act of 1940, the registrant has duly caused this report to be signed on its behalf by the undersigned, thereunto duly authorized.
| | |
| | | Goldman Sachs Trust |
| |
| By: | | /s/ James A. McNamara |
| |
| | |
| | James A. McNamara |
| | President/Principal Executive Officer |
| | Goldman Sachs Trust |
| |
| Date: | | May 4, 2015 |
Pursuant to the requirements of the Securities Exchange Act of 1934 and the Investment Company Act of 1940, this report has been signed below by the following persons on behalf of the registrant and in the capacities and on the dates indicated.
| | |
| By: | | /s/ James A. McNamara |
| |
| | |
| | James A. McNamara |
| | President/Principal Executive Officer |
| | Goldman Sachs Trust |
| |
| Date: | | May 4, 2015 |
| |
| By: | | /s/ Scott McHugh |
| |
| | |
| | Scott McHugh |
| | Principal Financial Officer |
| | Goldman Sachs Trust |
| |
| Date: | | May 4, 2015 |