UNITED STATES
SECURITIES AND EXCHANGE COMMISSION
Washington, D.C. 20549
FORM N-CSR
CERTIFIED SHAREHOLDER REPORT OF REGISTERED
MANAGEMENT INVESTMENT COMPANIES
Investment Company Act file number 811-05349
Goldman Sachs Trust
(Exact name of registrant as specified in charter)
71 South Wacker Drive, Chicago, Illinois 60606
(Address of principal executive offices) (Zip code)
| | |
| Caroline Kraus, Esq. | | Copies to: |
| Goldman, Sachs & Co. | | Geoffrey R.T. Kenyon, Esq. |
| 200 West Street | | Dechert LLP |
| New York, New York 10282 | | 100 Oliver Street |
| | 40th Floor |
| | Boston, MA 02110-2605 |
(Name and address of agents for service)
Registrant’s telephone number, including area code: (312) 655-4400
Date of fiscal year end: August 31
Date of reporting period: February 28, 2015
Explanatory Note
This amended and restated Semi-Annual Report (originally filed with the SEC on Form N-CSR on May 4, 2015) revises information with respect to the aggregate non-audit fees under Item 4(g).
| ITEM 1. | REPORTS TO STOCKHOLDERS. |
| | The Semi-Annual Report to Stockholders is filed herewith. |
Goldman Sachs Funds

| | | | |
| | |
| Semi-Annual Report | | | | February 28, 2015 |
| | |
| | | | Fundamental Equity Value Funds |
| | | | Growth and Income |
| | | | Large Cap Value |
| | | | Mid Cap Value |
| | | | Small Cap Value |
| | | | Small/Mid Cap Value |

Goldman Sachs Fundamental Equity Value Funds
| | | | |
TABLE OF CONTENTS | | | | |
| |
Principal Investment Strategies and Risks | | | 1 | |
| |
Investment Process | | | 2 | |
| |
Market Review | | | 3 | |
| |
Portfolio Management Discussions and Performance Summaries | | | 6 | |
| |
Schedules of Investments | | | 40 | |
| |
Financial Statements | | | 54 | |
| |
Financial Highlights | | | 60 | |
| |
Notes to Financial Statements | | | 70 | |
| |
Other Information | | | 88 | |
| | | | |
| | | |
| NOT FDIC-INSURED | | May Lose Value | | No Bank Guarantee |
GOLDMAN SACHS FUNDAMENTAL EQUITY VALUE FUNDS
Principal Investment Strategies and Risks
This is not a complete list of risks that may affect the Funds. For additional information concerning the risks applicable to the Funds, please see the Funds’ Prospectuses.
The Goldman Sachs Growth and Income Fund invests primarily in U.S. equity investments. The Fund’s equity investments are subject to market risk, which means that the value of the securities in which it invests may go up or down in response to the prospects of individual companies, particular sectors and/or general economic conditions. Different investment styles (e.g., “value”) tend to shift in and out of favor, and at times the Fund may underperform other funds that invest in similar asset classes. Foreign and emerging markets investments may be more volatile than investments in U.S. securities and are subject to the risks of currency fluctuations and adverse economic or political developments. Investments in master limited partnerships (“MLPs”) are subject to certain risks, including risks related to limited control and limited rights to vote, potential conflicts of interest, cash flow risks, dilution risks, limited liquidity and risks related to the general partner’s right to force sales at undesirable times or prices. Investing in REITs involves certain unique risks in addition to those risks associated with investing in the real estate industry in general. REITs whose underlying properties are concentrated in a particular industry or geographic region are also subject to risks affecting such industries and regions. The securities of REITs involve greater risks than those associated with larger, more established companies and may be subject to more abrupt or erratic price movements because of interest rate changes, economic conditions and other factors.
The Goldman Sachs Large Cap Value Fund invests primarily in large-capitalization U.S. equity investments. The Fund’s equity investments are subject to market risk, which means that the value of the securities in which it invests may go up or down in response to the prospects of individual companies, particular sectors and/or general economic conditions. Different investment styles (e.g., “value”) tend to shift in and out of favor, and at times the Fund may underperform other funds that invest in similar asset classes.
The Goldman Sachs Mid Cap Value Fund invests primarily in mid-capitalization U.S. equity investments. The Fund’s equity investments are subject to market risk, which means that the value of the securities in which it invests may go up or down in response to the prospects of individual companies, particular sectors and/or general economic conditions. The securities of mid- and small-capitalization companies involve greater risks than those associated with larger, more established companies and may be subject to more abrupt or erratic price movements. Different investment styles (e.g., “value”) tend to shift in and out of favor, and at times the Fund may underperform other funds that invest in similar asset classes.
The Goldman Sachs Small Cap Value Fund invests primarily in small-capitalization U.S. equity investments. The Fund’s equity investments are subject to market risk, which means that the value of the securities in which it invests may go up or down in response to the prospects of individual companies, particular sectors and/or general economic conditions. The securities of mid- and small-capitalization companies involve greater risks than those associated with larger, more established companies and may be subject to more abrupt or erratic price movements. Different investment styles (e.g., “value”) tend to shift in and out of favor, and at times the Fund may underperform other funds that invest in similar asset classes.
The Goldman Sachs Small/Mid Cap Value Fund invests primarily in equity investments with a primary focus on mid- and small-capitalization companies. The Fund’s equity investments are subject to market risk, which means that the value of the securities in which it invests may go up or down in response to the prospects of individual companies, particular sectors and/or general economic conditions. The securities of mid- and small-capitalization companies involve greater risks than those associated with larger, more established companies and may be subject to more abrupt or erratic price movements. Different investment styles (e.g., “value”) tend to shift in and out of favor, and at times the Fund may underperform other funds that invest in similar asset classes.
1
GOLDMAN SACHS FUNDAMENTAL EQUITY VALUE FUNDS
What Differentiates the Goldman Sachs
Fundamental Equity Value Investment Process?
Goldman Sachs’ Fundamental Equity Value Team believes that all successful investing should thoughtfully weigh two important attributes of a stock: price and prospects. Through independent fundamental research, the Team seeks to identify and invest in quality businesses that are selling at compelling valuations.


At the heart of our value investment philosophy is a belief in the rigorous analysis of business fundamentals. Our approach may include:
| n | | Meetings with management teams and on-site company visits |
| n | | Industry-specific, proprietary financial and valuation models |
| n | | Assessment of management quality |
| n | | Analysis of each company’s competitive position and industry dynamics |
| n | | Interviews with competitors, suppliers and customers |

We seek to invest in companies when we believe:
| n | | Market uncertainty exists |
| n | | Their economic value is not recognized by the market |

We seek to buy companies with quality characteristics. For us, this means companies that have:
| n | | Sustainable operating earnings, or competitive advantage |
| n | | Excellent stewardship of capital |
| n | | Capability to earn above their cost of capital |
| n | | Strong or improving balance sheets and cash flow |

Value portfolios that strive to offer:
| | n | | Capital appreciation potential as each company’s true value is recognized in the marketplace | |
| | n | | Investment style consistency | |
2
MARKET REVIEW
Goldman Sachs Fundamental Equity Value Funds
Market Review
Overall, U.S. equities advanced for the six months ended February 28, 2015 (the “Reporting Period”) with broad sector participation. The Standard & Poor’s 500® Index (the “S&P 500 Index”) ended the Reporting Period with a gain of 6.12%. The Russell 3000® Index generated a return of 5.98%. By the end of the Reporting Period, the S&P 500 Index and Dow Jones Industrial Average each rose to new record highs, and the NASDAQ Composite neared its dot. com era high seen in 2000.
Several macroeconomic themes influenced U.S. equity market performance during the Reporting Period, including the improving domestic economy, the expectation the Federal Reserve (the “Fed”) would increase interest rates soon, and sharply falling oil prices. More specifically, the U.S. reported Gross Domestic Product (“GDP”) growth well ahead of that of Europe and Japan during the Reporting Period. In addition, the U.S. labor market continued to improve, with unemployment falling to 5.6%, its lowest level since June 2008. In turn, financial markets increasingly focused on the potential that the Fed would increase interest rates, which led to an appreciation of the U.S. dollar against many currencies. At the same time, the price of West Texas Intermediate (“WTI”) crude oil fell from more than $90 per barrel at the beginning of the Reporting Period to less than $50 per barrel in January 2015, before recovering modestly in February 2015.
Given this backdrop, the energy sector declined significantly, the only sector in the S&P 500 Index to post a negative return during the Reporting Period. In contrast, both the consumer discretionary and consumer staples sectors significantly outperformed the S&P 500 Index during the Reporting Period, as the U.S. equity markets reflected investor sentiment that the combination of an improving economy, healthier job market, strong U.S. dollar and low oil prices would be positive for U.S. consumers. Health care was the best performing sector in the S&P 500 Index during the Reporting Period, as robust merger and acquisition activity pushed stock prices higher.
For the Reporting Period overall, mid-cap companies performed best, but only modestly ahead of both large-cap and small-cap companies. Growth stocks outpaced value stocks across the capitalization spectrum of the U.S. equity market. (All as measured by Russell Investments indices.)
3
MARKET REVIEW
Looking Ahead
At the end of the Reporting Period, we believed U.S. equities had further upside potential should the U.S. economy continue to accelerate. We believe real earnings growth may well serve as a fundamental driver of performance going forward. We believe U.S. corporate fundamentals are strong, evidenced by both healthy balance sheets and earnings resilience, and should provide companies with a number of options to increase shareholder value. While we acknowledge the potential for headwinds remains, such as geopolitical risks, we ultimately remain constructive on the direction of U.S. equity markets. We believe the U.S. has the best macroeconomic outlook of the developed economies, and we are optimistic on the strengthening U.S. housing and employment markets as well as on the potential for a continued recovery in consumer spending. Consumption, which accounts for approximately 70% of U.S. GDP, may benefit from the combination of low energy prices and a strong U.S. dollar. Furthermore, with strong GDP growth momentum from 2014, we believe an acceleration in earnings growth could continue in the U.S., as the country appears to be less exposed to weaker segments of the global economy given its lower reliance on exports.
Looking forward, we believe that should the U.S. economy continue to improve, companies may reinvest for future growth by increasing capital expenditures, research and development, hiring, and merger and acquisition activity rather than keeping excess cash on balance sheets. From a valuation perspective, we believe U.S. equities remained, at the end of the Reporting Period, fairly valued overall considering the positive macro environment and were inexpensive relative to fixed income. We believe a forward-looking analysis is critical in this investing environment, and we believe stock selection will be increasingly important as companies differentiate themselves on earnings growth and valuation.
Regardless of market direction, our fundamental, bottom-up stock selection continues to drive our process, rather than headlines or sentiment. We maintain high conviction in the companies the Fundamental Equity Value Funds own, and we believe they have the potential to outperform relative to the broader market regardless of economic growth conditions. We continue to focus on undervalued companies that we believe have comparatively greater control of their own destiny, such as innovators with differentiated products, companies with low cost structures, or companies that have been investing in their own businesses and may be poised to gain market share. We maintain our discipline in seeking to identify companies with strong or improving balance sheets, led by quality management teams and trading at discounted valuations, and we maintain our long-term investment perspective.
As always, deep research resources, a forward-looking investment process and truly actively managed portfolios are keys, in our view, to both preserving capital and seeking to outperform the market over the long term.
4
MARKET REVIEW
|
| |
| Changes to the Funds’ Portfolio Management Team during the Reporting Period |
| |
Effective February 18, 2015, Timothy Ryan serves as a portfolio manager for the Goldman Sachs Mid Cap Value Fund. Additionally, Sean Gallagher serves as sole Chief Investment Officer of the Value Equity Investment Team. The other portfolio managers serve as primary research analysts for particular industries. While the entire team debates investment ideas and overall portfolio structure, the final buy/sell decision for a particular security resides primarily with the portfolio manager responsible for that particular industry. As Chief Investment Officer of the Value Equity Investment Team, Mr. Gallagher is ultimately responsible for the composition of the Funds’ portfolio structure at both the stock and industry level. |
5
PORTFOLIO RESULTS
Goldman Sachs Growth and Income Fund
Portfolio Composition
Under normal circumstances, the Fund invests at least 65% of its total net assets in equity investments that the Goldman Sachs Value Equity Investment Team considers to have favorable prospects for capital appreciation and/or dividend-paying ability. Although the Fund will invest primarily in publicly traded U.S. securities, including preferred and convertible securities, master limited partnerships and real estate investment trusts, it may invest up to 25% of its total net assets in foreign securities, including securities of issuers in emerging countries and securities quoted in foreign currencies. The Fund may also invest up to 35% of its total net assets in fixed income securities, such as government, corporate and bank debt obligations, that offer the potential to further the Fund’s investment objective of long-term capital appreciation and growth of income.
Portfolio Management Discussion and Analysis
Below, the Goldman Sachs Value Equity Investment Team discusses the Goldman Sachs Growth and Income Fund’s (the “Fund”) performance and positioning for the six-month period ended February 28, 2015 (the “Reporting Period”).
| Q | | How did the Fund perform during the Reporting Period? |
| A | | During the Reporting Period, the Fund’s Class A, C, Institutional, Service, IR and R Shares generated cumulative total returns, without sales charges, of 3.29%, 2.94%, 3.54%, 3.25%, 3.44% and 3.18%, respectively. These returns compare to the 3.48% cumulative total return of the Fund’s benchmark, the Russell 1000® Value Index (with dividends reinvested) (the “Russell Index”), during the same period. |
| Q | | What key factors were responsible for the Fund’s performance during the Reporting Period? |
| A | | Stock selection overall contributed most to the Fund’s performance relative to the Russell Index during the Reporting Period. Sector allocation as a whole also contributed positively to the Fund’s results. |
| Q | | Which equity market sectors most significantly affected Fund performance? |
| A | | Effective stock selection in the information technology, industrials and health care sectors helped the Fund’s relative results most. The only two sectors that detracted from the Fund’s relative results during the Reporting Period were energy and consumer discretionary, wherein stock selection proved challenging. |
| Q | | What were some of the Fund’s best-performing individual stocks? |
| A | | The Fund benefited most relative to the Russell Index from positions in office supply retailer Staples, grocery chain Kroger and pharmaceuticals company Pfizer. |
| | Shares of Staples rose during the Reporting Period, supported by the announcement of an activist investor taking a 5% stake in the company, increasing speculation that a merger with Office Depot could be in the future. We believe the subsequently announced merger between these two companies could be highly accretive. Fundamentally, though, even without the merger, we believe the changing dynamics and near-term consolidation in the office supply industry create favorable tailwinds for the industry and that the market is currently underestimating this potential. We believe Staples’ management team’s decision to proceed with store closures should help to drive down costs and increase productivity in its remaining stores. At the end of the Reporting Period, we were also encouraged by the trajectory of the company’s international business after recent restructuring and leadership changes. |
| | Kroger reported positive quarterly earnings results driven by solid execution, which helped the company maintain its positive momentum and drive its shares higher. In line with our view, Kroger was able to gain additional market share from its peers. We also found it positive that its management repurchased its shares at a greater than anticipated rate during the Reporting Period. In our view, Kroger has consistently |
6
PORTFOLIO RESULTS
| | been able to gain market share, driven by a focus on low prices, high convenience and healthy choices. At the end of the Reporting Period, its margins appeared to have stabilized. We believe its margins may begin to expand following many years of investment to improve its competitive positioning. We also believe its acquisition of Harris Teeter Supermarkets may provide synergies and boost its earnings per share over the next two to three years. We believe that further industry consolidation could be beneficial for the company due to its strong market share and stable cash flows. |
| | Pfizer’s shares appreciated as the market started to reflect what we consider to be the true value of its product pipeline. Additionally, Pfizer’s shares reacted positively to the Food and Drug Administration’s (“FDA”) accelerated approval of its new drug Ibrance as well as early enthusiasm regarding its immune-oncology assets. Also, share price appreciation was supported by its recently announced acquisition of Hospira, which we believe may well strengthen its biosimilars pipeline. At the end of the Reporting Period, we continued to believe Pfizer has strong fundamentals, a number of growth opportunities and an attractive valuation. Indeed, in our view, Pfizer’s pipeline was undervalued at the end of the Reporting Period, and we expect its management to continue to highlight the pipeline value through clinical success. Pfizer also has a strong, highly rated balance sheet with more than $33 billion of cash that we believe provides the company with the financial flexibility to invest for growth and return capital to shareholders. The company also pays what we view as an attractive dividend. |
| Q | | Which stocks detracted significantly from the Fund’s performance during the Reporting Period? |
| A | | Detracting most from the Fund’s results relative to its benchmark index were positions in three oil and gas exploration and production companies — Canadian Oil Sands, Devon Energy and Apache. |
| | Shares of Canadian Oil Sands underperformed, as lower oil prices led to cash flow concerns and a subsequent dividend reduction. We believe the company’s capacity utilization has the potential to improve, with its management having made higher capital investments for upgrades in the past few years. Additionally, we believe these recent upgrades should lead to a decrease in capital expenditures over the next few years. With lower oil prices, however, free cash flow generation could be lower than anticipated and not support the company’s dividend, in our view. Thus, while we are encouraged by the company’s new management team, we exited the Fund’s position in the company in early January 2015 to reduce the Fund’s energy exposure, and we reallocated the capital into higher conviction names. |
| | Lower oil prices weighed negatively on Devon Energy’s shares and overshadowed the company’s strong results. Despite its underperformance, we continued to believe at the end of the Reporting Period that the value of Devon Energy’s large North American asset base was not fully recognized at its then current market price. We also remained positive on a number of actions the company has taken to unlock shareholder value. Finally, we believe Devon Energy maintains a strong balance sheet, which could help expedite the development of its oil properties going forward. |
| | Similarly, Apache’s shares declined along with the drop in energy prices during the Reporting Period. Still, during 2014, Apache announced the sale of $1.4 billion of non-core assets and the exit of liquid natural gas projects, which consumed capital. We view these sales of non-core assets favorably, as we feel it demonstrates Apache’s commitment to focus on its core business, which we believe has the potential to generate higher returns on investment and more predictable growth. Overall, at the end of the Reporting Period, we viewed its shares as attractively valued given Apache’s balance sheet strength, improving free cash flow generation and potential for increased shareholder distributions. |
| Q | | How did the Fund use derivatives and similar instruments during the Reporting Period? |
| A | | During the Reporting Period, we did not use derivatives as part of an active management strategy. |
| Q | | Did the Fund make any significant purchases or sales during the Reporting Period? |
| A | | We initiated a Fund position in diversified financial services company Fifth Third Bancorp based upon its improving returns and what we consider to be its attractive valuation relative to its peers. We believe the bank can continue to improve return on assets and return on equity, as it improves efficiency and sheds legacy costs. In our view, Fifth Third Bancorp’s ability to potentially benefit from eventual rising interest rates may be underappreciated by the market. |
| | We established a Fund position in insurance company Aflac. The company has a substantial presence in the supplemental medical insurance market in Japan, where it is the dominant provider of cancer insurance, and a leading presence in the supplemental health and life business in the U.S., especially |
7
PORTFOLIO RESULTS
| | with smaller firms. We believe the company is a high quality franchise, which at the time of our purchase, featured a reasonable valuation with the potential to benefit from increased capital deployment and improvement in sales. |
| | Conversely, in addition to the sale of Canadian Oil Sands, already mentioned, we sold the Fund’s position in semiconductor bellwether Intel. Its stock showed strong performance during the Reporting Period, but we believe it has limited upside potential moving forward. We also see the relatively flat personal computer market continuing and view such as a possible hindrance in the future. While we still believe the company is a well-run, quality business, we decided to exit the Fund’s position in favor of higher conviction opportunities. |
| | We sold the Fund’s position in diversified financial services institution Citigroup. Our confidence was tested on Citigroup’s results and execution in non-U.S. markets, where it has an outsized exposure relative to its peers. While we still have a favorable long-term view of the company, we believe the market is fully appreciating the company for now. We therefore eliminated the position in favor of companies we believe have greater upside potential. |
| Q | | Were there any notable changes in the Fund’s weightings during the Reporting Period? |
| A | | In constructing the Fund’s portfolio, we focus on picking stocks rather than on making industry or sector bets. We seek to outpace the benchmark index by overweighting stocks that we expect to outperform and underweighting those that we think may lag. Consequently, changes in its sector weights are generally the direct result of individual stock selection or of stock appreciation or depreciation. That said, during the Reporting Period, the Fund’s allocations compared to the benchmark index in financials and telecommunication services increased as did its position in cash. The Fund’s exposure to energy and information technology decreased compared to the Russell Index. |
| Q | | How was the Fund positioned relative to its benchmark index at the end of February 2015? |
| A | | At the end of February 2015, the Fund had overweighted positions relative to the Russell Index in the consumer discretionary, telecommunication services and health care sectors. On the same date, the Fund had underweighted positions compared to the Russell Index in materials, energy, consumer staples and utilities and was rather neutrally weighted to the Russell Index in financials, industrials and information technology. |
| Q | | Did the Fund make any significant purchases or sales during the Reporting Period? |
| A | | We initiated a Fund position in diversified financial services company Fifth Third Bancorp based upon its improving returns and what we consider to be its attractive valuation relative to its peers. We believe the bank can continue to improve return on assets and return on equity, as it improves efficiency and sheds legacy costs. In our view, Fifth Third Bancorp’s ability to potentially benefit from eventual rising interest rates may be underappreciated by the market. |
| | We established a Fund position in insurance company Aflac. The company has a substantial presence in the supplemental medical insurance market in Japan, where it is the dominant provider of cancer insurance, and a leading presence in the supplemental health and life business in the U.S., especially with smaller firms. We believe the company is a high quality franchise, which at the time of our purchase, featured a reasonable valuation with the potential to benefit from increased capital deployment and improvement in sales. |
| | Conversely, in addition to the sale of Canadian Oil Sands, already mentioned, we sold the Fund’s position in semiconductor bellwether Intel. Its stock showed strong performance during the Reporting Period, but we believe it has limited upside potential moving forward. We also see the relatively flat personal computer market continuing and view such as a possible hindrance in the future. While we still believe the company is a well-run, quality business, we decided to exit the Fund’s position in favor of higher conviction opportunities. |
| | We sold the Fund’s position in diversified financial services institution Citigroup. Our confidence was tested on Citigroup’s results and execution in non-U.S. markets, where it has an outsized exposure relative to its peers. While we still have a favorable long-term view of the company, we believe the market is fully appreciating the company for now. We therefore eliminated the position in favor of companies we believe have greater upside potential. |
| Q | | Were there any notable changes in the Fund’s weightings during the Reporting Period? |
| A | | In constructing the Fund’s portfolio, we focus on picking stocks rather than on making industry or sector bets. We seek to outpace the benchmark index by overweighting stocks that we expect to outperform and underweighting those that we think may lag. Consequently, changes in its sector weights are generally the direct result of individual stock selection or of stock appreciation or depreciation. That said, during the |
8
PORTFOLIO RESULTS
| | Reporting Period, the Fund’s allocations compared to the benchmark index in financials and telecommunication services increased as did its position in cash. The Fund’s exposure to energy and information technology decreased compared to the Russell Index. |
| Q | | How was the Fund positioned relative to its benchmark index at the end of February 2015? |
| A | | At the end of February 2015, the Fund had overweighted positions relative to the Russell Index in the consumer discretionary, telecommunication services and health care sectors. On the same date, the Fund had underweighted positions compared to the Russell Index in materials, energy, consumer staples and utilities and was rather neutrally weighted to the Russell Index in financials, industrials and information technology. |
9
FUND BASICS
Growth and Income Fund
as of February 28, 2015
| | | | | | | | | | |
| | PERFORMANCE REVIEW | |
| | | September 1, 2014–February 28, 2015 | | Fund Total Return
(based on NAV)1 | | | Russell 1000
Value Index2 | |
| | Class A | | | 3.29 | % | | | 3.48 | % |
| | Class C | | | 2.94 | | | | 3.48 | |
| | Institutional | | | 3.54 | | | | 3.48 | |
| | Service | | | 3.25 | | | | 3.48 | |
| | Class IR | | | 3.44 | | | | 3.48 | |
| | | Class R | | | 3.18 | | | | 3.48 | |
| | 1 | | The net asset value (“NAV”) represents the net assets of the class of the Fund (ex-dividend) divided by the total number of shares of the class outstanding. The Fund’s performance reflects the reinvestment of dividends and other distributions. The Fund’s performance does not reflect the deduction of any applicable sales charges. |
| | 2 | | The unmanaged Russell 1000 Value Index (with dividends reinvested) is a market capitalization weighted index of the 1,000 largest U.S. companies with lower price-to-book ratios and lower forecasted growth values. The Index figures do not reflect any deduction of fees, expenses or taxes. It is not possible to invest directly in an index. |
| | | | | | | | | | | | | | | | | | | | |
| | STANDARDIZED TOTAL RETURNS3 |
| | | For the period ended 12/31/14 | | One Year | | | Five Years | | | Ten Years | | | Since Inception | | | Inception Date |
| | Class A | | | 5.19 | % | | | 11.38 | % | | | 5.33 | % | | | 7.13 | % | | 2/5/93 |
| | Class C | | | 9.48 | | | | 11.82 | | | | 5.14 | | | | 3.14 | | | 8/15/97 |
| | Institutional | | | 11.76 | | | | 13.09 | | | | 6.35 | | | | 6.29 | | | 6/3/96 |
| | Service | | | 11.17 | | | | 12.54 | | | | 5.83 | | | | 5.85 | | | 3/6/96 |
| | Class IR | | | 11.61 | | | | 12.94 | | | | N/A | | | | 4.89 | | | 11/30/07 |
| | | Class R | | | 11.03 | | | | 12.38 | | | | N/A | | | | 4.38 | | | 11/30/07 |
| | 3 | | The Standardized Total Returns are average annual total returns as of the most recent calendar quarter-end. They assume reinvestment of all distributions at NAV. These returns reflect a maximum initial sales charge of 5.5% for Class A Shares and the assumed contingent deferred sales charge for Class C Shares (1% if redeemed within 12 months of purchase). Because Institutional, Service, Class IR and Class R Shares do not involve a sales charge, such a charge is not applied to their Standardized Total Returns. |
The returns set forth in the tables above represent past performance. Past performance does not guarantee future results. The Fund’s investment return and principal value will fluctuate so that an investor’s shares, when redeemed, may be worth more or less than their original cost. Current performance may be lower or higher than the performance quoted above. Please visit our web site at www.GSAMFUNDS.com to obtain the most recent month-end returns. Performance reflects fee waivers and/or expense limitations in effect during the periods shown. In their absence, performance would be reduced. Returns do not reflect the deduction of taxes that a shareholder would pay on Fund distributions or the redemption of Fund shares.
10
FUND BASICS
| | | | | | | | | | |
| | EXPENSE RATIOS4 | |
| | | | | Net Expense Ratio (Current) | | | Gross Expense Ratio (Before Waivers) | |
| | Class A | | | 1.14 | % | | | 1.23 | % |
| | Class C | | | 1.89 | | | | 1.98 | |
| | Institutional | | | 0.74 | | | | 0.83 | |
| | Service | | | 1.24 | | | | 1.33 | |
| | Class IR | | | 0.89 | | | | 0.97 | |
| | | Class R | | | 1.39 | | | | 1.48 | |
| | 4 | | The expense ratios of the Fund, both current (net of any fee waivers or expense limitations) and before waivers (gross of any fee waivers or expense limitations) are as set forth above. Pursuant to a contractual arrangement, the Fund’s waivers and/or expense limitations will remain in place through at least December 29, 2015, and prior to such date the investment adviser may not terminate the arrangements without the approval of the Fund’s Board of Trustees. |
| | | | | | | | |
| | TOP TEN HOLDINGS AS OF 2/28/155 |
| | | Holding | | % of Net Assets | | | Line of Business |
| | General Electric Co. | | | 5.3 | % | | Industrial Conglomerates |
| | JPMorgan Chase & Co. | | | 4.5 | | | Commercial Banks |
| | Exxon Mobil Corp. | | | 4.1 | | | Oil, Gas & Consumable Fuels |
| | Pfizer, Inc. | | | 4.0 | | | Pharmaceuticals |
| | Verizon Communications, Inc. | | | 3.6 | | | Diversified Telecommunication Services |
| | Merck & Co., Inc. | | | 3.0 | | | Pharmaceuticals |
| | Prudential Financial, Inc. | | | 2.8 | | | Insurance |
| | Eli Lilly & Co. | | | 2.8 | | | Pharmaceuticals |
| | Medtronic PLC | | | 2.6 | | | Health Care Equipment & Supplies |
| | | The Gap, Inc. | | | 2.6 | | | Specialty Retail |
| | 5 | | The top 10 holdings may not be representative of the Fund’s future investments. |
11
FUND BASICS
|
| FUND VS. BENCHMARK SECTOR ALLOCATIONS6 |
| As of February 28, 2015 |
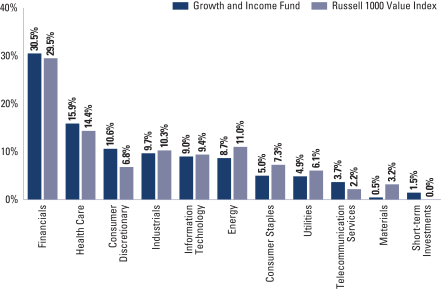
| | 6 | | The Fund is actively managed and, as such, its composition may differ over time. Consequently, the Fund’s overall sector allocations may differ from the percentages contained in the graph above. The graph categorizes investments using the Global Industry Classification Standard (“GICS”), however, the sector classifications used by the portfolio management team may differ from GICS. The percentage shown for each investment category reflects the value of investments in that category as a percentage of market value. Short-term investments represent repurchase agreements. The graph depicts the Fund’s investments but may not represent the Fund’s market exposure due to the exclusion of certain derivatives, if any, as listed in the Additional Investment Information section of the Schedule of Investments. |
12
PORTFOLIO RESULTS
Goldman Sachs Large Cap Value Fund
Portfolio Composition
The Fund invests, under normal circumstances, at least 80% of its total net assets in a diversified portfolio of equity investments in large-cap U.S. issuers with public stock market capitalizations within the range of the market capitalization of companies constituting the Russell 1000® Value Index at the time of investment. The Fund seeks its investment objective of long-term capital appreciation by investing in value opportunities that the Goldman Sachs Value Equity Investment Team defines as companies with identifiable competitive advantages whose intrinsic value is not reflected in the stock price. Although the Fund will invest primarily in publicly traded U.S. securities, including preferred and convertible securities, it may invest up to 20% of its total net assets in foreign securities, including securities of issuers in emerging countries and securities quoted in foreign currencies. The Fund may also invest up to 20% of its total net assets in fixed income securities, such as government, corporate and bank debt obligations.
Portfolio Management Discussion and Analysis
Below, the Goldman Sachs Value Equity Investment Team discusses the Goldman Sachs Large Cap Value Fund’s (the “Fund”) performance and positioning for the six-month period ended February 28, 2015 (the “Reporting Period”).
| Q | | How did the Fund perform during the Reporting Period? |
| A | | During the Reporting Period, the Fund’s Class A, C, Institutional, Service, IR and R Shares generated cumulative total returns, without sales charges, of 2.30%, 1.89%, 2.52%, 2.22%, 2.42% and 2.18%, respectively. These returns compare to the 3.48% cumulative total return of the Fund’s benchmark, the Russell 1000® Value Index (with dividends reinvested) (the “Russell Index”), during the same period. |
| Q | | What key factors were responsible for the Fund’s performance during the Reporting Period? |
| A | | The Fund generated absolute gains, but stock selection overall detracted from its performance relative to the Russell Index during the Reporting Period. Sector allocation as a whole contributed positively to the Fund’s results. |
| Q | | Which equity market sectors most significantly affected Fund performance? |
| A | | Detracting most from the Fund’s performance relative to the Russell Index were financials, energy and consumer discretionary, where stock selection was comparatively weak. Effective stock selection in the health care, consumer staples and utilities sectors helped the Fund’s relative results most. Having an underweighted allocation to telecommunication services, which lagged the Russell Index during the Reporting Period, also added value. |
| Q | | Which stocks detracted significantly from the Fund’s performance during the Reporting Period? |
| A | | Detracting most from the Fund’s results relative to its benchmark index were positions in three oil and gas exploration and production companies — Southwestern Energy, Apache and Devon Energy. |
| | Southwestern Energy was a top detractor from the Fund’s relative performance, driven by weaker natural gas prices. Despite the company’s underperformance, we believe its management has executed well on its strategy and, at the end of the Reporting Period, the company was attractively valued relative to its peers. Further, at the end of the Reporting Period, we continued to believe that Southwestern Energy has an underappreciated resource base, specifically in the Marcellus and Fayetteville shales, and that its newly acquired assets enhance the company’s position and growth opportunities. Additionally, we remained positive on the company’s operational leverage to higher natural gas prices and encouraged by its management team’s commitment to disciplined growth, costs reductions and shareholder returns. |
| | Apache’s shares declined along with the drop in energy prices during the Reporting Period. Still, during 2014, Apache announced the sale of $1.4 billion of non-core assets and the exit of liquid natural gas projects, which consumed capital. We view these sales of non-core assets favorably, as we feel |
13
PORTFOLIO RESULTS
| | it demonstrates Apache’s commitment to focus on its core business, which we believe has the potential to generate higher returns on investment and more predictable growth. Overall, at the end of the Reporting Period, we viewed its shares as attractively valued given Apache’s balance sheet strength, improving free cash flow generation and potential for increased shareholder distributions. |
| | Similarly, lower oil prices weighed negatively on Devon Energy’s shares and overshadowed the company’s strong results. Indeed, despite its underperformance, we continued to believe at the end of the Reporting Period that the value of Devon Energy’s large North American asset base was not fully recognized at its then current market price. We also remained positive on a number of actions the company has taken to unlock shareholder value. Finally, we believe Devon Energy maintains a strong balance sheet, which could help expedite the development of its oil properties going forward. |
| Q | | What were some of the Fund’s best-performing individual stocks? |
| A | | The Fund benefited most relative to the Russell Index from positions in grocery chain Kroger, medical device company Medtronic and pharmaceuticals company Pfizer. |
| | Kroger reported positive quarterly earnings results driven by solid execution, which helped the company maintain its positive momentum and drive its shares higher. In line with our view, Kroger was able to gain additional market share from its peers. We also found it positive that its management repurchased its shares at a greater than anticipated rate during the Reporting Period. In our view, Kroger has consistently been able to gain market share, driven by a focus on low prices, high convenience and healthy choices. At the end of the Reporting Period, its margins appeared to have stabilized. We believe its margins may begin to expand following many years of investment to improve its competitive positioning. We also believe its acquisition of Harris Teeter Supermarkets could provide synergies and boost its earnings per share over the next two to three years. We believe that further industry consolidation could be beneficial for the company due to its strong market share and stable cash flows. |
| | Following weakness related to an announced corporate tax inversion regulation and its resulting impact on Medtronic’s proposed acquisition of fellow medical device manufacturer Covidien, shares of Medtronic traded higher as the company’s management reaffirmed its commitment to the acquisition and reiterated the transaction’s potential benefits regardless of the new tax guidelines. We believe the deal between Medtronic and Covidien has the potential to provide Medtronic with strengthened revenue growth, earnings accretion driven by substantial cost synergies, improved free cash flow flexibility as well as higher returns on invested capital. In addition, we believe the potential combined entity’s increasingly diversified business could benefit from the continued growth of overall health care spending along with an expansion in medical device utilization as reimbursement and regulatory uncertainties subside. |
| | Pfizer’s shares appreciated as the market started to reflect what we consider to be the true value of its product pipeline. Additionally, Pfizer’s shares reacted positively to the Food and Drug Administration’s (“FDA”) accelerated approval of its new drug Ibrance as well as early enthusiasm regarding its immune-oncology assets. Also, share price appreciation was supported by its recently announced acquisition of Hospira, which we believe may well strengthen its biosimilars pipeline. At the end of the Reporting Period, we continued to believe Pfizer has strong fundamentals, a number of growth opportunities and an attractive valuation. Indeed, in our view, Pfizer’s pipeline was undervalued at the end of the Reporting Period, and we expect its management to continue to highlight the pipeline value through clinical success. Pfizer also has a strong, highly rated balance sheet with more than $33 billion of cash that we believe provides the company with the financial flexibility to invest for growth and return capital to shareholders. The company also pays what we view as an attractive dividend. |
| Q | | How did the Fund use derivatives and similar instruments during the Reporting Period? |
| A | | During the Reporting Period, we did not use derivatives as part of an active management strategy. |
| Q | | Did the Fund make any significant purchases or sales during the Reporting Period? |
| A | | We initiated a Fund position in health care products manufacturer Johnson & Johnson after its stock sold off due in part to lower than expected 2015 guidance from its management. Its stock also declined because the market seemed to become incrementally concerned about the company’s pharmaceutical business segment growth given the risk of losing its Remicade patent. At the time of purchase, we believed Johnson & Johnson had become attractively valued relative to its peers. Overall, we believe that Johnson & Johnson is a quality company with strong |
14
PORTFOLIO RESULTS
| | management that we expect can overcome these issues and maintain its pharmaceuticals segment growth. |
| | We established a Fund position in snack food and beverage provider Mondelez International. We believe the company is positioned well within its space, as we view the company as attractively valued when compared to its competitors. We also believe the company shows potential for improvements in the biscuit business in China and to be the beneficiary of a better pricing environment in European chocolate. We are encouraged by the company management team’s efforts to create shareholder value, as demonstrated recently through the implementation of a cost-cutting initiative. Overall, we view Mondelez International as an attractively valued company with a strong management team and compelling upside potential. |
| | Conversely, we sold the Fund’s position in beauty products manufacturer Estee Lauder. Our exit was motivated by slowing demand in the Hong Kong retail sector relating to the protests, along with the slowing of the China market in general. We felt that Estee Lauder was no longer a compelling position and chose to reallocate the capital into companies with what we considered to have more attractive risk/reward profiles. |
| | We exited the Fund’s position in semiconductor bellwether Intel. Its stock showed strong performance during the Reporting Period, but we believe it has limited upside potential moving forward. While we still believe the company is a well-run, quality business, we decided to exit the Fund’s position in favor of higher conviction opportunities. |
| Q | | Were there any notable changes in the Fund’s weightings during the Reporting Period? |
| A | | In constructing the Fund’s portfolio, we focus on picking stocks rather than on making industry or sector bets. We seek to outpace the benchmark index by overweighting stocks that we expect to outperform and underweighting those that we think may lag. Consequently, changes in its sector weights are generally the direct result of individual stock selection or of stock appreciation or depreciation. That said, during the Reporting Period, the Fund’s allocation compared to the benchmark index in consumer discretionary increased as did its position in cash. The Fund’s exposure to health care and industrials decreased compared to the Russell Index. |
| Q | | How was the Fund positioned relative to its benchmark index at the end of February 2015? |
| A | | At the end of February 2015, the Fund had overweighted positions relative to the Russell Index in the consumer discretionary and information technology sectors. On the same date, the Fund had underweighted positions compared to the Russell Index in financials, materials, utilities and energy and was rather neutrally weighted to the Russell Index in consumer staples, health care, industrials and telecommunication services. |
| Q | | Did the Fund make any significant purchases or sales during the Reporting Period? |
| A | | We initiated a Fund position in health care products manufacturer Johnson & Johnson after its stock sold off due in part to lower than expected 2015 guidance from its management. Its stock also declined because the market seemed to become incrementally concerned about the company’s pharmaceutical business segment growth given the risk of losing its Remicade patent. At the time of purchase, we believed Johnson & Johnson had become attractively valued relative to its peers. Overall, we believe that Johnson & Johnson is a quality company with strong management that we expect can overcome these issues and maintain its pharmaceuticals segment growth. |
| | We established a Fund position in snack food and beverage provider Mondelez International. We believe the company is positioned well within its space, as we view the company as attractively valued when compared to its competitors. We also believe the company shows potential for improvements in the biscuit business in China and to be the beneficiary of a better pricing environment in European chocolate. We are encouraged by the company management team’s efforts to create shareholder value, as demonstrated recently through the implementation of a cost-cutting initiative. Overall, we view Mondelez International as an attractively valued company with a strong management team and compelling upside potential. |
| | Conversely, we sold the Fund’s position in beauty products manufacturer Estee Lauder. Our exit was motivated by slowing demand in the Hong Kong retail sector relating to the protests, along with the slowing of the China market in general. We felt that Estee Lauder was no longer a compelling position and chose to reallocate the capital into companies with what we considered to have more attractive risk/reward profiles. |
15
PORTFOLIO RESULTS
| | We exited the Fund’s position in semiconductor bellwether Intel. Its stock showed strong performance during the Reporting Period, but we believe it has limited upside potential moving forward. While we still believe the company is a well-run, quality business, we decided to exit the Fund’s position in favor of higher conviction opportunities. |
| Q | | Were there any notable changes in the Fund’s weightings during the Reporting Period? |
| A | | In constructing the Fund’s portfolio, we focus on picking stocks rather than on making industry or sector bets. We seek to outpace the benchmark index by overweighting stocks that we expect to outperform and underweighting those that we think may lag. Consequently, changes in its sector weights are generally the direct result of individual stock selection or of stock appreciation or depreciation. That said, during the Reporting Period, the Fund’s allocation compared to the benchmark index in consumer discretionary increased as did its position in cash. The Fund’s exposure to health care and industrials decreased compared to the Russell Index. |
| Q | | How was the Fund positioned relative to its benchmark index at the end of February 2015? |
| A | | At the end of February 2015, the Fund had overweighted positions relative to the Russell Index in the consumer discretionary and information technology sectors. On the same date, the Fund had underweighted positions compared to the Russell Index in financials, materials, utilities and energy and was rather neutrally weighted to the Russell Index in consumer staples, health care, industrials and telecommunication services. |
16
FUND BASICS
Large Cap Value Fund
as of February 28, 2015
| | | | | | | | | | |
| | PERFORMANCE REVIEW | | | | | | | | |
| | | September 1, 2014–February 28, 2015 | | Fund Total Return
(based on NAV)1 | | | Russell 1000
Value Index2 | |
| | Class A | | | 2.30 | % | | | 3.48 | % |
| | Class C | | | 1.89 | | | | 3.48 | |
| | Institutional | | | 2.52 | | | | 3.48 | |
| | Service | | | 2.22 | | | | 3.48 | |
| | Class IR | | | 2.42 | | | | 3.48 | |
| | | Class R | | | 2.18 | | | | 3.48 | |
| | 1 | | The net asset value (“NAV”) represents the net assets of the class of the Fund (ex-dividend) divided by the total number of shares of the class outstanding. The Fund’s performance reflects the reinvestment of dividends and other distributions. The Fund’s performance does not reflect the deduction of any applicable sales charges. |
| | 2 | | The unmanaged Russell 1000 Value Index (with dividends reinvested) is a market capitalization weighted index of the 1,000 largest U.S. companies with lower price-to-book ratios and lower forecasted growth values. The Index figures do not reflect any deduction of fees, expenses or taxes. It is not possible to invest directly in an index. |
| | | | | | | | | | | | | | | | | | | | |
| | STANDARDIZED TOTAL RETURNS3 |
| | | For the period ended 12/31/14 | | One Year | | | Five Years | | | Ten Years | | | Since Inception | | | Inception Date |
| | Class A | | | 6.09 | % | | | 11.61 | % | | | 5.80 | % | | | 5.95 | % | | 12/15/99 |
| | Class C | | | 10.37 | | | | 12.05 | | | | 5.62 | | | | 5.55 | | | 12/15/99 |
| | Institutional | | | 12.73 | | | | 13.34 | | | | 6.84 | | | | 6.76 | | | 12/15/99 |
| | Service | | | 12.20 | | | | 12.78 | | | | 6.30 | | | | 6.27 | | | 12/15/99 |
| | Class IR | | | 12.56 | | | | 13.17 | | | | N/A | | | | 5.53 | | | 11/30/07 |
| | | Class R | | | 11.97 | | | | 12.59 | | | | N/A | | | | 5.02 | | | 11/30/07 |
| | 3 | | The Standardized Total Returns are average annual total returns as of the most recent calendar quarter-end. They assume reinvestment of all distributions at NAV. These returns reflect a maximum initial sales charge of 5.5% for Class A Shares and the assumed contingent deferred sales charge for Class C Shares (1% if redeemed within 12 months of purchase). Because Institutional, Service, Class IR and Class R Shares do not involve a sales charge, such a charge is not applied to their Standardized Total Returns. |
The returns set forth in the tables above represent past performance. Past performance does not guarantee future results. The Fund’s investment return and principal value will fluctuate so that an investor’s shares, when redeemed, may be worth more or less than their original cost. Current performance may be lower or higher than the performance quoted above. Please visit our web site at www.GSAMFUNDS.com to obtain the most recent month-end returns. Performance reflects fee waivers and/or expense limitations in effect during the periods shown. In their absence, performance would be reduced. Returns do not reflect the deduction of taxes that a shareholder would pay on Fund distributions or the redemption of Fund shares.
17
FUND BASICS
| | | | | | | | | | |
| | EXPENSE RATIOS4 | |
| | | | | Net Expense Ratio (Current) | | | Gross Expense Ratio (Before Waivers) | |
| | Class A | | | 1.16 | % | | | 1.20 | % |
| | Class C | | | 1.91 | | | | 1.95 | |
| | Institutional | | | 0.76 | | | | 0.80 | |
| | Service | | | 1.26 | | | | 1.30 | |
| | Class IR | | | 0.91 | | | | 0.95 | |
| | | Class R | | | 1.41 | | | | 1.45 | |
| | 4 | | The expense ratios of the Fund, both current (net of any fee waivers or expense limitations) and before waivers (gross of any fee waivers or expense limitations) are as set forth above. Pursuant to a contractual arrangement, the Fund’s waivers and/or expense limitations will remain in place through at least December 29, 2015, and prior to such date the investment adviser may not terminate the arrangements without the approval of the Fund’s Board of Trustees. |
| | | | | | | | |
| | TOP TEN HOLDINGS AS OF 2/28/155 |
| | | Holding | | % of Net Assets | | | Line of Business |
| | General Electric Co. | | | 5.1 | % | | Industrial Conglomerates |
| | JPMorgan Chase & Co. | | | 4.2 | | | Commercial Banks |
| | Exxon Mobil Corp. | | | 3.6 | | | Oil, Gas & Consumable Fuels |
| | Bank of America Corp. | | | 3.5 | | | Commercial Banks |
| | Pfizer, Inc. | | | 3.3 | | | Pharmaceuticals |
| | American International Group, Inc. | | | 3.0 | | | Insurance |
| | Prudential Financial, Inc. | | | 2.8 | | | Insurance |
| | EMC Corp. | | | 2.5 | | | Computers & Peripherals |
| | Devon Energy Corp. | | | 2.4 | | | Oil, Gas & Consumable Fuels |
| | | Medtronic PLC | | | 2.3 | | | Health Care Equipment & Supplies |
| | 5 | | The top 10 holdings may not be representative of the Fund’s future investments. |
18
FUND BASICS
|
| FUND VS. BENCHMARK SECTOR ALLOCATIONS6 |
| As of February 28, 2015 |
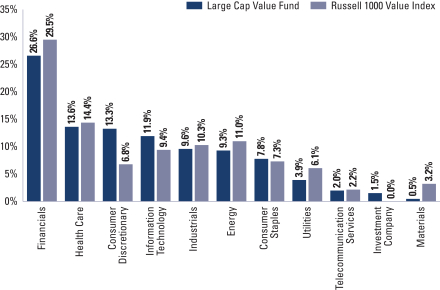
| | 6 | | The Fund is actively managed and, as such, its composition may differ over time. Consequently, the Fund’s overall sector allocations may differ from the percentages contained in the graph above. The graph categorizes investments using the Global Industry Classification Standard (“GICS”), however, the sector classifications used by the portfolio management team may differ from GICS. The percentage shown for each investment category reflects the value of investments in that category as a percentage of market value. The graph depicts the Fund’s investments but may not represent the Fund’s market exposure due to the exclusion of certain derivatives, if any, as listed in the Additional Investment Information section of the Schedule of Investments. |
19
PORTFOLIO RESULTS
Goldman Sachs Mid Cap Value Fund
Portfolio Composition
The Fund invests, under normal circumstances, at least 80% of its total net assets in a diversified portfolio of equity investments in mid-cap issuers with public stock market capitalizations within the range of the market capitalization of companies constituting the Russell Midcap® Value Index at the time of investment. The Fund seeks its investment objective of long-term capital appreciation by investing in mid-cap U.S. equity investments that are believed to be undervalued or undiscovered by the marketplace. Although the Fund will invest primarily in publicly traded U.S. securities, it may invest up to 25% of its total net assets in foreign securities, including securities of issuers in emerging countries and securities quoted in foreign currencies. The Fund may also invest in the aggregate up to 20% of its total net assets in companies with public stock market capitalizations outside the range of companies constituting the Russell Midcap® Value Index at the time of investment and in fixed income securities, such as government, corporate and bank debt obligations.
Portfolio Management Discussion and Analysis
Below, the Goldman Sachs Value Equity Investment Team discusses the Goldman Sachs Mid Cap Value Fund’s (the “Fund”) performance and positioning for the six-month period ended February 28, 2015 (the “Reporting Period”).
| Q | | How did the Fund perform during the Reporting Period? |
| A | | During the Reporting Period, the Fund’s Class A, C, Institutional, Service, IR and R Shares generated cumulative total returns, without sales charges, of 3.62%, 3.24%, 3.80%, 3.56%, 3.73% and 3.47%, respectively. These returns compare to the 4.68% cumulative total return of the Fund’s benchmark, the Russell Midcap® Value Index (with dividends reinvested) (the “Russell Index”), during the same period. |
| Q | | What key factors were responsible for the Fund’s performance during the Reporting Period? |
| A | | The Fund generated absolute gains, but sector allocation overall detracted from its performance relative to the Russell Index during the Reporting Period. Stock selection as a whole contributed positively, albeit modestly, to relative results. |
| Q | | Which equity market sectors most significantly affected Fund performance? |
| A | | Detracting from the Fund’s performance most relative to the Russell Index was stock selection in the financials and industrials sectors. Having an overweighted allocation to the poorly performing energy sector and exposure to cash during months when the Russell Index gained ground also hurt. Effective stock selection in the consumer staples, health care and information technology sectors helped the Fund’s relative results most. |
| Q | | Which stocks detracted significantly from the Fund’s performance during the Reporting Period? |
| A | | Detracting most from the Fund’s results relative to its benchmark index were positions in three oil and gas exploration and production companies — Southwestern Energy, QEP Resources and Cimarex Energy. |
| | Southwestern Energy was a top detractor from the Fund’s relative performance, driven by weaker natural gas prices. Despite the company’s underperformance, we believe its management has executed well on its strategy and, at the end of the Reporting Period, the company was attractively valued relative to its peers. Further, at the end of the Reporting Period, we continued to believe that Southwestern Energy has an underappreciated resource base, specifically in the Marcellus and Fayetteville shales, and that its newly acquired assets enhance the company’s position and growth opportunities. Additionally, we remained positive on the company’s operational leverage to higher natural gas prices and encouraged by its management team’s commitment to disciplined growth, costs reductions and shareholder returns. |
| | Although QEP Resources beat consensus earnings estimates and successfully sold its midstream business during the fourth quarter of 2014, shares of the company declined as a result of weaker energy prices. (The midstream component of the energy industry is usually defined as those companies providing products or services that help link the supply side, i.e., energy producers, and the demand side, i.e., energy end-users, for any type of energy commodity. Midstream |
20
PORTFOLIO RESULTS
| | businesses can include, but are not limited to, those that process, store, market and transport various energy commodities.) While we continue to have a positive long-term outlook on QEP Resources, we exited the position in efforts to reduce the Fund’s oil exposure and reallocated the proceeds into a higher conviction name. |
| | Similarly, shares of Cimarex Energy declined as lower oil prices negatively weighed on investor sentiment. Also, Cimarex Energy has relatively limited hedges to the dropping oil prices in place, so this means it may have to begin cutting its capital expenditures aggressively, which would likely, in turn, signify a drop in production. The company’s strong production growth outlook preceding the oil price drop, high quality Permian assets and strong balance sheet had attracted us to the name. However, we sold the Fund’s position in Cimarex Energy during the Reporting Period based on our concerns about what we believed to be an impending drop in production and a premium valuation. |
| Q | | What were some of the Fund’s best-performing individual stocks? |
| A | | The Fund benefited most relative to the Russell Index from positions in global specialty health care company Endo International, grocery chain Kroger and global health service organization Cigna. |
| | Shares of Endo International rose during the Reporting Period, as the company’s acquisition of Auxilium Pharmaceuticals was finalized, a deal that we believe will be accretive moving forward. The company also reported strong third quarter 2014 earnings, which had a positive impact on its share price. At the end of the Reporting Period, we remained encouraged by Endo International’s merger and acquisition activity and by what we consider to be its strong product pipeline and experienced management team. We thus believed the stock to be compelling from a risk/reward perspective. Indeed, despite strong performance during the Reporting Period, we continued to view its shares as attractively valued relative to its peers. |
| | Kroger reported positive quarterly earnings results driven by solid execution, which helped the company maintain its positive momentum and drive its shares higher. In line with our view, Kroger was able to gain additional market share from its peers. We also found it positive that its management repurchased its shares at a greater than anticipated rate during the Reporting Period. In our view, Kroger has consistently been able to gain market share, driven by a focus on low prices, high convenience and healthy choices. At the end of the Reporting Period, its margins appeared to have stabilized. We believe its margins may begin to expand following many years of investment to improve its competitive positioning. We also believe its acquisition of Harris Teeter Supermarkets could provide synergies and boost its earnings per share over the next two to three years. We believe that further industry consolidation could be beneficial for the company due to its strong market share and stable cash flows. |
| | Shares of Cigna benefited during the Reporting Period from better than expected results in its third and fourth quarter 2014 earnings and from better than expected earnings guidance for 2015. According to its statements, the company expected to double its size over the next seven to eight years through organic growth and future capital deployment. We also see upside potential in the company’s margin guidance for its Medicare Advantage and individual exchange portfolios. |
| Q | | How did the Fund use derivatives and similar instruments during the Reporting Period? |
| A | | During the Reporting Period, we did not use derivatives as part of an active management strategy. |
| Q | | Did the Fund make any significant purchases or sales during the Reporting Period? |
| A | | We initiated a Fund position in Broadcom, a company that provides semiconductor solutions for wired and wireless communications. Broadcom is a market leader in merchant silicon for Ethernet switches, which we believe should benefit both from leading network vendors choosing merchant silicon over custom application-specific integrated circuits and from the secular growth in white box switches, which typically use merchant silicon. We are also positive on its management’s recent decisions to take steps to maximize shareholder value, as demonstrated by the decisions to exit the baseband business and align management incentives with shareholders’ interests. Despite the stock’s strong performance during the Reporting Period, we believe its shares remained attractively valued at the end of February 2015. |
| | We established a Fund position in Devon Energy. Despite its recent underperformance, we believe the value of Devon Energy’s large North American asset base is not fully recognized at its market price at the time of our purchase, and we are positive on a number of actions the company has taken to unlock shareholder value. Further, we believe Devon |
21
PORTFOLIO RESULTS
| | Energy maintains a strong balance sheet, which could help expedite the development of its oil properties going forward. |
| | Conversely, in addition to the sales of Cimarex Energy and QEP Resources, already mentioned, we exited the Fund’s position in Agilent Technologies, a leading global life science and analytical measurement company. While we were optimistic about Agilent Technology’s health care business, we eliminated the Fund position due to the company’s exposure to energy end-markets, which we felt may lead to increased downside risk potential. |
| Q | | Were there any notable changes in the Fund’s weightings during the Reporting Period? |
| A | | In constructing the Fund’s portfolio, we focus on picking stocks rather than on making industry or sector bets. We seek to outpace the benchmark index by overweighting stocks that we expect to outperform and underweighting those that we think may lag. Consequently, changes in its sector weights are generally the direct result of individual stock selection or of stock appreciation or depreciation. That said, during the Reporting Period, the Fund’s allocations compared to the Russell Index in consumer discretionary, consumer staples and information technology increased as did its position in cash. The Fund’s exposure to the energy, financials, health care, industrials and materials sectors decreased compared to the Russell Index. |
| Q | | How was the Fund positioned relative to its benchmark index at the end of February 2015? |
| A | | At the end of February 2015, the Fund had overweighted positions relative to the Russell Index in the consumer discretionary, consumer staples, information technology and energy sectors. On the same date, the Fund had underweighted positions compared to the Russell Index in financials, utilities and materials and was rather neutrally weighted to the Russell Index in health care and industrials. The Fund had no allocation to telecommunication services at the end of February 2015. |
| Q | | Did the Fund make any significant purchases or sales during the Reporting Period? |
| A | | We initiated a Fund position in Broadcom, a company that provides semiconductor solutions for wired and wireless communications. Broadcom is a market leader in merchant silicon for Ethernet switches, which we believe should benefit both from leading network vendors choosing merchant silicon over custom application-specific integrated circuits and from the secular growth in white box switches, which typically use merchant silicon. We are also positive on its management’s recent decisions to take steps to maximize shareholder value, as demonstrated by the decisions to exit the baseband business and align management incentives with shareholders’ interests. Despite the stock’s strong performance during the Reporting Period, we believe its shares remained attractively valued at the end of February 2015. |
| | We established a Fund position in Devon Energy. Despite its recent underperformance, we believe the value of Devon Energy’s large North American asset base is not fully recognized at its market price at the time of our purchase, and we are positive on a number of actions the company has taken to unlock shareholder value. Further, we believe Devon Energy maintains a strong balance sheet, which could help expedite the development of its oil properties going forward. |
| | Conversely, in addition to the sales of Cimarex Energy and QEP Resources, already mentioned, we exited the Fund’s position in Agilent Technologies, a leading global life science and analytical measurement company. While we were optimistic about Agilent Technology’s health care business, we eliminated the Fund position due to the company’s exposure to energy end-markets, which we felt may lead to increased downside risk potential. |
| Q | | Were there any notable changes in the Fund’s weightings during the Reporting Period? |
| A | | In constructing the Fund’s portfolio, we focus on picking stocks rather than on making industry or sector bets. We seek to outpace the benchmark index by overweighting stocks that we expect to outperform and underweighting those that we think may lag. Consequently, changes in its sector weights are generally the direct result of individual stock selection or of stock appreciation or depreciation. That said, during the Reporting Period, the Fund’s allocations compared to the Russell Index in consumer discretionary, consumer staples and information technology increased as did its position in cash. The Fund’s exposure to the energy, financials, health care, industrials and materials sectors decreased compared to the Russell Index. |
22
PORTFOLIO RESULTS
| Q | | How was the Fund positioned relative to its benchmark index at the end of February 2015? |
| A | | At the end of February 2015, the Fund had overweighted positions relative to the Russell Index in the consumer discretionary, consumer staples, information technology and energy sectors. On the same date, the Fund had underweighted positions compared to the Russell Index in financials, utilities and materials and was rather neutrally weighted to the Russell Index in health care and industrials. The Fund had no allocation to telecommunication services at the end of February 2015. |
23
FUND BASICS
Mid Cap Value Fund
as of February 28, 2015
| | | | | | | | | | |
| | PERFORMANCE REVIEW | | | | | | | | |
| | | September 1, 2014–February 28, 2015 | | Fund Total Return
(based on NAV)1 | | | Russell Midcap
Value Index2 | |
| | Class A | | | 3.62 | % | | | 4.68 | % |
| | Class C | | | 3.24 | | | | 4.68 | |
| | Institutional | | | 3.80 | | | | 4.68 | |
| | Service | | | 3.56 | | | | 4.68 | |
| | Class IR | | | 3.73 | | | | 4.68 | |
| | | Class R | | | 3.47 | | | | 4.68 | |
| | 1 | | The net asset value (“NAV”) represents the net assets of the class of the Fund (ex-dividend) divided by the total number of shares of the class outstanding. The Fund’s performance reflects the reinvestment of dividends and other distributions. The Fund’s performance does not reflect the deduction of any applicable sales charges. |
| | 2 | | The Russell Midcap Value Index (with dividends reinvested) is an unmanaged index of common stock prices that measures the performance of those Russell Midcap companies with lower price-to-book ratios and lower forecasted growth values. The Index figures do not reflect any deduction for fees, expenses or taxes. It is not possible to invest directly in an index. |
| | | | | | | | | | | | | | | | | | | | |
| | STANDARDIZED TOTAL RETURNS3 |
| | | For the period ended 12/31/14 | | One Year | | | Five Years | | | Ten Years | | | Since Inception | | | Inception Date |
| | Class A | | | 7.01 | % | | | 14.19 | % | | | 8.11 | % | | | 9.25 | % | | 8/15/97 |
| | Class C | | | 11.28 | | | | 14.63 | | | | 7.91 | | | | 8.80 | | | 8/15/97 |
| | Institutional | | | 13.71 | | | | 15.96 | | | | 9.16 | | | | 11.94 | | | 8/1/95 |
| | Service | | | 13.15 | | | | 15.39 | | | | 8.62 | | | | 9.64 | | | 7/18/97 |
| | Class IR | | | 13.55 | | | | 15.80 | | | | N/A | | | | 8.43 | | | 11/30/07 |
| | | Class R | | | 12.97 | | | | 15.21 | | | | N/A | | | | 17.23 | | | 1/6/09 |
| | 3 | | The Standardized Total Returns are average annual total returns as of the most recent calendar quarter-end. They assume reinvestment of all distributions at NAV. These returns reflect a maximum initial sales charge of 5.5% for Class A Shares and the assumed contingent deferred sales charge for Class C Shares (1% if redeemed within 12 months of purchase). Because Institutional, Service, Class IR and Class R Shares do not involve a sales charge, such a charge is not applied to their Standardized Total Returns. |
The returns set forth in the tables above represent past performance. Past performance does not guarantee future results. The Fund’s investment return and principal value will fluctuate so that an investor’s shares, when redeemed, may be worth more or less than their original cost. Current performance may be lower or higher than the performance quoted above. Please visit our web site at www.GSAMFUNDS.com to obtain the most recent month-end returns. Performance reflects fee waivers and/or expense limitations in effect during the periods shown. In their absence, performance would be reduced. Returns do not reflect the deduction of taxes that a shareholder would pay on Fund distributions or the redemption of Fund shares.
24
FUND BASICS
| | | | | | | | | | |
| | EXPENSE RATIOS4 | |
| | | | | Net Expense Ratio (Current) | | | Gross Expense Ratio (Before Waivers) | |
| | Class A | | | 1.14 | % | | | 1.14 | % |
| | Class C | | | 1.89 | | | | 1.89 | |
| | Institutional | | | 0.74 | | | | 0.74 | |
| | Service | | | 1.24 | | | | 1.24 | |
| | Class IR | | | 0.89 | | | | 0.89 | |
| | | Class R | | | 1.39 | | | | 1.39 | |
| | 4 | | The expense ratios of the Fund, both current (net of applicable fee waivers and/or expense limitations) and before waivers (gross of applicable fee waivers and/or expense limitations) are as set forth above according to the most recently available Prospectus for the Fund and may differ from the expense ratios disclosed in the Financial Highlights in this report. |
| | | | | | | | |
| | TOP TEN HOLDINGS AS OF 2/28/155 |
| | | Holding | | % of Net Assets | | | Line of Business |
| | Cigna Corp. | | | 2.0 | % | | Health Care Providers & Services |
| | Sempra Energy | | | 1.9 | | | Multi-Utilities |
| | Navient Corp. | | | 1.9 | | | Consumer Finance |
| | Lincoln National Corp. | | | 1.9 | | | Insurance |
| | Brixmor Property Group, Inc. | | | 1.6 | | | Real Estate Investment Trusts |
| | Broadcom Corp. Class A | | | 1.6 | | | Semiconductors & Semiconductor
Equipment |
| | Endo International PLC | | | 1.6 | | | Pharmaceuticals |
| | The Gap, Inc. | | | 1.5 | | | Specialty Retail |
| | FirstEnergy Corp. | | | 1.5 | | | Electric Utilities |
| | | Huntington Bancshares, Inc | | | 1.5 | | | Commercial Banks |
| | 5 | | The top 10 holdings may not be representative of the Fund’s future investments. |
25
FUND BASICS
|
| FUND VS. BENCHMARK SECTOR ALLOCATIONS6 |
| As of February 28, 2015 |
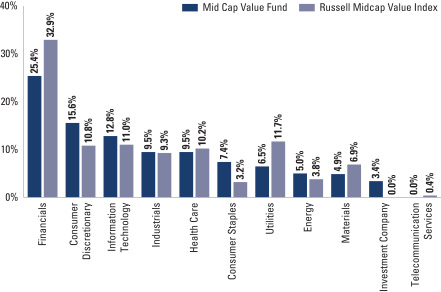
| | 6 | | The Fund is actively managed and, as such, its composition may differ over time. Consequently, the Fund’s overall sector allocations may differ from the percentages contained in the graph above. The graph categorizes investments using the Global Industry Classification Standard (“GICS”), however, the sector classifications used by the portfolio management team may differ from GICS. The percentage shown for each investment category reflects the value of investments in that category as a percentage of market value. The graph depicts the Fund’s investments but may not represent the Fund’s market exposure due to the exclusion of certain derivatives, if any, as listed in the Additional Investment Information section of the Schedule of Investments. |
26
PORTFOLIO RESULTS
Goldman Sachs Small Cap Value Fund
Portfolio Composition
The Fund invests, under normal circumstances, at least 80% of its total net assets in a diversified portfolio of equity investments in small-cap issuers with public stock market capitalizations within the range of the market capitalization of companies constituting the Russell 2000® Value Index at the time of investment. Under normal circumstances, the Fund’s investment horizon for ownership of stocks will be two to three years. The Fund seeks its investment objective of long-term capital appreciation by investing in small-cap U.S. equity investments that are believed to be undervalued or undiscovered by the marketplace. Although the Fund will invest primarily in publicly traded U.S. securities, it may invest up to 25% of its total net assets in foreign securities, including securities of issuers in emerging countries and securities quoted in foreign currencies. The Fund may also invest in the aggregate up to 20% of its total net assets in companies with public stock market capitalizations outside the range of companies constituting the Russell 2000® Value Index at the time of investment and in fixed income securities, such as government, corporate and bank debt obligations.
Portfolio Management Discussion and Analysis
Below, the Goldman Sachs Value Equity Investment Team discusses the Goldman Sachs Small Cap Value Fund’s (the “Fund”) performance and positioning for the six-month period ended February 28, 2015 (the “Reporting Period”).
| Q | | How did the Fund perform during the Reporting Period? |
| A | | During the Reporting Period, the Fund’s Class A, C, Institutional, Service, IR and R Shares generated cumulative total returns, without sales charges, of 3.95%, 3.56%, 4.14%, 3.89%, 4.06% and 3.81%, respectively. These returns compare to the 2.31% cumulative total return of the Fund’s benchmark, the Russell 2000® Value Index (with dividends reinvested) (the “Russell Index”), during the same period. |
| Q | | What key factors were responsible for the Fund’s performance during the Reporting Period? |
| A | | Stock selection overall contributed most to the Fund’s performance relative to the Russell Index during the Reporting Period. |
| Q | | Which equity market sectors most significantly affected Fund performance? |
| A | | Effective stock selection in the consumer discretionary, energy and financials sectors helped the Fund’s performance most relative to the Russell Index. Detracting from the Fund’s relative results most was weak stock selection in the health care and telecommunication services sectors, having an overweighted allocation to the poorly performing materials sector and having exposure to cash during a Reporting Period when the Russell Index gained ground. |
| Q | | What were some of the Fund’s best-performing individual stocks? |
| A | | The Fund benefited most relative to the Russell Index from positions in casual restaurant operator and franchiser Jack in the Box, oil and gas exploration and production company SM Energy and lodging resort Diamond Resorts International. |
| | | Jack in the Box operates and franchises Jack in the Box and Qdoba Mexican Grill restaurants. During the Reporting Period, Jack in the Box reported two consecutive quarters of earnings that exceeded consensus expectations, benefiting from robust same-store sales growth at both business chains. Overall, at the end of the Reporting Period, we believed Jack in the Box’s management team was executing well, and we remained optimistic on the potential for significant unit growth moving forward. In addition, in our view, Jack in the Box is supported by strong free cash flow generation, and we believe its operating margins can expand through more efficient business operations. |
| | | During the Reporting Period, we initiated a Fund position in SM Energy. We view SM Energy as a high quality company supported by a well-capitalized balance sheet and a strong, low cost position in the Eagle Ford shale. We established the Fund position in SM Energy at what we viewed as an attractive valuation following recent broad-based energy sector weakness due to sharply declining crude oil and natural gas prices. From our purchase date through the end of |
27
PORTFOLIO RESULTS
| | the Reporting Period, SM Energy’s stock recovered and outperformed the Russell Index based on strong execution and operational performance by the company and on some recovery and seeming stabilization in crude oil prices. |
| | | Strong quarterly earnings during the Reporting Period helped drive up shares of Diamond Resorts International. We view the company’s $100 million share buyback program, announced in October 2014, as a positive for shareholder value. Its acquisitions of Hospitality Management and Consulting Services was also a positive, in our view, and should, we believe, lead to a more transparent management structure for the company. |
| Q | | Which stocks detracted significantly from the Fund’s performance during the Reporting Period? |
| A | | Detracting most from the Fund’s results relative to its benchmark index were positions in three oil and gas exploration and production companies — Rex Energy, Laredo Petroleum and Rice Energy. |
| | | Shares of Rex Energy traded lower largely due to investor concerns about the recent decline in natural gas prices and the potential resulting impact of such on the company’s operations. At the end of December 2014, Rex Energy’s shares continued to move lower after the company announced a meaningful reduction to its 2015 capital expenditure budget. However, we believe this decision demonstrates financial discipline, and, at the end of the Reporting Period, we continued to be optimistic on the company’s outlook. Overall, we view Rex Energy as well positioned in areas that could experience significant production growth, and we are positive on its management’s commitment to strengthening the company’s operational results going forward. |
| | | At the beginning of November 2014, Laredo Petroleum reported better than expected earnings, highlighted by solid production results. However, its shares underperformed as lower oil prices during the fourth calendar quarter weighed negatively on investor sentiment. Despite what we believe may well be short-term weakness, we remained constructive at the end of the Reporting Period on the company’s acreage in the core of the Midland Basin, and we anticipate that Laredo Petroleum’s production and reserve growth could accelerate in this area going forward. Additionally, we view the company’s decision to reduce its 2015 capital expenditure budget favorably, as it demonstrates financial discipline. |
| | | Rice Energy reported lower than anticipated third quarter 2014 earnings per share, but earnings before interest, taxes, depreciation and amortization (“EBITDA”) exceeded investor expectations. As the Reporting Period progressed, Rice Energy’s shares were adversely impacted by the decline in energy prices. At the end of the Reporting Period, we maintained the Fund’s position in Rice Energy because, in our view, its prominent acreage in the Marcellus and Utica shales has the potential to drive strong results for the company. Additionally, Rice Energy is supported by a management team seemingly committed to high returns, and we believe the company’s growth opportunities in the Upper Devonian Shale were not fully reflected in the stock’s valuation at the end of the Reporting Period. |
| Q | | How did the Fund use derivatives and similar instruments during the Reporting Period? |
| A | | During the Reporting Period, we did not use derivatives as part of an active management strategy. |
| Q | | Did the Fund make any significant purchases or sales during the Reporting Period? |
| A | | In addition to the purchase of SM Energy, already mentioned, we initiated a Fund position in Curtiss-Wright during the Reporting Period. Curtiss-Wright designs, manufactures and overhauls precision components and systems, providing engineered services to the aerospace, automotive, shipbuilding, oil, petrochemical, agricultural equipment, power generation, metal working and fire and rescue industries. Curtiss-Wright has undergone a significant management change and strategic refocus over the last year or so. The company has stated it is looking to drive higher organic growth, margins and returns on invested capital by divesting less profitable businesses, realigning the organization and driving productivity improvements. Its management also seems to be committed to using cash flow for strategic bolt-on acquisitions as well as share repurchases. (A bolt-on acquisition is the acquisition of a company where the acquiring company intends to merge the target company into one of its departments.) We believe the company is in the early stages of its transformation and still has significant room for operational improvement in the coming years combined with capital deployment. |
| | Conversely, we exited the Fund’s position in oil and gas exploration and production company RSP Permian. The decision to sell the Fund’s position in RSP Permian was based on the company’s valuation, which we believe became |
28
PORTFOLIO RESULTS
| | in line with our expectations. In our view, the valuation at the time of sale left the company with limited upside potential, and we therefore decided to transition the capital into names that we believed had greater upside potential. |
| | | We sold the Fund’s position in Cleco, a Louisiana-based public utility holding company. We had initiated the Fund’s position in Cleco based on our positive outlook on the company’s above-average earnings growth prospects and its management’s focus on allocating free cash flow in a shareholder-friendly manner. Additionally, we viewed Cleco as a potential acquisition candidate. Indeed, in October 2014, its shares rose sharply after Cleco announced plans to be acquired by a group of infrastructure investors. Following the announcement, we exited the Fund’s position and transitioned the capital into names we believed had greater upside potential. |
| Q | | Were there any notable changes in the Fund’s weightings during the Reporting Period? |
| A | | In constructing the Fund’s portfolio, we focus on picking stocks rather than on making industry or sector bets. We seek to outpace the benchmark index by overweighting stocks that we expect to outperform and underweighting those that we think may lag. Consequently, changes in its sector weights are generally the direct result of individual stock selection or of stock appreciation or depreciation. That said, during the Reporting Period, the Fund’s allocation compared to the benchmark index in consumer discretionary increased as did its position in cash. The Fund’s exposure to the materials and utilities sectors decreased compared to the Russell Index. |
| Q | | How was the Fund positioned relative to its benchmark index at the end of February 2015? |
| A | | At the end of February 2015, the Fund was overweighted in materials and underweighted in financials relative to the Russell Index. The Fund was rather neutrally weighted to the other eight sectors in the Russell Index at the end of February 2015. |
| Q | | Did the Fund make any significant purchases or sales during the Reporting Period? |
| A | | In addition to the purchase of SM Energy, already mentioned, we initiated a Fund position in Curtiss-Wright during the Reporting Period. Curtiss-Wright designs, manufactures and overhauls precision components and systems, providing engineered services to the aerospace, automotive, shipbuilding, oil, petrochemical, agricultural equipment, power generation, metal working and fire and rescue industries. Curtiss-Wright has undergone a significant management change and strategic refocus over the last year or so. The company has stated it is looking to drive higher organic growth, margins and returns on invested capital by divesting less profitable businesses, realigning the organization and driving productivity improvements. Its management also seems to be committed to using cash flow for strategic bolt-on acquisitions as well as share repurchases. (A bolt-on acquisition is the acquisition of a company where the acquiring company intends to merge the target company into one of its departments.) We believe the company is in the early stages of its transformation and still has significant room for operational improvement in the coming years combined with capital deployment. |
| | Conversely, we exited the Fund’s position in oil and gas exploration and production company RSP Permian. The decision to sell the Fund’s position in RSP Permian was based on the company’s valuation, which we believe became in line with our expectations. In our view, the valuation at the time of sale left the company with limited upside potential, and we therefore decided to transition the capital into names that we believed had greater upside potential. |
| | We sold the Fund’s position in Cleco, a Louisiana-based public utility holding company. We had initiated the Fund’s position in Cleco based on our positive outlook on the company’s above-average earnings growth prospects and its management’s focus on allocating free cash flow in a shareholder-friendly manner. Additionally, we viewed Cleco as a potential acquisition candidate. Indeed, in October 2014, its shares rose sharply after Cleco announced plans to be acquired by a group of infrastructure investors. Following the announcement, we exited the Fund’s position and transitioned the capital into names we believed had greater upside potential. |
| Q | | Were there any notable changes in the Fund’s weightings during the Reporting Period? |
| A | | In constructing the Fund’s portfolio, we focus on picking stocks rather than on making industry or sector bets. We seek to outpace the benchmark index by overweighting stocks that we expect to outperform and underweighting those that we think may lag. Consequently, changes in its sector weights are generally the direct result of individual stock selection or of stock appreciation or depreciation. That said, during the Reporting Period, the Fund’s allocation compared to the benchmark index in consumer discretionary increased as did its position in cash. The Fund’s exposure to the materials and utilities sectors decreased compared to the Russell Index. |
29
PORTFOLIO RESULTS
| Q | | How was the Fund positioned relative to its benchmark index at the end of February 2015? |
| A | | At the end of February 2015, the Fund was overweighted in materials and underweighted in financials relative to the Russell Index. The Fund was rather neutrally weighted to the other eight sectors in the Russell Index at the end of February 2015. |
30
FUND BASICS
Small Cap Value Fund
as of February 28, 2015
| | | | | | | | | | |
| | PERFORMANCE REVIEW | |
| | | September 1, 2014–February 28, 2015 | | Fund Total Return
(based on NAV)1 | | | Russell 2000
Value Index2 | |
| | Class A | | | 3.95 | % | | | 2.31 | % |
| | Class C | | | 3.56 | | | | 2.31 | |
| | Institutional | | | 4.14 | | | | 2.31 | |
| | Service | | | 3.89 | | | | 2.31 | |
| | Class IR | | | 4.06 | | | | 2.31 | |
| | | Class R | | | 3.81 | | | | 2.31 | |
| | 1 | | The net asset value (“NAV”) represents the net assets of the class of the Fund (ex-dividend) divided by the total number of shares of the class outstanding. The Fund’s performance reflects the reinvestment of dividends and other distributions. The Fund’s performance does not reflect the deduction of any applicable sales charges. |
| | 2 | | The Russell 2000 Value Index (with dividends reinvested) is an unmanaged index of common stock prices that measures the performance of those Russell 2000 companies with lower price-to-book ratios and lower forecasted growth values. The Index figures do not reflect any deduction for fees, expenses or taxes. It is not possible to invest directly in an index. |
| | | | | | | | | | | | | | | | | | | | |
| | STANDARDIZED TOTAL RETURNS3 |
| | | For the period ended 12/31/14 | | One Year | | | Five Years | | | Ten Years | | | Since Inception | | | Inception Date |
| | Class A | | | 0.98 | % | | | 15.41 | % | | | 8.07 | % | | | 10.83 | % | | 10/22/92 |
| | Class C | | | 5.00 | | | | 15.85 | | | | 7.88 | | | | 8.93 | | | 8/15/97 |
| | Institutional | | | 7.28 | | | | 17.19 | | | | 9.13 | | | | 10.20 | | | 8/15/97 |
| | Service | | | 6.75 | | | | 16.61 | | | | 8.58 | | | | 9.65 | | | 8/15/97 |
| | Class IR | | | 7.14 | | | | 17.02 | | | | N/A | | | | 10.44 | | | 11/30/07 |
| | | Class R | | | 6.60 | | | | 16.43 | | | | N/A | | | | 9.91 | | | 11/30/07 |
| | 3 | | The Standardized Total Returns are average annual total returns as of the most recent calendar quarter-end. They assume reinvestment of all distributions at NAV. These returns reflect a maximum initial sales charge of 5.5% for Class A Shares and the assumed contingent deferred sales charge for Class C Shares (1% if redeemed within 12 months of purchase). Because Institutional, Service, Class IR and Class R Shares do not involve a sales charge, such a charge is not applied to their Standardized Total Returns. |
The returns set forth in the tables above represent past performance. Past performance does not guarantee future results. The Fund’s investment return and principal value will fluctuate so that an investor’s shares, when redeemed, may be worth more or less than their original cost. Current performance may be lower or higher than the performance quoted above. Please visit our web site at www.GSAMFUNDS.com to obtain the most recent month-end returns. Performance reflects fee waivers and/or expense limitations in effect during the periods shown. In their absence, performance would be reduced. Returns do not reflect the deduction of taxes that a shareholder would pay on Fund distributions or the redemption of Fund shares.
31
FUND BASICS
| | | | | | | | | | |
| | EXPENSE RATIOS4 | |
| | | | | Net Expense Ratio (Current) | | | Gross Expense Ratio (Before Waivers) | |
| | Class A | | | 1.35 | % | | | 1.40 | % |
| | Class C | | | 2.10 | | | | 2.15 | |
| | Institutional | | | 0.95 | | | | 1.00 | |
| | Service | | | 1.45 | | | | 1.50 | |
| | Class IR | | | 1.10 | | | | 1.15 | |
| | | Class R | | | 1.60 | | | | 1.65 | |
| | 4 | | The expense ratios of the Fund, both current (net of any fee waivers or expense limitations) and before waivers (gross of any fee waivers or expense limitations) are as set forth above. Pursuant to a contractual arrangement, the Fund’s waivers and/or expense limitations will remain in place through at least December 29, 2015, and prior to such date the investment adviser may not terminate the arrangements without the approval of the Fund’s Board of Trustees. |
| | | | | | | | |
| | TOP TEN HOLDINGS AS OF 2/28/155 |
| | | Holding | | % of Net Assets | | | Line of Business |
| | Esterline Technologies Corp. | | | 1.2 | % | | Aerospace & Defense |
| | Pebblebrook Hotel Trust | | | 1.2 | | | Real Estate Investment Trusts |
| | Chesapeake Lodging Trust | | | 1.1 | | | Real Estate Investment Trusts |
| | PrivateBancorp, Inc. | | | 1.0 | | | Commercial Banks |
| | SM Energy Co. | | | 1.0 | | | Oil, Gas & Consumable Fuels |
| | Strategic Hotels & Resorts, Inc. | | | 1.0 | | | Real Estate Investment Trusts |
| | Spectrum Brands Holdings, Inc. | | | 1.0 | | | Household Products |
| | National Health Investors, Inc. | | | 1.0 | | | Real Estate Investment Trusts |
| | American Equity Investment Life Holding Co. | | | 0.9 | | | Insurance |
| | | Bank of the Ozarks, Inc. | | | 0.9 | | | Commercial Banks |
| | 5 | | The top 10 holdings may not be representative of the Fund’s future investments. |
32
FUND BASICS
|
| FUND VS. BENCHMARK SECTOR ALLOCATIONS6 |
| As of February 28, 2015 |
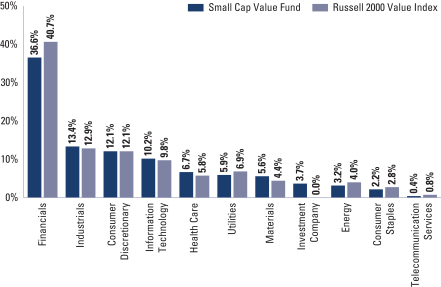
| | 6 | | The Fund is actively managed and, as such, its composition may differ over time. Consequently, the Fund’s overall sector allocations may differ from the percentages contained in the graph above. The graph categorizes investments using the Global Industry Classification Standard (“GICS”), however, the sector classifications used by the portfolio management team may differ from GICS. Underlying sector allocations of Exchange Traded Funds held by the Fund are not reflected in the graph above. The percentage shown for each investment category reflects the value of investments in that category as a percentage of market value. The graph depicts the Fund’s investments but may not represent the Fund’s market exposure due to the exclusion of certain derivatives, if any, as listed in the Additional Investment Information section of the Schedule of Investments. |
33
PORTFOLIO RESULTS
Goldman Sachs Small/Mid Cap Value Fund
Portfolio Composition
The Fund’s investment objective is to seek long-term capital appreciation. The Fund invests, under normal circumstances, at least 80% of its net assets plus any borrowings for investment purposes (measured at time of purchase) in a diversified portfolio of equity investments in small- and mid-cap issuers with public stock market capitalizations within the range of the market capitalization of companies constituting the Russell 2000® Value Index and the Russell Midcap Value Index, respectively, at the time of investment. As of September 30, 2014, the capitalization range of the companies in these indexes was between $56 million and $30.6 billion. Under normal circumstances, the Fund’s investment horizon for ownership of stocks will be two to three years. Although the Fund will invest primarily in publicly traded U.S. securities, it may also invest in foreign securities, including securities of issuers in emerging countries and securities quoted in foreign currencies. The Fund may invest in companies with public stock market capitalizations outside the range of companies constituting the Russell 2000® Value Index and the Russell Midcap Value Index at the time of investment and in fixed income securities, such as government, corporate and bank debt obligations.
Portfolio Management Discussion and Analysis
Below, the Goldman Sachs Value Equity Investment Team discusses the Goldman Sachs Small/Mid Cap Value Fund’s (the “Fund”) performance and positioning for the six-month period ended February 28, 2015 (the “Reporting Period”).
| Q | | How did the Fund perform during the Reporting Period? |
| A | | During the Reporting Period, the Fund’s Class A, C, Institutional, IR and R Shares generated cumulative total returns, without sales charges, of 2.76%, 2.45%, 3.11%, 2.89% and 2.63%, respectively. These returns compare to the 1.87% cumulative total return of the Fund’s benchmark, the Russell 2500® Value Index (with dividends reinvested) (the “Russell Index”), during the same period. |
| Q | | What key factors were responsible for the Fund’s performance during the Reporting Period? |
| A | | Stock selection overall contributed most to the Fund’s performance relative to the Russell Index during the Reporting Period. |
| Q | | Which equity market sectors most significantly affected Fund performance? |
| A | | Effective stock selection in the consumer discretionary, energy and information technology sectors helped the Fund’s performance most relative to the Russell Index. Detracting from the Fund’s relative results most was stock selection in the industrials, health care and utilities sectors. Having a portion of assets in cash during a Reporting Period when the Russell Index gained ground also detracted. |
| Q | | What were some of the Fund’s best-performing individual stocks? |
| A | | The Fund benefited most relative to the Russell Index from positions in casual restaurant operator and franchiser Jack in the Box, global specialty health care company Endo International and real estate investment trust Pebblebrook Hotel Trust. |
| | | Jack in the Box operates and franchises Jack in the Box and Qdoba Mexican Grill restaurants. During the Reporting Period, Jack in the Box reported two consecutive quarters of earnings that exceeded consensus expectations, benefiting from robust same-store sales growth at both business chains. Overall, at the end of the Reporting Period, we believed Jack in the Box’s management team was executing well, and we remained optimistic on the potential for significant unit growth moving forward. In addition, in our view, Jack in the Box is supported by strong free cash flow generation, and we believe its operating margins can expand through more efficient business operations. |
| | | Shares of Endo International rose during the Reporting Period, as the company’s acquisition of Auxilium Pharmaceuticals was finalized, a deal that we believe will be accretive moving forward. The company also reported strong third quarter 2014 earnings, which had a positive impact on its share price. At the end of the Reporting Period, we |
34
PORTFOLIO RESULTS
| | remained encouraged by Endo International’s merger and acquisition activity and by what we consider to be its strong product pipeline and experienced management team. We thus believed the stock to be compelling from a risk/reward perspective. Indeed, despite strong performance during the Reporting Period, we continued to view its shares as attractively valued relative to its peers. |
| | | Pebblebrook Hotel Trust, an owner of upper-upscale and luxury hotel properties in high barrier U.S. urban markets, was another top contributor to the Fund’s results during the Reporting Period. At the industry level, U.S. hotels experienced better than expected revenue per available room (“RevPar”) growth during the Reporting Period. Shares of Pebblebrook Hotel Trust also benefited from an improving macroeconomic backdrop given the company’s favorable geographic exposure and highly regarded management team. At the end of the Reporting Period, we remained constructive on Pebblebrook Hotel Trust’s potential for both margin expansion and earnings growth over the long term, and we also continued to be positive on its management’s profitable track record of capital allocation. |
| Q | | Which stocks detracted significantly from the Fund’s performance during the Reporting Period? |
| A | | Detracting most from the Fund’s results relative to its benchmark index were positions in three oil and gas exploration and production companies — Laredo Petroleum, QEP Resources and Eclipse Resources. |
| | | At the beginning of November 2014, Laredo Petroleum reported better than expected earnings, highlighted by solid production results. However, its shares underperformed as lower oil prices during the fourth calendar quarter weighed negatively on investor sentiment. Despite what we believe may well be short-term weakness, we remained constructive at the end of the Reporting Period on the company’s acreage in the core of the Midland Basin, and we anticipate that Laredo Petroleum’s production and reserve growth could accelerate in this area going forward. Additionally, we view the company’s decision to reduce its 2015 capital expenditure budget favorably, as it demonstrates financial discipline. |
| | | Although QEP Resources beat consensus earnings estimates and successfully sold its midstream business during the fourth quarter of 2014, shares of the company declined as a result of weaker energy prices. (The midstream component of the energy industry is usually defined as those companies providing products or services that help link the supply side, i.e., energy producers, and the demand side, i.e., energy end-users, for any type of energy commodity. Midstream businesses can include, but are not limited to, those that process, store, market and transport various energy commodities.) We initiated the Fund’s position in QEP Resources during the Reporting Period given our positive outlook on its management making a decision to the sell the remaining part of its midstream business in 2014. We also believe QEP Resources possesses an attractive risk/reward profile relative to its peers and are constructive its management’s strategic initiatives to transform the company into a focused and balanced exploration and production company. |
| | | We had bought Eclipse Resources, a Marcellus and Utica shale exploration and production company, on its Initial Public Offering (“IPO”) in the Fund’s prior fiscal year. Given the company’s focus on natural gas, we believed the position would provide some balance in the Fund’s portfolio, which had many oil-exposed names. However, the stock has underperformed since the IPO due to natural gas price weakness during the Reporting Period and on investor concerns over infrastructure/takeaway capacity constraints out of the Marcellus and Utica shales. At the end of the Reporting Period, we continued to believe Eclipse Resources had “best in class” acreage in the Marcellus and Utica shales, but after persistent underperformance, we decided to exit the Fund’s position and transition the capital into names that we believed have greater upside potential. |
| Q | | How did the Fund use derivatives and similar instruments during the Reporting Period? |
| A | | During the Reporting Period, we did not use derivatives as part of an active management strategy. |
| Q | | Did the Fund make any significant purchases or sales during the Reporting Period? |
| A | | In addition to the purchase of QEP Resources, already mentioned, we initiated a Fund position in Bank of Hawaii during the Reporting Period. In our view, Bank of Hawaii is a well-managed, high quality banking franchise with dominant market share in the Hawaiian Islands. Its management has a long track record of delivering high returns on a conservatively-managed balance sheet. Hawaii has been benefiting from a strong tourist trade, and its economy has been expanding at a solid rate. Hawaii is one of the most energy-dependent states, moreover, and is expected to benefit disproportionately from lower oil prices. |
35
PORTFOLIO RESULTS
| Q | | Did the Fund make any significant purchases or sales during the Reporting Period? |
| A | | In addition to the purchase of QEP Resources, already mentioned, we initiated a Fund position in Bank of Hawaii during the Reporting Period. In our view, Bank of Hawaii is a well-managed, high quality banking franchise with dominant share in the Hawaiian Islands. Its management has a long track record of delivering high returns on a conservatively-managed balance sheet. Hawaii has been benefiting from a strong tourist trade, and its economy has been expanding at a solid rate. Hawaii is one of the most energy-dependent states, moreover, and is expected to benefit disproportionately from lower oil prices. |
| | We established a Fund position in Empire State Realty Trust, the owner of the Empire State Building as well as other office and retail properties in New York City. We believe its shares were trading, at the time of the Fund’s purchase, at an unwarranted discount relative to its peers due to concerns over new supply in the observatory market. We recognize the potential for new competition in this space. However, we believe investors are underappreciating what we view as the company’s significant growth potential and high quality balance sheet. In addition, we believe Empire State Realty Trust’s upcoming re-leasing opportunities could lead to meaningful increases in the company’s rental rates. |
| | Conversely, in addition to those sales already mentioned, we sold the Fund’s position in TRW Automotive Holdings. After the announcement was made late in 2014 that ZF Friedrichshafen would be acquiring TRW Automotive Holdings, its shares surged higher. This strong performance had the company trading near our target price, and so we decided to exit the Fund’s position in favor of other high conviction opportunities. |
| | We exited the Fund’s position in Oil States International in early January 2015 because the company had outperformed its peer group and because we sought to reduce the Fund’s exposure to oil services. We opted to reallocate the proceeds to higher conviction natural gas exploration and production names. |
| Q | | Were there any notable changes in the Fund’s weightings during the Reporting Period? |
| A | | In constructing the Fund’s portfolio, we focus on picking stocks rather than on making industry or sector bets. We seek to outpace the benchmark index by overweighting stocks that we expect to outperform and underweighting those that we think may lag. Consequently, changes in its sector weights are generally the direct result of individual stock selection or of stock appreciation or depreciation. That said, during the Reporting Period, the Fund’s allocations compared to the benchmark index in consumer staples and information technology increased. The Fund’s exposure to the energy sector decreased compared to the Russell Index. |
| Q | | How was the Fund positioned relative to its benchmark index at the end of February 2015? |
| A | | At the end of February 2015, the Fund was overweighted in consumer discretionary, consumer staples, information technology and materials relative to the Russell Index. On the same date, the Fund had underweighted positions compared to the Russell Index in financials, industrials and utilities and was rather neutrally weighted to the Russell Index in energy and health care. The Fund had no allocation to telecommunication services at the end of February 2015. |
36
FUND BASICS
Small/Mid Cap Value Fund
as of February 28, 2015
| | | | | | | | | | |
| | PERFORMANCE REVIEW | |
| | | September 1, 2014–February 28, 2015 | | Fund Total Return
(based on NAV)1 | | | Russell 2500
Value Index2 | |
| | Class A | | | 2.76 | % | | | 1.87 | % |
| | Class C | | | 2.45 | | | | 1.87 | |
| | Institutional | | | 3.11 | | | | 1.87 | |
| | Class IR | | | 2.89 | | | | 1.87 | |
| | | Class R | | | 2.63 | | | | 1.87 | |
| | 1 | | The net asset value (“NAV”) represents the net assets of the class of the Fund (ex-dividend) divided by the total number of shares of the class outstanding. The Fund’s performance reflects the reinvestment of dividends and other distributions. The Fund’s performance does not reflect the deduction of any applicable sales charges. |
| | 2 | | The Russell 2500 Value Index is composed of the smallest 2,500 of the 3,000 largest U.S. companies based on total market capitalization with lower price-to-book ratios and lower forecast growth values. It is calculated by Frank Russell Company, and reflects reinvestment of all dividends and capital gains. The Index figures do not reflect any deduction for fees, expenses or taxes. It is not possible to invest directly in an index. |
| | | | | | | | | | |
| | STANDARDIZED TOTAL RETURNS3 | |
| | | For the period ended 12/31/14 | | Since Inception | | | Inception Date | |
| | Class A | | | 4.72 | % | | | 1/31/2014 | |
| | Class C | | | 9.04 | | | | 1/31/2014 | |
| | Institutional | | | 11.29 | | | | 1/31/2014 | |
| | Class IR | | | 11.14 | | | | 1/31/2014 | |
| | | Class R | | | 10.66 | | | | 1/31/2014 | |
| | 3 | | The Standardized Total Returns are cumulative annual total returns as of the most recent calendar quarter-end. They assume reinvestment of all distributions at NAV. These returns reflect a maximum initial sales charge of 5.5% for Class A Shares and the assumed contingent deferred sales charge for Class C Shares (1% if redeemed within 12 months of purchase). Because Institutional, Service, Class IR and Class R Shares do not involve a sales charge, such a charge is not applied to their Standardized Total Returns. |
The returns set forth in the tables above represent past performance. Past performance does not guarantee future results. The Fund’s investment return and principal value will fluctuate so that an investor’s shares, when redeemed, may be worth more or less than their original cost. Current performance may be lower or higher than the performance quoted above. Please visit our web site atwww.GSAMFUNDS.com to obtain the most recent month-end returns. Performance reflects fee waivers and/or expense limitations in effect during the periods shown. In their absence, performance would be reduced. Returns do not reflect the deduction of taxes that a shareholder would pay on Fund distributions or the redemption of Fund shares.
37
FUND BASICS
| | | | | | | | | | |
| | EXPENSE RATIOS3 | |
| | | | | Net Expense Ratio (Current) | | | Gross Expense Ratio (Before Waivers) | |
| | Class A | | | 1.33 | % | | | 4.81 | % |
| | Class C | | | 2.08 | | | | 6.16 | |
| | Institutional | | | 0.93 | | | | 10.28 | |
| | Class IR | | | 1.08 | | | | 10.63 | |
| | | Class R | | | 1.58 | | | | 11.13 | |
| | 3 | | The expense ratios of the Fund, both current (net of any fee waivers or expense limitations) and before waivers (gross of any fee waivers or expense limitations) are as set forth above. Pursuant to a contractual arrangement, the Fund’s waivers and/or expense limitations will remain in place through at least December 29, 2015, and prior to such date the investment adviser may not terminate the arrangements without the approval of the Fund’s Board of Trustees. |
| | | | | | | | |
| | TOP TEN HOLDINGS AS OF 2/28/155 |
| | | Holding | | % of Net Assets | | | Line of Business |
| | Pebblebrook Hotel Trust | | | 1.6 | % | | Real Estate Investment Trusts |
| | Brixmor Property Group, Inc. | | | 1.6 | | | Real Estate Investment Trusts |
| | Carlisle Cos., Inc. | | | 1.6 | | | Industrial Conglomerates |
| | Esterline Technologies Corp. | | | 1.5 | | | Aerospace & Defense |
| | Post Properties, Inc. | | | 1.4 | | | Real Estate Investment Trusts |
| | Highwoods Properties, Inc. | | | 1.4 | | | Real Estate Investment Trusts |
| | Packaging Corp. of America | | | 1.3 | | | Containers & Packaging |
| | CBL & Associates Properties, Inc. | | | 1.3 | | | Real Estate Investment Trusts |
| | Hanesbrands, Inc. | | | 1.2 | | | Textiles, Apparel & Luxury
Goods |
| | | Starwood Property Trust, Inc. | | | 1.1 | | | Real Estate Investment Trusts |
| | 5 | | The top 10 holdings may not be representative of the Fund’s future investments. |
38
FUND BASICS
|
| FUND VS. BENCHMARK SECTOR ALLOCATIONS6 |
| As of February 28, 2015 |
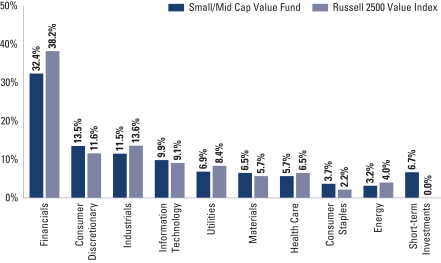
| | 6 | | The Fund is actively managed and, as such, its composition may differ over time. Consequently, the Fund’s overall sector allocations may differ from the percentages contained in the graph above. The graph categorizes investments using the Global Industry Classification Standard (“GICS”), however, the sector classifications used by the portfolio management team may differ from GICS. The percentage shown for each investment category reflects the value of investments in that category as a percentage of market value. Short-term investments represent repurchase agreements. The graph depicts the Fund’s investments but may not represent the Fund’s market exposure due to the exclusion of certain derivatives, if any, as listed in the Additional Investment Information section of the Schedule of Investments. |
39
GOLDMAN SACHS GROWTH AND INCOME FUND
Schedule of Investments
February 28, 2015 (Unaudited)
| | | | | | | | |
Shares | | | Description | | Value | |
| | | | | | | | |
| | Common Stocks – 96.7% | |
| | Aerospace & Defense – 1.0% | |
| | 31,605 | | | The Boeing Co. | | $ | 4,767,614 | |
| | |
| | Air Freight & Logistics – 1.0% | |
| | 47,243 | | | United Parcel Service, Inc. Class B | | | 4,806,030 | |
| | |
| | Automobiles – 1.8% | |
| | 234,586 | | | General Motors Co. | | | 8,752,404 | |
| | |
| | Capital Markets – 3.1% | |
| | 330,566 | | | AllianceBernstein Holding LP | | | 9,467,410 | |
| | 302,495 | | | Ares Capital Corp. | | | 5,233,164 | |
| | | | | | | | |
| | | | | | | 14,700,574 | |
| | |
| | Chemicals – 0.5% | |
| | 33,692 | | | Eastman Chemical Co. | | | 2,508,706 | |
| | |
| | Commercial Banks – 10.5% | |
| | 560,015 | | | Bank of America Corp. | | | 8,853,837 | |
| | 128,577 | | | BB&T Corp. | | | 4,892,355 | |
| | 394,987 | | | Fifth Third Bancorp | | | 7,646,948 | |
| | 351,640 | | | JPMorgan Chase & Co. | | | 21,548,499 | |
| | 136,098 | | | Wells Fargo & Co. | | | 7,456,810 | |
| | | | | | | | |
| | | | | | | 50,398,449 | |
| | |
| | Commercial Services & Supplies – 0.5% | |
| | 44,200 | | | Waste Management, Inc. | | | 2,408,016 | |
| | |
| | Communications Equipment – 2.3% | |
| | 367,506 | | | Cisco Systems, Inc. | | | 10,845,102 | |
| | |
| | Computers & Peripherals – 2.6% | |
| | 44,249 | | | Apple, Inc. | | | 5,684,227 | |
| | 239,717 | | | EMC Corp. | | | 6,937,410 | |
| | | | | | | | |
| | | | | | | 12,621,637 | |
| | |
| | Consumer Finance – 2.7% | |
| | 61,780 | | | Capital One Financial Corp. | | | 4,862,704 | |
| | 377,542 | | | Navient Corp. | | | 8,079,399 | |
| | | | | | | | |
| | | | | | | 12,942,103 | |
| | |
| | Diversified Telecommunication Services – 3.6% | |
| | 353,911 | | | Verizon Communications, Inc. | | | 17,500,899 | |
| | |
| | Electric Utilities – 3.1% | |
| | 266,751 | | | FirstEnergy Corp. | | | 9,330,950 | |
| | 28,096 | | | NextEra Energy, Inc. | | | 2,906,812 | |
| | 75,847 | | | PPL Corp. | | | 2,586,383 | |
| | | | | | | | |
| | | | | | | 14,824,145 | |
| | |
| | Electrical Equipment – 1.0% | |
| | 67,971 | | | Eaton Corp. PLC | | | 4,826,621 | |
| | |
| | Food & Staples Retailing – 1.3% | |
| | 52,503 | | | The Kroger Co. | | | 3,735,588 | |
| | 32,157 | | | Wal-Mart Stores, Inc. | | | 2,698,937 | |
| | | | | | | | |
| | | | | | | 6,434,525 | |
| | |
| | Food Products – 1.6% | |
| | 220,818 | | | ConAgra Foods, Inc. | | | 7,724,214 | |
| | |
| | | | | | | | |
Shares | | | Description | | Value | |
| | | | | | | | |
| | Common Stocks – (continued) | |
| | Health Care Equipment & Supplies – 2.6% | |
| | 159,681 | | | Medtronic PLC | | $ | 12,389,649 | |
| | |
| | Hotels, Restaurants & Leisure – 1.0% | |
| | 62,170 | | | Starwood Hotels & Resorts Worldwide, Inc. | | | 4,994,116 | |
| | |
| | Household Products – 0.8% | |
| | 44,626 | | | The Procter & Gamble Co. | | | 3,799,011 | |
| | |
| | Industrial Conglomerates – 5.3% | |
| | 982,594 | | | General Electric Co. | | | 25,537,618 | |
| | |
| | Insurance – 8.9% | |
| | 118,534 | | | Aflac, Inc. | | | 7,378,741 | |
| | 196,037 | | | American International Group, Inc. | | | 10,846,727 | |
| | 50,970 | | | Arthur J. Gallagher & Co. | | | 2,395,080 | |
| | 167,563 | | | Prudential Financial, Inc. | | | 13,547,469 | |
| | 117,684 | | | The Hartford Financial Services Group, Inc. | | | 4,820,337 | |
| | 37,397 | | | The Travelers Cos., Inc. | | | 4,017,934 | |
| | | | | | | | |
| | | | | | | 43,006,288 | |
| | |
| | Internet Software & Services* – 0.8% | |
| | 63,488 | | | eBay, Inc. | | | 3,676,590 | |
| | |
| | Machinery – 0.7% | |
| | 43,026 | | | Caterpillar, Inc. | | | 3,566,855 | |
| | |
| | Media – 4.0% | |
| | 85,525 | | | CBS Corp. Class B | | | 5,054,528 | |
| | 84,435 | | | Liberty Global PLC Series C* | | | 4,404,974 | |
| | 138,596 | | | Viacom, Inc. Class B | | | 9,693,404 | |
| | | | | | | | |
| | | | | | | 19,152,906 | |
| | |
| | Multi-Utilities – 1.7% | |
| | 151,829 | | | PG&E Corp. | | | 8,157,772 | |
| | |
| | Oil, Gas & Consumable Fuels – 8.5% | |
| | 78,971 | | | Apache Corp. | | | 5,199,451 | |
| | 184,715 | | | Devon Energy Corp. | | | 11,376,597 | |
| | 223,376 | | | Exxon Mobil Corp. | | | 19,777,711 | |
| | 180,514 | | | Southwestern Energy Co.* | | | 4,527,291 | |
| | | | | | | | |
| | | | | | | 40,881,050 | |
| | |
| | Pharmaceuticals – 13.0% | |
| | 191,332 | | | Eli Lilly & Co. | | | 13,425,766 | |
| | 93,849 | | | Johnson & Johnson | | | 9,620,461 | |
| | 247,432 | | | Merck & Co., Inc. | | | 14,484,669 | |
| | 99,642 | | | Mylan, Inc.* | | | 5,711,978 | |
| | 557,834 | | | Pfizer, Inc. | | | 19,144,863 | |
| | | | | | | | |
| | | | | | | 62,387,737 | |
| | |
| | Real Estate Investment Trusts – 3.1% | |
| | 202,260 | | | Brixmor Property Group, Inc. | | | 5,137,404 | |
| | 445,668 | | | MFA Financial, Inc. | | | 3,547,517 | |
| | 255,850 | | | Starwood Property Trust, Inc. | | | 6,242,740 | |
| | | | | | | | |
| | | | | | | 14,927,661 | |
| | |
| | |
| 40 | | The accompanying notes are an integral part of these financial statements. |
GOLDMAN SACHS GROWTH AND INCOME FUND
| | | | | | | | |
Shares | | | Description | | Value | |
| | | | | | | | |
| | Common Stocks – (continued) | |
| | Semiconductors & Semiconductor Equipment – 1.7% | |
| | 230,262 | | | Maxim Integrated Products, Inc. | | $ | 7,919,862 | |
| | |
| | Software – 1.6% | |
| | 173,039 | | | Microsoft Corp. | | | 7,587,760 | |
| | |
| | Specialty Retail – 3.6% | |
| | 294,498 | | | Staples, Inc. | | | 4,937,259 | |
| | 296,519 | | | The Gap, Inc. | | | 12,335,190 | |
| | | | | | | | |
| | | | | | | 17,272,449 | |
| | |
| | Thrifts & Mortgage Finance – 1.7% | |
| | 486,581 | | | New York Community Bancorp, Inc. | | | 8,082,110 | |
| | |
| | Tobacco – 1.1% | |
| | 97,765 | | | Altria Group, Inc. | | | 5,503,192 | |
| | |
| | TOTAL COMMON STOCKS | | | | |
| | (Cost $399,043,385) | | $ | 464,903,665 | |
| | |
| | | | | | | | | | | | | | |
Principal
Amount | | | Interest
Rate | | | Maturity
Date | | | Value | |
| | | | | | | | | | | | | | |
| | Short-term Investment(a) – 1.5% | |
| | Repurchase Agreement – 1.5% | |
| Joint Repurchase Agreement Account II | |
| $ | 7,100,000 | | | | 0.081 | % | | | 03/02/15 | | | $ | 7,100,000 | |
| | (Cost $7,100,000) | | | | | |
| | |
| | TOTAL INVESTMENTS – 98.2% | |
| | (Cost $406,143,385) | | | $ | 472,003,665 | |
| | |
| OTHER ASSETS IN EXCESS OF
LIABILITIES – 1.8% |
| | | 8,653,190 | |
| | |
| | NET ASSETS – 100.0% | | | $ | 480,656,855 | |
| | |
| | |
| The percentage shown for each investment category reflects the value of investments in that category as a percentage of net assets. |
* | | Non-income producing security. |
(a) | | Joint repurchase agreement was entered into on February 27, 2015. Additional information appears on page 53. |
| | |
|
Investment Abbreviation: |
LP | | —Limited Partnership |
|
| | |
| The accompanying notes are an integral part of these financial statements. | | 41 |
GOLDMAN SACHS LARGE CAP VALUE FUND
Schedule of Investments
February 28, 2015 (Unaudited)
| | | | | | | | |
Shares | | | Description | | Value | |
| | | | | | | | |
| | Common Stocks – 97.2% | |
| | Aerospace & Defense – 1.0% | |
| | 101,491 | | | The Boeing Co. | | $ | 15,309,917 | |
| | |
| | Automobiles – 1.6% | |
| | 668,008 | | | General Motors Co. | | | 24,923,378 | |
| | |
| | Beverages – 0.7% | |
| | 90,974 | | | Anheuser-Busch InBev NV ADR | | | 11,522,767 | |
| | |
| | Capital Markets – 2.6% | |
| | 106,771 | | | Affiliated Managers Group, Inc.* | | | 23,107,380 | |
| | 130,650 | | | Ameriprise Financial, Inc. | | | 17,458,759 | |
| | | | | | | | |
| | | | | | | 40,566,139 | |
| | |
| | Chemicals – 0.5% | |
| | 108,054 | | | Eastman Chemical Co. | | | 8,045,701 | |
| | |
| | Commercial Banks – 12.7% | |
| | 3,411,177 | | | Bank of America Corp. | | | 53,930,708 | |
| | 678,766 | | | Citigroup, Inc. | | | 35,580,914 | |
| | 958,853 | | | Fifth Third Bancorp | | | 18,563,394 | |
| | 1,058,980 | | | JPMorgan Chase & Co. | | | 64,894,294 | |
| | 434,655 | | | Wells Fargo & Co. | | | 23,814,748 | |
| | | | | | | | |
| | | | | | | 196,784,058 | |
| | |
| | Commercial Services & Supplies – 0.5% | |
| | 142,719 | | | Waste Management, Inc. | | | 7,775,331 | |
| | |
| | Communications Equipment – 1.9% | |
| | 1,025,020 | | | Cisco Systems, Inc. | | | 30,248,340 | |
| | |
| | Computers & Peripherals – 2.5% | |
| | 1,324,028 | | | EMC Corp. | | | 38,317,370 | |
| | |
| | Consumer Finance – 1.8% | |
| | 138,153 | | | Capital One Financial Corp. | | | 10,874,023 | |
| | 787,535 | | | Navient Corp. | | | 16,853,249 | |
| | | | | | | | |
| | | | | | | 27,727,272 | |
| | |
| | Diversified Telecommunication Services – 2.0% | |
| | 618,139 | | | Verizon Communications, Inc. | | | 30,566,974 | |
| | |
| | Electric Utilities – 3.3% | |
| | 449,060 | | | Exelon Corp. | | | 15,232,115 | |
| | 452,240 | | | FirstEnergy Corp. | | | 15,819,355 | |
| | 192,476 | | | NextEra Energy, Inc. | | | 19,913,567 | |
| | | | | | | | |
| | | | | | | 50,965,037 | |
| | |
| | Electrical Equipment – 1.0% | |
| | 219,866 | | | Eaton Corp. PLC | | | 15,612,685 | |
| | |
| | Food & Staples Retailing – 1.4% | |
| | 107,629 | | | The Kroger Co. | | | 7,657,804 | |
| | 256,580 | | | Whole Foods Market, Inc. | | | 14,494,204 | |
| | | | | | | | |
| | | | | | | 22,152,008 | |
| | |
| | Food Products – 4.5% | |
| | 576,139 | | | ConAgra Foods, Inc. | | | 20,153,342 | |
| | 672,954 | | | Mondelez International, Inc. Class A | | | 24,855,556 | |
| | 319,170 | | | Tyson Foods, Inc. Class A | | | 13,184,913 | |
| | |
| | | | | | | | |
Shares | | | Description | | Value | |
| | | | | | | | |
| | Common Stocks – (continued) | |
| | Food Products – (continued) | |
| | 257,675 | | | Unilever NV | | $ | 11,201,132 | |
| | | | | | | | |
| | | | | | | 69,394,943 | |
| | |
| | Health Care Equipment & Supplies – 2.3% | |
| | 466,906 | | | Medtronic PLC | | | 36,227,237 | |
| | |
| | Health Care Providers & Services – 2.6% | |
| | 169,677 | | | Express Scripts Holding Co.* | | | 14,386,913 | |
| | 235,593 | | | UnitedHealth Group, Inc. | | | 26,770,432 | |
| | | | | | | | |
| | | | | | | 41,157,345 | |
| | |
| | Hotels, Restaurants & Leisure – 1.8% | |
| | 697,045 | | | MGM Resorts International* | | | 15,146,788 | |
| | 153,712 | | | Starwood Hotels & Resorts Worldwide, Inc. | | | 12,347,685 | |
| | | | | | | | |
| | | | | | | 27,494,473 | |
| | |
| | Household Products – 1.0% | |
| | 187,940 | | | The Procter & Gamble Co. | | | 15,999,332 | |
| | |
| | Industrial Conglomerates – 5.1% | |
| | 3,034,786 | | | General Electric Co. | | | 78,874,088 | |
| | |
| | Insurance – 9.1% | |
| | 382,158 | | | Aflac, Inc. | | | 23,789,335 | |
| | 855,232 | | | American International Group, Inc. | | | 47,319,987 | |
| | 1,079,681 | | | Genworth Financial, Inc. Class A* | | | 8,367,528 | |
| | 529,039 | | | Prudential Financial, Inc. | | | 42,772,803 | |
| | 485,708 | | | The Hartford Financial Services Group, Inc. | | | 19,894,600 | |
| | | | | | | | |
| | | | | | | 142,144,253 | |
| | |
| | Internet & Catalog Retail – 1.1% | |
| | 184,089 | | | Expedia, Inc. | | | 16,890,166 | |
| | |
| | Internet Software & Services* – 2.8% | |
| | 204,226 | | | eBay, Inc. | | | 11,826,728 | |
| | 56,875 | | | Google, Inc. Class A | | | 31,999,581 | |
| | | | | | | | |
| | | | | | | 43,826,309 | |
| | |
| | IT Services* – 0.7% | |
| | 291,482 | | | Vantiv, Inc. Class A | | | 10,781,919 | |
| | |
| | Machinery – 0.7% | |
| | 138,914 | | | Caterpillar, Inc. | | | 11,515,971 | |
| | |
| | Media – 4.2% | |
| | 402,274 | | | CBS Corp. Class B | | | 23,774,393 | |
| | 271,087 | | | Liberty Global PLC Series C* | | | 14,142,609 | |
| | 387,906 | | | Viacom, Inc. Class B | | | 27,130,146 | |
| | | | | | | | |
| | | | | | | 65,047,148 | |
| | |
| | Multi-Utilities – 0.5% | |
| | 159,195 | | | PG&E Corp. | | | 8,553,547 | |
| | |
| | Oil, Gas & Consumable Fuels – 9.2% | |
| | 253,750 | | | Apache Corp. | | | 16,706,900 | |
| | 597,781 | | | Devon Energy Corp. | | | 36,817,332 | |
| | 633,315 | | | Exxon Mobil Corp. | | | 56,073,710 | |
| | |
| | |
| 42 | | The accompanying notes are an integral part of these financial statements. |
GOLDMAN SACHS LARGE CAP VALUE FUND
| | | | | | | | |
Shares | | | Description | | Value | |
| | | | | | | | |
| | Common Stocks – (continued) | |
| | Oil, Gas & Consumable Fuels – (continued) | |
| | 1,303,841 | | | Southwestern Energy Co.* | | $ | 32,700,332 | |
| | | | | | | | |
| | | | | | | 142,298,274 | |
| | |
| | Pharmaceuticals – 8.5% | |
| | 241,686 | | | Bristol-Myers Squibb Co. | | | 14,723,511 | |
| | 93,300 | | | Eli Lilly & Co. | | | 6,546,861 | |
| | 251,600 | | | Johnson & Johnson | | | 25,791,516 | |
| | 247,082 | | | Merck & Co., Inc. | | | 14,464,180 | |
| | 328,296 | | | Mylan, Inc.* | | | 18,819,568 | |
| | 1,498,227 | | | Pfizer, Inc. | | | 51,419,151 | |
| | | | | | | | |
| | | | | | | 131,764,787 | |
| | |
| | Road & Rail* – 1.2% | |
| | 791,165 | | | Hertz Global Holdings, Inc. | | | 18,252,177 | |
| | |
| | Semiconductors & Semiconductor Equipment – 1.2% | |
| | 526,138 | | | Maxim Integrated Products, Inc. | | | 18,096,517 | |
| | |
| | Software – 2.7% | |
| | 565,332 | | | Microsoft Corp. | | | 24,789,808 | |
| | 236,870 | | | SAP SE ADR | | | 16,625,905 | |
| | | | | | | | |
| | | | | | | 41,415,713 | |
| | |
| | Specialty Retail – 3.8% | |
| | 828,170 | | | Staples, Inc. | | | 13,884,270 | |
| | 740,343 | | | The Gap, Inc. | | | 30,798,269 | |
| | 352,911 | | | Urban Outfitters, Inc.* | | | 13,749,412 | |
| | | | | | | | |
| | | | | | | 58,431,951 | |
| | |
| | | | | | | | |
Shares | | | Description | | Value | |
| | | | | | | | |
| | Common Stocks – (continued) | |
| | Textiles, Apparel & Luxury Goods* – 0.7% | |
| | 129,964 | | | Fossil Group, Inc. | | $ | 11,178,204 | |
| | |
| | TOTAL COMMON STOCKS | |
| | (Cost $1,322,629,682) | | $ | 1,509,861,331 | |
| | |
| | | | | | | | |
| | Investment Company(a) – 1.5% | |
| | 22,615,928 | | | Goldman Sachs Financial Square Government Fund – Institutional Shares | | $ | 22,615,928 | |
| | (Cost $22,615,928) | | | | |
| | |
| | TOTAL INVESTMENTS – 98.7% | |
| | (Cost $1,345,245,610) | | $ | 1,532,477,259 | |
| | |
| OTHER ASSETS IN EXCESS OF
LIABILITIES – 1.3% | | | 20,110,947 | |
| | |
| | NET ASSETS – 100.0% | | $ | 1,552,588,206 | |
| | |
| | |
| The percentage shown for each investment category reflects the value of investments in that category as a percentage of net assets. |
* | | Non-income producing security. |
(a) | | Represents an Affiliated Fund. |
| | |
|
Investment Abbreviation: |
ADR | | —American Depositary Receipt |
|
| | |
| The accompanying notes are an integral part of these financial statements. | | 43 |
GOLDMAN SACHS MID CAP VALUE FUND
Schedule of Investments
February 28, 2015 (Unaudited)
| | | | | | | | |
Shares | | | Description | | Value | |
| | | | | | | | |
| | Common Stocks – 96.7% | |
| | Aerospace & Defense – 2.7% | | | | |
| | 1,028,813 | | | Orbital ATK, Inc. | | $ | 68,189,726 | |
| | 2,468,783 | | | Textron, Inc. | | | 109,391,775 | |
| | 1,288,185 | | | Triumph Group, Inc. | | | 77,020,581 | |
| | | | | | | | |
| | | | | | | 254,602,082 | |
| | |
| | Airlines* – 0.6% | | | | |
| | 853,289 | | | United Continental Holdings, Inc. | | | 55,617,377 | |
| | |
| | Beverages – 1.0% | | | | |
| | 1,274,872 | | | Molson Coors Brewing Co. Class B | | | 96,750,036 | |
| | |
| | Building Products – 1.9% | | | | |
| | 1,456,883 | | | Armstrong World Industries, Inc.* | | | 81,337,778 | |
| | 2,207,488 | | | Fortune Brands Home & Security, Inc. | | | 102,250,844 | |
| | | | | | | | |
| | | | | | | 183,588,622 | |
| | |
| | Capital Markets – 2.3% | | | | |
| | 2,665,181 | | | Invesco Ltd. | | | 107,326,839 | |
| | 1,997,920 | | | Raymond James Financial, Inc. | | | 114,141,169 | |
| | | | | | | | |
| | | | | | | 221,468,008 | |
| | |
| | Chemicals – 3.0% | | | | |
| | 2,317,494 | | | Axalta Coating Systems Ltd.* | | | 65,816,830 | |
| | 1,203,320 | | | Celanese Corp. Series A | | | 68,721,605 | |
| | 373,571 | | | CF Industries Holdings, Inc. | | | 114,398,647 | |
| | 380,386 | | | The Valspar Corp. | | | 32,960,447 | |
| | | | | | | | |
| | | | | | | 281,897,529 | |
| | |
| | Commercial Banks – 5.0% | | | | |
| | 4,257,801 | | | Fifth Third Bancorp | | | 82,431,027 | |
| | 2,416,467 | | | First Horizon National Corp. | | | 34,531,314 | |
| | 13,260,807 | | | Huntington Bancshares, Inc. | | | 145,073,229 | |
| | 258,097 | | | M&T Bank Corp. | | | 31,229,737 | |
| | 591,251 | | | Signature Bank* | | | 72,930,811 | |
| | 3,956,259 | | | Zions Bancorp. | | | 105,770,584 | |
| | | | | | | | |
| | | | | | | 471,966,702 | |
| | |
| | Communications Equipment – 1.7% | | | | |
| | 7,881,189 | | | Brocade Communications Systems, Inc. | | | 97,647,932 | |
| | 2,671,921 | | | Juniper Networks, Inc. | | | 63,885,631 | |
| | | | | | | | |
| | | | | | | 161,533,563 | |
| | |
| | Consumer Finance – 3.1% | | | | |
| | 8,498,338 | | | Navient Corp. | | | 181,864,433 | |
| | 12,266,540 | | | SLM Corp. | | | 116,164,134 | |
| | | | | | | | |
| | | | | | | 298,028,567 | |
| | |
| | Containers & Packaging – 1.1% | | | | |
| | 1,206,045 | | | Packaging Corp. of America | | | 99,932,889 | |
| | |
| | Diversified Financial Services – 1.0% | | | | |
| | 2,066,601 | | | Voya Financial, Inc. | | | 91,323,098 | |
| | |
| | Electric Utilities – 1.5% | | | | |
| | 4,160,813 | | | FirstEnergy Corp. | | | 145,545,239 | |
| | |
| | | | | | | | |
Shares | | | Description | | Value | |
| | Common Stocks – (continued) | |
| | Energy Equipment & Services* – 0.3% | | | | |
| | 2,642,040 | | | Weatherford International PLC | | $ | 33,527,488 | |
| | |
| | Food & Staples Retailing – 2.0% | | | | |
| | 1,190,328 | | | The Kroger Co. | | | 84,691,837 | |
| | 1,798,207 | | | Whole Foods Market, Inc. | | | 101,580,714 | |
| | | | | | | | |
| | | | | | | 186,272,551 | |
| | |
| | Food Products – 2.9% | | | | |
| | 3,809,653 | | | ConAgra Foods, Inc. | | | 133,261,662 | |
| | 3,449,707 | | | Tyson Foods, Inc. Class A | | | 142,507,396 | |
| | | | | | | | |
| | | | | | | 275,769,058 | |
| | |
| | Health Care Equipment & Supplies – 1.4% | | | | |
| | 1,129,482 | | | Zimmer Holdings, Inc. | | | 135,978,338 | |
| | |
| | Health Care Providers & Services – 5.1% | | | | |
| | 1,429,543 | | | Cardinal Health, Inc. | | | 125,785,489 | |
| | 1,589,729 | | | Cigna Corp. | | | 193,358,738 | |
| | 1,322,049 | | | Envision Healthcare Holdings, Inc.* | | | 48,413,434 | |
| | 952,268 | | | Laboratory Corp. of America Holdings* | | | 117,157,532 | |
| | | | | | | | |
| | | | | | | 484,715,193 | |
| | |
| | Health Care Technology* – 0.6% | | | | |
| | 4,875,377 | | | Allscripts Healthcare Solutions, Inc. | | | 58,528,901 | |
| | |
| | Hotels, Restaurants & Leisure – 2.1% | | | | |
| | 5,018,689 | | | MGM Resorts International* | | | 109,056,112 | |
| | 1,176,683 | | | Starwood Hotels & Resorts Worldwide, Inc. | | | 94,522,945 | |
| | | | | | | | |
| | | | | | | 203,579,057 | |
| | |
| | Household Durables* – 1.7% | | | | |
| | 434,654 | | | Mohawk Industries, Inc. | | | 80,128,465 | |
| | 2,050,227 | | | Toll Brothers, Inc. | | | 78,544,196 | |
| | | | | | | | |
| | | | | | | 158,672,661 | |
| | |
| | Household Products – 1.5% | | | | |
| | 1,055,011 | | | Energizer Holdings, Inc. | | | 141,192,122 | |
| | |
| | Independent Power Producers & Energy Traders – 0.8% | |
| | 3,192,225 | | | NRG Energy, Inc. | | | 76,549,556 | |
| | |
| | Insurance – 8.4% | | | | |
| | 2,192,482 | | | Arthur J. Gallagher & Co. | | | 103,024,729 | |
| | 656,784 | | | Everest Re Group Ltd. | | | 116,533,185 | |
| | 5,625,797 | | | Genworth Financial, Inc. Class A* | | | 43,599,927 | |
| | 3,101,935 | | | Lincoln National Corp. | | | 178,795,533 | |
| | 2,314,624 | | | Principal Financial Group, Inc. | | | 118,439,310 | |
| | 1,407,269 | | | Unum Group | | | 47,227,948 | |
| | 1,796,934 | | | Validus Holdings Ltd. | | | 74,824,332 | |
| | 3,060,244 | | | XL Group PLC | | | 110,780,833 | |
| | | | | | | | |
| | | | | | | 793,225,797 | |
| | |
| | Internet & Catalog Retail – 1.7% | |
| �� | 922,763 | | | Expedia, Inc. | | | 84,663,505 | |
| | 2,462,623 | | | Liberty Interactive Corp. Class A* | | | 72,721,257 | |
| | | | | | | | |
| | | | | | | 157,384,762 | |
| | |
| | |
| 44 | | The accompanying notes are an integral part of these financial statements. |
GOLDMAN SACHS MID CAP VALUE FUND
| | | | | | | | |
Shares | | | Description | | Value | |
| | Common Stocks – (continued) | |
| | Internet Software & Services* – 1.1% | |
| | 1,140,057 | | | AOL, Inc. | | $ | 46,217,911 | |
| | 3,744,049 | | | Pandora Media, Inc. | | | 55,411,925 | |
| | | | | | | | |
| | | | | | | 101,629,836 | |
| | |
| | IT Services – 2.1% | |
| | 598,449 | | | WEX, Inc.* | | | 64,028,059 | |
| | 9,596,785 | | | Xerox Corp. | | | 130,996,115 | |
| | | | | | | | |
| | | | | | | 195,024,174 | |
| | |
| | Leisure Equipment & Products* – 0.9% | |
| | 1,933,209 | | | Vista Outdoor, Inc. | | | 84,403,905 | |
| | |
| | Machinery – 1.0% | |
| | 3,506,749 | | | Terex Corp. | | | 96,119,990 | |
| | |
| | Marine* – 0.8% | |
| | 1,007,291 | | | Kirby Corp. | | | 77,641,990 | |
| | |
| | Media – 3.4% | |
| | 1,380,073 | | | AMC Networks, Inc. Class A* | | | 99,392,857 | |
| | 1,453,126 | | | Discovery Communications, Inc. Class A* | | | 46,935,970 | |
| | 545,668 | | | Liberty Broadband Corp. Class C* | | | 28,407,476 | |
| | 2,647,467 | | | Liberty Media Corp. Class C* | | | 102,192,226 | |
| | 664,179 | | | Scripps Networks Interactive Class A | | | 48,020,142 | |
| | | | | | | | |
| | | | | | | 324,948,671 | |
| | |
| | Metals & Mining – 0.9% | |
| | 1,344,099 | | | Carpenter Technology Corp. | | | 56,936,034 | |
| | 497,113 | | | Reliance Steel & Aluminum Co. | | | 28,340,412 | |
| | | | | | | | |
| | | | | | | 85,276,446 | |
| | |
| | Multi-Utilities – 4.1% | |
| | 2,171,247 | | | PG&E Corp. | | | 116,661,101 | |
| | 1,580,144 | | | SCANA Corp. | | | 89,989,201 | |
| | 1,705,443 | | | Sempra Energy | | | 184,528,933 | |
| | | | | | | | |
| | | | | | | 391,179,235 | |
| | |
| | Oil, Gas & Consumable Fuels – 4.6% | |
| | 4,523,199 | | | Chesapeake Energy Corp. | | | 75,446,959 | |
| | 2,189,828 | | | Devon Energy Corp. | | | 134,871,507 | |
| | 610,898 | | | Pioneer Natural Resources Co. | | | 93,174,163 | |
| | 5,267,017 | | | Southwestern Energy Co.* | | | 132,096,786 | |
| | | | | | | | |
| | | | | | | 435,589,415 | |
| | |
| | Pharmaceuticals* – 2.4% | |
| | 1,725,111 | | | Endo International PLC | | | 147,669,502 | |
| | 1,343,161 | | | Mylan, Inc. | | | 76,996,704 | |
| | | | | | | | |
| | | | | | | 224,666,206 | |
| | |
| | Professional Services – 0.4% | |
| | 267,419 | | | The Dun & Bradstreet Corp. | | | 35,427,669 | |
| | |
| | Real Estate Investment Trusts – 5.7% | |
| | 307,579 | | | AvalonBay Communities, Inc. | | | 51,777,849 | |
| | 6,125,620 | | | Brixmor Property Group, Inc. | | | 155,590,748 | |
| | 6,110,839 | | | DDR Corp. | | | 115,739,291 | |
| | 2,931,487 | | | RLJ Lodging Trust | | | 93,250,601 | |
| | 5,037,780 | | | Starwood Property Trust, Inc. | | | 122,921,832 | |
| | | | | | | | |
| | | | | | | 539,280,321 | |
| | |
| | | | | | | | |
Shares | | | Description | | Value | |
| | Common Stocks – (continued) | |
| | Road & Rail – 2.1% | |
| | 4,268,208 | | | Hertz Global Holdings, Inc.* | | $ | 98,467,558 | |
| | 900,040 | | | Kansas City Southern | | | 104,260,634 | |
| | | | | | | | |
| | | | | | | 202,728,192 | |
| | |
| | Semiconductors & Semiconductor Equipment – 4.8% | |
| | 3,878,980 | | | Altera Corp. | | | 143,561,050 | |
| | 9,262,859 | | | Atmel Corp.* | | | 77,252,244 | |
| | 3,369,376 | | | Broadcom Corp. Class A | | | 152,396,876 | |
| | 2,281,956 | | | Maxim Integrated Products, Inc. | | | 78,487,877 | |
| | | | | | | | |
| | | | | | | 451,698,047 | |
| | |
| | Software* – 3.2% | |
| | 882,974 | | | Check Point Software Technologies Ltd. | | | 73,719,499 | |
| | 1,262,102 | | | Citrix Systems, Inc. | | | 80,364,345 | |
| | 1,286,961 | | | Informatica Corp. | | | 55,268,540 | |
| | 1,071,599 | | | VMware, Inc. Class A | | | 91,160,927 | |
| | | | | | | | |
| | | | | | | 300,513,311 | |
| | |
| | Specialty Retail – 4.6% | |
| | 1,969,325 | | | Best Buy Co., Inc. | | | 75,031,282 | |
| | 963,123 | | | GNC Acquisition Holdings, Inc. Class A | | | 46,316,585 | |
| | 6,088,419 | | | Staples, Inc. | | | 102,072,345 | |
| | 3,510,507 | | | The Gap, Inc. | | | 146,037,091 | |
| | 1,801,696 | | | Urban Outfitters, Inc.* | | | 70,194,076 | |
| | | | | | | | |
| | | | | | | 439,651,379 | |
| | |
| | Textiles, Apparel & Luxury Goods* – 1.2% | |
| | 762,986 | | | Fossil Group, Inc. | | | 65,624,426 | |
| | 1,460,193 | | | Kate Spade & Co. | | | 50,303,649 | |
| | | | | | | | |
| | | | | | | 115,928,075 | |
| | |
| | TOTAL COMMON STOCKS | | | | |
| | (Cost $7,814,556,056) | | $ | 9,169,356,058 | |
| | |
| | | | | | | | |
| | Investment Company(a) – 3.4% | |
| | 326,511,533 | | | Goldman Sachs Financial Square Government Fund – Institutional Shares | | $ | 326,511,533 | |
| | (Cost $326,511,533) | | | | |
| | |
| | TOTAL INVESTMENTS – 100.1% | | | | |
| | (Cost $8,141,067,589) | | $ | 9,495,867,591 | |
| | |
| LIABILITIES IN EXCESS OF
OTHER ASSETS – (0.1)% | | | (11,517,284 | ) |
| | |
| | NET ASSETS – 100.0% | | $ | 9,484,350,307 | |
| | |
| | |
| The percentage shown for each investment category reflects the value of investments in that category as a percentage of net assets. |
* | | Non-income producing security. |
(a) | | Represents an Affiliated Fund. |
| | |
| The accompanying notes are an integral part of these financial statements. | | 45 |
GOLDMAN SACHS SMALL CAP VALUE FUND
Schedule of Investments
February 28, 2015 (Unaudited)
| | | | | | | | |
Shares | | | Description | | Value | |
| | Common Stocks – 94.7% | |
| | Aerospace & Defense – 2.7% | | | | |
| | 61,845 | | | Cubic Corp. | | $ | 3,232,638 | |
| | 630,089 | | | Curtiss-Wright Corp. | | | 45,731,860 | |
| | 686,114 | | | Esterline Technologies Corp.* | | | 80,858,535 | |
| | 589,173 | | | Moog, Inc. Class A* | | | 44,458,994 | |
| | | | | | | | |
| | | | | | | 174,282,027 | |
| | |
| | Air Freight & Logistics – 0.5% | | | | |
| | 636,415 | | | Forward Air Corp. | | | 34,048,203 | |
| | |
| | Auto Components* – 0.8% | | | | |
| | 1,016,912 | | | American Axle & Manufacturing Holdings, Inc. | | | 25,341,447 | |
| | 175,266 | | | Tenneco, Inc. | | | 10,207,492 | |
| | 512,885 | | | Tower International, Inc. | | | 13,883,797 | |
| | | | | | | | |
| | | | | | | 49,432,736 | |
| | |
| | Biotechnology* – 0.8% | | | | |
| | 1,663,897 | | | Infinity Pharmaceuticals, Inc. | | | 25,291,234 | |
| | 158,577 | | | Ligand Pharmaceuticals, Inc. | | | 8,732,835 | |
| | 354,047 | | | TESARO, Inc. | | | 18,881,327 | |
| | | | | | | | |
| | | | | | | 52,905,396 | |
| | |
| | Building Products* – 0.6% | | | | |
| | 1,009,685 | | | Continental Building Products, Inc. | | | 21,062,029 | |
| | 896,248 | | | NCI Building Systems, Inc. | | | 15,092,816 | |
| | | | | | | | |
| | | | | | | 36,154,845 | |
| | |
| | Capital Markets – 2.1% | | | | |
| | 212,309 | | | Cohen & Steers, Inc. | | | 8,846,916 | |
| | 466,990 | | | Golub Capital BDC, Inc. | | | 8,293,742 | |
| | 301,007 | | | Moelis & Co. | | | 9,686,405 | |
| | 732,668 | | | New Mountain Finance Corp. | | | 10,909,427 | |
| | 1,577,053 | | | OM Asset Management PLC* | | | 28,323,872 | |
| | 944,818 | | | Stifel Financial Corp.* | | | 51,747,682 | |
| | 157,431 | | | Virtus Investment Partners, Inc. | | | 20,776,169 | |
| | | | | | | | |
| | | | | | | 138,584,213 | |
| | |
| | Chemicals – 2.6% | | | | |
| | 210,761 | | | Axiall Corp. | | | 9,760,342 | |
| | 423,786 | | | Cytec Industries, Inc. | | | 22,261,478 | |
| | 217,929 | | | H.B. Fuller Co. | | | 9,741,426 | |
| | 490,622 | | | Methanex Corp. | | | 26,640,775 | |
| | 155,594 | | | Minerals Technologies, Inc. | | | 11,394,149 | |
| | 875,765 | | | PolyOne Corp. | | | 34,802,901 | |
| | 274,977 | | | Quaker Chemical Corp. | | | 22,322,633 | |
| | 131,363 | | | Tronox Ltd. Class A | | | 2,842,695 | |
| | 318,593 | | | W.R. Grace & Co.* | | | 31,588,496 | |
| | | | | | | | |
| | | | | | | 171,354,895 | |
| | |
| | Commercial Banks – 13.5% | | | | |
| | 2,236,394 | | | BancorpSouth, Inc. | | | 50,072,862 | |
| | 1,678,948 | | | Bank of the Ozarks, Inc. | | | 61,449,497 | |
| | 670,795 | | | Banner Corp. | | | 29,286,910 | |
| | 2,104,164 | | | Boston Private Financial Holdings, Inc. | | | 26,407,258 | |
| | 364,940 | | | Bridge Capital Holdings* | | | 7,846,210 | |
| | 753,828 | | | CoBiz, Inc. | | | 8,510,718 | |
| | |
| | | | | | | | |
Shares | | | Description | | Value | |
| | Common Stocks – (continued) | |
| | Commercial Banks – (continued) | | | | |
| | 754,130 | | | Community Bank System, Inc. | | $ | 26,786,698 | |
| | 398,424 | | | ConnectOne Bancorp, Inc. | | | 7,275,222 | |
| | 821,759 | | | CVB Financial Corp. | | | 12,860,528 | |
| | 955,781 | | | First Financial Bankshares, Inc. | | | 25,108,367 | |
| | 1,058,508 | | | First Midwest Bancorp, Inc. | | | 18,100,487 | |
| | 845,018 | | | Flushing Financial Corp. | | | 16,545,452 | |
| | 1,361,724 | | | Glacier Bancorp, Inc. | | | 33,076,276 | |
| | 944,840 | | | Great Western Bancorp, Inc. | | | 21,731,320 | |
| | 444,391 | | | Heritage Financial Corp. | | | 7,163,583 | |
| | 878,217 | | | Home Bancshares, Inc. | | | 27,795,568 | |
| | 545,132 | | | Independent Bank Corp. | | | 22,797,420 | |
| | 237,255 | | | Independent Bank Group, Inc. | | | 8,557,788 | |
| | 293,658 | | | Lakeland Financial Corp. | | | 11,464,408 | |
| | 1,340,237 | | | LegacyTexas Financial Group, Inc. | | | 30,825,451 | |
| | 1,400,954 | | | MB Financial, Inc. | | | 43,695,755 | |
| | 1,093,952 | | | PacWest Bancorp | | | 50,141,290 | |
| | 848,589 | | | Pinnacle Financial Partners, Inc. | | | 35,640,738 | |
| | 1,920,865 | | | PrivateBancorp, Inc. | | | 66,711,641 | |
| | 559,046 | | | Prosperity Bancshares, Inc. | | | 28,919,450 | |
| | 369,563 | | | Sandy Spring Bancorp, Inc. | | | 9,527,334 | |
| | 151,119 | | | Sierra Bancorp | | | 2,445,105 | |
| | 497,150 | | | South State Corp. | | | 33,572,540 | |
| | 122,272 | | | Southcoast Financial Corp.* | | | 868,131 | |
| | 622,505 | | | Southwest Bancorp, Inc. | | | 10,370,933 | |
| | 662,806 | | | State Bank Financial Corp. | | | 13,521,242 | |
| | 147,223 | | | Summit State Bank | | | 2,012,538 | |
| | 429,190 | | | Texas Capital Bancshares, Inc.* | | | 19,927,292 | |
| | 269,692 | | | The First of Long Island Corp. | | | 6,618,242 | |
| | 368,672 | | | TriCo Bancshares | | | 8,811,261 | |
| | 720,579 | | | UMB Financial Corp. | | | 37,138,642 | |
| | 1,751,869 | | | Webster Financial Corp. | | | 60,492,037 | |
| | | | | | | | |
| | | | | | | 884,076,194 | |
| | |
| | Commercial Services & Supplies – 1.5% | | | | |
| | 920,326 | | | Ceco Environmental Corp. | | | 13,096,239 | |
| | 328,863 | | | G&K Services, Inc. Class A | | | 23,674,847 | |
| | 879,219 | | | Mobile Mini, Inc. | | | 36,478,796 | |
| | 931,048 | | | Progressive Waste Solutions Ltd. | | | 26,060,034 | |
| | | | | | | | |
| | | | | | | 99,309,916 | |
| | |
| | Communications Equipment – 1.4% | | | | |
| | 785,551 | | | ADTRAN, Inc. | | | 16,912,913 | |
| | 715,931 | | | Digi International, Inc.* | | | 7,574,550 | |
| | 2,827,947 | | | Extreme Networks, Inc.* | | | 10,039,212 | |
| | 2,110,411 | | | JDS Uniphase Corp.* | | | 29,060,359 | |
| | 1,208,175 | | | RADWARE Ltd.* | | | 25,661,637 | |
| | | | | | | | |
| | | | | | | 89,248,671 | |
| | |
| | Computers & Peripherals* – 0.4% | | | | |
| | 643,651 | | | Electronics for Imaging, Inc. | | | 26,132,231 | |
| | |
| | Construction & Engineering – 1.1% | | | | |
| | 881,633 | | | Comfort Systems USA, Inc. | | | 16,486,537 | |
| | 831,404 | | | EMCOR Group, Inc. | | | 36,606,718 | |
| | 715,050 | | | MYR Group, Inc.* | | | 19,763,982 | |
| | | | | | | | |
| | | | | | | 72,857,237 | |
| | |
| | |
| 46 | | The accompanying notes are an integral part of these financial statements. |
GOLDMAN SACHS SMALL CAP VALUE FUND
| | | | | | | | |
Shares | | | Description | | Value | |
| | Common Stocks – (continued) | |
| | Consumer Finance* – 0.2% | | | | |
| | 343,645 | | | First Cash Financial Services, Inc. | | $ | 16,543,070 | |
| | |
| | Containers & Packaging* – 1.2% | | | | |
| | 1,480,557 | | | Berry Plastics Group, Inc. | | | 50,797,911 | |
| | 1,785,028 | | | Graphic Packaging Holding Co. | | | 26,936,072 | |
| | | | | | | | |
| | | | | | | 77,733,983 | |
| | |
| | Distributors – 0.4% | | | | |
| | 371,618 | | | Core-Mark Holding Co., Inc. | | | 26,132,178 | |
| | |
| | Diversified Financial Services – 0.4% | | | | |
| | 290,344 | | | MarketAxess Holdings, Inc. | | | 23,108,479 | |
| | |
| | Diversified Telecommunication Services*(a) – 0.3% | | | | |
| | 2,358,198 | | | Premiere Global Services, Inc. | | | 22,968,849 | |
| | |
| | Electric Utilities – 2.9% | | | | |
| | 804,979 | | | ALLETE, Inc. | | | 44,145,048 | |
| | 849,777 | | | IDACORP, Inc. | | | 53,213,036 | |
| | 257,483 | | | Otter Tail Corp. | | | 8,424,844 | |
| | 1,065,944 | | | PNM Resources, Inc. | | | 30,432,701 | |
| | 1,449,653 | | | Portland General Electric Co. | | | 54,057,560 | |
| | | | | | | | |
| | | | | | | 190,273,189 | |
| | |
| | Electrical Equipment* – 0.3% | | | | |
| | 809,136 | | | Thermon Group Holdings, Inc. | | | 19,840,015 | |
| | |
| | Electronic Equipment, Instruments & Components – 1.9% | |
| | 395,688 | | | Anixter International, Inc.* | | | 31,215,826 | |
| | 294,608 | | | Belden, Inc. | | | 26,155,298 | |
| | 1,012,260 | | | CTS Corp. | | | 17,674,060 | |
| | 227,807 | | | Littelfuse, Inc. | | | 22,853,598 | |
| | 1,288,736 | | | Newport Corp.* | | | 25,723,171 | |
| | | | | | | | |
| | | | | | | 123,621,953 | |
| | |
| | Energy Equipment & Services* – 0.6% | | | | |
| | 666,605 | | | Forum Energy Technologies, Inc. | | | 13,018,796 | |
| | 1,013,116 | | | Newpark Resources, Inc. | | | 9,594,208 | |
| | 134,488 | | | Oil States International, Inc. | | | 5,847,538 | |
| | 1,654,170 | | | TETRA Technologies, Inc. | | | 9,875,395 | |
| | | | | | | | |
| | | | | | | 38,335,937 | |
| | |
| | Food & Staples Retailing* – 0.1% | | | | |
| | 610,892 | | | SUPERVALU, Inc. | | | 6,035,613 | |
| | |
| | Food Products – 1.1% | | | | |
| | 402,941 | | | B&G Foods, Inc. | | | 11,544,260 | |
| | 176,219 | | | Freshpet, Inc.* | | | 3,247,716 | |
| | 186,275 | | | J&J Snack Foods Corp. | | | 18,849,167 | |
| | 641,853 | | | The Hain Celestial Group, Inc.* | | | 40,135,068 | |
| | | | | | | | |
| | | | | | | 73,776,211 | |
| | |
| | Gas Utilities – 1.3% | | | | |
| | 361,652 | | | New Jersey Resources Corp. | | | 22,632,182 | |
| | 1,059,365 | | | Southwest Gas Corp. | | | 60,659,240 | |
| | | | | | | | |
| | | | | | | 83,291,422 | |
| | |
| | Health Care Equipment & Supplies* – 1.4% | | | | |
| | 2,495,762 | | | Endologix, Inc. | | | 39,358,167 | |
| | |
| | | | | | | | |
Shares | | | Description | | Value | |
| | Common Stocks – (continued) | |
| | Health Care Equipment & Supplies* – (continued) | |
| | 535,292 | | | Integra LifeSciences Holdings Corp. | | $ | 32,122,873 | |
| | 930,355 | | | Tornier NV | | | 22,737,876 | |
| | | | | | | | |
| | | | | | | 94,218,916 | |
| | |
| | Health Care Providers & Services – 1.7% | | | | |
| | 333,525 | | | Adeptus Health, Inc. Class A* | | | 14,791,834 | |
| | 666,922 | | | Air Methods Corp.* | | | 35,340,197 | |
| | 1,199,404 | | | HealthSouth Corp. | | | 52,126,098 | |
| | 217,011 | | | Surgical Care Affiliates, Inc.* | | | 7,048,517 | |
| | | | | | | | |
| | | | | | | 109,306,646 | |
| | |
| | Health Care Technology – 1.1% | | | | |
| | 4,338,075 | | | Allscripts Healthcare Solutions, Inc.* | | | 52,078,590 | |
| | 972,716 | | | Quality Systems, Inc. | | | 16,905,804 | |
| | | | | | | | |
| | | | | | | 68,984,394 | |
| | |
| | Hotels, Restaurants & Leisure – 3.6% | | | | |
| | 1,037,427 | | | Bloomin’ Brands, Inc.* | | | 26,724,119 | |
| | 1,244,477 | | | Diamond Resorts International, Inc.* | | | 43,121,128 | |
| | 232,824 | | | DineEquity, Inc. | | | 25,268,389 | |
| | 563,403 | | | Jack in the Box, Inc. | | | 54,475,436 | |
| | 504,062 | | | Krispy Kreme Doughnuts, Inc.* | | | 10,998,633 | |
| | 373,765 | | | Marriott Vacations Worldwide Corp. | | | 28,428,566 | |
| | 522,717 | | | Vail Resorts, Inc. | | | 45,899,780 | |
| | | | | | | | |
| | | | | | | 234,916,051 | |
| | |
| | Household Durables* – 0.9% | | | | |
| | 531,738 | | | Meritage Homes Corp. | | | 23,667,658 | |
| | 2,698,716 | | | Standard Pacific Corp. | | | 23,586,778 | |
| | 507,230 | | | William Lyon Homes Class A | | | 11,509,049 | |
| | | | | | | | |
| | | | | | | 58,763,485 | |
| | |
| | Household Products – 1.0% | | | | |
| | 673,761 | | | Spectrum Brands Holdings, Inc. | | | 63,117,930 | |
| | |
| | Independent Power Producers & Energy Traders* – 0.5% | |
| | 1,262,222 | | | Dynegy, Inc. | | | 35,178,127 | |
| | |
| | Industrial Conglomerates – 0.7% | | | | |
| | 518,705 | | | Carlisle Cos., Inc. | | | 48,275,874 | |
| | |
| | Insurance – 4.8% | | | | |
| | 2,166,635 | | | American Equity Investment Life Holding Co. | | | 61,727,431 | |
| | 296,688 | | | AMERISAFE, Inc. | | | 12,324,420 | |
| | 315,477 | | | AmTrust Financial Services, Inc. | | | 17,004,210 | |
| | 3,474,732 | | | CNO Financial Group, Inc. | | | 56,499,142 | |
| | 450,782 | | | Endurance Specialty Holdings Ltd. | | | 28,656,212 | |
| | 86,280 | | | Enstar Group Ltd.* | | | 12,001,548 | |
| | 489,745 | | | Fidelity & Guaranty Life | | | 10,127,927 | |
| | 2,589,833 | | | Maiden Holdings Ltd. | | | 37,060,510 | |
| | 698,315 | | | National General Holdings Corp. | | | 12,988,659 | |
| | 532,546 | | | ProAssurance Corp. | | | 23,959,245 | |
| | 421,840 | | | RLI Corp. | | | 20,412,838 | |
| | 889,194 | | | Symetra Financial Corp. | | | 20,078,000 | |
| | | | | | | | |
| | | | | | | 312,840,142 | |
| | |
| | |
| The accompanying notes are an integral part of these financial statements. | | 47 |
GOLDMAN SACHS SMALL CAP VALUE FUND
Schedule of Investments (continued)
February 28, 2015 (Unaudited)
| | | | | | | | |
Shares | | | Description | | Value | |
| | Common Stocks – (continued) | |
| | Internet & Catalog Retail – 0.5% | | | | |
| | 441,844 | | | HSN, Inc. | | $ | 29,855,399 | |
| | |
| | Internet Software & Services*(a) – 0.3% | | | | |
| | 1,592,255 | | | Everyday Health, Inc. | | | 22,769,247 | |
| | |
| | IT Services – 0.6% | | | | |
| | 1,638,544 | | | Convergys Corp. | | | 36,621,458 | |
| | |
| | Leisure Equipment & Products – 0.0% | | | | |
| | 59,728 | | | Brunswick Corp. | | | 3,239,647 | |
| | |
| | Life Sciences Tools & Services* – 0.8% | | | | |
| | 1,072,952 | | | Albany Molecular Research, Inc. | | | 17,403,282 | |
| | 1,944,145 | | | Bruker Corp. | | | 36,997,079 | |
| | | | | | | | |
| | | | | | | 54,400,361 | |
| | |
| | Machinery – 3.6% | | | | |
| | 1,513,286 | | | Actuant Corp. Class A | | | 38,497,996 | |
| | 254,014 | | | Alamo Group, Inc. | | | 12,738,802 | |
| | 622,987 | | | Barnes Group, Inc. | | | 24,931,940 | |
| | 278,740 | | | CIRCOR International, Inc. | | | 14,959,976 | |
| | 548,453 | | | CLARCOR, Inc. | | | 36,093,692 | |
| | 201,106 | | | Graco, Inc. | | | 15,239,813 | |
| | 382,258 | | | RBC Bearings, Inc. | | | 23,719,109 | |
| | 230,913 | | | Standex International Corp. | | | 16,741,192 | |
| | 499,378 | | | Watts Water Technologies, Inc. Class A | | | 27,455,802 | |
| | 450,141 | | | Woodward, Inc. | | | 21,854,346 | |
| | | | | | | | |
| | | | | | | 232,232,668 | |
| | |
| | Media – 1.5% | | | | |
| | 743,239 | | | Carmike Cinemas, Inc.* | | | 23,226,219 | |
| | 1,827,619 | | | Live Nation Entertainment, Inc.* | | | 46,768,770 | |
| | 408,400 | | | Nexstar Broadcasting Group, Inc. Class A | | | 22,270,052 | |
| | 378,748 | | | Townsquare Media, Inc.* | | | 5,010,836 | |
| | | | | | | | |
| | | | | | | 97,275,877 | |
| | |
| | Metals & Mining – 1.1% | | | | |
| | 2,855,254 | | | AK Steel Holding Corp.* | | | 12,620,223 | |
| | 190,033 | | | Commercial Metals Co. | | | 2,859,997 | |
| | 1,019,357 | | | Globe Specialty Metals, Inc. | | | 16,972,294 | |
| | 494,331 | | | Kaiser Aluminum Corp. | | | 37,346,707 | |
| | 107,786 | | | TimkenSteel Corp. | | | 3,240,047 | |
| | | | | | | | |
| | | | | | | 73,039,268 | |
| | |
| | Multi-Utilities – 1.1% | | | | |
| | 527,662 | | | Black Hills Corp. | | | 26,821,059 | |
| | 844,194 | | | NorthWestern Corp. | | | 45,746,873 | |
| | | | | | | | |
| | | | | | | 72,567,932 | |
| | |
| | Multiline Retail* – 0.6% | | | | |
| | 687,382 | | | Burlington Stores, Inc. | | | 38,197,818 | |
| | |
| | Oil, Gas & Consumable Fuels – 2.6% | | | | |
| | 722,375 | | | Laredo Petroleum, Inc.* | | | 8,617,934 | |
| | 2,163,089 | | | Parsley Energy, Inc. Class A* | | | 32,208,395 | |
| | 3,675,703 | | | Rex Energy Corp.*(a) | | | 18,010,945 | |
| | |
| | | | | | | | |
Shares | | | Description | | Value | |
| | Common Stocks – (continued) | |
| | Oil, Gas & Consumable Fuels – (continued) | | | | |
| | 2,174,060 | | | Rice Energy, Inc.* | | $ | 42,568,095 | |
| | 1,374,783 | | | SM Energy Co. | | | 66,704,471 | |
| | | | | | | | |
| | | | | | | 168,109,840 | |
| | |
| | Paper & Forest Products – 0.6% | | | | |
| | 1,111,602 | | | KapStone Paper and Packaging Corp. | | | 38,305,805 | |
| | |
| | Pharmaceuticals* – 0.8% | | | | |
| | 990,801 | | | Catalent, Inc. | | | 27,712,704 | |
| | 623,965 | | | Prestige Brands Holdings, Inc. | | | 24,047,611 | |
| | | | | | | | |
| | | | | | | 51,760,315 | |
| | |
| | Professional Services* – 0.6% | | | | |
| | 502,814 | | | On Assignment, Inc. | | | 19,212,523 | |
| | 746,234 | | | TrueBlue, Inc. | | | 17,170,844 | |
| | | | | | | | |
| | | | | | | 36,383,367 | |
| | |
| | Real Estate Investment Trusts – 12.4% | | | | |
| | 1,767,613 | | | Acadia Realty Trust | | | 60,381,660 | |
| | 1,985,059 | | | Apollo Commercial Real Estate Finance, Inc. | | | 33,924,658 | |
| | 1,402,568 | | | Blackstone Mortgage Trust, Inc. Class A | | | 40,548,241 | |
| | 2,155,047 | | | CBL & Associates Properties, Inc. | | | 43,144,041 | |
| | 2,113,527 | | | Chesapeake Lodging Trust | | | 75,157,020 | |
| | 2,439,488 | | | CubeSmart | | | 56,596,122 | |
| | 1,155,735 | | | DuPont Fabros Technology, Inc. | | | 36,186,063 | |
| | 1,160,573 | | | Highwoods Properties, Inc. | | | 52,933,735 | |
| | 1,478,476 | | | Hudson Pacific Properties, Inc. | | | 47,252,093 | |
| | 4,073,265 | | | MFA Financial, Inc. | | | 32,423,189 | |
| | 877,559 | | | National Health Investors, Inc. | | | 62,464,650 | |
| | 1,568,723 | | | Pebblebrook Hotel Trust | | | 76,208,563 | |
| | 579,357 | | | PS Business Parks, Inc. | | | 48,190,915 | |
| | 141,873 | | | Sovran Self Storage, Inc. | | | 13,055,153 | |
| | 4,960,185 | | | Strategic Hotels & Resorts, Inc.* | | | 65,077,627 | |
| | 1,879,318 | | | Terreno Realty Corp. | | | 41,420,169 | |
| | 2,681,281 | | | Two Harbors Investment Corp. | | | 27,992,574 | |
| | | | | | | | |
| | | | | | | 812,956,473 | |
| | |
| | Real Estate Management & Development – 0.8% | |
| | 1,869,710 | | | Kennedy-Wilson Holdings, Inc. | | | 50,033,440 | |
| | |
| | Semiconductors & Semiconductor Equipment – 3.6% | |
| | 583,936 | | | Cabot Microelectronics Corp.* | | | 30,253,724 | |
| | 3,235,438 | | | Entegris, Inc.* | | | 43,387,224 | |
| | 1,469,367 | | | Fairchild Semiconductor International, Inc.* | | | 25,625,760 | |
| | 3,019,911 | | | Intersil Corp. Class A | | | 47,080,413 | |
| | 957,044 | | | MKS Instruments, Inc. | | | 33,841,076 | |
| | 981,940 | | | Semtech Corp.* | | | 28,407,524 | |
| | 554,394 | | | Silicon Laboratories, Inc.* | | | 28,074,512 | |
| | | | | | | | |
| | | | | | | 236,670,233 | |
| | |
| | Software – 1.9% | |
| | 850,745 | | | Bottomline Technologies de, Inc.* | | | 22,527,728 | |
| | 743,674 | | | Monotype Imaging Holdings, Inc. | | | 23,805,005 | |
| | |
| | |
| 48 | | The accompanying notes are an integral part of these financial statements. |
GOLDMAN SACHS SMALL CAP VALUE FUND
| | | | | | | | |
Shares | | | Description | | Value | |
| | Common Stocks – (continued) | |
| | Software – (continued) | | | | |
| | 756,512 | | | Pegasystems, Inc. | | $ | 14,971,372 | |
| | 794,460 | | | PTC, Inc.* | | | 27,532,011 | |
| | 545,863 | | | Verint System, Inc.* | | | 33,229,410 | |
| | | | | | | | |
| | | | | | | 122,065,526 | |
| | |
| | Specialty Retail – 2.9% | |
| | 1,232,027 | | | American Eagle Outfitters, Inc. | | | 18,443,444 | |
| | 254,279 | | | Asbury Automotive Group, Inc.* | | | 20,004,129 | |
| | 542,659 | | | Boot Barn Holdings, Inc.* | | | 13,354,838 | |
| | 38,288 | | | Genesco, Inc.* | | | 2,811,488 | |
| | 614,807 | | | GNC Acquisition Holdings, Inc. Class A | | | 29,566,069 | |
| | 463,346 | | | Lithia Motors, Inc. Class A | | | 43,767,663 | |
| | 253,585 | | | Monro Muffler Brake, Inc. | | | 16,036,715 | |
| | 5,138,241 | | | Office Depot, Inc.* | | | 48,145,318 | |
| | | | | | | | |
| | | | | | | 192,129,664 | |
| | |
| | Textiles, Apparel & Luxury Goods – 0.7% | |
| | 302,459 | | | Carter’s, Inc. | | | 26,849,285 | |
| | 177,412 | | | Movado Group, Inc. | | | 4,557,714 | |
| | 426,605 | | | Steven Madden Ltd.* | | | 15,575,349 | |
| | | | | | | | |
| | | | | | | 46,982,348 | |
| | |
| | Thrifts & Mortgage Finance – 1.7% | |
| | 807,462 | | | Brookline Bancorp, Inc. | | | 7,816,232 | |
| | 553,515 | | | Dime Community Bancshares | | | 8,612,693 | |
| | 692,991 | | | Oritani Financial Corp. | | | 9,916,701 | |
| | 1,085,322 | | | Provident Financial Services, Inc. | | | 19,752,861 | |
| | 3,258,955 | | | Radian Group, Inc. | | | 51,524,079 | |
| | 170,245 | | | WSFS Financial Corp. | | | 13,234,846 | |
| | | | | | | | |
| | | | | | | 110,857,412 | |
| | |
| | Trading Companies & Distributors – 1.6% | |
| | 540,539 | | | Applied Industrial Technologies, Inc. | | | 23,681,014 | |
| | 428,279 | | | Beacon Roofing Supply, Inc.* | | | 12,856,936 | |
| | 843,472 | | | Kaman Corp. | | | 35,004,088 | |
| | 474,631 | | | WESCO International, Inc.* | | | 32,953,630 | |
| | | | | | | | |
| | | | | | | 104,495,668 | |
| | |
| | TOTAL COMMON STOCKS | | | | |
| | (Cost $4,843,729,495) | | $ | 6,186,598,794 | |
| | |
| | | | | | | | |
| | | | | | | | |
Shares | | | Description | | Value | |
| | Exchange Traded Fund – 2.3% | |
| | 1,450,447 | | | iShares Russell 2000 Value ETF | | | | |
| | (Cost $146,080,023) | | $ | 147,757,036 | |
| | |
| | | | | | | | |
| | Investment Company(a) – 3.6% | |
| | 238,193,203 | | | Goldman Sachs Financial Square Government Fund – Institutional Shares | | $ | 238,193,203 | |
| | (Cost $238,193,203) | | | | |
| | |
| | TOTAL INVESTMENTS – 100.6% | | | | |
| | (Cost $5,228,002,721) | | $ | 6,572,549,033 | |
| | |
| LIABILITIES IN EXCESS OF
OTHER ASSETS – (0.6)% | | | (36,923,042 | ) |
| | |
| | NET ASSETS – 100.0% | | $ | 6,535,625,991 | |
| | |
| | |
| The percentage shown for each investment category reflects the value of investments in that category as a percentage of net assets. |
* | | Non-income producing security. |
(a) | | Represents an Affiliated Fund. |
| | |
|
Investment Abbreviation: |
ETF | | —Exchange Traded Fund |
|
| | |
| The accompanying notes are an integral part of these financial statements. | | 49 |
GOLDMAN SACHS SMALL/MID CAP VALUE FUND
Schedule of Investments
February 28, 2015 (Unaudited)
| | | | | | | | |
Shares | | | Description | | Value | |
| | Common Stocks – 99.4% | |
| | Aerospace & Defense – 2.4% | | | | |
| | 1,174 | | | Curtiss-Wright Corp. | | $ | 85,209 | |
| | 1,987 | | | Esterline Technologies Corp.* | | | 234,168 | |
| | 807 | | | Triumph Group, Inc. | | | 48,250 | |
| | | | | | | | |
| | | | | | | 367,627 | |
| | |
| | Auto Components – 1.7% | | | | |
| | 2,016 | | | American Axle & Manufacturing Holdings, Inc.* | | | 50,239 | |
| | 965 | | | BorgWarner, Inc. | | | 59,309 | |
| | 1,356 | | | Lear Corp. | | | 147,695 | |
| | | | | | | | |
| | | | | | | 257,243 | |
| | |
| | Beverages – 0.6% | | | | |
| | 1,324 | | | Molson Coors Brewing Co. Class B | | | 100,478 | |
| | |
| | Biotechnology* – 0.4% | | | | |
| | 378 | | | Ligand Pharmaceuticals, Inc. | | | 20,817 | |
| | 864 | | | TESARO, Inc. | | | 46,077 | |
| | | | | | | | |
| | | | | | | 66,894 | |
| | |
| | Building Products – 0.8% | | | | |
| | 1,207 | | | A.O. Smith Corp. | | | 76,077 | |
| | 1,188 | | | Fortune Brands Home & Security, Inc. | | | 55,028 | |
| | | | | | | | |
| | | | | | | 131,105 | |
| | |
| | Capital Markets – 2.3% | | | | |
| | 2,005 | | | Ares Capital Corp. | | | 34,686 | |
| | 5,054 | | | E*TRADE Financial Corp.* | | | 131,581 | |
| | 3,857 | | | OM Asset Management PLC* | | | 69,272 | |
| | 2,126 | | | Stifel Financial Corp.* | | | 116,441 | |
| | | | | | | | |
| | | | | | | 351,980 | |
| | |
| | Chemicals – 3.6% | | | | |
| | 766 | | | Ashland, Inc. | | | 97,757 | |
| | 3,806 | | | Axalta Coating Systems Ltd.* | | | 108,090 | |
| | 1,665 | | | Cytec Industries, Inc. | | | 87,462 | |
| | 1,131 | | | Methanex Corp. | | | 61,413 | |
| | 1,579 | | | PolyOne Corp. | | | 62,750 | |
| | 1,598 | | | RPM International, Inc. | | | 80,779 | |
| | 658 | | | W.R. Grace & Co.* | | | 65,241 | |
| | | | | | | | |
| | | | | | | 563,492 | |
| | |
| | Commercial Banks – 9.5% | | | | |
| | 3,993 | | | BancorpSouth, Inc. | | | 89,403 | |
| | 2,682 | | | Bank of Hawaii Corp. | | | 161,617 | |
| | 3,414 | | | Bank of the Ozarks, Inc. | | | 124,952 | |
| | 3,765 | | | BankUnited, Inc. | | | 122,024 | |
| | 3,623 | | | East West Bancorp, Inc. | | | 144,739 | |
| | 2,512 | | | Glacier Bancorp, Inc. | | | 61,016 | |
| | 3,602 | | | PacWest Bancorp | | | 165,098 | |
| | 4,050 | | | PrivateBancorp, Inc. | | | 140,657 | |
| | 1,190 | | | Prosperity Bancshares, Inc. | | | 61,559 | |
| | 1,243 | | | Signature Bank* | | | 153,324 | |
| | 696 | | | Texas Capital Bancshares, Inc.* | | | 32,315 | |
| | 1,465 | | | UMB Financial Corp. | | | 75,506 | |
| | 3,769 | | | Webster Financial Corp. | | | 130,144 | |
| | | | | | | | |
| | | | | | | 1,462,354 | |
| | |
| | | | | | | | |
Shares | | | Description | | Value | |
| | Common Stocks – (continued) | |
| | Commercial Services & Supplies – 0.6% | | | | |
| | 1,840 | | | Waste Connections, Inc. | | $ | 86,425 | |
| | |
| | Communications Equipment* – 0.8% | | | | |
| | 9,053 | | | JDS Uniphase Corp. | | | 124,660 | |
| | |
| | Construction & Engineering* – 0.5% | | | | |
| | 2,546 | | | Quanta Services, Inc. | | | 73,274 | |
| | |
| | Construction Materials – 0.3% | | | | |
| | 668 | | | Eagle Materials, Inc. | | | 52,438 | |
| | |
| | Consumer Finance* – 0.3% | | | | |
| | 824 | | | First Cash Financial Services, Inc. | | | 39,667 | |
| | |
| | Containers & Packaging – 2.3% | | | | |
| | 2,420 | | | MeadWestvaco Corp. | | | 128,405 | |
| | 2,443 | | | Packaging Corp. of America | | | 202,427 | |
| | 421 | | | Rock-Tenn Co. Class A | | | 28,898 | |
| | | | | | | | |
| | | | | | | 359,730 | |
| | |
| | Diversified Financial Services – 0.4% | | | | |
| | 709 | | | MarketAxess Holdings, Inc. | | | 56,429 | |
| | |
| | Electric Utilities – 2.8% | | | | |
| | 1,785 | | | IDACORP, Inc. | | | 111,777 | |
| | 3,561 | | | OGE Energy Corp. | | | 115,768 | |
| | 1,701 | | | Pinnacle West Capital Corp. | | | 109,000 | |
| | 2,668 | | | Westar Energy, Inc. | | | 103,652 | |
| | | | | | | | |
| | | | | | | 440,197 | |
| | |
| | Electrical Equipment – 1.1% | | | | |
| | 790 | | | Hubbell, Inc. Class B | | | 89,902 | |
| | 1,575 | | | Sensata Technologies Holding NV* | | | 84,641 | |
| | | | | | | | |
| | | | | | | 174,543 | |
| | |
| | Electronic Equipment, Instruments & Components – 3.0% | |
| | 1,103 | | | Anixter International, Inc.* | | | 87,016 | |
| | 2,343 | | | Avnet, Inc. | | | 107,333 | |
| | 536 | | | Belden, Inc. | | | 47,586 | |
| | 5,368 | | | Ingram Micro, Inc. Class A* | | | 132,643 | |
| | 6,062 | | | Vishay Intertechnology, Inc. | | | 86,323 | |
| | | | | | | | |
| | | | | | | 460,901 | |
| | |
| | Energy Equipment & Services* – 0.1% | | | | |
| | 319 | | | Oil States International, Inc. | | | 13,870 | |
| | |
| | Food & Staples Retailing* – 0.6% | | | | |
| | 11,789 | | | Rite Aid Corp. | | | 94,076 | |
| | |
| | Food Products – 1.7% | | | | |
| | 1,748 | | | Hormel Foods Corp. | | | 102,275 | |
| | 1,975 | | | Pinnacle Foods, Inc. | | | 71,693 | |
| | 1,406 | | | The Hain Celestial Group, Inc.* | | | 87,917 | |
| | | | | | | | |
| | | | | | | 261,885 | |
| | |
| | Gas Utilities – 2.0% | | | | |
| | 3,035 | | | Atmos Energy Corp. | | | 160,976 | |
| | 6,181 | | | Questar Corp. | | | 144,512 | |
| | | | | | | | |
| | | | | | | 305,488 | |
| | |
| | |
| 50 | | The accompanying notes are an integral part of these financial statements. |
GOLDMAN SACHS SMALL/MID CAP VALUE FUND
| | | | | | | | |
Shares | | | Description | | Value | |
| | Common Stocks – (continued) | |
| | Health Care Equipment & Supplies* – 0.4% | | | | |
| | 2,246 | | | Tornier NV | | $ | 54,892 | |
| | |
| | Health Care Providers & Services – 2.2% | | | | |
| | 4,171 | | | Envision Healthcare Holdings, Inc.* | | | 152,742 | |
| | 3,067 | | | HealthSouth Corp. | | | 133,292 | |
| | 1,088 | | | Tenet Healthcare Corp.* | | | 50,374 | |
| | | | | | | | |
| | | | | | | 336,408 | |
| | |
| | Health Care Technology* – 0.8% | | | | |
| | 10,400 | | | Allscripts Healthcare Solutions, Inc. | | | 124,852 | |
| | |
| | Hotels, Restaurants & Leisure – 2.0% | | | | |
| | 2,191 | | | Diamond Resorts International, Inc.* | | | 75,918 | |
| | 1,202 | | | Jack in the Box, Inc. | | | 116,221 | |
| | 3,815 | | | Krispy Kreme Doughnuts, Inc.* | | | 83,243 | |
| | 419 | | | Vail Resorts, Inc. | | | 36,793 | |
| | | | | | | | |
| | | | | | | 312,175 | |
| | |
| | Household Durables – 2.6% | | | | |
| | 3,270 | | | Jarden Corp.* | | | 173,539 | |
| | 2,283 | | | Lennar Corp. Class A | | | 114,629 | |
| | 2,806 | | | Toll Brothers, Inc.* | | | 107,498 | |
| | | | | | | | |
| | | | | | | 395,666 | |
| | |
| | Household Products – 1.0% | | | | |
| | 1,616 | | | Spectrum Brands Holdings, Inc. | | | 151,387 | |
| | |
| | Independent Power Producers & Energy Traders – 0.4% | | | | |
| | 2,699 | | | NRG Energy, Inc. | | | 64,722 | |
| | |
| | Industrial Conglomerates – 1.6% | | | | |
| | 2,711 | | | Carlisle Cos., Inc. | | | 252,313 | |
| | |
| | Insurance – 8.7% | | | | |
| | 4,133 | | | Allied World Assurance Co. Holdings AG | | | 167,180 | |
| | 4,700 | | | American Equity Investment Life Holding Co. | | | 133,903 | |
| | 1,474 | | | AmTrust Financial Services, Inc. | | | 79,449 | |
| | 9,014 | | | CNO Financial Group, Inc. | | | 146,568 | |
| | 1,945 | | | Endurance Specialty Holdings Ltd. | | | 123,644 | |
| | 2,654 | | | HCC Insurance Holdings, Inc. | | | 148,305 | |
| | 1,597 | | | ProAssurance Corp. | | | 71,849 | |
| | 1,481 | | | The Hanover Insurance Group, Inc. | | | 104,025 | |
| | 2,828 | | | Torchmark Corp. | | | 150,591 | |
| | 2,382 | | | Validus Holdings Ltd. | | | 99,186 | |
| | 2,356 | | | W.R. Berkley Corp. | | | 117,588 | |
| | | | | | | | |
| | | | | | | 1,342,288 | |
| | |
| | Internet & Catalog Retail – 0.5% | | | | |
| | 815 | | | HSN, Inc. | | | 55,070 | |
| | 623 | | | Liberty Ventures Series A* | | | 25,032 | |
| | | | | | | | |
| | | | | | | 80,102 | |
| | |
| | Internet Software & Services – 1.1% | | | | |
| | 2,488 | | | IAC/InterActiveCorp. | | | 167,741 | |
| | |
| | IT Services – 0.8% | | | | |
| | 1,113 | | | Broadridge Financial Solutions, Inc. | | | 59,245 | |
| | 1,738 | | | Vantiv, Inc. Class A* | | | 64,289 | |
| | | | | | | | |
| | | | | | | 123,534 | |
| | |
| | | | | | | | |
Shares | | | Description | | Value | |
| | Common Stocks – (continued) | |
| | Life Sciences Tools & Services – 0.9% | | | | |
| | 4,654 | | | Bruker Corp.* | | $ | 88,566 | |
| | 1,191 | | | PerkinElmer, Inc. | | | 55,977 | |
| | | | | | | | |
| | | | | | | 144,543 | |
| | |
| | Machinery – 4.4% | | | | |
| | 2,292 | | | Actuant Corp. Class A | | | 58,309 | |
| | 708 | | | CLARCOR, Inc. | | | 46,594 | |
| | 699 | | | Graco, Inc. | | | 52,970 | |
| | 2,190 | | | Kennametal, Inc. | | | 76,650 | |
| | 1,158 | | | Lincoln Electric Holdings, Inc. | | | 79,948 | |
| | 1,135 | | | Pall Corp. | | | 114,419 | |
| | 2,840 | | | Terex Corp. | | | 77,844 | |
| | 2,133 | | | The Timken Co. | | | 90,610 | |
| | 2,196 | | | Xylem, Inc. | | | 78,397 | |
| | | | | | | | |
| | | | | | | 675,741 | |
| | |
| | Media – 2.2% | | | | |
| | 2,799 | | | Gannett Co., Inc. | | | 99,085 | |
| | 5,347 | | | Live Nation Entertainment, Inc.* | | | 136,830 | |
| | 1,261 | | | The Madison Square Garden Co. Class A* | | | 98,799 | |
| | | | | | | | |
| | | | | | | 334,714 | |
| | |
| | Metals & Mining – 0.6% | | | | |
| | 7,838 | | | AK Steel Holding Corp.* | | | 34,644 | |
| | 775 | | | Royal Gold, Inc. | | | 55,878 | |
| | | | | | | | |
| | | | | | | 90,522 | |
| | |
| | Multi-Utilities – 1.6% | | | | |
| | 4,230 | | | CMS Energy Corp. | | | 148,600 | |
| | 2,365 | | | Vectren Corp. | | | 105,597 | |
| | | | | | | | |
| | | | | | | 254,197 | |
| | |
| | Oil, Gas & Consumable Fuels – 3.3% | | | | |
| | 5,630 | | | Chesapeake Energy Corp. | | | 93,908 | |
| | 1,746 | | | Laredo Petroleum, Inc.* | | | 20,830 | |
| | 6,574 | | | QEP Resources, Inc. | | | 141,210 | |
| | 5,094 | | | Rice Energy, Inc.* | | | 99,741 | |
| | 3,293 | | | SM Energy Co. | | | 159,776 | |
| | | | | | | | |
| | | | | | | 515,465 | |
| | |
| | Pharmaceuticals* – 1.4% | |
| | 2,609 | | | Catalent, Inc. | | | 72,974 | |
| | 1,656 | | | Endo International PLC | | | 141,753 | |
| | | | | | | | |
| | | | | | | 214,727 | |
| | |
| | Real Estate Investment Trusts – 12.2% | |
| | 2,551 | | | American Campus Communities, Inc. | | | 105,280 | |
| | 9,989 | | | Brixmor Property Group, Inc. | | | 253,721 | |
| | 9,711 | | | CBL & Associates Properties, Inc. | | | 194,414 | |
| | 8,489 | | | Empire State Realty Trust, Inc. Class A | | | 150,255 | |
| | 4,609 | | | Highwoods Properties, Inc. | | | 210,216 | |
| | 1,487 | | | National Health Investors, Inc. | | | 105,845 | |
| | 5,261 | | | Pebblebrook Hotel Trust | | | 255,579 | |
| | 3,711 | | | Post Properties, Inc. | | | 211,044 | |
| | 1,215 | | | PS Business Parks, Inc. | | | 101,064 | |
| | 7,244 | | | Starwood Property Trust, Inc. | | | 176,754 | |
| | |
| | |
| The accompanying notes are an integral part of these financial statements. | | 51 |
GOLDMAN SACHS SMALL/MID CAP VALUE FUND
Schedule of Investments (continued)
February 28, 2015 (Unaudited)
| | | | | | | | |
Shares | | | Description | | Value | |
| | Common Stocks – (continued) | |
| | Real Estate Investment Trusts – (continued) | |
| | 9,884 | | | Strategic Hotels & Resorts, Inc.* | | $ | 129,678 | |
| | | | | | | | |
| | | | | | | 1,893,850 | |
| | |
| | Real Estate Management & Development – 0.4% | |
| | 2,377 | | | Kennedy-Wilson Holdings, Inc. | | | 63,609 | |
| | |
| | Semiconductors & Semiconductor Equipment – 2.1% | |
| | 6,144 | | | Atmel Corp.* | | | 51,241 | |
| | 5,061 | | | Cypress Semiconductor Corp.* | | | 74,650 | |
| | 4,631 | | | Intersil Corp. Class A | | | 72,197 | |
| | 2,173 | | | Semtech Corp.* | | | 62,865 | |
| | 3,001 | | | Teradyne, Inc. | | | 57,979 | |
| | | | | | | | |
| | | | | | | 318,932 | |
| | |
| | Software – 2.8% | |
| | 2,824 | | | PTC, Inc.* | | | 97,866 | |
| | 1,156 | | | Solera Holdings, Inc. | | | 64,435 | |
| | 1,002 | | | SS&C Technologies Holdings, Inc. | | | 60,801 | |
| | 2,637 | | | Synopsys, Inc.* | | | 122,383 | |
| | 1,442 | | | Verint System, Inc.* | | | 87,782 | |
| | | | | | | | |
| | | | | | | 433,267 | |
| | |
| | Specialty Retail – 3.6% | |
| | 1,591 | | | CST Brands, Inc. | | | 66,233 | |
| | 2,192 | | | Dick’s Sporting Goods, Inc. | | | 118,565 | |
| | 1,681 | | | GNC Acquisition Holdings, Inc. Class A | | | 80,839 | |
| | 1,063 | | | Lithia Motors, Inc. Class A | | | 100,411 | |
| | 9,047 | | | Office Depot, Inc.* | | | 84,771 | |
| | 452 | | | Penske Automotive Group, Inc. | | | 22,297 | |
| | 1,081 | | | Williams-Sonoma, Inc. | | | 86,967 | |
| | | | | | | | |
| | | | | | | 560,083 | |
| | |
| | Textiles, Apparel & Luxury Goods – 1.9% | |
| | 1,700 | | | Gildan Activewear, Inc. | | | 103,394 | |
| | 1,458 | | | Hanesbrands, Inc. | | | 185,953 | |
| | | | | | | | |
| | | | | | | 289,347 | |
| | |
| | | | | | | | |
Shares | | | Description | | Value | |
| | Common Stocks – (continued) | |
| | Thrifts & Mortgage Finance – 0.8% | |
| | 7,848 | | | Radian Group, Inc. | | $ | 124,077 | |
| | |
| | Trading Companies & Distributors* – 0.8% | |
| | 1,886 | | | WESCO International, Inc. | | | 130,945 | |
| | |
| | Water Utilities – 0.5% | |
| | 2,756 | | | Aqua America, Inc. | | | 72,869 | |
| | |
| | TOTAL COMMON STOCKS | | | | |
| | (Cost $14,499,287) | | $ | 15,367,724 | |
| | |
| | | | | | | | | | | | |
Principal
Amount | | Interest
Rate | | | Maturity
Date | | | Value | |
| Short-term Investment(a) – 7.1% | |
| Repurchase Agreement – 7.1% | |
Joint Repurchase Agreement Account II | |
| $1,100,000 | | | 0.081 | % | | | 03/02/15 | | | $ | 1,100,000 | |
| (Cost $1,100,000) | | | | | | | | | |
| |
| TOTAL INVESTMENTS – 106.5% | | | | | |
| (Cost $15,599,287) | | | | | | | $ | 16,467,724 | |
| |
LIABILITIES IN EXCESS OF
OTHER ASSETS – (6.5)% | | | | (998,786 | ) |
| |
| NET ASSETS – 100.0% | | | $ | 15,468,938 | |
| |
| | |
| The percentage shown for each investment category reflects the value of investments in that category as a percentage of net assets. |
* | | Non-income producing security. |
(a) | | Joint repurchase agreement was entered into on February 27, 2015. Additional information appears on page 53. |
| | |
| 52 | | The accompanying notes are an integral part of these financial statements. |
GOLDMAN SACHS FUNDAMENTAL EQUITY VALUE FUNDS
Schedule of Investments
February 28, 2015 (Unaudited)
|
| ADDITIONAL INVESTMENT INFORMATION |
JOINT REPURCHASE AGREEMENT ACCOUNT II — At February 28, 2015, certain Funds had undivided interests in the Joint Repurchase Agreement Account II, with a maturity date of March 2, 2015, as follows:
| | | | | | | | | | | | |
| Fund | | Principal Amount | | | Maturity Value | | | Collateral Allocation Value | |
Growth and Income | | $ | 7,100,000 | | | $ | 7,100,048 | | | $ | 7,242,001 | |
Small/Mid Cap Value | | | 1,100,000 | | | | 1,100,007 | | | | 1,122,000 | |
REPURCHASE AGREEMENTS — At February 28, 2015, the Principal Amounts of certain Funds’ interest in the Joint Repurchase Agreement Account II were as follows:
| | | | | | | | | | | | |
| Counterparty | | Interest
Rate | | | Growth and
Income | | | Small/Mid
Cap Value | |
BNP Paribas Securities Co. | | | 0.090 | % | | $ | 2,860,212 | | | $ | 443,132 | |
Citigroup Global Markets, Inc. | | | 0.080 | | | | 2,383,510 | | | | 369,276 | |
Merrill Lynch & Co., Inc. | | | 0.070 | | | | 1,856,278 | | | | 287,592 | |
| TOTAL | | | | | | $ | 7,100,000 | | | $ | 1,100,000 | |
At February 28, 2015, the Joint Repurchase Agreement Account II was fully collateralized by:
| | | | | | | | |
| Issuer | | Interest Rates | | | Maturity Dates | |
Federal Home Loan Mortgage Corp. | | | 3.000% to 4.500 | % | | | 11/01/29 to 06/01/43 | |
Federal National Mortgage Association | | | 3.000 to 5.000 | | | | 10/01/25 to 11/01/44 | |
Government National Mortgage Association | | | 3.000 to 6.000 | | | | 11/15/34 to 09/20/44 | |
United States Treasury Stripped Securities | | | 0.000 | | | | 02/15/35 to 11/15/41 | |
United States Treasury Note | | | 1.625 | | | | 03/31/19 | |
| | |
| The accompanying notes are an integral part of these financial statements. | | 53 |
GOLDMAN SACHS FUNDAMENTAL EQUITY VALUE FUNDS
Statements of Assets and Liabilities
February 28, 2015 (Unaudited)
| | | | | | |
| | | | | Growth and
Income Fund | |
| | Assets: | | | | |
| | Investments of unaffiliated issuers, at value (cost $406,143,385, $1,322,629,682, $7,814,556,056, $4,902,989,599 and $15,599,287) | | $ | 472,003,665 | |
| | Investments of affiliated issuers, at value (cost $0, $22,615,928, $326,511,533, $325,013,122 and $0) | | | — | |
| | Cash | | | 68,062 | |
| | Receivables: | | | | |
| | Investments sold | | | 24,480,041 | |
| | Dividends and interest | | | 1,426,489 | |
| | Fund shares sold | | | 89,993 | |
| | Reimbursement from investment adviser | | | 37,233 | |
| | Foreign tax reclaims | | | 37,173 | |
| | Other assets | | | 5,641 | |
| | Total assets | | | 498,148,297 | |
| | | | | | |
| | Liabilities: | | | | |
| | Payables: | | | | |
| | Investments purchased | | | 16,583,388 | |
| | Fund shares redeemed | | | 404,256 | |
| | Management fees | | | 252,390 | |
| | Distribution and Service fees and Transfer Agent fee | | | 166,152 | |
| | Accrued expenses and other liabilities | | | 85,256 | |
| | Total liabilities | | | 17,491,442 | |
| | | | | | |
| | Net Assets: | | | | |
| | Paid-in capital | | | 549,617,554 | |
| | Undistributed (distributions in excess of) net investment income | | | 1,364,354 | |
| | Accumulated net realized gain (loss) | | | (136,185,333 | ) |
| | Net unrealized gain | | | 65,860,280 | |
| | | NET ASSETS | | $ | 480,656,855 | |
| | | Net Assets: | | | | |
| | | Class A | | $ | 418,091,798 | |
| | | Class C | | | 26,313,906 | |
| | | Institutional | | | 30,432,804 | |
| | | Service | | | 391,139 | |
| | | Class IR | | | 3,895,390 | |
| | | Class R | | | 1,531,818 | |
| | | Total Net Assets | | $ | 480,656,855 | |
| | | Shares Outstanding $0.001 par value (unlimited shares authorized): | | | | |
| | | Class A | | | 12,662,590 | |
| | | Class C | | | 834,581 | |
| | | Institutional | | | 907,099 | |
| | | Service | | | 11,850 | |
| | | Class IR | | | 118,214 | |
| | | Class R | | | 46,622 | |
| | | Net asset value, offering and redemption price per share:(a) | | | | |
| | | Class A | | | $33.02 | |
| | | Class C | | | 31.53 | |
| | | Institutional | | | 33.55 | |
| | | Service | | | 33.01 | |
| | | Class IR | | | 32.95 | |
| | | Class R | | | 32.86 | |
| | (a) | | Maximum public offering price per share for Class A Shares of the Growth and Income, Large Cap Value, Mid Cap Value, Small Cap Value and Small/Mid Cap Value Funds is $34.94, $18.85, $44.42, $56.05 and $11.77, respectively. At redemption, Class C Shares may be subject to a contingent deferred sales charge assessed on the amount equal to the lesser of the current NAV or the original purchase price of the shares. |
| | |
| 54 | | The accompanying notes are an integral part of these financial statements. |
GOLDMAN SACHS FUNDAMENTAL EQUITY VALUE FUNDS
| | | | | | | | | | | | | | | | | | | | | | |
| | | Large Cap
Value Fund | | | | | Mid Cap
Value Fund | | | | | Small Cap
Value Fund | | | | | Small/Mid Cap
Value Fund | |
| | | | | | | | | | | | | | | | | | | | | | |
| | $ | 1,509,861,331 | | | | | $ | 9,169,356,058 | | | | | $ | 6,270,606,789 | | | | | $ | 16,467,724 | |
| | | 22,615,928 | | | | | | 326,511,533 | | | | | | 301,942,244 | | | | | | — | |
| | | 8,817,815 | | | | | | 6,199,691 | | | | | | 2,770,590 | | | | | | 7,627 | |
| | | | | | | | | | | | | | | | | | | | | | |
| | | 43,813,498 | | | | | | 85,192,600 | | | | | | 10,202,043 | | | | | | 511 | |
| | | 3,606,464 | | | | | | 8,034,520 | | | | | | 3,807,661 | | | | | | 16,314 | |
| | | 899,212 | | | | | | 13,309,642 | | | | | | 9,160,086 | | | | | | 5,500 | |
| | | 39,188 | | | | | | — | | | | | | 107,594 | | | | | | 51,992 | |
| | | 49,993 | | | | | | — | | | | | | — | | | | | | — | |
| | | 7,584 | | | | | | 48,075 | | | | | | 25,895 | | | | | | — | |
| | | 1,589,711,013 | | | | | | 9,608,652,119 | | | | | | 6,598,622,902 | | | | | | 16,549,668 | |
| | | | | | | | | | | | | | | | | | | | | | |
| | | | | | | | | | | | | | | | | | | | | | |
| | | | | | | | | | | | | | | | | | | | | | |
| | | 34,599,118 | | | | | | 100,398,964 | | | | | | 45,848,613 | | | | | | 985,877 | |
| | | 1,384,800 | | | | | | 17,171,647 | | | | | | 11,671,022 | | | | | | — | |
| | | 854,404 | | | | | | 4,862,468 | | | | | | 4,409,442 | | | | | | 8,844 | |
| | | 171,909 | | | | | | 1,218,898 | | | | | | 669,472 | | | | | | 673 | |
| | | 112,576 | | | | | | 649,835 | | | | | | 398,362 | | | | | | 85,336 | |
| | | 37,122,807 | | | | | | 124,301,812 | | | | | | 62,996,911 | | | | | | 1,080,730 | |
| | | | | | | | | | | | | | | | | | | | | | |
| | | | | | | | | | | | | | | | | | | | | | |
| | | 1,320,890,058 | | | | | | 7,808,240,625 | | | | | | 5,072,371,239 | | | | | | 14,628,407 | |
| | | 284,196 | | | | | | (16,991,274 | ) | | | | | (859,941 | ) | | | | | 9,120 | |
| | | 44,182,303 | | | | | | 338,300,954 | | | | | | 119,568,381 | | | | | | (37,026 | ) |
| | | 187,231,649 | | | | | | 1,354,800,002 | | | | | | 1,344,546,312 | | | | | | 868,437 | |
| | | $ | 1,552,588,206 | | | | | $ | 9,484,350,307 | | | | | $ | 6,535,625,991 | | | | | $ | 15,468,938 | |
| | | | | | | | | | | | | | | | | | | | | | | |
| | | $ | 262,838,038 | | | | | $ | 2,262,372,149 | | | | | $ | 1,061,699,658 | | | | | $ | 280,686 | |
| | | | 46,090,825 | | | | | | 201,896,068 | | | | | | 68,941,984 | | | | | | 171,149 | |
| | | | 1,224,101,212 | | | | | | 6,350,580,100 | | | | | | 4,947,286,455 | | | | | | 14,869,476 | |
| | | | 3,536,879 | | | | | | 260,509,959 | | | | | | 173,852,021 | | | | | | — | |
| | | | 7,649,017 | | | | | | 365,321,761 | | | | | | 133,750,695 | | | | | | 119,395 | |
| | | | 8,372,235 | | | | | | 43,670,270 | | | | | | 150,095,178 | | | | | | 28,232 | |
| | | $ | 1,552,588,206 | | | | | $ | 9,484,350,307 | | | | | $ | 6,535,625,991 | | | | | $ | 15,468,938 | |
| | | | | | | | | | | | | | | | | | | | | | | |
| | | | 14,758,822 | | | | | | 53,897,826 | | | | | | 20,043,844 | | | | | | 25,233 | |
| | | | 2,678,167 | | | | | | 5,194,805 | | | | | | 1,604,560 | | | | | | 15,459 | |
| | | | 68,211,350 | | | | | | 150,010,797 | | | | | | 87,744,288 | | | | | | 1,330,629 | |
| | | | 199,582 | | | | | | 6,300,803 | | | | | | 3,367,243 | | | | | | — | |
| | | | 429,453 | | | | | | 8,847,166 | | | | | | 2,540,121 | | | | | | 10,714 | |
| | | | 479,005 | | | | | | 1,061,216 | | | | | | 2,877,893 | | | | | | 2,538 | |
| | | | | | | | | | | | | | | | | | | | | | | |
| | | | $17.81 | | | | | | $41.98 | | | | | | $52.97 | | | | | | $11.12 | |
| | | | 17.21 | | | | | | 38.86 | | | | | | 42.97 | | | | | | 11.07 | |
| | | | 17.95 | | | | | | 42.33 | | | | | | 56.38 | | | | | | 11.17 | |
| | | | 17.72 | | | | | | 41.35 | | | | | | 51.63 | | | | | | — | |
| | | | 17.81 | | | | | | 41.29 | | | | | | 52.66 | | | | | | 11.14 | |
| | | | 17.48 | | | | | | 41.15 | | | | | | 52.15 | | | | | | 11.12 | |
| | |
| The accompanying notes are an integral part of these financial statements. | | 55 |
GOLDMAN SACHS FUNDAMENTAL EQUITY VALUE FUNDS
Statements of Operations
For the Six Months Ended February 28, 2015 (Unaudited)
| | | | | | |
| | | | | Growth and
Income Fund | |
| | Investment income: | | | | |
| | Dividends — unaffiliated issuers (net of foreign withholding taxes of $12,968, $28,854, $0, $89,713 and $91) | | $ | 6,547,824 | |
| | Dividends — affiliated issuers | | | — | |
| | Interest | | | 3,469 | |
| | Total investment income | | | 6,551,293 | |
| | | | | | |
| | Expenses: | | | | |
| | Management fees | | | 1,648,300 | |
| | Distribution and Service fees(a) | | | 661,774 | |
| | Transfer Agent fees(a) | | | 425,212 | |
| | Printing and mailing costs | | | 67,572 | |
| | Custody, accounting and administrative services | | | 37,374 | |
| | Professional fees | | | 30,698 | |
| | Registration fees | | | 22,591 | |
| | Trustee fees | | | 10,396 | |
| | Service Share fees — Shareholder Administration Plan | | | 461 | |
| | Service Share fees — Service Plan | | | 461 | |
| | Amortization of offering costs | | | — | |
| | Other | | | 7,739 | |
| | Total expenses | | | 2,912,578 | |
| | Less — expense reductions | | | (144,055 | ) |
| | Net expenses | | | 2,768,523 | |
| | NET INVESTMENT INCOME | | | 3,782,770 | |
| | | | | | |
| | Realized and unrealized gain (loss): | | | | |
| | Net realized gain (loss) from: | | | | |
| | Investments — unaffiliated issuers (including commission recapture of $8,966, $55,038, $365,081, $0 and $0) | | | 34,198,799 | |
| | Investments — affiliated issuers | | | — | |
| | Foreign currency transactions | | | 124 | |
| | Net change in unrealized gain (loss) on: | | | | |
| | Investments — unaffiliated issuers | | | (22,888,924 | ) |
| | Investments — affiliated issuers | | | — | |
| | Foreign currency translations | | | (494 | ) |
| | Net realized and unrealized gain | | | 11,309,505 | |
| | NET INCREASE IN NET ASSETS RESULTING FROM OPERATIONS | | $ | 15,092,275 | |
| | (a) | | Class specific Distribution and Service, and Transfer Agent fees were as follows: |
| | | | | | | | | | | | | | | | | | | | | | | | | | | | | | | | | | | | | | | | | | | | |
| | | Distribution and Service Fees | | | Transfer Agent Fees | |
Fund | | Class A | | | Class B(b) | | | Class C | | | Class R | | | Class A | | | Class B(b) | | | Class C | | | Institutional | | | Service | | | Class IR | | | Class R | |
Growth and Income | | $ | 507,374 | | | $ | 21,477 | | | $ | 129,254 | | | $ | 3,669 | | | $ | 385,604 | | | $ | 4,081 | | | $ | 24,558 | | | $ | 5,842 | | | $ | 74 | | | $ | 3,659 | | | $ | 1,394 | |
Large Cap Value | | | 315,244 | | | | 10,378 | | | | 223,507 | | | | 19,926 | | | | 239,585 | | | | 1,972 | | | | 42,466 | | | | 237,650 | | | | 670 | | | | 6,913 | | | | 7,572 | |
Mid Cap Value | | | 3,029,644 | | | | 15,415 | | | | 976,402 | | | | 93,430 | | | | 2,302,530 | | | | 2,929 | | | | 185,516 | | | | 1,223,019 | | | | 53,077 | | | | 296,914 | | | | 35,504 | |
Small Cap Value | | | 1,287,362 | | | | 4,106 | | | | 335,149 | | | | 358,349 | | | | 978,395 | | | | 780 | | | | 63,678 | | | | 932,656 | | | | 34,030 | | | | 115,445 | | | | 136,173 | |
Small/Mid Cap Value | | | 268 | | | | — | | | | 654 | | | | 68 | | | | 204 | | | | — | | | | 124 | | | | 1,405 | | | | — | | | | 80 | | | | 26 | |
| | (b) | | Class B Shares were converted into Class A Shares at the close of business on November 14, 2014. |
| | |
| 56 | | The accompanying notes are an integral part of these financial statements. |
GOLDMAN SACHS FUNDAMENTAL EQUITY VALUE FUNDS
| | | | | | | | | | | | | | | | | | | | | | |
| | | Large Cap
Value Fund | | | | | Mid Cap
Value Fund | | | | | Small Cap
Value Fund | | | | | Small/Mid Cap
Value Fund | |
| | | | | | | | | | | | | | | | | | | | | | |
| | $ | 15,481,898 | | | | | $ | 66,697,153 | | | | | $ | 55,980,552 | | | | | $ | 64,673 | |
| | | 229 | | | | | | 4,565 | | | | | | 3,251 | | | | | | — | |
| | | 8,054 | | | | | | 25,302 | | | | | | 16,487 | | | | | | 308 | |
| | | 15,490,181 | | | | | | 66,727,020 | | | | | | 56,000,290 | | | | | | 64,981 | |
| | | | | | | | | | | | | | | | | | | | | | |
| | | | | | | | | | | | | | | | | | | | | | |
| | | 5,466,915 | | | | | | 31,762,709 | | | | | | 28,626,488 | | | | | | 31,801 | |
| | | 569,055 | | | | | | 4,114,891 | | | | | | 1,984,966 | | | | | | 990 | |
| | | 536,828 | | | | | | 4,099,489 | | | | | | 2,261,157 | | | | | | 1,839 | |
| | | 70,409 | | | | | | 743,201 | | | | | | 350,918 | | | | | | 20,927 | |
| | | 65,383 | | | | | | 221,690 | | | | | | 175,384 | | | | | | 32,860 | |
| | | 39,444 | | | | | | 30,505 | | | | | | 38,924 | | | | | | 27,936 | |
| | | — | | | | | | 124,442 | | | | | | 41,503 | | | | | | 21,216 | |
| | | 11,771 | | | | | | 22,795 | | | | | | 15,954 | | | | | | 8,944 | |
| | | 4,187 | | | | | | 331,730 | | | | | | 212,685 | | | | | | — | |
| | | 4,187 | | | | | | 331,730 | | | | | | 212,685 | | | | | | — | |
| | | — | | | | | | — | | | | | | — | | | | | | 77,639 | |
| | | 7,338 | | | | | | 53,682 | | | | | | 57,994 | | | | | | 5,806 | |
| | | 6,775,517 | | | | | | 41,836,864 | | | | | | 33,978,658 | | | | | | 229,958 | |
| | | (168,179 | ) | | | | | (84,960 | ) | | | | | (1,313,011 | ) | | | | | (193,682 | ) |
| | | 6,607,338 | | | | | | 41,751,904 | | | | | | 32,665,647 | | | | | | 36,276 | |
| | | 8,882,843 | | | | | | 24,975,116 | | | | | | 23,334,643 | | | | | | 28,705 | |
| | | | | | | | | | | | | | | | | | | | | | |
| | | | | | | | | | | | | | | | | | | | | | |
| | | | | | | | | | | | | | | | | | | | | | |
| | | 79,204,949 | | | | | | 621,156,840 | | | | | | 235,776,335 | | | | | | 17,890 | |
| | | — | | | | | | — | | | | | | (6,915,667 | ) | | | | | — | |
| | | — | | | | | | — | | | | | | (4,673 | ) | | | | | — | |
| | | | | | | | | | | | | | | | | | | | | | |
| | | (49,879,024 | ) | | | | | (385,272,112 | ) | | | | | 38,884,732 | | | | | | 586,037 | |
| | | — | | | | | | — | | | | | | (34,432,949 | ) | | | | | — | |
| | | — | | | | | | — | | | | | | — | | | | | | — | |
| | | 29,325,925 | | | | | | 235,884,728 | | | | | | 233,307,778 | | | | | | 603,927 | |
| | $ | 38,208,768 | | | | | $ | 260,859,844 | | | | | $ | 256,642,421 | | | | | $ | 632,632 | |
| | |
| The accompanying notes are an integral part of these financial statements. | | 57 |
GOLDMAN SACHS FUNDAMENTAL EQUITY VALUE FUNDS
Statements of Changes in Net Assets
| | | | | | | | | | |
| | | | | Growth and Income Fund | |
| | | | | For the
Six Months Ended
February 28, 2015
(Unaudited) | | | For the Fiscal
Year Ended
August 31, 2014 | |
| | From operations: | | | | | | | | |
| | Net investment income | | $ | 3,782,770 | | | $ | 6,511,534 | |
| | Net realized gain | | | 34,198,923 | | | | 52,774,464 | |
| | Net change in unrealized gain (loss) | | | (22,889,418 | ) | | | 34,286,381 | |
| | Net increase in net assets resulting from operations | | | 15,092,275 | | | | 93,572,379 | |
| | | | | | | | | | |
| | Distributions to shareholders: | | | | | | | | |
| | From net investment income | | | | | | | | |
| | Class A Shares | | | (3,133,530 | ) | | | (5,366,379 | ) |
| | Class B Shares(b) | | | (6,840 | ) | | | (77,334 | ) |
| | Class C Shares | | | (112,017 | ) | | | (177,566 | ) |
| | Institutional Shares | | | (278,088 | ) | | | (427,953 | ) |
| | Service Shares | | | (2,674 | ) | | | (4,483 | ) |
| | Class IR Shares | | | (34,914 | ) | | | (37,212 | ) |
| | Class R Shares | | | (9,573 | ) | | | (13,314 | ) |
| | From net realized gains | | | | | | | | |
| | Class A Shares | | | — | | | | — | |
| | Class B Shares(b) | | | — | | | | — | |
| | Class C Shares | | | — | | | | — | |
| | Institutional Shares | | | — | | | | — | |
| | Service Shares | | | — | | | | — | |
| | Class IR Shares | | | — | | | | — | |
| | Class R Shares | | | — | | | | — | |
| | Total distributions to shareholders | | | (3,577,636 | ) | | | (6,104,241 | ) |
| | | | | | | | | | |
| | From share transactions: | | | | | | | | |
| | Proceeds from sales of shares | | | 16,641,710 | | | | 33,190,470 | |
| | Reinvestment of distributions | | | 3,498,295 | | | | 5,972,060 | |
| | Cost of shares redeemed | | | (38,392,151 | ) | | | (79,431,964 | ) |
| | Net increase (decrease) in net assets resulting from share transactions | | | (18,252,146 | ) | | | (40,269,434 | ) |
| | TOTAL INCREASE (DECREASE) | | | (6,737,507 | ) | | | 47,198,704 | |
| | | | | | | | | | |
| | Net assets: | | | | | | | | |
| | Beginning of period | | | 487,394,362 | | | | 440,195,658 | |
| | End of period | | $ | 480,656,855 | | | $ | 487,394,362 | |
| | Undistributed (distributions in excess of) net investment income | | $ | 1,364,354 | | | $ | 1,159,220 | |
| | (a) | | Commenced operations on January 31, 2014. |
| | (b) | | Class B Shares were converted into Class A Shares at the close of business on November 14, 2014. |
| | |
| 58 | | The accompanying notes are an integral part of these financial statements. |
GOLDMAN SACHS FUNDAMENTAL EQUITY VALUE FUNDS
| | | | | | | | | | | | | | | | | | | | | | | | | | | | | | | | | | | | | | | | | | | | | | |
| | | Large Cap Value Fund | | | | | Mid Cap Value Fund | | | | | Small Cap Value Fund | | | | | Small/Mid Cap Value Fund | |
| | | For the
Six Months Ended
February 28, 2015
(Unaudited) | | | | | For the Fiscal
Year Ended
August 31, 2014 | | | | | For the
Six Months Ended
February 28, 2015
(Unaudited) | | | | | For the Fiscal
Year Ended
August 31, 2014 | | | | | For the
Six Months Ended
February 28, 2015
(Unaudited) | | | | | For the Fiscal
Year Ended
August 31, 2014 | | | | | For the
Six Months Ended
February 28, 2015
(Unaudited) | | | | | For the
Period Ended
August 31, 2014(a) | |
| | | | | | | | | | | | | | | | | | | | | | | | | | | | | | | | | | | | | | | | | | | | | | |
| | $ | 8,882,843 | | | | | $ | 15,828,767 | | | | | $ | 24,975,116 | | | | | $ | 59,631,231 | | | | | $ | 23,334,643 | | | | | $ | 25,788,305 | | | | | $ | 28,705 | | | | | $ | 9,357 | |
| | | 79,204,949 | | | | | | 286,882,856 | | | | | | 621,156,840 | | | | | | 1,703,829,506 | | | | | | 228,855,995 | | | | | | 524,407,855 | | | | | | 17,890 | | | | | | 61,010 | |
| | | (49,879,024 | ) | | | | | 25,760,290 | | | | | | (385,272,112 | ) | | | | | 455,303,231 | | | | | | 4,451,783 | | | | | | 444,964,616 | | | | | | 586,037 | | | | | | 282,400 | |
| | | 38,208,768 | | | | | | 328,471,913 | | | | | | 260,859,844 | | | | | | 2,218,763,968 | | | | | | 256,642,421 | | | | | | 995,160,776 | | | | | | 632,632 | | | | | | 352,767 | |
| | | | | | | | | | | | | | | | | | | | | | | | | | | | | | | | | | | | | | | | | | | | | | |
| | | | | | | | | | | | | | | | | | | | | | | | | | | | | | | | | | | | | | | | | | | | | | |
| | | | | | | | | | | | | | | | | | | | | | | | | | | | | | | | | | | | | | | | | | | | | | |
| | | (1,971,852 | ) | | | | | (1,513,190 | ) | | | | | (6,131,547 | ) | | | | | (15,099,431 | ) | | | | | (1,910,002 | ) | | | | | (4,159,357 | ) | | | | | (501 | ) | | | | | — | |
| | | — | | | | | | — | | | | | | — | | | | | | — | | | | | | — | | | | | | — | | | | | | — | | | | | | — | |
| | | (41,993 | ) | | | | | (20,449 | ) | | | | | — | | | | | | — | | | | | | — | | | | | | — | | | | | | — | | | | | | — | |
| | | (13,800,311 | ) | | | | | (11,520,072 | ) | | | | | (50,295,540 | ) | | | | | (47,767,342 | ) | | | | | (26,380,902 | ) | | | | | (22,049,182 | ) | | | | | (28,474 | ) | | | | | — | |
| | | (25,657 | ) | | | | | (13,780 | ) | | | | | (464,450 | ) | | | | | (1,332,203 | ) | | | | | (132,770 | ) | | | | | (560,679 | ) | | | | | — | | | | | | — | |
| | | — | | | | | | (1,444,396 | ) | | | | | (2,233,494 | ) | | | | | (843,215 | ) | | | | | (533,992 | ) | | | | | (521,770 | ) | | | | | (405 | ) | | | | | — | |
| | | (51,733 | ) | | | | | (29,460 | ) | | | | | (93,600 | ) | | | | | (98,131 | ) | | | | | — | | | | | | (230,422 | ) | | | | | — | | | | | | — | |
| | | | | | | | | | | | | | | | | | | | | | | | | | | | | | | | | | | | | | | | | | | | | | |
| | | (13,448,251 | ) | | | | | — | | | | | | (393,324,779 | ) | | | | | (492,502,746 | ) | | | | | (81,794,765 | ) | | | | | (111,483,030 | ) | | | | | (3,415 | ) | | | | | — | |
| | | — | | | | | | — | | | | | | — | | | | | | (1,668,030 | ) | | | | | — | | | | | | (326,290 | ) | | | | | — | | | | | | — | |
| | | (2,465,823 | ) | | | | | — | | | | | | (36,786,968 | ) | | | | | (27,991,344 | ) | | | | | (6,496,966 | ) | | | | | (7,182,985 | ) | | | | | (1,817 | ) | | | | | — | |
| | | (62,217,693 | ) | | | | | — | | | | | | (1,066,177,321 | ) | | | | | (818,935,019 | ) | | | | | (349,994,344 | ) | | | | | (288,325,511 | ) | | | | | (108,542 | ) | | | | | — | |
| | | (184,114 | ) | | | | | — | | | | | | (45,262,217 | ) | | | | | (50,965,016 | ) | | | | | (13,748,544 | ) | | | | | (17,459,319 | ) | | | | | — | | | | | | — | |
| | | (407,704 | ) | | | | | — | | | | | | (56,126,966 | ) | | | | | (16,845,350 | ) | | | | | (9,398,212 | ) | | | | | (8,052,327 | ) | | | | | (1,740 | ) | | | | | — | |
| | | (444,809 | ) | | | | | — | | | | | | (6,534,801 | ) | | | | | (4,179,219 | ) | | | | | (11,584,866 | ) | | | | | (10,627,996 | ) | | | | | (412 | ) | | | | | — | |
| | | (95,059,940 | ) | | | | | (14,541,347 | ) | | | | | (1,663,431,683 | ) | | | | | (1,478,227,046 | ) | | | | | (501,975,363 | ) | | | | | (470,978,868 | ) | | | | | (145,306 | ) | | | | | — | |
| | | | | | | | | | | | | | | | | | | | | | | | | | | | | | | | | | | | | | | | | | | | | | |
| | | | | | | | | | | | | | | | | | | | | | | | | | | | | | | | | | | | | | | | | | | | | | |
| | | 122,826,426 | | | | | | 216,962,386 | | | | | | 1,256,844,712 | | | | | | 2,361,232,626 | | | | | | 856,270,998 | | | | | | 2,515,156,976 | | | | | | 13,429,165 | | | | | | 3,714,572 | |
| | | 89,252,736 | | | | | | 13,608,739 | | | | | | 1,521,893,834 | | | | | | 1,350,080,936 | | | | | | 481,869,928 | | | | | | 454,113,027 | | | | | | 143,453 | | | | | | — | |
| | | (138,385,507 | ) | | | | | (482,955,091 | ) | | | | | (2,302,527,821 | ) | | | | | (3,309,755,308 | ) | | | | | (842,048,342 | ) | | | | | (1,647,294,346 | ) | | | | | (2,656,204 | ) | | | | | (2,141 | ) |
| | | 73,693,655 | | | | | | (252,383,966 | ) | | | | | 476,210,725 | | | | | | 401,558,254 | | | | | | 496,092,584 | | | | | | 1,321,975,657 | | | | | | 10,916,414 | | | | | | 3,712,431 | |
| | | 16,842,483 | | | | | | 61,546,600 | | | | | | (926,361,114 | ) | | | | | 1,142,095,176 | | | | | | 250,759,642 | | | | | | 1,846,157,565 | | | | | | 11,403,740 | | | | | | 4,065,198 | |
| | | | | | | | | | | | | | | | | | | | | | | | | | | | | | | | | | | | | | | | | | | | | | |
| | | | | | | | | | | | | | | | | | | | | | | | | | | | | | | | | | | | | | | | | | | | | | |
| | | 1,535,745,723 | | | | | | 1,474,199,123 | | | | | | 10,410,711,421 | | | | | | 9,268,616,245 | | | | | | 6,284,866,349 | | | | | | 4,438,708,784 | | | | | | 4,065,198 | | | | | | — | |
| | $ | 1,552,588,206 | | | | | $ | 1,535,745,723 | | | | | $ | 9,484,350,307 | | | | | $ | 10,410,711,421 | | | | | $ | 6,535,625,991 | | | | | $ | 6,284,866,349 | | | | | $ | 15,468,938 | | | | | $ | 4,065,198 | |
| | $ | 284,196 | | | | | $ | 7,292,899 | | | | | $ | (16,991,274 | ) | | | | $ | 17,252,241 | | | | | $ | (859,941 | ) | | | | $ | 4,763,082 | | | | | $ | 9,120 | | | | | $ | 9,795 | |
| | |
| The accompanying notes are an integral part of these financial statements. | | 59 |
GOLDMAN SACHS GROWTH AND INCOME FUND
Financial Highlights
Selected Data for a Share Outstanding Throughout Each Period
| | | | | | | | | | | | | | | | | | | | | | |
| | | | | | | | From
investment operations | | | | |
| | | Year - Share Class | | Net asset
value,
beginning
of period | | | Net
investment
income(a) | | | Net realized
and unrealized
gain | | | Total from
investment
operations | | | Distributions
to shareholders
from net
investment
income | |
| | FOR THE SIX MONTHS ENDED FEBRUARY 28, (UNAUDITED) | |
| | 2015 - A | | $ | 32.21 | | | $ | 0.26 | | | $ | 0.79 | | | $ | 1.05 | | | $ | (0.24 | ) |
| | 2015 - C | | | 30.77 | | | | 0.13 | | | | 0.76 | | | | 0.89 | | | | (0.13 | ) |
| | 2015 - Institutional | | | 32.72 | | | | 0.33 | | | | 0.81 | | | | 1.14 | | | | (0.31 | ) |
| | 2015 - Service | | | 32.20 | | | | 0.24 | | | | 0.80 | | | | 1.04 | | | | (0.23 | ) |
| | 2015 - IR | | | 32.15 | | | | 0.30 | | | | 0.79 | | | | 1.09 | | | | (0.29 | ) |
| | 2015 - R | | | 32.05 | | | | 0.22 | | | | 0.80 | | | | 1.02 | | | | (0.21 | ) |
| | | | | | | | | | | | | | | | | | | | | | |
| | FOR THE FISCAL YEARS ENDED AUGUST 31, | |
| | 2014 - A | | | 26.70 | | | | 0.42 | | | | 5.48 | | | | 5.90 | | | | (0.39 | ) |
| | 2014 - C | | | 25.54 | | | | 0.19 | | | | 5.23 | | | | 5.42 | | | | (0.19 | ) |
| | 2014 - Institutional | | | 27.12 | | | | 0.55 | | | | 5.56 | | | | 6.11 | | | | (0.51 | ) |
| | 2014 - Service | | | 26.69 | | | | 0.39 | | | | 5.48 | | | | 5.87 | | | | (0.36 | ) |
| | 2014 - IR | | | 26.65 | | | | 0.51 | | | | 5.46 | | | | 5.97 | | | | (0.47 | ) |
| | 2014 - R | | | 26.60 | | | | 0.35 | | | | 5.45 | | | | 5.80 | | | | (0.35 | ) |
| | 2013 - A | | | 21.68 | | | | 0.29 | | | | 5.02 | | | | 5.31 | | | | (0.29 | ) |
| | 2013 - C | | | 20.78 | | | | 0.11 | | | | 4.80 | | | | 4.91 | | | | (0.15 | ) |
| | 2013 - Institutional | | | 22.01 | | | | 0.40 | | | | 5.09 | | | | 5.49 | | | | (0.38 | ) |
| | 2013 - Service | | | 21.66 | | | | 0.27 | | | | 5.02 | | | | 5.29 | | | | (0.26 | ) |
| | 2013 - IR | | | 21.64 | | | | 0.38 | | | | 4.97 | | | | 5.35 | | | | (0.34 | ) |
| | 2013 - R | | | 21.60 | | | | 0.23 | | | | 5.00 | | | | 5.23 | | | | (0.23 | ) |
| | 2012 - A | | | 19.04 | | | | 0.32 | (e) | | | 2.58 | | | | 2.90 | | | | (0.26 | ) |
| | 2012 - C | | | 18.28 | | | | 0.16 | (e) | | | 2.48 | | | | 2.64 | | | | (0.14 | ) |
| | 2012 - Institutional | | | 19.33 | | | | 0.41 | (e) | | | 2.61 | | | | 3.02 | | | | (0.34 | ) |
| | 2012 - Service | | | 19.04 | | | | 0.30 | (e) | | | 2.56 | | | | 2.86 | | | | (0.24 | ) |
| | 2012 - IR | | | 19.02 | | | | 0.36 | (e) | | | 2.58 | | | | 2.94 | | | | (0.32 | ) |
| | 2012 - R | | | 18.99 | | | | 0.26 | (e) | | | 2.57 | | | | 2.83 | | | | (0.22 | ) |
| | 2011 - A | | | 17.84 | | | | 0.21 | | | | 1.21 | | | | 1.42 | | | | (0.22 | ) |
| | 2011 - C | | | 17.16 | | | | 0.05 | | | | 1.17 | | | | 1.22 | | | | (0.10 | ) |
| | 2011 - Institutional | | | 18.12 | | | | 0.30 | | | | 1.21 | | | | 1.51 | | | | (0.30 | ) |
| | 2011 - Service | | | 17.83 | | | | 0.20 | | | | 1.20 | | | | 1.40 | | | | (0.19 | ) |
| | 2011 - IR | | | 17.82 | | | | 0.33 | | | | 1.14 | | | | 1.47 | | | | (0.27 | ) |
| | 2011 - R | | | 17.79 | | | | 0.16 | | | | 1.21 | | | | 1.37 | | | | (0.17 | ) |
| | 2010 - A | | | 17.65 | | | | 0.22 | (f) | | | 0.18 | | | | 0.40 | | | | (0.21 | ) |
| | 2010 - C | | | 16.98 | | | | 0.07 | (f) | | | 0.19 | | | | 0.26 | | | | (0.08 | ) |
| | 2010 - Institutional | | | 17.91 | | | | 0.30 | (f) | | | 0.20 | | | | 0.50 | | | | (0.29 | ) |
| | 2010 - Service | | | 17.63 | | | | 0.20 | (f) | | | 0.20 | | | | 0.40 | | | | (0.20 | ) |
| | 2010 - IR | | | 17.63 | | | | 0.26 | (f) | | | 0.20 | | | | 0.46 | | | | (0.27 | ) |
| | 2010 - R | | | 17.60 | | | | 0.16 | (f) | | | 0.21 | | | | 0.37 | | | | (0.18 | ) |
| | (a) | | Calculated based on the average shares outstanding methodology. |
| | (b) | | Assumes investment at the net asset value at the beginning of the period, reinvestment of all dividends and distributions, a complete redemption of the investment at the net asset value at the end of the period and no sales or redemption charges. Total returns would be reduced if a sales or redemption charge was taken into account. Returns do not reflect the deduction of taxes that a shareholder would pay on Fund distributions or the redemption of Fund shares. Total returns for periods less than one full year are not annualized. |
| | (c) | | The Fund’s portfolio turnover rate is calculated in accordance with regulatory requirements, without regard to transactions involving short term investments and certain derivatives. If such transactions were included, the Fund’s portfolio turnover rate may be higher. |
| | (e) | | Reflects income recognized from special dividends which amounted to $0.06 per share and 0.28% of average net assets. |
| | (f) | | Reflects income recognized from special dividends which amounted to $0.04 per share and 0.21% of average net assets. |
| | |
| 60 | | The accompanying notes are an integral part of these financial statements. |
GOLDMAN SACHS GROWTH AND INCOME FUND
| | | | | | | | | | | | | | | | | | | | | | | | | | | | | | | | | | | | | | | | |
| | | | | | | | | | | | | | | | | | | | | | | | | | | | | | | | | | |
| | | Net asset
value, end
of period | | | | | Total
return(b) | | | | | Net assets,
end of
period
(in 000s) | | | | | Ratio of
net expenses
to average
net assets | | | | | Ratio of
total expenses
to average
net assets | | | | | Ratio of
net investment
income
to average
net assets | | | | | Portfolio
turnover
rate(c) | |
| | | | | | | | | | | | | | | | | | | | | | | | | | | | | | | | | | | | | | | | |
| | $ | 33.02 | | | | | | 3.29 | % | | | | $ | 418,092 | | | | | | 1.15 | %(d) | | | | | 1.21 | %(d) | | | | | 1.63 | %(d) | | | | | 24 | % |
| | | 31.53 | | | | | | 2.94 | | | | | | 26,314 | | | | | | 1.90 | (d) | | | | | 1.96 | (d) | | | | | 0.88 | (d) | | | | | 24 | |
| | | 33.55 | | | | | | 3.54 | | | | | | 30,433 | | | | | | 0.75 | (d) | | | | | 0.81 | (d) | | | | | 2.03 | (d) | | | | | 24 | |
| | | 33.01 | | | | | | 3.25 | | | | | | 391 | | | | | | 1.25 | (d) | | | | | 1.31 | (d) | | | | | 1.53 | (d) | | | | | 24 | |
| | | 32.95 | | | | | | 3.44 | | | | | | 3,895 | | | | | | 0.90 | (d) | | | | | 0.96 | (d) | | | | | 1.87 | (d) | | | | | 24 | |
| | | 32.86 | | | | | | 3.18 | | | | | | 1,532 | | | | | | 1.40 | (d) | | | | | 1.46 | (d) | | | | | 1.37 | (d) | | | | | 24 | |
| | | | | | | | | | | | | | | | | | | | | | | | | | | | | | | | | | | | | | | | |
| | | | | | | | | | | | | | | | | | | | | | | | | | | | | | | | | | | | | | | | |
| | | 32.21 | | | | | | 22.27 | | | | | | 414,276 | | | | | | 1.18 | | | | | | 1.24 | | | | | | 1.42 | | | | | | 40 | |
| | | 30.77 | | | | | | 21.32 | | | | | | 26,742 | | | | | | 1.93 | | | | | | 1.99 | | | | | | 0.67 | | | | | | 40 | |
| | | 32.72 | | | | | | 22.73 | | | | | | 29,476 | | | | | | 0.78 | | | | | | 0.84 | | | | | | 1.82 | | | | | | 40 | |
| | | 32.20 | | | | | | 22.12 | | | | | | 368 | | | | | | 1.28 | | | | | | 1.34 | | | | | | 1.33 | | | | | | 40 | |
| | | 32.15 | | | | | | 22.58 | | | | | | 3,937 | | | | | | 0.93 | | | | | | 0.98 | | | | | | 1.71 | | | | | | 40 | |
| | | 32.05 | | | | | | 21.94 | | | | | | 1,462 | | | | | | 1.43 | | | | | | 1.49 | | | | | | 1.16 | | | | | | 40 | |
| | | 26.70 | | | | | | 24.68 | | | | | | 379,500 | | | | | | 1.19 | | | | | | 1.24 | | | | | | 1.21 | | | | | | 83 | |
| | | 25.54 | | | | | | 23.77 | | | | | | 24,154 | | | | | | 1.94 | | | | | | 1.99 | | | | | | 0.46 | | | | | | 83 | |
| | | 27.12 | | | | | | 25.20 | | | | | | 19,279 | | | | | | 0.79 | | | | | | 0.84 | | | | | | 1.60 | | | | | | 83 | |
| | | 26.69 | | | | | | 24.62 | | | | | | 356 | | | | | | 1.29 | | | | | | 1.34 | | | | | | 1.09 | | | | | | 83 | |
| | | 26.65 | | | | | | 24.98 | | | | | | 2,158 | | | | | | 0.94 | | | | | | 1.01 | | | | | | 1.54 | | | | | | 83 | |
| | | 26.60 | | | | | | 24.41 | | | | | | 609 | | | | | | 1.44 | | | | | | 1.49 | | | | | | 0.94 | | | | | | 83 | |
| | | 21.68 | | | | | | 15.36 | | | | | | 374,273 | | | | | | 1.19 | | | | | | 1.22 | | | | | | 1.63 | (e) | | | | | 115 | |
| | | 20.78 | | | | | | 14.49 | | | | | | 20,726 | | | | | | 1.94 | | | | | | 1.97 | | | | | | 0.85 | (e) | | | | | 115 | |
| | | 22.01 | | | | | | 15.81 | | | | | | 18,001 | | | | | | 0.79 | | | | | | 0.82 | | | | | | 2.06 | (e) | | | | | 115 | |
| | | 21.66 | | | | | | 15.16 | | | | | | 566 | | | | | | 1.29 | | | | | | 1.32 | | | | | | 1.50 | (e) | | | | | 115 | |
| | | 21.64 | | | | | | 15.61 | | | | | | 480 | | | | | | 0.94 | | | | | | 0.97 | | | | | | 1.78 | (e) | | | | | 115 | |
| | | 21.60 | | | | | | 14.99 | | | | | | 801 | | | | | | 1.44 | | | | | | 1.47 | | | | | | 1.31 | (e) | | | | | 115 | |
| | | 19.04 | | | | | | 7.82 | | | | | | 505,502 | | | | | | 1.19 | | | | | | 1.21 | | | | | | 1.02 | | | | | | 60 | |
| | | 18.28 | | | | | | 7.06 | | | | | | 21,860 | | | | | | 1.94 | | | | | | 1.96 | | | | | | 0.27 | | | | | | 60 | |
| | | 19.33 | | | | | | 8.20 | | | | | | 44,224 | | | | | | 0.79 | | | | | | 0.81 | | | | | | 1.48 | | | | | | 60 | |
| | | 19.04 | | | | | | 7.77 | | | | | | 646 | | | | | | 1.29 | | | | | | 1.31 | | | | | | 0.95 | | | | | | 60 | |
| | | 19.02 | | | | | | 8.16 | | | | | | 696 | | | | | | 0.94 | | | | | | 0.96 | | | | | | 1.77 | | | | | | 60 | |
| | | 18.99 | | | | | | 7.65 | | | | | | 591 | | | | | | 1.44 | | | | | | 1.46 | | | | | | 0.75 | | | | | | 60 | |
| | | 17.84 | | | | | | 2.30 | | | | | | 625,385 | | | | | | 1.17 | | | | | | 1.18 | | | | | | 1.15 | (f) | | | | | 93 | |
| | | 17.16 | | | | | | 1.52 | | | | | | 24,908 | | | | | | 1.92 | | | | | | 1.93 | | | | | | 0.40 | (f) | | | | | 93 | |
| | | 18.12 | | | | | | 2.74 | | | | | | 468,009 | | | | | | 0.77 | | | | | | 0.78 | | | | | | 1.54 | (f) | | | | | 93 | |
| | | 17.83 | | | | | | 2.21 | | | | | | 1,625 | | | | | | 1.27 | | | | | | 1.28 | | | | | | 1.06 | (f) | | | | | 93 | |
| | | 17.82 | | | | | | 2.55 | | | | | | 65 | | | | | | 0.92 | | | | | | 0.93 | | | | | | 1.37 | (f) | | | | | 93 | |
| | | 17.79 | | | | | | 2.04 | | | | | | 498 | | | | | | 1.42 | | | | | | 1.43 | | | | | | 0.87 | (f) | | | | | 93 | |
| | |
| The accompanying notes are an integral part of these financial statements. | | 61 |
GOLDMAN SACHS LARGE CAP VALUE FUND
Financial Highlights
Selected Data for a Share Outstanding Throughout Each Period
| | | | | | | | | | | | | | | | | | | | | | | | | | | | | | |
| | | | | | | | From
investment operations | | | Distributions
to shareholders | |
| | | Year - Share Class | |
Net asset
value,
beginning
of period | | | Net
investment
income (loss)(a) | | | Net realized
and unrealized
gain (loss) | | | Total from
investment
operations | | | From net
investment
income | | | From net
realized
gains | | | Total
distributions | |
| FOR THE SIX MONTHS ENDED FEBRUARY 28, (UNAUDITED) | | | | | |
| | 2015 - A | | $ | 18.50 | | | $ | 0.08 | | | $ | 0.33 | | | $ | 0.41 | | | $ | (0.14 | ) | | $ | (0.96 | ) | | $ | (1.10 | ) |
| | 2015 - C | | | 17.86 | | | | 0.01 | | | | 0.32 | | | | 0.33 | | | | (0.02 | ) | | | (0.96 | ) | | | (0.98 | ) |
| | 2015 - Institutional | | | 18.67 | | | | 0.11 | | | | 0.35 | | | | 0.46 | | | | (0.22 | ) | | | (0.96 | ) | | | (1.18 | ) |
| | 2015 - Service | | | 18.42 | | | | 0.07 | | | | 0.33 | | | | 0.40 | | | | (0.14 | ) | | | (0.96 | ) | | | (1.10 | ) |
| | 2015 - IR | | | 18.34 | | | | 0.10 | | | | 0.33 | | | | 0.43 | | | | — | (e) | | | (0.96 | ) | | | (0.96 | ) |
| | 2015 - R | | | 18.17 | | | | 0.06 | | | | 0.33 | | | | 0.39 | | | | (0.12 | ) | | | (0.96 | ) | | | (1.08 | ) |
| | | | | | | | | | | | | | | | | | | | | | | | | | | | | | |
| | FOR THE FISCAL YEARS ENDED AUGUST 31, | |
| | 2014 - A | | | 15.06 | | | | 0.13 | | | | 3.41 | | | | 3.54 | | | | (0.10 | ) | | | — | | | | — | |
| | 2014 - C | | | 14.56 | | | | — | (e) | | | 3.31 | | | | 3.31 | | | | (0.01 | ) | | | — | | | | — | |
| | 2014 - Institutional | | | 15.20 | | | | 0.19 | | | | 3.45 | | | | 3.64 | | | | (0.17 | ) | | | — | | | | — | |
| | 2014 - Service | | | 14.99 | | | | 0.11 | | | | 3.40 | | | | 3.51 | | | | (0.08 | ) | | | — | | | | — | |
| | 2014 - IR | | | 14.94 | | | | 0.17 | | | | 3.38 | | | | 3.55 | | | | (0.15 | ) | | | — | | | | — | |
| | 2014 - R | | | 14.80 | | | | 0.08 | | | | 3.36 | | | | 3.44 | | | | (0.07 | ) | | | — | | | | — | |
| | 2013 - A | | | 12.13 | | | | 0.12 | | | | 2.95 | | | | 3.07 | | | | (0.14 | ) | | | — | | | | — | |
| | 2013 - C | | | 11.74 | | | | 0.01 | | | | 2.86 | | | | 2.87 | | | | (0.05 | ) | | | — | | | | — | |
| | 2013 - Institutional | | | 12.26 | | | | 0.17 | | | | 2.97 | | | | 3.14 | | | | (0.20 | ) | | | — | | | | — | |
| | 2013 - Service | | | 12.06 | | | | 0.10 | | | | 2.94 | | | | 3.04 | | | | (0.11 | ) | | | — | | | | — | |
| | 2013 - IR | | | 12.05 | | | | 0.15 | | | | 2.92 | | | | 3.07 | | | | (0.18 | ) | | | — | | | | — | |
| | 2013 - R | | | 11.93 | | | | 0.08 | | | | 2.90 | | | | 2.98 | | | | (0.11 | ) | | | — | | | | — | |
| | 2012 - A | | | 10.70 | | | | 0.15 | (g) | | | 1.41 | | | | 1.56 | | | | (0.13 | ) | | | — | | | | — | |
| | 2012 - C | | | 10.33 | | | | 0.06 | (g) | | | 1.38 | | | | 1.44 | | | | (0.03 | ) | | | — | | | | — | |
| | 2012 - Institutional | | | 10.82 | | | | 0.20 | (g) | | | 1.42 | | | | 1.62 | | | | (0.18 | ) | | | — | | | | — | |
| | 2012 - Service | | | 10.64 | | | | 0.14 | (g) | | | 1.40 | | | | 1.54 | | | | (0.12 | ) | | | — | | | | — | |
| | 2012 - IR | | | 10.64 | | | | 0.17 | (g) | | | 1.41 | | | | 1.58 | | | | (0.17 | ) | | | — | | | | — | |
| | 2012 - R | | | 10.54 | | | | 0.11 | (g) | | | 1.40 | | | | 1.51 | | | | (0.12 | ) | | | — | | | | — | |
| | 2011 - A | | | 9.90 | | | | 0.07 | | | | 0.80 | | | | 0.87 | | | | (0.07 | ) | | | — | | | | — | |
| | 2011 - C | | | 9.57 | | | | (0.01 | ) | | | 0.77 | | | | 0.76 | | | | — | | | | — | | | | — | |
| | 2011 - Institutional | | | 10.01 | | | | 0.12 | | | | 0.81 | | | | 0.93 | | | | (0.12 | ) | | | — | | | | — | |
| | 2011 - Service | | | 9.85 | | | | 0.06 | | | | 0.79 | | | | 0.85 | | | | (0.06 | ) | | | — | | | | — | |
| | 2011 - IR | | | 9.85 | | | | 0.10 | | | | 0.79 | | | | 0.89 | | | | (0.10 | ) | | | — | | | | — | |
| | 2011 - R | | | 9.77 | | | | 0.05 | | | | 0.78 | | | | 0.83 | | | | (0.06 | ) | | | — | | | | — | |
| | 2010 - A | | | 9.81 | | | | 0.07 | (h) | | | 0.12 | | | | 0.19 | | | | (0.10 | ) | | | — | | | | — | |
| | 2010 - C | | | 9.49 | | | | (0.01 | )(h) | | | 0.12 | | | | 0.11 | | | | (0.03 | ) | | | — | | | | — | |
| | 2010 - Institutional | | | 9.92 | | | | 0.11 | (h) | | | 0.11 | | | | 0.22 | | | | (0.13 | ) | | | — | | | | — | |
| | 2010 - Service | | | 9.76 | | | | 0.06 | (h) | | | 0.12 | | | | 0.18 | | | | (0.09 | ) | | | — | | | | — | |
| | 2010 - IR | | | 9.76 | | | | 0.10 | (h) | | | 0.11 | | | | 0.21 | | | | (0.12 | ) | | | — | | | | — | |
| | 2010 - R | | | 9.72 | | | | 0.03 | (h) | | | 0.14 | | | | 0.17 | | | | (0.12 | ) | | | — | | | | — | |
| | (a) | | Calculated based on the average shares outstanding methodology. |
| | (b) | | Assumes investment at the net asset value at the beginning of the period, reinvestment of all dividends and distributions, a complete redemption of the investment at the net asset value at the end of the period and no sales or redemption charges. Total returns would be reduced if a sales or redemption charge was taken into account. Returns do not reflect the deduction of taxes that a shareholder would pay on Fund distributions or the redemption of Fund shares. Total returns for periods less than one full year are not annualized. |
| | (c) | | The Fund’s portfolio turnover rate is calculated in accordance with regulatory requirements, without regard to transactions involving short term investments and certain derivatives. If such transactions were included, the Fund’s portfolio turnover rate may be higher. |
| | (e) | | Amount is less than $0.005 per share. |
| | (f) | | Amount is less than 0.005% of average net assets. |
| | (g) | | Reflects income recognized from special dividends which amounted to $0.02 per share and 0.21% of average net assets. |
| | (h) | | Reflects income recognized from special dividends which amounted to $0.02 per share and 0.22% of average net assets. |
| | |
| 62 | | The accompanying notes are an integral part of these financial statements. |
GOLDMAN SACHS LARGE CAP VALUE FUND
| | | | | | | | | | | | | | | | | | | | | | | | | | | | | | | | | | | | | | | | |
| | | | | | | | | | | | | | | | | | | | | | | | | | | | | | | | | | |
| | | Net asset
value, end
of period | | | | | Total
return(b) | | | | | Net assets,
end of
period
(in 000s) | | | | | Ratio of
net expenses
to average
net assets | | | | | Ratio of
total expenses
to average
net assets | | | | | Ratio of
net investment
income (loss)
to average
net assets | | | | | Portfolio
turnover
rate(c) | |
| | | | | | | | | | | | | | | | | | | | | | | | | | | | | | | | | | | | | | | | |
| | $ | 17.81 | | | | | | 2.30 | % | | | | $ | 262,838 | | | | | | 1.17 | %(d) | | | | | 1.19 | %(d) | | | | | 0.89 | %(d) | | | | | 41 | % |
| | | 17.21 | | | | | | 1.89 | | | | | | 46,091 | | | | | | 1.92 | (d) | | | | | 1.94 | (d) | | | | | 0.14 | (d) | | | | | 41 | |
| | | 17.95 | | | | | | 2.52 | | | | | | 1,224,101 | | | | | | 0.77 | (d) | | | | | 0.79 | (d) | | | | | 1.29 | (d) | | | | | 41 | |
| | | 17.72 | | | | | | 2.22 | | | | | | 3,537 | | | | | | 1.27 | (d) | | | | | 1.29 | (d) | | | | | 0.80 | (d) | | | | | 41 | |
| | | 17.81 | | | | | | 2.42 | | | | | | 7,649 | | | | | | 0.92 | (d) | | | | | 0.94 | (d) | | | | | 1.15 | (d) | | | | | 41 | |
| | | 17.48 | | | | | | 2.18 | | | | | | 8,372 | | | | | | 1.42 | (d) | | | | | 1.44 | (d) | | | | | 0.63 | (d) | | | | | 41 | |
| | | | | | | | | | | | | | | | | | | | | | | | | | | | | | | | | | | | | | | | |
| | | | | | | | | | | | | | | | | | | | | | | | | | | | | | | | | | | | | | | | |
| | | 18.50 | | | | | | 23.62 | | | | | | 260,256 | | | | | | 1.19 | | | | | | 1.20 | | | | | | 0.74 | | | | | | 67 | |
| | | 17.86 | | | | | | 22.73 | | | | | | 45,535 | | | | | | 1.94 | | | | | | 1.95 | | | | | | (0.01 | ) | | | | | 67 | |
| | | 18.67 | | | | | | 24.15 | | | | | | 1,206,895 | | | | | | 0.79 | | | | | | 0.80 | | | | | | 1.14 | | | | | | 67 | |
| | | 18.42 | | | | | | 23.53 | | | | | | 3,185 | | | | | | 1.29 | | | | | | 1.30 | | | | | | 0.64 | | | | | | 67 | |
| | | 18.34 | | | | | | 23.93 | | | | | | 6,618 | | | | | | 0.95 | | | | | | 0.95 | | | | | | 1.05 | | | | | | 67 | |
| | | 18.17 | | | | | | 23.33 | | | | | | 7,705 | | | | | | 1.44 | | | | | | 1.45 | | | | | | 0.49 | | | | | | 67 | |
| | | 15.06 | | | | | | 25.56 | | | | | | 229,781 | | | | | | 1.20 | | | | | | 1.20 | | | | | | 0.89 | | | | | | 98 | |
| | | 14.56 | | | | | | 24.56 | | | | | | 37,763 | | | | | | 1.95 | | | | | | 1.95 | | | | | | 0.08 | | | | | | 98 | |
| | | 15.20 | | | | | | 25.95 | | | | | | 1,048,489 | | | | | | 0.80 | | | | | | 0.80 | | | | | | 1.22 | | | | | | 98 | |
| | | 14.99 | | | | | | 25.39 | | | | | | 2,985 | | | | | | 1.30 | | | | | | 1.30 | | | | | | 0.74 | | | | | | 98 | |
| | | 14.94 | | | | | | 25.82 | | | | | | 141,673 | | | | | | 0.95 | | | | | | 0.95 | | | | | | 1.07 | | | | | | 98 | |
| | | 14.80 | | | | | | 25.22 | | | | | | 6,702 | | | | | | 1.45 | | | | | | 1.45 | | | | | | 0.58 | | | | | | 98 | |
| | | 12.13 | | | | | | 14.69 | | | | | | 418,274 | | | | | | 1.19 | | | | | | 1.19 | | | | | | 1.31 | (g) | | | | | 123 | |
| | | 11.74 | | | | | | 13.89 | | | | | | 34,854 | | | | | | 1.94 | | | | | | 1.94 | | | | | | 0.55 | (g) | | | | | 123 | |
| | | 12.26 | | | | | | 15.19 | | | | | | 900,661 | | | | | | 0.79 | | | | | | 0.79 | | | | | | 1.75 | (g) | | | | | 123 | |
| | | 12.06 | | | | | | 14.63 | | | | | | 3,424 | | | | | | 1.29 | | | | | | 1.29 | | | | | | 1.23 | (g) | | | | | 123 | |
| | | 12.05 | | | | | | 14.99 | | | | | | 103,975 | | | | | | 0.94 | | | | | | 0.94 | | | | | | 1.52 | (g) | | | | | 123 | |
| | | 11.93 | | | | | | 14.38 | | | | | | 5,411 | | | | | | 1.44 | | | | | | 1.44 | | | | | | 1.02 | (g) | | | | | 123 | |
| | | 10.70 | | | | | | 8.75 | | | | | | 555,309 | | | | | | 1.17 | | | | | | 1.17 | | | | | | 0.63 | | | | | | 76 | |
| | | 10.33 | | | | | | 7.94 | | | | | | 43,479 | | | | | | 1.92 | | | | | | 1.92 | | | | | | (0.11 | ) | | | | | 76 | |
| | | 10.82 | | | | | | 9.18 | | | | | | 1,418,409 | | | | | | 0.77 | | | | | | 0.77 | | | | | | 1.04 | | | | | | 76 | |
| | | 10.64 | | | | | | 8.56 | | | | | | 6,374 | | | | | | 1.27 | | | | | | 1.27 | | | | | | 0.54 | | | | | | 76 | |
| | | 10.64 | | | | | | 8.99 | | | | | | 93,853 | | | | | | 0.92 | | | | | | 0.92 | | | | | | 0.89 | | | | | | 76 | |
| | | 10.54 | | | | | | 8.44 | | | | | | 5,318 | | | | | | 1.42 | | | | | | 1.42 | | | | | | 0.39 | | | | | | 76 | |
| | | 9.90 | | | | | | 1.87 | | | | | | 616,533 | | | | | | 1.17 | | | | | | 1.17 | | | | | | 0.67 | (h) | | | | | 108 | |
| | | 9.57 | | | | | | 1.10 | | | | | | 53,186 | | | | | | 1.92 | | | | | | 1.92 | | | | | | (0.07 | )(h) | | | | | 108 | |
| | | 10.01 | | | | | | 2.22 | | | | | | 1,648,589 | | | | | | 0.77 | | | | | | 0.77 | | | | | | 1.06 | (h) | | | | | 108 | |
| | | 9.85 | | | | | | 1.83 | | | | | | 6,149 | | | | | | 1.27 | | | | | | 1.27 | | | | | | 0.58 | (h) | | | | | 108 | |
| | | 9.85 | | | | | | 2.12 | | | | | | 80,471 | | | | | | 0.92 | | | | | | 0.92 | | | | | | 0.92 | (h) | | | | | 108 | |
| | | .77 | | | | | | 1.71 | | | | | | 3,578 | | | | | | 1.42 | | | | | | 1.42 | | | | | | 0.31 | (h) | | | | | 108 | |
| | |
| The accompanying notes are an integral part of these financial statements. | | 63 |
GOLDMAN SACHS MID CAP VALUE FUND
Financial Highlights
Selected Data for a Share Outstanding Throughout Each Period
| | | | | | | | | | | | | | | | | | | | | | | | | | | | | | |
| | | | | | | | From
investment operations | | | Distributions
to shareholders | |
| | | Year - Share Class | | Net asset
value,
beginning
of period | | | Net
investment
income (loss)(a) | | | Net realized
and unrealized
gain (loss) | | | Total from
investment
operations | | | From net
investment
income | | | From net
realized
gains | | | Total
distributions | |
| | FOR THE SIX MONTHS ENDED FEBRUARY 28, (UNAUDITED) | |
| | 2015 - A | | $ | 49.03 | | | $ | 0.07 | (d) | | $ | 1.48 | | | $ | 1.55 | | | $ | (0.13 | ) | | $ | (8.47 | ) | | $ | (8.60 | ) |
| | 2015 - C | | | 46.05 | | | | (0.10 | )(d) | | | 1.38 | | | | 1.28 | | | | — | | | | (8.47 | ) | | | (8.47 | ) |
| | 2015 - Institutional | | | 49.55 | | | | 0.15 | (d) | | | 1.50 | | | | 1.65 | | | | (0.40 | ) | | | (8.47 | ) | | | (8.87 | ) |
| | 2015 - Service | | | 48.40 | | | | 0.04 | (d) | | | 1.47 | | | | 1.51 | | | | (0.09 | ) | | | (8.47 | ) | | | (8.56 | ) |
| | 2015 - IR | | | 48.52 | | | | 0.11 | (d) | | | 1.47 | | | | 1.58 | | | | (0.34 | ) | | | (8.47 | ) | | | (8.81 | ) |
| | 2015 - R | | | 48.28 | | | | — | (d)(f) | | | 1.46 | | | | 1.46 | | | | (0.12 | ) | | | (8.47 | ) | | | (8.59 | ) |
| | | | | | | | | | | | | | | | | | | | | | | | | | | | | | |
| | FOR THE FISCAL YEARS ENDED AUGUST 31, | |
| | 2014 - A | | | 46.08 | | | | 0.18 | | | | 10.10 | | | | 10.28 | | | | (0.22 | ) | | | (7.11 | ) | | | (7.33 | ) |
| | 2014 - C | | | 43.79 | | | | (0.17 | ) | | | 9.54 | | | | 9.37 | | | | — | | | | (7.11 | ) | | | (7.11 | ) |
| | 2014 - Institutional | | | 46.52 | | | | 0.36 | | | | 10.19 | | | | 10.55 | | | | (0.41 | ) | | | (7.11 | ) | | | (7.52 | ) |
| | 2014 - Service | | | 45.59 | | | | 0.13 | | | | 9.97 | | | | 10.10 | | | | (0.18 | ) | | | (7.11 | ) | | | (7.29 | ) |
| | 2014 - IR | | | 45.70 | | | | 0.30 | | | | 9.98 | | | | 10.28 | | | | (0.35 | ) | | | (7.11 | ) | | | (7.46 | ) |
| | 2014 - R | | | 45.54 | | | | 0.05 | | | | 9.97 | | | | 10.02 | | | | (0.17 | ) | | | (7.11 | ) | | | (7.28 | ) |
| | 2013 - A | | | 37.43 | | | | 0.24 | | | | 8.75 | | | | 8.99 | | | | (0.34 | ) | | | — | | | | (0.34 | ) |
| | 2013 - C | | | 35.57 | | | | (0.07 | ) | | | 8.34 | | | | 8.27 | | | | (0.05 | ) | | | — | | | | (0.05 | ) |
| | 2013 - Institutional | | | 37.77 | | | | 0.41 | | | | 8.83 | | | | 9.24 | | | | (0.49 | ) | | | — | | | | (0.49 | ) |
| | 2013 - Service | | | 37.02 | | | | 0.19 | | | | 8.67 | | | | 8.86 | | | | (0.29 | ) | | | — | | | | (0.29 | ) |
| | 2013 - IR | | | 37.12 | | | | 0.34 | | | | 8.68 | | | | 9.02 | | | | (0.44 | ) | | | — | | | | (0.44 | ) |
| | 2013 - R | | | 37.04 | | | | 0.12 | | | | 8.67 | | | | 8.79 | | | | (0.29 | ) | | | — | | | | (0.29 | ) |
| | 2012 - A | | | 33.41 | | | | 0.31 | (g) | | | 3.88 | | | | 4.19 | | | | (0.17 | ) | | | — | | | | (0.17 | ) |
| | 2012 - C | | | 31.83 | | | | 0.05 | (g) | | | 3.69 | | | | 3.74 | | | | — | | | | — | | | | — | |
| | 2012 - Institutional | | | 33.74 | | | | 0.46 | (g) | | | 3.89 | | | | 4.35 | | | | (0.32 | ) | | | — | | | | (0.32 | ) |
| | 2012 - Service | | | 33.06 | | | | 0.27 | (g) | | | 3.83 | | | | 4.10 | | | | (0.14 | ) | | | — | | | | (0.14 | ) |
| | 2012 - IR | | | 33.18 | | | | 0.41 | (g) | | | 3.82 | | | | 4.23 | | | | (0.29 | ) | | | — | | | | (0.29 | ) |
| | 2012 - R | | | 33.14 | | | | 0.25 | (g) | | | 3.81 | | | | 4.06 | | | | (0.16 | ) | | | — | | | | (0.16 | ) |
| | 2011 - A | | | 29.10 | | | | 0.17 | (h) | | | 4.27 | | | | 4.44 | | | | (0.13 | ) | | | — | | | | (0.13 | ) |
| | 2011 - C | | | 27.83 | | | | (0.09 | )(h) | | | 4.09 | | | | 4.00 | | | | — | | | | — | | | | — | |
| | 2011 - Institutional | | | 29.37 | | | | 0.31 | (h) | | | 4.32 | | | | 4.63 | | | | (0.26 | ) | | | — | | | | (0.26 | ) |
| | 2011 - Service | | | 28.80 | | | | 0.13 | (h) | | | 4.24 | | | | 4.37 | | | | (0.11 | ) | | | — | | | | (0.11 | ) |
| | 2011 - IR | | | 28.93 | | | | 0.22 | (h) | | | 4.28 | | | | 4.50 | | | | (0.25 | ) | | | — | | | | (0.25 | ) |
| | 2011 - R | | | 28.96 | | | | 0.06 | (h) | | | 4.27 | | | | 4.33 | | | | (0.15 | ) | | | — | | | | (0.15 | ) |
| | 2010 - A | | | 26.29 | | | | 0.16 | (i) | | | 2.93 | | | | 3.09 | | | | (0.28 | ) | | | — | | | | (0.28 | ) |
| | 2010 - C | | | 25.17 | | | | (0.05 | )(i) | | | 2.81 | | | | 2.76 | | | | (0.10 | ) | | | — | | | | (0.10 | ) |
| | 2010 - Institutional | | | 26.52 | | | | 0.28 | (i) | | | 2.95 | | | | 3.23 | | | | (0.38 | ) | | | — | | | | (0.38 | ) |
| | 2010 - Service | | | 26.02 | | | | 0.13 | (i) | | | 2.91 | | | | 3.04 | | | | (0.26 | ) | | | — | | | | (0.26 | ) |
| | 2010 - IR | | | 26.16 | | | | 0.16 | (i) | | | 2.99 | | | | 3.15 | | | | (0.38 | ) | | | — | | | | (0.38 | ) |
| | 2010 - R | | | 26.26 | | | | 0.02 | (i) | | | 3.00 | | | | 3.02 | | | | (0.32 | ) | | | — | | | | (0.32 | ) |
| | (a) | | Calculated based on the average shares outstanding methodology. |
| | (b) | | Assumes investment at the net asset value at the beginning of the period, reinvestment of all dividends and distributions, a complete redemption of the investment at the net asset value at the end of the period and no sales or redemption charges. Total returns would be reduced if a sales or redemption charge was taken into account. Returns do not reflect the deduction of taxes that a shareholder would pay on Fund distributions or the redemption of Fund shares. Total returns for periods less than one full year are not annualized. |
| | (c) | | The Fund’s portfolio turnover rate is calculated in accordance with regulatory requirements, without regard to transactions involving short term investments and certain derivatives. If such transactions were included, the Fund’s portfolio turnover rate may be higher. |
| | (d) | | Reflects income recognized from special dividends which amounted to $0.03 per share and 0.13% of average net assets. |
| | (f) | | Amount is less than $0.005 per share. |
| | (g) | | Reflects income recognized from special dividends which amounted to $0.09 per share and 0.25% of average net assets. |
| | (h) | | Reflects income recognized from special dividends which amounted to $0.03 per share and 0.07% of average net assets. |
| | (i) | | Reflects income recognized from special dividends which amounted to $0.09 per share and 0.31% of average net assets. |
| | |
| 64 | | The accompanying notes are an integral part of these financial statements. |
GOLDMAN SACHS MID CAP VALUE FUND
| | | | | | | | | | | | | | | | | | | | | | | | | | | | | | | | | | | | | | | | |
| | | | | | | | | | | | | | | | | | | | | | | | | | | | | | | | | | |
| | | Net asset
value, end
of period | | | | | Total
return(b) | | | | | Net assets,
end of
period
(in 000s) | | | | | Ratio of
net expenses
to average
net assets | | | | | Ratio of
total expenses
to average
net assets | | | | | Ratio of
net investment
income (loss)
to average
net assets | | | | | Portfolio
turnover
rate(c) | |
| | | | | | | | | | | | | | | | | | | | | | | | | | | | | | | | | | | | | | | | |
| | $ | 41.98 | | | | | | 3.62 | % | | | | $ | 2,262,372 | | | | | | 1.14 | %(e) | | | | | 1.14 | %(e) | | | | | 0.31 | %(d)(e) | | | | | 48 | % |
| | | 38.86 | | | | | | 3.24 | | | | | | 201,896 | | | | | | 1.89 | (e) | | | | | 1.90 | (e) | | | | | (0.48 | )(d)(e) | | | | | 48 | |
| | | 42.33 | | | | | | 3.80 | | | | | | 6,350,580 | | | | | | 0.74 | (e) | | | | | 0.75 | (e) | | | | | 0.68 | (d)(e) | | | | | 48 | |
| | | 41.35 | | | | | | 3.56 | | | | | | 260,510 | | | | | | 1.24 | (e) | | | | | 1.25 | (e) | | | | | 0.19 | (d)(e) | | | | | 48 | |
| | | 41.29 | | | | | | 3.73 | | | | | | 365,322 | | | | | | 0.89 | (e) | | | | | 0.90 | (e) | | | | | 0.52 | (d)(e) | | | | | 48 | |
| | | 41.15 | | | | | | 3.47 | | | | | | 43,670 | | | | | | 1.39 | (e) | | | | | 1.40 | (e) | | | | | 0.01 | (d)(e) | | | | | 48 | |
| | | | | | | | | | | | | | | | | | | | | | | | | | | | | | | | | | | | | | | | |
| | | | | | | | | | | | | | | | | | | | | | | | | | | | | | | | | | | | | | | | |
| | | 49.03 | | | | | | 24.77 | | | | | | 3,153,971 | | | | | | 1.14 | | | | | | 1.14 | | | | | | 0.38 | | | | | | 87 | |
| | | 46.05 | | | | | | 23.81 | | | | | | 202,083 | | | | | | 1.89 | | | | | | 1.89 | | | | | | (0.38 | ) | | | | | 87 | |
| | | 49.55 | | | | | | 25.25 | | | | | | 6,347,006 | | | | | | 0.74 | | | | | | 0.74 | | | | | | 0.77 | | | | | | 87 | |
| | | 48.40 | | | | | | 24.63 | | | | | | 368,720 | | | | | | 1.24 | | | | | | 1.24 | | | | | | 0.28 | | | | | | 87 | |
| | | 48.52 | | | | | | 25.07 | | | | | | 295,017 | | | | | | 0.89 | | | | | | 0.89 | | | | | | 0.66 | | | | | | 87 | |
| | | 48.28 | | | | | | 24.44 | | | | | | 35,896 | | | | | | 1.39 | | | | | | 1.39 | | | | | | 0.12 | | | | | | 87 | |
| | | 46.08 | | | | | | 24.20 | | | | | | 3,297,185 | | | | | | 1.14 | | | | | | 1.14 | | | | | | 0.58 | | | | | | 103 | |
| | | 43.79 | | | | | | 23.29 | | | | | | 174,875 | | | | | | 1.89 | | | | | | 1.89 | | | | | | (0.18 | ) | | | | | 103 | |
| | | 46.52 | | | | | | 24.74 | | | | | | 5,328,684 | | | | | | 0.74 | | | | | | 0.74 | | | | | | 0.96 | | | | | | 103 | |
| | | 45.59 | | | | | | 24.11 | | | | | | 334,583 | | | | | | 1.24 | | | | | | 1.24 | | | | | | 0.47 | | | | | | 103 | |
| | | 45.70 | | | | | | 24.54 | | | | | | 97,243 | | | | | | 0.89 | | | | | | 0.89 | | | | | | 0.80 | | | | | | 103 | |
| | | 45.54 | | | | | | 23.91 | | | | | | 24,201 | | | | | | 1.39 | | | | | | 1.39 | | | | | | 0.28 | | | | | | 103 | |
| | | 37.43 | | | | | | 12.56 | | | | | | 3,074,173 | | | | | | 1.15 | | | | | | 1.15 | | | | | | 0.91 | (g) | | | | | 80 | |
| | | 35.57 | | | | | | 11.72 | | | | | | 160,062 | | | | | | 1.90 | | | | | | 1.90 | | | | | | 0.16 | (g) | | | | | 80 | |
| | | 37.77 | | | | | | 12.96 | | | | | | 3,985,625 | | | | | | 0.75 | | | | | | 0.75 | | | | | | 1.31 | (g) | | | | | 80 | |
| | | 37.02 | | | | | | 12.41 | | | | | | 268,412 | | | | | | 1.25 | | | | | | 1.25 | | | | | | 0.81 | (g) | | | | | 80 | |
| | | 37.12 | | | | | | 12.83 | | | | | | 70,409 | | | | | | 0.90 | | | | | | 0.90 | | | | | | 1.20 | (g) | | | | | 80 | |
| | | 37.04 | | | | | | 12.28 | | | | | | 13,255 | | | | | | 1.40 | | | | | | 1.40 | | | | | | 0.73 | (g) | | | | | 80 | |
| | | 33.41 | | | | | | 15.22 | | | | | | 3,278,879 | | | | | | 1.16 | | | | | | 1.16 | | | | | | 0.47 | (h) | | | | | 77 | |
| | | 31.83 | | | | | | 14.37 | | | | | | 166,559 | | | | | | 1.91 | | | | | | 1.91 | | | | | | (0.28 | )(h) | | | | | 77 | |
| | | 33.74 | | | | | | 15.73 | | | | | | 3,633,400 | | | | | | 0.76 | | | | | | 0.76 | | | | | | 0.86 | (h) | | | | | 77 | |
| | | 33.06 | | | | | | 15.16 | | | | | | 269,370 | | | | | | 1.26 | | | | | | 1.26 | | | | | | 0.37 | (h) | | | | | 77 | |
| | | 33.18 | | | | | | 15.51 | | | | | | 40,531 | | | | | | 0.91 | | | | | | 0.91 | | | | | | 0.62 | (h) | | | | | 77 | |
| | | 33.14 | | | | | | 14.94 | | | | | | 5,972 | | | | | | 1.41 | | | | | | 1.41 | | | | | | 0.18 | (h) | | | | | 77 | |
| | | 29.10 | | | | | | 11.84 | | | | | | 2,819,867 | | | | | | 1.16 | | | | | | 1.16 | | | | | | 0.54 | (i) | | | | | 104 | |
| | | 27.83 | | | | | | 10.98 | | | | | | 147,697 | | | | | | 1.91 | | | | | | 1.91 | | | | | | (0.19 | )(i) | | | | | 104 | |
| | | 29.37 | | | | | | 12.26 | | | | | | 2,710,882 | | | | | | 0.76 | | | | | | 0.76 | | | | | | 0.93 | (i) | | | | | 104 | |
| | | 28.80 | | | | | | 11.74 | | | | | | 232,356 | | | | | | 1.26 | | | | | | 1.26 | | | | | | 0.44 | (i) | | | | | 104 | |
| | | 28.93 | | | | | | 12.10 | | | | | | 1,764 | | | | | | 0.91 | | | | | | 0.91 | | | | | | 0.54 | (i) | | | | | 104 | |
| | | 28.96 | | | | | | 11.56 | | | | | | 1,862 | | | | | | 1.41 | | | | | | 1.41 | | | | | | 0.06 | (i) | | | | | 104 | |
| | |
| The accompanying notes are an integral part of these financial statements. | | 65 |
GOLDMAN SACHS SMALL CAP VALUE FUND
Financial Highlights
Selected Data for a Share Outstanding Throughout Each Period
| | | | | | | | | | | | | | | | | | | | | | | | | | | | | | |
| | | | | | | | Income (loss) from
investment operations | | | Distributions
to shareholders | |
| | | Year - Share Class | | Net asset
value,
beginning
of period | | | Net
investment
income (loss)(a) | | | Net realized
and unrealized
gain | | | Total from
investment
operations | | | From net
investment
income | | | From net
realized
gains | | | Total
distributions | |
| | FOR THE SIX MONTHS ENDED FEBRUARY 28, (UNAUDITED) | |
| | 2015 - A | | $ | 55.40 | | | $ | 0.12 | (d) | | $ | 1.91 | | | $ | 2.03 | | | $ | (0.10 | ) | | $ | (4.36 | ) | | $ | (4.46 | ) |
| | 2015 - C | | | 45.84 | | | | (0.06 | )(d) | | | 1.55 | | | | 1.49 | | | | — | | | | (4.36 | ) | | | (4.36 | ) |
| | 2015 - Institutional | | | 58.80 | | | | 0.24 | (d) | | | 2.03 | | | | 2.27 | | | | (0.33 | ) | | | (4.36 | ) | | | (4.69 | ) |
| | 2015 - Service | | | 54.08 | | | | 0.09 | (d) | | | 1.86 | | | | 1.95 | | | | (0.04 | ) | | | (4.36 | ) | | | (4.40 | ) |
| | 2015 - IR | | | 55.18 | | | | 0.18 | (d) | | | 1.91 | | | | 2.09 | | | | (0.25 | ) | | | (4.36 | ) | | | (4.61 | ) |
| | 2015 - R | | | 54.58 | | | | 0.06 | (d) | | | 1.87 | | | | 1.93 | | | | — | | | | (4.36 | ) | | | (4.36 | ) |
| | | | | | | | | | | | | | | | | | | | | | | | | | | | | | |
| | FOR THE FISCAL YEARS ENDED AUGUST 31, | |
| | 2014 - A | | | 50.43 | | | | 0.12 | | | | 9.94 | | | | 10.06 | | | | (0.18 | ) | | | (4.91 | ) | | | (5.09 | ) |
| | 2014 - C | | | 42.64 | | | | (0.25 | ) | | | 8.36 | | | | 8.11 | | | | — | | | | (4.91 | ) | | | (4.91 | ) |
| | 2014 - Institutional | | | 53.22 | | | | 0.33 | | | | 10.53 | | | | 10.86 | | | | (0.37 | ) | | | (4.91 | ) | | | (5.28 | ) |
| | 2014 - Service | | | 49.36 | | | | 0.05 | | | | 9.74 | | | | 9.79 | | | | (0.16 | ) | | | (4.91 | ) | | | (5.07 | ) |
| | 2014 - IR | | | 50.25 | | | | 0.23 | | | | 9.93 | | | | 10.16 | | | | (0.32 | ) | | | (4.91 | ) | | | (5.23 | ) |
| | 2014 - R | | | 49.80 | | | | (0.03 | ) | | | 9.82 | | | | 9.79 | | | | (0.10 | ) | | | (4.91 | ) | | | (5.01 | ) |
| | 2013 - A | | | 43.11 | | | | 0.35 | (f) | | | 9.73 | | | | 10.08 | | | | (0.48 | ) | | | (2.28 | ) | | | (2.76 | ) |
| | 2013 - C | | | 36.89 | | | | 0.01 | (f) | | | 8.25 | | | | 8.26 | | | | (0.23 | ) | | | (2.28 | ) | | | (2.51 | ) |
| | 2013 - Institutional | | | 45.36 | | | | 0.55 | (f) | | | 10.26 | | | | 10.81 | | | | (0.67 | ) | | | (2.28 | ) | | | (2.95 | ) |
| | 2013 - Service | | | 42.30 | | | | 0.30 | (f) | | | 9.52 | | | | 9.82 | | | | (0.48 | ) | | | (2.28 | ) | | | (2.76 | ) |
| | 2013 - IR | | | 43.00 | | | | 0.41 | (f) | | | 9.74 | | | | 10.15 | | | | (0.62 | ) | | | (2.28 | ) | | | (2.90 | ) |
| | 2013 - R | | | 42.65 | | | | 0.19 | (f) | | | 9.65 | | | | 9.84 | | | | (0.41 | ) | | | (2.28 | ) | | | (2.69 | ) |
| | 2012 - A | | | 37.73 | | | | 0.27 | (g) | | | 5.86 | | | | 6.13 | | | | (0.08 | ) | | | (0.67 | ) | | | (0.75 | ) |
| | 2012 - C | | | 32.55 | | | | (0.03 | )(g) | | | 5.04 | | | | 5.01 | | | | — | | | | (0.67 | ) | | | (0.67 | ) |
| | 2012 - Institutional | | | 39.65 | | | | 0.46 | (g) | | | 6.15 | | | | 6.61 | | | | (0.23 | ) | | | (0.67 | ) | | | (0.90 | ) |
| | 2012 - Service | | | 37.01 | | | | 0.23 | (g) | | | 5.75 | | | | 5.98 | | | | (0.02 | ) | | | (0.67 | ) | | | (0.69 | ) |
| | 2012 - IR | | | 37.65 | | | | 0.36 | (g) | | | 5.85 | | | | 6.21 | | | | (0.19 | ) | | | (0.67 | ) | | | (0.86 | ) |
| | 2012 - R | | | 37.39 | | | | 0.17 | (g) | | | 5.81 | | | | 5.98 | | | | (0.05 | ) | | | (0.67 | ) | | | (0.72 | ) |
| | 2011 - A | | | 31.29 | | | | 0.10 | (h) | | | 6.43 | | | | 6.53 | | | | (0.09 | ) | | | — | | | | (0.09 | ) |
| | 2011 - C | | | 27.14 | | | | (0.17 | )(h) | | | 5.58 | | | | 5.41 | | | | — | | | | — | | | | — | |
| | 2011 - Institutional | | | 32.86 | | | | 0.26 | (h) | | | 6.75 | | | | 7.01 | | | | (0.22 | ) | | | — | | | | (0.22 | ) |
| | 2011 - Service | | | 30.71 | | | | 0.05 | (h) | | | 6.32 | | | | 6.37 | | | | (0.07 | ) | | | — | | | | (0.07 | ) |
| | 2011 - IR | | | 31.24 | | | | 0.15 | (h) | | | 6.45 | | | | 6.60 | | | | (0.19 | ) | | | — | | | | (0.19 | ) |
| | 2011 - R | | | 31.08 | | | | (0.04 | )(h) | | | 6.43 | | | | 6.39 | | | | (0.08 | ) | | | — | | | | (0.08 | ) |
| | 2010 - A | | | 28.58 | | | | 0.09 | (i) | | | 2.79 | | | | 2.88 | | | | (0.17 | ) | | | — | | | | (0.17 | ) |
| | 2010 - C | | | 24.85 | | | | (0.13 | )(i) | | | 2.43 | | | | 2.30 | | | | (0.01 | ) | | | — | | | | (0.01 | ) |
| | 2010 - Institutional | | | 29.99 | | | | 0.23 | (i) | | | 2.91 | | | | 3.14 | | | | (0.27 | ) | | | — | | | | (0.27 | ) |
| | 2010 - Service | | | 28.05 | | | | 0.05 | (i) | | | 2.76 | | | | 2.81 | | | | (0.15 | ) | | | — | | | | (0.15 | ) |
| | 2010 - IR | | | 28.55 | | | | 0.16 | (i) | | | 2.79 | | | | 2.95 | | | | (0.26 | ) | | | — | | | | (0.26 | ) |
| | 2010 - R | | | 28.53 | | | | (0.01 | )(i) | | | 2.80 | | | | 2.79 | | | | (0.24 | ) | | | — | | | | (0.24 | ) |
| | (a) | | Calculated based on the average shares outstanding methodology. |
| | (b) | | Assumes investment at the net asset value at the beginning of the period, reinvestment of all dividends and distributions, a complete redemption of the investment at the net asset value at the end of the period and no sales or redemption charges. Total returns would be reduced if a sales or redemption charge was taken into account. Returns do not reflect the deduction of taxes that a shareholder would pay on Fund distributions or the redemption of Fund shares. Total returns for periods less than one full year are not annualized. |
| | (c) | | The Fund’s portfolio turnover rate is calculated in accordance with regulatory requirements, without regard to transactions involving short term investments and certain derivatives. If such transactions were included, the Fund’s portfolio turnover rate may be higher. |
| | (d) | | Reflects income recognized from special dividends which amounted to $0.10 per share and 0.36% of average net assets. |
| | (f) | | Reflects income recognized from special dividends which amounted to $0.26 per share and 0.55% of average net assets. |
| | (g) | | Reflects income recognized from special dividends which amounted to $0.17 per share and 0.41% of average net assets. |
| | (h) | | Reflects Income recognized from special dividends which amounted to $0.06 per share and 0.16% of average net assets. |
| | (i) | | Reflects income recognized from special dividends which amounted to $0.05 per share and 0.14% of average net assets. |
| | |
| 66 | | The accompanying notes are an integral part of these financial statements. |
GOLDMAN SACHS SMALL CAP VALUE FUND
| | | | | | | | | | | | | | | | | | | | | | | | | | | | | | | | | | | | | | | | |
| | | | | | | | | | | | | | | | | | | | | | | | | | | | | | | | | | |
| | | Net asset
value, end
of period | | | | | Total
return(b) | | | | | Net assets,
end of
period
(in 000s) | | | | | Ratio of
net expenses
to average
net assets | | | | | Ratio of
total expenses
to average net
assets | | | | | Ratio of
net investment
income (loss)
to average
net assets | | | | | Portfolio
turnover
rate(c) | |
| | | | | | | | | | | | | | | | | | | | | | | | | | | | | | | | | | | | | | | | |
| | $ | 52.97 | | | | | | 3.95 | % | | | | $ | 1,061,700 | | | | | | 1.34 | %(e) | | | | | 1.39 | %(e) | | | | | 0.47 | %(d)(e) | | | | | 24 | % |
| | | 42.97 | | | | | | 3.56 | | | | | | 68,942 | | | | | | 2.09 | (e) | | | | | 2.14 | (e) | | | | | (0.29 | )(d)(e) | | | | | 24 | |
| | | 56.38 | | | | | | 4.14 | | | | | | 4,947,286 | | | | | | 0.94 | (e) | | | | | 0.99 | (e) | | | | | 0.86 | (d)(e) | | | | | 24 | |
| | | 51.63 | | | | | | 3.89 | | | | | | 173,852 | | | | | | 1.44 | (e) | | | | | 1.49 | (e) | | | | | 0.36 | (d)(e) | | | | | 24 | |
| | | 52.66 | | | | | | 4.06 | | | | | | 133,751 | | | | | | 1.09 | (e) | | | | | 1.14 | (e) | | | | | 0.70 | (d)(e) | | | | | 24 | |
| | | 52.15 | | | | | | 3.81 | | | | | | 150,095 | | | | | | 1.59 | (e) | | | | | 1.64 | (e) | | | | | 0.22 | (d)(e) | | | | | 24 | |
| | | | | | | | | | | | | | | | | | | | | | | | | | | | | | | | | | | | | | | | |
| | | | | | | | | | | | | | | | | | | | | | | | | | | | | | | | | | | | | | | | |
| | | 55.40 | | | | | | 20.72 | | | | | | 1,080,393 | | | | | | 1.35 | | | | | | 1.40 | | | | | | 0.22 | | | | | | 46 | |
| | | 45.84 | | | | | | 19.85 | | | | | | 69,319 | | | | | | 2.10 | | | | | | 2.15 | | | | | | (0.55 | ) | | | | | 46 | |
| | | 58.80 | | | | | | 21.22 | | | | | | 4,694,737 | | | | | | 0.95 | | | | | | 1.00 | | | | | | 0.58 | | | | | | 46 | |
| | | 54.08 | | | | | | 20.62 | | | | | | 176,500 | | | | | | 1.45 | | | | | | 1.50 | | | | | | 0.10 | | | | | | 46 | |
| | | 55.18 | | | | | | 21.05 | | | | | | 121,895 | | | | | | 1.10 | | | | | | 1.15 | | | | | | 0.43 | | | | | | 46 | |
| | | 54.58 | | | | | | 20.44 | | | | | | 139,858 | | | | | | 1.60 | | | | | | 1.65 | | | | | | (0.06 | ) | | | | | 46 | |
| | | 50.43 | | | | | | 24.86 | | | | | | 1,141,424 | | | | | | 1.38 | | | | | | 1.42 | | | | | | 0.75 | (f) | | | | | 57 | |
| | | 42.64 | | | | | | 23.89 | | | | | | 64,751 | | | | | | 2.13 | | | | | | 2.17 | | | | | | 0.03 | (f) | | | | | 57 | |
| | | 53.22 | | | | | | 25.34 | | | | | | 2,891,932 | | | | | | 0.98 | | | | | | 1.02 | | | | | | 1.12 | (f) | | | | | 57 | |
| | | 49.36 | | | | | | 24.70 | | | | | | 162,696 | | | | | | 1.48 | | | | | | 1.52 | | | | | | 0.65 | (f) | | | | | 57 | |
| | | 50.25 | | | | | | 25.16 | | | | | | 73,723 | | | | | | 1.13 | | | | | | 1.17 | | | | | | 0.86 | (f) | | | | | 57 | |
| | | 49.80 | | | | | | 24.51 | | | | | | 101,060 | | | | | | 1.63 | | | | | | 1.67 | | | | | | 0.40 | (f) | | | | | 57 | |
| | | 43.11 | | | | | | 16.43 | | | | | | 931,473 | | | | | | 1.41 | | | | | | 1.44 | | | | | | 0.68 | (g) | | | | | 50 | |
| | | 36.89 | | | | | | 15.59 | | | | | | 58,926 | | | | | | 2.16 | | | | | | 2.19 | | | | | | (0.07 | )(g) | | | | | 50 | |
| | | 45.36 | | | | | | 16.91 | | | | | | 1,852,215 | | | | | | 1.01 | | | | | | 1.04 | | | | | | 1.07 | (g) | | | | | 50 | |
| | | 42.30 | | | | | | 16.33 | | | | | | 115,385 | | | | | | 1.51 | | | | | | 1.54 | | | | | | 0.57 | (g) | | | | | 50 | |
| | | 43.00 | | | | | | 16.74 | | | | | | 24,332 | | | | | | 1.16 | | | | | | 1.19 | | | | | | 0.90 | (g) | | | | | 50 | |
| | | 42.65 | | | | | | 16.17 | | | | | | 45,525 | | | | | | 1.66 | | | | | | 1.69 | | | | | | 0.42 | (g) | | | | | 50 | |
| | | 37.73 | | | | | | 20.85 | | | | | | 827,768 | | | | | | 1.45 | | | | | | 1.46 | | | | | | 0.25 | (h) | | | | | 46 | |
| | | 32.55 | | | | | | 19.93 | | | | | | 58,293 | | | | | | 2.20 | | | | | | 2.21 | | | | | | (0.49 | )(h) | | | | | 46 | |
| | | 39.65 | | | | | | 21.33 | | | | | | 1,568,115 | | | | | | 1.05 | | | | | | 1.06 | | | | | | 0.62 | (h) | | | | | 46 | |
| | | 37.01 | | | | | | 20.74 | | | | | | 76,841 | | | | | | 1.55 | | | | | | 1.56 | | | | | | 0.14 | (h) | | | | | 46 | |
| | | 37.65 | | | | | | 21.12 | | | | | | 11,801 | | | | | | 1.20 | | | | | | 1.21 | | | | | | 0.38 | (h) | | | | | 46 | |
| | | 37.39 | | | | | | 20.56 | | | | | | 25,269 | | | | | | 1.70 | | | | | | 1.71 | | | | | | (0.10 | )(h) | | | | | 46 | |
| | | 31.29 | | | | | | 10.11 | | | | | | 670,228 | | | | | | 1.48 | | | | | | 1.48 | | | | | | 0.28 | (i) | | | | | 56 | |
| | | 27.14 | | | | | | 9.27 | | | | | | 52,143 | | | | | | 2.23 | | | | | | 2.23 | | | | | | (0.47 | )(i) | | | | | 56 | |
| | | 32.86 | | | | | | 10.53 | | | | | | 943,868 | | | | | | 1.08 | | | | | | 1.08 | | | | | | 0.67 | (i) | | | | | 56 | |
| | | 30.71 | | | | | | 10.05 | | | | | | 58,064 | | | | | | 1.58 | | | | | | 1.58 | | | | | | 0.17 | (i) | | | | | 56 | |
| | | 31.24 | | | | | | 10.39 | | | | | | 3,660 | | | | | | 1.23 | | | | | | 1.23 | | | | | | 0.48 | (i) | | | | | 56 | |
| | | 31.08 | | | | | | 9.83 | | | | | | 8,869 | | | | | | 1.73 | | | | | | 1.73 | | | | | | (0.03 | )(i) | | | | | 56 | |
| | |
| The accompanying notes are an integral part of these financial statements. | | 67 |
GOLDMAN SACHS SMALL/MID CAP VALUE FUND
Financial Highlights
Selected Data for a Share Outstanding Throughout Each Period
| | | | | | | | | | | | | | | | | | | | | | | | | | | | | | |
| | | | | | | | From
investment operations | | | Distributions
to shareholders | |
| | | Year - Share Class | | Net asset
value,
beginning
of period | | | Net
investment
income (loss)(a) | | | Net realized
and unrealized
gain | | | Total from
investment
operations | | | From net
investment
income | | | From net
realized
gains | | | Total
distributions | |
| | FOR THE SIX MONTHS ENDED FEBRUARY 28, (UNAUDITED) | |
| | 2015 - A | | $ | 11.01 | | | $ | 0.02 | (e) | | $ | 0.28 | | | $ | 0.30 | | | $ | (0.03 | ) | | $ | (0.16 | ) | | $ | (0.19 | ) |
| | 2015 - C | | | 10.97 | | | | (0.02 | )(e) | | | 0.28 | | | | 0.26 | | | | — | | | | (0.16 | ) | | | (0.16 | ) |
| | 2015 - Institutional | | | 11.04 | | | | 0.04 | (e) | | | 0.30 | | | | 0.34 | | | | (0.05 | ) | | | (0.16 | ) | | | (0.21 | ) |
| | 2015 - IR | | | 11.03 | | | | 0.04 | (e) | | | 0.27 | | | | 0.31 | | | | (0.04 | ) | | | (0.16 | ) | | | (0.20 | ) |
| | 2015 - R | | | 11.00 | | | | — | (e)(f) | | | 0.28 | | | | 0.28 | | | | — | | | | (0.16 | ) | | | (0.16 | ) |
| | | | | | | | | | | | | | | | | | | | | | | | | | | | | | |
| | FOR THE PERIOD ENDED AUGUST 31, | |
| | 2014 - A (Commenced on January 31, 2014) | | | 10.00 | | | | (0.02 | ) | | | 1.03 | | | | 1.01 | | | | — | | | | — | | | | — | |
| | 2014 - C (Commenced on January 31, 2014) | | | 10.00 | | | | (0.06 | ) | | | 1.03 | | | | 0.97 | | | | — | | | | — | | | | — | |
| | 2014 - Institutional (Commenced on January 31, 2014) | | | 10.00 | | | | 0.03 | | | | 1.01 | | | | 1.04 | | | | — | | | | — | | | | — | |
| | 2014 - IR (Commenced on January 31, 2014) | | | 10.00 | | | | 0.02 | | | | 1.01 | | | | 1.03 | | | | — | | | | — | | | | — | |
| | 2014 - R (Commenced on January 31, 2014) | | | 10.00 | | | | (0.01 | ) | | | 1.01 | | | | 1.00 | | | | — | | | | — | | | | — | |
| | (a) | | Calculated based on the average shares outstanding methodology. |
| | (b) | | Assumes investment at the net asset value at the beginning of the period, reinvestment of all dividends and distributions, a complete redemption of the investment at the net asset value at the end of the period and no sales or redemption charges. Total returns would be reduced if a sales or redemption charge was taken into account. Returns do not reflect the deduction of taxes that a shareholder would pay on Fund distributions or the redemption of Fund shares. Total returns for periods less than one full year are not annualized. |
| | (d) | | The Fund’s portfolio turnover rate is calculated in accordance with regulatory requirements, without regard to transactions involving short term investments and certain derivatives. If such transactions were included, the Fund’s portfolio turnover rate may be higher. |
| | (e) | | Reflects income recognized from special dividends which amounted to $0.01 per share and 0.31% of average net assets. |
| | (f) | | Amount is less than $0.005 per share. |
| | |
| 68 | | The accompanying notes are an integral part of these financial statements. |
GOLDMAN SACHS SMALL/MID CAP VALUE FUND
| | | | | | | | | | | | | | | | | | | | | | | | | | | | | | | | | | | | | | | | |
| | | | | | | | | | | | | | | | | | | | | | | | | | | | | | | | | | |
| | | Net asset
value, end
of period | | | | | Total
return(b) | | | | | Net assets,
end of
period
(in 000s) | | | | | Ratio of
net expenses
to average
net assets(c) | | | | | Ratio of
total expenses
to average
net assets(c) | | | | | Ratio of
net investment
income (loss)
to average
net assets(c) | | | | | Portfolio
turnover
rate(d) | |
| | | | | | | | | | | | | | | | | | | | | | | | | | | | | | | | | | | | | | | | |
| | $ | 11.12 | | | | | | 2.76 | % | | | | $ | 281 | | | | | | 1.34 | % | | | | | 5.44 | % | | | | | 0.32 | %(e) | | | | | 77 | % |
| | | 11.07 | | | | | | 2.45 | | | | | | 171 | | | | | | 2.09 | | | | | | 6.27 | | | | | | (0.41 | )(e) | | | | | 77 | |
| | | 11.17 | | | | | | 3.11 | | | | | | 14,869 | | | | | | 0.93 | | | | | | 5.07 | | | | | | 0.81 | (e) | | | | | 77 | |
| | | 11.14 | | | | | | 2.89 | | | | | | 119 | | | | | | 1.09 | | | | | | 4.92 | | | | | | 0.68 | (e) | | | | | 77 | |
| | | 11.12 | | | | | | 2.63 | | | | | | 28 | | | | | | 1.59 | | | | | | 5.87 | | | | | | 0.04 | (e) | | | | | 77 | |
| | | | | | | | | | | | | | | | | | | | | | | | | | | | | | | | | | | | | | | | |
| | | | | | | | | | | | | | | | | | | | | | | | | | | | | | | | | | | | | | | | |
| | | 11.01 | | | | | | 10.10 | | | | | | 150 | | | | | | 1.33 | | | | | | 6.90 | | | | | | (0.27 | ) | | | | | 53 | |
| | | 10.97 | | | | | | 9.70 | | | | | | 105 | | | | | | 2.08 | | | | | | 8.31 | | | | | | (1.01 | ) | | | | | 53 | |
| | | 11.04 | | | | | | 10.40 | | | | | | 3,755 | | | | | | 0.93 | | | | | | 12.86 | | | | | | 0.49 | | | | | | 53 | |
| | | 11.03 | | | | | | 10.30 | | | | | | 28 | | | | | | 1.08 | | | | | | 13.25 | | | | | | 0.39 | | | | | | 53 | |
| | | 11.00 | | | | | | 10.00 | | | | | | 28 | | | | | | 1.58 | | | | | | 13.76 | | | | | | (0.11 | ) | | | | | 53 | |
| | |
| The accompanying notes are an integral part of these financial statements. | | 69 |
GOLDMAN SACHS FUNDAMENTAL EQUITY VALUE FUNDS
Notes to Financial Statements
February 28, 2015 (Unaudited)
Goldman Sachs Trust (the “Trust”) is a Delaware statutory trust registered under the Investment Company Act of 1940, as amended (the “Act”), as an open-end management investment company. The following table lists those series of the Trust that are included in this report (collectively, the “Funds” or individually a “Fund”), along with their corresponding share classes and respective diversification status under the Act:
| | | | |
| Fund | | Share Classes Offered | | Diversified/
Non-diversified |
Growth and Income, Large Cap Value, Mid Cap Value, Small Cap Value | | A, C, Institutional, Service, IR and R | | Diversified |
Small/Mid Cap Value (Commenced January 31, 2014) | | A, C, Institutional, IR and R | | Diversified |
Class A Shares are sold with a front-end sales charge of up to 5.50%. Class C Shares are sold with a contingent deferred sales charge (“CDSC”) of 1.00%, which is imposed on redemptions made within 12 months of purchase. Institutional, Service, Class IR and Class R Shares are not subject to a sales charge.
At the close of business on November 14, 2014, Class B Shares of each applicable Fund were converted to Class A Shares of the Fund.
Goldman Sachs Asset Management, L.P. (“GSAM”), an affiliate of Goldman, Sachs & Co. (“Goldman Sachs”), serves as investment adviser to the Funds pursuant to a management agreement (the “Agreement”) with the Trust.
|
| 2. SIGNIFICANT ACCOUNTING POLICIES |
The financial statements have been prepared in accordance with accounting principles generally accepted in the United States of America (“GAAP”) and require management to make estimates and assumptions that may affect the reported amounts and disclosures. Actual results may differ from those estimates and assumptions.
A. Investment Valuation — The Funds’ valuation policy is to value investments at fair value.
B. Investment Income and Investments — Investment income includes interest income and dividend income, net of any foreign withholding taxes, less any amounts reclaimable. Interest income is accrued daily and adjusted for amortization of premiums and accretion of discounts. Dividend income is recognized on ex-dividend date or, for certain foreign securities, as soon as such information is obtained subsequent to the ex-dividend date. Investment transactions are reflected on trade date. Realized gains and losses are calculated using identified cost. Investment transactions are recorded on the following business day for daily
70
GOLDMAN SACHS FUNDAMENTAL EQUITY VALUE FUNDS
|
| 2. SIGNIFICANT ACCOUNTING POLICIES (continued) |
net asset value (“NAV”) calculations. Any foreign capital gains tax is accrued daily based upon net unrealized gains, and is payable upon sale of such investments. Distributions received from the Funds’ investments in U.S. real estate investment trusts (“REITs”) may be characterized as ordinary income, net capital gain or a return of capital. A return of capital is recorded by the Funds as a reduction to the cost basis of the REIT. Distributions from Master Limited Partnerships (“MLPs”) are generally recorded based on the characterization reported on the MLP’s tax return.
C. Class Allocations and Expenses — Investment income, realized and unrealized gain (loss), and non-class specific expenses of each Fund are allocated daily based upon the proportion of net assets of each class. Class specific expenses, where applicable, are borne by the respective share classes and include Distribution and Service, Transfer Agent and Service and Shareholder Administration fees. Non-class specific expenses directly incurred by a Fund are charged to that Fund, while such expenses incurred by the Trust are allocated across the respective Funds on a straight-line and/or pro-rata basis depending upon the nature of the expenses.
D. Organization and Offering Costs — Offering costs paid in connection with the offering of shares of Small/Mid Cap Value Fund were amortized on a straight-line basis over 12 months from the date of commencement of operations. Organization costs paid in connection with the organization of the Fund were expensed on the first day of operations.
E. Federal Taxes and Distributions to Shareholders — It is each Fund’s policy to comply with the requirements of the Internal Revenue Code of 1986, as amended (the “Code”), applicable to regulated investment companies (mutual funds) and to distribute each year substantially all of its investment company taxable income and capital gains to its shareholders. Accordingly, the Funds are not required to make any provisions for the payment of federal income tax. Distributions to shareholders are recorded on the ex-dividend date. Income and capital gains distributions, if any, are declared and paid according to the following schedule:
| | | | | | |
| Fund | | | | Income Distributions
Declared/Paid | | Capital Gains Distributions
Declared/Paid |
Growth and Income | | | | Quarterly | | Annually |
Large Cap Value, Mid Cap Value, Small Cap Value and Small/Mid Cap Value | | | | Annually | | Annually |
Net capital losses are carried forward to future fiscal years and may be used to the extent allowed by the Code to offset any future capital gains. Utilization of capital loss carryforwards will reduce the requirement of future capital gains distributions.
Under the Regulated Investment Company Modernization Act of 2010, the Funds are permitted to carry forward capital losses incurred in taxable years beginning after December 22, 2010 for an unlimited period. However, any losses incurred during those future taxable years will be required to be utilized prior to the losses incurred in pre-enactment taxable years. As a result of this ordering rule, pre-enactment capital loss carryforwards may be more likely to expire unused. Additionally, post-enactment capital
71
GOLDMAN SACHS FUNDAMENTAL EQUITY VALUE FUNDS
Notes to Financial Statements (continued)
February 28, 2015 (Unaudited)
|
| 2. SIGNIFICANT ACCOUNTING POLICIES (continued) |
losses that are carried forward will retain their character as either short-term or long-term capital losses rather than being considered all short-term as under previous law.
The characterization of distributions to shareholders for financial reporting purposes is determined in accordance with federal income tax rules, which may differ from GAAP. The source of each Fund’s distributions may be shown in the accompanying financial statements as either from net investment income, net realized gain or capital. Certain components of the Funds’ net assets on the Statements of Assets and Liabilities reflect permanent GAAP/tax differences based on the appropriate tax character.
F. Foreign Currency Translation — The accounting records and reporting currency of the Funds are maintained in U.S. dollars. Assets and liabilities denominated in foreign currencies are translated into U.S. dollars using the current exchange rates at the close of each business day. The effect of changes in foreign currency exchange rates on investments is included within net realized and unrealized gain (loss) on investments. Changes in the value of other assets and liabilities as a result of fluctuations in foreign exchange rates are included in the Statements of Operations within net change in unrealized gain (loss) on foreign currency transactions. Transactions denominated in foreign currencies are translated into U.S. dollars on the date the transaction occurred, the effects of which are included within net realized gain (loss) on foreign currency transactions.
G. Commission Recapture — GSAM, on behalf of certain Funds, may direct portfolio trades, subject to seeking best execution, to various brokers who have agreed to rebate a portion of the commissions generated. Such rebates are made directly to a Fund as cash payments and are included in net realized gain (loss) from investments on the Statements of Operations.
|
| 3. INVESTMENTS AND FAIR VALUE MEASUREMENTS |
The fair value of a financial instrument is the amount that would be received to sell an asset or paid to transfer a liability in an orderly transaction between market participants at the measurement date (i.e., the exit price). GAAP establishes a fair value hierarchy that prioritizes the inputs to valuation techniques used to measure fair value. The hierarchy gives the highest priority to unadjusted quoted prices in active markets for identical assets or liabilities (Level 1 measurements) and the lowest priority to unobservable inputs (Level 3 measurements). The levels used for classifying investments are not necessarily an indication of the risk associated with investing in these investments. The three levels of the fair value hierarchy are described below:
Level 1 — Unadjusted quoted prices in active markets that are accessible at the measurement date for identical, unrestricted assets or liabilities;
Level 2 — Quoted prices in markets that are not active or financial instruments for which significant inputs are observable (including, but not limited to, quoted prices for similar investments, interest rates, foreign exchange rates, volatility and credit spreads), either directly or indirectly;
Level 3 — Prices or valuations that require significant unobservable inputs (including GSAM’s assumptions in determining fair value measurement).
72
GOLDMAN SACHS FUNDAMENTAL EQUITY VALUE FUNDS
|
| 3. INVESTMENTS AND FAIR VALUE MEASUREMENTS (continued) |
The Trustees have adopted Valuation Procedures that govern the valuation of the portfolio investments held by the Funds, including investments for which market quotations are not readily available. The Trustees have delegated to GSAM day-to-day responsibility for implementing and maintaining internal controls and procedures related to the valuation of the Funds’ portfolio investments. To assess the continuing appropriateness of pricing sources and methodologies, GSAM regularly performs price verification procedures and issues challenges as necessary to third party pricing vendors or brokers, and any differences are reviewed in accordance with the Valuation Procedures.
A. Level 1 and Level 2 Fair Value Investments — The valuation techniques and significant inputs used in determining the fair values for investments classified as Level 1 and Level 2 are as follows:
Equity Securities — Equity securities and investment companies traded on a U.S. securities exchange or the NASDAQ system, or those located on certain foreign exchanges, including but not limited to the Americas, are valued daily at their last sale price or official closing price on the principal exchange or system on which they are traded. If there is no sale or official closing price or it is believed by the investment adviser to not represent fair value, equity securities and exchange traded investment companies are valued at the last bid price for long positions and at the last ask price for short positions. Investments in investment companies (other than those that are exchange traded) are valued at the NAV on the valuation date. To the extent these investments are actively traded, they are classified as Level 1 of the fair value hierarchy, otherwise they are generally classified as Level 2.
Unlisted equity securities for which market quotations are available are valued at the last sale price on the valuation date, or if no sale occurs, at the last bid price. Securities traded on certain foreign securities exchanges are valued daily at fair value determined by an independent fair value service (if available) under Valuation Procedures approved by the Trustees and consistent with applicable regulatory guidance. The independent fair value service takes into account multiple factors including, but not limited to, movements in the securities markets, certain depositary receipts, futures contracts and foreign currency exchange rates that have occurred subsequent to the close of the foreign securities exchange. These investments are generally classified as Level 2 of the fair value hierarchy.
Investments in Money Market Funds — Investments in the Goldman Sachs Financial Square Government Fund are valued at the NAV of the Institutional Share class on the day of valuation. These investments are generally classified as Level 1 of the fair value hierarchy.
The Goldman Sachs Financial Square Government Fund may invest in debt securities which are valued daily on the basis of quotations supplied by dealers, if market quotations are readily available, or an independent pricing service approved by the Trustees. The pricing services may use valuation models or matrix pricing, which consider: (i) yield or price with respect to bonds that are considered comparable in characteristics such as rating, interest rate and maturity date or (ii) quotations from securities dealers to determine current value. Short-term debt obligations that mature in sixty days or less and that do not exhibit signs of credit deterioration are valued at amortized cost, which approximates fair value. With the exception of treasury securities, which are generally classified as Level 1, these investments are generally classified as Level 2 of the fair value hierarchy.
73
GOLDMAN SACHS FUNDAMENTAL EQUITY VALUE FUNDS
Notes to Financial Statements (continued)
February 28, 2015 (Unaudited)
|
| 3. INVESTMENTS AND FAIR VALUE MEASUREMENTS (continued) |
Debt Securities — Debt securities for which market quotations are readily available are valued daily on the basis of quotations supplied by dealers or an independent pricing service approved by the Trustees. The pricing services may use valuation models or matrix pricing, which consider: (i) yield or price with respect to bonds that are considered comparable in characteristics such as rating, interest rate and maturity date or (ii) quotations from securities dealers to determine current value. Short-term debt obligations that mature in sixty days or less and that do not exhibit signs of credit deterioration are valued at amortized cost, which approximates fair value. With the exception of treasury securities of G8 countries (not held in money market funds), which are generally classified as Level 1, these investments are generally classified as Level 2 of the fair value hierarchy.
Short Term Investments — Short-term investments having a maturity of 60 days or less are generally valued at amortized cost which approximates fair market value. These investments are classified as Level 2 of the fair value hierarchy.
Repurchase Agreements — Repurchase agreements involve the purchase of securities subject to the seller’s agreement to repurchase the securities at a mutually agreed upon date and price, under the terms of a Master Repurchase Agreement (“MRA”). During the term of a repurchase agreement, the value of the underlying securities held as collateral on behalf of a Fund, including accrued interest, is required to exceed the value of the repurchase agreement, including accrued interest. The gross value of repurchase agreements is included in the Statements of Assets and Liabilities for financial reporting purposes. The underlying securities for all repurchase agreements are held at the Funds’ custodian or designated sub-custodians under tri-party repurchase agreements.
An MRA governs transactions between a Fund and select counterparties. An MRA contains provisions for, among other things, initiation, income payments, events of default and maintenance of securities for repurchase agreements. An MRA also permits offsetting with collateral to create one single net payment in the event of default or similar events, including the bankruptcy or insolvency of a counterparty.
If the seller defaults, a Fund could suffer a loss to the extent that the proceeds from the sale of the underlying securities and other collateral held by the Fund are less than the repurchase price and the Fund’s costs associated with delay and enforcement of the repurchase agreement. In addition, in the event of default or insolvency of the seller, a court could determine that a Fund’s interest in the collateral is not enforceable, resulting in additional losses to the Fund.
Pursuant to exemptive relief granted by the Securities and Exchange Commission (“SEC”) and terms and conditions contained therein, the Funds, together with other funds of the Trust and registered investment companies having management agreements with GSAM or its affiliates, may transfer uninvested cash into joint accounts, the daily aggregate balance of which is invested in one or more repurchase agreements. Under these joint accounts, the Funds maintain pro-rata credit exposure to the underlying repurchase agreements’ counterparties. With the exception of certain transaction fees, the Funds are not subject to any expenses in relation to these investments.
B. Level 3 Fair Value Investments — To the extent that the aforementioned significant inputs are unobservable, or if quotations are not readily available, or if GSAM believes that such quotations do not accurately reflect fair value, the fair value of the Funds’ investments may be determined under Valuation Procedures approved by the Trustees. GSAM, consistent with its
74
GOLDMAN SACHS FUNDAMENTAL EQUITY VALUE FUNDS
|
| 3. INVESTMENTS AND FAIR VALUE MEASUREMENTS (continued) |
procedures and applicable regulatory guidance, may make an adjustment to the most recent valuation prices of either domestic or foreign securities in light of significant events to reflect what it believes to be the fair value of the securities at the time of determining a Fund’s NAV. Significant events which could affect a large number of securities in a particular market may include, but are not limited to: significant fluctuations in U.S. or foreign markets; market dislocations; market disruptions; or unscheduled market closings. Significant events which could also affect a single issuer may include, but are not limited to: corporate actions such as reorganizations, mergers and buy-outs; ratings downgrades; and bankruptcies.
C. Fair Value Hierarchy — The following is a summary of the Funds’ investments classified in the fair value hierarchy as of February 28, 2015:
| | | | | | | | | | | | |
| | | |
| GROWTH AND INCOME | | | | | | | | | | | | |
| | | |
| Investment Type | | Level 1 | | | Level 2 | | | Level 3 | |
| Assets | | | | | | | | | | | | |
Common Stock and/or Other Equity Investments(a) | | | | | | | | | | | | |
Europe | | $ | 16,794,623 | | | $ | — | | | $ | — | |
North America | | | 448,109,042 | | | | — | | | | — | |
Short-term Investment | | | — | | | | 7,100,000 | | | | — | |
| Total | | $ | 464,903,665 | | | $ | 7,100,000 | | | $ | — | |
| | | |
| LARGE CAP VALUE | | | | | | | | | | | | |
| | | |
| Investment Type | | Level 1 | | | Level 2 | | | Level 3 | |
| Assets | | | | | | | | | | | | |
Common Stock and/or Other Equity Investments(a) | | | | | | | | | | | | |
Europe | | $ | 89,719,650 | | | $ | — | | | $ | — | |
North America | | | 1,420,141,681 | | | | — | | | | — | |
Investment Company | | | 22,615,928 | | | | — | | | | — | |
| Total | | $ | 1,532,477,259 | | | $ | — | | | $ | — | |
75
GOLDMAN SACHS FUNDAMENTAL EQUITY VALUE FUNDS
Notes to Financial Statements (continued)
February 28, 2015 (Unaudited)
|
| 3. INVESTMENTS AND FAIR VALUE MEASUREMENTS (continued) |
| | | | | | | | | | | | |
| | | |
| MID CAP VALUE | | | | | | | | | | | | |
| | | |
| Investment Type | | Level 1 | | | Level 2 | | | Level 3 | |
| Assets | | | | | | | | | | | | |
Common Stock and/or Other Equity Investments(a) | | | | | | | | | | | | |
Asia | | $ | 73,719,499 | | | $ | — | | | $ | — | |
Europe | | | 291,977,823 | | | | — | | | | — | |
North America | | | 8,803,658,736 | | | | — | | | | — | |
Investment Company | | | 326,511,533 | | | | — | | | | — | |
| Total | | $ | 9,495,867,591 | | | $ | — | | | $ | — | |
| | | |
| SMALL CAP VALUE | | | | | | | | | | | | |
| | | |
| Investment Type | | Level 1 | | | Level 2 | | | Level 3 | |
| Assets | | | | | | | | | | | | |
Common Stock and/or Other Equity Investments(a) | | | | | | | | | | | | |
Asia | | $ | 25,661,637 | | | $ | — | | | $ | — | |
Europe | | | 51,061,748 | | | | — | | | | — | |
North America | | | 6,109,875,409 | | | | — | | | | — | |
Exchange Traded Fund | | | 147,757,036 | | | | — | | | | — | |
Investment Company | | | 238,193,203 | | | | — | | | | — | |
| Total | | $ | 6,572,549,033 | | | $ | — | | | $ | — | |
| | | |
| SMALL/MID CAP VALUE | | | | | | | | | | | | |
| | | |
| Investment Type | | Level 1 | | | Level 2 | | | Level 3 | |
| Assets | | | | | | | | | | | | |
Common Stock and/or Other Equity Investments(a) | | | | | | | | | | | | |
Europe | | $ | 517,738 | | | $ | — | | | $ | — | |
North America | | | 14,849,986 | | | | — | | | | — | |
Short-term Investment | | | — | | | | 1,100,000 | | | | — | |
| Total | | $ | 15,367,724 | | | $ | 1,100,000 | | | $ | — | |
| (a) | | Amounts are disclosed by continent to highlight the impact of time zone differences between local market close and the calculation of net asset value. Security valuations are based on the principal exchange or system on which they are traded, which may differ from country of domicile. |
For further information regarding security characteristics, see the Schedules of Investments.
76
GOLDMAN SACHS FUNDAMENTAL EQUITY VALUE FUNDS
|
| 4. AGREEMENTS AND AFFILIATED TRANSACTIONS |
A. Management Agreement — Under the Agreement, GSAM manages the Funds, subject to the general supervision of the Trustees.
As compensation for the services rendered pursuant to the Agreement, the assumption of the expenses related thereto and administration of the Funds’ business affairs, including providing facilities, GSAM is entitled to a management fee, accrued daily and paid monthly, equal to an annual percentage rate of each Fund’s average daily net assets.
For the six months ended February 28, 2015, contractual and effective net management fees with GSAM were at the following rates:
| | | | | | | | | | | | | | | | | | | | | | | | | | | | | | |
| | | | | Contractual Management Rate | | | Effective Net
Management
Rate | |
| Fund | | | | First
$1 billion | | | Next
$1 billion | | | Next
$3 billion | | | Next
$3 billion | | | Over
$8 billion | | | Effective
Rate | | |
Growth and Income | | | | | 0.70 | % | | | 0.63 | % | | | 0.60 | % | | | 0.59 | % | | | 0.58 | % | | | 0.70 | % | | | 0.69 | %* |
Large Cap Value | | | | | 0.75 | | | | 0.68 | | | | 0.65 | | | | 0.64 | | | | 0.63 | | | | 0.73 | | | | 0.73 | |
Mid Cap Value | | | | | 0.75 | | | | 0.75 | | | | 0.68 | | | | 0.65 | | | | 0.64 | | | | 0.68 | | | | 0.68 | |
Small Cap Value | | | | | 1.00 | | | | 1.00 | | | | 0.90 | | | | 0.86 | | | | 0.84 | | | | 0.92 | | | | 0.93 | * |
Small/Mid Cap Value | | | | | 0.85 | | | | 0.85 | | | | 0.77 | | | | 0.73 | | | | 0.71 | | | | 0.85 | | | | 0.85 | |
| * | | GSAM agreed to waive a portion of its management fees, in order to achieve effective net management fee rates shown above through at least December 29, 2015. Prior to such date GSAM may not terminate the arrangements without the approval of the Trustees. In addition, the Effective Net Management Rate includes the impact of management fee waivers of affiliated underlying funds, if any. Where the application of the above contractual management fee breakpoint schedule would result in a lower management fee rate, the breakpoint schedule will be applied to the Fund’s assets. |
B. Distribution and Service Plans — The Trust, on behalf of each Fund, has adopted Distribution and Service Plans (the “Plans”). Under the Plans, Goldman Sachs, which serves as distributor (the “Distributor”), is entitled to a fee accrued daily and paid monthly, for distribution services and personal and account maintenance services, which may then be paid by Goldman Sachs to authorized dealers, at the following annual rates calculated on a Fund’s average daily net assets of each respective share class:
| | | | | | | | | | | | |
| | | Distribution and Service Plan Rates | |
| | | Class A* | | | Class C | | | Class R* | |
Distribution Plan | | | 0.25 | % | | | 0.75 | % | | | 0.50 | % |
Service Plan | | | — | | | | 0.25 | | | | — | |
| * | | With respect to Class A and Class R Shares, the Distributor at its discretion may use compensation for distribution services paid under the Distribution Plan to compensate service organizations for personal and account maintenance services and expenses as long as such total compensation does not exceed the maximum cap on “service fees” imposed by the Financial Industry Regulatory Authority. |
77
GOLDMAN SACHS FUNDAMENTAL EQUITY VALUE FUNDS
Notes to Financial Statements (continued)
February 28, 2015 (Unaudited)
|
| 4. AGREEMENTS AND AFFILIATED TRANSACTIONS (continued) |
C. Distribution Agreement — Goldman Sachs, as Distributor of the shares of the Funds pursuant to a Distribution Agreement, may retain a portion of the Class A front end sales charge and Class C Shares’ CDSC. During the six months ended February 28, 2015, Goldman Sachs advised that it retained the following amounts:
| | | | | | | | | | |
| | | | | Front End
Sales Charge | | | Contingent Deferred
Sales Charge | |
| Fund | | | | Class A | | | Class C | |
Growth and Income | | | | $ | 15,203 | | | $ | — | |
Large Cap Value | | | | | 8,854 | | | | 16 | |
Mid Cap Value | | | | | 34,417 | | | | 6 | |
Small Cap Value | | | | | 4,592 | | | | 4 | |
Small/Mid Cap Value | | | | | 58 | | | | — | |
D. Service Plan and Shareholder Administration Plan — The Trust, on behalf of each Fund that offers Service Shares, has adopted a Service Plan and a Shareholder Administration Plan. These plans allow for service organizations to provide varying levels of personal and account maintenance and shareholder administration services to their customers who are beneficial owners of such shares. The Service Plan and Shareholder Administration Plan each provide for compensation to the service organizations which is accrued daily and paid monthly at an annual rate of 0.25% (0.50% in aggregate) of the average daily net assets of the Service Shares.
E. Transfer Agency Agreement — Goldman Sachs also serves as the transfer agent of the Funds for a fee pursuant to the Transfer Agency Agreement. The fees charged for such transfer agency services are accrued daily and paid monthly at annual rates as follows: 0.19% of the average daily net assets of Class A, Class C, Class IR and Class R Shares; and 0.04% of the average daily net assets of Institutional and Service Shares.
F. Other Expense Agreements and Affiliated Transactions — GSAM has agreed to limit certain “Other Expenses” of the Funds (excluding acquired fund fees and expenses, transfer agency fees and expenses, service fees and shareholder administration fees (as applicable), taxes, interest, brokerage fees, shareholder meetings, litigation, indemnification and extraordinary expenses) to the extent such expenses exceed, on an annual basis, a percentage rate of the average daily net assets of each Fund. Such Other Expense reimbursements, if any, are accrued daily and paid monthly. In addition, the Funds are not obligated to reimburse GSAM for prior fiscal year expense reimbursements, if any. The Other Expense limitations as an annual percentage rate of average daily net assets for Growth and Income, Large Cap Value, Small Cap Value and Small/Mid Cap Value Funds are 0.004%, 0.004%, 0.004% and 0.044%, respectively. These Other Expense limitations will remain in place through at least December 29, 2015, and prior to such date GSAM may not terminate the arrangements without the approval of the Trustees. The Funds bear their respective
78
GOLDMAN SACHS FUNDAMENTAL EQUITY VALUE FUNDS
|
| 4. AGREEMENTS AND AFFILIATED TRANSACTIONS (continued) |
share of costs related to proxy and shareholder meetings, and GSAM has agreed to reimburse each Fund to the extent such expenses exceed a specified percentage of the Fund’s net assets. In addition, the Funds have entered into certain offset arrangements with the custodian and the transfer agent, which may result in a reduction of the Funds’ expenses and are received irrespective of the application of the “Other Expense” limitations described above.
For the six months ended February 28, 2015, these expense reductions, including any fee waivers and Other Expense reimbursements, were as follows:
| | | | | | | | | | | | | | |
| | | | | Management
Fee Waiver | | | Other
Expense
Reimbursements | | | Total
Expense
Reductions | |
Growth and Income | | | | $ | 8,066 | | | $ | 135,989 | | | $ | 144,055 | |
Large Cap Value | | | | | 3,950 | | | | 164,229 | | | | 168,179 | |
Mid Cap Value | | | | | 84,960 | | | | — | | | | 84,960 | |
Small Cap Value | | | | | 756,254 | | | | 556,757 | | | | 1,313,011 | |
Small/Mid Cap Value | | | | | — | | | | 193,682 | | | | 193,682 | |
G. Line of Credit Facility — As of February 28, 2015, the Funds participated in a $1,080,000,000 committed, unsecured revolving line of credit facility (the “facility”) together with other funds of the Trust and registered investment companies having management agreements with GSAM or its affiliates (“Other Borrowers”). Pursuant to the terms of the facility, the Funds and Other Borrowers could increase the credit amount by an additional $120,000,000, for a total of up to $1,200,000,000. This facility is to be used solely for temporary or emergency purposes, which may include the funding of redemptions. The interest rate on borrowings is based on the federal funds rate. The facility also requires a fee to be paid by the Funds based on the amount of the commitment that has not been utilized. For the six months ended February 28, 2015, the Funds did not have any borrowings under the facility.
H. Other Transactions with Affiliates — For the six months ended February 28, 2015, Goldman Sachs earned $6,367, $476,908, $67,940 and $36 in brokerage commissions from portfolio transactions, on behalf of the Growth and Income, Mid Cap Value, Small Cap Value and Small/Mid Cap Value Funds, respectively.
An investment by a Fund representing greater than 5% of the voting securities of an issuer makes that issuer an affiliated person (as defined by the Act) of such Fund. The following table provides information about the investment in shares of issuers of which a Fund is an affiliate for the six months ended February 28, 2015:
| | | | | | | | | | | | | | | | | | | | | | |
| Fund | | Name of Affiliated Issuer | | Number of
Shares Held
Beginning
of Period | | | Shares
Bought | | | Shares
Sold | | | Number of
Shares Held
End of Period | | | Value at
End of Period | |
Small Cap Value | | Everyday Health, Inc. | | | 603,508 | | | | 1,033,619 | | | | (44,872 | ) | | | 1,592,255 | | | $ | 22,769,247 | |
| | | Premiere Global Services, Inc. | | | 2,406,839 | | | | 14,897 | | | | (63,538 | ) | | | 2,358,198 | | | | 22,968,849 | |
| | | Rex Energy Corp. | | | 3,135,400 | | | | 956,367 | | | | (416,064 | ) | | | 3,675,703 | | | | 18,010,945 | |
79
GOLDMAN SACHS FUNDAMENTAL EQUITY VALUE FUNDS
Notes to Financial Statements (continued)
February 28, 2015 (Unaudited)
|
| 4. AGREEMENTS AND AFFILIATED TRANSACTIONS (continued) |
The Large Cap Value, Mid Cap Value, and Small Cap Value invest in the Institutional Shares of the Goldman Sachs Financial Square Government Fund. This Underlying Fund is considered to be affiliated with the Funds. GSAM has contractually agreed to waive irrevocably a portion of any underlying fund’s management fee in an amount equal to the management fee paid to GSAM due to the Funds’ investment in an affiliated fund for which it also serves as investment advisor. For the six months ended February 28, 2015, GSAM waived $3,950, $84,960, and $62,007 of such fund’s management fee for the Large Cap Value, Mid Cap Value, and Small Cap Value, respectively. The table below shows the transactions in and earnings from investments in this affiliated Fund for the six months ended February 28, 2015:
| | | | | | | | | | | | | | | | | | | | | | |
| Fund | | Underlying Fund | | Market
Value
09/01/14 | | | Purchases
at Cost | | | Proceeds
from Sales | | | Market
Value
02/28/15 | | | Dividend
Income | |
Large Cap Value | | Goldman Sachs Financial Square Government Fund | | $ | — | | | $ | 141,780,583 | | | $ | (119,164,655 | ) | | $ | 22,615,928 | | | $ | 229 | |
Mid Cap Value | | Goldman Sachs Financial Square Government Fund | | | — | | | | 1,066,885,458 | | | | (740,373,925 | ) | | | 326,511,533 | | | | 4,565 | |
Small Cap Value | | Goldman Sachs Financial Square Government Fund | | | — | | | | 627,664,609 | | | | (389,471,406 | ) | | | 238,193,203 | | | | 3,251 | |
As of February 28, 2015, the Goldman Sachs Group, Inc. was the beneficial owner of 5% or more of total outstanding shares of the following fund:
| | | | | | | | | | | | | | | | | | |
| Fund | | | | Class C | | | Institutional | | | Class IR | | | Class R | |
Small/Mid Cap Value | | | | | 7 | % | | | 22 | % | | | 24 | % | | | 100 | % |
As of February 28, 2015, the Goldman Sachs Profit Sharing Master Trust was the beneficial owner of approximately 9% of total outstanding shares of the Large Cap Value Fund.
|
| 5. PORTFOLIO SECURITIES TRANSACTIONS |
The cost of purchases and proceeds from sales and maturities of long-term securities for the six months ended February 28, 2015, were as follows:
| | | | | | | | | | |
| Fund | | | | Purchases | | | Sales and Maturities | |
Growth and Income | | | | $ | 110,611,249 | | | $ | 136,546,683 | |
Large Cap Value | | | | | 616,272,092 | | | | 645,727,094 | |
Mid Cap Value | | | | | 4,452,623,237 | | | | 5,802,817,936 | |
Small Cap Value | | | | | 1,494,579,163 | | | | 1,623,902,977 | |
Small/Mid Cap Value | | | | | 16,657,040 | | | | 5,968,592 | |
80
GOLDMAN SACHS FUNDAMENTAL EQUITY VALUE FUNDS
As of the Funds’ most recent fiscal year end, August 31, 2014, the Funds’ capital loss carryforwards were as follows:
| | | | |
| | | Growth and Income | |
Capital loss carryforward:(1) Expiring 2018 | | $ | (168,871,399 | ) |
| (1) | | Expiration occurs on August 31 of the year indicated. |
As of February 28, 2015, the Funds’ aggregate security unrealized gains and losses based on cost for U.S. federal income tax purposes were as follows:
| | | | | | | | | | | | | | | | | | | | |
| | | Growth and
Income | | | Large Cap
Value | | | Mid Cap
Value | | | Small Cap
Value | | | Small/Mid Cap
Value | |
Tax Cost | | $ | 407,118,624 | | | $ | 1,349,892,148 | | | $ | 8,156,233,239 | | | $ | 5,237,027,292 | | | $ | 15,605,036 | |
Gross unrealized gain | | | 71,997,686 | | | | 211,923,353 | | | | 1,525,266,687 | | | | 1,487,953,602 | | | | 971,247 | |
Gross unrealized loss | | | (7,112,645 | ) | | | (29,338,242 | ) | | | (185,632,335 | ) | | | (152,431,861 | ) | | | (108,559 | ) |
Net unrealized gain | | $ | 64,885,041 | | | $ | 182,585,111 | | | $ | 1,339,634,352 | | | $ | 1,335,521,741 | | | $ | 862,688 | |
The difference between GAAP-basis and tax-basis unrealized gains (losses) is attributable primarily to wash sales, differences related to the tax treatment of partnerships, underlying fund investments, real estate investment trusts and passive foreign investment company investments.
GSAM has reviewed the Funds’ tax positions for all open tax years (the current and prior three years, as applicable) and has concluded that no provision for income tax is required in the Funds’ financial statements. Such open tax years remain subject to examination and adjustment by tax authorities.
The Funds’ risks include, but are not limited to, the following:
Investments in Other Investment Companies — As a shareholder of another investment company, including an exchange traded fund (“ETF”), a Fund will directly bear its proportionate share of any net management fees and other expenses paid by such other investment companies, in addition to the fees and expenses regularly borne by the Fund. ETFs are subject to risks that do not apply to conventional mutual funds, including but not limited to the following: (i) the market price of the ETF’s shares may trade at a premium or a discount to their NAV; and (ii) an active trading market for an ETF’s shares may not develop or be maintained.
Large Shareholder Transactions Risk — A Fund may experience adverse effects when certain large shareholders, such as other funds, institutional investors (including those trading by use of non-discretionary mathematical formulas), financial intermediaries (who may make investment decisions on behalf of underlying clients and/or include a Fund in their investment model), individuals, accounts and Goldman Sachs affiliates, purchase or redeem large amounts of shares of a Fund. Such large shareholder redemptions may cause the Fund to sell portfolio securities at times when it would not otherwise do so, which may negatively impact a Fund’s NAV and liquidity. Similarly, large Fund share purchases may adversely affect a Fund’s performance
81
GOLDMAN SACHS FUNDAMENTAL EQUITY VALUE FUNDS
Notes to Financial Statements (continued)
February 28, 2015 (Unaudited)
|
| 7. OTHER RISKS (continued) |
to the extent that a Fund is delayed in investing new cash and is required to maintain a larger cash position than it ordinarily would. These transactions may also accelerate the realization of taxable income to shareholders if such sales of investments resulted in gains, and may also increase transaction costs. In addition, a large redemption could result in a Fund’s current expenses being allocated over a smaller asset base, leading to an increase in the Fund’s expense ratio.
Liquidity Risk — The Funds may make investments that are illiquid or that may become less liquid in response to market developments or adverse investor perceptions. Illiquid investments may be more difficult to value. Liquidity risk may also refer to the risk that a Fund will not be able to pay redemption proceeds within the allowable time period because of unusual market conditions, an unusually high volume of redemption requests, or other reasons. To meet redemption requests, a Fund may be forced to sell investments at an unfavorable time and/or under unfavorable conditions. Liquidity risk may be the result of, among other things, the reduced number and capacity of traditional market participants to make a market in fixed income securities or the lack of an active market. The potential for liquidity risk may be magnified by a rising interest rate environment or other circumstances where investor redemptions from fixed income mutual funds may be higher than normal, potentially causing increased supply in the market due to selling activity.
Market and Credit Risks — In the normal course of business, the Funds trade financial instruments and enter into financial transactions where risk of potential loss exists due to changes in the market (market risk). Additionally, the Funds may also be exposed to credit risk in the event that an issuer or guarantor fails to perform or that an institution or entity with which the funds have unsettled or open transactions defaults.
Master Limited Partnership Risk — Investments in securities of MLPs involve risks that differ from investments in common stock, including risks related to limited control and limited rights to vote on matters affecting the MLP, risks related to potential conflicts of interest between the MLP and the MLP’s general partner, cash flow risks, dilution risks, limited liquidity and risks related to the general partner’s right to require unit-holders to sell their common units at an undesirable time or price.
Under the Trust’s organizational documents, its Trustees, officers, employees and agents are indemnified, to the extent permitted by the Act and state law, against certain liabilities that may arise out of performance of their duties to the Funds. Additionally, in the course of business, the Funds enter into contracts that contain a variety of indemnification clauses. The Funds’ maximum exposure under these arrangements is unknown, as this would involve future claims that may be made against the Funds that have not yet occurred. However, GSAM believes the risk of loss under these arrangements to be remote.
Subsequent events after the Statement of Assets and Liabilities date have been evaluated through the date the financial statements were issued. GSAM has concluded that there is no impact requiring adjustment or disclosure in the financial statements.
82
GOLDMAN SACHS FUNDAMENTAL EQUITY VALUE FUNDS
|
| 10. SUMMARY OF SHARE TRANSACTIONS |
Share activity is as follows:
| | | | | | | | | | | | | | | | |
| | | Growth and Income Fund | |
| | | | |
| | | For the Six Months Ended
February 28, 2015 (Unaudited) | | | For the Fiscal Year Ended
August 31, 2014 | |
| | | | |
| | | Shares | | | Dollars | | | Shares | | | Dollars | |
| | | | |
| Class A Shares | | | | | | | | | | | | | | | | |
Shares sold | | | 432,173 | | | $ | 13,897,449 | | | | 504,808 | | | $ | 14,835,766 | |
Reinvestment of distributions | | | 95,795 | | | | 3,080,822 | | | | 180,525 | | | | 5,275,767 | |
Shares converted from Class B(a) | | | 142,604 | | | | 4,598,832 | | | | 57,812 | | | | 1,701,680 | |
Shares redeemed | | | (869,902 | ) | | | (27,748,033 | ) | | | (2,093,331 | ) | | | (61,961,506 | ) |
| | | | (199,330 | ) | | | (6,170,930 | ) | | | (1,350,186 | ) | | | (40,148,293 | ) |
| Class B Shares | | | | | | | | | | | | | | | | |
Shares sold | | | 53 | | | | 1,596 | | | | 10,363 | | | | 288,316 | |
Reinvestment of distributions | | | 223 | | | | 6,800 | | | | 2,742 | | | | 76,152 | |
Shares converted to Class A(a) | | | (148,163 | ) | | | (4,598,832 | ) | | | (60,089 | ) | | | (1,701,680 | ) |
Shares redeemed | | | (211,336 | ) | | | (6,553,374 | ) | | | (144,179 | ) | | | (4,102,267 | ) |
| | | | (359,223 | ) | | | (11,143,810 | ) | | | (191,163 | ) | | | (5,439,479 | ) |
| Class C Shares | | | | | | | | | | | | | | | | |
Shares sold | | | 35,510 | | | | 1,087,309 | | | | 105,052 | | | | 2,969,114 | |
Reinvestment of distributions | | | 3,154 | | | | 97,347 | | | | 5,634 | | | | 156,855 | |
Shares redeemed | | | (73,163 | ) | | | (2,237,702 | ) | | | (187,520 | ) | | | (5,216,013 | ) |
| | | | (34,499 | ) | | | (1,053,046 | ) | | | (76,834 | ) | | | (2,090,044 | ) |
| Institutional Shares | | | | | | | | | | | | | | | | |
Shares sold | | | 45,624 | | | | 1,482,508 | | | | 429,132 | | | | 12,714,092 | |
Reinvestment of distributions | | | 8,272 | | | | 269,848 | | | | 13,839 | | | | 413,191 | |
Shares redeemed | | | (47,548 | ) | | | (1,548,202 | ) | | | (253,053 | ) | | | (7,631,117 | ) |
| | | | 6,348 | | | | 204,154 | | | | 189,918 | | | | 5,496,166 | |
| Service Shares | | | | | | | | | | | | | | | | |
Shares sold | | | 638 | | | | 20,517 | | | | 2,631 | | | | 79,191 | |
Reinvestment of distributions | | | 22 | | | | 707 | | | | 25 | | | | 724 | |
Shares redeemed | | | (246 | ) | | | (7,891 | ) | | | (4,550 | ) | | | (139,707 | ) |
| | | | 414 | | | | 13,333 | | | | (1,894 | ) | | | (59,792 | ) |
| Class IR Shares | | | | | | | | | | | | | | | | |
Shares sold | | | 880 | | | | 28,381 | | | | 48,200 | | | | 1,520,398 | |
Reinvestment of distributions | | | 1,089 | | | | 34,914 | | | | 1,275 | | | | 37,212 | |
Shares redeemed | | | (6,226 | ) | | | (198,888 | ) | | | (7,952 | ) | | | (237,194 | ) |
| | | | (4,257 | ) | | | (135,593 | ) | | | 41,523 | | | | 1,320,416 | |
| Class R Shares | | | | | | | | | | | | | | | | |
Shares sold | | | 3,854 | | | | 123,950 | | | | 27,265 | | | | 783,593 | |
Reinvestment of distributions | | | 245 | | | | 7,857 | | | | 416 | | | | 12,159 | |
Shares redeemed | | | (3,078 | ) | | | (98,061 | ) | | | (4,988 | ) | | | (144,160 | ) |
| | | | 1,021 | | | | 33,746 | | | | 22,693 | | | | 651,592 | |
NET DECREASE | | | (589,526 | ) | | $ | (18,252,146 | ) | | | (1,365,943 | ) | | $ | (40,269,434 | ) |
| (a) | | Class B Shares were converted into Class A Shares at the close of business on November 14, 2014. |
83
GOLDMAN SACHS FUNDAMENTAL EQUITY VALUE FUNDS
Notes to Financial Statements (continued)
February 28, 2015 (Unaudited)
|
| 10. SUMMARY OF SHARE TRANSACTIONS (continued) |
| | | | | | | | | | | | | | | | |
| | | Large Cap Value Fund | |
| | | | |
| | | For the Six Months Ended
February 28, 2015 (Unaudited) | | | For the Fiscal Year Ended August 31, 2014 | |
| | | | |
| | | Shares | | | Dollars | | | Shares | | | Dollars | |
| | | | |
| Class A Shares | | | | | | | | | | | | | | | | |
Shares sold | | | 1,747,800 | | | $ | 31,175,288 | | | | 3,136,680 | | | $ | 52,852,500 | |
Reinvestment of distributions | | | 842,745 | | | | 14,849,166 | | | | 90,848 | | | | 1,458,128 | |
Shares converted from Class B(a) | | | 58,028 | | | | 1,072,273 | | | | 20,042 | | | | 330,786 | |
Shares redeemed | | | (1,956,618 | ) | | | (34,862,611 | ) | | | (4,441,658 | ) | | | (75,090,853 | ) |
| | | | 691,955 | | | | 12,234,116 | | | | (1,194,088 | ) | | | (20,449,439 | ) |
| Class B Shares | | | | | | | | | | | | | | | | |
Shares sold | | | 454 | | | | 7,511 | | | | 6,907 | | | | 110,226 | |
Reinvestment of distributions | | | — | | | | — | | | | — | | | | — | |
Shares converted to Class A(a) | | | (59,670 | ) | | | (1,072,273 | ) | | | (20,524 | ) | | | (330,786 | ) |
Shares redeemed | | | (249,034 | ) | | | (4,467,141 | ) | | | (141,787 | ) | | | (2,317,781 | ) |
| | | | (308,250 | ) | | | (5,531,903 | ) | | | (155,404 | ) | | | (2,538,341 | ) |
| Class C Shares | | | | | | | | | | | | | | | | |
Shares sold | | | 202,677 | | | | 3,482,428 | | | | 320,446 | | | | 5,150,437 | |
Reinvestment of distributions | | | 119,509 | | | | 2,038,830 | | | | 1,029 | | | | 16,037 | |
Shares redeemed | | | (194,016 | ) | | | (3,314,536 | ) | | | (365,638 | ) | | | (5,991,461 | ) |
| | | | 128,170 | | | | 2,206,722 | | | | (44,163 | ) | | | (824,987 | ) |
| Institutional Shares | | | | | | | | | | | | | | | | |
Shares sold | | | 4,792,422 | | | | 84,613,760 | | | | 7,976,282 | | | | 135,304,068 | |
Reinvestment of distributions | | | 4,022,551 | | | | 71,360,049 | | | | 659,652 | | | | 10,653,393 | |
Shares redeemed | | | (5,245,585 | ) | | | (93,838,535 | ) | | | (12,971,811 | ) | | | (219,055,282 | ) |
| | | | 3,569,388 | | | | 62,135,274 | | | | (4,335,877 | ) | | | (73,097,821 | ) |
| Service Shares | | | | | | | | | | | | | | | | |
Shares sold | | | 35,680 | | | | 636,678 | | | | 35,811 | | | | 597,368 | |
Reinvestment of distributions | | | 6,911 | | | | 121,215 | | | | 489 | | | | 7,824 | |
Shares redeemed | | | (15,949 | ) | | | (282,330 | ) | | | (62,550 | ) | | | (1,009,418 | ) |
| | | | 26,642 | | | | 475,563 | | | | (26,250 | ) | | | (404,226 | ) |
| Class IR Shares | | | | | | | | | | | | | | | | |
Shares sold | | | 83,829 | | | | 1,469,617 | | | | 1,271,813 | | | | 20,983,126 | |
Reinvestment of distributions | | | 23,151 | | | | 407,705 | | | | 90,957 | | | | 1,444,396 | |
Shares redeemed | | | (38,356 | ) | | | (674,021 | ) | | | (10,485,942 | ) | | | (177,099,655 | ) |
| | | | 68,624 | | | | 1,203,301 | | | | (9,123,172 | ) | | | (154,672,133 | ) |
| Class R Shares | | | | | | | | | | | | | | | | |
Shares sold | | | 81,902 | | | | 1,441,144 | | | | 117,871 | | | | 1,964,661 | |
Reinvestment of distributions | | | 27,502 | | | | 475,771 | | | | 1,834 | | | | 28,961 | |
Shares redeemed | | | (54,399 | ) | | | (946,333 | ) | | | (148,593 | ) | | | (2,390,641 | ) |
| | | | 55,005 | | | | 970,582 | | | | (28,888 | ) | | | (397,019 | ) |
NET INCREASE (DECREASE) | | | 4,231,534 | | | $ | 73,693,655 | | | | (14,907,842 | ) | | $ | (252,383,966 | ) |
| (a) | | Class B Shares were converted into Class A Shares at the close of business on November 14, 2014. |
84
GOLDMAN SACHS FUNDAMENTAL EQUITY VALUE FUNDS
|
| 10. SUMMARY OF SHARE TRANSACTIONS (continued) |
| | | | | | | | | | | | | | | | |
| | | Mid Cap Value Fund | |
| | | | |
| | | For the Six Months Ended February 28, 2015 (Unaudited) | | | For the Fiscal Year Ended August 31, 2014 | |
| | | | |
| | | Shares | | | Dollars | | | Shares | | | Dollars | |
| | | | |
| Class A Shares | | | | | | | | | | | | | | | | |
Shares sold | | | 6,755,815 | | | $ | 297,535,596 | | | | 14,609,556 | | | $ | 674,991,568 | |
Reinvestment of distributions | | | 8,926,462 | | | | 365,270,828 | | | | 11,190,520 | | | | 474,925,689 | |
Shares converted from Class B(a) | | | 15,485 | | | | 752,662 | | | | 5,414 | | | | 245,040 | |
Shares redeemed | | | (26,127,307 | ) | | | (1,159,171,616 | ) | | | (33,023,938 | ) | | | (1,520,926,228 | ) |
| | | | (10,429,545 | ) | | | (495,612,530 | ) | | | (7,218,448 | ) | | | (370,763,931 | ) |
| Class B Shares | | | | | | | | | | | | | | | | |
Shares sold | | | 332 | | | | 14,230 | | | | 7,320 | | | | 316,401 | |
Reinvestment of distributions | | | — | | | | — | | | | 38,609 | | | | 1,565,599 | |
Shares converted to Class A(a) | | | (16,322 | ) | | | (752,662 | ) | | | (5,674 | ) | | | (245,040 | ) |
Shares redeemed | | | (156,144 | ) | | | (7,196,845 | ) | | | (136,037 | ) | | | (5,959,707 | ) |
| | | | (172,134 | ) | | | (7,935,277 | ) | | | (95,782 | ) | | | (4,322,747 | ) |
| Class C Shares | | | | | | | | | | | | | | | | |
Shares sold | | | 470,900 | | | | 18,582,858 | | | | 578,534 | | | | 24,773,952 | |
Reinvestment of distributions | | | 770,735 | | | | 29,257,102 | | | | 537,431 | | | | 21,545,591 | |
Shares redeemed | | | (434,947 | ) | | | (17,520,836 | ) | | | (721,694 | ) | | | (31,394,878 | ) |
| | | | 806,688 | | | | 30,319,124 | | | | 394,271 | | | | 14,924,665 | |
| Institutional Shares | | | | | | | | | | | | | | | | |
Shares sold | | | 16,956,142 | | | | 746,268,460 | | | | 27,696,045 | | | | 1,292,926,043 | |
Reinvestment of distributions | | | 24,758,184 | | | | 1,020,779,916 | | | | 18,281,663 | | | | 781,906,738 | |
Shares redeemed | | | (19,793,276 | ) | | | (879,623,671 | ) | | | (32,437,518 | ) | | | (1,499,672,015 | ) |
| | | | 21,921,050 | | | | 887,424,705 | | | | 13,540,190 | | | | 575,160,766 | |
| Service Shares | | | | | | | | | | | | | | | | |
Shares sold | | | 1,177,675 | | | | 53,006,659 | | | | 1,604,814 | | | | 73,164,548 | |
Reinvestment of distributions | | | 1,044,799 | | | | 42,126,306 | | | | 1,152,450 | | | | 48,322,230 | |
Shares redeemed | | | (3,540,141 | ) | | | (161,781,301 | ) | | | (2,477,988 | ) | | | (112,674,260 | ) |
| | | | (1,317,667 | ) | | | (66,648,336 | ) | | | 279,276 | | | | 8,812,518 | |
| Class IR Shares | | | | | | | | | | | | | | | | |
Shares sold | | | 2,981,165 | | | | 130,211,435 | | | | 6,408,598 | | | | 279,400,837 | |
Reinvestment of distributions | | | 1,450,642 | | | | 58,359,342 | | | | 421,908 | | | | 17,686,371 | |
Shares redeemed | | | (1,665,105 | ) | | | (72,894,346 | ) | | | (2,877,904 | ) | | | (128,848,654 | ) |
| | | | 2,766,702 | | | | 115,676,431 | | | | 3,952,602 | | | | 168,238,554 | |
| Class R Shares | | | | | | | | | | | | | | | | |
Shares sold | | | 265,450 | | | | 11,225,474 | | | | 341,697 | | | | 15,659,277 | |
Reinvestment of distributions | | | 151,976 | | | | 6,100,340 | | | | 98,608 | | | | 4,128,718 | |
Shares redeemed | | | (99,730 | ) | | | (4,339,206 | ) | | | (228,253 | ) | | | (10,279,566 | ) |
| | | | 317,696 | | | | 12,986,608 | | | | 212,052 | | | | 9,508,429 | |
NET INCREASE | | | 13,892,790 | | | $ | 476,210,725 | | | | 11,064,161 | | | $ | 401,558,254 | |
| (a) | | Class B Shares were converted into Class A Shares at the close of business on November 14, 2014. |
85
GOLDMAN SACHS FUNDAMENTAL EQUITY VALUE FUNDS
Notes to Financial Statements (continued)
February 28, 2015 (Unaudited)
|
| 10. SUMMARY OF SHARE TRANSACTIONS (continued) |
| | | | | | | | | | | | | | | | |
| | | Small Cap Value Fund | |
| | | | |
| | | For the Six Months Ended
February 28, 2015
(Unaudited) | | | For the Fiscal Year Ended
August 31, 2014 | |
| | | | |
| | | Shares | | | Dollars | | | Shares | | | Dollars | |
| | | | |
| Class A Shares | | | | | | | | | | | | | | | | |
Shares sold | | | 2,249,938 | | | $ | 118,640,022 | | | | 5,591,513 | | | $ | 299,944,726 | |
Reinvestment of distributions | | | 1,477,416 | | | | 75,628,918 | | | | 2,092,273 | | | | 107,459,174 | |
Shares converted from Class B(a) | | | 3,007 | | | | 168,387 | | | | 1,661 | | | | 87,897 | |
Shares redeemed | | | (3,188,266 | ) | | | (168,457,418 | ) | | | (10,815,291 | ) | | | (577,342,866 | ) |
| | | | 542,095 | | | | 25,979,909 | | | | (3,129,844 | ) | | | (169,851,069 | ) |
| Class B Shares | | | | | | | | | | | | | | | | |
Shares sold | | | 2 | | | | 87 | | | | 1,006 | | | | 44,768 | |
Reinvestment of distributions | | | — | | | | — | | | | 7,230 | | | | 311,023 | |
Shares converted to Class A(a) | | | (3,616 | ) | | | (168,387 | ) | | | (1,981 | ) | | | (87,897 | ) |
Shares redeemed | | | (43,295 | ) | | | (2,006,417 | ) | | | (32,124 | ) | | | (1,441,891 | ) |
| | | | (46,909 | ) | | | (2,174,717 | ) | | | (25,869 | ) | | | (1,173,997 | ) |
| Class C Shares | | | | | | | | | | | | | | | | |
Shares sold | | | 106,242 | | | | 4,560,108 | | | | 226,793 | | | | 10,030,220 | |
Reinvestment of distributions | | | 118,922 | | | | 4,947,167 | | | | 129,672 | | | | 5,540,863 | |
Shares redeemed | | | (132,865 | ) | | | (5,740,800 | ) | | | (362,587 | ) | | | (16,209,846 | ) |
| | | | 92,299 | | | | 3,766,475 | | | | (6,122 | ) | | | (638,763 | ) |
| Institutional Shares | | | | | | | | | | | | | | | | |
Shares sold | | | 11,622,178 | | | | 650,516,947 | | | | 35,914,269 | | | | 2,031,071,807 | |
Reinvestment of distributions | | | 6,749,742 | | | | 367,455,935 | | | | 5,613,555 | | | | 305,096,723 | |
Shares redeemed | | | (10,473,572 | ) | | | (587,164,296 | ) | | | (16,020,469 | ) | | | (907,919,930 | ) |
| | | | 7,898,348 | | | | 430,808,586 | | | | 25,507,355 | | | | 1,428,248,600 | |
| Service Shares | | | | | | | | | | | | | | | | |
Shares sold | | | 362,078 | | | | 18,702,002 | | | | 1,070,225 | | | | 56,328,299 | |
Reinvestment of distributions | | | 264,973 | | | | 13,224,791 | | | | 336,878 | | | | 16,901,197 | |
Shares redeemed | | | (523,609 | ) | | | (27,235,786 | ) | | | (1,439,224 | ) | | | (74,842,656 | ) |
| | | | 103,442 | | | | 4,691,007 | | | | (32,121 | ) | | | (1,613,160 | ) |
| Class IR Shares | | | | | | | | | | | | | | | | |
Shares sold | | | 693,448 | | | | 36,653,692 | | | | 1,283,318 | | | | 68,451,418 | |
Reinvestment of distributions | | | 195,285 | | | | 9,932,204 | | | | 167,409 | | | | 8,547,903 | |
Shares redeemed | | | (557,765 | ) | | | (29,885,575 | ) | | | (708,611 | ) | | | (37,728,721 | ) |
| | | | 330,968 | | | | 16,700,321 | | | | 742,116 | | | | 39,270,600 | |
| Class R Shares | | | | | | | | | | | | | | | | |
Shares sold | | | 517,876 | | | | 27,198,140 | | | | 932,290 | | | | 49,285,738 | |
Reinvestment of distributions | | | 211,797 | | | | 10,680,913 | | | | 202,331 | | | | 10,256,144 | |
Shares redeemed | | | (414,194 | ) | | | (21,558,050 | ) | | | (601,404 | ) | | | (31,808,436 | ) |
| | | | 315,479 | | | | 16,321,003 | | | | 533,217 | | | | 27,733,446 | |
NET INCREASE | | | 9,235,722 | | | $ | 496,092,584 | | | | 23,588,732 | | | $ | 1,321,975,657 | |
| (a) | | Class B Shares were converted into Class A Shares at the close of business on November 14, 2014. |
86
GOLDMAN SACHS FUNDAMENTAL EQUITY VALUE FUNDS
|
| 10. SUMMARY OF SHARE TRANSACTIONS (continued) |
| | | | | | | | | | | | | | | | |
| | | Small/Mid Cap Value Fund | |
| | | | |
| | | For the Six Months Ended
February 28, 2015
(Unaudited) | | | For the Period Ended
August 31, 2014(a) | |
| | | | |
| | | Shares | | | Dollars | | | Shares | | | Dollars | |
| | | | |
| Class A Shares | | | | | | | | | | | | | | | | |
Shares sold | | | 11,682 | | | $ | 122,484 | | | | 13,578 | | | $ | 142,360 | |
Reinvestment of distributions | | | 299 | | | | 3,239 | | | | — | | | | — | |
Shares redeemed | | | (324 | ) | | | (3,465 | ) | | | (2 | ) | | | (15 | ) |
| | | | 11,657 | | | | 122,258 | | | | 13,576 | | | | 142,345 | |
| Class C Shares | | | | | | | | | | | | | | | | |
Shares sold | | | 5,791 | | | | 61,975 | | | | 9,599 | | | | 101,057 | |
Reinvestment of distributions | | | 137 | | | | 1,480 | | | | — | | | | — | |
Shares redeemed | | | (66 | ) | | | (720 | ) | | | (2 | ) | | | (15 | ) |
| | | | 5,862 | | | | 62,735 | | | | 9,597 | | | | 101,042 | |
| Institutional Shares | | | | | | | | | | | | | | | | |
Shares sold | | | 1,218,868 | | | | 13,156,806 | | | | 340,247 | | | | 3,421,125 | |
Reinvestment of distributions | | | 12,554 | | | | 136,177 | | | | — | | | | — | |
Shares redeemed | | | (240,841 | ) | | | (2,651,396 | ) | | | (199 | ) | | | (2,081 | ) |
| | | | 990,581 | | | | 10,641,587 | | | | 340,048 | | | | 3,419,044 | |
| Class IR Shares | | | | | | | | | | | | | | | | |
Shares sold | | | 8,073 | | | | 87,900 | | | | 2,502 | | | | 25,015 | |
Reinvestment of distributions | | | 198 | | | | 2,145 | | | | — | | | | — | |
Shares redeemed | | | (57 | ) | | | (623 | ) | | | (2 | ) | | | (15 | ) |
| | | | 8,214 | | | | 89,422 | | | | 2,500 | | | | 25,000 | |
| Class R Shares | | | | | | | | | | | | | | | | |
Shares sold | | | — | | | | — | | | | 2,502 | | | | 25,015 | |
Reinvestment of distributions | | | 38 | | | | 412 | | | | — | | | | — | |
Shares redeemed | | | — | | | | — | | | | (2 | ) | | | (15 | ) |
| | | | 38 | | | | 412 | | | | 2,500 | | | | 25,000 | |
NET INCREASE | | | 1,016,352 | | | $ | 10,916,414 | | | | 368,221 | | | $ | 3,712,431 | |
| (a) | | Commenced operations on January 31, 2014. |
87
GOLDMAN SACHS FUNDAMENTAL EQUITY VALUE FUNDS
Fund Expenses — Six Month Period Ended February 28, 2015 (Unaudited)
As a shareholder of Class A, Class C, Institutional, Service, Class IR or Class R Shares of a Fund, you incur two types of costs: (1) transaction costs, including sales charges on purchase payments (with respect to Class A Shares), contingent deferred sales charges on redemptions (with respect to Class C Shares), and (2) ongoing costs, including management fees; distribution and service (12b-1) fees (with respect to Class A, Class C and Class R Shares); and other Fund expenses. This Example is intended to help you understand your ongoing costs (in dollars) of investing in Class A, Class C, Institutional, Service, Class IR or Class R Shares of the Funds and to compare these costs with the ongoing costs of investing in other mutual funds.
The Example is based on an investment of $1,000 invested at the beginning of the period and held for the entire period from September 1, 2014 through February 28, 2015.
Actual Expenses — The first line under each share class in the table below provides information about actual account values and actual expenses. You may use the information in this line, together with the amount you invested, to estimate the expenses that you paid over the period. Simply divide your account value by $1,000 (for example, an $8,600 account value divided by $1,000=8.6), then multiply the result by the number in the first line under the heading entitled “Expenses Paid” to estimate the expenses you paid on your account during this period.
Hypothetical Example for Comparison Purposes — The second line under each share class in the table below provides information about hypothetical account values and hypothetical expenses based on the Funds’ actual net expense ratios and an assumed rate of return of 5% per year before expenses, which is not the Funds’ actual return. The hypothetical account values and expenses may not be used to estimate the actual ending account balance or expenses you paid for the period. You may use this information to compare the ongoing costs of investing in the Funds and other funds. To do so, compare this 5% hypothetical example with the 5% hypothetical examples that appear in the shareholder reports of the other funds.
Please note that the expenses shown in the table are meant to highlight your ongoing costs only and do not reflect any transactional costs, such as sales charges, redemption fees, or exchange fees. Therefore, the second line of the table is useful in comparing ongoing costs only, and will not help you determine the relative total costs of owning different funds. In addition, if these transactional costs were included, your costs would have been higher.
| | | | | | | | | | | | | | | | | | | | | | | | | | | | | | | | | | | | | | | | | | | | | | | | | | | | | | | | | | | | | | | | | | | | | | | | | | | |
| | | Growth and Income Fund | | Large Cap Value Fund | | Mid Cap Value Fund | | Small Cap Value Fund | | Small/Mid Cap Value Fund |
| Share Class | | Beginning
Account
Value
9/1/14 | | Ending
Account
Value
2/28/15 | | Expenses
Paid
for the
6 months
ended
2/28/15* | | Beginning
Account
Value
9/1/14 | | Ending
Account
Value
2/28/15 | | Expenses
Paid
for the
6 months
ended
2/28/15* | | Beginning
Account
Value
9/1/14 | | Ending
Account
Value
2/28/15 | | Expenses
Paid
for the
6 months
ended
2/28/15* | | Beginning
Account
Value
9/1/14 | | Ending
Account
Value
2/28/15 | | Expenses
Paid
for the
6 months
ended
2/28/15* | | Beginning
Account
Value
9/1/14 | | Ending
Account
Value
2/28/15 | | Expenses
Paid
for the
6 months
ended
2/28/15* |
| Class A | | | | | | | | | | | | | | | | | | | | | | | | | | | | | | | | | | | | | | | | | | | | | | | | | | | | | | | | | | | | | | | | | | | | | | | | | | | |
Actual | | | $ | 1,000.00 | | | | $ | 1,032.90 | | | | $ | 5.80 | | | | $ | 1,000.00 | | | | $ | 1,023.00 | | | | $ | 5.87 | | | | $ | 1,000.00 | | | | $ | 1,036.20 | | | | $ | 5.76 | | | | $ | 1,000.00 | | | | $ | 1,039.50 | | | | $ | 6.78 | | | | $ | 1,000.00 | | | | $ | 1,027.60 | | | | $ | 6.74 | |
Hypothetical 5% return | | | | 1,000.00 | | | | | 1,019.09 | + | | | | 5.76 | | | | | 1,000.00 | | | | | 1,018.99 | + | | | | 5.86 | | | | | 1,000.00 | | | | | 1,019.14 | + | | | | 5.71 | | | | | 1,000.00 | | | | | 1,018.15 | + | | | | 6.71 | | | | | 1,000.00 | | | | | 1,018.15 | + | | | | 6.71 | |
| Class C | | | | | | | | | | | | | | | | | | | | | | | | | | | | | | | | | | | | | | | | | | | | | | | | | | | | | | | | | | | | | | | | | | | | | | | | | | | |
Actual | | | | 1,000.00 | | | | | 1,029.40 | | | | | 9.56 | | | | | 1,000.00 | | | | | 1,018.90 | | | | | 9.61 | | | | | 1,000.00 | | | | | 1,032.40 | | | | | 9.52 | | | | | 1,000.00 | | | | | 1,035.60 | | | | | 10.55 | | | | | 1,000.00 | | | | | 1,024.50 | | | | | 10.49 | |
Hypothetical 5% return | | | | 1,000.00 | | | | | 1,015.37 | + | | | | 9.49 | | | | | 1,000.00 | | | | | 1,015.27 | + | | | | 9.59 | | | | | 1,000.00 | | | | | 1,015.42 | + | | | | 9.44 | | | | | 1,000.00 | | | | | 1,014.43 | + | | | | 10.44 | | | | | 1,000.00 | | | | | 1,014.43 | + | | | | 10.44 | |
| Institutional | | | | | | | | | | | | | | | | | | | | | | | | | | | | | | | | | | | | | | | | | | | | | | | | | | | | | | | | | | | | | | | | | | | | | | | | | | | |
Actual | | | | 1,000.00 | | | | | 1,035.40 | | | | | 3.79 | | | | | 1,000.00 | | | | | 1,025.20 | | | | | 3.87 | | | | | 1,000.00 | | | | | 1,038.00 | | | | | 3.74 | | | | | 1,000.00 | | | | | 1,041.40 | | | | | 4.76 | | | | | 1,000.00 | | | | | 1,031.10 | | | | | 4.68 | |
Hypothetical 5% return | | | | 1,000.00 | | | | | 1,021.08 | + | | | | 3.76 | | | | | 1,000.00 | | | | | 1,020.98 | + | | | | 3.86 | | | | | 1,000.00 | | | | | 1,021.13 | + | | | | 3.71 | | | | | 1,000.00 | | | | | 1,020.13 | + | | | | 4.71 | | | | | 1,000.00 | | | | | 1,020.18 | + | | | | 4.66 | |
| Service | | | | | | | | | | | | | | | | | | | | | | | | | | | | | | | | | | | | | | | | | | | | | | | | | | | | | | | | | | | | | | | | | | | | | | | | | | | |
Actual | | | | 1,000.00 | | | | | 1,032.50 | | | | | 6.30 | | | | | 1,000.00 | | | | | 1,022.20 | | | | | 6.37 | | | | | 1,000.00 | | | | | 1,035.60 | | | | | 6.26 | | | | | 1,000.00 | | | | | 1,038.90 | | | | | 7.28 | | | | | N/A | | | | | N/A | | | | | N/A | |
Hypothetical 5% return | | | | 1,000.00 | | | | | 1,018.60 | + | | | | 6.26 | | | | | 1,000.00 | | | | | 1,018.50 | + | | | | 6.36 | | | | | 1,000.00 | | | | | 1,018.65 | + | | | | 6.21 | | | | | 1,000.00 | | | | | 1,017.65 | + | | | | 7.20 | | | | | N/A | | | | | N/A | | | | | N/A | |
| Class IR | | | | | | | | | | | | | | | | | | | | | | | | | | | | | | | | | | | | | | | | | | | | | | | | | | | | | | | | | | | | | | | | | | | | | | | | | | | |
Actual | | | | 1,000.00 | | | | | 1,034.40 | | | | | 4.54 | | | | | 1,000.00 | | | | | 1,024.20 | | | | | 4.62 | | | | | 1,000.00 | | | | | 1,037.30 | | | | | 4.50 | | | | | 1,000.00 | | | | | 1,040.60 | | | | | 5.51 | | | | | 1,000.00 | | | | | 1,028.90 | | | | | 5.48 | |
Hypothetical 5% return | | | | 1,000.00 | | | | | 1,020.33 | + | | | | 4.51 | | | | | 1,000.00 | | | | | 1,020.23 | + | | | | 4.61 | | | | | 1,000.00 | | | | | 1,020.38 | + | | | | 4.46 | | | | | 1,000.00 | | | | | 1,019.39 | + | | | | 5.46 | | | | | 1,000.00 | | | | | 1,019.39 | + | | | | 5.46 | |
| Class R | | | | | | | | | | | | | | | | | | | | | | | | | | | | | | | | | | | | | | | | | | | | | | | | | | | | | | | | | | | | | | | | | | | | | | | | | | | |
Actual | | | | 1,000.00 | | | | | 1,031.80 | | | | | 7.05 | | | | | 1,000.00 | | | | | 1,021.80 | | | | | 7.12 | | | | | 1,000.00 | | | | | 1,034.70 | | | | | 7.01 | | | | | 1,000.00 | | | | | 1,038.10 | | | | | 8.03 | | | | | 1,000.00 | | | | | 1,026.30 | | | | | 7.99 | |
Hypothetical 5% return | | | | 1,000.00 | | | | | 1,017.85 | + | | | | 7.00 | | | | | 1,000.00 | | | | | 1,017.75 | + | | | | 7.10 | | | | | 1,000.00 | | | | | 1,017.90 | + | | | | 6.95 | | | | | 1,000.00 | | | | | 1,016.91 | + | | | | 7.95 | | | | | 1,000.00 | | | | | 1,016.91 | + | | | | 7.95 | |
| * | | Expenses for each share class are calculated using each Fund’s annualized net expense ratio for each class, which represents the ongoing expenses as a percentage of net assets for the six months ended February 28, 2015. Expenses are calculated by multiplying the annualized net expense ratio by the average account value for the period; then multiplying the result by the number of days in the most recent fiscal half year; and then dividing that result by the number of days in the fiscal year. The annualized net expense ratios for the period were as follows: |
| | | | | | | | | | | | | | | | | | | | | | | | |
| Fund | | Class A | | | Class C | | | Institutional | | | Service | | | Class IR | | | Class R | |
Growth and Income | | | 1.15 | % | | | 1.90 | % | | | 0.75 | % | | | 1.25 | % | | | 0.90 | % | | | 1.40 | % |
Large Cap Value | | | 1.17 | | | | 1.92 | | | | 0.77 | | | | 1.27 | | | | 0.92 | | | | 1.42 | |
Mid Cap Value | | | 1.14 | | | | 1.89 | | | | 0.74 | | | | 1.24 | | | | 0.89 | | | | 1.39 | |
Small Cap Value | | | 1.34 | | | | 2.09 | | | | 0.94 | | | | 1.44 | | | | 1.09 | | | | 1.59 | |
Small/Mid Cap Value | | | 1.34 | | | | 2.09 | | | | 0.93 | | | | N/A | | | | 1.09 | | | | 1.59 | |
| + | | Hypothetical expenses are based on each Fund’s actual annualized net expense ratios and an assumed rate of return of 5% per year before expenses. |
88
FUNDS PROFILE
Goldman Sachs Funds

Goldman Sachs is a premier financial services firm, known since 1869 for creating thoughtful and customized investment solutions in complex global markets.
Today, the Investment Management Division of Goldman Sachs serves a diverse set of clients worldwide, including private institutions, public entities and individuals. With approximately $1.02 trillion in assets under supervision as of December 31, 2014, Goldman Sachs Asset Management (“GSAM”) has portfolio management teams located around the world and our investment professionals bring firsthand knowledge of local markets to every investment decision. Assets under supervision includes assets under management and other client assets for which Goldman Sachs does not have full discretion. GSAM leverages the resources of Goldman, Sachs & Co. subject to legal, internal and regulatory restrictions.

Money Market1
Financial Square FundsSM
| n | | Financial Square Tax-Exempt Funds |
| n | | Financial Square Federal Fund |
| n | | Financial Square Government Fund |
| n | | Financial Square Money Market Fund |
| n | | Financial Square Prime Obligations Fund |
| n | | Financial Square Treasury Instruments Fund |
| n | | Financial Square Treasury Obligations Fund |
Fixed Income
Short Duration and Government
| n | | High Quality Floating Rate Fund |
| n | | Limited Maturity Obligations Fund |
| n | | Short Duration Government Fund |
| n | | Short Duration Income Fund |
| n | | Inflation Protected Securities Fund |
Multi-Sector
Municipal and Tax-Free
| n | | High Yield Municipal Fund |
| n | | Dynamic Municipal Income Fund3 |
| n | | Short Duration Tax-Free Fund |
Single Sector
| n | | Investment Grade Credit Fund |
| n | | High Yield Floating Rate Fund |
| n | | Emerging Markets Debt Fund |
| n | | Local Emerging Markets Debt Fund |
| n | | Dynamic Emerging Markets Debt Fund |
Fixed Income Alternatives
| n | | Long Short Credit Strategies Fund |
| n | | Fixed Income Macro Strategies Fund |
Fundamental Equity
| n | | Small/Mid Cap Value Fund |
| n | | Small/Mid Cap Growth Fund |
| n | | Flexible Cap Growth Fund |
| n | | Concentrated Growth Fund |
| n | | Technology Tollkeeper Fund |
| n | | Growth Opportunities Fund |
| n | | Rising Dividend Growth Fund |
Tax-Advantaged Equity
| n | | U.S. Tax-Managed Equity Fund5 |
| n | | International Tax-Managed Equity Fund5 |
| n | | U.S. Equity Dividend and Premium Fund |
| n | | International Equity Dividend and Premium Fund |
Equity Insights
| n | | Small Cap Equity Insights Fund |
| n | | U.S. Equity Insights Fund |
| n | | Small Cap Growth Insights Fund |
| n | | Large Cap Growth Insights Fund |
| n | | Large Cap Value Insights Fund |
| n | | Small Cap Value Insights Fund |
| n | | International Small Cap Insights Fund |
| n | | International Equity Insights Fund |
| n | | Emerging Markets Equity Insights Fund |
Fundamental Equity International
| n | | Strategic International Equity Fund |
| n | | Focused International Equity Fund |
| n | | International Small Cap Fund |
| n | | Emerging Markets Equity Fund |
| n | | BRIC Fund (Brazil, Russia, India, China) |
Select Satellite6
| n | | Real Estate Securities Fund |
| n | | International Real Estate Securities Fund |
| n | | Commodity Strategy Fund |
| n | | Dynamic Commodity Strategy Fund |
| n | | Dynamic Allocation Fund |
| n | | Absolute Return Tracker Fund |
| n | | Managed Futures Strategy Fund |
| n | | MLP Energy Infrastructure Fund |
| n | | Multi-Manager Alternatives Fund |
| n | | Multi-Asset Real Return Fund |
| n | | Retirement Portfolio Completion Fund |
| n | | Tactical Tilt Implementation Fund |
Total Portfolio Solutions6
| n | | Balanced Strategy Portfolio |
| n | | Growth and Income Strategy Portfolio |
| n | | Growth Strategy Portfolio |
| n | | Equity Growth Strategy Portfolio |
| n | | Satellite Strategies Portfolio |
| n | | Enhanced Dividend Global Equity Portfolio |
| n | | Tax Advantaged Global Equity Portfolio |
| 1 | | An investment in a money market fund is neither insured nor guaranteed by the Federal Deposit Insurance Corporation (“FDIC”) or any other government agency. Although the Funds seek to preserve the value of your investment at $1.00 per share, it is possible to lose money by investing in the Funds. |
| 2 | | Effective on October 1, 2014, the Goldman Sachs Core Plus Fixed Income Fund was renamed the Goldman Sachs Bond Fund. |
| 3 | | Effective on December 18, 2014, the Goldman Sachs Municipal Income Fund was renamed the Goldman Sachs Dynamic Municipal Income Fund. |
| 4 | | Effective April 30, 2015, the Goldman Sachs U.S. Equity Fund will be renamed the Goldman Sachs Dynamic U.S. Equity Fund. |
| 5 | | Effective on April 30, 2014, the Goldman Sachs Structured Tax-Managed Equity and Structured International Tax-Managed Equity Funds were renamed the Goldman Sachs U.S. Tax-Managed Equity and International Tax-Managed Equity Funds, respectively. |
| 6 | | Individual Funds within the Total Portfolio Solutions and Select Satellite categories will have various placement on the risk/return spectrum and may have greater or lesser risk than that indicated by the placement of the general Total Portfolio Solutions or Select Satellite category. |
Financial Square FundsSM is a registered service mark of Goldman, Sachs & Co.
*This list covers open-end funds only. Please visit our web site at www.GSAMFUNDS.com to learn about our closed-end funds.
| | |
TRUSTEES Ashok N. Bakhru, Chairman Kathryn A. Cassidy John P. Coblentz, Jr. Diana M. Daniels Joseph P. LoRusso Herbert J. Markley James A. McNamara Jessica Palmer Alan A. Shuch Richard P. Strubel Roy W. Templin Gregory G. Weaver | | OFFICERS James A. McNamara, President Scott M. McHugh, Principal Financial Officer and Treasurer Caroline Kraus, Secretary |
| |
GOLDMAN, SACHS & CO. Distributor and Transfer Agent | | GOLDMAN SACHS ASSET MANAGEMENT, L.P. Investment Adviser |
Visit our web site at www.GSAMFUNDS.com to obtain the most recent month-end returns.
Goldman Sachs Asset Management, L.P. 200 West Street, New York, New York 10282
The reports concerning the Funds included in this shareholder report may contain certain forward-looking statements about the factors that may affect the performance of the Funds in the future. These statements are based on Fund management’s predictions and expectations concerning certain future events and their expected impact on the Funds, such as performance of the economy as a whole and of specific industry sectors, changes in the levels of interest rates, the impact of developing world events, and other factors that may influence the future performance of the Funds. Management believes these forward-looking statements to be reasonable, although they are inherently uncertain and difficult to predict. Actual events may cause adjustments in portfolio management strategies from those currently expected to be employed.
A description of the policies and procedures that the Funds use to determine how to vote proxies relating to portfolio securities and information regarding how a Fund voted proxies relating to portfolio securities during the most recent 12-month period ended June 30 is available (i) without charge, upon request by calling 1-800-526-7384 (for Retail Shareholders) or 1-800-621-2550 (for Institutional Shareholders); and (ii) on the Securities and Exchange Commission (“SEC”) web site at http://www.sec.gov.
The Funds file their complete schedule of portfolio holdings with the SEC for the first and third quarters of each fiscal year on Form N-Qs. The Funds’ Forms N-Qs are available on the SEC’s web site at http://www.sec.gov within 60 days after the Funds’ first and third fiscal quarters. The Funds’ Forms N-Qs may be reviewed and copied at the SEC’s Public Reference Room in Washington, D.C., and information on the operation of the Public Reference Room may also be obtained by calling 1-800-SEC-0330. Forms N-Qs may be obtained upon request and without charge by calling 1-800-526-7384 (for Retail Shareholders) or 1-800-621-2550 (for Institutional Shareholders).
Goldman, Sachs & Co. (‘‘Goldman Sachs’’) does not provide legal, tax or accounting advice. Any statement contained in this communication (including any attachments) concerning U.S. tax matters was not intended or written to be used, and cannot be used, for the purpose of avoiding penalties under the Internal Revenue Code, and was written to support the promotion or marketing of the transaction(s) or matter(s) addressed. Clients of Goldman Sachs should obtain their own independent tax advice based on their particular circumstances.
Fund holdings and allocations shown are as of February 28, 2015 and may not be representative of future investments. Fund holdings should not be relied on in making investment decisions and should not be construed as research or investment advice regarding particular securities. Current and future holdings are subject to risk.
The Global Industry Classification Standard (GICS) was developed by and is the exclusive property and a service mark of Morgan Stanley Capital International Inc. (MSCI) and Standard & Poor’s, a division of The McGraw-Hill Companies, Inc. (S&P) and is licensed for use by Goldman Sachs. Neither MSCI, S&P nor any other party involved in making or compiling the GICS or any GICS classifications makes any express or implied warranties or representations with respect to such standard or classification (or the results to be obtained by the use thereof), and all such parties hereby expressly disclaim all warranties of originality, accuracy, completeness, merchantability or fitness for a particular purpose with respect to any of such standard or classification. Without limiting any of the foregoing, in no event shall MSCI, S&P, any of their affiliates or any third party involved in making or compiling the GICS or any GICS classifications have any liability for any direct, indirect, special, punitive, consequential or any other damages (including lost profits) even if notified of the possibility of such damages.
The portfolio risk management process includes an effort to monitor and manage risk, but does not imply low risk.
This material is not authorized for distribution to prospective investors unless preceded or accompanied by a current Prospectus or summary prospectus, if applicable. Investors should consider a Fund’s objective, risks, and charges and expenses, and read the summary prospectus, if available, and/or the Prospectus carefully before investing or sending money. The summary prospectus, if available, and the Prospectus contain this and other information about a Fund and may be obtained from your Authorized Institution or from Goldman, Sachs & Co. by calling (retail – 1-800-526-7384) (institutional – 1-800-621-2550).
© 2015 Goldman Sachs. All rights reserved. 159659.MF.MED.TMPL/4/2015 EQVALSAR-15 / 226K
(a) As of the end of the period covered by this report, the registrant has adopted a code of ethics that applies to the registrant’s principal executive officer, principal financial officer, principal accounting officer or controller, or persons performing similar functions, regardless of whether these individuals are employed by the registrant or a third party (the “Code of Ethics”).
(b) During the period covered by this report, no amendments were made to the provisions of the Code of Ethics.
(c) During the period covered by this report, the registrant did not grant any waivers, including an implicit waiver, from any provision of the Code of Ethics.
(d) A copy of the Code of Ethics is available as provided in Item 12(a)(1) of this report.
| ITEM 3. | AUDIT COMMITTEE FINANCIAL EXPERT. |
The registrant’s board of trustees has determined that the registrant has at least one “audit committee financial expert” (as defined in Item 3 of Form N-CSR) serving on its audit committee. John P. Coblentz, Jr. is the “audit committee financial expert” and is “independent” (as each term is defined in Item 3 of Form N-CSR).
| ITEM 4. | PRINCIPAL ACCOUNTANT FEES AND SERVICES. |
Table 1 — Items 4(a) - 4(d). The accountant fees below reflect the aggregate fees billed by all of the Funds of the Goldman Sachs Trust and includes the Goldman Sachs Funds to which this certified shareholder report relates.
| | | | | | | | | | | | |
| | | 2014 | | 2013 | | Description of Services Rendered |
| | | |
| | | | | | | | | | | | |
| | | |
Audit Fees: | | | | | | | | | | | | |
| | | |
• PricewaterhouseCoopers LLP
(“PwC”) | | | $ | 4,269,524 | | | | $ | 3,372,161 | | | Financial Statement audits. |
| | | |
Audit-Related Fees: | | | | | | | | | | | | |
| | | |
• PwC | | | $ | 0 | | | | $ | 2,340 | | | Other attest services. |
| | | |
Tax Fees: | | | | | | | | | | | | |
| | | |
• PwC | | | $ | 939,217 | | | | $ | 816,858 | | | Tax compliance services provided in connection with the preparation and review of registrant’s tax returns. |
Table 2 — Items 4(b)(c) & (d). Non-Audit Services to the Goldman Sachs Trust’s service affiliates * that were pre-approved by the Audit Committee of the Goldman Sachs Trust pursuant to Rule 2-01(c)(7)(ii) of Regulation S-X.
| | | | | | | | | | | | |
| | | 2014 | | 2013 | | Description of Services Rendered |
| | | |
| | | | | | | | | | | | |
| | | |
Audit-Related Fees: | | | | | | | | | | | | |
| | | |
• PwC | | | $ | 1,486,420 | | | | $ | 1,516,680 | | | Internal control review performed in accordance with Statement on Standards for Attestation Engagements No. 16. These fees are borne by the Funds’ Adviser. |
| * | These include the advisor (excluding sub-advisors) and any entity controlling, controlled by or under common control with the advisor that provides ongoing services to the registrant (hereinafter referred to as “service affiliates”). |
Item 4(e)(1) — Audit Committee Pre-Approval Policies and Procedures
Pre-Approval of Audit and Non-Audit Services Provided to the Funds of the Goldman Sachs Trust. The Audit and Non-Audit Services Pre-Approval Policy (the “Policy”) adopted by the Audit Committee of Goldman Sachs Trust (“GST”) sets forth the procedures and the conditions pursuant to which services performed by an independent auditor for GST may be pre-approved. Services may be pre-approved specifically by the Audit Committee as a whole or, in certain circumstances, by the Audit Committee Chairman or the person designated as the Audit Committee Financial Expert. In addition, subject to specified cost limitations, certain services may be pre-approved under the provisions of the Policy. The Policy provides that the Audit Committee will consider whether the services provided by an independent auditor are consistent with the Securities and Exchange Commission’s rules on auditor independence. The Policy provides for periodic review and pre-approval by the Audit Committee of the services that may be provided by the independent auditor.
De Minimis Waiver. The pre-approval requirements of the Policy may be waived with respect to the provision of non-audit services that are permissible for an independent auditor to perform, provided (1) the aggregate amount of all such services provided constitutes no more than five percent of the total amount of revenues subject to pre-approval that was paid to the independent auditors during the fiscal year in which the services are provided; (2) such services were not recognized by GST at the time of the engagement to be non-audit services; and (3) such services are promptly brought to the attention of the Audit Committee and approved prior to the completion of the audit by the Audit Committee or by one or more members of the Audit Committee to whom authority to grant such approvals has been delegated by the Audit Committee, pursuant to the pre-approval provisions of the Policy.
Pre-Approval of Non-Audit Services Provided to GST’s Investment Advisers. The Policy provides that, in addition to requiring pre-approval of audit and non-audit services provided to GST, the Audit Committee will pre-approve those non-audit services provided to GST’s investment advisers (and entities controlling, controlled by or under common control with the investment advisers that provide ongoing services to GST) where the engagement relates directly to the operations or financial reporting of GST.
Item 4(e)(2) – 0% of the audit-related fees, tax fees and other fees listed in Table 1 were approved by GST’s Audit Committee pursuant to the “de minimis” exception of Rule 2-01(c)(7)(i)(C) of Regulation S-X. In addition, 0% of the non-audit services to the GST’s service affiliates listed in Table 2 were approved by GST’s Audit Committee pursuant to the “de minimis” exception of Rule 2-01(c)(7)(i)(C) of Regulation S-X.
Item 4(f) – Not applicable.
Item 4(g) Aggregate Non-Audit Fees Disclosure
The aggregate non-audit fees billed to GST by PwC for the twelve months ended August 31, 2014 and August 31, 2013 were approximately $939,217 and $819,198 respectively. The aggregate non-audit fees billed to GST’s adviser and service affiliates by PwC for non-audit services for the twelve months ended December 31, 2013 and December 31, 2012 were approximately $9.8 million and $10.0 million respectively. With regard to the aggregate non-audit fees billed to GST’s adviser and service affiliates, the 2013 and 2012 amounts include fees for non-audit services required to be pre-approved [see Table 2] and fees for non-audit services that did not require pre-approval since they did not directly relate to GST’s operations or financial reporting.
Item 4(h) — GST’s Audit Committee has considered whether the provision of non-audit services to GST’s investment adviser and service affiliates that did not require pre-approval pursuant to paragraph (c)(7)(ii) of Rule 2-01 of Regulation S-X is compatible with maintaining the auditors’ independence.
| ITEM 5. | AUDIT COMMITTEE OF LISTED REGISTRANTS. |
| ITEM 6. | SCHEDULE OF INVESTMENTS. |
| | Schedule of Investments is included as part of the Report to Stockholders filed under Item 1. |
| ITEM 7. | DISCLOSURE OF PROXY VOTING POLICIES AND PROCEDURES FOR CLOSED-END MANAGEMENT INVESTMENT COMPANIES. |
| ITEM 8. | PORTFOLIO MANAGERS OF CLOSED-END MANAGEMENT INVESTMENT COMPANIES. |
| ITEM 9. | PURCHASES OF EQUITY SECURITIES BY CLOSED-END MANAGEMENT INVESTMENT COMPANY AND AFFILIATED PURCHASERS. |
| ITEM 10. | SUBMISSION OF MATTERS TO A VOTE OF SECURITY HOLDERS. |
| | There have been no material changes to the procedures by which shareholders may recommend nominees to the registrant’s board of trustees. |
| ITEM 11. | CONTROLS AND PROCEDURES. |
| | (a) | The registrant’s principal executive and principal financial officers, or persons performing similar functions have concluded that the registrant’s disclosure controls and procedures (as defined in Rule 30a-3(c) under the Investment Company Act of 1940, as amended (the “1940 Act”)) are effective as of a date within 90 days of the filing of this report that includes the disclosure required by this paragraph, based on the evaluation of these controls and procedures required by Rule 30a-3(b) under the 1940 Act and 15d-15(b) under the Securities Exchange Act of 1934, as amended. |
| | (b) | There were no changes in the registrant’s internal control over financial reporting (as defined in Rule 30a-3(d) under the 1940 Act) that occurred during the registrant’s second fiscal quarter of the period covered by this report that have materially affected, or are reasonably likely to materially affect, the registrant’s internal control over financial reporting. |
| | | | |
| (a)(1) | | Goldman Sachs Trust’s Code of Ethics for Principal Executive and Senior Financial Officers is incorporated by reference to Exhibit 12(a)(1) of the registrant’s Form N-CSR filed on June 3, 2010 for its Short Duration and Government Fixed Income Funds. |
| | |
| (a)(2) | | Exhibit 99.CERT | | Certifications pursuant to Section 302 of the Sarbanes-Oxley Act of 2002 filed herewith. |
| | |
| (b) | | Exhibit 99.906CERT | | Certifications pursuant to Section 906 of the Sarbanes-Oxley Act of 2002 filed herewith. |
SIGNATURES
Pursuant to the requirements of the Securities Exchange Act of 1934 and the Investment Company Act of 1940, the registrant has duly caused this report to be signed on its behalf by the undersigned, thereunto duly authorized.
| | |
| | | Goldman Sachs Trust |
| |
| By: | | /s/ James A. McNamara |
| |
| | |
| | James A. McNamara |
| | President/Principal Executive Officer |
| | Goldman Sachs Trust |
| |
| Date: | | May 8, 2015 |
Pursuant to the requirements of the Securities Exchange Act of 1934 and the Investment Company Act of 1940, this report has been signed below by the following persons on behalf of the registrant and in the capacities and on the dates indicated.
| | |
| By: | | /s/ James A. McNamara |
| |
| | |
| | James A. McNamara |
| | President/Principal Executive Officer |
| | Goldman Sachs Trust |
| |
| Date: | | May 8, 2015 |
| |
| By: | | /s/ Scott McHugh |
| |
| | |
| | Scott McHugh |
| | Principal Financial Officer |
| | Goldman Sachs Trust |
| |
| Date: | | May 8, 2015 |