UNITED STATES
SECURITIES AND EXCHANGE COMMISSION
Washington, D.C. 20549
FORM N-CSR
CERTIFIED SHAREHOLDER REPORT OF REGISTERED
MANAGEMENT INVESTMENT COMPANIES
Investment Company Act file number 811-05349
Goldman Sachs Trust
(Exact name of registrant as specified in charter)
71 South Wacker Drive, Chicago, Illinois 60606
(Address of principal executive offices) (Zip code)
| | |
| Caroline Kraus, Esq. | | Copies to: |
| Goldman, Sachs & Co. | | Geoffrey R.T. Kenyon, Esq. |
| 200 West Street | | Dechert LLP |
| New York, New York 10282 | | 100 Oliver Street |
| | 40th Floor |
| | Boston, MA 02110-2605 |
(Name and address of agents for service)
Registrant’s telephone number, including area code: (312) 655-4400
Date of fiscal year end: October 31
Date of reporting period: April 30, 2015
| ITEM 1. | REPORTS TO STOCKHOLDERS. |
| | The Semi-Annual Report to Stockholders is filed herewith. |
Goldman Sachs Funds

| | | | |
| | |
| Semi-Annual Report | | | | April 30, 2015 |
| | |
| | | | Fundamental Emerging Markets Equity Funds |
| | | | Asia Equity |
| | | | BRIC |
| | | | Emerging Markets Equity |
| | | | N-11 Equity |

Goldman Sachs Fundamental Emerging Markets Equity Funds
| n | | EMERGING MARKETS EQUITY |
| | | | |
TABLE OF CONTENTS | | | | |
| |
Principal Investment Strategies and Risks | | | 1 | |
| |
Investment Process | | | 3 | |
| |
Market Review | | | 4 | |
| |
Portfolio Management Discussions and Performance Summaries | | | 6 | |
| |
Schedules of Investments | | | 30 | |
| |
Financial Statements | | | 42 | |
| |
Financial Highlights | | | 46 | |
| |
Notes to Financial Statements | | | 54 | |
| |
Other Information | | | 68 | |
| | | | |
| | | |
| NOT FDIC-INSURED | | May Lose Value | | No Bank Guarantee |
GOLDMAN SACHS FUNDAMENTAL EMERGING MARKETS EQUITY FUNDS
Principal Investment Strategies and Risks
This is not a complete list of risks that may affect the Funds. For additional information concerning the risks applicable to the Funds, please see the Funds’ Prospectuses.
The Goldman Sachs Asia Equity Fund invests primarily in a diversified portfolio of equity investments in Asian issuers (excluding Japanese issuers). The Fund is subject to market risk, which means that the value of the securities in which it invests may go up or down in response to the prospects of individual companies, particular sectors and/or general economic conditions. Foreign and emerging markets investments may be more volatile than investments in U.S. securities and are subject to the risks of currency fluctuations and adverse economic or political developments. Because of its exposure to Asian issuers, the Fund is subject to greater risk of loss as a result of adverse securities markets, exchange rates and social, political, regulatory or economic events that may occur in Asian countries. The securities of mid- and small-capitalization companies involve greater risks than those associated with larger, more established companies and may be subject to more abrupt or erratic price movements. At times, the Fund may be unable to sell certain of its illiquid investments without a substantial drop in price, if at all.
The Goldman Sachs BRIC Fund invests primarily in a portfolio of equity investments in Brazil, Russia, India and China (“BRIC countries”) or in issuers that participate in the markets of the BRIC countries. The Fund is subject to market risk, which means that the value of the securities in which it invests may go up or down in response to the prospects of individual companies, particular sectors and/ or general economic conditions. Foreign and emerging markets investments may be more volatile than investments in U.S. securities and are subject to the risks of currency fluctuations and adverse economic or political developments. Because of its exposure to the BRIC countries, the Fund is subject to greater risk of loss as a result of adverse securities markets, exchange rates and social, political, regulatory or economic events that may occur in those countries. Because the Fund may invest heavily in specific sectors, the Fund is subject to greater risk of loss as a result of adverse economic, business or other developments affecting such sectors. At times, the Fund may be unable to sell certain of its illiquid investments without a substantial drop in price, if at all. The Fund is “non-diversified” and may invest a larger percentage of its assets in fewer issuers than “diversified” mutual funds. Accordingly, the Fund may be more susceptible to adverse developments affecting any single issuer held in its portfolio and to greater losses resulting from these developments.
The Goldman Sachs Emerging Markets Equity Fund invests primarily in a diversified portfolio of equity investments in emerging country issuers. The Fund is subject to market risk, which means that the value of the securities in which it invests may go up or down in response to the prospects of individual companies, particular sectors and/or general economic conditions. Foreign and emerging markets investments may be more volatile than investments in U.S. securities and are subject to the risks of currency fluctuations and adverse economic or political developments. The securities markets of emerging countries have less government regulation and are subject to less extensive accounting and financial reporting requirements than the markets of more developed countries. Because the Fund may invest heavily in specific sectors, the Fund is subject to greater risk of loss as a result of adverse economic, business or other developments affecting such sectors. At times, the Fund may be unable to sell certain of its illiquid investments without a substantial drop in price, if at all.
The Goldman Sachs N-11 Equity Fund invests primarily in a portfolio of equity investments that are tied economically to the “N-11 countries” or in issuers that participate in the markets of the following N-11 countries: Bangladesh, Egypt, Indonesia, Mexico, Nigeria, Pakistan, Philippines, South Korea, Turkey and Vietnam. While Iran is among the N-11 countries, the Fund will not invest in issuers organized under the laws of Iran, or domiciled in Iran, or in certain other issuers as necessary to comply
1
GOLDMAN SACHS FUNDAMENTAL EMERGING MARKETS EQUITY FUNDS
with U.S. economic sanctions against Iran. The Fund is subject to market risk, which means that the value of the securities in which it invests may go up or down in response to the prospects of individual companies, particular sectors and/or general economic conditions. Foreign and emerging markets investments may be more volatile than investments in U.S. securities and are subject to the risks of currency fluctuations and adverse economic or political developments. Such securities are also subject to foreign custody risk. Because of its exposure to the N-11 countries, the Fund is subject to greater risk of loss as a result of adverse securities markets, exchange rates and social, political, regulatory or economic events that may occur in those countries. The N-11 countries generally have smaller economies or less developed capital markets than traditional emerging markets countries, and, as a result, the risks of investing in these countries are magnified. Because the Fund may invest heavily in specific sectors, the Fund is subject to greater risk of loss as a result of adverse economic, business or other developments affecting such sectors. The Fund may concentrate its investments in a specific industry (only in the event that that industry represents 20% or more of the Fund’s benchmark index at the time of investment), subjecting it to greater risk of loss as a result of adverse economic, business or other developments affecting that industry. At times, the Fund may be unable to sell certain of its illiquid investments without a substantial drop in price, if at all. The Fund is “non-diversified” and may invest a larger percentage of its assets in fewer issuers than “diversified” mutual funds. Accordingly, the Fund may be more susceptible to adverse developments affecting any single issuer held in its portfolio and to greater losses resulting from these developments.
2
GOLDMAN SACHS FUNDAMENTAL EMERGING MARKETS EQUITY FUNDS
What Differentiates Goldman Sachs’ Fundamental Emerging Markets Equity Investment Process?
Goldman Sachs’ Fundamental Emerging Markets Equity investment process is based on the belief that strong, consistent results are best achieved through expert stock selection, performed by our dedicated Emerging Markets Team that works together on a global scale. Our deep, diverse and experienced team of research analysts and portfolio managers combines local insights with global, industry-specific expertise to identify its best investment ideas.

| n | | The Emerging Markets Equity research team, based in the United States, United Kingdom, Japan, China, Korea, Singapore, Brazil, India, and Australia focuses on long- term business and management quality |
| n | | Proprietary, bottom-up research is the key driver of our investment process |
| n | | Analysts collaborate regularly to leverage regional and industry-specific research and insights |

| n | | Members of each local investment team are aligned by sector and are responsible for finding ideas with the best risk-adjusted upside in their respective areas of coverage |
| n | | The decision-making process includes active participation in frequent and regular research meetings |
| n | | The Emerging Market Equity team benefits from the country and currency expertise of our Global Emerging Markets Debt and Currency teams |

| n | | Security selections are aligned with levels of investment conviction and risk-adjusted upside |
| n | | Continual risk monitoring identifies various risks at the stock and portfolio level and assesses whether they are intended and justified |
| n | | Dedicated portfolio construction team assists in ongoing monitoring and adjustment of the Funds |

Emerging markets equity portfolios that strive to offer:
| | n | | Access to markets across emerging markets | |
| | n | | Disciplined approach to stock selection | |
| | n | | Optimal risk/return profiles | |
3
MARKET REVIEW
Goldman Sachs Fundamental Emerging
Markets Equity Funds
Market Review
Emerging markets equities advanced during the six-month period ended April 30, 2015 (the “Reporting Period”). The Morgan Stanley Capital International (MSCI®) Emerging Markets Index (Net, USD, Unhedged) (the “MSCI® EM Index”) posted a return of 3.92%.* However, emerging markets equities lagged developed markets equities, as measured by the MSCI® Europe, Australasia, Far East (EAFE) Index, with relatively tepid performance of emerging market equities for most of the Reporting Period reflecting concerns about slowing economic growth, particularly in China, and the impact of weak commodity prices, particularly the sharp decline in oil prices.
During the Reporting Period, China’s Gross Domestic Product (“GDP”) growth slowed to 7% for the first quarter of 2015, down from 7.3% for calendar year 2014, while many other economic indicators similarly deteriorated. However, the Chinese central bank took a number of steps toward easing its monetary policy during the Reporting Period. Most notably, perhaps, in April 2015, the People’s Bank of China (“PBOC”) slashed its reserve requirement ratio by 100 basis points to 18.5% for the largest banks, which is the lowest level since 2012. (A basis point is 1/100th of a percentage point. The reserve requirement ratio is the portion, expressed as a percent, of depositors’ balances banks must have on hand as cash. This is a requirement determined by a country’s central bank. The reserve ratio affects the money supply in a country.) Chinese equities soared on the news, sparking a sharp rally in emerging markets equities broadly in April 2015. Indeed, significant outperformance of Chinese equities accounted for most of the gains of the MSCI® EM Index for the Reporting Period as a whole.
As for oil prices, the international Brent crude oil benchmark price fell steadily from a high of $115 per barrel in June 2014 to a low of $47 per barrel in January 2015 before rebounding to almost $70 per barrel by the end of April 2015. In turn, big commodity-exporting countries, including Brazil and Russia, as well as the energy sector of the MSCI® EM Index, were negatively impacted by the low oil prices for most of the Reporting Period. However, both countries’ equity markets and the broader MSCI® EM Index rallied with the rebound in oil prices in April 2015. The utilities, materials, consumer staples and telecommunication services sectors also posted negative returns during the Reporting Period.
Information technology was the best performing sector in the MSCI® EM Index during the Reporting Period in part due to robust merger and acquisition activity. The financials sector also notably outperformed the MSCI® EM Index, driven largely by many Chinese financials stocks that rose with strong Chinese equity market performance.
From a country perspective, China and Hungary were by a wide margin the best performing individual country constituents of the MSCI® EM Index for the Reporting Period overall, while Greece, Colombia, Brazil, Turkey and Mexico each posted double-digit negative returns.
| * | | All index returns are expressed in U.S. dollar terms. |
4
MARKET REVIEW
Looking Ahead
As the equity bull market enters its seventh year, we believe the global economy may be nearing several inflection points and new equity market leaders may well emerge. For example, we believe the U.S. economy has strengthened to the point where the Federal Reserve (the “Fed”) may prepare to raise interest rates for the first time since June 2006. The euro has depreciated to match the European Central Bank’s (“ECB”) near zero interest rate, and European banks are lending again after years of deleveraging. In Japan, inflation is taking hold, wages are rising and consumption may be about to pick up. It is widely anticipated that India’s re-accelerating GDP growth will likely eclipse China’s slowing economic growth rate this year. In our view, the macroeconomic themes behind many of these changes — diverging monetary policies, currency movements, low oil prices and structural reforms — affect nearly every company’s earnings and stock price in a different way.
Naturally, we believe new equity market leaders are likely to emerge from the changing economic landscape. But, in our view, the best performing stocks and stock markets may not necessarily be in the countries or industries with the highest economic growth, and yesterday’s laggards are not always ready to be tomorrow’s leaders. Furthermore, earnings multiples have increased, leaving few bargains, in our opinion. Indeed, because earnings multiples have already expanded, we believe earnings growth will become an increasingly important driver of stock performance in the months ahead. The sometimes offsetting or contradicting effects of macroeconomic conditions are likely to make top-down calls more difficult, but we believe the true impact may be revealed in corporate earnings. In our view, more expensive equities, lower return expectations and offsetting macroeconomic influences create a stock-picker’s market and one in which portfolios that outperform may look different from the broader market. Even when sector and country weightings are similar, a closer look may reveal differentiation through concentration, market capitalization, quality or other characteristics. The past year or so was challenging for most active managers, but we think that is about to change.
In all, we think global equity returns for calendar year 2015 may be slightly below their long-term average, but are still likely to compare favorably with other asset classes. As always, we maintain our focus on seeking high-quality equity investments trading at what we believe to be compelling valuations and intend to stay true to our long-term discipline as we seek to navigate potentially volatile markets ahead.
5
PORTFOLIO RESULTS
Goldman Sachs Asia Equity Fund
Investment Objective
The Fund seeks long-term capital appreciation.
Portfolio Management Discussion and Analysis
Below, the Goldman Sachs Fundamental Asia ex Japan Equity Portfolio Management Team discusses the Goldman Sachs Asia Equity Fund’s (the “Fund”) performance and positioning for the six-month period ended April 30, 2015 (the “Reporting Period”).
| Q | | How did the Fund perform during the Reporting Period? |
| A | | During the Reporting Period, the Fund’s Class A, C, Institutional and IR Shares generated cumulative total returns, without sales charges, of 12.33%, 11.91%, 12.59% and 12.50%, respectively. These returns compare to the 10.45% cumulative total return of the Fund’s benchmark, the MSCI® All Country Asia ex-Japan Index (Net, USD, Unhedged) (the “Index”), during the same time period. |
| Q | | What key factors were responsible for the Fund’s performance during the Reporting Period? |
| A | | The Fund outperformed the Index on a relative basis during the Reporting Period, primarily attributable to individual stock selection. From a country perspective, effective stock selection in South Korea, Taiwan and India contributed most positively. Stock selection in China was the only major detractor from the Fund’s relative results during the Reporting Period. |
| Q | | What were some of the Fund’s best-performing individual stocks? |
| A | | The Fund benefited most relative to the Index from holdings in Cheil Industries, Amorepacific and Kweichow Moutai. |
| | | The top individual stock contributor to the Fund’s results during the Reporting Period was Cheil Industries, a South Korean manufacturer and seller of chemicals and electronic materials. Cheil Industries, partially owned by Samsung Electronics, is widely seen as the de facto holding company of Samsung Group, and the stock outperformed the Index during the Reporting Period amid increasing anticipation that the company may indeed become Samsung Group’s holding company in the future. However, as the company’s valuations began to overshoot the fundamentals of its underlying business divisions, we exited from the Fund’s position, taking profits. |
| | | Another significant positive contributor was Amorepacific, a leading cosmetics company in South Korea with approximately 30 brands across cosmetics, personal care and health care. The company, a newly established position for the Fund during the Reporting Period, has been gaining both market and mind share in China against competitors, such as L’Oreal and Estee Lauder, perhaps due to its positioning as an Asian brand catering to the Asian demographic’s needs. (Mind share is the amount of consumer awareness or popularity surrounding a particular product, service or company compared to its competitors.) We believe Amorepacific has significant multi-year growth potential given improving brand awareness in China and further expansion potential into the Southeast Asian market. Furthermore, it has been gaining momentum toward robust revenue growth and margin expansion after successful channel and brand restructuring in both South Korea and China and, in our view, could continue to benefit from the Chinese consumers’ tourism in South Korea. |
| | | Kweichow Moutai, the largest white spirit company in China, positioned at the premium end of the market, was a new position for the Fund during the Reporting Period and a strong contributor to the Fund’s relative results. We initiated the position, as we believed its valuation at the time of purchase was at a significant discount to its domestic and international peers, and we see re-rating potential largely driven by sequential earnings improvement, enforcement of the A-H shares through-train1, and the ongoing state-owned |
| | 1 | | The A-H shares through-train refers to the Shanghai-Hong Kong Stock Connect, a pilot program for establishing mutual stock market access between Mainland China and Hong Kong, announced in April 2014 by Premier Li Keqiang at the Boao Forum for Asia and officially launched in November 2014. The new cross-border investment channel enables individual investors from Hong Kong and overseas to invest directly in designated securities listed on the Shanghai Stock Exchange and domestic investors from Mainland China to invest directly in designated securities listed on the Stock Exchange of Hong Kong, through their respective local brokers for the first time. A shares refers to shares issued by companies incorporated in Mainland China. They are listed on the Shanghai and Shenzhen Stock Exchanges and quoted in renminbi. They are not listed on the Hong Kong Stock Exchange. H shares refers to shares issued by companies incorporated in Mainland China and listed on the Hong Kong Stock Exchange. |
6
PORTFOLIO RESULTS
| | enterprise reform process. Given its unparalleled brand equity and scarcity in supply, Kweichow Moutai may command higher margins versus its peers. Brand equity is defined as the value premium that a company realizes from a product with a recognizable name as compared to its generic equivalent. (Re-rating is when the market changes its view of a company sufficiently to make calculation ratios, such as its price/ earnings ratio, substantially higher or lower.) Following the anti-corruption drive that dampened demand from government sectors, we believe we are seeing a stabilization of channel inventory level and retail prices. We believe this could contribute to the company’s recovery, especially if demand from the private and mass sectors proves resilient. |
| Q | | Which stocks detracted significantly from the Fund’s performance during the Reporting Period? |
| A | | Detracting most from the Fund’s results relative to the Index were positions in Hong Kong-based casino and hotel operator Galaxy Entertainment Group, Chinese web services company Baidu.com and South Korean bank holding company Hana Financial Group. |
| | | Galaxy Entertainment Group, which operates casino, hotel and other entertainment facilities in Macau, detracted most from the Fund’s results. It underperformed the Index during the Reporting Period on a murky outlook for the overall gaming industry in Macau amid a continuing anti-corruption campaign in China. At the end of the Reporting Period, we still considered the company to be better positioned than many of its peers to defend and compete for market share, especially given its new casino opening in the Cotai area. |
| | | Baidu.com detracted from the Fund’s results after a weak quarter ending in March 2015, even as such results were expected given the Chinese renminbi’s depreciation in late February 2015 and the deterioration of the company’s business amidst a growing proportion of mobile traffic. Further, the company’s guidance for the second calendar quarter was not particularly exciting. Still, at the end of the Reporting Period, we maintained our belief that Baidu.com is one of the few names that has built its own closed-loop ecosystem, and therefore, it should be able to maintain its business without external factors or outside aid. In other words, we believe Baidu.com should be able to achieve future growth supported almost solely by the growing number of Chinese Internet users. |
| | | Hana Financial Group underperformed the Index, reflecting the concerns of net interest margin compression going forward given that the central bank of South Korea is expected to further cut its benchmark interest rates. While we expect the South Korean banking sector broadly to continue to be pressured in the months ahead, we also believed at the end of the Reporting Period that Hana Financial Group should be more resilient than some of its peers, should the turnaround of its merged entity with Korea Exchange Bank and the stabilization of its employer and labor union relationship be realized. |
| Q | | Which equity market sectors most significantly affected Fund performance during the Reporting Period? |
| A | | The sectors that contributed most positively to the Fund’s performance relative to the Index were consumer staples, industrials and materials, where stock selection in each boosted relative results. In consumer staples, the Fund’s holding in Amorepacific, mentioned earlier, was the strongest positive contributor. In industrials, a holding in Cheil Industries, also mentioned earlier, boosted results most. In materials, a position in OCI Materials was an outstanding performer. OCI Materials manufactures and supplies various advanced materials and special gases in South Korea and internationally. OCI Materials’ products are used in the manufacturing process of semiconductors, thin film transistor liquid crystal displays (“TFT-LCD”) and solar cells and film deposition. |
| | | The biggest detractors from the Fund’s relative results during the Reporting Period were the financials, information technology and health care sectors. Having an underweighted allocation to financials, which outperformed the Index during the Reporting Period, hurt most. At an individual stock level, Hana Financial Group, mentioned earlier, disappointed most. Weak stock selection drove lagging performance most in the information technology sector, with a position in Baidu.com, also mentioned earlier, the largest detractor from relative returns. Both having an overweighted allocation to and stock selection within the health care sector dampened the Fund’s relative results. The Fund’s position in Aurobindo Pharma, which manufactures generic pharmaceuticals and active pharmaceutical ingredients, detracted most within the health care sector. |
| Q | | How did the Fund use derivatives and similar instruments during the Reporting Period? |
| A | | During the Reporting Period, we did not use derivatives to hedge positions or as part of an active management strategy. |
7
PORTFOLIO RESULTS
| Q | | Did the Fund make any significant purchases or sales during the Reporting Period? |
| A | | In addition to the purchases already mentioned, we initiated a Fund position in China Merchants Bank, a Chinese financials company, during the Reporting Period, in seeking to gain exposure to the Chinese financials industry than for company-specific reasons. The Chinese government and its central bank have been fueling its weak macroeconomic environment by implementing a wide range of accommodative measures, including the cut in banks’ reserve requirement ratio (discussed in detail in the Market Review) and quantitative easing by the People’s Bank of China (“PBOC”) and bond issuance by local governments. We believe quantitative easing in China will help ease concerns about weak loan growth and deteriorating asset quality. In our view, China Merchants Bank, with its exposure to the securities business, should be able to leverage its strength in the capital markets under a more market-oriented financials industry better than its peers. |
| | We sold the Fund’s position in China Cinda Asset Management (H-shares) (“CINDA”), a Chinese asset management firm in the financials sector. With authorities appearing slow to tackle non-performing loans (“NPLs”) within the banking industry, incremental bad debt formation is accelerating, which is forcing the government to address the issue with the intention of spreading out the risk across the broader capital market. In our view, this may require CINDA to pay competitive costs under the new environment. Although we still believe that “bad banks” will play a leading role in absorbing the system’s NPLs, they are now faced with a more challenging situation, where return on invested capital much less clear than before. (“Bad banks” are banks set up to buy the bad loans of a bank with significant nonperforming assets at market price. By transferring the bad assets of an institution to the bad bank, the banks clear their balance sheet of toxic assets but would be forced to take write downs. Shareholders and bondholders stand to lose money from this solution (but not depositors). Banks that become insolvent as a result of the process can be recapitalized, nationalized or liquidated.) |
| | We exited the Fund’s position in Sun Hung Kai Properties, a Hong Kong-based real estate owner, developer and operator. In our view, the Hong Kong property market has already entered into a structural downturn, as it reached the point where inbound travelers from China have no more than an incremental impact on retailers in Hong Kong. Also, we believe property development in China has shown clear deceleration, as consumers’ purchasing power has failed to catch up with supply growth. |
| Q | | Were there any notable changes in the Fund’s weightings during the Reporting Period? |
| A | | Most sector weights are usually established within a relatively narrow range from the Index, as our team prefers to make decisions at the individual stock level, where we believe we can generate more added value. That said, during the Reporting Period, the Fund’s exposure to consumer staples and financials increased, and its allocations to consumer discretionary, information technology and utilities decreased. |
| | Similarly, allocations to countries are directly the result of various stock selection decisions. During the Reporting Period, the Fund’s allocations to Taiwan and Singapore increased, and its exposure to India and Thailand decreased. |
| Q | | How was the Fund positioned relative to the Index at the end of the Reporting Period? |
| A | | At the end of the Reporting Period, the Fund had overweighted exposure to China, the Philippines, South Korea and India compared to the Index. On the same date, the Fund had underweighted exposure relative to the Index to Hong Kong, Singapore, Malaysia and Taiwan and had rather neutral exposure relative to the Index in Thailand and Indonesia. |
| | From a sector allocation perspective, the Fund had overweighted positions relative to the Index in the consumer staples, health care, consumer discretionary and materials sectors at the end of the Reporting Period. On the same date, the Fund had underweighted positions compared to the Index in the financials, telecommunication services, and energy sectors and was relatively neutrally weighted compared to the Index in information technology and industrials. |
| | As always, we remained focused on individual stock selection, with sector and country positioning being a secondary, closely-monitored effect. |
8
FUND BASICS
Asia Equity Fund
as of April 30, 2015
| | | | | | | | | | |
| | PERFORMANCE REVIEW | |
| | | November 1, 2014–April 30, 2015 | | Fund Total Return
(based on NAV)1 | | | MSCI® All Country Asia
ex-Japan Index
(Net, USD, Unhedged)2 | |
| | Class A | | | 12.33 | % | | | 10.45 | % |
| | Class C | | | 11.91 | | | | 10.45 | |
| | Institutional | | | 12.59 | | | | 10.45 | |
| | | Class IR | | | 12.50 | | | | 10.45 | |
| | 1 | | The net asset value (“NAV”) represents the net assets of the class of the Fund (ex-dividend) divided by the total number of shares of the class outstanding. The Fund’s performance assumes the reinvestment of dividends and other distributions. The Fund’s performance does not reflect the deduction of any applicable sales charges. |
| | 2 | | The MSCI® All Country Asia ex-Japan Index (net, USD, unhedged) is a free float-adjusted market capitalization weighted index that is designed to measure the equity market performance of Asia, excluding Japan. The MSCI® All Country Asia ex-Japan Index consists of the following 10 developed and emerging market country indices: China, Hong Kong, India, Indonesia, Korea, Malaysia, Philippines, Singapore, Taiwan, and Thailand. This index is net of dividends re-invested after deduction of withholding taxes, using a tax rate applicable to non-resident institutional investors who do not benefit from double taxation treaties. This series approximates the minimum possible dividend reinvestment. The dividend is reinvested after deduction of withholding tax, applying the rate to nonresident individuals who do not benefit from double taxation treaties. MSCI® Barra uses withholding tax rates applicable to Luxembourg holding companies, as Luxembourg applies the highest rates. It is not possible to invest directly in an index. |
| | | | | | | | | | | | | | | | | | | | | | |
| | STANDARDIZED TOTAL RETURNS3 | |
| | | For the period ended 3/31/15 | | One Year | | | Five Years | | | Ten Years | | | Since Inception | | | Inception Date | |
| | Class A | | | 1.44 | % | | | 4.12 | % | | | 6.16 | % | | | 2.47 | % | | | 7/08/94 | |
| | Class C | | | 5.61 | | | | 4.53 | | | | 5.95 | | | | 1.74 | | | | 8/15/97 | |
| | Institutional | | | 7.77 | | | | 5.74 | | | | 7.18 | | | | 2.54 | | | | 2/02/96 | |
| | | Class IR | | | 7.62 | | | | N/A | | | | N/A | | | | 6.37 | | | | 2/28/14 | |
| | 3 | | The Standardized Total Returns are average annual total returns as of the most recent calendar quarter-end. They assume reinvestment of all distributions at NAV. These returns reflect a maximum initial sales charge of 5.5% for Class A Shares and the assumed contingent deferred sales charge for Class C Shares (1% if redeemed within 12 months of purchase). Because Institutional and Class IR Shares do not involve a sales charge, such a charge is not applied to their Standardized Total Returns. |
The returns set forth in the tables above represent past performance. Past performance does not guarantee future results. The Fund’s investment return and principal value will fluctuate so that an investor’s shares, when redeemed, may be worth more or less than their original cost. Current performance may be lower or higher than the performance quoted above. Please visit our web site at www.GSAMFUNDS.com to obtain the most recent month-end returns. Performance reflects applicable fee waivers and/or expense limitations in effect during the periods shown. In their absence, performance would be reduced. Returns do not reflect the deduction of taxes that a shareholder would pay on Fund distributions or the redemption of Fund shares.
9
FUND BASICS
| | | | | | | | | | |
| | EXPENSE RATIOS4 | |
| | | | | Net Expense Ratio (Current) | | | Gross Expense Ratio (Before Waivers) | |
| | Class A | | | 1.72 | % | | | 2.23 | % |
| | Class C | | | 2.47 | | | | 2.99 | |
| | Institutional | | | 1.31 | | | | 1.86 | |
| | | Class IR | | | 1.44 | | | | 1.99 | |
| | 4 | | The expense ratios of the Fund, both current (net of applicable fee waivers and/or expense limitations) and before waivers (gross of applicable fee waivers and/or expense limitations) are as set forth above according to the most recent publicly available Prospectus for the Fund and may differ from the expense ratios disclosed in the Financial Highlights in this report. Pursuant to a contractual arrangement, the Fund’s waivers and/or expense limitations will remain in place through at least February 29, 2016, and prior to such date the Investment Adviser may not terminate the arrangements without the approval of the Fund’s Board of Trustees. If these arrangements are discontinued in the future, the expense ratios may change without shareholder approval. |
| | | | | | | | | | |
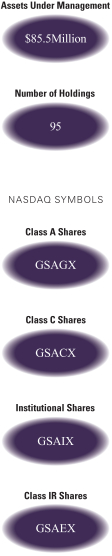
| | TOP TEN HOLDINGS AS OF 4/30/155 |
| | | Holding | | % of Total
Net Assets | | | Line of Business | | Country |
| | Tencent Holdings Ltd. | | | 5.1 | % | | Software & Services | | China |
| | AIA Group Ltd. | | | 4.3 | | | Insurance | | Hong Kong |
| | Kweichow Moutai Co. Ltd. | | | 3.9 | | | Food, Beverage & Tobacco | | China |
| | Industrial & Commercial Bank of China Ltd. Class H | | | 3.4 | | | Banks | | China |
| | China Merchants Bank Co. Ltd. Class H | | | 3.0 | | | Banks | | China |
| | Amorepacific Corp. | | | 2.8 | | | Household & Personal Products | | South Korea |
| | Sino Biopharmaceutical Ltd. | | | 2.6 | | | Pharmaceuticals, Biotechnology
& Life Sciences | | Hong Kong |
| | Taiwan Semiconductor Manufacturing Co. Ltd. | | | 2.5 | | | Semiconductors &
Semiconductor Equipment | | Taiwan |
| | CJ CheilJedang Corp. | | | 2.4 | | | Food, Beverage & Tobacco | | South Korea |
| | | DBS Group Holdings Ltd. | | | 2.3 | | | Banks | | Singapore |
| | 5 | | The top 10 holdings may not be representative of the Fund’s future investments. |
10
FUND BASICS
|
| FUND VS. BENCHMARK SECTOR ALLOCATIONS6 |
| As of April 30, 2015 |
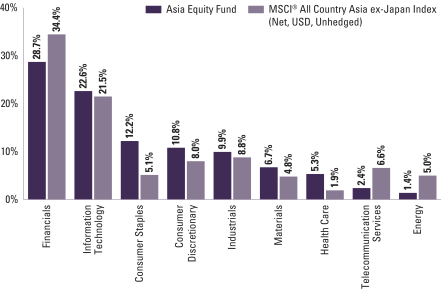
| | 6 | | The Fund is actively managed and, as such, its composition may differ over time. Consequently, the Fund’s overall sector allocations may differ from percentages contained in the graph above. The graph categorizes investments using Global Industry Classification Standard (“GICS”), however, the sector classifications used by the portfolio management team may differ from GICS. The percentage shown for each investment category reflects the value of investments in that category as a percentage of market value. The graph depicts the Fund’s investments but may not represent the Fund’s market exposure due to the exclusion of certain derivatives, if any, as listed in the Additional Investment Information section of the Schedule of Investments. |
11
PORTFOLIO RESULTS
Goldman Sachs BRIC Fund
Investment Objective
The Fund seeks long-term capital appreciation.
Portfolio Management Discussion and Analysis
Below, the Goldman Sachs Fundamental Emerging Markets Equity Portfolio Management Team discusses the Goldman Sachs BRIC Fund’s (the “Fund”) performance and positioning for the six-month period ended April 30, 2015 (the “Reporting Period”).
| Q | | How did the Fund perform during the Reporting Period? |
| A | | During the Reporting Period, the Fund’s Class A, C, Institutional and IR Shares generated cumulative total returns, without sales charges, of 8.77%, 8.33%, 8.92% and 8.91%, respectively. These returns compare to the 9.00% cumulative total return of the Fund’s benchmark, the MSCI® BRIC Index (Net, USD, Unhedged) (the “Index”), during the same period. |
| Q | | What key factors were responsible for the Fund’s performance during the Reporting Period? |
| A | | The Fund produced solid positive absolute returns but modestly underperformed the Index on a relative basis during the Reporting Period. Stock selection and positioning in China and Russia detracted, slightly more than offsetting the positive contribution of effective stock selection in India and Brazil. Having an underweighted allocation to Brazil, which posted double-digit negative returns during the Reporting Period, also helped. |
| Q | | Which stocks detracted significantly from the Fund’s performance during the Reporting Period? |
| A | | Detracting most from the Fund’s results relative to the Index were positions in Russian bank Sberbank, Brazilian insurance and brokerage holding company BB Segurigade and Russian food retailer Magnit. |
| | The Fund’s holding in Sberbank detracted most from the Fund’s relative results during the Reporting Period. Russia’s largest bank was weighed down by the continued impact of sanctions on the nation, prompting us to eliminate the Fund’s position by the end of the Reporting Period. |
| | BB Segurigade detracted from the Fund’s relative returns. The macroeconomic environment in Brazil deteriorated during the Reporting Period, weighing on the Brazilian equity market broadly, and BB Segurigade performed in line with the broader market. Indeed, the company’s performance was weak despite reporting sound fourth quarter 2014 results and reaffirming its 2015 guidance. By the end of the Reporting Period, we had trimmed the Fund’s position in BB Segurigade but maintained a sizable position in the company, as it has been able to increase its market share in new pension contribution and insurance premiums by leveraging the existing client base of Banco do Brasil, its parent company. Magnit, the largest food retailer in Russia, also detracted from the Fund’s relative returns during the Reporting Period. The European and U.S. sanctions on Russia — as well as the drop in oil prices — pushed the Russian economy into recession. The company reported solid results for the fourth quarter of 2014 but was negatively affected by these geopolitical factors and by the sharp fall in the ruble. Still, as the dominant player within the food retail industry in Russia, we believe Magnit can benefit from current weakness by gaining market share using its scale to source cheaper products and by continuing to grow its store footprint. |
| Q | | What were some of the Fund’s best-performing individual stocks? |
| A | | The strongest contributors to the Fund’s performance during the Reporting Period were Indian automotive components supplier Bosch, Hong Kong stock exchange Hong Kong Exchanges & Clearing and Indian non-banking finance company Bajaj Finance. |
| | Bosch outperformed the Index during the Reporting Period due to a pick-up in growth in the passenger cars and heavy commercial vehicle segments of its business. We trimmed the Fund’s position in Bosch following sustained outperformance, but maintained a positive view on the company at the end of the Reporting Period given what we believed was its potential for continued strong growth in an improving demand environment. |
12
PORTFOLIO RESULTS
| | Hong Kong Exchanges & Clearing, Asia’s second largest stock exchange in terms of market capitalization, was a new purchase for the Fund during the Reporting Period. Its stock outperformed the Index during the Reporting Period, as the consensus expects meaningful scaling up of volumes through Shanghai-Hong Kong Stock Connect1 in 2015, which could be a catalyst for strong financial performance. |
| | Bajaj Finance, an Indian non-banking finance company engaged in consumer finance, small and medium enterprise finance and commercial lending, was a strong contributor to the Fund’s relative results. The company performed well as measured by loan growth, margins and asset quality relative to its peers. Improving consumer sentiment and a strong outlook on consumer durable sales provided a positive backdrop to Bajaj Finance’s consumer lending business. While we trimmed the Fund’s position in Bajaj Finance, taking some profits during the first quarter of 2015, we maintained an overweight position in the company based on what we considered to be its healthy return ratios and attractive valuations. |
| Q | | Which equity market sectors most significantly affected Fund performance during the Reporting Period? |
| A | | Weak stock selection in the financials, information technology and industrials sectors detracted most from the Fund’s performance relative to the Index during the Reporting Period. At an individual stock level, the Fund’s position in Sberbank, Russia’s largest bank, already mentioned, was the largest detractor within the financials sector. Within information technology, the Fund’s position in Alibaba, the Chinese e-commerce giant, detracted most from performance during the Reporting Period. In industrials, the Fund’s holding in Globaltrans Investment, a company engaged in transportation and logistics, detracted most from returns. |
| | On the positive side, effective stock selection in consumer discretionary boosted the Fund’s results most during the Reporting Period. Notably, the Fund’s holding in Bosch, mentioned earlier, was the strongest contributor within the consumer discretionary sector. Additionally, having underweighted allocations to the energy and materials sectors, each of which significantly underperformed the Index during the Reporting Period, contributed positively to the Fund’s relative results. To a more modest degree, stock selection within energy and materials also added value. In energy, the Fund’s holding in PetroBras, the Brazilian multinational energy corporation, was the strongest positive contributor. In materials, the Fund’s position in Alrosa, a Russian group of diamond mining companies, was a particularly strong performer. |
| Q | | How did the Fund use derivatives and similar instruments during the Reporting Period? |
| A | | During the Reporting Period, the Fund gained exposure to select stocks through equity-linked notes and participatory notes. |
| Q | | Did the Fund make any significant purchases or sales during the Reporting Period? |
| A | | In addition to the purchase of Hong Kong Exchanges & Clearing, mentioned earlier, we initiated a Fund position in Kweichow Moutai, the largest white spirit company in China, positioned at the premium end of the market. We initiated the position, as we believed its valuation at the time of purchase was at a significant discount to its domestic and international peers, and we see re-rating potential largely driven by sequential earnings improvement, enforcement of the A-H shares through-train1, and the ongoing state-owned enterprise reform process. Given its unparalleled brand equity and scarcity in supply, Kweichow Moutai may command higher margins versus its peers. Brand equity is defined as the value premium that a company realizes from a product with a recognizable name as compared to its generic equivalent. (Re-rating is when the market changes its view of a company sufficiently to make calculation ratios, such as its price/earnings ratio, substantially higher or lower.) Following the anti-corruption drive that dampened demand from government sectors, we believe we are seeing a stabilization of channel inventory level and retail prices. We believe this could contribute to the company’s recovery, especially if demand from the private and mass sector proves resilient. |
| | 1 | | The A-H shares through-train refers to the Shanghai-Hong Kong Stock Connect, a pilot program for establishing mutual stock market access between Mainland China and Hong Kong, announced in April 2014 by Premier Li Keqiang at the Boao Forum for Asia and officially launched in November 2014. The new cross-border investment channel enables individual investors from Hong Kong and overseas to invest directly in designated securities listed on the Shanghai Stock Exchange and domestic investors from Mainland China to invest directly in designated securities listed on the Stock Exchange of Hong Kong, through their respective local brokers for the first time. A shares refers to shares issued by companies incorporated in Mainland China. They are listed on the Shanghai and Shenzhen Stock Exchanges and quoted in renminbi. They are not listed on the Hong Kong Stock Exchange. H shares refers to shares issued by companies incorporated in Mainland China and listed on the Hong Kong Stock Exchange. |
13
PORTFOLIO RESULTS
| | | As already mentioned, we trimmed the Fund’s position in BB Segurigade and sold its holding in Sberbank during the Reporting Period. |
| Q | | Were there any notable changes in the Fund’s weightings during the Reporting Period? |
| A | | Most sector weights are usually established within a narrow range from the Index, as our team prefers to make decisions at the individual stock level, where we believe we can generate more added value. That said, during the Reporting Period, the Fund’s exposure relative to the Index in consumer staples, telecommunication services and financials increased, and its allocations relative to the Index to information technology, industrials and consumer discretionary decreased. |
| | | Resulting from various stock selection decisions, the Fund’s exposure relative to the Index to China and Brazil increased, and its allocations relative to the Index to India and Russia decreased. |
| Q | | Were there any changes to the Fund’s portfolio management team during the Reporting Period? |
| A | | Effective early March 2015, Prashant Khemka, CFA, Managing Director and Chief Investment Officer of Emerging Markets Equity, was named as a portfolio manager of the Fund. Basak Yavuz, CFA, Executive Director, was also named as a portfolio manager for the Fund. Basak has been with the Fundamental Equity team since 2011 and brings 17 years of investment experience in both emerging and frontier markets. Alina Chiew, CFA, Managing Director, will no longer be a portfolio manager of the Fund. Alina will continue to serve as Head of the Greater China Equity Team. |
| Q | | How was the Fund positioned relative to the Index at the end of the Reporting Period? |
| A | | At the end of the Reporting Period, the Fund had overweighted exposure to India, underweighted exposure to China and Brazil and a rather neutral exposure relative to the Index in Russia. |
| | | From a sector perspective, the Fund had overweighted allocations to consumer staples, health care, information technology, consumer discretionary and financials compared to the Index at the end of the Reporting Period. On the same date, the Fund had underweighted exposure to the energy, telecommunication services, materials, utilities and industrials sectors. |
| | | As always, we remained focused on individual stock selection, with sector and country positioning being a secondary, closely-monitored effect. |
14
FUND BASICS
BRIC Fund
as of April 30, 2015
| | | | | | | | | | |
| | PERFORMANCE REVIEW | |
| | | November 1, 2014–April 30, 2015 | | Fund Total Return
(based on NAV)1 | | | MSCI® BRIC Index
(Net, USD, Unhedged)2 | |
| | Class A | | | 8.77 | % | | | 9.00 | % |
| | Class C | | | 8.33 | | | | 9.00 | |
| | Institutional | | | 8.92 | | | | 9.00 | |
| | | Class IR | | | 8.91 | | | | 9.00 | |
| | 1 | | The net asset value (“NAV”) represents the net assets of the class of the Fund (ex-dividend) divided by the total number of shares of the class outstanding. The Fund’s performance assumes the reinvestment of dividends and other distributions. The Fund’s performance does not reflect the deduction of any applicable sales charges. |
| | 2 | | The MSCI® BRIC Index (Net, USD, Unhedged) is a free float-adjusted market capitalization weighted index that is designed to measure the equity market performance of the following four emerging market country indices: Brazil, Russia, India and China. This series approximates the minimum possible dividend reinvestment. The dividend is reinvested after deduction of withholding tax, applying the rate to non-resident individuals who do not benefit from double taxation treaties. MSCI® Barra uses withholding tax rates applicable to Luxembourg holding companies, as Luxembourg applies the highest rates. It is not possible to invest directly in an index. |
| | | | | | | | | | | | | | | | | | |
| | STANDARDIZED TOTAL RETURNS3 | |
| | | For the period ended 3/31/15 | | One Year | | | Five Years | | | Since Inception | | | Inception Date | |
| | Class A | | | -0.86 | % | | | -2.56 | % | | | 3.45 | % | | | 6/30/06 | |
| | Class C | | | 3.11 | | | | -2.19 | | | | 3.33 | | | | 6/30/06 | |
| | Institutional | | | 5.38 | | | | -1.05 | | | | 4.53 | | | | 6/30/06 | |
| | | Class IR | | | 5.18 | | | | N/A | | | | -0.11 | | | | 8/31/10 | |
| | 3 | | The Standardized Total Returns are average annual total returns as of the most recent calendar quarter-end. They assume reinvestment of all distributions at NAV. These returns reflect a maximum initial sales charge of 5.5% for Class A Shares and the assumed contingent deferred sales charge for Class C Shares (1% if redeemed within 12 months of purchase). Because Institutional and Class IR Shares do not involve a sales charge, such a charge is not applied to their Standardized Total Returns. |
The returns set forth in the tables above represent past performance. Past performance does not guarantee future results. The Fund’s investment return and principal value will fluctuate so that an investor’s shares, when redeemed, may be worth more or less than their original cost. Current performance may be lower or higher than the performance quoted above. Please visit our web site at www.GSAMFUNDS.com to obtain the most recent month-end returns. Performance reflects applicable fee waivers and/or expense limitations in effect during the periods shown. In their absence, performance would be reduced. Returns do not reflect the deduction of taxes that a shareholder would pay on Fund distributions or the redemption of Fund shares.
15
FUND BASICS
| | | | | | | | | | |
| | EXPENSE RATIOS4 | |
| | | | | Net Expense Ratio (Current) | | | Gross Expense Ratio (Before Waivers) | |
| | Class A | | | 1.66 | % | | | 2.04 | % |
| | Class C | | | 2.41 | | | | 2.79 | |
| | Institutional | | | 1.26 | | | | 1.63 | |
| | | Class IR | | | 1.41 | | | | 1.79 | |
| | 4 | | The expense ratios of the Fund, both current (net of applicable fee waivers and/or expense limitations) and before waivers (gross of applicable fee waivers and/or expense limitations) are as set forth above according to the most recent publicly available Prospectus for the Fund and may differ from the expense ratios disclosed in the Financial Highlights in this report. Pursuant to a contractual arrangement, the Fund’s waivers and/or expense limitations will remain in place through at least February 29, 2016, and prior to such date the Investment Adviser may not terminate the arrangements without the approval of the Fund’s Board of Trustees. If these arrangements are discontinued in the future, the expense ratios may change without shareholder approval. |
| | | | | | | | | | |
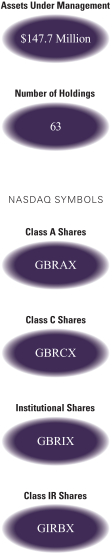
| | TOP TEN HOLDINGS AS OF 4/30/155 |
| | | Holding | | % of Total
Net Assets | | | Line of Business | | Country |
| | Tencent Holdings Ltd. | | | 9.2 | % | | Software & Services | | China |
| | iShares China Large-Cap ETF | | | 4.2 | | | Exchange Traded Fund | | United States |
| | Agricultural Bank of China Ltd. Class H | | | 3.8 | | | Banks | | China |
| | Industrial & Commercial Bank of China Ltd. Class H | | | 3.6 | | | Banks | | China |
| | Kweichow Moutai Co. Ltd. | | | 3.5 | | | Food, Beverage & Tobacco | | China |
| | BB Seguridade Participacoes SA | | | 3.1 | | | Insurance | | Brazil |
| | Sino Biopharmaceutical Ltd. | | | 3.0 | | | Pharmaceuticals,
Biotechnology & Life
Sciences | | Hong Kong |
| | AMBEV SA | | | 2.9 | | | Food, Beverage & Tobacco | | Brazil |
| | China Construction Bank Corp. Class H | | | 2.9 | | | Banks | | China |
| | | Hong Kong Exchanges and Clearing Ltd. | | | 2.7 | | | Diversified Financials | | Hong Kong |
| | 5 | | The top 10 holdings may not be representative of the Fund’s future investments. |
16
FUND BASICS
|
| FUND VS. BENCHMARK SECTOR ALLOCATIONS6 |
| As of April 30, 2015 |
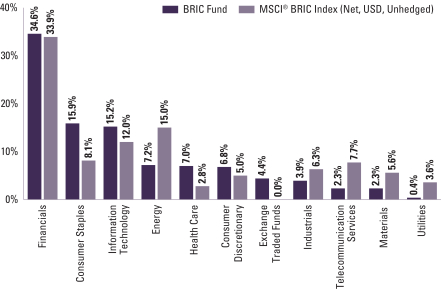
| | 6 | | The Fund is actively managed and, as such, its composition may differ over time. Consequently, the Fund’s overall sector allocations may differ from percentages contained in the graph above. The graph categorizes investments using Global Industry Classification Standard (“GICS”), however, the sector classifications used by the portfolio management team may differ from GICS. Underlying sector allocations of exchange traded funds held by the Fund are not reflected in the graph above. The percentage shown for each investment category reflects the value of investments in that category as a percentage of market value. The graph depicts the Fund’s investments but may not represent the Fund’s market exposure due to the exclusion of certain derivatives, if any, as listed in the Additional Investment Information section of the Schedule of Investments. |
17
PORTFOLIO RESULTS
Goldman Sachs Emerging Markets Equity Fund
Investment Objective
The Fund seeks long-term capital appreciation.
Portfolio Management Discussion and Analysis
Below, the Goldman Sachs Fundamental Emerging Markets Equity Portfolio Management Team discusses the Goldman Sachs Emerging Markets Equity Fund’s (the “Fund”) performance and positioning for the six-month period ended April 30, 2015 (the “Reporting Period”).
| Q | | How did the Fund perform during the Reporting Period? |
| A | | During the Reporting Period, the Fund’s Class A, C, Institutional, Service and IR Shares generated cumulative total returns, without sales charges, of 6.50%, 6.05%, 6.67%, 6.44% and 6.64%, respectively. These returns compare to the 3.92% cumulative total return of the Fund’s benchmark, the MSCI® Emerging Markets Index (Net, USD, Unhedged) (the “Index”), during the same period. |
| Q | | What key factors were responsible for the Fund’s performance during the Reporting Period? |
| A | | The Fund outperformed the Index on a relative basis during the Reporting Period. Effective stock selection in India, South Korea and Taiwan benefited the Fund’s performance most. Such positive contributors were only partially offset by the detracting effect of weak stock selection in China and Russia. Having exposure to Georgia, which is not a component of the Index and which significantly underperformed the Index, also hurt. |
| Q | | What were some of the Fund’s best-performing individual stocks? |
| A | | The strongest contributors to the Fund’s performance during the Reporting Period were Cheil Industries, PCHome Online and Hong Kong Exchanges & Clearing. |
| | | The top individual stock contributor to the Fund’s results during the Reporting Period was Cheil Industries, a South Korean manufacturer and seller of chemicals and electronic materials. Cheil Industries, partially owned by Samsung Electronics, is widely seen as the de facto holding company of Samsung Group, and the stock outperformed the Index during the Reporting Period amid increasing anticipation that the company may indeed become Samsung Group’s holding company in the future. However, as the company’s valuations began to overshoot the fundamentals of its underlying business divisions, we exited from the Fund’s position, taking profits. |
| | | PCHome Online, a leading e-commerce service provider in Taiwan, was a key positive contributor to the Fund’s results during the Reporting Period. The company outperformed the Index on optimism surrounding warehouse additions, the launch of PCHomestore (an online cosmetics store) and faster growth in its consumer to consumer platform, known as Ruten. |
| | | Hong Kong Exchanges & Clearing, Asia’s second largest stock exchange in terms of market capitalization, was a new purchase for the Fund during the Reporting Period. Its stock outperformed the Index during the Reporting Period, as the consensus expects meaningful scaling up of volumes through Shanghai-Hong Kong Stock Connect1 in 2015, which could be a catalyst for strong financial performance. |
| Q | | Which stocks detracted significantly from the Fund’s performance during the Reporting Period? |
| A | | Detracting most from the Fund’s results relative to the Index were positions in Sberbank, Samsung Electronics and Galaxy Entertainment. |
| | 1 | | The A-H shares through-train refers to the Shanghai-Hong Kong Stock Connect, a pilot program for establishing mutual stock market access between Mainland China and Hong Kong, announced in April 2014 by Premier Li Keqiang at the Boao Forum for Asia and officially launched in November 2014. The new cross-border investment channel enables individual investors from Hong Kong and overseas to invest directly in designated securities listed on the Shanghai Stock Exchange and domestic investors from Mainland China to invest directly in designated securities listed on the Stock Exchange of Hong Kong, through their respective local brokers for the first time. A shares refers to shares issued by companies incorporated in Mainland China. They are listed on the Shanghai and Shenzhen Stock Exchanges and quoted in renminbi. They are not listed on the Hong Kong Stock Exchange. H shares refers to shares issued by companies incorporated in Mainland China and listed on the Hong Kong Stock Exchange. |
18
PORTFOLIO RESULTS
| | | The Fund’s holding in Sberbank detracted most from the Fund’s relative results during the Reporting Period. Russia’s largest bank was weighed down by the continued impact of sanctions on the nation, prompting us to eliminate the Fund’s position by the end of the Reporting Period. |
| | | South Korean electronics equipment and products manufacturer, Samsung Electronics, detracted from relative results during the Reporting Period driven by the Fund’s underweighted position in the stock. The stock performed strongly during the Reporting Period despite reporting disappointing third quarter 2014 results, impacted, in turn, by a slump in operating margins. Its management guided to higher earnings in the fourth quarter of 2014, and the market was pricing in strong dynamic random-access memory (“DRAM”) growth in 2015. Positive analyst sentiment provided a catalyst to the company’s share price performance. |
| | | Galaxy Entertainment Group is a Hong Kong-based operator of casino, hotel and other entertainment facilities in Macau. It underperformed the Index during the Reporting Period on a murky outlook for the overall gaming industry in Macau amid a continuing anti-corruption campaign in China. At the end of the Reporting Period, we still considered the company to be better positioned than many of its peers to defend and compete for market share, especially given its new casino opening in the Cotai area. |
| Q | | Which equity market sectors most significantly affected Fund performance during the Reporting Period? |
| A | | Relative to the Index, strong stock selection within the consumer staples, industrials and consumer discretionary sectors contributed most positively to the Fund’s performance. In consumer staples, the Fund’s holding in Amorepacific, a leading cosmetic, personal care and health care company in South Korea, was the strongest contributor. In industrials, the Fund’s position in Cheil Industries, already mentioned, was an outstanding performer. In consumer discretionary, the Fund’s holding in Bosch, an Indian automotive components supplier, boosted Fund results most. |
| | | Conversely, weak stock selection in financials, health care and materials detracted most from the Fund’s relative results during the Reporting Period. In financials, the Fund’s position in Sberbank, already mentioned, was the largest detractor from relative returns. In health care, the Fund’s position in Hong Kong’s Dawnrays Pharmaceutical Holdings, principally engaged in the development, manufacturing and sales of cephalosporin antibiotics and system specific medicines, was the biggest disappointment. In materials, the Fund’s position in Mexichem, a Mexican company producing and selling chemical products, detracted most from returns. |
| Q | | How did the Fund use derivatives and similar instruments during the Reporting Period? |
| A | | During the Reporting Period, the Fund used equity-linked notes and participatory notes to gain exposure to select stocks. |
| Q | | Did the Fund make any significant purchases or sales during the Reporting Period? |
| A | | In addition to the purchase of Hong Kong Exchanges & Clearing, mentioned earlier, we initiated a Fund position in Kweichow Moutai, the largest white spirit company in China, positioned at the premium end of the market. We initiated the position, as we believed its valuation at the time of purchase was at a significant discount to its domestic and international peers, and we see re-rating potential largely driven by sequential earnings improvement, enforcement of the A-H shares through-train1, and the ongoing state-owned enterprise reform process. Given its unparalleled brand equity and scarcity in supply, Kweichow Moutai may command higher margins versus its peers. Brand equity is defined as the value premium that a company realizes from a product with a recognizable name as compared to its generic equivalent. (Re-rating is when the market changes its view of a company sufficiently to make calculation ratios, such as its price/ earnings ratio, substantially higher or lower.) Following the anti-corruption drive that dampened demand from government sectors, we believe we are seeing a stabilization of channel inventory level and retail prices. We believe this could contribute to the company’s recovery, especially if demand from the private and mass sectors proves resilient. |
| | | We established a Fund position in Amorepacific in the consumer staples sector. A leading cosmetics company in South Korea with approximately 30 brands across cosmetics, personal care and health care, Amorepacific has been gaining both market and mind share in China against competitors, such as L’Oreal and Estee Lauder, perhaps due to its positioning as an Asian brand catering to the Asian demographic’s needs. We believe Amorepacific has significant multi-year growth potential given improving brand awareness in China and further expansion potential into the Southeast Asian market. Furthermore, it has been gaining momentum toward robust revenue growth and |
19
PORTFOLIO RESULTS
| | margin expansion after successful channel and brand restructuring in both South Korea and China and, in our view, could continue to benefit from the Chinese consumers’ tourism in South Korea. |
| | | We exited the Fund’s position in Hanjin Kal within the South Korean industrials sector. Hanjin Kal is a holding company with subsidiaries in the South Korean travel industry, including airline, hotel, travel-related services and real estate. We believed Hanjin Kal has been a direct beneficiary of strong tourism in South Korea, and its stock significantly outperformed the Index during the Reporting Period. We decided to sell the Fund’s position, taking profits, as its valuation began to seem rich, in our view, relative to other opportunities in this sector. |
| | | We eliminated the Fund’s position in Qualicorp, a company that operates as a healthcare benefits administrator and health management services provider in Brazil. Brazilian equities broadly suffered during the first quarter of 2015, led by the health care sector. Qualicorp, in particular, underperformed, and thus we made the decision to sell. |
| Q | | Were there any notable changes in the Fund’s weightings during the Reporting Period? |
| A | | Most sector weights are usually established within a narrow range from the Index, as our team prefers to make decisions at the individual stock level, where we believe we can generate more added value. That said, during the Reporting Period, the Fund’s exposure relative to the Index to consumer staples, financials and telecommunication services increased, and its allocations relative to the Index to information technology, industrials and utilities decreased. |
| | | Similarly, allocations to countries are directly the result of various stock selection decisions. As such, the Fund’s exposure relative to the Index in Taiwan, Singapore and Greece increased, and its allocations relative to the Index to South Korea, India and China decreased. |
| Q | | Were there any changes to the Fund’s portfolio management team during the Reporting Period? |
| A | | Effective early March 2015, Prashant Khemka, CFA, Managing Director and Chief Investment Officer of Emerging Markets Equity, was named as a portfolio manager of the Fund. Basak Yavuz, CFA, Executive Director, was also named as a portfolio manager for the Fund. Basak has been with the Fundamental Equity team since 2011 and brings 17 years of investment experience in both emerging and frontier markets. Alina Chiew, CFA, Managing Director, will no longer be a portfolio manager of the Fund. Alina will continue to serve as Head of the Greater China Equity Team. |
| Q | | How was the Fund positioned relative to the Index at the end of the Reporting Period? |
| A | | At the end of the Reporting Period, the Fund had overweighted exposures to India, Peru, Taiwan and Indonesia and underweighted exposures to South Korea, China, Malaysia and South Africa relative to the Index. On the same date, the Fund was relatively neutrally weighted to the Index in the remaining components of the Index and had exposure to several equity markets that are not components of the Index, including Singapore and Georgia. |
| | | From a sector allocation perspective, the Fund had overweighted positions relative to the Index in consumer discretionary, consumer staples, health care, financials and information technology at the end of the Reporting Period. The Fund had underweighted positions compared to the Index in the energy, telecommunication services, materials, utilities and industrials sectors at the end of the Reporting Period. |
| | | As always, we remained focused on individual stock selection, with sector and country positioning being a secondary, closely-monitored effect. |
20
FUND BASICS
Emerging Markets Equity Fund
as of April 30, 2015
| | | | | | | | | | |
| | PERFORMANCE REVIEW | |
| | | November 1, 2014–April 30, 2015 | | Fund Total Return
(based on NAV)1 | | | MSCI® Emerging
Markets Index
(Net, USD, Unhedged)2 | |
| | Class A | | | 6.50 | % | | | 3.92 | % |
| | Class C | | | 6.05 | | | | 3.92 | |
| | Institutional | | | 6.67 | | | | 3.92 | |
| | Service | | | 6.44 | | | | 3.92 | |
| | | Class IR | | | 6.64 | | | | 3.92 | |
| | 1 | | The net asset value (“NAV”) represents the net assets of the class of the Fund (ex-dividend) divided by the total number of shares of the class outstanding. The Fund’s performance assumes the reinvestment of dividends and other distributions. The Fund’s performance does not reflect the deduction of any applicable sales charges. |
| | 2 | | The MSCI® Emerging Markets Index (Net, USD, Unhedged) is a free float-adjusted market capitalization index that is designed to measure equity market performance of emerging markets. As of January 1, 2015 the MSCI® Emerging Markets Index consisted of the following 21 emerging market country indices: Brazil, Chile, China, Colombia, Czech Republic, Egypt, Greece, Hungary, India, Indonesia, Korea, Malaysia, Mexico, Peru, Philippines, Poland, Russia, South Africa, Taiwan, Thailand, and Turkey. This Index offers an exhaustive representation of the emerging markets by targeting all companies with a market capitalization within the top 85% of their investable equity universe, subject to a global minimum size requirement. It is based on the Global Investable Market Indices methodology. This series approximates the minimum possible dividend reinvestment. The dividend is reinvested after deduction of withholding tax, applying the rate to non-resident individuals who do not benefit from double taxation treaties. MSCI® Barra uses withholding tax rates applicable to Luxembourg holding companies, as Luxembourg applies the highest rates. It is not possible to invest directly in an index. |
| | | | | | | | | | | | | | | | | | | | |
| | STANDARDIZED TOTAL RETURNS3 |
| | | For the period ended 3/31/15 | | One Year | | | Five Years | | | Ten Years | | | Since Inception | | | Inception Date |
| | Class A | | | -0.62 | % | | | 0.40 | % | | | 6.36 | % | | | 6.02 | % | | 12/15/97 |
| | Class C | | | 3.47 | | | | 0.79 | | | | 6.16 | | | | 5.68 | | | 12/15/97 |
| | Institutional | | | 5.65 | | | | 1.95 | | | | 7.39 | | | | 6.90 | | | 12/15/97 |
| | Service | | | 5.15 | | | | 1.44 | | | | 6.86 | | | | 6.25 | | | 12/15/97 |
| | | Class IR | | | 5.44 | | | | N/A | | | | N/A | | | | 2.97 | | | 8/31/10 |
| | 3 | | The Standardized Total Returns are average annual total returns as of the most recent calendar quarter-end. They assume reinvestment of all distributions at NAV. These returns reflect a maximum initial sales charge of 5.5% for Class A Shares assumed contingent deferred sales charge for Class C Shares (1% if redeemed within 12 months of purchase). Because Institutional, Service and Class IR Shares do not involve a sales charge, such a charge is not applied to their Standardized Total Returns. |
The returns set forth in the tables above represent past performance. Past performance does not guarantee future results. The Fund’s investment return and principal value will fluctuate so that an investor’s shares, when redeemed, may be worth more or less than their original cost. Current performance may be lower or higher than the performance quoted above. Please visit our web site at www.GSAMFUNDS.com to obtain the most recent month-end returns. Performance reflects applicable fee waivers and/or expense limitations in effect during the periods shown. In their absence, performance would be reduced. Returns do not reflect the deduction of taxes that a shareholder would pay on Fund distributions or the redemption of Fund shares.
21
FUND BASICS
| | | | | | | | | | |
| | EXPENSE RATIOS4 | |
| | | | | Net Expense Ratio (Current) | | | Gross Expense Ratio (Before Waivers) | |
| | Class A | | | 1.64 | % | | | 1.94 | % |
| | Class C | | | 2.40 | | | | 2.69 | |
| | Institutional | | | 1.24 | | | | 1.54 | |
| | Service | | | 1.75 | | | | 2.04 | |
| | | Class IR | | | 1.40 | | | | 1.69 | |
| | 4 | | The expense ratios of the Fund, both current (net of applicable fee waivers and/or expense limitations) and before waivers (gross of applicable fee waivers and/or expense limitations) are as set forth above according to the most recent publicly available Prospectus for the Fund and may differ from the expense ratios disclosed in the Financial Highlights in this report. Pursuant to a contractual arrangement, the Fund’s waivers and/or expense limitations will remain in place through at least February 29, 2016, and prior to such date the Investment Adviser may not terminate the arrangements without the approval of the Fund’s Board of Trustees. If these arrangements are discontinued in the future, the expense ratios may change without shareholder approval. |
| | | | | | | | | | |
| | TOP TEN HOLDINGS AS OF 4/30/155 |
| | | Holding | | % of Total
Net Assets | | | Line of Business | | Country |
| | Tencent Holdings Ltd. | | | 3.2 | % | | Software & Services | | China |
| | Kweichow Moutai Co. Ltd. | | | 3.0 | | | Food, Beverage & Tobacco | | China |
| | Taiwan Semiconductor Manufacturing Co. Ltd. | | | 3.0 | | | Semiconductors &
Semiconductor Equipment | | Taiwan |
| | PChome Online, Inc. | | | 2.8 | | | Software & Services | | Taiwan |
| | Amorepacific Corp. | | | 2.5 | | | Household & Personal Products | | South Korea |
| | Airports of Thailand PCL | | | 2.0 | | | Transportation | | Thailand |
| | Naspers Ltd. Class N | | | 1.8 | | | Media | | South Africa |
| | PT Bank Central Asia Tbk | | | 1.6 | | | Banks | | Indonesia |
| | BB Seguridade Participacoes SA | | | 1.5 | | | Insurance | | Brazil |
| | | Hong Kong Exchanges and Clearing Ltd. | | | 1.5 | | | Diversified Financials | | Hong Kong |
| | 5 | | The top 10 holdings may not be representative of the Fund’s future investments. |
22
FUND BASICS
|
| FUND VS. BENCHMARK SECTOR ALLOCATIONS6 |
| As of April 30, 2015 |
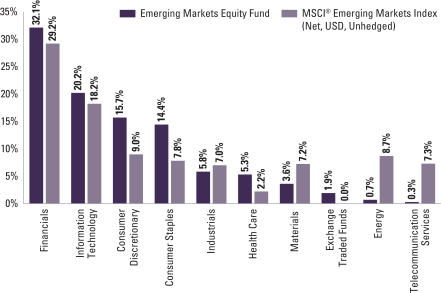
| | 6 | | The Fund is actively managed and, as such, its composition may differ over time. Consequently, the Fund’s overall sector allocations may differ from percentages contained in the graph above. The graph categorizes investments using Global Industry Classification Standard (“GICS”), however, the sector classifications used by the portfolio management team may differ from GICS. Underlying sector allocations of exchange traded funds held by the Fund are not reflected in the graph above. The percentage shown for each investment category reflects the value of investments in that category as a percentage of market value. The graph depicts the Fund’s investments but may not represent the Fund’s market exposure due to the exclusion of certain derivatives, if any, as listed in the Additional Investment Information section of the Schedule of Investments. |
23
PORTFOLIO RESULTS
Goldman Sachs N-11 Equity Fund
Investment Objective
The Fund seeks long-term capital appreciation.
Portfolio Management Discussion and Analysis
Below, the Goldman Sachs Fundamental Emerging Markets Equity Portfolio Management Team discusses the Goldman Sachs N-11 Equity Fund’s (the “Fund”) performance and positioning for the six-month period ended April 30, 2015 (the “Reporting Period”).
| Q | | How did the Fund perform during the Reporting Period? |
| A | | During the Reporting Period, the Fund’s Class A, C, Institutional and IR Shares generated cumulative total returns, without sales charges, of -7.19%, -7.46%, -6.89% and -6.98%, respectively. These returns compare to the -6.56% cumulative total return of the Fund’s benchmark, the MSCI® Next 11 ex Iran GDP Weighted Index (Net, USD, Unhedged) (the “Index”), during the same period. |
| Q | | What key factors were responsible for the Fund’s performance during the Reporting Period? |
| A | | The Fund modestly underperformed the Index during the Reporting Period. The Fund’s stock selection and positioning in Mexico, Pakistan and Indonesia detracted most. Such detractors were only partially offset by the positive contributions of effective stock selection in South Korea, Turkey and the Philippines. Having an overweighted allocation to the Philippines, which significantly outpaced the Index during the Reporting Period, also helped. |
| Q | | Which stocks detracted significantly from the Fund’s performance during the Reporting Period? |
| A | | Detracting most from the Fund’s results relative to the Index were positions in Genomma Lab Internacional, Telecom Egypt and Grupo Financiero Banorte. |
| | Genomma Lab Internacional, a Mexican specialty pharmaceuticals company, was the largest detractor from the Fund’s relative results during the Reporting Period. The company missed consensus expectations with its earnings declining, as they were negatively impacted by destocking, or inventory reduction, in the pharmaceuticals industry and by currency effects. |
| | Telecom Egypt, an Egyptian telecommunications company, detracted from the Fund’s results as it missed consensus expectations. The company has been facing structural pressures in its fixed line business and has been unable to grow as fast as initially planned in other business lines, mainly mobile, due to regulatory uncertainties. |
| | Grupo Financiero Banorte, a financial institution in Mexico, saw its shares decline during the Reporting Period. We sold the Fund’s position in the bank early in the Reporting Period, as there were several management changes at the start of the fourth quarter of 2014, as both its chairman and chief executive officer were replaced. We felt these changes impacted our investment thesis and so we decided to exit the position. |
| Q | | What were some of the Fund’s best-performing individual stocks? |
| A | | The strongest contributors to the Fund’s performance during the Reporting Period were Amorepacific, Hanssem and Engro. |
| | Amorepacific, a leading cosmetics company in South Korea with approximately 30 brands across cosmetics, personal care and health care, was the top positive contributor to the Fund’s relative results during the Reporting Period. The company, a newly established position for the Fund during the Reporting Period, has been gaining both market and mind share in China against competitors, such as L’Oreal and Estee Lauder, perhaps due to its positioning as an Asian brand catering to the Asian demographic’s needs. We believe Amorepacific has significant multi-year growth potential given improving brand awareness in China and further expansion potential into the Southeast Asian market. Furthermore, it has been gaining momentum toward robust revenue growth and margin expansion after successful channel and brand restructuring in both South Korea and China and, in our view, could continue to benefit from the Chinese consumers’ tourism in South Korea. |
24
PORTFOLIO RESULTS
| | Hanssem is a domestic furniture company based in South Korea and has been the main consolidator of a fragmented furniture market in the country. During the Reporting Period, Hanssem benefited from strong top-line, or revenue, growth. The company also remained an industry leader in terms of earnings growth, return on equity and valuation. |
| | Engro is a Pakistani public multinational corporation based in Karachi with subsidiaries involved in production of fertilizers, foods, chemicals, energy and petrochemicals. Its stock performed well during the Reporting Period, as the company announced strong results with better top-line, or revenue, growth and profitability. At the end of the Reporting Period, we continued to like the stock over the long term given positive developments within its foods and fertilizer subsidiaries. |
| Q | | Which equity market sectors most significantly affected Fund performance during the Reporting Period? |
| A | | Relative to the Index, weak stock selection within the energy, health care and industrials sectors detracted most from the Fund’s performance during the Reporting Period. Notable individual drivers of underperformance in the energy sector were holdings in Tupras, a Turkish oil refiner, and Oil & Gas Development Company, a Pakistani oil and gas exploration and development company. In health care, holdings in the pharmaceutical biotechnology and life sciences industries hurt most, with positions in Genomma Lab Internacional, already mentioned, and South Korea’s Celltrion especially disappointing. In industrials, exposure to the capital goods segment of the market dampened results most, with notable individual drivers of underperformance being Mexico’s Alfa and Indonesia’s Wijaya Karya. |
| | Conversely, strong stock selection within consumer staples, consumer discretionary and financials contributed most positively to the Fund’s performance. In consumer staples, holdings within the food and beverage industry performed particularly well, with South Korean food and bio business company, CJ Cheil Jedang Garam, being the largest positive contributor to results within the industry. A holding in Amorepacific, already mentioned, also performed especially strongly. In consumer discretionary, holdings within the consumer durables and apparel industries helped most, with Hanssem, mentioned earlier, and Tofas Otomobil, a Turkish automaker, the strongest individual performers. In financials, positions within the banks industry boosted results most, with holdings in the Philippines’ Metropolitan Bank and Turkey’s IS Bank being the strongest performers. |
| Q | | How did the Fund use derivatives and similar instruments during the Reporting Period? |
| A | | During the Reporting Period, the Fund gained exposure to select stocks through equity-linked notes and participatory notes. |
| Q | | Did the Fund make any significant purchases or sales during the Reporting Period? |
| A | | In addition to Amorepacific, already mentioned, we initiated Fund positions in Wijaya Karya and Vietnam Dairy Product during the Reporting Period. We expect Wijaya Karya, an Indonesian construction company, to be one of the primary beneficiaries of higher infrastructure spending in Indonesia. Vietnam Dairy Product is a leading dairy producer in Vietnam. We like the structural growth story in Vietnam, given low consumption levels and what we consider to be supportive demographics. In our view, Vietnam Dairy Product provides an attractive investment opportunity given what we view as its good business model and sound balance sheet. |
| | We sold the Fund’s positions in Lafarge Surma Cement, a Bangladeshi materials company, and Charoen Pokphand Indonesia, an Indonesian poultry producer. We exited Lafarge Surma Cement, taking profits, as we no longer viewed its valuation as attractive. We eliminated the Fund’s position in Charoen Pokphand Indonesia following disappointing results and deteriorating margins. |
| Q | | Were there any notable changes in the Fund’s weightings during the Reporting Period? |
| A | | Most sector weights are usually established within a narrow range from the Index, as our team prefers to make decisions at the individual stock level, where we believe we can generate more added value. That said, during the Reporting Period, the Fund’s exposure relative to the Index to consumer staples and financials increased, and its allocations relative to the Index to industrials and materials decreased. |
| | Similarly, allocations to countries are directly the result of various stock selection decisions. As such, the Fund’s allocation relative to the Index to South Korea increased, and its exposure relative to the Index in Indonesia decreased. |
| Q | | Were there any changes to the Fund’s portfolio management team during the Reporting Period? |
| A | | Effective early March 2015, Prashant Khemka, CFA, Managing Director and Chief Investment Officer of Emerging Markets Equity, was named as a portfolio manager |
25
PORTFOLIO RESULTS
| | of the Fund. Basak Yavuz, CFA, Executive Director, was named as the lead portfolio manager for the Fund. Basak has been with the Fundamental Equity team since 2011 and brings 17 years of investment experience in both emerging and frontier markets. Maria Drew, Executive Director, will no longer be a portfolio manager of the Fund. Maria will continue to cover the energy and utility sectors within the firm’s Global and European Equity Team. |
| Q | | How was the Fund positioned relative to the Index at the end of the Reporting Period? |
| A | | At the end of the Reporting Period, the Fund was relatively neutrally weighted to the Index in all of the country components of the Index, with the exception of Indonesia, where the Fund held a modest underweight relative to the Index. |
| | | From a sector allocation perspective, the Fund had overweighted positions relative to the Index in consumer staples, consumer discretionary and financials at the end of the Reporting Period. The Fund had underweighted positions compared to the Index in the industrials, materials and energy sectors and rather neutral positions relative to the Index in the utilities, health care, information technology and telecommunication services sectors at the end the Reporting Period. |
| | | As always, we remained focused on individual stock selection, with sector and country positioning being a secondary, closely-monitored effect. |
��
26
FUND BASICS
N-11 Equity Fund
as of April 30, 2015
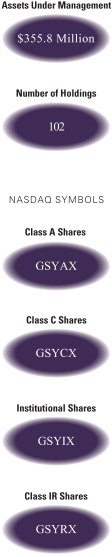
| | | | | | | | | | |
| | PERFORMANCE REVIEW | |
| | | November 1, 2014–April 30, 2015 | | Fund Total Return
(based on NAV)1 | | | MSCI® Next 11 ex Iran GDP
Weighted Index
(Net, USD, Unhedged)2 | |
| | Class A | | | -7.19 | % | | | -6.56 | % |
| | Class C | | | -7.46 | | | | -6.56 | |
| | Institutional | | | -6.89 | | | | -6.56 | |
| | | Class IR | | | -6.98 | | | | -6.56 | |
| | 1 | | The net asset value (“NAV”) represents the net assets of the class of the Fund (ex-dividend) divided by the total number of shares of the class outstanding. The Fund’s performance assumes the reinvestment of dividends and other distributions. The Fund’s performance does not reflect the deduction of any applicable sales charges. |
| | 2 | | The MSCI® Next-11 ex Iran GDP Weighted Index (Net, USD, Unhedged) comprises the following 10 emerging and frontier market indices: Bangladesh, Egypt, Indonesia, Mexico, Nigeria, Pakistan, Philippines, South Korea, Turkey and Vietnam. The index is designed to reflect the performance of the Next-11 ex Iran countries based on the size of each country’s economy rather than the size of its equity market, by using country weights based on a country’s gross domestic product (GDP). Each country is divided into large- and mid-cap segments and provides exhaustive coverage of these size segments by targeting a coverage range around 85% of free float-adjusted market capitalization in that market. It is not possible to invest directly in an index. |
| | | | | | | | | | | | |
| | STANDARDIZED TOTAL RETURNS3 |
| | | For the period ended 3/31/15 | | One Year | | | Since Inception | | | Inception Date |
| | Class A | | | -10.69 | % | | | -0.39 | % | | 2/28/11 |
| | Class C | | | -7.17 | | | | 0.22 | | | 2/28/11 |
| | Institutional | | | -5.19 | | | | 1.37 | | | 2/28/11 |
| | | Class IR | | | -5.27 | | | | 1.23 | | | 2/28/11 |
| | 3 | | The Standardized Total Returns are average annual total returns as of the most recent calendar quarter-end. They assume reinvestment of all distributions at NAV. These returns reflect a maximum initial sales charge of 5.5% for Class A Shares and the assumed contingent deferred sales charge for Class C Shares (1% if redeemed within 12 months of purchase). Because Institutional and Class IR Shares do not involve a sales charge, such a charge is not applied to their Standardized Total Returns. |
The returns set forth in the tables above represent past performance. Past performance does not guarantee future results. The Fund’s investment return and principal value will fluctuate so that an investor’s shares, when redeemed, may be worth more or less than their original cost. Current performance may be lower or higher than the performance quoted above. Please visit our web site at www.GSAMFUNDS.com to obtain the most recent month-end returns. Performance reflects applicable fee waivers and/or expense limitations in effect during the periods shown. In their absence, performance would be reduced. Returns do not reflect the deduction of taxes that a shareholder would pay on Fund distributions or the redemption of Fund shares.
27
FUND BASICS
| | | | | | | | | | |
| | EXPENSE RATIOS4 | |
| | | | | Net Expense Ratio (Current) | | | Gross Expense Ratio (Before Waivers) | |
| | Class A | | | 1.73 | % | | | 2.07 | % |
| | Class C | | | 2.48 | | | | 2.82 | |
| | Institutional | | | 1.33 | | | | 1.67 | |
| | | Class IR | | | 1.48 | | | | 1.81 | |
| | 4 | | The expense ratios of the Fund, both current (net of applicable fee waivers and/or expense limitations) and before waivers (gross of applicable fee waivers and/or expense limitations) are as set forth above according to the most recent publicly available Prospectus for the Fund and may differ from the expense ratios disclosed in the Financial Highlights in this report. Pursuant to a contractual arrangement, the Fund’s waivers and/or expense limitations will remain in place through at least February 29, 2016, and prior to such date the Investment Adviser may not terminate the arrangements without the approval of the Fund’s Board of Trustees. If these arrangements are discontinued in the future, the expense ratios may change without shareholder approval. |
| | | | | | | | | | |
| | TOP TEN HOLDINGS AS OF 4/30/155 |
| | | Holding | | % of Total
Net Assets | | | Line of Business | | Country |
| | Samsung Electronics Co. Ltd. | | | 5.5 | % | | Technology Hardware &
Equipment | | South Korea |
| | America Movil SAB de CV Class L ADR | | | 5.1 | | | Telecommunication Services | | Mexico |
| | PT Bank Central Asia Tbk | | | 3.4 | | | Banks | | Indonesia |
| | Commercial International Bank Egypt SAE | | | 2.5 | | | Banks | | Egypt |
| | PT Bank Rakyat Indonesia (Persero) Tbk | | | 2.5 | | | Banks | | Indonesia |
| | Amorepacific Corp. | | | 2.4 | | | Household & Personal
Products | | South Korea |
| | Grupo Televisa SAB ADR | | | 2.4 | | | Media | | Mexico |
| | Cemex SAB de CV ADR | | | 2.4 | | | Materials | | Mexico |
| | Turkiye Garanti Bankasi AS | | | 2.3 | | | Banks | | Turkey |
| | | SK Hynix, Inc. | | | 2.2 | | | Semiconductors &
Semiconductor Equipment | | South Korea |
| | 5 | | The top 10 holdings may not be representative of the Fund’s future investments. |
28
FUND BASICS
|
| FUND VS. BENCHMARK SECTOR ALLOCATIONS6 |
| As of April 30, 2015 |
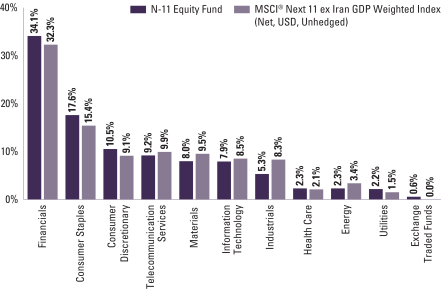
| | 6 | | The Fund is actively managed and, as such, its composition may differ over time. Consequently, the Fund’s overall sector allocations may differ from percentages contained in the graph above. The graph categorizes investments using Global Industry Classification Standard (“GICS”), however, the sector classifications used by the portfolio management team may differ from GICS. Underlying sector allocations of exchange traded funds held by the Fund are not reflected in the graph above. The percentage shown for each investment category reflects the value of investments in that category as a percentage of market value. The graph depicts the Fund’s investments but may not represent the Fund’s market exposure due to the exclusion of certain derivatives, if any, as listed in the Additional Investment Information section of the Schedule of Investments. |
29
GOLDMAN SACHS ASIA EQUITY FUND
Schedule of Investments
April 30, 2015 (Unaudited)
| | | | | | | | |
Shares | | | Description | | Value | |
| | | | | | | | |
| | Common Stocks – 94.2% | |
| | China – 26.0% | |
| | 12,120 | | | Alibaba Group Holding Ltd. ADR (Software & Services)* | | $ | 985,235 | |
| | 4,488 | | | Baidu, Inc. ADR (Software & Services)* | | | 898,857 | |
| | 467,500 | | | Bloomage Biotechnology Corp. Ltd. (Materials) | | | 1,081,563 | |
| | 868,500 | | | China Merchants Bank Co. Ltd. Class H (Banks) | | | 2,606,927 | |
| | 1,236,000 | | | China Petroleum & Chemical Corp. Class H (Energy) | | | 1,166,495 | |
| | 310,500 | | | CITIC Securities Co. Ltd. Class H (Diversified Financials) | | | 1,375,484 | |
| | 52,500 | | | Great Wall Motor Co. Ltd. Class H (Automobiles & Components) | | | 398,348 | |
| | 3,347,635 | | | Industrial & Commercial Bank of China Ltd. Class H (Banks) | | | 2,903,942 | |
| | 13,162 | | | JD.com, Inc. ADR (Retailing)* | | | 441,717 | |
| | 865,220 | | | PICC Property & Casualty Co. Ltd. Class H (Insurance) | | | 1,916,922 | |
| | 112,500 | | | Ping An Insurance Group Co. of China Ltd. Class H (Insurance) | | | 1,608,890 | |
| | 760,000 | | | Shanghai Electric Group Co. Ltd. Class H (Capital Goods) | | | 774,976 | |
| | 162,500 | | | Shanghai Fosun Pharmaceutical Group Co. Ltd. Class H (Pharmaceuticals, Biotechnology & Life Sciences) | | | 618,456 | |
| | 170,000 | | | Shenzhou International Group Holdings Ltd. (Consumer Durables & Apparel) | | | 799,548 | |
| | 211,900 | | | Tencent Holdings Ltd. (Software & Services) | | | 4,373,379 | |
| | 10,585 | | | Vipshop Holdings Ltd. ADR (Retailing)* | | | 299,450 | |
| | | | | | | | |
| | | | | | | 22,250,189 | |
| | |
| | Hong Kong – 12.9% | |
| | 558,836 | | | AIA Group Ltd. (Insurance) | | | 3,716,528 | |
| | 164,000 | | | Alibaba Health Information Technology Ltd. (Telecommunication Services)* | | | 253,157 | |
| | 224,000 | | | Brilliance China Automotive Holdings Ltd. (Automobiles & Components) | | | 420,388 | |
| | 125,500 | | | China Mobile Ltd. (Telecommunication Services) | | | 1,792,552 | |
| | 36,000 | | | CK Hutchison Holdings Ltd. (Real Estate) | | | 780,918 | |
| | 213,000 | | | Galaxy Entertainment Group Ltd. (Consumer Services) | | | 1,023,652 | |
| | 21,400 | | | Hong Kong Exchanges and Clearing Ltd. (Diversified Financials) | | | 815,774 | |
| | 1,960,000 | | | Peace Mark Holdings Ltd. (Consumer Durables & Apparel)* | | | — | |
| | 1,940,000 | | | Sino Biopharmaceutical Ltd. (Pharmaceuticals, Biotechnology & Life Sciences) | | | 2,214,856 | |
| | | | | | | | |
| | | | | | | 11,017,825 | |
| | |
| | | | | | | | |
| | Common Stocks – (continued) | |
| | India – 8.3% | |
| | 161,115 | | | Ashiana Housing Ltd. (Real Estate) | | $ | 546,647 | |
| | 37,586 | | | Atul Auto Ltd. (Automobiles & Components) | | | 287,905 | |
| | 31,769 | | | Aurobindo Pharma Ltd. (Pharmaceuticals, Biotechnology & Life Sciences) | | | 642,173 | |
| | 4,016 | | | Bajaj Finance Ltd. (Diversified Financials) | | | 255,651 | |
| | 4,159 | | | Bayer CropScience Ltd. (Materials) | | | 245,980 | |
| | 7,949 | | | Container Corp. Of India Ltd. (Transportation) | | | 205,005 | |
| | 3,910 | | | Dynamatic Technologies Ltd. (Automobiles & Components)* | | | 194,715 | |
| | 975 | | | Eicher Motors Ltd. (Capital Goods) | | | 232,835 | |
| | 4,510 | | | Gillette India Ltd. (Household & Personal Products) | | | 307,219 | |
| | 3,157 | | | Grasim Industries Ltd. GDR (Materials) | | | 178,246 | |
| | 76,396 | | | HCL Technologies Ltd. (Software & Services) | | | 1,059,128 | |
| | 34,984 | | | Indiabulls Housing Finance Ltd. (Banks) | | | 326,000 | |
| | 16,580 | | | Info Edge India Ltd. (Software & Services) | | | 200,753 | |
| | 12,497 | | | Infosys Ltd. (Software & Services) | | | 381,468 | |
| | 21,636 | | | Inox Wind Ltd. (Capital Goods)* | | | 145,233 | |
| | 9,264 | | | Lupin Ltd. (Pharmaceuticals, Biotechnology & Life Sciences) | | | 258,167 | |
| | 14,503 | | | MPS Ltd. (Media) | | | 207,094 | |
| | 13,921 | | | Multi Commodity Exchange of India Ltd. (Diversified Financials) | | | 240,030 | |
| | 75,977 | | | Prestige Estates Projects Ltd. (Real Estate) | | | 286,028 | |
| | 19,181 | | | Thermax Ltd. (Capital Goods) | | | 296,148 | |
| | 130,886 | | | VRL Logistics Ltd. (Transportation)* | | | 606,055 | |
| | | | | | | | |
| | | | | | | 7,102,480 | |
| | |
| | Indonesia – 2.3% | |
| | 495,000 | | | PT Bank Rakyat Indonesia (Persero) Tbk (Banks) | | | 441,936 | |
| | 3,078,800 | | | PT Kalbe Farma Tbk (Pharmaceuticals, Biotechnology & Life Sciences) | | | 425,635 | |
| | 14,400 | | | PT Mitra Keluarga Karyasehat Tbk (Health Care Equipment & Services)* | | | 27,106 | |
| | 2,899,500 | | | PT Summarecon Agung Tbk (Real Estate) | | | 396,139 | |
| | 2,813,000 | | | PT Wijaya Karya Persero Tbk (Capital Goods) | | | 644,909 | |
| | | | | | | | |
| | | | | | | 1,935,725 | |
| | |
| | Israel – 0.3% | |
| | 1,718 | | | Taro Pharmaceutical Industries Ltd. (Pharmaceuticals, Biotechnology & Life Sciences)* | | | 241,568 | |
| | |
| | |
| 30 | | The accompanying notes are an integral part of these financial statements. |
GOLDMAN SACHS ASIA EQUITY FUND
| | | | | | | | |
Shares | | | Description | | Value | |
| | | | | | | | |
| | Common Stocks – (continued) | |
| | Malaysia – 1.1% | |
| | 417,900 | | | Gamuda Bhd (Capital Goods) | | $ | 613,335 | |
| | 68,940 | | | Public Bank Bhd (Banks) | | | 377,075 | |
| | | | | | | | |
| | | | | | | 990,410 | |
| | |
| | Philippines – 3.4% | |
| | 2,903,700 | | | Lafarge Republic, Inc. (Materials) | | | 659,902 | |
| | 11,434,600 | | | Megaworld Corp. (Real Estate) | | | 1,355,624 | |
| | 192,530 | | | Universal Robina Corp. (Food, Beverage & Tobacco) | | | 938,891 | |
| | | | | | | | |
| | | | | | | 2,954,417 | |
| | |
| | Singapore – 2.8% | |
| | 125,430 | | | DBS Group Holdings Ltd. (Banks) | | | 1,993,130 | |
| | 386,900 | | | Silverlake Axis Ltd. (Software & Services) | | | 371,345 | |
| | | | | | | | |
| | | | | | | 2,364,475 | |
| | |
| | South Korea – 19.8% | |
| | 668 | | | Amorepacific Corp. (Household & Personal Products) | | | 2,420,254 | |
| | 3,776 | | | BGF retail Co. Ltd. (Food & Staples Retailing) | | | 413,299 | |
| | 183,522 | | | Byucksan Corp. (Capital Goods) | | | 1,072,075 | |
| | 5,251 | | | CJ CheilJedang Corp. (Food, Beverage & Tobacco) | | | 2,042,099 | |
| | 39,250 | | | Doosan Infracore Co. Ltd. (Capital Goods)* | | | 433,786 | |
| | 15,768 | | | Grand Korea Leisure Co. Ltd. (Consumer Services) | | | 564,298 | |
| | 49,966 | | | GS Engineering & Construction Corp. (Capital Goods)* | | | 1,492,556 | |
| | 15,494 | | | Hana Financial Group, Inc. (Banks) | | | 456,080 | |
| | 3,897 | | | Hana Tour Service, Inc. (Consumer Services) | | | 462,305 | |
| | 1,937 | | | Hanssem Co. Ltd. (Consumer Durables & Apparel) | | | 357,436 | |
| | 15,466 | | | Hanwha Chemical Corp. (Materials) | | | 246,609 | |
| | 17,898 | | | Kia Motors Corp. (Automobiles & Components) | | | 824,772 | |
| | 3,126 | | | LG Chem Ltd. (Materials) | | | 789,654 | |
| | 5,090 | | | Lotte Chemical Corp. (Materials) | | | 1,180,850 | |
| | 13,484 | | | OCI Materials Co. Ltd. (Materials) | | | 1,273,527 | |
| | 1,075 | | | Samsung Electronics Co. Ltd. (Technology Hardware & Equipment) | | | 1,410,243 | |
| | 24,466 | | | SK Hynix, Inc. (Semiconductors & Semiconductor Equipment) | | | 1,046,780 | |
| | 2,969 | | | Spigen Korea Co. Ltd. (Technology Hardware & Equipment) | | | 409,138 | |
| | | | | | | | |
| | | | | | | 16,895,761 | |
| | |
| | Taiwan – 13.7% | |
| | 401,000 | | | Chipbond Technology Corp. (Semiconductors & Semiconductor Equipment) | | | 866,558 | |
| | 52,120 | | | Eclat Textile Co. Ltd. (Consumer Durables & Apparel) | | | 697,799 | |
| | |
| | | | | | | | |
| | Common Stocks – (continued) | |
| | Taiwan – (continued) | |
| | 16,000 | | | Hermes Microvision, Inc. (Semiconductors & Semiconductor Equipment) | | $ | 1,125,085 | |
| | 92,000 | | | MediaTek, Inc. (Semiconductors & Semiconductor Equipment) | | | 1,182,586 | |
| | 100,617 | | | PChome Online, Inc. (Software & Services) | | | 1,701,975 | |
| | 74,000 | | | Poya International Co. Ltd. (Retailing) | | | 790,385 | |
| | 95,752 | | | Silergy Corp. (Semiconductors & Semiconductor Equipment) | | | 947,282 | |
| | 120,648 | | | Superalloy Industrial Co. Ltd. (Automobiles & Components) | | | 508,182 | |
| | 444,338 | | | Taiwan Semiconductor Manufacturing Co. Ltd. (Semiconductors & Semiconductor Equipment) | | | 2,139,164 | |
| | 3,058,000 | | | Yuanta Financial Holding Co. Ltd. (Diversified Financials) | | | 1,777,405 | |
| | | | | | | | |
| | | | | | | 11,736,421 | |
| | |
| | Thailand – 2.6% | |
| | 157,100 | | | Airports of Thailand PCL (Transportation) | | | 1,377,420 | |
| | 637,100 | | | CP ALL PCL (Food & Staples Retailing) | | | 810,452 | |
| | | | | | | | |
| | | | | | | 2,187,872 | |
| | |
| | United States – 1.0% | |
| | 229,800 | | | Samsonite International SA (Consumer Durables & Apparel) | | | 838,119 | |
| | |
| | TOTAL COMMON STOCKS | | | | |
| | (Cost $73,238,292) | | $ | 80,515,262 | |
| | |
| | | | | | | | | | |
| Units | | Description | | Expiration
Month | | | Value | |
| Warrants* – 4.5% | |
| China – 4.0% | | | | | |
| 83,108 | | Kweichow Moutai Co.
Ltd. (Food, Beverage &
Tobacco) | | | 12/24 | | | $ | 3,376,175 | |
| |
| | |
| The accompanying notes are an integral part of these financial statements. | | 31 |
GOLDMAN SACHS ASIA EQUITY FUND
Schedule of Investments (continued)
April 30, 2015 (Unaudited)
| | | | | | | | | | |
| Units | | Description | | Expiration
Month | | | Value | |
| Warrants* – (continued) | |
| India – 0.5% | | | | | |
| 56,075 | | Inox Wind Ltd.
(Capital Goods) | | | 03/16 | | | $ | 376,408 | |
| | VRL Logistics Ltd.
(Transportation) | | | | | | | | |
| 4,660 | | | | | 04/16 | | | | 21,578 | |
| 13,945 | | | | | 04/18 | | | | 64,571 | |
| | | | | | | | | | |
| | | | 462,557 | |
| |
| TOTAL WARRANTS | | | | | | | | |
| (Cost $2,826,880) | | | | | | $ | 3,838,732 | |
| |
| TOTAL INVESTMENTS – 98.7% | | | | | |
| (Cost $76,065,172) | | | | | | $ | 84,353,994 | |
| |
OTHER ASSETS IN EXCESS OF
LIABILITIES – 1.3% | | | | 1,120,455 | |
| |
| NET ASSETS – 100.0% | | | $ | 85,474,449 | |
| |
| | |
| The percentage shown for each investment category reflects the value of investments in that category as a percentage of net assets. |
* | | Non-income producing security. |
| | |
|
Investment Abbreviations: |
| ADR | | —American Depositary Receipt |
| GDR | | —Global Depositary Receipt |
|
| | |
| 32 | | The accompanying notes are an integral part of these financial statements. |
GOLDMAN SACHS BRIC FUND
Schedule of Investments
April 30, 2015 (Unaudited)
| | | | | | | | |
Shares | | | Description | | Value | |
| | Common Stocks – 86.8% | |
| | Brazil – 11.6% | |
| | 686,232 | | | AMBEV SA (Food, Beverage & Tobacco) | | $ | 4,313,790 | |
| | 386,607 | | | BB Seguridade Participacoes SA (Insurance) | | | 4,523,108 | |
| | 552,205 | | | BM&FBovespa SA – Bolsa de Valores Mercadorias e Futuros (Diversified Financials) | | | 2,274,470 | |
| | 202,528 | | | CETIP SA – Mercados Organizados (Diversified Financials) | | | 2,322,422 | |
| | 746,790 | | | Odontoprev SA (Health Care Equipment & Services) | | | 2,602,531 | |
| | 98,239 | | | Totvs SA (Software & Services) | | | 1,135,000 | |
| | | | | | | | |
| | | | | | | 17,171,321 | |
| | |
| | China – 39.3% | |
| | 10,008,800 | | | Agricultural Bank of China Ltd. Class H (Banks) | | | 5,634,759 | |
| | 21,174 | | | Alibaba Group Holding Ltd. ADR (Software & Services)* | | | 1,721,234 | |
| | 4,389,360 | | | China Construction Bank Corp. Class H (Banks) | | | 4,260,904 | |
| | 549,000 | | | China Mengniu Dairy Co. Ltd. (Food, Beverage & Tobacco) | | | 2,780,222 | |
| | 2,280,400 | | | China Petroleum & Chemical Corp. Class H (Energy) | | | 2,152,165 | |
| | 1,048,500 | | | China Vanke Co. Ltd. Class H (Real Estate)* | | | 2,776,589 | |
| | 273,000 | | | Great Wall Motor Co. Ltd. Class H (Automobiles & Components) | | | 2,071,409 | |
| | 307,000 | | | Hengan International Group Co. Ltd. (Household & Personal Products) | | | 3,787,437 | |
| | 35,005 | | | Hollysys Automation Technologies Ltd. (Technology Hardware & Equipment) | | | 769,060 | |
| | 6,047,050 | | | Industrial & Commercial Bank of China Ltd. Class H (Banks) | | | 5,245,579 | |
| | 52,601 | | | JD.com, Inc. ADR (Retailing)* | | | 1,765,290 | |
| | 1,968,000 | | | PetroChina Co. Ltd. Class H (Energy) | | | 2,538,256 | |
| | 723,760 | | | PICC Property & Casualty Co. Ltd. Class H (Insurance) | | | 1,603,513 | |
| | 122,500 | | | Ping An Insurance Group Co. of China Ltd. Class H (Insurance) | | | 1,751,902 | |
| | 499,500 | | | Shanghai Fosun Pharmaceutical Group Co. Ltd. Class H (Pharmaceuticals, Biotechnology & Life Sciences) | | | 1,901,040 | |
| | 429,000 | | | Shenzhou International Group Holdings Ltd. (Consumer Durables & Apparel) | | | 2,017,684 | |
| | 656,800 | | | Tencent Holdings Ltd. (Software & Services) | | | 13,555,617 | |
| | 62,620 | | | Vipshop Holdings Ltd. ADR (Retailing)* | | | 1,771,520 | |
| | | | | | | | |
| | | | | | | 58,104,180 | |
| | |
| | Common Stocks – (continued) | |
| | Cyprus – 0.3% | |
| | 82,645 | | | Globaltrans Investment PLC GDR (Transportation)* | | $ | 409,093 | |
| | |
| | Hong Kong – 8.7% | |
| | 496,000 | | | Alibaba Health Information Technology Ltd. (Telecommunication Services)* | | | 765,645 | |
| | 186,500 | | | China Mobile Ltd. (Telecommunication Services) | | | 2,663,833 | |
| | 200,000 | | | Galaxy Entertainment Group Ltd. (Consumer Services) | | | 961,175 | |
| | 104,100 | | | Hong Kong Exchanges and Clearing Ltd. (Diversified Financials) | | | 3,968,320 | |
| | 3,920,000 | | | Sino Biopharmaceutical Ltd. (Pharmaceuticals, Biotechnology & Life Sciences) | | | 4,475,379 | |
| | | | | | | | |
| | | | | | | 12,834,352 | |
| | |
| | India – 17.5% | |
| | 67,810 | | | Aurobindo Pharma Ltd. (Pharmaceuticals, Biotechnology & Life Sciences) | | | 1,370,699 | |
| | 192,409 | | | Axis Bank Ltd. (Banks) | | | 1,727,812 | |
| | 23,235 | | | Bajaj Finance Ltd. (Diversified Financials) | | | 1,479,100 | |
| | 2,553 | | | Bosch Ltd. (Automobiles & Components) | | | 904,545 | |
| | 26,336 | | | Container Corp. Of India Ltd. (Transportation) | | | 679,205 | |
| | 49,548 | | | CRISIL Ltd. (Diversified Financials) | | | 1,541,227 | |
| | 2,140 | | | Eicher Motors Ltd. (Capital Goods) | | | 511,043 | |
| | 23,839 | | | Gillette India Ltd. (Household & Personal Products) | | | 1,623,900 | |
| | 28,112 | | | Grasim Industries Ltd. GDR (Materials) | | | 1,587,218 | |
| | 157,272 | | | HCL Technologies Ltd. (Software & Services) | | | 2,180,365 | |
| | 60,736 | | | Indiabulls Housing Finance Ltd. (Banks) | | | 565,971 | |
| | 72,877 | | | Info Edge India Ltd. (Software & Services) | | | 882,407 | |
| | 39,960 | | | Infosys Ltd. (Software & Services) | | | 1,219,768 | |
| | 28,020 | | | Infosys Ltd. ADR (Software & Services) | | | 868,060 | |
| | 662,995 | | | KSK Energy Ventures Ltd. (Utilities)* | | | 600,537 | |
| | 540,992 | | | Prestige Estates Projects Ltd. (Real Estate) | | | 2,036,657 | |
| | 24,047 | | | Siemens Ltd. (Capital Goods) | | | 514,209 | |
| | 227,476 | | | Sobha Ltd. (Real Estate) | | | 1,400,972 | |
| | 234,277 | | | Thermax Ltd. (Capital Goods) | | | 3,617,157 | |
| | 86,401 | | | Titan Co. Ltd. (Consumer Durables & Apparel) | | | 527,632 | |
| | | | | | | | |
| | | | | | | 25,838,484 | |
| | |
| | Russia – 9.4% | |
| | 770,521 | | | Alrosa AO (Materials) | | | 1,024,193 | |
| | 250,221 | | | OAO Gazprom ADR (Energy) | | | 1,466,033 | |
| | |
| | |
| The accompanying notes are an integral part of these financial statements. | | 33 |
GOLDMAN SACHS BRIC FUND
Schedule of Investments (continued)
April 30, 2015 (Unaudited)
| | | | | | | | |
Shares | | | Description | | Value | |
| | Common Stocks – (continued) | |
| | Russia – (continued) | |
| | 69,357 | | | OAO Lukoil ADR (Energy) | | $ | 3,547,993 | |
| | 1,663,376 | | | OAO Moscow Exchange MICEX-RTS (Diversified Financials) | | | 2,480,983 | |
| | 164,257 | | | OAO Rosneft GDR (Energy) | | | 810,479 | |
| | 17,420 | | | OJSC Magnit (Food & Staples Retailing) | | | 3,810,442 | |
| | 53,191 | | | OJSC Novolipetsk Steel GDR (Materials) | | | 702,121 | |
| | | | | | | | |
| | | | | | | 13,842,244 | |
| | |
| | TOTAL COMMON STOCKS | | | | |
| | (Cost $106,795,593) | | $ | 128,199,674 | |
| | |
| | | | | | | | |
| | Preferred Stocks – 4.8% | |
| | Brazil – 4.8% | |
| | 364,980 | | | Banco Bradesco SA (Banks) | | $ | 3,895,769 | |
| | 56,892 | | | Cia Brasileira de Distribuicao Grupo Pao de Acucar (Food & Staples Retailing) | | | 1,926,014 | |
| | 99,075 | | | Itau Unibanco Holding SA (Banks) | | | 1,266,984 | |
| | |
| | TOTAL PREFERRED STOCKS | | | | |
| | (Cost $8,740,491) | | $ | 7,088,767 | |
| | |
| | | | | | | | |
| | Exchange Traded Funds – 4.4% | |
| | United States – 4.4% | |
| | 119,525 | | | iShares China Large-Cap ETF | | $ | 6,135,218 | |
| | 10,321 | | | iShares MSCI Brazil Capped ETF | | | 373,724 | |
| | |
| | TOTAL EXCHANGE TRADED FUNDS | |
| | (Cost $6,621,302) | | $ | 6,508,942 | |
| | |
| | | | | | | | | | | | |
| Units | | | Description | | Expiration
Month | | | Value | |
| | Warrant* – 3.5% | | | | | |
| | China – 3.5% | | | | | |
| | 127,000 | | | Kweichow Moutai Co.
Ltd. (Food, Beverage &
Tobacco) | | | 12/24 | | | | | |
| | (Cost $4,001,166) | | | | | | $ | 5,159,241 | |
| | |
| | TOTAL INVESTMENTS – 99.5% | | | | | |
| | (Cost $126,158,552) | | | | | | $ | 146,956,624 | |
| | |
| OTHER ASSETS IN EXCESS OF
LIABILITIES – 0.5% |
| | | 702,333 | |
| | |
| | NET ASSETS – 100.0% | | | $ | 147,658,957 | |
| | |
| | |
| The percentage shown for each investment category reflects the value of investments in that category as a percentage of net assets. |
* | | Non-income producing security. |
| | |
|
Investment Abbreviations: |
ADR | | —American Depositary Receipt |
GDR | | —Global Depositary Receipt |
|
| | |
| 34 | | The accompanying notes are an integral part of these financial statements. |
GOLDMAN SACHS EMERGING MARKETS EQUITY FUND
Schedule of Investments
April 30, 2015 (Unaudited)
| | | | | | | | |
Shares | | | Description | | Value | |
| | | | | | | | |
| | Common Stocks – 92.0% | |
| | Austria – 0.5% | |
| | 24,285 | | | DO & CO AG (Consumer Services) | | $ | 1,797,261 | |
| | |
| | Brazil – 6.0% | |
| | 500,641 | | | BB Seguridade Participacoes SA (Insurance) | | | 5,857,248 | |
| | 1,007,855 | | | BM&FBovespa SA – Bolsa de Valores Mercadorias e Futuros (Diversified Financials) | | | 4,151,241 | |
| | 329,138 | | | CETIP SA – Mercados Organizados (Diversified Financials) | | | 3,774,280 | |
| | 126,681 | | | Ez Tec Empreendimentos e Participacoes SA (Consumer Durables & Apparel) | | | 805,171 | |
| | 292,321 | | | LPS Brasil Consultoria de Imoveis SA (Real Estate) | | | 549,142 | |
| | 140,200 | | | Mahle-Metal Leve SA (Automobiles & Components) | | | 944,609 | |
| | 714,909 | | | Odontoprev SA (Health Care Equipment & Services) | | | 2,491,427 | |
| | 90,500 | | | Sao Martinho SA (Food, Beverage & Tobacco) | | | 1,151,319 | |
| | 247,413 | | | Totvs SA (Software & Services) | | | 2,858,476 | |
| | | | | | | | |
| | | | | | | 22,582,913 | |
| | |
| | Chile – 0.6% | |
| | 30,117 | | | Banco de Chile ADR (Banks) | | | 2,114,213 | |
| | |
| | China – 13.3% | |
| | 5,829,000 | | | Agricultural Bank of China Ltd. Class H (Banks) | | | 3,281,613 | |
| | 43,444 | | | Alibaba Group Holding Ltd. ADR (Software & Services)* | | | 3,531,563 | |
| | 575,000 | | | Bloomage Biotechnology Corp. Ltd. (Materials) | | | 1,330,265 | |
| | 628,000 | | | China Mengniu Dairy Co. Ltd. (Food, Beverage & Tobacco) | | | 3,180,290 | |
| | 1,666,200 | | | China Vanke Co. Ltd. Class H (Real Estate)* | | | 4,412,353 | |
| | 392,000 | | | Great Wall Motor Co. Ltd. Class H (Automobiles & Components) | | | 2,974,332 | |
| | 231,000 | | | Hengan International Group Co. Ltd. (Household & Personal Products) | | | 2,849,830 | |
| | 100,233 | | | JD.com, Inc. ADR (Retailing)* | | | 3,363,819 | |
| | 189,100 | | | Livzon Pharmaceutical Group, Inc. Class H (Pharmaceuticals, Biotechnology & Life Sciences) | | | 1,366,303 | |
| | 1,322,000 | | | PICC Property & Casualty Co. Ltd. Class H (Insurance) | | | 2,928,933 | |
| | 287,000 | | | Ping An Insurance Group Co. of China Ltd. Class H (Insurance) | | | 4,104,457 | |
| | 598,500 | | | Shanghai Fosun Pharmaceutical Group Co. Ltd. Class H (Pharmaceuticals, Biotechnology & Life Sciences) | | | 2,277,823 | |
| | |
| | | | | | | | |
| | Common Stocks – (continued) | |
| | China – (continued) | |
| | 591,900 | | | Tencent Holdings Ltd. (Software & Services) | | $ | 12,216,154 | |
| | 94,126 | | | Vipshop Holdings Ltd. ADR (Retailing)* | | | 2,662,825 | |
| | | | | | | | |
| | | | | | | 50,480,560 | |
| | |
| | Colombia – 0.7% | |
| | 68,433 | | | Banco de Bogota SA (Banks) | | | 1,806,493 | |
| | 100,000 | | | Grupo Aval Acciones y Valores ADR (Banks) | | | 1,012,000 | |
| | | | | | | | |
| | | | | | | 2,818,493 | |
| | |
| | Cyprus – 0.1% | |
| | 84,136 | | | Globaltrans Investment PLC GDR (Transportation)* | | | 416,473 | |
| | |
| | Georgia – 0.8% | |
| | 32,622 | | | Bank of Georgia Holdings PLC (Banks) | | | 895,904 | |
| | 30,207 | | | TBC Bank JSC GDR (Banks)* | | | 336,931 | |
| | 175,110 | | | TBC Bank JSC GDR (Banks)*(a) | | | 1,953,189 | |
| | | | | | | | |
| | | | | | | 3,186,024 | |
| | |
| | Greece – 0.8% | |
| | 312,459 | | | Hellenic Exchanges – Athens Stock Exchange SA Holding (Diversified Financials)* | | | 2,034,898 | |
| | 125,769 | | | Sarantis SA (Household & Personal Products)* | | | 1,143,880 | |
| | | | | | | | |
| | | | | | | 3,178,778 | |
| | |
| | Hong Kong – 3.9% | |
| | 750,000 | | | Alibaba Health Information Technology Ltd. (Telecommunication Services)* | | | 1,157,729 | |
| | 302,000 | | | Galaxy Entertainment Group Ltd. (Consumer Services) | | | 1,451,375 | |
| | 148,900 | | | Hong Kong Exchanges and Clearing Ltd. (Diversified Financials) | | | 5,676,107 | |
| | 4,144,000 | | | Sino Biopharmaceutical Ltd. (Pharmaceuticals, Biotechnology & Life Sciences) | | | 4,731,115 | |
| | 808,000 | | | Vinda International Holdings Ltd. (Household & Personal Products) | | | 1,805,196 | |
| | | | | | | | |
| | | | | | | 14,821,522 | |
| | |
| | India – 10.9% | |
| | 982,857 | | | Ashiana Housing Ltd. (Real Estate) | | | 3,334,735 | |
| | 191,630 | | | Atul Auto Ltd. (Automobiles & Components) | | | 1,467,866 | |
| | 177,507 | | | Aurobindo Pharma Ltd. (Pharmaceuticals, Biotechnology & Life Sciences) | | | 3,588,094 | |
| | 20,836 | | | Bajaj Finance Ltd. (Diversified Financials) | | | 1,326,384 | |
| | 18,712 | | | Bayer CropScience Ltd. (Materials) | | | 1,106,703 | |
| | |
| | |
| The accompanying notes are an integral part of these financial statements. | | 35 |
GOLDMAN SACHS EMERGING MARKETS EQUITY FUND
Schedule of Investments (continued)
April 30, 2015 (Unaudited)
| | | | | | | | |
Shares | | | Description | | Value | |
| | | | | | | | |
| | Common Stocks – (continued) | |
| | India – (continued) | |
| | 54,368 | | | Container Corp. Of India Ltd. (Transportation) | | $ | 1,402,150 | |
| | 21,516 | | | Dynamatic Technologies Ltd. (Automobiles & Components)* | | | 1,071,481 | |
| | 5,461 | | | Eicher Motors Ltd. (Capital Goods) | | | 1,304,114 | |
| | 38,948 | | | Gillette India Ltd. (Household & Personal Products) | | | 2,653,116 | |
| | 26,876 | | | Grasim Industries Ltd. GDR (Materials) | | | 1,517,433 | |
| | 206,514 | | | HCL Technologies Ltd. (Software & Services) | | | 2,863,039 | |
| | 155,617 | | | Indiabulls Housing Finance Ltd. (Banks) | | | 1,450,123 | |
| | 103,639 | | | Info Edge India Ltd. (Software & Services) | | | 1,254,878 | |
| | 57,456 | | | Infosys Ltd. (Software & Services) | | | 1,753,830 | |
| | 24,336 | | | Infosys Ltd. ADR (Software & Services) | | | 753,929 | |
| | 56,851 | | | Lupin Ltd. (Pharmaceuticals, Biotechnology & Life Sciences) | | | 1,584,311 | |
| | 79,139 | | | MPS Ltd. (Media) | | | 1,130,056 | |
| | 108,636 | | | Multi Commodity Exchange of India Ltd. (Diversified Financials) | | | 1,873,139 | |
| | 678,086 | | | Prestige Estates Projects Ltd. (Real Estate) | | | 2,552,771 | |
| | 306,371 | | | Sobha Ltd. (Real Estate) | | | 1,886,868 | |
| | 176,034 | | | Thermax Ltd. (Capital Goods) | | | 2,717,905 | |
| | 584,943 | | | VRL Logistics Ltd. (Transportation)* | | | 2,708,521 | |
| | | | | | | | |
| | | | | | | 41,301,446 | |
| | |
| | Indonesia – 3.3% | |
| | 5,764,100 | | | PT Bank Central Asia Tbk (Banks) | | | 5,968,190 | |
| | 1,537,400 | | | PT Bank Rakyat Indonesia (Persero) Tbk (Banks) | | | 1,372,591 | |
| | 9,047,500 | | | PT Kalbe Farma Tbk (Pharmaceuticals, Biotechnology & Life Sciences) | | | 1,250,791 | |
| | 66,200 | | | PT Mitra Keluarga Karyasehat Tbk (Health Care Equipment & Services)* | | | 124,612 | |
| | 19,049,700 | | | PT Summarecon Agung Tbk (Real Estate) | | | 2,602,634 | |
| | 5,901,000 | | | PT Wijaya Karya Persero Tbk (Capital Goods) | | | 1,352,864 | |
| | | | | | | | |
| | | | | | | 12,671,682 | |
| | |
| | Israel – 0.3% | |
| | 8,482 | | | Taro Pharmaceutical Industries Ltd. (Pharmaceuticals, Biotechnology & Life Sciences)* | | | 1,192,654 | |
| | |
| | Jersey – 0.6% | |
| | 937,090 | | | Petra Diamonds Ltd. (Materials)* | | | 2,247,507 | |
| | |
| | | | | | | | |
| | Common Stocks – (continued) | |
| | Malaysia – 1.4% | |
| | 1,239,800 | | | 7-Eleven Malaysia Holdings Bhd (Food & Staples Retailing) | | $ | 577,866 | |
| | 1,870,700 | | | Bursa Malaysia Bhd (Diversified Financials) | | | 4,584,975 | |
| | | | | | | | |
| | | | | | | 5,162,841 | |
| | |
| | Mexico – 3.7% | |
| | 1,218,485 | | | Alsea SAB de CV (Consumer Services)* | | | 3,658,950 | |
| | 2,166,810 | | | Bolsa Mexicana de Valores SAB de CV (Diversified Financials) | | | 4,167,811 | |
| | 3,088,406 | | | Cemex SAB de CV (Materials)* | | | 2,979,299 | |
| | 1,190,820 | | | Gentera SAB de CV (Diversified Financials)* | | | 2,032,823 | |
| | 615,500 | | | Grupo Rotoplas SAB de CV (Capital Goods)* | | | 1,123,322 | |
| | | | | | | | |
| | | | | | | 13,962,205 | |
| | |
| | Peru – 2.3% | |
| | 1,632,406 | | | BBVA Banco Continental SA (Banks) | | | 2,205,390 | |
| | 32,500 | | | Credicorp Ltd. (Banks) | | | 4,957,875 | |
| | 50,866 | | | Intercorp Financial Services, Inc. (Banks)* | | | 1,520,385 | |
| | | | | | | | |
| | | | | | | 8,683,650 | |
| | |
| | Philippines – 1.6% | |
| | 5,153,700 | | | Lafarge Republic, Inc. (Materials) | | | 1,171,243 | |
| | 21,601,000 | | | Megaworld Corp. (Real Estate) | | | 2,560,897 | |
| | 487,580 | | | Universal Robina Corp. (Food, Beverage & Tobacco) | | | 2,377,731 | |
| | | | | | | | |
| | | | | | | 6,109,871 | |
| | |
| | Poland – 1.3% | |
| | 33,766 | | | Bank Pekao SA (Banks) | | | 1,755,115 | |
| | 218,378 | | | Warsaw Stock Exchange (Diversified Financials) | | | 2,979,592 | |
| | | | | | | | |
| | | | | | | 4,734,707 | |
| | |
| | Russia – 3.2% | |
| | 49,909 | | | OAO Lukoil ADR (Energy) | | | 2,553,121 | |
| | 2,889,361 | | | OAO Moscow Exchange MICEX-RTS (Diversified Financials) | | | 4,309,583 | |
| | 18,180 | | | OJSC Magnit (Food & Staples Retailing) | | | 3,976,684 | |
| | 95,730 | | | OJSC Novolipetsk Steel GDR (Materials) | | | 1,263,636 | |
| | | | | | | | |
| | | | | | | 12,103,024 | |
| | |
| | Singapore – 1.3% | |
| | 738,100 | | | Singapore Exchange Ltd. (Diversified Financials) | | | 4,744,387 | |
| | |
| | South Africa – 4.7% | |
| | 4,061,246 | | | Alexander Forbes Group Holdings Ltd. (Diversified Financials)* | | | 3,362,679 | |
| | 298,955 | | | JSE Ltd. (Diversified Financials) | | | 3,344,326 | |
| | |
| | |
| 36 | | The accompanying notes are an integral part of these financial statements. |
GOLDMAN SACHS EMERGING MARKETS EQUITY FUND
| | | | | | | | |
Shares | | | Description | | Value | |
| | | | | | | | |
| | Common Stocks – (continued) | |
| | South Africa – (continued) | |
| | 508,891 | | | Metair Investments Ltd. (Automobiles & Components) | | $ | 1,567,270 | |
| | 43,562 | | | Naspers Ltd. Class N (Media) | | | 6,834,260 | |
| | 144,361 | | | Santam Ltd. (Insurance) | | | 2,824,385 | |
| | | | | | | | |
| | | | | | | 17,932,920 | |
| | |
| | South Korea – 10.8% | |
| | 2,590 | | | Amorepacific Corp. (Household & Personal Products) | | | 9,383,918 | |
| | 229,996 | | | Byucksan Corp. (Capital Goods) | | | 1,343,561 | |
| | 6,387 | | | CJ CheilJedang Corp. (Food, Beverage & Tobacco) | | | 2,483,886 | |
| | 60,645 | | | Grand Korea Leisure Co. Ltd. (Consumer Services) | | | 2,170,337 | |
| | 22,361 | | | Hana Tour Service, Inc. (Consumer Services) | | | 2,652,710 | |
| | 21,812 | | | Hanssem Co. Ltd. (Consumer Durables & Apparel) | | | 4,024,981 | |
| | 87,406 | | | Kia Motors Corp. (Automobiles & Components) | | | 4,027,827 | |
| | 21,067 | | | OCI Materials Co. Ltd. (Materials) | | | 1,989,720 | |
| | 95,814 | | | Samchuly Bicycle Co. Ltd. (Consumer Durables & Apparel) | | | 2,248,465 | |
| | 2,980 | | | Samsung Electronics Co. Ltd. (Technology Hardware & Equipment) | | | 3,909,325 | |
| | 121,247 | | | SK Hynix, Inc. (Semiconductors & Semiconductor Equipment) | | | 5,187,564 | |
| | 9,887 | | | Spigen Korea Co. Ltd. (Technology Hardware & Equipment) | | | 1,362,462 | |
| | | | | | | | |
| | | | | | | 40,784,756 | |
| | |
| | Taiwan – 14.1% | |
| | 1,007,000 | | | Chipbond Technology Corp. (Semiconductors & Semiconductor Equipment) | | | 2,176,120 | |
| | 63,000 | | | Hermes Microvision, Inc. (Semiconductors & Semiconductor Equipment) | | | 4,430,021 | |
| | 1,010,198 | | | Hon Hai Precision Industry Co. Ltd. (Technology Hardware & Equipment) | | | 3,027,006 | |
| | 411,000 | | | MediaTek, Inc. (Semiconductors & Semiconductor Equipment) | | | 5,283,072 | |
| | 276,150 | | | Merida Industry Co. Ltd. (Consumer Durables & Apparel) | | | 2,069,065 | |
| | 313,000 | | | momo.com, Inc. (Retailing) | | | 3,063,195 | |
| | 630,956 | | | PChome Online, Inc. (Software & Services) | | | 10,672,858 | |
| | 337,000 | | | Poya International Co. Ltd. (Retailing) | | | 3,599,455 | |
| | 203,000 | | | President Chain Store Corp. (Food & Staples Retailing) | | | 1,502,235 | |
| | 398,497 | | | Silergy Corp. (Semiconductors & Semiconductor Equipment) | | | 3,942,363 | |
| | 614,383 | | | Superalloy Industrial Co. Ltd. (Automobiles & Components) | | | 2,587,847 | |
| | |
| | | | | | | | |
| | Common Stocks – (continued) | |
| | Taiwan – (continued) | |
| | 2,326,883 | | | Taiwan Semiconductor Manufacturing Co. Ltd. (Semiconductors & Semiconductor Equipment) | | $ | 11,202,249 | |
| | | | | | | | |
| | | | | | | 53,555,486 | |
| | |
| | Thailand – 2.9% | |
| | 864,400 | | | Airports of Thailand PCL (Transportation) | | | 7,578,878 | |
| | 530,200 | | | Kasikornbank PCL NVDR (Banks) | | | 3,364,270 | |
| | | | | | | | |
| | | | | | | 10,943,148 | |
| | |
| | Turkey – 1.7% | |
| | 158,973 | | | BIM Birlesik Magazalar AS (Food & Staples Retailing) | | | 2,943,166 | |
| | 457,619 | | | Ulker Biskuvi Sanayi AS (Food, Beverage & Tobacco) | | | 3,496,782 | |
| | | | | | | | |
| | | | | | | 6,439,948 | |
| | |
| | United Kingdom – 0.4% | |
| | 104,761 | | | Al Noor Hospitals Group PLC (Health Care Equipment & Services) | | | 1,444,057 | |
| | |
| | United States – 0.9% | |
| | 903,900 | | | Samsonite International SA (Consumer Durables & Apparel) | | | 3,296,676 | |
| | |
| | TOTAL COMMON STOCKS | | | | |
| | (Cost $301,930,662) | | $ | 348,707,202 | |
| | |
| | | | | | | | |
| | Preferred Stocks – 2.3% | |
| | Brazil – 2.0% | |
| | 417,264 | | | Banco Bradesco SA 0.016 BRL (Banks) | | $ | 4,453,845 | |
| | 91,721 | | | Cia Brasileira de Distribuicao Grupo Pao de Acucar 0.758 BRL (Food & Staples Retailing) | | | 3,105,110 | |
| | | | | | | | |
| | | | | | | 7,558,955 | |
| | |
| | Colombia – 0.3% | |
| | 2,256,618 | | | Grupo Aval Acciones y Valores (Banks) | | | 1,146,309 | |
| | |
| | TOTAL PREFERRED STOCKS | |
| | (Cost $10,923,661) | | $ | 8,705,264 | |
| | |
| | | | | | | | |
| | Exchange Traded Funds – 1.9% | |
| | United States – 1.9% | |
| | 44,085 | | | iShares China Large-Cap ETF | | $ | 2,262,883 | |
| | 185,685 | | | iShares MSCI Russia Capped ETF | | | 2,824,269 | |
| | 36,984 | | | iShares MSCI South Korea Capped Fund | | | 2,262,311 | |
| | |
| | TOTAL EXCHANGE TRADED FUNDS | |
| | (Cost $6,989,289) | | $ | 7,349,463 | |
| | |
| | |
| The accompanying notes are an integral part of these financial statements. | | 37 |
GOLDMAN SACHS EMERGING MARKETS EQUITY FUND
Schedule of Investments (continued)
April 30, 2015 (Unaudited)
| | | | | | | | | | |
| Units | | Description | | Expiration
Month | | | Value | |
| Warrants* – 3.7% | | | | | |
| China – 3.0% | | | | | |
| 278,800 | | Kweichow Moutai Co.
Ltd. (Food, Beverage &
Tobacco) | | | 12/24 | | | $ | 11,325,955 | |
| |
| India – 0.6% | | | | | |
| 255,068 | | Inox Wind Ltd. (Capital
Goods) | | | 03/16 | | | | 1,712,166 | |
| | VRL Logistics Ltd.
(Transportation) | | | | | | | | |
| 21,119 | | | | | 04/16 | | | | 97,789 | |
| 63,345 | | | | | 04/18 | | | | 293,313 | |
| | | | | | | | | | |
| | | | 2,103,268 | |
| |
| Vietnam – 0.1% | | | | | |
| 89,038 | | Vietnam Dairy
Products JSC (Food,
Beverage & Tobacco) | | | 01/16 | | | | 476,574 | |
| |
| TOTAL WARRANTS | | | | | | | | |
| (Cost $11,054,390) | | | | | | $ | 13,905,797 | |
| |
| TOTAL INVESTMENTS – 99.9% | | | | | |
| (Cost $330,898,002) | | | | | | $ | 378,667,726 | |
| |
OTHER ASSETS IN EXCESS OF LIABILITIES – 0.1% | | | | 221,660 | |
| |
| NET ASSETS – 100.0% | | | $ | 378,889,386 | |
| |
| | |
| The percentage shown for each investment category reflects the value of investments in that category as a percentage of net assets. |
* | | Non-income producing security. |
(a) | | Exempt from registration under Rule 144A of the Securities Act of 1933. Under procedures approved by the Board of Trustees, such securities have been determined to be liquid by the Investment Adviser and may be resold, normally to qualified institutional buyers in transactions exempt from registration. Total market value of Rule 144A securities amounts to $1,953,189, which represents approximately 0.5% of net assets as of April 30, 2015. |
| | |
|
Investment Abbreviations: |
ADR | | —American Depositary Receipt |
GDR | | —Global Depositary Receipt |
NVDR | | —Non-Voting Depositary Receipt |
|
| | |
| 38 | | The accompanying notes are an integral part of these financial statements. |
GOLDMAN SACHS N-11 EQUITY FUND
Schedule of Investments
April 30, 2015 (Unaudited)
| | | | | | | | |
Shares | | | Description | | Value | |
| | | | | | | | |
| | Common Stocks – 97.7% | |
| | Bangladesh – 2.8% | |
| | 627,800 | | | GrameenPhone Ltd. (Telecommunication Services) | | $ | 2,611,732 | |
| | 3,367,189 | | | Islami Bank Bangladesh Ltd. (Banks) | | | 701,047 | |
| | 1,630,043 | | | Square Pharmaceuticals Ltd. (Pharmaceuticals, Biotechnology & Life Sciences) | | | 5,153,458 | |
| | 1,624,775 | | | Titas Gas Transmission & Distribution Co. Ltd. (Energy) | | | 1,374,885 | |
| | | | | | | | |
| | | | | | | 9,841,122 | |
| | |
| | Egypt – 5.7% | |
| | 1,213,776 | | | Commercial International Bank Egypt SAE (Banks) | | | 8,784,695 | |
| | 761,641 | | | Commercial International Bank Egypt SAE (Registered) GDR (Banks) | | | 5,257,024 | |
| | 3,384,174 | | | Talaat Moustafa Group (Real Estate) | | | 4,455,236 | |
| | 1,372,062 | | | Telecom Egypt Co. (Telecommunication Services) | | | 1,773,973 | |
| | | | | | | | |
| | | | | | | 20,270,928 | |
| | |
| | Indonesia – 13.9% | |
| | 8,936,900 | | | PT Astra International Tbk (Automobiles & Components) | | | 4,702,884 | |
| | 11,557,600 | | | PT Bank Central Asia Tbk (Banks) | | | 11,966,822 | |
| | 1,957,100 | | | PT Bank Mandiri (Persero) Tbk (Banks) | | | 1,609,796 | |
| | 9,839,300 | | | PT Bank Rakyat Indonesia (Persero) Tbk (Banks) | | | 8,784,527 | |
| | 6,779,800 | | | PT Bumi Serpong Damai (Real Estate) | | | 971,453 | |
| | 1,099,600 | | | PT Indocement Tunggal Prakarsa Tbk (Materials) | | | 1,775,768 | |
| | 5,536,800 | | | PT Indofood Sukses Makmur Tbk (Food, Beverage & Tobacco) | | | 2,873,762 | |
| | 5,566,135 | | | PT Jasa Marga (Persero) Tbk (Transportation) | | | 2,651,817 | |
| | 20,664,300 | | | PT Kalbe Farma Tbk (Pharmaceuticals, Biotechnology & Life Sciences) | | | 2,856,780 | |
| | 2,266,700 | | | PT Matahari Department Store Tbk (Retailing) | | | 3,048,506 | |
| | 68,200 | | | PT Mitra Keluarga Karyasehat Tbk (Health Care Equipment & Services)* | | | 128,377 | |
| | 3,266,200 | | | PT Semen Indonesia (Persero) Tbk (Materials) | | | 3,140,861 | |
| | 11,576,300 | | | PT Summarecon Agung Tbk (Real Estate) | | | 1,581,593 | |
| | 10,742,200 | | | PT Telekomunikasi Indonesia (Persero) Tbk (Telecommunication Services) | | | 2,160,485 | |
| | 5,054,700 | | | PT Wijaya Karya Persero Tbk (Capital Goods) | | | 1,158,841 | |
| | | | | | | | |
| | | | | | | 49,412,272 | |
| | |
| | | | | | | | |
| | Common Stocks – (continued) | |
| | Mexico – 20.7% | |
| | 1,740,800 | | | Alfa SAB de CV Class A (Capital Goods) | | $ | 3,534,475 | |
| | 567,400 | | | Alpek SAB de CV (Materials) | | | 764,818 | |
| | 1,042,627 | | | Alsea SAB de CV (Consumer Services)* | | | 3,130,871 | |
| | 865,513 | | | America Movil SAB de CV Class L ADR (Telecommunication Services) | | | 18,080,566 | |
| | 437,500 | | | Arca Continental SAB de CV (Food, Beverage & Tobacco) | | | 2,687,679 | |
| | 481,200 | | | Bolsa Mexicana de Valores SAB de CV (Diversified Financials) | | | 925,578 | |
| | 873,662 | | | Cemex SAB de CV ADR (Materials)* | | | 8,404,632 | |
| | 183,400 | | | El Puerto de Liverpool SAB de CV (Retailing)* | | | 2,014,627 | |
| | 1,291,672 | | | Fibra Uno Administracion SA de CV (REIT) | | | 3,222,866 | |
| | 69,400 | | | Fomento Economico Mexicano SAB de CV ADR (Food, Beverage & Tobacco)* | | | 6,280,006 | |
| | 1,273,082 | | | Gentera SAB de CV (Diversified Financials)* | | | 2,173,251 | |
| | 221,831 | | | Grupo Aeroportuario del Sureste SAB de CV Class B (Transportation) | | | 3,139,786 | |
| | 408,800 | | | Grupo Financiero Inbursa SAB de CV Class O (Banks) | | | 976,036 | |
| | 1,225,808 | | | Grupo Mexico SAB de CV Series B (Materials) | | | 3,784,009 | |
| | 231,268 | | | Grupo Televisa SAB ADR (Media)* | | | 8,420,468 | |
| | 2,502,924 | | | Wal-Mart de Mexico SAB de CV (Food & Staples Retailing) | | | 5,912,265 | |
| | | | | | | | |
| | | | | | | 73,451,933 | |
| | |
| | Nigeria – 6.9% | |
| | 1,135,130 | | | Dangote Cement PLC (Materials) | | | 1,052,419 | |
| | 32,364,376 | | | FBN Holdings PLC (Banks) | | | 1,587,582 | |
| | 42,897,104 | | | Guaranty Trust Bank PLC (Banks) | | | 6,194,616 | |
| | 806,244 | | | Lafarge Africa PLC (Materials) | | | 380,671 | |
| | 714,047 | | | Nestle Nigeria PLC (Food, Beverage & Tobacco) | | | 3,410,491 | |
| | 8,064,532 | | | Nigerian Breweries PLC (Food, Beverage & Tobacco) | | | 6,369,565 | |
| | 53,672,497 | | | Zenith Bank PLC (Banks) | | | 5,670,244 | |
| | | | | | | | |
| | | | | | | 24,665,588 | |
| | |
| | Pakistan – 4.9% | |
| | 1,169,933 | | | Engro Corp. Ltd. (Materials) | | | 3,641,939 | |
| | 1,754,600 | | | Habib Bank Ltd. (Banks) | | | 3,461,403 | |
| | 19,621,037 | | | K-Electric Ltd. (Utilities)* | | | 1,447,193 | |
| | 373,267 | | | MCB Bank Ltd. (Banks) | | | 1,014,173 | |
| | 2,653,700 | | | Oil & Gas Development Co. Ltd. (Energy) | | | 4,773,256 | |
| | 670,920 | | | Pakistan Petroleum Ltd. (Energy) | | | 1,187,704 | |
| | 1,174,900 | | | United Bank Ltd. (Banks) | | | 2,052,970 | |
| | | | | | | | |
| | | | | | | 17,578,638 | |
| | |
| | |
| The accompanying notes are an integral part of these financial statements. | | 39 |
GOLDMAN SACHS N-11 EQUITY FUND
Schedule of Investments (continued)
April 30, 2015 (Unaudited)
| | | | | | | | |
Shares | | | Description | | Value | |
| | | | | | | | |
| | Common Stocks – (continued) | |
| | Philippines – 6.2% | |
| | 3,783,900 | | | Alliance Global Group, Inc. (Capital Goods) | | $ | 2,150,404 | |
| | 243,960 | | | Ayala Corp. (Diversified Financials) | | | 4,265,958 | |
| | 4,969,300 | | | Ayala Land, Inc. (Real Estate) | | | 4,299,137 | |
| | 29,395,300 | | | Megaworld Corp. (Real Estate) | | | 3,484,947 | |
| | 830,558 | | | Metropolitan Bank & Trust Co. (Banks) | | | 1,731,383 | |
| | 41,715 | | | Philippine Long Distance Telephone Co. (Telecommunication Services) | | | 2,617,542 | |
| | 105,727 | | | SM Investments Corp. (Capital Goods) | | | 2,135,966 | |
| | 275,150 | | | Universal Robina Corp. (Food, Beverage & Tobacco) | | | 1,341,795 | |
| | | | | | | | |
| | | | | | | 22,027,132 | |
| | |
| | South Korea – 21.6% | |
| | 2,396 | | | Amorepacific Corp. (Household & Personal Products) | | | 8,681,030 | |
| | 8,541 | | | CJ CheilJedang Corp. (Food, Beverage & Tobacco) | | | 3,321,570 | |
| | 64,246 | | | Grand Korea Leisure Co. Ltd. (Consumer Services) | | | 2,299,208 | |
| | 73,484 | | | Hana Financial Group, Inc. (Banks) | | | 2,163,066 | |
| | 20,192 | | | Hanssem Co. Ltd. (Consumer Durables & Apparel) | | | 3,726,041 | |
| | 31,971 | | | Hyundai Motor Co. (Automobiles & Components) | | | 5,017,564 | |
| | 151,307 | | | KB Financial Group, Inc. (Banks) | | | 5,769,988 | |
| | 63,210 | | | Kia Motors Corp. (Automobiles & Components) | | | 2,912,831 | |
| | 80,437 | | | Korea Electric Power Corp. (Utilities) | | | 3,497,717 | |
| | 65,034 | | | KT Corp. (Telecommunication Services)* | | | 1,922,403 | |
| | 9,591 | | | LG Chem Ltd. (Materials) | | | 2,422,767 | |
| | 28,416 | | | LG Electronics, Inc. (Consumer Durables & Apparel) | | | 1,597,914 | |
| | 3,819 | | | LG Household & Health Care Ltd. (Household & Personal Products) | | | 2,807,250 | |
| | 21,218 | | | OCI Materials Co. Ltd. (Materials) | | | 2,003,982 | |
| | 14,903 | | | Samsung Electronics Co. Ltd. (Technology Hardware & Equipment) | | | 19,550,558 | |
| | 12,714 | | | Samsung Life Insurance Co. Ltd. (Insurance) | | | 1,243,586 | |
| | 186,026 | | | SK Hynix, Inc. (Semiconductors & Semiconductor Equipment) | | | 7,959,139 | |
| | | | | | | | |
| | | | | | | 76,896,614 | |
| | |
| | Turkey – 12.0% | |
| | 1,841,822 | | | Akbank TAS (Banks) | | | 5,366,227 | |
| | 452,989 | | | Aygaz AS (Utilities) | | | 1,659,885 | |
| | 390,498 | | | BIM Birlesik Magazalar AS (Food & Staples Retailing) | | | 7,229,531 | |
| | 3,490,078 | | | Emlak Konut Gayrimenkul Yatirim Ortakligi AS (REIT) | | | 4,031,403 | |
| | |
| | | | | | | | |
| | Common Stocks – (continued) | |
| | Turkey – (continued) | |
| | 947,680 | | | Enka Insaat ve Sanayi AS (Capital Goods) | | $ | 2,036,852 | |
| | 547,822 | | | Turk Hava Yollari AO (Transportation)* | | | 1,817,249 | |
| | 557,901 | | | Turk Telekomunikasyon AS (Telecommunication Services) | | | 1,542,026 | |
| | 349,924 | | | Turkcell Iletisim Hizmetleri AS (Telecommunication Services) | | | 1,558,059 | |
| | 2,518,389 | | | Turkiye Garanti Bankasi AS (Banks) | | | 8,012,893 | |
| | 386,778 | | | Turkiye Halk Bankasi AS (Banks) | | | 1,959,349 | |
| | 3,810,992 | | | Turkiye Sinai Kalkinma Bankasi AS (Banks) | | | 2,876,733 | |
| | 607,263 | | | Ulker Biskuvi Sanayi AS (Food, Beverage & Tobacco) | | | 4,640,250 | |
| | | | | | | | |
| | | | | | | 42,730,457 | |
| | |
| | Vietnam – 3.0% | |
| | 820,766 | | | Bank for Foreign Trade of Vietnam JSC (Banks) | | | 1,376,180 | |
| | 1,238,710 | | | Masan Group Corp. (Food, Beverage & Tobacco)* | | | 4,647,314 | |
| | 215,404 | | | PetroVietnam Drilling and Well Services JSC (Energy) | | | 541,001 | |
| | 395,750 | | | Petrovietnam Fertilizer & Chemicals JSC (Materials) | | | 553,573 | |
| | 382,170 | | | PetroVietnam Gas JSC (Utilities) | | | 1,159,361 | |
| | 302,601 | | | Saigon Thuong Tin Commercial JSB (Banks)* | | | 250,883 | |
| | 224,660 | | | Vietnam Dairy Products JSC (Food, Beverage & Tobacco) | | | 1,202,488 | |
| | 419,228 | | | Vingroup JSC (Real Estate) | | | 937,909 | |
| | | | | | | | |
| | | | | | | 10,668,709 | |
| | |
| | TOTAL COMMON STOCKS | | | | |
| | (Cost $327,607,972) | | $ | 347,543,393 | |
| | |
| | | | | | | | |
| | Exchange Traded Funds – 0.6% | |
| | United States – 0.6% | |
| | 10,878 | | | iShares MSCI Mexico Capped ETF | | $ | 637,560 | |
| | 22,306 | | | iShares MSCI South Korea Capped Fund | | | 1,364,458 | |
| | |
| | TOTAL EXCHANGE TRADED FUNDS | |
| | (Cost $1,874,137) | | $ | 2,002,018 | |
| | |
| | |
| 40 | | The accompanying notes are an integral part of these financial statements. |
GOLDMAN SACHS N-11 EQUITY FUND
| | | | | | | | | | |
| Units | | Description | | Expiration
Month | | | Value | |
| Warrant* – 0.0% | | | | | |
| Vietnam – 0.0% | | | | | |
| 15,100 | | Vietnam Dairy
Products JSC (Food,
Beverage & Tobacco) | | | 01/16 | | | | | |
| (Cost $82,554) | | | | | | $ | 80,822 | |
| |
| TOTAL INVESTMENTS – 98.3% | | | | | |
| (Cost $329,564,663) | | | | | | $ | 349,626,233 | |
| |
OTHER ASSETS IN EXCESS OF LIABILITIES – 1.7% | | | | 6,127,899 | |
| |
| NET ASSETS – 100.0% | | | $ | 355,754,132 | |
| |
| | |
| The percentage shown for each investment category reflects the value of investments in that category as a percentage of net assets. |
* | | Non-income producing security. |
| | |
|
Investment Abbreviations: |
ADR | | —American Depositary Receipt |
GDR | | —Global Depositary Receipt |
REIT | | —Real Estate Investment Trust |
|
| | |
| The accompanying notes are an integral part of these financial statements. | | 41 |
GOLDMAN SACHS FUNDAMENTAL EMERGING MARKETS EQUITY FUNDS
Statements of Assets and Liabilities
April 30, 2015 (Unaudited)
| | | | | | | | | | | | | | | | | | |
| | | | | Asia Equity Fund | | | BRIC Fund | | | Emerging Markets
Equity Fund | | | N-11 Equity Fund | |
| | Assets: | | | | | | | | | | | | | | | | |
| | Investments, at value (cost $76,065,172, $126,158,552, $330,898,002 and $329,564,663) | | $ | 84,353,994 | | | $ | 146,956,624 | | | $ | 378,667,726 | | | $ | 349,626,233 | |
| | Cash | | | 1,557,199 | | | | 1,325,557 | | | | 6,273,553 | | | | 3,668,075 | |
| | Foreign currencies, at value (cost $64,328, $126,217, $255,013 and $1,280,511) | | | 63,952 | | | | 123,868 | | | | 250,768 | | | | 1,280,011 | |
| | Receivables: | | | | | | | | | | | | | | | | |
| | Investments sold | | | 338,832 | | | | 2,275,220 | | | | 6,314,171 | | | | 826,616 | |
| | Dividends | | | 87,221 | | | | 114,410 | | | | 367,603 | | | | 1,031,513 | |
| | Reimbursement from investment adviser | | | 27,002 | | | | — | | | | — | | | | — | |
| | Fund shares sold | | | 21,713 | | | | 45,625 | | | | 217,169 | | | | 468,907 | |
| | Foreign tax reclaims | | | — | | | | — | | | | 11,094 | | | | — | |
| | Other assets | | | 7,980 | | | | 927 | | | | 1,582 | | | | 1,737 | |
| | Total assets | | | 86,457,893 | | | | 150,842,231 | | | | 392,103,666 | | | | 356,903,092 | |
| | | | | | | | | | | | | | | | | | |
| | Liabilities: | | | | | | | | | | | | | | | | |
| | Payables: | | | | | | | | | | | | | | | | |
| | Investments purchased | | | 630,890 | | | | 2,251,962 | | | | 7,526,910 | | | | — | |
| | Foreign capital gains taxes | | | 147,432 | | | | — | | | | 847,813 | | | | 91,979 | |
| | Management fees | | | 69,533 | | | | 159,599 | | | | 341,257 | | | | 404,161 | |
| | Distribution and Service fees and Transfer Agent fees | | | 9,935 | | | | 60,540 | | | | 44,536 | | | | 52,297 | |
| | Fund shares redeemed | | | 4,147 | | | | 584,546 | | | | 4,307,443 | | | | 442,327 | |
| | Accrued expenses | | | 121,507 | | | | 126,627 | | | | 146,321 | | | | 158,196 | |
| | Total liabilities | | | 983,444 | | | | 3,183,274 | | | | 13,214,280 | | | | 1,148,960 | |
| | | | | | | | | | | | | | | | | | |
| | Net Assets: | | | | | | | | | | | | | | | | |
| | Paid-in capital | | | 86,274,409 | | | | 360,977,961 | | | | 787,614,758 | | | | 369,189,737 | |
| | Undistributed (distributions in excess of) net investment income (loss) | | | (264,699 | ) | | | (480,868 | ) | | | (413,229 | ) | | | 1,409,407 | |
| | Accumulated net realized loss | | | (8,671,153 | ) | | | (233,592,363 | ) | | | (455,043,577 | ) | | | (34,819,629 | ) |
| | Net unrealized gain | | | 8,135,892 | | | | 20,754,227 | | | | 46,731,434 | | | | 19,974,617 | |
| | | NET ASSETS | | $ | 85,474,449 | | | $ | 147,658,957 | | | $ | 378,889,386 | | | $ | 355,754,132 | |
| | | Net Assets: | | | | | | | | | | | | | | | | |
| | | Class A | | $ | 15,432,328 | | | $ | 56,346,393 | | | $ | 44,744,089 | | | $ | 75,964,174 | |
| | | Class C | | | 2,328,183 | | | | 38,969,095 | | | | 11,371,141 | | | | 11,954,923 | |
| | | Institutional | | | 67,656,406 | | | | 51,841,533 | | | | 304,424,552 | | | | 246,303,148 | |
| | | Service | | | — | | | | — | | | | 18,055,174 | | | | — | |
| | | Class IR | | | 57,532 | | | | 501,936 | | | | 294,430 | | | | 21,531,887 | |
| | | Total Net Assets | | $ | 85,474,449 | | | $ | 147,658,957 | | | $ | 378,889,386 | | | $ | 355,754,132 | |
| | | Shares outstanding $0.001 par value (unlimited shares authorized): | | | | | | | | | | | | | | | | |
| | | Class A | | | 685,530 | | | | 3,935,211 | | | | 2,625,626 | | | | 7,273,414 | |
| | | Class C | | | 111,072 | | | | 2,854,351 | | | | 736,925 | | | | 1,175,409 | |
| | | Institutional | | | 2,871,348 | | | | 3,555,243 | | | | 16,763,336 | | | | 23,443,652 | |
| | | Service | | | — | | | | — | | | | 1,092,825 | | | | — | |
| | | Class IR | | | 2,444 | | | | 34,093 | | | | 16,277 | | | | 2,054,635 | |
| | | Net asset value, offering and redemption price per share:(a) | | | | | | | | | | | | | | | | |
| | | Class A | | | $22.51 | | | | $14.32 | | | | $17.04 | | | | $10.44 | |
| | | Class C | | | 20.96 | | | | 13.65 | | | | 15.43 | | | | 10.17 | |
| | | Institutional | | | 23.56 | | | | 14.58 | | | | 18.16 | | | | 10.51 | |
| | | Service | | | — | | | | — | | | | 16.52 | | | | — | |
| | | Class IR | | | 23.54 | | | | 14.72 | | | | 18.09 | | | | 10.48 | |
| | (a) | | Maximum public offering price per share for Class A Shares of the Asia Equity, BRIC, Emerging Markets Equity and N-11 Equity Funds is $23.82, $15.15, $18.03 and $11.05, respectively. At redemption, Class C Shares may be subject to a contingent deferred sales charge assessed on the amount equal to the lesser of the current net asset value (“NAV”) or the original purchase price of the shares. |
| | |
| 42 | | The accompanying notes are an integral part of these financial statements. |
GOLDMAN SACHS FUNDAMENTAL EMERGING MARKETS EQUITY FUNDS
Statements of Operations
For the Six Months Ended April 30, 2015 (Unaudited)
| | | | | | | | | | | | | | | | | | |
| | | | | Asia Equity Fund | | | BRIC Fund | | | Emerging Markets
Equity Fund | | | N-11 Equity Fund | |
| | Investment income: | | | | | | | | | | | | | | | | |
| | Dividends (net of foreign taxes withheld of $40,694, $6,154, $125,233 and $714,801) | | $ | 292,874 | | | $ | 787,769 | | | $ | 2,121,403 | | | $ | 4,778,007 | |
| | | | | | | | | | | | | | | | | | |
| | Expenses: | | | | | | | | | | | | | | | | |
| | Management fees | | | 396,393 | | | | 944,652 | | | | 2,156,812 | | | | 2,533,290 | |
| | Custody, accounting and administrative services | | | 143,317 | | | | 87,125 | | | | 313,487 | | | | 469,134 | |
| | Registration fees | | | 43,390 | | | | 29,013 | | | | 42,018 | | | | 35,149 | |
| | Professional fees | | | 38,580 | | | | 50,931 | | | | 41,096 | | | | 51,938 | |
| | Distribution and Service fees(a) | | | 28,166 | | | | 257,856 | | | | 98,884 | | | | 172,226 | |
| | Transfer Agent fees(a) | | | 28,056 | | | | 98,361 | | | | 107,140 | | | | 169,549 | |
| | Printing and mailing costs | | | 18,017 | | | | 26,783 | | | | 47,968 | | | | 18,192 | |
| | Trustee fees | | | 8,543 | | | | 10,615 | | | | 10,470 | | | | 11,258 | |
| | Service share fees — Service Plan | | | — | | | | — | | | | 19,624 | | | | — | |
| | Service share fees — Shareholder Administration Plan | | | — | | | | — | | | | 19,624 | | | | — | |
| | Other | | | 20,293 | | | | 21,049 | | | | 16,956 | | | | 2,116 | |
| | Total expenses | | | 724,755 | | | | 1,526,385 | | | | 2,874,079 | | | | 3,462,852 | |
| | Less — expense reductions | | | (172,256 | ) | | | (257,813 | ) | | | (367,355 | ) | | | (601,358 | ) |
| | Net expenses | | | 552,499 | | | | 1,268,572 | | | | 2,506,724 | | | | 2,861,494 | |
| | NET INVESTMENT INCOME (LOSS) | | | (259,625 | ) | | | (480,803 | ) | | | (385,321 | ) | | | 1,916,513 | |
| | | | | | | | | | | | | | | | | | |
| | Realized and unrealized gain (loss): | | | | | | | | | | | | | | | | |
| | Net realized gain (loss) from: | | | | | | | | | | | | | | | | |
| | Investments | | | 2,840,056 | | | | 2,713,690 | | | | 8,115,925 | | | | (18,093,949 | ) |
| | Foreign currency transactions | | | (30,338 | ) | | | (56,015 | ) | | | (83,565 | ) | | | (189,775 | ) |
| | Net change in unrealized gain (loss) on: | | | | | | | | | | | | | | | | |
| | Investments (including the effects of the net change in the foreign capital gains tax liability of $178,464, $0, $646,692 and $93,018) | | | 7,130,132 | | | | 9,277,271 | | | | 17,335,462 | | | | (14,565,775 | ) |
| | Foreign currency translation | | | (97,804 | ) | | | (2,151 | ) | | | (778,413 | ) | | | (28,400 | ) |
| | Net realized and unrealized gain (loss) | | | 9,842,046 | | | | 11,932,795 | | | | 24,589,409 | | | | (32,877,899 | ) |
| | NET INCREASE (DECREASE) IN NET ASSETS RESULTING FROM OPERATIONS | | $ | 9,582,421 | | | $ | 11,451,992 | | | $ | 24,204,088 | | | $ | (30,961,386 | ) |
| | (a) | | Class specific Distribution and Service, and Transfer Agent fees were as follows: |
| | | | | | | | | | | | | | | | | | | | | | | | | | | | | | | | | | | | |
| | | Distribution and Service Fees | | | Transfer Agent Fees | |
Fund | | Class A | | | Class B(b) | | | Class C | | | Class A | | | Class B(b) | | | Class C | | | Institutional | | | Service | | | Class IR | |
Asia Equity | | $ | 17,635 | | | $ | 128 | | | $ | 10,403 | | | $ | 13,402 | | | $ | 24 | | | $ | 1,977 | | | $ | 12,603 | | | $ | — | | | $ | 50 | |
BRIC | | | 67,223 | | | | — | | | | 190,633 | | | | 51,090 | | | | — | | | | 36,220 | | | | 10,588 | | | | — | | | | 463 | |
Emerging Markets Equity | | | 44,885 | | | | 768 | | | | 53,231 | | | | 34,113 | | | | 146 | | | | 10,114 | | | | 59,356 | | | | 3,140 | | | | 271 | |
N-11 Equity | | | 106,456 | | | | — | | | | 65,770 | | | | 80,907 | | | | — | | | | 12,496 | | | | 53,521 | | | | — | | | | 22,625 | |
| | (b) | | Class B Shares were converted into Class A Shares at the close of business on November 14, 2014. |
| | |
| The accompanying notes are an integral part of these financial statements. | | 43 |
GOLDMAN SACHS FUNDAMENTAL EMERGING MARKETS EQUITY FUNDS
Statements of Changes in Net Assets
| | | | | | | | | | |
| | | | | Asia Equity Fund | |
| | | | | For the Six Months Ended
April 30, 2015
(Unaudited) | | | For the Fiscal Year Ended
October 31, 2014 | |
| | From operations: | | | | | | | | |
| | Net investment income (loss) | | $ | (259,625 | ) | | $ | 301,304 | |
| | Net realized gain (loss) | | | 2,809,718 | | | | 9,287,977 | |
| | Net change in unrealized gain (loss) | | | 7,032,328 | | | | (6,266,089 | ) |
| | Net increase in net assets resulting from operations | | | 9,582,421 | | | | 3,323,192 | |
| | | | | | | | | | |
| | Distributions to shareholders: | | | | | | | | |
| | From net investment income | | | | | | | | |
| | Class A Shares | | | — | | | | (57,630 | ) |
| | Class C Shares | | | — | | | | — | |
| | Institutional Shares | | | (192,643 | ) | | | (337,444 | ) |
| | Service Shares | | | — | | | | — | |
| | Class IR Shares | | | (134 | ) | | | — | |
| | Total distributions to shareholders | | | (192,777 | ) | | | (395,074 | ) |
| | | | | | | | | | |
| | From share transactions: | | | | | | | | |
| | Proceeds from sales of shares | | | 2,477,732 | | | | 10,769,299 | |
| | Proceeds received in connection with merger | | | — | | | | 25,146,142 | |
| | Reinvestment of distributions | | | 191,574 | | | | 393,393 | |
| | Cost of shares redeemed | | | (5,712,399 | ) | | | (20,372,806 | ) |
| | Net increase (decrease) in net assets resulting from share transactions | | | (3,043,093 | ) | | | 15,936,028 | |
| | TOTAL INCREASE (DECREASE) | | | 6,346,551 | | | | 18,864,146 | |
| | | | | | | | | | |
| | Net assets: | | | | | | | | |
| | Beginning of period | | | 79,127,898 | | | | 60,263,752 | |
| | End of period | | $ | 85,474,449 | | | $ | 79,127,898 | |
| | Undistributed (distributions in excess of) net investment income (loss) | | $ | (264,699 | ) | | $ | 187,703 | |
| | |
| 44 | | The accompanying notes are an integral part of these financial statements. |
GOLDMAN SACHS FUNDAMENTAL EMERGING MARKETS EQUITY FUNDS
| | | | | | | | | | | | | | | | | | | | | | | | | | | | | | | | | | |
| | | BRIC Fund | | | | | Emerging Markets Equity Fund | | | | | N-11 Equity Fund | |
| | | For the Six Months��Ended
April 30, 2015
(Unaudited) | | | | | For the Fiscal Year Ended
October 31, 2014 | | | | | For the Six Months Ended
April 30, 2015
(Unaudited) | | | | | For the Fiscal Year Ended
October 31, 2014 | | | | | For the Six Months Ended
April 30, 2015
(Unaudited) | | | | | For the Fiscal Year Ended
October 31, 2014 | |
| | | | | | | | | | | | | | | | | | | | | | | | | | | | | | | | | | |
| | $ | (480,803 | ) | | | | $ | 767,874 | | | | | $ | (385,321 | ) | | | | $ | 1,805,020 | | | | | $ | 1,916,513 | | | | | $ | 1,960,855 | |
| | | 2,657,675 | | | | | | 1,273,632 | | | | | | 8,032,360 | | | | | | 14,974,134 | | | | | | (18,283,724 | ) | | | | | (3,400,450 | ) |
| | | 9,275,120 | | | | | | (560,767 | ) | | | | | 16,557,049 | | | | | | 2,279,725 | | | | | | (14,594,175 | ) | | | | | 11,740,042 | |
| | | 11,451,992 | | | | | | 1,480,739 | | | | | | 24,204,088 | | | | | | 19,058,879 | | | | | | (30,961,386 | ) | | | | | 10,300,447 | |
| | | | | | | | | | | | | | | | | | | | | | | | | | | | | | | | | | |
| | | | | | | | | | | | | | | | | | | | | | | | | | | | | | | | | | |
| | | | | | | | | | | | | | | | | | | | | | | | | | | | | | | | | | |
| | | (179,722 | ) | | | | | (878,085 | ) | | | | | — | | | | | | (138,840 | ) | | | | | (5,746 | ) | | | | | (574,638 | ) |
| | | — | | | | | | (92,382 | ) | | | | | — | | | | | | — | | | | | | — | | | | | | (15,699 | ) |
| | | (474,325 | ) | | | | | (1,612,238 | ) | | | | | (949,860 | ) | | | | | (2,726,144 | ) | | | | | (1,254,995 | ) | | | | | (2,695,030 | ) |
| | | — | | | | | | — | | | | | | — | | | | | | (34,951 | ) | | | | | — | | | | | | — | |
| | | (2,779 | ) | | | | | (9,450 | ) | | | | | (472 | ) | | | | | (1,886 | ) | | | | | (73,277 | ) | | | | | (258,613 | ) |
| | | (656,826 | ) | | | | | (2,592,155 | ) | | | | | (950,332 | ) | | | | | (2,901,821 | ) | | | | | (1,334,018 | ) | | | | | (3,543,980 | ) |
| | | | | | | | | | | | | | | | | | | | | | | | | | | | | | | | | | |
| | | | | | | | | | | | | | | | | | | | | | | | | | | | | | | | | | |
| | | 6,847,813 | | | | | | 15,318,479 | | | | | | 57,336,365 | | | | | | 64,399,140 | | | | | | 34,272,072 | | | | | | 119,952,293 | |
| | | — | | | | | | — | | | | | | — | | | | | | — | | | | | | — | | | | | | — | |
| | | 606,221 | | | | | | 2,403,225 | | | | | | 866,901 | | | | | | 2,705,592 | | | | | | 1,139,428 | | | | | | 3,290,941 | |
| | | (30,400,940 | ) | | | | | (117,137,821 | ) | | | | | (63,615,458 | ) | | | | | (177,112,853 | ) | | | | | (96,457,789 | ) | | | | | (159,511,410 | ) |
| | $ | (22,946,906 | ) | | | | $ | (99,416,117 | ) | | | | | (5,412,192 | ) | | | | | (110,008,121 | ) | | | | | (61,046,289 | ) | | | | | (36,268,176 | ) |
| | $ | (12,151,740 | ) | | | | $ | (100,527,533 | ) | | | | | 17,841,564 | | | | | | (93,851,063 | ) | | | | | (93,341,693 | ) | | | | | (29,511,709 | ) |
| | | | | | | | | | | | | | | | | | | | | | | | | | | | | | | | | | |
| | | | | | | | | | | | | | | | | | | | | | | | | | | | | | | | | | |
| | | 159,810,697 | | | | | | 260,338,230 | | | | | | 361,047,822 | | | | | | 454,898,885 | | | | | | 449,095,825 | | | | | | 478,607,534 | |
| | $ | 147,658,957 | | | | | $ | 159,810,697 | | | | | $ | 378,889,386 | | | | | $ | 361,047,822 | | | | | $ | 355,754,132 | | | | | $ | 449,095,825 | |
| | $ | (480,868 | ) | | | | $ | 656,761 | | | | | $ | (413,229 | ) | | | | $ | 922,424 | | | | | $ | 1,409,407 | | | | | $ | 826,912 | |
| | |
| The accompanying notes are an integral part of these financial statements. | | 45 |
GOLDMAN SACHS ASIA EQUITY FUND
Financial Highlights
Selected Data for a Share Outstanding Throughout Each Period
| | | | | | | | | | | | | | | | | | | | | | |
| | | | | | | | Income (loss) from
investment operations | | | | |
| | | Year - Share Class | | Net asset value, beginning of period | | | Net investment income (loss)(a) | | | Net realized and unrealized gain (loss) | | | Total from investment operations | | | Distributions to shareholders from net investment income | |
| | FOR THE SIX MONTHS ENDED APRIL 30, (UNAUDITED) | |
| | 2015 - A | | $ | 20.04 | | | $ | (0.10 | ) | | $ | 2.57 | | | $ | 2.47 | | | $ | — | |
| | 2015 - C | | | 18.73 | | | | (0.16 | ) | | | 2.39 | | | | 2.23 | | | | — | |
| | 2015 - Institutional | | | 20.99 | | | | (0.06 | ) | | | 2.69 | | | | 2.63 | | | | (0.06 | ) |
| | 2015 - IR | | | 20.98 | | | | (0.08 | ) | | | 2.69 | | | | 2.61 | | | | (0.05 | ) |
| | | | | | | | | | | | | | | | | | | | | | |
| | FOR THE FISCAL YEARS ENDED OCTOBER 31, | |
| | 2014 - A | | | 19.21 | | | | — | (e)(f) | | | 0.91 | | | | 0.91 | | | | (0.08 | ) |
| | 2014 - C | | | 18.02 | | | | (0.13 | )(e) | | | 0.84 | | | | 0.71 | | | | — | |
| | 2014 - Institutional | | | 20.13 | | | | 0.12 | (e) | | | 0.90 | | | | 1.02 | | | | (0.16 | ) |
| | 2014 - IR (Commenced February 28, 2014) | | | 20.71 | | | | 0.06 | (e) | | | 0.21 | | | | 0.27 | | | | — | |
| | 2013 - A | | | 17.78 | | | | 0.04 | | | | 1.51 | | | | 1.55 | | | | (0.12 | ) |
| | 2013 - C | | | 16.77 | | | | (0.10 | ) | | | 1.43 | | | | 1.33 | | | | (0.08 | ) |
| | 2013 - Institutional | | | 18.71 | | | | 0.12 | | | | 1.58 | | | | 1.70 | | | | (0.28 | ) |
| | 2012 - A | | | 17.33 | | | | 0.11 | | | | 0.41 | | | | 0.52 | | | | (0.07 | ) |
| | 2012 - C | | | 16.39 | | | | (0.03 | ) | | | 0.41 | | | | 0.38 | | | | — | |
| | 2012 - Institutional | | | 18.24 | | | | 0.19 | | | | 0.43 | | | | 0.62 | | | | (0.15 | ) |
| | 2011 - A | | | 19.14 | | | | 0.12 | | | | (1.69 | ) | | | (1.57 | ) | | | (0.24 | ) |
| | 2011 - C | | | 18.12 | | | | (0.03 | ) | | | (1.59 | ) | | | (1.62 | ) | | | (0.11 | ) |
| | 2011 - Institutional | | | 20.12 | | | | 0.23 | | | | (1.80 | ) | | | (1.57 | ) | | | (0.31 | ) |
| | 2010 - A | | | 15.39 | | | | 0.07 | (g) | | | 3.84 | | | | 3.91 | | | | (0.16 | ) |
| | 2010 - C | | | 14.64 | | | | (0.05 | )(g) | | | 3.64 | | | | 3.59 | | | | (0.11 | ) |
| | 2010 - Institutional | | | 16.16 | | | | 0.14 | (g) | | | 4.03 | | | | 4.17 | | | | (0.21 | ) |
| | (a) | | Calculated based on the average shares outstanding methodology. |
| | (b) | | Assumes investment at the net asset value at the beginning of the period, reinvestment of all distributions, a complete redemption of the investment at the net asset value at the end of the period and no sales or redemption charges. Total returns would be reduced if a sales or redemption charge was taken into account. Returns do not reflect the deduction of taxes that a shareholder would pay on Fund distributions or the redemption of Fund shares. Total returns for periods less than one full year are not annualized. |
| | (c) | | The Fund’s portfolio turnover rate is calculated in accordance with regulatory requirements, without regard to transactions involving short term investments and certain derivatives. If such transactions were included, the Fund’s portfolio turnover rate may be higher. |
| | (e) | | Reflects income recognized from special dividends which amounted to $0.05 per share and 0.25% of average net assets. |
| | (f) | | Amount is less than $0.005 per share. |
| | (g) | | Reflects income recognized from special dividends which amounted to $0.02 per share and 0.10% of average net assets. |
| | |
| 46 | | The accompanying notes are an integral part of these financial statements. |
GOLDMAN SACHS ASIA EQUITY FUND
| | | | | | | | | | | | | | | | | | | | | | | | | | | | | | | | | | | | | | | | |
| | | | | | | | | | | | | | | | | | | | | | | | | | | | | | | | | | |
| | | Net asset value, end of period | | | | | Total
return(b) | | | | | Net assets, end of period (in 000s) | | | | | Ratio of net expenses to average net assets | | | | | Ratio of total expenses to average net assets | | | | | Ratio of net investment income (loss) to average net assets | | | | | Portfolio turnover rate(c) | |
| | | | |
| | $ | 22.51 | | | | | | 12.33 | % | | | | $ | 15,432 | | | | | | 1.69 | %(d) | | | | | 2.13 | %(d) | | | | | (0.95 | )%(d) | | | | | 66 | % |
| | | 20.96 | | | | | | 11.91 | | | | | | 2,328 | | | | | | 2.44 | (d) | | | | | 2.87 | (d) | | | | | (1.70 | )(d) | | | | | 66 | |
| | | 23.56 | | | | | | 12.59 | | | | | | 67,656 | | | | | | 1.29 | (d) | | | | | 1.73 | (d) | | | | | (0.55 | )(d) | | | | | 66 | |
| | | 23.54 | | | | | | 12.50 | | | | | | 58 | | | | | | 1.44 | (d) | | | | | 1.87 | (d) | | | | | (0.70 | )(d) | | | | | 66 | |
| | | | | | | | | | | | | | | | | | | | | | | | | | | | | | | | | | | | | | | | |
| | | | |
| | | 20.04 | | | | | | 4.75 | | | | | | 13,711 | | | | | | 1.73 | | | | | | 2.24 | | | | | | 0.02 | (e) | | | | | 169 | |
| | | 18.73 | | | | | | 4.00 | | | | | | 2,114 | | | | | | 2.48 | | | | | | 3.00 | | | | | | (0.71 | )(e) | | | | | 169 | |
| | | 20.99 | | | | | | 5.15 | | | | | | 62,951 | | | | | | 1.32 | | | | | | 1.87 | | | | | | 0.59 | (e) | | | | | 169 | |
| | | 20.98 | | | | | | 1.30 | | | | | | 51 | | | | | | 1.43 | (d) | | | | | 2.06 | (d) | | | | | 0.41 | (d)(e) | | | | | 169 | |
| | | 19.21 | | | | | | 8.72 | | | | | | 14,097 | | | | | | 1.72 | | | | | | 2.25 | | | | | | 0.21 | | | | | | 102 | |
| | | 18.02 | | | | | | 7.87 | | | | | | 2,331 | | | | | | 2.47 | | | | | | 2.99 | | | | | | (0.56 | ) | | | | | 102 | |
| | | 20.13 | | | | | | 9.16 | | | | | | 43,208 | | | | | | 1.32 | | | | | | 1.85 | | | | | | 0.62 | | | | | | 102 | |
| | | 17.78 | | | | | | 3.05 | | | | | | 15,136 | | | | | | 1.60 | | | | | | 2.24 | | | | | | 0.66 | | | | | | 83 | |
| | | 16.77 | | | | | | 2.31 | | | | | | 2,684 | | | | | | 2.35 | | | | | | 2.97 | | | | | | (0.18 | ) | | | | | 83 | |
| | | 18.71 | | | | | | 3.50 | | | | | | 44,345 | | | | | | 1.20 | | | | | | 1.79 | | | | | | 1.03 | | | | | | 83 | |
| | | 17.33 | | | | | | (8.33 | ) | | | | | 39,688 | | | | | | 1.60 | | | | | | 2.17 | | | | | | 0.61 | | | | | | 107 | |
| | | 16.39 | | | | | | (9.00 | ) | | | | | 3,219 | | | | | | 2.35 | | | | | | 2.92 | | | | | | (0.18 | ) | | | | | 107 | |
| | | 18.24 | | | | | | (7.94 | ) | | | | | 27,071 | | | | | | 1.20 | | | | | | 1.77 | | | | | | 1.15 | | | | | | 107 | |
| | | 19.14 | | | | | | 25.59 | | | | | | 47,238 | | | | | | 1.60 | | | | | | 2.32 | | | | | | 0.40 | (g) | | | | | 85 | |
| | | 18.12 | | | | | | 24.53 | | | | | | 4,986 | | | | | | 2.35 | | | | | | 3.07 | | | | | | (0.32 | )(g) | | | | | 85 | |
| | | 20.12 | | | | | | 26.05 | | | | | | 24,864 | | | | | | 1.20 | | | | | | 1.92 | | | | | | 0.82 | (g) | | | | | 85 | |
| | |
| The accompanying notes are an integral part of these financial statements. | | 47 |
GOLDMAN SACHS BRIC FUND
Financial Highlights
Selected Data for a Share Outstanding Throughout Each Period
| | | | | | | | | | | | | | | | | | | | | | |
| | | | | | | | Income (loss) from
investment operations | | | | |
| | | Year - Share Class | | Net asset value, beginning of period | | | Net investment income (loss)(a) | | | Net realized and unrealized gain (loss) | | | Total from investment operations | | | Distributions to shareholders from net investment income | |
| | FOR THE SIX MONTHS ENDED APRIL 30, (UNAUDITED) | |
| | 2015 - A | | $ | 13.21 | | | $ | (0.04 | ) | | $ | 1.19 | | | $ | 1.15 | | | $ | (0.04 | ) |
| | 2015 - C | | | 12.60 | | | | (0.08 | ) | | | 1.13 | | | | 1.05 | | | | — | |
| | 2015 - Institutional | | | 13.50 | | | | (0.01 | ) | | | 1.20 | | | | 1.19 | | | | (0.11 | ) |
| | 2015 - IR | | | 13.59 | | | | (0.02 | ) | | | 1.22 | | | | 1.20 | | | | (0.07 | ) |
| | | | | | | | | | | | | | | | | | | | | | |
| | FOR THE FISCAL YEARS ENDED OCTOBER 31, | |
| | 2014 - A | | | 13.10 | | | | 0.06 | | | | 0.18 | | | | 0.24 | | | | (0.13 | ) |
| | 2014 - C | | | 12.49 | | | | (0.03 | ) | | | 0.16 | | | | 0.13 | | | | (0.02 | ) |
| | 2014 - Institutional | | | 13.40 | | | | 0.10 | | | | 0.20 | | | | 0.30 | | | | (0.20 | ) |
| | 2014 - IR | | | 13.47 | | | | 0.10 | | | | 0.17 | | | | 0.27 | | | | (0.15 | ) |
| | 2013 - A | | | 12.71 | | | | 0.10 | | | | 0.39 | | | | 0.49 | | | | (0.10 | ) |
| | 2013 - C | | | 12.11 | | | | — | (e) | | | 0.38 | | | | 0.38 | | | | — | |
| | 2013 - Institutional | | | 13.01 | | | | 0.17 | | | | 0.38 | | | | 0.55 | | | | (0.16 | ) |
| | 2013 - IR | | | 13.08 | | | | 0.12 | | | | 0.41 | | | | 0.53 | | | | (0.14 | ) |
| | 2012 - A | | | 13.13 | | | | 0.09 | | | | (0.51 | ) | | | (0.42 | ) | | | — | |
| | 2012 - C | | | 12.60 | | | | — | (e) | | | (0.49 | ) | | | (0.49 | ) | | | — | |
| | 2012 - Institutional | | | 13.38 | | | | 0.15 | | | | (0.52 | ) | | | (0.37 | ) | | | — | |
| | 2012 - IR | | | 13.47 | | | | 0.15 | | | | (0.54 | ) | | | (0.39 | ) | | | — | |
| | 2011 - A | | | 15.78 | | | | 0.03 | | | | (2.68 | ) | | | (2.65 | ) | | | — | |
| | 2011 - C | | | 15.26 | | | | (0.06 | ) | | | (2.60 | ) | | | (2.66 | ) | | | — | |
| | 2011 - Institutional | | | 16.04 | | | | 0.18 | | | | (2.81 | ) | | | (2.63 | ) | | | (0.03 | ) |
| | 2011 - IR | | | 16.19 | | | | 0.03 | | | | (2.72 | ) | | | (2.69 | ) | | | (0.03 | ) |
| | 2010 - A | | | 13.12 | | | | (0.03 | )(f) | | | 2.69 | | | | 2.66 | | | | — | |
| | 2010 - C | | | 12.79 | | | | (0.13 | )(f) | | | 2.60 | | | | 2.47 | | | | — | |
| | 2010 - Institutional | | | 13.29 | | | | 0.05 | (f) | | | 2.70 | | | | 2.75 | | | | — | |
| | 2010 - IR (Commenced August 31, 2010) | | | 14.12 | | | | (0.02 | )(f) | | | 2.09 | | | | 2.07 | | | | — | |
| | (a) | | Calculated based on the average shares outstanding methodology. |
| | (b) | | Assumes investment at the net asset value at the beginning of the period, reinvestment of all distributions, a complete redemption of the investment at the net asset value at the end of the period and no sales or redemption charges. Total returns would be reduced if a sales or redemption charge was taken into account. Returns do not reflect the deduction of taxes that a shareholder would pay on Fund distributions or the redemption of Fund shares. Total returns for periods less than one full year are not annualized. |
| | (c) | | The Fund’s portfolio turnover rate is calculated in accordance with regulatory requirements, without regard to transactions involving short term investments and certain derivatives. If such transactions were included, the Fund’s portfolio turnover rate may be higher. |
| | (e) | | Amount is less than $0.005 per share. |
| | (f) | | Reflects income recognized from special dividends which amounted to $0.02 per share and 0.12% of average net assets. |
| | |
| 48 | | The accompanying notes are an integral part of these financial statements. |
GOLDMAN SACHS BRIC FUND
| | | | | | | | | | | | | | | | | | | | | | | | | | | | | | | | | | | | | | | | |
| | | | | | | | | | | | | | | | | | | | | | | | | | | | | | | | | | |
| | | Net asset value, end of period | | | | | Total return(b) | | | | | Net assets, end of period (in 000s) | | | | | Ratio of net expenses to average net assets | | | | | Ratio of total expenses to average net assets | | | | | Ratio of net investment income (loss) to average net assets | | | | | Portfolio turnover rate(c) | |
| | | | | | | | | | | | | | | | | | | | | | | | | | | | | | | | | | | | | | | | |
| | $ | 14.32 | | | | | | 8.77 | % | | | | $ | 56,346 | | | | | | 1.69 | %(d) | | | | | 2.05 | %(d) | | | | | (0.61 | )%(d) | | | | | 31 | % |
| | | 13.65 | | | | | | 8.33 | | | | | | 38,969 | | | | | | 2.44 | (d) | | | | | 2.80 | (d) | | | | | (1.36 | )(d) | | | | | 31 | |
| | | 14.58 | | | | | | 8.92 | | | | | | 51,842 | | | | | | 1.30 | (d) | | | | | 1.65 | (d) | | | | | (0.22 | )(d) | | | | | 31 | |
| | | 14.72 | | | | | | 8.91 | | | | | | 502 | | | | | | 1.44 | (d) | | | | | 1.80 | (d) | | | | | (0.35 | )(d) | | | | | 31 | |
| | | | | | | | | | | | | | | | | | | | | | | | | | | | | | | | | | | | | | | | |
| | | | |
| | | 13.21 | | | | | | 1.89 | | | | | | 57,505 | | | | | | 1.76 | | | | | | 2.05 | | | | | | 0.48 | | | | | | 64 | |
| | | 12.60 | | | | | | 1.13 | | | | | | 41,943 | | | | | | 2.51 | | | | | | 2.80 | | | | | | (0.25 | ) | | | | | 64 | |
| | | 13.50 | | | | | | 2.29 | | | | | | 59,702 | | | | | | 1.36 | | | | | | 1.64 | | | | | | 0.73 | | | | | | 64 | |
| | | 13.59 | | | | | | 2.07 | | | | | | 660 | | | | | | 1.51 | | | | | | 1.80 | | | | | | 0.76 | | | | | | 64 | |
| | | 13.10 | | | | | | 3.83 | | | | | | 90,652 | | | | | | 1.76 | | | | | | 1.97 | | | | | | 0.77 | | | | | | 94 | |
| | | 12.49 | | | | | | 3.06 | | | | | | 57,124 | | | | | | 2.50 | | | | | | 2.72 | | | | | | 0.04 | | | | | | 94 | |
| | | 13.40 | | | | | | 4.26 | | | | | | 111,712 | | | | | | 1.36 | | | | | | 1.57 | | | | | | 1.29 | | | | | | 94 | |
| | | 13.47 | | | | | | 4.09 | | | | | | 851 | | | | | | 1.51 | | | | | | 1.72 | | | | | | 0.93 | | | | | | 94 | |
| | | 12.71 | | | | | | (3.19 | ) | | | | | 140,354 | | | | | | 1.82 | | | | | | 1.96 | | | | | | 0.69 | | | | | | 82 | |
| | | 12.11 | | | | | | (3.88 | ) | | | | | 81,879 | | | | | | 2.57 | | | | | | 2.71 | | | | | | (0.02 | ) | | | | | 82 | |
| | | 13.01 | | | | | | (2.76 | ) | | | | | 164,600 | | | | | | 1.42 | | | | | | 1.56 | | | | | | 1.20 | | | | | | 82 | |
| | | 13.08 | | | | | | (2.89 | ) | | | | | 2,292 | | | | | | 1.57 | | | | | | 1.71 | | | | | | 1.19 | | | | | | 82 | |
| | | 13.13 | | | | | | (16.79 | ) | | | | | 227,178 | | | | | | 1.86 | | | | | | 1.92 | | | | | | 0.16 | | | | | | 91 | |
| | | 12.60 | | | | | | (17.43 | ) | | | | | 114,773 | | | | | | 2.61 | | | | | | 2.67 | | | | | | (0.41 | ) | | | | | 91 | |
| | | 13.38 | | | | | | (16.45 | ) | | | | | 219,820 | | | | | | 1.46 | | | | | | 1.52 | | | | | | 1.15 | | | | | | 91 | |
| | | 13.47 | | | | | | (16.66 | ) | | | | | 200 | | | | | | 1.60 | | | | | | 1.66 | | | | | | 0.18 | | | | | | 91 | |
| | | 15.78 | | | | | | 20.27 | | | | | | 474,512 | | | | | | 1.89 | | | | | | 1.92 | | | | | | (0.22 | )(f) | | | | | 87 | |
| | | 15.26 | | | | | | 19.31 | | | | | | 178,404 | | | | | | 2.64 | | | | | | 2.67 | | | | | | (0.96 | )(f) | | | | | 87 | |
| | | 16.04 | | | | | | 20.69 | | | | | | 158,912 | | | | | | 1.49 | | | | | | 1.52 | | | | | | 0.36 | (f) | | | | | 87 | |
| | | 16.19 | | | | | | 14.66 | | | | | | 23 | | | | | | 1.64 | (d) | | | | | 1.64 | (d) | | | | | (0.83 | )(d)(f) | | | | | 87 | |
| | |
| The accompanying notes are an integral part of these financial statements. | | 49 |
GOLDMAN SACHS EMERGING MARKETS EQUITY FUND
Financial Highlights
Selected Data for a Share Outstanding Throughout Each Period
| | | | | | | | | | | | | | | | | | | | | | |
| | | | | | | | Income (loss) from
investment operations | | | | |
| | | Year - Share Class | | Net asset value, beginning of period | | | Net investment income (loss)(a) | | | Net realized and unrealized gain (loss) | | | Total from investment operations | | | Distributions to shareholders from net investment income | |
| | FOR THE SIX MONTHS ENDED APRIL 30, (UNAUDITED) | |
| | 2015 - A | | $ | 16.00 | | | $ | (0.04 | ) | | $ | 1.08 | | | $ | 1.04 | | | $ | — | |
| | 2015 - C | | | 14.55 | | | | (0.09 | ) | | | 0.97 | | | | 0.88 | | | | — | |
| | 2015 - Institutional | | | 17.08 | | | | (0.01 | ) | | | 1.14 | | | | 1.13 | | | | (0.05 | ) |
| | 2015 - Service | | | 15.52 | | | | (0.05 | ) | | | 1.05 | | | | 1.00 | | | | — | |
| | 2015 - IR | | | 16.99 | | | | (0.02 | ) | | | 1.15 | | | | 1.13 | | | | (0.03 | ) |
| | | | | | | | | | | | | | | | | | | | | | |
| | FOR THE FISCAL YEARS ENDED OCTOBER 31, | |
| | 2014 - A | | | 15.20 | | | | 0.03 | | | | 0.83 | | | | 0.86 | | | | (0.06 | ) |
| | 2014 - C | | | 13.87 | | | | (0.08 | ) | | | 0.76 | | | | 0.68 | | | | — | |
| | 2014 - Institutional | | | 16.22 | | | | 0.10 | | | | 0.88 | | | | 0.98 | | | | (0.12 | ) |
| | 2014 - Service | | | 14.74 | | | | 0.02 | | | | 0.80 | | | | 0.82 | | | | (0.04 | ) |
| | 2014 - IR | | | 16.14 | | | | 0.08 | | | | 0.87 | | | | 0.95 | | | | (0.10 | ) |
| | 2013 - A | | | 14.68 | | | | 0.05 | | | | 0.54 | | | | 0.59 | | | | (0.07 | ) |
| | 2013 - C | | | 13.42 | | | | (0.06 | ) | | | 0.51 | | | | 0.45 | | | | — | |
| | 2013 - Institutional | | | 15.65 | | | | 0.13 | | | | 0.58 | | | | 0.71 | | | | (0.14 | ) |
| | 2013 - Service | | | 14.24 | | | | 0.04 | | | | 0.53 | | | | 0.57 | | | | (0.07 | ) |
| | 2013 - IR | | | 15.58 | | | | 0.10 | | | | 0.58 | | | | 0.68 | | | | (0.12 | ) |
| | 2012 - A | | | 14.66 | | | | 0.06 | | | | (0.04 | ) | | | 0.02 | | | | — | |
| | 2012 - C | | | 13.51 | | | | (0.05 | ) | | | (0.04 | ) | | | (0.09 | ) | | | — | |
| | 2012 - Institutional | | | 15.63 | | | | 0.12 | | | | (0.05 | ) | | | 0.07 | | | | (0.05 | ) |
| | 2012 - Service | | | 14.24 | | | | 0.05 | | | | (0.05 | ) | | | — | (e) | | | — | |
| | 2012 - IR | | | 15.59 | | | | 0.12 | | | | (0.07 | ) | | | 0.05 | | | | (0.06 | ) |
| | 2011 - A | | | 16.38 | | | | 0.04 | | | | (1.73 | ) | | | (1.69 | ) | | | (0.03 | ) |
| | 2011 - C | | | 15.20 | | | | (0.07 | ) | | | (1.60 | ) | | | (1.67 | ) | | | (0.02 | ) |
| | 2011 - Institutional | | | 17.48 | | | | 0.11 | | | | (1.84 | ) | | | (1.73 | ) | | | (0.12 | ) |
| | 2011 - Service | | | 15.95 | | | | 0.02 | | | | (1.68 | ) | | | (1.66 | ) | | | (0.05 | ) |
| | 2011 - IR | | | 17.56 | | | | 0.02 | | | | (1.87 | ) | | | (1.85 | ) | | | (0.12 | ) |
| | 2010 - A | | | 13.37 | | | | (0.02 | )(f) | | | 3.03 | | | | 3.01 | | | | — | |
| | 2010 - C | | | 12.50 | | | | (0.10 | )(f) | | | 2.80 | | | | 2.70 | | | | — | |
| | 2010 - Institutional | | | 14.22 | | | | 0.07 | (f) | | | 3.20 | | | | 3.27 | | | | (0.01 | ) |
| | 2010 - Service | | | 13.03 | | | | (0.01 | )(f) | | | 2.93 | | | | 2.92 | | | | — | |
| | 2010 - IR (Commenced August 31, 2010) | | | 15.24 | | | | (0.01 | )(f) | | | 2.33 | | | | 2.32 | | | | — | |
| | (a) | | Calculated based on the average shares outstanding methodology. |
| | (b) | | Assumes investment at the net asset value at the beginning of the period, reinvestment of all distributions, a complete redemption of the investment at the net asset value at the end of the period and no sales or redemption charges. Total returns would be reduced if a sales or redemption charge was taken into account. Returns do not reflect the deduction of taxes that a shareholder would pay on Fund distributions or the redemption of Fund shares. Total returns for periods less than one full year are not annualized. |
| | (c) | | The Fund’s portfolio turnover rate is calculated in accordance with regulatory requirements, without regard to transactions involving short term investments and certain derivatives. If such transactions were included, the Fund’s portfolio turnover rate may be higher. |
| | (e) | | Amount is less than $0.005 per share. |
| | (f) | | Reflects income recognized from special dividends which amounted to $0.02 per share and 0.12% of average net assets. |
| | |
| 50 | | The accompanying notes are an integral part of these financial statements. |
GOLDMAN SACHS EMERGING MARKETS EQUITY FUND
| | | | | | | | | | | | | | | | | | | | | | | | | | | | | | | | | | | | | | | | |
| | | | | | | | | | | | | | | | | | | | | | | | | | | | | | | | | | |
| | | Net asset value, end of period | | | | | Total return(b) | | | | | Net assets, end of period (in 000s) | | | | | Ratio of net expenses to average net assets | | | | | Ratio of total expenses to average net assets | | | | | Ratio of net investment income (loss) to average net assets | | | | | Portfolio turnover rate(c) | |
| | | | | | | | | | | | | | | | | | | | | | | | | | | | | | | | | | | | | | | | |
| | $ | 17.04 | | | | | | 6.50 | % | | | | $ | 44,744 | | | | | | 1.69 | %(d) | | | | | 1.90 | %(d) | | | | | (0.50 | )%(d) | | | | | 47 | % |
| | | 15.43 | | | | | | 6.05 | | | | | | 11,371 | | | | | | 2.45 | (d) | | | | | 2.65 | (d) | | | | | (1.27 | )(d) | | | | | 47 | |
| | | 18.16 | | | | | | 6.67 | | | | | | 304,425 | | | | | | 1.30 | (d) | | | | | 1.50 | (d) | | | | | (0.12 | )(d) | | | | | 47 | |
| | | 16.52 | | | | | | 6.44 | | | | | | 18,055 | | | | | | 1.80 | (d) | | | | | 2.00 | (d) | | | | | (0.62 | )(d) | | | | | 47 | |
| | | 18.09 | | | | | | 6.64 | | | | | | 294 | | | | | | 1.45 | (d) | | | | | 1.65 | (d) | | | | | (0.28 | )(d) | | | | | 47 | |
| | | | | | | | | | | | | | | | | | | | | | | | | | | | | | | | | | | | | | | | |
| | | | |
| | | 16.00 | | | | | | 5.67 | | | | | | 28,157 | | | | | | 1.70 | | | | | | 1.93 | | | | | | 0.19 | | | | | | 114 | |
| | | 14.55 | | | | | | 4.90 | | | | | | 11,217 | | | | | | 2.46 | | | | | | 2.68 | | | | | | (0.55 | ) | | | | | 114 | |
| | | 17.08 | | | | | | 6.17 | | | | | | 303,676 | | | | | | 1.30 | | | | | | 1.53 | | | | | | 0.58 | | | | | | 114 | |
| | | 15.52 | | | | | | 5.55 | | | | | | 15,919 | | | | | | 1.81 | | | | | | 2.03 | | | | | | 0.11 | | | | | | 114 | |
| | | 16.99 | | | | | | 5.93 | | | | | | 313 | | | | | | 1.46 | | | | | | 1.68 | | | | | | 0.46 | | | | | | 114 | |
| | | 15.20 | | | | | | 4.04 | | | | | | 36,578 | | | | | | 1.73 | | | | | | 1.89 | | | | | | 0.32 | | | | | | 159 | |
| | | 13.87 | | | | | | 3.35 | | | | | | 11,869 | | | | | | 2.48 | | | | | | 2.64 | | | | | | (0.44 | ) | | | | | 159 | |
| | | 16.22 | | | | | | 4.49 | | | | | | 388,046 | | | | | | 1.33 | | | | | | 1.49 | | | | | | 0.80 | | | | | | 159 | |
| | | 14.74 | | | | | | 4.02 | | | | | | 14,584 | | | | | | 1.83 | | | | | | 1.99 | | | | | | 0.25 | | | | | | 159 | |
| | | 16.14 | | | | | | 4.37 | | | | | | 329 | | | | | | 1.48 | | | | | | 1.64 | | | | | | 0.62 | | | | | | 159 | |
| | | 14.68 | | | | | | 0.14 | | | | | | 38,889 | | | | | | 1.82 | | | | | | 1.94 | | | | | | 0.39 | | | | | | 119 | |
| | | 13.42 | | | | | | (0.66 | ) | | | | | 15,418 | | | | | | 2.57 | | | | | | 2.69 | | | | | | (0.35 | ) | | | | | 119 | |
| | | 15.65 | | | | | | 0.49 | | | | | | 310,167 | | | | | | 1.41 | | | | | | 1.54 | | | | | | 0.80 | | | | | | 119 | |
| | | 14.24 | | | | | | 0.00 | | | | | | 15,446 | | | | | | 1.91 | | | | | | 2.03 | | | | | | 0.36 | | | | | | 119 | |
| | | 15.58 | | | | | | 0.35 | | | | | | 240 | | | | | | 1.55 | | | | | | 1.68 | | | | | | 0.78 | | | | | | 119 | |
| | | 14.66 | | | | | | (10.33 | ) | | | | | 51,221 | | | | | | 1.90 | | | | | | 1.93 | | | | | | 0.24 | | | | | | 121 | |
| | | 13.51 | | | | | | (11.01 | ) | | | | | 18,896 | | | | | | 2.65 | | | | | | 2.68 | | | | | | (0.49 | ) | | | | | 121 | |
| | | 15.63 | | | | | | (9.98 | ) | | | | | 351,982 | | | | | | 1.50 | | | | | | 1.53 | | | | | | 0.61 | | | | | | 121 | |
| | | 14.24 | | | | | | (10.43 | ) | | | | | 14,432 | | | | | | 2.00 | | | | | | 2.03 | | | | | | 0.15 | | | | | | 121 | |
| | | 15.59 | | | | | | (10.21 | ) | | | | | 21 | | | | | | 1.65 | | | | | | 1.68 | | | | | | 0.16 | | | | | �� | 121 | |
| | | 16.38 | | | | | | 22.51 | | | | | | 68,118 | | | | | | 1.91 | | | | | | 1.91 | | | | | | (0.16 | )(f) | | | | | 147 | |
| | | 15.20 | | | | | | 21.60 | | | | | | 23,226 | | | | | | 2.66 | | | | | | 2.66 | | | | | | (0.73 | )(f) | | | | | 147 | |
| | | 17.48 | | | | | | 23.04 | | | | | | 472,994 | | | | | | 1.51 | | | | | | 1.51 | | | | | | 0.43 | (f) | | | | | 147 | |
| | | 15.95 | | | | | | 22.41 | | | | | | 13,954 | | | | | | 2.01 | | | | | | 2.01 | | | | | | (0.10 | )(f) | | | | | 147 | |
| | | 17.56 | | | | | | 15.22 | | | | | | 1 | | | | | | 1.66 | (d) | | | | | 1.66 | (d) | | | | | (0.09 | )(d)(f) | | | | | 147 | |
| | |
| The accompanying notes are an integral part of these financial statements. | | 51 |
GOLDMAN SACHS N-11 EQUITY FUND
Financial Highlights
Selected Data for a Share Outstanding Throughout Each Period
| | | | | | | | | | | | | | | | | | | | | | |
| | | | | | | | Income (loss) from
investment operations | | | | |
| | | Year - Share Class | | Net asset value, beginning of period | | | Net investment income (loss)(a) | | | Net realized and unrealized gain (loss) | | | Total from investment operations | | | Distributions to shareholders from net investment income | |
| | FOR THE SIX MONTHS ENDED APRIL 30, (UNAUDITED) | |
| | 2015 - A | | $ | 11.25 | | | $ | 0.04 | | | $ | (0.85 | ) | | $ | (0.81 | ) | | $ | — | (d) |
| | 2015 - C | | | 10.99 | | | | — | (d) | | | (0.82 | ) | | | (0.82 | ) | | | — | |
| | 2015 - Institutional | | | 11.34 | | | | 0.06 | | | | (0.84 | ) | | | (0.78 | ) | | | (0.05 | ) |
| | 2015 - IR | | | 11.30 | | | | 0.05 | | | | (0.84 | ) | | | (0.79 | ) | | | (0.03 | ) |
| | | | | | | | | | | | | | | | | | | | | | |
| | FOR THE FISCAL YEARS ENDED OCTOBER 31, | |
| | 2014 - A | | | 11.03 | | | | 0.02 | | | | 0.26 | | | | 0.28 | | | | (0.06 | ) |
| | 2014 - C | | | 10.81 | | | | (0.06 | ) | | | 0.25 | | | | 0.19 | | | | (0.01 | ) |
| | 2014 - Institutional | | | 11.12 | | | | 0.06 | | | | 0.26 | | | | 0.32 | | | | (0.10 | ) |
| | 2014 - IR | | | 11.08 | | | | 0.05 | | | | 0.25 | | | | 0.30 | | | | (0.08 | ) |
| | 2013 - A | | | 10.38 | | | | 0.01 | | | | 0.65 | | | | 0.66 | | | | (0.01 | ) |
| | 2013 - C | | | 10.25 | | | | (0.07 | ) | | | 0.63 | | | | 0.56 | | | | — | |
| | 2013 - Institutional | | | 10.45 | | | | 0.05 | | | | 0.65 | | | | 0.70 | | | | (0.03 | ) |
| | 2013 - IR | | | 10.42 | | | | 0.03 | | | | 0.65 | | | | 0.68 | | | | (0.02 | ) |
| | 2012 - A | | | 9.57 | | | | 0.01 | | | | 0.80 | | | | 0.81 | | | | — | |
| | 2012 - C | | | 9.52 | | | | (0.06 | ) | | | 0.79 | | | | 0.73 | | | | — | |
| | 2012 - Institutional | | | 9.60 | | | | 0.05 | | | | 0.80 | | | | 0.85 | | | | — | |
| | 2012 - IR | | | 9.59 | | | | 0.02 | | | | 0.81 | | | | 0.83 | | | | — | |
| | 2011 - A (Commenced February 28, 2011) | | | 10.00 | | | | (0.03 | ) | | | (0.40 | ) | | | (0.43 | ) | | | — | |
| | 2011 - C (Commenced February 28, 2011) | | | 10.00 | | | | (0.08 | ) | | | (0.40 | ) | | | (0.48 | ) | | | — | |
| | 2011 - Institutional (Commenced February 28, 2011) | | | 10.00 | | | | 0.02 | | | | (0.42 | ) | | | (0.40 | ) | | | — | |
| | 2011 - IR (Commenced February 28, 2011) | | | 10.00 | | | | (0.02 | ) | | | (0.39 | ) | | | (0.41 | ) | | | — | |
| | (a) | | Calculated based on the average shares outstanding methodology. |
| | (b) | | Assumes investment at the net asset value at the beginning of the period, reinvestment of all distributions, a complete redemption of the investment at the net asset value at the end of the period and no sales or redemption charges. Total returns would be reduced if a sales or redemption charge was taken into account. Returns do not reflect the deduction of taxes that a shareholder would pay on Fund distributions or the redemption of Fund shares. Total returns for periods less than one full year are not annualized. |
| | (c) | | The Fund’s portfolio turnover rate is calculated in accordance with regulatory requirements, without regard to transactions involving short term investments and certain derivatives. If such transactions were included, the Fund’s portfolio turnover rate may be higher. |
| | (d) | | Amount is less than $0.005 per share. |
| | |
| 52 | | The accompanying notes are an integral part of these financial statements. |
GOLDMAN SACHS N-11 EQUITY FUND
| | | | | | | | | | | | | | | | | | | | | | | | | | | | | | | | | | | | | | | | |
| | | | | | | | | | | | | | | | | | | | | | | | | | | | | | | | | | |
| | | Net asset value, end of period | | | | | Total return(b) | | | | | Net assets, end of period (in 000s) | | | | | Ratio of net expenses to average net assets | | | | | Ratio of total expenses to average net assets | | | | | Ratio of net investment income (loss) to average net assets | | | | | Portfolio turnover rate(c) | |
| | | | | | | | | | | | | | | | | | | | | | | | | | | | | | | | | | | | | | | | |
| | $ | 10.44 | | | | | | (7.19 | )% | | | | $ | 75,964 | | | | | | 1.73 | %(e) | | | | | 2.04 | %(e) | | | | | 0.71 | %(e) | | | | | 27 | % |
| | | 10.17 | | | | | | (7.46 | ) | | | | | 11,955 | | | | | | 2.48 | (e) | | | | | 2.79 | (e) | | | | | (0.04 | )(e) | | | | | 27 | |
| | | 10.51 | | | | | | (6.89 | ) | | | | | 246,303 | | | | | | 1.33 | (e) | | | | | 1.64 | (e) | | | | | 1.13 | (e) | | | | | 27 | |
| | | 10.48 | | | | | | (6.98 | ) | | | | | 21,532 | | | | | | 1.48 | (e) | | | | | 1.79 | (e) | | | | | 0.93 | (e) | | | | | 27 | |
| | | | | | | | | | | | | | | | | | | | | | | | | | | | | | | | | | | | | | | | |
| | | | |
| | | 11.25 | | | | | | 2.54 | | | | | | 96,440 | | | | | | 1.74 | | | | | | 2.08 | | | | | | 0.20 | | | | | | 41 | |
| | | 10.99 | | | | | | 1.76 | | | | | | 15,127 | | | | | | 2.49 | | | | | | 2.83 | | | | | | (0.54 | ) | | | | | 41 | |
| | | 11.34 | | | | | | 2.88 | | | | | | 310,186 | | | | | | 1.34 | | | | | | 1.68 | | | | | | 0.57 | | | | | | 41 | |
| | | 11.30 | | | | | | 2.76 | | | | | | 27,343 | | | | | | 1.49 | | | | | | 1.82 | | | | | | 0.44 | | | | | | 41 | |
| | | 11.03 | | | | | | 6.31 | | | | | | 114,658 | | | | | | 1.74 | | | | | | 2.12 | | | | | | 0.07 | | | | | | 53 | |
| | | 10.81 | | | | | | 5.46 | | | | | | 19,018 | | | | | | 2.49 | | | | | | 2.87 | | | | | | (0.66 | ) | | | | | 53 | |
| | | 11.12 | | | | | | 6.73 | | | | | | 308,502 | | | | | | 1.35 | | | | | | 1.72 | | | | | | 0.44 | | | | | | 53 | |
| | | 11.08 | | | | | | 6.48 | | | | | | 36,429 | | | | | | 1.49 | | | | | | 1.87 | | | | | | 0.26 | | | | | | 53 | |
| | | 10.38 | | | | | | 8.33 | | | | | | 35,417 | | | | | | 1.79 | | | | | | 2.35 | | | | | | 0.09 | | | | | | 90 | |
| | | 10.25 | | | | | | 7.53 | | | | | | 6,720 | | | | | | 2.54 | | | | | | 3.12 | | | | | | (0.57 | ) | | | | | 90 | |
| | | 10.45 | | | | | | 8.83 | | | | | | 111,826 | | | | | | 1.39 | | | | | | 1.94 | | | | | | 0.52 | | | | | | 90 | |
| | | 10.42 | | | | | | 8.73 | | | | | | 9,500 | | | | | | 1.54 | | | | | | 2.05 | | | | | | 0.22 | | | | | | 90 | |
| | | 9.57 | | | | | | (4.20 | ) | | | | | 18,335 | | | | | | 1.82 | (e) | | | | | 3.92 | (e) | | | | | (0.40 | )(e) | | | | | 73 | |
| | | 9.52 | | | | | | (4.70 | ) | | | | | 3,528 | | | | | | 2.57 | (e) | | | | | 4.67 | (e) | | | | | (1.29 | )(e) | | | | | 73 | |
| | | 9.60 | | | | | | (4.00 | ) | | | | | 42,740 | | | | | | 1.42 | (e) | | | | | 3.52 | (e) | | | | | 0.24 | (e) | | | | | 73 | |
| | | 9.59 | | | | | | (4.10 | ) | | | | | 1,448 | | | | | | 1.57 | (e) | | | | | 3.67 | (e) | | | | | (0.28 | )(e) | | | | | 73 | |
| | |
| The accompanying notes are an integral part of these financial statements. | | 53 |
GOLDMAN SACHS FUNDAMENTAL EMERGING MARKETS EQUITY FUNDS
Notes to Financial Statements
April 30, 2015 (Unaudited)
Goldman Sachs Trust (the “Trust”) is a Delaware statutory trust registered under the Investment Company Act of 1940, as amended (the “Act”), as an open-end management investment company. The following table lists those series of the Trust that are included in this report (collectively, the “Funds” or individually a “Fund”), along with their corresponding share classes and respective diversification status under the Act:
| | | | | | | | |
| Fund | | | | Share Classes Offered | | | | Diversified/ Non-diversified |
Asia Equity | | | | A, C, Institutional and IR | | | | Diversified |
BRIC and N-11 Equity | | | | A, C, Institutional and IR | | | | Non-diversified |
Emerging Markets Equity | | | | A, C, Institutional, Service and IR | | | | Diversified |
Class A Shares are sold with a front-end sales charge of up to 5.50%. Class C Shares are sold with a contingent deferred sales charge (“CDSC”) of 1.00%, which is imposed on redemptions made within 12 months of purchase. Institutional, Service and Class IR Shares are not subject to a sales charge.
At the close of business on November 14, 2014, Class B Shares of Asia Equity and Emerging Markets Equity Funds were converted to Class A Shares of the Funds.
Goldman Sachs Asset Management International (“GSAMI”), an affiliate of Goldman, Sachs & Co. (“Goldman Sachs”), serves as investment adviser to the Funds pursuant to a management agreement (the “Agreement”) with the Trust.
|
| 2. SIGNIFICANT ACCOUNTING POLICIES |
The financial statements have been prepared in accordance with accounting principles generally accepted in the United States of America (“GAAP”) and require management to make estimates and assumptions that may affect the reported amounts and disclosures. Actual results may differ from those estimates and assumptions.
A. Investment Valuation — The Funds’ valuation policy is to value investments at fair value.
B. Investment Income and Investments — Investment income includes interest income and dividend income, net of any foreign withholding taxes, less any amounts reclaimable. Interest income is accrued daily and adjusted for amortization of premiums and accretion of discounts. Dividend income is recognized on ex-dividend date or, for certain foreign securities, as soon as such information is obtained subsequent to the ex-dividend date. Investment transactions are reflected on trade date. Realized gains and losses are calculated using identified cost. Investment transactions are recorded on the following business day for daily net asset value (“NAV”) calculations. Any foreign capital gains tax is accrued daily based upon net unrealized gains, and is payable upon sale of such investments. Distributions received from the Funds’ investments in United States (“U.S.”) real estate investment trusts (“REITs”) may be characterized as ordinary income, net capital gain or a return of capital. A return of capital is recorded by the Funds as a reduction to the cost basis of the REIT.
54
GOLDMAN SACHS FUNDAMENTAL EMERGING MARKETS EQUITY FUNDS
|
| 2. SIGNIFICANT ACCOUNTING POLICIES (continued) |
C. Class Allocations and Expenses — Investment income, realized and unrealized gain (loss), and non-class specific expenses of each Fund are allocated daily based upon the proportion of net assets of each class. Class specific expenses, where applicable, are borne by the respective share classes and include Distribution and Service, Transfer Agent and Service and Shareholder Administration fees. Non-class specific expenses directly incurred by a Fund are charged to that Fund, while such expenses incurred by the Trust are allocated across the respective Funds on a straight-line and/or pro-rata basis depending upon the nature of the expenses.
D. Federal Taxes and Distributions to Shareholders — It is each Fund’s policy to comply with the requirements of the Internal Revenue Code of 1986, as amended (the “Code”), applicable to regulated investment companies (mutual funds) and to distribute each year substantially all of its investment company taxable income and capital gains to its shareholders. Accordingly, the Funds are not required to make any provisions for the payment of federal income tax. Distributions to shareholders are recorded on the ex-dividend date. Income and capital gains distributions, if any, are declared and paid annually.
Net capital losses are carried forward to future fiscal years and may be used to the extent allowed by the Code to offset any future capital gains. Utilization of capital loss carryforwards will reduce the requirement of future capital gains distributions.
Under the Regulated Investment Company Modernization Act of 2010, the Funds are permitted to carry forward capital losses incurred in taxable years beginning after December 22, 2010 for an unlimited period. However, any losses incurred during those future taxable years will be required to be utilized prior to the losses incurred in pre-enactment taxable years. As a result of this ordering rule, pre-enactment capital loss carryforwards may be more likely to expire unused. Additionally, post-enactment capital losses that are carried forward will retain their character as either short-term or long-term capital losses rather than being considered all short-term as under previous law.
The characterization of distributions to shareholders for financial reporting purposes is determined in accordance with federal income tax rules, which may differ from GAAP. The source of each Fund’s distributions may be shown in the accompanying financial statements as either from net investment income, net realized gain or capital. Certain components of the Funds’ net assets on the Statements of Assets and Liabilities reflect permanent GAAP/tax differences based on the appropriate tax character.
E. Foreign Currency Translation — The accounting records and reporting currency of the Funds are maintained in U.S. dollars. Assets and liabilities denominated in foreign currencies are translated into U.S. dollars using the current exchange rates at the close of each business day. The effect of changes in foreign currency exchange rates on investments is included within net realized and unrealized gain (loss) on investments. Changes in the value of other assets and liabilities as a result of fluctuations in foreign exchange rates are included in the Statements of Operations within net change in unrealized gain (loss) on foreign currency transactions. Transactions denominated in foreign currencies are translated into U.S. dollars on the date the transaction occurred, the effects of which are included within net realized gain (loss) on foreign currency transactions.
|
| 3. INVESTMENTS AND FAIR VALUE MEASUREMENTS |
The fair value of a financial instrument is the amount that would be received to sell an asset or paid to transfer a liability in an orderly transaction between market participants at the measurement date (i.e., the exit price). GAAP establishes a fair value hierarchy that prioritizes the inputs to valuation techniques used to measure fair value. The hierarchy gives the highest priority to unadjusted quoted prices in active markets for identical assets or liabilities (Level 1 measurements) and the lowest priority to
55
GOLDMAN SACHS FUNDAMENTAL EMERGING MARKETS EQUITY FUNDS
Notes to Financial Statements (continued)
April 30, 2015 (Unaudited)
|
| 3. INVESTMENTS AND FAIR VALUE MEASUREMENTS (continued) |
unobservable inputs (Level 3 measurements). The levels used for classifying investments are not necessarily an indication of the risk associated with investing in these investments. The three levels of the fair value hierarchy are described below:
Level 1 — Unadjusted quoted prices in active markets that are accessible at the measurement date for identical, unrestricted assets or liabilities;
Level 2 — Quoted prices in markets that are not active or financial instruments for which significant inputs are observable (including, but not limited to, quoted prices for similar investments, interest rates, foreign exchange rates, volatility and credit spreads), either directly or indirectly;
Level 3 — Prices or valuations that require significant unobservable inputs (including GSAMI’s assumptions in determining fair value measurement).
The Trustees have adopted Valuation Procedures that govern the valuation of the portfolio investments held by the Funds, including investments for which market quotations are not readily available. The Trustees have delegated to GSAMI day-to-day responsibility for implementing and maintaining internal controls and procedures related to the valuation of the Funds’ portfolio investments. To assess the continuing appropriateness of pricing sources and methodologies, GSAMI regularly performs price verification procedures and issues challenges as necessary to third party pricing vendors or brokers, and any differences are reviewed in accordance with the Valuation Procedures.
A. Level 1 and Level 2 Fair Value Investments — The valuation techniques and significant inputs used in determining the fair values for investments classified as Level 1 and Level 2 are as follows:
Equity Securities — Equity securities and investment companies traded on a U.S securities exchange or the NASDAQ system, or those located on certain foreign exchanges, including but not limited to the Americas, are valued daily at their last sale price or official closing price on the principal exchange or system on which they are traded. If there is no sale or official closing price or it is believed by the investment adviser to not represent fair value, equity securities and exchange traded investment companies are valued at the last bid price for long positions and at the last ask price for short positions. Investments in investment companies (other than those that are exchange traded) are valued at the NAV on the valuation date. To the extent these investments are actively traded, they are classified as Level 1 of the fair value hierarchy, otherwise they are generally classified as Level 2.
Unlisted equity securities for which market quotations are available are valued at the last sale price on the valuation date, or if no sale occurs, at the last bid price. Securities traded on certain foreign securities exchanges are valued daily at fair value determined by an independent fair value service (if available) under Valuation Procedures approved by the Trustees and consistent with applicable regulatory guidance. The independent fair value service takes into account multiple factors including, but not limited to, movements in the securities markets, certain depositary receipts, futures contracts and foreign currency exchange rates that have occurred subsequent to the close of the foreign securities exchange. These investments are generally classified as Level 2 of the fair value hierarchy.
B. Level 3 Fair Value Investments — To the extent that significant inputs to valuation models and other alternative pricing sources are unobservable, or if quotations are not readily available, or if GSAMI believes that such quotations do not accurately reflect fair value, the fair value of the Funds’ investments may be determined under Valuation Procedures approved by the Trustees. GSAMI, consistent with its procedures and applicable regulatory guidance, may make an adjustment to the most recent
56
GOLDMAN SACHS FUNDAMENTAL EMERGING MARKETS EQUITY FUNDS
|
| 3. INVESTMENTS AND FAIR VALUE MEASUREMENTS (continued) |
valuation prices of either domestic or foreign securities in light of significant events to reflect what it believes to be the fair value of the securities at the time of determining a Fund’s NAV. Significant events which could affect a large number of securities in a particular market may include, but are not limited to: significant fluctuations in U.S. or foreign markets; market dislocations; market disruptions; or unscheduled market closings. Significant events which could also affect a single issuer may include, but are not limited to: corporate actions such as reorganizations, mergers and buy-outs; ratings downgrades; and bankruptcies.
C. Fair Value Hierarchy — The following is a summary of the Funds’ investments classified in the fair value hierarchy as of April 30, 2015:
| | | | | | | | | | | | |
| | | |
| ASIA EQUITY | | | | | | | | | | | | |
| | | |
| Investment Type | | Level 1 | | | Level 2 | | | Level 3 | |
| Assets | | | | | | | | | | | | |
Common Stock and/or Other Equity Investments(a) | | | | | | | | | | | | |
Asia | | $ | 2,866,827 | | | $ | 80,627,470 | | | $ | — | |
Europe | | | — | | | | 21,578 | | | | — | |
North America | | | — | | | | 838,119 | | | | — | |
| Total | | $ | 2,866,827 | | | $ | 81,487,167 | | | $ | — | |
| | | |
| BRIC | | | | | | | | | | | | |
| | | |
| Investment Type | | Level 1 | | | Level 2 | | | Level 3 | |
| Assets | | | | | | | | | | | | |
Common Stock and/or Other Equity Investments(a) | | | | | | | | | | | | |
Asia | | $ | 6,895,164 | | | $ | 108,883,337 | | | $ | — | |
Europe | | | — | | | | 409,093 | | | | — | |
NorthAmerica | | | 6,508,942 | | | | — | | | | — | |
South America | | | 17,171,321 | | | | 7,088,767 | | | | — | |
| Total | | $ | 30,575,427 | | | $ | 116,381,197 | | | $ | — | |
| | | |
| EMERGING MARKETS EQUITY | | | | | | | | | | | | |
| | | |
| Investment Type | | Level 1 | | | Level 2 | | | Level 3 | |
| Assets | | | | | | | | | | | | |
Common Stock and/or Other Equity Investments(a) | | | | | | | | | | | | |
Africa | | $ | — | | | $ | 17,932,920 | | | $ | — | |
Asia | | | 11,504,790 | | | | 262,614,543 | | | | — | |
Europe | | | — | | | | 17,102,596 | | | | — | |
North America | | | 21,311,668 | | | | 3,296,676 | | | | — | |
South America | | | 36,199,269 | | | | 8,705,264 | | | | — | |
| Total | | $ | 69,015,727 | | | $ | 309,651,999 | | | $ | — | |
57
GOLDMAN SACHS FUNDAMENTAL EMERGING MARKETS EQUITY FUNDS
Notes to Financial Statements (continued)
April 30, 2015 (Unaudited)
|
| 3. INVESTMENTS AND FAIR VALUE MEASUREMENTS (continued) |
| | | | | | | | | | | | |
| | | |
| N-11 EQUITY | | | | | | | | | | | | |
| | | |
| Investment Type | | Level 1 | | | Level 2 | | | Level 3 | |
| Assets | | | | | | | | | | | | |
Common Stock and/or Other Equity Investments(a) | | | | | | | | | | | | |
Africa | | $ | — | | | $ | 44,936,516 | | | $ | — | |
Asia | | | — | | | | 229,235,766 | | | | — | |
North America | | | 75,453,951 | | | | — | | | | — | |
| Total | | $ | 75,453,951 | | | $ | 274,172,282 | | | $ | — | |
| (a) | | Amounts are disclosed by continent to highlight the impact of time zone differences between local market close and the calculation of NAV. Security valuations are based on the principal exchange or system on which they are traded, which may differ from country of domicile. The Funds utilize fair value model prices provided by an independent fair value service for international equities, resulting in a Level 2 classification. |
For further information regarding security characteristics, see the Schedules of Investments.
|
| 4. AGREEMENTS AND AFFILIATED TRANSACTIONS |
A. Management Agreement — Under the Agreement, GSAMI manages the Funds, subject to the general supervision of the Trustees.
As compensation for the services rendered pursuant to the Agreement, the assumption of the expenses related thereto and administration of the Funds’ business affairs, including providing facilities, GSAMI is entitled to a management fee, accrued daily and paid monthly, equal to an annual percentage rate of each Fund’s average daily net assets.
For the six months ended April 30, 2015, contractual and effective net management fees with GSAMI were at the following rates:
| | | | | | | | | | | | | | | | | | | | | | | | | | | | | | |
| | | | | Contractual Management Rate | | | Effective Net
Management
Rate^ | |
| Fund | | | | First
$1 billion | | | Next
$1 billion | | | Next
$3 billion | | | Next
$3 billion | | | Over
$8 billion | | | Effective
Rate | | |
Asia Equity | | | | | 1.00 | % | | | 0.90 | % | | | 0.86 | % | | | 0.84 | % | | | 0.82 | % | | | 1.00 | % | | | 1.00 | % |
BRIC | | | | | 1.30 | | | | 1.30 | | | | 1.17 | | | | 1.11 | | | | 1.09 | | | | 1.30 | | | | 1.04 | * |
Emerging Markets Equity | | | | | 1.20 | | | | 1.20 | | | | 1.08 | | | | 1.03 | | | | 1.01 | | | | 1.20 | | | | 1.02 | * |
N-11 Equity | | | | | 1.30 | | | | 1.30 | | | | 1.24 | | | | 1.21 | | | | 1.19 | | | | 1.30 | | | | 1.13 | * |
| ^ | | Effective Net Management Rate includes the impact of management fee waivers of affiliated underlying funds, if any. |
| * | | GSAMI has agreed to waive a portion of its management fee in order to achieve net management rates as defined in the Funds’ most recent prospectuses. These waivers will be effective through at least February 29, 2016, and prior to such date, GSAMI may not terminate the arrangements without the approval of the Trustees. |
58
GOLDMAN SACHS FUNDAMENTAL EMERGING MARKETS EQUITY FUNDS
|
| 4. AGREEMENTS AND AFFILIATED TRANSACTIONS (continued) |
B. Distribution and Service Plans — The Trust, on behalf of each Fund, has adopted Distribution and Service Plans (the “Plans”). Under the Plans, Goldman Sachs, which serves as distributor (the “Distributor”), is entitled to a fee accrued daily and paid monthly, for distribution services and personal and account maintenance services, which may then be paid by Goldman Sachs to authorized dealers, at the following annual rates calculated on a Fund’s average daily net assets of each respective share class:
| | | | | | | | |
| | | Distribution and Service Plan Rates | |
| | | Class A* | | | Class C | |
Distribution Plan | | | 0.25 | % | | | 0.75 | % |
Service Plan | | | — | | | | 0.25 | |
| * | | With respect to Class A Shares, the Distributor at its discretion may use compensation for distribution services paid under the Distribution Plan to compensate service organizations for personal and account maintenance services and expenses as long as such total compensation does not exceed the maximum cap on “service fees” imposed by the Financial Industry Regulatory Authority. |
C. Distribution Agreement — Goldman Sachs, as Distributor of the shares of the Funds pursuant to a Distribution Agreement, may retain a portion of the Class A front end sales charge and Class C Shares’ CDSC. During the six months ended April 30, 2015, Goldman Sachs advised that it retained the following amounts:
| | | | | | | | | | |
| | | | | Front End
Sales Charge | | | Contingent Deferred
Sales Charge | |
| Fund | | | | Class A | | | Class C | |
Asia Equity | | | | $ | 1,430 | | | $ | — | |
BRIC | | | | | 1,652 | | | | 81 | |
Emerging Markets Equity | | | | | 2,018 | | | | — | |
N-11 Equity | | | | | 1,278 | | | | — | |
D. Service Plan and Shareholder Administration Plan — The Trust, on behalf of each Fund that offers Service Shares, has adopted a Service Plan and a Shareholder Administration Plan. These plans allow for service organizations to provide varying levels of personal and account maintenance and shareholder administration services to their customers who are beneficial owners of such shares. The Service Plan and Shareholder Administration Plan each provide for compensation to the service organizations which is accrued daily and paid monthly at an annual rate of 0.25% (0.50% in aggregate) of the average daily net assets of the Service Shares.
E. Transfer Agency Agreement — Goldman Sachs also serves as the transfer agent of the Funds for a fee pursuant to the Transfer Agency Agreement. The fees charged for such transfer agency services are accrued daily and paid monthly at annual rates as follows: 0.19% of the average daily net assets of Class A, Class C, and Class IR Shares; and 0.04% of the average daily net assets of Institutional and Service Shares.
59
GOLDMAN SACHS FUNDAMENTAL EMERGING MARKETS EQUITY FUNDS
Notes to Financial Statements (continued)
April 30, 2015 (Unaudited)
|
| 4. AGREEMENTS AND AFFILIATED TRANSACTIONS (continued) |
F. Other Expense Agreements and Affiliated Transactions — GSAMI has agreed to limit certain “Other Expenses” of the Funds (excluding acquired fund fees and expenses, transfer agency fees and expenses, service fees and shareholder administration fees (as applicable), taxes, interest, brokerage fees, shareholder meetings, litigation, indemnification and extraordinary expenses) to the extent such expenses exceed, on an annual basis, a percentage rate of the average daily net assets of each Fund. Such Other Expense reimbursements, if any, are accrued daily and paid monthly. In addition, the Funds are not obligated to reimburse GSAMI for prior fiscal year expense reimbursements, if any. The Other Expense limitations as an annual percentage rate of average daily net assets for the Asia Equity, BRIC, Emerging Markets Equity and N-11 Equity Funds are 0.254%, 0.174%, 0.194% and 0.164%, respectively. Prior to February 27, 2015, the Other Expense limitation was 0.264% for the BRIC and Emerging Markets Equity Funds. These Other Expense limitations will remain in place through at least February 29, 2016 and prior to such date GSAMI may not terminate the arrangements without the approval of the Trustees. The Funds bear their respective share of costs related to proxy and shareholder meetings, and GSAMI has agreed to reimburse each Fund to the extent such expenses exceed a specified percentage of the Fund’s net assets. In addition, the Funds have entered into certain offset arrangements with the custodian and the transfer agent, which may result in a reduction of the Funds’ expenses and are received irrespective of the application of the “Other Expense” limitations described above.
For the six months ended April 30, 2015, these expense reductions, including any fee waivers and Other Expense reimbursements, were as follows:
| | | | | | | | | | | | | | | | | | |
| Fund | | | | Management
Fee Waiver | | | Other Expense
Reimbursement | | | Custody Fee
Credits | | | Total Expense
Reductions | |
Asia Equity | | | | $ | — | | | $ | 171,385 | | | $ | 871 | | | $ | 172,256 | |
BRIC | | | | | 188,931 | | | | 68,601 | | | | 281 | | | | 257,813 | |
Emerging Markets Equity | | | | | 323,522 | | | | 42,151 | | | | 1,682 | | | | 367,355 | |
N-11 Equity | | | | | 331,274 | | | | 268,332 | | | | 1,752 | | | | 601,358 | |
G. Line of Credit Facility — As of April 30, 2015, the Funds participated in a $1,080,000,000 committed, unsecured revolving line of credit facility (the “facility”) together with other funds of the Trust and registered investment companies having management agreements with GSAMI or its affiliates (“Other Borrowers”). Pursuant to the terms of the facility, the Funds and Other Borrowers could increase the credit amount by an additional $120,000,000, for a total of up to $1,200,000,000. This facility is to be used for temporary emergency purposes, or to allow for an orderly liquidation of securities to meet redemption requests. The interest rate on borrowings is based on the federal funds rate. The facility also requires a fee to be paid by the Funds based on the amount of the commitment that has not been utilized. For the six months ended April 30, 2015, the Funds did not have any borrowings under the facility. The facility was increased to $1,205,000,000 effective May 5, 2015.
60
GOLDMAN SACHS FUNDAMENTAL EMERGING MARKETS EQUITY FUNDS
|
| 4. AGREEMENTS AND AFFILIATED TRANSACTIONS (continued) |
H. Other Transactions with Affiliates — For the six months ended April 30, 2015, Goldman Sachs did not earn brokerage commissions from portfolio transactions.
As of April 30, 2015, the Goldman Sachs Satellite Strategies Portfolio was the beneficial owner of approximately 15% of total outstanding shares of the Emerging Markets Equity Fund.
As of April 30, 2015, the Goldman Sachs Group, Inc. was the beneficial owner of approximately 48% of the Class IR Shares of the Asia Equity Fund.
|
| 5. PORTFOLIO SECURITIES TRANSACTIONS |
The cost of purchases and proceeds from sales and maturities of long-term securities for the six months ended April 30, 2015, were as follows:
| | | | | | | | | | |
| Fund | | | | Purchases | | | Sales and Maturities | |
Asia Equity | | | | $ | 52,445,885 | | | $ | 55,774,657 | |
BRIC | | | | | 46,133,310 | | | | 70,633,580 | |
Emerging Markets Equity | | | | | 170,491,905 | | | | 179,146,771 | |
N-11 Equity | | | | | 104,358,951 | | | | 161,109,881 | |
As of the Funds’ most recent fiscal year end, October 31, 2014, the Funds’ capital loss carryforwards on a tax-basis were as follows:
| | | | | | | | | | | | | | | | |
| | | Asia Equity | | | BRIC | | | Emerging
Markets Equity | | | N-11 Equity | |
Capital loss carryforwards: | | | | | | | | | | | | | | | | |
Expiring 2016(1) | | $ | — | | | $ | (46,894,391 | ) | | $ | (16,387,620 | ) | | $ | — | |
Expiring 2017(1) | | | (11,355,624 | ) | | | (151,677,917 | ) | | | (445,745,035 | ) | | | — | |
Perpetual Long-term | | | — | | | | (16,568,112 | ) | | | — | | | | (1,196,012 | ) |
Perpetual Short-term | | | — | | | | (20,210,840 | ) | | | — | | | | (10,084,318 | ) |
Total capital loss carryforwards | | $ | (11,355,624 | ) | | $ | (235,351,260 | ) | | $ | (462,132,655 | ) | | $ | (11,280,330 | ) |
| (1) | | Expiration occurs on October 31 of the year indicated. |
As of April 30, 2015, the Funds’ aggregate security unrealized gains and losses based on cost for U.S. federal income tax purposes were as follows:
| | | | | | | | | | | | | | | | |
| | | Asia Equity | | | BRIC | | | Emerging
Markets Equity | | | N-11 Equity | |
Tax cost | | $ | 76,190,419 | | | $ | 127,057,330 | | | $ | 331,841,284 | | | $ | 334,820,238 | |
Gross unrealized gain | | | 13,868,879 | | | | 30,170,858 | | | | 66,050,012 | | | | 40,431,967 | |
Gross unrealized loss | | | (5,705,304 | ) | | | (10,271,564 | ) | | | (19,223,570 | ) | | | (25,625,972 | ) |
Net unrealized security gain | | $ | 8,163,575 | | | $ | 19,899,294 | | | $ | 46,826,442 | | | $ | 14,805,995 | |
61
GOLDMAN SACHS FUNDAMENTAL EMERGING MARKETS EQUITY FUNDS
Notes to Financial Statements (continued)
April 30, 2015 (Unaudited)
|
| 6. TAX INFORMATION (continued) |
The difference between GAAP-basis and tax-basis unrealized gains (losses) is attributable primarily to wash sales.
GSAMI has reviewed the Funds’ tax positions for all open tax years (the current and prior three years, as applicable) and has concluded that no provision for income tax is required in the Funds’ financial statements. Such open tax years remain subject to examination and adjustment by tax authorities.
The Funds’ risks include, but are not limited to, the following:
Foreign Custody Risk — A Fund that invests in foreign securities may hold such securities and foreign currency with foreign banks, agents, and securities depositories appointed by the Fund’s custodian (each a “Foreign Custodian”). Some foreign custodians may be recently organized or new to the foreign custody business. In some countries, Foreign Custodians may be subject to little or no regulatory oversight or independent evaluation of their operations. Further, the laws of certain countries may place limitations on a Fund’s ability to recover its assets if a Foreign Custodian enters bankruptcy. Investments in emerging markets may be subject to greater custody risks than investments in more developed markets. Custody services in emerging market countries are very often undeveloped and may be considerably less well regulated than in more developed countries, and thus may not afford the same level of investor protection as would apply in developed countries.
Geographic Risk — Concentration of the investments of a Fund in issuers located in a particular country or region will subject the Fund, to a greater extent than if investments were less concentrated, to the risks of adverse securities markets, exchange rates and social, political, regulatory or economic events which may occur in a given country or region. The Asia Equity Fund invests primarily in equity investments in Asian issuers. The BRIC Fund invests primarily in equity investments in Brazil, Russia, India and China issuers. The N-11 Equity Fund invests primarily in equity investments in the N-11 countries, and may invest up to 50% of its assets in any one N-11 country.
Investments in Other Investment Companies — As a shareholder of another investment company, including an exchange traded fund (“ETF”), a Fund will directly bear its proportionate share of any net management fees and other expenses paid by such other investment companies, in addition to the fees and expenses regularly borne by the Fund. ETFs are subject to risks that do not apply to conventional mutual funds, including but not limited to the following: (i) the market price of the ETF’s shares may trade at a premium or a discount to their NAV; and (ii) an active trading market for an ETF’s shares may not develop or be maintained.
Large Shareholder Transactions Risk — A Fund may experience adverse effects when certain large shareholders, such as other funds, institutional investors (including those trading by use of non-discretionary mathematical formulas), financial intermediaries (who may make investment decisions on behalf of underlying clients and/or include a Fund in their investment model), individuals, accounts and Goldman Sachs affiliates, purchase or redeem large amounts of shares of a Fund. Such large shareholder redemptions may cause the Fund to sell portfolio securities at times when it would not otherwise do so, which may negatively impact a Fund’s NAV and liquidity. Similarly, large Fund share purchases may adversely affect a Fund’s performance to the extent that a Fund is delayed in investing new cash and is required to maintain a larger cash position than it ordinarily would. These transactions may also accelerate the realization of taxable income to shareholders if such sales of investments resulted in gains, and may also increase transaction costs. In addition, a large redemption could result in a Fund’s current expenses being allocated over a smaller asset base, leading to an increase in the Fund’s expense ratio.
62
GOLDMAN SACHS FUNDAMENTAL EMERGING MARKETS EQUITY FUNDS
|
| 7. OTHER RISKS (continued) |
Liquidity Risk — The Funds may make investments that are illiquid or that may become less liquid in response to market developments or adverse investor perceptions. Illiquid investments may be more difficult to value. Liquidity risk may also refer to the risk that a Fund will not be able to pay redemption proceeds within the allowable time period because of unusual market conditions, an unusually high volume of redemption requests, or other reasons. To meet redemption requests, a Fund may be forced to sell investments at an unfavorable time and/or under unfavorable conditions.
Market and Credit Risks — In the normal course of business, the Funds trade financial instruments and enter into financial transactions where risk of potential loss exists due to changes in the market (market risk). Additionally, the Funds may also be exposed to credit risk in the event that an issuer or guarantor fails to perform or that an institution or entity with which the Funds have unsettled or open transactions defaults.
Investing in foreign markets may involve special risks and considerations not typically associated with investing in the U.S. Foreign securities may be subject to risk of loss because of more or less foreign government regulation, less public information and less economic, political and social stability in the countries in which the Fund invests. Loss may also result from the imposition of exchange controls, confiscations and other government restrictions by the U.S. or other governments, or from problems in registration, settlement or custody. Foreign risk also involves the risk of negative foreign currency rate fluctuations, which may cause the value of securities denominated in such foreign currency (or other instruments through which the Fund has exposure to foreign currencies) to decline in value. Currency exchange rates may fluctuate significantly over short periods of time. To the extent that the Fund also invests in securities of issuers located in emerging markets, these risks may be more pronounced.
Non-Diversification Risk — The BRIC and N-11 Equity Funds are non-diversified, meaning that they are permitted to invest a larger percentage of their assets in fewer issuers than diversified mutual funds. Thus, a Fund may be more susceptible to adverse developments affecting any single issuer held in its portfolio, and may be more susceptible to greater losses because of these developments.
Under the Trust’s organizational documents, its Trustees, officers, employees and agents are indemnified, to the extent permitted by the Act and state law, against certain liabilities that may arise out of performance of their duties to the Funds. Additionally, in the course of business, the Funds enter into contracts that contain a variety of indemnification clauses. The Funds’ maximum exposure under these arrangements is unknown, as this would involve future claims that may be made against the Funds that have not yet occurred. However, GSAMI believes the risk of loss under these arrangements to be remote.
Subsequent events after the Statement of Assets and Liabilities date have been evaluated through the date the financial statements were issued. GSAMI has concluded that there is no impact requiring adjustment or disclosure in the financial statements.
63
GOLDMAN SACHS FUNDAMENTAL EMERGING MARKETS EQUITY FUNDS
Notes to Financial Statements (continued)
April 30, 2015 (Unaudited)
|
| 10. SUMMARY OF SHARE TRANSACTIONS |
Share activity is as follows:
| | | | | | | | | | | | | | | | |
| | | Asia Equity Fund | |
| | | | |
| | | For the Six Months Ended
April 30, 2015
(Unaudited) | | | For the Fiscal Year Ended
October 31, 2014 | |
| | | | |
| | | Shares | | | Dollars | | | Shares | | | Dollars | |
| | | | |
| Class A Shares | | | | | | | | | | | | | | | | |
Shares sold | | | 42,300 | | | $ | 874,955 | | | | 372,532 | | | $ | 7,189,718 | |
Shares issued in connection with merger | | | — | | | | — | | | | 1,463 | | | | 28,606 | |
Shares converted from Class B | | | 3,947 | | | | 79,446 | | | | 1,317 | | | | 26,035 | |
Reinvestment of distributions | | | — | | | | — | | | | 2,986 | | | | 56,823 | |
Shares redeemed | | | (45,073 | ) | | | (928,915 | ) | | | (472,608 | ) | | | (8,338,547 | ) |
| | | | 1,174 | | | | 25,486 | | | | (94,310 | ) | | | (1,037,365 | ) |
| Class B Shares(a) | | | | | | | | | | | | | | | | |
Shares sold | | | — | | | | — | | | | — | (b) | | | 6 | |
Shares converted to Class A | | | (4,175 | ) | | | (79,446 | ) | | | (1,387 | ) | | | (26,035 | ) |
Shares redeemed | | | (11,670 | ) | | | (221,835 | ) | | | (17,216 | ) | | | (320,899 | ) |
| | | | (15,845 | ) | | | (301,281 | ) | | | (18,603 | ) | | | (346,928 | ) |
| Class C Shares | | | | | | | | | | | | | | | | |
Shares sold | | | 8,133 | | | | 165,725 | | | | 30,077 | | | | 558,916 | |
Shares issued in connection with merger | | | — | | | | — | | | | 16,455 | | | | 301,777 | |
Shares redeemed | | | (9,972 | ) | | | (189,415 | ) | | | (63,003 | ) | | | (1,163,371 | ) |
| | | | (1,839 | ) | | | (23,690 | ) | | | (16,471 | ) | | | (302,678 | ) |
| Institutional Shares | | | | | | | | | | | | | | | | |
Shares sold | | | 65,886 | | | | 1,437,017 | | | | 142,559 | | | | 2,978,318 | |
Shares issued in connection with merger | | | — | | | | — | | | | 1,213,633 | | | | 24,806,694 | |
Reinvestment of distributions | | | 9,275 | | | | 191,440 | | | | 16,939 | | | | 336,570 | |
Shares redeemed | | | (202,239 | ) | | | (4,372,199 | ) | | | (520,995 | ) | | | (10,549,989 | ) |
| | | | (127,078 | ) | | | (2,743,742 | ) | | | 852,136 | | | | 17,571,593 | |
| Class IR Shares(c) | | | | | | | | | | | | | | | | |
Shares sold | | | — | | | | — | | | | 1,995 | | | | 42,341 | |
Shares issued in connection with merger | | | — | | | | — | | | | 443 | | | | 9,065 | |
Reinvestment of distributions | | | 6 | | | | 134 | | | | — | | | | — | |
| | | | 6 | | | | 134 | | | | 2,438 | | | | 51,406 | |
NET INCREASE (DECREASE) | | | (143,582 | ) | | $ | (3,043,093 | ) | | | 725,190 | | | $ | 15,936,028 | |
| (a) | | Class B Shares converted into Class A Shares at the close of business on November 14, 2014. |
| (b) | | Shares are less than 1. |
| (c) | | Class IR Shares commenced operations on February 28, 2014. |
64
GOLDMAN SACHS FUNDAMENTAL EMERGING MARKETS EQUITY FUNDS
|
| 10. SUMMARY OF SHARE TRANSACTIONS (continued) |
Share activity is as follows:
| | | | | | | | | | | | | | | | |
| | | BRIC Fund | |
| | | | |
| | | For the Six Months Ended
April 30, 2015
(Unaudited) | | | For the Fiscal Year Ended
October 31, 2014 | |
| | | | |
| | | Shares | | | Dollars | | | Shares | | | Dollars | |
| | | | |
| Class A Shares | | | | | | | | | | | | | | | | |
Shares sold | | | 345,306 | | | $ | 4,690,398 | | | | 415,883 | | | $ | 5,385,668 | |
Reinvestment of distributions | | | 13,373 | | | | 169,434 | | | | 64,277 | | | | 830,475 | |
Shares redeemed | | | (776,469 | ) | | | (10,201,917 | ) | | | (3,044,695 | ) | | | (39,398,354 | ) |
| | | | (417,790 | ) | | | (5,342,085 | ) | | | (2,564,535 | ) | | | (33,182,211 | ) |
| Class C Shares | | | | | | | | | | | | | | | | |
Shares sold | | | 62,722 | | | | 805,501 | | | | 187,723 | | | | 2,283,648 | |
Reinvestment of distributions | | | — | | | | — | | | | 5,310 | | | | 65,892 | |
Shares redeemed | | | (536,944 | ) | | | (6,698,348 | ) | | | (1,439,564 | ) | | | (17,614,746 | ) |
| | | | (474,222 | ) | | | (5,892,847 | ) | | | (1,246,531 | ) | | | (15,265,206 | ) |
| Institutional Shares | | | | | | | | | | | | | | | | |
Shares sold | | | 93,736 | | | | 1,295,468 | | | | 519,033 | | | | 7,130,132 | |
Reinvestment of distributions | | | 33,670 | | | | 434,008 | | | | 113,871 | | | | 1,497,408 | |
Shares redeemed | | | (995,739 | ) | | | (13,248,969 | ) | | | (4,545,962 | ) | | | (59,413,491 | ) |
| | | | (868,333 | ) | | | (11,519,493 | ) | | | (3,913,058 | ) | | | (50,785,951 | ) |
| Class IR Shares | | | | | | | | | | | | | | | | |
Shares sold | | | 4,045 | | | | 56,446 | | | | 39,434 | | | | 519,031 | |
Reinvestment of distributions | | | 214 | | | | 2,779 | | | | 712 | | | | 9,450 | |
Shares redeemed | | | (18,748 | ) | | | (251,706 | ) | | | (54,713 | ) | | | (711,230 | ) |
| | | | (14,489 | ) | | | (192,481 | ) | | | (14,567 | ) | | | (182,749 | ) |
NET DECREASE | | | (1,774,834 | ) | | $ | (22,946,906 | ) | | | (7,738,691 | ) | | $ | (99,416,117 | ) |
65
GOLDMAN SACHS FUNDAMENTAL EMERGING MARKETS EQUITY FUNDS
Notes to Financial Statements (continued)
April 30, 2015 (Unaudited)
|
| 10. SUMMARY OF SHARE TRANSACTIONS (continued) |
Share activity is as follows:
| | | | | | | | | | | | | | | | |
| | | Emerging Markets Equity Fund | |
| | | | |
| | | For the Six Months Ended
April 30, 2015
(Unaudited) | | | For the Fiscal Year Ended
October 31, 2014 | |
| | | | |
| | | Shares | | | Dollars | | | Shares | | | Dollars | |
| | | | |
| Class A Shares | | | | | | | | | | | | | | | | |
Shares sold | | | 1,120,313 | | | $ | 17,916,001 | | | | 477,560 | | | $ | 7,381,033 | |
Shares converted from Class B | | | 22,303 | | | | 355,064 | | | | 7,144 | | | | 108,897 | |
Reinvestment of distributions | | | — | | | | — | | | | 9,026 | | | | 136,017 | |
Shares redeemed | | | (276,316 | ) | | | (4,381,644 | ) | | | (1,140,560 | ) | | | (17,611,834 | ) |
| | | | 866,300 | | | | 13,889,421 | | | | (646,830 | ) | | | (9,985,887 | ) |
| Class B Shares(a) | | | | | | | | | | | | | | | | |
Shares sold | | | — | | | | — | | | | 549 | | | | 7,536 | |
Shares converted to Class A | | | (24,726 | ) | | | (355,064 | ) | | | (7,885 | ) | | | (108,897 | ) |
Shares redeemed | | | (97,564 | ) | | | (1,400,667 | ) | | | (124,011 | ) | | | (1,728,895 | ) |
| | | | (122,290 | ) | | | (1,755,731 | ) | | | (131,347 | ) | | | (1,830,256 | ) |
| Class C Shares | | | | | | | | | | | | | | | | |
Shares sold | | | 56,592 | | | | 833,982 | | | | 123,764 | | | | 1,763,211 | |
Shares redeemed | | | (90,837 | ) | | | (1,301,144 | ) | | | (208,565 | ) | | | (2,886,901 | ) |
| | | | (34,245 | ) | | | (467,162 | ) | | | (84,801 | ) | | | (1,123,690 | ) |
| Institutional Shares | | | | | | | | | | | | | | | | |
Shares sold | | | 2,148,361 | | | | 35,712,215 | | | | 3,001,698 | | | | 49,094,434 | |
Reinvestment of distributions | | | 52,352 | | | | 866,429 | | | | 158,000 | | | | 2,532,738 | |
Shares redeemed | | | (3,220,489 | ) | | | (54,746,521 | ) | | | (9,306,768 | ) | | | (149,200,716 | ) |
| | | | (1,019,776 | ) | | | (18,167,877 | ) | | | (6,147,070 | ) | | | (97,573,544 | ) |
| Service Shares | | | | | | | | | | | | | | | | |
Shares sold | | | 180,952 | | | | 2,862,411 | | | | 400,257 | | | | 6,069,974 | |
Reinvestment of distributions | | | — | | | | — | | | | 2,389 | | | | 34,951 | |
Shares redeemed | | | (113,569 | ) | | | (1,738,513 | ) | | | (366,690 | ) | | | (5,566,727 | ) |
| | | | 67,383 | | | | 1,123,898 | | | | 35,956 | | | | 538,198 | |
| Class IR Shares | | | | | | | | | | | | | | | | |
Shares sold | | | 658 | | | | 11,403 | | | | 5,140 | | | | 82,952 | |
Reinvestment of distributions | | | 29 | | | | 472 | | | | 118 | | | | 1,886 | |
Shares redeemed | | | (2,804 | ) | | | (46,616 | ) | | | (7,275 | ) | | | (117,780 | ) |
| | | | (2,117 | ) | | | (34,741 | ) | | | (2,017 | ) | | | (32,942 | ) |
NET DECREASE | | | (244,745 | ) | | $ | (5,412,192 | ) | | | (6,976,109 | ) | | $ | (110,008,121 | ) |
| (a) | | Class B Shares converted into Class A Shares at the close of business on November 14, 2014. |
66
GOLDMAN SACHS FUNDAMENTAL EMERGING MARKETS EQUITY FUNDS
|
| 10. SUMMARY OF SHARE TRANSACTIONS (continued) |
Share activity is as follows:
| | | | | | | | | | | | | | | | |
| | | N-11 Equity Fund | |
| | | | |
| | | For the Six Months Ended
April 30, 2015
(Unaudited) | | | For the Fiscal Year Ended
October 31, 2014 | |
| | | | |
| | | Shares | | | Dollars | | | Shares | | | Dollars | |
| | | | |
| Class A Shares | | | | | | | | | | | | | | | | |
Shares sold | | | 674,813 | | | $ | 7,134,014 | | | | 2,292,086 | | | $ | 25,823,261 | |
Reinvestment of distributions | | | 541 | | | | 5,728 | | | | 52,792 | | | | 572,818 | |
Shares redeemed | | | (1,977,345 | ) | | | (20,800,851 | ) | | | (4,165,612 | ) | | | (46,492,946 | ) |
| | | | (1,301,991 | ) | | | (13,661,109 | ) | | | (1,820,734 | ) | | | (20,096,867 | ) |
| Class C Shares | | | | | | | | | | | | | | | | |
Shares sold | | | 22,182 | | | | 230,432 | | | | 108,780 | | | | 1,173,462 | |
Reinvestment of distributions | | | — | | | | — | | | | 1,484 | | | | 15,699 | |
Shares redeemed | | | (222,960 | ) | | | (2,299,017 | ) | | | (492,940 | ) | | | (5,299,728 | ) |
| | | | (200,778 | ) | | | (2,068,585 | ) | | | (382,676 | ) | | | (4,110,567 | ) |
| Institutional Shares | | | | | | | | | | | | | | | | |
Shares sold | | | 2,403,248 | | | | 25,534,082 | | | | 7,945,164 | | | | 89,002,301 | |
Reinvestment of distributions | | | 99,758 | | | | 1,060,423 | | | | 223,827 | | | | 2,443,811 | |
Shares redeemed | | | (6,406,366 | ) | | | (68,090,107 | ) | | | (8,571,125 | ) | | | (94,251,261 | ) |
| | | | (3,903,360 | ) | | | (41,495,602 | ) | | | (402,134 | ) | | | (2,805,149 | ) |
| Class IR Shares | | | | | | | | | | | | | | | | |
Shares sold | | | 129,223 | | | | 1,373,544 | | | | 357,823 | | | | 3,953,269 | |
Reinvestment of distributions | | | 6,906 | | | | 73,277 | | | | 23,756 | | | | 258,613 | |
Shares redeemed | | | (500,565 | ) | | | (5,267,814 | ) | | | (1,249,742 | ) | | | (13,467,475 | ) |
| | | | (364,436 | ) | | | (3,820,993 | ) | | | (868,163 | ) | | | (9,255,593 | ) |
NET DECREASE | | | (5,770,565 | ) | | $ | (61,046,289 | ) | | | (3,473,707 | ) | | $ | (36,268,176 | ) |
67
GOLDMAN SACHS FUNDAMENTAL EMERGING MARKETS EQUITY FUNDS
Fund Expenses — Six Month Period Ended April 30, 2015 (Unaudited)
As a shareholder of Class A, Class C, Institutional, Service or Class IR Shares of a Fund you incur two types of costs: (1) transaction costs, including sales charges on purchase payments (with respect to Class A Shares) and contingent deferred sales charges on redemptions (with respect to Class C Shares); and (2) ongoing costs, including management fees; distribution and service (12b-1) fees (with respect to Class A and Class C Shares); and other Fund expenses. This example is intended to help you understand your ongoing costs (in dollars) of investing in Class A, Class C, Institutional, Service and Class IR Shares of the Funds and to compare these costs with the ongoing costs of investing in other mutual funds.
The example is based on an investment of $1,000 invested at the beginning of the period and held for the entire period from November 1, 2014 through April 30, 2015.
Actual Expenses — The first line under each share class in the table below provides information about actual account values and actual expenses. You may use the information in this line, together with the amount you invested, to estimate the expenses that you paid over the period. Simply divide your account value by $1,000 (for example, an $8,600 account value divided by $1,000=8.6), then multiply the result by the number in the first line under the heading entitled “Expenses Paid” to estimate the expenses you paid on your account during this period.
Hypothetical Example for Comparison Purposes — The second line under each share class in the table below provides information about hypothetical account values and hypothetical expenses based on the Funds’ actual net expense ratio and an assumed rate of return of 5% per year before expenses, which is not the Funds’ actual return. The hypothetical account values and expenses may not be used to estimate the actual ending account balance or expenses you paid for the period. You may use this information to compare the ongoing costs of investing in the Funds and other funds. To do so, compare this 5% hypothetical example with the 5% hypothetical examples that appear in the shareholder reports of the other funds.
Please note that the expenses shown in the table are meant to highlight your ongoing costs only and do not reflect any transactional costs, such as sales charges, redemption fees, or exchange fees. Therefore, the second line of the table is useful in comparing ongoing costs only, and will not help you determine the relative total costs of owning different funds. In addition, if these transactional costs were included, your costs would have been higher.
| | | | | | | | | | | | | | | | | | | | | | | | | | | | | | | | | | | | | | | | | | | | | | | | |
| | | Asia Equity Fund | | | BRIC Fund | | | Emerging Markets Equity Fund | | | N-11 Equity Fund | |
| Share Class | | Beginning
Account
Value
11/01/14 | | | Ending
Account
Value
04/30/15 | | | Expenses
Paid for the
6 Months
Ended
04/30/15* | | | Beginning
Account
Value
11/01/14 | | | Ending
Account
Value
04/30/15 | | | Expenses
Paid for the
6 Months
Ended
04/30/15* | | | Beginning
Account
Value
11/01/14 | | | Ending
Account
Value
04/30/15 | | | Expenses
Paid for the
6 Months
Ended
04/30/15* | | | Beginning
Account
Value
11/01/14 | | | Ending
Account
Value
04/30/15 | | | Expenses
Paid for the
6 Months
Ended
04/30/15* | |
| Class A | | | | | | | | | | | | | | | | | | | | | | | | | | | | | | | | | | | | | | | | | | | | | | | | |
Actual | | $ | 1,000 | | | $ | 1,123.30 | | | $ | 8.90 | | | $ | 1,000 | | | $ | 1,211.00 | | | $ | 9.26 | | | $ | 1,000 | | | $ | 1,065.00 | | | $ | 8.65 | | | $ | 1,000 | | | $ | 928.10 | | | $ | 8.27 | |
Hypothetical 5% return | | | 1,000 | | | | 1,016.41 | + | | | 8.45 | | | | 1,000 | | | | 1,016.41 | + | | | 8.45 | | | | 1,000 | | | | 1,016.41 | + | | | 8.45 | | | | 1,000 | | | | 1,016.22 | + | | | 8.65 | |
| Class C | | | | | | | | | | | | | | | | | | | | | | | | | | | | | | | | | | | | | | | | | | | | | | | | |
Actual | | | 1,000 | | | | 1,119.10 | | | | 12.82 | | | | 1,000 | | | | 1,202.40 | | | | 13.32 | | | | 1,000 | | | | 1,060.50 | | | | 12.52 | | | | 1,000 | | | | 925.40 | | | | 11.84 | |
Hypothetical 5% return | | | 1,000 | | | | 1,012.69 | + | | | 12.18 | | | | 1,000 | | | | 1,012.69 | + | | | 12.18 | | | | 1,000 | | | | 1,012.65 | + | | | 12.23 | | | | 1,000 | | | | 1,012.50 | + | | | 12.37 | |
| Institutional | | | | | | | | | | | | | | | | | | | | | | | | | | | | | | | | | | | | | | | | | | | | | | | | |
Actual | | | 1,000 | | | | 1,125.90 | | | | 6.80 | | | | 1,000 | | | | 1,215.10 | | | | 7.14 | | | | 1,000 | | | | 1,066.70 | | | | 6.66 | | | | 1,000 | | | | 931.10 | | | | 6.37 | |
Hypothetical 5% return | | | 1,000 | | | | 1,018.40 | + | | | 6.46 | | | | 1,000 | | | | 1,018.35 | + | | | 6.51 | | | | 1,000 | | | | 1,018.35 | + | | | 6.51 | | | | 1,000 | | | | 1,018.20 | + | | | 6.66 | |
| Service | | | | | | | | | | | | | | | | | | | | | | | | | | | | | | | | | | | | | | | | | | | | | | | | |
Actual | | | N/A | | | | N/A | | | | N/A | | | | N/A | | | | N/A | | | | N/A | | | | 1,000 | | | | 1,064.40 | | | | 9.21 | | | | N/A | | | | N/A | | | | N/A | |
Hypothetical 5% return | | | N/A | | | | N/A | | | | N/A | | | | N/A | | | | N/A | | | | N/A | | | | 1,000 | | | | 1,015.87 | + | | | 9.00 | | | | N/A | | | | N/A | | | | N/A | |
| Class IR | | | | | | | | | | | | | | | | | | | | | | | | | | | | | | | | | | | | | | | | | | | | | | | | |
Actual | | | 1,000 | | | | 1,125.00 | | | | 7.59 | | | | 1,000 | | | | 1,214.10 | | | | 7.91 | | | | 1,000 | | | | 1,066.40 | | | | 7.43 | | | | 1,000 | | | | 930.20 | | | | 7.08 | |
Hypothetical 5% return | | | 1,000 | | | | 1,017.65 | + | | | 7.20 | | | | 1,000 | | | | 1,017.65 | + | | | 7.20 | | | | 1,000 | | | | 1,017.60 | + | | | 7.25 | | | | 1,000 | | | | 1,017.46 | + | | | 7.40 | |
| * | | Expenses are calculated using each Fund’s annualized net expense ratio for each class, which represents the ongoing expenses as a percentage of net assets for the six months ended April 30, 2015. Expenses are calculated by multiplying the annualized net expense ratio by the average account value for the period; then multiplying the result by the number of days in the most recent fiscal half year; and then dividing that result by the number of days in the fiscal year. The annualized net expense ratios for the period were as follows: |
| | | | | | | | | | | | | | | | | | | | |
| Fund | | Class A | | | Class C | | | Institutional | | | Service | | | Class IR | |
Asia Equity | | | 1.69 | % | | | 2.44 | % | | | 1.29 | % | | | N/A | | | | 1.44 | % |
BRIC | | | 1.69 | | | | 2.44 | | | | 1.30 | | | | N/A | | | | 1.44 | |
Emerging Markets Equity | | | 1.69 | | | | 2.45 | | | | 1.30 | | | | 1.80 | % | | | 1.45 | |
N-11 Equity | | | 1.73 | | | | 2.48 | | | | 1.33 | | | | N/A | | | | 1.48 | |
| + | | Hypothetical expenses are based on each Fund’s actual annualized net expense ratios and an assumed rate of return of 5% per year before expenses. |
68
FUNDS PROFILE
Goldman Sachs Funds

Goldman Sachs is a premier financial services firm, known since 1869 for creating thoughtful and customized investment solutions in complex global markets.
Today, the Investment Management Division of Goldman Sachs serves a diverse set of clients worldwide, including private institutions, public entities and individuals. With approximately $1.02 trillion in assets under supervision as of March 31, 2015, Goldman Sachs Asset Management (“GSAM”) has portfolio management teams located around the world and our investment professionals bring firsthand knowledge of local markets to every investment decision. Assets under supervision includes assets under management and other client assets for which Goldman Sachs does not have full discretion. GSAM leverages the resources of Goldman, Sachs & Co. subject to legal, internal and regulatory restrictions.

Money Market1
Financial Square FundsSM
| n | | Financial Square Tax-Exempt Funds |
| n | | Financial Square Federal Fund |
| n | | Financial Square Government Fund |
| n | | Financial Square Money Market Fund |
| n | | Financial Square Prime Obligations Fund |
| n | | Financial Square Treasury Instruments Fund |
| n | | Financial Square Treasury Obligations Fund |
Fixed Income
Short Duration and Government
| n | | High Quality Floating Rate Fund |
| n | | Limited Maturity Obligations Fund |
| n | | Short Duration Government Fund |
| n | | Short Duration Income Fund |
| n | | Inflation Protected Securities Fund |
Multi-Sector
Municipal and Tax-Free
| n | | High Yield Municipal Fund |
| n | | Dynamic Municipal Income Fund3 |
| n | | Short Duration Tax-Free Fund |
Single Sector
| n | | Investment Grade Credit Fund |
| n | | High Yield Floating Rate Fund |
| n | | Emerging Markets Debt Fund |
| n | | Local Emerging Markets Debt Fund |
| n | | Dynamic Emerging Markets Debt Fund |
Fixed Income Alternatives
| n | | Long Short Credit Strategies Fund |
| n | | Fixed Income Macro Strategies Fund |
Fundamental Equity
| n | | Small/Mid Cap Value Fund |
| n | | Small/Mid Cap Growth Fund |
| n | | Flexible Cap Growth Fund |
| n | | Concentrated Growth Fund |
| n | | Technology Tollkeeper Fund |
| n | | Growth Opportunities Fund |
| n | | Rising Dividend Growth Fund |
| n | | Dynamic U.S. Equity Fund4 |
Tax-Advantaged Equity
| n | | U.S. Tax-Managed Equity Fund |
| n | | International Tax-Managed Equity Fund |
| n | | U.S. Equity Dividend and Premium Fund |
| n | | International Equity Dividend and Premium Fund |
Equity Insights
| n | | Small Cap Equity Insights Fund |
| n | | U.S. Equity Insights Fund |
| n | | Small Cap Growth Insights Fund |
| n | | Large Cap Growth Insights Fund |
| n | | Large Cap Value Insights Fund |
| n | | Small Cap Value Insights Fund |
| n | | International Small Cap Insights Fund |
| n | | International Equity Insights Fund |
| n | | Emerging Markets Equity Insights Fund |
Fundamental Equity International
| n | | Strategic International Equity Fund |
| n | | Focused International Equity Fund |
| n | | International Small Cap Fund |
| n | | Emerging Markets Equity Fund |
| n | | BRIC Fund (Brazil, Russia, India, China) |
Select Satellite5
| n | | Multi-Manager Non-Core Fixed Income Fund |
| n | | Real Estate Securities Fund |
| n | | International Real Estate Securities Fund |
| n | | Commodity Strategy Fund |
| n | | Dynamic Commodity Strategy Fund |
| n | | Dynamic Allocation Fund |
| n | | Absolute Return Tracker Fund |
| n | | Managed Futures Strategy Fund |
| n | | MLP Energy Infrastructure Fund |
| n | | Multi-Manager Alternatives Fund |
| n | | Multi-Asset Real Return Fund |
| n | | Retirement Portfolio Completion Fund |
| n | | Tactical Tilt Implementation Fund |
Total Portfolio Solutions5
| n | | Balanced Strategy Portfolio |
| n | | Growth and Income Strategy Portfolio |
| n | | Growth Strategy Portfolio |
| n | | Equity Growth Strategy Portfolio |
| n | | Satellite Strategies Portfolio |
| n | | Enhanced Dividend Global Equity Portfolio |
| n | | Tax Advantaged Global Equity Portfolio |
| 1 | | An investment in a money market fund is neither insured nor guaranteed by the Federal Deposit Insurance Corporation (“FDIC”) or any other government agency. Although the Funds seek to preserve the value of your investment at $1.00 per share, it is possible to lose money by investing in the Funds. |
| 2 | | Effective on October 1, 2014, the Goldman Sachs Core Plus Fixed Income Fund was renamed the Goldman Sachs Bond Fund. |
| 3 | | Effective on December 18, 2014, the Goldman Sachs Municipal Income Fund was renamed the Goldman Sachs Dynamic Municipal Income Fund. |
| 4 | | Effective on April 30, 2015, the Goldman Sachs U.S. Equity Fund was renamed the Goldman Sachs Dynamic U.S. Equity Fund. |
| 5 | | Individual Funds within the Total Portfolio Solutions and Select Satellite categories will have various placement on the risk/return spectrum and may have greater or lesser risk than that indicated by the placement of the general Total Portfolio Solutions or Select Satellite category. |
Financial Square FundsSM is a registered service mark of Goldman, Sachs & Co.
| * | | This list covers open-end funds only. Please visit our web site at www.GSAMFUNDS.com to learn about our closed-end funds. |
| | |
TRUSTEES Ashok N. Bakhru, Chairman Kathryn A. Cassidy John P. Coblentz, Jr. Diana M. Daniels Joseph P. LoRusso Herbert J. Markley James A. McNamara Jessica Palmer Alan A. Shuch Richard P. Strubel Roy W. Templin Gregory G. Weaver | | OFFICERS James A. McNamara, President Scott M. McHugh, Principal Financial Officer and Treasurer Caroline L. Kraus, Secretary |
| |
GOLDMAN, SACHS & CO. Distributor and Transfer Agent | | GOLDMAN SACHS ASSET MANAGEMENT, INTERNATIONAL L.P. Investment Adviser |
Visit our web site at www.GSAMFUNDS.com to obtain the most recent month-end returns.
Goldman Sachs Asset Management, L.P., 200 West Street, New York, New York 10282
The reports concerning the Funds included in this shareholder report may contain certain forward-looking statements about the factors that may affect the performance of the Funds in the future. These statements are based on Fund management’s predictions and expectations concerning certain future events and their expected impact on the Funds, such as performance of the economy as a whole and of specific industry sectors, changes in the levels of interest rates, the impact of developing world events, and other factors that may influence the future performance of the Funds. Management believes these forward-looking statements to be reasonable, although they are inherently uncertain and difficult to predict. Actual events may cause adjustments in portfolio management strategies from those currently expected to be employed.
A description of the policies and procedures that the Funds use to determine how to vote proxies relating to portfolio securities and information regarding how a Fund voted proxies relating to portfolio securities during the most recent 12-month period ended June 30 is available (I) without charge, upon request by calling 1-800-526-7384 (for Retail Shareholders) or 1-800-621-2550 (for Institutional Shareholders); and (II) on the Securities and Exchange Commission (“SEC”) web site at http://www.sec.gov.
The Funds file their complete schedule of portfolio holdings with the SEC for the first and third quarters of each fiscal year on Form N-Q. The Funds’ Forms N-Q are available on the SEC’s web site at http://www.sec.gov within 60 days after the Funds’ first and third fiscal quarters. The Funds’ Forms N-Q may be reviewed and copied at the SEC’s Public Reference Room in Washington, D.C., and information on the operation of the Public Reference Room may also be obtained by calling 1-800-SEC-0330. Forms N-Q may be obtained upon request and without charge by calling 1-800-526-7384 (for Retail Shareholders) or 1-800-621-2550 (for Institutional Shareholders).
The website links provided are for your convenience only and are not an endorsement or recommendation by GSAM of any of these websites or the products or services offered. GSAM is not responsible for the accuracy and validity of the content of these websites.
Fund holdings and allocations shown are as of April 30, 2015 and may not be representative of future investments. Fund holdings should not be relied on in making investment decisions and should not be construed as research or investment advice regarding particular securities. Current and future holdings are subject to risk.
Economic and market forecasts presented herein reflect a series of assumptions and judgments as of the date of this presentation and are subject to change without notice. These forecasts do not take into account the specific investment objectives, restrictions, tax and financial situation or other needs of any specific client. Actual data will vary and may not be reflected here. These forecasts are subject to high levels of uncertainty that may affect actual performance. Accordingly, these forecasts should be viewed as merely representative of a broad range of possible outcomes. These forecasts are estimated, based on assumptions, and are subject to significant revision and may change materially as economic and market conditions change. Goldman Sachs has no obligation to provide updates or changes to these forecasts. Case studies and examples are for illustrative purposes only.
The Global Industry Classification Standard (GICS) was developed by and is the exclusive property and a service mark of Morgan Stanley Capital International Inc. (MSCI) and Standard & Poor’s, a division of The McGraw-Hill Companies, Inc. (S&P) and is licensed for use by Goldman Sachs. Neither MSCI, S&P nor any other party involved in making or compiling the GICS or any GICS classifications makes any express or implied warranties or representations with respect to such standard or classification (or the results to be obtained by the use thereof), and all such parties hereby expressly disclaim all warranties of originality, accuracy, completeness, merchantability or fitness for a particular purpose with respect to any of such standard or classification. Without limiting any of the foregoing, in no event shall MSCI, S&P, any of their affiliates or any third party involved in making or compiling the GICS or any GICS classifications have any liability for any direct, indirect, special, punitive, consequential or any other damages (including lost profits) even if notified of the possibility of such damages.
The portfolio risk management process includes an effort to monitor and manage risk, but does not imply low risk.
This material is not authorized for distribution to prospective investors unless preceded or accompanied by a current Prospectus or summary prospectus, if applicable. Investors should consider a Fund’s objective, risks, and charges and expenses, and read the summary prospectus, if available, and/or the Prospectus carefully before investing or sending money. The summary prospectus, if available, and the Prospectus contain this and other information about a Fund and may be obtained from your authorized dealer or from Goldman, Sachs & Co. by calling (retail – 1-800-526-7384) (institutional – 1-800-621-2550).
© 2015 Goldman Sachs. All rights reserved. 164471.MF.MED.TMPL/6/2015 EMESAR-15 / 18.7K
| | (a) | As of the end of the period covered by this report, the registrant has adopted a code of ethics that applies to the registrant’s principal executive officer, principal financial officer, principal accounting officer or controller, or persons performing similar functions, regardless of whether these individuals are employed by the registrant or a third party (the “Code of Ethics”). |
| | (b) | During the period covered by this report, no amendments were made to the provisions of the Code of Ethics. |
| | (c) | During the period covered by this report, the registrant did not grant any waivers, including an implicit waiver, from any provision of the Code of Ethics. |
| | (d) | A copy of the Code of Ethics is available as provided in Item 12(a)(1) of this report. |
| ITEM 3. | AUDIT COMMITTEE FINANCIAL EXPERT. |
| | The registrant’s board of trustees has determined that the registrant has at least one “audit committee financial expert” (as defined in Item 3 of Form N-CSR) serving on its audit committee. John P. Coblentz, Jr. is the “audit committee financial expert” and is “independent” (as each term is defined in Item 3 of Form N-CSR). |
| ITEM 4. | PRINCIPAL ACCOUNTANT FEES AND SERVICES. |
Table 1 — Items 4(a) - 4(d). The accountant fees below reflect the aggregate fees billed by all of the Funds of the Goldman Sachs Trust and includes the Goldman Sachs Funds to which this certified shareholder report relates.
| | | | | | | | | | | | |
| | | 2014 | | 2013 | | Description of Services Rendered |
| | | |
| | | | | | | | | | | | |
| | | |
Audit Fees: | | | | | | | | | | | | |
| | | |
• PricewaterhouseCoopers LLP
(“PwC”) | | | $ | 4,291,739 | | | | $ | 2,304,956 | | | Financial Statement audits. |
| | | |
Audit-Related Fees: | | | | | | | | | | | | |
| | | |
• PwC | | | $ | 0 | | | | $ | 2,340 | | | Other attest services. |
| | | |
Tax Fees: | | | | | | | | | | | | |
| | | |
• PwC | | | $ | 794,850 | | | | $ | 864,950 | | | Tax compliance services provided in connection with the preparation and review of registrant’s tax returns. |
Table 2 — Items 4(b)(c) & (d). Non-Audit Services to the Goldman Sachs Trust’s service affiliates * that were pre-approved by the Audit Committee of the Goldman Sachs Trust pursuant to Rule 2-01(c)(7)(ii) of Regulation S-X.
| | | | | | | | | | | | |
| | | 2014 | | 2013 | | Description of Services Rendered |
| | | |
| | | | | | | | | | | | |
| | | |
Audit-Related Fees: | | | | | | | | | | | | |
| | | |
• PwC | | | $ | 1,486,420 | | | | $ | 1,516,680 | | | Internal control review performed in accordance with Statement on Standards for Attestation Engagements No. 16. These fees are borne by the Funds’ Adviser. |
| * | These include the advisor (excluding sub-advisors) and any entity controlling, controlled by or under common control with the advisor that provides ongoing services to the registrant (hereinafter referred to as “service affiliates”). |
Item 4(e)(1) — Audit Committee Pre-Approval Policies and Procedures
Pre-Approval of Audit and Non-Audit Services Provided to the Funds of the Goldman Sachs Trust. The Audit and Non-Audit Services Pre-Approval Policy (the “Policy”) adopted by the Audit Committee of Goldman Sachs Trust (“GST”) sets forth the procedures and the conditions pursuant to which services performed by an independent auditor for GST may be pre-approved. Services may be pre-approved specifically by the Audit Committee as a whole or, in certain circumstances, by the Audit Committee Chairman or the person designated as the Audit Committee Financial Expert. In addition, subject to specified cost limitations, certain services may be pre-approved under the provisions of the Policy. The Policy provides that the Audit Committee will consider whether the services provided by an independent auditor are consistent with the Securities and Exchange Commission’s rules on auditor independence. The Policy provides for periodic review and pre-approval by the Audit Committee of the services that may be provided by the independent auditor.
De Minimis Waiver. The pre-approval requirements of the Policy may be waived with respect to the provision of non-audit services that are permissible for an independent auditor to perform, provided (1) the aggregate amount of all such services provided constitutes no more than five percent of the total amount of revenues subject to pre-approval that was paid to the independent auditors during the fiscal year in which the services are provided; (2) such services were not recognized by GST at the time of the engagement to be non-audit services; and (3) such services are promptly brought to the attention of the Audit Committee and approved prior to the completion of the audit by the Audit Committee or by one or more members of the Audit Committee to whom authority to grant such approvals has been delegated by the Audit Committee, pursuant to the pre-approval provisions of the Policy.
Pre-Approval of Non-Audit Services Provided to GST’s Investment Advisers. The Policy provides that, in addition to requiring pre-approval of audit and non-audit services provided to GST, the Audit Committee will pre-approve those non-audit services provided to GST’s investment advisers (and entities controlling, controlled by or under common control with the investment advisers that provide ongoing services to GST) where the engagement relates directly to the operations or financial reporting of GST.
Item 4(e)(2) – 0% of the audit-related fees, tax fees and other fees listed in Table 1 were approved by GST’s Audit Committee pursuant to the “de minimis” exception of Rule 2-01(c)(7)(i)(C) of Regulation S-X. In addition, 0% of the non-audit services to the GST’s service affiliates listed in Table 2 were approved by GST’s Audit Committee pursuant to the “de minimis” exception of Rule 2-01(c)(7)(i)(C) of Regulation S-X.
Item 4(f) – Not applicable.
Item 4(g) Aggregate Non-Audit Fees Disclosure
The aggregate non-audit fees billed to GST by PwC for the twelve months ended October 31, 2014 and October 31, 2013 were approximately $794,850 and $867,290 respectively. The aggregate non-audit fees billed to GST’s adviser and service affiliates by PwC for non-audit services for the twelve months ended December 31, 2013 and December 31, 2012 were approximately $9.8 million and $10.0 million respectively. With regard to the aggregate non-audit fees billed to GST’s adviser and service affiliates, the 2014 and 2013 amounts include fees for non-audit services required to be pre-approved [see Table 2] and fees for non-audit services that did not require pre-approval since they did not directly relate to GST’s operations or financial reporting.
Item 4(h) — GST’s Audit Committee has considered whether the provision of non-audit services to GST’s investment adviser and service affiliates that did not require pre-approval pursuant to paragraph (c)(7)(ii) of Rule 2-01 of Regulation S-X is compatible with maintaining the auditors’ independence.
| ITEM 5. | AUDIT COMMITTEE OF LISTED REGISTRANTS. |
| ITEM 6. | SCHEDULE OF INVESTMENTS. |
| | Schedule of Investments is included as part of the Report to Stockholders filed under Item 1. |
| ITEM 7. | DISCLOSURE OF PROXY VOTING POLICIES AND PROCEDURES FOR CLOSED-END MANAGEMENT INVESTMENT COMPANIES. |
| ITEM 8. | PORTFOLIO MANAGERS OF CLOSED-END MANAGEMENT INVESTMENT COMPANIES. |
| ITEM 9. | PURCHASES OF EQUITY SECURITIES BY CLOSED-END MANAGEMENT INVESTMENT COMPANY AND AFFILIATED PURCHASERS. |
| ITEM 10. | SUBMISSION OF MATTERS TO A VOTE OF SECURITY HOLDERS. |
| | There have been no material changes to the procedures by which shareholders may recommend nominees to the registrant’s board of trustees. |
| ITEM 11. | CONTROLS AND PROCEDURES. |
| | (a) | The registrant’s principal executive and principal financial officers, or persons performing similar functions have concluded that the registrant’s disclosure controls and procedures (as defined in Rule 30a-3(c) under the Investment Company Act of 1940, as amended (the “1940 Act”)) are effective as of a date within 90 days of the filing of this report that includes the disclosure required by this paragraph, based on the evaluation of these controls and procedures required by Rule 30a-3(b) under the 1940 Act and 15d-15(b) under the Securities Exchange Act of 1934, as amended. |
| | (b) | There were no changes in the registrant’s internal control over financial reporting (as defined in Rule 30a-3(d) under the 1940 Act) that occurred during the registrant’s fiscal quarter of the period covered by this report that have materially affected, or are reasonably likely to materially affect, the registrant’s internal control over financial reporting. |
| | | | |
| (a)(1) | | Goldman Sachs Trust’s Code of Ethics for Principal Executive and Senior Financial Officers is incorporated by reference to Exhibit 12(a)(1) of the registrant’s Form N-CSR filed on July 8, 2015 for its International Equity Insights Funds. |
| | |
| (a)(2) | | Exhibit 99.CERT | | Certifications pursuant to Section 302 of the Sarbanes-Oxley Act of 2002 filed herewith. |
| | |
| (b) | | Exhibit 99.906CERT | | Certifications pursuant to Section 906 of the Sarbanes-Oxley Act of 2002 filed herewith. |
SIGNATURES
Pursuant to the requirements of the Securities Exchange Act of 1934 and the Investment Company Act of 1940, the registrant has duly caused this report to be signed on its behalf by the undersigned, thereunto duly authorized.
| | |
| | | Goldman Sachs Trust |
| |
| By: | | /s/ James A. McNamara |
| |
| | |
| | James A. McNamara |
| | President/Principal Executive Officer |
| | Goldman Sachs Trust |
| |
| Date: | | July 8, 2015 |
Pursuant to the requirements of the Securities Exchange Act of 1934 and the Investment Company Act of 1940, this report has been signed below by the following persons on behalf of the registrant and in the capacities and on the dates indicated.
| | |
| By: | | /s/ James A. McNamara |
| |
| | |
| | James A. McNamara |
| | President/Principal Executive Officer |
| | Goldman Sachs Trust |
| |
| Date: | | July 8, 2015 |
| |
| By: | | /s/ Scott McHugh |
| |
| | |
| | Scott McHugh |
| | Principal Financial Officer |
| | Goldman Sachs Trust |
| |
| Date: | | July 8, 2015 |