UNITED STATES
SECURITIES AND EXCHANGE COMMISSION
Washington, D.C. 20549
FORM N-CSR
CERTIFIED SHAREHOLDER REPORT OF REGISTERED
MANAGEMENT INVESTMENT COMPANIES
Investment Company Act file number 811-05349
Goldman Sachs Trust
(Exact name of registrant as specified in charter)
71 South Wacker Drive, Chicago, Illinois 60606
(Address of principal executive offices) (Zip code)
| | |
| Caroline Kraus, Esq. | | Copies to: |
| Goldman, Sachs & Co. | | Geoffrey R.T. Kenyon, Esq. |
| 200 West Street | | Dechert LLP |
| New York, New York 10282 | | 100 Oliver Street |
| | 40th Floor |
| | Boston, MA 02110-2605 |
(Name and address of agents for service)
Registrant’s telephone number, including area code: (312) 655-4400
Date of fiscal year end: November 30
Date of reporting period: May 31, 2015
| ITEM 1. | REPORTS TO STOCKHOLDERS. |
| | The Semi-Annual Report to Stockholders is filed herewith. |
Goldman Sachs Funds

| | | | |
| | |
| Semi-Annual Report | | | | May 31, 2015 |
| | |
| | | | MLP Energy Infrastructure Fund |

Goldman Sachs MLP Energy Infrastructure Fund
| | | | |
| | | |
| NOT FDIC-INSURED | | May Lose Value | | No Bank Guarantee |
GOLDMAN SACHS MLP ENERGY INFRASTRUCTURE FUND
Principal Investment Strategies and Risks
This is not a complete list of risks that may affect the Fund. For additional information concerning the risks applicable to the Fund, please see the Fund’s Prospectus.
The Goldman Sachs MLP Energy Infrastructure Fund invests primarily in a portfolio of master limited partnership (“MLP”) investments in the energy sector. The Fund’s equity investments are subject to market risk, which means that the value of the securities in which it invests may go up or down in response to the prospects of individual companies, particular sectors and/or general economic conditions. Investments in MLPs are subject to certain risks, including risks related to limited control and limited rights to vote, potential conflicts of interest, cash flow risks, dilution risks, limited liquidity, risks related to the general partner’s right to force sales at undesirable times or prices, interest rate sensitivity and for MLPs with smaller capitalizations, lower trading volume and abrupt or erratic price movements. MLPs are also subject to risks relating to their complex tax structure, including the risk that an MLP could lose its tax status as a partnership, resulting in a reduction in the value of the Fund’s investment in the MLP and lower income to the Fund. MLPs are also subject to the risk that to the extent that a distribution received from an MLP is treated as a return of capital, the Fund’s adjusted tax basis in the MLP interests may be reduced, which may increase the Fund’s tax liability upon the sale of the MLP interests or upon subsequent distributions in respect of such interests. The Fund’s strategy of investing primarily in MLPs, resulting in its being taxed as a regular corporation, or “C” corporation, involves complicated accounting, tax and valuation issues. Many MLPs in which the Fund invests operate facilities within the energy sector and are also subject to risks affecting that sector. Because the Fund concentrates its investments in the energy sector, the Fund is subject to greater risk of loss as a result of adverse economic, business or other developments affecting industries within that sector than if its investments were more diversified across different industries. The Fund may invest in private investment in public equities (“PIPEs”) which may be deemed illiquid. The securities of mid- and small-capitalization companies involve greater risks than those associated with larger, more established companies and may be subject to more abrupt or erratic price movements. The Fund is “non-diversified” and may invest a larger percentage of its assets in fewer issuers than “diversified” funds. Accordingly, the Fund may be more susceptible to adverse developments affecting any single issuer held in its portfolio and to greater losses resulting from these developments.
1
GOLDMAN SACHS MLP ENERGY INFRASTRUCTURE FUND
What Differentiates Goldman Sachs’ MLP Energy Infrastructure Fund Investment Process?
With a quality-oriented approach, the MLP Energy Infrastructure Fund seeks total return through current income and capital appreciation. We have an experienced investment team integrated within Goldman Sachs Asset Management, L.P. (“GSAM”), allowing us to leverage franchise expertise and risk framework across multiple asset classes. We invest primarily in Master Limited Partnerships (“MLPs”), or similar structures, that own energy infrastructure assets.

| n | | To capture the full energy chain, we analyze energy production and user trends that ultimately impact energy infrastructure. |
| n | | We rigorously assess companies on both the asset and equity level. |

First, we analyze overall energy trends through capital spending shifts and drilling trends, in addition to regional supply and demand imbalances.
| n | | Top-Down Sector Selection |
Secondly, we establish the impact of macro and regional trends on energy infrastructure.
| n | | Bottom-Up Security Selection |
Finally, we select names by evaluating a company’s management, assets, expected returns and technicals.

| n | | Our team of MLP dedicated investment professionals includes lead portfolio managers averaging 10 years of investment experience. |
| n | | Ability to leverage energy related resources across GSAM Equity, Fixed Income and Commodity groups, as well as utilize risk management resources. |
| n | | Unique investment approach stemming from a more holistic view across the extremes of the energy value chain, broader valuation understanding, and resource advantages. |
2
PORTFOLIO RESULTS
Goldman Sachs MLP Energy Infrastructure Fund
Investment Objective And Principal Strategy
The Fund seeks total return through current income and capital appreciation. The Fund, under normal circumstances, invests at least 80% of its net assets plus any borrowings for investment purposes (measured at the time of purchase) in energy infrastructure master limited partnership (“MLP”) investments. The Fund’s MLP investments may include, but are not limited to: MLPs structured as limited partnerships or limited liability companies; MLPs that are taxed as “C” corporations; institutional units issued by MLP affiliates; “C” corporations that hold significant interests in MLPs; private investments in public equities issued by MLPs; and other equity and fixed income securities and derivative instruments, including pooled investment vehicles and exchange-traded notes, that provide exposure to MLPs. Energy infrastructure MLPs own and operate assets that are used in the energy sector, including assets used in exploring, developing, producing, generating, transporting (including marine), transmitting, terminal operation, storing, gathering, processing, refining, distributing, mining or marketing of natural gas, natural gas liquids, crude oil, refined products, coal or electricity, or that provide energy-related equipment or services. The Fund’s MLP investments may be of any capitalization size.
Portfolio Management Discussion and Analysis
Below, the Goldman Sachs Energy and Infrastructure Team discusses the Goldman Sachs MLP Energy Infrastructure Fund’s (the “Fund”) performance and positioning for the six-month period ended May 31, 2015 (the “Reporting Period”).
| Q | | How did the Fund perform during the Reporting Period? |
| A | | During the Reporting Period, the Fund’s Class A, C, Institutional, IR and R Shares generated cumulative total returns, without sales charges, of -3.71%, -4.02%, -3.43%, -3.44% and -3.73%, respectively. These returns compare to the -8.42% cumulative total return of the Alerian MLP Index (the “Alerian Index”). The Alerian Index1 is a composite of the 50 most prominent energy MLPs. |
| Q | | How did energy master limited partnerships (“MLPs”) overall perform during the Reporting Period? |
| A | | During the Reporting Period, energy MLPs, as represented by the Alerian Index, declined on a total return basis. Persistent weakness in the crude oil market, largely because of continued production growth and a resulting inventory build-up at the U.S. crude oil storage hub in Cushing, Oklahoma, was a headwind for energy MLPs. In the first two months of the Reporting Period, energy MLPs benefited from falling interest rates, as the yield on the 10-year U.S. Treasury note fell to a low of 1.68% on January 31, 2015. However, interest rates rose through the remainder of the Reporting Period, serving as a headwind for energy MLPs. At the end of the Reporting Period, the yield on the 10-Year U.S. Treasury note stood at 2.12%. |
| | Larger than expected U.S. production growth, combined with weaker than expected demand growth in the emerging markets, put downward pressure on crude oil prices during the first few months of the Reporting Period. On March 17, 2015, the price of West Texas Intermediate (“WTI”) crude oil hit a low for the Reporting Period of $43.46 per barrel. Prices increased thereafter, rising 38.7% to close the Reporting Period at $60.30 per barrel.2 |
| | In response to the steep drop in oil prices, North American energy producers significantly reduced capital expenditures and rig count. By June 5, 2015, after the end of the Reporting Period, the U.S. oil-focused rig count had fallen to 642, down 60% from the October 2014 high of 1,609.3 Despite these reductions, U.S. hydrocarbon production continued to surge to higher than expected levels. March 2015 crude oil production of 9.5 million barrels per day was the highest level since 1972 and reflected a 15.9% year over year increase. U.S. natural gas production also increased, rising 8.4% year over year for the three months ended March 2015. During the same time period, U.S. production of natural gas liquids was up 14.1% versus the first three months of 2014, as production of each purity product (ethane, propane, butane, iso-butane and pentanes) continued to grow.4 |
| 4 | | Source: U.S. Energy Information Administration. |
3
PORTFOLIO RESULTS
| | During the Reporting Period, net investment inflows into the MLP sector remained positive although they were below the record levels seen during 2014. There were $4.0 billion of inflows through exchange traded funds (“ETFs”), exchange traded notes (“ETNs”) and mutual funds during the Reporting Period. This compares with $9.6 billion of inflows during the same timeframe a year earlier. The increase in inflows was supportive of MLPs during the Reporting Period.5 |
| | During the Reporting Period overall, the Alerian Index (-8.42%) underperformed the S&P 500® Index (+2.96%) and the AMEX Energy Select Sector Index (-0.41%).6 The Alerian Index also underperformed the utilities (-1.93%) and real estate investment trust (“REIT”) (+0.11%) sectors, as represented by the Philadelphia Stock Exchange (PHLX) Utility Sector Index and the FTSE NAREIT (National Association of Real Estate Investment Trusts) U.S. Real Estate Index, respectively.7 |
| Q | | What key factors were responsible for the Fund’s performance during the Reporting Period? |
| A | | Security selection drove the Fund’s performance during the Reporting Period. |
| | The Fund benefited from its ownership of what we consider to be quality companies with strong management teams, strong balance sheets and favorable commodity and geographical exposures (asset footprint). |
| Q | | What individual holdings added to the Fund’s relative performance during the Reporting Period? |
| A | | During the Reporting Period, the Fund’s investments in Energy Transfer Equity LP, Shell Midstream Partners LP and SemGroup Corp. added to returns. |
| | Energy Transfer Equity LP (ETE) is an MLP that owns the general partner and 100% of the incentive distribution rights of Energy Transfer Partners, LP (ETP). ETE also owns approximately 82.6 million of ETP’s Class H units, which tracks 90% of the underlying economics of the general partner interest and incentive distribution rights of Sunoco Logistics Partners LP. On a consolidated basis, ETE’s family of companies owns and operates approximately 71,000 miles of natural gas, natural gas liquids, refined products and crude oil pipelines. In April 2015, ETE’s board of directors approved a tenth consecutive increase in ETE’s quarterly distribution — to $0.49 per unit for the first quarter of 2015, an increase of 8.9% on an annualized basis compared to the fourth quarter of 2014 and an increase of 37% on an annualized basis compared to the first quarter of 2014. Looking forward, we believe ETE’s distribution growth prospects are supported by a combination of ongoing organic growth projects, mergers and acquisitions activity and exposure to fee-based midstream assets.8 During the Reporting Period, ETE was up 17.42% on a total return basis. As of May 31, 2015, ETE had a yield of 2.85%. |
| | Shell Midstream Partners LP (SHLX) is a fee-based, growth-oriented MLP formed by Royal Dutch Shell to own, operate, develop and acquire pipelines and other midstream assets. For the first quarter of 2015, SHLX declared a cash distribution of $0.175 per unit, a 7.7% increase over the prorated minimum quarterly distribution of $0.1625 per unit paid for the fourth quarter of 2014. The increase was largely due to strong transportation volumes. During May 2015, SHLX acquired additional interests in the Zydeco Pipeline and Colonial Pipeline from Shell Pipeline Company, which should help to diversify SHLX’s assets geographically. SHLX management expects the new assets to be immediately accretive to distributable cash flow. During the Reporting Period, SHLX was up 23.80% on a total return basis. As of May 31, 2015, SHLX had a yield of 1.50%. |
| | SemGroup Corp. (SEMG) provides gathering, transportation, storage, distribution, marketing and other midstream services primarily to independent producers and refiners of petroleum products. SEMG reported strong earnings growth during the Reporting Period, as strong demand drove growth in its petroleum products storage business. In May 2015, SEMG announced that cash distributions for the first quarter of 2015 would increase 12% from the fourth quarter of 2014 to $0.38 |
| 5 | | Source: Bloomberg, U.S. Capital Advisors. |
| 6 | | The S&P 500® Index is a diverse index that includes 500 American companies that represent more than 70% of the total market capitalization of the U.S. stock market. The AMEX Energy Select Sector Index (IXE) is a modified market capitalization-based index intended to track the movements of companies that are components of the S&P 500® Index and are involved in the development or production of energy products. |
| 7 | | The PHLX Utility Sector Index is composed of geographically diverse public U.S. utility stocks. The FTSE NAREIT U.S. Real Estate Index Series is a that span the commercial real estate space across the U.S. economy, offering exposure to all investment and property sectors. |
| 8 | | The midstream component of the energy industry has historically been defined as those companies providing products or services that help link the supply side (i.e., energy producers) and the demand side (i.e., energy end-users) for any type of energy commodity. Such midstream businesses can include, but are not limited to, those that process, store, market and transport various energy commodities. |
4
PORTFOLIO RESULTS
| | per unit. Additionally, SEMG announced plans to construct, own and operate three new pipelines in the U.S. Gulf Coast region, which are expected to be operational in the fourth quarter of 2016. During the Reporting Period, SEMG was up 7.32% on a total return basis. As of May 31, 2015, SEMG had a yield of 1.97%. |
| | At the end of the Reporting Period, the Fund continued to hold positions in all three securities. |
| Q | | What individual holdings detracted from the Fund’s relative performance during the Reporting Period? |
| A | | During the Reporting Period, the Fund was hurt relative to the Alerian Index by its positions in Summit Midstream Partners LP, Targa Resources Corp. and Emerge Energy Services LP. |
| | Summit Midstream Partners LP (SMLP) is an MLP that owns and operates midstream energy infrastructure strategically located in the core producing areas of unconventional resource basins, primarily shale formations, in North America. SMLP was negatively impacted by the announcement of a large goodwill impairment charge for the fourth quarter of 2014, which caused its earnings to fall below consensus estimates. However, in April 2015, SMLP increased its first quarter 2015 cash distribution by 13% on a year-over-year basis. In May 2015, it completed a drop-down acquisition of crude oil gathering systems and transmission pipelines that we expect to be immediately accretive to cash flow. During the Reporting Period, SMLP was down 23.56% on a total return basis. As of May 31, 2015, SMLP had a yield of 7.32%. |
| | Targa Resources Corp. (TRGP) provides midstream natural gas and natural gas liquid services through its interests in the MLP Targa Resources Partners LP (NGLS). Shares of TRGP traded lower on news of a proposed merger with Atlas Energy, which was eventually approved by TRGP shareholders in February 2015. In addition, during April 2015, TRGP’s stock price weakened after management reduced estimates for calendar year 2015 distribution and dividend growth for both NGLS and TRGP. We remained positive on TRGP because of potential infrastructure growth from the partnership’s leading positions in natural gas liquids in the Permian and Bakken Shales as well as from its presence on the U.S. Gulf Coast. During the Reporting Period, TRGP was down 18.07% on a total return basis. As of May 31, 2015, TRGP had a yield of 3.72%. |
| | Emerge Energy Services LP (EMES) is engaged in two business segments. The first is the mining, processing and distributing of silica sand used for the hydraulic fracturing of oil and gas wells. The second is the processing of transmix and the distribution of refined products. EMES underperformed during the Reporting Period as increased sand segment costs and decreased fuel segment revenue weighed on results. In April 2015, EMES declared a cash distribution of $1.00 per unit for the first quarter of 2015, representing a 29% decline quarter over quarter and a 12% decline year over year. Investor sentiment was also dampened by the announcement of a second consecutive downward revision to distribution guidance. During the Reporting Period, EMES was down 35.09% on a total return basis. As of May 31, 2015, EMES had a yield of 10.11%. |
| | The Fund maintained positions in all three securities at the end of the Reporting Period. |
| Q | | Were there any notable purchases or sales during the Reporting Period? |
| A | | During the Reporting Period, the Fund initiated a position in EQT GP Holdings LP (EQGP). The company was formed in January 2015 by EQT Corporation (EQT) to own partnership interests in EQT Midstream Partners LP (EQM), a growth-oriented MLP that owns, operates, acquires and develops midstream assets in the Appalachian Basin. EQM has fee-based assets located in the Marcellus Shale, which — combined with its working relationship with EQT — positions it as a leading Appalachian Basin midstream energy company. In our opinion, EQGP is well positioned to benefit from EQM’s distribution growth profile because of incentive distribution rights that could allow EQGPs distribution growth rate to be among the highest in the energy industry. |
| | The Fund also added a position in Tallgrass Energy GP, LP (TEGP) during the Reporting Period. TEGP holds general and limited partnership interests in Tallgrass Energy Partners, LP (TEP), including all of TEP’s incentive distribution rights. TEP is engaged in the transportation, storage and processing of natural gas, the transportation of crude oil and the provision of water business services, primarily to the oil and gas exploration and production industry. TEGP went public through an initial public offering (“IPO”) on May 6, 2015 at $29.00 per share and its shares traded well above the IPO price through the end of the Reporting Period. Expectations for rapid growth in the company’s payout ratio make it, in our view, an attractive |
5
PORTFOLIO RESULTS
| | investment. In addition, we believe TEGP’s indirect ownership of TEP’s incentive distribution rights could allow it to grow its payout ratio at a faster rate than TEP. |
| | During the Reporting Period, the Fund sold its holdings of Keyera Corp. (KEY), an independent natural gas and natural gas liquids midstream company that operates in western Canada. Shares of KEY modestly declined, partly because of a drop in natural gas prices, increased leverage and flat monthly dividend distribution growth. We decided to exit the position in favor of securities we viewed more positively. |
| | In addition, we eliminated the Fund’s investment in Western Gas Equity Partners, LP (WGP) during the Reporting Period. WGP owns interests in Western Gas Partners LP (WES), which owns, operates, acquires and develops midstream energy assets. The position contributed positively to Fund performance after WGP increased its first quarter 2015 cash distribution to 10% quarter over quarter and 37% year over year. We ultimately exited our position in WGP and reallocated the proceeds to companies about which we held more favorable views. |
| Q | | How did the Fund use derivatives and similar instruments during the Reporting Period? |
| A | | During the Reporting Period, the Fund did not use derivatives or similar instruments. |
| Q | | What is the Fund’s tactical view and strategy for the months ahead? |
| A | | Although commodity prices declined during the Reporting Period, we still believe overall production volumes will likely continue to grow across oil, natural gas liquids and dry natural gas, albeit at lower levels than those expected in mid-2014 when crude oil prices were near $100 per barrel. In our view, the reductions by U.S. exploration and production companies in capital expenditures and rig counts should eventually translate to slower U.S. production growth. We also anticipate a potential decrease in supply from outside the U.S., partly because members of the Organization of the Petroleum Exporting Countries (“OPEC”) have relatively high breakeven points (i.e., they need to sell oil at a certain price to balance their budgets). We believe U.S. breakeven points have fallen along with crude oil prices — a dynamic that could potentially continue going forward. We believe the drop in U.S. breakeven points is largely due to exploration and production companies focusing only on the highest quality drilling locations, service companies offering large cost discounts, and enhanced drilling and completion efficiencies deriving from a better understanding of rock formations. In the months ahead, we expect an uptick in crude oil demand, which has historically been at an incremental pace of approximately one million barrels a day per year during the last 10 years. In our view, additional tailwinds for the MLP sector include increased merger and acquisition activity, continued investor interest and growing U.S. government support for the U.S. energy sector. Despite our positive outlook, investors should, in our view, remain mindful that the MLP sector is facing additional challenges beyond lower commodity prices. For example, rising interest rates could negatively affect MLP valuations. Finally, we believe investors should recognize a growing dispersion in performance. Rising U.S. production has greatly altered the energy landscape, proving beneficial to some regions and detrimental to others. As a result, the dispersion between the energy “haves” and “have nots” has increased. In our opinion, rigorous fundamental analysis is essential in seeking to take advantage of the powerful energy revolution theme that we believe persists. |
6
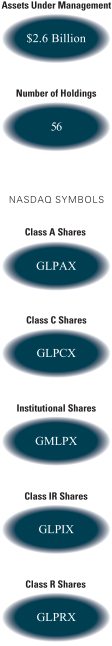
FUND BASICS
Goldman Sachs MLP Energy Infrastructure Fund
as of May 31, 2015
| | | | | | | | | | |
| | PERFORMANCE REVIEW | |
| | | December 1, 2014–May 31, 2015 | | Fund Total Return
(based on NAV)1 | | | Alerian MLP
Index2 | |
| | Class A | | | -3.71 | % | | | -8.42 | % |
| | Class C | | | -4.02 | | | | -8.42 | |
| | Institutional | | | -3.43 | | | | -8.42 | |
| | Class IR | | | -3.44 | | | | -8.42 | |
| | | Class R | | | -3.73 | | | | -8.42 | |
| | 1 | | The net asset value (“NAV”) represents the net assets of the class of the Fund (ex-dividend) divided by the total number of shares of the class outstanding. The Fund’s performance assumes the reinvestment of dividends and other distributions. The Fund’s performance does not reflect the deduction of any applicable sales charges. |
| | 2 | | The Alerian MLP Index is a composite of the 50 most prominent energy master limited partnerships calculated by Standard & Poor’s using a float-adjusted market capitalization methodology. The index is disseminated by the New York Stock Exchange real-time on a price return basis (NYSE: AMZ). The corresponding total return index is calculated and disseminated daily through ticker AMZX. |
| | | | | | | | | | | | |
| | STANDARDIZED TOTAL RETURNS3 |
| | | For the period ended 3/31/15 | | One Year | | | Since Inception | | | Inception Date |
| | Class A | | | -6.07 | % | | | 7.39 | % | | 3/28/13 |
| | Class C | | | -2.31 | | | | 9.69 | | | 3/28/13 |
| | Institutional | | | -0.18 | | | | 10.92 | | | 3/28/13 |
| | Class IR | | | -0.27 | | | | 10.77 | | | 3/28/13 |
| | | Class R | | | -0.79 | | | | 10.21 | | | 3/28/13 |
| | 3 | | The Standardized Total Returns are average annual total returns as of the most recent calendar quarter-end. They assume reinvestment of all distributions at net asset value. These returns reflect a maximum initial sales charge of 5.5% for Class A Shares and the contingent deferred sales charge for Class C Shares (1% if shares are redeemed within 12 months of purchase). Because Institutional, Class IR and Class R Shares do not involve a sales charge, such a charge is not applied to their Standardized Total Returns. |
The returns set forth in the tables above represent past performance. Past performance does not guarantee future results. The Fund’s investment return and principal value will fluctuate so that an investor’s shares, when redeemed, may be worth more or less than their original cost. Current performance may be lower or higher than the performance quoted above. Please visit our web site at www.GSAMFUNDS.com to obtain the most recent month-end returns. Performance reflects applicable fee waivers and/or expense limitations in effect during the periods shown. In their absence, performance would be reduced. Returns do not reflect the deduction of taxes that a shareholder would pay on Fund distributions or the redemption of Fund shares.
7
FUND BASICS
| | | | | | | | | | | | | | | | | | |
| | EXPENSE RATIOS4 | |
| | | | | Net Operating Expenses Ratio
(After Waivers
Excluding Tax
Benefit/Expense) | | | Gross Operating Expense Ratio
(Before Waivers
Excluding Tax
Benefit/Expense) | | | Net Expense Ratio (After
Waivers
Including Tax
Benefit/Expense) | | | Gross Expense Ratio (Before
Waivers
Including Tax
Benefit/Expense) | |
| | Class A | | | 1.45 | % | | | 1.45 | % | | | 3.56 | % | | | 3.56% | |
| | Class C | | | 2.20 | | | | 2.20 | | | | 4.31 | | | | 4.31 | |
| | Institutional | | | 1.05 | | | | 1.05 | | | | 3.16 | | | | 3.16 | |
| | Class IR | | | 1.20 | | | | 1.20 | | | | 3.31 | | | | 3.31 | |
| | | Class R | | | 1.70 | | | | 1.70 | | | | 3.81 | | | | 3.81 | |
| | 4 | | The expense ratios of the Fund, both current (net of applicable fee waivers and/ or expense limitations) and before waivers (gross of applicable fee waivers and/ or expense limitations) are as set forth above according to the most recent publicly available Prospectus for the Fund and may differ from the expense ratios disclosed in the Financial Highlights in this report. |
| | | | | | | | |
| | TOP TEN HOLDINGS AS OF 5/31/155,6 |
| | | Holding | | % of Net Assets | | | Line of Business |
| | Enterprise Products Partners LP | | | 5.6 | % | | Diversified Midstream |
| | Williams Partners LP | | | 4.8 | | | Diversified Midstream |
| | Energy Transfer Equity LP | | | 4.6 | | | General Partner |
| | SemGroup Corp. Class A | | | 4.1 | | | General Partner |
| | Magellan Midstream Partners LP | | | 3.8 | | | Liquids, Pipelines & Terminalling |
| | Energy Transfer Partners LP | | | 3.8 | | | Diversified Midstream |
| | Sunoco Logistics Partners LP | | | 3.6 | | | Liquids, Pipelines & Terminalling |
| | Plains GP Holdings LP Class A | | | 3.4 | | | General Partner |
| | Targa Resources Corp. | | | 2.9 | | | General Partner |
| | | Summit Midstream Partners LP | | | 2.8 | | | Natural Gas and NGL Infrastructure |
| | 5 | | The top 10 holdings may not be representative of the Fund’s future investments. |
| | 6 | | The Fund’s overall top ten holdings differ from the table above due to the exclusion of the Goldman Sachs Financial Square Government Fund (a short term investment Fund) which represents 4.4% of the Fund’s net assets as of 5/31/15. |
8
FUND BASICS
|
| FUND SECTOR ALLOCATIONS7 |
| As of May 31, 2015 |
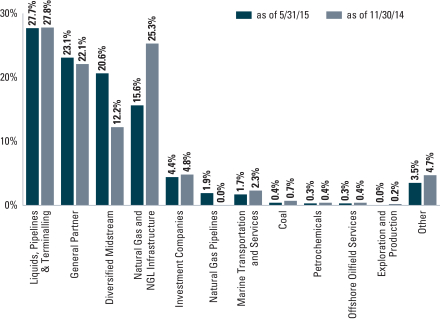
| | 7The | | Fund is actively managed and, as such, its composition may differ over time. Consequently, the Fund’s overall sector allocations may differ from the percentages contained in the graph above. The percentage shown for each investment category reflects the value of investments in that category as a percentage of total net assets. The graph depicts the Fund’s investments but may not represent the Fund’s market exposure due to the exclusion of certain derivatives, if any, as listed in the Additional Investment Information section of the Schedule of Investments. Sector allocations are defined by GSAM and may differ from sector allocations used by the Alerian Total Return Index. |
9
GOLDMAN SACHS MLP ENERGY INFRASTRUCTURE FUND
Schedule of Investments
May 31, 2015 (Unaudited)
| | | | | | | | |
Shares | | | Description | | Value | |
| | Common Stocks – 95.1% | |
| | Coal – 0.4% | |
| | 386,997 | | | Alliance Resource Partners LP | | $ | 11,606,040 | |
| | |
| | Diversified Midstream – 20.6% | |
| | 671,411 | | | Enbridge, Inc. | | | 32,174,015 | |
| | 1,724,149 | | | Energy Transfer Partners LP | | | 96,948,898 | |
| | 4,447,461 | | | Enterprise Products Partners LP | | | 144,186,686 | |
| | 1,057,504 | | | Gibson Energy, Inc. | | | 20,349,044 | |
| | 2,191,872 | | | Inter Pipeline Ltd. | | | 54,532,422 | |
| | 1,360,710 | | | Targa Resources Partners LP | | | 58,823,493 | |
| | 2,200,740 | | | Williams Partners LP | | | 122,977,351 | |
| | | | | | | | |
| | | | | | | 529,991,909 | |
| | |
| | General Partner – 23.1% | |
| | 436,746 | | | Alliance Holdings GP LP | | | 21,051,157 | |
| | 1,739,379 | | | Energy Transfer Equity LP | | | 119,443,156 | |
| | 1,653,156 | | | EQT GP Holdings LP* | | | 53,264,686 | |
| | 516,341 | | | ONEOK, Inc. | | | 21,645,015 | |
| | 3,146,471 | | | Plains GP Holdings LP Class A | | | 87,975,329 | |
| | 1,328,054 | | | SemGroup Corp. Class A | | | 104,517,850 | |
| | 999,087 | | | Tallgrass Energy GP LP* | | | 32,020,738 | |
| | 812,113 | | | Targa Resources Corp. | | | 74,673,790 | |
| | 401,368 | | | Teekay Corp. | | | 18,390,682 | |
| | 1,213,594 | | | The Williams Cos., Inc. | | | 62,014,654 | |
| | | | | | | | |
| | | | | | | 594,997,057 | |
| | |
| | Liquids, Pipelines & Terminalling – 27.7% | |
| | 583,135 | | | Buckeye Partners LP | | | 45,093,830 | |
| | 1,187,192 | | | Genesis Energy LP | | | 57,733,147 | |
| | 1,233,729 | | | Magellan Midstream Partners LP | | | 98,352,876 | |
| | 482,563 | | | MPLX LP | | | 35,227,099 | |
| | 1,346,166 | | | PBF Logistics LP(a) | | | 31,123,358 | |
| | 747,849 | | | Pembina Pipeline Corp. | | | 24,108,448 | |
| | 509,666 | | | Phillips 66 Partners LP | | | 37,073,105 | |
| | 1,498,415 | | | Plains All American Pipeline LP | | | 70,350,584 | |
| | 889,589 | | | Rose Rock Midstream LP | | | 45,075,475 | |
| | 1,124,856 | | | Shell Midstream Partners LP | | | 50,506,035 | |
| | 615,385 | | | Shell Midstream Partners LP (PIPE)(b) | | | 26,123,093 | |
| | 2,321,427 | | | Sunoco Logistics Partners LP | | | 91,928,509 | |
| | 184,712 | | | Sunoco LP | | | 8,533,694 | |
| | 896,551 | | | Tesoro Logistics LP | | | 51,829,613 | |
| | 673,077 | | | VTTI Energy Partners LP | | | 17,425,964 | |
| | 729,714 | | | Western Refining Logistics LP | | | 21,533,860 | |
| | | | | | | | |
| | | | | | | 712,018,690 | |
| | |
| | Marine Transportation and Services – 1.7% | |
| | 997,449 | | | Dynagas LNG Partners LP | | | 19,041,301 | |
| | 786,421 | | | GasLog Partners LP(a) | | | 20,053,736 | |
| | 231,653 | | | KNOT Offshore Partners LP | | | 5,467,011 | |
| | | | | | | | |
| | | | | | | 44,562,048 | |
| | |
| | Natural Gas and NGL Infrastructure – 15.6% | |
| | 622,585 | | | Antero Midstream Partners LP | | | 17,743,673 | |
| | 2,027,014 | | | Cone Midstream Partners LP(a) | | | 39,547,043 | |
| | 230,602 | | | Crestwood Midstream Partners LP | | | 3,094,679 | |
| | 1,182,366 | | | DCP Midstream Partners LP | | | 44,693,435 | |
| | 119,185 | | | Dominion Midstream Partners LP | | | 5,024,840 | |
| | 826,048 | | | EQT Midstream Partners LP | | | 69,115,436 | |
| | 1,078,357 | | | MarkWest Energy Partners LP | | | 69,694,213 | |
| | 510,759 | | | ONEOK Partners LP | | | 19,945,139 | |
| | 2,166,691 | | | Summit Midstream Partners LP(a) | | | 72,865,818 | |
| | |
| | Common Stocks – (continued) | |
| | Natural Gas and NGL Infrastructure – (continued) | | | | |
| | 491,558 | | | Tallgrass Energy Partners LP | | $ | 24,327,205 | |
| | 518,578 | | | Western Gas Partners LP | | | 35,522,593 | |
| | | | | | | | |
| | | | | | | 401,574,074 | |
| | |
| | Natural Gas Pipelines – 1.9% | |
| | 1,791,531 | | | Columbia Pipeline Partners LP | | | 48,460,913 | |
| | |
| | Offshore Oilfield Services – 0.3% | |
| | 508,228 | | | Seadrill Partners LLC | | | 6,998,300 | |
| | |
| | Petrochemicals – 0.3% | |
| | 380,369 | | | Westlake Chemical Partners LP | | | 8,307,259 | |
| | |
| | Other – 3.5% | |
| | 738,806 | | | CVR Refining LP | | | 14,473,209 | |
| | 424,935 | | | Emerge Energy Services LP | | | 16,818,927 | |
| | 1,522,595 | | | Northern Tier Energy LP | | | 37,196,996 | |
| | 1,185,379 | | | OCI Partners LP | | | 20,673,010 | |
| | | | | | | | |
| | | | | | | 89,162,142 | |
| | |
| | TOTAL COMMON STOCKS | |
| | (Cost $2,444,381,108) | | $ | 2,447,678,432 | |
| | |
| | | | | | |
| Shares | | Rate | | Value | |
| Investment Company(a) – 4.4% | |
Goldman Sachs Financial Square Government Fund — FST Shares | |
| 112,448,150 | | 0.006% | | | | |
| (Cost $112,448,150) | | $ | 112,448,150 | |
| |
| TOTAL INVESTMENTS – 99.5% | |
| (Cost $2,556,829,258) | | $ | 2,560,126,582 | |
| |
| OTHER ASSETS IN EXCESS OF LIABILITIES – 0.5% | | | 12,834,552 | |
| |
| NET ASSETS – 100.0% | | $ | 2,572,961,134 | |
| |
| | |
| The percentage shown for each investment category reflects the value of investments in that category as a percentage of net assets. |
* | | Newly issued security: non-income producing. |
(a) | | Represents an Affiliated Issuer/Fund. |
(b) | | Restricted securities are not registered under the Securities Act of 1933, as amended, and are subject to legal restrictions on resale. These securities generally may be resold in transactions exempt from registration or to the public if the securities are subsequently registered. Disposal of these securities may involve time consuming negotiations and prompt sale at an acceptable price may be difficult. See additional details below: |
| | | | | | | | | | |
| | | Restricted Security | | Acquisition
Date | | | Cost | |
| | Shell Midstream Partners LP (PIPE) | | | 5/18/2015 | | | $ | 24,000,015 | |
| | |
|
Investment Abbreviations: |
LLC | | —Limited Liability Company |
LP | | —Limited Partnership |
PIPE | | —Private Investment in Public Equity |
|
| | |
| 10 | | The accompanying notes are an integral part of these financial statements. |
GOLDMAN SACHS MLP ENERGY INFRASTRUCTURE FUND
Statement of Assets and Liabilities
May 31, 2015 (Unaudited)
| | | | | | |
| | | | | | |
| | Assets: | |
| | Investments of unaffiliated issuers, at value (cost $2,230,466,814) | | $ | 2,284,088,477 | |
| | Investments of affiliated issuers, at value (cost $326,362,444) | | | 276,038,105 | |
| | Cash | | | 2,854,831 | |
| | Receivables: | | | | |
| | Investments sold | | | 23,512,731 | |
| | Fund shares sold | | | 5,247,919 | |
| | Foreign tax reclaims | | | 527,909 | |
| | Dividends | | | 402,600 | |
| | Prepaid federal income taxes | | | 5,821,000 | |
| | Prepaid state and local income taxes | | | 612,546 | |
| | Other assets | | | 1,655 | |
| | Total assets | | | 2,599,107,773 | |
| | | | | | |
| | Liabilities: | |
| | Payables: | | | | |
| | Investments purchased | | | 17,876,468 | |
| | Fund shares redeemed | | | 5,436,630 | |
| | Management fees | | | 2,035,655 | |
| | Distribution and service fees and transfer agent fees | | | 540,936 | |
| | Accrued expenses | | | 256,950 | |
| | Total liabilities | | | 26,146,639 | |
| | | | | | |
| | Net Assets: | |
| | Paid-in capital | | | 2,611,780,513 | |
| | Distributions in excess of net investment income, net of taxes | | | (16,484,485 | ) |
| | Accumulated net realized gain, net of taxes | | | 7,632,979 | |
| | Net unrealized loss, net of taxes | | | (29,967,873 | ) |
| | | NET ASSETS | | $ | 2,572,961,134 | |
| | | Net Assets: | | | | |
| | | Class A | | $ | 500,404,285 | |
| | | Class C | | | 263,518,465 | |
| | | Institutional | | | 1,652,562,456 | |
| | | Class IR | | | 156,192,344 | |
| | | Class R | | | 283,584 | |
| | | Total Net Assets | | $ | 2,572,961,134 | |
| | | Shares Outstanding $0.001 par value (unlimited shares authorized): | | | | |
| | | Class A | | | 44,424,924 | |
| | | Class C | | | 23,777,898 | |
| | | Institutional | | | 145,350,442 | |
| | | Class IR | | | 13,778,064 | |
| | | Class R | | | 25,308 | |
| | | Net asset value, offering and redemption price per share:(a) | | | | |
| | | Class A | | | $11.26 | |
| | | Class C | | | 11.08 | |
| | | Institutional | | | 11.37 | |
| | | Class IR | | | 11.34 | |
| | | Class R | | | 11.21 | |
| | (a) | | Maximum public offering price per share for Class A Shares is $11.92. At redemption, Class C Shares may be subject to a contingent deferred sales charge, assessed on the amount equal to the lesser of the current net asset value or the original purchase price of the shares. |
| | |
| The accompanying notes are an integral part of these financial statements. | | 11 |
GOLDMAN SACHS MLP ENERGY INFRASTRUCTURE FUND
Statement of Operations
For the Six Months Ended May 31, 2015 (Unaudited)
| | | | | | |
| | | | | | |
| | Investment income: | |
| | Dividends — unaffiliated issuers (net of tax withholding of $427,075) | | $ | 53,433,716 | |
| | Dividends — affiliated issuers | | | 5,503,654 | |
| | Less: Return of Capital on Dividends | | | (46,858,109 | ) |
| | Total investment income | | | 12,079,261 | |
| | | | | | |
| | Expenses: | |
| | Management fees | | | 11,208,873 | |
| | Distribution and Service fees(a) | | | 1,830,637 | |
| | Transfer Agent fees(a) | | | 1,137,823 | |
| | Professional fees | | | 153,304 | |
| | Printing and mailing costs | | | 113,107 | |
| | Registration fees | | | 95,079 | |
| | Custody, accounting and administrative services | | | 87,905 | |
| | Trustee fees | | | 20,326 | |
| | Other | | | 27,168 | |
| | Total operating expenses, before taxes | | | 14,674,222 | |
| | Less — expense reductions | | | (41,266 | ) |
| | Net operating expenses, before taxes | | | 14,632,956 | |
| | NET INVESTMENT LOSS, BEFORE TAXES | | | (2,553,695 | ) |
| | Current tax benefit | | | 5,820,505 | |
| | Deferred tax benefit(b) | | | — | |
| | NET INVESTMENT INCOME, NET OF TAXES | | | 3,266,810 | |
| | | | | | |
| | Realized and unrealized gain (loss): | |
| | Net realized loss from: | | | | |
| | Investments — unaffiliated issuers | | | (4,922,591 | ) |
| | Investment — affiliated issuers | | | (8,480,248 | ) |
| | Foreign currency transactions | | | (16,627 | ) |
| | Deferred tax benefit(b) | | | — | |
| | Net change in unrealized loss on: | | | | |
| | Investments — unaffiliated issuers | | | (52,667,184 | ) |
| | Investments — affiliated issuers | | | (33,750,833 | ) |
| | Foreign currency translation | | | (35,776 | ) |
| | Deferred tax benefit(b) | | | — | |
| | Net realized and unrealized loss, net of taxes | | | (99,873,259 | ) |
| | NET DECREASE IN NET ASSETS RESULTING FROM OPERATIONS | | $ | (96,606,449 | ) |
| | (a) | | Class specific Distribution and Service, and Transfer Agent fees were as follows: |
| | | | | | | | | | | | | | | | | | | | | | | | | | | | | | |
| Distribution and Service Fees | | | Transfer Agent Fees | |
Class A | | | Class C | | | Class R | | | Class A | | | Class C | | | Institutional | | | Class IR | | | Class R | |
| $ | 597,105 | | | $ | 1,233,116 | | | $ | 416 | | | $ | 453,800 | | | $ | 234,292 | | | $ | 304,070 | | | $ | 145,503 | | | $ | 158 | |
| | (b) | | Any net tax benefit was fully offset by a 100% valuation allowance recorded as of May 31, 2015. |
| | |
| 12 | | The accompanying notes are an integral part of these financial statements. |
GOLDMAN SACHS MLP ENERGY INFRASTRUCTURE FUND
Statements of Changes in Net Assets
| | | | | | | | | | |
| | | | | For the Six Months Ended
May 31, 2015
(Unaudited) | | | For the Fiscal Year Ended
November 30, 2014 | |
| | From operations: | |
| | Net investment income (loss), net of taxes | | $ | 3,266,810 | | | $ | (3,786,328 | ) |
| | Net realized gain (loss), net of taxes | | | (13,419,466 | ) | | | 20,702,810 | |
| | Net change in unrealized gain (loss), net of taxes | | | (86,453,793 | ) | | | 38,981,919 | |
| | Net increase (decrease) in net assets resulting from operations | | | (96,606,449 | ) | | | 55,898,401 | |
| | | | | | | | | | |
| | Distributions to shareholders: | |
| | From net investment income | | | | | | | | |
| | Class A Shares | | | — | | | | (3,342,062 | ) |
| | Class C Shares | | | — | | | | (1,324,904 | ) |
| | Institutional Shares | | | — | | | | (9,984,819 | ) |
| | Class IR Shares | | | — | | | | (962,093 | ) |
| | Class R Shares | | | — | | | | (584 | ) |
| | From return of capital | | | | | | | | |
| | Class A Shares | | | (11,793,711 | ) | | | (10,594,809 | ) |
| | Class C Shares | | | (6,254,383 | ) | | | (4,200,133 | ) |
| | Institutional Shares | | | (37,739,526 | ) | | | (31,653,294 | ) |
| | Class IR Shares | | | (3,672,368 | ) | | | (3,049,971 | ) |
| | Class R Shares | | | (5,091 | ) | | | (1,852 | ) |
| | Total distributions to shareholders | | | (59,465,079 | ) | | | (65,114,521 | ) |
| | | | | | | | | | |
| | From share transactions: | |
| | Proceeds from sales of shares | | | 869,748,243 | | | | 2,722,164,931 | |
| | Reinvestment of distributions | | | 58,832,635 | | | | 64,492,126 | |
| | Cost of shares redeemed | | | (747,493,857 | ) | | | (520,117,010 | ) |
| | Net increase in net assets resulting from share transactions | | | 181,087,021 | | | | 2,266,540,047 | |
| | TOTAL INCREASE | | | 25,015,493 | | | | 2,257,323,927 | |
| | | | | | | | | | |
| | Net assets: | |
| | Beginning of period | | | 2,547,945,641 | | | | 290,621,714 | |
| | End of period | | $ | 2,572,961,134 | | | $ | 2,547,945,641 | |
| | Distributions in excess of net investment income, net of taxes | | $ | (16,484,485 | ) | | $ | (19,751,295 | ) |
| | |
| The accompanying notes are an integral part of these financial statements. | | 13 |
GOLDMAN SACHS MLP ENERGY INFRASTRUCTURE FUND
Financial Highlights
Selected Data for a Share Outstanding Throughout Each Period
| | | | | | | | | | | | | | | | | | | | | | | | | | | | | | |
| | | | | | | | Income (loss) from
investment operations | | | Distributions
to shareholders | |
| | | Year - Share Class | | Net asset
value,
beginning
of period | | | Net
investment
income (loss)(a) | | | Net realized
and unrealized
gain (loss) | | | Total from
investment
operations | | | From net
investment
income | | | From
capital | | | Total
distributions | |
| | FOR THE SIX MONTHS ENDED MAY 31, (UNAUDITED) | |
| | 2015 - A | | $ | 11.98 | | | $ | (0.02 | ) | | $ | (0.42 | ) | | $ | (0.44 | ) | | $ | — | | | $ | (0.28 | ) | | $ | (0.28 | ) |
| | 2015 - C | | | 11.83 | | | | (0.06 | ) | | | (0.41 | ) | | | (0.47 | ) | | | — | | | | (0.28 | ) | | | (0.28 | ) |
| | 2015 - Institutional | | | 12.06 | | | | — | (g) | | | (0.41 | ) | | | (0.41 | ) | | | — | | | | (0.28 | ) | | | (0.28 | ) |
| | 2015 - IR | | | 12.04 | | | | (0.02 | ) | | | (0.40 | ) | | | (0.42 | ) | | | — | | | | (0.28 | ) | | | (0.28 | ) |
| | 2015 - R | | | 11.93 | | | | 0.02 | | | | (0.46 | ) | | | (0.44 | ) | | | — | | | | (0.28 | ) | | | (0.28 | ) |
| | | | | | | | | | | | | | | | | | | | | | | | | | | | | | |
| | FOR THE FISCAL YEARS ENDED NOVEMBER 30, | |
| | 2014 - A | | | 10.81 | | | | (0.08 | ) | | | 1.75 | | | | 1.67 | | | | (0.12 | ) | | | (0.38 | ) | | | (0.50 | ) |
| | 2014 - C | | | 10.76 | | | | (0.15 | ) | | | 1.72 | | | | 1.57 | | | | (0.12 | ) | | | (0.38 | ) | | | (0.50 | ) |
| | 2014 - Institutional | | | 10.84 | | | | (0.01 | ) | | | 1.73 | | | | 1.72 | | | | (0.12 | ) | | | (0.38 | ) | | | (0.50 | ) |
| | 2014 - IR | | | 10.83 | | | | (0.02 | ) | | | 1.73 | | | | 1.71 | | | | (0.12 | ) | | | (0.38 | ) | | | (0.50 | ) |
| | 2014 - R | | | 10.79 | | | | (0.11 | ) | | | 1.75 | | | | 1.64 | | | | (0.12 | ) | | | (0.38 | ) | | | (0.50 | ) |
| | | | | | | | | | | | | | | | | | | | | | | | | | | | | | |
| | FOR THE PERIOD ENDED NOVEMBER 30, | |
| | 2013 - A(h) | | | 10.00 | | | | (0.07 | ) | | | 1.27 | | | | 1.20 | | | | – | | | | (0.39 | ) | | | (0.39 | ) |
| | 2013 - C(h) | | | 10.00 | | | | (0.06 | ) | | | 1.21 | | | | 1.15 | | | | – | | | | (0.39 | ) | | | (0.39 | ) |
| | 2013 - Institutional(h) | | | 10.00 | | | | (0.01 | ) | | | 1.24 | | | | 1.23 | | | | – | | | | (0.39 | ) | | | (0.39 | ) |
| | 2013 - IR(h) | | | 10.00 | | | | (0.05 | ) | | | 1.27 | | | | 1.22 | | | | – | | | | (0.39 | ) | | | (0.39 | ) |
| | 2013 - R(h) | | | 10.00 | | | | (0.06 | ) | | | 1.24 | | | | 1.18 | | | | – | | | | (0.39 | ) | | | (0.39 | ) |
| | (a) | | Calculated based on the average shares outstanding methodology. |
| | (b) | | Assumes investment at the net asset value at the beginning of the period, reinvestment of all dividends and distributions, a complete redemption of the investment at the net asset value at the end of the period and no sales or redemption charges. Total returns would be reduced if a sales or redemption charge was taken into account. Returns do not reflect the deduction of taxes that a shareholder would pay on Fund distributions or the redemption of Fund shares. Total returns for periods less than one full year are not annualized. |
| | (c) | | A current and defered tax estimate for the ratio calculation is derived from the net investment income (loss), and realized and unrealized gains (losses). |
| | (d) | | Current and deferred tax benefit for the ratio calculation is derived from net investment income (loss) only. |
| | (e) | | The Fund’s portfolio turnover rate is calculated in accordance with regulatory requirements, without regard to transactions involving short term investments and certain derivatives. If such transactions were included, the Fund’s portfolio turnover rate may be higher. |
| | (f) | | Annualized with the exception of tax expenses. |
| | (g) | | Amount is less than $0.005 per share. |
| | (h) | | Commenced operations on March 28, 2013. |
| | |
| 14 | | The accompanying notes are an integral part of these financial statements. |
GOLDMAN SACHS MLP ENERGY INFRASTRUCTURE FUND
| | | | | | | | | | | | | | | | | | | | | | | | | | | | | | | | | | | | | | | | | | | | | | | | | | | | | | | | | | | | | | | | |
| | | | | | | | | | | | | | | | | | Ratio of Expenses to Average Net Assets | | | | | Ratio of Investment income (loss)
to Average Net Assets | | | | | | |
| | | Net asset
value, end
of period | | | | | Total
return(b) | | | | | Net assets,
end of
period
(in 000s) | | | | | After expense
reimbursements
and tax (benefit)/
expense(c) | | | | | Before expense
reimbursements
and after
tax (benefit)/
expense(c) | | | | | Net of expense
reimbursements
and before
tax (benefit)/
expense | | | | | Before expense
reimbursements
and tax (benefit)/
expense | | | | | After expense
reimbursements
and tax benefit/
(expense)(d) | | | | | Net of expense
reimbursements
and before
tax benefit/
(expense) | | | | | Before expense
reimbursements
and tax benefit/
(expense) | | | | | Portfolio
turnover
rate(e) | |
| | | | | | | | | | | | | | | | | | | | | | | | | | | | | | | | | | | | | | | | | | | | | | | | | | | | | | | | | | | | | | | | |
| | $ | 11.26 | | | | | | (3.71 | )% | | | | $ | 500,404 | | | | | | 1.17 | %(f) | | | | | 1.18 | %(f) | | | | | 1.41 | %(f) | | | | | 1.42 | %(f) | | | | | (0.20 | )%(f) | | | | | (0.44 | )%(f) | | | | | (0.45 | )%(f) | | | | | 29 | % |
| | | 11.08 | | | | | | (4.02 | ) | | | | | 263,518 | | | | | | 1.92 | (f) | | | | | 1.93 | (f) | | | | | 2.16 | (f) | | | | | 2.17 | (f) | | | | | (0.90 | )(f) | | | | | (1.14 | )(f) | | | | | (1.14 | )(f) | | | | | 29 | |
| | | 11.37 | | | | | | (3.43 | ) | | | | | 1,652,562 | | | | | | 0.77 | (f) | | | | | 0.78 | (f) | | | | | 1.01 | (f) | | | | | 1.02 | (f) | | | | | 0.26 | (f) | | | | | 0.02 | (f) | | | | | 0.01 | (f) | | | | | 29 | |
| | | 11.34 | | | | | | (3.44 | ) | | | | | 156,192 | | | | | | 0.92 | (f) | | | | | 0.93 | (f) | | | | | 1.16 | (f) | | | | | 1.17 | (f) | | | | | (0.04 | )(f) | | | | | (0.28 | )(f) | | | | | (0.28 | )(f) | | | | | 29 | |
| | | 11.21 | | | | | | (3.73 | ) | | | | | 284 | | | | | | 1.42 | (f) | | | | | 1.43 | (f) | | | | | 1.66 | (f) | | | | | 1.67 | (f) | | | | | 0.64 | (f) | | | | | 0.40 | (f) | | | | | 0.40 | (f) | | | | | 29 | |
| | | | | | | | | | | | | | | | | | | | | | | | | | | | | | | | | | | | | | | | | | | | | | | | | | | | | | | | | | | | | | | | |
| | | | | | | | | | | | | | | | | | | | | | | | | | | | | | | | | | | | | | | | | | | | | | | | | | | | | | | | | | | | | | | | |
| | | 11.98 | | | | | | 15.59 | | | | | | 513,722 | | | | | | 3.57 | | | | | | 3.57 | | | | | | 1.46 | | | | | | 1.46 | | | | | | (0.56 | ) | | | | | (0.61 | ) | | | | | (0.61 | ) | | | | | 25 | |
| | | 11.83 | | | | | | 14.61 | | | | | | 241,841 | | | | | | 4.32 | | | | | | 4.32 | | | | | | 2.21 | | | | | | 2.21 | | | | | | (1.19 | ) | | | | | (1.24 | ) | | | | | (1.24 | ) | | | | | 25 | |
| | | 12.06 | | | | | | 15.91 | | | | | | 1,613,322 | | | | | | 3.17 | | | | | | 3.17 | | | | | | 1.06 | | | | | | 1.06 | | | | | | (0.06 | ) | | | | | (0.11 | ) | | | | | (0.11 | ) | | | | | 25 | |
| | | 12.04 | | | | | | 15.73 | | | | | | 178,966 | | | | | | 3.32 | | | | | | 3.32 | | | | | | 1.21 | | | | | | 1.21 | | | | | | (0.10 | ) | | | | | (0.15 | ) | | | | | (0.15 | ) | | | | | 25 | |
| | | 11.93 | | | | | | 15.23 | | | | | | 96 | | | | | | 3.82 | | | | | | 3.84 | | | | | | 1.71 | | | | | | 1.73 | | | | | | (0.89 | ) | | | | | (0.93 | ) | | | | | (0.95 | ) | | | | | 25 | |
| | | | | | | | | | | | | | | | | | | | | | | | | | | | | | | | | | | | | | | | | | | | | | | | | | | | | | | | | | | | | | | | |
| | | | | | | | | | | | | | | | | | | | | | | | | | | | | | | | | | | | | | | | | | | | | | | | | | | | | | | | | | | | | | | | |
| | | 10.81 | | | | | | 12.12 | | | | | | 51,363 | | | | | | 9.36 | (f) | | | | | 9.71 | (f) | | | | | 1.51 | (f) | | | | | 1.86 | (f) | | | | | (1.00 | )(f) | | | | | (1.23 | )(f) | | | | | (1.63 | )(f) | | | | | 96 | |
| | | 10.76 | | | | | | 11.71 | | | | | | 20,112 | | | | | | 10.11 | (f) | | | | | 10.45 | (f) | | | | | 2.26 | (f) | | | | | 2.60 | (f) | | | | | (0.90 | )(f) | | | | | (1.14 | )(f) | | | | | (1.54 | )(f) | | | | | 96 | |
| | | 10.84 | | | | | | 12.53 | | | | | | 206,886 | | | | | | 8.95 | (f) | | | | | 9.50 | (f) | | | | | 1.11 | (f) | | | | | 1.66 | (f) | | | | | (0.17 | )(f) | | | | | (0.40 | )(f) | | | | | (1.03 | )(f) | | | | | 96 | |
| | | 10.83 | | | | | | 12.42 | | | | | | 12,229 | | | | | | 9.11 | (f) | | | | | 9.49 | (f) | | | | | 1.26 | (f) | | | | | 1.64 | (f) | | | | | (0.72 | )(f) | | | | | (0.96 | )(f) | | | | | (1.39 | )(f) | | | | | 96 | |
| | | 10.79 | | | | | | 12.02 | | | | | | 32 | | | | | | 9.59 | (f) | | | | | 10.13 | (f) | | | | | 1.75 | (f) | | | | | 2.29 | (f) | | | | | (0.86 | )(f) | | | | | (1.09 | )(f) | | | | | (1.71 | )(f) | | | | | 96 | |
| | |
| The accompanying notes are an integral part of these financial statements. | | 15 |
GOLDMAN SACHS MLP ENERGY INFRASTRUCTURE FUND
Notes to Financial Statements
May 31, 2015 (Unaudited)
Goldman Sachs Trust (the “Trust”) is a Delaware statutory trust registered under the Investment Company Act of 1940, as amended (the “Act”), as an open-end management investment company. The Trust includes the Goldman Sachs MLP Energy Infrastructure Fund (the “Fund”). The Fund is a non-diversified portfolio under the Act offering five classes of shares — Class A, Class C, Class IR, Class R and Institutional Shares. Class A Shares are sold with a front-end sales charge of up to 5.50%. Class C Shares are sold with a contingent deferred sales charge (“CDSC”) of 1.00%, which is imposed on redemptions made within 12 months of purchase. Institutional, Class IR and Class R are not subject to a sales charge.
Goldman Sachs Asset Management, L.P. (“GSAM”), an affiliate of Goldman, Sachs & Co. (“Goldman Sachs”), serves as investment adviser to the Fund pursuant to a management agreement (“Agreement”) with the Trust.
|
| 2. SIGNIFICANT ACCOUNTING POLICIES |
The financial statements have been prepared in accordance with accounting principles generally accepted in the United States of America (“GAAP”) and require management to make estimates and assumptions that may affect the reported amounts and disclosures. Actual results may differ from those estimates and assumptions.
A. Investment Valuation — The Fund’s valuation policy is to value investments at fair value.
B. Investment Income and Investments — Investment income includes interest income and dividend income, net of any foreign withholding taxes, less any amounts reclaimable. Interest income is accrued daily and adjusted for amortization of premiums and accretion of discounts. Dividend income is recognized on ex-dividend date or, for certain foreign securities, as soon as such information is obtained subsequent to the ex-dividend date. Investment transactions are reflected on trade date. Realized gains and losses are calculated using the average cost method for partnership investments and the First In First Out method for all other investments. Investment transactions are recorded on the following business day for daily net asset value (“NAV”) calculations. Distributions from Master Limited Partnerships (“MLPs”) are generally recorded based on the characterization reported on the Fund’s schedule K-1 received from the MLPs. The Fund records its pro-rata share of the income/loss and capital gains/losses, allocated from the underlying partnerships and adjusts the cost basis of the underlying partnerships accordingly.
C. Class Allocations and Expenses — Investment income, realized and unrealized gain (loss), and non-class specific expenses of the Fund are allocated daily based upon the proportion of net assets of each class. Class specific expenses, where applicable, are borne by the respective share classes and include Distribution and Service, Transfer Agent and Service and Shareholder Administration fees. Non-class specific expenses directly incurred by the Fund are charged to the Fund, while such expenses incurred by the Trust are allocated across the respective Funds on a straight-line and/or pro-rata basis depending upon the nature of the expenses.
D. Distributions to Shareholders — Over the long term, the Fund makes distributions to its shareholders each fiscal quarter at a rate that is approximately equal to the distributions the Fund receives from the MLPs and other securities in which it invests. To permit the Fund to maintain more stable quarterly distributions, the distribution for any particular quarterly period may be more or less than the amount of total investment income actually earned by the fund. The Fund estimates that only a portion of the distributions paid to shareholders will be treated as income. The remaining portion of the Fund’s distribution, which may be significant, is expected to be a return of capital. These estimates are based on the Fund’s operating results during the period, and their final federal income tax characterization may differ.
16
GOLDMAN SACHS MLP ENERGY INFRASTRUCTURE FUND
|
| 2. SIGNIFICANT ACCOUNTING POLICIES (continued) |
The characterization of distributions to shareholders for financial reporting purposes is determined in accordance with federal income tax rules, which may differ from GAAP. Certain components of the Fund’s net assets on the Statement of Assets and Liabilities reflect permanent GAAP/Tax differences based on the appropriate tax character.
E. Income Taxes — The Fund does not intend to qualify as a regulated investment company pursuant to Subchapter M of the Internal Revenue Code, but will rather be taxed as a corporation. As a result, the Fund is obligated to pay federal, state and local income tax on its taxable income.
The Fund invests primarily in MLPs, which generally are treated as partnerships for federal income tax purposes. As a limited partner in the MLPs, the Fund must report its allocable share of the MLPs’ taxable income or loss in computing its own taxable income or loss. The Fund’s tax expense or benefit is included in the Statement of Operations based on the component of income or gains/losses to which such expense or benefit relates. Deferred income taxes reflect the net tax effects of temporary differences between the carrying amounts of assets and liabilities for financial reporting purposes and the amounts used for income tax purposes. Such temporary differences are principally: (i) taxes on unrealized gains/losses, which are attributable to the temporary difference between fair market value and tax basis, (ii) the net tax effects of temporary differences between the carrying amounts of assets and liabilities for financial reporting and income tax purposes, and (iii) the net tax benefit of accumulated net operating losses and capital loss carryforwards. The Fund will accrue a deferred income tax liability balance, at the currently effective statutory United States (“U.S.”) federal income tax rate (currently 35%) plus an estimated state and local income tax rate, for its future tax liability associated with the capital appreciation of its investments and the distributions received by the Fund on interests of MLPs considered to be return of capital and for any net operating gains. The Fund may also record a deferred tax asset balance, which reflects an estimate of the Fund’s future tax benefit associated with net operating losses and/or unrealized losses.
To the extent the Fund has a deferred tax asset, consideration is given to whether or not a valuation allowance, which would offset the value of some or all of the deferred tax asset balance, is required. A valuation allowance is required if based on the evaluation criterion provided by Accounting Standards Codification (“ASC”) 740, Income Taxes (ASC 740) it is more likely than not that some portion, or all, of the deferred tax asset will not be realized. The factors considered in assessing the Fund’s valuation allowance include: the nature, frequency and severity of current and cumulative losses, the duration of the statutory carryforward periods and the associated risks that operating and capital loss carryforwards may expire unutilized. From time to time, as new information becomes available, the Fund will modify its estimates or assumptions regarding the deferred tax liability or asset.
Unexpected significant decreases in cash distributions from the Fund’s MLP investments or significant declines in the fair value of its investments may change the Fund’s assessment regarding the recoverability of their deferred tax assets and may result in a valuation allowance. If a valuation allowance is required to reduce any deferred tax asset in the future, it could have a material impact on the Fund’s NAV and results of operations in the period it is recorded. The Fund will rely to some extent on information provided by MLPs, which may not be provided to the Fund on a timely basis, to estimate operating income/loss and gains/losses and current taxes and deferred tax liabilities and/or asset balances for purposes of daily reporting of net asset values and financial statement reporting.
It is the Fund’s policy to classify interest and penalties associated with underpayment of federal and state income taxes, if any, as income tax expense on its Statement of Operations. The Fund anticipates filing income tax returns in the U.S. federal jurisdiction and various states, and such returns are subject to examination by the tax jurisdictions. The Fund has reviewed all major jurisdictions and concluded that there is no significant impact on its net assets and no tax liability resulting from unrecognized tax benefits or expenses relating to uncertain tax positions expected to be taken on its tax returns.
17
GOLDMAN SACHS MLP ENERGY INFRASTRUCTURE FUND
Notes to Financial Statements (continued)
May 31, 2015 (Unaudited)
|
| 2. SIGNIFICANT ACCOUNTING POLICIES (continued) |
Return of Capital Estimates — Distributions received from the Fund’s investments in MLPs generally are comprised of income and return of capital. The Fund records investment income and return of capital based on estimates made at the time such distributions are received. Such estimates are based on historical information available from each MLP and other industry sources. These estimates may subsequently be revised based on information received from MLPs after their tax reporting periods are concluded.
|
| 3. INVESTMENTS AND FAIR VALUE MEASUREMENTS |
The fair value of a financial instrument is the amount that would be received to sell an asset or paid to transfer a liability in an orderly transaction between market participants at the measurement date (i.e., the exit price). GAAP establishes a fair value hierarchy that prioritizes the inputs to valuation techniques used to measure fair value. The hierarchy gives the highest priority to unadjusted quoted prices in active markets for identical assets or liabilities (Level 1 measurements) and the lowest priority to unobservable inputs (Level 3 measurements). The levels used for classifying investments are not necessarily an indication of the risk associated with investing in these investments. The three levels of the fair value hierarchy are described below:
Level 1 — Unadjusted quoted prices in active markets that are accessible at the measurement date for identical, unrestricted assets or liabilities;
Level 2 — Quoted prices in markets that are not active or financial instruments for which significant inputs are observable (including, but not limited to, quoted prices for similar investments, interest rates, foreign exchange rates, volatility and credit spreads), either directly or indirectly;
Level 3 — Prices or valuations that require significant unobservable inputs (including GSAM’s assumptions in determining fair value measurement).
The Board of Trustees have adopted Valuation Procedures that govern the valuation of the portfolio investments held by the Fund, including investments for which market quotations are not readily available. The Board of Trustees have delegated to GSAM day-to-day responsibility for implementing and maintaining internal controls and procedures related to the valuation of the Fund’s portfolio investments. To assess the continuing appropriateness of pricing sources and methodologies, GSAM regularly performs price verification procedures and issues challenges as necessary to third party pricing vendors or brokers, and any differences are reviewed in accordance with the Valuation Procedures.
A. Level 1 and Level 2 Fair Value Investments — The valuation techniques and significant inputs used in determining the fair values for investments classified as Level 1 and Level 2 are as follows:
Equity Securities — Equity securities and investment companies traded on a U.S. securities exchange or the NASDAQ system, or those located on certain foreign exchanges, including but not limited to the Americas, are valued daily at their last sale price or official closing price on the principal exchange or system on which they are traded. If there is no sale or official closing price or it is believed by the investment adviser to not represent fair value, equity securities and exchange traded investment companies are valued at the last bid price for long positions and at the last ask price for short positions. Investments in investment companies (other than those that are exchange traded) are valued at the NAV on the valuation date. To the extent these investments are actively traded, they are classified as Level 1 of the fair value hierarchy, otherwise they are generally classified as Level 2.
Unlisted equity securities for which market quotations are available are valued at the last sale price on the valuation date, or if no sale occurs, at the last bid price.
18
GOLDMAN SACHS MLP ENERGY INFRASTRUCTURE FUND
|
| 3. INVESTMENTS AND FAIR VALUE MEASUREMENTS (continued) |
Subordinated Units and Private Investments — Subordinated units and private investments in public equities (“PIPEs”) are valued the same as other equity securities as noted above. A Liquidity Value Adjustment (LVA) may be applied to securities which are subject to transfer restrictions or which convert to publicly traded securities in the future when certain conditions are met. Subordinated units and PIPEs are classified as Level 2 until such time as the transfer restriction is removed.
Money Market Funds — Investments in the Goldman Sachs Financial Square Government Fund are valued at the NAV of the FST Share class on the day of valuation. These investments are generally classified as Level 1 of the fair value hierarchy.
The Goldman Sachs Financial Square Government Fund may invest in debt securities which are valued daily on the basis of quotations supplied by dealers, if market quotations are readily available, or an independent pricing service approved by the Board of Trustees. The pricing services may use valuation models or matrix pricing, which consider: (i) yield or price with respect to bonds that are considered comparable in characteristics such as rating, interest rate and maturity date or (ii) quotations from securities dealers to determine current value.
B. Level 3 Fair Value Investments — To the extent that significant inputs to valuation models and other alternative pricing sources are unobservable, or if quotations are not readily available, or if GSAM believes that such quotations do not accurately reflect fair value, the fair value of the Fund’s investments may be determined under Valuation Procedures approved by the Board of Trustees. GSAM, consistent with its procedures and applicable regulatory guidance, may make an adjustment to the most recent valuation prices of either domestic or foreign securities in light of significant events to reflect what it believes to be the fair value of the securities at the time of determining a Fund’s NAV. Significant events which could affect a large number of securities in a particular market may include, but are not limited to: significant fluctuations in U.S. or foreign markets; market dislocations; market disruptions; or unscheduled market closings. Significant events which could also affect a single issuer may include, but are not limited to: corporate actions such as reorganizations, mergers and buy-outs; ratings downgrades; and bankruptcies.
C. Fair Value Hierarchy — The following is a summary of the Fund’s investments and derivatives classified in the fair value hierarchy as of May 31, 2015:
| | | | | | | | | | | | |
| | | |
| Investment Type | | Level 1 | | | Level 2 | | | Level 3 | |
| Assets | | | | | | | | | | | | |
Common Stocks(a) | | | | | | | | | | | | |
Europe | | $ | 68,986,312 | | | $ | — | | | $ | — | |
North America | | | 2,352,569,027 | | | | 26,123,093 | | | | | |
Investment Company | | | 112,448,150 | | | | — | | | | — | |
| Total | | $ | 2,534,003,489 | | | $ | 26,123,093 | | | $ | — | |
| (a) | | Amounts are disclosed by continent to highlight the impact of time zone differences between local market close and the calculation of net asset value. Security valuations are based on the principal exchange or system on which they are traded, which may differ from country of domicile. |
For further information regarding security characteristics, see the Schedule of Investments.
19
GOLDMAN SACHS MLP ENERGY INFRASTRUCTURE FUND
Notes to Financial Statements (continued)
May 31, 2015 (Unaudited)
Currently, the highest marginal federal income tax rate for a corporation is 35%. The Fund may also be subject to a 20% alternative minimum tax to the extent that its alternative minimum tax exceeds its regular federal income tax. Total income taxes are computed by applying the federal statutory rate plus a blended state income tax rate. State taxes are estimated at a blended rate of 2.01%, net of federal tax benefit.
The reconciliation between the federal statutory income tax rate of 35% and the effective tax rate on net investment income/loss and realized and unrealized gain/loss is as follows:
| | | | |
| Description | | Amount | |
Application of statutory income tax rate | | $ | 33,468,514 | |
State income taxes, net of federal benefit | | | 2,005,672 | |
Effect of permanent differences | | | 1,456,131 | |
Other, net | | | (1,540 | ) |
Valuation Allowance | | | (31,108,272 | ) |
| Total current income tax benefit, net | | $ | 5,820,505 | |
At May 31, 2015, components of the Fund’s deferred tax assets and liabilities are as follows:
| | | | |
| Deferred tax assets: | | | |
Net operating loss carryforward (tax basis) | | $ | 31,104,642 | |
Valuation Allowance | | | (16,843,976 | ) |
| |
Total Deferred Tax assets: | | $ | 14,260,666 | |
| Deferred tax liabilities: | | | |
Net unrealized gains on investment securities (tax basis) | | | 14,260,666 | |
| |
Total Deferred Tax liabilities: | | $ | 14,260,666 | |
The Fund reviews the recoverability of its deferred tax assets based upon the weight of the available evidence. When assessing, the Fund’s management considers available carrybacks, reversing temporary taxable differences, and tax planning, if any. As a result of its analysis of the recoverability of its deferred tax assets, the Fund recorded $16,843,976 of valuation allowances as of May 31, 2015.
For the period ended May 31, 2015, components of the Fund’s current and deferred tax benefit are as follows:
| | | | |
| Current and Deferred tax benefit: | | | |
Federal | | $ | 34,923,189 | |
State | | | 2,005,588 | |
Valuation Allowance | | | (31,108,272 | ) |
| Total | | $ | 5,820,505 | |
20
GOLDMAN SACHS MLP ENERGY INFRASTRUCTURE FUND
For the six months ended May 31, 2015, the Fund does not have any interest or penalties associated with the underpayment of any income taxes. At May 31, 2015, gross unrealized appreciation and depreciation of investments, based on cost for federal income tax purposes was as follows:
| | | | |
Tax Cost | | $ | 2,521,594,655 | |
Gross unrealized gain | | | 280,443,417 | |
Gross unrealized loss | | | (241,911,490 | ) |
Net unrealized security gain | | $ | 38,531,927 | |
Any difference between cost amounts for financial statement and federal income tax purposes is due primarily to timing differences related to the tax treatment of partnership investments. For the six months ended May 31, 2015, GSAM estimates that 100% of the MLP distributions received will be treated as a return of capital.
For the six months ended May 31, 2015, the Fund distributions are estimated to be comprised of 100% return of capital. Shareholders will be informed of the final tax characterization of the distributions in February 2016. All tax years since inception remain open for examination by U.S. and state tax authorities. Management of the Fund is not aware of any tax positions for which it is reasonably possible that the total amounts of unrecognized tax benefits or expenses will significantly change in the next 12 months.
|
| 5. AGREEMENTS AND AFFILIATED TRANSACTIONS |
A. Management Agreement — Under the Agreement, GSAM manages the Fund, subject to the general supervision of the Board of Trustees.
As compensation for the services rendered pursuant to the Agreement, the assumption of the expenses related thereto and administration of the Fund’s business affairs, including providing facilities, GSAM is entitled to a management fee, accrued daily and paid monthly, equal to an annual percentage rate of the Fund’s average daily net assets.
For the six months ended May 31, 2015, the contractual and effective net management fee with GSAM were at the following rates:
| | | | | | | | | | | | | | | | | | | | | | | | | | |
| Contractual Management Rate | | | Effective Net
Management
Rate^ | |
First $1 billion | | | Next $1 billion | | | Next $3 billion | | | Next $3 billion | | | Over $8 billion | | | Effective Rate | | |
| | 1.00% | | | | 0.90% | | | | 0.86% | | | | 0.84% | | | | 0.82% | | | | 0.93% | | | | 0.93% | * |
| ^ | | Effective Net Management Rate includes the impact of management fee waivers of affiliated underlying funds, if any. |
| * | | GSAM has agreed to waive a portion of its management fee payable by the Fund in an amount equal to any management fees it earns as an investment adviser to any of the affiliated funds in which the Fund invests. The management fee waiver will remain in effect through at least March 30, 2016, and prior to such date GSAM may not terminate the arrangement without the approval of the Trustees. |
The Fund invests in the FST Shares of the Goldman Sachs Financial Square Government Fund (“Underlying Fund”). This Underlying Fund is considered to be affiliated with the Fund. GSAM has contractually agreed to waive irrevocably a portion of any underlying fund’s management fee in an amount equal to the management fee paid to GSAM due to the Fund’s investment in an affiliated fund for which it also serves as investment advisor. For the six months ended May 31, 2015, GSAM waived $41,266 of such fund’s management fee.
21
GOLDMAN SACHS MLP ENERGY INFRASTRUCTURE FUND
Notes to Financial Statements (continued)
May 31, 2015 (Unaudited)
|
| 5. AGREEMENTS AND AFFILIATED TRANSACTIONS (continued) |
B. Distribution and Service Plans — The Trust, on behalf of the Fund, has adopted Distribution and Service Plans (the “Plans”). Under the Plans, Goldman Sachs, which serves as distributor (the “Distributor”), is entitled to a fee accrued daily and paid monthly, for distribution services and personal and account maintenance services, which may then be paid by Goldman Sachs to authorized dealers, at the following annual rates calculated on the Fund’s average daily net assets of each respective share class:
| | | | | | | | | | | | |
| | | Distribution and Service Plan Rates | |
| | | Class A* | | | Class C | | | Class R* | |
Distribution Plan | | | 0.25 | % | | | 0.75 | % | | | 0.50 | % |
Service Plan | | | — | | | | 0.25 | | | �� | — | |
| * | | With respect to Class A and Class R Shares, the Distributor at its discretion may use compensation for distribution services paid under the Distribution Plan to compensate service organizations for personal and account maintenance services and expenses as long as such total compensation does not exceed the maximum cap on “service fees” imposed by the Financial Industry Regulatory Authority. |
C. Distribution Agreement — Goldman Sachs, as Distributor of the shares of the Fund pursuant to a Distribution Agreement, may retain a portion of the Class A front end sales charge and Class C Shares’ CDSC. During the six months ended May 31, 2015, Goldman Sachs advised that it retained $129,537 and $300, respectively.
D. Transfer Agency Agreement — Goldman Sachs also serves as the transfer agent of the Fund for a fee pursuant to the Transfer Agency Agreement. The fees charged for such transfer agency services are accrued daily and paid monthly at annual rates as follows: 0.19% of the average daily net assets of Class A, Class C, Class IR and Class R Shares; and 0.04% of the average daily net assets of Institutional Shares.
E. Other Expense Agreements and Affiliated Transactions — GSAM has agreed to limit certain “Other Expenses” of the Fund (excluding acquired fund fees and expenses, transfer agency fees and expenses, service fees and shareholder administration fees (as applicable), taxes, interest, brokerage fees, shareholder meeting, litigation, indemnification and extraordinary expenses) to the extent such expenses exceed, on an annual basis, a percentage rate of the average daily net assets of the Fund. Such Other Expense reimbursements, if any, are accrued daily and paid monthly. In addition, the Fund is not obligated to reimburse GSAM for prior fiscal year expense reimbursements, if any. The Other Expense limitations as an annual percentage rate of average daily net assets for the Fund is 0.064%. These Other Expense limitations will remain in place through at least March 30, 2016, and prior to such date GSAM may not terminate the arrangements without the approval of the Board of Trustees. The Fund bears its respective share of costs related to proxy and shareholder meetings, and GSAM has agreed to reimburse the Fund to the extent such expenses exceed a specified percentage of the Fund’s net assets. In addition, the Fund has entered into certain offset arrangements with the custodian and the transfer agent, which may result in a reduction of the Fund’s expenses and are received irrespective of the application of the “Other Expense” limitations described above. For the six months ended May 31, 2015, there were no expense reimbursements.
22
GOLDMAN SACHS MLP ENERGY INFRASTRUCTURE FUND
|
| 5. AGREEMENTS AND AFFILIATED TRANSACTIONS (continued) |
F. Other Transactions with Affiliates — For the six months ended May 31, 2015, Goldman Sachs did not earn any brokerage commissions from portfolio transactions on behalf of the Fund.
An investment by the Fund representing greater than 5% of the voting securities of an issuer makes that issuer an affiliated person (as defined by the Act) of the Fund. The following table provides information about the investment in shares of issuers of which the Fund is an affiliate for the six months ended May 31, 2015:
| | | | | | | | | | | | | | | | | | | | | | | | | | |
| Name of Affiliated Issuer | | | | Number of Shares Held Beginning of Period | | | Shares Bought | | | Shares Sold | | | Number of Shares Held End of Period | | | Value at End of Period | | | Dividend Income | |
Cone Midstream Partners LP | | | | | 1,893,155 | | | | 207,593 | | | | (73,734 | ) | | | 2,027,014 | | | $ | 39,547,043 | | | $ | 852,792 | |
GasLog Partners LP | | | | | 1,000,000 | | | | — | | | | (213,579 | ) | | | 786,421 | | | | 20,053,736 | | | | 831,557 | |
PBF Logistics LP | | | | | 1,573,900 | | | | — | | | | (227,734 | ) | | | 1,346,166 | | | | 31,123,358 | | | | 1,001,741 | |
Summit Midstream Partners LP | | | | | 2,762,470 | | | | 51,207 | | | | (646,986 | ) | | | 2,166,691 | | | | 72,865,818 | | | | 2,815,643 | |
The table below shows the transactions in and earnings from investments in this affiliated Fund for the six months ended May 31, 2015:
| | | | | | | | | | | | | | | | | | | | | | |
| Underlying Fund | | | | Market Value
11/30/14 | | | Purchases at
Cost | | | Proceeds from
Sales | | | Market Value
5/31/15 | | | Dividend
Income | |
Goldman Sachs Financial Square Government Fund | | | | $ | 121,214,808 | | | $ | 452,523,329 | | | $ | (461,289,987 | ) | | $ | 112,448,150 | | | $ | 1,921 | |
G. Line of Credit Facility — As of May 31, 2015, the Fund participated in a $1,205,000,000 committed, unsecured revolving line of credit facility (the “facility”) together with other funds of the Trust and registered investment companies having management agreements with GSAM or its affiliates (“Other Borrowers”). Pursuant to the terms of the facility, the Fund and Other Borrowers could increase the credit amount by an additional $115,000,000, for a total of up to $1,320,000,000. This facility is to be used for temporary emergency purposes, or to allow for an orderly liquidation of securities to meet redemption requests. The interest rate on borrowings is based on the federal funds rate. The facility also requires a fee to be paid by the Fund based on the amount of the commitment that has not been utilized. For the six months ended May 31, 2015, the Fund did not have any borrowings under the facility.
|
| 6. PORTFOLIO SECURITIES TRANSACTIONS |
The cost of purchases and proceeds from sales and maturities of long-term securities for the six months ended May 31, 2015, were $877,929,112 and $697,140,870, respectively.
The Fund’s risks include, but are not limited to, the following:
Investments in Other Investment Companies — As a shareholder of another investment company, the Fund will directly bear its proportionate share of any net management fees and other expenses paid by such other investment companies, in addition to the fees and expenses regularly borne by the Fund.
23
GOLDMAN SACHS MLP ENERGY INFRASTRUCTURE FUND
Notes to Financial Statements (continued)
May 31, 2015 (Unaudited)
|
| 7. OTHER RISKS (continued) |
Large Shareholder Transactions Risk — The Fund may experience adverse effects when certain large shareholders, such as other funds, institutional investors (including those trading by use of non-discretionary mathematical formulas), financial intermediaries (who may make investment decisions on behalf of underlying clients and/or include the Fund in their investment model), individuals, accounts and Goldman Sachs affiliates, purchase or redeem large amounts of shares of the Fund. Such large shareholder redemptions may cause the Fund to sell portfolio securities at times when it would not otherwise do so, which may negatively impact the Fund’s NAV and liquidity. Similarly, large Fund share purchases may adversely affect the Fund’s performance to the extent that the Fund is delayed in investing new cash and is required to maintain a larger cash position than it ordinarily would. These transactions may also accelerate the realization of taxable income to shareholders if such sales of investments resulted in gains, and may also increase transaction costs. In addition, a large redemption could result in the Fund’s current expenses being allocated over a smaller asset base, leading to an increase in the Fund’s expense ratio.
Liquidity Risk — The Fund may make investments that are illiquid or that may become less liquid in response to market developments or adverse investor perceptions. Illiquid investments may be more difficult to value. Liquidity risk may also refer to the risk that the Fund will not be able to pay redemption proceeds within the allowable time period because of unusual market conditions, an unusually high volume of redemption requests, or other reasons. To meet redemption requests, the Fund may be forced to sell investments at an unfavorable time and/or under unfavorable conditions.
Market and Credit Risks — In the normal course of business, the Fund trades financial instruments and enters into financial transactions where risk of potential loss exists due to changes in the market (market risk). Additionally, the Fund may also be exposed to credit risk in the event that an issuer or guarantor fails to perform or that an institution or entity with which the Fund has unsettled or open transactions defaults. An investment in the Fund represents an indirect investment in the securities owned by the Fund, a significant portion of which are traded on a national securities exchange. The value of these securities, like other investments, may move up or down, sometimes rapidly and unpredictably.
Master Limited Partnership Risk — Investments in securities of MLPs involve risks that differ from investments in common stocks, including risks related to limited control and limited rights to vote on matters affecting the MLP, risks related to potential conflicts of interest between the MLP and the MLP’s general partner, cash flow risks, dilution risks, limited liquidity and risks related to the general partner’s right to require unit-holders to sell their common units at an undesirable time or price.
Non-Diversification Risk — The Fund is non-diversified, meaning that it is permitted to invest a larger percentage of its assets in fewer issuers than diversified mutual funds. Thus, the Fund may be more susceptible to adverse developments affecting any single issuer held in its portfolio, and may be more susceptible to greater losses because of these developments.
Private Investment Risk — The Funds may invest in PIPE securities. PIPE transactions typically involve the purchase of securities directly from a publicly traded company or its affiliates in a private placement transaction, typically at a discount to the market price of the company’s common stock. In a PIPE transaction, the Funds may bear the price risk from the time of pricing until the time of closing. Equity issued in this manner is often subject to transfer restrictions and is therefore less liquid than equity issued through a registered public offering. The Funds may be subject to lock-up agreements that prohibit transfers for a fixed period of time. In addition, because the sale of the securities in a PIPE transaction is not registered under the Securities Act, the securities are “restricted” and cannot be immediately resold into the public markets. The ability of the Funds to freely transfer restricted shares is conditioned upon, among other things, the SEC’s preparedness to declare the resale registration statement effective and the issuer’s right to suspend the Fund’s use of the resale registration statement if the issuer is pursuing a transaction or some other material non-public event is occurring. Accordingly, PIPE securities may be subject to risks associated with illiquid securities.
24
GOLDMAN SACHS MLP ENERGY INFRASTRUCTURE FUND
|
| 7. OTHER RISKS (continued) |
Portfolio Concentration Risk — The Fund concentrates its investments in the energy sector, and will therefore be susceptible to adverse economic, environmental, business, regulatory or other occurrences affecting that sector. The energy sector has historically experienced substantial price volatility. MLPs and other companies operating in the energy sector are subject to specific risks, including, among others, fluctuations in commodity prices; reduced consumer demand for commodities such as oil, natural gas or petroleum products; reduced availability of natural gas or other commodities for transporting, processing, storing or delivering; slowdowns in new construction; extreme weather or other natural disasters; and threats of attack by terrorists on energy assets. Additionally, changes in the regulatory environment for energy companies may adversely impact their profitability. Over time, depletion of natural gas reserves and other energy reserves may also affect the profitability of energy companies.
Strategy Risk — The Fund’s strategy of investing primarily in MLPs, resulting in its being taxed as a corporation, or a “C” corporation, rather than as a regulated investment company for U.S. federal income tax purposes, is a relatively new investment strategy for funds. This strategy involves complicated accounting, tax and valuation issues. Volatility in the NAV may be experienced because of the use of estimates at various times during a given year that may result in unexpected and potentially significant consequences for the Fund and its shareholders.
Tax Risks — Tax risks associated with investments in the Fund include but are not limited to the following:
Fund Structure Risk. Unlike traditional mutual funds that are structured as regulated investment companies for U.S. federal income tax purposes, the Fund will be taxable as a regular corporation, or “C” corporation, for U.S. federal income tax purposes. This means the Fund generally will be subject to U.S. federal income tax on its taxable income at the rates applicable to corporations (currently a maximum rate of 35%), and will also be subject to state and local income taxes.
MLP Tax Risk. MLPs are generally treated as partnerships for U.S. federal income tax purposes. Partnerships do not pay U.S. federal income tax at the partnership level. Rather, each partner is allocated a share of the partnership’s income, gains, losses, deductions and expenses. A change in current tax law or a change in the underlying business mix of a given MLP could result in an MLP being treated as a corporation for U.S. federal income tax purposes, which would result in the MLP being required to pay U.S. federal income tax (as well as state and local income taxes) on its taxable income. This would have the effect of reducing the amount of cash available for distribution by the MLP and could result in a reduction in the value of the Fund’s investment in the MLP and lower income to the Fund.
To the extent a distribution received by the Fund from an MLP is treated as a return of capital, the Fund’s adjusted tax basis in the interests of the MLP will be reduced, which may increase the Fund’s tax liability upon the sale of the interests in the MLP or upon subsequent distributions in respect of such interests.
25
GOLDMAN SACHS MLP ENERGY INFRASTRUCTURE FUND
Notes to Financial Statements (continued)
May 31, 2015 (Unaudited)
|
| 7. OTHER RISKS (continued) |
Tax Estimation/NAV Risk. In calculating the Fund’s NAV, the Fund will, among other things, include its current taxes and deferred tax liability and/or asset balances and related valuation balances, if any. The Fund may accrue a deferred income tax liability balance, at the currently effective statutory U.S. federal income tax rate (currently 35%) plus an estimated state and local income tax rate, for its future tax liability associated with the capital appreciation of its investments and the distributions received by the Fund on interests of MLPs considered to be return of capital and for any net operating gains. Any deferred tax liability balance will reduce the Fund’s NAV which could have an effect on the market price of the shares. The Fund may also record a deferred tax asset balance, which reflects an estimate of the Fund’s future tax benefit associated with net operating losses and/or unrealized losses. Any deferred tax asset balance will increase the Fund’s NAV to the extent it exceeds any valuation allowance which could have an effect on the market price of the shares. The Fund will rely to some extent on information provided by MLPs, which may not be provided to the Fund on a timely basis, to estimate current taxes and deferred tax liability and/or asset balances for purposes of financial statement reporting and determining its NAV to the extent it exceeds any valuation allowance. The daily estimate of the Fund’s current taxes and deferred tax liability and/or asset balances used to calculate the Fund’s NAV could vary significantly from the Fund’s actual tax liability or benefit, and, as a result, the determination of the Fund’s actual tax liability or benefit may have a material impact on the Fund’s NAV. From time to time, the Fund may modify its estimates or assumptions regarding its current taxes and deferred tax liability and/or asset balances as new information becomes available, which modifications in estimates or assumptions may have a material impact on the Fund’s NAV.
Under the Trust’s organizational documents, its Trustees, officers, employees and agents are indemnified, to the extent permitted by the Act and state law, against certain liabilities that may arise out of performance of their duties to the Fund. Additionally, in the course of business, the Fund enters into contracts that contain a variety of indemnification clauses. The Fund’s maximum exposure under these arrangements is unknown, as this would involve future claims that may be made against the Fund that have not yet occurred. However, GSAM believes the risk of loss under these arrangements to be remote.
Subsequent events after the Statement of Assets and Liabilities date have been evaluated through the date the financial statements were issued. GSAM has concluded that there is no impact requiring adjustment or disclosure in the financial statements.
26
GOLDMAN SACHS MLP ENERGY INFRASTRUCTURE FUND
|
| 10. SUMMARY OF SHARE TRANSACTIONS |
Share activity is as follows:
| | | | | | | | | | | | | | | | |
| | | MLP Energy Infrastructure Fund | |
| | | | |
| | | For the Six Months Ended May 31, 2015 (Unaudited) | | | For the Fiscal Year Ended November 30, 2014 | |
| | | | |
| | | Shares | | | Dollars | | | Shares | | | Dollars | |
| | | | |
| Class A Shares | | | | | | | | | | | | | | | | |
Shares sold | | | 11,711,463 | | | $ | 131,705,599 | | | | 51,624,941 | | | $ | 632,407,858 | |
Reinvestment of distributions | | | 1,025,589 | | | | 11,739,016 | | | | 1,138,092 | | | | 13,885,854 | |
Shares redeemed | | | (11,208,026 | ) | | | (125,177,856 | ) | | | (14,620,671 | ) | | | (183,610,381 | ) |
| | | | 1,529,026 | | | | 18,266,759 | | | | 38,142,362 | | | | 462,683,331 | |
| Class C Shares | | | | | | | | | | | | | | | | |
Shares sold | | | 5,574,030 | | | | 61,853,623 | | | | 19,314,978 | | | | 236,914,029 | |
Reinvestment of distributions | | | 551,942 | | | | 6,226,756 | | | | 454,569 | | | | 5,496,812 | |
Shares redeemed | | | (2,789,572 | ) | | | (30,910,602 | ) | | | (1,197,380 | ) | | | (14,349,140 | ) |
| | | | 3,336,400 | | | | 37,169,777 | | | | 18,572,167 | | | | 228,061,701 | |
| Institutional Shares | | | | | | | | | | | | | | | | |
Shares sold | | | 55,350,499 | | | | 625,870,461 | | | | 135,026,025 | | | | 1,662,053,148 | |
Reinvestment of distributions | | | 3,222,573 | | | | 37,194,046 | | | | 3,353,487 | | | | 41,101,075 | |
Shares redeemed | | | (46,990,390 | ) | | | (525,974,915 | ) | | | (23,702,743 | ) | | | (297,365,208 | ) |
| | | | 11,582,682 | | | | 137,089,592 | | | | 114,676,769 | | | | 1,405,789,015 | |
| Class IR Shares | | | | | | | | | | | | | | | | |
Shares sold | | | 4,443,556 | | | | 50,125,050 | | | | 15,383,813 | | | | 190,708,488 | |
Reinvestment of distributions | | | 318,658 | | | | 3,667,726 | | | | 326,552 | | | | 4,005,949 | |
Shares redeemed | | | (5,854,304 | ) | | | (65,425,033 | ) | | | (1,969,365 | ) | | | (24,769,836 | ) |
| | | | (1,092,090 | ) | | | (11,632,257 | ) | | | 13,741,000 | | | | 169,944,601 | |
| Class R Shares | | | | | | | | | | | | | | | | |
Shares sold | | | 17,326 | | | | 193,510 | | | | 6,520 | | | | 81,408 | |
Reinvestment of distributions | | | 446 | | | | 5,091 | | | | 201 | | | | 2,436 | |
Shares redeemed | | | (473 | ) | | | (5,451 | ) | | | (1,709 | ) | | | (22,445 | ) |
| | | | 17,299 | | | | 193,150 | | | | 5,012 | | | | 61,399 | |
NET INCREASE | | | 15,373,317 | | | $ | 181,087,021 | | | | 185,137,310 | | | $ | 2,266,540,047 | |
27
GOLDMAN SACHS MLP ENERGY INFRASTRUCTURE FUND
| | |
Fund Expenses — Six Month Period Ended May 31, 2015 (Unaudited) | | |
As a shareholder of Class A, Class C, Institutional, Class IR or Class R Shares of the Fund, you incur two types of costs: (1) transaction costs, including sales charges on purchase payments (with respect to Class A Shares), contingent deferred sales charges on redemptions (with respect to Class C Shares), and (2) ongoing costs, including management fees; distribution and service (12b-1) fees (with respect to Class A, Class C and Class R Shares); and other Fund expenses. This Example is intended to help you understand your ongoing costs (in dollars) of investing in Class A, Class C, Institutional, Class IR or Class R Shares of the Fund and to compare these costs with the ongoing costs of investing in other mutual funds.
The Example is based on an investment of $1,000 invested at the beginning of the period and held for the entire period from December 1, 2014 through May 31, 2015, which represents a period of 182 days of a 365 day year.
Actual Expenses — The first line under each share class in the table below provides information about actual account values and actual expenses. You may use the information in this line, together with the amount you invested, to estimate the expenses that you paid over the period. Simply divide your account value by $1,000 (for example, an $8,600 account value divided by $1,000=8.6), then multiply the result by the number in the first line under the heading entitled “Expenses Paid” to estimate the expenses you paid on your account during this period, which represents a period of 182 days of a 365 day year.
Hypothetical Example for Comparison Purposes — The second line under each share class in the table below provides information about hypothetical account values and hypothetical expenses based on the Fund’s actual net expense ratios and an assumed rate of return of 5% per year before expenses, which is not the Fund’s actual return. The hypothetical account values and expenses may not be used to estimate the actual ending account balance or expenses you paid for the period. You may use this information to compare the ongoing costs of investing in the Fund and other funds. To do so, compare this 5% hypothetical example with the 5% hypothetical examples that appear in the shareholder reports of the other funds.
Please note that the expenses shown in the table are meant to highlight your ongoing costs only and do not reflect any transactional costs, such as sales charges, redemption fees, or exchange fees. Therefore, the second line of the table is useful in comparing ongoing costs only, and will not help you determine the relative total costs of owning different funds. In addition, if these transactional costs were included, your costs would have been higher.
| | | | | | | | | | | | |
| | | MLP Energy Infrastructure Fund | |
| Share Class | | Beginning Account Value
12/1/14 | | | Ending
Account Value
5/31/15 | | | Expenses
Paid for the
6 months ended
5/31/15* | |
| Class A | | | | | | | | | | | | |
Actual | | $ | 1,000.00 | | | $ | 962.90 | | | $ | 6.90 | |
Hypothetical 5% return | | | 1,000.00 | | | | 1,017.90 | + | | | 7.09 | |
| Class C | | | | | | | | | | | | |
Actual | | | 1,000.00 | | | | 959.80 | | | | 10.55 | |
Hypothetical 5% return | | | 1,000.00 | | | | 1,014.16 | + | | | 10.85 | |
| Institutional | | | | | | | | | | | | |
Actual | | | 1,000.00 | | | | 965.70 | | | | 4.95 | |
Hypothetical 5% return | | | 1,000.00 | | | | 1,019.90 | + | | | 5.09 | |
| Class IR | | | | | | | | | | | | |
Actual | | | 1,000.00 | | | | 965.60 | | | | 5.68 | |
Hypothetical 5% return | | | 1,000.00 | | | | 1,019.15 | + | | | 5.84 | |
| Class R | | | | | | | | | | | | |
Actual | | | 1,000.00 | | | | 962.70 | | | | 8.12 | |
Hypothetical 5% return | | | 1,000.00 | | | | 1,016.65 | + | | | 8.35 | |
| | * | | Expenses for each share class are calculated using the Fund’s annualized net expense ratio for each class, which represents the ongoing expenses as a percentage of net assets for the six months ended May 31, 2015. Deferred tax (benefit) expense is not included in the ratio calculation. Expenses are calculated by multiplying the annualized net expense ratio by the average account value for the period; then multiplying the result by the number of days in the most recent fiscal half year; and then dividing that result by the number of days in the fiscal year. The annualized net expense ratios for the period were as follows: | |
| | | | | | | | | | | | | | | | | | | | |
| Fund | | Class A | | | Class C | | | Institutional | | | Class IR | | | Class R | |
MLP Energy Infrastructure | | | 1.41 | % | | | 2.16 | % | | | 1.01 | % | | | 1.16 | % | | | 1.66 | % |
| | + | | Hypothetical expenses are based on the Fund’s actual annualized net expense ratios and an assumed rate of return of 5% per year before expenses. | |
28
FUNDS PROFILE
Goldman Sachs Funds

Goldman Sachs is a premier financial services firm, known since 1869 for creating thoughtful and customized investment solutions in complex global markets.
Today, the Investment Management Division of Goldman Sachs serves a diverse set of clients worldwide, including private institutions, public entities and individuals. With approximately $1.02 trillion in assets under supervision as of March 31, 2015, Goldman Sachs Asset Management (“GSAM”) has portfolio management teams located around the world and our investment professionals bring firsthand knowledge of local markets to every investment decision. Assets under supervision includes assets under management and other client assets for which Goldman Sachs does not have full discretion. GSAM leverages the resources of Goldman, Sachs & Co. subject to legal, internal and regulatory restrictions.

Money Market1
Financial Square FundsSM
| n | | Financial Square Tax-Exempt Funds |
| n | | Financial Square Federal Fund |
| n | | Financial Square Government Fund |
| n | | Financial Square Money Market Fund |
| n | | Financial Square Prime Obligations Fund |
| n | | Financial Square Treasury Instruments Fund |
| n | | Financial Square Treasury Obligations Fund |
Fixed Income
Short Duration and Government
| n | | High Quality Floating Rate Fund |
| n | | Limited Maturity Obligations Fund |
| n | | Short Duration Government Fund |
| n | | Short Duration Income Fund |
| n | | Inflation Protected Securities Fund |
Multi-Sector
Municipal and Tax-Free
| n | | High Yield Municipal Fund |
| n | | Dynamic Municipal Income Fund3 |
| n | | Short Duration Tax-Free Fund |
Single Sector
| n | | Investment Grade Credit Fund |
| n | | High Yield Floating Rate Fund |
| n | | Emerging Markets Debt Fund |
| n | | Local Emerging Markets Debt Fund |
| n | | Dynamic Emerging Markets Debt Fund |
Fixed Income Alternatives
| n | | Long Short Credit Strategies Fund |
| n | | Fixed Income Macro Strategies Fund |
Fundamental Equity
| n | | Small/Mid Cap Value Fund |
| n | | Small/Mid Cap Growth Fund |
| n | | Flexible Cap Growth Fund |
| n | | Concentrated Growth Fund |
| n | | Technology Tollkeeper Fund |
| n | | Growth Opportunities Fund |
| n | | Rising Dividend Growth Fund |
| n | | Dynamic U.S. Equity Fund4 |
Tax-Advantaged Equity
| n | | U.S. Tax-Managed Equity Fund |
| n | | International Tax-Managed Equity Fund |
| n | | U.S. Equity Dividend and Premium Fund |
| n | | International Equity Dividend and Premium Fund |
Equity Insights
| n | | Small Cap Equity Insights Fund |
| n | | U.S. Equity Insights Fund |
| n | | Small Cap Growth Insights Fund |
| n | | Large Cap Growth Insights Fund |
| n | | Large Cap Value Insights Fund |
| n | | Small Cap Value Insights Fund |
| n | | International Small Cap Insights Fund |
| n | | International Equity Insights Fund |
| n | | Emerging Markets Equity Insights Fund |
Fundamental International Equity
| n | | Strategic International Equity Fund |
| n | | Focused International Equity Fund4 |
| n | | International Small Cap Fund |
| n | | Emerging Markets Equity Fund |
| n | | BRIC Fund (Brazil, Russia, India, China) |
Select Satellite5
| n | | Global Managed Beta Fund |
| n | | Multi-Manager Non-Core Fixed Income Fund |
| n | | Real Estate Securities Fund |
| n | | International Real Estate Securities Fund |
| n | | Commodity Strategy Fund |
| n | | Dynamic Commodity Strategy Fund |
| n | | Dynamic Allocation Fund |
| n | | Absolute Return Tracker Fund |
| n | | Managed Futures Strategy Fund |
| n | | MLP Energy Infrastructure Fund |
| n | | Multi-Manager Alternatives Fund |
| n | | Multi-Asset Real Return Fund |
| n | | Retirement Portfolio Completion Fund |
| n | | Tactical Tilt Implementation Fund |
Total Portfolio Solutions5
| n | | Balanced Strategy Portfolio |
| n | | Growth and Income Strategy Portfolio |
| n | | Growth Strategy Portfolio |
| n | | Equity Growth Strategy Portfolio |
| n | | Satellite Strategies Portfolio |
| n | | Enhanced Dividend Global Equity Portfolio |
| n | | Tax Advantaged Global Equity Portfolio |
| 1 | | An investment in a money market fund is neither insured nor guaranteed by the Federal Deposit Insurance Corporation (“FDIC”) or any other government agency. Although the Funds seek to preserve the value of your investment at $1.00 per share, it is possible to lose money by investing in the Funds. |
| 2 | | Effective on October 1, 2014, the Goldman Sachs Core Plus Fixed Income Fund was renamed the Goldman Sachs Bond Fund. |
| 3 | | Effective on December 18, 2014, the Goldman Sachs Municipal Income Fund was renamed the Goldman Sachs Dynamic Municipal Income Fund. |
| 4 | | Effective on April 30, 2015, the Goldman Sachs U.S. Equity Fund was renamed the Goldman Sachs Dynamic U.S. Equity Fund. |
| 5 | | Individual Funds within the Total Portfolio Solutions and Select Satellite categories will have various placement on the risk/return spectrum and may have greater or lesser risk than that indicated by the placement of the general Total Portfolio Solutions or Select Satellite category. |
Financial Square FundsSM is a registered service mark of Goldman, Sachs & Co.
| *This | | list covers open-end funds only. Please visit our website at www.GSAMFUNDS.com to learn about our closed-end funds. |
| | |
| TRUSTEES | | OFFICERS |
Ashok N. Bakhru, Chairman Kathryn A. Cassidy John P. Coblentz, Jr. Diana M. Daniels Joseph P. LoRusso Herbert J. Markley James A. McNamara Jessica Palmer Alan A. Shuch Richard P. Strubel Roy W. Templin Gregory G. Weaver | | James A. McNamara, President Scott M. McHugh, Principal Financial Officer and Treasurer Caroline Kraus, Secretary |
| |
GOLDMAN, SACHS & CO. Distributor and Transfer Agent | | GOLDMAN SACHS ASSET MANAGEMENT, L.P. Investment Adviser |
Visit our web site at www.GSAMFUNDS.com to obtain the most recent month-end returns.
Goldman Sachs Asset Management, L.P., 200 West Street, New York, New York 10282
The reports concerning the Fund included in this shareholder report may contain certain forward-looking statements about the factors that may affect the performance of the Fund in the future. These statements are based on Fund management’s predictions and expectations concerning certain future events and their expected impact on the Fund, such as performance of the economy as a whole and of specific industry sectors, changes in the levels of interest rates, the impact of developing world events, and other factors that may influence the future performance of the Fund. Management believes these forward-looking statements to be reasonable, although they are inherently uncertain and difficult to predict. Actual events may cause adjustments in portfolio management strategies from those currently expected to be employed.
A description of the policies and procedures that the Fund uses to determine how to vote proxies relating to portfolio securities and information regarding how the Fund voted proxies relating to portfolio securities during the most recent 12-month period ended June 30 is available (I) without charge, upon request by calling 1-800-526-7384 (for Retail Shareholders) or 1-800-621-2550 (for Institutional Shareholders); and (II) on the Securities and Exchange Commission web site at http://www.sec.gov.
The Fund files its complete schedule of portfolio holdings with the SEC for the first and third quarters of each fiscal year on Form N-Q. The Fund’s Forms N-Q are available on the SEC’s web site at http://www.sec.gov within 60 days after the Fund’s first and third fiscal quarters. The Fund’s Forms N-Q may be reviewed and copied at the SEC’s Public Reference Room in Washington, D.C., and information on the operation of the Public Reference Room may also be obtained by calling 1-800-SEC-0330. Forms N-Q may be obtained upon request and without charge by calling 1-800-526-7384 (for Retail Shareholders) or 1-800-621-2550 (for Institutional Shareholders).
Fund holdings and allocations shown are as of May 31, 2015 and may not be representative of future investments. Fund holdings should not be relied on in making investment decisions and should not be construed as research or investment advice regarding particular securities. Current and future holdings are subject to risk.
Economic and market forecasts presented herein reflect our judgment as of the date of this presentation and are subject to change without notice. These forecasts do not take into account the specific investment objectives, restrictions, tax and financial situation or other needs of any specific client. Actual data will vary and may not be reflected here. These forecasts are subject to high levels of uncertainty that may affect actual performance. Accordingly, these forecasts should be viewed as merely representative of a broad range of possible outcomes. These forecasts are estimated, based on assumptions, and are subject to significant revision and may change materially as economic and market conditions change. Goldman Sachs has no obligation to provide updates or changes to these forecasts. Case studies and examples are for illustrative purposes only.
“Alerian MLP Index”, “Alerian MLP Total Return Index”, “AMZ” and “AMZX” are trademarks of Alerian and their use is granted under a license from Alerian. The Global Industry Classification Standard (GICS) was developed by and is the exclusive property and a service mark of Morgan Stanley Capital International Inc. (MSCI) and Standard & Poor’s, a division of The McGraw-Hill Companies, Inc. (S&P) and is licensed for use by Goldman Sachs. Neither MSCI, S&P nor any other party involved in making or compiling the GICS or any GICS classifications makes any express or implied warranties or representations with respect to such standard or classification (or the results to be obtained by the use thereof), and all such parties hereby expressly disclaim all warranties of originality, accuracy, completeness, merchantability or fitness for a particular purpose with respect to any of such standard or classification. Without limiting any of the foregoing, in no event shall MSCI, S&P, any of their affiliates or any third party involved in making or compiling the GICS or any GICS classifications have any liability for any direct, indirect, special, punitive, consequential or any other damages (including lost profits) even if notified of the possibility of such damages.
The portfolio risk management process includes an effort to monitor and manage risk, but does not imply low risk.
This material is not authorized for distribution to prospective investors unless preceded or accompanied by a current Prospectus or summary prospectus, if applicable. Investors should consider a Fund’s objective, risks, and charges and expenses, and read the summary prospectus, if available, and/or the Prospectus carefully before investing or sending money. The summary prospectus, if available, and the Prospectus contain this and other information about a Fund and may be obtained from your authorized dealer or from Goldman, Sachs & Co. by calling (retail – 1-800-526-7384) (institutional – 1-800-621-2550).
© 2015 Goldman Sachs. All rights reserved. 166754.MF.MED.TMPL/7/2015 MLPEISAR-15 / 44.2k
| (a) | As of the end of the period covered by this report, the registrant has adopted a code of ethics that applies to the registrant’s principal executive officer, principal financial officer, principal accounting officer or controller, or persons performing similar functions, regardless of whether these individuals are employed by the registrant or a third party (the “Code of Ethics”). |
| (b) | During the period covered by this report, no amendments were made to the provisions of the Code of Ethics. |
| (c) | During the period covered by this report, the registrant did not grant any waivers, including an implicit waiver, from any provision of the Code of Ethics. |
| (d) | A copy of the Code of Ethics is available as provided in Item 12(a)(1) of this report. |
| ITEM 3. | AUDIT COMMITTEE FINANCIAL EXPERT. |
| | The registrant’s board of trustees has determined that the registrant has at least one “audit committee financial expert” (as defined in Item 3 of Form N-CSR) serving on its audit committee. John P. Coblentz, Jr. is the “audit committee financial expert” and is “independent” (as each term is defined in Item 3 of Form N-CSR). |
| ITEM 4. | PRINCIPAL ACCOUNTANT FEES AND SERVICES. |
Table 1 — Items 4(a) - 4(d). The accountant fees below reflect the aggregate fees billed by all of the Funds of the Goldman Sachs Trust and includes the Goldman Sachs Funds to which this certified shareholder report relates.
| | | | | | | | | | |
| | | 2014 | | | 2013 | | | Description of Services Rendered |
Audit Fees: | | | | | | | | | | |
• PricewaterhouseCoopers LLP (“PwC”) | | $ | 3,563,029 | | | $ | 2,304,956 | | | Financial Statement audits. |
Audit-Related Fees: | | | | | | | | | | |
• PwC | | $ | 0 | | | $ | 2,340 | | | Other attest services. |
Tax Fees: | | | | | | | | | | |
• PwC | | $ | 818,750 | | | $ | 933,950 | | | Tax compliance services provided in connection with the preparation and review of registrant’s tax returns. |
Table 2 — Items 4(b)(c) & (d). Non-Audit Services to the Goldman Sachs Trust’s service affiliates * that were pre-approved by the Audit Committee of the Goldman Sachs Trust pursuant to Rule 2-01(c)(7)(ii) of Regulation S-X.
| | | | | | | | | | |
| | | 2014 | | | 2013 | | | Description of Services Rendered |
Audit-Related Fees: | | | | | | | | | | |
• PwC | | $ | 1,486,420 | | | $ | 1,516,680 | | | Internal control review performed in accordance with Statement on Standards for Attestation Engagements No. 16. These fees are borne by the Funds’ Adviser. |
| * | These include the advisor (excluding sub-advisors) and any entity controlling, controlled by or under common control with the advisor that provides ongoing services to the registrant (hereinafter referred to as “service affiliates”). |
Item 4(e)(1) — Audit Committee Pre-Approval Policies and Procedures
Pre-Approval of Audit and Non-Audit Services Provided to the Funds of the Goldman Sachs Trust. The Audit and Non-Audit Services Pre-Approval Policy (the “Policy”) adopted by the Audit Committee of Goldman Sachs Trust (“GST”) sets forth the procedures and the conditions pursuant to which services performed by an independent auditor for GST may be pre-approved. Services may be pre-approved specifically by the Audit Committee as a whole or, in certain circumstances, by the Audit Committee Chairman or the person designated as the Audit Committee Financial Expert. In addition, subject to specified cost limitations, certain services may be pre-approved under the provisions of the Policy. The Policy provides that the Audit Committee will consider whether the services provided by an independent auditor are consistent with the Securities and Exchange Commission’s rules on auditor independence. The Policy provides for periodic review and pre-approval by the Audit Committee of the services that may be provided by the independent auditor.
De Minimis Waiver. The pre-approval requirements of the Policy may be waived with respect to the provision of non-audit services that are permissible for an independent auditor to perform, provided (1) the aggregate amount of all such services provided constitutes no more than five percent of the total amount of revenues subject to pre-approval that was paid to the independent auditors during the fiscal year in which the services are provided; (2) such services were not recognized by GST at the time of the engagement to be non-audit services; and (3) such services are promptly brought to the attention of the Audit Committee and approved prior to the completion of the audit by the Audit Committee or by one or more members of the Audit Committee to whom authority to grant such approvals has been delegated by the Audit Committee, pursuant to the pre-approval provisions of the Policy.
Pre-Approval of Non-Audit Services Provided to GST’s Investment Advisers. The Policy provides that, in addition to requiring pre-approval of audit and non-audit services provided to GST, the Audit Committee will pre-approve those non-audit services provided to GST’s investment advisers (and entities controlling, controlled by or under common control with the investment advisers that provide ongoing services to GST) where the engagement relates directly to the operations or financial reporting of GST.
Item 4(e)(2) – 0% of the audit-related fees, tax fees and other fees listed in Table 1 were approved by GST’s Audit Committee pursuant to the “de minimis” exception of Rule 2-01(c)(7)(i)(C) of Regulation S-X. In addition, 0% of the non-audit services to the GST’s service affiliates listed in Table 2 were approved by GST’s Audit Committee pursuant to the “de minimis” exception of Rule 2-01(c)(7)(i)(C) of Regulation S-X.
Item 4(f) – Not applicable.
Item 4(g) Aggregate Non-Audit Fees Disclosure
The aggregate non-audit fees billed to GST by PwC for the twelve months ended November 30, 2014 and November 30, 2013 were $794,850 and $936,290 respectively. The aggregate non-audit fees billed to GST’s adviser and service affiliates by PwC for non-audit services for the twelve months ended December 31, 2013 and December 31, 2012 were approximately $9.8 million and $10.0 million respectively. With regard to the aggregate non-audit fees billed to GST’s adviser and service affiliates, the 2013 and 2012 amounts include fees for non-audit services required to be pre-approved [see Table 2] and fees for non-audit services that did not require pre-approval since they did not directly relate to GST’s operations or financial reporting.
Item 4(h) — GST’s Audit Committee has considered whether the provision of non-audit services to GST’s investment adviser and service affiliates that did not require pre-approval pursuant to paragraph (c)(7)(ii) of Rule 2-01 of Regulation S-X is compatible with maintaining the auditors’ independence.
| ITEM 5. | AUDIT COMMITTEE OF LISTED REGISTRANTS. |
| ITEM 6. | SCHEDULE OF INVESTMENTS. |
| | Schedule of Investments is included as part of the Report to Stockholders filed under Item 1. |
| ITEM 7. | DISCLOSURE OF PROXY VOTING POLICIES AND PROCEDURES FOR CLOSED-END MANAGEMENT INVESTMENT COMPANIES. |
| ITEM 8. | PORTFOLIO MANAGERS OF CLOSED-END MANAGEMENT INVESTMENT COMPANIES. |
| ITEM 9. | PURCHASES OF EQUITY SECURITIES BY CLOSED-END MANAGEMENT INVESTMENT COMPANY AND AFFILIATED PURCHASERS. |
| ITEM 10. | SUBMISSION OF MATTERS TO A VOTE OF SECURITY HOLDERS. |
| | There have been no material changes to the procedures by which shareholders may recommend nominees to the registrant’s board of trustees. |
| ITEM 11. | CONTROLS AND PROCEDURES. |
| | (a) | The registrant’s principal executive and principal financial officers, or persons performing similar functions have concluded that the registrant’s disclosure controls and procedures (as defined in Rule 30a-3(c) under the Investment Company Act of 1940, as amended (the “1940 Act”)) are effective as of a date within 90 days of the filing of this report that includes the disclosure required by this paragraph, based on the evaluation of these controls and procedures required by Rule 30a-3(b) under the 1940 Act and 15d-15(b) under the Securities Exchange Act of 1934, as amended. |
| | (b) | There were no changes in the registrant’s internal control over financial reporting (as defined in Rule 30a-3(d) under the 1940 Act) that occurred during the registrant’s second fiscal quarter of the period covered by this report that have materially affected, or are reasonably likely to materially affect, the registrant’s internal control over financial reporting. |
| | | | |
| (a)(1) | | Goldman Sachs Trust’s Code of Ethics for Principal Executive and Senior Financial Officers is incorporated by reference to Exhibit 12(a)(1) of the registrant’s Form N-CSR filed on July 8, 2015 for its International Equity Insights Funds. |
| | |
| (a)(2) | | Exhibit 99.CERT | | Certifications pursuant to Section 302 of the Sarbanes-Oxley Act of 2002 filed herewith. |
| | |
| (b) | | Exhibit 99.906CERT | | Certifications pursuant to Section 906 of the Sarbanes-Oxley Act of 2002 filed herewith. |
SIGNATURES
Pursuant to the requirements of the Securities Exchange Act of 1934 and the Investment Company Act of 1940, the registrant has duly caused this report to be signed on its behalf by the undersigned, thereunto duly authorized.
| | |
| | | Goldman Sachs Trust |
| |
| By: | | /s/ James A. McNamara |
| |
| | |
| | James A. McNamara |
| | President/Principal Executive Officer |
| | Goldman Sachs Trust |
| |
| Date: | | August 7, 2015 |
Pursuant to the requirements of the Securities Exchange Act of 1934 and the Investment Company Act of 1940, this report has been signed below by the following persons on behalf of the registrant and in the capacities and on the dates indicated.
| | |
| By: | | /s/ James A. McNamara |
| |
| | |
| | James A. McNamara |
| | President/Principal Executive Officer |
| | Goldman Sachs Trust |
| |
| Date: | | August 7, 2015 |
| |
| By: | | /s/ Scott McHugh |
| |
| | |
| | Scott McHugh |
| | Principal Financial Officer |
| | Goldman Sachs Trust |
| |
| Date: | | August 7, 2015 |