UNITED STATES
SECURITIES AND EXCHANGE COMMISSION
Washington, D.C. 20549
FORM N-CSR
CERTIFIED SHAREHOLDER REPORT OF REGISTERED
MANAGEMENT INVESTMENT COMPANIES
Investment Company Act file number 811-05349
Goldman Sachs Trust
(Exact name of registrant as specified in charter)
71 South Wacker Drive, Chicago, Illinois 60606
(Address of principal executive offices) (Zip code)
| | |
| Caroline Kraus, Esq. | | Copies to: |
| Goldman, Sachs & Co. | | Geoffrey R.T. Kenyon, Esq. |
| 200 West Street | | Dechert LLP |
| New York, New York 10282 | | 100 Oliver Street |
| | 40th Floor |
| | Boston, MA 02110-2605 |
(Name and address of agents for service)
Registrant’s telephone number, including area code: (312) 655-4400
Date of fiscal year end: December 31
Date of reporting period: June 30, 2015
| ITEM 1. | REPORTS TO STOCKHOLDERS. |
| | The Semi-Annual Report to Shareholders is filed herewith. |
Goldman Sachs Funds

| | | | |
| | |
| Semi-Annual Report | | | | June 30, 2015 |
| | |
| | | | Long Short Fund |

Goldman Sachs Long Short Fund
| | | | |
TABLE OF CONTENTS | | | | |
| |
Principal Investment Strategies and Risks | | | 1 | |
| |
Investment Process | | | 2 | |
| |
Portfolio Management Discussion and Performance Summaries | | | 3 | |
| |
Schedule of Investments | | | 12 | |
| |
Financial Statements | | | 16 | |
| |
Financial Highlights | | | 20 | |
| |
Notes to Financial Statements | | | 22 | |
| |
Other Information | | | 34 | |
| | | | |
| | | |
| NOT FDIC-INSURED | | May Lose Value | | No Bank Guarantee |
GOLDMAN SACHS LONG SHORT FUND
Principal Investment Strategies and Risks
This is not a complete list of risks that may affect the Fund. For additional information concerning the risks applicable to the Fund, please see the Fund’s Prospectus.
The Goldman Sachs Long Short Fund invests primarily in the global equity markets, with a focus on securities listed on North American and European exchanges, through the use of long and/or short positions. The Fund may also invest in global fixed income, commodity and currency instruments. The Fund’s equity investments are subject to market risk, which means that the value of the securities in which it invests may go up or down in response to the prospects of individual companies, particular sectors or governments and/or general economic conditions. The securities of mid- and small-capitalization companies involve greater risks than those associated with larger, more established companies and may be subject to more abrupt or erratic price movements. The Fund’s fixed income investments are subject to the risks associated with debt securities generally, including credit, liquidity and interest rate risk. High yield, lower rated investments involve greater price volatility and present greater risks than higher rated fixed income securities. Foreign and emerging markets investments may be more volatile and less liquid than investments in U.S. securities and are subject to the risks of currency fluctuations and adverse economic or political developments. Derivative instruments (including swaps and forward foreign currency transactions) may involve a high degree of financial risk. These risks include the risk that small movements in the price of the underlying security or benchmark may result in a disproportionately large movement, unfavorable or favorable, in the price of the derivative instrument; risk of default by a counterparty; and liquidity risk. The Fund is subject to the risks associated with short selling of securities, which involves leverage of the Fund’s assets and presents various other risks. The Fund may be obligated to cover its short position at a higher price than the short price, resulting in a loss. Losses on short sales are potentially unlimited as a loss occurs when the value of a security sold short increases. The Fund’s borrowing and use of derivatives result in leverage, which can make the Fund more volatile. The Fund’s investments in other investment companies (including exchange-traded funds) subject it to additional expenses. At times, the Fund may be unable to sell certain of its illiquid investments without a substantial drop in price, if at all. Different investment styles tend to shift in and out of favor, and at times the Fund may underperform other funds that invest in similar asset classes. Certain shareholders, including clients or affiliates of the investment adviser, may from time to time own or control a significant percentage of the Fund’s shares. Redemptions by these shareholders of their shares of the Fund may impact the Fund’s liquidity and NAV. The Fund is “non-diversified” and may invest more of its assets in fewer issuers than “diversified” funds. Accordingly, the Fund may be more susceptible to adverse developments affecting any single issuer held in its portfolio and to greater losses resulting from these developments.
The investment program of the Fund is speculative, entails substantial risks and includes alternative investment techniques not employed by traditional mutual funds. The Fund should not be relied upon as a complete investment program. The Fund’s investment techniques (if they do not perform as designed) may increase the volatility of performance and the risk of investment loss, including the loss of the entire amount that is invested, and there can be no assurance that the investment objective of the Fund will be achieved.
1
GOLDMAN SACHS LONG SHORT FUND
What Differentiates Goldman Sachs’ Long Short
Fund Investment Process?
The Fund seeks long-term growth of capital. We pursue potentially attractive risk-adjusted returns through stock selection, market insights, and risk management. Investment ideas are generated from the deep industry knowledge of the GS Investment Strategies (“GSIS”) team and the top-down views of the team’s leadership. Deep fundamental bottom-up research is at the core of every investment in the Fund. Our team-based and opportunistic approach seeks to drive allocations to attractive investment opportunities.

| n | | The Fund pursues high conviction investments in global equity markets, focusing on North America and Europe. Investment ideas are generated through fundamental, bottom-up research, and generally based on secular changes that will positively or negatively impact companies. |
| n | | We seek to identify idiosyncratic investments with asymmetric risk/return profiles and identifiable catalysts. |

| n | | The Fund actively hedges the portfolio’s long positions against security specific and sector risk. We also dynamically adjusts the Fund’s exposure to the broad equity markets, seeking to be less exposed to broader equity market moves. |

| n | | Our investment team has a long history extending back four decades and has managed a global long/short strategy since 2008. The team has a global footprint with offices in New York, London, Hong Kong, Tokyo and Bangalore. |
GS Investment Strategies, LLC, the investment manager of the Funds, is a US-registered investment adviser and is a wholly-owned subsidiary of The Goldman Sachs Group, Inc.
2
PORTFOLIO RESULTS
Goldman Sachs Long Short Fund
Investment Objective And Principal Strategy
The Fund seeks long-term growth of capital.
Portfolio Management Discussion and Analysis
Below, the GS Investment Strategies (“GSIS”) Team (the “Team”) discusses the Goldman Sachs Long Short Fund’s (the “Fund”) performance and positioning for the six-month period ended June 30, 2015 (the “Reporting Period”).
| Q | | How did the Fund perform during the Reporting Period? |
| A | | During the Reporting Period, the Fund’s Class A, Class C, Institutional, Class IR and Class R Shares generated cumulative total returns of 3.74%, 3.45%, 4.03%, 3.93% and 3.74%, respectively. These returns compare to the 0.14% cumulative total return of the Fund’s primary benchmark, the BofA Merrill Lynch U.S. Dollar 3-Month LIBOR Constant Maturity Index (the “Index”) during the same time period. |
| | References to the Fund’s benchmark and to other indices mentioned herein are for informational purposes only, and unless otherwise noted, are not an indication of how the Fund is managed. The use of the Index as the Fund’s benchmark does not imply the Fund is being managed like cash and does not imply low risk or low volatility. |
| Q | | What economic and market factors most influenced the financial markets as a whole during the Reporting Period? |
| A | | The Reporting Period was an uneven ride for investors. Unstable oil prices, quantitative easing in Europe, uncertain economic and political climate in Greece, decelerating economy in China and volatility in the currency markets were just some of the contributing factors to the markets’ choppy returns. Overall, global equity markets generated positive returns, led by the European and Japanese markets. The MSCI World Index, representing global equity markets, posted a modest return of 2.63%, just slightly behind the MSCI Emerging Markets Index, representing emerging equity markets, at 2.95%. European equity markets, as measured by the Stoxx Europe 600 Index, posted an 11.8% return during the Reporting Period, despite uncertainties in Greece, buoyed by quantitative easing by the European Central Bank. Japanese equity markets rallied 15.96%, as measured by the Nikkei 225 Index, for the same period. Chinese equity markets saw an even stronger rally, as evidenced by the 32.23% return of the Shanghai Composite, as China’s slowing economy raised expectations of additional stimulus by its government. The U.S. equity market shed most of its early 2015 gains toward the end of the Reporting Period, with the S&P 500® Index, representing the U.S. equity market, ending almost flat with a six-month return of 1.23%. Indeed, the end of the Reporting Period witnessed a sell-off in virtually all major developed equity markets — the U.S., Europe and Japan — as well as in the emerging markets due primarily to the peaked uncertainty around Greece. Volatility also heightened toward the end of June 2015, reaching its highest levels since February 2015. (All returns are in U.S. dollar terms.) |
| Q | | What key factors were responsible for the Fund’s performance during the Reporting Period? |
| A | | In seeking to achieve its investment objective, the Fund primarily takes long and/or short positions in the global equity markets, with a focus on securities listed on North American and European exchanges. The Fund may also invest in global fixed income, commodity and currency instruments. The Team employs an opportunistic investment approach and pursues asymmetric risk-reward opportunities, which are those that the Team believes have a greater potential for gains than losses. While the Fund will not be limited to any predetermined investment strategies, the Fund will primarily employ long/short equity and event driven investment strategies. |
| | Consistent with the Fund’s mandate of seeking to generate attractive absolute returns through security selection and alpha generation and seeking to hedge market risk and limit |
3
PORTFOLIO RESULTS
| | volatility, the Fund generated positive absolute returns for the Reporting Period overall. |
| | Overall, long positions in equities contributed positively to Fund results. Several of the Fund’s positions had an event-driven component to them. Short positions in equities generally detracted from Fund results, attributable almost exclusively to its short index positions, which are meant to hedge the Fund’s portfolio. Such positions performed as expected in a positive equity market. During the Reporting Period, the Fund made no investments in fixed income and commodity instruments. The Fund used currency instruments to manage foreign currency risk. |
| Q | | Which equity market sectors most significantly affected Fund performance? |
| A | | Contributing most positively to the Fund’s results during the Reporting Period were long positions in the health care, financials and consumer discretionary sectors. Detracting most from the Fund’s performance were hedges, or short index positions, as mentioned earlier, and long positions in the industrials, information technology and materials sectors. |
| Q | | What were some of the Fund’s best-performing individual stocks? |
| A | | The Fund benefited most from long positions in health care products and services provider Fresenius, specialty pharmaceuticals company Valeant Pharmaceuticals International and bank Citizens Financial Group. |
| | Shares of Fresenius rose in January 2015 after the company received a Food and Drug Administration (“FDA”) status upgrade for its Grand Island manufacturing facility. This removed the primary overhang on the stock created by the FDA warning letter received in 2012 for this facility and also allowed new products to be approved there in the future. Also in January 2015, Fresenius received a credit rating upgrade to investment grade from Standard & Poor’s. The company took immediate advantage of its investment grade rating and refinanced its credit facilities to enjoy better financing costs. Further supporting the company’s performance was Fresenius’ Chief Executive Officer’s confirmation in late January 2015 that the company had hit its 2014 targets and planned to raise its dividend for a 22nd consecutive year. Fresenius’ shares rose again in March 2015, the beneficiary of the weakening euro relative to the U.S. dollar. The company also announced an acquisition of a small, 66-bed hospital in Germany focusing on pulmonology. |
| | Valeant Pharmaceuticals International enjoyed a significant advance in its share price in January 2015 after it provided reports of both stronger than anticipated fourth quarter 2014 earnings and 2015 guidance despite significant currency headwinds. Its results were driven by strong organic core revenue growth, better expense management, and debt reduction. The company’s shares continued to gain in February 2015 after its management reported high quality fourth quarter 2014 earnings that surpassed the prior positive preannouncement in January 2015. In addition, Valeant Pharmaceuticals International announced an opportunistic all-cash acquisition of Salix Pharmaceuticals, expected to be accretive to its earnings and adding another platform to the company’s diverse portfolio. |
| | Shares of Citizens Financial Group, a new purchase for the Fund during the Reporting Period, traded up during the month of April 2015. At the end of March 2015, Royal Bank of Scotland Group further sold down its stake in Citizens Financial Group through a secondary placing, representing about a quarter of the total shares outstanding. The Fund participated in this offering as a way to further build our investment. In April 2015, Citizens Financial Group reported strong first quarter 2015 results, characterized by continued loan growth, expense discipline and low credit provisions. The bank’s management demonstrated that its plan to improve the financial returns of the business remains on track. |
| Q | | Which stocks detracted significantly from the Fund’s performance during the Reporting Period? |
| A | | Detracting from the Fund’s results were long positions in several Chinese Internet companies, car and equipment rental center operator Hertz Global Holdings and diversified bank Royal Bank of Scotland Group (“RBS”). |
| | Long positions in Chinese Internet companies YY and Qihoo detracted from the Fund’s returns, as each saw its share price decline significantly during the Reporting Period. Disappointing results from Alibaba and lower margin expectations from Baidu, as well as margin pressures elsewhere in the industry, served to further undermine sentiment in the Chinese Internet space. Accordingly, Qihoo and YY de-rated ahead of their first quarter 2015 earnings reports in March 2015. (A de-rated stock is one wherein a stock’s price/earnings ratio contracts based on broad perceptions of market recognition, anticipated growth rates and other complex factors.) In addition, Qihoo’s |
4
PORTFOLIO RESULTS
| | Chief Financial Officer guided for lower web-game revenue and a sell-side analyst subsequently downgraded its stock, highlighting the company’s lack of competitiveness in mobile. While we believe the web-game business is not material to Qihoo’s long-term earnings prospects and concern about the company’s limited mobile presence is nothing new, the share price reaction underscores how fragile investor sentiment is regarding the Chinese Internet industry. We therefore reduced the Fund’s positions in YY and Qihoo. |
| | After increasing the Fund’s position in Hertz Global Holdings in May 2015, the company’s shares declined on fundamentals related to the planned spin-off of its equipment rental business and other special situations. At the end of the Reporting Period, we looked forward to the resumption later in the summer of 2015 of audited financial filings and the eventual separation of the company’s equipment rental business. |
| | Shares of RBS declined in January 2015 as the market reassessed concerns about lower interest rates and political risk in the U.K. ahead of the May 2015 elections there. The market also appeared concerned that RBS was incurring some incremental interest expense in 2015 related to the planned issuance of Additional Tier 1 (“AT1”) securities later this year. The issuance of AT1 securities has been communicated by its management for some time, and we believe the incremental cost is manageable and factored into earnings projections and our target price. RBS’ shares traded off further in March 2015. The market appeared concerned about the incremental restructuring charges related to a further restructuring of RBS’ corporate and institutional banking segments. Ultimately, we believe this initiative could significantly help RBS’ capital position, and we expect RBS’ medium-term earnings power to remain stable following a successful execution of this plan. Uncertainty surrounding the then-upcoming May 2015 U.K. election also continued to weigh on the markets. Overall, we believe RBS is making substantial progress turning around its core franchises, while reducing balance sheet risk through the disposal of non-core assets. Thus, following the recent price decline, we believe RBS offers a highly attractive risk-reward profile, and so we added to the Fund’s position in its stock. |
| Q | | How did the Fund use derivatives and similar instruments during the Reporting Period? |
| A | | During the Reporting Period, the Fund used total return swaps, currency forwards and equivalents, futures and forward contracts, and options. Total return swaps were used to gain exposure to specific securities. Currency forwards and equivalents were used to gain exposure to specific currencies or to hedge against currency risk. Futures and forward contracts were used primarily for hedging purposes or to gain exposure to specific securities, indices, sectors and geographies. Options were used primarily for hedging purposes either at a strategy level or portfolio level and to gain exposure to specific securities and indices synthetically. |
| Q | | Did the Fund make any significant purchases or sales during the Reporting Period? |
| A | | Having sold the Fund’s position in computers and peripherals giant Apple in 2014, we added the position back into the portfolio during the Reporting Period. Also, based on our U.S. Financials theme, wherein the Fund is seeking exposure to names we believe have fundamentally attractive businesses and that should also benefit from a rising interest rate environment, we initiated Fund positions in Citizens Financial Group, mentioned earlier, and Bank of America. Based on our European Restructuring Financials theme, wherein the Fund is seeking to invest in European banks undergoing restructurings, we established a Fund position in Lloyds Banking Group. |
| | In addition to those sales mentioned earlier, we exited the Fund’s position in American International Group (“AIG”), stepping aside due to the class-action lawsuit against the company still not settled. We also find what we consider to be better risk-reward profiles in other positions within the financials sector. We sold the Fund’s position in media and television broadcasting services provider Comcast during the Reporting Period. |
| Q | | Were there any notable changes in the Fund’s allocations during the Reporting Period? |
| A | | Given the Fund’s launch on September 30, 2014, it was not a matter of making changes but of building the portfolio. That said, due both to active management decisions and stock appreciation or depreciation, the Fund’s exposure to the financials sector increased during the Reporting Period. There were no notable shifts in allocation from a regional perspective. |
| Q | | How was the Fund positioned at the end of the Reporting Period? |
| A | | At the end of June 2015, the Fund had its greatest exposure, based on long market value, to the financials (ex-real estate), health care and consumer discretionary sectors. (Long market value is the current market value of stocks held (i.e. having a long position) in an account, calculated on a daily |
5
PORTFOLIO RESULTS
| | basis.) The Fund had its most modest exposure, based on long market value, to the materials, utilities and consumer staples sectors. |
| | By region, the Fund had its greatest exposure, based on long market value, to the Americas, followed by the EMEA (Europe, Middle East and Africa) region and then Asia as of June 30, 2015. |
| Q | | What is the Fund’s tactical view and strategy for the months ahead? |
| A | | At the end of the Reporting Period, the Fund was positioned exclusively in equity long/short and event-driven strategies. The Fund was operating, at the end of the Reporting Period, with relatively low net exposure and high optionality, which could, we believe, help manage the downside in market sell-offs. (Net exposure is the percentage difference between a fund’s long and short exposure. Net exposure is a measure of the extent to which a fund’s trading book is exposed to market fluctuations. Optionality describes the gamma profile of the portfolio; gamma measures the rate of change of the portfolio’s net exposure (delta) given a change in equity markets.) |
6
PORTFOLIO RESULTS
The primary investment themes being implemented in the Fund at the end of the Reporting Period were:
Health care special situations – health care companies that are actively participating in the ongoing health care industry consolidation, such as Valeant Pharmaceuticals International or Allergan, or where a thesis is based on a company’s transformation or restructuring, such as Shire;
Special situations/opportunistic – potential positions with specific catalysts in the future, such as Lamar Advertising, or select merger arbitrage situations;
Cable companies – we believe this industry can benefit from what we anticipate will be strong secular growth, leading to investments including Liberty Global and Time Warner Cable;
European financials – European banks undergoing restructurings, such as RBS, Lloyds Banking Group and UBS;
Internet companies – fast-growing Internet companies where we have a differentiated view on earnings, such as Facebook;
U.S. financials – we are seeking exposure within the Fund to companies we believe have fundamentally attractive businesses and that should also benefit from a rising interest rate environment, such as Charles Schwab, Wells Fargo, Citizens Financial Group and Bank of America.
7
PORTFOLIO RESULTS
Index Definitions
The MSCI® World Index is a free float-adjusted market capitalization weighted index that is designed to measure the equity market performance of developed markets. The MSCI World Index consists of the following 23 developed market country indexes: Australia, Austria, Belgium, Canada, Denmark, Finland, France, Germany, Hong Kong, Ireland, Israel, Italy, Japan, Netherlands, New Zealand, Norway, Portugal, Singapore, Spain, Sweden, Switzerland, the United Kingdom, and the United States.
The S&P 500® Index is the Standard & Poor’s 500 Composite Index of 500 stocks, an unmanaged index of common stock prices.
The Nikkei 225® Index is a price-weighted equity index, which consists of 225 stocks in the 1st section of the Tokyo Stock Exchange.
The STOXX® Europe 600 Index is derived from the STOXX Europe Total Market Index (TMI) and is a subset of the STOXX Global 1800 Index. With a fixed number of 600 components, the STOXX Europe 600 Index represents large, mid and small capitalization companies across 18 countries of the European region: Austria, Belgium, Czech Republic, Denmark, Finland, France, Germany, Greece, Ireland, Italy, Luxembourg, the Netherlands, Norway, Portugal, Spain, Sweden, Switzerland and the United Kingdom.
The MSCI Emerging Markets Index is a free float-adjusted market capitalization index that is designed to measure equity market performance of emerging markets. As of June 30, 2015, the MSCI Emerging Markets Index consisted of the following 23 emerging market country indices: Brazil, Chile, China, Colombia, Czech Republic, Egypt, Greece, Hungary, India, Indonesia, Korea, Malaysia, Mexico, Peru, Philippines, Poland, Qatar, Russia, South Africa, Taiwan, Thailand, Turkey and United Arab Emirates.
The Shanghai Stock Exchange Composite Index is a capitalization-weighted index. The index tracks the daily price performance of all A-shares and B-shares listed on the Shanghai Stock Exchange.
8
FUND BASICS
Goldman Sachs Long Short Fund
as of June 30, 2015
| | | | | | | | | | |
| | PERFORMANCE REVIEW | |
| | | January 1, 2015–June 30, 2015 | | Fund Total Return
(based on NAV)1 | | | BofA Merrill Lynch US
Dollar Three-Month
Index2 | |
| | Class A | | | 3.74 | % | | | 0.14 | % |
| | Class C | | | 3.45 | | | | 0.14 | |
| | Institutional | | | 4.03 | | | | 0.14 | |
| | Class IR | | | 3.93 | | | | 0.14 | |
| | | Class R | | | 3.74 | | | | 0.14 | |
| | 1 | | The net asset value (“NAV”) represents the net assets of the class of the Fund (ex-dividend) divided by the total number of shares of the class outstanding. The Fund’s performance assumes the reinvestment of dividends and other distributions. The Fund’s performance does not reflect the deduction of any applicable sales charges. |
| | 2 | | The Bank of America Merrill Lynch U.S. Dollar Three-Month LIBOR Constant Maturity Index (the “Index”) tracks the performance of a synthetic asset paying LIBOR to a stated maturity. The Index is based on the assumed purchase at par of a synthetic instrument having exactly its stated maturity and with a coupon equal to that day’s fixing rate. That issue is assumed to be sold the following business day (priced at a yield equal to the current day fixing rate) and rolled into a new instrument. |
| | | | | | | | |
| | STANDARDIZED TOTAL RETURNS3 |
| | | For the period ended 6/30/15 | | Since Inception | | | Inception Date |
| | Class A | | | -0.28 | % | | 9/30/2014 |
| | Class C | | | 4.00 | | | 9/30/2014 |
| | Institutional | | | 5.90 | | | 9/30/2014 |
| | Class IR | | | 5.80 | | | 9/30/2014 |
| | | Class R | | | 5.40 | | | 9/30/2014 |
| | 3 | | The Standardized Total Returns are cumulative total returns as of the most recent calendar quarter-end. They assume reinvestment of all distributions at net asset value. These returns reflect a maximum initial sales charge of 5.5% for Class A Shares and the contingent deferred sales charge for Class C Shares (1% if shares are redeemed within 12 months of purchase). Because Institutional, Class IR and Class R Shares do not involve a sales charge, such a charge is not applied to their Standardized Total Returns. |
The returns set forth in the tables above represent past performance. Past performance does not guarantee future results. The Fund’s investment return and principal value will fluctuate so that an investor’s shares, when redeemed, may be worth more or less than their original cost. Current performance may be lower or higher than the performance quoted above. Please visit our web site at www.GSAMFUNDS.com to obtain the most recent month-end returns. Performance reflects applicable fee waivers and/or expense limitations in effect during the periods shown. In their absence, performance would be reduced. Returns do not reflect the deduction of taxes that a shareholder would pay on Fund distributions or the redemption of Fund shares.
9
FUND BASICS
| | | | | | | | | | |
| | EXPENSE RATIOS4 | | | | | | | | |
| | | | | Expense Ratios (Current) | | | Expense Ratios (Before Waiver) | |
| | Class A | | | 2.58 | % | | | 3.96 | % |
| | Class C | | | 3.33 | | | | 4.71 | |
| | Institutional | | | 2.20 | | | | 3.58 | |
| | Class IR | | | 2.34 | | | | 3.72 | |
| | | Class R | | | 2.85 | | | | 4.23 | |
| | 4 | | The expense ratios of the Fund, both current (net of applicable fee waivers and/or expense limitations) and before waivers (gross of applicable fee waivers and/or expense limitations) are as set forth above according to the most recent publicly available Prospectus for the Fund and may differ from the expense ratios disclosed in the Financial Highlights in this report. Pursuant to a contractual arrangement, the Fund’s waivers and/or expense limitations will remain in place through at least April 30, 2016, and prior to such date the Investment Adviser may not terminate the arrangements without the approval of the Fund’s Board of Trustees. If these arrangements are discontinued in the future, the expense ratios may change without shareholder approval. |
| | | | | | | | |
| | TOP TEN HOLDINGS AS OF 6/30/155 |
| | | Holding | | % of Net Assets | | | Line of Business |
| | Apple, Inc. | | | 6.1 | % | | Computers & Peripherals |
| | Time Warner Cable, Inc. | | | 5.9 | | | Media |
| | Lamar Advertising Co. Class A | | | 5.9 | | | Real Estate Investment Trusts |
| | Liberty Global PLC Series C | | | 4.8 | | | Media |
| | Baker Hughes, Inc. | | | 4.7 | | | Energy Equipment & Services |
| | Fresenius SE & Co. KGaA | | | 4.5 | | | Health Care Providers & Services |
| | Mallinckrodt PLC | | | 4.4 | | | Pharmaceuticals |
| | Allergan PLC | | | 4.3 | | | Pharmaceuticals |
| | Citizens Financial Group, Inc. | | | 4.3 | | | Commercial Banks |
| | | Wells Fargo & Co. | | | 4.2 | | | Commercial Banks |
| | 5 | | The top 10 holdings do not include the Fund’s short positions, if any, as listed in the Schedule of Investments and may not be representative of the Fund’s future investments. |
10
FUND BASICS
|
| FUND COMPOSITION6 |
| As of June 30, 2015 |
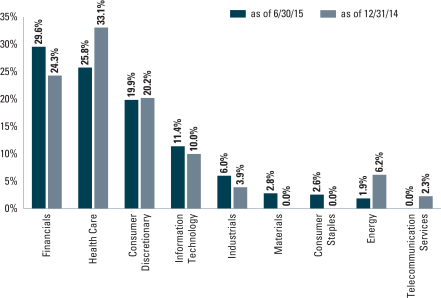
| | 6 | | The Fund is actively managed and, as such, its composition may differ over time. Consequently, the Fund’s overall sector allocations may differ from the percentages contained in the graph above. The graph categorizes investments using the Global Industry Classification Standard (“GICS”), however, the sector classifications used by the portfolio management team may differ from GICS. The percentage shown for each investment category reflects the value of investments in that category as a percentage of the total value of the Fund’s Equity investments. The graph depicts the Fund’s investments but may not represent the Fund’s market exposure due to the exclusion of the Fund’s short positions, if any, as listed in the Schedule of Investments and certain derivatives, if any, as listed in the Additional Investment Information section of the Schedule of Investments. |
11
GOLDMAN SACHS LONG SHORT FUND
Schedule of Investments
June 30, 2015 (Unaudited)
| | | | | | | | |
Shares | | | Description | | Value | |
| | | | | | | | |
| | Common Stocks – 90.3% | |
| | Biotechnology* – 0.4% | |
| | 2,228 | | | Alexion Pharmaceuticals, Inc. | | $ | 402,743 | |
| | |
| | Capital Markets – 8.3% | |
| | 144,726 | | | The Charles Schwab Corp.(a)(b) | | | 4,725,304 | |
| | 220,830 | | | UBS Group AG | | | 4,685,235 | |
| | | | | | | | |
| | | | | | | 9,410,539 | |
| | |
| | Chemicals – 2.4% | |
| | 15,059 | | | Monsanto Co. | | | 1,605,139 | |
| | 2,736 | | | Syngenta AG | | | 1,116,348 | |
| | | | | | | | |
| | | | | | | 2,721,487 | |
| | |
| | Commercial Banks – 10.8% | |
| | 154,496 | | | Bank of America Corp. | | | 2,629,522 | |
| | 175,903 | | | Citizens Financial Group, Inc.(a) | | | 4,803,911 | |
| | 84,241 | | | Wells Fargo & Co.(a)(b) | | | 4,737,714 | |
| | | | | | | | |
| | | | | | | 12,171,147 | |
| | |
| | Computers & Peripherals(a) – 6.1% | |
| | 55,265 | | | Apple, Inc. | | | 6,931,613 | |
| | |
| | Energy Equipment & Services(a) – 4.7% | |
| | 85,714 | | | Baker Hughes, Inc. | | | 5,288,554 | |
| | |
| | Food Products – 2.2% | |
| | 29,182 | | | Kraft Foods Group, Inc. | | | 2,484,555 | |
| | |
| | Health Care Providers & Services – 4.5% | |
| | 80,219 | | | Fresenius SE & Co. KGaA | | | 5,150,570 | |
| | |
| | Internet & Catalog Retail* – 1.2% | |
| | 59,306 | | | Vipshop Holdings Ltd. ADR | | | 1,319,559 | |
| | |
| | Internet Software & Services* – 3.6% | |
| | 15,041 | | | Alibaba Group Holding Ltd. ADR | | | 1,237,423 | |
| | 33,020 | | | Facebook, Inc. Class A(a)(b) | | | 2,831,960 | |
| | | | | | | | |
| | | | | | | 4,069,383 | |
| | |
| | Machinery(a) – 2.8% | |
| | 47,126 | | | Ingersoll-Rand PLC | | | 3,177,235 | |
| | |
| | Media – 15.7% | |
| | 1,576 | | | Altice SA* | | | 217,077 | |
| | 60,342 | | | Discovery Communications, Inc. Class A* | | | 2,006,975 | |
| | 107,016 | | | Liberty Global PLC Series C*(a)(b) | | | 5,418,220 | |
| | 37,929 | | | Time Warner Cable, Inc.(a) | | | 6,757,810 | |
| | 105,185 | | | Twenty-First Century Fox, Inc. Class A(a)(b) | | | 3,423,246 | |
| | | | | | | | |
| | | | | | | 17,823,328 | |
| | |
| | Oil, Gas & Consumable Fuels(b) – 0.6% | |
| | 14,462 | | | Golar LNG Ltd. | | | 676,822 | |
| | |
| | Pharmaceuticals – 17.3% | |
| | 16,171 | | | Allergan PLC*(a) | | | 4,907,252 | |
| | 30,494 | | | Endo International PLC*(b) | | | 2,428,847 | |
| | 41,902 | | | Mallinckrodt PLC*(a)(b) | | | 4,932,703 | |
| | 2,378 | | | Mylan NV* | | | 161,371 | |
| | 4,554 | | | Shire PLC ADR | | | 1,099,746 | |
| | |
| | | | | | | | |
| | Common Stocks – (continued) | |
| | Pharmaceuticals – (continued) | |
| | 32,053 | | | Teva Pharmaceutical Industries Ltd. ADR | | $ | 1,894,332 | |
| | 18,914 | | | Valeant Pharmaceuticals International, Inc.*(a) | | | 4,201,745 | |
| | | | | | | | |
| | | | | | | 19,625,996 | |
| | |
| | Real Estate Investment Trusts(a) – 5.9% | |
| | 116,179 | | | Lamar Advertising Co. Class A | | | 6,677,969 | |
| | |
| | Real Estate Management & Development*(a) – 1.5% | |
| | 36,820 | | | Realogy Holdings Corp. | | | 1,720,230 | |
| | |
| | Road & Rail*(a) – 2.3% | |
| | 144,576 | | | Hertz Global Holdings, Inc. | | | 2,619,717 | |
| | |
| | TOTAL COMMON STOCKS | |
| | (Cost $98,055,944) | | $ | 102,271,447 | |
| | |
| | | | | | | | | | | | | | |
| Contracts | | | Exercise
Rate | | | Expiration
Date | | | Value | |
| | | | | | | | | | | | | | |
| | Options Purchased – 1.3% | |
| | Options on Equities | |
| Citibank NA (London) Call – Facebook, Inc. Strike Price
60.000% |
|
| | 224 | | | | 60.000 | % | | | 01/15/16 | | | $ | 596,400 | |
| Citibank NA (London) Call – Facebook, Inc. Strike Price
80.000% |
|
| | 77 | | | | 80.000 | | | | 01/15/16 | | | | 79,310 | |
| Credit Suisse International (London) Put – S&P 500 Index Strike
Price 2,050.000% |
|
| | 48 | | | | 2,050.000 | | | | 07/10/15 | | | | 101,520 | |
| Deutsche Bank AG Call – Apple, Inc. Strike Price 129.000% | |
| | 74 | | | | 129.000 | | | | 07/31/15 | | | | 17,353 | |
| Deutsche Bank AG Call – Vodafone Group PLC Strike Price
2.500.000% |
|
| | 265 | | | | 2.500 | | | | 09/18/15 | | | | 11,451 | |
| Deutsche Bank AG Put – S&P 500 Index Strike Price 2,040.000% | |
| | 31 | | | | 2,040.000 | | | | 07/10/15 | | | | 55,645 | |
| Merrill Lynch International Put – DAX Index Strike Price
10,800.000% |
|
| | 18 | | | | 10,800.000 | | | | 07/17/15 | | | | 23,067 | |
| Morgan Stanley & Co. International PLC Call – DAX Index
Strike Price 11,600.000% |
|
| | 45 | | | | 11,600.000 | | | | 07/03/15 | | | | 3,512 | |
| Morgan Stanley Capital Services, Inc. Call – Apple, Inc. Strike
Price 127.000% |
|
| | 479 | | | | 127.000 | | | | 07/31/15 | | | | 152,083 | |
| Morgan Stanley Capital Services, Inc. Call – Liberty Global PLC
Strike Price 60.000% |
|
| | 328 | | | | 60.000 | | | | 01/15/16 | | | | 82,000 | |
| Morgan Stanley Capital Services, Inc. Put – S&P 500 Index Strike
Price 2,060.000% |
|
| | 24 | | | | 2,060.000 | | | | 07/02/15 | | | | 25,560 | |
| Morgan Stanley Capital Services, Inc. Put – S&P 500 Index Strike
Price 2,100.000% |
|
| | 64 | | | | 2,100.000 | | | | 07/17/15 | | | | 312,640 | |
| | |
| | |
| 12 | | The accompanying notes are an integral part of these financial statements. |
GOLDMAN SACHS LONG SHORT FUND
| | | | | | | | | | | | | | |
| Contracts | | | Exercise
Rate | | | Expiration
Date | | | Value | |
| | | | | | | | | | | | | | |
| | Options Purchased – (continued) | |
| | Options on Equities – (continued) | |
| UBS AG (London) Call – Liberty Global PLC Strike Price
62.500% |
|
| | 191 | | | | 62.500 | % | | | 01/15/16 | | | $ | 34,380 | |
| UBS AG (London) Call – Vodafone Group PLC Strike Price
2.550.000% |
|
| | 723 | | | | 2.550 | | | | 08/21/15 | | | | 22,720 | |
| | |
| | TOTAL OPTIONS PURCHASED | | | | | |
| | (Cost $1,577,639) | | | $ | 1,517,641 | |
| | |
| | | | | | | | |
| Shares | | | Distribution Rate | | Value | |
| | | | | | | | |
| | Investment Company(c) – 16.6% | |
| Goldman Sachs Financial Square Government Fund –
FST Shares |
|
| | 18,741,015 | | | 0.006% | | $ | 18,741,015 | |
| | (Cost $18,741,015) | | | | |
| | |
| TOTAL INVESTMENTS BEFORE
SHORT POSITIONS – 108.2% | | | | |
| | (Cost $118,374,598) | | $ | 122,530,103 | |
| | |
| | | | | | | | |
| Shares | | | Description | | Value | |
| | | | | | | | |
| | Common Stocks Sold Short – (5.4)% | |
| | Biotechnology* – (0.4)% | |
| | 2,227 | | | Alexion Pharmaceuticals, Inc. | | $ | (402,575 | ) |
| | |
| | Energy Equipment & Services – (3.6)% | |
| | 96,000 | | | Halliburton Co. | | | (4,134,720 | ) |
| | |
| | Regional Banks – (1.4)% | |
| | 16,747 | | | Royal Bank of Canada | | | (1,024,128 | ) |
| | 12,570 | | | The Toronto-Dominion Bank | | | (533,797 | ) |
| | | | | | | | |
| | | | (1,557,925 | ) |
| | |
| | TOTAL COMMON STOCKS SOLD SHORT | | | | |
| | (Cost $6,317,471) | | $ | (6,095,220 | ) |
| | |
| | | | | | | | |
| | Exchange Traded Funds Sold Short – (9.7)% | |
| | 2,666 | | | iShares Nasdaq Biotechnology ETF | | $ | (983,674 | ) |
| | 61,412 | | | iShares Russell 2000 ETF | | | (7,667,902 | ) |
| | 21,911 | | | PowerShares QQQ Trust Series 1 | | | (2,346,011 | ) |
| | |
| TOTAL EXCHANGE TRADED FUNDS
SOLD SHORT | | | | |
| | (Cost $10,898,250) | | $ | (10,997,587 | ) |
| | |
| | TOTAL SECURITIES SOLD SHORT – (15.1)% | |
| | (Cost $(17,215,721)) | | $ | (17,092,807 | ) |
| | |
| OTHER ASSETS IN EXCESS OF
OTHER LIABILITIES – 6.9% | | | 7,773,999 | |
| | |
| | NET ASSETS – 100.0% | | $ | 113,211,295 | |
| | |
| | |
| The percentage shown for each investment category reflects the value of investments in that category as a percentage of net assets. |
* | | Non-income producing security. |
(a) | | All or portion of security is pledged as collateral for short sales. Total market value of securities pledged as collateral on short sales amounts to $24,179,403, which represents approximately 21.4% of net assets as of June 30, 2015. |
(b) | | All or a portion of security pledged as collateral for the line of credit facility. Total market value of security amount pledged as collateral for the line of credit facility amounts to $10,546,889, which represents approximately 9.3% of net assets as of June 30, 2015. |
(c) | | Represents an Affiliated Fund. |
| | |
|
Currency Abbreviations: |
CAD | | —Canadian Dollar |
CHF | | —Swiss Franc |
EUR | | —Euro |
GBP | | —British Pound |
USD | | —U.S. Dollar |
| | |
Investment Abbreviations: |
ADR | | —American Depositary Receipt |
ETF | | —Exchange Traded Fund |
|
| | |
| The accompanying notes are an integral part of these financial statements. | | 13 |
GOLDMAN SACHS LONG SHORT FUND
Schedule of Investments (continued)
June 30, 2015 (Unaudited)
|
| ADDITIONAL INVESTMENT INFORMATION |
FORWARD FOREIGN CURRENCY EXCHANGE CONTRACTS — At June 30, 2015, the Fund had the following forward foreign currency exchange contracts:
FORWARD FOREIGN CURRENCY EXCHANGE CONTRACTS WITH UNREALIZED GAIN
| | | | | | | | | | | | |
| Counterparty | | Contracts to
Buy/Sell | | Settlement
Date | | Current
Value | | | Unrealized
Gain | |
Morgan Stanley & Co. International PLC | | USD/CHF | | 09/16/15 | | $ | 2,282,862 | | | $ | 20,070 | |
| | | USD/EUR | | 09/16/15 | | | 3,900,469 | | | | 37,152 | |
| TOTAL | | | | | | | | | | $ | 57,222 | |
FORWARD FOREIGN CURRENCY EXCHANGE CONTRACTS WITH UNREALIZED LOSS
| | | | | | | | | | | | |
| Counterparty | | Contracts to
Buy/Sell | | Settlement
Date | | Current
Value | | | Unrealized
Loss | |
Morgan Stanley & Co. International PLC | | CAD/USD | | 09/16/15 | | $ | 1,481,587 | | | $ | (21,734 | ) |
| | CHF/USD | | 09/16/15 | | | 1,168,010 | | | | (18,446 | ) |
| | USD/CHF | | 09/16/15 | | | 1,798,675 | | | | (1,115 | ) |
| | USD/EUR | | 09/16/15 | | | 171,874 | | | | (256 | ) |
| | | USD/GBP | | 09/16/15 | | | 456,821 | | | | (6,184 | ) |
| TOTAL | | | | | | | | | | $ | (47,735 | ) |
FUTURES CONTRACTS — At June 30, 2015, the Fund had the following futures contracts:
| | | | | | | | | | | | | | |
| Type | | Number of
Contracts
Long (Short) | | | Expiration
Date | | Current
Value | | | Unrealized
Gain (Loss) | |
DAX Index | | | 9 | | | September 2015 | | $ | 2,759,629 | | | $ | 9,887 | |
S&P 500 E-Mini Index | | | (586 | ) | | September 2015 | | | (60,193,920 | ) | | | 1,346,760 | |
| TOTAL | | | | | | | | | | | | $ | 1,356,647 | |
| | |
| 14 | | The accompanying notes are an integral part of these financial statements. |
GOLDMAN SACHS LONG SHORT FUND
|
| ADDITIONAL INVESTMENT INFORMATION (continued) |
SWAP CONTRACTS — At June 30, 2015, the Fund had the following swap contracts:
OVER THE COUNTER TOTAL RETURN SWAP CONTRACTS
| | | | | | | | | | | | | | | | |
| Counterparty | | Notional
Amount
(000s) | | | Reference
Security | | Termination
Date | | Financing
Fee# | | | Unrealized
Gain (Loss)* | |
Credit Suisse International (London) | | GBP | 112 | | | BG Group PLC | | 04/14/20 | | | 0.300 | % | | $ | (162,679 | ) |
| | | 39 | | | CRH PLC | | 04/20/20 | | | 0.300 | | | | (51,404 | ) |
| | EUR | 24 | | | Ferrovial SA | | 12/22/16 | | | 0.400 | | | | (12,712 | ) |
| | GBP | 3,498 | | | Lloyds Banking Group PLC | | 02/26/20 | | | 0.300 | | | | (83,045 | ) |
| | | 17 | | | Next PLC | | 03/10/20 | | | 0.300 | | | | 26,861 | |
| | | 830 | | | Royal Bank of Scotland Group | | 10/04/19 | | | 0.400 | | | | (109,576 | ) |
| | | 996 | | | Royal Dutch Shell PLC | | 04/14/20 | | | 0.300 | | | | 149,810 | |
| | | 66 | | | Shire PLC | | 10/03/19 | | | 0.300 | | | | 325,738 | |
| | | | 988 | | | Vodafone Group PLC | | 11/22/16 | | | 0.300 | | | | (80,428 | ) |
| TOTAL | | | | | | | | | | | | | | $ | 2,565 | |
| | # | | The Fund receives annual coupon payments in accordance with the swap contract(s). On the termination date of the swap contract(s), the Fund will either receive from or pay to the counterparty an amount equal to the net of the accrued financing fees and the value of the reference security subtracted from the original notional cost (notional multiplied by the price change of the reference security, converted to U.S. Dollars). |
| | * | | There are no upfront payments on the swap contract(s), therefore the unrealized gain (loss) on the swap contracts is equal to their market value. |
WRITTEN OPTIONS CONTRACTS — At June 30, 2015, the Fund had the following written options:
OPTIONS ON EQUITY CONTRACTS
| | | | | | | | | | | | | | | | | | |
| Counterparty | | Description | | Contracts | | | Expiration
Date | | | Strike
Price | | | Value | |
Deutsche Bank AG | | Call - Apple, Inc. | | | 148 | | | | 07/31/15 | | | | 134 | % | | $ | (14,578 | ) |
| | Call - Vodafone Group PLC | | | 530 | | | | 09/18/15 | | | | 2 | | | | (20,819 | ) |
Morgan Stanley & Co. International PLC | | Call - Vodafone Group PLC | | | 1,446 | | | | 08/21/15 | | | | 3 | | | | (34,081 | ) |
| | Call - Dax Index | | | 90 | | | | 07/03/15 | | | | 11,800 | | | | (2,458 | ) |
Morgan Stanley Capital Services, Inc. | | Call - Apple, Inc. | | | 958 | | | | 07/31/15 | | | | 133 | | | | (114,481 | ) |
| TOTAL (Premium Received $400,579) | | | | | 3,172 | | | | | | | | | | | $ | (186,417 | ) |
For the period ended June 30, 2015, the Fund had the following written options activity:
OPTIONS ON EQUITIES
| | | | | | | | |
| | | Contracts | | | Premiums
Received | |
Contracts Outstanding December 31, 2014 | | | 740 | | | $ | 159,987 | |
Contracts Written | | | 8,311 | | | | 1,669,327 | |
Contracts Bought to Close | | | (2,553 | ) | | | (663,818 | ) |
Contracts Expired | | | (3,149 | ) | | | (740,675 | ) |
Contracts Assigned | | | (177 | ) | | | (24,242 | ) |
Contracts Outstanding June 30, 2015 | | | 3,172 | | | $ | 400,579 | |
| | |
| The accompanying notes are an integral part of these financial statements. | | 15 |
GOLDMAN SACHS LONG SHORT FUND
Statement of Assets and Liabilities
June 30, 2015 (Unaudited)
| | | | | | |
| | | | | | |
| | Assets: | | | | |
| | Investments of unaffiliated issuers, at value (cost $99,633,583) | | $ | 103,789,088 | |
| | Investments of affiliated issuers, at value (cost $18,741,015) | | | 18,741,015 | |
| | Cash | | | 2,060,486 | |
| | Foreign currencies, at value (cost $778,241) | | | 777,880 | |
| | Unrealized gain on swap contracts | | | 502,409 | |
| | Unrealized gain on forward foreign currency exchange contracts | | | 57,222 | |
| | Variation margin on certain derivative contracts | | | 3,033,480 | |
| | Receivables: | | | | |
| | Collateral on certain derivative contracts(a) | | | 3,696,693 | |
| | Investments sold | | | 2,695,978 | |
| | Fund shares sold | | | 2,238,775 | |
| | Deferred offering costs | | | 109,986 | |
| | Dividends and interest | | | 36,886 | |
| | Foreign tax reclaims | | | 3,489 | |
| | Due from broker — upfront payment | | | 3,420 | |
| | Total assets | | | 137,746,807 | |
| | | | | | |
| | Liabilities: | | | | |
| | Investments sold short, at value (proceeds received $17,215,721) | | | 17,092,807 | |
| | Unrealized loss on swap contracts | | | 499,844 | |
| | Unrealized loss on forward foreign currency exchange contracts | | | 47,735 | |
| | Written option contracts, at value (premium received $400,579) | | | 186,417 | |
| | Payables: | | | | |
| | Investments purchased | | | 6,396,994 | |
| | Management fees | | | 144,534 | |
| | Amounts owed to affiliates | | | 30,489 | |
| | Fund shares redeemed | | | 12,561 | |
| | Distribution and service fees and transfer agent fees | | | 8,372 | |
| | Interest | | | 5,569 | |
| | Accrued expenses | | | 110,190 | |
| | Total liabilities | | | 24,535,512 | |
| | | | | | |
| | Net Assets: | | | | |
| | Paid-in capital | | | 109,948,119 | |
| | Net investment loss | | | (528,675 | ) |
| | Accumulated net realized loss | | | (2,070,426 | ) |
| | Net unrealized gain | | | 5,862,277 | |
| | | NET ASSETS | | $ | 113,211,295 | |
| | | Net Assets: | | | | |
| | | Class A | | $ | 9,373,352 | |
| | | Class C | | | 2,055,608 | |
| | | Institutional | | | 93,916,115 | |
| | | Class IR | | | 7,839,881 | |
| | | Class R | | | 26,339 | |
| | | Total Net Assets | | $ | 113,211,295 | |
| | | Shares Outstanding $0.001 par value (unlimited shares authorized): | | | | |
| | | Class A | | | 888,169 | |
| | | Class C | | | 195,860 | |
| | | Institutional | | | 8,870,432 | |
| | | Class IR | | | 741,145 | |
| | | Class R | | | 2,500 | |
| | | Net asset value, offering and redemption price per share:(b) | | | | |
| | | Class A | | | $10.55 | |
| | | Class C | | | 10.50 | |
| | | Institutional | | | 10.59 | |
| | | Class IR | | | 10.58 | |
| | | Class R | | | 10.54 | |
| | (a) | | Includes amounts segregated for initial margin requirements and/or collateral on forward foreign currency transactions, swap contracts, and options of $80,000, $870,000 and $2,746,693, respectively. |
| | (b) | | Maximum public offering price per share for Class A Shares of the Fund is $11.16. At redemption, Class C shares may be subject to a contingent deferred sales charge, assessed on the amount equal to the lesser of the current net asset value (“NAV”) or the original purchase price of the shares. |
| | |
| 16 | | The accompanying notes are an integral part of these financial statements. |
GOLDMAN SACHS LONG SHORT FUND
Statement of Operations
For the Six Months Ended June 30, 2015 (Unaudited)
| | | | | | |
| | | | | | |
| | Investment income: | | | | |
| | Dividends — (net of foreign withholding taxes of $6,601) | | $ | 462,316 | |
| | Dividends — affiliated fund | | | 458 | |
| | Total investment income | | | 462,774 | |
| | | | | | |
| | Expenses: | | | | |
| | Management fees | | | 635,436 | |
| | Amortization of offering costs | | | 216,389 | |
| | Dividend Expense on Short Positions | | | 92,065 | |
| | Brokerage Fees | | | 71,770 | |
| | Professional fees | | | 59,419 | |
| | Custody, accounting and administrative services | | | 44,950 | |
| | Transfer Agent fees(a) | | | 20,714 | |
| | Trustee fees | | | 17,487 | |
| | Printing and mailing costs | | | 16,114 | |
| | Registration fees | | | 16,034 | |
| | Interest expense | | | 10,001 | |
| | Distribution and Service fees(a) | | | 6,884 | |
| | Other | | | 1,381 | |
| | Total expenses | | | 1,208,644 | |
| | Less — expense reductions | | | (337,369 | ) |
| | Net expenses | | | 871,275 | |
| | NET INVESTMENT LOSS | | | (408,501 | ) |
| | | | | | |
| | Realized and unrealized gain (loss): | | | | |
| | Net realized gain (loss) from: | | | | |
| | Investments — unaffiliated issuers | | | (313,210 | ) |
| | Investments sold short | | | (506,202 | ) |
| | Futures contracts | | | (2,513,602 | ) |
| | Written options | | | 1,050,647 | |
| | Swap contracts | | | 234,953 | |
| | Forward foreign currency exchange contracts | | | 425,653 | |
| | Foreign currency transactions | | | 8,208 | |
| | Net change in unrealized gain (loss) on: | | | | |
| | Investments — unaffiliated issuers | | | 2,760,752 | |
| | Investments sold short | | | 135,212 | |
| | Futures contracts | | | 1,750,133 | |
| | Written options | | | 173,500 | |
| | Swap contracts | | | (338,612 | ) |
| | Forward foreign currency exchange contracts | | | (143,249 | ) |
| | Foreign currency translation | | | 1,175 | |
| | Net realized and unrealized gain | | | 2,725,358 | |
| | NET INCREASE IN NET ASSETS RESULTING FROM OPERATIONS | | $ | 2,316,857 | |
| | (a) | | Class specific Distribution and Service and Transfer Agent fees were as follows: |
| | | | | | | | | | | | | | | | | | | | | | | | | | | | | | |
| Distribution and Service Fees | | | Transfer Agent Fees | |
Class A | | | Class C | | | Class R | | | Class A | | | Class C | | | Institutional | | | Class IR | | | Class R | |
| $ | 3,934 | | | $ | 2,885 | | | $ | 65 | | | $ | 2,990 | | | $ | 548 | | | $ | 14,598 | | | $ | 2,553 | | | $ | 25 | |
| | |
| The accompanying notes are an integral part of these financial statements. | | 17 |
GOLDMAN SACHS LONG SHORT FUND
Statement of Changes in Net Assets
| | | | | | | | | | |
| | | | | For the
Six Months Ended
June 30, 2015
(Unaudited) | | | For the
Period Ended
December 31, 2014(a) | |
| | From operations: | | | | | | | | |
| | Net investment loss | | $ | (408,501 | ) | | $ | (190,585 | ) |
| | Net realized loss | | | (1,613,553 | ) | | | (414,589 | ) |
| | Net change in unrealized gain | | | 4,338,911 | | | | 1,523,366 | |
| | Net increase in net assets resulting from operations | | | 2,316,857 | | | | 918,192 | |
| | | | | | | | | | |
| | From share transactions: | | | | | | | | |
| | Proceeds from sales of shares | | | 81,609,301 | | | | 52,122,816 | |
| | Cost of shares redeemed | | | (23,755,660 | ) | | | (211 | ) |
| | Net increase in net assets resulting from share transactions | | | 57,853,641 | | | | 52,122,605 | |
| | TOTAL INCREASE | | | 60,170,498 | | | | 53,040,797 | |
| | | | | | | | | | |
| | Net assets: | | | | | | | | |
| | Beginning of period | | | 53,040,797 | | | | — | |
| | End of period | | $ | 113,211,295 | | | $ | 53,040,797 | |
| | Net investment loss | | $ | (528,675 | ) | | $ | (120,174 | ) |
| | (a) | | Fund commenced operations on September 30, 2014. |
| | |
| 18 | | The accompanying notes are an integral part of these financial statements. |
GOLDMAN SACHS LONG SHORT FUND
Statement of Cash Flows
For the Six Months Ended June 30, 2015 (Unaudited)
| | | | | | |
| | Increase/(Decrease) in cash – Cash flows used in operating activities: | | | | |
| | Net increase (decrease) in net assets from operations | | $ | 2,316,857 | |
| | Adjustments to reconcile net increase in net assets from operations to net cash received from/(used in) operating activities: | | | | |
| | Payments for purchases of investments in securities | | | (162,810,665 | ) |
| | Proceeds from sales of investment securities | | | 115,208,687 | |
| | Payments for closing purchases of securities sold short | | | (21,865,119 | ) |
| | Proceeds from sales of securities sold short | | | 30,678,842 | |
| | Purchases of short-term investments securities, net | | | (5,993,495 | ) |
| | Net realized (gain) loss on investments in securities and securities sold short | | | 819,412 | |
| | Net realized loss from derivatives | | | (1,285,600 | ) |
| | Net change in unrealized gain on investment securities and securities sold short | | | (2,895,964 | ) |
| | Net change in unrealized (gain) loss on derivatives | | | (173,500 | ) |
| | Payment for options purchased | | | (6,961,657 | ) |
| | Payment for options repurchased | | | (350,919 | ) |
| | Proceeds from options sold | | | 3,919,748 | |
| | Proceeds from options written | | | 1,669,325 | |
| | Proceeds from swaps, net | | | (1,292,734 | ) |
| | Increase in variation margin on certain derivative contracts | | | (461,085 | ) |
| | Increase in collateral on certain derivative contracts | | | (2,490,918 | ) |
| | Increase in unrealized gain on swap contracts | | | (161,232 | ) |
| | Decrease in deferred offering costs | | | 216,389 | |
| | Decrease in reimbursement from investment adviser | | | 235,854 | |
| | Decrease in unrealized gain on forward foreign currency exchange contracts | | | 127,240 | |
| | Increase in dividends receivable | | | (30,258 | ) |
| | Increase in receivables for investments sold | | | (320,284 | ) |
| | Increase in due to broker-upfront payment | | | (3,420 | ) |
| | Increase in foreign tax reclaims | | | (3,489 | ) |
| | Decrease in payable for investments purchased | | | (2,040,317 | ) |
| | Decrease in payable for amounts owed to affiliates | | | (24,801 | ) |
| | Decrease in payable for offering costs | | | (12,000 | ) |
| | Increase in unrealized loss on swaps contracts | | | 499,844 | |
| | Increase in unrealized loss on forward foreign currency contracts | | | 16,009 | |
| | Decrease in accrued expenses | | | (71,761 | ) |
| | Net cash used in operating activities | | | (53,541,011 | ) |
| | | | | | |
| | Cash flows from financing activities: | | | | |
| | Increase in fund shares redeemed | | | (178,006 | ) |
| | Increase in fund shares sold | | | (2,182,075 | ) |
| | Proceed from sales of shares | | | 81,609,301 | |
| | Cost of shares redeemed | | | (23,755,660 | ) |
| | Net cash received from financing activities | | | 55,493,560 | |
| | NET INCREASE IN CASH | | $ | 1,952,549 | |
| | | | | | |
| | Cash: | | | | |
| | Beginning of period | | | 885,817 | |
| | End of period | | $ | 2,838,366 | |
| | |
| The accompanying notes are an integral part of these financial statements. | | 19 |
GOLDMAN SACHS LONG SHORT FUND
Financial Highlights
Selected Data for a Share Outstanding Throughout Each Period
| | | | | | | | | | | | | | | | | | |
| | | | | | | | From
investment operations | |
| | | Year - Share Class | | Net asset
value,
beginning
of period | | | Net
investment
loss(a) | | | Net realized
and unrealized
gain | | | Total from
investment
operations | |
| | FOR THE SIX MONTHS ENDED JUNE 30, (UNAUDITED) | | | | | | | | | | | | | | | | |
| | 2015 - A | | $ | 10.17 | | | $ | (0.07 | ) | | $ | 0.45 | | | $ | 0.38 | |
| | 2015 - C | | | 10.15 | | | | (0.11 | ) | | | 0.46 | | | | 0.35 | |
| | 2015 - Institutional | | | 10.18 | | | | (0.05 | ) | | | 0.46 | | | | 0.41 | |
| | 2015 - IR | | | 10.18 | | | | (0.05 | ) | | | 0.45 | | | | 0.40 | |
| | 2015 - R | | | 10.16 | | | | (0.09 | ) | | | 0.47 | | | | 0.38 | |
| | | | | | | | | | | | | | | | | | |
| | FOR THE PERIOD ENDED DECEMBER 31, | | | | | | | | | | | | | | | | |
| | 2014 - A (Commenced September 30, 2014) | | | 10.00 | | | | (0.06 | ) | | | 0.23 | | | | 0.17 | |
| | 2014 - C (Commenced September 30, 2014) | | | 10.00 | | | | (0.07 | ) | | | 0.22 | | | | 0.15 | |
| | 2014 - Institutional (Commenced September 30, 2014) | | | 10.00 | | | | (0.04 | ) | | | 0.22 | | | | 0.18 | |
| | 2014 - IR (Commenced September 30, 2014) | | | 10.00 | | | | (0.05 | ) | | | 0.23 | | | | 0.18 | |
| | 2014 - R (Commenced September 30, 2014) | | | 10.00 | | | | (0.05 | ) | | | 0.21 | | | | 0.16 | |
| | (a) | | Calculated based on the average shares outstanding methodology. |
| | (b) | | Assumes investment at the NAV at the beginning of the period, reinvestment of all dividends and distributions, a complete redemption of the investment at the NAV at the end of the period and no sales or redemption charges. Total returns would be reduced if a sales or redemption charge was taken into account. Returns do not reflect the deduction of taxes that a shareholder would pay on Fund distributions or the redemption of Fund shares. Total returns for periods less than one full year are not annualized. |
| | (d) | | The Fund’s portfolio turnover rate is calculated in accordance with regulatory requirements, without regard to transactions involving short term investments and certain derivatives. If such transactions were included, the Fund’s portfolio turnover rate may be higher. |
| | |
| 20 | | The accompanying notes are an integral part of these financial statements. |
GOLDMAN SACHS LONG SHORT FUND
| | | | | | | | | | | | | | | | | | | | | | | | | | | | | | | | | | | | | | | | | | | | | | | | | | | | |
| | | | | | | | | | | | | | | | | | | | | | | | | | | | | | | | | | | | | | | | | | | | |
| | | Net asset
value, end
of period | | | | | Total
return(b) | | | | | Net assets,
end of
period
(in 000s) | | | | | Ratio of
net expenses
to average
net assets
(including
dividend
expenses for
securities
sold short)(c) | | | | | Ratio of
net expenses
to average
net assets
(excluding
dividend
expenses for
securities
sold short)(c) | | | | | Ratio of
total expenses
to average
net assets
(including
dividend
expenses for
securities
sold short)(c) | | | | | Ratio of
total expenses
to average
net assets
(excluding
dividend
expenses for
securities
sold short)(c) | | | | | Ratio of
net investment
loss
to average
net assets(c) | | | | | Portfolio
turnover
rate(d) | |
| | | | | | | | | | | | | | | | | | | | | | | | | | | | | | | | | | | | | | | | | | | | | | | | | | | | |
| | $ | 10.55 | | | | | | 3.74 | % | | | | $ | 9,373 | | | | | | 2.58 | % | | | | | 2.30 | % | | | | | 2.80 | % | | | | | 2.52 | % | | | | | (1.27 | )% | | | | | 159 | % |
| | | 10.50 | | | | | | 3.45 | | | | | | 2,056 | | | | | | 3.36 | | | | | | 3.07 | | | | | | 3.48 | | | | | | 3.19 | | | | | | (2.06 | ) | | | | | 159 | |
| | | 10.59 | | | | | | 4.03 | | | | | | 93,916 | | | | | | 2.16 | | | | | | 1.91 | | | | | | 2.77 | | | | | | 2.51 | | | | | | (1.01 | ) | | | | | 159 | |
| | | 10.58 | | | | | | 3.93 | | | | | | 7,840 | | | | | | 2.33 | | | | | | 2.05 | | | | | | 2.57 | | | | | | 2.30 | | | | | | (1.00 | ) | | | | | 159 | |
| | | 10.54 | | | | | | 3.74 | | | | | | 26 | | | | | | 2.80 | | | | | | 2.56 | | | | | | 3.51 | | | | | | 3.27 | | | | | | (1.73 | ) | | | | | 159 | |
| | | | | | | | | | | | | | | | | | | | | | | | | | | | | | | | | | | | | | | | | | | | | | | | | | | | |
| | | | | | | | | | | | | | | | | | | | | | | | | | | | | | | | | | | | | | | | | | | | | | | | | | | | |
| | | 10.17 | | | | | | 1.70 | | | | | | 543 | | | | | | 3.43 | | | | | | 2.80 | | | | | | 5.58 | | | | | | 4.95 | | | | | | (2.40 | ) | | | | | 118 | |
| | | 10.15 | | | | | | 1.50 | | | | | | 62 | | | | | | 3.79 | | | | | | 3.32 | | | | | | 5.64 | | | | | | 5.17 | | | | | | (2.87 | ) | | | | | 118 | |
| | | 10.18 | | | | | | 1.80 | | | | | | 52,328 | | | | | | 2.18 | | | | | | 1.94 | | | | | | 3.74 | | | | | | 3.51 | | | | | | (1.47 | ) | | | | | 118 | |
| | | 10.18 | | | | | | 1.80 | | | | | | 82 | | | | | | 2.71 | | | | | | 2.28 | | | | | | 4.50 | | | | | | 4.08 | | | | | | (1.77 | ) | | | | | 118 | |
| | | 10.16 | | | | | | 1.60 | | | | | | 25 | | | | | | 2.82 | | | | | | 2.59 | | | | | | 4.38 | | | | | | 4.15 | | | | | | (2.11 | ) | | | | | 118 | |
| | |
| The accompanying notes are an integral part of these financial statements. | | 21 |
GOLDMAN SACHS LONG SHORT FUND
Notes to Financial Statements
June 30, 2015 (Unaudited)
Goldman Sachs Trust (the “Trust”) is a Delaware statutory trust registered under the Investment Company Act of 1940, as amended (the “Act”), as an open-end management investment company. The Trust includes the Goldman Sachs Long Short Fund (the “Fund”). The Fund is a non- diversified portfolio and currently offers five classes of shares: Class A, Class C, Institutional, Class IR and Class R Shares.
Class A Shares are sold with a front-end sales charge of up to 5.50%. Class C Shares are sold with a contingent deferred sales charge (“CDSC”) of 1.00%, which is imposed on redemptions made within 12 months of purchase. Institutional, Class IR and Class R are not subject to a sales charge.
GS Investment Strategies, LLC (“GSIS”), an affiliate of Goldman, Sachs & Co. (“Goldman Sachs”), serves as investment adviser to the Fund pursuant to a management agreement (the “Agreement”) with the Trust.
|
| 2. SIGNIFICANT ACCOUNTING POLICIES |
The financial statements have been prepared in accordance with accounting principles generally accepted in the United States of America (“GAAP”) and require management to make estimates and assumptions that may affect the reported amounts and disclosures. Actual results may differ from those estimates and assumptions.
A. Investment Valuation — The Fund’s valuation policy is to value investments at fair value.
B. Investment Income and Investments — Investment income includes interest income and dividend income, net of any foreign withholding taxes, less any amounts reclaimable. Interest income is accrued daily and adjusted for amortization of premiums and accretion of discounts. Dividend income is recognized on ex-dividend date or, for certain foreign securities, as soon as such information is obtained subsequent to the ex-dividend date. Investment transactions are reflected on trade date. Realized gains and losses are calculated using identified cost. Investment transactions are recorded on the following business day for daily net asset value (“NAV”) calculations. Any foreign capital gains tax is accrued daily based upon net unrealized gains, and is payable upon sale of such investments.
For derivative contracts, realized gains and losses are recorded upon settlement of the contract. Upfront payments are made or received upon entering into a swap agreement and are reflected in the Statement of Assets and Liabilities. Upfront payments are recognized over the contract’s term/event as realized gains or losses, with the exception of forward starting interest rate swaps whose realized gains or losses are recognized from the effective start date. For securities with paydown provisions, principal payments received are treated as a proportionate reduction to the cost basis of the securities, and excess or shortfall amounts are recorded as income. For treasury inflation protected securities (“TIPS”), adjustments to principal due to inflation/deflation are reflected as increases/decreases to interest income with a corresponding adjustment to cost.
C. Class Allocations and Expenses — Investment income, realized and unrealized gain (loss), and non-class specific expenses of the Fund are allocated daily based upon the proportion of net assets of each class. Class specific expenses, where applicable, are borne by the respective share classes and include Distribution and Service, Transfer Agency and Service and Shareholder Administration fees. Non-class specific expenses directly incurred by the Fund are charged to the Fund, while such expenses incurred by the Trust are allocated across the Fund on a straight-line and/or pro-rata basis depending upon the nature of the expenses.
D. Federal Taxes and Distributions to Shareholders — It is the Fund’s policy to comply with the requirements of the Internal Revenue Code of 1986, as amended (the “Code”), applicable to regulated investment companies (mutual funds) and to distribute each year substantially all of its investment company taxable income and capital gains to its shareholders. Accordingly, the Fund is not required to make any provisions for the payment of federal income tax. Distributions to shareholders are recorded on the ex-dividend date. Distributions from net investment income and net capital gains, if any, are declared and paid annually.
Net capital losses are carried forward to future fiscal years and may be used to the extent allowed by the Code to offset any future capital gains. Losses that are carried forward will retain their character as either short-term or long-term capital losses. Utilization of capital loss carryforwards will reduce the requirement of future capital gains distributions.
22
GOLDMAN SACHS LONG SHORT FUND
|
| 2. SIGNIFICANT ACCOUNTING POLICIES (continued) |
The characterization of distributions to shareholders for financial reporting purposes is determined in accordance with federal income tax rules, which may differ from GAAP. The source of the Fund’s distributions may be shown in the accompanying financial statements as either from net investment income, net realized gain or capital. Certain components of the Fund’s net assets on the Statement of Assets and Liabilities reflect permanent GAAP/tax differences based on the appropriate tax character.
E. Foreign Currency Translation — The accounting records and reporting currency of the Fund is maintained in U.S. dollars. Assets and liabilities denominated in foreign currencies are translated into U.S. dollars using the current exchange rates at the close of each business day. The effect of changes in foreign currency exchange rates on investments is included within net realized and unrealized gain (loss) on investments. Changes in the value of other assets and liabilities as a result of fluctuations in foreign exchange rates are included in the Statement of Operations within net change in unrealized gain (loss) on foreign currency transactions. Transactions denominated in foreign currencies are translated into U.S. dollars on the date the transaction occurred, the effects of which are included within net realized gain (loss) on foreign currency transactions.
F. Offering Costs — Offering costs paid in connection with the offering of shares of the Fund are being amortized on a straight-line basis over 12 months from the date of commencement of operations.
G. In-Kind Transactions — The Fund may allow investors, under certain circumstances, to purchase shares with securities instead of cash. In addition, the Trust reserves the right to redeem an investor’s shares by distributing securities instead of cash. These are known as in-kind transactions. Securities included as part of in-kind purchases and redemptions of Fund shares are valued in the same manner as they are valued for purposes of computing a Fund’s NAV, in accordance with the Fund’s Valuation Procedures, and such valuations are as of the date the trade is submitted pursuant to the procedures specified in the Fund’s prospectus.
|
| 3. INVESTMENTS AND FAIR VALUE MEASUREMENTS |
The fair value of a financial instrument is the amount that would be received to sell an asset or paid to transfer a liability in an orderly transaction between market participants at the measurement date (i.e., the exit price). GAAP establishes a fair value hierarchy that prioritizes the inputs to valuation techniques used to measure fair value. The hierarchy gives the highest priority to unadjusted quoted prices in active markets for identical assets or liabilities (Level 1 measurements) and the lowest priority to unobservable inputs (Level 3 measurements). The levels used for classifying investments are not necessarily an indication of the risk associated with investing in these investments. The three levels of the fair value hierarchy are described below:
Level 1 — Unadjusted quoted prices in active markets that are accessible at the measurement date for identical, unrestricted assets or liabilities;
Level 2 — Quoted prices in markets that are not active or financial instruments for which significant inputs are observable (including, but not limited to, quoted prices for similar investments, interest rates, foreign exchange rates, volatility and credit spreads), either directly or indirectly;
Level 3 — Prices or valuations that require significant unobservable inputs (including GSIS’ assumptions in determining fair value measurement).
The Board of Trustees (“Trustees”) have adopted Valuation Procedures that govern the valuation of the portfolio investments held by the Fund, including investments for which market quotations are not readily available. The Trustees have delegated to GSIS day-to-day responsibility for implementing and maintaining internal controls and procedures related to the valuation of the Fund’s portfolio investments. To assess the continuing appropriateness of pricing sources and methodologies, GSIS regularly performs price verification procedures and issues challenges as necessary to third party pricing vendors or brokers, and any differences are reviewed in accordance with the Valuation Procedures.
23
GOLDMAN SACHS LONG SHORT FUND
Notes to Financial Statements (continued)
June 30, 2015 (Unaudited)
|
| 3. INVESTMENTS AND FAIR VALUE MEASUREMENTS (continued) |
A. Level 1 and Level 2 Fair Value Investments — The valuation techniques and significant inputs used in determining the fair values for investments classified as Level 1 and Level 2 are as follows:
Equity Securities — Equity securities and investment companies traded on a United States (“U.S.”) securities exchange or the NASDAQ system, or those located on certain foreign exchanges, including but not limited to the Americas, are valued daily at their last sale price or official closing price on the principal exchange or system on which they are traded. If there is no sale or official closing price or it is believed by the investment adviser to not represent fair value, equity securities and exchange traded investment companies are valued at the last bid price for long positions and at the last ask price for short positions. Investments in investment companies (other than those that are exchange traded) are valued at the NAV on the valuation date. To the extent these investments are actively traded, they are classified as Level 1 of the fair value hierarchy, otherwise they are generally classified as Level 2.
Unlisted equity securities for which market quotations are available are valued at the last sale price on the valuation date, or if no sale occurs, at the last bid price. Securities traded on certain foreign securities exchanges are valued daily at fair value determined by an independent fair value service (if available) under Valuation Procedures approved by the Trustees and consistent with applicable regulatory guidance. The independent fair value service takes into account multiple factors including, but not limited to, movements in the securities markets, certain depositary receipts, futures contracts and foreign currency exchange rates that have occurred subsequent to the close of the foreign securities exchange. These investments are generally classified as Level 2 of the fair value hierarchy.
Money Market Funds — Investments in the Goldman Sachs Financial Square Government Fund (“Underlying Fund”) are valued at the NAV of the FST Share class on the day of valuation. These investments are generally classified as Level 1 of the fair value hierarchy.
The Underlying Fund may invest in debt securities which are valued daily on the basis of quotations supplied by dealers, if market quotations are readily available, or an independent pricing service approved by the Trustees. The pricing services may use valuation models or matrix pricing, which consider: (i) yield or price with respect to bonds that are considered comparable in characteristics such as rating, interest rate and maturity date or (ii) quotations from securities dealers to determine current value.
Debt Securities — Debt securities for which market quotations are readily available are valued daily on the basis of quotations supplied by dealers or an independent pricing service approved by the Trustees. The pricing services may use valuation models or matrix pricing, which consider: (i) yield or price with respect to bonds that are considered comparable in characteristics such as rating, interest rate and maturity date or (ii) quotations from securities dealers to determine current value. Short-term debt obligations that mature in sixty days or less and that do not exhibit signs of credit deterioration are valued at amortized cost, which approximates fair value. With the exception of treasury securities of G8 countries (not held in money market funds), which are generally classified as Level 1, these investments are generally classified as Level 2 of the fair value hierarchy.
Derivative Contracts — A derivative is an instrument whose value is derived from underlying assets, indices, reference rates or a combination of these factors. The Fund enters into derivative transactions to hedge against changes in interest rates, securities prices, and/or currency exchange rates, to increase total return, or to gain access to certain markets or attain exposure to other underliers.
Exchange-traded derivatives, including futures contracts, are valued at the last sale or settlement price and typically fall within Level 1 of the fair value hierarchy. Over-the-counter (“OTC”) and centrally cleared derivatives are valued using market transactions and other market evidence, including market-based inputs to models, calibration to market-clearing transactions, broker or dealer quotations, or other alternative pricing sources. Where models are used, the selection of a particular model to value OTC and centrally cleared derivatives depends upon the contractual terms of, and specific risks inherent in, the instrument, as well as the availability of pricing information in the market. Valuation models require a variety of inputs, including contractual terms, market prices, yield curves, credit curves, measures of volatility, voluntary and involuntary prepayment rates, loss severity rates and correlations of such inputs. For OTC and centrally cleared derivatives that trade in liquid markets, model inputs can generally be verified and model selection does not involve significant management judgment. OTC and centrally cleared derivatives are classified within Level 2 of the fair value hierarchy when significant inputs are corroborated by market evidence.
24
GOLDMAN SACHS LONG SHORT FUND
|
| 3. INVESTMENTS AND FAIR VALUE MEASUREMENTS (continued) |
i. Forward Contracts — A forward contract is a contract between two parties to buy or sell an asset at a specified price on a future date. A forward contract settlement can occur on a cash or delivery basis. Forward contracts are marked-to-market daily using independent vendor prices, and the change in value, if any, is recorded as an unrealized gain or loss.
A forward foreign currency contract is a forward contract in which a Fund agrees to receive or deliver a fixed quantity of one currency for another, at a pre-determined price at a future date. All forward foreign currency exchange contracts are marked-to-market daily at the applicable forward rate. Non-deliverable forward foreign currency exchange contracts are settled with the counterparty in cash without the delivery of foreign currency.
ii. Futures Contracts — Futures contracts are contracts to buy or sell a standardized quantity of a specified commodity or security and are valued based on exchanged settlement prices or independent market quotes. Futures contracts are valued at the last settlement price, or in the absence of a sale, the last bid price for long positions and at the last ask price for short positions, at the end of each day on the board of trade or exchange upon which they are traded. Upon entering into a futures contract, a Fund deposits cash or securities in an account on behalf of the broker in an amount sufficient to meet the initial margin requirement. Subsequent payments are made or received by a Fund equal to the daily change in the contract value and are recorded as variation margin receivable or payable with a corresponding offset to unrealized gains or losses.
iii. Options — When a Fund writes call or put options, an amount equal to the premium received is recorded as a liability and is subsequently marked-to-market to reflect the current value of the option written. Swaptions are options on interest rate swap contracts.
Upon the purchase of a call option or a put option by a Fund, the premium paid is recorded as an investment and subsequently marked-to-market to reflect the current value of the option. Certain options may be purchased with premiums to be determined on a future date. The premiums for these options are based upon implied volatility parameters at specified terms.
iv. Swap Contracts — Bilateral swap contracts are agreements in which the Fund and a counterparty agree to exchange periodic payments on a specified notional amount or make a net payment upon termination. Bilateral swap transactions are privately negotiated in the OTC market and payments are settled through direct payments between the Fund and the counterparty. By contrast, certain swap transactions are subject to mandatory central clearing. These swaps are executed through a derivatives clearing member (“DCM”), acting in an agency capacity, and submitted to a central counterparty (“CCP”) (“centrally cleared swaps”), in which case all payments are settled with the CCP through the DCM. Swaps are marked-to-market daily using pricing vendor quotations, counterparty or clearinghouse prices or model prices, and the change in value, if any, is recorded as an unrealized gain or loss. Upon entering into a swap contract, the Fund is required to satisfy an initial margin requirement by delivering cash or securities to the counterparty (or in some cases, segregated in a triparty account on behalf of the counterparty), which can be adjusted by any mark-to-market gains or losses pursuant to bilateral or centrally cleared arrangements. For centrally cleared swaps the daily change in valuation, if any, is recorded as a receivable or payable for variation margin.
A total return swap is an agreement that gives the Fund the right to receive the appreciation in the value of a specified security, index or other instrument in return for a fee paid to the counterparty, which will typically be an agreed upon interest rate. If the underlying asset declines in value over the term of the swap, the Fund may also be required to pay the dollar value of that decline to the counterparty.
Securities Sold Short — Securities sold short are those securities which the Fund has sold but which it does not own. When the Fund sells a security it does not own, it must borrow the position that was sold and deliver it to the broker through which it made the short sale. In addition, cash and certain investments in securities may be used to collateralize the securities sold short. Each day the securities sold short transaction is open, the liability to replace the borrowed security is marked to market and an unrealized gain or loss is recorded. While the transaction remains open, the Fund may also incur expenses for any dividends or interest which will be paid to the lender of the securities as well as a fee to borrow the delivered security. During the term of the short sale, the value of the securities pledged as collateral on short sales is required to exceed the value of the securities sold short. The market value of securities pledged as collateral is included in the Schedule of Investments.
25
GOLDMAN SACHS LONG SHORT FUND
Notes to Financial Statements (continued)
June 30, 2015 (Unaudited)
|
| 3. INVESTMENTS AND FAIR VALUE MEASUREMENTS (continued) |
B. Level 3 Fair Value Investments — To the extent that significant inputs to valuation models and other alternative pricing sources are unobservable, or if quotations are not readily available, or if GSIS believes that such quotations do not accurately reflect fair value, the fair value of the Fund’s investments may be determined under Valuation Procedures approved by the Trustees. GSIS, consistent with its procedures and applicable regulatory guidance, may make an adjustment to the most recent valuation prices of either domestic or foreign securities in light of significant events to reflect what it believes to be the fair value of the securities at the time of determining a Fund’s NAV. Significant events which could affect a large number of securities in a particular market may include, but are not limited to: significant fluctuations in U.S. or foreign markets; market dislocations; market disruptions; or unscheduled market closings. Significant events which could also affect a single issuer may include, but are not limited to: corporate actions such as reorganizations, mergers and buy-outs; ratings downgrades; and bankruptcies.
C. Fair Value Hierarchy — The following is a summary of the Fund’s investments and derivatives classified in the fair value hierarchy as of June 30, 2015:
| | | | | | | | | | | | |
| | | |
| Investment Type | | Level 1 | | | Level 2 | | | Level 3 | |
| Assets(a) | | | | | | | | | | | | |
Common Stock and/or Other Equity Investments | | | | | | | | | | | | |
Asia | | $ | 4,451,314 | | | $ | — | | | $ | — | |
Europe | | | 9,163,890 | | | | 10,952,153 | | | | — | |
North America | | | 77,704,090 | | | | — | | | | — | |
Investment Company | | | 18,741,015 | | | | — | | | | — | |
| Total | | $ | 110,060,309 | | | $ | 10,952,153 | | | $ | — | |
| Liabilities(a) | | | | | | | | | | | | |
Common Stock and Exchange Traded Funds Sold Short | | | | | | | | | | | | |
North America | | $ | (17,092,807 | ) | | $ | — | | | $ | — | |
| | | |
| Derivative Type | | | | | | | | | |
| Assets | | | | | | | | | | | | |
Options Purchased | | $ | 1,517,641 | | | $ | — | | | $ | — | |
Forward Foreign Currency Exchange Contracts(b) | | | — | | | | 57,222 | | | | — | |
Futures Contracts(b) | | | 1,356,647 | | | | — | | | | — | |
Total Return Swap Contracts(b) | | | — | | | | 502,409 | | | | — | |
| Total | | $ | 2,874,288 | | | $ | 559,631 | | | $ | — | |
| Liabilities | | | | | | | | | | | | |
Forward Foreign Currency Exchange Contracts(b) | | $ | — | | | $ | (47,735 | ) | | $ | — | |
Total Return Swap Contracts(b) | | | — | | | | (499,844 | ) | | | — | |
Written Options Contracts | | | (186,417 | ) | | | — | | | | — | |
| Total | | $ | (186,417 | ) | | $ | (547,579 | ) | | $ | — | |
| (a) | | Amounts are disclosed by continent to highlight the impact of time zone differences between local market close and the calculation of net asset value. Security valuations are based on the principle exchange or system on which they are traded, which may differ from country of domicile. |
| (b) | | Amount shown represents unrealized gain (loss) at period end. |
26
GOLDMAN SACHS LONG SHORT FUND
|
| 4. INVESTMENTS IN DERIVATIVES |
The following table sets forth, by certain risk types, the gross value of derivative contracts as of June 30, 2015. These instruments were used to meet the Fund’s investment objectives and to obtain and/or manage exposure related to the risks below. The values in the table below exclude the effects of cash collateral received or posted pursuant to these derivative contracts, and therefore are not representative of the Fund’s net exposure.
| | | | | | | | | | | | |
| Risk | | Statement of Assets
and Liabilities | | Assets | | | Statement of Assets
and Liabilities | | Liabilities | |
Equity | | Receivable for unrealized gain on swap contracts; Variation margin on certain derivative contracts; Investments, at value | | $ | 3,376,697 | (a) | | Payable for unrealized loss on swap contracts; Written options, at value | | $ | (686,261) | |
Currency | | Receivable for unrealized gain on forward foreign currency exchange contracts | | | 57,222 | | | Payable for unrealized loss on forward foreign currency exchange contracts | | | (47,735) | |
| Total | | | | $ | 3,433,919 | | | | | $ | (733,996) | |
| (a) | | Includes unrealized gain (loss) on futures contracts described in the Additional Investment Information sections of the Schedule of Investments. Only current day’s variation margin is reported within the Statement of Assets and Liabilities. |
The following table sets forth, by certain risk types, the Fund’s gains (losses) related to these derivatives and their indicative volumes For the six months ended June 30, 2015. These gains (losses) should be considered in the context that these derivative contracts may have been executed to create investment opportunities and/or economically hedge certain investments, and accordingly, certain gains (losses) on such derivative contracts may offset certain (losses) gains attributable to investments. These gains (losses) are included in “Net realized gain (loss)” or “Net change in unrealized gain (loss)” on the Statement of Operations:
| | | | | | | | | | | | | | |
| Risk | | Statement of Operations | | Net
Realized
Gain (Loss) | | | Net Change in
Unrealized
Gain (Loss) | | | Average
Number of
Contracts(a) | |
| Equity | | Net realized gain (loss) from investments, futures contracts, swap contracts and written options/Net change in unrealized gain (loss) on investments, futures contracts, swap contracts and written options | | $ | (3,416,175 | ) | | $ | 2,182,983 | | | | 472 | |
| Currency | | Net realized gain (loss) from forward foreign currency exchange contracts/Net change in unrealized gain (loss) on forward foreign currency exchange contracts | | | 425,653 | | | | (143,249 | ) | | | 34 | |
| Total | | | | $ | (2,990,522 | ) | | $ | 2,039,734 | | | | 506 | |
| (a) | | Average number of contracts is based on the average of month end balances for the period ended June 30, 2015. |
In order to better define its contractual rights and to secure rights that will help the Fund mitigate its counterparty risk, the Fund may enter into an International Swaps and Derivatives Association, Inc. Master Agreement (“ISDA Master Agreement”) or similar agreement with its derivatives’ counterparties. An ISDA Master Agreement is a bilateral agreement between the Fund and a counterparty that governs OTC derivatives, including foreign exchange contracts, and typically contains, among other things, collateral posting terms and netting provisions in the event of a default and/or termination event. The provisions of the ISDA Master Agreement typically permit a single net payment in the event of a default (close-out netting) or similar event, including the bankruptcy or insolvency of the counterparty.
Collateral and margin requirements differ between exchange traded derivatives and OTC derivatives. Margin requirements are established by the broker or clearing house for exchange-traded and centrally cleared derivatives (financial futures contracts, options and centrally cleared swaps) pursuant to governing agreements for those instrument types. Brokers can ask for margin in excess of the minimum in certain circumstances. Collateral terms are contract-specific for OTC derivatives (foreign currency exchange contracts, and certain options and swaps). For derivatives traded under an ISDA Master Agreement, the collateral requirements are typically calculated by netting the marked to market amount for each transaction under such agreement and comparing that amount to the value of any collateral currently pledged by the Fund and the counterparty. Additionally, the Fund
27
GOLDMAN SACHS LONG SHORT FUND
Notes to Financial Statements (continued)
June 30, 2015 (Unaudited)
|
| 4. INVESTMENTS IN DERIVATIVES (continued) |
may be required to post initial margin to the counterparty, the terms of which would be outlined in the confirmation of the OTC transaction.
For financial reporting purposes, cash collateral that has been pledged to cover obligations of the Fund and cash collateral received from the counterparty, if any, is reported separately on the Statement of Assets and Liabilities as receivables/payables for collateral on certain derivative contracts. Non-cash collateral pledged by the Fund, if any, is noted in the Schedule of Investments. Generally, the amount of collateral due from or to a counterparty must exceed a minimum transfer amount threshold before a transfer is required to be made. To the extent amounts due to the Fund from its counterparties are not fully collateralized, contractually or otherwise, the Fund bears the risk of loss from counterparty nonperformance. The Fund attempts to mitigate counterparty risk by only entering into agreements with counterparties that it believes to be of good standing and by monitoring the financial stability of those counterparties.
Additionally, the netting of assets and liabilities and the offsetting of collateral pledged or received are based on contractual netting/set-off provisions in the ISDA Master Agreement or similar agreements. However, in the event of a default or insolvency of a counterparty, a court could determine that such rights are not enforceable due the restrictions or prohibitions against the right of setoff that may be imposed due to a particular jurisdiction’s bankruptcy or insolvency laws.
The following table sets forth the Fund’s net exposure for derivative instruments that are subject to enforceable master netting arrangements or similar agreements as of June 30, 2015:
| | | | | | | | | | | | | | | | | | | | | | | | | | | | | | | | | | | | | | | | | | | | |
| | | Derivative Assets(1) | | | Derivative Liabilities(1) | | | | | | | | | | |
| Counterparty | | Options
Purchased | | | Swaps | | | Forward
Currency
Contracts | | | Total | | | Swaps | | | Forward
Currency
Contracts | | | Options
Written | | | Total | | | Net Derivative
Asset
(Liabilities) | | | Collateral
(Received)
Pledged(1) | | | Net
Amount(2) | |
Citibank NA (London) | | $ | 675,710 | | | $ | — | | | $ | — | | | $ | 675,710 | | | $ | — | | | $ | — | | | $ | — | | | $ | — | | | $ | 675,710 | | | $ | — | | | $ | 675,710 | |
Credit Suisse International (London) | | | 101,520 | | | | 502,409 | | | | — | | | | 603,929 | | | | (499,844 | ) | | | — | | | | — | | | | (499,844 | ) | | | 104,085 | | | | — | | | | 104,085 | |
Deutsche Bank AG | | | 84,449 | | | | — | | | | — | | | | 84,449 | | | | — | | | | — | | | | (35,397 | ) | | | (35,397 | ) | | | 49,052 | | | | — | | | | 49,052 | |
Merrill Lynch International | | | 23,067 | | | | — | | | | — | | | | 23,067 | | | | — | | | | — | | | | — | | | | — | | | | 23,067 | | | | — | | | | 23,067 | |
Morgan Stanley & Co. International PLC | | | 3,512 | | | | — | | | | 57,222 | | | | 60,734 | | | | — | | | | (47,735 | ) | | | (36,539 | ) | | | (84,274 | ) | | | (23,540 | ) | | | 23,540 | | | | — | |
Morgan Stanley Capital Services, Inc. | | | 572,283 | | | | — | | | | — | | | | 572,283 | | | | — | | | | — | | | | (114,481 | ) | | | (114,481 | ) | | | 457,802 | | | | — | | | | 457,802 | |
UBS AG (London) | | | 57,100 | | | | — | | | | — | | | | 57,100 | | | | — | | | | — | | | | — | | | | — | | | | 57,100 | | | | — | | | | 57,100 | |
Total | | $ | 1,517,641 | | | $ | 502,409 | | | $ | 57,222 | | | $ | 2,077,272 | | | $ | (499,844 | ) | | $ | (47,735 | ) | | $ | (186,417 | ) | | $ | (733,996 | ) | | $ | 1,343,276 | | | $ | 23,540 | | | $ | 1,366,816 | |
| (1) | | Gross amounts available for offset but not netted in the Statement of Assets and Liabilities. |
| (2) | | Net amount represents the net amount due (to) from counterparty in the event of a default based on the contractual set-off rights under the agreement. Net amount excludes any over-collateralized amounts. |
|
| 5. AGREEMENTS AND AFFILIATED TRANSACTIONS |
A. Management Agreement — Under the Agreement, GSIS manages the Fund, subject to the general supervision of the Trustees.
As compensation for the services rendered pursuant to the Agreement, the assumption of the expenses related thereto and administration of the Fund’s business affairs, including providing facilities, GSIS is entitled to a management fee, accrued daily and paid monthly, equal to an annual percentage rate of the Fund’s average daily net assets.
28
GOLDMAN SACHS LONG SHORT FUND
|
| 5. AGREEMENTS AND AFFILIATED TRANSACTIONS (continued) |
For the six months ended June 30, 2015, the contractual and effective net management fee with GSIS were at the following rates:
| | | | | | | | | | | | | | | | | | | | | | |
| Contractual Management Rate | | | | | | | |
First
$2 billion | | | Next
$3 billion | | | Next
$3 billion | | | Over
$8 billion | | | Effective
Management
Rate | | | Effective Net
Management
Rate*^ | |
| | 1.60% | | | | 1.44% | | | | 1.37% | | | | 1.34% | | | | 1.60% | | | | 1.57% | |
| * | | GSIS has agreed to waive a portion of its management fee payable by the Fund in an amount equal to any management fee it earns as an investment adviser to any of the affiliated funds in which the Fund invests through at least April 30, 2016. Prior to such date GSIS may not terminate the arrangement without the approval of the Trustees. |
| ^ | | Effective Net Management Rate includes the impact of management fee waivers of affiliated underlying funds, if any. |
The Fund invests in the FST Shares of Goldman Sachs Financial Square Government Fund, which is an affiliated Underlying Fund. GSIS has agreed to waive a portion of its management fee payable by the Fund in an amount equal to the management fee it earns as an investment adviser to any of the affiliated Underlying Funds in which the Fund invests. For the six months ended June 30, 2015, GSIS waived $10,938 of the Fund’s management fees.
B. Distribution and Service Plans — The Trust, on behalf of the Fund, has adopted Distribution and Service Plans (the “Plans”). Under the Plans, Goldman Sachs, which serves as distributor (the “Distributor”), is entitled to a fee accrued daily and paid monthly, for distribution services and personal and account maintenance services, which may then be paid by Goldman Sachs to authorized dealers, at the following annual rates calculated on the Fund’s average daily net assets of each respective share class:
| | | | | | | | | | | | |
| | | Distribution and Service Plan Rates | |
| | | Class A* | | | Class C | | | Class R* | |
Distribution Plan | | | 0.25 | % | | | 0.75 | % | | | 0.50 | % |
Service Plan | | | — | | | | 0.25 | | | | — | |
| * | | With respect to Class A and Class R Shares, the Distributor, at its discretion may use compensation for distribution services paid under the Distribution Plan to compensate service organizations for personal and account maintenance services and expenses as long as such total compensation does not exceed the maximum cap on “service fees” imposed by the Financial Industry Regulatory Authority. |
C. Distribution Agreement — Goldman Sachs, as Distributor of the shares of the Fund pursuant to a Distribution Agreement, may retain a portion of the Class A front end sales charge and Class C Shares’ CDSC. During the six months ended June 30, 2015, Goldman Sachs advised that it retained $2,990 of Class A shares and did not retain any portion of Class C shares.
D. Transfer Agency Agreement — Goldman Sachs also serves as the transfer agent of the Fund for a fee pursuant to the Transfer Agency Agreement. The fees charged for such transfer agency services are accrued daily and paid monthly at annual rates as follows: 0.19% of the average daily net assets of Class A, Class C, Class IR and Class R Shares; and 0.04% of the average daily net assets of Institutional Shares.
E. Other Expense Agreements and Affiliated Transactions — GSIS has agreed to limit certain “Other Expenses” of the Fund (excluding acquired fund fees and expenses, transfer agency fees and expenses, service fees and shareholder administration fees (as applicable), taxes, dividend and interest payments on securities sold short, interest, brokerage fees, shareholder meetings, litigation, indemnification and extraordinary expenses) to the extent such expenses exceed, on an annual basis, a percentage rate of the average daily net assets of the Fund. Such Other Expense reimbursements, if any, are accrued daily and paid monthly. In addition, the Fund is not obligated to reimburse GSIS for prior fiscal year expense reimbursements, if any. The Other Expense limitations as an annual percentage rate of average daily net assets for the Fund are 0.114%. These Other Expense limitations will remain in place through at least April 30, 2016, and prior to such date GSIS may not terminate the arrangements without the approval of the Trustees. In addition, the Fund has entered into certain offset arrangements with the custodian and the transfer
29
GOLDMAN SACHS LONG SHORT FUND
Notes to Financial Statements (continued)
June 30, 2015 (Unaudited)
|
| 5. AGREEMENTS AND AFFILIATED TRANSACTIONS (continued) |
agent, which may result in a reduction of the Fund’s expenses and are received irrespective of the application of the “Other Expense” limitations described above.
For the six months ended June 30, 2015, these expense reductions, including any fee waivers and Other Expense reimbursements, were as follows:
| | | | | | | | | | |
Management
Fee Waiver | | | Other Expense
Reimbursements | | | Total Expense
Reductions | |
| $ | 10,938 | | | $ | 326,431 | | | $ | 337,369 | |
F. Line of Credit Facility — On October 3, 2014, the Fund entered into a committed revolving line of credit facility with a major financial institution. Pursuant to the terms of the facility, the Fund may borrow an aggregate amount of up to $10,000,000. The interest rate on borrowings is based on market rates. The facility also requires a fee to be paid by the Fund based on the amount of the commitment that has not been utilized. For the six months ended June 30, 2015, the Fund did not have any borrowings under the facility.
G. Other Transactions with Affiliates — The table below shows the transactions in and earnings from investments in these affiliated Underlying Funds for the six months ended June 30, 2015:
| | | | | | | | | | | | | | | | | | | | |
| Underlying Fund | | Market Value 12/31/14 | | | Purchases at Costs | | | Proceeds from Sales | | | Market Value 6/30/15 | | | Dividend Income | |
Goldman Sachs Financial Square Government Fund — FST Shares | | $ | 11,154,562 | | | $ | 116,693,749 | | | $ | (109,107,296 | ) | | $ | 18,741,015 | | | $ | 458 | |
As of June 30, 2015, the Goldman Sachs Group (“GSG”), Inc. was the beneficial owner of approximately 35% and 100% of Institutional Class and Class R Shares, respectively of the Fund.
|
| 6. PORTFOLIO SECURITIES TRANSACTIONS |
The cost of purchases and proceeds from sales and maturities of long-term securities for the six months ended June 30, 2015, were $162,810,665 and $115,208,687, respectively.
As of the Fund’s most recent fiscal year end, December 31, 2014, the Fund had timing differences (Qualified Late Year Loss Deferral) of $(269,865).
As of June 30, 2015, the Fund’s aggregate security unrealized gains and losses based on cost for U.S. federal income tax purposes were as follows:
| | | | |
Tax Cost | | $ | 119,457,143 | |
Gross unrealized gain | | | 5,420,154 | |
Gross unrealized loss | | | (2,347,194 | ) |
Net unrealized gain | | $ | 3,072,960 | |
The difference between GAAP-basis and tax-basis unrealized gains (losses) is attributable primarily to wash sales, net mark to market gains (losses) on regulated futures and options contracts, net mark to market on foreign currency contracts and differences in the tax treatment of swap transactions and underlying fund investments.
30
GOLDMAN SACHS LONG SHORT FUND
|
| 7. TAX INFORMATION (continued) |
GSIS has reviewed the Fund’s tax positions for all open tax years (the current year, as applicable) and has concluded that no provision for income tax is required in the Fund’s financial statements. Such open tax years remain subject to examination and adjustment by tax authorities.
The Fund’s risks include, but are not limited to, the following:
Foreign Custody Risk — A Fund that invests in foreign securities may hold such securities and foreign currency with foreign banks, agents, and securities depositories appointed by the Fund’s custodian (each a “Foreign Custodian”). Some foreign custodians may be recently organized or new to the foreign custody business. In some countries, Foreign Custodians may be subject to little or no regulatory oversight or independent evaluation of their operations. Further, the laws of certain countries may place limitations on a Fund’s ability to recover its assets if a Foreign Custodian enters bankruptcy.
Investments in Other Investment Companies — As a shareholder of another investment company, including an exchange traded fund (“ETF”), a Fund will directly bear its proportionate share of any net management fees and other expenses paid by such other investment companies, in addition to the fees and expenses regularly borne by the Fund. ETFs are subject to risks that do not apply to conventional mutual funds, including but not limited to the following: (i) the market price of the ETF’s shares may trade at a premium or a discount to their NAV; and (ii) an active trading market for an ETF’s shares may not develop or be maintained.
Large Shareholder Transactions Risk — The Fund may experience adverse effects when certain large shareholders, such as other funds, participating insurance companies, accounts and Goldman Sachs affiliates, purchase or redeem large amounts of shares of the Fund. Such large shareholder redemptions may cause the Fund to sell portfolio securities at times when it would not otherwise do so, which may negatively impact the Fund’s NAV and liquidity. Similarly, large Fund share purchases may adversely affect the Fund’s performance to the extent that the Fund is delayed in investing new cash and is required to maintain a larger cash position than it ordinarily would. These transactions may also increase transaction costs. In addition, a large redemption could result in the Fund’s current expenses being allocated over a smaller asset base, leading to an increase in the Fund’s expense ratio.
Liquidity Risk — The Fund may make investments that are illiquid or that may become less liquid in response to market developments or adverse investor perceptions. Illiquid investments may be more difficult to value. Liquidity risk may also refer to the risk that a Fund will not be able to pay redemption proceeds within the allowable time period because of unusual market conditions, an unusually high volume of redemption requests, or other reasons. To meet redemption requests, a Fund may be forced to sell investments at an unfavorable time and/or under unfavorable conditions. Liquidity risk may be the result of, among other things, the reduced number and capacity of traditional market participants to make a market in fixed income securities or the lack of an active market. The potential for liquidity risk may be magnified by a rising interest rate environment or other circumstances where investor redemptions from fixed income mutual funds may be higher than normal, potentially causing increased supply in the market due to selling activity.
Market and Credit Risks — In the normal course of business, the Fund trades financial instruments and enters into financial transactions where risk of potential loss exists due to changes in the market (market risk). Additionally, the Fund may also be exposed to credit risk in the event that an issuer or guarantor fails to perform or that an institution or entity with which the Fund has unsettled or open transactions defaults. An investment in the Fund represents an indirect investment in the securities owned by the Fund, a significant portion of which are traded on a national securities exchange. The value of these securities, like other investments, may move up or down, sometimes rapidly and unpredictably. The Fund will utilize leverage, which magnifies the market risk. Additionally, the Fund may also be exposed to credit risk in the event that an issuer fails to perform or that an institution or entity with which the Fund has unsettled or open transactions defaults.
31
GOLDMAN SACHS LONG SHORT FUND
Notes to Financial Statements (continued)
June 30, 2015 (Unaudited)
|
| 8. OTHER RISKS (continued) |
Investing in foreign markets may involve special risks and considerations not typically associated with investing in the U.S. Foreign securities may be subject to risk of loss because of more or less foreign government regulation, less public information and less economic, political and social stability in the countries in which the Fund invests. Loss may also result from the imposition of exchange controls, confiscations and other government restrictions by the United States or other governments, or from problems in registration, settlement or custody. Foreign risk also involves the risk of negative foreign currency rate fluctuations, which may cause the value of securities denominated in such foreign currency (or other instruments through which the Fund has exposure to foreign currencies) to decline in value. Currency exchange rates may fluctuate significantly over short periods of time. To the extent that the Fund also invests in securities of issuers located in emerging markets, these risks may be more pronounced.
Non-Diversification Risk — The Fund is non-diversified, meaning that it is permitted to invest a larger percentage of its assets in fewer issuers than diversified mutual funds. Thus, the Fund may be more susceptible to adverse developments affecting any single issuer held in its portfolio, and may be more susceptible to greater losses because of these developments.
Portfolio Concentration Risk — As a result of the Fund’s ability to invest a large percentage of its assets in obligations of issuers within the same country, state, region, currency or economic sector, an adverse economic, business or political development may affect the value of the Fund’s investments more than if its investments were not so concentrated.
Short Position Risk — The Fund may enter into a short position through a futures contract, an option or swap agreement or through short sales of any instrument that the Fund may purchase for investment. Taking short positions involves leverage of the Fund’s assets and presents various risks. If the value of the underlying instrument or market in which the Fund has taken a short position increases, then the Fund will incur a loss equal to the increase in value from the time that the short position was entered into plus any related dividend payments or other fees. Taking short positions involves the risk that losses may be disproportionate, may exceed the amount invested, and may be unlimited.
Under the Trust’s organizational documents, its Trustees, officers, employees and agents are indemnified, to the extent permitted by the Act and state law, against certain liabilities that may arise out of performance of their duties to the Fund. Additionally, in the course of business, the Fund enters into contracts that contain a variety of indemnification clauses. The Fund’s maximum exposure under these arrangements is unknown, as this would involve future claims that may be made against the Fund that have not yet occurred. However, GSIS believes the risk of loss under these arrangements to be remote.
Subsequent events after the Statement of Assets and Liabilities date have been evaluated through the date the financial statements were issued. GSIS has concluded that there is no impact requiring adjustment or disclosure in the financial statements.
32
GOLDMAN SACHS LONG SHORT FUND
|
| 11. SUMMARY OF SHARE TRANSACTIONS |
Share activity is as follows:
| | | | | | | | | | | | | | | | |
| | | For the Six Months Ended
June 30, 2015
(Unaudited) | | | For the Period Ended
December 31, 2014(a) | |
| | | Shares | | | Dollars | | | Shares | | | Dollars | |
| | | | |
| Class A Shares | | | | | | | | | | | | | | | | |
Shares sold | | | 875,567 | | | $ | 9,247,150 | | | | 53,422 | | | $ | 539,145 | |
Shares redeemed | | | (40,819 | ) | | | (432,296 | ) | | | (1 | ) | | | (15 | ) |
| | | | 834,748 | | | | 8,814,854 | | | | 53,421 | | | | 539,130 | |
| Class C Shares | | | | | | | | | | | | | | | | |
Shares sold | | | 190,242 | | | | 2,007,191 | | | | 6,104 | | | | 61,131 | |
Shares redeemed | | | (485 | ) | | | (5,136 | ) | | | (1 | ) | | | (10 | ) |
| | | | 189,757 | | | | 2,002,055 | | | | 6,103 | | | | 61,121 | |
| Institutional Shares | | | | | | | | | | | | | | | | |
Shares sold | | | 5,873,520 | | | | 62,213,864 | | | | 5,140,792 | | | | 51,416,520 | |
Shares redeemed | | | (2,143,864 | ) | | | (22,941,534 | ) | | | (16 | ) | | | (166 | ) |
| | | | 3,729,656 | | | | 39,272,330 | | | | 5,140,776 | | | | 51,416,354 | |
| Class IR Shares | | | | | | | | | | | | | | | | |
Shares sold | | | 768,515 | | | | 8,141,096 | | | | 8,058 | | | | 81,010 | |
Shares redeemed | | | (35,427 | ) | | | (376,694 | ) | | | (1 | ) | | | (10 | ) |
| | | | 733,088 | | | | 7,764,402 | �� | | | 8,057 | | | | 81,000 | |
| Class R Shares | | | | | | | | | | | | | | | | |
Shares sold | | | — | | | | — | | | | 2,501 | | | | 25,010 | |
Shares redeemed | | | — | | | | — | | | | (1 | ) | | | (10 | ) |
| | | | — | | | | — | | | | 2,500 | | | | 25,000 | |
NET INCREASE | | | 5,487,249 | | | $ | 57,853,641 | | | | 5,210,857 | | | $ | 52,122,605 | |
| (a) | | Fund commenced operations on September 30, 2014. |
33
GOLDMAN SACHS LONG SHORT FUND
| | |
Fund Expenses — Six Month Period Ended June 30, 2015 (Unaudited) | | |
As a shareholder of Class A, Class C, Institutional, Class IR or Class R Shares of a Fund, you incur two types of costs: (1) transaction costs, including sales charges on purchase payments (with respect to Class A Shares), contingent deferred sales charges on redemptions (with respect to Class C Shares), and (2) ongoing costs, including management fees; distribution and service (12b-1) fees (with respect to Class A, Class C and Class R Shares); and other Fund expenses. This Example is intended to help you understand your ongoing costs (in dollars) of investing in Class A, Class C, Institutional, Class IR or Class R Shares of the Funds and to compare these costs with the ongoing costs of investing in other mutual funds.
The Example is based on an investment of $1,000 invested at the beginning of the period and held for the entire period from January 1, 2015 through June 30, 2015, which represented a period of 181 days of a 365 day year.
Actual Expenses — The first line under each share class in the table below provides information about actual account values and actual expenses. You may use the information in this line, together with the amount you invested, to estimate the expenses that you paid over the period. Simply divide your account value by $1,000 (for example, an $8,600 account value divided by $1,000=8.6), then multiply the result by the number in the first line under the heading entitled “Expenses Paid” to estimate the expenses you paid on your account during this period.
Hypothetical Example for Comparison Purposes — The second line under each share class in the table below provides information about hypothetical account values and hypothetical expenses based on the Funds’ actual net expense ratios and an assumed rate of return of 5% per year before expenses, which is not the Funds’ actual return. The hypothetical account values and expenses may not be used to estimate the actual ending account balance or expenses you paid for the period. You may use this information to compare the ongoing costs of investing in the Funds and other funds. To do so, compare this 5% hypothetical example with the 5% hypothetical examples that appear in the shareholder reports of the other funds.
Please note that the expenses shown in the table are meant to highlight your ongoing costs only and do not reflect any transactional costs, such as sales charges, redemption fees, or exchange fees. Therefore, the second line of the table is useful in comparing ongoing costs only, and will not help you determine the relative total costs of owning different funds. In addition, if these transactional costs were included, your costs would have been higher.
| | | | | | | | | | | | |
| | | Long Short Fund | |
| Share Class | | Beginning
Account Value
1/1/15 | | | Ending
Account Value
6/30/15 | | | Expenses Paid for the
6 months ended
6/30/15* | |
| Class A | | | | | | | | | | | | |
Actual | | $ | 1,000.00 | | | $ | 1,037.40 | | | $ | 13.03 | |
Hypothetical 5% return | | | 1,000.00 | | | | 1,012.00 | + | | | 12.87 | |
| Class C | | | | | | | | | | | | |
Actual | | | 1,000.00 | | | | 1,034.50 | | | | 16.95 | |
Hypothetical 5% return | | | 1,000.00 | | | | 1,008.13 | + | | | 16.73 | |
| Institutional | | | | | | | | | | | | |
Actual | | | 1,000.00 | | | | 1,040.30 | | | | 10.93 | |
Hypothetical 5% return | | | 1,000.00 | | | | 1,014.08 | + | | | 10.79 | |
| Class IR | | | | | | | | | | | | |
Actual | | | 1,000.00 | | | | 1,039.30 | | | | 11.78 | |
Hypothetical 5% return | | | 1,000.00 | | | | 1,013.24 | + | | | 11.63 | |
| Class R | | | | | | | | | | | | |
Actual | | | 1,000.00 | | | | 1,037.40 | | | | 14.14 | |
Hypothetical 5% return | | | 1,000.00 | | | | 1,010.91 | + | | | 13.96 | |
| | * | | Expenses for each share class are calculated using each Fund’s annualized net expense ratio for each class, which represents the ongoing expenses as a percentage of net assets for the six months ended June 30, 2015. Expenses are calculated by multiplying the annualized net expense ratio by the average account value for the period; then multiplying the result by the number of days in the most recent fiscal half year; and then dividing that result by the number of days in the fiscal year. The annualized net expense ratios for the period were as follows: | |
| | | | | | | | | | | | | | | | | | | | |
| Fund | | Class A | | | Class C | | | Institutional | | | Class IR | | | Class R | |
Long Short | | | 2.58 | % | | | 3.36 | % | | | 2.16 | % | | | 2.33 | % | | | 2.80 | % |
| | + | | Hypothetical expenses are based on each Fund’s actual annualized net expense ratios and an assumed rate of return of 5% per year before expenses. | |
34
GOLDMAN SACHS LONG SHORT FUND
Statement Regarding Basis for Approval of Management Agreement (Unaudited)
Background
The Goldman Sachs Long Short Fund (the “Fund”) is an investment portfolio of Goldman Sachs Trust (the “Trust”). The Board of Trustees oversees the management of the Trust and reviews the investment performance and expenses of the Fund at regularly scheduled meetings held throughout the year. In addition, the Board of Trustees determines annually whether to approve the continuance of the Trust’s investment management agreement (the “Management Agreement”) with GS Investment Strategies, LLC (the “Investment Adviser”) on behalf of the Fund.
The Management Agreement was most recently approved for continuation until June 30, 2016 by the Board of Trustees, including those Trustees who are not parties to the Management Agreement or “interested persons” (as defined in the Investment Company Act of 1940, as amended) of any party thereto (the “Independent Trustees”), at a meeting held on June 10-11, 2015 (the “Annual Meeting”).
The review process undertaken by the Trustees spans the course of the year and culminates with the Annual Meeting. To assist the Trustees in their deliberations, the Trustees have established a Contract Review Committee (the “Committee”), comprised of the Independent Trustees. The Committee held three meetings over the course of the year since the Management Agreement was last approved. At those Committee meetings, regularly scheduled Board or other committee meetings, and/or the Annual Meeting, matters relevant to the renewal of the Management Agreement were considered by the Board, or the Independent Trustees, as applicable. Such matters included:
| | (a) | | the nature and quality of the advisory, administrative, and other services provided to the Fund by the Investment Adviser and its affiliates, including information about: |
| | (i) | | the structure, staff, and capabilities of the Investment Adviser and its portfolio management teams; |
| | (ii) | | the groups within the Investment Adviser and its affiliates that support the portfolio management teams or provide other types of necessary services, including fund services groups (e.g., accounting and financial reporting, tax, shareholder services and operations); controls and risk management groups (e.g., legal, compliance, valuation oversight, credit risk management, internal audit, compliance testing, market risk analysis, finance and strategy and central funding); sales and distribution support groups and others (e.g., information technology and training); |
| | (iii) | | trends in employee headcount; |
| | (iv) | | the Investment Adviser’s financial resources and ability to hire and retain talented personnel and strengthen its operations; and |
| | (v) | | the parent company’s support of the Investment Adviser and its mutual fund business, as expressed by the firm’s senior management; |
| | (b) | | information on the investment performance of the Fund, including comparisons to the performance of similar mutual funds, as provided by the Investment Adviser using a peer group constructed by a third-party mutual fund data provider |
35
GOLDMAN SACHS LONG SHORT FUND
Statement Regarding Basis for Approval of Management Agreement (Unaudited) (continued)
| | engaged as part of the contract review process (the “Outside Data Provider”), and its benchmark performance index, and general investment outlooks in the markets in which the Fund invests; |
| | (c) | | information provided by GSAM indicating GSAM’s views on whether the Fund’s peer group and/or benchmark index had high, medium, or low relevance given the Fund’s particular investment strategy; |
| | (d) | | the terms of the Management Agreement and other agreements with affiliated service providers entered into by the Trust on behalf of the Fund; |
| | (e) | | fee and expense information for the Fund, including the relative management fee and expense level of the Fund as compared to those of comparable funds managed by other advisers, as provided by the Outside Data Provider; |
| | (f) | | with respect to the investment performance and expense comparison data provided by the Outside Data Provider, its processes in producing that data for the Fund; |
| | (g) | | the undertakings of the Investment Adviser to limit certain expenses of the Fund that exceed a specified level; |
| | (h) | | information relating to the profitability of the Management Agreement and the transfer agency and distribution and service arrangements of the Fund and the Trust as a whole to the Investment Adviser and its affiliates; |
| | (i) | | whether the Fund’s existing management fee schedule adequately addressed any economies of scale; |
| | (j) | | a summary of the “fall-out” benefits derived by the Investment Adviser and its affiliates from their relationships with the Fund, including the fees received by the Investment Adviser’s affiliates from the Fund for transfer agency, portfolio trading, distribution and other services; |
| | (k) | | a summary of potential benefits derived by the Fund as a result of its relationship with the Investment Adviser; |
| | (l) | | information regarding commissions paid by the Fund and broker oversight, an update on the Investment Adviser’s soft dollars practices, other information regarding portfolio trading, and how the Investment Adviser carries out its duty to seek best execution; |
| | (m) | | portfolio manager ownership of Fund shares; the manner in which portfolio manager compensation is determined; and the number and types of accounts managed by the portfolio managers; |
| | (n) | | the nature and quality of the services provided to the Fund by its unaffiliated service providers, and the Investment Adviser’s general oversight and evaluation (including reports on due diligence) of those service providers as part of the administration services provided under the Management Agreement; and |
| | (o) | | the Investment Adviser’s processes and policies addressing various types of potential conflicts of interest; its approach to risk management; the annual review of the effectiveness of the Fund’s compliance program; and periodic compliance reports. |
The Trustees also received an overview of the Fund’s distribution arrangements. They received information regarding the Fund’s assets, share purchase and redemption activity and the payment of Rule 12b-1 distribution and service fees by the Fund.
36
GOLDMAN SACHS LONG SHORT FUND
Statement Regarding Basis for Approval of Management Agreement (Unaudited) (continued)
Information was also provided to the Trustees relating to revenue sharing payments made by and services provided by the Investment Adviser and its affiliates to intermediaries that promote the sale, distribution, and/or servicing of Fund shares.
The presentations made at the Board and Committee meetings and at the Annual Meeting encompassed the Fund and other mutual fund portfolios for which the Board of Trustees has responsibility. In evaluating the Management Agreement at the Annual Meeting, the Trustees relied upon their knowledge, resulting from their meetings and other interactions throughout the year, of the Investment Adviser and its affiliates, their services, and the Fund. In conjunction with these meetings, the Trustees received written materials and oral presentations on the topics covered, and were advised by their independent legal counsel regarding their responsibilities and other regulatory requirements related to the approval and continuation of mutual fund investment management agreements under applicable law. In addition, the Investment Adviser and its affiliates provided the Independent Trustees with a written response to a formal request for information sent on behalf of the Independent Trustees by their independent legal counsel. During the course of their deliberations, the Independent Trustees met in executive sessions with their independent legal counsel, without representatives of the Investment Adviser or its affiliates present. The Independent Trustees also discussed the broad range of other investment choices that are available to Fund investors, including the availability of comparable funds managed by other advisers.
Nature, Extent, and Quality of the Services Provided Under the Management Agreement
As part of their review, the Trustees considered the nature, extent, and quality of the services provided to the Fund by the Investment Adviser. In this regard, the Trustees considered both the investment advisory services and non-advisory services that are provided by the Investment Adviser and its affiliates. The Trustees noted the transition in the leadership and changes in personnel of various of the Investment Adviser’s portfolio management teams that had occurred in recent periods, and the ongoing recruitment efforts aimed at bringing high quality investment talent to the Investment Adviser. They also noted the Investment Adviser’s commitment to maintaining high quality systems. The Trustees concluded that the Investment Adviser continued to commit substantial financial and operational resources to the Fund and expressed confidence that the Investment Adviser would continue to do so in the future. The Trustees also recognized that the Investment Adviser had made significant commitments to address regulatory compliance requirements applicable to the Fund and the Investment Adviser.
Investment Performance
The Trustees also considered the investment performance of the Fund. In this regard, they compared the investment performance of the Fund to its peers using performance information prepared by the Investment Adviser using the peer group identified by the Outside Data Provider for the three-month period ended March 31, 2015 (the Fund commenced operations on September 30, 2014). The Trustees also reviewed the Fund’s investment performance over the same period relative to its performance benchmark.
37
GOLDMAN SACHS LONG SHORT FUND
Statement Regarding Basis for Approval of Management Agreement (Unaudited) (continued)
In addition, the Trustees considered materials prepared and presentations made by the Investment Adviser’s senior management and portfolio management personnel. The Trustees considered the Investment Adviser’s periodic reports with respect to the Fund’s risk profile, and how the Investment Adviser’s approach to risk monitoring and management influences portfolio management.
The Trustees noted that the Fund had launched on September 30, 2014, and did not yet have a meaningful performance history.
Costs of Services Provided and Competitive Information
The Trustees considered the contractual terms of the Management Agreement and the fee rates payable by the Fund thereunder. In this regard, the Trustees considered information on the services rendered by the Investment Adviser to the Fund, which included both advisory and administrative services that were directed to the needs and operations of the Fund as a registered mutual fund.
In particular, the Trustees reviewed analyses prepared by the Outside Data Provider regarding the expense rankings of the Fund. The analyses provided a comparison of the Fund’s management fees and breakpoints to those of a relevant peer group and category universe; an expense analysis which compared the Fund’s overall net and gross expenses to a peer group and a category universe. The analyses also compared the Fund’s transfer agency, custody, and distribution fees, other expenses and fee waivers/reimbursements to those of the peer group and category medians. The Trustees concluded that the comparisons provided by the Outside Data Provider were useful in evaluating the reasonableness of the management fees and total expenses paid by the Fund.
In addition, the Trustees considered the Investment Adviser’s undertakings to limit certain expenses of the Fund that exceed a specified level. They also noted that the Investment Adviser did not manage other types of accounts having investment objectives and policies similar to those of the Fund, and therefore this type of fee comparison was not possible.
In addition, the Trustees noted that shareholders are able to redeem their Fund shares at any time if shareholders believe that the Fund fees and expenses are too high or if they are dissatisfied with the performance of the Fund.
Profitability
The Trustees reviewed the Investment Adviser’s revenues and pre-tax profit margins with respect to the Trust and the Fund. In this regard the Trustees noted that they had received, among other things, profitability analyses and summaries, revenue and expense schedules by Fund and by function (i.e., investment management, transfer agency and distribution and service), and information on the Investment Adviser’s expense allocation methodology. They observed that the profitability and expense figures are substantially similar to those used by the Investment Adviser for many internal purposes, including compensation decisions among various business groups, and are thus subject to a vigorous internal debate about how certain revenue and expenses should
38
GOLDMAN SACHS LONG SHORT FUND
Statement Regarding Basis for Approval of Management Agreement (Unaudited) (continued)
be allocated. The Trustees also noted that the internal audit group within the Goldman Sachs organization had audited the expense allocation methodology and was satisfied with the reasonableness, consistency, and accuracy of the Investment Adviser’s expense allocation methodology and profitability analysis calculations. Profitability data for the Trust and the Fund were provided for 2014, and the Trustees considered this information in relation to the Investment Adviser’s overall profitability. The Trustees considered the Investment Adviser’s revenues and pre-tax profit margins both in absolute terms and in comparison to information on the reported pre-tax profit margins earned by certain other asset management firms.
Economies of Scale
The Trustees considered the information that had been provided regarding the Investment Adviser’s profitability. The Trustees also considered the breakpoints in the fee rate payable under the Management Agreement for the Fund at the following annual percentage rates of the average daily net assets of the Fund:
| | | | |
| First $2 billion | | | 1.60 | % |
| Next $3 billion | | | 1.44 | |
| Next $3 billion | | | 1.37 | |
| Over $8 billion | | | 1.34 | |
The Trustees noted that the breakpoints were designed to share potential economies of scale, if any, with the Fund and its shareholders as assets under management reach those asset levels. The Trustees considered the amount of assets in the Fund; the Fund’s recent share purchase and redemption activity; the information provided by the Investment Adviser relating to the costs of the services provided by the Investment Adviser and its affiliates and their realized profits; information comparing fee rates charged by the Investment Adviser with fee rates charged to other funds in the peer group; and the Investment Adviser’s undertakings to limit certain expenses of the Fund that exceed a specified level. Upon reviewing these matters at the Annual Meeting, the Trustees concluded that the fee breakpoints represented a means of assuring that benefits of scalability, if any, would be passed along to shareholders at the specified asset levels.
Other Benefits to the Investment Adviser and Its Affiliates
The Trustees also considered the other benefits derived by the Investment Adviser and its affiliates from their relationships with the Fund as stated above, including: (a) transfer agency fees received by Goldman, Sachs & Co. (“Goldman Sachs”); (b) brokerage and futures commissions earned by Goldman Sachs for executing securities and futures transactions on behalf of the Fund; (c) research received by the Investment Adviser from broker-dealers in exchange for executing certain transactions on behalf of the Fund; (d) trading efficiencies resulting from aggregation of orders of the Fund with those for other funds or accounts
39
GOLDMAN SACHS LONG SHORT FUND
Statement Regarding Basis for Approval of Management Agreement (Unaudited) (continued)
managed by the Investment Adviser; (e) the Investment Adviser’s ability to leverage the infrastructure designed to service the Fund on behalf of its other clients; (f) the Investment Adviser’s ability to cross-market other products and services to Fund shareholders; (g) Goldman Sachs’ retention of certain fees as Fund Distributor; (h) the Investment Adviser’s ability to negotiate better pricing with custodians on behalf of its other clients, as a result of the relationship with the Fund; and (i) the possibility that the working relationship between the Investment Adviser and the Fund’s third-party service providers may cause those service providers to be more likely to do business with other areas of Goldman Sachs. In the course of considering the foregoing, the Independent Trustees requested and received further information quantifying certain of these fall-out benefits.
Other Benefits to the Fund and Its Shareholders
The Trustees also noted that the Fund receives certain potential benefits as a result of its relationship with the Investment Adviser, including: (a) trading efficiencies resulting from aggregation of orders of the Fund with those of other funds or accounts managed by the Investment Adviser; (b) enhanced servicing from vendors because of the volume of business generated by the Investment Adviser and its affiliates; (c) enhanced servicing from broker-dealers because of the volume of business generated by the Investment Adviser and its affiliates; (d) the Investment Adviser’s ability to negotiate favorable terms with derivatives counterparties on behalf of the Fund as a result of the size and reputation of the Goldman Sachs organization; (e) the Investment Adviser’s knowledge and experience gained from managing other accounts and products; (f) the Investment Adviser’s ability to hire and retain qualified personnel to provide services to the Fund because of the reputation of the Goldman Sachs organization; (g) the Fund’s access, through the Investment Adviser, to certain firmwide resources (e.g., proprietary risk management systems and databases), subject to certain restrictions; and (h) the Fund’s access to certain affiliated distribution channels. In addition, the Trustees noted the competitive nature of the mutual fund marketplace, and considered that many of the Fund’s shareholders invested in the Fund in part because of the Fund’s relationship with the Investment Adviser and that those shareholders have a general expectation that the relationship will continue.
Conclusion
In connection with their consideration of the Management Agreement, the Trustees gave weight to each of the factors described above, but did not identify any particular factor as controlling their decision. After deliberation and consideration of all of the information provided, including the factors described above, the Trustees concluded, in the exercise of their business judgment, that the management fees paid by the Fund were reasonable in light of the services provided to it by the Investment Adviser, the Investment Adviser’s costs and the Fund’s current and reasonably foreseeable asset levels. The Trustees unanimously concluded that the Investment Adviser’s continued management likely would benefit the Fund and its shareholders and that the Management Agreement should be approved and continued with respect to the Fund until June 30, 2016.
40
FUNDS PROFILE
Goldman Sachs Funds

Goldman Sachs is a premier financial services firm, known since 1869 for creating thoughtful and customized investment solutions in complex global markets.
Today, the Investment Management Division of Goldman Sachs serves a diverse set of clients worldwide, including private institutions, public entities and individuals. With approximately $1.02 trillion in assets under supervision as of June 30, 2015, Goldman Sachs Asset Management (“GSAM”) has portfolio management teams located around the world and our investment professionals bring firsthand knowledge of local markets to every investment decision. Assets under supervision includes assets under management and other client assets for which Goldman Sachs does not have full discretion. GSAM leverages the resources of Goldman, Sachs & Co. subject to legal, internal and regulatory restrictions.

Money Market1
Financial Square FundsSM
| n | | Financial Square Tax-Exempt Funds |
| n | | Financial Square Federal Fund |
| n | | Financial Square Government Fund |
| n | | Financial Square Money Market Fund |
| n | | Financial Square Prime Obligations Fund |
| n | | Financial Square Treasury Instruments Fund |
| n | | Financial Square Treasury Obligations Fund |
Fixed Income
Short Duration and Government
| n | | High Quality Floating Rate Fund |
| n | | Limited Maturity Obligations Fund |
| n | | Short Duration Government Fund |
| n | | Short Duration Income Fund |
| n | | Inflation Protected Securities Fund |
Multi-Sector
Municipal and Tax-Free
| n | | High Yield Municipal Fund |
| n | | Dynamic Municipal Income Fund3 |
| n | | Short Duration Tax-Free Fund |
Single Sector
| n | | Investment Grade Credit Fund |
| n | | High Yield Floating Rate Fund |
| n | | Emerging Markets Debt Fund |
| n | | Local Emerging Markets Debt Fund |
| n | | Dynamic Emerging Markets Debt Fund |
Fixed Income Alternatives
| n | | Long Short Credit Strategies Fund |
| n | | Fixed Income Macro Strategies Fund |
Fundamental Equity
| n | | Small/Mid Cap Value Fund |
| n | | Small/Mid Cap Growth Fund |
| n | | Flexible Cap Growth Fund |
| n | | Concentrated Growth Fund |
| n | | Technology Tollkeeper Fund |
| n | | Growth Opportunities Fund |
| n | | Rising Dividend Growth Fund |
| n | | Dynamic U.S. Equity Fund4 |
Tax-Advantaged Equity
| n | | U.S. Tax-Managed Equity Fund |
| n | | International Tax-Managed Equity Fund |
| n | | U.S. Equity Dividend and Premium Fund |
| n | | International Equity Dividend and Premium Fund |
Equity Insights
| n | | Small Cap Equity Insights Fund |
| n | | U.S. Equity Insights Fund |
| n | | Small Cap Growth Insights Fund |
| n | | Large Cap Growth Insights Fund |
| n | | Large Cap Value Insights Fund |
| n | | Small Cap Value Insights Fund |
| n | | International Small Cap Insights Fund |
| n | | International Equity Insights Fund |
| n | | Emerging Markets Equity Insights Fund |
Fundamental Equity International
| n | | Strategic International Equity Fund |
| n | | Focused International Equity Fund |
| n | | International Small Cap Fund |
| n | | Emerging Markets Equity Fund |
| n | | BRIC Fund (Brazil, Russia, India, China) |
Select Satellite5
| n | | Real Estate Securities Fund |
| n | | International Real Estate Securities Fund |
| n | | Commodity Strategy Fund |
| n | | Dynamic Commodity Strategy Fund |
| n | | Dynamic Allocation Fund |
| n | | Absolute Return Tracker Fund |
| n | | Managed Futures Strategy Fund |
| n | | MLP Energy Infrastructure Fund |
| n | | Multi-Manager Alternatives Fund |
| n | | Multi-Asset Real Return Fund |
| n | | Retirement Portfolio Completion Fund |
Total Portfolio Solutions5
| n | | Global Managed Beta Fund |
| n | | Multi-Manager Global Equity Fund |
| n | | Multi-Manager Non-Core Fixed Income Fund |
| n | | Multi-Manager Real Assets Strategy Fund |
| n | | Tactical Tilt Implementation Fund |
| n | | Balanced Strategy Portfolio |
| n | | Growth and Income Strategy Portfolio |
| n | | Growth Strategy Portfolio |
| n | | Equity Growth Strategy Portfolio |
| n | | Satellite Strategies Portfolio |
| n | | Enhanced Dividend Global Equity Portfolio |
| n | | Tax Advantaged Global Equity Portfolio |
| 1 | | An investment in a money market fund is neither insured nor guaranteed by the Federal Deposit Insurance Corporation (“FDIC”) or any other government agency. Although the Funds seek to preserve the value of your investment at $1.00 per share, it is possible to lose money by investing in the Funds. |
| 2 | | Effective on October 1, 2014, the Goldman Sachs Core Plus Fixed Income Fund was renamed the Goldman Sachs Bond Fund. |
| 3 | | Effective on December 18, 2014, the Goldman Sachs Municipal Income Fund was renamed the Goldman Sachs Dynamic Municipal Income Fund. |
| 4 | | Effective on April 30, 2015, the Goldman Sachs U.S. Equity Fund was renamed the Goldman Sachs Dynamic U.S. Equity Fund. |
| 5 | | Individual Funds within the Total Portfolio Solutions and Select Satellite categories will have various placement on the risk/return spectrum and may have greater or lesser risk than that indicated by the placement of the general Total Portfolio Solutions or Select Satellite category. |
Financial Square FundsSM is a registered service mark of Goldman, Sachs & Co.
| *This | | list covers open-end funds only. Please visit our website at www.GSAMFUNDS.com to learn about our closed-end funds. |
| | |
TRUSTEES Ashok N. Bakhru, Chairman Kathryn A. Cassidy John P. Coblentz, Jr. Diana M. Daniels Joseph P. LoRusso Herbert J. Markley James A. McNamara Jessica Palmer Alan A. Shuch Richard P. Strubel Roy W. Templin Gregory G. Weaver | | OFFICERS James A. McNamara, President Scott M. McHugh, Principal Financial Officer and Treasurer Caroline Kraus, Secretary |
| |
GOLDMAN, SACHS & CO. Distributor and Transfer Agent | | GS INVESTMENT STRATEGIES, LLC Investment Adviser |
Visit our web site at www.GSAMFUNDS.com to obtain the most recent month-end returns.
Goldman Sachs Asset Management, L.P., 200 West Street, New York, New York 10282
The reports concerning the Fund included in this shareholder report may contain certain forward-looking statements about the factors that may affect the performance of the Fund in the future. These statements are based on Fund management’s predictions and expectations concerning certain future events and their expected impact on the Fund, such as performance of the economy as a whole and of specific industry sectors, changes in the levels of interest rates, the impact of developing world events, and other factors that may influence the future performance of the Fund. Management believes these forward-looking statements to be reasonable, although they are inherently uncertain and difficult to predict. Actual events may cause adjustments in portfolio management strategies from those currently expected to be employed.
A description of the policies and procedures that the Fund uses to determine how to vote proxies relating to portfolio securities and information regarding how the Fund voted proxies relating to portfolio securities for the most recent 12-month period ended June 30, are available (I) without charge, upon request by calling 1-800-526-7384; and (II) on the Securities and Exchange Commission (“SEC’’) web site at http://www.sec.gov.
The Fund files its complete schedule of portfolio holdings with the Securities and Exchange Commission (“SEC”) for the first and third quarters of each fiscal year on Form N-Qs. The Fund’s Form N-Qs are available on the SEC’s web site at http://www.sec.gov within 60 days after the Fund’s first and third fiscal quarters. The Fund’s Form N-Qs may be reviewed and copied at the SEC’s Public Reference Room in Washington, D.C., and information on the operation of the Public Reference Room may also be obtained by calling 1-800-SEC-0330. Form N-Qs may be obtained upon request and without charge by calling 1-800-526-7384 (for Retail Shareholders) or 1-800-621-2550 (for Institutional Shareholders).
Fund holdings and allocations shown are as of June 30, 2015 and may not be representative of future investments. Fund holdings should not be relied on in making investment decisions and should not be construed as research or investment advice regarding particular securities. Current and future holdings are subject to risk.
The Global Industry Classification Standard (GICS) was developed by and is the exclusive property and a service mark of Morgan Stanley Capital International Inc. (MSCI) and Standard & Poor’s, a division of The McGraw-Hill Companies, Inc. (S&P) and is licensed for use by Goldman Sachs. Neither MSCI, S&P nor any other party involved in making or compiling the GICS or any GICS classifications makes any express or implied warranties or representations with respect to such standard or classification (or the results to be obtained by the use thereof), and all such parties hereby expressly disclaim all warranties of originality, accuracy, completeness, merchantability or fitness for a particular purpose with respect to any of such standard or classification. Without limiting any of the foregoing, in no event shall MSCI, S&P, any of their affiliates or any third party involved in making or compiling the GICS or any GICS classifications have any liability for any direct, indirect, special, punitive, consequential or any other damages (including lost profits) even if notified of the possibility of such damages.
Economic and market forecasts presented herein reflect our judgment as of the date of this presentation and are subject to change without notice. These forecasts do not take into account the specific investment objectives, restrictions, tax and financial situation or other needs of any specific client. Actual data will vary and may not be reflected here. These forecasts are subject to high levels of uncertainty that may affect actual performance. Accordingly, these forecasts should be viewed as merely representative of a broad range of possible outcomes. These forecasts are estimated, based on assumptions, and are subject to significant revision and may change materially as economic and market conditions change. Goldman Sachs has no obligation to provide updates or changes to these forecasts. Case studies and examples are for illustrative purposes only.
The portfolio risk management process includes an effort to monitor and manage risk, but does not imply low risk.
This material is not authorized for distribution to prospective investors unless preceded or accompanied by a current Prospectus or summary prospectus, if applicable. Investors should consider a Fund’s objective, risks, and charges and expenses, and read the summary prospectus, if available, and/or the Prospectus carefully before investing or sending money. The summary prospectus, if available, and the Prospectus contain this and other information about a Fund and may be obtained from your authorized dealer or from Goldman, Sachs & Co. by calling (retail – 1-800-526-7384) (institutional – 1-800-621-2550).
© 2015 Goldman Sachs. All rights reserved. 167706.MF.MED.TMPL/8/2015 LONGSHSAR-15/1.7K
| | (a) | As of the end of the period covered by this report, the registrant has adopted a code of ethics that applies to the registrant’s principal executive officer, principal financial officer, principal accounting officer or controller, or persons performing similar functions, regardless of whether these individuals are employed by the registrant or a third party (the “Code of Ethics”). |
| | (b) | During the period covered by this report, no amendments were made to the provisions of the Code of Ethics. |
| | (c) | During the period covered by this report, the registrant did not grant any waivers, including an implicit waiver, from any provision of the Code of Ethics. |
| | (d) | A copy of the Code of Ethics is available as provided in Item 12(a)(1) of this report. |
| ITEM 3. | AUDIT COMMITTEE FINANCIAL EXPERT. |
The registrant’s board of trustees has determined that the registrant has at least one “audit committee financial expert” (as defined in Item 3 of Form N-CSR) serving on its audit committee. John P. Coblentz, Jr. is the “audit committee financial expert” and is “independent” (as each term is defined in Item 3 of Form N-CSR).
| ITEM 4. | PRINCIPAL ACCOUNTANT FEES AND SERVICES. |
Table 1 — Items 4(a) – 4(d). The accountant fees below reflect the aggregate fees billed by all of the Funds of the Goldman Sachs Trust and includes the Goldman Sachs Funds to which this certified shareholder report relates.
| | | | | | | | | | |
| | | 2014 | | | 2013 | | | Description of Services Rendered |
Audit Fees: | | | | | | | | | | |
• PricewaterhouseCoopers LLP (“PwC”) | | $ | 3,563,029 | | | $ | 2,422,346 | | | Financial Statement audits. |
Audit-Related Fees: | | | | | | | | | | |
• PwC | | $ | 0 | | | $ | 2,340 | | | Other attest services. |
Tax Fees: | | | | | | | | | | |
• PwC | | $ | 672,155 | | | $ | 894,195 | | | Tax compliance services provided in connection with the preparation and review of registrant’s tax returns. |
Table 2 — Items 4(b)(c) & (d). Non-Audit Services to the Goldman Sachs Trust’s service affiliates * that were pre-approved by the Audit Committee of the Goldman Sachs Trust pursuant to Rule 2-01(c)(7)(ii) of Regulation S-X.
| | | | | | | | | | |
| | | 2014 | | | 2013 | | | Description of Services Rendered |
Audit-Related Fees: | | | | | | | | | | |
• PwC | | $ | 1,486,420 | | | $ | 1,486,420 | | | Internal control review performed in accordance with Statement on Standards for Attestation Engagements No. 16. These fees are borne by the Funds’ Adviser. |
* These include the advisor (excluding sub-advisors) and any entity controlling, controlled by or under common control with the advisor that provides ongoing services to the registrant (hereinafter referred to as “service affiliates”).
Item 4(e)(1) — Audit Committee Pre-Approval Policies and Procedures
Pre-Approval of Audit and Non-Audit Services Provided to the Funds of the Goldman Sachs Trust. The Audit and Non-Audit Services Pre-Approval Policy (the “Policy”) adopted by the Audit Committee of Goldman Sachs Trust (“GST”) sets forth the procedures and the conditions pursuant to which services performed by an independent auditor for GST may be pre-approved. Services may be pre-approved specifically by the Audit Committee as a whole or, in certain circumstances, by the Audit Committee Chairman or the person designated as the Audit Committee Financial Expert. In addition, subject to specified cost limitations, certain services may be pre-approved under the provisions of the Policy. The Policy provides that the Audit Committee will consider whether the services provided by an independent auditor are consistent with the Securities and Exchange Commission’s rules on auditor independence. The Policy provides for periodic review and pre-approval by the Audit Committee of the services that may be provided by the independent auditor.
De Minimis Waiver. The pre-approval requirements of the Policy may be waived with respect to the provision of non-audit services that are permissible for an independent auditor to perform, provided (1) the aggregate amount of all such services provided constitutes no more than five percent of the total amount of revenues subject to pre-approval that was paid to the independent auditors during the fiscal year in which the services are provided; (2) such services were not recognized by GST at the time of the engagement to be non-audit services; and (3) such services are promptly brought to the attention of the Audit Committee and approved prior to the completion of the audit by the Audit Committee or by one or more members of the Audit Committee to whom authority to grant such approvals has been delegated by the Audit Committee, pursuant to the pre-approval provisions of the Policy.
Pre-Approval of Non-Audit Services Provided to GST’s Investment Advisers. The Policy provides that, in addition to requiring pre-approval of audit and non-audit services provided to GST, the Audit Committee will pre-approve those non-audit services provided to GST’s investment advisers (and entities controlling, controlled by or under common control with the investment advisers that provide ongoing services to GST) where the engagement relates directly to the operations or financial reporting of GST.
Item 4(e)(2) – 0% of the audit-related fees, tax fees and other fees listed in Table 1 were approved by GST’s Audit Committee pursuant to the “de minimis” exception of Rule 2-01(c)(7)(i)(C) of Regulation S-X. In addition, 0% of the non-audit services to the GST’s service affiliates listed in Table 2 were approved by GST’s Audit Committee pursuant to the “de minimis” exception of Rule2-01(c)(7)(i)(C) of Regulation S-X.
Item 4(f) – Not applicable.
Item 4(g) Aggregate Non-Audit Fees Disclosure
The aggregate non-audit fees billed to GST by PwC for the twelve months ended December 31, 2014 and December 31, 2013 were $672,155 and $896,535 respectively. The aggregate non-audit fees billed to GST’s adviser and service affiliates by PwC for non-audit services for the twelve months ended December 31, 2014 and December 31, 2013 were approximately $10.2 million and $9.8 million, respectively. With regard to the aggregate non-audit fees billed to GST’s adviser and service affiliates, the 2014 and 2013 amounts include fees for non-audit services required to be pre-approved [see Table 2] and fees for non-audit services that did not require pre-approval since they did not directly relate to GST’s operations or financial reporting.
Item 4(h) — GST’s Audit Committee has considered whether the provision of non-audit services to GST’s investment adviser and service affiliates that did not require pre-approval pursuant to paragraph (c)(7)(ii) of Rule 2-01 of Regulation S-X is compatible with maintaining the auditors’ independence.
| ITEM 5. | AUDIT COMMITTEE OF LISTED REGISTRANTS. |
| ITEM 6. | SCHEDULE OF INVESTMENTS. |
| | Schedule of Investments is included as part of the Report to Stockholders filed under Item 1. |
| ITEM 7. | DISCLOSURE OF PROXY VOTING POLICIES AND PROCEDURES FOR CLOSED-END MANAGEMENT INVESTMENT COMPANIES. |
| ITEM 8. | PORTFOLIO MANAGERS OF CLOSED-END MANAGEMENT INVESTMENT COMPANIES. |
| ITEM 9. | PURCHASES OF EQUITY SECURITIES BY CLOSED-END MANAGEMENT INVESTMENT COMPANY AND AFFILIATED PURCHASERS. |
| ITEM 10. | SUBMISSION OF MATTERS TO A VOTE OF SECURITY HOLDERS. |
| | There have been no material changes to the procedures by which shareholders may recommend nominees to the registrant’s board of trustees. |
| ITEM 11. | CONTROLS AND PROCEDURES. |
| | (a) | The registrant’s principal executive and principal financial officers, or persons performing similar functions have concluded that the registrant’s disclosure controls and procedures (as defined in Rule 30a-3(c) under the Investment Company Act of 1940, as amended (the “1940 Act”)) are effective as of a date within 90 days of the filing of this report that includes the disclosure required by this paragraph, based on the evaluation of these controls and procedures required by Rule 30a-3(b) under the 1940 Act and 15d-15(b) under the Securities Exchange Act of 1934, as amended. |
| | (b) | There were no changes in the registrant’s internal control over financial reporting (as defined in Rule 30a-3(d) under the 1940 Act) that occurred during the registrant’s second fiscal quarter of the period covered by this report that have materially affected, or are reasonably likely to materially affect, the registrant’s internal control over financial reporting. |
| | | | |
| (a)(1) | | Goldman Sachs Trust’s Code of Ethics for Principal Executive and Senior Financial Officers is incorporated by reference to Exhibit 12(a)(1) of the registrant’s Form N-CSR filed on July 8, 2015 for its International Equity Insights Funds. |
| | |
| (a)(2) | | Exhibit 99.CERT | | Certifications pursuant to Section 302 of the Sarbanes-Oxley Act of 2002 filed herewith. |
| | |
| (b) | | Exhibit 99.906CERT | | Certifications pursuant to Section 906 of the Sarbanes-Oxley Act of 2002 filed herewith. |
SIGNATURES
Pursuant to the requirements of the Securities Exchange Act of 1934 and the Investment Company Act of 1940, the registrant has duly caused this report to be signed on its behalf by the undersigned, thereunto duly authorized.
| | |
| | | Goldman Sachs Trust |
| |
| By: | | /s/ James A. McNamara |
| |
| | |
| | James A. McNamara |
| | President/Chief Executive Officer |
| | Goldman Sachs Trust |
| |
| Date: | | September 4, 2015 |
Pursuant to the requirements of the Securities Exchange Act of 1934 and the Investment Company Act of 1940, this report has been signed below by the following persons on behalf of the registrant and in the capacities and on the dates indicated.
| | |
| By: | | /s/ James A. McNamara |
| |
| | |
| | James A. McNamara |
| | President/Chief Executive Officer |
| | Goldman Sachs Trust |
| |
| Date: | | September 4, 2015 |
| |
| By: | | /s/ Scott McHugh |
| |
| | |
| | Scott McHugh |
| | Principal Financial Officer |
| | Goldman Sachs Trust |
| |
| Date: | | September 4, 2015 |