UNITED STATES
SECURITIES AND EXCHANGE COMMISSION
Washington, D.C. 20549
FORM N-CSR
CERTIFIED SHAREHOLDER REPORT OF REGISTERED
MANAGEMENT INVESTMENT COMPANIES
Investment Company Act file number 811-05349
Goldman Sachs Trust
(Exact name of registrant as specified in charter)
71 South Wacker Drive, Chicago, Illinois 60606
(Address of principal executive offices) (Zip code)
| | |
| Caroline Kraus, Esq. | | Copies to: |
| Goldman, Sachs & Co. | | Geoffrey R.T. Kenyon, Esq. |
| 200 West Street | | Dechert LLP |
| New York, New York 10282 | | 100 Oliver Street |
| | 40th Floor |
| | Boston, MA 02110-2605 |
(Name and address of agents for service)
Registrant’s telephone number, including area code: (312) 655-4400
Date of fiscal year end: March 31
Date of reporting period: September 30, 2015
| ITEM 1. | REPORTS TO STOCKHOLDERS. |
| | The Semi-Annual Report to Shareholders is filed herewith. |
Goldman Sachs Funds

| | | | |
| | |
| Semi-Annual Report | | | | September 30, 2015 |
| | |
| | | | Single Sector Fixed Income Funds |
| | | | Dynamic Emerging Markets Debt |
| | | | Emerging Markets Debt |
| | | | High Yield |
| | | | High Yield Floating Rate |
| | | | Investment Grade Credit |
| | | | Local Emerging Markets Debt |
| | | | U.S. Mortgages |

Goldman Sachs Single Sector Fixed Income Funds
| n | | DYNAMIC EMERGING MARKETS DEBT |
| n | | HIGH YIELD FLOATING RATE |
| n | | INVESTMENT GRADE CREDIT |
| n | | LOCAL EMERGING MARKETS DEBT |
| | | | |
TABLE OF CONTENTS | | | | |
| |
Principal Investment Strategies and Risks | | | 1 | |
| |
Investment Process | | | 4 | |
| |
Market Review | | | 5 | |
| |
Portfolio Management Discussions and Performance Summaries | | | 7 | |
| |
Schedules of Investments | | | 45 | |
| |
Financial Statements | | | 120 | |
| |
Financial Highlights | | | 128 | |
| |
Notes to the Financial Statements | | | 142 | |
| |
Other Information | | | 178 | |
| | | | |
| | | |
| NOT FDIC-INSURED | | May Lose Value | | No Bank Guarantee |
GOLDMAN SACHS SINGLE SECTOR FIXED INCOME FUNDS
Principal Investment Strategies and Risks
This is not a complete list of risks that may affect the Funds. For additional information concerning the risks applicable to the Funds, please see the Funds’ Prospectus.
The Goldman Sachs Dynamic Emerging Markets Debt Fund invests primarily in sovereign and corporate debt of issuers located in or tied economically to emerging countries or in currencies of such emerging countries. Investments in fixed income securities are subject to the risks associated with debt securities generally, including credit, liquidity and interest rate risk. Foreign and emerging markets investments may be more volatile and less liquid than investments in U.S. securities and are subject to the risks of currency fluctuations and adverse economic or political developments. The securities markets of emerging countries have less government regulation and are subject to less extensive accounting and financial reporting requirements than the markets of more developed countries. Such securities are also subject to foreign custody risk. The Fund is also subject to the risk that the issuers of sovereign debt or the government authorities that control the payment of debt may be unable or unwilling to repay principal or interest when due. High yield, lower rated investments involve greater price volatility and present greater risks than higher rated fixed income securities. Derivative instruments may involve a high degree of financial risk. These risks include the risk that a small movement in the price of the underlying security or benchmark may result in a disproportionately large movement, unfavorable or favorable, in the price of the derivative instrument; the risk of default by a counterparty; and liquidity risk. At times, the Fund may be unable to sell certain of its illiquid investments without a substantial drop in price, if at all. The Fund is “non-diversified” and may invest more of its assets in fewer issuers than “diversified” funds. Accordingly, the Fund may be more susceptible to adverse developments affecting any single issuer held in its portfolio and to greater losses resulting from these developments.
The Goldman Sachs Emerging Markets Debt Fund invests primarily in sovereign and corporate debt of issuers located in or tied economically to emerging countries. The Fund’s investments in fixed income securities are subject to the risks associated with debt securities generally, including credit, liquidity and interest rate risk. Foreign and emerging markets investments may be more volatile and less liquid than investments in U.S. securities and are subject to the risks of currency fluctuations and adverse economic or political developments. The countries in which the Fund invests may have sovereign ratings that are below investment grade or are unrated. High yield, lower rated investments involve greater price volatility and present greater risks than higher rated fixed income securities. The securities markets of emerging countries have less government regulation and are subject to less extensive accounting and financial reporting requirements than the markets of more developed countries. Such securities are also subject to foreign custody risk. The Fund is also subject to the risk that the issuers of sovereign debt or the government authorities that control the payment of debt may be unable or unwilling to repay principal or interest when due. Derivative instruments may involve a high degree of financial risk. These risks include the risk that a small movement in the price of the underlying security or benchmark may result in a disproportionately large movement, unfavorable or favorable, in the price of the derivative instrument; the risk of default by a counterparty; and liquidity risk. At times, the Fund may be unable to sell certain of its illiquid investments without a substantial drop in price, if at all. The Fund is “non-diversified” and may invest more of its assets in fewer issuers than “diversified” funds. Accordingly, the Fund may be more susceptible to adverse developments affecting any single issuer held in its portfolio and to greater losses resulting from these developments.
The Goldman Sachs High Yield Fund invests primarily in high yield, fixed income securities that, at the time of purchase, are non-investment grade securities. The Fund’s investments in fixed income securities are subject to the risks associated with debt securities generally, including credit, liquidity and interest rate risk. High yield, lower rated investments involve greater price volatility and present greater risks than higher rated fixed income securities. Foreign and emerging markets investments may be more volatile and less liquid than investments in U.S. securities and are subject to the risks of
1
GOLDMAN SACHS SINGLE SECTOR FIXED INCOME FUNDS
currency fluctuations and adverse economic or political developments. Derivative instruments may involve a high degree of financial risk. These risks include the risk that a small movement in the price of the underlying security or benchmark may result in a disproportionately large movement, unfavorable or favorable, in the price of the derivative instrument; the risk of default by a counterparty; and liquidity risk. At times, the Fund may be unable to sell certain of its illiquid investments without a substantial drop in price, if at all.
The Goldman Sachs High Yield Floating Rate Fund invests primarily in domestic or foreign floating rate loans and other floating or variable rate obligations rated below investment grade. Indirect loan participations may subject the Fund to greater delays, expenses and risks than direct obligations in the case that a borrower fails to pay scheduled principal and interest. Investments in loans and fixed income instruments are subject to the risks associated with debt instruments generally, including credit, liquidity and interest rate risk. Foreign and emerging markets investments may be more volatile and less liquid than investments in U.S. securities and are subject to the risks of currency fluctuations and adverse economic or political developments. High yield, lower rated investments involve greater price volatility and present greater risks than higher rated investments. At times, the Fund may be unable to sell certain of its illiquid investments without a substantial drop in price, if at all. Derivative instruments may involve a high degree of financial risk. These risks include the risk that a small movement in the price of the underlying security or benchmark may result in a disproportionately large movement, unfavorable or favorable, in the price of the derivative instrument; the risk of default by a counterparty; and liquidity risk.
The Goldman Sachs Investment Grade Credit Fund invests primarily in investment grade fixed income securities. The Fund’s investments in fixed income securities are subject to the risks associated with debt securities generally, including credit, liquidity and interest rate risk. Any guarantee on U.S. government securities applies only to the underlying securities of the Fund if held to maturity and not to the value of the Fund’s shares. Foreign and emerging markets investments may be more volatile and less liquid than its investment in U.S. securities and are subject to the risks of currency fluctuations and adverse economic or political developments. Derivative instruments may involve a high degree of financial risk. These risks include the risk that a small movement in the price of the underlying security or benchmark may result in a disproportionately large movement, unfavorable or favorable, in the price of the derivative instrument; the risk of default by a counterparty; and liquidity risk.
The Goldman Sachs Local Emerging Markets Debt Fund invests primarily in sovereign and corporate debt of issuers located in or tied economically to emerging countries, denominated in the local currency of such emerging countries, or in currencies of such emerging countries. Investments in fixed income securities are subject to the risks associated with debt securities generally, including credit, liquidity and interest rate risk. Foreign and emerging markets investments may be more volatile and less liquid than investments in U.S. securities and are subject to the risks of currency fluctuations and adverse economic or political developments. The securities markets of emerging countries have less government regulation and are subject to less extensive accounting and financial reporting requirements than the markets of more developed countries. Such securities are also subject to foreign custody risk. The Fund is also subject to the risk that the issuers of sovereign debt or the government authorities that control the payment of debt may be unable or unwilling to repay principal or interest when due. High yield, lower rated investments involve greater price volatility and present greater risks than higher rated fixed income securities. Derivative instruments may involve a high degree of financial risk. These risks include the risk that a small movement in the price of the underlying security or benchmark may result in a disproportionately large movement, unfavorable or favorable, in the price of the derivative instrument; the risk of default by a counterparty; and liquidity risk. At times, the Fund may be unable to sell certain of its illiquid investments without a substantial drop in price, if at all. The Fund is “non-diversified” and may invest more of its assets in fewer issuers than “diversified” funds. Accordingly, the Fund may be
2
GOLDMAN SACHS SINGLE SECTOR FIXED INCOME FUNDS
more susceptible to adverse developments affecting any single issuer held in its portfolio and to greater losses resulting from these developments.
The Goldman Sachs U.S. Mortgages Fund invests primarily in mortgage-backed securities of U.S. issuers. The Fund’s investments in fixed income securities are subject to the risks associated with debt securities generally, including credit, liquidity and interest rate risk. Investments in mortgage-backed securities are also subject to prepayment risk, the risk that in a declining interest rate environment the Fund’s underlying mortgages may be prepaid, causing the Fund to have to reinvest at lower interest rates. Any guarantee on U.S. government securities applies only to the underlying securities of the Fund if held to maturity and not to the value of the Fund’s shares. Derivative instruments may involve a high degree of financial risk. These risks include the risk that a small movement in the price of the underlying security or benchmark may result in a disproportionately large movement, unfavorable or favorable, in the price of the derivative instrument; the risk of default by a counterparty; and liquidity risk.
3
GOLDMAN SACHS SINGLE SECTOR FIXED INCOME FUNDS
What Differentiates the Goldman Sachs Asset Management Fixed Income Investment Process?
At Goldman Sachs Asset Management, L.P. (“GSAM”), the goal of our fixed income investment process is to provide consistent, strong performance by actively managing our portfolios within a research-intensive, risk-managed framework.
A key element of our fixed income investment philosophy is to evaluate the broadest global opportunity set to capture relative value across sectors and instruments. Our globally integrated investment process involves managing dynamically along the risk/return spectrum, as we continue to develop value-added strategies through:

| n | | Assess relative value among securities and sectors |
| n | | Leverage the vast resources of GSAM in selecting securities for each portfolio |

| n | | Team approach to decision making |
| n | | Manage risk by avoiding significant sector and interest rate bets |
| n | | Careful management of yield curve strategies — while closely managing portfolio duration |

Fixed Income portfolios that:
| | n | | Include domestic and global investment options, income opportunities, and access to areas of specialization such as high yield | |
| | n | | Capitalize on GSAM’s industry-renowned credit research capabilities | |
| | n | | Use a risk-managed framework to seek total return, recognizing the importance of investors’ capital accumulation goals as well as their need for income | |
4
MARKET REVIEW
Goldman Sachs Single Sector Fixed Income Funds
Market Review
Shifting expectations about global economic growth and the timing of a potential Federal Reserve (“Fed”) interest rate hike, along with falling commodities prices, influenced the performance of the global fixed income markets during the six months ended September 30, 2015 (the “Reporting Period”).
When the Reporting Period began in April 2015, the performance of spread, or non-government bond, sectors was mixed. U.S. Treasury yields rose, as U.S. economic data improved, including positive surprises in inflation and retail sales. First quarter 2015 U.S. Gross Domestic Product (“GDP”) was revised upwards from -0.7% to a seasonally adjusted annualized rate of -0.2%. The upward revision stemmed in part from stronger than estimated consumer spending and inventory data. U.S. dollar gains hit a roadblock during the second calendar quarter on uncertainty around the Fed’s plans for raising interest rates in 2015. The Eurozone’s economic progress took a back seat to the seemingly intractable challenges surrounding Greece.
In the third quarter of 2015, spread sectors underperformed U.S. Treasuries as the outlook for the global economy grew cloudy. Investors focused on slowing economic growth in China, the devaluation of the Chinese renminbi and an unexpected increase in market volatility. Oil and commodities prices dropped to new lows, partly because of falling demand from China. Uncertainty about the timing of potential Fed policy tightening became an increasingly key theme. Surprisingly to many, the Fed chose to leave rates unchanged at its September 2015 policy meeting, citing conditions in the global economy. Although the U.S. economy continued to improve, economic growth in other developed countries softened and emerging markets economies broadly weakened. Despite accommodative monetary policies by many global central banks, inflation remained subdued in the world’s major economies.
For the Reporting Period overall, U.S. Treasuries performed strongly, outpacing other fixed income sectors with the exception of asset-backed securities. High yield corporate bonds underperformed U.S. Treasuries the most, followed by investment grade corporate bonds, sovereign emerging market debt and agency securities. Commercial mortgage-backed securities and residential mortgage-backed securities also underperformed U.S. Treasuries, albeit more modestly. The U.S. Treasury yield curve, or spectrum of maturities, steepened during the Reporting Period, as longer-term yields rose more than intermediate-term yields, and shorter-term yields edged down. The yield on the bellwether 10-year U.S. Treasury rose approximately 18 basis points to 2.04%. (A basis point is 1/100th of a percentage point.)
Looking Ahead
At the end of the Reporting Period, we had not changed our broadly positive view for the global economy, though we did see less cause for optimism. We believe the economic slowdown in the emerging markets is constraining global economic growth overall. Further, in our view, U.S. and European economic momentum is moderating, and Japan is facing stronger headwinds. The risks of policy missteps in China have manifested, in our view, raising the prospect of further volatility in the fixed income markets. Additionally, we think the benefits of lower oil prices are fading, with no end in sight for the downward trend in the commodities markets.
We believed, at the end of the Reporting Period, that the U.S. economy was caught in the cross-currents of domestic strength and global weakness. In our view, the U.S. is likely to benefit from labor market tightening as well as from improvements in the housing market
5
MARKET REVIEW
and in retail sales. Risks include tight financial conditions and weak global demand, while production cuts in the energy sector could have an impact on capital expenditures. Although the Fed may yet raise rates in 2015, we believe the odds of a delay are growing.
In the Eurozone, economic growth momentum appears to have flattened. The Syrian refugee crisis seems to have replaced worries about a potential Greek exit as the dominant policy challenge. We think the European Central Bank is likely to expand its quantitative easing in early 2016. In the U.K., we expect economic growth data to remain positive and believe an interest rate hike by the Bank of England in early 2016 is possible. However, we do not expect the U.K. central bank to move before the Fed acts. Japan faces a possible relapse into recession, and we believe the Bank of Japan is likely to ease again in the near term. In the emerging markets, economic growth has weakened under the combined pressures of the commodities slump, China’s economic slowdown, U.S. dollar strength and fears of Fed policy tightening.
6
PORTFOLIO RESULTS
Goldman Sachs Dynamic Emerging Markets Debt Fund
Investment Objective
The Fund seeks a high level of total return consisting of income and capital appreciation.
Portfolio Management Discussion and Analysis
Below, the Goldman Sachs Global Fixed Income Investment Management Team discusses the Goldman Sachs Dynamic Emerging Markets Debt Fund’s (the “Fund”) performance and positioning for the six-month period ended September 30, 2015 (the “Reporting Period”).
| Q | | How did the Fund perform during the Reporting Period? |
| A | | During the Reporting Period, the Fund’s Class A, C, Institutional, IR and R Shares generated cumulative total returns, without sales charges, of -6.69%, -7.13%, -6.62%, -6.68% and -6.90%, respectively. These returns compare to the -6.66% cumulative total return of the Fund’s benchmark, the Dynamic Emerging Markets Debt Fund Composite Index (the “Index”), which is comprised 50% of the J.P. Morgan Government Bond Index — Emerging Markets (GBI-EMSM) Global Diversified Index (Gross, USD, Unhedged), 25% of the J.P. Morgan Emerging Markets Bond Index (EMBISM) Global Diversified Index (Gross, USD, Unhedged) and 25% of the J.P. Morgan Corporate Emerging Markets Bond Index (CEMBISM) Broad Diversified Index (Gross, USD, Unhedged) during the same time period. The components of the Fund’s blended benchmark, the J.P. Morgan GBI-EMSM Global Diversified Index, J.P. Morgan EMBISM Global Diversified Index and J.P. Morgan CEMBISM Broad Diversified Index, generated cumulative total returns of -11.40%, -2.04% and -1.48%, respectively, during the Reporting Period. |
| Q | | What economic and market factors most influenced emerging markets debt as a whole during the Reporting Period? |
| A | | When the Reporting Period began during the second quarter of 2015, external emerging markets debt recorded a small decline, with Argentina, Uruguay and Peru posting the weakest results in the J.P. Morgan EMBISM Global Diversified Index. External emerging markets debt also retreated during the third calendar quarter, led by declines in Ecuador, Zambia and Iraq. For the Reporting Period overall, external emerging markets debt, as represented by the J.P. Morgan EMBISM Global Diversified Index, returned -2.04%. Sovereign spreads (that is, the difference in yields between external emerging markets debt and U.S. Treasuries) widened by approximately 65 basis points to close the Reporting Period 433 basis points wider than U.S. Treasury securities. (A basis point is 1/100th of a percentage point.) |
| | During the second quarter of 2015, local emerging markets recorded a small decline, driven by changes in local interest rates that was partially offset by modest currency appreciation. In the third calendar quarter, local emerging markets debt declined significantly, driven by currency depreciation versus the U.S. dollar and to a lesser extent, by changes in local interest rates. |
| | In the emerging markets corporate bond sector, performance overall was affected by a number of macro and sector themes as well as by major corporate news headlines. During August 2015, Moody’s Investors Service downgraded the ratings of 14 Brazilian financial institutions, following the ratings agency’s downgrade earlier in the month of Brazil’s sovereign rating to Baa3 from Baa2. In September 2015, Standard and Poor’s Ratings downgraded Brazilian oil company Petroleo Brasileiro (“Petrobras”), along with number of other Brazilian corporates, to BB from BBB- with a negative outlook. Also in September 2015, Standard and Poor’s Ratings downgraded Brazil’s foreign currency rating to BB+ from BBB- and kept its negative outlook in response to political challenges that continued to mount and that added to the country’s fiscal deterioration. Elsewhere, six ministries in China jointly announced loosened policy for foreign buyers of Chinese property, which among other things removed the one-year residency requirement for foreigners seeking to purchase properties and also simplified the procedures for foreign real estate companies to remit renminbi into China for property investment. The emerging markets corporate bond sector saw approximately $119 billion of gross new issuance during the Reporting Period, bringing 2015 year to date through September 30 issuance to approximately $198 billion.1 Meanwhile, in September 2015, J.P. Morgan revised its global emerging markets corporate default rate forecast to 4.3%. |
7
PORTFOLIO RESULTS
| Q | | What key factors were responsible for the Fund’s performance during the Reporting Period? |
| A | | During the Reporting Period, the Fund’s sector positioning in external emerging markets debt detracted from relative performance. In addition, country and issue selection among local emerging markets bonds hurt results. |
| | Sector positioning and issue selection among emerging markets corporate bonds added to relative returns. Country and issue selection among external emerging markets debt also contributed positively during the Reporting Period. |
| Q | | Which segments of emerging markets debt most significantly affected Fund performance? |
| A | | During the Reporting Period, the Fund’s position in the Mexican peso (accomplished through the use of forward foreign currency exchange contracts) detracted from relative performance. The Mexican peso depreciated against the U.S. dollar amid overall emerging markets currency weakness. We believe that Mexico remains closely tied to the U.S. economy and may therefore benefit should U.S. economic growth continue to improve. The Fund was also hurt by an underweight position in Argentinian external debt during the Reporting Period, with most of the negative impact occurring in the second quarter of 2015. Although the Fund started the Reporting Period with an overweight in Argentinian external debt, we shifted it to an underweight position based on our belief that Argentina’s macroeconomic conditions have been deteriorating, policy making has been weak, government expenditures have been increasing and uncertainty remains regarding negotiations with holdout creditors in a sovereign debt restructuring. This underweight position dampened performance, as Argentinian external bonds performed well on positive sentiment about the country’s presidential elections. The election race remained broadly open, although polls suggested that Daniel Scioli was slightly ahead of Mauricio Macri. Daniel Scioli is seen as a positive figure for business compared to outgoing President Christina Fernández de Kirchner. Also detracting from Fund results during the Reporting Period was an overweight position in Colombian local interest rates (accomplished through investments in local emerging markets bonds and derivative instruments). We believe Colombia’s strong policy framework — which includes a structural fiscal balance rule, inflation-targeting regime, flexible exchange rate and effective financial supervision and regulation — could help the government facilitate economic and financial stability. However, given Colombia’s reliance on energy exports, low oil prices dampened sentiment for Colombian local bonds during the Reporting Period and also drove a sharp depreciation in the Colombian peso. |
| | On the positive side, the Fund benefited from its underweight position relative to the Index in Turkish local interest rates (accomplished through investments in local emerging markets bonds). We believe geopolitical turmoil and domestic political uncertainty were some of the drivers of the poor performance of Turkish local bonds. In addition, the Fund’s underweights in the Taiwan dollar and South Korean won (accomplished through the use of forward foreign currency exchange contracts) added to results, as fears about China’s slowing economic growth pressured the currencies of many Southeast Asian countries. The Fund also benefited from our tactical trading of Russian external debt, which was driven mainly by valuations. At the same time, we remained mindful that geopolitical tensions and oil price weakness were potential risks to Russian external bonds. |
| Q | | Did the Fund’s duration and yield curve positioning strategy help or hurt its results during the Reporting Period? |
| A | | The Fund’s U.S. duration and yield curve positioning did not have a meaningful impact on relative returns during the Reporting Period. Duration is a measure of the Fund’s sensitivity to changes in interest rates. Yield curve indicates a spectrum of maturities. |
| Q | | How did the Fund use derivatives and similar instruments during the Reporting Period? |
| A | | The Fund invested in U.S. Treasury futures, Eurodollar futures, forward foreign currency exchange contracts, interest rate swaps, total return swaps, credit default swaps, cross currency swaps, non-deliverable currency forwards and structured notes. U.S. Treasury futures were used to manage U.S. interest rate duration. Eurodollar futures were used to express our views on the direction of interest rates and to facilitate specific duration and yield curve strategies. Eurodollar futures are contracts that have underlying assets linked to time deposits denominated in U.S. dollars at banks outside the U.S. Forward foreign currency exchange contracts were used for hedging purposes or to express a positive view on a given currency. Interest rate swaps were used to express our views on the direction of a country’s interest rates. Cross-currency swaps were employed to express relative value views on given currencies as well as our views on the direction of a country’s interest rates. Credit default swaps were used to implement specific credit-related investment strategies. Total return swaps and structured notes were used in place of buying a local currency denominated bond when a particular market was otherwise inaccessible or as a more efficient means of gaining access to a local market. Non-deliverable currency forwards were used to gain exposure to a particular country and also to take advantage of relative value opportunities. |
8
PORTFOLIO RESULTS
| | Derivatives may be used in combination with cash securities to implement our views in the Fund. |
| | During the Reporting Period, we used credit default swaps to gain exposure to Chinese external debt, which slightly detracted from performance. The Fund’s use of forward foreign currency exchange contracts as well as swaps to take a long position in the Mexican peso also had a negative impact on the Fund’s performance during the Reporting Period. In addition, we used interest rate swaps and total return swaps to gain access to the Colombia local debt market, positioning that detracted from performance. Another detractor was the Fund’s exposure to Brazil for which we used interest rate swaps, as well as sovereign local bonds. Conversely, the Fund’s positioning in the Brazilian real and Taiwan dollar, implemented via forward foreign exchange contracts, added to the Fund’s performance. |
| Q | | Were there any notable changes in the Fund’s weightings during the Reporting Period? |
| A | | During the Reporting Period, we increased the Fund’s already overweight positions in Indonesian and Colombian external debt because of what we considered to be attractive valuations. We believe Colombia’s strong policy framework could help the government facilitate economic and financial stability. In addition, during the Reporting Period, we increased the Fund’s underweight in Malaysian local interest rates, as the country faces, in our view, multiple challenges including depletion of its foreign exchange reserves, deterioration of its trade balance and political dynamics. In addition, as ongoing oil price weakness and fears about China’s slowing economic growth pressured emerging markets currencies, we reduced the Fund’s exposure to emerging markets currencies. |
| Q | | How was the Fund positioned relative to its benchmark index at the end of the Reporting Period? |
| A | | At the end of the Reporting Period, the Fund was overweight Indonesian and Colombian external debt and underweight Malaysian local interest rates. It held selective overweights in the corporate bonds of companies with what we considered to be solid balance sheets. Overall, we favored defensive non-cyclical companies, such as bottlers and certain telecommunications companies, which have comparable spreads to riskier cyclical names. The Fund also had an overweight position in the utilities sector due to the defensive nature of utilities companies, which typically generate strong, stable cash flows. It was underweight relative to the Index in financials based on our concerns about their limited disclosure regarding balance sheet asset quality, funding risks when banks rely on the wholesale funding markets as well as macro risks. Bank corporate debt also generally tends to be correlated with sovereign emerging markets debt. In terms of currencies, we maintained the Fund’s reduced exposure in emerging market currencies, with the Fund’s largest long position held in the Mexico peso and its largest short position held in the Chinese renminbi. |
| Q | | What is the Fund’s tactical view and strategy for the months ahead? |
| A | | At the end of the Reporting Period, the external debt markets had been shaken by the relentless volatility in the commodities markets and worries around China’s economic growth. In our view, China’s situation has grown increasingly complex, as numerous developments have sharpened concerns about the Chinese economy and the country’s policy direction. Looking ahead, we expect the Fed to raise interest rates either in December 2015 or early in 2016, with international headwinds such as low commodities prices and volatility in Asia skewing risks, in our view, toward a later hike. As the window for a potential Fed hike in 2015 gets smaller, we believe the external debt markets have already priced in policy tightening. Overall, we do not think a Fed rate increase will have much of an effect on how external debt trades. First, we believe any 2015 rate hike may be limited to a single increase, given that U.S. dollar strength, tighter financial conditions and downward inflationary pressures may temper the Fed’s willingness to move aggressively. Second, there has been widespread speculation about the exact timing of Fed action, which has, in our view, allowed market participants time to adjust their positioning. |
| | In terms of local emerging markets debt at the end of the Reporting Period, we recognized the environment was likely to remain challenging as a result of persistent U.S. dollar strength and overall emerging markets currency weakness, weaker emerging markets economic growth, commodities market volatility and idiosyncratic factors affecting individual countries. Although Fed monetary policy tightening might lead to an initial sell-off in local emerging markets debt, we believe the anticipated rate hikes have been well telegraphed and a gradual increase in U.S. interest rates is not likely, in our view, to be a problem over the long term. |
| | At the end of the Reporting Period, we had a cautious outlook on emerging markets corporate bonds given challenging operating conditions, including low commodities prices and currency fluctuations. That said, we continued to see opportunities and have a positive view on names with less leverage and more attractive valuations than comparable developed market companies. In our view, emerging markets corporate balance sheets remain robust, with limited near-term rollover needs, though liquidity in emerging markets corporate debt is generally below that of emerging markets sovereign debt. |
9
FUND BASICS
Dynamic Emerging Markets Debt Fund
as of September 30, 2015
| | | | | | | | | | | | | | | | | | | | | | | | | | | | | | |
| | PERFORMANCE REVIEW | |
| | | April 1, 2015–
September 30,
2015 | | Fund
Total
Return
(based
on NAV)1 | | | Dynamic
Emerging
Markets
Debt Fund
Composite
Index2 | | | J.P. Morgan
EMBISM
Global
Diversified
Index3 | | | J.P. Morgan
GBI-EMSM
Global
Diversified
Index4 | | | J.P. Morgan
CEMBISM
Broad
Diversified
Index5 | | | 30-Day
Standardized
Subsidized
Yield6 | | | 30-Day
Standardized
Unsubsidized
Yield6 | |
| | Class A | | | -6.69 | % | | | -6.66 | % | | | -2.04 | % | | | -11.40 | % | | | -1.48 | % | | | 4.22 | % | | | 2.28 | % |
| | Class C | | | -7.13 | | | | -6.66 | | | | -2.04 | | | | -11.40 | | | | -1.48 | | | | 3.61 | | | | 1.59 | |
| | Institutional | | | -6.62 | | | | -6.66 | | | | -2.04 | | | | -11.40 | | | | -1.48 | | | | 4.68 | | | | 2.66 | |
| | Class IR | | | -6.68 | | | | -6.66 | | | | -2.04 | | | | -11.40 | | | | -1.48 | | | | 4.54 | | | | 2.51 | |
| | | Class R | | | -6.90 | | | | -6.66 | | | | -2.04 | | | | -11.40 | | | | -1.48 | | | | 4.54 | | | | 2.51 | |
| | 1 | | The net asset value (“NAV”) represents the net assets of the class of the Fund (ex-dividend) divided by the total number of shares of the class outstanding. The Fund’s performance assumes the reinvestment of dividends and other distributions. The Fund’s performance does not reflect the deduction of any applicable sales charges. |
| | 2 | | The Dynamic Emerging Markets Debt Fund Composite Index is comprised of the J.P. Morgan GBI-EMSM Global Diversified Index (50%), the J.P. Morgan EMBISM Global Diversified Index (25%), and the J.P. Morgan CEMBISM Broad Diversified Index (25%). The index figures do not reflect any deduction for fees, expenses or taxes. It is not possible to invest directly in an index. |
| | 3 | | The J.P. Morgan EMBISM Global Diversified Index is an unmanaged index of debt instruments of 50 emerging countries. The Index figures do not reflect any deduction for fees, expenses or taxes. It is not possible to invest directly in an index. |
| | 4 | | The J.P. Morgan GBI-EMSM Global Diversified Index (with dividends reinvested) is an unmanaged index of debt instruments of 14 emerging countries. The Index figures do not reflect any deduction for fees, expenses or taxes. It is not possible to invest directly in an index. |
| | 5 | | The J.P. Morgan CEMBISM Broad Diversified Index tracks total returns of U.S. dollar-denominated debt instruments issued by corporate entities in emerging markets countries. The Index figures do not reflect any deduction for fees, expenses or taxes. It is not possible to invest directly in an index. |
| | 6 | | The method of calculation of the 30-Day Standardized Subsidized Yield is mandated by the Securities and Exchange Commission and is determined by dividing the net investment income per share earned during the last 30 days of the period by the maximum public offering price (“POP”) per share on the last day of the period. This number is then annualized. The 30-Day Standardized Subsidized Yield reflects fee waivers and/or expense reimbursements recorded by the Fund during the period. Without waivers and/or reimbursements, yields would be reduced. This yield does not necessarily reflect income actually earned and distributed by the Fund and, therefore, may not be correlated with the dividends or other distributions paid to shareholders. The 30-Day Standardized Unsubsidized Yield does not adjust for any fee waivers and/or expense reimbursements in effect. If the Fund does not incur any fee waivers and/or expense reimbursements during the period, the 30-Day Standardized Subsidized Yield and 30-Day Standardized Unsubsidized Yield will be identical. |
10
FUND BASICS
| | | | | | | | | | | | | | |
| | STANDARDIZED TOTAL RETURNS7 | |
| | | For the period ended 9/30/15 | | One Year | | | Since Inception | | | Inception Date | |
| | Class A | | | -16.20 | % | | | -7.87 | % | | | 5/31/13 | |
| | Class C | | | -13.83 | | | | -6.63 | | | | 5/31/13 | |
| | Institutional | | | -12.00 | | | | -5.63 | | | | 5/31/13 | |
| | Class IR | | | -12.11 | | | | -5.83 | | | | 5/31/13 | |
| | | Class R | | | -12.53 | | | | -6.18 | | | | 5/31/13 | |
| | 7 | | The Standardized Total Returns are average annual total returns or cumulative total returns (only if the performance period is one year or less) as of the most recent calendar quarter-end. They assume reinvestment of all distributions at NAV. These returns reflect a maximum initial sales charge of 4.50% for Class A Shares and the assumed contingent deferred sales charge for Class C Shares (1% if redeemed within 12 months of purchase). Because Institutional, Class IR and Class R Shares do not involve a sales charge, such a charge is not applied to their Standardized Total Returns. The Fund will charge a 2% redemption fee on the redemption of shares (including by exchange) held for 30 calendar days or less. The performance figures do not reflect the deduction of the redemption fee. If reflected, the redemption fee would reduce the performance quoted. |
The returns set forth in the tables above represent past performance. Past performance does not guarantee future results. The Fund’s investment return and principal value will fluctuate so that an investor’s shares, when redeemed, may be worth more or less than their original cost. Current performance may be lower or higher than the performance quoted above. Please visit our web site at www.GSAMFUNDS.com to obtain the most recent month-end returns. Performance reflects applicable fee waivers and/or expense limitations in effect during the periods shown. In their absence, performance would be reduced. Returns do not reflect the deduction of taxes that a shareholder would pay on Fund distributions or the redemption of Fund shares.
11
FUND BASICS
| | | | | | | | | | |
| | EXPENSE RATIOS8 | |
| | | | | Net Expense Ratio
(Current) | | | Gross Expense Ratio
(Before Waivers) | |
| | Class A | | | 1.24 | % | | | 3.45 | % |
| | Class C | | | 1.99 | | | | 3.66 | |
| | Institutional | | | 0.90 | | | | 2.57 | |
| | Class IR | | | 1.00 | | | | 2.77 | |
| | | Class R | | | 1.49 | | | | 3.27 | |
| | 8 | | The expense ratios of the Fund, both current (net of applicable fee waivers and/or expense limitations) and before waivers (gross of applicable fee waivers and/or expense limitations) are as set forth above according to the most recent publicly available Prospectus for the Fund and may differ from the expense ratios disclosed in the Financial Highlights in this report. Pursuant to a contractual arrangement, the Fund’s waivers and/or expense limitations will remain in place through at least July 29, 2016, and prior to such date the Investment Adviser may not terminate the arrangements without the approval of the Fund’s Board of Trustees. If these arrangements are discontinued in the future, the expense ratios may change without shareholder approval. |
| | | | | | | | | | |
| | TOP TEN COUNTRY ALLOCATION9 | |
| | | | | Percentage of Net Assets | |
| | | | | as of 9/30/15 | | | as of 3/31/15 | |
| | Mexico | | | 13.3 | % | | | 10.4 | % |
| | Colombia | | | 6.9 | | | | 4.2 | |
| | Turkey | | | 5.7 | | | | 6.4 | |
| | Indonesia | | | 5.6 | | | | 6.2 | |
| | Brazil | | | 5.6 | | | | 7.9 | |
| | South Africa | | | 4.7 | | | | 2.6 | |
| | United States | | | 4.4 | | | | 5.9 | |
| | Poland | | | 3.9 | | | | 2.3 | |
| | Russia | | | 3.5 | | | | 2.5 | |
| | Thailand | | | 2.8 | | | | 3.8 | |
| | | Other | | | 44.9 | | | | 51.2 | |
| | 9 | | The percentage shown for each investment category reflects the value of investments in that country as a percentage of net assets. The table does not include repurchase agreements of 16.2% as of 9/30/15 and 9.8% as of 3/31/15. The table depicts the Fund’s investments but may not represent the Fund’s market exposure due to the exclusion of certain derivatives, if any, as listed in the Additional Investment Information section of the Schedule of Investments. |
12
PORTFOLIO RESULTS
Goldman Sachs Emerging Markets Debt Fund
Investment Objective
The Fund seeks a high level of total return consisting of income and capital appreciation.
Portfolio Management Discussion and Analysis
Below, the Goldman Sachs Global Fixed Income Investment Management Team discusses the Goldman Sachs Emerging Markets Debt Fund’s (the “Fund”) performance and positioning for the six-month period ended September 30, 2015 (the “Reporting Period”).
| Q | | How did the Fund perform during the Reporting Period? |
| A | | During the Reporting Period, the Fund’s Class A, C, Institutional and IR Shares generated cumulative total returns, without sales charges, of -1.60%, -1.97%, -1.43% and -1.47%, respectively. These returns compare to the -2.04% cumulative total return of the Fund’s benchmark, the J.P. Morgan Emerging Markets Bond Index (EMBISM) Global Diversified (Gross, USD, Unhedged) Index (the “Index”), during the same time period. |
| | During the period since their inception on July 31, 2015 through September 30, 2015, the Fund’s Class R6 Shares generated a cumulative total return, without sales charges, of -1.71% compared to the -2.19% cumulative total return of the Index. |
| Q | | What economic and market factors most influenced emerging markets debt as a whole during the Reporting Period? |
| A | | When the Reporting Period began during the second quarter of 2015, external emerging markets debt recorded a small decline, with Argentina, Uruguay and Peru posting the weakest results in the Index. External emerging markets debt also retreated during the third calendar quarter, led by declines in Ecuador, Zambia, and Iraq. |
| | For the Reporting Period overall, external emerging markets debt, as represented by the Index, returned -2.04%. Sovereign spreads (that is, the difference in yields between external emerging markets debt and U.S. Treasuries) widened by approximately 65 basis points to close the Reporting Period 433 basis points wider than U.S. Treasury securities. (A basis point is 1/100th of a percentage point.) The weakest performing emerging external debt markets during the Reporting Period, as represented by the Index, were (in U.S. dollar terms1) Zambia (-21.06%), Iraq (-13.97%) and Brazil (-9.76%). The top performing emerging external debt markets were Ukraine (+104.98%), Belarus (+14.48%) and Russia (+6.32%). |
| Q | | What key factors were responsible for the Fund’s performance during the Reporting Period? |
| A | | During the Reporting Period, the Fund benefited from country and issue selection of external emerging markets bonds. Issue selection among emerging markets corporate bonds also added to relative returns. In addition, the Fund’s performance was enhanced by our active currency management through which the Fund takes positions in local currencies (accomplished through the use of forward foreign currency exchange contracts as well as bonds denominated in local currencies). |
| | Conversely, the Fund was hurt by sector positioning in external emerging markets debt and emerging markets corporate bonds. Our U.S. duration and yield curve strategy also detracted from relative results. Duration is a measure of the Fund’s sensitivity to changes in interest rates. Yield curve indicates a spectrum of maturities. |
| Q | | Which segments of emerging markets debt most significantly affected Fund performance? |
| A | | During the Reporting Period, the Fund benefited from its tactical trading of Venezuelan external debt. While we remain concerned about the country’s deteriorating fundamentals, we took advantage of opportunities to add to the Fund’s overweight position relative to the Index. An overweight in Dominican Republic external debt also added to relative results. In our view, the Dominican Republic’s current account has improved due to lower oil prices, and its economy is growing at a strong pace. In addition, the government has made significant fiscal reforms, with a focus on tax increases and capital expenditures. The repayment of |
| 1 | | All regional and market returns are in U.S. dollar terms (unless otherwise specified), are based on country-specific stock market indices and reflect the reinvestment of any dividends if applicable. |
13
PORTFOLIO RESULTS
| | the Dominican Republic’s Petrocaribe debt to Venezuela was a positive development, as it enabled the Dominican Republic to reduce its external debt burden. The Fund’s underweight position in Peruvian external debt also contributed positively during the Reporting Period. Investors appeared to have concerns about Peru’s interventions in the foreign exchange market and about the impact of commodities-related weakness. Peru is a large exporter of commodities to China. |
| | The Fund was hurt during the Reporting Period by its underweight relative to the Index in Argentinian external debt. The Fund was underweight based on our belief that Argentina’s macroeconomic conditions are deteriorating, policy making has been weak, government expenditures have been increasing and uncertainty remains regarding negotiations with holdout creditors in a sovereign debt restructuring. However, Argentinian external debt advanced on positive momentum in economic activity as well as on optimism that the successor to current President Christina Fernández de Kirchner would be friendlier to business. The Fund was also hampered by its underweight in Lebanese external debt, which performed well. We continue to believe the country has weak credit fundamentals and is reliant on external funding. In addition, the Fund’s position in the Mexican peso (accomplished through the use of forward foreign currency exchange contracts) detracted from relative performance. The Mexican peso depreciated against the U.S. dollar amid overall emerging markets currency weakness. We believe that Mexico remains closely tied to the U.S. economy and may therefore benefit should U.S. economic growth continue to improve. |
| Q | | Did the Fund’s duration and yield curve positioning strategy help or hurt its results during the Reporting Period? |
| A | | The Fund’s U.S. duration and yield curve positioning detracted from relative returns. For most of the Reporting Period, we tactically shifted the Fund’s duration position on the U.S. Treasury yield curve between a slightly short duration position and a slightly long duration position, ending the Reporting Period with a slightly long duration position. We made these tactical shifts because we believed the Federal Reserve (the “Fed”) might be inclined to hike interest rates in the near term because of strong U.S. economic data but also thought the Fed might stay on hold because of global factors, such as low commodities prices and volatility in the Asian financial markets. The Fund’s duration positioning detracted slightly from performance during the Reporting Period, as U.S. government yields broadly rose on stronger U.S. economic data and market expectations that the Fed would increase interest rates in 2015. |
| Q | | How did the Fund use derivatives and similar instruments during the Reporting Period? |
| A | | The Fund invested in U.S. Treasury futures, Eurodollar futures, forward foreign currency exchange contracts, interest rate swaps, credit default swaps, non-deliverable currency forwards and structured notes. U.S. Treasury futures were used to manage U.S. interest rate duration. Eurodollar futures were used to express our views on the direction of interest rates and to facilitate specific duration and yield curve strategies. Eurodollar futures are contracts that have underlying assets linked to time deposits denominated in U.S. dollars at banks outside the U.S. Forward foreign currency exchange contracts were used for hedging purposes or to express a positive view on a given currency. Interest rate swaps were used to express our views on the direction of a country’s interest rates. Credit default swaps and structured notes were used in place of buying a local currency denominated bond when a particular market was otherwise inaccessible or as a more efficient means of gaining access to a local market. Non-deliverable currency forwards were used to gain exposure to a particular country. Derivatives may be used in combination with cash securities to implement our views in the Fund. |
| | During the Reporting Period, we used credit default swaps to gain exposure to Chinese external debt, which slightly detracted from performance. In addition, the Fund’s use of forward foreign currency exchange contracts as well as swaps to take a long position in the Mexican peso had a negative impact on the Fund’s performance during the Reporting Period. |
| Q | | Were there any notable changes in the Fund’s weightings during the Reporting Period? |
| A | | During the Reporting Period, we increased the Fund’s overweight relative to the Index in Mexican external debt. We shifted the Fund from an underweight in Colombian external debt to an overweight position. In addition, during the Reporting Period, we increased the Fund’s underweight in Chinese external debt. We also increased the Fund’s underweight compared to the Index in Peruvian external debt. |
14
PORTFOLIO RESULTS
| Q | | How was the Fund positioned relative to its benchmark index at the end of the Reporting Period? |
| A | | Overall, at the end of the Reporting Period, the Fund was positioned to capitalize on the theme of developed markets economic growth and monetary policy divergence, given that continued easing from the European Central Bank (“ECB”) and Bank of Japan contrasts with expectations of higher interest rates from the Fed. Against the backdrop of the ECB’s significant quantitative easing program, some Eastern European external debt, such as Croatian external bonds, appeared to us to be attractive on a relative basis. At the end of the Reporting Period, the Fund was overweight relative to the Index in Croatian external bonds due largely to what we consider to be Croatia’s improving macroeconomic dynamics and reform agendas. It was also overweight Dominican Republic and Colombian external debt. We believe the Dominican Republic’s government has implemented significant fiscal reforms and reduced its fiscal deficit. We believe lower energy prices should further benefit the country’s current account. We expect monetary policy divergence to have an impact on countries within the immediate sphere of the U.S., the Eurozone and Japan. Accordingly, the Fund had a long position in the Mexican peso at the end of the Reporting Period. |
| | Looking ahead, we expect the markets to scrutinize the agendas of incoming administrations. Therefore, at the end of the Reporting Period, the Fund was positioned with an overweight in Indonesian external debt and an underweight in Turkish external debt. In Turkey, geopolitics and domestic politics continue to cloud the country’s outlook. Widely-held concerns remain that ongoing uncertainties could delay the completion of economic policies aimed at reducing external vulnerabilities, improving the investment climate and reactivating economic growth. At the same time, the Fund maintained an underweight in Malaysian external debt, as we remain concerned about depletion of the country’s foreign exchange reserves, deterioration of its trade balance and challenging political dynamics within the country. |
| | Finally, we retained our focus at the end of the Reporting Period on seeking the cheapest valuations. We believe Venezuelan external bond prices imply a material probability of restructuring, as they hover close to their all-time lows. In our view, Venezuelan external bonds offered the possibility of significant recovery, and we believed the country would find a way to avoid default. At the end of the Reporting Period, the Fund held an overweight position relative to the Index in Venezuelan external debt. |
| Q | | What is the Fund’s tactical view and strategy for the months ahead? |
| A | | At the end of the Reporting Period, the external debt markets had been shaken by the relentless volatility in the commodities markets and worries around China’s economic growth. In our view, China’s situation has grown increasingly complex, as numerous developments have sharpened concerns about the Chinese economy and the country’s policy direction. |
| | Looking ahead, we expect the Fed to raise interest rates either in December 2015 or early in 2016, with international headwinds, such as low commodities prices and volatility in Asia skewing risks, in our view, toward a later hike. As the window for a potential Fed hike in 2015 gets smaller, we believe the external debt markets have already priced in policy tightening. Overall, we do not think a Fed rate increase will have much of an effect on how external debt trades. First, we believe any 2015 rate hike may be limited to a single increase, given that U.S. dollar strength, tighter financial conditions and downward inflationary pressures may temper the Fed’s willingness to move aggressively. Second, there has been widespread speculation about the exact timing of Fed action, which has, in our view, allowed market participants time to adjust their positioning. In the near term, we believe bond pickers are likely to be rewarded, with continued dispersion of returns among countries. |
15
FUND BASICS
Emerging Markets Debt Fund
as of September 30, 2015
| | | | | | | | | | | | | | | | | | |
| | PERFORMANCE REVIEW | |
| | | April 1, 2015– September 30, 2015 | | Fund Total Return
(based on NAV)1 | | | J.P. Morgan
EMBISM Global
Diversified Index2 | | | 30-Day
Standardized
Subsidized Yield3 | | | 30-Day
Standardized
Unsubsidized Yield3 | |
| | Class A | | | -1.60 | % | | | -2.04 | % | | | 4.92 | % | | | 4.87 | % |
| | Class C | | | -1.97 | | | | -2.04 | | | | 4.39 | | | | 4.34 | |
| | Institutional | | | -1.43 | | | | -2.04 | | | | 5.50 | | | | 5.45 | |
| | | Class IR | | | -1.47 | | | | -2.04 | | | | 5.41 | | | | 5.36 | |
| | | | | | | | | | | | | | | | | | | |
| | | July 31, 2015– September 30, 2015 | | Fund Total Return
(based on NAV)1 | | | J.P. Morgan
EMBISM Global
Diversified Index2 | | | 30-Day
Standardized
Subsidized Yield3 | | | 30-Day
Standardized
Unsubsidized Yield3 | |
| | | Class R6 | | | -1.71 | % | | | -2.19 | % | | | 5.39 | % | | | 5.34 | % |
| | 1 | | The net asset value (“NAV”) represents the net assets of the class of the Fund (ex-dividend) divided by the total number of shares of the class outstanding. The Fund’s performance assumes the reinvestment of dividends and other distributions. The Fund’s performance does not reflect the deduction of any applicable sales charges. |
| | 2 | | The J.P. Morgan Emerging Markets Bond Index (EMBISM) Global Diversified (Gross, USD, Unhedged) Index is an unmanaged index of debt instruments of 50 emerging countries. The Index figures do not reflect any deduction for fees, expenses or taxes. It is not possible to invest directly in an index. |
| | 3 | | The method of calculation of the 30-Day Standardized Subsidized Yield is mandated by the Securities and Exchange Commission and is determined by dividing the net investment income per share earned during the last 30 days of the period by the maximum public offering price (“POP”) per share on the last day of the period. This number is then annualized. The 30-Day Standardized Subsidized Yield reflects fee waivers and/or expense reimbursements recorded by the Fund during the period. Without waivers and/or reimbursements, yields would be reduced. This yield does not necessarily reflect income actually earned and distributed by the Fund and, therefore, may not be correlated with the dividends or other distributions paid to shareholders. The 30-Day Standardized Unsubsidized Yield does not adjust for any fee waivers and/or expense reimbursements in effect. If the Fund does not incur any fee waivers and/or expense reimbursements during the period, the 30-Day Standardized Subsidized Yield and 30-Day Standardized Unsubsidized Yield will be identical. |
16
FUND BASICS
| | | | | | | | | | | | | | | | | | | | | | |
| | STANDARDIZED TOTAL RETURNS4 | | | | | |
| | | For the period ended 9/30/15 | | One Year | | | Five Years | | | Ten Years | | | Since Inception | | | Inception Date | |
| | Class A | | | -6.58 | % | | | 3.30 | % | | | 6.15 | % | | | 8.18 | % | | | 8/29/03 | |
| | Class C | | | -3.85 | | | | 3.51 | | | | N/A | | | | 5.81 | | | | 9/29/06 | |
| | Institutional | | | -1.81 | | | | 4.63 | | | | 7.02 | | | | 8.99 | | | | 8/29/03 | |
| | Class IR | | | -1.90 | | | | 4.53 | | | | N/A | | | | 5.26 | | | | 7/30/10 | |
| | | Class R6 | | | N/A | | | | N/A | | | | N/A | | | | -1.71 | | | | 7/31/15 | |
| | 4 | | The Standardized Total Returns are average annual total returns or cumulative total returns (only if the performance period is one year or less) as of the most recent calendar quarter-end. They assume reinvestment of all distributions at NAV. These returns reflect a maximum initial sales charge of 4.5% for Class A Shares and the assumed contingent deferred sales charge for Class C Shares (1% if redeemed within 12 months of purchase). Because Institutional, Class IR and Class R6 Shares do not involve a sales charge, such a charge is not applied to their Standardized Total Returns. The Fund will charge a 2% redemption fee on the redemption of shares (including by exchange) held for 30 calendar days or less. The performance figures do not reflect the deduction of the redemption fee. If reflected, the redemption fee would reduce the performance quoted. |
The returns set forth in the tables above represent past performance. Past performance does not guarantee future results. The Fund’s investment return and principal value will fluctuate so that an investor’s shares, when redeemed, may be worth more or less than their original cost. Current performance may be lower or higher than the performance quoted above. Please visit our web site at www.GSAMFUNDS.com to obtain the most recent month-end returns. Performance reflects applicable fee waivers and/or expense limitations in effect during the periods shown. In their absence, performance would be reduced. Returns do not reflect the deduction of taxes that a shareholder would pay on Fund distributions or the redemption of Fund shares.
| | | | | | | | | | |
| | EXPENSE RATIOS5 | | | | | | | | |
| | | | | Net Expense Ratio
(Current) | | | Gross Expense Ratio
(Before Waivers) | |
| | Class A | | | 1.24 | % | | | 1.25 | % |
| | Class C | | | 1.99 | | | | 2.00 | |
| | Institutional | | | 0.90 | | | | 0.91 | |
| | Class IR | | | 0.99 | | | | 1.00 | |
| | | Class R6 | | | 0.88 | | | | 0.89 | |
| | 5 | | The expense ratios of the Fund, both current (net of applicable fee waivers and/or expense limitations) and before waivers (gross of applicable fee waivers and/or expense limitations) are as set forth above according to the most recent publicly available Prospectus for the Fund and may differ from the expense ratios disclosed in the Financial Highlights in this report. Pursuant to a contractual arrangement, the Fund’s waivers and/or expense limitations will remain in place through at least July 29, 2016, and prior to such date the Investment Adviser may not terminate the arrangements without the approval of the Fund’s Board of Trustees. If these arrangements are discontinued in the future, the expense ratios may change without shareholder approval. |
17
FUND BASICS
| | | | | | | | | | |
| | TOP TEN COUNTRY ALLOCATION6 | | | | | | | | |
| | | | | Percentage of Net Assets | |
| | | | | as of 9/30/15 | | | as of 3/31/15 | |
| | Mexico | | | 9.1 | % | | | 5.1 | % |
| | Croatia | | | 6.1 | | | | 5.9 | |
| | Dominican Republic | | | 5.8 | | | | 5.3 | |
| | United States | | | 6.4 | | | | 14.7 | |
| | Indonesia | | | 5.2 | | | | 3.4 | |
| | Hungary | | | 4.3 | | | | 0.6 | |
| | Brazil | | | 4.1 | | | | 3.7 | |
| | Chile | | | 4.0 | | | | 3.8 | |
| | Colombia | | | 4.0 | | | | 2.5 | |
| | Venezuela | | | 3.9 | | | | 3.4 | |
| | | Other | | | 47.6 | | | | 55.0 | |
| | 6 | | The percentage shown for each investment category reflects the value of investments in that country as a percentage of net assets. The table does not include repurchase agreements of 0.3% as of 9/30/15 and 1.0% as of 3/31/15. The table depicts the Fund’s investments but may not represent the Fund’s market exposure due to the exclusion of certain derivatives, if any, as listed in the Additional Investment Information section of the Schedule of Investments. |
18
PORTFOLIO RESULTS
Goldman Sachs High Yield Fund
Investment Objective
The Fund seeks a high level of current income and may also consider the potential for capital appreciation.
Portfolio Management Discussion and Analysis
Below, the Goldman Sachs High Yield Fixed Income Investment Management Team discusses the Goldman Sachs High Yield Fund’s (the “Fund”) performance and positioning the six-month period ended September 30, 2015 (the “Reporting Period”).
| Q | | How did the Fund perform during the Reporting Period? |
| A | | During the Reporting Period, the Fund’s Class A, C, Institutional, Service, IR and R Shares generated cumulative total returns, without sales charges, of -5.39%, -5.73%, -5.21%, -5.33%, -5.26%, and -5.51%, respectively. These returns compare to the -4.82% cumulative total return of the Fund’s benchmark, the Barclays U.S. High Yield, 2% Issuer Capped Bond Index (the “Index”), during the same time period. |
| | During the period since their inception on July 31, 2015 through September 30, 2015, the Fund’s Class R6 Shares generated a cumulative total return, without sales charges, of -4.50% compared to the -4.28% cumulative total return of the Index. |
| Q | | What economic and market factors most influenced the high yield corporate bond market as a whole during the Reporting Period? |
| A | | During the second quarter of 2015, when the Reporting Period started, high yield corporate bond prices fell. After generating robust positive returns during April and May 2015, they retreated in June 2015, as volatility increased and geopolitical concerns resurfaced. High yield corporate bond prices also declined during the third calendar quarter, as global growth concerns, sector-specific issues and a sharp drop in commodities prices fueled uncertainty and drove higher levels of volatility. |
| | For the Reporting Period overall, BB-rated credits outperformed B-rated credits and lower quality credits. Option adjusted spreads widened approximately 165 basis points, ending the Reporting Period at 630 basis points. (The option adjusted spread is a measurement tool for evaluating price differences between similar products with different embedded options. A basis point is 1/100th of a percentage point.) High yield corporate bonds underperformed high yield loans, as represented by the Barclays U.S. High-Yield Loan Index. |
| | In terms of issuance, approximately $95.5 billion of new high yield corporate bonds were priced during the second quarter of 2015, with refinancing the primary use of the proceeds. In the third calendar quarter, approximately $59.7 billion of new high yield corporate bonds came to market, a quarter-over-quarter decline of 38% and the lowest quarterly total since the second quarter of 2012 when approximately $54.7 billion were priced. The proceeds during the third calendar quarter were used for both refinancing and acquisition financing. |
| | Demand was weak during the Reporting Period, with high yield corporate bond mutual funds experiencing approximately $15.8 billion of investment outflows. The default rate for high yield corporate bonds remained low in historical terms, helped by healthier corporate balance sheets. For the Reporting Period overall, there were 15 defaults among high yield issuers, primarily in the energy and coal sectors, which affected approximately $16.4 billion in high yield corporate bonds. The 12-month par-weighted default high yield corporate bond rate through September 30, 2015 was 2.29%. |
| Q | | What key factors were responsible for the Fund’s performance during the Reporting Period? |
| A | | The Fund was hurt by its overweight position relative to the Index in short duration spread credits (less than four years) and its overweight in intermediate spread duration credits (between four and nine years), as option adjusted spreads widened during the Reporting Period. (Spread duration represents the price sensitivity of a high yield corporate bond |
19
PORTFOLIO RESULTS
| | to a change in spreads.) In addition, the Fund’s performance was hampered by its overall credit quality positioning. Individual issue selection also dampened relative returns. |
| | The Fund’s duration positioning added slightly to its relative results during the Reporting Period. (Duration is a measure of a portfolio’s sensitivity to changes in interest rates.) The Fund’s duration strategy is primarily implemented via interest rate swaps and/or futures. Sector positioning also added modestly to the Fund’s relative returns during the Reporting Period. |
| Q | | Which segments within high yield most significantly affected Fund performance? |
| A | | The Fund’s underweight relative to the Index in BB-rated credits detracted from relative performance, as BB-rated credits outperformed during the Reporting Period. The Fund was also hurt by its overweight in non-rated credits. Conversely, an overweight in high yield loans and BBB-rated credits added to relative returns. |
| | In terms of sector positioning, the Fund benefited from an underweight relative to the Index in metals and mining and an overweight in building materials. It was hindered by an overweight in cellular telecommunications and an underweight in food and drug retailers. |
| | With regard to individual issue selection, Fund performance was dampened by overweight positions in Intelsat, a communications satellite services provider; Sprint Communications, a telecommunications company; and Peabody Energy, a coal mining company. The Fund’s lack of exposure to Energy XXI Gulf Coast, California Resources and SandRidge Energy — all oil and natural gas producers — added to relative results. |
| Q | | Did the Fund’s duration and yield curve positioning strategy help or hurt its results during the Reporting Period? |
| A | | During the Reporting Period, the Fund’s duration and yield curve positioning somewhat bolstered its performance versus the Index. More specifically, the Fund slightly benefited from its neutral duration positioning relative to the Index, which it held for most of the Reporting Period. |
| Q | | How did the Fund use derivatives and similar instruments during the Reporting Period? |
| A | | To hedge against currency risk (that is, the risk that certain currencies might fluctuate in value), the Fund employed forward foreign exchange currency contracts during the Reporting Period. Additionally, a specialized index of credit default swaps (CDX) was used to manage the beta of the Fund on an active basis. It was also used as a cost-efficient instrument to help manage the Fund’s cash position. We employ CDX contracts as a way to gain credit exposure by being short credit protection, when the Fund experiences significant cash inflows. The Fund used U.S. Treasury futures, Eurodollar futures and interest rate swaps to facilitate specific duration and yield curve strategies. Eurodollar futures are contracts that have underlying assets linked to time deposits denominated in U.S. dollars at banks outside the U.S. Derivatives may be used in combination with cash securities to implement our views in the Fund. |
| Q | | Were there any notable changes in the Fund’s weightings during the Reporting Period? |
| A | | During the Reporting Period, we increased the Fund’s allocation to high yield corporate bonds and high yield loans. We reduced its Fund’s allocation to B-rated high yield corporate bonds, while increasing its allocation to BB-rated high yield corporate bonds. In addition, we increased the Fund’s overweight in health care and decreased its allocation to non-cable media during the Reporting Period. |
| Q | | How was the Fund positioned relative to its benchmark index at the end of the Reporting Period? |
| A | | At the end of the Reporting Period, the Fund was overweight relative to the Index in certain cyclical sectors, such as consumer-related and real estate-related sectors, that we believe are experiencing healthy growth. The Fund was also overweight a number of defensive sectors, including cable, health care and utilities. It was underweight compared to the Index in cyclical sectors more sensitive to global growth worries, including technology and metals and mining. At the end of the Reporting Period, we favored B-rated and BB-rated credits and maintained the Fund’s modest exposure to CCC-rated credits. |
| Q | | What is the Fund’s tactical view and strategy for the months ahead? |
| A | | At the end of the Reporting Period, we had a positive, though cautious, outlook on high yield corporate bonds, as we considered European and U.S. corporate fundamentals healthy in most industries, except those negatively affected by low commodities prices. In our view, corporations are experiencing moderate earnings growth, and they have remained focused on cost controls and maintaining operating margins. We believe economic conditions in the U.S. are |
20
PORTFOLIO RESULTS
| | improving and are supportive of healthy earnings within domestic industries. In addition, nearly 80% of the U.S. high yield corporate bond market is represented by industries in which the negative impact of falling commodities prices is less certain or is a potential benefit, including those related to consumers, communications, electric utilities, food and real estate. At the end of the Reporting Period, we expected to see continued mergers and acquisitions activity and for corporate management to be willing to engage in shareholder friendly activities. |
| | We had a positive view on high yield loans at the end of the Reporting Period, as their lower yields compared to high yield corporate bonds was more than offset by their more defensive characteristics. |
| | Looking ahead, we see some downside risk potential, especially as we believe oil and gas prices are apt to remain lower for longer. Although the default rate on high yield corporate bonds remained low at the end of Reporting Period, we expect defaults to pick up, led by energy and metals and mining credits, with some contagion among distressed credits in other industries. That said, at the end of the Reporting Period, we saw some signs of stabilization in the oil markets, reflecting an improved balance between supply and demand. Additional near-term risks, in our view, may stem from macroeconomic or geopolitical developments, such as renewed weakness in Europe or an escalation in growth concerns about China. |
21
FUND BASICS
High Yield Fund
as of September 30, 2015
| | | | | | | | | | | | | | | | | | |
| | PERFORMANCE REVIEW | |
| | | April 1, 2015–
September 30, 2015 | | Fund Total Return
(based on NAV)1 | | | Barclays
U.S. High Yield 2%
Issuer Capped
Bond Index2 | | | 30-Day
Standardized
Subsidized Yield3 | | | 30-Day
Standardized
Unsubsidized Yield3 | |
| | Class A | | | -5.39 | % | | | -4.82 | % | | | 5.69 | % | | | 5.69 | % |
| | Class C | | | -5.73 | | | | -4.82 | | | | 5.18 | | | | 5.17 | |
| | Institutional | | | -5.21 | | | | -4.82 | | | | 6.30 | | | | 6.30 | |
| | Service | | | -5.33 | | | | -4.82 | | | | 5.79 | | | | 5.78 | |
| | Class IR | | | -5.26 | | | | -4.82 | | | | 6.22 | | | | 6.21 | |
| | | Class R | | | -5.51 | | | | -4.82 | | | | 5.70 | | | | 5.69 | |
| | | | | | | | | | | | | | | | | | | |
| | | July 31, 2015–
September 30, 2015 | | Fund Total Return
(based on NAV)1 | | | Barclays
U.S. High Yield 2%
Issuer Capped
Bond Index2 | | | 30-Day
Standardized
Subsidized Yield3 | | | 30-Day
Standardized
Unsubsidized Yield3 | |
| | | Class R6 | | | -4.50 | % | | | -4.28 | % | | | 6.21 | % | | | 6.21 | % |
| | 1 | | The net asset value (“NAV”) represents the net assets of the class of the Fund (ex-dividend) divided by the total number of shares of the class outstanding. The Fund’s performance assumes the reinvestment of dividends and other distributions. The Fund’s performance does not reflect the deduction of any applicable sales charges. |
| | 2 | | The Barclays U.S. High-Yield 2% Issuer Capped Bond Index, an unmanaged index, covers the universe of U.S. dollar denominated, non-convertible, fixed rate, non-investment grade debt. Index holdings must have at least one year to final maturity, at least $150 million par amount outstanding, and be publicly issued with a rating of Ba1 or lower. The Index figures do not reflect any deduction for fees, expenses or taxes. It is not possible to invest directly in an index. |
| | 3 | | The method of calculation of the 30-Day Standardized Subsidized Yield is mandated by the Securities and Exchange Commission and is determined by dividing the net investment income per share earned during the last 30 days of the period by the maximum public offering price (“POP”) per share on the last day of the period. This number is then annualized. The 30-Day Standardized Subsidized Yield reflects fee waivers and/or expense reimbursements recorded by the Fund during the period. Without waivers and/or reimbursements, yields would be reduced. This yield does not necessarily reflect income actually earned and distributed by the Fund and, therefore, may not be correlated with the dividends or other distributions paid to shareholders. The 30-Day Standardized Unsubsidized Yield does not adjust for any fee waivers and/or expense reimbursements in effect. If the Fund does not incur any fee waivers and/or expense reimbursements during the period, the 30-Day Standardized Subsidized Yield and 30-Day Standardized Unsubsidized Yield will be identical. |
The returns set forth in the table above represent past performance. Past performance does not guarantee future results. The Fund’s investment return and principal value will fluctuate so that an investor’s shares, when redeemed, may be worth more or less than their original cost. Current performance may be lower or higher than the performance quoted above. Please visit our web site at www.GSAMFUNDS.com to obtain the most recent month-end returns. Performance reflects applicable fee waivers and/or expense limitations in effect during the periods shown. In their absence, performance would be reduced. Returns do not reflect the deduction of taxes that a shareholder would pay on Fund distributions or the redemption of Fund shares.
22
FUND BASICS
| | | | | | | | | | | | | | | | | | | | |
| | STANDARDIZED TOTAL RETURNS4 |
| | | For the period ended 9/30/15 | | One Year | | | Five Years | | | Ten Years | | | Since Inception | | | Inception Date |
| | Class A | | | -8.28 | % | | | 4.32 | % | | | 5.31 | % | | | 5.83 | % | | 8/1/97 |
| | Class C | | | -5.62 | | | | 4.51 | | | | 5.01 | | | | 5.34 | | | 8/15/97 |
| | Institutional | | | -3.62 | | | | 5.65 | | | | 6.16 | | | | 6.49 | | | 8/1/97 |
| | Service | | | -4.12 | | | | 5.13 | | | | 5.64 | | | | 5.95 | | | 8/1/97 |
| | Class IR | | | -3.85 | | | | 5.56 | | | | N/A | | | | 5.97 | | | 11/30/07 |
| | Class R6 | | | N/A | | | | N/A | | | | N/A | | | | -4.50 | | | 7/31/15 |
| | | Class R | | | -4.21 | | | | 5.03 | | | | N/A | | | | 5.43 | | | 11/30/07 |
| | 4 | | The Standardized Total Returns are average annual total returns or cumulative total returns (only if the performance period is one year or less) as of the most recent calendar quarter-end. They assume reinvestment of all distributions at NAV. These returns reflect a maximum initial sales charge of 4.5% for Class A Shares and the assumed contingent deferred sales charge for Class C Shares (1% if redeemed within 12 months of purchase). Because Institutional, Service, Class IR, Class R and Class R6 Shares do not involve a sales charge, such a charge is not applied to their Standardized Total Returns. The Fund will charge a 2% redemption fee on the redemption of shares (including by exchange) held for 60 calendar days or less. The performance figures do not reflect the deduction of the redemption fee. If reflected, the redemption fee would reduce the performance quoted. |
The returns set forth in the table above represent past performance. Past performance does not guarantee future results. The Fund’s investment return and principal value will fluctuate so that an investor’s shares, when redeemed, may be worth more or less than their original cost. Current performance may be lower or higher than the performance quoted above. Please visit our web site at www.GSAMFUNDS.com to obtain the most recent month-end returns. Performance reflects applicable fee waivers and/or expense limitations in effect during the periods shown. In their absence, performance would be reduced. Returns do not reflect the deduction of taxes that a shareholder would pay on Fund distributions or the redemption of Fund shares.
| | | | | | | | | | |
| | EXPENSE RATIOS5 | |
| | | | | Net Expense Ratio
(Current) | | | Gross Expense Ratio
(Before Waivers) | |
| | Class A | | | 1.06 | % | | | 1.06 | % |
| | Class C | | | 1.81 | | | | 1.81 | |
| | Institutional | | | 0.72 | | | | 0.72 | |
| | Service | | | 1.22 | | | | 1.22 | |
| | Class IR | | | 0.81 | | | | 0.81 | |
| | Class R6 | | | 0.70 | | | | 0.70 | |
| | | Class R | | | 1.31 | | | | 1.31 | |
| | 5 | | The expense ratios of the Fund, both current (net of applicable fee waivers and/or expense limitations) and before waivers (gross of applicable fee waivers and/or expense limitations), are as set forth above according to the most recent publicly available Prospectus. |
23
FUND BASICS
| | | | | | | | |
| | TOP TEN ISSUERS AS OF 9/30/156 |
| | | Company | | % of
Net Assets | | | Line of Business |
| | HCA, Inc. | | | 1.2 | % | | Health Care – Services |
| | Sprint Corp. | | | 1.0 | | | Telecommunications – Cellular |
| | Reynolds Group Issuer, Inc. | | | 0.8 | | | Packaging |
| | Numericable – SFR SAS | | | 0.8 | | | Media – Cable |
| | MGM Resorts International | | | 0.7 | | | Gaming |
| | SoftBank Corp. | | | 0.7 | | | Telecommunications – Cellular |
| | BWAY Holding Co. | | | 0.7 | | | Packaging |
| | Schaeffler Finance BV | | | 0.6 | | | Automotive Parts |
| | Tenet Healthcare Corp. | | | 0.6 | | | Health Care – Services |
| | | HCA, Inc. | | | 0.6 | | | Health Care – Services |
| | 6 | | The top 10 issuers may not be representative of the Fund’s future investments. |
| | | | | | | | | | |
| | TOP TEN INDUSTRY ALLOCATION7 | |
| | | | | Percentage of Net Assets | |
| | | | | as of 9/30/15 | | | as of 3/31/15 | |
| | Telecommunications | | | 11.3 | % | | | 11.3 | % |
| | Health Care | | | 10.8 | | | | 8.9 | |
| | Energy | | | 9.1 | | | | 9.8 | |
| | Media | | | 8.9 | | | | 9.8 | |
| | Banks | | | 6.4 | | | | 3.5 | |
| | Finance | | | 5.7 | | | | 5.8 | |
| | Technology | | | 5.4 | | | | 6.1 | |
| | Retailers | | | 4.3 | | | | 3.4 | |
| | Gaming | | | 4.2 | | | | 4.1 | |
| | Consumer Products | | | 3.9 | | | | 5.2 | |
| | | Other | | | 31.0 | | | | 32.1 | |
| | 7 | | The percentage shown for each investment category reflects the value of investments in that category as a percentage of net assets. The table depicts the Fund’s investments but may not represent the Fund’s market exposure due to the exclusion of certain derivatives, if any, as listed in the Additional Investment Information section of the Schedule of Investments. |
24
PORTFOLIO RESULTS
Goldman Sachs High Yield Floating Rate Fund
Investment Objective
The Fund seeks a high level of current income.
Portfolio Management Discussion and Analysis
Below, the Goldman Sachs High Yield Fixed Income Investment Management Team discusses the Goldman Sachs High Yield Floating Rate Fund’s (the “Fund”) performance and positioning for the six-month period ended September 30, 2015 (the “Reporting Period”).
| Q | | How did the Fund perform during the Reporting Period? |
| A | | During the Reporting Period, the Fund’s Class A, C, Institutional, IR and R Shares generated cumulative total returns, without sales charges, of -0.98%, -1.35%, -0.80%, -0.85%, and -0.99%, respectively. These returns compare to the -0.86% cumulative total return of the Fund’s benchmark, the Barclays U.S. High-Yield Loans Index (the “Index”), during the same time period. |
| Q | | What economic and market factors most influenced the high yield floating rate loan market as a whole during the Reporting Period? |
| A | | High yield loans recorded a modest decline during the Reporting Period, with BB-rated credits outperforming B-rated credits and lower quality credits. High yield loan spreads (or yield differentials versus duration-equivalent U.S. Treasury securities) contracted by six basis points, ending the Reporting Period at 445 basis points. (A basis point is 1/100th of a percentage point.) |
| | The technical, or supply/demand, backdrop for high yield loans was challenging during the Reporting Period. In the second quarter of 2015, approximately $159 billion of new high yield loans were brought to market, the fourth highest quarterly total on record. In the third calendar quarter, however, new high yield loan issuance totaled approximately $58.7 billion, a 63% quarter-over-quarter decline. Meanwhile, high yield loan mutual funds experienced investment outflows of $7.8 billion for the Reporting Period overall. |
| | During the Reporting Period, the default rate for high yield loans remained below the historical average, helped by healthier corporate balance sheets. There were eight defaults among high yield loan issuers, predominantly in commodities-related sectors, affecting approximately $5.8 billion in high yield loans. The trailing 12-month default rate through September 30, 2015 was 1.51%. (All data per JPMorgan.) |
| Q | | What key factors were responsible for the Fund’s performance during the Reporting Period? |
| A | | During the Reporting Period, the Fund was hampered by its overall credit quality positioning relative to the Index. In addition, as high yield loan spreads narrowed, the Fund was hurt by an underweight in intermediate spread duration loans (between four and nine years). (Spread duration represents the price sensitivity of a high yield bond to a change in spreads.) |
| | Conversely, individual issue selection within the high yield loan market added slightly to relative returns. |
| Q | | Which segments of the high yield floating rate loan market significantly affected Fund performance? |
| A | | The Fund was hurt overall during the Reporting Period by its credit quality positioning, namely its overweight relative to the Index in CCC-rated loans. This was offset somewhat by the Fund’s overweight in BB-rated loans. An overweight in Canadian- and European-domiciled high yield loans contributed positively. |
| | Relative to sector positioning, the Fund’s underweight positions relative to the Index in energy and electric utilities added to relative returns. An overweight in cellular telecommunications and underweights in media cable and satellite television detracted from relative results. |
| | In terms of individual issue selection, the Fund benefited from its lack of exposure to TXU, an electric utility company; Millennium Laboratories, a research-based medication monitoring company; and Fieldwood Energy, which focuses on the acquisition and development of conventional oil and gas assets. Overweight positions in oil |
25
PORTFOLIO RESULTS
| | and natural gas company American Energy Marcellus; clothing company True Religion Apparel; and stock photo agency Getty Images detracted from relative performance. |
| Q | | Did the Fund’s duration and yield curve positioning strategy help or hurt its results during the Reporting Period? |
| A | | During the Reporting Period, the Fund’s duration and yield curve positioning did not have a meaningful impact on performance. The Fund’s duration strategy is primarily implemented via interest rate swaps and/or futures. Derivatives are used in combination with cash securities to implement our views in the Fund. |
| Q | | How did the Fund use derivatives and similar instruments during the Reporting Period? |
A To hedge against currency risk (that is, the risk that certain currencies might fluctuate in value), the Fund employed forward foreign exchange currency contracts during the Reporting Period. The Fund also employed interest rate swaps as a cost-efficient instrument to provide us with greater precision and versatility in the management of duration. Interest rate swaps were only utilized in the Fund for the purpose of hedging duration, as the Fund does not take active duration and yield curve positions. Additionally, a specialized index of credit default swaps (CDX) was used to manage the beta of the Fund on an active basis. It was also used as a cost-efficient instrument to help manage the Fund’s cash position. We employ CDX contracts as a way to gain credit exposure by being short credit protection, when the Fund experiences significant cash inflows. Derivatives may be used in combination with cash securities to implement our views in the Fund.
| Q | | Were there any notable changes in the Fund’s weightings during the Reporting Period? |
| A | | During the Reporting Period, we increased the Fund’s allocation to high yield loans and high yield corporate bonds. We reduced its allocation to CCC-rated high yield loans and high yield corporate bonds. At the same time, we increased its allocation to B-rated high yield loans and high yield corporate bonds. In addition, we increased the Fund’s overweight in health care while decreasing its allocation to non-cable media. |
| Q | | How was the Fund positioned relative to its benchmark index at the end of the Reporting Period? |
| A | | At the end of the Reporting Period, the Fund was overweight relative to the Index in sectors widely considered as defensive, including food and beverage as well as health care. In addition, the Fund was overweight sectors such as transportation and also retail and apparel because we believe they are among the beneficiaries of lower commodities prices. In addition, the Fund was overweight in the building materials sector at the end of the Reporting Period. It was underweight compared to the Index in what we consider weaker sectors, such as metals and mining and energy. |
| Q | | What is the Fund’s tactical view and strategy for the months ahead? |
| A | | At the end of the Reporting Period, we maintained a positive view on the high yield loan market because we believed spreads offered compensation for the potential of credit defaults. In the near term, we expect returns to be disproportionately driven by current income, as they have been historically, although we see some potential for capital appreciation. Overall, we believed the high yield loan market would continue to benefit from improving U.S. economic conditions; default rates that remain relatively low and below historical averages; the supportive issuance of structured securities, such as collateralized loan obligations, which remain a consistent source of demand; and modest primary market issuance. |
| | That said, we acknowledge a number of risks. These include the potential for increased market volatility and greater required risk premiums; the high yield loan market displaying little forbearance for poorly performing credits with steepening credit curves and providing little support for distressed credits; and the low likelihood that the high yield loan market will completely decouple from energy-related volatility in the high yield corporate bond market. |
| | Relative to our positioning, we intend to continue to be vigilant in credit selection, with a focus on higher quality, higher performing non-investment grade high yield loans. As always, most of the Fund’s investments will be concentrated in higher quality issues — more specifically, on first lien, senior secured debt — with an emphasis on default loss mitigation. We may make selective purchases lower on the capitalization structure in names about which we have particular conviction. |
26
FUND BASICS
High Yield Floating Rate Fund
as of September 30, 2015
| | | | | | | | | | | | | | | | | | |
| | PERFORMANCE REVIEW | |
| | | April 1, 2015–
September 30, 2015 | | Fund Total Return
(based on NAV)1 | | | Barclays
U.S. High-Yield
Loans Index2 | | | 30-Day
Standardized
Subsidized Yield3 | | | 30-Day
Standardized
Unsubsidized Yield3 | |
| | Class A | | | -0.98 | % | | | -0.86 | % | | | 3.73 | % | | | 3.72 | % |
| | Class C | | | -1.35 | | | | -0.86 | | | | 3.06 | | | | 3.05 | |
| | Institutional | | | -0.80 | | | | -0.86 | | | | 4.16 | | | | 4.15 | |
| | Class IR | | | -0.85 | | | | -0.86 | | | | 4.08 | | | | 4.06 | |
| | | Class R | | | -0.99 | | | | -0.86 | | | | 3.57 | | | | 3.57 | |
| | 1 | | The net asset value (“NAV”) represents the net assets of the class of the Fund (ex-dividend) divided by the total number of shares of the class outstanding. The Fund’s performance assumes the reinvestment of dividends and other distributions. The Fund’s performance does not reflect the deduction of any applicable sales charges. |
| | 2 | | The Barclays U.S. High-Yield Loans Index provides broad and comprehensive total return metrics of the universe of syndicated term loans. To be included in the index, a bank loan must be dollar denominated, have at least $150 million, a minimum term of one year, and a minimum initial spread of LIBOR+125. It is not possible to invest directly in an index. |
| | 3 | | The method of calculation of the 30-Day Standardized Subsidized Yield is mandated by the Securities and Exchange Commission and is determined by dividing the net investment income per share earned during the last 30 days of the period by the maximum public offering price (“POP”) per share on the last day of the period. This number is then annualized. The 30-Day Standardized Subsidized Yield reflects fee waivers and/or expense reimbursements recorded by the Fund during the period. Without waivers and/or reimbursements, yields would be reduced. This yield does not necessarily reflect income actually earned and distributed by the Fund and, therefore, may not be correlated with the dividends or other distributions paid to shareholders. The 30-Day Standardized Unsubsidized Yield does not adjust for any fee waivers and/or expense reimbursements in effect. If the Fund does not incur any fee waivers and/or expense reimbursements during the period, the 30-Day Standardized Subsidized Yield and 30-Day Standardized Unsubsidized Yield will be identical. |
| | | | | | | | | | | | |
| | STANDARDIZED TOTAL RETURNS4 |
| | | For the period ended 9/30/15 | | One Year | | | Since Inception | | | Inception Date |
| | Class A | | | -1.43 | % | | | 2.19 | % | | 3/31/11 |
| | Class C | | | -0.89 | | | | 1.95 | | | 3/31/11 |
| | Institutional | | | 1.21 | | | | 3.08 | | | 3/31/11 |
| | Class IR | | | 1.12 | | | | 3.01 | | | 3/31/11 |
| | | Class R | | | 0.72 | | | | 2.48 | | | 3/31/11 |
| | 4 | | The Standardized Total Returns are average annual total returns or cumulative total returns (only if the performance period is one year or less) as of the most recent calendar quarter-end. They assume reinvestment of all distributions at NAV. These returns reflect a maximum initial sales charge of 2.25% for Class A Shares and the assumed contingent deferred sales charge for Class C Shares (1% if redeemed within 12 months of purchase). Because Institutional, Class IR and Class R Shares do not involve a sales charge, such a charge is not applied to their Standardized Total Returns. |
The returns set forth in the tables above represent past performance. Past performance does not guarantee future results. The Fund’s investment return and principal value will fluctuate so that an investor’s shares, when redeemed, may be worth more or less than their original cost. Current performance may be lower or higher than the performance quoted above. Please visit our web site at www.GSAMFUNDS.com to obtain the most recent month-end returns. Performance reflects applicable fee waivers and/or expense limitations in effect during the periods shown. In their absence, performance would be reduced. Returns do not reflect the deduction of taxes that a shareholder would pay on Fund distributions or the redemption of Fund shares.
27
FUND BASICS
| | | | | | | | | | |
| | EXPENSE RATIOS5 | |
| | | | | Net Expense Ratio
(Current) | | | Gross Expense Ratio
(Before Waivers) | |
| | Class A | | | 0.94 | % | | | 0.95 | % |
| | Class C | | | 1.69 | | | | 1.70 | |
| | Institutional | | | 0.60 | | | | 0.61 | |
| | Class IR | | | 0.70 | | | | 0.71 | |
| | | Class R | | | 1.16 | | | | 1.17 | |
| | 5 | | The expense ratios of the Fund, both current (net of applicable fee waivers and/or expense limitations) and before waivers (gross of applicable fee waivers and/or expense limitations) are as set forth above according to the most recent publicly available Prospectus for the Fund and may differ from the expense ratios disclosed in the Financial Highlights in this report. Pursuant to a contractual arrangement, the Fund’s waivers and/or expense limitations will remain in place through at least July 29, 2016, and prior to such date the Investment Adviser may not terminate the arrangements without the approval of the Fund’s Board of Trustees. If these arrangements are discontinued in the future, the expense ratios may change without shareholder approval. |
| | | | | | | | | | |
| | TOP TEN INDUSTRY ALLOCATION6 | |
| | | | | Percentage of Net Assets | |
| | | | | as of 9/30/15 | | | as of 3/31/15 | |
| | Retailers | | | 7.1 | % | | | 6.0 | % |
| | Health Care | | | 6.0 | | | | 6.2 | |
| | Food & Beverages | | | 6.0 | | | | 6.4 | |
| | Services Cyclical – Business Services | | | 4.9 | | | | 4.7 | |
| | Wireless Telecommunications | | | 4.5 | | | | 3.3 | |
| | Health Care – Services | | | 4.2 | | | | 3.6 | |
| | Media – Broadcasting & Radio | | | 4.0 | | | | 4.2 | |
| | Technology – Software/Services | | | 3.9 | | | | 3.2 | |
| | Building Materials | | | 3.9 | | | | 3.2 | |
| | Airlines | | | 3.8 | | | | 3.8 | |
| | | Other | | | 50.2 | | | | 57.1 | |
| | 6 | | The percentage shown for each investment category reflects the value of investments in that category as a percentage of net assets. The table depicts the Fund’s investments but may not represent the Fund’s market exposure due to the exclusion of certain derivatives, if any, as listed in the Additional Investment Information section of the Schedule of Investments. |
28
PORTFOLIO RESULTS
Goldman Sachs Investment Grade Credit Fund
Investment Objective
The Fund seeks a high level of total return consisting of capital appreciation and income that exceeds the total return of the Barclays U.S. Credit Index.
Portfolio Management Discussion and Analysis
Below, the Goldman Sachs U.S. Fixed Income Investment Management Team discusses the Goldman Sachs Investment Grade Credit Fund’s (the “Fund”) performance and positioning for the six-month period ended September 30, 2015 (the “Reporting Period”).
| Q | | How did the Fund perform during the Reporting Period? |
| A | | During the Reporting Period, the Fund’s Class A, Institutional, IR and Separate Account Institutional Shares generated cumulative total returns, without sales charges, of -3.06%, -3.00%, -2.94% and -2.89%, respectively. These returns compare to the -2.37% cumulative total return of the Fund’s benchmark, the Barclays U.S. Credit Index (the “Index”), during the same time period. |
| | During the period since their inception on July 31, 2015 through September 30, 2015, the Fund’s Class R6 Shares generated a cumulative total return, without sales charges, of -0.49% compared to the -0.10% cumulative total return of the Index. |
| Q | | What economic and market factors most influenced the investment grade credit market as a whole during the Reporting Period? |
| A | | In the second quarter of 2015 when the Reporting Period began, investment grade corporate bonds underperformed U.S. Treasury securities. Investment grade credit spreads, or the difference in yields between corporate bonds and duration-equivalent U.S. Treasury securities, widened by 15 basis points to end the quarter at 139 basis points, their widest levels since 2013. (A basis point is 1/100th of a percentage point.) Nevertheless, corporate fundamentals remained strong. European investment grade corporate bonds underperformed both U.S. and U.K. investment grade corporate bonds. In the third calendar quarter, investment grade corporate bonds continued to trail U.S. Treasuries. Investment grade credit spreads widened by 27 basis points to end the quarter and the Reporting Period at 166 basis points, their widest levels since 2012, amid increased market volatility related to lower commodities prices, China’s slowing economic growth and the prolonged accommodative monetary policy of the Federal Reserve (the “Fed”). European investment grade corporate bonds modestly underperformed U.S. investment grade corporate bonds, while U.K. investment grade corporate bonds lagged both. |
| | Issuance was strong during the Reporting Period overall. In the second calendar quarter, U.S. new issuance was approximately $295 billion, while European new issuance was approximately $143 billion (including U.K. new issuance). During the third calendar quarter, U.S. new issuance was approximately $256 billion, and European new issuance was approximately $108 billion (including U.K. new issuance). The primary use of the proceeds was to help finance increased mergers and acquisitions activity, though some was in response to the prospect of an imminent Fed rate hiking cycle and potentially higher borrowing costs ahead. |
| Q | | What key factors were responsible for the Fund’s performance during the Reporting Period? |
| A | | The Fund underperformed the Index during the Reporting Period due primarily to our cross-sector strategy. In our cross-sector strategy, we invest Fund assets across a variety of fixed income sectors, including some that may not be included in the Fund’s benchmark. Individual issue selection among investment grade corporate bonds also detracted from relative performance. The Fund’s duration and yield curve positioning did not have a meaningful impact on relative results during the Reporting Period. Duration is a measure of the Fund’s sensitivity to changes in interest rates. Yield curve indicates a spectrum of maturities. |
| Q | | Which segments of investment grade credit most significantly affected Fund performance? |
| A | | As spreads widened during the Reporting Period, the Fund was hurt by its overweight relative to the Index in investment |
29
PORTFOLIO RESULTS
| | grade corporate bonds. Individual issue selection of investment grade corporate bonds also dampened performance. More specifically, the Fund was hampered by its investments in Glencore, a multinational commodity and trading company; Monsanto, an agrochemical and agricultural biotechnology company; and Freeport-McMoRan, a copper and gold mining company. On the positive side, the Fund benefited from select investments within specific industries and based on credit quality, although this was partially offset by positioning along the yield curve, which detracted. For example, the Fund’s overweight in the banking sector and underweight in higher quality investment grade corporate bonds added to performance. |
| Q | | Did the Fund’s duration and yield curve positioning strategy help or hurt its results during the Reporting Period? |
| A | | During the Reporting Period, the Fund’s duration and yield curve positioning did not have a meaningful impact on performance. The Fund’s duration strategy is primarily implemented via interest rate swaps and/or futures. Derivatives are used in combination with cash securities to implement our views in the Fund. |
| Q | | How did the Fund use derivatives and similar instruments during the Reporting Period? |
| A | | As market conditions warranted during the Reporting Period, the Fund used U.S. Treasury futures and Eurodollar futures to hedge interest rate exposure and facilitate specific duration and yield curve strategies. Eurodollar futures are contracts that have underlying assets linked to time deposits denominated in U.S. dollars at banks outside the U.S. Interest rate swaps were used to express our views on the direction of a country’s interest rates. The Fund employed interest rate swaps and swaptions (options on interest rate swap contracts) to hedge interest rate exposure and express an outright term structure view (term structure, most often depicted as a yield curve, refers to the term structure of interest rates, which is the relationship between the yield to maturity and the time to maturity for pure discount bonds). In addition, it used credit default swaps to implement specific credit-related investment strategies and hedge corporate spread duration (the price sensitivity of a corporate bond to a 100 basis point change in its spread over the London Interbank Offered Rate (“LIBOR”)). It utilized forward foreign currency exchange contracts to hedge currency exposure. |
| Q | | Were there any notable changes in the Fund’s weightings during the Reporting Period? |
| A | | Throughout the Reporting Period, the Fund held an overweight position in investment grade corporate bonds. During April and May 2015, the Fund held a moderate overweight position in investment grade corporate bonds given that we expected U.S. economic growth to continue and for relatively low market volatility to support moderate tightening in investment grade credit spreads. During June 2015, we reduced the size of the Fund’s overweight in investment grade corporate bonds because we believed seasonal factors were becoming less supportive and that the Fed’s data dependency might limit the upside potential in riskier U.S. asset classes. At the beginning of August 2015, we further decreased the size of the Fund’s overweight in investment grade corporate bonds as a result of a number of headwinds. For example, we expected global economic growth to improve, but we thought continued mergers and acquisitions activity would likely damage credit quality while adding to investment grade corporate bond supply. At the same time, seasonal factors were less supportive for riskier asset classes. Near the end of August 2015, we increased the Fund’s overweight position because we expected investment grade corporate bonds to benefit from improving global economic growth and from attractive valuations resulting from recent market volatility. Despite our concerns about low oil prices, slowing economic growth in China and currency volatility, we maintained our belief that developed markets economies are largely stable and should continue to expand. Thus, the Fund held a moderate overweight position in investment grade corporate bonds at the end of the Reporting Period. |
| Q | | How was the Fund positioned relative to its benchmark index at the end of the Reporting Period? |
| A | | At the end of the Reporting Period, the Fund was overweight relative to the Index in banking, pipelines and real estate investment trusts (“REITs”) investment grade corporate bonds. Compared to the Index, it was underweight electric utilities, property and casualty insurance and automotive investment grade corporate bonds. We generally favored lower credit quality issues and short-term and intermediate-term maturities at the end of the Reporting Period. |
30
PORTFOLIO RESULTS
| Q | | What is the Fund’s tactical view and strategy for the months ahead? |
| A | | At the end of the Reporting Period, the Fund was modestly overweight relative the Index in investment grade corporate bonds. In our view, the asset class is likely to benefit from a supportive macroeconomic outlook for the developed markets, corporations’ ability to service their debt in most sectors and what we consider to be attractive investment grade credit spreads. However, we are aware of potential downside risks, including weakened oil prices, a further slowing of Chinese economic growth and the trend toward increased levels of debt, particularly among U.S. non-financial companies. Overall, we believe REITs and financials have less exposure to potential credit quality deterioration due to mergers and acquisitions activity. REITs are one of the only sectors in the investment grade corporate bond market where covenants are in place that limit the amount of leverage that can be taken. Within financials, regulations have generally incentivized banks to become smaller rather than larger, which has tended to limit their risk-taking activities, such as increased leverage and proprietary trading. |
31
FUND BASICS
Investment Grade Credit Fund
as of September 30, 2015
| | | | | | | | | | | | | | | | | | |
| | PERFORMANCE REVIEW | |
| | | April 1, 2015– September 30, 2015 | | Fund Total Return
(based on NAV)1 | | | Barclays U.S.
Credit Index2 | | | 30-Day
Standardized
Subsidized Yield3 | | | 30-Day
Standardized
Unsubsidized Yield3 | |
| | Class A | | | -3.06 | % | | | -2.37 | % | | | 3.00 | % | | | 2.82 | % |
| | Institutional | | | -3.00 | | | | -2.37 | | | | 3.45 | | | | 3.27 | |
| | Class IR | | | -2.94 | | | | -2.37 | | | | 3.36 | | | | 3.18 | |
| | | Separate Account Institutional | | | -2.89 | | | | -2.37 | | | | 3.45 | | | | 3.27 | |
| | | | | | | | | | | | | | | | | | | |
| | | July 31, 2015– September 30, 2015 | | Fund Total Return
(based on NAV)1 | | | Barclays U.S.
Credit Index2 | | | 30-Day
Standardized
Subsidized Yield3 | | | 30-Day
Standardized
Unsubsidized Yield3 | |
| | | Class R6 | | | -0.49 | % | | | -0.10 | % | | | 3.47 | % | | | 3.30 | % |
| | 1 | | The net asset value (“NAV”) represents the net assets of the class of the Fund (ex-dividend) divided by the total number of shares of the class outstanding. The Fund’s performance assumes the reinvestment of dividends and other distributions. The Fund’s performance does not reflect the deduction of any applicable sales charges. |
| | 2 | | The Barclays U.S. Credit Index is an unmanaged index which is unbundled into pure corporates (industrial, utility, and finance, including both U.S. and non-U.S. corporations) and non-corporates (sovereign, supranational, foreign agencies, and foreign local governments). The index figures do not reflect any deduction for fees, expenses or taxes. It is not possible to invest directly in an index. |
| | 3 | | The method of calculation of the 30-Day Standardized Subsidized Yield is mandated by the Securities and Exchange Commission and is determined by dividing the net investment income per share earned during the last 30 days of the period by the maximum public offering price (“POP”) per share on the last day of the period. This number is then annualized. The 30-Day Standardized Subsidized Yield reflects fee waivers and/or expense reimbursements recorded by the Fund during the period. Without waivers and/or reimbursements, yields would be reduced. This yield does not necessarily reflect income actually earned and distributed by the Fund and, therefore, may not be correlated with the dividends or other distributions paid to shareholders. The 30-Day Standardized Unsubsidized Yield does not adjust for any fee waivers and/or expense reimbursements in effect. If the Fund does not incur any fee waivers and/or expense reimbursements during the period, the 30-Day Standardized Subsidized Yield and 30-Day Standardized Unsubsidized Yield will be identical. |
32
FUND BASICS
| | | | | | | | | | | | | | | | | | | | | | |
| | STANDARDIZED TOTAL RETURNS4 | |
| | | For the period ended 9/30/15 | | One Year | | | Five Years | | | Ten Years | | | Since
Inception | | | Inception
Date | |
| | Class A | | | -3.61 | % | | | 3.57 | % | | | 4.04 | % | | | 4.09 | % | | | 11/3/03 | |
| | Institutional | | | 0.38 | | | | 4.72 | | | | 4.78 | | | | 4.81 | | | | 11/3/03 | |
| | Class IR | | | 0.40 | | | | N/A | | | | N/A | | | | 4.30 | | | | 7/29/11 | |
| | Class R6 | | | N/A | | | | N/A | | | | N/A | | | | -0.49 | | | | 7/31/15 | |
| | | Separate Account Institutional | | | 0.49 | | | | 4.74 | | | | 4.83 | | | | 4.85 | | | | 11/3/03 | |
| | 4 | | The Standardized Total Returns are average annual total returns or cumulative total returns (only if the performance period is one year or less) as of the most recent calendar quarter-end. They assume reinvestment of all distributions at NAV. These returns reflect a maximum initial sales charge of 3.75% for Class A Shares. Prior to July 29, 2009, the maximum initial sales charge applicable to Class A Shares was 4.5%, which is not reflected in the average annual total return figures shown. Because Institutional, Separate Account Institutional, Class IR and Class R6 Shares do not involve a sales charge, such a charge is not applied to their Standardized Total Returns. |
The returns set forth in the tables above represent past performance. Past performance does not guarantee future results. The Fund’s investment return and principal value will fluctuate so that an investor’s shares, when redeemed, may be worth more or less than their original cost. Current performance may be lower or higher than the performance quoted above. Please visit our web site at www.GSAMFUNDS.com to obtain the most recent month-end returns. Performance reflects applicable fee waivers and/or expense limitations in effect during the periods shown. In their absence, performance would be reduced. Returns do not reflect the deduction of taxes that a shareholder would pay on Fund distributions or the redemption of Fund shares.
| | | | | | | | | | |
| | EXPENSE RATIOS5 | |
| | | | | Net Expense Ratio
(Current) | | | Gross Expense Ratio
(Before Waivers) | |
| | Class A | | | 0.72 | % | | | 0.86 | % |
| | Institutional | | | 0.38 | | | | 0.52 | |
| | Class IR | | | 0.47 | | | | 0.61 | |
| | Class R6 | | | 0.36 | | | | 0.50 | |
| | | Separate Account Institutional | | | 0.38 | | | | 0.52 | |
| | 5 | | The expense ratios of the Fund, both current (net of applicable fee waivers and/or expense limitations) and before waivers (gross of applicable fee waivers and/or expense limitations) are as set forth above according to the most recent publicly available Prospectus for the Fund and may differ from the expense ratios disclosed in the Financial Highlights in this report. Pursuant to a contractual arrangement, the Fund’s waivers and/or expense limitations will remain in place through at least July 29, 2016, and prior to such date the Investment Adviser may not terminate the arrangements without the approval of the Fund’s Board of Trustees. If these arrangements are discontinued in the future, the expense ratios may change without shareholder approval. |
33
FUND BASICS
| | |
| | FUND COMPOSITION6 |
| | | Percentage of Net Assets |
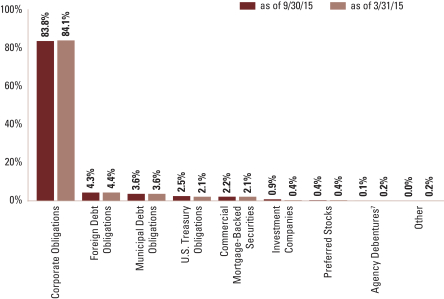
| | 6 | | The percentage shown for each investment category reflects the value of investments in that category as a percentage of net assets. Figures in the graph may not sum to 100% due to the exclusion of other assets and liabilities. The graph depicts the Fund’s investments but may not represent the Fund’s market exposure due to the exclusion of certain derivatives, if any, as listed in the Additional Investment Information section of the Schedule of Investments. |
| | 7 | | “Agency Debentures” include agency securities offered by companies such as Federal National Mortgage Association and Federal Home Loan Mortgage Corp., which operate under a government charter. While they are required to report to a government regulator, their assets are not explicitly guaranteed by the government and they otherwise operate similarly to any other publicly traded company. |
| | | | | | | | | | |
| | TOP TEN INDUSTRY ALLOCATION8 | |
| | | | | Percentage of Net Assets | |
| | | | | as of 9/30/15 | | | as of 3/31/15 | |
| | Banks | | | 16.6 | % | | | 18.1 | % |
| | Real Estate Investment Trusts | | | 6.8 | | | | 8.0 | |
| | Energy | | | 6.4 | | | | 5.5 | |
| | Wirelines Telecommunications | | | 5.1 | | | | 4.3 | |
| | Pipelines | | | 4.8 | | | | 4.8 | |
| | Electric | | | 4.2 | | | | 4.2 | |
| | Food & Beverage | | | 4.0 | | | | 4.2 | |
| | Insurance | | | 3.9 | | | | 3.4 | |
| | Technology | | | 3.7 | | | | 2.2 | |
| | | Pharmaceuticals | | | 3.5 | | | | 3.7 | |
| | 8 | | The percentage shown for each investment category reflects the value of investments in that category as a percentage of net assets. The table depicts the Fund’s investments but may not represent the Fund’s market exposure due to the exclusion of certain derivatives, if any, as listed in the Additional Investment Information section of the Schedule of Investments. |
34
PORTFOLIO RESULTS
Goldman Sachs Local Emerging
Markets Debt Fund
Investment Objective
The Fund seeks a high level of total return consisting of income and capital appreciation.
Portfolio Management Discussion and Analysis
Below, the Goldman Sachs Global Fixed Income Investment Management Team discusses the Goldman Sachs Local Emerging Markets Debt Fund’s (the “Fund”) performance and positioning for the six-month period ended September 30, 2015 (the “Reporting Period”).
| Q | | How did the Fund perform during the Reporting Period? |
| A | | During the Reporting Period, the Fund’s Class A, C, Institutional and IR Shares generated cumulative total returns, without sales charges, of -11.93%, -12.37%, -11.90% and -11.82%, respectively. These returns compare to the -11.40% cumulative total return of the Fund’s benchmark, the J.P. Morgan Government Bond Index — Emerging Markets (GBI-EMSM) Global Diversified (Gross, USD, Unhedged) Index (the “Index”), during the same time period. |
| Q | | What economic and market factors most influenced local emerging markets debt as a whole during the Reporting Period? |
| A | | When the Reporting Period began during the second quarter of 2015, local emerging markets debt recorded a small decline, driven by changes in local interest rates that were partially offset by modest currency appreciation. In the third calendar quarter, local emerging markets debt declined significantly, driven by currency depreciation versus the U.S. dollar and, to a lesser extent, by changes in local interest rates. |
| | During the Reporting Period overall, the asset class, as represented by the Index, posted a return of -11.40% as a result of currency depreciation (-7.99%) and changes in local interest rates (-3.41%). Among countries, on a total return basis, the weakest performers (in U.S. dollar terms1) during the Reporting Period were Brazil (-20.02%), Turkey (-18.95%) and Indonesia (-18.62%). The top performers were Nigeria (+6.98%), Romania (+4.75%), and Hungary (+1.78%). |
| Q | | What key factors were responsible for the Fund’s performance during the Reporting Period? |
| A | | During the Reporting Period, our country and issue selection of local emerging markets bonds detracted most from relative performance. The Fund was also hurt by its positioning in external emerging markets debt. |
| | On the positive side, the Fund benefited from our active currency management through which the Fund takes positions in local currencies (accomplished through the use of forward foreign currency exchange contracts as well as bonds denominated in local currencies). Our country and issue selection of external emerging markets bonds also contributed positively. In addition, the Fund’s U.S. duration and yield curve strategy added to results. Duration is a measure of the Fund’s sensitivity to changes in interest rates. Yield curve indicates a spectrum of maturities. |
| Q | | Which segments of local emerging markets debt most significantly affected Fund performance? |
| A | | The Fund was hampered during the Reporting Period by its overweight relative to the Index in Brazilian local interest rates. Although Brazil’s economy is weak, with high inflation and tepid growth, the Fund was overweight Brazilian local bonds on the back of Brazil’s monetary and fiscal tightening. In addition, we considered the overall valuations of Brazilian local debt attractive relative to the local bonds of other emerging markets countries. However, in July 2015, the Brazilian government revised downward its 2015 fiscal target to 0.15% of its Gross Domestic Product (“GDP”) from 1.1% and also lowered its 2016 fiscal target, both of which were more drastic reductions than widely anticipated. Subsequently, Standard and Poor’s Ratings downgraded Brazil’s foreign currency rating by a notch to BB+ in September 2015. Brazil’s local currency rating was dropped two notches to BBB- but remained investment |
35
| 1 | | All regional and market returns are in U.S. dollar terms (unless otherwise specified), are based on country-specific stock market indices and reflect the reinvestment of any dividends if applicable. |
PORTFOLIO RESULTS
| | grade. The negative impact of the Fund’s overweight in Brazilian local interest rates was offset somewhat by the positive contribution of having a short position in the Brazilian real (accomplished through the use of forward foreign currency exchange contracts). The Brazilian real depreciated through much of the Reporting Period. Also detracting from Fund results during the Reporting Period was an overweight position in Colombian local interest rates. We believe Colombia’s strong policy framework — which includes a structural fiscal balance rule, inflation-targeting regime, flexible exchange rate and effective financial supervision and regulation — could help its government facilitate economic and financial stability. However, given Colombia’s reliance on energy exports, low oil prices dampened sentiment for Colombian local bonds during the Reporting Period and also drove a sharp depreciation in the Colombian peso. Additionally, the Fund’s position in the Mexican peso (accomplished through the use of forward foreign currency exchange contracts) dampened relative performance during the Reporting Period. The Mexican peso depreciated against the U.S. dollar amid overall emerging markets currency weakness. We believe that Mexico remains closely tied to the U.S. economy and may therefore benefit should U.S. economic growth continues to improve. |
| | During the Reporting Period, the Fund benefited from its underweight position relative to the Index in Turkish local interest rates. We believe geopolitical turmoil and domestic political uncertainty were some of the drivers of the poor performance of Turkish local bonds. An underweight in Malaysian local interest rates also enhanced relative returns. We are concerned about depletion of the country’s foreign exchange reserves, deterioration of its trade balance and challenging political dynamics. Indeed, during the Reporting Period, political uncertainty and weakening market sentiment weighed on Malaysian local bonds. In addition, the Fund was helped during the Reporting Period by our tactical trading of the Brazilian real (accomplished through the use of forward foreign currency exchange contracts). |
| Q | | Did the Fund’s duration and yield curve positioning strategy help or hurt its results during the Reporting Period? |
| A | | During the Reporting Period, the Fund’s U.S. duration and yield curve positioning added to relative performance. We moved the Fund from a slightly short duration position to a slightly long duration position on the U.S. Treasury yield curve relative to the Index over the course of the Reporting Period, which bolstered performance as a Federal Reserve (the “Fed”) rate hike did not materialize and market expectations about the timing of Fed action shifted further into the future. |
| Q | | How did the Fund use derivatives and similar instruments during the Reporting Period? |
| A | | The Fund invested in U.S. Treasury futures, Eurodollar futures, forward foreign currency exchange contracts, interest rate swaps, credit default swaps, total return swaps, cross-currency swaps, non-deliverable currency forwards and structured notes. U.S. Treasury futures were used to manage U.S. interest rate duration. Eurodollar futures were used to express our views on the direction of interest rates and to facilitate specific duration and yield curve strategies. Eurodollar futures are contracts that have underlying assets linked to time deposits denominated in U.S. dollars at banks outside the U.S. Forward foreign currency exchange contracts were used for hedging purposes or to express a positive view on a given currency. Interest rate swaps were used to express our views on the direction of a country’s interest rates. Credit default swaps were used to implement specific credit-related investment strategies. Total return swaps were used in place of buying a local currency denominated bond when a particular market was otherwise inaccessible or as a more efficient means of gaining access to a local market. Cross-currency swaps were employed to express relative value views on given currencies as well as our views on the direction of a country’s interest rates. Non-deliverable currency forwards were used to gain exposure to a particular country and also to take advantage of relative value opportunities. Structured notes were used in place of buying a local currency denominated bond when a particular market was otherwise inaccessible or as a more efficient means of gaining access to a local market. Derivatives may be used in combination with cash securities to implement our views in the Fund. |
| | During the Reporting Period, we used interest rate swaps and total return swaps to gain access to the Colombia local debt market, positioning that detracted from performance. Another detractor was the Fund’s exposure to Brazil for which we used interest rate swaps, as well as sovereign local bonds. The Fund’s use of forward foreign currency exchange contracts as well as swaps to take a long position in the Mexican peso also had a negative impact on the Fund’s performance during the Reporting Period. Conversely, the Fund’s positioning in the Brazilian real and Taiwan dollar, implemented via forward foreign currency exchange contracts, added to the Fund’s performance. |
36
PORTFOLIO RESULTS
| Q | | Were there any notable changes in the Fund’s weightings during the Reporting Period? |
| A | | During the Reporting Period, we reduced the size of the Fund’s underweight relative to the Index in South Korean local interest rates. We increased its underweight in Malaysian local interest rates. In addition, we reduced the size of the Fund’s overweight positions relative to the Index in Thai local interest rates. We increased the Fund’s overweight in Mexican local interest rates relative to the Index. We also moved the Fund from an underweight in Colombian local interest rates to an overweight position versus the Index and from a neutral position in Russian local interest rates to an overweight position relative to the Index. |
| Q | | How was the Fund positioned relative to its benchmark index at the end of the Reporting Period? |
| A | | At the end of the Reporting Period, the Fund was underweight Turkish local interest rates relative to the Index and held a short position in the Turkish lira given political uncertainty in Turkey. The Fund also held an underweight in Malaysian local interest rates and had a short position in the Malaysian ringgit, as we continue to be concerned about depletion of Malaysia’s foreign exchange reserves, deterioration of its trade balance and challenging political dynamics. In addition, we continued to look for value in long-maturity Brazilian inflation-linked debt. At the end of the Reporting Period, the Fund had a long position in the Mexican peso, which we expect to appreciate due to increased capital flows and investment going forward. We believe Mexico is likely to benefit if the U.S. economy continues to outperform other developed economies. |
| | We remained negative on the macroeconomic outlook for China, specifically that country’s growth trajectory and capital outflows. Recent indicators point to tepid domestic demand and continued disinflationary pressures. Accordingly, we have increased the Fund’s short position in the Chinese renminbi. In addition, at the end of the Reporting Period, the Fund held short positions in a number of Southeast Asian currencies, including the South Korean won, Taiwan dollar and Singapore dollar, considering the close trade links that many Southeast Asian countries have with China. |
| Q | | What is the Fund’s tactical view and strategy for the months ahead? |
| A | | At the end of the Reporting Period, we recognized the environment was likely to remain challenging for local emerging markets debt as a result of persistent U.S. dollar strength and overall emerging markets currency weakness, slower emerging markets growth, commodities market volatility and idiosyncratic factors affecting individual countries. Although Fed monetary policy tightening might lead to an initial sell-off in local emerging markets debt, we believe the anticipated rate hikes have been well telegraphed and a gradual increase in U.S. interest rates is not likely, in our view, to be a problem over the long term. We believe bond pickers are likely to be rewarded in the near term with continued dispersion of returns among countries. |
37
FUND BASICS
Local Emerging Markets Debt Fund
as of September 30, 2015

| | | | | | | | | | | | | | | | | | |
| | PERFORMANCE REVIEW | | | | | |
| | | April 1, 2015– September 30, 2015 | | Fund Total Return
(based on NAV)1 | | | J.P. Morgan GBI-EMSM Global
Diversified Index2 | | | 30-Day
Standardized
Subsidized Yield3 | | | 30-Day
Standardized
Unsubsidized Yield3 | |
| | Class A | | | -11.93 | % | | | -11.40 | % | | | 5.94 | % | | | 6.06 | % |
| | Class C | | | -12.37 | | | | -11.40 | | | | 5.45 | | | | 5.58 | |
| | Institutional | | | -11.90 | | | | -11.40 | | | | 6.57 | | | | 6.69 | |
| | | Class IR | | | -11.82 | | | | -11.40 | | | | 6.47 | | | | 6.65 | |
| | 1 | | The net asset value (“NAV”) represents the net assets of the class of the Fund (ex-dividend) divided by the total number of shares of the class outstanding. The Fund’s performance assumes the reinvestment of dividends and other distributions. The Fund’s performance does not reflect the deduction of any applicable sales charges. |
| | 2 | | The J.P. Morgan Government Bond Index — Emerging Markets (GBI-EMSM) Global Diversified (Gross, USD, Unhedged) Index is an unmanaged index of debt instruments of 14 emerging countries. The Index figures do not reflect any deduction for fees, expenses or taxes. It is not possible to invest directly in an index. |
| | 3 | | The method of calculation of the 30-Day Standardized Subsidized Yield is mandated by the Securities and Exchange Commission and is determined by dividing the net investment income per share earned during the last 30 days of the period by the maximum public offering price (“POP”) per share on the last day of the period. This number is then annualized. The 30-Day Standardized Subsidized Yield reflects fee waivers and/or expense reimbursements recorded by the Fund during the period. Without waivers and/or reimbursements, yields would be reduced. This yield does not necessarily reflect income actually earned and distributed by the Fund and, therefore, may not be correlated with the dividends or other distributions paid to shareholders. The 30-Day Standardized Unsubsidized Yield does not adjust for any fee waivers and/or expense reimbursements in effect. If the Fund does not incur any fee waivers and/or expense reimbursements during the period, the 30-Day Standardized Subsidized Yield and 30-Day Standardized Unsubsidized Yield will be identical. |
| | | | | | | | | | | | | | | | | | |
| | STANDARDIZED TOTAL RETURNS4 | |
| | | For the period ended 9/30/15 | | One Year | | | Five Year | | | Since Inception | | | Inception Date | |
| | Class A | | | -25.28 | % | | | -5.28 | % | | | -1.87 | % | | | 2/15/08 | |
| | Class C | | | -23.17 | | | | -5.12 | | | | -1.99 | | | | 2/15/08 | |
| | Institutional | | | -21.48 | | | | -4.06 | | | | -0.94 | | | | 2/15/08 | |
| | | Class IR | | | -21.55 | | | | -4.15 | | | | -2.98 | | | | 7/30/10 | |
| | 4 | | The Standardized Total Returns are average annual total returns or cumulative total returns (only if the performance period is one year or less) as of the most recent calendar quarter-end. They assume reinvestment of all distributions at NAV. These returns reflect a maximum initial sales charge of 4.5% for Class A Shares and the assumed contingent deferred sales charge for Class C Shares (1% if redeemed within 12 months of purchase). Because Institutional and Class IR Shares do not involve a sales charge, such a charge is not applied to their Standardized Total Returns. The Fund will charge a 2% redemption fee on the redemption of shares (including by exchange) held for 30 calendar days or less. The performance figures do not reflect the deduction of the redemption fee. If reflected, the redemption fee would reduce the performance quoted. |
The returns set forth in the tables above represent past performance. Past performance does not guarantee future results. The Fund’s investment return and principal value will fluctuate so that an investor’s shares, when redeemed, may be worth more or less than their original cost. Current performance may be lower or higher than the performance quoted above. Please visit our web site at www.GSAMFUNDS.com to obtain the most recent month-end returns. Performance reflects applicable fee waivers and/or expense limitations in effect during the periods shown. In their absence, performance would be reduced. Returns do not reflect the deduction of taxes that a shareholder would pay on Fund distributions or the redemption of Fund shares.
38
FUND BASICS
| | | | | | | | | | |
| | EXPENSE RATIOS5 | |
| | | | | Net Expense Ratio
(Current) | | | Gross Expense Ratio
(Before Waivers) | |
| | Class A | | | 1.25 | % | | | 1.36 | % |
| | Class C | | | 2.01 | | | | 2.14 | |
| | Institutional | | | 0.92 | | | | 1.05 | |
| | | Class IR | | | 1.01 | | | | 1.14 | |
| | 5 | | The expense ratios of the Fund, both current (net of applicable fee waivers and/or expense limitations) and before waivers (gross of applicable fee waivers and/or expense limitations) are as set forth above according to the most recent publicly available Prospectus for the Fund and may differ from the expense ratios disclosed in the Financial Highlights in this report. Pursuant to a contractual arrangement, the Fund’s waivers and/or expense limitations will remain in place through at least July 29, 2016, and prior to such date the Investment Adviser may not terminate the arrangements without the approval of the Fund’s Board of Trustees. If these arrangements are discontinued in the future, the expense ratios may change without shareholder approval. |
| | | | | | | | | | |
| | TOP TEN COUNTRY ALLOCATION6 | |
| | | | | Percentage of Net Assets | |
| | | | | as of 9/30/15 | | | as of 3/31/15 | |
| | United States | | | 11.5 | % | | | 6.9 | % |
| | Brazil | | | 10.7 | | | | 11.6 | |
| | Mexico | | | 10.0 | | | | 9.0 | |
| | Colombia | | | 9.6 | | | | 8.1 | |
| | Indonesia | | | 8.6 | | | | 8.7 | |
| | Turkey | | | 7.8 | | | | 7.8 | |
| | Russia | | | 7.3 | | | | 4.6 | |
| | South Africa | | | 6.1 | | | | 5.1 | |
| | Thailand | | | 5.8 | | | | 9.5 | |
| | Poland | | | 4.9 | | | | 5.8 | |
| | | Other | | | 14.7 | | | | 17.0 | |
| | 6 | | The percentage shown for each investment category reflects the value of investments in that country as a percentage of net assets. The table depicts the Fund’s investments but may not represent the Fund’s market exposure due to the exclusion of certain derivatives, if any, as listed in the Additional Investment Information section of the Schedule of Investments. |
39
PORTFOLIO RESULTS
Goldman Sachs U.S. Mortgages Fund
Investment Objective
The Fund seeks a high level of total return consisting of income and capital appreciation.
Portfolio Management Discussion and Analysis
Below, the Goldman Sachs U.S. Fixed Income Investment Management Team discusses the Goldman Sachs U.S. Mortgages Fund’s (the “Fund”) performance and positioning for the six-month period ended September 30, 2015 (the “Reporting Period”).
| Q | | How did the Fund perform during the Reporting Period? |
| A | | During the Reporting Period, the Fund’s Class A, Institutional, IR and Separate Account Institutional Shares generated cumulative total returns, without sales charges, of 0.48%, 0.56%, 0.61% and 0.56%, respectively. These returns compare to the 0.55% cumulative total return of the Fund’s benchmark, the Barclays U.S. Securitized Bond Index (the “Index”), during the same time period. |
| | During the period since their inception on July 31, 2015 through September 30, 2015, the Fund’s Class R6 Shares generated a cumulative total return, without sales charges, of 0.56% compared to the 0.68% cumulative total return of the Index. |
| Q | | What economic and market factors most influenced the U.S. mortgage markets as a whole during the Reporting Period? |
| A | | During the second quarter of 2015 when the Reporting Period began, mortgage-backed securities slightly outperformed duration-equivalent U.S. Treasury securities, benefiting from particular strength during April and May 2015. In June 2015, mortgage-backed securities retraced most of those gains, underperforming duration-equivalent U.S. Treasury securities as the U.S. Treasury yield curve steepened in response to stronger U.S. economic data. In the third calendar quarter, mortgage-backed securities underperformed duration-equivalent U.S. Treasury securities. Mortgage-backed securities spreads (or yield differentials versus U.S. Treasury securities) widened along with many other riskier asset classes amidst increased market volatility. |
| Q | | What key factors were responsible for the Fund’s performance during the Reporting Period? |
| A | | During the Reporting Period, the Fund benefited from its positioning in the securitized sector. Our government/swaps strategy added to relative performance. The government/ swaps strategy is primarily implemented via interest rate swaps and/or futures. Derivatives are used in combination with cash securities to implement our views in the Fund. |
| | Conversely, our cross-sector strategy detracted from relative performance. In our cross-sector strategy, we invest Fund assets across a variety of fixed income sectors, including some that may not be included in the Fund’s benchmark. In addition, the management of the Fund’s just duration positioning modestly dampened relative returns. The Fund’s duration strategy is primarily implemented via interest rate swaps and/or futures. Duration is a measure of the Fund’s sensitivity to changes in interest rates. Yield curve indicates a spectrum of maturities. |
| Q | | Which segments of the U.S. mortgage-backed securities sector most significantly affected Fund performance? |
| A | | The Fund’s positioning in the securitized sector added to relative performance. More specifically, the Fund benefited from its positioning in the coupon stack (i.e., across securities with different coupons). The Fund’s selection of specific agency mortgage-backed securities, including certain pass-through securities, also enhanced results. (Pass-through mortgage securities consist of a pool of residential mortgage loans, where homeowners’ monthly payments of principal, |
40
PORTFOLIO RESULTS
| | interest and prepayments pass from the original bank through a government agency or investment bank to investors.) |
| | The Fund was hurt by its overweight in commercial mortgage-backed securities (“CMBS”). |
| Q | | Did the Fund’s duration and yield curve positioning strategy help or hurt its results during the Reporting Period? |
| A | | During the Reporting Period, the Fund’s underweight position in the front-end, or short-term segment, of the U.S. Treasury yield curve detracted modestly from performance, especially in July 2015 when yields in the intermediate-term and longer-term segments of the U.S. Treasury yield curve fell. |
| Q | | How did the Fund use derivatives and similar instruments during the Reporting Period? |
| A | | The Fund used U.S. Treasury and Eurodollar futures to hedge interest rate exposure and to facilitate specific duration and yield curve strategies. Eurodollar futures are contracts that have underlying assets linked to time deposits denominated in U.S. dollars at banks outside the U.S. Interest rate swaps were used to hedge interest rate exposure and express a relative term structure view. (Term structure, most often depicted as a yield curve, refers to the terms structure of interest rates, which is the relationship between the yield to the maturity and the time to maturity for pure discount bonds.) The Fund used mortgage-backed securities forward agreements (known as “TBAs”) to efficiently manage certain of its mortgage-backed securities positions. It used swaptions to hedge volatility and yield curve risks in the Fund and/ or to express tactical views on rate markets. The Fund also employed index total return swaps to efficiently manage the Fund’s mortgage-backed securities exposure. Additionally, a specialized index of credit default swaps (CDX) was used to manage the MBS beta of the Fund on an active basis and to hedge the Fund’s CMBS exposure. |
| Q | | Were there any notable changes in the Fund’s weightings during the Reporting Period? |
| A | | We decreased the size of the Fund’s underweight in agency mortgage-backed securities, but remained modestly underweight relative to the Index at the end of the Reporting Period. In addition, we shifted the Fund from an underweight duration position to a modest overweight duration position in the front-end, or short-term part, of the U.S. Treasury yield curve by the end of the Reporting Period. |
| Q | | How was the Fund positioned relative to its benchmark index at the end of the Reporting Period? |
| A | | At the end of the Reporting Period, on a contribution to duration basis, the Fund was underweight CMBS, pass-through mortgage-backed securities and agency adjustable-rate mortgages (“ARMs”). It was overweight agency collateralized mortgage obligations (“CMOs”) on a contribution to duration basis. On a market value-weighted basis, the Fund was overweight asset-backed securities (“ABS”) relative to the Index, including positions in Federal Family Education Loan Program (“FFELP”) student loan ABS. At the end of the Reporting Period, the Fund also had positions in U.S. government bonds and non-agency mortgage-backed securities. U.S government bonds, CMOs, FFELP ABS and non-agency mortgage-backed securities are not represented in the Index. |
| Q | | What is the Fund’s tactical view and strategy for the months ahead? |
| A | | At the end of the Reporting Period, we expected to remain modestly underweight agency mortgage-backed securities, which face headwinds such as increased supply and less anticipated demand. Within agency mortgage-backed securities, we planned to maintain an overweight in Ginnie Mae (“GNMA”) mortgage-backed securities, as they were trading at the end of the Reporting Period close to their lowest levels relative to conventional mortgage-backed securities, in price terms. Additionally, we expect GNMA prepayment speeds to converge with lower conventional mortgage prepayment speeds, which should further support our bias towards holding GNMA mortgage pass-through securities. At the end of the Reporting Period, we also favored FFELP student loan ABS, senior collateralized loan obligations and U.K. non-conforming residential mortgage-backed securities, all of which we believed offer attractive spreads and limited credit risk due to substantial credit enhancement and, in the case of FFELP ABS, partial government reinsurance on the collateral. (Non-conforming residential mortgage-backed securities are loans made to higher-risk borrowers.) |
41
FUND BASICS
U.S. Mortgages Fund
as of September 30, 2015
| | | | | | | | | | | | | | | | | | |
| | PERFORMANCE REVIEW | | | | | |
| | | April 1, 2015– September 30, 2015 | | Fund Total Return
(based on NAV)1 | | | Barclays U.S.
Securitized
Bond Index2 | | | 30-Day
Standardized
Subsidized Yield3 | | | 30-Day
Standardized
Unsubsidized Yield3 | |
| | Class A | | | 0.48 | % | | | 0.55 | % | | | 1.96 | % | | | 1.59 | % |
| | Institutional | | | 0.56 | | | | 0.55 | | | | 2.37 | | | | 1.98 | |
| | Class IR | | | 0.61 | | | | 0.55 | | | | 2.28 | | | | 1.90 | |
| | | Separate Account Institutional | | | 0.56 | | | | 0.55 | | | | 2.38 | | | | 1.98 | |
| | | | | | | | | | | | | | | | | | | |
| | | July 31, 2015– September 30, 2015 | | Fund Total Return
(based on NAV)1 | | | Barclays U.S.
Securitized
Bond Index2 | | | 30-Day
Standardized
Subsidized Yield3 | | | 30-Day
Standardized
Unsubsidized Yield3 | |
| | | Class R6 | | | 0.56 | % | | | 0.68 | % | | | 2.36 | % | | | 1.96 | % |
| | 1 | | The net asset value (“NAV”) represents the net assets of the class of the Fund (ex-dividend) divided by the total number of shares of the class outstanding. The Fund’s performance assumes the reinvestment of dividends and other distributions. The Fund’s performance does not reflect the deduction of any applicable sales charges. |
| | 2 | | The Barclays U.S. Securitized Bond Index (with dividends reinvested) is an unmanaged composite of asset-backed securities, collateralized mortgage-backed securities and fixed rate mortgage-backed securities. The index figures do not reflect any deduction for fees, expenses or taxes. It is not possible to invest directly in an index. |
| | 3 | | The method of calculation of the 30-Day Standardized Subsidized Yield is mandated by the Securities and Exchange Commission and is determined by dividing the net investment income per share earned during the last 30 days of the period by the maximum public offering price (“POP”) per share on the last day of the period. This number is then annualized. The 30-Day Standardized Subsidized Yield reflects fee waivers and/or expense reimbursements recorded by the Fund during the period. Without waivers and/or reimbursements, yields would be reduced. This yield does not necessarily reflect income actually earned and distributed by the Fund and, therefore, may not be correlated with the dividends or other distributions paid to shareholders. The 30-Day Standardized Unsubsidized Yield does not adjust for any fee waivers and/or expense reimbursements in effect. If the Fund does not incur any fee waivers and/or expense reimbursements during the period, the 30-Day Standardized Subsidized Yield and 30-Day Standardized Unsubsidized Yield will be identical. |
42
FUND BASICS
| | | | | | | | | | | | | | | | | | | | | | |
| | STANDARDIZED TOTAL RETURNS4 | |
| | | For the period ended 9/30/15 | | One Year | | | Five Years | | | Ten Years | | | Since
Inception | | | Inception
Date | |
| | Class A | | | -0.77 | % | | | 2.54 | % | | | 3.74 | % | | | 3.75 | % | | | 11/3/03 | |
| | Institutional | | | 3.32 | | | | 3.70 | | | | 4.51 | | | | 4.47 | | | | 11/3/03 | |
| | Class IR | | | 3.33 | | | | N/A | | | | N/A | | | | 3.48 | | | | 7/29/11 | |
| | Class R6 | | | N/A | | | | N/A | | | | N/A | | | | 0.56 | | | | 7/31/15 | |
| | | Separate Account Institutional | | | 3.42 | | | | 3.68 | | | | 4.53 | | | | 4.49 | | | | 11/3/03 | |
| | 4 | | The Standardized Total Returns are average annual total returns or cumulative total returns (only if the performance period is one year or less) as of the most recent calendar quarter-end. They assume reinvestment of all distributions at NAV. These returns reflect a maximum initial sales charge of 3.75% for Class A Shares. Prior to July 29, 2009, the maximum initial sales charge applicable to Class A Shares was 4.5%, which is not reflected in the average annual return figures shown. Because Institutional, Separate Account Institutional, Class IR and Class R6 Shares do not involve a sales charge, such a charge is not applied to their Standardized Total Returns. |
The returns set forth in the tables above represent past performance. Past performance does not guarantee future results. The Fund’s investment return and principal value will fluctuate so that an investor’s shares, when redeemed, may be worth more or less than their original cost. Current performance may be lower or higher than the performance quoted above. Please visit our web site at www.GSAMFUNDS.com to obtain the most recent month-end returns. Performance reflects applicable fee waivers and/or expense limitations in effect during the periods shown. In their absence, performance would be reduced. Returns do not reflect the deduction of taxes that a shareholder would pay on Fund distributions or the redemption of Fund shares.
| | | | | | | | | | |
| | EXPENSE RATIOS5 | |
| | | | | Net Expense Ratio
(Current) | | | Gross Expense Ratio
(Before Waivers) | |
| | Class A | | | 0.78 | % | | | 0.95 | % |
| | Institutional | | | 0.44 | | | | 0.62 | |
| | Class IR | | | 0.53 | | | | 0.71 | |
| | Class R6 | | | 0.42 | | | | 0.60 | |
| | | Separate Account Institutional | | | 0.44 | | | | 0.63 | |
| | 5 | | The expense ratios of the Fund, both current (net of applicable fee waivers and/or expense limitations) and before waivers (gross of applicable fee waivers and/or expense limitations) are as set forth above according to the most recent publicly available Prospectus for the Fund and may differ from the expense ratios disclosed in the Financial Highlights in this report. Pursuant to a contractual arrangement, the Fund’s waivers and/or expense limitations will remain in place through at least July 29, 2016, and prior to such date the Investment Adviser may not terminate the arrangements without the approval of the Fund’s Board of Trustees. If these arrangements are discontinued in the future, the expense ratios may change without shareholder approval. |
43
FUND BASICS
|
| FUND COMPOSITION6 |
| Percentage of Net Assets |
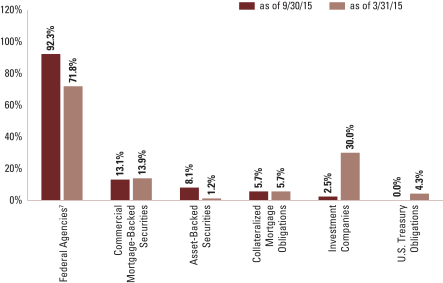
| | 6 | | The percentage shown for each investment category reflects the value of investments in that category as a percentage of net assets. Figures in the graph may not sum to 100% due to the exclusion of other assets and liabilities. The graph depicts the Fund’s investments but may not represent the Fund’s market exposure due to the exclusion of certain derivatives, if any, as listed in the Additional Investment Information section of the Schedule of Investments. |
| | 7 | | “Federal Agencies” are mortgage-backed securities guaranteed by the Government National Mortgage Association (“GNMA”), Federal National Mortgage Association (“FNMA”) and Federal Home Loan Mortgage Corp. (“FHLMC”). GNMA instruments are backed by the full faith and credit of the U.S. Government. |
44
GOLDMAN SACHS DYNAMIC EMERGING MARKETS DEBT FUND
Schedule of Investments
September 30, 2015 (Unaudited)
| | | | | | | | | | | | | | |
Principal
Amount | | | Interest
Rate | | | Maturity
Date | | | Value | |
| | Sovereign Debt Obligations – 62.6% | |
| | Argentina – 0.3% | |
| Republic of Argentina (NR/NR) | |
| $ | 42,061 | | | | 8.280 | %(a) | | | 12/31/33 | | | $ | 41,851 | |
| | 750,000 | | | | 0.000 | (b) | | | 12/15/35 | | | | 60,375 | |
| | | | | | | | | | | | | | |
| | | | | | | | | | | | | 102,226 | |
| | |
| | Azerbaijan – 0.5% | |
| Republic of Azerbaijan (NR/Baa3) | |
| | 200,000 | | | | 4.750 | | | | 03/18/24 | | | | 188,000 | |
| | |
| | Brazil – 5.3% | |
| Brazil Letras do Tesouro Nacional (BBB-/Baa3)(c) | |
| BRL | 135,000 | | | | 0.000 | | | | 01/01/16 | | | | 32,904 | |
| Brazil Notas do Tesouro Nacional (BBB-/Baa3) | |
| | 2,750,000 | | | | 10.000 | | | | 01/01/18 | | | | 623,968 | |
| | 1,308,000 | | | | 10.000 | | | | 01/01/23 | | | | 256,060 | |
| | 1,284,000 | | | | 10.000 | | | | 01/01/25 | | | | 241,850 | |
| | 1,670,830 | | | | 6.000 | | | | 08/15/50 | | | | 350,893 | |
| Federal Republic of Brazil (BB+/Baa3) | |
| $ | 100,000 | | | | 4.875 | | | | 01/22/21 | | | | 97,000 | |
| | 230,000 | | | | 2.625 | | | | 01/05/23 | | | | 186,875 | |
| | 20,000 | | | | 8.250 | | | | 01/20/34 | | | | 20,700 | |
| | 10,000 | | | | 7.125 | | | | 01/20/37 | | | | 9,375 | |
| | | | | | | | | | | | | | |
| | | | | | | | | | | | | 1,819,625 | |
| | |
| | Chile – 0.4% | |
| Republic of Chile (AA-/Aa3) | |
| CLP | 83,500,000 | | | | 5.500 | | | | 08/05/20 | | | | 123,808 | |
| | |
| | Colombia – 6.2% | |
| Republic of Colombia (NR/Baa2) | |
| COP | 192,000,000 | | | | 4.375 | | | | 03/21/23 | | | | 50,889 | |
| Republic of Colombia (BBB/NR) | |
| $ | 200,000 | | | | 4.500 | | | | 01/28/26 | | | | 195,097 | |
| Republic of Colombia (BBB/Baa2) | |
| COP | 212,000,000 | | | | 7.750 | | | | 04/14/21 | | | | 69,517 | |
| $ | 200,000 | | | | 4.375 | | | | 07/12/21 | | | | 203,700 | |
| | 310,000 | | | | 6.125 | | | | 01/18/41 | | | | 306,900 | |
| Republic of Colombia (BBB+/Baa2) | |
| COP | 62,800,000 | | | | 8.000 | | | | 10/28/15 | | | | 20,387 | |
| | 68,000,000 | | | | 7.250 | | | | 06/15/16 | | | | 22,241 | |
| | 12,300,000 | | | | 11.250 | | | | 10/24/18 | | | | 4,424 | |
| | 752,700,000 | | | | 7.000 | | | | 05/04/22 | | | | 235,219 | |
| | 192,400,000 | | | | 10.000 | | | | 07/24/24 | | | | 69,722 | |
| | 2,056,700,000 | | | | 7.500 | | | | 08/26/26 | | | | 621,485 | |
| | 69,800,000 | | | | 6.000 | | | | 04/28/28 | | | | 18,341 | |
| | 1,048,900,000 | | | | 7.750 | | | | 09/18/30 | | | | 306,480 | |
| | | | | | | | | | | | | | |
| | | | | | | | | | | | | 2,124,402 | |
| | |
| | Costa Rica – 0.8% | |
| Republic of Costa Rica (BB/Ba1) | |
| $ | 70,000 | | | | 9.995 | | | | 08/01/20 | | | | 84,612 | |
| | 200,000 | | | | 7.158 | | | | 03/12/45 | | | | 178,500 | |
| | | | | | | | | | | | | | |
| | | | | | | | | | | | | 263,112 | |
| | |
| | Croatia – 2.4% | |
| Republic of Croatia (BB/Ba1) | |
| | 100,000 | | | | 6.750 | | | | 11/05/19 | | | | 108,625 | |
| | 200,000 | | | | 6.625 | | | | 07/14/20 | | | | 217,000 | |
| | |
Principal
Amount | | | Interest
Rate | | | Maturity
Date | | | Value | |
| | Sovereign Debt Obligations – (continued) | |
| | Croatia – (continued) | |
| Republic of Croatia (BB/Ba1) – (continued) | |
| $ | 200,000 | | | | 6.375 | % | | | 03/24/21 | | | $ | 215,000 | |
| EUR | 100,000 | | | | 3.875 | | | | 05/30/22 | | | | 111,975 | |
| | 170,000 | | | | 3.000 | | | | 03/11/25 | | | | 171,912 | |
| | | | | | | | | | | | | | |
| | | | | | | | | | | | | 824,512 | |
| | |
| | Czech Republic(b) – 0.1% | |
| Czech Republic Government Bond (AA/NR) | |
| CZK | 990,000 | | | | 0.380 | | | | 10/27/16 | | | | 40,929 | |
| | |
| | Dominican Republic – 2.2% | |
| Dominican Republic (NR/NR) | |
| DOP | 1,900,000 | | | | 16.000 | | | | 07/10/20 | | | | 51,843 | |
| | 100,000 | | | | 16.950 | | | | 02/04/22 | | | | 2,939 | |
| | 5,800,000 | | | | 10.375 | | | | 03/04/22 | | | | 129,470 | |
| | 4,200,000 | | | | 11.375 | | | | 07/06/29 | | | | 96,213 | |
| Dominican Republic (BB-/B1) | |
| $ | 8,874 | | | | 9.040 | | | | 01/23/18 | | | | 9,406 | |
| | 150,000 | | | | 5.875 | | | | 04/18/24 | | | | 148,688 | |
| | 100,000 | | | | 7.450 | | | | 04/30/44 | | | | 102,125 | |
| | 140,000 | | | | 6.850 | (d) | | | 01/27/45 | | | | 134,575 | |
| | 100,000 | | | | 6.850 | | | | 01/27/45 | | | | 96,125 | |
| | | | | | | | | | | | | | |
| | | | | | | | | | | | | 771,384 | |
| | |
| | Egypt – 0.3% | |
| Republic of Egypt (B-/B3) | |
| | 100,000 | | | | 6.875 | | | | 04/30/40 | | | | 93,375 | |
| | |
| | El Salvador – 0.2% | |
| El Salvador Government International Bond (B+/Ba3) | |
| | 10,000 | | | | 7.750 | | | | 01/24/23 | | | | 9,925 | |
| | 10,000 | | | | 5.875 | | | | 01/30/25 | | | | 8,688 | |
| | 10,000 | | | | 8.250 | | | | 04/10/32 | | | | 9,775 | |
| | 60,000 | | | | 7.650 | | | | 06/15/35 | | | | 53,325 | |
| | | | | | | | | | | | | | |
| | | | | | | | | | | | | 81,713 | |
| | |
| | Ethiopia – 0.5% | |
| Republic of Ethiopia (B/B1) | |
| | 200,000 | | | | 6.625 | | | | 12/11/24 | | | | 183,500 | |
| | |
| | Free Of Tax – 0.2% | |
| Corporacion Andina de Fomento (AA-/Aa3) | |
| | 80,000 | | | | 1.500 | | | | 08/08/17 | | | | 80,691 | |
| | |
| | Guatemala – 0.6% | |
| Republic of Guatemala (BB/Ba1) | |
| | 200,000 | | | | 5.750 | | | | 06/06/22 | | | | 211,500 | |
| | |
| | Honduras – 0.6% | |
| Republic of Honduras (B+/B3) | |
| | 200,000 | | | | 7.500 | | | | 03/15/24 | | | | 208,750 | |
| | |
| | Hungary – 1.4% | |
| Hungary Government Bond (BB+/Ba1) | |
| EUR | 50,000 | | | | 4.375 | | | | 07/04/17 | | | | 59,417 | |
| $ | 30,000 | | | | 4.125 | | | | 02/19/18 | | | | 31,110 | |
| EUR | 140,000 | | | | 5.750 | | | | 06/11/18 | | | | 176,180 | |
| | 50,000 | | | | 6.000 | | | | 01/11/19 | | | | 64,694 | |
| $ | 20,000 | | | | 4.000 | | | | 03/25/19 | | | | 20,775 | |
| | 20,000 | | | | 6.250 | | | | 01/29/20 | | | | 22,447 | |
| | |
| | |
| The accompanying notes are an integral part of these financial statements. | | 45 |
GOLDMAN SACHS DYNAMIC EMERGING MARKETS DEBT FUND
Schedule of Investments (continued)
September 30, 2015 (Unaudited)
| | | | | | | | | | | | | | |
Principal
Amount | | | Interest
Rate | | | Maturity
Date | | | Value | |
| | Sovereign Debt Obligations – (continued) | |
| | Hungary – (continued) | |
| Hungary Government Bond (BB+/Ba1) – (continued) | |
| $ | 70,000 | | | | 5.375 | % | | | 02/21/23 | | | $ | 76,160 | |
| | 10,000 | | | | 5.750 | | | | 11/22/23 | | | | 11,118 | |
| | 10,000 | | | | 7.62 | | | | 03/29/41 | | | | 13,224 | |
| | | | | | | | | | | | | | |
| | | | | | | | | | | | | 475,125 | |
| | |
| | Indonesia – 2.2% | |
| Republic of Indonesia (BB+/Baa3) | |
| | 400,000 | | | | 3.750 | | | | 04/25/22 | | | | 380,000 | |
| | 200,000 | | | | 3.375 | | | | 04/15/23 | | | | 181,500 | |
| | 200,000 | | | | 6.750 | | | | 01/15/44 | | | | 211,750 | |
| | | | | | | | | | | | | | |
| | | | | | | | | | | | | 773,250 | |
| | |
| | Kazakhstan – 1.1% | |
| Republic of Kazakhstan (BBB/Baa2) | |
| | 200,000 | | | | 3.875 | | | | 10/14/24 | | | | 180,250 | |
| | 200,000 | | | | 5.125 | (d) | | | 07/21/25 | | | | 194,250 | |
| | | | | | | | | | | | | | |
| | | | | | | | | | | | | 374,500 | |
| | |
| | Kenya – 0.5% | |
| Republic of Kenya (B+/NR) | |
| | 200,000 | | | | 6.875 | | | | 06/24/24 | | | | 179,000 | |
| | |
| | Mexico – 12.0% | |
| Mexican Udibonos (A/A3) | |
| MXN | 264,424 | | | | 4.500 | | | | 12/04/25 | | | | 17,706 | |
| | 280,884 | | | | 4.000 | | | | 11/08/46 | | | | 17,699 | |
| United Mexican States (NR/NR)(c) | |
| | 6,451,800 | | | | 0.000 | | | | 10/01/15 | | | | 381,145 | |
| | 10,000,000 | | | | 0.000 | | | | 10/29/15 | | | | 589,811 | |
| | 3,496,280 | | | | 0.000 | | | | 11/19/15 | | | | 205,821 | |
| United Mexican States (NR/A3) | |
| | 7,837,700 | | | | 4.750 | | | | 06/14/18 | | | | 465,545 | |
| United Mexican States (A/A3) | |
| | 1,938,000 | | | | 7.750 | | | | 12/14/17 | | | | 123,289 | |
| | 9,503,500 | | | | 8.500 | | | | 12/13/18 | | | | 623,707 | |
| | 1,738,000 | | | | 5.000 | | | | 12/11/19 | | | | 102,388 | |
| | 564,200 | | | | 6.500 | | | | 06/10/21 | | | | 34,974 | |
| | 5,946,300 | | | | 6.500 | | | | 06/09/22 | | | | 364,971 | |
| | 4,141,700 | | | | 8.000 | | | | 12/07/23 | | | | 276,446 | |
| | 4,259,600 | | | | 10.000 | | | | 12/05/24 | | | | 321,586 | |
| | 740,200 | | | | 7.750 | | | | 11/23/34 | | | | 48,603 | |
| | 2,411,600 | | | | 8.500 | | | | 11/18/38 | | | | 169,655 | |
| United Mexican States (BBB+/A3) | |
| $ | 60,000 | | | | 3.625 | | | | 03/15/22 | | | | 60,540 | |
| | 90,000 | | | | 4.750 | | | | 03/08/44 | | | | 82,125 | |
| | 30,000 | | | | 5.550 | | | | 01/21/45 | | | | 30,750 | |
| | 200,000 | | | | 4.600 | | | | 01/23/46 | | | | 178,000 | |
| | 30,000 | | | | 5.750 | | | | 10/12/49 | | | | 28,050 | |
| | | | | | | | | | | | | | |
| | | | | | | | | | | | | 4,122,811 | |
| | |
| | Pakistan(d) – 0.6% | |
| Islamic Republic of Pakistan (NR/NR) | |
| | 200,000 | | | | 8.250 | | | | 09/30/25 | | | | 205,500 | |
| | |
| | Panama – 0.4% | |
| Panama Notas del Tesoro (BBB/NR) | |
| | 30,000 | | | | 4.875 | | | | 02/05/21 | | | | 31,617 | |
| | |
Principal
Amount | | | Interest
Rate | | | Maturity
Date | | | Value | |
| | Sovereign Debt Obligations – (continued) | |
| | Panama – (continued) | |
| Republic of Panama (BBB/Baa2) | |
| $ | 10,000 | | | | 9.375 | % | | | 04/01/29 | | | $ | 14,388 | |
| | 70,000 | | | | 6.700 | | | | 01/26/36 | | | | 83,300 | |
| | | | | | | | | | | | | | |
| | | | | | | | | | | | | 129,305 | |
| | |
| | Peru – 0.7% | |
| Republic of Peru (A-/A3) | |
| PEN | 297,000 | | | | 5.700 | %(d) | | | 08/12/24 | | | $ | 82,471 | |
| | 4,000 | | | | 8.200 | | | | 08/12/26 | | | | 1,287 | |
| | 521,000 | | | | 6.950 | | | | 08/12/31 | | | | 148,924 | |
| | 53,000 | | | | 6.900 | | | | 08/12/37 | | | | 14,677 | |
| | | | | | | | | | | | | | |
| | | | | | | | | | | | | 247,359 | |
| | |
| | Philippines – 0.7% | |
| Republic of Philippines (BBB/Baa2) | |
| $ | 200,000 | | | | 5.500 | | | | 03/30/26 | | | | 238,000 | |
| | |
| | Poland – 3.9% | |
| Poland Government Bond (A/NR) | |
| PLN | 990,000 | | | | 0.000 | (c) | | | 07/25/16 | | | | 257,041 | |
| | 2,100,000 | | | | 1.500 | | | | 04/25/20 | | | | 532,362 | |
| | 1,170,000 | | | | 3.250 | | | | 07/25/25 | | | | 318,200 | |
| Poland Government Bond (A/A2) | |
| | 360,000 | | | | 5.750 | | | | 09/23/22 | | | | 113,306 | |
| | 480,000 | | | | 4.000 | | | | 10/25/23 | | | | 137,535 | |
| | | | | | | | | | | | | | |
| | | | | | | | | | | | | 1,358,444 | |
| | |
| | Romania – 0.1% | |
| Republic of Romania (BBB-/Baa3) | |
| EUR | 30,000 | | | | 5.250 | | | | 06/17/16 | | | | 34,662 | |
| | |
| | Russia – 3.5% | |
| Russian Federation Bond (BB+/Ba1) | |
| $ | 400,000 | | | | 4.875 | | | | 09/16/23 | | | | 402,000 | |
| Russian Federation Bond (BBB-/Ba1) | |
| RUB | 4,720,000 | | | | 7.000 | | | | 01/25/23 | | | | 58,118 | |
| | 15,650,000 | | | | 7.000 | | | | 08/16/23 | | | | 190,567 | |
| | 28,570,000 | | | | 8.150 | | | | 02/03/27 | | | | 365,003 | |
| | 15,920,000 | | | | 7.050 | | | | 01/19/28 | | | | 183,539 | |
| | | | | | | | | | | | | | |
| | | | | | | | | | | | | 1,199,227 | |
| | |
| | South Africa – 4.7% | |
| Republic of South Africa (NR/NR) | |
| ZAR | 1,090,000 | | | | 8.875 | | | | 02/28/35 | | | | 77,324 | |
| Republic of South Africa (NR/Baa2) | |
| | 8,100,000 | | | | 7.750 | | | | 02/28/23 | | | | 566,706 | |
| | 1,170,000 | | | | 8.000 | | | | 01/31/30 | | | | 78,610 | |
| | 3,660,000 | | | | 8.250 | | | | 03/31/32 | | | | 248,981 | |
| | 180,000 | | | | 8.500 | | | | 01/31/37 | | | | 12,292 | |
| | 800,000 | | | | 8.750 | | | | 01/31/44 | | | | 55,670 | |
| | 1,790,000 | | | | 8.750 | | | | 02/28/48 | | | | 124,670 | |
| Republic of South Africa (BBB+/Baa2) | |
| | 940,000 | | | | 10.500 | | | | 12/21/26 | | | | 77,764 | |
| Republic of South Africa (BBB-/Baa2) | |
| $ | 150,000 | | | | 4.665 | | | | 01/17/24 | | | | 148,500 | |
| | 210,000 | | | | 5.875 | | | | 09/16/25 | | | | 223,545 | |
| | | | | | | | | | | | | | |
| | | | | | | | | | | | | 1,614,062 | |
| | |
| | |
| 46 | | The accompanying notes are an integral part of these financial statements. |
GOLDMAN SACHS DYNAMIC EMERGING MARKETS DEBT FUND
| | | | | | | | | | | | | | |
Principal
Amount | | | Interest
Rate | | | Maturity
Date | | | Value | |
| | Sovereign Debt Obligations – (continued) | |
| | Sri Lanka(d) – 0.6% | |
| Republic of Sri Lanka (B+/B1) | |
| $ | 200,000 | | | | 6.000 | % | | | 01/14/19 | | | $ | 203,000 | |
| | |
| | Thailand – 2.8% | |
| Thailand Government Bond (NR/Baa1) | |
| THB | 7,559,026 | | | | 1.250 | | | | 03/12/28 | | | | 172,587 | |
| Thailand Government Bond (A-/Baa1) | |
| | 4,520,000 | | | | 3.875 | | | | 06/13/19 | | | | 132,853 | |
| | 10,540,926 | | | | 1.200 | | | | 07/14/21 | | | | 269,443 | |
| | 6,695,000 | | | | 3.650 | | | | 12/17/21 | | | | 195,920 | |
| | 2,630,000 | | | | 3.625 | | | | 06/16/23 | | | | 76,935 | |
| | 4,110,000 | | | | 3.850 | | | | 12/12/25 | | | | 124,013 | |
| | | | | | | | | | | | | | |
| | | | | | | | | | | | | 971,751 | |
| | |
| | Turkey – 5.3% | |
| Republic of Turkey (NR/NR) | |
| TRY | 130,000 | | | | 8.500 | | | | 07/10/19 | | | | 39,659 | |
| | 20,000 | | | | 8.000 | | | | 03/12/25 | | | | 5,542 | |
| Republic of Turkey (NR/Baa3) | |
| $ | 100,000 | | | | 7.500 | | | | 07/14/17 | | | | 107,875 | |
| | 300,000 | | | | 6.750 | | | | 04/03/18 | | | | 324,000 | |
| | 330,000 | | | | 6.250 | | | | 09/26/22 | | | | 352,770 | |
| Turkey Government Bond (NR/NR) | |
| TRY | 210,000 | | | | 10.400 | | | | 03/27/19 | | | | 68,125 | |
| | 590,000 | | | | 7.400 | | | | 02/05/20 | | | | 170,559 | |
| | 1,500,000 | | | | 9.400 | | | | 07/08/20 | | | | 466,219 | |
| | 90,000 | | | | 7.100 | | | | 03/08/23 | | | | 24,010 | |
| | 180,000 | | | | 10.400 | | | | 03/20/24 | | | | 57,776 | |
| | 660,000 | | | | 9.000 | | | | 07/24/24 | | | | 193,089 | |
| | | | | | | | | | | | | | |
| | | | | | | | | | | | | 1,809,624 | |
| | |
| | Venezuela – 0.5% | |
| Republic of Venezuela (CCC/Caa3) | |
| $ | 10,000 | | | | 13.625 | | | | 08/15/18 | | | | 5,787 | |
| | 10,000 | | | | 7.750 | | | | 10/13/19 | | | | 3,425 | |
| | 40,000 | | | | 6.000 | | | | 12/09/20 | | | | 13,200 | |
| | 20,000 | | | | 12.750 | | | | 08/23/22 | | | | 8,550 | |
| | 40,000 | | | | 9.000 | | | | 05/07/23 | | | | 13,700 | |
| | 50,000 | | | | 8.250 | | | | 10/13/24 | | | | 16,750 | |
| | 40,000 | | | | 7.650 | | | | 04/21/25 | | | | 13,300 | |
| | 10,000 | | | | 11.750 | | | | 10/21/26 | | | | 3,850 | |
| | 50,000 | | | | 9.250 | | | | 09/15/27 | | | | 19,375 | |
| | 60,000 | | | | 9.250 | | | | 05/07/28 | | | | 20,100 | |
| | 30,000 | | | | 11.950 | | | | 08/05/31 | | | | 11,700 | |
| | 90,000 | | | | 9.375 | | | | 01/13/34 | | | | 31,050 | |
| | 10,000 | | | | 7.000 | | | | 03/31/38 | | | | 3,225 | |
| | | | | | | | | | | | | | |
| | | | | | | | | | | | | 164,012 | |
| | |
| | Vietnam – 0.5% | |
| Socialist Republic of Vietnam (BB-/B1) | |
| | 200,000 | | | | 4.800 | | | | 11/19/24 | | | | 189,250 | |
| | |
| | Zambia – 0.5% | |
| Republic of Zambia (B/NR) | |
| | 200,000 | | | | 8.500 | | | | 04/14/24 | | | | 160,000 | |
| | |
| | TOTAL SOVEREIGN DEBT OBLIGATIONS | |
| | (Cost $23,679,613) | | | $ | 21,566,409 | |
| | |
| | | | | | | | | | | | | | |
| | Corporate Obligations – 14.2% | |
| | Australia – 0.1% | |
| Toyota Finance Australia Ltd. (NR/NR) | |
| MXN | 330,000 | | | | 3.760 | % | | | 07/20/17 | | | $ | 19,045 | |
| | |
| | Brazil(b)(e) – 0.3% | |
| Banco do Brasil SA (B/NR) | |
| | 200,000 | | | | 6.250 | | | | 04/15/49 | | | | 94,000 | |
| | |
| | Chile – 2.4% | |
| AES Gener SA (BBB-/Baa3) | |
| | 170,000 | | | | 5.250 | | | | 08/15/21 | | | | 175,950 | |
| GNL Quintero SA (BBB/Baa2) | |
| | 290,000 | | | | 4.634 | (d) | | | 07/31/29 | | | | 283,475 | |
| | 200,000 | | | | 4.634 | | | | 07/31/29 | | | | 195,500 | |
| Sociedad Quimica y Minera de Chile SA (BBB/Baa1) | |
| | 200,000 | | | | 3.625 | | | | 04/03/23 | | | | 170,441 | |
| | | | | | | | | | | | | | |
| | | | | | | | | | | | | 825,366 | |
| | |
| | Colombia – 0.7% | |
| Banco de Bogota SA (BBB-/Baa2) | |
| | 200,000 | | | | 5.000 | | | | 01/15/17 | | | | 204,000 | |
| Ecopetrol SA (BBB/Baa2) | |
| | 30,000 | | | | 7.375 | | | | 09/18/43 | | | | 27,300 | |
| | | | | | | | | | | | | | |
| | | | | | | | | | | | | 231,300 | |
| | |
| | Dominican Republic(e)(f) – 0.6% | |
| Aeropuertos Dominicanos Siglo XXI SA (B/B1) | |
| | 200,000 | | | | 9.750 | | | | 11/13/19 | | | | 200,000 | |
| | |
| | Hong Kong(b)(e) – 0.2% | |
| Hutchison Whampoa International 10 Ltd. (BBB/Baa2) | |
| | 50,000 | | | | 6.000 | | | | 10/28/49 | | | | 50,000 | |
| | |
| | Israel(d) – 0.6% | |
| Delek & Avner Tamar Bond Ltd. (BBB-/Baa3) | |
| | 100,000 | | | | 2.803 | | | | 12/30/16 | | | | 100,000 | |
| | 100,000 | | | | 3.839 | | | | 12/30/18 | | | | 100,500 | |
| | | | | | | | | | | | | | |
| | | | | | | | | | | | | 200,500 | |
| | |
| | Ivory Coast(d) – 0.3% | |
| Agromercantil Senior Trust (BB/NR) | |
| | 100,000 | | | | 6.250 | | | | 04/10/19 | | | | 99,380 | |
| | |
| | Jamaica(d)(e) – 0.5% | |
| Digicel Group Ltd. (NR/Caa1) | |
| | 200,000 | | | | 8.250 | | | | 09/30/20 | | | | 184,900 | |
| | |
| | Kazakhstan – 0.6% | |
| KazMunayGas National Co. JSC (BB+/Baa3) | |
| | 190,000 | | | | 9.125 | | | | 07/02/18 | | | | 205,912 | |
| | |
| | Luxembourg(d)(e) – 1.2% | |
| Altice Financing SA (BB-/B1) | |
| EUR | 100,000 | | | | 5.250 | | | | 02/15/23 | | | | 110,064 | |
| Tupy Overseas SA (BB-/NR) | |
| $ | 200,000 | | | | 6.625 | | | | 07/17/24 | | | | 178,000 | |
| Wind Acquisition Finance SA (BB/Ba3) | |
| EUR | 110,000 | | | | 4.000 | | | | 07/15/20 | | | | 121,267 | |
| | | | | | | | | | | | | | |
| | | | | | | | | | | | | 409,331 | |
| | |
| | |
| The accompanying notes are an integral part of these financial statements. | | 47 |
GOLDMAN SACHS DYNAMIC EMERGING MARKETS DEBT FUND
Schedule of Investments (continued)
September 30, 2015 (Unaudited)
| | | | | | | | | | | | | | |
Principal
Amount | | | Interest
Rate | | | Maturity
Date | | | Value | |
| | Corporate Obligations – (continued) | |
| | Mexico – 1.4% | |
| Cemex SAB de CV (B+/NR)(d)(e) | |
| | EUR 100,000 | | | | 4.750 | % | | | 01/11/22 | | | $ | 105,594 | |
| Gruma SAB de CV (BBB-/NR)(e) | |
| $ | 200,000 | | | | 4.875 | | | | 12/01/24 | | | | 209,000 | |
| Grupo Televisa SAB (BBB+/Baa1) | |
| | 100,000 | | | | 6.000 | | | | 05/15/18 | | | | 109,200 | |
| Petroleos Mexicanos (NR/A3) | |
| MXN | 947,700 | | | | 7.470 | | | | 11/12/26 | | | | 51,576 | |
| | | | | | | | | | | | | | |
| | | | | | | | | | | | | 475,370 | |
| | |
| | Netherlands – 0.7% | |
| Myriad International Holding BV (NR/Baa3) | |
| $ | 100,000 | | | | 6.375 | | | | 07/28/17 | | | | 105,625 | |
| Petrobras Global Finance BV (BB/Ba2) | |
| | 10,000 | | | | 3.000 | | | | 01/15/19 | | | | 7,239 | |
| | 20,000 | | | | 4.875 | | | | 03/17/20 | | | | 14,500 | |
| | 60,000 | | | | 4.375 | | | | 05/20/23 | | | | 39,119 | |
| | 20,000 | | | | 6.250 | | | | 03/17/24 | | | | 14,406 | |
| Petrobras International Finance Co. (BB/Ba2) | |
| | 100,000 | | | | 5.375 | | | | 01/27/21 | | | | 72,660 | |
| | | | | | | | | | | | | | |
| | | | | | | | | | | | | 253,549 | |
| | |
| | Paraguay(d) – 0.4% | |
| Banco Regional SAECA (BB-/Ba1) | |
| | 150,000 | | | | 8.125 | | | | 01/24/19 | | | | 150,152 | |
| | |
| | Peru – 1.5% | |
| Abengoa Transmision Sur SA (BBB-/NR)(d) | |
| | 200,000 | | | | 6.875 | | | | 04/30/43 | | | | 210,000 | |
| Corp Lindley S.A. (BB+/NR) | |
| | 290,000 | | | | 6.750 | | | | 11/23/21 | | | | 317,550 | |
| | | | | | | | | | | | | | |
| | | | | | | | | | | | | 527,550 | |
| | |
| | Philippines – 0.3% | |
| Energy Development Corp. (NR/NR) | |
| | 100,000 | | | | 6.500 | | | | 01/20/21 | | | | 109,750 | |
| | |
| | Turkey(e) – 0.5% | |
| Global Liman Isletmeleri (NR/B1) | |
| | 200,000 | | | | 8.125 | | | | 11/14/21 | | | | 169,053 | |
| | |
| | United Arab Emirates – 1.3% | |
| Dolphin Energy Ltd. (NR/A1) | |
| | 200,000 | | | | 5.500 | | | | 12/15/21 | | | | 225,250 | |
| Ruwais Power Co. PJSC (A-/A3)(d) | |
| | 200,000 | | | | 6.000 | | | | 08/31/36 | | | | 223,000 | |
| | | | | | | | | | | | | | |
| | | | | | | | | | | | | 448,250 | |
| | |
| | United Kingdom – 0.4% | |
| Vedanta Resources PLC (BB-/Ba3) | |
| | 200,000 | | | | 8.250 | | | | 06/07/21 | | | | 144,500 | |
| | |
| | Venezuela – 0.2% | |
| Petroleos de Venezuela SA (CCC/NR) | |
| | 20,000 | | | | 9.000 | | | | 11/17/21 | | | | 7,180 | |
| | 40,000 | | | | 6.000 | | | | 05/16/24 | | | | 13,000 | |
| | |
| | Corporate Obligations – (continued) | |
| | Venezuela – (continued) | |
| Petroleos de Venezuela SA (CCC/NR) – (continued) | |
| $ | 200,000 | | | | 6.000 | % | | | 11/15/26 | | | $ | 63,270 | |
| | | | | | | | | | | | | | |
| | | | | | | | | | | | | 83,450 | |
| | |
| | TOTAL CORPORATE OBLIGATIONS | |
| | (Cost $5,077,617) | | | $ | 4,881,358 | |
| | |
| | | | | | | | | | | | | | |
| | Structured Notes(d) – 3.3% | |
| | Indonesia – 3.3% | |
| Republic of Indonesia (Issuer Deutsche Bank AG (London))
(NR/NR) |
|
| IDR | 3,000,000,000 | | | | 8.375 | % | | | 03/20/24 | | | $ | 191,160 | |
| | 4,100,000,000 | | | | 9.000 | | | | 03/20/29 | | | | 264,471 | |
| | 2,200,000,000 | | | | 8.250 | | | | 06/17/32 | | | | 131,024 | |
| Republic of Indonesia (Issuer Standard Chartered Bank) (NR/NR) | |
| | 5,570,000,000 | | | | 8.375 | | | | 03/19/24 | | | | 354,921 | |
| | 1,026,000,000 | | | | 9.000 | | | | 03/19/29 | | | | 66,182 | |
| | 1,110,000,000 | | | | 9.000 | | | | 03/19/29 | | | | 71,601 | |
| | 1,050,000,000 | | | | 8.750 | | | | 05/19/31 | | | | 66,081 | |
| | |
| | TOTAL STRUCTURED NOTES | |
| | (Cost $1,467,606) | | | $ | 1,145,440 | |
| | |
| | | | | | | | | | | | | | |
| | Municipal Debt Obligations – 1.1% | |
| | Puerto Rico – 1.1% | |
| Puerto Rico Commonwealth Aqueduct & Sewer Authority RB
(Senior Lien) Series 2008 A (CCC-/Caa3) |
|
| $ | 20,000 | | | | 6.000 | % | | | 07/01/44 | | | $ | 13,850 | |
| Puerto Rico Commonwealth Aqueduct & Sewer Authority RB
(Senior Lien) Series 2012 A (CCC-/Caa3) |
|
| | 5,000 | | | | 5.125 | | | | 07/01/37 | | | | 3,388 | |
| Puerto Rico Commonwealth Aqueduct & Sewer Authority RB
(Senior Lien) Series 2012 D (CCC-/Caa3) |
|
| | 5,000 | | | | 5.000 | | | | 07/01/33 | | | | 3,388 | |
| Puerto Rico Commonwealth GO Bonds Refunding for Public
Improvement Series 2008 A (CC/Caa3) |
|
| | 20,000 | | | | 5.500 | | | | 07/01/32 | | | | 13,025 | |
| Puerto Rico Commonwealth GO Bonds Refunding for Public
Improvement Series 2012 A (CC/Caa3) |
|
| | 15,000 | | | | 5.500 | | | | 07/01/26 | | | | 9,881 | |
| | 20,000 | | | | 5.500 | | | | 07/01/39 | | | | 12,950 | |
| Puerto Rico Commonwealth GO Bonds Series 2008 A (CC/Caa3) | |
| | 15,000 | | | | 5.375 | | | | 07/01/33 | | | | 9,731 | |
| Puerto Rico Sales Tax Financing Corp. Sales Tax RB
SubSeries 2009 A (CC/Ca) |
|
| | 30,000 | | | | 0.000 | (c) | | | 08/01/32 | | | | 12,190 | |
| | 25,000 | | | | 6.000 | | | | 08/01/42 | | | | 10,563 | |
| Puerto Rico Sales Tax Financing Corp. Sales Tax RB
SubSeries 2010 A (CC/Ca) |
|
| | 15,000 | | | | 5.500 | | | | 08/01/37 | | | | 6,319 | |
| | 55,000 | | | | 5.375 | | | | 08/01/39 | | | | 23,169 | |
| | 35,000 | | | | 5.500 | | | | 08/01/42 | | | | 14,744 | |
| | |
| | |
| 48 | | The accompanying notes are an integral part of these financial statements. |
GOLDMAN SACHS DYNAMIC EMERGING MARKETS DEBT FUND
| | | | | | | | | | | | | | |
Principal
Amount | | | Interest
Rate | | | Maturity
Date | | | Value | |
| | Municipal Debt Obligations – 1.1% | |
| | Puerto Rico – (continued) | |
| Puerto Rico Sales Tax Financing Corp. Sales Tax RB
SubSeries 2010 C (CC/Ca) |
|
| $ | 5,000 | | | | 5.000 | % | | | 08/01/35 | | | $ | 2,106 | |
| | 10,000 | | | | 6.000 | | | | 08/01/39 | | | | 4,225 | |
| | 430,000 | | | | 5.250 | | | | 08/01/41 | | | | 181,137 | |
| Puerto Rico Sales Tax Financing Corp. Sales Tax RB
SubSeries 2011 A-1 (CC/Ca) |
|
| | 75,000 | | | | 5.000 | | | | 08/01/43 | | | | 31,594 | |
| Puerto Rico Sales Tax Financing Corp. Sales Tax RB Unrefunded
SubSeries 2009 A (CC/Ca) |
|
| | 45,000 | | | | 5.500 | | | | 08/01/28 | | | | 19,406 | |
| | 35,000 | | | | 6.125 | | | | 08/01/29 | | | | 15,181 | |
| | |
| | TOTAL MUNICIPAL DEBT OBLIGATIONS | |
| | (Cost $499,832) | | | $ | 386,847 | |
| | |
Principal
Amount | | | Interest
Rate | | | Maturity
Date | | | Value | |
| | U.S. Treasury Obligations – 3.9% | |
| United States Treasury Notes | |
| $ | 600,000 | | | | 2.250 | % | | | 04/30/21 | | | $ | 622,854 | |
| | 400,000 | | | | 1.750 | | | | 09/30/22 | | | | 399,844 | |
| | 300,000 | | | | 2.250 | | | | 11/15/24 | | | | 305,634 | |
| | |
| | TOTAL U.S. TREASURY OBLIGATIONS | |
| | (Cost $1,313,134) | | | $ | 1,328,332 | |
| | |
| TOTAL INVESTMENTS BEFORE SHORT-TERM
INVESTMENT |
|
| | (Cost $32,037,802) | | | $ | 29,308,386 | |
| | |
| | | | | | | | | | | | | | |
| | Short-term Investment(g) – 16.2% | |
| | Repurchase Agreements – 16.2% | |
| Joint Repurchase Agreement Account II | |
| $ | 5,600,000 | | | | 0.122 | % | | | 10/01/15 | | | $ | 5,600,000 | |
| | (Cost $5,600,000) | | | | | | | | | |
| | |
| | TOTAL INVESTMENTS – 101.3% | |
| | (Cost $37,637,802) | | | $ | 34,908,386 | |
| | |
| LIABILITIES IN EXCESS OF
OTHER ASSETS – (1.3)% |
| | | (463,450 | ) |
| | |
| | NET ASSETS – 100.0% | | | $ | 34,444,936 | |
| | |
| | |
| The percentage shown for each investment category reflects the value of investments in that category as a percentage of net assets. |
(a) | | Security is currently in default and/or non-income producing. |
(b) | | Variable rate security. Interest rate or distribution rate disclosed is that which is in effect on September 30, 2015. |
(c) | | Issued with a zero coupon. Income is recognized through the accretion of discount. |
| | |
(d) | | Exempt from registration under Rule 144A of the Securities Act of 1933. Under procedures approved by the Board of Trustees, such securities have been determined to be liquid by the investment adviser and may be resold, normally to qualified institutional buyers in transactions exempt from registration. Total market value of Rule 144A securities amounts to $3,831,568, which represents approximately 11.1% of net assets as of September 30, 2015. |
(e) | | Security with “Call” features with resetting interest rates. Maturity dates disclosed are the final maturity dates. |
(f) | | Coupon changes periodically based upon a predetermined schedule. Interest rate disclosed is that which is in effect on September 30, 2015. |
(g) | | Joint repurchase agreement was entered into on September 30, 2015. Additional information appears on page 119. |
Security ratings disclosed, if any, are obtained from by Standard & Poor’s/Moody’s Investor Service and are unaudited. A brief description of the ratings is available in the Fund’s Statement of Additional Information.
| | |
|
Currency Abbreviations: |
AED | | —United Arab Emirates Dirham |
BRL | | —Brazilian Real |
CLP | | —Chilean Peso |
CNH | | —Chinese Yuan Renminbi Offshore |
COP | | —Colombian Peso |
CZK | | —Czech Koruna |
DOP | | —Dominican Peso |
EUR | | —Euro |
HUF | | —Hungarian Forint |
IDR | | —Indonesian Rupiah |
ILS | | —Israeli Shekel |
INR | | —Indian Rupee |
KRW | | —South Korean Won |
MXN | | —Mexican Peso |
MYR | | —Malaysian Ringgit |
NGN | | —Nigerian Naira |
PEN | | —Peruvian Nuevo Sol |
PHP | | —Philippine Peso |
PLN | | —Polish Zloty |
RON | | —New Romanian Leu |
RUB | | —Russian Ruble |
SGD | | —Singapore Dollar |
THB | | —Thai Baht |
TRY | | —Turkish Lira |
TWD | | —Taiwan Dollar |
USD | | —U.S. Dollar |
ZAR | | —South African Rand |
| | |
Investment Abbreviations: |
CLICP | | —Sinacofi Chile Interbank Rate |
DTF | | —Depositos Termino Fijo |
EURO | | —Euro Offered Rate |
GO | | —General Obligation |
JIBAR | | —Johannesburg Interbank Agreed Rate |
LLC | | —Limited Liability Company |
MIBOR | | —Mumbai Interbank Offered Rate |
NR | | —Not Rated |
RB | | —Revenue Bond |
TIIE | | —La Tasa de Interbank Equilibrium Interest Rate |
|
| | |
| The accompanying notes are an integral part of these financial statements. | | 49 |
GOLDMAN SACHS DYNAMIC EMERGING MARKETS DEBT FUND
Schedule of Investments (continued)
September 30, 2015 (Unaudited)
|
| ADDITIONAL INVESTMENT INFORMATION |
FORWARD FOREIGN CURRENCY EXCHANGE CONTRACTS — At September 30, 2015, the Fund had the following forward foreign currency exchange contracts:
FORWARD FOREIGN CURRENCY EXCHANGE CONTRACTS WITH UNREALIZED GAIN
| | | | | | | | | | | | | | | | | | | | | | | | | | | | |
| Counterparty | | Currency
Purchased | | | Currency
Sold | | | Current
Value | | | Settlement
Date | | | Unrealized
Gain | |
Bank of America Securities LLC | | | TRY | | | | 868,500 | | | | USD | | | | 277,840 | | | $ | 280,226 | | | | 12/16/15 | | | $ | 2,386 | |
| | | USD | | | | 21,825 | | | | MXN | | | | 346,656 | | | | 20,505 | | | | 10/01/15 | | | | 1,320 | |
Barclays Bank PLC | | | INR | | | | 3,690,540 | | | | USD | | | | 55,960 | | | | 56,112 | | | | 10/19/15 | | | | 152 | |
| | | USD | | | | 55,000 | | | | TRY | | | | 167,682 | | | | 54,104 | | | | 12/16/15 | | | | 896 | |
| | | USD | | | | 56,089 | | | | TWD | | | | 1,825,697 | | | | 55,402 | | | | 10/02/15 | | | | 688 | |
| | | USD | | | | 55,865 | | | | TWD | | | | 1,820,927 | | | | 55,043 | | | | 10/26/15 | | | | 822 | |
| | | ZAR | | | | 5,972,783 | | | | USD | | | | 421,351 | | | | 425,008 | | | | 12/17/15 | | | | 3,657 | |
BNP Paribas SA | | | EUR | | | | 75,000 | | | | PLN | | | | 318,238 | | | | 83,918 | | | | 12/16/15 | | | | 363 | |
| | | USD | | | | 416,632 | | | | AED | | | | 1,532,802 | | | | 416,386 | | | | 08/11/16 | | | | 246 | |
| | | USD | | | | 299,139 | | | | AED | | | | 1,100,983 | | | | 299,074 | | | | 08/15/16 | | | | 65 | |
| | | USD | | | | 117,119 | | | | CLP | | | | 76,584,000 | | | | 109,790 | | | | 10/23/15 | | | | 7,329 | |
| | | USD | | | | 40,550 | | | | CZK | | | | 968,139 | | | | 39,887 | | | | 12/16/15 | | | | 664 | |
| | | USD | | | | 55,354 | | | | TWD | | | | 1,802,595 | | | | 54,635 | | | | 10/05/15 | | | | 719 | |
| | | USD | | | | 107,950 | | | | TWD | | | | 3,572,056 | | | | 107,917 | | | | 11/30/15 | | | | 33 | |
Citibank NA | | | USD | | | | 55,369 | | | | CNH | | | | 362,071 | | | | 55,313 | | | | 09/01/16 | | | | 55 | |
| | | USD | | | | 39,226 | | | | KRW | | | | 46,379,988 | | | | 39,118 | | | | 10/05/15 | | | | 108 | |
| | | USD | | | | 93,451 | | | | KRW | | | | 110,991,238 | | | | 93,434 | | | | 12/04/15 | | | | 16 | |
| | | USD | | | | 130,856 | | | | SGD | | | | 185,770 | | | | 130,203 | | | | 12/16/15 | | | | 653 | |
Credit Suisse International (London) | | | COP | | | | 176,479,820 | | | | USD | | | | 56,455 | | | | 56,958 | | | | 10/29/15 | | | | 502 | |
| | | USD | | | | 296,518 | | | | COP | | | | 830,770,478 | | | | 268,320 | | | | 10/23/15 | | | | 28,198 | |
Deutsche Bank AG | | | HUF | | | | 63,275,946 | | | | USD | | | | 224,510 | | | | 225,509 | | | | 12/16/15 | | | | 999 | |
| | | ILS | | | | 161,519 | | | | USD | | | | 41,000 | | | | 41,173 | | | | 10/02/15 | | | | 173 | |
| | | ILS | | | | 161,519 | | | | USD | | | | 41,089 | | | | 41,218 | | | | 12/16/15 | | | | 129 | |
| | | INR | | | | 5,073,083 | | | | USD | | | | 76,679 | | | | 77,133 | | | | 10/19/15 | | | | 454 | |
| | | KRW | | | | 131,617,057 | | | | USD | | | | 110,315 | | | | 111,028 | | | | 10/02/15 | | | | 713 | |
| | | MXN | | | | 4,998,000 | | | | USD | | | | 293,238 | | | | 293,824 | | | | 12/16/15 | | | | 586 | |
| | | MYR | | | | 806,000 | | | | USD | | | | 182,065 | | | | 183,528 | | | | 10/20/15 | | | | 1,464 | |
| | | THB | | | | 6,188,780 | | | | USD | | | | 169,000 | | | | 170,199 | | | | 11/20/15 | | | | 1,199 | |
| | | TWD | | | | 3,612,097 | | | | USD | | | | 109,358 | | | | 109,611 | | | | 10/02/15 | | | | 252 | |
| | | USD | | | | 29,486 | | | | COP | | | | 85,068,000 | | | | 27,475 | | | | 10/23/15 | | | | 2,011 | |
| | | USD | | | | 74,214 | | | | COP | | | | 229,450,000 | | | | 74,080 | | | | 10/26/15 | | | | 134 | |
| | | USD | | | | 72,917 | | | | IDR | | | | 1,010,990,400 | | | | 68,241 | | | | 10/30/15 | | | | 4,676 | |
| | | USD | | | | 385,190 | | | | ILS | | | | 1,489,227 | | | | 380,038 | | | | 12/16/15 | | | | 5,153 | |
| | | USD | | | | 167,382 | | | | KRW | | | | 194,832,648 | | | | 164,221 | | | | 10/21/15 | | | | 3,161 | |
| | | USD | | | | 217,656 | | | | SGD | | | | 305,119 | | | | 213,853 | | | | 12/16/15 | | | | 3,803 | |
| | | USD | | | | 55,000 | | | | TWD | | | | 1,786,400 | | | | 54,209 | | | | 10/02/15 | | | | 791 | |
| | | USD | | | | 148,704 | | | | TWD | | | | 4,812,061 | | | | 145,459 | | | | 10/26/15 | | | | 3,245 | |
HSBC Bank PLC | | | PHP | | | | 2,569,644 | | | | USD | | | | 54,453 | | | | 54,926 | | | | 10/19/15 | | | | 473 | |
| | | TRY | | | | 254,402 | | | | USD | | | | 82,000 | | | | 82,084 | | | | 12/16/15 | | | | 84 | |
| | | USD | | | | 55,000 | | | | BRL | | | | 211,728 | | | | 53,364 | | | | 10/02/15 | | | | 1,636 | |
| | | USD | | | | 162,081 | | | | ILS | | | | 631,483 | | | | 161,149 | | | | 12/16/15 | | | | 932 | |
| | | USD | | | | 55,000 | | | | TWD | | | | 1,779,921 | | | | 53,948 | | | | 10/05/15 | | | | 1,052 | |
| | | USD | | | | 54,145 | | | | TWD | | | | 1,753,091 | | | | 53,029 | | | | 10/19/15 | | | | 1,116 | |
JPMorgan Securities, Inc. | | | CNH | | | | 777,959 | | | | USD | | | | 120,000 | | | | 121,090 | | | | 12/16/15 | | | | 1,090 | |
| | | HUF | | | | 61,727,129 | | | | USD | | | | 219,482 | | | | 219,990 | | | | 12/16/15 | | | | 508 | |
| | | INR | | | | 3,667,593 | | | | USD | | | | 55,444 | | | | 55,623 | | | | 11/03/15 | | | | 179 | |
| | | RUB | | | | 12,548,145 | | | | USD | | | | 190,000 | | | | 190,104 | | | | 10/21/15 | | | | 104 | |
| | | USD | | | | 56,133 | | | | KRW | | | | 66,480,557 | | | | 56,081 | | | | 10/02/15 | | | | 52 | |
| | | USD | | | | 475,145 | | | | MXN | | | | 7,394,681 | | | | 437,393 | | | | 10/01/15 | | | | 37,752 | |
| | | USD | | | | 446,993 | | | | PLN | | | | 1,655,245 | | | | 434,595 | | | | 12/16/15 | | | | 12,398 | |
| | | USD | | | | 95,155 | | | | TWD | | | | 3,141,057 | | | | 94,894 | | | | 12/04/15 | | | | 261 | |
| | |
| 50 | | The accompanying notes are an integral part of these financial statements. |
GOLDMAN SACHS DYNAMIC EMERGING MARKETS DEBT FUND
|
| ADDITIONAL INVESTMENT INFORMATION (continued) |
FORWARD FOREIGN CURRENCY EXCHANGE CONTRACTS WITH UNREALIZED GAIN (continued)
| | | | | | | | | | | | | | | | | | | | | | | | | | | | |
| Counterparty | | Currency
Purchased | | | Currency
Sold | | | Current
Value | | | Settlement
Date | | | Unrealized
Gain | |
Morgan Stanley & Co. | | | BRL | | | | 1,165,128 | | | | USD | | | | 290,722 | | | $ | 293,662 | | | | 10/02/15 | | | $ | 2,940 | |
| | | USD | | | | 110,000 | | | | BRL | | | | 427,520 | | | | 107,753 | | | | 10/02/15 | | | | 2,247 | |
| | | USD | | | | 30,457 | | | | ZAR | | | | 428,000 | | | | 30,455 | | | | 12/17/15 | | | | 2 | |
Royal Bank of Canada | | | USD | | | | 34,645 | | | | BRL | | | | 124,742 | | | | 31,440 | | | | 10/02/15 | | | | 3,205 | |
| | | USD | | | | 20,053 | | | | MXN | | | | 310,905 | | | | 18,390 | | | | 10/01/15 | | | | 1,663 | |
| | | USD | | | | 208,148 | | | | MXN | | | | 3,441,305 | | | | 202,743 | | | | 11/19/15 | | | | 5,405 | |
| | | USD | | | | 856,146 | | | | MXN | | | | 14,302,896 | | | | 840,843 | | | | 12/16/15 | | | | 15,303 | |
Royal Bank of Scotland PLC | | | CLP | | | | 262,866,225 | | | | USD | | | | 376,000 | | | | 376,732 | | | | 10/26/15 | | | | 732 | |
| | | COP | | | | 219,150,040 | | | | USD | | | | 69,562 | | | | 70,933 | | | | 10/05/15 | | | | 1,371 | |
| | | TRY | | | | 170,939 | | | | USD | | | | 55,000 | | | | 55,154 | | | | 12/16/15 | | | | 154 | |
| | | USD | | | | 110,000 | | | | TRY | | | | 338,643 | | | | 109,264 | | | | 12/16/15 | | | | 736 | |
Standard Chartered Bank | | | CNH | | | | 1,069,614 | | | | USD | | | | 165,000 | | | | 166,487 | | | | 12/16/15 | | | | 1,487 | |
| | | COP | | | | 159,914,553 | | | | USD | | | | 49,448 | | | | 51,778 | | | | 10/02/15 | | | | 2,330 | |
| | | NGN | | | | 10,134,000 | | | | USD | | | | 47,355 | | | | 50,795 | | | | 10/06/15 | | | | 3,440 | |
| | | USD | | | | 274,000 | | | | CNH | | | | 1,753,740 | | | | 272,972 | | | | 12/16/15 | | | | 1,028 | |
| | | USD | | | | 309,918 | | | | EUR | | | | 271,516 | | | | 303,802 | | | | 12/16/15 | | | | 6,116 | |
| | | USD | | | | 55,000 | | | | KRW | | | | 64,611,250 | | | | 54,494 | | | | 10/05/15 | | | | 506 | |
| | | USD | | | | 82,000 | | | | KRW | | | | 96,584,192 | | | | 81,403 | | | | 10/23/15 | | | | 597 | |
| | | USD | | | | 544,814 | | | | MXN | | | | 9,200,274 | | | | 540,868 | | | | 12/16/15 | | | | 3,946 | |
| | | USD | | | | 527,258 | | | | ZAR | | | | 7,094,330 | | | | 504,815 | | | | 12/17/15 | | | | 22,443 | |
UBS AG (London) | | | BRL | | | | 783,454 | | | | USD | | | | 187,721 | | | | 195,238 | | | | 11/04/15 | | | | 7,516 | |
| | | EUR | | | | 73,000 | | | | HUF | | | | 22,888,420 | | | | 81,681 | | | | 12/16/15 | | | | 109 | |
| | | INR | | | | 4,184,934 | | | | USD | | | | 62,686 | | | | 63,629 | | | | 10/19/15 | | | | 943 | |
| | | USD | | | | 167,722 | | | | BRL | | | | 651,680 | | | | 164,251 | | | | 10/02/15 | | | | 3,472 | |
| | | USD | | | | 55,000 | | | | KRW | | | | 65,136,500 | | | | 54,947 | | | | 10/02/15 | | | | 53 | |
| | | USD | | | | 42,000 | | | | KRW | | | | 49,023,198 | | | | 41,321 | | | | 10/21/15 | | | | 679 | |
Westpac Banking Corp. | | | USD | | | | 1,664,850 | | | | EUR | | | | 1,474,010 | | | | 1,649,287 | | | | 12/16/15 | | | | 15,562 | |
| | | | USD | | | | 95,752 | | | | TWD | | | | 3,136,357 | | | | 95,060 | | | | 10/05/15 | | | | 692 | |
| TOTAL | | | | | | | | | | | | | | | | | | | | | | | | | | $ | 240,129 | |
FORWARD FOREIGN CURRENCY EXCHANGE CONTRACTS WITH UNREALIZED LOSS
| | | | | | | | | | | | | | | | | | | | | | | | | | | | |
| Counterparty | | Currency
Purchased | | | Currency
Sold | | | Current
Value | | | Settlement
Date | | | Unrealized
Loss | |
Bank of America Securities LLC | | | CLP | | | | 31,745,760 | | | | USD | | | | 46,089 | | | $ | 45,515 | | | | 10/22/15 | | | $ | (574 | ) |
| | | PLN | | | | 207,291 | | | | EUR | | | | 49,000 | | | | 54,426 | | | | 12/16/15 | | | | (402 | ) |
| | | PLN | | | | 635,197 | | | | USD | | | | 168,099 | | | | 166,775 | | | | 12/16/15 | | | | (1,324 | ) |
| | | USD | | | | 22,335 | | | | RUB | | | | 1,487,298 | | | | 22,532 | | | | 10/21/15 | | | | (197 | ) |
Barclays Bank PLC | | | PHP | | | | 2,926,000 | | | | USD | | | | 64,188 | | | | 62,501 | | | | 10/30/15 | | | | (1,686 | ) |
| | | USD | | | | 184,454 | | | | CNH | | | | 1,228,466 | | | | 187,672 | | | | 09/01/16 | | | | (3,218 | ) |
| | | USD | | | | 82,000 | | | | INR | | | | 5,446,407 | | | | 82,809 | | | | 10/19/15 | | | | (809 | ) |
| | | ZAR | | | | 1,143,311 | | | | USD | | | | 83,000 | | | | 81,355 | | | | 12/17/15 | | | | (1,645 | ) |
BNP Paribas SA | | | IDR | | | | 782,190,000 | | | | USD | | | | 54,000 | | | | 52,797 | | | | 10/30/15 | | | | (1,203 | ) |
| | | PLN | | | | 636,815 | | | | USD | | | | 168,823 | | | | 167,200 | | | | 12/16/15 | | | | (1,623 | ) |
| | | USD | | | | 195,102 | | | | AED | | | | 718,244 | | | | 195,106 | | | | 08/15/16 | | | | (4 | ) |
Citibank NA | | | BRL | | | | 842,266 | | | | USD | | | | 259,478 | | | | 212,287 | | | | 10/02/15 | | | | (47,191 | ) |
| | | CLP | | | | 73,077,200 | | | | USD | | | | 106,063 | | | | 104,865 | | | | 10/13/15 | | | | (1,198 | ) |
| | | COP | | | | 1,570,762,900 | | | | USD | | | | 511,000 | | | | 507,138 | | | | 10/26/15 | | | | (3,862 | ) |
| | | HUF | | | | 61,362,938 | | | | USD | | | | 219,040 | | | | 218,692 | | | | 12/16/15 | | | | (348 | ) |
| | | KRW | | | | 110,991,238 | | | | USD | | | | 93,648 | | | | 93,612 | | | | 10/05/15 | | | | (36 | ) |
| | | MXN | | | | 1,672,820 | | | | USD | | | | 98,843 | | | | 98,342 | | | | 12/16/15 | | | | (501 | ) |
| | |
| The accompanying notes are an integral part of these financial statements. | | 51 |
GOLDMAN SACHS DYNAMIC EMERGING MARKETS DEBT FUND
Schedule of Investments (continued)
September 30, 2015 (Unaudited)
|
| ADDITIONAL INVESTMENT INFORMATION (continued) |
FORWARD FOREIGN CURRENCY EXCHANGE CONTRACTS WITH UNREALIZED LOSS (continued)
| | | | | | | | | | | | | | | | | | | | | | | | | | | | |
| Counterparty | | Currency
Purchased | | | Currency
Sold | | | Current
Value | | | Settlement
Date | | | Unrealized
Loss | |
Citibank NA (continued) | | | USD | | | | 171,558 | | | | CNH | | | | 1,109,519 | | | $ | 172,698 | | | | 12/16/15 | | | $ | (1,140 | ) |
| | | USD | | | | 72,503 | | | | COP | | | | 226,190,285 | | | | 73,236 | | | | 10/02/15 | | | | (734 | ) |
| | | USD | | | | 55,000 | | | | ZAR | | | | 774,769 | | | | 55,131 | | | | 12/17/15 | | | | (131 | ) |
Credit Suisse International (London) | | | USD | | | | 163,000 | | | | RUB | | | | 10,922,500 | | | | 165,475 | | | | 10/21/15 | | | | (2,475 | ) |
Deutsche Bank AG | | | COP | | | | 229,450,000 | | | | USD | | | | 74,424 | | | | 74,268 | | | | 10/05/15 | | | | (157 | ) |
| | | COP | | | | 193,512,894 | | | | USD | | | | 71,289 | | | | 62,500 | | | | 10/23/15 | | | | (8,788 | ) |
| | | MYR | | | | 1,272,164 | | | | USD | | | | 329,764 | | | | 289,649 | | | | 10/23/15 | | | | (40,115 | ) |
| | | MYR | | | | 271,301 | | | | USD | | | | 63,000 | | | | 61,758 | | | | 10/30/15 | | | | (1,242 | ) |
| | | THB | | | | 10,090,340 | | | | USD | | | | 278,585 | | | | 277,496 | | | | 11/20/15 | | | | (1,089 | ) |
| | | USD | | | | 204,791 | | | | CNH | | | | 1,360,983 | | | | 207,916 | | | | 09/01/16 | | | | (3,125 | ) |
| | | USD | | | | 95,000 | | | | INR | | | | 6,291,588 | | | | 95,659 | | | | 10/19/15 | | | | (659 | ) |
| | | USD | | | | 86,000 | | | | INR | | | | 5,715,844 | | | | 86,686 | | | | 11/03/15 | | | | (686 | ) |
| | | USD | | | | 173,156 | | | | KRW | | | | 206,843,000 | | | | 174,277 | | | | 11/02/15 | | | | (1,122 | ) |
| | | USD | | | | 181,900 | | | | MYR | | | | 806,000 | | | | 183,530 | | | | 10/05/15 | | | | (1,630 | ) |
| | | USD | | | | 127,000 | | | | SGD | | | | 182,140 | | | | 127,659 | | | | 12/16/15 | | | | (659 | ) |
| | | USD | | | | 109,012 | | | | TWD | | | | 3,612,097 | | | | 109,127 | | | | 11/30/15 | | | | (115 | ) |
| | | ZAR | | | | 4,338,065 | | | | USD | | | | 313,872 | | | | 308,686 | | | | 12/17/15 | | | | (5,187 | ) |
HSBC Bank PLC | | | BRL | | | | 741,605 | | | | USD | | | | 193,318 | | | | 186,916 | | | | 10/02/15 | | | | (6,402 | ) |
| | | MYR | | | | 806,000 | | | | USD | | | | 186,509 | | | | 183,530 | | | | 10/05/15 | | | | (2,979 | ) |
| | | MYR | | | | 379,453 | | | | USD | | | | 89,103 | | | | 86,431 | | | | 10/09/15 | | | | (2,672 | ) |
| | | PEN | | | | 185,000 | | | | USD | | | | 57,430 | | | | 56,812 | | | | 10/23/15 | | | | (619 | ) |
| | | RUB | | | | 9,768,137 | | | | USD | | | | 166,486 | | | | 147,842 | | | | 10/23/15 | | | | (18,644 | ) |
| | | TRY | | | | 248,625 | | | | USD | | | | 81,000 | | | | 80,220 | | | | 12/16/15 | | | | (780 | ) |
| | | USD | | | | 86,000 | | | | BRL | | | | 343,078 | | | | 86,470 | | | | 10/02/15 | | | | (470 | ) |
| | | USD | | | | 55,000 | | | | TRY | | | | 172,688 | | | | 55,719 | | | | 12/16/15 | | | | (719 | ) |
| | | ZAR | | | | 2,634,668 | | | | USD | | | | 189,000 | | | | 187,476 | | | | 12/17/15 | | | | (1,524 | ) |
HSBC Securities, Inc. | | | USD | | | | 164,000 | | | | CNH | | | | 1,081,891 | | | | 165,280 | | | | 09/01/16 | | | | (1,280 | ) |
JPMorgan Securities, Inc. | | | MXN | | | | 934,709 | | | | USD | | | | 55,000 | | | | 54,950 | | | | 12/16/15 | | | | (50 | ) |
| | | TWD | | | | 6,718,873 | | | | USD | | | | 205,415 | | | | 203,642 | | | | 10/05/15 | | | | (1,773 | ) |
| | | USD | | | | 110,000 | | | | CNH | | | | 723,225 | | | | 110,487 | | | | 09/01/16 | | | | (487 | ) |
| | | USD | | | | 92,414 | | | | RUB | | | | 6,151,067 | | | | 93,188 | | | | 10/21/15 | | | | (774 | ) |
| | | USD | | | | 25,000 | | | | TRY | | | | 77,897 | | | | 25,134 | | | | 12/16/15 | | | | (134 | ) |
Morgan Stanley & Co. | | | BRL | | | | 512,846 | | | | USD | | | | 132,646 | | | | 129,259 | | | | 10/02/15 | | | | (3,387 | ) |
| | | IDR | | | | 992,460,000 | | | | USD | | | | 68,000 | | | | 66,990 | | | | 10/30/15 | | | | (1,010 | ) |
| | | MXN | | | | 916,239 | | | | USD | | | | 55,367 | | | | 53,864 | | | | 12/16/15 | | | | (1,503 | ) |
| | | MYR | | | | 553,000 | | | | USD | | | | 125,925 | | | | 125,696 | | | | 11/30/15 | | | | (229 | ) |
| | | USD | | | | 642,104 | | | | BRL | | | | 2,705,826 | | | | 681,983 | | | | 10/02/15 | | | | (39,879 | ) |
| | | USD | | | | 54,076 | | | | BRL | | | | 226,260 | | | | 56,384 | | | | 11/04/15 | | | | (2,308 | ) |
Royal Bank of Canada | | | BRL | | | | 219,246 | | | | USD | | | | 56,000 | | | | 55,259 | | | | 10/02/15 | | | | (741 | ) |
| | | USD | | | | 84,000 | | | | MXN | | | | 1,459,815 | | | | 85,820 | | | | 12/16/15 | | | | (1,820 | ) |
Royal Bank of Scotland PLC | | | BRL | | | | 1,559,550 | | | | USD | | | | 401,222 | | | | 393,073 | | | | 10/02/15 | | | | (8,149 | ) |
| | | CLP | | | | 37,912,323 | | | | USD | | | | 55,000 | | | | 54,404 | | | | 10/13/15 | | | | (596 | ) |
| | | HUF | | | | 176,875,127 | | | | USD | | | | 643,961 | | | | 630,366 | | | | 12/16/15 | | | | (13,595 | ) |
| | | MXN | | | | 20,532,334 | | | | USD | | | | 1,231,419 | | | | 1,207,060 | | | | 12/16/15 | | | | (24,359 | ) |
| | | PLN | | | | 2,082,651 | | | | USD | | | | 564,343 | | | | 546,813 | | | | 12/16/15 | | | | (17,530 | ) |
| | | RON | | | | 1,723,300 | | | | USD | | | | 441,849 | | | | 435,195 | | | | 12/16/15 | | | | (6,654 | ) |
| | | TRY | | | | 964,026 | | | | USD | | | | 312,549 | | | | 311,048 | | | | 12/16/15 | | | | (1,501 | ) |
| | | USD | | | | 18,243 | | | | COP | | | | 56,403,961 | | | | 18,257 | | | | 10/05/15 | | | | (13 | ) |
| | | USD | | | | 493,451 | | | | COP | | | | 1,563,252,768 | | | | 504,896 | | | | 10/23/15 | | | | (11,445 | ) |
| | | USD | | | | 164,210 | | | | ILS | | | | 644,065 | | | | 164,360 | | | | 12/16/15 | | | | (149 | ) |
| | | ZAR | | | | 6,606,383 | | | | USD | | | | 490,539 | | | | 470,093 | | | | 12/17/15 | | | | (20,446 | ) |
Standard Chartered Bank | | | MYR | | | | 1,793,629 | | | | USD | | | | 424,126 | | | | 408,292 | | | | 10/30/15 | | | | (15,834 | ) |
| | | TWD | | | | 3,005,413 | | | | USD | | | | 92,433 | | | | 90,910 | | | | 10/19/15 | | | | (1,523 | ) |
| | |
| 52 | | The accompanying notes are an integral part of these financial statements. |
GOLDMAN SACHS DYNAMIC EMERGING MARKETS DEBT FUND
|
| ADDITIONAL INVESTMENT INFORMATION (continued) |
FORWARD FOREIGN CURRENCY EXCHANGE CONTRACTS WITH UNREALIZED LOSS (continued)
| | | | | | | | | | | | | | | | | | | | | | | | | | | | |
| Counterparty | | Currency
Purchased | | | Currency
Sold | | | Current
Value | | | Settlement
Date | | | Unrealized
Loss | |
Standard Chartered Bank (continued) | | | USD | | | | 774,829 | | | | CNH | | | | 4,998,180 | | | $ | 777,974 | | | | 12/16/15 | | | $ | (3,145 | ) |
| | | USD | | | | 55,000 | | | | CNH | | | | 366,383 | | | | 55,972 | | | | 09/01/16 | | | | (972 | ) |
| | | USD | | | | 34,000 | | | | NGN | | | | 7,106,000 | | | | 34,036 | | | | 01/05/16 | | | | (36 | ) |
| | | USD | | | | 130,730 | | | | SGD | | | | 187,100 | | | | 131,136 | | | | 12/16/15 | | | | (406 | ) |
| | | USD | | | | 84,000 | | | | TWD | | | | 2,798,523 | | | | 84,569 | | | | 10/29/15 | | | | (569 | ) |
| | | ZAR | | | | 750,670 | | | | USD | | | | 56,000 | | | | 53,416 | | | | 12/17/15 | | | | (2,584 | ) |
UBS AG (London) | | | BRL | | | | 207,390 | | | | USD | | | | 55,000 | | | | 52,271 | | | | 10/02/15 | | | | (2,729 | ) |
| | | USD | | | | 189,928 | | | | BRL | | | | 783,454 | | | | 197,464 | | | | 10/02/15 | | | | (7,535 | ) |
| | | USD | | | | 175,962 | | | | CNH | | | | 1,148,413 | | | | 178,752 | | | | 12/16/15 | | | | (2,791 | ) |
Westpac Banking Corp. | | | MYR | | | | 1,320,505 | | | | USD | | | | 343,774 | | | | 300,593 | | | | 10/30/15 | | | | (43,181 | ) |
| | | USD | | | | 271,563 | | | | CNH | | | | 1,769,642 | | | | 275,447 | | | | 12/16/15 | | | | (3,884 | ) |
| | | USD | | | | 110,000 | | | | CNH | | | | 722,136 | | | | 110,320 | | | | 09/01/16 | | | | (320 | ) |
| | | | USD | | | | 113,712 | | | | KRW | | | | 135,491,085 | | | | 114,138 | | | | 11/09/15 | | | | (426 | ) |
| TOTAL | | | | | | | | | | | | | | | | | | | | | | | | | | $ | (415,431 | ) |
FUTURES CONTRACTS — At September 30, 2015, the Fund had the following futures contracts:
| | | | | | | | | | | | | | |
| Type | | Number of
Contracts
Long (Short) | | | Expiration
Date | | Current
Value | | | Unrealized
Gain (Loss) | |
20 Year U.S. Treasury Bonds | | $ | (1 | ) | | December 2015 | | $ | (157,344 | ) | | $ | (56 | ) |
2 Year U.S. Treasury Notes | | | 4 | | | December 2015 | | | 876,125 | | | | 1,278 | |
5 Year U.S. Treasury Notes | | | 16 | | | December 2015 | | | 1,928,250 | | | | 7,340 | |
10 Year U.S. Treasury Notes | | | (4 | ) | | December 2015 | | | (514,937 | ) | | | (3,171 | ) |
| TOTAL | | | | | | | | | | | | $ | 5,391 | |
SWAP CONTRACTS — At September 30, 2015, the Fund had the following swap contracts:
OVER THE COUNTER INTEREST RATE SWAP CONTRACTS
| | | | | | | | | | | | | | | | | | | | |
| Counterparty | | Notional
Amount
(000s) | | | Termination
Date | | | Payments
Received | | Payments
Made | | Unrealized
Gain (Loss)* | |
Bank of America Securities LLC | | | BRL | | | | 2,340 | | | | 01/04/16 | | | 13.795% | | 1 month Brazilian
Interbank Deposit Average | | $ | (1,062 | ) |
| | | INR | | | | 71,120 | | | | 05/28/16 | | | 6 Month MIBOR | | 7.369% | | | (1,283 | ) |
| | | BRL | | | | 1,180 | | | | 01/02/18 | | | 13.962 | | 1 month Brazilian
Interbank Deposit Average | | | (8,447 | ) |
| | | MXN | | | | 680 | | | | 03/03/26 | | | 6.930 | | Mexico Interbank TIIE
28 Days | | | 1,638 | |
Barclays Bank PLC | | | BRL | | | | 540 | | | | 01/04/16 | | | 11.555 | | 1 month Brazilian
Interbank Deposit Average | | | (1,171 | ) |
| | | | | | | 440 | | | | 01/02/17 | | | 12.190 | | 1 month Brazilian
Interbank Deposit Average | | | (3,293 | ) |
Citibank NA | | | | | | | 120 | | | | 01/04/16 | | | 1 month Brazilian
Interbank Deposit
Average | | 11.945 | | | 192 | |
| | | THB | | | | 8,830 | | | | 11/17/16 | | | 1.905 | | 6 Month Thai Reuters | | | 952 | |
| | | | | | | 8,830 | | | | 11/25/16 | | | 1.800 | | 6 month Thai Reuters | | | 639 | |
| | |
| The accompanying notes are an integral part of these financial statements. | | 53 |
GOLDMAN SACHS DYNAMIC EMERGING MARKETS DEBT FUND
Schedule of Investments (continued)
September 30, 2015 (Unaudited)
|
| ADDITIONAL INVESTMENT INFORMATION (continued) |
OVER THE COUNTER INTEREST RATE SWAP CONTRACTS (continued)
| | | | | | | | | | | | | | | | | | | | |
| Counterparty | | Notional
Amount
(000s) | | | Termination
Date | | | Payments
Received | | Payments
Made | | Unrealized
Gain (Loss)* | |
Citibank NA (continued) | | | BRL | | | | 980 | | | | 01/02/17 | | | 11.455% | | 1 month Brazilian
Interbank Deposit Average | | $ | (12,100 | ) |
| | | | | | | 320 | | | | 01/02/18 | | | 14.460 | | 1 month Brazilian
Interbank Deposit Average | | | (1,630 | ) |
Credit Suisse International (London) | | | | | | | 6,830 | | | | 01/04/16 | | | 13.815 | | 1 month Brazilian
Interbank Deposit Average | | | (3,198 | ) |
| | | CLP | | | | 36,600 | | | | 03/28/16 | | | 6 month CLICP | | 3.860% | | | (310 | ) |
| | | | | | | 42,120 | | | | 04/28/17 | | | 6 month CLICP | | 3.980 | | | (262 | ) |
| | | | | | | 22,170 | | | | 05/12/17 | | | 6 month CLICP | | 3.950 | | | (103 | ) |
| | | BRL | | | | 170 | | | | 01/02/18 | | | 11.120 | | 1 month Brazilian
Interbank Deposit Average | | | (3,680 | ) |
| | | | | | | 300 | | | | 01/02/18 | | | 11.960 | | 1 month Brazilian
Interbank Deposit Average | | | (5,085 | ) |
| | | COP | | | | 95,320 | | | | 04/15/19 | | | Colombia 90 days DTF | | 5.110 | | | 900 | |
Deutsche Bank AG | | | BRL | | | | 250 | | | | 01/04/16 | | | 11.230 | | 1 month Brazilian
Interbank Deposit Average | | | (1,189 | ) |
| | | | | | | 1,720 | | | | 01/04/16 | | | 1 month Brazilian
Interbank Deposit
Average | | 13.155 | | | 1,927 | |
| | | | | | | 1,850 | | | | 01/04/16 | | | 9.280 | | 1 month Brazilian
Interbank Deposit Average | | | (22,071 | ) |
| | | | | | | 2,020 | | | | 01/04/16 | | | 13.874 | | 1 month Brazilian
Interbank Deposit Average | | | (807 | ) |
| | | | | | | 2,110 | | | | 01/04/16 | | | 1 month Brazilian
Interbank Deposit
Average | | 12.000 | | | 6,033 | |
| | | | | | | 880 | | | | 01/02/17 | | | 16.860 | | 1 month Brazilian
Interbank Deposit Average | | | 2,681 | |
| | | | | | | 1,880 | | | | 01/02/17 | | | 12.842 | | 1 month Brazilian
Interbank Deposit Average | | | (13,290 | ) |
| | | | | | | 40 | | | | 01/02/18 | | | 11.150 | | 1 month Brazilian
Interbank Deposit Average | | | (858 | ) |
| | | | | | | 400 | | | | 01/02/18 | | | 11.945 | | 1 month Brazilian
Interbank Deposit Average | | | (6,813 | ) |
| | | | | | | 480 | | | | 01/02/18 | | | 14.580 | | 1 month Brazilian
Interbank Deposit Average | | | (2,211 | ) |
| | | MXN | | | | 990 | | | | 09/25/18 | | | Mexico Interbank TIIE
28 Days | | 5.180 | | | (700 | ) |
| | | CLP | | | | 17,660 | | | | 04/10/19 | | | 6 month CLICP | | 4.430 | | | (269 | ) |
| | | BRL | | | | 150 | | | | 01/02/25 | | | 1 month Brazilian
Interbank Deposit
Average | | 12.340 | | | 3,639 | |
| | | MXN | | | | 3,740 | (a) | | | 02/15/29 | | | 9.625 | | Mexico Interbank TIIE
28 Days | | | 9,304 | |
JPMorgan Securities, Inc. | | | INR | | | | 53,590 | | | | 06/01/16 | | | 6 Month MIBOR | | 7.345 | | | (235 | ) |
| | | THB | | | | 9,440 | | | | 11/24/16 | | | 1.810 | | 1 month Thai Reuters | | | 693 | |
| | | BRL | | | | 1,520 | | | | 01/02/17 | | | 1 month Brazilian
Interbank Deposit
Average | | 12.290 | | | 14,027 | |
| | | | | | | 390 | | | | 01/02/18 | | | 13.910 | | 1 month Brazilian
Interbank Deposit Average | | | (2,879 | ) |
| | |
| 54 | | The accompanying notes are an integral part of these financial statements. |
GOLDMAN SACHS DYNAMIC EMERGING MARKETS DEBT FUND
|
| ADDITIONAL INVESTMENT INFORMATION (continued) |
OVER THE COUNTER INTEREST RATE SWAP CONTRACTS (continued)
| | | | | | | | | | | | | | | | | | | | |
| Counterparty | | Notional
Amount
(000s) | | | Termination
Date | | | Payments
Received | | Payments
Made | | Unrealized
Gain (Loss)* | |
JPMorgan Securities, Inc. (continued) | | | COP | | | | 67,690 | | | | 04/22/19 | | | Colombia IBR
Overnight Interbank | | 5.190 | | $ | 592 | |
Morgan Stanley & Co. International PLC | | | THB | | | | 4,410 | | | | 11/28/16 | | | 1.820% | | 6 month Thai Reuters | | | 362 | |
| | | BRL | | | | 110 | | | | 01/02/17 | | | 16.490 | | 1 month Brazilian
Interbank Deposit Average | | | 239 | |
| | | | | | | 1,190 | | | | 01/02/17 | | | 15.954 | | 1 month Brazilian
Interbank Deposit Average | | | 1,088 | |
| | | | | | | 1,270 | | | | 01/02/17 | | | 15.575 | | 1 month Brazilian
Interbank Deposit Average | | | (28 | ) |
| | | ZAR | | | | 6,350 | | | | 07/23/20 | | | 7.490 | | 3 month JIBAR | | | (4,576 | ) |
| | | | BRL | | | | 150 | | | | 01/04/21 | | | 1 month Brazilian
Interbank Deposit
Average | | 11.410% | | | 4,460 | |
| TOTAL | | | | | | | | | | | | | | | | | | $ | (48,184 | ) |
| | * | | There are no upfront payments on the swap contracts, therefore the unrealized gain (loss) on the swap contracts is equal to their market value. |
| | (a) | | Represents forward starting interest rate swaps whose effective dates of commencement of accruals and cash flows occur subsequent to September 30, 2015. |
CENTRALLY CLEARED INTEREST RATE SWAP CONTRACTS
| | | | | | | | | | | | | | | | | | |
| | | | | | | Rates Exchanged | | Market Value | |
Notional
Amount
(000s) | | | Termination
Date | | | Payments
Received | | Payments
Made | | Upfront
Payments
Made (Received) | | | Unrealized
Gain (Loss) | |
| | ZAR 1,120 | | | | 06/13/19 | | | 7.640% | | 3 month JIBAR | | $ | 1 | | | $ | 175 | |
| | 350 | | | | 09/05/19 | | | 7.280 | | 3 month JIBAR | | | (1 | ) | | | (292 | ) |
| | 2,400 | | | | 09/08/19 | | | 7.310 | | 3 month JIBAR | | | (6 | ) | | | (1,848 | ) |
| | EUR 330 | (a) | | | 12/16/20 | | | 0.500 | | 6 month EURO | | | 104 | | | | (2,185 | ) |
| | ZAR 750 | | | | 03/14/24 | | | 3 month JIBAR | | 8.550% | | | 1 | | | | (985 | ) |
| | 690 | | | | 12/18/24 | | | 3 month JIBAR | | 7.890 | | | — | | | | 1,397 | |
| | MXN 1,060 | | | | 01/24/25 | | | Mexico Interbank TIIE
28 Days | | 5.660 | | | 1 | | | | 3,060 | |
| | EUR 260 | (a) | | | 12/16/25 | | | 6 month EURO | | 0.750 | | | 8,486 | | | | (1,290 | ) |
| | TOTAL | | | | | | | | | | | $ | 8,586 | | | $ | (1,968 | ) |
| | (a) | | Represents forward starting interest rate swaps whose effective dates of commencement of accruals and cash flows occur subsequent to September 30, 2015. |
OVER THE COUNTER CREDIT DEFAULT SWAP CONTRACTS
| | | | | | | | | | | | | | | | | | | | | | | | | | |
| | | | | | | | | | | | | | | | | Market Value | |
| Counterparty | | Referenced
Obligation | | Notional
Amount
(000s) | | | Rates Received
(Paid) | | | Termination
Date | | | Credit
Spread at
September 30,
2015(b) | | | Upfront
Payments
Made (Received) | | | Unrealized
Gain (Loss) | |
Protection Purchased: | | | | | | | | | | | | | | | | | | | | | | | | | | |
Bank of America Securities LLC | | People’s Republic of China, 4.250%, 10/28/17 | | $ | 30 | | | | (1.000 | )% | | | 06/20/19 | | | | 0.965 | % | | $ | (133 | ) | | $ | 87 | |
Barclays Bank PLC | | Russian Federation, 7.500%, 3/31/30 | | | 30 | | | | (1.000 | ) | | | 03/20/19 | | | | 0.904 | | | | (91 | ) | | | (15 | ) |
| | |
| The accompanying notes are an integral part of these financial statements. | | 55 |
GOLDMAN SACHS DYNAMIC EMERGING MARKETS DEBT FUND
Schedule of Investments (continued)
September 30, 2015 (Unaudited)
|
| ADDITIONAL INVESTMENT INFORMATION (continued) |
OVER THE COUNTER CREDIT DEFAULT SWAP CONTRACTS (continued)
| | | | | | | | | | | | | | | | | | | | | | | | | | |
| | | | | | | | | | | | | | | | | Market Value | |
| Counterparty | | Referenced
Obligation | | Notional
Amount
(000s) | | | Rates Received
(Paid) | | | Termination
Date | | | Credit
Spread at
September 30,
2015(b) | | | Upfront
Payments
Made (Received) | | | Unrealized
Gain (Loss) | |
Protection Purchased: (continued) | | | | | | | | | | | | | | | | | | | | | | | | | | |
Citibank NA | | People’s Republic of China, 4.250%, 10/28/17 | | $ | 480 | | | | (1.000 | )% | | | 03/20/19 | | | | 0.904 | % | | $ | (1,510 | ) | | $ | (190 | ) |
| | | | | 850 | | | | (1.000 | ) | | | 06/20/19 | | | | 0.965 | | | | (4,766 | ) | | | 3,447 | |
JPMorgan Securities, Inc. | | | | | 30 | | | | (1.000 | ) | | | 03/20/19 | | | | 0.904 | | | | (76 | ) | | | (30 | ) |
| | | | | 170 | | | | (1.000 | ) | | | 06/20/19 | | | | 0.965 | | | | (733 | ) | | | 468 | |
Protection Sold: | | | | | | | | | | | | | | | | | | | | | | | | | | |
Barclays Bank PLC | | Republic of Colombia, 10.375%, 01/28/33 | | | 300 | | | | 1.000 | | | | 12/20/19 | | | | 2.248 | | | | (10,520 | ) | | | (4,282 | ) |
| | | | | 60 | | | | 1.000 | | | | 06/20/20 | | | | 3.507 | | | | (6,335 | ) | | | (59 | ) |
Deutsche Bank AG | | Republic of Brazil, 4.250%, 01/07/25 | | | 90 | | | | 1.000 | | | | 12/20/20 | | | | 4.730 | | | | (14,769 | ) | | | (114 | ) |
| TOTAL | | | | | | | | | | | | | | | | | | | | $ | (38,933 | ) | | $ | (688 | ) |
| | (b) | | Credit spread on the Referenced Obligation, together with the term of the swap contract, are indicators of payment/performance risk. The likelihood of a credit event occurring which would require a fund to make a payment or otherwise be required to perform under the swap contract is generally greater as the credit spread and the term of the swap contract increase. |
NON-DELIVERABLE BOND FORWARD CONTRACTS#
| | | | | | | | | | | | |
| Counterparty | | Notional
Amount
(000s) | | | Reference
Obligation | | Settlement
Date | | Unrealized
Gain (Loss)* | |
Deutsche Bank AG | | | COP 289,800 | | | Titulos de Tesoreria 7.750%, 09/18/30 | | 10/14/15 | | $ | 923 | |
| | | | 75,400 | | | Titulos de Tesoreria 7.750%, 09/18/30 | | 10/15/15 | | | 99 | |
| TOTAL | | | | | | | | | | $ | 1,022 | |
| | # | | Represents a short term forward contract to purchase the referenced obligation denominated in a non-deliverable foreign currency. |
| | * | | There are no upfront payments on the bond forward contracts, therefore the unrealized gain (loss) of the bond forward contracts is equal to their market value. |
| | |
| 56 | | The accompanying notes are an integral part of these financial statements. |
GOLDMAN SACHS EMERGING MARKETS DEBT FUND
Schedule of Investments
September 30, 2015 (Unaudited)
| | | | | | | | | | | | | | |
Principal
Amount | | | Interest
Rate | | | Maturity
Date | | | Value | |
| | Sovereign Debt Obligations – 67.6% | |
| | Argentina – 2.0% | |
| Republic of Argentina (NR/NR) | |
| EUR | 5,353,043 | | | | 7.820 | %(a) | | | 12/31/33 | | | $ | 5,428,201 | |
| $ | 7,795,331 | | | | 8.280 | (a) | | | 12/31/33 | | | | 7,756,355 | |
| | 1,586,000 | | | | 0.000 | (b) | | | 12/15/35 | | | | 127,673 | |
| EUR | 64,905,341 | | | | 0.000 | (b) | | | 12/15/35 | | | | 5,802,016 | |
| $ | 2,600,000 | | | | 2.500 | (a) | | | 12/31/38 | | | | 1,501,500 | |
| | | | | | | | | | | | | | |
| | | | | | | | | | | | | 20,615,745 | |
| | |
| | Azerbaijan – 1.2% | |
| Republic of Azerbaijan (NR/Baa3) | |
| | 13,530,000 | | | | 4.750 | | | | 03/18/24 | | | | 12,718,200 | |
| | |
| | Belize(c)(d) – 0.2% | |
| Government of Belize (B-/Caa2) | |
| | 2,446,500 | | | | 5.000 | | | | 02/20/38 | | | | 1,798,178 | |
| | |
| | Brazil – 2.1% | |
| Brazil Letras do Tesouro Nacional (BBB-/Baa3)(e) | |
| BRL | 13,438,000 | | | | 0.000 | | | | 01/01/16 | | | | 3,275,282 | |
| Brazil Notas do Tesouro Nacional (BBB-/Baa3) | |
| | 2,702,000 | | | | 10.000 | | | | 01/01/25 | | | | 508,940 | |
| | 6,640,132 | | | | 6.000 | | | | 08/15/40 | | | | 1,421,126 | |
| Federal Republic of Brazil (BB+/Baa3) | |
| $ | 2,760,000 | | | | 4.875 | | | | 01/22/21 | | | | 2,677,200 | |
| | 3,540,000 | | | | 4.250 | | | | 01/07/25 | | | | 3,097,500 | |
| | 2,230,000 | | | | 8.250 | | | | 01/20/34 | | | | 2,308,050 | |
| | 1,470,000 | | | | 7.125 | | | | 01/20/37 | | | | 1,378,125 | |
| | 1,170,000 | | | | 5.625 | | | | 01/07/41 | | | | 938,925 | |
| | 2,240,000 | | | | 5.000 | | | | 01/27/45 | | | | 1,674,400 | |
| Federal Republic of Brazil (BBB-/Baa3) | |
| BRL | 19,707,155 | | | | 6.000 | | | | 08/15/50 | | | | 4,138,721 | |
| | | | | | | | | | | | | | |
| | | | | | | | | | | | | 21,418,269 | |
| | |
| | Bulgaria – 0.1% | |
| Republic of Bulgaria (BB+/Baa2) | |
| EUR | 610,000 | | | | 4.250 | | | | 07/09/17 | | | | 725,237 | |
| | |
| | Colombia – 3.4% | |
| Republic of Colombia (BBB/NR) | |
| $ | 7,280,000 | | | | 4.500 | | | | 01/28/26 | | | | 7,101,531 | |
| Republic of Colombia (BBB/Baa2) | |
| | 310,000 | | | | 8.700 | | | | 02/15/16 | | | | 307,946 | |
| | 920,000 | | | | 7.375 | | | | 09/18/37 | | | | 1,032,700 | |
| | 3,170,000 | | | | 6.125 | | | | 01/18/41 | | | | 3,138,300 | |
| | 6,770,000 | | | | 5.625 | | | | 02/26/44 | | | | 6,313,025 | |
| | 19,910,000 | | | | 5.000 | | | | 06/15/45 | | | | 17,023,050 | |
| | | | | | | | | | | | | | |
| | | | | | | | | | | | | 34,916,552 | |
| | |
| | Costa Rica – 1.6% | |
| Republic of Costa Rica (BB/Ba1) | |
| | 390,000 | | | | 9.995 | | | | 08/01/20 | | | | 471,413 | |
| | 3,500,000 | | | | 5.625 | (c) | | | 04/30/43 | | | | 2,620,625 | |
| | 2,660,000 | | | | 5.625 | | | | 04/30/43 | | | | 1,991,675 | |
| | 12,430,000 | | | | 7.158 | (c) | | | 03/12/45 | | | | 11,093,775 | |
| | | | | | | | | | | | | | |
| | | | | | | | | | | | | 16,177,488 | |
| | |
| | Croatia – 6.1% | |
| Republic of Croatia (BB/Ba1) | |
| | 10,087,000 | | | | 6.250 | | | | 04/27/17 | | | | 10,553,524 | |
| | |
Principal
Amount | | | Interest
Rate | | | Maturity
Date | | | Value | |
| | Sovereign Debt Obligations – (continued) | |
| | Croatia – (continued) | |
| Republic of Croatia (BB/Ba1) – (continued) | |
| EUR | 1,240,000 | | | | 5.875 | % | | | 07/09/18 | | | $ | 1,518,937 | |
| $ | 3,870,000 | | | | 6.750 | | | | 11/05/19 | | | | 4,203,788 | |
| | 3,140,000 | | | | 6.625 | | | | 07/14/20 | | | | 3,406,900 | |
| | 930,000 | | | | 6.375 | | | | 03/24/21 | | | | 999,750 | |
| EUR | 19,740,000 | | | | 3.875 | | | | 05/30/22 | | | | 22,103,899 | |
| $ | 201,000 | | | | 5.500 | | | | 04/04/23 | | | | 206,025 | |
| | 6,451,000 | | | | 6.000 | | | | 01/26/24 | | | | 6,805,805 | |
| EUR | 12,770,000 | | | | 3.000 | | | | 03/11/25 | | | | 12,913,619 | |
| | | | | | | | | | | | | | |
| | | | | | | | | | | | | 62,712,247 | |
| | |
| | Dominican Republic – 5.5% | |
| Dominican Republic (NR/NR) | |
| DOP | 20,700,000 | | | | 16.000 | | | | 07/10/20 | | | | 564,812 | |
| | 57,100,000 | | | | 11.500 | | | | 05/10/24 | | | | 1,339,084 | |
| | 8,900,000 | | | | 18.500 | (c) | | | 02/04/28 | | | | 287,817 | |
| | 140,800,000 | | | | 11.375 | | | | 07/06/29 | | | | 3,225,441 | |
| Dominican Republic (BB-/B1) | |
| $ | 1,694,114 | | | | 9.040 | | | | 01/23/18 | | | | 1,795,761 | |
| | 1,532,000 | | | | 7.500 | | | | 05/06/21 | | | | 1,646,900 | |
| | 1,500,000 | | | | 8.625 | | | | 04/20/27 | | | | 1,736,250 | |
| | 15,210,000 | | | | 7.450 | (c) | | | 04/30/44 | | | | 15,533,212 | |
| | 7,456,000 | | | | 7.450 | | | | 04/30/44 | | | | 7,614,440 | |
| | 18,320,000 | | | | 6.850 | (c) | | | 01/27/45 | | | | 17,610,100 | |
| | 5,099,000 | | | | 6.850 | | | | 01/27/45 | | | | 4,901,414 | |
| | | | | | | | | | | | | | |
| | | | | | | | | | | | | 56,255,231 | |
| | |
| | Ecuador – 0.3% | |
| Ecuador Government International Bond (B/NR) | |
| | 2,960,000 | | | | 10.500 | (c) | | | 03/24/20 | | | | 2,220,000 | |
| | 740,000 | | | | 10.500 | | | | 03/24/20 | | | | 555,000 | |
| | 450,000 | | | | 7.950 | | | | 06/20/24 | | | | 317,250 | |
| | | | | | | | | | | | | | |
| | | | | | | | | | | | | 3,092,250 | |
| | |
| | Egypt – 1.0% | |
| Republic of Egypt (B-/B3) | |
| | 2,290,000 | | | | 5.875 | (c) | | | 06/11/25 | | | | 2,165,195 | |
| | 6,120,000 | | | | 5.875 | | | | 06/11/25 | | | | 5,786,460 | |
| | 2,200,000 | | | | 6.875 | | | | 04/30/40 | | | | 2,054,250 | |
| | | | | | | | | | | | | | |
| | | | | | | | | | | | | 10,005,905 | |
| | |
| | El Salvador – 1.1% | |
| El Salvador Government International Bond (B+/Ba3) | |
| | 1,550,000 | | | | 7.375 | | | | 12/01/19 | | | | 1,581,000 | |
| | 1,160,000 | | | | 7.750 | (f) | | | 01/24/23 | | | | 1,151,300 | |
| | 210,000 | | | | 5.875 | | | | 01/30/25 | | | | 182,438 | |
| | 2,120,000 | | | | 6.375 | | | | 01/18/27 | | | | 1,857,650 | |
| | 3,870,000 | | | | 8.250 | | | | 04/10/32 | | | | 3,782,925 | |
| | 1,810,000 | | | | 7.650 | | | | 06/15/35 | | | | 1,608,637 | |
| | 1,650,000 | | | | 7.625 | | | | 02/01/41 | | | | 1,452,000 | |
| | | | | | | | | | | | | | |
| | | | | | | | | | | | | 11,615,950 | |
| | |
| | Ethiopia – 0.5% | |
| Republic of Ethiopia (B/B1) | |
| | 2,210,000 | | | | 6.625 | (c) | | | 12/11/24 | | | | 2,027,675 | |
| | 3,530,000 | | | | 6.625 | | | | 12/11/24 | | | | 3,238,775 | |
| | | | | | | | | | | | | | |
| | | | | | | | | | | | | 5,266,450 | |
| | |
| | |
| The accompanying notes are an integral part of these financial statements. | | 57 |
GOLDMAN SACHS EMERGING MARKETS DEBT FUND
Schedule of Investments (continued)
September 30, 2015 (Unaudited)
| | | | | | | | | | | | | | |
Principal
Amount | | | Interest
Rate | | | Maturity
Date | | | Value | |
| | Sovereign Debt Obligations – (continued) | |
| | Gabon(c) – 0.2% | |
| Republic of Gabon (B+/NR) | |
| $ | 911,800 | | | | 6.375 | % | | | 12/12/24 | | | $ | 754,515 | |
| Republic of Gabon (B+/Ba3) | |
| | 1,770,000 | | | | 6.950 | | | | 06/16/25 | | | | 1,484,145 | |
| | | | | | | | | | | | | | |
| | | | | | | | | | | | | 2,238,660 | |
| | |
| | Guatemala – 0.7% | |
| Republic of Guatemala (BB/Ba1) | |
| | 3,300,000 | | | | 5.750 | (c) | | | 06/06/22 | | | | 3,489,750 | |
| | 3,180,000 | | | | 5.750 | | | | 06/06/22 | | | | 3,362,850 | |
| | | | | | | | | | | | | | |
| | | | | | | | | | | | | 6,852,600 | |
| | |
| | Honduras – 1.5% | |
| Republic of Honduras (B+/B3) | |
| | 9,990,000 | | | | 8.750 | (c) | | | 12/16/20 | | | | 11,038,950 | |
| | 1,218,000 | | | | 8.750 | | | | 12/16/20 | | | | 1,345,890 | |
| | 2,660,000 | | | | 7.500 | (c) | | | 03/15/24 | | | | 2,776,375 | |
| | | | | | | | | | | | | | |
| | | | | | | | | | | | | 15,161,215 | |
| | |
| | Hungary – 4.0% | |
| Hungary Government Bond (BB+/Ba1) | |
| EUR | 5,780,000 | | | | 4.375 | | | | 07/04/17 | | | | 6,868,624 | |
| $ | 1,850,000 | | | | 4.125 | | | | 02/19/18 | | | | 1,918,450 | |
| EUR | 7,530,000 | | | | 5.750 | | | | 06/11/18 | | | | 9,475,952 | |
| $ | 3,080,000 | | | | 4.000 | | | | 03/25/19 | | | | 3,199,350 | |
| | 2,360,000 | | | | 6.250 | | | | 01/29/20 | | | | 2,648,793 | |
| | 200,000 | | | | 5.375 | | | | 02/21/23 | | | | 217,600 | |
| | 4,690,000 | | | | 5.750 | | | | 11/22/23 | | | | 5,214,108 | |
| | 6,320,000 | | | | 5.375 | | | | 03/25/24 | | | | 6,819,280 | |
| | 3,410,000 | | | | 7.625 | | | | 03/29/41 | | | | 4,509,350 | |
| | | | | | | | | | | | | | |
| | | | | | | | | | | | | 40,871,507 | |
| | |
| | Indonesia – 4.8% | |
| Perusahaan Penerbit SBSN (NR/Baa3) | |
| | 530,000 | | | | 4.325 | | | | 05/28/25 | | | | 490,621 | |
| Perusahaan Penerbit SBSN (BB+/Baa3) | |
| | 360,000 | | | | 3.300 | | | | 11/21/22 | | | | 328,500 | |
| | 4,580,000 | | | | 4.325 | (c) | | | 05/28/25 | | | | 4,239,706 | |
| Republic of Indonesia (BB+/Baa3) | |
| | 820,000 | | | | 7.500 | | | | 01/15/16 | | | | 833,325 | |
| | 2,970,000 | | | | 6.875 | | | | 01/17/18 | | | | 3,255,863 | |
| | 5,364,000 | | | | 11.625 | | | | 03/04/19 | | | | 6,812,280 | |
| | 610,000 | | | | 5.375 | | | | 10/17/23 | | | | 629,825 | |
| | 2,766,000 | | | | 5.875 | | | | 01/15/24 | | | | 2,925,045 | |
| | 2,850,000 | | | | 4.125 | | | | 01/15/25 | | | | 2,686,125 | |
| | 3,120,000 | | | | 6.625 | | | | 02/17/37 | | | | 3,272,100 | |
| | 6,454,000 | | | | 7.750 | | | | 01/17/38 | | | | 7,599,585 | |
| | 7,479,000 | | | | 5.250 | | | | 01/17/42 | | | | 6,675,007 | |
| | 610,000 | | | | 4.625 | | | | 04/15/43 | | | | 509,350 | |
| | 2,400,000 | | | | 6.750 | | | | 01/15/44 | | | | 2,541,000 | |
| | 8,170,000 | | | | 5.125 | | | | 01/15/45 | | | | 7,158,962 | |
| | | | | | | | | | | | | | |
| | | | | | | | | | | | | 49,957,294 | |
| | |
| | Iraq – 0.5% | |
| Republic of Iraq (NR/NR) | |
| | 7,740,000 | | | | 5.800 | | | | 01/15/28 | | | | 5,330,925 | |
| | |
Principal
Amount | | | Interest
Rate | | | Maturity
Date | | | Value | |
| | Sovereign Debt Obligations – (continued) | |
| | Kazakhstan – 1.6% | |
| Republic of Kazakhstan (BBB/Baa2) | |
| $ | 4,750,000 | | | | 5.125 | %(c) | | | 07/21/25 | | | $ | 4,613,437 | |
| | 810,000 | | | | 4.875 | (c) | | | 10/14/44 | | | | 643,950 | |
| | 1,190,000 | | | | 4.875 | | | | 10/14/44 | | | | 946,050 | |
| | 11,420,000 | | | | 6.500 | (c) | | | 07/21/45 | | | | 10,763,350 | |
| | | | | | | | | | | | | | |
| | | | | | | | | | | | | 16,966,787 | |
| | |
| | Kenya – 1.2% | |
| Republic of Kenya (B+/NR) | |
| | 2,780,000 | | | | 6.875 | (c) | | | 06/24/24 | | | | 2,488,100 | |
| | 11,257,000 | | | | 6.875 | | | | 06/24/24 | | | | 10,075,015 | |
| | | | | | | | | | | | | | |
| | | | | | | | | | | | | 12,563,115 | |
| | |
| | Latvia – 0.6% | |
| Republic of Latvia (A-/A3) | |
| | 5,583,000 | | | | 5.250 | | | | 02/22/17 | | | | 5,888,167 | |
| | |
| | Lithuania – 0.5% | |
| Republic of Lithuania (A-/A3) | |
| | 4,730,000 | | | | 7.375 | | | | 02/11/20 | | | | 5,689,764 | |
| | |
| | Mexico – 8.1% | |
| United Mexican States (NR/NR)(e) | |
| MXN | 19,076,260 | | | | 0.000 | | | | 10/01/15 | | | | 1,126,945 | |
| | 79,350,450 | | | | 0.000 | | | | 10/29/15 | | | | 4,680,174 | |
| | 566,174,840 | | | | 0.000 | | | | 11/12/15 | | | | 33,325,975 | |
| United Mexican States (NR/A3) | |
| | 47,442,000 | | | | 4.750 | | | | 06/14/18 | | | | 2,817,967 | |
| United Mexican States (A/A3) | |
| | 48,146,912 | | | | 5.000 | | | | 06/16/16 | | | | 2,961,172 | |
| | 22,389,600 | | | | 10.000 | | | | 12/05/24 | | | | 1,690,342 | |
| | 4,382,200 | | | | 7.500 | | | | 06/03/27 | | | | 282,990 | |
| | 10,713,200 | | | | 8.500 | | | | 05/31/29 | | | | 749,222 | |
| | 54,875,100 | | | | 7.750 | | | | 11/23/34 | | | | 3,603,243 | |
| United Mexican States (BBB+/A3) | |
| $ | 990,000 | | | | 3.625 | | | | 03/15/22 | | | | 998,910 | |
| | 3,260,000 | | | | 3.600 | | | | 01/30/25 | | | | 3,198,060 | |
| | 280,000 | | | | 6.050 | | | | 01/11/40 | | | | 306,600 | |
| | 8,098,000 | | | | 4.750 | | | | 03/08/44 | | | | 7,389,425 | |
| | 3,783,000 | | | | 5.550 | | | | 01/21/45 | | | | 3,877,575 | |
| | 13,198,000 | | | | 4.600 | | | | 01/23/46 | | | | 11,746,220 | |
| | 2,632,000 | | | | 5.750 | | | | 10/12/10 | | | | 2,460,920 | |
| EUR | 1,960,000 | | | | 4.000 | | | | 03/15/15 | | | | 1,808,598 | |
| | | | | | | | | | | | | | |
| | | | | | | | | | | | | 83,024,338 | |
| | |
| | Montenegro(c) – 0.1% | |
| Republic of Montenegro (B+/Ba3) | |
| | 1,360,000 | | | | 3.875 | | | | 03/18/20 | | | | 1,447,548 | |
| | |
| | Netherlands – 0.2% | |
| Republic of Mozambique (NR/B2) | |
| $ | 2,670,850 | | | | 6.305 | | | | 09/11/20 | | | | 2,283,577 | |
| | |
| | Nigeria – 0.5% | |
| Republic of Nigeria (B+/NR) | |
| | 1,621,000 | | | | 6.750 | | | | 01/28/21 | | | | 1,531,845 | |
| | 3,710,000 | | | | 6.375 | | | | 07/12/23 | | | | 3,283,350 | |
| | | | | | | | | | | | | | |
| | | | | | | | | | | | | 4,815,195 | |
| | |
| | |
| 58 | | The accompanying notes are an integral part of these financial statements. |
GOLDMAN SACHS EMERGING MARKETS DEBT FUND
| | | | | | | | | | | | | | |
Principal
Amount | | | Interest
Rate | | | Maturity
Date | | | Value | |
| | Sovereign Debt Obligations – (continued) | |
| | Pakistan – 1.0% | |
| Islamic Republic of Pakistan (NR/B3) | |
| $ | 3,290,000 | | | | 8.250 | %(c) | | | 09/30/25 | | | $ | 3,380,475 | |
| Islamic Republic of Pakistan (B-/B3) | |
| | 1,830,000 | | | | 6.875 | | | | 06/01/17 | | | | 1,891,762 | |
| | 1,070,000 | | | | 6.875 | (c) | | | 06/01/17 | | | | 1,106,113 | |
| | 3,060,000 | | | | 6.750 | (c) | | | 12/03/19 | | | | 3,128,850 | |
| | 560,000 | | | | 8.250 | (c) | | | 04/15/24 | | | | 584,884 | |
| | | | | | | | | | | | | | |
| | | | | | | | | | | | | 10,092,084 | |
| | |
| | Panama – 2.0% | |
| Panama Notas del Tesoro (BBB/NR) | |
| | 920,000 | | | | 4.875 | | | | 02/05/21 | | | | 969,588 | |
| Republic of Panama (BBB/Baa2) | |
| | 210,000 | | | | 3.750 | | | | 03/16/25 | | | | 203,175 | |
| | 1,911,000 | | | | 8.875 | | | | 09/30/27 | | | | 2,641,957 | |
| | 1,528,000 | | | | 9.375 | (f) | | | 04/01/29 | | | | 2,198,410 | |
| | 12,600,000 | | | | 6.700 | | | | 01/26/36 | | | | 14,994,000 | |
| | | | | | | | | | | | | | |
| | | | | | | | | | | | | 21,007,130 | |
| | |
| | Paraguay – 0.3% | |
| Republic of Paraguay (BB/Ba1) | |
| | 3,490,000 | | | | 6.100 | | | | 08/11/44 | | | | 3,402,750 | |
| | |
| | Peru – 0.0% | |
| Republic of Peru (BBB+/A3) | |
| | 70,000 | | | | 5.625 | | | | 11/18/50 | | | | 71,925 | |
| | |
| | Philippines – 1.3% | |
| Republic of Philippines (BBB/Baa2) | |
| | 2,160,000 | | | | 9.875 | | | | 01/15/19 | | | | 2,713,500 | |
| | 5,869,000 | | | | 8.375 | | | | 06/17/19 | | | | 7,211,534 | |
| | 100,000 | | | | 6.375 | | | | 01/15/32 | | | | 127,750 | |
| | 2,410,000 | | | | 6.375 | | | | 10/23/34 | | | | 3,151,075 | |
| | | | | | | | | | | | | | |
| | | | | | | | | | | | | 13,203,859 | |
| | |
| | Romania – 0.3% | |
| Republic of Romania (BBB-/Baa3) | |
| EUR | 2,490,000 | | | | 5.250 | | | | 06/17/16 | | | | 2,876,924 | |
| | |
| | Russia – 0.5% | |
| Russian Federation (BB+/Ba1) | |
| $ | 4,800,000 | | | | 4.875 | (g) | | | 09/16/23 | | | | 4,824,000 | |
| | 200,000 | | | | 5.625 | | | | 04/04/42 | | | | 186,250 | |
| | 200,000 | | | | 5.875 | | | | 09/16/43 | | | | 192,000 | |
| | | | | | | | | | | | | | |
| | | | | | | | | | | | | 5,202,250 | |
| | |
| | South Africa – 1.3% | |
| Republic of South Africa (BBB-/Baa2) | |
| | 430,000 | | | | 4.665 | | | | 01/17/24 | | | | 425,700 | |
| | 5,640,000 | | | | 5.875 | | | | 09/16/25 | | | | 6,003,780 | |
| | 7,670,000 | | | | 5.375 | | | | 07/24/44 | | | | 7,194,460 | |
| | | | | | | | | | | | | | |
| | | | | | | | | | | | | 13,623,940 | |
| | |
| | Sri Lanka – 2.3% | |
| Republic of Sri Lanka (B+/B1) | |
| | 1,180,000 | | | | 6.000 | (c) | | | 01/14/19 | | | | 1,197,700 | |
| | 360,000 | | | | 6.000 | | | | 01/14/19 | | | | 365,400 | |
| | 1,222,000 | | | | 6.250 | (c) | | | 10/04/20 | | | | 1,235,747 | |
| | 1,260,000 | | | | 6.250 | | | | 10/04/20 | | | | 1,274,175 | |
| | |
Principal
Amount | | | Interest
Rate | | | Maturity
Date | | | Value | |
| | Sovereign Debt Obligations – (continued) | |
| | Sri Lanka – (continued) | |
| Republic of Sri Lanka (B+/B1) – (continued) | |
| $ | 13,294,000 | | | | 6.250 | % | | | 07/27/21 | | | $ | 13,260,765 | |
| | 4,590,000 | | | | 5.875 | | | | 07/25/22 | | | | 4,417,875 | |
| | 1,807,000 | | | | 6.125 | | | | 06/03/25 | | | | 1,734,720 | |
| | | | | | | | | | | | | | |
| | | | | | | | | | | | | 23,486,382 | |
| | |
| | Turkey – 2.8% | |
| Republic of Turkey (NR/Baa3) | |
| | 6,450,000 | | | | 4.250 | | | | 04/14/26 | | | | 5,863,050 | |
| | 5,180,000 | | | | 4.875 | | | | 04/16/43 | | | | 4,322,710 | |
| | 5,364,000 | | | | 7.500 | | | | 07/14/17 | | | | 5,786,415 | |
| | 1,992,000 | | | | 7.375 | | | | 02/05/25 | | | | 2,278,848 | |
| | 610,000 | | | | 8.000 | | | | 02/14/34 | | | | 736,880 | |
| | 140,000 | | | | 6.750 | | | | 05/30/40 | | | | 149,100 | |
| | 9,760,000 | | | | 6.000 | | | | 01/14/41 | | | | 9,516,000 | |
| | | | | | | | | | | | | | |
| | | | | | | | | | | | | 28,653,003 | |
| | |
| | Ukraine – 1.2% | |
| Financing of Infrastructural Projects State Enterprise (NR/Ca) | |
| | 3,950,000 | | | | 8.375 | | | | 11/03/17 | | | | 3,090,890 | |
| | 2,190,000 | | | | 9.000 | (c) | | | 12/07/17 | | | | 1,730,100 | |
| | 510,000 | | | | 9.000 | | | | 12/07/17 | | | | 402,900 | |
| | 2,030,000 | | | | 7.400 | | | | 04/20/18 | | | | 1,591,633 | |
| Ukraine Government Bond (CC/Ca) | |
| | 5,310,000 | | | | 6.250 | | | | 06/17/16 | | | | 4,168,350 | |
| Ukraine Government Bond (D/Ca) | |
| | 1,380,000 | | | | 6.750 | | | | 11/14/17 | | | | 1,092,270 | |
| | | | | | | | | | | | | | |
| | | | | | | | | | | | | 12,076,143 | |
| | |
| | Uruguay – 0.2% | |
| Republic of Uruguay (BBB/Baa2) | |
| | 2,772,828 | | | | 5.100 | | | | 06/18/50 | | | | 2,405,428 | |
| | |
| | Venezuela – 2.5% | |
| Republic of Venezuela (CCC/Caa3) | |
| | 1,182,000 | | | | 13.625 | | | | 08/15/18 | | | | 684,082 | |
| | 2,810,000 | | | | 6.000 | | | | 12/09/20 | | | | 927,300 | |
| | 16,980,000 | | | | 9.000 | | | | 05/07/23 | | | | 5,815,650 | |
| | 23,031,600 | | | | 8.250 | | | | 10/13/24 | | | | 7,715,586 | |
| | 13,060,000 | | | | 7.650 | | | | 04/21/25 | | | | 4,342,450 | |
| | 40,000 | | | | 11.750 | | | | 10/21/26 | | | | 15,400 | |
| | 9,248,000 | | | | 9.250 | | | | 05/07/28 | | | | 3,098,080 | |
| | 6,240,000 | | | | 9.375 | | | | 01/13/34 | | | | 2,152,800 | |
| | 2,970,000 | | | | 7.000 | | | | 03/31/38 | | | | 957,825 | |
| | | | | | | | | | | | | | |
| | | | | | | | | | | | | 25,709,173 | |
| | |
| | Vietnam – 1.6% | |
| Socialist Republic of Vietnam (BB-/B1) | |
| | 12,950,000 | | | | 6.750 | (c) | | | 01/29/20 | | | | 14,131,687 | |
| | 2,576,000 | | | | 4.800 | (c) | | | 11/19/24 | | | | 2,437,540 | |
| | 200,000 | | | | 4.800 | | | | 11/19/24 | | | | 189,250 | |
| | | | | | | | | | | | | | |
| | | | | | | | | | | | | 16,758,477 | |
| | |
| | Zambia – 0.7% | |
| Republic of Zambia (B/NR) | |
| | 5,171,000 | | | | 5.375 | | | | 09/20/22 | | | | 3,663,654 | |
| | 4,660,000 | | | | 8.970 | (c)(g) | | | 07/30/27 | | | | 3,693,050 | |
| | | | | | | | | | | | | | |
| | | | | | | | | | | | | 7,356,704 | |
| | |
| | TOTAL SOVEREIGN DEBT OBLIGATIONS | |
| | (Cost $750,231,160) | | | $ | 696,334,566 | |
| | |
| | |
| The accompanying notes are an integral part of these financial statements. | | 59 |
GOLDMAN SACHS EMERGING MARKETS DEBT FUND
Schedule of Investments (continued)
September 30, 2015 (Unaudited)
| | | | | | | | | | | | | | |
Principal
Amount | | | Interest
Rate | | | Maturity
Date | | | Value | |
| | Foreign Debt Obligation – 0.5% | |
| | Supranational – 0.5% | |
| Corporacion Andina de Fomento (AA-/Aa3) | |
| $ | 4,640,000 | | | | 1.500 | % | | | 08/08/17 | | | $ | 4,680,095 | |
| | (Cost $4,655,949) | | | | | |
| | |
| | | | | | | | | | | | | | |
| | Corporate Obligations – 26.3% | |
| | Azerbaijan – 0.8% | |
| State Oil Company of the Azerbaijan Republic (BB+/Ba1) | |
| $ | 4,110,000 | | | | 5.450 | % | | | 02/09/17 | | | $ | 4,171,650 | |
| | 4,580,000 | | | | 4.750 | | | | 03/13/23 | | | | 3,973,150 | |
| | | | | | | | | | | | | | |
| | | | | | | | | | | | | 8,144,800 | |
| | |
| | Bermuda(c)(h) – 0.5% | |
| Digicel Ltd. (NR/B1) | |
| | 5,230,000 | | | | 6.750 | | | | 03/01/23 | | | | 4,707,000 | |
| | |
| | Brazil – 1.7% | |
| Banco do Brasil SA (B/NR)(b)(h) | |
| | 3,410,000 | | | | 6.250 | | | | 10/29/49 | | | | 1,602,700 | |
| Banco do Brasil SA (B/Ba3)(b)(h) | |
| | 4,900,000 | | | | 9.000 | | | | 06/29/49 | | | | 2,891,000 | |
| Banco do Estado do Rio Grande do Sul SA (NR/Ba1)(c) | |
| | 3,740,000 | | | | 7.375 | | | | 02/02/22 | | | | 2,757,371 | |
| Brazil Minas SPE via State of Minas Gerais (BB+/NR)(c) | |
| | 12,630,000 | | | | 5.333 | | | | 02/15/28 | | | | 10,104,000 | |
| Independencia International Ltd. (NR/NR)(a)(c) | |
| | 1,277,436 | | | | 12.000 | | | | 12/30/16 | | | | — | |
| Raizen Energy Finance Ltd. (BBB/Baa3) | |
| | 450,000 | | | | 7.000 | | | | 02/01/17 | | | | 461,250 | |
| | | | | | | | | | | | | | |
| | | | | | | | | | | | | 17,816,321 | |
| | |
| | British Virgin Islands(c)(g) – 0.2% | |
| Arcos Dorados Holdings, Inc. (NR/Ba3) | |
| | 2,717,000 | | | | 6.625 | | | | 09/27/23 | | | | 2,200,770 | |
| | |
| | Chile – 4.0% | |
| AES Gener SA (BBB-/Baa3) | |
| | 1,320,000 | | | | 5.250 | (c) | | | 08/15/21 | | | | 1,366,200 | |
| | 3,309,000 | | | | 5.250 | | | | 08/15/21 | | | | 3,424,815 | |
| Banco del Estado de Chile | |
| | 3,550,000 | | | | 4.125 | (c) | | | 10/07/20 | | | | 3,697,325 | |
| | 970,000 | | | | 3.875 | (c) | | | 02/08/22 | | | | 985,763 | |
| | 1,510,000 | | | | 3.875 | | | | 02/08/22 | | | | 1,534,538 | |
| Corpbanca SA (BBB/Baa3)(c) | |
| | 4,071,000 | | | | 3.875 | | | | 09/22/19 | | | | 4,101,532 | |
| E.CL SA (BBB/NR) | |
| | 2,490,000 | | | | 5.625 | %(c) | | | 01/15/21 | | | | 2,714,100 | |
| | 430,000 | | | | 5.625 | | | | 01/15/21 | | | | 468,700 | |
| Embotelladora Andina SA (BBB/NR)(c) | |
| | 980,000 | | | | 5.000 | | | | 10/01/23 | | | | 1,041,250 | |
| Empresa Electrica Angamos SA (NR/Baa3)(c) | |
| | 5,760,000 | | | | 4.875 | | | | 05/25/29 | | | | 5,443,200 | |
| GNL Quintero SA (BBB/Baa2) | |
| | 1,060,000 | | | | 4.634 | | | | 07/31/29 | | | | 1,036,150 | |
| | 9,080,000 | | | | 4.634 | (c) | | | 07/31/29 | | | | 8,875,700 | |
| Sociedad Quimica y Minera de Chile SA (BBB/Baa1) | |
| | 1,360,000 | | | | 5.500 | | | | 04/21/20 | | | | 1,346,400 | |
| | |
Principal
Amount | | | Interest
Rate | | | Maturity
Date | | | Value | |
| | Corporate Obligations – (continued) | |
| | Chile – (continued) | |
| Sociedad Quimica y Minera de Chile SA
(BBB/Baa1) – (continued) |
|
| $ | 2,333,000 | | | | 3.625 | % | | | 04/03/23 | | | $ | 1,988,194 | |
| | 3,991,000 | | | | 4.375 | (c)(h) | | | 01/28/25 | | | | 3,352,440 | |
| | | | | | | | | | | | | | |
| | | | | | | | | | | | | 41,376,307 | |
| | |
| | Colombia – 0.6% | |
| Banco de Bogota SA (BBB-/Baa2) | |
| | 1,450,000 | | | | 5.000 | (c) | | | 01/15/17 | | | | 1,479,000 | |
| | 4,324,000 | | | | 5.000 | | | | 01/15/17 | | | | 4,410,480 | |
| Ecopetrol SA (BBB/Baa2) | |
| | 600,000 | | | | 7.375 | | | | 09/18/43 | | | | 546,000 | |
| | | | | | | | | | | | | | |
| | | | | | | | | | | | | 6,435,480 | |
| | |
| | Costa Rica – 1.5% | |
| Banco de Costa Rica (NR/Ba1) | |
| | 4,870,000 | | | | 5.250 | (c) | | | 08/12/18 | | | | 4,876,087 | |
| | 1,010,000 | | | | 5.250 | | | | 08/12/18 | | | | 1,011,263 | |
| Banco Nacional de Costa Rica (NR/Ba1) | |
| | 3,000,000 | | | | 4.875 | (c) | | | 11/01/18 | | | | 2,966,250 | |
| | 380,000 | | | | 4.875 | | | | 11/01/18 | | | | 375,725 | |
| | 5,890,000 | | | | 6.250 | (c) | | | 11/01/23 | | | | 5,764,837 | |
| | | | | | | | | | | | | | |
| | | | | | | | | | | | | 14,994,162 | |
| | |
| | Croatia(c) – 0.0% | |
| Hrvatska Elektroprivreda (BB-/Ba2) | |
| | 290,000 | | | | 6.000 | | | | 11/09/17 | | | | 301,600 | |
| | |
| | Dominican Republic(h) – 0.3% | |
| Aeropuertos Dominicanos Siglo XXI SA (B/B1) | |
| | 3,392,000 | | | | 9.750 | | | | 11/13/19 | | | | 3,392,000 | |
| | |
| | Ecuador(b) – 0.3% | |
| EP PetroEcuador via Noble Sovereign Funding I Ltd. (B/NR) | |
| | 3,810,526 | | | | 5.957 | | | | 09/24/19 | | | | 2,886,474 | |
| | |
| | Guatemala(h) – 0.3% | |
| Central American Bottling Corp. (BB/Ba2) | |
| | 2,050,000 | | | | 6.750 | (c) | | | 02/09/22 | | | | 2,142,250 | |
| | 604,000 | | | | 6.750 | | | | 02/09/22 | | | | 631,180 | |
| | | | | | | | | | | | | | |
| | | | | | | | | | | | | 2,773,430 | |
| | |
| | Hong Kong – 0.4% | |
| Biostime International Holdings Ltd. (NR/NR)(e)(f) | |
| HKD | 16,000,000 | | | | 0.000 | | | | 02/20/19 | | | | 1,847,730 | |
| China Unicom Ltd. (NR/NR) | |
| CNH | 8,770,000 | | | | 4.000 | | | | 04/16/17 | | | | 1,349,422 | |
| CITIC Ltd. (BBB+/A3) | |
| $ | 630,000 | | | | 6.375 | | | | 04/10/20 | | | | 695,585 | |
| | 200,000 | | | | 6.800 | | | | 01/17/23 | | | | 226,577 | |
| | | | | | | | | | | | | | |
| | | | | | | | | | | | | 4,119,314 | |
| | |
| | Hungary(c) – 0.3% | |
| MFB Magyar Fejlesztesi Bank Zrt (NR/Ba1) | |
| | 2,510,000 | | | | 6.250 | | | | 10/21/20 | | | | 2,775,407 | |
| | |
| | India(c) – 0.1% | |
| Adani Ports & Special Economic Zone Ltd. (BBB-/Baa3) | |
| | 1,360,000 | | | | 3.500 | | | | 07/29/20 | | | | 1,348,361 | |
| | |
| | |
| 60 | | The accompanying notes are an integral part of these financial statements. |
GOLDMAN SACHS EMERGING MARKETS DEBT FUND
| | | | | | | | | | | | | | |
Principal
Amount | | | Interest
Rate | | | Maturity
Date | | | Value | |
| | Corporate Obligations – (continued) | |
| | Indonesia – 0.4% | |
| Pertamina Persero PT (BB+/Baa3)(c) | |
| $ | 2,930,000 | | | | 5.625 | % | | | 05/20/43 | | | $ | 2,270,384 | |
| Perusahaan Gas Negara Persero Tbk PT (BB+/Baa3) | |
| | 1,940,000 | | | | 5.125 | | | | 05/16/24 | | | | 1,830,875 | |
| | | | | | | | | | | | | | |
| | | | | | | | | | | | | 4,101,259 | |
| | |
| | Ireland – 1.0% | |
| AHML Finance Ltd. (BB+/Ba1)(c) | |
| RUB | 103,900,000 | | | | 7.750 | | | | 02/13/18 | | | | 1,430,283 | |
| EDC Finance Ltd. (BB+/NR)(c) | |
| $ | 2,270,000 | | | | 4.875 | | | | 04/17/20 | | | | 1,929,500 | |
| MTS International Funding Ltd. (BB+/Ba1) | |
| | 2,943,000 | | | | 5.000 | | | | 05/30/23 | | | | 2,648,700 | |
| Phosagro OAO via Phosagro Bond Funding Ltd. (NR/Ba1) | |
| | 3,830,000 | | | | 4.204 | (c) | | | 02/13/18 | | | | 3,777,337 | |
| | 240,000 | | | | 4.204 | | | | 02/13/18 | | | | 236,700 | |
| | | | | | | | | | | | | | |
| | | | | | | | | | | | | 10,022,520 | |
| | |
| | Israel(c) – 0.2% | |
| Delek & Avner Tamar Bond Ltd. (BBB-/Baa3) | |
| | 1,200,000 | | | | 2.803 | | | | 12/30/16 | | | | 1,200,000 | |
| | 1,200,000 | | | | 3.839 | | | | 12/30/18 | | | | 1,206,000 | |
| | | | | | | | | | | | | | |
| | | | | | | | | | | | | 2,406,000 | |
| | |
| | Ivory Coast – 0.5% | |
| Agromercantil Senior Trust (BB/NR)(c) | |
| | 3,420,000 | | | | 6.250 | | | | 04/10/19 | | | | 3,398,779 | |
| Comcel Trust (NR/Ba1)(h) | |
| | 330,000 | | | | 6.875 | | | | 02/06/24 | | | | 325,050 | |
| Comunicaciones Celulares SA (NR/Ba1)(c)(h) | |
| | 810,000 | | | | 6.875 | | | | 02/06/24 | | | | 797,850 | |
| | | | | | | | | | | | | | |
| | | | | | | | | | | | | 4,521,679 | |
| | |
| | Jamaica(c)(h) – 0.1% | |
| Digicel Group Ltd. (NR/Caa1) | |
| | 1,220,000 | | | | 8.250 | | | | 09/30/20 | | | | 1,127,890 | |
| | |
| | Kazakhstan – 0.6% | |
| KazMunayGas National Co. (BB+/Baa3) | |
| | 3,060,000 | | | | 5.750 | (c) | | | 04/30/43 | | | | 2,219,648 | |
| | 1,348,000 | | | | 5.750 | | | | 04/30/43 | | | | 977,805 | |
| KazMunayGas National Co. JSC (BB+/Baa3) | |
| | 2,220,000 | | | | 9.125 | | | | 07/02/18 | | | | 2,405,925 | |
| | | | | | | | | | | | | | |
| | | | | | | | | | | | | 5,603,378 | |
| | |
| | Luxembourg – 3.1% | |
| Altice Financing SA (BB-/B1)(c)(h) | |
| | 1,680,000 | | | | 6.500 | | | | 01/15/22 | | | | 1,629,600 | |
| Altice Financing SA (BB-/B1)(c)(h) | |
| | 1,160,000 | | | | 6.625 | | | | 02/15/23 | | | | 1,116,500 | |
| Gazprom Neft OAO Via GPN Capital SA (BB+/Ba1) | |
| | 208,000 | | | | 4.375 | | | | 09/19/22 | | | | 177,123 | |
| | 14,080,000 | | | | 6.000 | (c) | | | 11/27/23 | | | | 13,059,200 | |
| | 1,320,000 | | | | 6.000 | | | | 11/27/23 | | | | 1,224,300 | |
| MHP SA (CCC-/NR) | |
| | 2,040,000 | | | | 8.250 | | | | 04/02/20 | | | | 1,721,250 | |
| | |
Principal
Amount | | | Interest
Rate | | | Maturity
Date | | | Value | |
| | Corporate Obligations – (continued) | |
| | Luxembourg – (continued) | |
| Tupy Overseas SA (BB-/NR)(h) | |
| $ | 3,450,000 | | | | 6.625 | %(c) | | | 07/17/24 | | | $ | 3,070,500 | |
| | 879,000 | | | | 6.625 | | | | 07/17/24 | | | | 782,310 | |
| Wind Acquisition Finance SA (B/Caa1)(h) | |
| EUR | 4,490,000 | | | | 7.000 | | | | 04/23/21 | | | | 5,004,581 | |
| Wind Acquisition Finance SA (B/Caa1)(c)(h) | |
| $ | 3,920,000 | | | | 7.375 | | | | 04/23/21 | | | | 3,792,600 | |
| Wind Acquisition Finance SA (BB/Ba3)(h) | |
| EUR | 150,000 | | | | 4.000 | | | | 07/15/20 | | | | 165,364 | |
| | | | | | | | | | | | | | |
| | | | | | | | | | | | | 31,743,328 | |
| | |
| | Mexico – 1.0% | |
| America Movil SAB de CV (A-/A2) | |
| MXN | 19,010,000 | | | | 6.000 | | | | 06/09/19 | | | | 1,118,956 | |
| Cemex SAB de CV (B+/NR)(c)(h) | |
| EUR | 1,300,000 | | | | 4.750 | | | | 01/11/22 | | | | 1,372,725 | |
| CIBanco SA Institucion de Banca Multiple (D/NR)(a)(h) | |
| $ | 363,000 | | | | 9.625 | (c) | | | 05/02/21 | | | | 10,890 | |
| | 471,900 | | | | 9.625 | | | | 05/02/21 | | | | 14,157 | |
| Gruma SAB de CV (BBB-/NR)(c)(h) | |
| | 2,620,000 | | | | 4.875 | | | | 12/01/24 | | | | 2,737,900 | |
| Grupo Cementos de Chihuahua SAB de CV (BB+/NR)(c)(h) | |
| | 710,000 | | | | 8.125 | | | | 02/08/20 | | | | 737,440 | |
| Metalsa SA de CV (BB+/NR)(c) | |
| | 2,420,000 | | | | 4.900 | | | | 04/24/23 | | | | 2,069,100 | |
| Trust F/1401 (NR/Baa2)(c) | |
| | 2,110,000 | | | | 6.950 | | | | 01/30/44 | | | | 2,189,125 | |
| | | | | | | | | | | | | | |
| | | | | | | | | | | | | 10,250,293 | |
| | |
| | Netherlands – 1.4% | |
| Greenko Dutch BV (B/NR)(c)(h) | |
| | 4,530,000 | | | | 8.000 | | | | 08/01/19 | | | | 4,620,396 | |
| Listrindo Capital BV (BB-/Ba2)(h) | |
| | 2,722,000 | | | | 6.950 | | | | 02/21/19 | | | | 2,745,817 | |
| Lukoil International Finance BV (BBB-/Ba1) | |
| | 1,480,000 | | | | 3.416 | | | | 04/24/18 | | | | 1,424,500 | |
| | 1,270,000 | | | | 7.250 | | | | 11/05/19 | | | | 1,339,850 | |
| | 1,650,000 | | | | 6.125 | | | | 11/09/20 | | | | 1,650,000 | |
| | 620,000 | | | | 4.563 | | | | 04/24/23 | | | | 551,800 | |
| Majapahit Holding BV (BB/Baa3) | |
| | 494,000 | | | | 7.750 | | | | 10/17/16 | | | | 521,170 | |
| | 100,000 | | | | 7.250 | | | | 06/28/17 | | | | 107,250 | |
| Petrobras Global Finance BV (BB/Ba2) | |
| | 500,000 | | | | 3.000 | | | | 01/15/19 | | | | 361,975 | |
| | 790,000 | | | | 4.875 | | | | 03/17/20 | | | | 572,750 | |
| | 610,000 | | | | 5.375 | | | | 01/27/21 | | | | 443,226 | |
| | 470,000 | | | | 4.375 | | | | 05/20/23 | | | | 306,431 | |
| | 230,000 | | | | 6.250 | | | | 03/17/24 | | | | 165,669 | |
| | | | | | | | | | | | | | |
| | | | | | | | | | | | | 14,810,834 | |
| | |
| | Panama(c) – 0.0% | |
| Autoridad Canal De Panam (A-/A2) | |
| | 380,000 | | | | 4.950 | | | | 07/29/35 | | | | 376,330 | |
| | |
| | Paraguay – 1.1% | |
| Banco Continental SAECA (BB/Ba1)(h) | |
| | 1,900,000 | | | | 8.875 | (c) | | | 10/15/17 | | | | 1,943,996 | |
| | 1,990,000 | | | | 8.875 | | | | 10/15/17 | | | | 2,036,080 | |
| | |
| | |
| The accompanying notes are an integral part of these financial statements. | | 61 |
GOLDMAN SACHS EMERGING MARKETS DEBT FUND
Schedule of Investments (continued)
September 30, 2015 (Unaudited)
| | | | | | | | | | | | | | |
Principal
Amount | | | Interest
Rate | | | Maturity
Date | | | Value | |
| | Corporate Obligations – (continued) | |
| | Paraguay – (continued) | |
| Banco Regional SAECA (BB-/Ba1) | |
| $ | 4,670,000 | | | | 8.125 | %(c) | | | 01/24/19 | | | $ | 4,674,740 | |
| | 905,000 | | | | 8.125 | | | | 01/24/19 | | | | 905,919 | |
| Telefonica Celular del Paraguay SA (NR/Ba3)(h) | |
| | 1,970,000 | | | | 6.750 | | | | 12/13/22 | | | | 1,891,200 | |
| | | | | | | | | | | | | | |
| | | | | | | | | | | | | 11,451,935 | |
| | |
| | Peru – 1.4% | |
| Abengoa Transmision Sur SA (BBB-/NR)(c) | |
| | 5,160,000 | | | | 6.875 | | | | 04/30/43 | | | | 5,418,000 | |
| Corp Financiera de Desarrollo SA (BBB+/NR) | |
| | 389,000 | | | | 4.750 | (c) | | | 02/08/22 | | | | 393,863 | |
| | 2,858,000 | | | | 4.750 | | | | 02/08/22 | | | | 2,893,725 | |
| Corp Lindley S.A. (BB+/NR) | |
| | 1,630,000 | | | | 6.750 | (c) | | | 11/23/21 | | | | 1,784,850 | |
| | 3,560,000 | | | | 6.750 | | | | 11/23/21 | | | | 3,898,200 | |
| | 120,000 | | | | 4.625 | (c) | | | 04/12/23 | | | | 117,204 | |
| | | | | | | | | | | | | | |
| | | | | | | | | | | | | 14,505,842 | |
| | |
| | Philippines – 0.7% | |
| Alliance Global Group Cayman Islands, Inc. (NR/NR) | |
| | 650,000 | | | | 6.500 | | | | 08/18/17 | | | | 682,500 | |
| Development Bank of Philippines (BBB/NR) | |
| | 1,610,000 | | | | 5.500 | | | | 03/25/21 | | | | 1,786,448 | |
| Energy Development Corp. (NR/NR) | |
| | 3,455,000 | | | | 6.500 | | | | 01/20/21 | | | | 3,791,863 | |
| San Miguel Corp. (NR/NR)(h) | |
| | 1,134,000 | | | | 4.875 | | | | 04/26/23 | | | | 1,036,565 | |
| | | | | | | | | | | | | | |
| | | | | | | | | | | | | 7,297,376 | |
| | |
| | Singapore – 0.2% | |
| China Resources Cement Holdings Ltd. (NR/Aa1) | |
| | 1,240,000 | | | | 2.125 | | | | 10/05/17 | | | | 1,241,135 | |
| Olam International Ltd. (NR/NR) | |
| | 1,100,000 | | | | 6.000 | | | | 10/15/16 | | | | 1,112,375 | |
| | | | | | | | | | | | | | |
| | | | | | | | | | | | | 2,353,510 | |
| | |
| | South Korea – 0.3% | |
| Korea South-East Power Co. Ltd. (A+/Aa3) | |
| | 240,000 | | | | 6.000 | | | | 05/25/16 | | | | 246,987 | |
| The Korea Development Bank (AA-/Aa3) | |
| | 2,240,000 | | | | 3.250 | | | | 03/09/16 | | | | 2,260,339 | |
| | | | | | | | | | | | | | |
| | | | | | | | | | | | | 2,507,326 | |
| | |
| | Turkey – 0.3% | |
| Export Credit Bank of Turkey (BB+/Baa3) | |
| | 270,000 | | | | 5.375 | (c) | | | 11/04/16 | | | | 274,725 | |
| | 2,240,000 | | | | 5.375 | | | | 11/04/16 | | | | 2,279,200 | |
| Hazine Mustesarligi Varlik Kiralama AS (NR/Baa3) | |
| | 208,000 | | | | 2.803 | | | | 03/26/18 | | | | 205,691 | |
| | | | | | | | | | | | | | |
| | | | | | | | | | | | | 2,759,616 | |
| | |
| | United Arab Emirates – 0.6% | |
| Dolphin Energy Ltd. (NR/A1) | |
| | 850,986 | | | | 5.888 | | | | 06/15/19 | | | | 911,619 | |
| Ruwais Power Co. PJSC (A-/A3)(c) | |
| | 4,990,000 | | | | 6.000 | | | | 08/31/36 | | | | 5,563,850 | |
| | | | | | | | | | | | | | |
| | | | | | | | | | | | | 6,475,469 | |
| | |
Principal
Amount | | | Interest
Rate | | | Maturity
Date | | | Value | |
| | Corporate Obligations – (continued) | |
| | United States(c) – 0.9% | |
| Brazil Loan Trust 1 (BB+/NR) | |
| $ | 10,012,103 | | | | 5.477 | % | | | 07/24/23 | | | $ | 8,660,469 | |
| New Cotai LLC/New Cotai Capital Corp. (NR/NR)(g)(h)(i) | |
| | 1,202,900 | | | | 10.625 | | | | 05/01/19 | | | | 948,161 | |
| | | | | | | | | | | | | | |
| | | | | | | | | | | | | 9,608,630 | |
| | |
| | Venezuela – 1.4% | |
| Petroleos de Venezuela SA (CCC/NR) | |
| | 11,600,000 | | | | 9.000 | | | | 11/17/21 | | | | 4,164,400 | |
| | 1,730,000 | | | | 6.000 | | | | 05/16/24 | | | | 562,250 | |
| | 27,895,000 | | | | 6.000 | | | | 11/15/26 | | | | 8,824,583 | |
| | 1,280,000 | | | | 5.375 | | | | 04/12/27 | | | | 404,800 | |
| | | | | | | | | | | | | | |
| | | | | | | | | | | | | 13,956,033 | |
| | |
| | Vietnam(h) – 0.1% | |
| Debt and Asset Trading Corp. (NR/NR) | |
| | 1,960,000 | | | | 1.000 | | | | 10/10/25 | | | | 1,078,000 | |
| | |
| | TOTAL CORPORATE OBLIGATIONS | |
| | (Cost $298,164,551) | | | $ | 270,228,674 | |
| | |
| | |
| | Agency Debenture(e) – 2.4% | |
| FHLB (NR/NR) | |
| $ | 25,000,000 | | | | 0.000 | % | | | 10/21/15 | | | $ | 24,999,575 | |
| | (Cost $24,999,305) | |
| | |
| | |
| | Structured Note – 0.3% | |
| | Brazil – 0.3% | |
| Notas do Tesouro Nacional Series B (Issuer HSBC Corp.)
(NR/NR) |
|
| $ | 14,575,899 | | | | 6.000 | % | | | 08/15/40 | | | $ | 3,119,546 | |
| | (Cost $8,177,920) | |
| | |
| | |
| | Municipal Debt Obligations – 1.2% | |
| | Puerto Rico – 1.2% | |
| Puerto Rico Commonwealth Aqueduct & Sewer Authority RB
(Senior Lien) Series 2008 A (CCC-/Caa3) |
|
| $ | 975,000 | | | | 6.000 | % | | | 07/01/44 | | | $ | 675,197 | |
| Puerto Rico Commonwealth Aqueduct & Sewer Authority RB
(Senior Lien) Series 2012 A (CCC-/Caa3) |
|
| | 305,000 | | | | 5.125 | | | | 07/01/37 | | | | 206,641 | |
| | 640,000 | | | | 5.250 | | | | 07/01/42 | | | | 433,600 | |
| Puerto Rico Commonwealth Aqueduct & Sewer Authority RB
(Senior Lien) Series 2012 D (CCC-/Caa3) |
|
| | 305,000 | | | | 5.000 | | | | 07/01/33 | | | | 206,638 | |
| Puerto Rico Commonwealth GO Bonds Refunding for Public
Improvement Series 2008 A (CC/Caa3) |
|
| | 135,000 | | | | 5.500 | | | | 07/01/32 | | | | 87,920 | |
| Puerto Rico Commonwealth GO Bonds Refunding Public
Improvement Series 2009 B (CC/Caa3) |
|
| | 1,385,000 | | | | 5.750 | | | | 07/01/38 | | | | 900,250 | |
| | |
| | |
| 62 | | The accompanying notes are an integral part of these financial statements. |
GOLDMAN SACHS EMERGING MARKETS DEBT FUND
| | | | | | | | | | | | | | |
Principal
Amount | | | Interest
Rate | | | Maturity
Date | | | Value | |
| | Municipal Debt Obligations – (continued) | |
| | Puerto Rico – (continued) | |
| Puerto Rico Commonwealth GO Bonds Refunding Public
Improvement Series 2012 A (CC/Caa3) |
|
| $ | 1,210,000 | | | | 5.500 | % | | | 07/01/26 | | | $ | 797,087 | |
| Puerto Rico Commonwealth GO Bonds Series 2008 A (CC/Caa3) | |
| | 1,315,000 | | | | 5.375 | | | | 07/01/33 | | | | 853,106 | |
| Puerto Rico Commonwealth GO Bonds Series 2014 A (CC/Caa3) | |
| | 1,770,000 | | | | 8.000 | | | | 07/01/35 | | | | 1,327,500 | |
| Puerto Rico Highways & Transportation Authority RB Refunding
Series 2007 CC (AA/A2) |
|
| | 125,000 | | | | 5.250 | | | | 07/01/36 | | | | 117,449 | |
| Puerto Rico Sales Tax Financing Corp. Sales Tax RB
SubSeries 2009 A (CC/Ca) |
|
| | 4,600,000 | | | | 5.500 | | | | 08/01/22 | | | | 2,093,000 | |
| | 4,210,000 | | | | 5.250 | | | | 08/01/27 | | | | 1,805,037 | |
| | 340,000 | | | | 0.000 | (e) | | | 08/01/32 | | | | 138,152 | |
| Puerto Rico Sales Tax Financing Corp. Sales Tax RB
SubSeries 2010 A (CC/Ca) |
|
| | 3,965,000 | | | | 5.500 | | | | 08/01/37 | | | | 1,670,256 | |
| | 240,000 | | | | 5.375 | | | | 08/01/39 | | | | 101,100 | |
| | 260,000 | | | | 5.500 | | | | 08/01/42 | | | | 109,525 | |
| Puerto Rico Sales Tax Financing Corp. Sales Tax RB
SubSeries 2010 C (CC/Ca) |
|
| | 660,000 | | | | 6.000 | | | | 08/01/39 | | | | 278,850 | |
| | 1,410,000 | | | | 5.250 | | | | 08/01/41 | | | | 593,963 | |
| Puerto Rico Sales Tax Financing Corp. Sales Tax RB
SubSeries 2011 A-1 (CC/Ca) |
|
| | 720,000 | | | | 5.000 | | | | 08/01/43 | | | | 303,300 | |
| | 90,000 | | | | 5.250 | | | | 08/01/43 | | | | 37,913 | |
| | |
| | TOTAL MUNICIPAL DEBT OBLIGATIONS | |
| | (Cost $18,766,926) | | | $ | 12,736,484 | |
| | |
| | | | | | | | | | | | | | |
| | U.S. Treasury Obligations – 1.9% | |
| United States Treasury Bond | |
| $ | 4,200,000 | | | | 2.875 | % | | | 08/15/45 | | | $ | 4,197,396 | |
| United States Treasury Note | |
| | 15,300,000 | | | | 1.750 | | | | 09/30/22 | | | | 15,294,033 | |
| | |
| | TOTAL U.S. TREASURY OBLIGATIONS | |
| | (Cost $19,349,973) | | | | | | | | | | | $ | 19,491,429 | |
| | |
| TOTAL INVESTMENTS BEFORE SHORT-TERM
INVESTMENT AND REVERSE REPURCHASE
AGREEMENTS |
|
| | (Cost $1,124,345,784) | | | | | | | | | | | $ | 1,031,590,369 | |
| | |
| | | | | | | | | | | | | | |
| | Short-term Investment(j) – 0.3% | |
| | Repurchase Agreements – 0.3% | |
| Joint Repurchase Agreement Account II | |
| $ | 3,100,000 | | | | 0.122 | % | | | 10/01/15 | | | $ | 3,100,000 | |
| | (Cost $3,100,000) | |
| | |
| | | | | | | | | | | | | | |
Principal
Amount | | | Interest Rate
(Paid) Received | | | Maturity
Date | | | Value | |
| | Reverse Repurchase Agreements – (0.8)% | |
| Barclays Reverse Repurchase Agreement (NR/NR) | |
| $ | (2,621,905 | ) | | | 1.250 | % | | | 08/11/16 | | | $ | (2,621,905 | ) |
| Citigroup Reverse Repurchase Agreement (NR/NR) | |
| | (4,496,900 | ) | | | 0.250 | | | | 08/16/16 | | | | (4,496,900 | ) |
| | (1,005,000 | ) | | | 1.000 | | | | 09/15/16 | | | | (1,005,000 | ) |
| | |
| | TOTAL REVERSE REPURCHASE AGREEMENTS | |
| | (Cost $(8,123,805)) | | | | | | | | | | | $ | (8,123,805 | ) |
| | |
| OTHER ASSETS IN EXCESS OF
LIABILITIES – 0.3% |
| | | 3,162,877 | |
| | |
| | NET ASSETS – 100.0% | | | $ | 1,029,729,441 | |
| | |
| | |
| The percentage shown for each investment category reflects the value of investments in that category as a percentage of net assets. |
(a) | | Security is currently in default and/or non-income producing. |
(b) | | Variable rate security. Interest rate or distribution rate disclosed is that which is in effect on September 30, 2015. |
(c) | | Exempt from registration under Rule 144A of the Securities Act of 1933. Under procedures approved by the Board of Trustees, such securities have been determined to be liquid by the investment adviser and may be resold, normally to qualified institutional buyers in transactions exempt from registration. Total market value of Rule 144A securities amounts to $290,642,827, which represents approximately 28.2% of net assets as of September 30, 2015. |
(d) | | Coupon changes periodically based upon a predetermined schedule. Interest rate disclosed is that which is in effect on September 30, 2015. |
(e) | | Issued with a zero coupon. Income is recognized through the accretion of discount. |
(f) | | Security with “Put” features and resetting interest rates. Maturity dates disclosed are the puttable dates. Interest rate disclosed is that which is in effect at September 30, 2015. |
(g) | | All or a portion of the security was pledged as collateral against open reverse repurchase agreements. As of September 30, 2015, the value of securities pledged amounted to $6,898,820. |
(h) | | Security with “Call” features with resetting interest rates. Maturity dates disclosed are the final maturity dates. |
(i) | | Pay-in-kind securities. |
(j) | | Joint repurchase agreement was entered into on September 30, 2015. Additional information appears on page 119. |
| | |
| The accompanying notes are an integral part of these financial statements. | | 63 |
GOLDMAN SACHS EMERGING MARKETS DEBT FUND
Schedule of Investments (continued)
September 30, 2015 (Unaudited)
Security ratings disclosed, if any, are obtained from by Standard & Poor’s/Moody’s Investor Service and are unaudited. A brief description of the ratings is available in the Fund’s Statement of Additional Information.
| | |
|
Currency Abbreviations: |
BRL | | —Brazilian Real |
CLP | | —Chilean Peso |
CNH | | —Chinese Yuan Renminbi Offshore |
COP | | —Colombian Peso |
DOP | | —Dominican Peso |
EUR | | —Euro |
HKD | | —Hong Kong Dollar |
HUF | | —Hungarian Forint |
ILS | | —Israeli Shekel |
INR | | —Indian Rupee |
KRW | | —South Korean Won |
MXN | | —Mexican Peso |
MYR | | —Malaysian Ringgit |
PHP | | —Philippine Peso |
PLN | | —Polish Zloty |
RUB | | —Russian Ruble |
SGD | | —Singapore Dollar |
TRY | | —Turkish Lira |
TWD | | —Taiwan Dollar |
USD | | —U.S. Dollar |
ZAR | | —South African Rand |
| | |
Investment Abbreviations: |
EURO | | —Euro Offered Rate |
FHLB | | —Federal Home Loan Bank |
GO | | —General Obligation |
KLIBOR | | —Kuala Lumpur Interbank Offered Rate |
KWCDC | | —South Korean Won Certificate of Deposit |
LLC | | —Limited Liability Company |
NR | | —Not Rated |
RB | | —Revenue Bond |
TIIE | | —La Tasa de Interbank Equilibrium Interest Rate |
|
|
| ADDITIONAL INVESTMENT INFORMATION |
FORWARD FOREIGN CURRENCY EXCHANGE CONTRACTS — At September 30, 2015, the Fund had the following forward foreign currency exchange contracts:
FORWARD FOREIGN CURRENCY EXCHANGE CONTRACTS WITH UNREALIZED GAIN
| | | | | | | | | | | | | | | | | | | | | | | | | | | | |
| Counterparty | | Currency
Purchased | | | Currency
Sold | | | Current
Value | | | Settlement
Date | | | Unrealized
Gain | |
Bank of America Securities LLC | | | USD | | | | 1,177,024 | | | | MXN | | | | 18,695,253 | | | $ | 1,105,817 | | | | 10/01/15 | | | $ | 71,206 | |
| | | USD | | | | 43,666,045 | | | | MXN | | | | 709,202,072 | | | | 41,804,526 | | | | 11/12/15 | | | | 1,861,520 | |
Barclays Bank PLC | | | BRL | | | | 8,885,211 | | | | USD | | | | 2,161,000 | | | | 2,239,450 | | | | 10/02/15 | | | | 78,450 | |
| | | INR | | | | 118,492,695 | | | | USD | | | | 1,796,705 | | | | 1,801,598 | | | | 10/19/15 | | | | 4,893 | |
| | | USD | | | | 1,069,334 | | | | MXN | | | | 17,986,083 | | | | 1,061,553 | | | | 10/26/15 | | | | 7,780 | |
| | | USD | | | | 1,776,000 | | | | TRY | | | | 5,414,616 | | | | 1,747,051 | | | | 12/16/15 | | | | 28,949 | |
| | | USD | | | | 1,832,581 | | | | TWD | | | | 59,650,499 | | | | 1,810,118 | | | | 10/02/15 | | | | 22,463 | |
| | | USD | | | | 1,800,656 | | | | TWD | | | | 58,692,373 | | | | 1,774,151 | | | | 10/26/15 | | | | 26,505 | |
| | | ZAR | | | | 23,600,164 | | | | USD | | | | 1,664,879 | | | | 1,679,328 | | | | 12/17/15 | | | | 14,448 | |
BNP Paribas SA | | | EUR | | | | 1,593,000 | | | | PLN | | | | 6,759,379 | | | | 1,782,427 | | | | 12/16/15 | | | | 7,709 | |
| | | USD | | | | 3,653,717 | | | | TWD | | | | 120,901,498 | | | | 3,652,613 | | | | 11/30/15 | | | | 1,104 | |
| | |
| 64 | | The accompanying notes are an integral part of these financial statements. |
GOLDMAN SACHS EMERGING MARKETS DEBT FUND
|
| ADDITIONAL INVESTMENT INFORMATION (continued) |
FORWARD FOREIGN CURRENCY EXCHANGE CONTRACTS WITH UNREALIZED GAIN (continued)
| | | | | | | | | | | | | | | | | | | | | | | | | | | | |
| Counterparty | | Currency
Purchased | | | Currency
Sold | | | Current
Value | | | Settlement
Date | | | Unrealized
Gain | |
Citibank NA | | | USD | | | | 1,797,966 | | | | CNH | | | | 11,757,440 | | | $ | 1,796,176 | | | | 09/01/16 | | | $ | 1,790 | |
| | | USD | | | | 64,231,995 | | | | EUR | | | | 57,090,793 | | | | 63,829,193 | | | | 11/06/15 | | | | 402,802 | |
| | | USD | | | | 1,110,430 | | | | KRW | | | | 1,312,950,498 | | | | 1,107,361 | | | | 10/05/15 | | | | 3,069 | |
| | | USD | | | | 2,882,863 | | | | KRW | | | | 3,423,976,248 | | | | 2,882,358 | | | | 12/04/15 | | | | 505 | |
| | | USD | | | | 4,470,269 | | | | SGD | | | | 6,346,217 | | | | 4,447,969 | | | | 12/16/15 | | | | 22,300 | |
Credit Suisse International (London) | | | COP | | | | 5,730,781,064 | | | | USD | | | | 1,833,263 | | | | 1,849,575 | | | | 10/29/15 | | | | 16,312 | |
Deutsche Bank AG | | | HUF | | | | 799,251,753 | | | | USD | | | | 2,835,835 | | | | 2,848,457 | | | | 12/16/15 | | | | 12,622 | |
| | | ILS | | | | 7,000,451 | | | | USD | | | | 1,777,000 | | | | 1,784,493 | | | | 10/02/15 | | | | 7,493 | |
| | | ILS | | | | 7,000,451 | | | | USD | | | | 1,780,877 | | | | 1,786,451 | | | | 12/16/15 | | | | 5,574 | |
| | | TWD | | | | 118,017,059 | | | | USD | | | | 3,573,026 | | | | 3,581,274 | | | | 10/02/15 | | | | 8,248 | |
| | | USD | | | | 5,129,543 | | | | ILS | | | | 19,862,104 | | | | 5,068,628 | | | | 12/16/15 | | | | 60,915 | |
| | | USD | | | | 4,864,387 | | | | MXN | | | | 78,673,682 | | | | 4,642,147 | | | | 10/29/15 | | | | 222,240 | |
| | | USD | | | | 1,788,000 | | | | SGD | | | | 2,505,651 | | | | 1,756,174 | | | | 12/16/15 | | | | 31,826 | |
| | | USD | | | | 1,797,000 | | | | TWD | | | | 58,366,560 | | | | 1,771,156 | | | | 10/02/15 | | | | 25,844 | |
HSBC Bank PLC | | | PHP | | | | 84,155,841 | | | | USD | | | | 1,783,341 | | | | 1,798,820 | | | | 10/19/15 | | | | 15,479 | |
| | | RUB | | | | 178,866,706 | | | | USD | | | | 2,688,714 | | | | 2,709,818 | | | | 10/21/15 | | | | 21,104 | |
| | | TRY | | | | 5,587,530 | | | | USD | | | | 1,801,000 | | | | 1,802,843 | | | | 12/16/15 | | | | 1,843 | |
| | | USD | | | | 1,782,000 | | | | BRL | | | | 6,859,978 | | | | 1,729,006 | | | | 10/02/15 | | | | 52,994 | |
| | | USD | | | | 5,177,959 | | | | ILS | | | | 20,173,847 | | | | 5,148,182 | | | | 12/16/15 | | | | 29,777 | |
| | | USD | | | | 1,797,000 | | | | TWD | | | | 58,154,873 | | | | 1,762,612 | | | | 10/05/15 | | | | 34,388 | |
| | | USD | | | | 1,151,614 | | | | TWD | | | | 37,286,956 | | | | 1,127,887 | | | | 10/19/15 | | | | 23,727 | |
JPMorgan Securities, Inc. | | | BRL | | | | 29,203,559 | | | | USD | | | | 7,117,611 | | | | 7,360,536 | | | | 10/02/15 | | | | 242,925 | |
| | | CNH | | | | 19,420,059 | | | | USD | | | | 2,996,000 | | | | 3,022,761 | | | | 12/16/15 | | | | 26,761 | |
| | | HUF | | | | 779,688,286 | | | | USD | | | | 2,772,324 | | | | 2,778,735 | | | | 12/16/15 | | | | 6,411 | |
| | | INR | | | | 119,096,731 | | | | USD | | | | 1,800,404 | | | | 1,806,220 | | | | 11/03/15 | | | | 5,816 | |
| | | KRW | | | | 4,300,288,215 | | | | USD | | | | 3,607,322 | | | | 3,627,580 | | | | 10/02/15 | | | | 20,258 | |
| | | RUB | | | | 186,833,535 | | | | USD | | | | 2,818,746 | | | | 2,830,515 | | | | 10/21/15 | | | | 11,769 | |
| | | USD | | | | 3,899,000 | | | | BRL | | | | 15,633,742 | | | | 3,895,943 | | | | 11/04/15 | | | | 3,057 | |
| | | USD | | | | 1,834,018 | | | | KRW | | | | 2,172,101,115 | | | | 1,832,312 | | | | 10/02/15 | | | | 1,706 | |
| | | USD | | | | 3,591,253 | | | | TWD | | | | 118,547,274 | | | | 3,581,417 | | | | 12/04/15 | | | | 9,837 | |
Morgan Stanley & Co. | | | BRL | | | | 25,298,339 | | | | USD | | | | 6,311,782 | | | | 6,376,254 | | | | 10/02/15 | | | | 64,472 | |
| | | USD | | | | 3,284,000 | | | | BRL | | | | 12,768,424 | | | | 3,218,185 | | | | 10/02/15 | | | | 65,815 | |
| | | USD | | | | 1,530,603 | | | | RUB | | | | 89,846,425 | | | | 1,359,839 | | | | 10/23/15 | | | | 170,764 | |
Royal Bank of Canada | | | USD | | | | 18,102,311 | | | | BRL | | | | 60,500,155 | | | | 15,248,607 | | | | 10/02/15 | | | | 2,853,704 | |
| | | USD | | | | 851,852 | | | | MXN | | | | 13,207,545 | | | | 781,221 | | | | 10/01/15 | | | | 70,631 | |
Royal Bank of Scotland PLC | | | CLP | | | | 3,210,323,682 | | | | USD | | | | 4,592,000 | | | | 4,600,941 | | | | 10/26/15 | | | | 8,941 | |
| | | COP | | | | 7,245,554,780 | | | | USD | | | | 2,299,926 | | | | 2,345,199 | | | | 10/05/15 | | | | 45,274 | |
| | | TRY | | | | 5,547,744 | | | | USD | | | | 1,785,000 | | | | 1,790,006 | | | | 12/16/15 | | | | 5,006 | |
| | | USD | | | | 3,552,000 | | | | TRY | | | | 10,935,081 | | | | 3,528,256 | | | | 12/16/15 | | | | 23,744 | |
Standard Chartered Bank | | | CNH | | | | 23,208,011 | | | | USD | | | | 3,580,000 | | | | 3,612,361 | | | | 12/16/15 | | | | 32,361 | |
| | | COP | | | | 5,294,313,955 | | | | USD | | | | 1,637,079 | | | | 1,714,206 | | | | 10/02/15 | | | | 77,127 | |
| | | USD | | | | 3,529,000 | | | | CNH | | | | 22,587,400 | | | | 3,515,762 | | | | 12/16/15 | | | | 13,238 | |
| | | USD | | | | 1,797,000 | | | | KRW | | | | 2,111,025,750 | | | | 1,780,469 | | | | 10/05/15 | | | | 16,531 | |
| | | USD | | | | 1,820,000 | | | | KRW | | | | 2,143,697,920 | | | | 1,806,747 | | | | 10/23/15 | | | | 13,253 | |
State Street Bank and Trust | | | EUR | | | | 1,066,931 | | | | USD | | | | 1,191,344 | | | | 1,192,860 | | | | 11/06/15 | | | | 1,516 | |
| | | USD | | | | 43,773,853 | | | | MXN | | | | 709,202,072 | | | | 41,804,526 | | | | 11/12/15 | | | | 1,969,327 | |
UBS AG (London) | | | EUR | | | | 1,601,000 | | | | HUF | | | | 501,977,540 | | | | 1,791,378 | | | | 12/16/15 | | | | 2,378 | |
| | | HUF | | | | 511,278,000 | | | | USD | | | | 1,821,309 | | | | 1,822,146 | | | | 12/16/15 | | | | 837 | |
| | | INR | | | | 137,206,059 | | | | USD | | | | 2,055,214 | | | | 2,086,122 | | | | 10/19/15 | | | | 30,908 | |
| | | USD | | | | 3,965,782 | | | | BRL | | | | 15,380,868 | | | | 3,876,631 | | | | 10/02/15 | | | | 89,152 | |
| | | USD | | | | 1,797,000 | | | | KRW | | | | 2,128,187,100 | | | | 1,795,268 | | | | 10/02/15 | | | | 1,733 | |
| | | USD | | | | 1,788,000 | | | | KRW | | | | 2,086,987,572 | | | | 1,759,080 | | | | 10/21/15 | | | | 28,920 | |
| | |
| The accompanying notes are an integral part of these financial statements. | | 65 |
GOLDMAN SACHS EMERGING MARKETS DEBT FUND
Schedule of Investments (continued)
September 30, 2015 (Unaudited)
|
| ADDITIONAL INVESTMENT INFORMATION (continued) |
FORWARD FOREIGN CURRENCY EXCHANGE CONTRACTS WITH UNREALIZED GAIN (continued)
| | | | | | | | | | | | | | | | | | | | | | | | | | | | |
| Counterparty | | Currency
Purchased | | | Currency
Sold | | | Current
Value | | | Settlement
Date | | | Unrealized
Gain | |
Westpac Banking Corp. | | | USD | | | | 40,786,568 | | | | EUR | | | | 36,111,245 | | | $ | 40,405,309 | | | | 12/16/15 | | | $ | 381,258 | |
| | | | USD | | | | 5,468,191 | | | | TWD | | | | 179,110,595 | | | | 5,428,651 | | | | 10/05/15 | | | | 39,539 | |
| TOTAL | | | | | | | | | | | | | | | | | | | | | | | | | | $ | 9,460,848 | |
FORWARD FOREIGN CURRENCY EXCHANGE CONTRACTS WITH UNREALIZED LOSS
| | | | | | | | | | | | | | | | | | | | | | | | | | | | |
| Counterparty | | Currency
Purchased | | | Currency
Sold | | | Current
Value | | | Settlement
Date | | | Unrealized
Loss | |
Bank of America Securities LLC | | | CLP | | | | 1,023,233,881 | | | | USD | | | | 1,485,531 | | | $ | 1,467,039 | | | | 10/22/15 | | | $ | (18,492 | ) |
| | | MXN | | | | 431,926,437 | | | | USD | | | | 25,607,781 | | | | 25,492,652 | | | | 10/26/15 | | | | (115,129 | ) |
| | | MXN | | | | 168,839,511 | | | | USD | | | | 9,998,491 | | | | 9,925,788 | | | | 12/16/15 | | | | (72,702 | ) |
| | | PLN | | | | 6,743,305 | | | | EUR | | | | 1,594,000 | | | | 1,770,498 | | | | 12/16/15 | | | | (13,048 | ) |
| | | PLN | | | | 4,855,630 | | | | USD | | | | 1,285,000 | | | | 1,274,877 | | | | 12/16/15 | | | | (10,123 | ) |
Barclays Bank PLC | | | KRW | | | | 4,331,403,000 | | | | USD | | | | 3,743,715 | | | | 3,649,649 | | | | 10/30/15 | | | | (94,066 | ) |
| | | USD | | | | 6,226,956 | | | | CNH | | | | 41,471,529 | | | | 6,335,577 | | | | 09/01/16 | | | | (108,621 | ) |
| | | USD | | | | 1,917,188 | | | | HKD | | | | 14,864,000 | | | | 1,917,880 | | | | 10/15/15 | | | | (692 | ) |
| | | USD | | | | 1,793,000 | | | | INR | | | | 119,090,343 | | | | 1,810,685 | | | | 10/19/15 | | | | (17,685 | ) |
| | | ZAR | | | | 24,946,217 | | | | USD | | | | 1,811,000 | | | | 1,775,109 | | | | 12/17/15 | | | | (35,891 | ) |
BNP Paribas SA | | | PLN | | | | 8,611,853 | | | | USD | | | | 2,283,051 | | | | 2,261,097 | | | | 12/16/15 | | | | (21,954 | ) |
Citibank NA | | | CLP | | | | 2,494,414,410 | | | | USD | | | | 3,620,340 | | | | 3,579,444 | | | | 10/13/15 | | | | (40,896 | ) |
| | | COP | | | | 8,905,088,300 | | | | USD | | | | 2,897,000 | | | | 2,875,103 | | | | 10/26/15 | | | | (21,897 | ) |
| | | HUF | | | �� | 775,088,117 | | | | USD | | | | 2,766,739 | | | | 2,762,340 | | | | 12/16/15 | | | | (4,399 | ) |
| | | KRW | | | | 3,423,976,248 | | | | USD | | | | 2,888,944 | | | | 2,887,830 | | | | 10/05/15 | | | | (1,114 | ) |
| | | TWD | | | | 2,569,277 | | | | USD | | | | 78,933 | | | | 77,872 | | | | 10/05/15 | | | | (1,061 | ) |
| | | USD | | | | 5,791,604 | | | | CNH | | | | 37,456,038 | | | | 5,830,088 | | | | 12/16/15 | | | | (38,484 | ) |
| | | USD | | | | 1,784,000 | | | | ZAR | | | | 25,130,673 | | | | 1,788,235 | | | | 12/17/15 | | | | (4,235 | ) |
Credit Suisse International (London) | | | USD | | | | 3,586,000 | | | | RUB | | | | 240,294,991 | | | | 3,640,453 | | | | 10/21/15 | | | | (54,453 | ) |
Deutsche Bank AG | | | MXN | | | | 169,870,017 | | | | USD | | | | 10,058,623 | | | | 9,986,370 | | | | 12/16/15 | | | | (72,253 | ) |
| | | USD | | | | 6,868,466 | | | | CNH | | | | 45,648,708 | | | | 6,973,722 | | | | 09/01/16 | | | | (105,256 | ) |
| | | USD | | | | 2,089,000 | | | | INR | | | | 138,348,704 | | | | 2,103,495 | | | | 10/19/15 | | | | (14,495 | ) |
| | | USD | | | | 1,765,000 | | | | INR | | | | 117,307,725 | | | | 1,779,088 | | | | 11/03/15 | | | | (14,088 | ) |
| | | USD | | | | 1,777,000 | | | | SGD | | | | 2,548,520 | | | | 1,786,220 | | | | 12/16/15 | | | | (9,220 | ) |
| | | USD | | | | 3,561,704 | | | | TWD | | | | 118,017,059 | | | | 3,565,470 | | | | 11/30/15 | | | | (3,766 | ) |
HSBC Bank PLC | | | BRL | | | | 14,683,045 | | | | USD | | | | 3,733,807 | | | | 3,700,751 | | | | 10/02/15 | | | | (33,056 | ) |
| | | TRY | | | | 5,567,982 | | | | USD | | | | 1,814,000 | | | | 1,796,536 | | | | 12/16/15 | | | | (17,464 | ) |
| | | USD | | | | 2,452,000 | | | | BRL | | | | 9,781,715 | | | | 2,465,407 | | | | 10/02/15 | | | | (13,407 | ) |
| | | USD | | | | 1,783,000 | | | | TRY | | | | 5,598,246 | | | | 1,806,301 | | | | 12/16/15 | | | | (23,301 | ) |
| | | ZAR | | | | 24,799,331 | | | | USD | | | | 1,779,000 | | | | 1,764,657 | | | | 12/17/15 | | | | (14,343 | ) |
HSBC Securities, Inc. | | | USD | | | | 5,352,000 | | | | CNH | | | | 35,306,587 | | | | 5,393,763 | | | | 09/01/16 | | | | (41,763 | ) |
JPMorgan Securities, Inc. | | | MXN | | | | 23,349,000 | | | | USD | | | | 1,387,097 | | | | 1,378,077 | | | | 10/26/15 | | | | (9,020 | ) |
| | | MXN | | | | 30,182,587 | | | | USD | | | | 1,776,000 | | | | 1,774,383 | | | | 12/16/15 | | | | (1,617 | ) |
| | | TWD | | | | 234,696,192 | | | | USD | | | | 7,172,072 | | | | 7,113,392 | | | | 10/05/15 | | | | (58,680 | ) |
| | | USD | | | | 7,034,121 | | | | BRL | | | | 29,203,559 | | | | 7,277,553 | | | | 11/04/15 | | | | (243,432 | ) |
| | | USD | | | | 3,568,000 | | | | CNH | | | | 23,458,801 | | | | 3,583,785 | | | | 09/01/16 | | | | (15,785 | ) |
| | | USD | | | | 3,602,728 | | | | KRW | | | | 4,300,288,215 | | | | 3,623,240 | | | | 11/02/15 | | | | (20,512 | ) |
| | | USD | | | | 2,033,000 | | | | TRY | | | | 6,334,543 | | | | 2,043,871 | | | | 12/16/15 | | | | (10,871 | ) |
Morgan Stanley & Co. | | | BRL | | | | 13,497,161 | | | | USD | | | | 3,511,358 | | | | 3,401,857 | | | | 10/02/15 | | | | (109,501 | ) |
| | | MXN | | | | 29,545,701 | | | | USD | | | | 1,785,401 | | | | 1,736,942 | | | | 12/16/15 | | | | (48,459 | ) |
| | | USD | | | | 1,061,112 | | | | BRL | | | | 4,439,820 | | | | 1,106,407 | | | | 11/04/15 | | | | (45,295 | ) |
| | | USD | | | | 3,306,380 | | | | TRY | | | | 10,359,714 | | | | 3,342,611 | | | | 12/16/15 | | | | (36,231 | ) |
| | |
| 66 | | The accompanying notes are an integral part of these financial statements. |
GOLDMAN SACHS EMERGING MARKETS DEBT FUND
|
| ADDITIONAL INVESTMENT INFORMATION (continued) |
FORWARD FOREIGN CURRENCY EXCHANGE CONTRACTS WITH UNREALIZED LOSS (continued)
| | | | | | | | | | | | | | | | | | | | | | | | | | | | |
| Counterparty | | Currency
Purchased | | | Currency
Sold | | | Current
Value | | | Settlement
Date | | | Unrealized
Loss | |
Royal Bank of Canada | | | BRL | | | | 7,011,944 | | | | USD | | | | 1,791,000 | | | $ | 1,767,308 | | | | 10/02/15 | | | $ | (23,692 | ) |
| | | MXN | | | | 169,214,443 | | | | USD | | | | 9,977,267 | | | | 9,947,830 | | | | 12/16/15 | | | | (29,437 | ) |
| | | USD | | | | 749,617 | | | | MXN | | | | 12,826,539 | | | | 757,033 | | | | 10/26/15 | | | | (7,416 | ) |
| | | USD | | | | 1,792,000 | | | | MXN | | | | 31,142,720 | | | | 1,830,828 | | | | 12/16/15 | | | | (38,828 | ) |
Royal Bank of Scotland PLC | | | CLP | | | | 1,229,737,906 | | | | USD | | | | 1,784,000 | | | | 1,764,654 | | | | 10/13/15 | | | | (19,346 | ) |
| | | MXN | | | | 119,520,977 | | | | USD | | | | 7,149,000 | | | | 7,026,435 | | | | 12/16/15 | | | | (122,565 | ) |
| | | USD | | | | 597,465 | | | | COP | | | | 1,847,229,719 | | | | 597,901 | | | | 10/05/15 | | | | (436 | ) |
| | | USD | | | | 5,245,985 | | | | ILS | | | | 20,575,801 | | | | 5,250,757 | | | | 12/16/15 | | | | (4,772 | ) |
| | | USD | | | | 1,792,000 | | | | MXN | | | | 31,102,956 | | | | 1,828,490 | | | | 12/16/15 | | | | (36,490 | ) |
| | | USD | | | | 1,777,000 | | | | TRY | | | | 5,568,230 | | | | 1,796,616 | | | | 12/16/15 | | | | (19,616 | ) |
Standard Chartered Bank | | | TWD | | | | 97,430,018 | | | | USD | | | | 2,996,510 | | | | 2,947,144 | | | | 10/19/15 | | | | (49,366 | ) |
| | | USD | | | | 1,779,000 | | | | CNH | | | | 11,490,419 | | | | 1,788,501 | | | | 12/16/15 | | | | (9,501 | ) |
| | | USD | | | | 1,785,000 | | | | CNH | | | | 11,890,778 | | | | 1,816,546 | | | | 09/01/16 | | | | (31,546 | ) |
| | | USD | | | | 4,465,947 | | | | SGD | | | | 6,391,663 | | | | 4,479,821 | | | | 12/16/15 | | | | (13,875 | ) |
| | | USD | | | | 1,792,000 | | | | TWD | | | | 59,701,824 | | | | 1,804,131 | | | | 10/29/15 | | | | (12,130 | ) |
| | | ZAR | | | | 24,088,462 | | | | USD | | | | 1,797,000 | | | | 1,714,074 | | | | 12/17/15 | | | | (82,926 | ) |
State Street Bank and Trust | | | EUR | | | | 1,693,720 | | | | USD | | | | 1,897,000 | | | | 1,895,124 | | | | 12/16/15 | | | | (1,876 | ) |
UBS AG (London) | | | BRL | | | | 6,711,882 | | | | USD | | | | 1,780,000 | | | | 1,691,679 | | | | 10/02/15 | | | | (88,321 | ) |
| | | MXN | | | | 173,730,976 | | | | USD | | | | 10,305,857 | | | | 10,213,349 | | | | 12/16/15 | | | | (92,507 | ) |
| | | USD | | | | 5,940,250 | | | | CNH | | | | 38,769,042 | | | | 6,034,459 | | | | 12/16/15 | | | | (94,207 | ) |
Westpac Banking Corp. | | | USD | | | | 9,117,145 | | | | CNH | | | | 59,411,873 | | | | 9,247,545 | | | | 12/16/15 | | | | (130,400 | ) |
| | | USD | | | | 3,568,000 | | | | CNH | | | | 23,423,474 | | | | 3,578,388 | | | | 09/01/16 | | | | (10,387 | ) |
| | | | USD | | | | 7,062,399 | | | | KRW | | | | 8,415,060,250 | | | | 7,088,862 | | | | 11/09/15 | | | | (26,462 | ) |
| TOTAL | | | | | | | | | | | | | | | | | | | | | | | | | | $ | (2,582,859 | ) |
FUTURES CONTRACTS — At September 30, 2015, the Fund had the following futures contracts:
| | | | | | | | | | | | | | | | |
| Type | | Number of
Contracts
Long (Short) | | | Expiration
Date | | | Current
Value | | | Unrealized
Gain (Loss) | |
Ultra Long U.S. Treasury Bonds | | | (424 | ) | | | December 2015 | | | | $(68,012,250) | | | | $(727,283) | |
10 Year German Euro-Bund | | | 16 | | | | December 2015 | | | | 2,792,426 | | | | 20,715 | |
2 Year U.S. Treasury Notes | | | 62 | | | | December 2015 | | | | 13,579,937 | | | | 26,374 | |
5 Year U.S. Treasury Notes | | | 832 | | | | December 2015 | | | | 100,269,000 | | | | 667,397 | |
10 Year U.S. Treasury Notes | | | 861 | | | | December 2015 | | | | 110,840,297 | | | | 1,078,159 | |
20 Year U.S. Treasury Bonds | | | 381 | | | | December 2015 | | | | 59,947,969 | | | | 685,618 | |
| TOTAL | | | | | | | | | | | | | | $ | 1,750,980 | |
SWAP CONTRACTS — At September 30, 2015, the Fund had the following swap contracts:
OVER THE COUNTER INTEREST RATE SWAP CONTRACTS
| | | | | | | | | | | | | | | | | | | | |
| Counterparty | | Notional
Amount
(000s) | | | Termination
Date | | | Payments
Received | | Payments
Made | | Unrealized
Gain (Loss)* | |
Bank of America Securities LLC | | | KRW | | | | 7,739,660 | | | | 11/04/17 | | | 2.060% | | 3 month KWCDC | | $ | 79,467 | |
| | | BRL | | | | 36,700 | | | | 01/02/18 | | | 13.962 | | 1 month Brazilian
Interbank Deposit
Average | | | (262,722 | ) |
| | | MXN | | | | 14,640 | | | | 03/03/26 | | | 6.930 | | Mexico Interbank TIIE
28 Days | | | 35,264 | |
| | |
| The accompanying notes are an integral part of these financial statements. | | 67 |
GOLDMAN SACHS EMERGING MARKETS DEBT FUND
Schedule of Investments (continued)
September 30, 2015 (Unaudited)
|
| ADDITIONAL INVESTMENT INFORMATION (continued) |
OVER THE COUNTER INTEREST RATE SWAP CONTRACTS (continued)
| | | | | | | | | | | | | | | | | | | | |
| Counterparty | | Notional
Amount
(000s) | | | Termination
Date | | | Payments
Received | | Payments
Made | | Unrealized
Gain (Loss)* | |
Barclays Bank PLC | | | KRW | | | | 1,000,000 | | | | 08/09/23 | | | 3 month KWCDC | | 3.440% | | $ | (106,636 | ) |
| | | MYR | | | | 6,800 | | | | 08/14/23 | | | 3 month KLIBOR | | 4.485 | | | 34,974 | |
Citibank NA | | | KRW | | | | 4,820,980 | | | | 03/07/17 | | | 2.875% | | 3 month KWCDC | | | 83,161 | |
| | | | | | | 18,832,760 | | | | 10/06/17 | | | 2.239 | | 3 month KWCDC | | | 257,810 | |
| | | | | | | 4,044,740 | | | | 10/14/17 | | | 2.240 | | 3 month KWCDC | | | 55,322 | |
| | | BRL | | | | 8,360 | | | | 01/02/18 | | | 14.460 | | 1 month Brazilian
Interbank Deposit
Average | | | (42,590 | ) |
| | | MYR | | | | 18,970 | | | | 09/17/18 | | | 3 month KLIBOR | | 3.830 | | | 62,560 | |
| | | | | | | 11,920 | | | | 09/24/18 | | | 3 month KLIBOR | | 3.785 | | | 43,185 | |
| | | | | | | 20,280 | | | | 11/19/18 | | | 3 month KLIBOR | | 3.915 | | | 61,076 | |
| | | | | | | 9,040 | | | | 11/21/18 | | | 3 month KLIBOR | | 3.960 | | | 24,509 | |
| | | KRW | | | | 2,069,140 | | | | 08/16/23 | | | 3 month KWCDC | | 3.485 | | | (226,355 | ) |
| | | MYR | | | | 14,950 | | | | 11/15/23 | | | 3 month KLIBOR | | 4.450 | | | 91,191 | |
Deutsche Bank AG | | | BRL | | | | 15,170 | | | | 01/04/16 | | | 11.230 | | 1 month
Brazilian Interbank
Deposit Average | | | (72,142 | ) |
| | | | | | | 64,600 | | | | 01/04/16 | | | 11.650 | | 1 month Brazilian
Interbank Deposit
Average | | | (232,705 | ) |
| | | | | | | 84,590 | | | | 01/04/16 | | | 1 month Brazilian
Interbank Deposit
Average | | 12.000 | | | 241,860 | |
| | | | | | | 2,300 | | | | 01/02/17 | | | 15.715 | | 1 month Brazilian
Interbank Deposit
Average | | | 805 | |
| | | | | | | 6,910 | | | | 01/02/17 | | | 15.575 | | 1 month Brazilian
Interbank Deposit
Average | | | 153 | |
| | | | | | | 31,040 | | | | 01/02/17 | | | 16.860 | | 1 month Brazilian
Interbank Deposit
Average | | | 94,566 | |
| | | KRW | | | | 4,252,430 | | | | 03/03/17 | | | 2.850 | | 3 month KWCDC | | | 71,942 | |
| | | BRL | | | | 12,050 | | | | 01/02/18 | | | 14.580 | | 1 month Brazilian
Interbank Deposit
Average | | | (55,508 | ) |
| | | MYR | | | | 19,420 | | | | 09/13/18 | | | 3 month KLIBOR | | 3.920 | | | 52,294 | |
| | | MXN | | | | 60,090 | | | | 09/25/18 | | | Mexico Interbank TIIE
28 Days | | 5.180 | | | (42,499 | ) |
| | | MYR | | | | 16,090 | | | | 11/14/18 | | | 3 month KLIBOR | | 3.880 | | | 51,912 | |
| | | | | | | 5,830 | | | | 08/14/23 | | | 3 month KLIBOR | | 4.490 | | | 29,540 | |
JPMorgan Securities, Inc. | | | KRW | | | | 38,314,470 | | | | 03/05/17 | | | 2.889 | | 3 month KWCDC | | | 669,528 | |
| | | BRL | | | | 12,380 | | | | 01/02/18 | | | 13.910 | | 1 month Brazilian
Interbank Deposit
Average | | | (91,380 | ) |
| | | MYR | | | | 11,150 | | | | 12/11/18 | | | 3 month KLIBOR | | 3.972 | | | 30,677 | |
| | | | | | | 6,450 | | | | 08/15/23 | | | 3 month KLIBOR | | 4.520 | | | 29,788 | |
| | | KRW | | | | 2,607,840 | | | | 08/19/23 | | | 3 month KWCDC | | 3.563 | | | (298,786 | ) |
| | | MYR | | | | 9,260 | | | | 09/26/23 | | | 3 month KLIBOR | | 4.330 | | | 72,888 | |
| | | KRW | | | | 1,936,610 | | | | 01/15/24 | | | 3 month KWCDC | | 3.445 | | | (217,463 | ) |
| | |
| 68 | | The accompanying notes are an integral part of these financial statements. |
GOLDMAN SACHS EMERGING MARKETS DEBT FUND
|
| ADDITIONAL INVESTMENT INFORMATION (continued) |
OVER THE COUNTER INTEREST RATE SWAP CONTRACTS (continued)
| | | | | | | | | | | | | | | | | | | | |
| Counterparty | | Notional
Amount
(000s) | | | Termination
Date | | | Payments
Received | | Payments
Made | | Unrealized
Gain (Loss)* | |
Morgan Stanley & Co. International PLC | | | BRL | | | | 2,260 | | | | 01/02/17 | | | 15.700% | | 1 month Brazilian
Interbank Deposit
Average | | $ | 709 | |
| | | | | | | 2,350 | | | | 01/02/17 | | | 15.715 | | 1 month Brazilian
Interbank Deposit
Average | | | 823 | |
| | | | | | | 3,630 | | | | 01/02/17 | | | 16.490 | | 1 month Brazilian
Interbank Deposit
Average | | | 7,890 | |
| | | | | | | 27,780 | | | | 01/02/17 | | | 15.954 | | 1 month Brazilian
Interbank Deposit
Average | | | 25,403 | |
| | | | | | | 29,690 | | | | 01/02/17 | | | 15.575 | | 1 month Brazilian
Interbank Deposit
Average | | | (646 | ) |
| | | KRW | | | | 767,460 | | | | 10/13/17 | | | 2.250 | | 3 month KWCDC | | | 10,622 | |
| | | | | | | 3,709,820 | | | | 10/14/17 | | | 2.245 | | 3 month KWCDC | | | 51,093 | |
| | | | | | | 3,709,830 | | | | 10/14/17 | | | 2.250 | | 3 month KWCDC | | | 51,444 | |
| | | MYR | | | | 23,990 | | | | 11/20/18 | | | 3 month KLIBOR | | 3.934% | | | 69,603 | |
| | | KRW | | | | 6,983,920 | (a) | | | 12/11/22 | | | 3 month KWCDC | | 3.260 | | | (385,188 | ) |
| | | | | | | 18,128,470 | (a) | | | 12/12/22 | | | 3 month KWCDC | | 3.290 | | | (1,021,965 | ) |
| | | | | | | | 2,022,340 | | | | 08/16/23 | | | 3 month KWCDC | | 3.485 | | | (221,400 | ) |
| TOTAL | | | | | | | | | | | | | | | | | | $ | (885,926 | ) |
| | (a) | | Represents forward starting interest rate swaps whose effective dates of commencement of accruals and cash flows occur subsequent to September 30, 2015. |
| | * | | There are no upfront payments on the swap contracts, therefore the unrealized gain (loss) on the swap contracts is equal to their market value. |
CENTRALLY CLEARED INTEREST RATE SWAP CONTRACTS
| | | | | | | | | | | | | | | | |
| | | | | | Rates Exchanged | | Market Value | |
Notional
Amount
(000s) | | | Termination
Date | | Payments
Received | | Payments
Made | | Upfront
Payments
Made (Received) | | | Unrealized
Gain (Loss) | |
| EUR | 24,830 | | | 12/16/17 | | 6 month EURO | | 0.250% | | $ | (81,931 | ) | | $ | (24,191 | ) |
| MXN | 103,600 | | | 09/25/18 | | Mexico Interbank TIIE
28 Days | | 5.190 | | | 23 | | | | (75,058 | ) |
| EUR | 12,520 | (a) | | 12/16/20 | | 6 month EURO | | 0.500 | | | 2,980 | | | | (81,915 | ) |
| | 18,600 | (a) | | 12/16/22 | | 6 month EURO | | 0.500 | | | 315,278 | | | | (90,071 | ) |
| | 13,530 | (a) | | 12/16/25 | | 6 month EURO | | 0.750 | | | 441,459 | | | | (67,009 | ) |
| | 3,830 | (a) | | 12/16/35 | | 6 month EURO | | 1.250 | | | 250,964 | | | | (53,516 | ) |
| | TOTAL | | | | | | | | | $ | 928,773 | | | $ | (391,760 | ) |
| | (a) | | Represents forward starting interest rate swaps whose effective dates of commencement of accruals and cash flows occur subsequent to September 30, 2015. |
| | |
| The accompanying notes are an integral part of these financial statements. | | 69 |
GOLDMAN SACHS EMERGING MARKETS DEBT FUND
Schedule of Investments (continued)
September 30, 2015 (Unaudited)
|
| ADDITIONAL INVESTMENT INFORMATION (continued) |
OVER THE COUNTER CREDIT DEFAULT SWAP CONTRACTS
| | | | | | | | | | | | | | | | | | | | | | | | | | |
| | | | | | | | | | | | | | | | | Market Value | |
| Counterparty | | Referenced
Obligation | | Notional
Amount
(000s) | | | Rates Received
(Paid) | | | Termination
Date | | | Credit
Spread at
September 30,
2015(b) | | | Upfront
Payments
Made (Received) | | | Unrealized
Gain (Loss) | |
Protection Purchased: | | | | | | | | | | | | | | | | | | | | | | | | | | |
Bank of America Securities LLC | | People’s Republic of China 4.250%, 10/28/17 | | $ | 1,100 | | | | (1.000 | )% | | | 03/20/19 | | | | 0.904 | % | | $ | (1,443 | ) | | $ | (2,452 | ) |
| | | | | 2,680 | | | | (1.000 | ) | | | 06/20/19 | | | | 0.965 | | | | (12,256 | ) | | | 8,095 | |
Barclays Bank PLC | | | | | 12,630 | | | | (1.000 | ) | | | 03/20/19 | | | | 0.904 | | | | (109,673 | ) | | | 64,951 | |
| | | | | 3,350 | | | | (1.000 | ) | | | 09/20/19 | | | | 1.018 | | | | (38,655 | ) | | | 40,030 | |
Citibank NA | | | | | 31,240 | | | | (1.000 | ) | | | 03/20/19 | | | | 0.904 | | | | (100,356 | ) | | | (10,269 | ) |
| | | | | 21,330 | | | | (1.000 | ) | | | 06/20/19 | | | | 0.965 | | | | (55,501 | ) | | | 22,375 | |
JPMorgan Securities, Inc. | | | | | 10,100 | | | | (1.000 | ) | | | 03/20/19 | | | | 0.904 | | | | (43,289 | ) | | | 7,524 | |
| | | | | 2,690 | | | | (1.000 | ) | | | 06/20/19 | | | | 0.965 | | | | (11,399 | ) | | | 7,221 | |
Protection Sold: | | | | | | | | | | | | | | | | | | | | | | | | | | |
Bank of America Securities LLC | | Russian Federation 7.500%, 03/31/30 | | | 2,390 | | | | 1.000 | | | | 12/20/19 | | | | 3.417 | | | | (338,772 | ) | | | 115,885 | |
Barclays Bank PLC | | Republic of Colombia 10.375%, 01/28/33 | | | 10,640 | | | | 1.000 | | | | 12/20/19 | | | | 2.248 | | | | (373,112 | ) | | | (151,877 | ) |
| | Russian Federation 7.500%, 03/31/30 | | | 3,450 | | | | 1.000 | | | | 06/20/20 | | | | 3.507 | | | | (364,267 | ) | | | (3,383 | ) |
| | | | | 2,900 | | | | 1.000 | | | | 09/20/20 | | | | 4.701 | | | | (349,932 | ) | | | (107,829 | ) |
| | | | | 3,130 | | | | 1.000 | | | | 09/20/20 | | | | 4.701 | | | | (381,426 | ) | | | (112,639 | ) |
Citibank NA | | | | | 550 | | | | 1.000 | | | | 03/20/20 | | | | 3.464 | | | | (92,017 | ) | | | 37,050 | |
JPMorgan Securities, Inc. | | | | | 2,470 | | | | 1.000 | | | | 09/20/20 | | | | 4.701 | | | | (319,294 | ) | | | (70,592 | ) |
| TOTAL | | | | | | | | | | | | | | | | | | | | $ | (2,591,392 | ) | | $ | (155,910 | ) |
| | (b) | | Credit spread on the Referenced Obligation, together with the term of the swap contract, are indicators of payment/performance risk. The likelihood of a credit event occurring which would require a fund to make a payment or otherwise be required to perform under the swap contract is generally greater as the credit spread and the term of the swap contract increase. |
| | |
| 70 | | The accompanying notes are an integral part of these financial statements. |
GOLDMAN SACHS HIGH YIELD FUND
Schedule of Investments
September 30, 2015 (Unaudited)
| | | | | | | | | | | | | | |
Principal
Amount | | | Interest
Rate | | | Maturity
Date | | | Value | |
| | Corporate Obligations – 92.7% | |
| | Aerospace & Defense – 0.6% | |
| Moog, Inc. (BB/Ba3)(a) | |
| $ | 11,350,000 | | | | 5.250 | % | | | 12/01/22 | | | $ | 11,350,000 | |
| TransDigm, Inc. (CCC+/Caa1) | |
| | 14,250,000 | | | | 6.000 | | | | 07/15/22 | | | | 13,323,750 | |
| | | | | | | | | | | | | | |
| | | | | | | | | | | | | 24,673,750 | |
| | |
| | Airlines – 0.9% | |
| Air Canada (BB/B2)(a) | |
| | 10,000,000 | | | | 8.750 | | | | 04/01/20 | | | | 10,875,000 | |
| Air Canada (BB/Ba3)(a) | |
| | 6,850,000 | | | | 6.750 | | | | 10/01/19 | | | | 7,226,750 | |
| Continental Airlines 2012-3 Class C Pass Thru Certificates
(NR/Ba2) |
|
| | 8,100,000 | | | | 6.125 | | | | 04/29/18 | | | | 8,424,000 | |
| VistaJet Malta Finance PLC/VistaJet Co Finance LLC (B-/NR)(a) | |
| | 15,800,000 | | | | 7.750 | | | | 06/01/20 | | | | 13,746,000 | |
| | | | | | | | | | | | | | |
| | | | | | | | | | | | | 40,271,750 | |
| | |
| | Automotive – 0.3% | |
| Chrysler Group LLC (BB-/B1) | |
| | 12,000,000 | | | | 8.250 | | | | 06/15/21 | | | | 12,750,000 | |
| General Motors Liquidation Co. (NR/NR)(b) | |
| | 2,000,000 | | | | 7.700 | | | | 04/15/16 | | | | — | |
| | 7,125,000 | | | | 7.125 | | | | 07/15/13 | | | | — | |
| | 1,000,000 | | | | 8.800 | | | | 03/01/49 | | | | — | |
| | 14,500,000 | | | | 8.375 | | | | 07/15/49 | | | | — | |
| | | | | | | | | | | | | | |
| | | | | | | | | | | | | 12,750,000 | |
| | |
| | Automotive Parts(a) – 1.8% | |
| Gates Global LLC (B/Caa2) | |
| | 25,000,000 | | | | 6.000 | | | | 07/15/22 | | | | 20,250,000 | |
| Schaeffler Finance BV (BB-/Ba2) | |
| | 28,350,000 | | | | 4.250 | | | | 05/15/21 | | | | 27,216,000 | |
| Schaeffler Holding Finance BV (B/B1)(c) | |
| | 7,200,000 | | | | 6.875 | | | | 08/15/18 | | | | 7,452,000 | |
| | 4,000,000 | | | | 6.750 | | | | 11/15/22 | | | | 4,310,000 | |
| ZF North America Capital, Inc. (BB/Ba2) | |
| | 10,050,000 | | | | 4.500 | | | | 04/29/22 | | | | 9,497,250 | |
| | 13,950,000 | | | | 4.750 | | | | 04/29/25 | | | | 12,781,688 | |
| | | | | | | | | | | | | | |
| | | | | | | | | | | | | 81,506,938 | |
| | |
| | Banks(d) – 3.8% | |
| Bank of America Corp. (BB+/Ba2) | |
| | 10,050,000 | | | | 6.250 | | | | 09/05/49 | | | | 9,823,875 | |
| | 15,000,000 | | | | 6.500 | | | | 10/23/49 | | | | 15,281,250 | |
| Barclays Bank PLC (B+/NR) | |
| | 10,000,000 | | | | 8.250 | | | | 12/15/49 | | | | 10,450,000 | |
| Citigroup, Inc. (BB+/Ba2) | |
| | 14,000,000 | | | | 5.875 | | | | 03/27/49 | | | | 13,755,000 | |
| | 10,000,000 | | | | 5.900 | (e) | | | 12/31/49 | | | | 9,750,000 | |
| Credit Suisse Group AG (BB/NR)(a) | |
| | 20,000,000 | | | | 7.500 | | | | 12/11/49 | | | | 20,850,000 | |
| ING Groep NV (BB-/Ba1) | |
| | 5,500,000 | | | | 6.500 | | | | 04/16/49 | | | | 5,225,000 | |
| JPMorgan Chase & Co. (BBB-/Baa3) | |
| | 4,250,000 | | | | 5.000 | | | | 07/01/49 | | | | 4,133,125 | |
| | 20,000,000 | | | | 6.100 | | | | 10/01/49 | | | | 19,870,000 | |
| | |
Principal
Amount | | | Interest
Rate | | | Maturity
Date | | | Value | |
| | Corporate Obligations – (continued) | |
| | Banks(d) – (continued) | |
| Morgan Stanley, Inc. (BB/Ba1) | |
| $ | 10,000,000 | | | | 5.550 | % | | | 07/15/49 | | | $ | 9,850,000 | |
| Royal Bank of Scotland Group PLC (B/B1) | |
| | 26,850,000 | | | | 7.500 | | | | 12/29/49 | | | | 26,791,199 | |
| | 8,550,000 | | | | 8.000 | | | | 12/29/49 | | | | 8,614,125 | |
| Wells Fargo & Co. (BBB/Baa2) | |
| | 12,000,000 | | | | 5.875 | | | | 06/15/49 | | | | 12,285,000 | |
| | | | | | | | | | | | | | |
| | | | | | | | | | | | | 166,678,574 | |
| | |
| | Building Materials – 2.1% | |
| Atrium Windows & Doors, Inc. (B-/Caa1)(a) | |
| | 11,150,000 | | | | 7.750 | | | | 05/01/19 | | | | 8,237,063 | |
| Builders FirstSource, Inc. (BB-/B3)(a) | |
| | 8,000,000 | | | | 7.625 | | | | 06/01/21 | | | | 8,310,000 | |
| Building Materials Corp. of America (BB+/Ba2)(a) | |
| | 8,500,000 | | | | 6.000 | | | | 10/15/25 | | | | 8,585,000 | |
| Gibraltar Industries, Inc. (BB-/NR) | |
| | 5,000,000 | | | | 6.250 | | | | 02/01/21 | | | | 5,075,000 | |
| Hardwoods Acquisition, Inc. (B/B3)(a) | |
| | 14,000,000 | | | | 7.500 | | | | 08/01/21 | | | | 13,072,500 | |
| James Hardie International Finance Ltd. (BB-/Ba2)(a) | |
| | 6,450,000 | | | | 5.875 | | | | 02/15/23 | | | | 6,498,375 | |
| Masonite International Corp. (NR/B2)(a) | |
| | 9,000,000 | | | | 5.625 | | | | 03/15/23 | | | | 9,202,500 | |
| RSI Home Products, Inc. (B+/B1)(a) | |
| | 9,900,000 | | | | 6.500 | | | | 03/15/23 | | | | 9,974,250 | |
| Safway Group Holding LLC/Safway Finance Corp. (B+/B3)(a) | |
| | 4,800,000 | | | | 7.000 | | | | 05/15/18 | | | | 4,914,000 | |
| Summit Materials LLC/Summit Materials Finance Corp. (B/Caa2) | |
| | 1,575,000 | | | | 10.500 | | | | 01/31/20 | | | | 1,685,250 | |
| Transfield Services Ltd. (B+/Ba3)(a) | |
| | 4,350,000 | | | | 8.375 | | | | 05/15/20 | | | | 4,426,125 | |
| Zachry Holdings, Inc. (B+/B2)(a) | |
| | 12,000,000 | | | | 7.500 | | | | 02/01/20 | | | | 11,880,000 | |
| | | | | | | | | | | | | | |
| | | | | | | | | | | | | 91,860,063 | |
| | |
| | Chemicals – 1.8% | |
| Ashland, Inc. (BB/Ba1) | |
| | 10,000,000 | | | | 4.750 | | | | 08/15/22 | | | | 9,300,000 | |
| Hexion US Finance Corp./Hexion Nova Scotia Finance ULC
(CCC/Caa2) |
|
| | 15,000,000 | | | | 8.875 | | | | 02/01/18 | | | | 11,925,000 | |
| Hexion, Inc./Hexion Nova Scotia Finance ULC (CCC/Caa3) | |
| | 750,000 | | | | 9.000 | | | | 11/15/20 | | | | 435,000 | |
| Huntsman International LLC (B+/B1) | |
| | 16,950,000 | | | | 4.875 | | | | 11/15/20 | | | | 14,704,125 | |
| Momentive Performance Materials, Inc. (B/B3) | |
| | 14,500,000 | | | | 3.880 | | | | 10/24/21 | | | | 11,165,000 | |
| The Chemours Co. (BB-/B1)(a)(e) | |
| | 5,550,000 | | | | 6.625 | | | | 05/15/23 | | | | 3,735,872 | |
| | 20,150,000 | | | | 7.000 | | | | 05/15/25 | | | | 13,399,750 | |
| Univar USA, Inc. (B/Caa1)(a) | |
| | 10,350,000 | | | | 6.750 | | | | 07/15/23 | | | | 9,573,750 | |
| WR Grace & Co. (BB-/Ba3)(a) | |
| | 3,000,000 | | | | 5.125 | | | | 10/01/21 | | | | 2,955,000 | |
| | 2,150,000 | | | | 5.625 | | | | 10/01/24 | | | | 2,096,250 | |
| | | | | | | | | | | | | | |
| | | | | | | | | | | | | 79,289,747 | |
| | |
| | |
| The accompanying notes are an integral part of these financial statements. | | 71 |
GOLDMAN SACHS HIGH YIELD FUND
Schedule of Investments (continued)
September 30, 2015 (Unaudited)
| | | | | | | | | | | | | | |
Principal
Amount | | | Interest
Rate | | | Maturity
Date | | | Value | |
| | Corporate Obligations – (continued) | |
| | Conglomerates – 0.4% | |
| Park-Ohio Industries, Inc. (B-/B3) | |
| $ | 15,000,000 | | | | 8.125 | % | | | 04/01/21 | | | $ | 15,525,000 | |
| | |
| | Construction Machinery(a) – 1.6% | |
| Accudyne Industries Borrower/Accudyne Industries LLC
(CCC/Caa1) |
|
| | 10,000,000 | | | | 7.750 | | | | 12/15/20 | | | | 8,662,500 | |
| ATS Automation Tooling Systems, Inc. (B+/B2) | |
| | 10,250,000 | | | | 6.500 | | | | 06/15/23 | | | | 10,407,850 | |
| Cleaver-Brooks, Inc. (B/B2) | |
| | 5,000,000 | | | | 8.750 | | | | 12/15/19 | | | | 4,775,000 | |
| DH Services Luxembourg Sarl (CCC+/Caa1) | |
| | 17,000,000 | | | | 7.750 | | | | 12/15/20 | | | | 17,340,000 | |
| Milacron LLC/Mcron Finance Corp. (CCC+/Caa1) | |
| | 21,000,000 | | | | 7.750 | | | | 02/15/21 | | | | 21,472,500 | |
| Waterjet Holdings, Inc. (B/B2) | |
| | 10,200,000 | | | | 7.625 | | | | 02/01/20 | | | | 10,200,000 | |
| | | | | | | | | | | | | | |
| | | | | | | | | | | | | 72,857,850 | |
| | |
| | Consumer Products – Household & Leisure – 0.6% | |
| Spectrum Brands, Inc. (B/B2) | |
| | 3,750,000 | | | | 6.375 | | | | 11/15/20 | | | | 3,951,562 | |
| | 6,915,000 | | | | 6.625 | | | | 11/15/22 | | | | 7,338,544 | |
| The Sun Products Corp. (CCC/Caa2)(a) | |
| | 19,000,000 | | | | 7.750 | | | | 03/15/21 | | | | 16,150,000 | |
| | | | | | | | | | | | | | |
| | | | | | | | | | | | | 27,440,106 | |
| | |
| | Consumer Products – Industrial – 1.2% | |
| HD Supply, Inc. (B-/B3) | |
| | 7,000,000 | | | | 11.000 | | | | 04/15/20 | | | | 7,778,750 | |
| HD Supply, Inc. (B-/Caa1) | |
| | 10,000,000 | | | | 7.500 | | | | 07/15/20 | | | | 10,437,500 | |
| | 15,000,000 | | | | 11.500 | | | | 07/15/20 | | | | 16,968,750 | |
| HD Supply, Inc. (BB-/B1)(a) | |
| | 11,950,000 | | | | 5.250 | | | | 12/15/21 | | | | 12,024,687 | |
| WESCO Distribution, Inc. (BB-/B1) | |
| | 8,250,000 | | | | 5.375 | | | | 12/15/21 | | | | 7,950,938 | |
| | | | | | | | | | | | | | |
| | | | | | | | | | | | | 55,160,625 | |
| | |
| | Consumer Products – Non Durable – 1.5% | |
| Acosta, Inc. (CCC+/Caa1)(a) | |
| | 10,000,000 | | | | 7.750 | | | | 10/01/22 | | | | 9,475,000 | |
| Constellation Brands, Inc. (BB+/Ba1) | |
| | 2,500,000 | | | | 3.750 | | | | 05/01/21 | | | | 2,484,375 | |
| | 12,500,000 | | | | 4.250 | | | | 05/01/23 | | | | 12,468,750 | |
| | 8,150,000 | | | | 4.750 | | | | 11/15/24 | | | | 8,272,250 | |
| Prestige Brands, Inc. (B-/Caa1) | |
| | 3,700,000 | | | | 8.125 | | | | 02/01/20 | | | | 3,885,000 | |
| | 6,850,000 | | | | 5.375 | (a) | | | 12/15/21 | | | | 6,678,750 | |
| Sally Holdings LLC (BB+/Ba2) | |
| | 150,000 | | | | 6.875 | | | | 11/15/19 | | | | 156,000 | |
| | 20,000,000 | | | | 5.750 | | | | 06/01/22 | | | | 20,800,000 | |
| | | | | | | | | | | | | | |
| | | | | | | | | | | | | 64,220,125 | |
| | |
| | Electrical Components & Equipment(a) – 0.2% | |
| Anixter, Inc. (BB/Ba3) | |
| | 7,250,000 | | | | 5.500 | | | | 03/01/23 | | | | 7,213,750 | |
| | |
Principal
Amount | | | Interest
Rate | | | Maturity
Date | | | Value | |
| | Corporate Obligations – (continued) | |
| | Emerging Markets(a) – 1.0% | |
| Digicel Group Ltd. (NR/Caa1) | |
| $ | 11,800,000 | | | | 8.250 | % | | | 09/30/20 | | | $ | 10,909,100 | |
| | 5,000,000 | | | | 7.125 | | | | 04/01/22 | | | | 4,325,000 | |
| Digicel Ltd. (NR/B1) | |
| | 5,000,000 | | | | 7.000 | | | | 02/15/20 | | | | 4,950,000 | |
| | 4,000,000 | | | | 6.000 | | | | 04/15/21 | | | | 3,630,000 | |
| | 22,000,000 | | | | 6.750 | | | | 03/01/23 | | | | 19,800,000 | |
| | | | | | | | | | | | | | |
| | | | | | | | | | | | | 43,614,100 | |
| | |
| | Energy – Coal – 0.1% | |
| Peabody Energy Corp. (B-/Caa2)(e) | |
| | 12,000,000 | | | | 6.000 | | | | 11/15/18 | | | | 3,090,000 | |
| Peabody Energy Corp. (BB-/Caa1)(a) | |
| | 6,850,000 | | | | 10.000 | | | | 03/15/22 | | | | 2,585,875 | |
| | | | | | | | | | | | | | |
| | | | | | | | | | | | | 5,675,875 | |
| | |
| | Energy – Exploration & Production – 7.4% | |
| Antero Resources Corp. (BB/Ba3) | |
| | 8,550,000 | | | | 5.375 | | | | 11/01/21 | | | | 7,502,625 | |
| | 7,900,000 | | | | 5.125 | | | | 12/01/22 | | | | 6,754,500 | |
| Antero Resources Corp. (BB/Ba3)(a) | |
| | 11,025,000 | | | | 5.625 | | | | 06/01/23 | | | | 9,646,875 | |
| Berry Petroleum Co. (B+/B3) | |
| | 12,000,000 | | | | 6.375 | | | | 09/15/22 | | | | 3,960,000 | |
| Carrizo Oil & Gas, Inc. (B/B2) | |
| | 5,400,000 | | | | 6.250 | | | | 04/15/23 | | | | 4,698,000 | |
| Chaparral Energy, Inc. (B-/Caa1) | |
| | 7,000,000 | | | | 9.875 | | | | 10/01/20 | | | | 2,205,000 | |
| | 3,175,000 | | | | 8.250 | | | | 09/01/21 | | | | 920,750 | |
| | 10,000,000 | | | | 7.625 | | | | 11/15/22 | | | | 2,800,000 | |
| Chesapeake Energy Corp. (BB+/Ba1) | |
| | 4,000,000 | | | | 6.625 | | | | 08/15/20 | | | | 2,965,000 | |
| | 850,000 | | | | 6.875 | | | | 11/15/20 | | | | 624,750 | |
| | 3,000,000 | | | | 6.125 | | | | 02/15/21 | | | | 2,100,000 | |
| | 9,000,000 | | | | 4.875 | | | | 04/15/22 | | | | 5,872,500 | |
| Chesapeake Energy Corp. (BB+/Ba1)(e) | |
| | 11,000,000 | | | | 5.750 | | | | 03/15/23 | | | | 7,177,500 | |
| Comstock Resources, Inc. (B/B2)(a)(e) | |
| | 10,975,000 | | | | 10.000 | | | | 03/15/20 | | | | 7,627,625 | |
| Concho Resources, Inc. (BB+/Ba3) | |
| | 760,000 | | | | 7.000 | | | | 01/15/21 | | | | 767,600 | |
| | 6,000,000 | | | | 5.500 | | | | 10/01/22 | | | | 5,700,000 | |
| CrownRock LP/CrownRock Finance, Inc. (B/Caa1)(a) | |
| | 20,000,000 | | | | 7.125 | | | | 04/15/21 | | | | 19,200,000 | |
| | 1,450,000 | | | | 7.750 | | | | 02/15/23 | | | | 1,428,250 | |
| Denbury Resources, Inc. (BB/B1) | |
| | 11,350,000 | | | | 4.625 | | | | 07/15/23 | | | | 6,129,000 | |
| EP Energy LLC/Everest Acquisition Finance, Inc. (B/B1) | |
| | 14,000,000 | | | | 6.375 | | | | 06/15/23 | | | | 10,500,000 | |
| Gulfmark Offshore, Inc. (B/Caa1)(e) | |
| | 9,250,000 | | | | 6.375 | | | | 03/15/22 | | | | 5,607,813 | |
| Halcon Resources Corp. (CCC/Caa2)(a) | |
| | 10,157,000 | | | | 13.000 | | | | 02/15/22 | | | | 6,462,391 | |
| Laredo Petroleum, Inc. (B/B2) | |
| | 9,300,000 | | | | 5.625 | | | | 01/15/22 | | | | 8,323,500 | |
| | 6,385,000 | | | | 7.375 | | | | 05/01/22 | | | | 6,177,487 | |
| | 10,900,000 | | | | 6.250 | | | | 03/15/23 | | | | 9,810,000 | |
| | |
| | |
| 72 | | The accompanying notes are an integral part of these financial statements. |
GOLDMAN SACHS HIGH YIELD FUND
| | | | | | | | | | | | | | |
Principal
Amount | | | Interest
Rate | | | Maturity
Date | | | Value | |
| | Corporate Obligations – (continued) | |
| | Energy – Exploration & Production – (continued) | |
| Linn Energy LLC/Linn Energy Finance Corp. (B/B3) | |
| $ | 19,000,000 | | | | 6.250 | % | | | 11/01/19 | | | $ | 5,035,000 | |
| | 2,850,000 | | | | 7.750 | | | | 02/01/21 | | | | 669,750 | |
| MEG Energy Corp. (BB-/B1)(a) | |
| | 7,500,000 | | | | 6.500 | | | | 03/15/21 | | | | 6,150,000 | |
| | 17,000,000 | | | | 6.375 | | | | 01/30/23 | | | | 13,302,500 | |
| Newfield Exploration Co. (BBB-/Ba1) | |
| | 8,700,000 | | | | 5.375 | | | | 01/01/26 | | | | 7,960,500 | |
| Oasis Petroleum, Inc. (B+/B2)(e) | |
| | 19,000,000 | | | | 6.875 | | | | 03/15/22 | | | | 15,057,500 | |
| Paramount Resources Ltd. (BB-/B3)(a) | |
| | 10,650,000 | | | | 6.875 | | | | 06/30/23 | | | | 9,159,000 | |
| Rice Energy, Inc. (B-/B3)(a) | |
| | 10,000,000 | | | | 7.250 | | | | 05/01/23 | | | | 9,325,000 | |
| RSP Permian, Inc. (B/B3) | |
| | 9,850,000 | | | | 6.625 | | | | 10/01/22 | | | | 9,456,000 | |
| Samson Investment Co. (D/WR)(b) | |
| | 20,000,000 | | | | 9.750 | | | | 02/15/20 | | | | 200,000 | |
| SM Energy Co. (BB/Ba2) | |
| | 15,000,000 | | | | 6.500 | | | | 11/15/21 | | | | 14,100,000 | |
| | 2,450,000 | | | | 6.125 | | | | 11/15/22 | | | | 2,229,500 | |
| | 19,000,000 | | | | 5.000 | | | | 01/15/24 | | | | 16,007,500 | |
| Vanguard Natural Resourses LLC/VNR Finance Corp. (B/B3) | |
| | 14,650,000 | | | | 7.875 | | | | 04/01/20 | | | | 8,790,000 | |
| Whiting Canadian Holding Co. ULC (BB/Ba2) | |
| | 12,000,000 | | | | 8.125 | | | | 12/01/19 | | | | 11,610,000 | |
| Whiting Petroleum Corp. (BB/Ba2) | |
| | 12,000,000 | | | | 5.000 | | | | 03/15/19 | | | | 10,440,000 | |
| | 19,000,000 | | | | 5.750 | | | | 03/15/21 | | | | 16,435,000 | |
| | 12,000,000 | | | | 6.250 | | | | 04/01/23 | | | | 10,260,000 | |
| WPX Energy, Inc. (BB/Ba1)(e) | |
| | 15,550,000 | | | | 8.250 | | | | 08/01/23 | | | | 14,111,625 | |
| | | | | | | | | | | | | | |
| | | | | | | | | | | | | 325,260,041 | |
| | |
| | Energy – Services – 1.1% | |
| CVR Refining LLC/Coffeyville Finance, Inc. (BB-/B1) | |
| | 7,500,000 | | | | 6.500 | | | | 11/01/22 | | | | 7,256,250 | |
| FTS International, Inc. (B+/B1)(a)(d) | |
| | 5,100,000 | | | | 7.837 | | | | 06/15/20 | | | | 3,799,500 | |
| FTS International, Inc. (CCC+/Caa2) | |
| | 7,250,000 | | | | 6.250 | | | | 05/01/22 | | | | 2,247,500 | |
| Sunoco LP/Sunoco Finance Corp. (BB/Ba3)(a) | |
| | 8,150,000 | | | | 5.500 | | | | 08/01/20 | | | | 8,027,750 | |
| | 2,800,000 | | | | 6.375 | | | | 04/01/23 | | | | 2,737,000 | |
| Transocean, Inc. (BB+/Ba1) | |
| | 21,500,000 | | | | 6.375 | (e) | | | 12/15/21 | | | | 15,963,750 | |
| | 12,000,000 | | | | 7.500 | | | | 04/15/31 | | | | 7,740,000 | |
| | | | | | | | | | | | | | |
| | | | | | | | | | | | | 47,771,750 | |
| | |
| | Entertainment & Leisure – 0.3% | |
| Carmike Cinemas, Inc. (BB/B1)(a) | |
| | 3,950,000 | | | | 6.000 | | | | 06/15/23 | | | | 3,989,500 | |
| Regal Entertainment Group (B-/B3) | |
| | 10,100,000 | | | | 5.750 | | | | 03/15/22 | | | | 9,898,000 | |
| | | | | | | | | | | | | | |
| | | | | | | | | | | | | 13,887,500 | |
| | |
Principal
Amount | | | Interest
Rate | | | Maturity
Date | | | Value | |
| | Corporate Obligations – (continued) | |
| | Environmental – 0.6% | |
| ADS Waste Holdings, Inc. (CCC+/Caa2) | |
| $ | 13,200,000 | | | | 8.250 | % | | | 10/01/20 | | | $ | 13,134,000 | |
| Casella Waste Systems, Inc. (B-/Caa1) | |
| | 15,000,000 | | | | 7.750 | | | | 02/15/19 | | | | 14,737,500 | |
| | | | | | | | | | | | | | |
| | | | | | | | | | | | | 27,871,500 | |
| | |
| | Finance – 5.7% | |
| Aircastle Ltd. (BB+/Ba2) | |
| | 5,000,000 | | | | 5.500 | | | | 02/15/22 | | | | 5,112,500 | |
| Ally Financial, Inc. (BB+/B1) | |
| | 10,000,000 | | | | 6.250 | | | | 12/01/17 | | | | 10,500,000 | |
| | 10,000,000 | | | | 5.125 | | | | 09/30/24 | | | | 9,875,000 | |
| | 15,000,000 | | | | 8.000 | | | | 11/01/31 | | | | 17,325,000 | |
| CIT Group, Inc. (BB-/B1) | |
| | 12,000,000 | | | | 5.250 | | | | 03/15/18 | | | | 12,390,000 | |
| CIT Group, Inc. (BB-/B1)(a) | |
| | 19,000,000 | | | | 5.500 | | | | 02/15/19 | | | | 19,712,500 | |
| CIT Group, Inc. (BB-/B1) | |
| | 7,000,000 | | | | 5.000 | | | | 08/15/22 | | | | 7,000,000 | |
| HRG Group, Inc. (B+/Ba3) | |
| | 10,000,000 | | | | 7.875 | | | | 07/15/19 | | | | 10,375,000 | |
| International Lease Finance Corp. (BB+/Ba2) | |
| | 20,000,000 | | | | 5.875 | | | | 04/01/19 | | | | 21,000,000 | |
| | 8,450,000 | | | | 6.250 | | | | 05/15/19 | | | | 8,999,250 | |
| | 11,900,000 | | | | 4.625 | | | | 04/15/21 | | | | 11,959,500 | |
| Jefferies Finance LLC/JFIN Co-Issuer Corp. (B/B1)(a) | |
| | 9,150,000 | | | | 7.375 | | | | 04/01/20 | | | | 8,818,312 | |
| Jefferies LoanCore LLC/JLC Finance Corp. (B/B2)(a) | |
| | 5,000,000 | | | | 6.875 | | | | 06/01/20 | | | | 4,800,000 | |
| Nationstar Mortgage LLC/Nationstar Capital Corp. (B+/B2) | |
| | 10,950,000 | | | | 6.500 | | | | 08/01/18 | | | | 10,402,500 | |
| | 8,000,000 | | | | 7.875 | | | | 10/01/20 | | | | 7,280,000 | |
| | 9,000,000 | | | | 6.500 | | | | 07/01/21 | | | | 7,470,000 | |
| Navient Corp. (BB/Ba3) | |
| | 15,900,000 | | | | 5.500 | | | | 01/15/19 | | | | 14,767,125 | |
| | 10,000,000 | | | | 4.875 | | | | 06/17/19 | | | | 8,900,000 | |
| | 6,000,000 | | | | 5.875 | | | | 03/25/21 | | | | 5,025,000 | |
| | 5,000,000 | | | | 6.125 | | | | 03/25/24 | | | | 4,000,000 | |
| OneMain Financial Holdings, Inc. (B+/B2)(a) | |
| | 10,000,000 | | | | 6.750 | | | | 12/15/19 | | | | 10,325,000 | |
| Rialto Holdings LLC/Rialto Corp. (B/B2)(a) | |
| | 11,300,000 | | | | 7.000 | | | | 12/01/18 | | | | 11,469,500 | |
| Speedy Cash Intermediate Holdings Corp. (B/B3)(a) | |
| | 13,500,000 | | | | 10.750 | | | | 05/15/18 | | | | 10,732,500 | |
| Synovus Financial Corp. (BB+/Ba2) | |
| | 10,896,000 | | | | 7.875 | | | | 02/15/19 | | | | 12,176,280 | |
| | | | | | | | | | | | | | |
| | | | | | | | | | | | | 250,414,967 | |
| | |
| | Food – 1.1% | |
| Cott Beverages, Inc. (B-/B3) | |
| | 16,050,000 | | | | 5.375 | | | | 07/01/22 | | | | 15,568,500 | |
| Post Holdings, Inc. (B/B3)(a) | |
| | 11,800,000 | | | | 6.750 | | | | 12/01/21 | | | | 11,829,500 | |
| | 3,250,000 | | | | 6.000 | | | | 12/15/22 | | | | 3,128,125 | |
| R&R Ice Cream PLC (B/B2) | |
| AUD | 3,800,000 | | | | 8.250 | | | | 05/15/20 | | | | 2,694,026 | |
| | |
| | |
| The accompanying notes are an integral part of these financial statements. | | 73 |
GOLDMAN SACHS HIGH YIELD FUND
Schedule of Investments (continued)
September 30, 2015 (Unaudited)
| | | | | | | | | | | | | | |
Principal
Amount | | | Interest
Rate | | | Maturity
Date | | | Value | |
| | Corporate Obligations – (continued) | |
| | Food – (continued) | |
| Shearer’s Foods LLC/Chip Finance Corp. (B/B1)(a) | |
| $ | 6,957,000 | | | | 9.000 | % | | | 11/01/19 | | | $ | 7,374,420 | |
| Wells Enterprises, Inc. (B+/B3)(a) | |
| | 8,750,000 | | | | 6.750 | | | | 02/01/20 | | | | 8,881,250 | |
| | | | | | | | | | | | | | |
| | | | | | | | | | | | | 49,475,821 | |
| | |
| | Gaming – 4.2% | |
| Downstream Development Authority of the Quapaw Tribe of
Oklahoma (B/B3)(a) |
|
| | 14,000,000 | | | | 10.500 | | | | 07/01/19 | | | | 14,420,000 | |
| GLP Capital LP/GLP Financing II, Inc. (BBB-/Ba1) | |
| | 10,000,000 | | | | 4.875 | | | | 11/01/20 | | | | 10,125,000 | |
| | 8,800,000 | | | | 5.375 | | | | 11/01/23 | | | | 8,932,000 | |
| International Game Technology PLC (BB+/Ba2)(a) | |
| | 9,100,000 | | | | 6.250 | | | | 02/15/22 | | | | 8,394,750 | |
| MGM Resorts International (B+/B3) | |
| | 19,900,000 | | | | 6.750 | | | | 10/01/20 | | | | 20,497,000 | |
| | 30,000,000 | | | | 6.625 | | | | 12/15/21 | | | | 30,675,000 | |
| | 16,900,000 | | | | 7.750 | | | | 03/15/22 | | | | 18,040,750 | |
| | 4,100,000 | | | | 6.000 | (e) | | | 03/15/23 | | | | 3,992,375 | |
| New Red Finance, Inc. (B+/Ba3)(a) | |
| | 16,000,000 | | | | 4.625 | | | | 01/15/22 | | | | 15,640,000 | |
| New Red Finance, Inc. (B-/B3)(a) | |
| | 26,250,000 | | | | 6.000 | | | | 04/01/22 | | | | 26,610,938 | |
| River Cree Enterprises LP (B-/NR)(a) | |
| CAD | 6,750,000 | | | | 11.000 | | | | 01/20/21 | | | | 5,058,074 | |
| Scientific Games International, Inc. (B/Caa1) | |
| $ | 12,500,000 | | | | 10.000 | | | | 12/01/22 | | | | 10,906,250 | |
| Seminole Hard Rock Entertainment, Inc. (BB-/B2)(a) | |
| | 13,150,000 | | | | 5.875 | | | | 05/15/21 | | | | 12,985,625 | |
| | | | | | | | | | | | | | |
| | | | | | | | | | | | | 186,277,762 | |
| | |
| | Health Care – Medical Products(a) – 0.4% | |
| Fresenius Medical Care US Finance II, Inc. (BB+/Ba2) | |
| | 8,650,000 | | | | 5.625 | | | | 07/31/19 | | | | 9,212,250 | |
| | 4,505,000 | | | | 5.875 | | | | 01/31/22 | | | | 4,842,875 | |
| Fresenius Medical Care US Finance, Inc. (BB+/Ba2) | |
| | 4,550,000 | | | | 5.750 | | | | 02/15/21 | | | | 4,891,250 | |
| | | | | | | | | | | | | | |
| | | | | | | | | | | | | 18,946,375 | |
| | |
| | Health Care – Pharmaceuticals(a) – 2.7% | |
| Concordia Healthcare Corp. (CCC+/Caa2) | |
| | 10,650,000 | | | | 7.000 | | | | 04/15/23 | | | | 9,105,750 | |
| Endo Ltd./Endo Finance LLC/Endo Finco, Inc. (B/B1) | |
| | 10,000,000 | | | | 6.000 | | | | 07/15/23 | | | | 9,875,000 | |
| Valeant Pharmaceuticals International, Inc. (B/B1) | |
| | 5,147,000 | | | | 6.750 | | | | 08/15/18 | | | | 5,237,073 | |
| | 25,000,000 | | | | 6.375 | | | | 10/15/20 | | | | 24,968,750 | |
| Valeant Pharmaceuticals International, Inc. (B/B1) | |
| | 20,000,000 | | | | 7.500 | | | | 07/15/21 | | | | 20,700,000 | |
| Valeant Pharmaceuticals International, Inc. (B/B1) | |
| | 7,000,000 | | | | 6.750 | | | | 08/15/21 | | | | 7,052,500 | |
| | 8,000,000 | | | | 5.625 | | | | 12/01/21 | | | | 7,680,000 | |
| | 50,000 | | | | 7.250 | | | | 07/15/22 | | | | 51,125 | |
| | 4,650,000 | | | | 5.500 | | | | 03/01/23 | | | | 4,417,500 | |
| Valeant Pharmaceuticals International, Inc. (B/B1) | |
| | 16,900,000 | | | | 5.875 | | | | 05/15/23 | | | | 16,139,500 | |
| | |
Principal
Amount | | | Interest
Rate | | | Maturity
Date | | | Value | |
| | Corporate Obligations – (continued) | |
| | Health Care – Pharmaceuticals(a) – (continued) | |
| Valeant Pharmaceuticals International, Inc. (B/B1) | |
| $ | 14,450,000 | | | | 6.125 | % | | | 04/15/25 | | | $ | 13,763,625 | |
| | | | | | | | | | | | | | |
| | | | | | | | | | | | | 118,990,823 | |
| | |
| | Health Care – Services – 6.8% | |
| Acadia Healthcare Co., Inc. (B-/B3)(a) | |
| | 4,000,000 | | | | 5.625 | | | | 02/15/23 | | | | 3,985,000 | |
| CHS/Community Health Systems, Inc. (B-/B3) | |
| | 20,000,000 | | | | 6.875 | | | | 02/01/22 | | | | 20,475,000 | |
| CHS/Community Health Systems, Inc. (BB/Ba2) | |
| | 25,000,000 | | | | 5.125 | | | | 08/15/18 | | | | 25,500,000 | |
| CHS/Community Health Systems, Inc. (BB/Ba2) | |
| | 7,700,000 | | | | 5.125 | | | | 08/01/21 | | | | 7,892,500 | |
| Crimson Merger Sub, Inc. (CCC+/Caa1)(a) | |
| | 24,885,000 | | | | 6.625 | | | | 05/15/22 | | | | 21,463,312 | |
| Emdeon, Inc. (CCC+/Caa1)(a) | |
| | 5,950,000 | | | | 6.000 | | | | 02/15/21 | | | | 5,831,000 | |
| ExamWorks Group, Inc. (B-/B3) | |
| | 5,200,000 | | | | 5.625 | | | | 04/15/23 | | | | 5,232,500 | |
| HCA, Inc. (B+/B1) | |
| | 15,000,000 | | | | 7.500 | | | | 02/15/22 | | | | 16,875,000 | |
| | 1,200,000 | | | | 5.875 | | | | 05/01/23 | | | | 1,239,000 | |
| HCA, Inc. (BBB-/Ba1) | |
| | 3,000,000 | | | | 3.750 | | | | 03/15/19 | | | | 2,992,500 | |
| | 50,000,000 | | | | 6.500 | | | | 02/15/20 | | | | 54,500,000 | |
| | 18,750,000 | | | | 5.000 | | | | 03/15/24 | | | | 18,796,875 | |
| | 26,400,000 | | | | 5.250 | | | | 04/15/25 | | | | 26,961,000 | |
| Lifepoint Hospitals, Inc. (BB-/Ba2) | |
| | 9,700,000 | | | | 5.500 | | | | 12/01/21 | | | | 9,797,000 | |
| MPT Operating Partnership LP/MPT Finance Corp. (BBB-/Ba1) | |
| | 19,500,000 | | | | 6.875 | | | | 05/01/21 | | | | 20,377,500 | |
| | 5,000,000 | | | | 6.375 | | | | 02/15/22 | | | | 5,225,000 | |
| Quintiles Transnational Corp. (BB/Ba3)(a) | |
| | 9,200,000 | | | | 4.875 | | | | 05/15/23 | | | | 9,108,000 | |
| Surgical Care Affiliates, Inc. (B-/Caa1)(a) | |
| | 5,900,000 | | | | 6.000 | | | | 04/01/23 | | | | 5,855,750 | |
| Tenet Healthcare Corp. (BB-/Ba2)(a)(d) | |
| | 9,550,000 | | | | 3.837 | | | | 06/15/20 | | | | 9,478,375 | |
| Tenet Healthcare Corp. (CCC+/B3) | |
| | 27,300,000 | | | | 6.750 | | | | 06/15/23 | | | | 27,095,250 | |
| | | | | | | | | | | | | | |
| | | | | | | | | | | | | 298,680,562 | |
| | |
| | Home Construction – 2.9% | |
| Beazer Homes USA, Inc. (CCC/Caa1) | |
| | 2,900,000 | | | | 5.750 | | | | 06/15/19 | | | | 2,729,625 | |
| | 6,900,000 | | | | 7.500 | | | | 09/15/21 | | | | 6,658,500 | |
| | 5,000,000 | | | | 7.250 | | | | 02/01/23 | | | | 4,612,500 | |
| Brookfield Residential Properties, Inc. (BB-/B1)(a) | |
| | 13,000,000 | | | | 6.500 | | | | 12/15/20 | | | | 12,902,500 | |
| | 2,650,000 | | | | 6.125 | | | | 07/01/22 | | | | 2,557,250 | |
| | 4,000,000 | | | | 6.375 | | | | 05/15/25 | | | | 3,800,000 | |
| Calatlantic Group, Inc. (BB/B1) | |
| | 8,000,000 | | | | 6.250 | | | | 12/15/21 | | | | 8,530,000 | |
| Century Communities, Inc. (B/B3) | |
| | 5,075,000 | | | | 6.875 | | | | 05/15/22 | | | | 4,827,594 | |
| CPG Merger Sub LLC (CCC+/Caa2)(a) | |
| | 5,700,000 | | | | 8.000 | | | | 10/01/21 | | | | 5,742,750 | |
| | |
| | |
| 74 | | The accompanying notes are an integral part of these financial statements. |
GOLDMAN SACHS HIGH YIELD FUND
| | | | | | | | | | | | | | |
Principal
Amount | | | Interest
Rate | | | Maturity
Date | | | Value | |
| | Corporate Obligations – (continued) | |
| | Home Construction – (continued) | |
| D.R. Horton, Inc. (BB+/Ba1) | |
| $ | 7,000,000 | | | | 3.750 | % | | | 03/01/19 | | | $ | 7,035,000 | |
| | 3,200,000 | | | | 4.000 | | | | 02/15/20 | | | | 3,232,000 | |
| | 5,000,000 | | | | 4.750 | | | | 02/15/23 | | | | 5,018,750 | |
| Lennar Corp. (BB/Ba2) | |
| | 2,000,000 | | | | 6.950 | | | | 06/01/18 | | | | 2,172,500 | |
| | 7,600,000 | | | | 4.500 | | | | 06/15/19 | | | | 7,695,000 | |
| | 5,000,000 | | | | 4.500 | | | | 11/15/19 | | | | 5,056,250 | |
| | 3,000,000 | | | | 4.750 | | | | 11/15/22 | | | | 2,895,000 | |
| Meritage Homes Corp. (BB-/Ba3) | |
| | 3,000,000 | | | | 7.150 | | | | 04/15/20 | | | | 3,318,750 | |
| | 2,650,000 | | | | 7.000 | | | | 04/01/22 | | | | 2,855,375 | |
| Toll Brothers Finance Corp. (BB+/Ba1) | |
| | 800,000 | | | | 5.875 | | | | 02/15/22 | | | | 864,000 | |
| | 10,000,000 | | | | 4.375 | | | | 04/15/23 | | | | 9,825,000 | |
| Tri Pointe Holdings, Inc. (BB-/B1) | |
| | 4,000,000 | | | | 4.375 | | | | 06/15/19 | | | | 3,920,000 | |
| | 8,000,000 | | | | 5.875 | | | | 06/15/24 | | | | 7,780,000 | |
| William Lyon Homes, Inc. (B-/NR)(a) | |
| | 1,400,000 | | | | 7.000 | | | | 08/15/22 | | | | 1,431,500 | |
| William Lyon Homes, Inc. (B-/B3) | |
| | 12,650,000 | | | | 7.000 | | | | 08/15/22 | | | | 12,934,625 | |
| Woodside Homes Co. LLC/Woodside Homes Finance, Inc.
(B/B3)(a) |
|
| | 2,054,000 | | | | 6.750 | | | | 12/15/21 | | | | 1,876,842 | |
| | | | | | | | | | | | | | |
| | | | | | | | | | | | | 130,271,311 | |
| | |
| | Life Insurance(a) – 0.2% | |
| Fidelity & Guaranty Life Holdings, Inc. (BB-/Ba3) | |
| | 10,000,000 | | | | 6.375 | | | | 04/01/21 | | | | 10,400,000 | |
| | |
| | Lodging – 0.4% | |
| Felcor Lodging LP (B+/B2) | |
| | 10,000,000 | | | | 5.625 | | | | 03/01/23 | | | | 10,200,000 | |
| New Cotai LLC/New Cotai Capital Corp. (NR/NR)(a)(c)(e) | |
| | 8,265,038 | | | | 10.625 | | | | 05/01/19 | | | | 6,514,744 | |
| RHP Hotel Properties LP/RHP Finance Corp. (BB/B1) | |
| | 3,100,000 | | | | 5.000 | | | | 04/15/23 | | | | 3,069,000 | |
| | | | | | | | | | | | | | |
| | | | | | | | | | | | | 19,783,744 | |
| | |
| | Machinery – 0.5% | |
| AECOM (BB-/Ba3)(a) | |
| | 2,500,000 | | | | 5.750 | | | | 10/15/22 | | | | 2,514,335 | |
| | 5,000,000 | | | | 5.875 | | | | 10/15/24 | | | | 5,047,060 | |
| Constellation Enterprises LLC (CCC+/Caa2)(a) | |
| | 4,350,000 | | | | 10.625 | | | | 02/01/16 | | | | 3,632,250 | |
| EnPro Industries, Inc. (BB-/B1) | |
| | 4,450,000 | | | | 5.875 | | | | 09/15/22 | | | | 4,472,250 | |
| Oshkosh Corp. (BB+/Ba3) | |
| | 4,400,000 | | | | 5.375 | | | | 03/01/25 | | | | 4,400,000 | |
| | | | | | | | | | | | | | |
| | | | | | | | | | | | | 20,065,895 | |
| | |
| | Media – Broadcasting & Radio – 2.5% | |
| iHeartCommunications, Inc. (CCC+/Caa1) | |
| | 10,000,000 | | | | 9.000 | | | | 12/15/19 | | | | 8,600,000 | |
| iHeartCommunications, Inc. (CCC+/Caa1) | |
| | 10,000,000 | | | | 10.625 | | | | 03/15/23 | | | | 8,500,000 | |
| | |
Principal
Amount | | | Interest
Rate | | | Maturity
Date | | | Value | |
| | Corporate Obligations – (continued) | |
| | Media – Broadcasting & Radio – (continued) | |
| iHeartCommunications, Inc. (CCC-/NR)(c) | |
| $ | 6,261,300 | | | | 14.000 | % | | | 02/01/21 | | | $ | 2,629,746 | |
| Nielsen Finance LLC/Nielsen Finance Co. (BB+/B1) | |
| | 5,000,000 | | | | 4.500 | | | | 10/01/20 | | | | 5,012,500 | |
| Sirius XM Radio, Inc. (BB/Ba3)(a) | |
| | 3,200,000 | | | | 5.875 | | | | 10/01/20 | | | | 3,264,000 | |
| | 12,000,000 | | | | 5.750 | | | | 08/01/21 | | | | 12,030,000 | |
| | 9,750,000 | | | | 6.000 | | | | 07/15/24 | | | | 9,774,375 | |
| | 11,800,000 | | | | 5.375 | | | | 04/15/25 | | | | 11,269,000 | |
| Tribune Media Co. (BB-/B2)(a) | |
| | 22,650,000 | | | | 5.875 | | | | 07/15/22 | | | | 21,857,250 | |
| Univision Communications, Inc. (B+/B2)(a) | |
| | 20,000,000 | | | | 6.750 | | | | 09/15/22 | | | | 20,650,000 | |
| | 5,000,000 | | | | 5.125 | | | | 05/15/23 | | | | 4,750,000 | |
| | 2,000,000 | | | | 5.125 | | | | 02/15/25 | | | | 1,880,000 | |
| | | | | | | | | | | | | | |
| | | | | | | | | | | | | 110,216,871 | |
| | |
| | Media – Cable – 4.6% | |
| Adelphia Communications Corp. (NR/NR)(b) | |
| | 2,000,000 | | | | 10.250 | | | | 06/15/49 | | | | 10,000 | |
| Altice US Finance I Corp. (BB-/Ba3)(a) | |
| | 5,050,000 | | | | 5.375 | | | | 07/15/23 | | | | 4,873,250 | |
| Altice US Finance II Corp. (B-/Caa1)(a) | |
| | 3,000,000 | | | | 7.750 | | | | 07/15/25 | | | | 2,640,000 | |
| CCO Holdings LLC/CCO Holdings Capital Corp. (BB-/B1) | |
| | 5,000,000 | | | | 6.625 | | | | 01/31/22 | | | | 5,025,000 | |
| | 18,800,000 | | | | 5.750 | | | | 09/01/23 | | | | 17,907,000 | |
| | 22,600,000 | | | | 5.875 | (a) | | | 05/01/27 | | | | 20,792,000 | |
| CCO Safari II LLC (BBB-/Ba1)(a) | |
| | 10,800,000 | | | | 4.908 | | | | 07/23/25 | | | | 10,739,410 | |
| CSC Holdings LLC (BB/Ba2) | |
| | 5,100,000 | | | | 8.625 | | | | 02/15/19 | | | | 5,253,000 | |
| | 7,650,000 | | | | 6.750 | | | | 11/15/21 | | | | 6,789,375 | |
| | 18,000,000 | | | | 5.250 | | | | 06/01/24 | | | | 14,130,000 | |
| DISH DBS Corp. (BB-/Ba3) | |
| | 10,000,000 | | | | 6.750 | | | | 06/01/21 | | | | 9,450,000 | |
| | 19,000,000 | | | | 5.875 | | | | 11/15/24 | | | | 16,055,000 | |
| Midcontinent Communications & Midcontinent Finance Corp.
(B/B3)(a) |
|
| | 7,500,000 | | | | 6.250 | | | | 08/01/21 | | | | 7,425,000 | |
| Numericable – SFR SAS (B+/Ba3)(a) | |
| | 35,900,000 | | | | 6.000 | | | | 05/15/22 | | | | 34,464,000 | |
| UPC Holding BV (B/B2)(a) | |
| CHF | 8,000,000 | | | | 6.750 | | | | 03/15/23 | | | | 8,810,014 | |
| UPCB Finance IV Ltd. (BB/Ba3)(a) | |
| $ | 7,150,000 | | | | 5.375 | | | | 01/15/25 | | | | 6,721,000 | |
| Virgin Media Finance PLC (B/B2)(a) | |
| | 2,000,000 | | | | 6.375 | | | | 04/15/23 | | | | 1,985,000 | |
| Virgin Media Secured Finance PLC (BB-/Ba3)(a) | |
| | 14,400,000 | | | | 5.375 | | | | 04/15/21 | | | | 14,490,000 | |
| VTR Finance BV (B+/B1)(a) | |
| | 15,000,000 | | | | 6.875 | | | | 01/15/24 | | | | 13,687,500 | |
| Ziggo Bond Finance BV (B/B2)(a) | |
| | 4,100,000 | | | | 5.875 | | | | 01/15/25 | | | | 3,751,500 | |
| | | | | | | | | | | | | | |
| | | | | | | | | | | | | 204,998,049 | |
| | |
| | |
| The accompanying notes are an integral part of these financial statements. | | 75 |
GOLDMAN SACHS HIGH YIELD FUND
Schedule of Investments (continued)
September 30, 2015 (Unaudited)
| | | | | | | | | | | | | | |
Principal
Amount | | | Interest
Rate | | | Maturity
Date | | | Value | |
| | Corporate Obligations – (continued) | |
| | Media – Diversified – 0.4% | |
| Videotron Ltd. (BB/Ba2) | |
| $ | 10,000,000 | | | | 5.000 | % | | | 07/15/22 | | | $ | 9,787,500 | |
| | 8,000,000 | | | | 5.375 | (a) | | | 06/15/24 | | | | 7,820,000 | |
| | | | | | | | | | | | | | |
| | | | | | | | | | | | | 17,607,500 | |
| | |
| | Media – Non Cable(a) – 0.6% | |
| Netflix, Inc. (B+/B1) | |
| | 10,000,000 | | | | 5.500 | | | | 02/15/22 | | | | 10,100,000 | |
| | 14,150,000 | | | | 5.875 | | | | 02/15/25 | | | | 14,539,125 | |
| | | | | | | | | | | | | | |
| | | | | | | | | | | | | 24,639,125 | |
| | |
| | Metals – 1.7% | |
| AK Steel Corp. (B-/Caa1) | |
| | 4,300,000 | | | | 7.625 | | | | 05/15/20 | | | | 2,236,000 | |
| | 5,500,000 | | | | 7.625 | | | | 10/01/21 | | | | 2,928,750 | |
| Alcoa, Inc. (BBB-/Ba1) | |
| | 3,219,000 | | | | 6.150 | | | | 08/15/20 | | | | 3,315,570 | |
| | 12,350,000 | | | | 5.125 | | | | 10/01/24 | | | | 11,763,375 | |
| ArcelorMittal (BB/Ba1) | |
| | 6,000,000 | | | | 6.000 | | | | 03/01/21 | | | | 5,430,000 | |
| | 10,000,000 | | | | 6.750 | (e) | | | 02/25/22 | | | | 9,050,000 | |
| | 10,000,000 | | | | 6.125 | | | | 06/01/25 | | | | 8,100,000 | |
| Constellium NV (B/B1)(a) | |
| | 15,250,000 | | | | 5.750 | | | | 05/15/24 | | | | 11,590,000 | |
| Steel Dynamics, Inc. (BB+/Ba2) | |
| | 6,000,000 | | | | 5.125 | | | | 10/01/21 | | | | 5,685,000 | |
| | 8,650,000 | | | | 5.250 | | | | 04/15/23 | | | | 7,914,750 | |
| | 6,150,000 | | | | 5.500 | | | | 10/01/24 | | | | 5,627,250 | |
| | | | | | | | | | | | | | |
| | | | | | | | | | | | | 73,640,695 | |
| | |
| | Mining(a) – 0.3% | |
| New Gold, Inc. (BB-/B2) | |
| | 14,200,000 | | | | 6.250 | | | | 11/15/22 | | | | 11,644,000 | |
| | |
| | Packaging – 3.0% | |
| Ardagh Finance Holdings SA (CCC+/Caa2)(a)(c) | |
| | 15,244,032 | | | | 8.625 | | | | 06/15/19 | | | | 15,142,723 | |
| Ardagh Packaging Finance PLC (CCC+/Caa1)(a) | |
| | 15,000,000 | | | | 6.250 | | | | 01/31/19 | | | | 14,925,000 | |
| | 5,275,000 | | | | 9.125 | | | | 10/15/20 | | | | 5,499,187 | |
| Ardagh Packaging Finance PLC (NR/Caa1)(a) | |
| | 1,685,294 | | | | 7.000 | | | | 11/15/20 | | | | 1,685,294 | |
| BWAY Holding Co. (CCC/Caa2)(a) | |
| | 29,300,000 | | | | 9.125 | | | | 08/15/21 | | | | 29,007,000 | |
| Reynolds Group Issuer, Inc. (B+/B1) | |
| | 3,200,000 | | | | 7.875 | | | | 08/15/19 | | | | 3,316,000 | |
| Reynolds Group Issuer, Inc. (B+/B1) | |
| | 11,000,000 | | | | 5.750 | | | | 10/15/20 | | | | 11,110,000 | |
| | 2,000,000 | | | | 6.875 | | | | 02/15/21 | | | | 2,070,000 | |
| Reynolds Group Issuer, Inc. (CCC+/Caa2) | |
| | 35,000,000 | | | | 9.000 | | | | 04/15/19 | | | | 35,437,500 | |
| Reynolds Group Issuer, Inc. (CCC+/Caa2) | |
| | 16,000,000 | | | | 9.875 | | | | 08/15/19 | | | | 16,560,000 | |
| | | | | | | | | | | | | | |
| | | | | | | | | | | | | 134,752,704 | |
| | |
| | Paper – 0.8% | |
| Clearwater Paper Corp. (BB/Ba2) | |
| | 2,800,000 | | | | 4.500 | | | | 02/01/23 | | | | 2,611,000 | |
| | |
Principal
Amount | | | Interest
Rate | | | Maturity
Date | | | Value | |
| | Corporate Obligations – (continued) | |
| | Paper – (continued) | |
| Clearwater Paper Corp. (BB/Ba2) – (continued) | |
| $ | 18,550,000 | | | | 5.375 | %(a) | | | 02/01/25 | | | $ | 17,715,250 | |
| Mercer International, Inc. (B+/B2) | |
| | 4,350,000 | | | | 7.000 | | | | 12/01/19 | | | | 4,415,250 | |
| | 9,186,000 | | | | 7.750 | | | | 12/01/22 | | | | 9,300,825 | |
| Stone Container Finance Co. of Canada II (NR/WR)(b) | |
| | 2,250,000 | | | | 7.375 | | | | 07/15/14 | | | | — | |
| | | | | | | | | | | | | | |
| | | | | | | | | | | | | 34,042,325 | |
| | |
| | Printing(a) – 0.4% | |
| Southern Graphics, Inc. (CCC+/Caa1) | |
| | 15,700,000 | | | | 8.375 | | | | 10/15/20 | | | | 15,582,250 | |
| | |
| | Publishing – 0.7% | |
| Nielsen Finance LLC/Nielsen Finance Co. (BB+/B1)(a) | |
| | 10,650,000 | | | | 5.000 | | | | 04/15/22 | | | | 10,357,125 | |
| Outfront Media Capital LLC/Outfront Media Capital Corp.
(BB-/B1) |
|
| | 8,650,000 | | | | 5.875 | | | | 03/15/25 | | | | 8,714,875 | |
| The Nielsen Co Luxembourg SARL (BB+/B1)(a) | |
| | 12,000,000 | | | | 5.500 | | | | 10/01/21 | | | | 12,000,000 | |
| Time, Inc. (BB/B1)(a) | |
| | 1,600,000 | | | | 5.750 | | | | 04/15/22 | | | | 1,500,000 | |
| | | | | | | | | | | | | | |
| | | | | | | | | | | | | 32,572,000 | |
| | |
| | Real Estate – 0.7% | |
| CBRE Services, Inc. (BBB/Baa3) | |
| | 10,000,000 | | | | 5.250 | | | | 03/15/25 | | | | 10,212,500 | |
| DuPont Fabros Technology LP (BB/Ba1) | |
| | 20,000,000 | | | | 5.875 | | | | 09/15/21 | | | | 20,450,000 | |
| | | | | | | | | | | | | | |
| | | | | | | | | | | | | 30,662,500 | |
| | |
| | Retailers – 2.3% | |
| Alphabet Holding Co., Inc. (CCC+/Caa1)(c) | |
| | 400,000 | | | | 7.750 | | | | 11/01/17 | | | | 392,000 | |
| Asbury Automotive Group, Inc. (BB/B1) | |
| | 5,650,000 | | | | 6.000 | | | | 12/15/24 | | | | 5,819,500 | |
| Dollar Tree, Inc. (B+/Ba3)(a) | |
| | 10,050,000 | | | | 5.750 | | | | 03/01/23 | | | | 10,414,312 | |
| L Brands, Inc. (BB+/Ba1) | |
| | 10,337,000 | | | | 6.625 | | | | 04/01/21 | | | | 11,486,991 | |
| | 10,000,000 | | | | 5.625 | | | | 02/15/22 | | | | 10,512,500 | |
| | 950,000 | | | | 5.625 | | | | 10/15/23 | | | | 1,008,188 | |
| Neiman Marcus Group Ltd., Inc. (CCC+/Caa2)(a) | |
| | 25,000,000 | | | | 8.000 | | | | 10/15/21 | | | | 25,843,750 | |
| | 25,000,000 | | | | 8.750 | (c) | | | 10/15/21 | | | | 25,875,000 | |
| Party City Holdings, Inc. (CCC+/B3)(a) | |
| | 4,200,000 | | | | 6.125 | | | | 08/15/23 | | | | 4,236,750 | |
| The William Carter Co. (BB+/Ba2) | |
| | 8,000,000 | | | | 5.250 | | | | 08/15/21 | | | | 8,180,000 | |
| | | | | | | | | | | | | | |
| | | | | | | | | | | | | 103,768,991 | |
| | |
| | Retailers – Food & Drug – 0.5% | |
| Rite Aid Corp. (CCC+/B3) | |
| | 7,000,000 | | | | 6.750 | | | | 06/15/21 | | | | 7,227,500 | |
| | 13,400,000 | | | | 6.125 | (a) | | | 04/01/23 | | | | 13,266,000 | |
| | | | | | | | | | | | | | |
| | | | | | | | | | | | | 20,493,500 | |
| | |
| | |
| 76 | | The accompanying notes are an integral part of these financial statements. |
GOLDMAN SACHS HIGH YIELD FUND
| | | | | | | | | | | | | | |
Principal
Amount | | | Interest
Rate | | | Maturity
Date | | | Value | |
| | Corporate Obligations – (continued) | |
| | Services Cyclical – Business Services – 0.8% | |
| CoreLogic, Inc. (B+/Ba3) | |
| $ | 12,100,000 | | | | 7.250 | % | | | 06/01/21 | | | $ | 12,644,500 | |
| SPL Logistics Escrow LLC (B/B2)(a) | |
| | 11,000,000 | | | | 8.875 | | | | 08/01/20 | | | | 11,550,000 | |
| WEX, Inc. (BB-/Ba3)(a) | |
| | 10,000,000 | | | | 4.750 | | | | 02/01/23 | | | | 9,500,000 | |
| | | | | | | | | | | | | | |
| | | | | | | | | | | | | 33,694,500 | |
| | |
| | Services Cyclical – Rental Equipment – 1.5% | |
| Ahern Rentals, Inc. (B/B3)(a) | |
| | 23,000,000 | | | | 7.375 | | | | 05/15/23 | | | | 20,038,750 | |
| Ashtead Capital, Inc. (BB/Ba3)(a) | |
| | 18,000,000 | | | | 5.625 | | | | 10/01/24 | | | | 17,910,000 | |
| Emeco Pty Ltd. (B-/Caa1)(a) | |
| | 12,250,000 | | | | 9.875 | | | | 03/15/19 | | | | 6,431,250 | |
| United Rentals North America, Inc. (BB+/Ba1) | |
| | 12,200,000 | | | | 4.625 | | | | 07/15/23 | | | | 11,849,250 | |
| United Rentals North America, Inc. (BB-/B1) | |
| | 5,000,000 | | | | 5.750 | | | | 11/15/24 | | | | 4,800,000 | |
| | 7,100,000 | | | | 5.500 | | | | 07/15/25 | | | | 6,647,375 | |
| | | | | | | | | | | | | | |
| | | | | | | | | | | | | 67,676,625 | |
| | |
| | Technology – Hardware – 1.3% | |
| Alcatel-Lucent USA, Inc. (B+/WR) | |
| | 7,000,000 | | | | 6.450 | | | | 03/15/29 | | | | 7,105,000 | |
| Ancestry.com, Inc. (CCC+/B3) | |
| | 5,249,000 | | | | 11.000 | | | | 12/15/20 | | | | 5,747,655 | |
| CDW LLC/CDW Finance Corp. (B+/B1) | |
| | 3,100,000 | | | | 5.500 | | | | 12/01/24 | | | | 3,123,250 | |
| CommScope, Inc. (B/B2)(a) | |
| | 10,000,000 | | | | 5.000 | | | | 06/15/21 | | | | 9,775,000 | |
| Micron Technology, Inc. (BB/Ba3) | |
| | 16,350,000 | | | | 5.250 | (a) | | | 08/01/23 | | | | 15,164,625 | |
| | 1,000,000 | | | | 5.500 | | | | 02/01/25 | | | | 935,000 | |
| NCR Corp. (BB/Ba3) | |
| | 5,000,000 | | | | 4.625 | | | | 02/15/21 | | | | 4,825,000 | |
| | 7,011,000 | | | | 5.000 | | | | 07/15/22 | | | | 6,607,868 | |
| VeriSign, Inc. (BB+/Ba1) | |
| | 6,150,000 | | | | 5.250 | | | | 04/01/25 | | | | 6,103,875 | |
| | | | | | | | | | | | | | |
| | | | | | | | | | | | | 59,387,273 | |
| | |
| | Technology – Software/Services – 3.9% | |
| Aspect Software, Inc. (CCC/Caa2) | |
| | 6,000,000 | | | | 10.625 | | | | 05/15/17 | | | | 5,160,000 | |
| BMC Software Finance, Inc. (CCC+/Caa1)(a) | |
| | 22,000,000 | | | | 8.125 | | | | 07/15/21 | | | | 17,710,000 | |
| Boxer Parent Co., Inc. (CCC+/Caa2)(a)(c)(e) | |
| | 10,000,000 | | | | 9.000 | | | | 10/15/19 | | | | 7,175,000 | |
| CyrusOne LP/CyrusOne Finance Corp. (B+/B1) | |
| | 12,000,000 | | | | 6.375 | | | | 11/15/22 | | | | 12,180,000 | |
| Equinix, Inc. (BB/B1) | |
| | 5,750,000 | | | | 4.875 | | | | 04/01/20 | | | | 5,836,250 | |
| | 9,250,000 | | | | 5.375 | | | | 01/01/22 | | | | 9,226,875 | |
| | 14,050,000 | | | | 5.375 | | | | 04/01/23 | | | | 13,839,250 | |
| | 14,000,000 | | | | 5.750 | | | | 01/01/25 | | | | 13,930,000 | |
| First Data Corp. (B-/Caa1)(a) | |
| | 17,450,000 | | | | 8.750 | | | | 01/15/22 | | | | 18,235,250 | |
| | |
Principal
Amount | | | Interest
Rate | | | Maturity
Date | | | Value | |
| | Corporate Obligations – (continued) | |
| | Technology – Software/Services – (continued) | |
| First Data Corp. (BB-/B1)(a) | |
| $ | 21,000,000 | | | | 6.750 | % | | | 11/01/20 | | | $ | 21,945,000 | |
| IHS, Inc. (BB+/Ba1) | |
| | 15,000,000 | | | | 5.000 | | | | 11/01/22 | | | | 14,437,500 | |
| Infor (US), Inc. (B-/Caa1)(a) | |
| | 9,150,000 | | | | 6.500 | | | | 05/15/22 | | | | 8,372,250 | |
| Infor Software Parent LLC/Infor Software Parent, Inc. (CCC+/
Caa2)(a)(c) |
|
| | 10,000,000 | | | | 7.125 | | | | 05/01/21 | | | | 8,600,000 | |
| Nuance Communications, Inc. (BB-/B1)(a) | |
| | 10,000,000 | | | | 5.375 | | | | 08/15/20 | | | | 10,000,000 | |
| SS&C Technologies Holdings, Inc. (B+/B3)(a) | |
| | 6,450,000 | | | | 5.875 | | | | 07/15/23 | | | | 6,514,500 | |
| | | | | | | | | | | | | | |
| | | | | | | | | | | | | 173,161,875 | |
| | |
| | Telecommunications – 2.6% | |
| Frontier Communications Corp. (BB-/Ba3) | |
| | 10,000,000 | | | | 8.125 | | | | 10/01/18 | | | | 10,250,000 | |
| | 18,000,000 | | | | 8.500 | | | | 04/15/20 | | | | 17,505,000 | |
| | 4,000,000 | | | | 8.875 | (a) | | | 09/15/20 | | | | 3,930,000 | |
| | 16,000,000 | | | | 11.000 | (a) | | | 09/15/25 | | | | 15,440,000 | |
| Level 3 Financing, Inc. (B/B1) | |
| | 10,000,000 | | | | 7.000 | | | | 06/01/20 | | | | 10,400,000 | |
| | 5,000,000 | | | | 6.125 | | | | 01/15/21 | | | | 5,137,500 | |
| | 5,000,000 | | | | 5.125 | (a) | | | 05/01/23 | | | | 4,775,000 | |
| | 6,500,000 | | | | 5.375 | (a) | | | 05/01/25 | | | | 6,175,000 | |
| Telecom Italia Capital SA (BB+/Ba1) | |
| | 7,100,000 | | | | 7.721 | | | | 06/04/38 | | | | 7,703,500 | |
| Telecom Italia SpA (BB+/Ba1)(a) | |
| | 20,000,000 | | | | 5.303 | | | | 05/30/24 | | | | 19,400,000 | |
| Windstream Corp. (BB-/B2) | |
| | 6,325,000 | | | | 7.875 | | | | 11/01/17 | | | | 6,546,375 | |
| | 5,050,000 | | | | 7.750 | (e) | | | 10/15/20 | | | | 4,292,500 | |
| | 6,000,000 | | | | 7.750 | | | | 10/01/21 | | | | 4,650,000 | |
| | | | | | | | | | | | | | |
| | | | | | | | | | | | | 116,204,875 | |
| | |
| | Telecommunications – Cellular – 7.0% | |
| Altice Financing SA (BB-/B1)(a) | |
| | 6,450,000 | | | | 6.500 | | | | 01/15/22 | | | | 6,256,500 | |
| Altice Financing SA (BB-/B1)(a) | |
| | 4,300,000 | | | | 6.625 | | | | 02/15/23 | | | | 4,138,750 | |
| Altice Finco SA (B-/B3)(a) | |
| | 7,000,000 | | | | 8.125 | | | | 01/15/24 | | | | 6,685,000 | |
| | 4,652,000 | | | | 7.625 | | | | 02/15/25 | | | | 4,337,990 | |
| Communications Sales & Leasing, Inc. (B/Caa1) | |
| | 11,000,000 | | | | 8.250 | | | | 10/15/23 | | | | 9,405,000 | |
| Crown Castle International Corp. (BB+/Ba3) | |
| | 20,157,000 | | | | 5.250 | | | | 01/15/23 | | | | 21,316,027 | |
| SBA Communications Corp. (B/B3) | |
| | 7,450,000 | | | | 4.875 | | | | 07/15/22 | | | | 7,301,000 | |
| SBA Telecommunications, Inc. (B+/B3) | |
| | 5,250,000 | | | | 5.750 | | | | 07/15/20 | | | | 5,407,500 | |
| SoftBank Group Corp. (BB+/Ba1)(a) | |
| | 30,950,000 | | | | 4.500 | | | | 04/15/20 | | | | 30,021,500 | |
| Sprint Capital Corp. (B+/Caa1) | |
| | 14,000,000 | | | | 6.900 | | | | 05/01/19 | | | | 12,320,000 | |
| | 3,000,000 | | | | 8.750 | | | | 03/15/32 | | | | 2,332,500 | |
| | |
| | |
| The accompanying notes are an integral part of these financial statements. | | 77 |
GOLDMAN SACHS HIGH YIELD FUND
Schedule of Investments (continued)
September 30, 2015 (Unaudited)
| | | | | | | | | | | | | | |
Principal
Amount | | | Interest
Rate | | | Maturity
Date | | | Value | |
| | Corporate Obligations – (continued) | |
| | Telecommunications – Cellular – (continued) | |
| Sprint Communications, Inc. (B+/Caa1) | |
| $ | 24,600,000 | | | | 8.375 | % | | | 08/15/17 | | | $ | 24,415,500 | |
| Sprint Communications, Inc. (B+/Caa1) | |
| | 7,000,000 | | | | 7.000 | | | | 08/15/20 | | | | 5,862,500 | |
| Sprint Communications, Inc. (B+/Caa1) | |
| | 10,000,000 | | | | 11.500 | | | | 11/15/21 | | | | 10,000,000 | |
| Sprint Communications, Inc. (BB/B1)(a) | |
| | 15,450,000 | | | | 9.000 | | | | 11/15/18 | | | | 16,222,500 | |
| Sprint Communications, Inc. (BB/B1)(a) | |
| | 10,000,000 | | | | 7.000 | | | | 03/01/20 | | | | 10,000,000 | |
| Sprint Corp. (B+/Caa1) | |
| | 19,000,000 | | | | 7.250 | | | | 09/15/21 | | | | 15,532,500 | |
| Sprint Corp. (B+/Caa1) | |
| | 53,400,000 | | | | 7.875 | | | | 09/15/23 | | | | 42,720,000 | |
| T-Mobile USA, Inc. (BB/Ba3) | |
| | 9,050,000 | | | | 6.542 | | | | 04/28/20 | | | | 9,185,750 | |
| | 20,000,000 | | | | 6.250 | | | | 04/01/21 | | | | 19,800,000 | |
| | 2,600,000 | | | | 6.633 | | | | 04/28/21 | | | | 2,593,500 | |
| | 5,000,000 | | | | 6.125 | | | | 01/15/22 | | | | 4,862,500 | |
| | 9,000,000 | | | | 6.731 | | | | 04/28/22 | | | | 8,955,000 | |
| Wind Acquisition Finance SA (B/Caa1)(a) | |
| | 15,000,000 | | | | 7.375 | | | | 04/23/21 | | | | 14,512,500 | |
| Wind Acquisition Finance SA (BB/Ba3)(a) | |
| | 15,000,000 | | | | 4.750 | | | | 07/15/20 | | | | 14,737,500 | |
| | | | | | | | | | | | | | |
| | | | | | | | | | | | | 308,921,517 | |
| | |
| | Telecommunications – Satellites – 1.7% | |
| Inmarsat Finance PLC (BB+/Ba2)(a) | |
| | 15,000,000 | | | | 4.875 | | | | 05/15/22 | | | | 14,531,250 | |
| Intelsat Jackson Holdings SA (B+/B3) | |
| | 10,100,000 | | | | 7.500 | | | | 04/01/21 | | | | 9,317,250 | |
| | 5,000,000 | | | | 5.500 | | | | 08/01/23 | | | | 4,125,000 | |
| Intelsat Jackson Holdings SA (CCC+/Caa1) | |
| | 20,000,000 | | | | 6.625 | (e) | | | 12/15/22 | | | | 15,600,000 | |
| Intelsat Luxembourg SA (CCC+/Caa2) | |
| | 38,000,000 | | | | 7.750 | | | | 06/01/21 | | | | 24,700,000 | |
| | 13,000,000 | | | | 8.125 | (e) | | | 06/01/23 | | | | 8,352,500 | |
| | | | | | | | | | | | | | |
| | | | | | | | | | | | | 76,626,000 | |
| | |
| | Utilities – Electric – 2.0% | |
| Calpine Corp. (B/B3) | |
| | 10,000,000 | | | | 5.375 | | | | 01/15/23 | | | | 9,225,000 | |
| | 10,000,000 | | | | 5.500 | | | | 02/01/24 | | | | 9,275,000 | |
| Calpine Corp. (BB/Ba3)(a) | |
| | 5,600,000 | | | | 6.000 | | | | 01/15/22 | | | | 5,838,000 | |
| | 7,000,000 | | | | 7.875 | | | | 01/15/23 | | | | 7,437,500 | |
| | 1,450,000 | | | | 5.875 | | | | 01/15/24 | | | | 1,502,563 | |
| Dynegy, Inc. (B+/B3) | |
| | 7,525,000 | | | | 6.750 | | | | 11/01/19 | | | | 7,543,812 | |
| | 5,000,000 | | | | 7.375 | | | | 11/01/22 | | | | 5,043,750 | |
| Illinois Power Generating Co. (CCC+/B3)(e) | |
| | 4,900,000 | | | | 7.000 | | | | 04/15/18 | | | | 4,434,500 | |
| | 11,000,000 | | | | 6.300 | | | | 04/01/20 | | | | 9,075,000 | |
| MPM Escrow LLC (NR/NR)(b) | |
| | 14,460,000 | | | | 8.875 | | | | 10/15/20 | | | | — | |
| | |
Principal
Amount | | | Interest
Rate | | | Maturity
Date | | | Value | |
| | Corporate Obligations – (continued) | |
| | Utilities – Electric – (continued) | |
| NRG Energy, Inc. (BB-/B1) | |
| $ | 6,250,000 | | | | 8.250 | % | | | 09/01/20 | | | $ | 6,453,125 | |
| | 19,000,000 | | | | 6.625 | | | | 03/15/23 | | | | 17,195,000 | |
| Talen Energy Supply LLC (BB-/Ba3)(a) | |
| | 7,650,000 | | | | 6.500 | | | | 06/01/25 | | | | 6,579,000 | |
| | | | | | | | | | | | | | |
| | | | | | | | | | | | | 89,602,250 | |
| | |
| | Utilities – Pipelines – 1.2% | |
| NGPL PipeCo LLC (CCC-/Caa2)(a) | |
| | 10,000,000 | | | | 7.119 | | | | 12/15/17 | | | | 9,500,000 | |
| | 2,150,000 | | | | 9.625 | (e) | | | 06/01/19 | | | | 2,064,000 | |
| Sabine Pass Liquefaction LLC (BB+/Ba3) | |
| | 11,000,000 | | | | 6.250 | | | | 03/15/22 | | | | 10,202,500 | |
| | 5,000,000 | | | | 5.625 | | | | 04/15/23 | | | | 4,462,500 | |
| | 20,000,000 | | | | 5.750 | | | | 05/15/24 | | | | 17,900,000 | |
| | 5,450,000 | | | | 5.625 | (a) | | | 03/01/25 | | | | 4,782,375 | |
| Tesoro Logistics LP/Tesoro Logistics Finance Corp. (BB/Ba3)(a) | |
| | 3,375,000 | | | | 6.250 | | | | 10/15/22 | | | | 3,299,063 | |
| | | | | | | | | | | | | | |
| | | | | | | | | | | | | 52,210,438 | |
| | |
| | TOTAL CORPORATE OBLIGATIONS | |
| | (Cost $4,417,463,828) | | | $ | 4,098,942,167 | |
| | |
| | | | | | | | | | | | | | |
| | Senior Term Loans(f) – 5.5% | |
| | Consumer Products – Industrial – 0.6% | |
| Atkore International, Inc. (B/B3) | |
| $ | 10,956,757 | | | | 4.500 | % | | | 04/09/21 | | | $ | 10,436,311 | |
| Atkore International, Inc. (CCC+/Caa2) | |
| | 8,275,000 | | | | 7.750 | | | | 10/09/21 | | | | 7,602,656 | |
| Dynacast International LLC (B/Ba3) | |
| | 5,024,750 | | | | 4.500 | | | | 01/28/22 | | | | 4,993,345 | |
| Dynacast International LLC (B-/Caa1) | |
| | 4,625,000 | | | | 9.500 | | | | 01/30/23 | | | | 4,604,789 | |
| | | | | | | | | | | | | | |
| | | | | | | | | | | | | 27,637,101 | |
| | |
| | Energy – 0.1% | |
| American Energy – Marcellus LLC (CCC+/Caa1) | |
| | 9,950,000 | | | | 5.250 | | | | 08/04/20 | | | | 5,596,875 | |
| American Energy – Marcellus LLC (CCC-/Caa3) | |
| | 3,275,000 | | | | 8.500 | | | | 08/04/21 | | | | 349,344 | |
| | | | | | | | | | | | | | |
| | | | | | | | | | | | | 5,946,219 | |
| | |
| | Energy – Exploration & Production – 0.4% | |
| Magnum Hunter Resources Corp. (CCC/B2) | |
| | 8,489,250 | | | | 8.500 | | | | 10/22/19 | | | | 8,361,911 | |
| Murray Energy Corp. (NR/NR) | |
| | 9,090,875 | | | | 7.500 | | | | 04/16/20 | | | | 7,042,883 | |
| | | | | | | | | | | | | | |
| | | | | | | | | | | | | 15,404,794 | |
| | |
| | Food & Beverages – 0.7% | |
| Performance Food Group, Inc. (BB-/B3) | |
| | 19,947,352 | | | | 6.753 | | | | 11/14/19 | | | | 19,938,974 | |
| Shearer’s Foods, Inc. (CCC+/Caa1) | |
| | 13,000,000 | | | | 7.750 | | | | 06/30/22 | | | | 12,707,500 | |
| | | | | | | | | | | | | | |
| | | | | | | | | | | | | 32,646,474 | |
| | |
| | |
| 78 | | The accompanying notes are an integral part of these financial statements. |
GOLDMAN SACHS HIGH YIELD FUND
| | | | | | | | | | | | | | |
Principal
Amount | | | Interest
Rate | | | Maturity
Date | | | Value | |
| | Senior Term Loans(f) – (continued) | |
| | Health Care – Pharmaceuticals – 0.5% | |
| Endo Luxembourg Finance Co. I S.A.R.L. (NR/NR) | |
| $ | 8,350,000 | | | | 3.750 | % | | | 09/26/22 | | | $ | 8,316,099 | |
| Valeant Pharmaceuticals International, Inc. (BB+/Ba1) | |
| | 12,014,625 | | | | 4.000 | | | | 04/01/22 | | | | 11,878,018 | |
| | | | | | | | | | | | | | |
| | | | | | | | | | | | | 20,194,117 | |
| | |
| | Health Care – Services – 0.5% | |
| American Renal Holdings, Inc. (CCC+/Caa1) | |
| | 19,995,926 | | | | 8.500 | | | | 03/20/20 | | | | 19,920,941 | |
| | |
| | Home Construction – 0.2% | |
| BRG Bell Sports, Inc. (CCC/Caa1) | |
| | 7,600,000 | | | | 10.250 | | | | 04/14/22 | | | | 7,448,000 | |
| | |
| | Media – Non Cable – 0.7% | |
| Getty Images, Inc. (CCC+/B2) | |
| | 19,526,944 | | | | 4.750 | | | | 10/18/19 | | | | 12,623,388 | |
| Renaissance Learning, Inc. (B-/B1) | |
| | 7,095,497 | | | | 4.500 | | | | 04/09/21 | | | | 6,864,893 | |
| Renaissance Learning, Inc. (CCC/Caa2) | |
| | 12,047,700 | | | | 8.000 | | | | 04/11/22 | | | | 11,666,150 | |
| | | | | | | | | | | | | | |
| | | | | | | | | | | | | 31,154,431 | |
| | |
| | Retailers – 1.5% | |
| Academy Ltd. (B/B2) | |
| | 12,797,227 | | | | 5.000 | | | | 07/01/22 | | | | 12,718,908 | |
| Bass Pro Group LLC (BB-/B1) | |
| | 7,283,400 | | | | 4.000 | | | | 06/05/20 | | | | 7,237,879 | |
| Dollar Tree, Inc. (BB+/Ba1) | |
| | 4,803,797 | | | | 3.500 | | | | 07/06/22 | | | | 4,803,125 | |
| J Crew Group, Inc. (B-/B2) | |
| | 17,919,395 | | | | 4.000 | | | | 03/05/21 | | | | 13,833,056 | |
| PetSmart, Inc. (BB-/Ba3) | |
| | 4,962,563 | | | | 4.250 | | | | 03/11/22 | | | | 4,949,660 | |
| Rue21, Inc. (B-/B2) | |
| | 19,112,285 | | | | 5.625 | | | | 10/09/20 | | | | 16,349,031 | |
| True Religion Apparel, Inc. (B-/Caa1) | |
| | 8,250,750 | | | | 5.875 | | | | 07/30/19 | | | | 4,936,671 | |
| True Religion Apparel, Inc. (CCC/Caa3) | |
| | 6,825,000 | | | | 11.000 | | | | 01/30/20 | | | | 2,900,625 | |
| | | | | | | | | | | | | | |
| | | | | | | | | | | | | 67,728,955 | |
| | |
| | Services Cyclical – Rental Equipment – 0.2% | |
| Maxim Crane Works LP (B/Caa2) | |
| | 6,975,000 | | | | 10.250 | | | | 11/26/18 | | | | 6,905,250 | |
| | |
| | Technology – Software/Services – 0.1% | |
| SS&C Technologies, Inc. (BB/Ba3) | |
| | 6,434,978 | | | | 4.000 | | | | 07/08/22 | | | | 6,439,032 | |
| | |
| | TOTAL SENIOR TERM LOANS | |
| | (Cost $265,156,811) | | | $ | 241,425,314 | |
| | |
| | | | | | | | |
Shares | | | Rate | | Value | |
| | Preferred Stock(c)(g) – 0.1% | |
| | Media – Broadcasting & Radio – 0.1% | |
| Spanish Broadcasting System, Inc. | |
| | 3,014 | | | 10.750% | | $ | 3,526,380 | |
| | (Cost $3,042,344) | | | | |
| | |
| | |
| Shares | | | Description | | Value | |
| | Common Stocks – 0.1% | |
| | 40 | | | Dawn Holdings, Inc.(b) | | $ | — | |
| | 64,385 | | | General Motors Co. | | | 1,932,838 | |
| | 2,142,857 | | | Halcon Resources Corp.(b) | | | 1,135,714 | |
| | 341,350 | | | Huntsman Corp. | | | 3,307,681 | |
| | 28,148 | | | Motors Liquidation Co. | | | 427,568 | |
| | 21 | | | New Cotai Class B Shares(b) | | | — | |
| | 11 | | | Nycomed(b) | | | — | |
| | 3,874 | | | Panolam Holdings Co.(b) | | | 39 | |
| | 2,500 | | | Port Townsend Holdings Co., Inc.(b) | | | — | |
| | |
| | TOTAL COMMON STOCKS | |
| | (Cost $22,717,880) | | $ | 6,803,840 | |
| | |
| | | | | | | | | | | | |
| Units | | | Description | | Expiration
Date | | | Value | |
| | Warrant(b) – 0.0% | |
| General Motors Co. (NR/NR) | |
| | 54,264 | | | | | | 07/10/16 | | | $ | 1,105,900 | |
| General Motors Co. (NR/NR) | |
| | 54,264 | | | | | | 07/10/19 | | | | 717,370 | |
| Lender Process Services, Inc. (NR/NR) | |
| | 14,274 | | | | | | 12/31/20 | | | | — | |
| Masonite International Corp. (NR/NR) | |
| | 22,734 | | | | | | 06/09/16 | | | | 346,239 | |
| | |
| | TOTAL WARRANT | |
| | (Cost $23,842,381) | | | $ | 2,169,509 | |
| | |
| | | | | | | | |
| Shares | | | Rate | | Value | |
| | Investment Company(h) – 2.6% | |
| Goldman Sachs Financial Square Government Fund – FST Shares | |
| | 114,348,213 | | | 0.006% | | $ | 114,348,213 | |
| | (Cost $114,348,213) | | | | |
| | |
| | | | | | | | | | | | | | |
| | TOTAL INVESTMENTS – 101.0% | | | | | |
| | (Cost $4,846,571,457) | | | $ | 4,467,215,423 | |
| | |
| | | | | | | | | | | | | | |
Principal
Amount | | | Interest Rate
(Paid) Received | | | Maturity
Date | | | Value | |
| | Reverse Repurchase Agreements – (2.7)% | |
| Barclays Reverse Repurchase Agreement (NR/NR) | |
| $ | (824,000 | ) | | | 0.350 | % | | | 10/05/15 | | | $ | (824,000 | ) |
| | (3,855,000 | ) | | | 0.750 | | | | 10/06/15 | | | | (3,855,000 | ) |
| | |
| | |
| The accompanying notes are an integral part of these financial statements. | | 79 |
GOLDMAN SACHS HIGH YIELD FUND
Schedule of Investments (continued)
September 30, 2015 (Unaudited)
| | | | | | | | | | | | | | |
Principal
Amount | | | Interest Rate
(Paid) Received | | | Maturity
Date | | | Value | |
| | Reverse Repurchase Agreements – (continued) | |
| Barclays Reverse Repurchase Agreement (NR/NR) – (continued) | |
| $ | (9,262,500 | ) | | | 0.750 | % | | | 07/21/16 | | | $ | (9,262,500 | ) |
| | (1,013,750 | ) | | | 2.000 | | | | 07/21/16 | | | | (1,013,750 | ) |
| | (4,281,250 | ) | | | 0.100 | | | | 07/28/16 | | | | (4,281,250 | ) |
| | (2,438,437 | ) | | | 0.500 | | | | 08/02/16 | | | | (2,438,437 | ) |
| | (1,167,250 | ) | | | 2.000 | | | | 08/02/16 | | | | (1,167,250 | ) |
| | (4,500,000 | ) | | | 0.100 | | | | 08/05/16 | | | | (4,500,000 | ) |
| | (3,400,000 | ) | | | 0.250 | | | | 08/13/16 | | | | (3,400,000 | ) |
| | (7,550,000 | ) | | | 0.150 | | | | 08/20/16 | | | | (7,550,000 | ) |
| | (824,000 | ) | | | 0.350 | | | | 09/03/16 | | | | (824,000 | ) |
| | (456,250 | ) | | | 0.650 | | | | 09/07/16 | | | | (456,250 | ) |
| | (1,677,500 | ) | | | 1.750 | | | | 09/17/16 | | | | (1,677,500 | ) |
| | (2,146,875 | ) | | | 0.375 | | | | 09/23/16 | | | | (2,146,875 | ) |
| | (915,000 | ) | | | 0.500 | | | | 09/23/16 | | | | (915,000 | ) |
| | (5,782,500 | ) | | | 0.750 | | | | 09/23/16 | | | | (5,782,500 | ) |
| | (3,787,500 | ) | | | 0.250 | | | | 09/24/16 | | | | (3,787,500 | ) |
| | (1,911,250 | ) | | | 0.750 | | | | 09/24/16 | | | | (1,911,250 | ) |
| | (3,900,000 | ) | | | 0.500 | | | | 09/27/16 | | | | (3,900,000 | ) |
| | (3,790,000 | ) | | | 0.750 | | | | 09/27/16 | | | | (3,790,000 | ) |
| | (1,314,375 | ) | | | 0.500 | | | | 09/28/16 | | | | (1,314,375 | ) |
| BNP Paribas Reverse Repurchase Agreement (NR/NR) | |
| | (1,495,000 | ) | | | 1.500 | | | | 10/01/15 | | | | (1,495,000 | ) |
| | (3,628,125 | ) | | | 1.000 | | | | 07/28/16 | | | | (3,628,125 | ) |
| Citigroup Reverse Repurchase Agreement (NR/NR) | |
| | (3,670,000 | ) | | | 0.750 | | | | 07/23/16 | | | | (3,670,000 | ) |
| | (6,995,313 | ) | | | 0.750 | | | | 08/02/16 | | | | (6,995,313 | ) |
| | (1,702,250 | ) | | | 0.500 | | | | 08/25/16 | | | | (1,702,250 | ) |
| | (722,500 | ) | | | 0.875 | | | | 08/25/16 | | | | (722,500 | ) |
| First Boston Reverse Repurchase Agreement (NR/NR) | |
| | (2,527,500 | ) | | | 0.500 | | | | 08/11/16 | | | | (2,527,500 | ) |
| | (3,004,563 | ) | | | 1.750 | | | | 09/17/16 | | | | (3,004,563 | ) |
| Royal Bank Of Canada Reverse Repurchase Agreement (NR/NR) | |
| | (5,616,000 | ) | | | 1.000 | | | | 05/05/16 | | | | (5,616,000 | ) |
| | (10,950,000 | ) | | | 0.150 | % | | | 05/06/16 | | | | (10,950,000 | ) |
| | (2,600,000 | ) | | | 2.500 | | | | 06/30/16 | | | | (2,600,000 | ) |
| | (4,637,500 | ) | | | 1.000 | | | | 07/21/16 | | | | (4,637,500 | ) |
| | (4,250,000 | ) | | | 1.250 | | | | 08/20/16 | | | | (4,250,000 | ) |
| | (1,464,750 | ) | | | 1.000 | | | | 08/23/16 | | | | (1,464,750 | ) |
| | (1,015,000 | ) | | | 0.350 | | | | 08/26/16 | | | | (1,015,000 | ) |
| | |
| | TOTAL REVERSE REPURCHASE AGREEMENTS | |
| | (Cost $(119,075,938)) | | | $ | (119,075,938 | ) |
| | |
| OTHER ASSETS IN EXCESS OF
LIABILITIES – 1.7% |
| | | 75,437,220 | |
| | |
| | NET ASSETS – 100.0% | | | $ | 4,423,576,705 | |
| | |
| | |
| The percentage shown for each investment category reflects the value of investments in that category as a percentage of net assets. |
(a) | | Exempt from registration under Rule 144A of the Securities Act of 1933. Under procedures approved by the Board of Trustees, such securities have been determined to be liquid by the investment adviser and may be resold, normally to qualified institutional buyers in transactions exempt from registration. Total market value of Rule 144A securities amounts to $1,840,565,602, which represents approximately 41.6% of net assets as of September 30, 2015. |
(b) | | Security is currently in default and/or non-income producing. |
(c) | | Pay-in-kind securities. |
(d) | | Variable rate security. Interest rate or distribution rate disclosed is that which is in effect on September 30, 2015. |
(e) | | All or a portion of the security was pledged as collateral against open reverse repurchase agreements. As of September 30, 2015, the value of securities pledged amounted to $101,091,934. |
(f) | | Senior Term Loans often require prepayments from excess cash flows or permit the borrower to repay at its election. The degree to which borrowers repay, whether as a contractual requirement or at their election, cannot be predicted with accuracy. As a result, the actual remaining maturity may be substantially less than the stated maturities shown. The stated interest rate represents the weighted average interest rate of all contracts within the senior loan facility on September 30, 2015. Senior Term Loans typically have rates of interest which are predetermined either daily, monthly, quarterly or semi-annually by reference to a base lending rate, plus a premium. These base lending rates are primarily the London-Interbank Offered Rate (“LIBOR”), and secondarily the prime rate offered by one or more major United States banks (the “Prime Rate”) and the certificate of deposit (“CD”) rate or other base lending rates used by commercial lenders. |
(g) | | Security with “Put” features and resetting interest rates. Maturity dates disclosed are the puttable dates. Interest rate disclosed is that which is in effect at September 30, 2015. |
(h) | | Represents an Affiliated Fund. |
Security ratings disclosed, if any, are obtained from Standard & Poor’s/Moody’s Investors Service and are unaudited. A description of the ratings is available in the Fund’s Statement of Additional Information.
| | |
| 80 | | The accompanying notes are an integral part of these financial statements. |
GOLDMAN SACHS HIGH YIELD FUND
| | |
|
Currency Abbreviations: |
AUD | | —Australian Dollar |
CAD | | —Canadian Dollar |
CHF | | —Swiss Franc |
EUR | | —Euro |
GBP | | —British Pound |
USD | | —U.S. Dollar |
| | |
Investment Abbreviations: |
LLC | | —Limited Liability Company |
LP | | —Limited Partnership |
WR | | —Withdrawn Rating |
|
|
| ADDITIONAL INVESTMENT INFORMATION |
FORWARD FOREIGN CURRENCY EXCHANGE CONTRACTS — At September 30, 2015, the Fund had the following forward foreign currency exchange contracts:
FORWARD FOREIGN CURRENCY EXCHANGE CONTRACTS WITH UNREALIZED GAIN
| | | | | | | | | | | | | | | | | | | | | | | | | | |
| Counterparty | | Currency Purchased | | | Currency Sold | | | Current
Value | | | Settlement
Date | | | Unrealized
Gain | |
Citibank NA | | USD | | | 4,723,655 | | | | EUR | | | | 4,192,000 | | | $ | 4,684,468 | | | | 10/05/15 | | | $ | 39,186 | |
Credit Suisse International (London) | | USD | | | 10,015,202 | | | | CHF | | | | 9,637,809 | | | | 9,890,512 | | | | 10/05/15 | | | | 124,690 | |
JPMorgan Securities, Inc. | | USD | | | 6,363,874 | | | | CAD | | | | 8,391,920 | | | | 6,288,236 | | | | 10/05/15 | | | | 75,639 | |
| TOTAL | | | | | | | | | | | | | | | | | | | | | | | | $ | 239,515 | |
FORWARD FOREIGN CURRENCY EXCHANGE CONTRACTS WITH UNREALIZED LOSS
| | | | | | | | | | | | | | | | | | | | | | | | |
| Counterparty | | Currency Purchased | | | Currency Sold | | Current
Value | | Settlement
Date | | | Unrealized
Loss | |
UBS AG (London) | | | EUR | | | | 2,309,111 | | | | USD | | | 2,616,225 | | $2,580,381 | | | 10/05/15 | | | $ | (35,844 | ) |
FUTURES CONTRACTS — At September 30, 2015, the Fund had the following futures contracts:
| | | | | | | | | | | | | | |
| Type | | Number of
Contracts
Long (Short) | | | Expiration Date | | Current Value | | | Unrealized
Gain (Loss) | |
Russell 2000 Mini Index | | | 30 | | | December 2015 | | $ | 3,287,700 | | | $ | (196,723 | ) |
Ultra Long U.S. Treasury Bonds | | | 251 | | | December 2015 | | | 40,261,969 | | | | 222,750 | |
10 Year German Euro-Bund | | | (29 | ) | | December 2015 | | | (5,061,273 | ) | | | (92,721 | ) |
10 Year U.K. Long Gilt | | | (36 | ) | | December 2015 | | | (6,483,886 | ) | | | (54,524 | ) |
2 Year U.S. Treasury Notes | | | 477 | | | December 2015 | | | 104,477,906 | | | | 140,569 | |
5 Year U.S. Treasury Notes | | | 1,267 | | | December 2015 | | | 152,693,297 | | | | 999,910 | |
10 Year U.S. Treasury Notes | | | (1,999 | ) | | December 2015 | | | (257,340,016 | ) | | | (3,067,795 | ) |
Ultra Long U.S. Treasury Bonds | | | 122 | | | December 2015 | | | 19,195,938 | | | | 89,757 | |
| TOTAL | | | | | | | | | | | | $ | (1,958,777 | ) |
| | |
| The accompanying notes are an integral part of these financial statements. | | 81 |
GOLDMAN SACHS HIGH YIELD FLOATING RATE FUND
Schedule of Investments
September 30, 2015 (Unaudited)
| | | | | | | | | | | | | | |
Principal
Amount | | | Interest
Rate | | | Maturity
Date | | | Value | |
| | Senior Term Loans(a) – 83.1% | |
| | Aerospace – 1.6% | |
| BE Aerospace, Inc. (BB+/Ba2) | |
| $ | 5,443,636 | | | | 4.000 | % | | | 12/16/21 | | | $ | 5,441,949 | |
| LM U.S. Corp. Acquisition, Inc. (CCC/Caa2) | |
| | 6,472,375 | | | | 8.250 | | | | 01/25/21 | | | | 6,423,832 | |
| Silver II US Holdings LLC (B/B1) | |
| | 8,574,086 | | | | 4.000 | | | | 12/13/19 | | | | 7,795,301 | |
| Transdigm, Inc. (B/Ba3) | |
| | 21,628,137 | | | | 3.750 | | | | 02/28/20 | | | | 21,334,643 | |
| | 8,067,576 | | | | 3.750 | | | | 06/04/21 | | | | 7,959,551 | |
| | 12,978,266 | | | | 3.500 | | | | 05/14/22 | | | | 12,764,644 | |
| | | | | | | | | | | | | | |
| | | | | | | | | | | | | 61,719,920 | |
| | |
| | Airlines – 2.1% | |
| Air Canada (BB/Ba3) | |
| | 3,275,803 | | | | 4.000 | | | | 09/26/19 | | | | 3,267,614 | |
| Atlantic Aviation FBO, Inc. (BB-/Ba3) | |
| | 12,991,923 | | | | 3.250 | | | | 06/01/20 | | | | 12,882,271 | |
| Continental Airlines, Inc. (BB+/Ba1) | |
| | 27,556,338 | | | | 3.250 | | | | 04/01/19 | | | | 27,424,343 | |
| Delta Air Lines, Inc. (BBB/Baa3) | |
| | 32,085,077 | | | | 3.250 | | | | 10/18/18 | | | | 32,004,864 | |
| | 750,000 | | | | 3.250 | | | | 08/24/22 | | | | 749,812 | |
| Flying Fortress, Inc. (BBB-/Ba1) | |
| | 5,041,667 | | | | 3.500 | | | | 04/30/20 | | | | 5,033,802 | |
| | | | | | | | | | | | | | |
| | | | | | | | | | | | | 81,362,706 | |
| | |
| | Automotive – 1.3% | |
| Chrysler Group LLC (BB+/Ba1) | |
| | 43,096,077 | | | | 3.500 | | | | 05/24/17 | | | | 42,859,049 | |
| | 4,987,342 | | | | 3.250 | | | | 12/31/18 | | | | 4,937,468 | |
| | | | | | | | | | | | | | |
| | | | | | | | | | | | | 47,796,517 | |
| | |
| | Automotive – Parts – 1.0% | |
| Cooper Standard Holdings, Inc. (BB-/B1) | |
| | 8,516,439 | | | | 4.000 | | | | 04/04/21 | | | | 8,452,566 | |
| Gates Global LLC (B+/B2) | |
| | 22,077,947 | | | | 4.250 | | | | 07/05/21 | | | | 20,879,336 | |
| Jason, Inc. (B/B1) | |
| | 8,910,000 | | | | 5.500 | | | | 06/30/21 | | | | 8,876,587 | |
| | | | | | | | | | | | | | |
| | | | | | | | | | | | | 38,208,489 | |
| | |
| | Building Materials – 3.9% | |
| American Builders & Contractors Supply Co., Inc. (BB+/B1) | |
| | 33,074,186 | | | | 3.500 | | | | 04/16/20 | | | | 32,770,896 | |
| Armstrong World Industries, Inc. (BB/B1) | |
| | 1,885,170 | | | | 3.500 | | | | 03/15/20 | | | | 1,874,576 | |
| CPG International, Inc. (B/B2) | |
| | 3,916,907 | | | | 4.750 | | | | 09/30/20 | | | | 3,864,695 | |
| Gyp Holdings III Corp. (B/B3) | |
| | 21,330,000 | | | | 4.750 | | | | 04/01/21 | | | | 20,779,046 | |
| Headwaters, Inc. (BB-/B1) | |
| | 5,162,063 | | | | 4.500 | | | | 03/24/22 | | | | 5,168,515 | |
| Jeld-Wen, Inc. (B/B1) | |
| | 22,852,313 | | | | 5.250 | | | | 10/15/21 | | | | 22,776,214 | |
| | 10,625,000 | | | | 5.000 | | | | 06/18/22 | | | | 10,578,569 | |
| PLY Gem Industries, Inc. (B+/B1) | |
| | 7,133,825 | | | | 4.000 | | | | 02/01/21 | | | | 7,048,220 | |
| | |
Principal
Amount | | | Interest
Rate | | | Maturity
Date | | | Value | |
| | Senior Term Loans(a) – (continued) | |
| | Building Materials – (continued) | |
| Quikrete Cos., Inc. (B+/B1) | |
| $ | 17,624,711 | | | | 4.000 | % | | | 09/28/20 | | | $ | 17,499,928 | |
| Roofing Supply Group LLC (B/B3) | |
| | 7,058,639 | | | | 6.000 | | | | 05/31/19 | | | | 7,052,780 | |
| Ultima US Holdings LLC (B/B1) | |
| | 5,194,348 | | | | 5.500 | | | | 07/02/20 | | | | 5,207,334 | |
| US LBM Holdings LLC (B+/B3) | |
| | 13,500,000 | | | | 6.250 | | | | 08/20/22 | | | | 13,145,625 | |
| | | | | | | | | | | | | | |
| | | | | | | | | | | | | 147,766,398 | |
| | |
| | Capital Goods – Others – 0.2% | |
| USIC Holdings, Inc. (B+/B2) | |
| | 9,260,413 | | | | 4.000 | | | | 07/10/20 | | | | 9,156,233 | |
| | |
| | Chemicals – 2.3% | |
| American Pacific Corp. (NR/NR) | |
| | 10,449,512 | | | | 7.000 | | | | 02/27/19 | | | | 10,390,786 | |
| Axalta Coating Systems US Holdings, Inc./Axalta Coating
Systems Dutch Holding BV (BB-/Ba3)(b) |
|
| EUR | 850,000 | | | | 5.750 | | | | 02/01/21 | | | | 966,458 | |
| Emerald Performance Materials LLC (B/B1) | |
| $ | 7,449,750 | | | | 4.500 | | | | 08/01/21 | | | | 7,393,877 | |
| Emerald Performance Materials LLC (CCC+/Caa1) | |
| | 6,350,000 | | | | 7.750 | | | | 08/01/22 | | | | 6,275,895 | |
| Huntsman International LLC (BB+/Ba2) | |
| | 3,473,750 | | | | 3.750 | | | | 10/01/21 | | | | 3,352,169 | |
| MacDermid, Inc. (BB/B1) | |
| | 2,208,313 | | | | 4.750 | | | | 06/07/20 | | | | 2,144,824 | |
| PQ Corp. (B+/B2) | |
| | 7,956,427 | | | | 4.000 | | | | 08/07/17 | | | | 7,918,873 | |
| Univar, Inc. (BB-/B2) | |
| | 13,075,000 | | | | 4.250 | | | | 07/01/22 | | | | 12,811,408 | |
| US Coatings Acquisition, Inc. (BB-/Ba3) | |
| | 38,025,098 | | | | 3.750 | | | | 02/01/20 | | | | 37,651,692 | |
| | | | | | | | | | | | | | |
| | | | | | | | | | | | | 88,905,982 | |
| | |
| | Consumer Cyclical Services – Distribution Logistics – 0.2% | |
| Beacon Roofing Supply, Inc. (BB+/B2) | |
| | 5,850,000 | | | | 4.500 | | | | 10/01/22 | | | | 5,832,918 | |
| | |
| | Consumer Products – Household & Leisure – 3.2% | |
| Bombardier Recreational Products, Inc. (BB-/Ba3) | |
| | 19,379,491 | | | | 3.750 | | | | 01/30/19 | | | | 19,352,166 | |
| Jarden Corp. (BBB-/Ba1) | |
| | 1,122,137 | | | | 2.944 | | | | 09/30/20 | | | | 1,123,540 | |
| | 9,500,000 | | | | 2.944 | | | | 07/30/22 | | | | 9,484,135 | |
| Polymer Group, Inc. (B-/B2) | |
| | 16,901,425 | | | | 5.250 | | | | 12/19/19 | | | | 16,890,946 | |
| Renfro Corp. (B/B3) | |
| | 26,570,455 | | | | 5.750 | | | | 01/30/19 | | | | 25,906,193 | |
| Spectrum Brands, Inc. (BB/Ba2) | |
| EUR | 568,575 | | | | 3.500 | | | | 06/23/22 | | | | 633,604 | |
| $ | 15,933,484 | | | | 3.750 | | | | 06/23/22 | | | | 15,975,548 | |
| The Sun Products Corp. (B-/B1) | |
| | 36,114,270 | | | | 5.500 | | | | 03/23/20 | | | | 33,917,439 | |
| | | | | | | | | | | | | | |
| | | | | | | | | | | | | 123,283,571 | |
| | |
| | Consumer Products – Industrial – 0.9% | |
| Atkore International, Inc. (B/B3) | |
| | 13,466,394 | | | | 4.500 | | | | 04/09/21 | | | | 12,826,740 | |
| | |
| | |
| 82 | | The accompanying notes are an integral part of these financial statements. |
GOLDMAN SACHS HIGH YIELD FLOATING RATE FUND
| | | | | | | | | | | | | | |
Principal
Amount | | | Interest
Rate | | | Maturity
Date | | | Value | |
| | Senior Term Loans(a) – (continued) | |
| | Consumer Products – Industrial – (continued) | |
| Atkore International, Inc. (CCC+/Caa2) | |
| $ | 12,750,000 | | | | 7.750 | % | | | 10/09/21 | | | $ | 11,714,062 | |
| Southwire Co. (BB+/Ba3) | |
| | 8,926,333 | | | | 3.000 | | | | 02/10/21 | | | | 8,703,175 | |
| | | | | | | | | | | | | | |
| | | | | | | | | | | | | 33,243,977 | |
| | |
| | Diversified Manufacturing – 3.0% | |
| CPM Holdings, Inc. (B+/B1) | |
| | 7,883,526 | | | | 6.000 | | | | 04/11/22 | | | | 7,890,069 | |
| Crosby US Acquisition Corp. (B/B1) | |
| | 22,914,377 | | | | 3.750 | | | | 11/23/20 | | | | 19,820,936 | |
| Doosan Infracore Co., Ltd. (BB-/Ba3) | |
| | 9,242,356 | | | | 4.500 | | | | 05/28/21 | | | | 9,246,238 | |
| Dynacast International LLC (B/Ba3) | |
| | 2,832,321 | | | | 4.500 | | | | 01/28/22 | | | | 2,814,619 | |
| Gardner Denver, Inc. (B/B1) | |
| | 15,433,197 | | | | 4.250 | | | | 07/30/20 | | | | 14,515,848 | |
| Mannington Mills, Inc. (BB-/B1) | |
| | 6,509,250 | | | | 4.750 | | | | 10/01/21 | | | | 6,525,523 | |
| Mirror Bidco Corp. (B/Ba3) | |
| | 19,139,807 | | | | 4.250 | | | | 12/28/19 | | | | 19,068,033 | |
| Rexnord LLC (BB-/B2) | |
| | 35,008,082 | | | | 4.000 | | | | 08/21/20 | | | | 34,652,400 | |
| | | | | | | | | | | | | | |
| | | | | | | | | | | | | 114,533,666 | |
| | |
| | Energy – 2.0% | |
| American Energy – Marcellus LLC (CCC+/Caa1) | |
| | 13,550,000 | | | | 5.250 | | | | 08/04/20 | | | | 7,621,875 | |
| American Energy – Marcellus LLC (CCC-/Caa3) | |
| | 34,190,000 | | | | 8.500 | | | | 08/04/21 | | | | 3,647,047 | |
| CITGO Holding, Inc. (B-/Caa1) | |
| | 6,708,963 | | | | 9.500 | | | | 05/12/18 | | | | 6,595,783 | |
| Jonah Energy LLC (B/B3) | |
| | 9,250,000 | | | | 7.500 | | | | 05/12/21 | | | | 7,400,000 | |
| Magnum Hunter Resources Corp. (CCC/B2) | |
| | 16,283,013 | | | | 8.500 | | | | 10/22/19 | | | | 16,038,767 | |
| MEG Energy Corp. (BB+/Ba2) | |
| | 35,951,066 | | | | 3.750 | | | | 03/31/20 | | | | 33,524,369 | |
| | | | | | | | | | | | | | |
| | | | | | | | | | | | | 74,827,841 | |
| | |
| | Energy – Exploration & Production – 0.4% | |
| EP Energy LLC (B+/Ba2) | |
| | 11,900,000 | | | | 3.500 | | | | 05/24/18 | | | | 11,052,125 | |
| | 1,375,000 | | | | 4.500 | | | | 04/30/19 | | | | 1,313,125 | |
| NGPL PipeCo LLC (CCC-/Caa2) | |
| | 1,964,302 | | | | 6.750 | | | | 09/15/17 | | | | 1,760,015 | |
| | | | | | | | | | | | | | |
| | | | | | | | | | | | | 14,125,265 | |
| | |
| | Entertainment – 0.7% | |
| Sabre, Inc. (BB-/Ba3) | |
| | 488,222 | | | | 3.500 | | | | 02/19/18 | | | | 485,932 | |
| | 27,148,245 | | | | 4.000 | | | | 02/19/19 | | | | 27,058,713 | |
| | | | | | | | | | | | | | |
| | | | | | | | | | | | | 27,544,645 | |
| | |
| | Environmental – 0.5% | |
| EnergySolutions LLC (BB-/B3) | |
| | 18,365,897 | | | | 6.750 | | | | 05/29/20 | | | | 17,998,579 | |
| | |
Principal
Amount | | | Interest
Rate | | | Maturity
Date | | | Value | |
| | Senior Term Loans(a) – (continued) | |
| | Finance – 1.2% | |
| CeramTec Acquisition Corp. (B/Ba3) | |
| $ | 8,632,380 | | | | 4.250 | % | | | 08/30/20 | | | $ | 8,621,588 | |
| ROC Finance LLC (B+/B2) | |
| | 1,960,000 | | | | 5.000 | | | | 06/20/19 | | | | 1,855,885 | |
| SBA Senior Finance II LLC (BB/B1) | |
| | 16,268,938 | | | | 3.250 | | | | 03/24/21 | | | | 16,049,796 | |
| Victory Capital Management, Inc. (BB-/B2) | |
| | 20,057,788 | | | | 7.000 | | | | 10/31/21 | | | | 19,456,055 | |
| | | | | | | | | | | | | | |
| | | | | | | | | | | | | 45,983,324 | |
| | |
| | Food & Beverages – 5.6% | |
| Albertson’s Holdings LLC (BB-/Ba3) | |
| | 19,251,313 | | | | 5.000 | | | | 08/25/19 | | | | 19,229,944 | |
| | 2,985,495 | | | | 5.500 | | | | 08/25/21 | | | | 2,983,644 | |
| Atrium Innovations, Inc. (B/B2) | |
| | 1,746,984 | | | | 4.250 | | | | 02/13/21 | | | | 1,644,349 | |
| Atrium Innovations, Inc. (CCC+/Caa2) | |
| | 9,545,000 | | | | 7.750 | | | | 08/13/21 | | | | 8,375,737 | |
| Blue Buffalo Co. Ltd. (BB/Ba3) | |
| | 5,961,008 | | | | 3.750 | | | | 08/08/19 | | | | 5,953,557 | |
| Diamond Foods, Inc. (B/B2) | |
| | 16,301,307 | | | | 4.250 | | | | 08/20/18 | | | | 16,235,124 | |
| Dole Food Co., Inc. (B-/B1) | |
| | 8,272,092 | | | | 4.500 | | | | 11/01/18 | | | | 8,245,207 | |
| High Liner Foods, Inc. (B+/B2) | |
| | 9,529,875 | | | | 4.250 | | | | 04/24/21 | | | | 9,458,401 | |
| Performance Food Group, Inc. (BB-/B3) | |
| | 57,734,194 | | | | 6.250 | | | | 11/14/19 | | | | 57,709,946 | |
| Pinnacle Foods Finance LLC (BB+/Ba2) | |
| | 15,651,376 | | | | 3.000 | | | | 04/29/20 | | | | 15,596,643 | |
| Shearer’s Foods, Inc. (B/B1) | |
| | 7,647,750 | | | | 4.500 | | | | 06/30/21 | | | | 7,585,650 | |
| Shearer’s Foods, Inc. (CCC+/Caa1) | |
| | 12,800,000 | | | | 7.750 | | | | 06/30/22 | | | | 12,512,000 | |
| US Foods, Inc. (B-/B2) | |
| | 48,946,571 | | | | 4.500 | | | | 03/31/19 | | | | 48,858,956 | |
| | | | | | | | | | | | | | |
| | | | | | | | | | | | | 214,389,158 | |
| | |
| | Food & Drug Retailers – 0.7% | |
| Rite Aid Corp. (B+/B2) | |
| | 8,790,000 | | | | 5.750 | | | | 08/21/20 | | | | 8,877,900 | |
| | 16,345,000 | | | | 4.875 | | | | 06/21/21 | | | | 16,345,000 | |
| | | | | | | | | | | | | | |
| | | | | | | | | | | | | 25,222,900 | |
| | |
| | Gaming – 1.6% | |
| Aristocrat Leisure Ltd. (BB/Ba2) | |
| | 16,723,462 | | | | 4.750 | | | | 10/20/21 | | | | 16,710,417 | |
| CCM Merger, Inc. (BB-/B2) | |
| | 504,596 | | | | 4.500 | | | | 08/08/21 | | | | 503,021 | |
| CityCenter Holdings LLC (BB-/B2) | |
| | 15,889,724 | | | | 4.250 | | | | 10/16/20 | | | | 15,835,064 | |
| Graton Economic Development Authority (B+/B2) | |
| | 2,275,000 | | | | 4.750 | | | | 07/28/22 | | | | 2,265,058 | |
| Marina District Finance Co., Inc. (BB/B2) | |
| | 6,222,139 | | | | 6.500 | | | | 08/15/18 | | | | 6,260,903 | |
| MGM Resorts International (BB/Ba2) | |
| | 10,228,354 | | | | 3.500 | | | | 12/20/19 | | | | 10,141,413 | |
| | |
| | |
| The accompanying notes are an integral part of these financial statements. | | 83 |
GOLDMAN SACHS HIGH YIELD FLOATING RATE FUND
Schedule of Investments (continued)
September 30, 2015 (Unaudited)
| | | | | | | | | | | | | | |
Principal
Amount | | | Interest
Rate | | | Maturity
Date | | | Value | |
| | Senior Term Loans(a) – (continued) | |
| | Gaming – (continued) | |
| Peninsula Gaming LLC (B+/B1) | |
| $ | 4,381,326 | | | | 4.250 | % | | | 11/20/17 | | | $ | 4,369,015 | |
| Scientific Games International, Inc. (BB-/Ba3) | |
| | 5,627,450 | | | | 6.000 | | | | 10/01/21 | | | | 5,549,172 | |
| | | | | | | | | | | | | | |
| | | | | | | | | | | | | 61,634,063 | |
| | |
| | Health Care – 1.6% | |
| Community Health Systems, Inc. (BB/Ba2) | |
| | 7,945,607 | | | | 3.750 | | | | 12/31/19 | | | | 7,928,206 | |
| | 12,573,263 | | | | 4.000 | | | | 01/27/21 | | | | 12,570,120 | |
| HCA, Inc. (BBB-/Ba1) | |
| | 28,820,170 | | | | 2.944 | | | | 03/31/17 | | | | 28,780,974 | |
| | 12,004,137 | | | | 3.077 | | | | 05/01/18 | | | | 11,987,691 | |
| MedAssets, Inc. (BB+/Ba3) | |
| | 70,854 | | | | 4.000 | | | | 12/13/19 | | | | 70,322 | |
| | | | | | | | | | | | | | |
| | | | | | | | | | | | | 61,337,313 | |
| | |
| | Health Care – Medical Products – 0.5% | |
| Convatec, Inc. (B+/Ba2) | |
| | 2,691,643 | | | | 4.250 | | | | 06/15/20 | | | | 2,681,549 | |
| Ortho-Clinical Diagnostics, Inc. (B/B1) | |
| | 17,490,519 | | | | 4.750 | | | | 06/30/21 | | | | 17,140,709 | |
| | | | | | | | | | | | | | |
| | | | | | | | | | | | | 19,822,258 | |
| | |
| | Health Care – Pharmaceuticals – 2.3% | |
| Endo Luxembourg Finance Co. I S.A.R.L. (BB/Ba1) | |
| | 13,900,000 | | | | 3.750 | | | | 06/11/22 | | | | 13,843,566 | |
| PharMedium Healthcare Corp. (B/B1) | |
| | 4,298,992 | | | | 4.250 | | | | 01/28/21 | | | | 4,238,075 | |
| PharMedium Healthcare Corp. (CCC+/Caa2) | |
| | 2,000,000 | | | | 7.750 | | | | 01/28/22 | | | | 1,970,000 | |
| Valeant Pharmaceuticals International, Inc. (BB+/Ba1) | |
| | 4,561,323 | | | | 3.500 | | | | 02/13/19 | | | | 4,485,149 | |
| | 23,300,954 | | | | 3.750 | | | | 08/05/20 | | | | 22,928,139 | |
| | 41,681,141 | | | | 4.000 | | | | 04/01/22 | | | | 41,207,226 | |
| | | | | | | | | | | | | | |
| | | | | | | | | | | | | 88,672,155 | |
| | |
| | Health Care – Services – 4.2% | |
| 21st Century Oncology Holdings, Inc. (B-/B1) | |
| | 12,718,125 | | | | 6.500 | | | | 04/30/22 | | | | 12,050,423 | |
| American Renal Holdings, Inc. (B/Ba3) | |
| | 14,330,147 | | | | 4.500 | | | | 09/22/19 | | | | 14,186,845 | |
| American Renal Holdings, Inc. (CCC+/Caa1) | |
| | 21,385,439 | | | | 8.500 | | | | 03/20/20 | | | | 21,305,244 | |
| Amsurg Corp. (BB-/Ba2) | |
| | 3,852,877 | | | | 3.500 | | | | 07/16/21 | | | | 3,849,256 | |
| Envision Healthcare Corp. (BB-/Ba3) | |
| | 14,053,820 | | | | 4.000 | | | | 05/25/18 | | | | 14,039,205 | |
| MPH Acquisition Holdings LLC (B+/B1) | |
| | 38,399,298 | | | | 3.750 | | | | 03/31/21 | | | | 37,890,508 | |
| Sedgwick Claims Management Services, Inc. (B/B1) | |
| | 13,194,936 | | | | 3.750 | | | | 03/01/21 | | | | 12,976,428 | |
| Sedgwick Claims Management Services, Inc. (CCC+/Caa2) | |
| | 26,450,758 | | | | 6.750 | | | | 02/28/22 | | | | 24,797,585 | |
| U.S. Renal Care, Inc. (B/Ba3) | |
| | 7,141,402 | | | | 4.250 | | | | 07/03/19 | | | | 7,120,549 | |
| U.S. Renal Care, Inc. (CCC+/Caa1) | |
| | 4,000,000 | | | | 8.500 | | | | 01/03/20 | | | | 4,030,000 | |
| | 7,975,000 | | | | 10.250 | | | | 01/03/20 | | | | 7,975,000 | |
| | | | | | | | | | | | | | |
| | | | | | | | | | | | | 160,221,043 | |
| | |
Principal
Amount | | | Interest
Rate | | | Maturity
Date | | | Value | |
| | Senior Term Loans(a) – (continued) | |
| | Lodging – 2.6% | |
| Four Seasons Holdings, Inc. (BB/B1) | |
| $ | 16,937,348 | | | | 3.500 | % | | | 06/27/20 | | | $ | 16,805,067 | |
| Four Seasons Holdings, Inc. (B-/Caa1) | |
| | 11,767,000 | | | | 6.250 | | | | 12/27/20 | | | | 11,708,165 | |
| Hilton Worldwide Finance LLC (BBB-/Ba2) | |
| | 29,974,863 | | | | 3.500 | | | | 10/26/20 | | | | 29,874,747 | |
| La Quinta Intermediate Holding LLC (BB/B1) | |
| | 40,066,263 | | | | 3.750 | | | | 04/14/21 | | | | 39,665,600 | |
| | | | | | | | | | | | | | |
| | | | | | | | | | | | | 98,053,579 | |
| | |
| | Media – Broadcasting & Radio – 3.2% | |
| Getty Images, Inc. (CCC+/B2) | |
| | 51,815,556 | | | | 4.750 | | | | 10/18/19 | | | | 33,496,684 | |
| iHeart Communications, Inc. (CCC+/Caa1) | |
| | 26,847,038 | | | | 7.694 | | | | 07/30/19 | | | | 22,350,159 | |
| Salem Communications Corp. (B/B2) | |
| | 13,743,198 | | | | 4.500 | | | | 03/13/20 | | | | 13,580,067 | |
| Telesat Canada (BB/Ba3) | |
| | 2,013,747 | | | | 3.500 | | | | 03/28/19 | | | | 1,994,234 | |
| The E.W. Scripps Co. (BBB-/Ba2) | |
| | 12,916,612 | | | | 3.500 | | | | 11/26/20 | | | | 12,908,603 | |
| Townsquare Media, Inc. (BB-/Ba2) | |
| | 3,333,250 | | | | 4.250 | | | | 04/01/22 | | | | 3,314,517 | |
| Univision Communications, Inc. (B+/B2) | |
| | 33,026,055 | | | | 4.000 | | | | 03/01/20 | | | | 32,786,826 | |
| | | | | | | | | | | | | | |
| | | | | | | | | | | | | 120,431,090 | |
| | |
| | Media – Cable – 2.5% | |
| Altice Financing SA (BB-/B1) | |
| | 2,131,157 | | | | 5.500 | | | | 07/02/19 | | | | 2,126,894 | |
| Charter Communications Operating LLC (BB+/Baa3) | |
| | 28,540,888 | | | | 3.000 | | | | 07/01/20 | | | | 28,166,431 | |
| | 11,556,132 | | | | 3.000 | | | | 01/03/21 | | | | 11,351,010 | |
| CSC Holdings LLC (BB+/Baa3) | |
| | 10,136,623 | | | | 2.694 | | | | 04/17/20 | | | | 10,058,976 | |
| Neptune Finco Corp. (NR/NR) | |
| | 7,775,000 | | | | 5.000 | | | | 09/21/22 | | | | 7,724,462 | |
| Numericable Group SA (NR/NR) | |
| | 3,725,000 | | | | 4.000 | | | | 07/31/22 | | | | 3,648,638 | |
| Wave Division Holdings LLC (BB-/Ba3) | |
| | 6,807,500 | | | | 4.000 | | | | 10/15/19 | | | | 6,787,622 | |
| Ziggo N.V. (BB-/Ba3) | |
| | 20,950,000 | | | | 3.500 | | | | 01/15/22 | | | | 20,541,475 | |
| EUR | 5,500,000 | | | | 3.750 | | | | 01/15/22 | | | | 6,027,578 | |
| | | | | | | | | | | | | | |
| | | | | | | | | | | | | 96,433,086 | |
| | |
| | Media – Non Cable – 3.6% | |
| Advantage Sales & Marketing, Inc. (B/B1) | |
| $ | 18,244,729 | | | | 4.250 | | | | 07/23/21 | | | | 17,885,490 | |
| Advantage Sales & Marketing, Inc. (CCC+/Caa1) | |
| | 4,791,893 | | | | 7.500 | | | | 07/25/22 | | | | 4,576,258 | |
| Checkout Holding Corp. (B/B1) | |
| | 21,074,646 | | | | 4.500 | | | | 04/09/21 | | | | 18,018,823 | |
| Checkout Holding Corp. (CCC/Caa1) | |
| | 21,800,000 | | | | 7.750 | | | | 04/11/22 | | | | 14,415,250 | |
| McGraw-Hill Global Education Holdings LLC (B+/B1) | |
| | 6,258,605 | | | | 4.750 | | | | 03/22/19 | | | | 6,261,233 | |
| | |
| | |
| 84 | | The accompanying notes are an integral part of these financial statements. |
GOLDMAN SACHS HIGH YIELD FLOATING RATE FUND
| | | | | | | | | | | | | | |
Principal
Amount | | | Interest
Rate | | | Maturity
Date | | | Value | |
| | Senior Term Loans(a) – (continued) | |
| | Media – Non Cable – (continued) | |
| Media General, Inc. (BB+/Ba3) | |
| $ | 12,083,020 | | | | 4.000 | % | | | 07/31/20 | | | $ | 11,969,802 | |
| NEP Supershooters LP (B-/Caa1) | |
| | 20,832,739 | | | | 10.000 | | | | 07/22/20 | | | | 20,693,785 | |
| NEP/NCP Holdco, Inc. (B/B1) | |
| | 26,289,160 | | | | 4.250 | | | | 01/22/20 | | | | 25,697,654 | |
| Renaissance Learning, Inc. (B-/B1) | |
| | 7,493,043 | | | | 4.500 | | | | 04/09/21 | | | | 7,249,519 | |
| Renaissance Learning, Inc. (CCC/Caa2) | |
| | 9,612,400 | | | | 8.000 | | | | 04/11/22 | | | | 9,307,975 | |
| | | | | | | | | | | | | | |
| | | | | | | | | | | | | 136,075,789 | |
| | |
| | Metals & Mining – 0.2% | |
| Hi Crush Partners LP (BB-/B2) | |
| | 6,859,350 | | | | 4.750 | | | | 04/28/21 | | | | 6,344,898 | |
| Novelis, Inc. (BB/Ba2) | |
| | 274,313 | | | | 4.000 | | | | 06/02/22 | | | | 269,512 | |
| | | | | | | | | | | | | | |
| | | | | | | | | | | | | 6,614,410 | |
| | |
| | Packaging – 3.3% | |
| Ardagh Holdings USA, Inc. (B+/Ba3) | |
| | 3,765,242 | | | | 4.000 | | | | 12/17/19 | | | | 3,745,248 | |
| Berry Plastics Holding Corp. (BB-/Ba3) | |
| | 27,921,305 | | | | 3.500 | | | | 02/08/20 | | | | 27,637,624 | |
| Berry Plastics Holding Group, Inc. (BB-/Ba3) | |
| | 12,387,681 | | | | 3.750 | | | | 01/06/21 | | | | 12,290,314 | |
| BWAY Holding Co., Inc. (B-/B2) | |
| | 30,807,756 | | | | 5.500 | | | | 08/14/20 | | | | 30,682,676 | |
| Klockner-Pentaplast of America, Inc. (B/B1) | |
| EUR | 2,244,375 | | | | 5.000 | | | | 04/28/20 | | | | 2,514,911 | |
| $ | 5,223,884 | | | | 5.000 | | | | 04/28/20 | | | | 5,235,324 | |
| KP Germany Erste GmbH (B/B1) | |
| | 2,232,429 | | | | 5.000 | | | | 04/28/20 | | | | 2,237,318 | |
| Onex Wizard U.S. Acquisition, Inc. (B+/B1) | |
| | 15,934,962 | | | | 4.250 | | | | 03/13/22 | | | | 15,891,779 | |
| Reynolds Group Holdings, Inc. (B+/B1) | |
| | 26,959,650 | | | | 4.500 | | | | 12/01/18 | | | | 26,953,449 | |
| | | | | | | | | | | | | | |
| | | | | | | | | | | | | 127,188,643 | |
| | |
| | Property/Casualty Insurance – 0.2% | |
| York Risk Services Holding Corp. (B/B1) | |
| | 9,733,581 | | | | 4.750 | | | | 10/01/21 | | | | 9,323,992 | |
| | |
| | Real Estate – 1.0% | |
| Communications Sales & Leasing, Inc. (BB/B1) | |
| | 9,975,000 | | | | 5.000 | | | | 10/24/22 | | | | 9,339,094 | |
| Realogy Corp. (BB/Ba2) | |
| | 20,772,124 | | | | 3.750 | | | | 03/05/20 | | | | 20,707,315 | |
| Starwood Property Trust, Inc. (BB/Ba3) | |
| | 9,406,588 | | | | 3.500 | | | | 04/17/20 | | | | 9,247,898 | |
| | | | | | | | | | | | | | |
| | | | | | | | | | | | | 39,294,307 | |
| | |
| | Restaurants – 1.5% | |
| 1011778 B.C. Unlimited Liability Co. (B+/Ba3) | |
| | 53,183,810 | | | | 3.750 | | | | 12/12/21 | | | | 52,904,595 | |
| Seminole Hard Rock Entertainment, Inc. (BB+/Ba1) | |
| | 4,887,500 | | | | 3.500 | | | | 05/14/20 | | | | 4,789,750 | |
| | | | | | | | | | | | | | |
| | | | | | | | | | | | | 57,694,345 | |
| | |
Principal
Amount | | | Interest
Rate | | | Maturity
Date | | | Value | |
| | Senior Term Loans(a) – (continued) | |
| | Retailers – 6.9% | |
| Academy Ltd. (B/B2) | |
| $ | 9,335,066 | | | | 5.000 | % | | | 07/01/22 | | | $ | 9,277,935 | |
| American Apparel (USA) LLC (CCC-/Caa3) | |
| | 1,833,600 | | | | 7.194 | | | | 01/15/18 | | | | 1,833,600 | |
| | 2,292,000 | | | | 5.199 | | | | 04/04/18 | | | | 2,292,000 | |
| Bass Pro Group LLC (BB-/B1) | |
| | 9,172,750 | | | | 4.000 | | | | 06/05/20 | | | | 9,115,421 | |
| BJ’s Wholesale Club, Inc. (B-/B3) | |
| | 14,929,090 | | | | 4.500 | | | | 09/26/19 | | | | 14,764,870 | |
| BJ’s Wholesale Club, Inc. (CCC/Caa2) | |
| | 19,900,000 | | | | 8.500 | | | | 03/26/20 | | | | 19,659,608 | |
| Burlington Coat Factory Warehouse Corp. (BB-/Ba3) | |
| | 11,215,645 | | | | 4.250 | | | | 08/13/21 | | | | 11,215,533 | |
| Container Store, Inc. (B/B2) | |
| | 6,486,457 | | | | 4.250 | | | | 04/06/19 | | | | 6,413,484 | |
| Dollar Tree, Inc. (BB+/Ba1) | |
| | 18,858,544 | | | | 3.500 | | | | 07/06/22 | | | | 18,855,904 | |
| | 16,700,000 | | | | 4.250 | | | | 07/06/22 | | | | 16,699,833 | |
| Hudson’s Bay Co. (BB/B1) | |
| | 6,000,000 | | | | 4.750 | | | | 08/10/22 | | | | 6,016,800 | |
| J Crew Group, Inc. (B-/B2) | |
| | 24,641,887 | | | | 4.000 | | | | 03/05/21 | | | | 19,022,551 | |
| Michaels Stores, Inc. (BB-/Ba2) | |
| | 21,164,865 | | | | 3.750 | | | | 01/28/20 | | | | 21,115,762 | |
| Neiman Marcus Group Ltd., Inc. (B/B2) | |
| | 32,213,311 | | | | 4.250 | | | | 10/25/20 | | | | 31,485,612 | |
| Payless, Inc. (B/B1) | |
| | 6,154,376 | | | | 5.000 | | | | 03/11/21 | | | | 4,769,642 | |
| Payless, Inc. (CCC+/B3) | |
| | 3,750,000 | | | | 8.500 | | | | 03/11/22 | | | | 2,925,000 | |
| Petco Animal Supplies, Inc. (B+/Ba3) | |
| | 11,108,700 | | | | 4.000 | | | | 11/24/17 | | | | 11,088,815 | |
| PetSmart, Inc. (BB-/Ba3) | |
| | 21,896,313 | | | | 4.250 | | | | 03/11/22 | | | | 21,839,382 | |
| Staples, Inc. (BBB/Baa2) | |
| | 11,400,000 | | | | 3.500 | | | | 04/07/21 | | | | 11,333,082 | |
| The Men’s Wearhouse, Inc. (BB-/Ba2) | |
| | 2,355,682 | | | | 4.500 | | | | 06/18/21 | | | | 2,357,166 | |
| | 6,525,000 | | | | 5.000 | | | | 06/18/21 | | | | 6,508,688 | |
| True Religion Apparel, Inc. (B-/Caa1) | |
| | 16,646,250 | | | | 5.875 | | | | 07/30/19 | | | | 9,959,951 | |
| True Religion Apparel, Inc. (CCC/Caa3) | |
| | 7,650,000 | | | | 11.000 | | | | 01/29/20 | | | | 3,251,250 | |
| | | | | | | | | | | | | | |
| | | | | | | | | | | | | 261,801,889 | |
| | |
| | Services Cyclical – Business Services – 4.6% | |
| Acosta Holdco, Inc. (B/B1) | |
| | 4,457,813 | | | | 4.250 | | | | 09/26/21 | | | | 4,379,801 | |
| ADS Waste Holdings, Inc. (B+/B2) | |
| | 42,488,398 | | | | 3.750 | | | | 10/09/19 | | | | 41,811,133 | |
| Crossmark Holdings, Inc. (CCC/Caa2) | |
| | 6,864,000 | | | | 8.750 | | | | 12/21/20 | | | | 5,216,640 | |
| First Data Corp. (BB-/B1) | |
| | 7,925,000 | | | | 3.696 | | | | 03/24/17 | | | | 7,882,918 | |
| | 38,460,076 | | | | 3.696 | | | | 03/24/18 | | | | 38,111,628 | |
| | 10,000,000 | | | | 3.696 | | | | 09/24/18 | | | | 9,895,000 | |
| | 12,477,728 | | | | 4.196 | | | | 03/24/21 | | | | 12,446,534 | |
| | |
| | |
| The accompanying notes are an integral part of these financial statements. | | 85 |
GOLDMAN SACHS HIGH YIELD FLOATING RATE FUND
Schedule of Investments (continued)
September 30, 2015 (Unaudited)
| | | | | | | | | | | | | | |
Principal
Amount | | | Interest
Rate | | | Maturity
Date | | | Value | |
| | Senior Term Loans(a) – (continued) | |
| | Services Cyclical – Business Services – (continued) | |
| Koosharem LLC (B-/B3) | |
| $ | 6,884,825 | | | | 7.500 | % | | | 05/15/20 | | | $ | 6,760,072 | |
| TCH 2 Holdings LLC (B-/B1) | |
| | 5,531,772 | | | | 5.500 | | | | 05/06/21 | | | | 5,476,454 | |
| Travelport Finance S.A.R.L. (B/B2) | |
| | 10,545,313 | | | | 5.750 | | | | 09/02/21 | | | | 10,486,048 | |
| Vantiv, LLC (BB+/Ba3) | |
| | 28,031,558 | | | | 3.750 | | | | 06/13/21 | | | | 28,037,164 | |
| Waste Industries USA, Inc. (BB-/B1) | |
| | 5,472,500 | | | | 4.250 | | | | 02/27/20 | | | | 5,486,127 | |
| | | | | | | | | | | | | | |
| | | | | | | | | | | | | 175,989,519 | |
| | |
| | Services Cyclical – Consumer Services – 1.7% | |
| Bright Horizons Family Solution, Inc. (BB/B1) | |
| | 36,819,551 | | | | 3.750 | | | | 01/30/20 | | | | 36,806,296 | |
| Spin Holdco, Inc. (B/B2) | |
| | 21,248,283 | | | | 4.250 | | | | 11/14/19 | | | | 20,810,143 | |
| Weight Watchers International, Inc. (B-/B3) | |
| | 971,898 | | | | 3.210 | | | | 04/02/16 | | | | 873,494 | |
| | 10,192,202 | | | | 4.000 | | | | 04/02/20 | | | | 5,542,010 | |
| | | | | | | | | | | | | | |
| | | | | | | | | | | | | 64,031,943 | |
| | |
| | Services Cyclical – Rental Equipment – 0.3% | |
| Maxim Crane Works LP (B/Caa2) | |
| | 12,000,000 | | | | 10.250 | | | | 11/26/18 | | | | 11,880,000 | |
| | |
| | Technology – 0.7% | |
| CDW LLC (BB+/Ba2) | |
| | 22,084,151 | | | | 3.250 | | | | 04/29/20 | | | | 21,867,285 | |
| Riverbed Technology, Inc. (B/B1) | |
| | 5,522,250 | | | | 6.000 | | | | 04/24/22 | | | | 5,522,250 | |
| | | | | | | | | | | | | | |
| | | | | | | | | | | | | 27,389,535 | |
| | |
| | Technology – Software/Services – 3.8% | |
| Aspect Software, Inc. (B-/B1) | |
| | 4,876,279 | | | | 7.500 | | | | 05/07/16 | | | | 4,754,372 | |
| Avago Technologies Cayman Ltd. (BBB-/Ba1) | |
| | 33,295,368 | | | | 3.750 | | | | 05/06/21 | | | | 33,246,756 | |
| BMC Software Finance, Inc. (B/B1) | |
| | 20,403,377 | | | | 5.000 | | | | 09/10/20 | | | | 18,495,661 | |
| Dealertrack Technologies, Inc. (BB-/WR) | |
| | 7,618,332 | | | | 5.000 | | | | 02/28/21 | | | | 7,575,517 | |
| Electrical Components International, Inc. (B+/B1) | |
| | 7,266,680 | | | | 5.750 | | | | 05/28/21 | | | | 7,253,092 | |
| Emdeon, Inc. (B+/Ba3) | |
| | 17,980,560 | | | | 3.750 | | | | 11/02/18 | | | | 17,860,630 | |
| Freescale Semiconductor, Inc. (B/B1) | |
| | 15,269,317 | | | | 4.250 | | | | 02/28/20 | | | | 15,250,231 | |
| | 7,245,722 | | | | 5.000 | | | | 01/15/21 | | | | 7,244,418 | |
| Lawson Software, Inc. (B+/B1) | |
| | 4,316,308 | | | | 3.750 | | | | 06/03/20 | | | | 4,171,539 | |
| MA FinanceCo., LLC (BB-/B1) | |
| | 6,703,125 | | | | 4.500 | | | | 11/20/19 | | | | 6,683,016 | |
| SS&C Technologies, Inc. (BB/Ba3) | |
| | 20,017,377 | | | | 4.000 | | | | 07/08/22 | | | | 20,029,987 | |
| TTM Technologies, Inc. (B+/B2) | |
| | 4,050,000 | | | | 6.000 | | | | 05/31/21 | | | | 3,766,500 | |
| | | | | | | | | | | | | | |
| | | | | | | | | | | | | 146,331,719 | |
| | |
Principal
Amount | | | Interest
Rate | | | Maturity
Date | | | Value | |
| | Senior Term Loans(a) – (continued) | |
| | Transportation – 0.1% | |
| Pilot Travel Centers LLC (BB+/Ba2) | |
| $ | 3,267,000 | | | | 4.250 | % | | | 10/01/21 | | | $ | 3,275,821 | |
| | |
| | Utilities – Electric – 1.4% | |
| Calpine Corp. (BB/Ba3) | |
| | 20,922,992 | | | | 4.000 | | | | 10/09/19 | | | | 20,861,897 | |
| | 6,553,192 | | | | 4.000 | | | | 10/30/20 | | | | 6,534,778 | |
| | 17,955,000 | | | | 3.500 | | | | 05/27/22 | | | | 17,645,815 | |
| NRG Energy, Inc. (BB+/Baa3) | |
| | 8,453,524 | | | | 2.750 | | | | 07/02/18 | | | | 8,256,980 | |
| | | | | | | | | | | | | | |
| | | | | | | | | | | | | 53,299,470 | |
| | |
| | Wireless Telecommunications – 4.5% | |
| Asurion LLC (B/Ba3) | |
| | 4,929,054 | | | | 5.000 | | | | 05/24/19 | | | | 4,693,692 | |
| Asurion LLC (CCC+/Caa1) | |
| | 41,536,979 | | | | 8.500 | | | | 03/03/21 | | | | 37,217,133 | |
| Asurion LLC (B/Ba3) | |
| | 3,042,375 | | | | 5.000 | | | | 08/04/22 | | | | 2,869,812 | |
| Crown Castle Operating Co. (BBB/Ba1) | |
| | 18,506,346 | | | | 3.000 | | | | 01/31/21 | | | | 18,428,620 | |
| GCI Holdings, Inc. (BB+/Ba2) | |
| | 5,174,000 | | | | 4.000 | | | | 02/02/22 | | | | 5,167,533 | |
| Intelsat Jackson Holdings Ltd. (BB-/Ba3) | |
| | 61,184,955 | | | | 3.750 | | | | 06/30/19 | | | | 59,456,480 | |
| Level 3 Financing, Inc. (BB/Ba1) | |
| | 12,095,000 | | | | 4.000 | | | | 08/01/19 | | | | 12,082,905 | |
| | 13,000,000 | | | | 4.000 | | | | 01/15/20 | | | | 12,951,250 | |
| | 10,227,000 | | | | 3.500 | | | | 05/31/22 | | | | 10,133,218 | |
| LTS Buyer LLC (B/B1) | |
| | 3,231,735 | | | | 4.000 | | | | 04/13/20 | | | | 3,167,100 | |
| Zayo Group LLC (BB-/Ba2) | |
| | 3,982,992 | | | | 3.750 | | | | 05/06/21 | | | | 3,954,474 | |
| | | | | | | | | | | | | | |
| | | | | | | | | | | | | 170,122,217 | |
| | |
| | TOTAL SENIOR TERM LOANS | |
| | (Cost $3,294,719,804) | | | | | | | $ | 3,168,820,275 | |
| | |
| | | | | | | | | | | | | | |
| | Corporate Obligations – 9.9% | |
| | Airlines – 1.7% | |
| Air Canada (BB/Ba3)(b)(c) | |
| | $18,525,000 | | | | 6.750 | % | | | 10/01/19 | | | $ | 19,543,875 | |
| Air Canada (BB-/NR)(c) | |
| | 10,000,000 | | | | 5.000 | | | | 03/15/20 | | | | 9,837,600 | |
| Air Canada (BBB-/Ba1)(c) | |
| | 15,394,857 | | | | 5.375 | | | | 11/15/22 | | | | 15,818,216 | |
| Air Canada 2013-1 Class C Pass Through Trust (BB-/Ba3)(c) | |
| | 9,221,000 | | | | 6.625 | | | | 05/15/18 | | | | 9,565,865 | |
| Continental Airlines 2012-3 Class C Pass Thru Certificates
(NR/Ba2) |
|
| | 4,500,000 | | | | 6.125 | | | | 04/29/18 | | | | 4,680,000 | |
| United Airlines 2014-1 Class B Pass Through Trust (BBB/NR) | |
| | 3,850,000 | | | | 4.750 | | | | 10/11/23 | | | | 3,850,000 | |
| | | | | | | | | | | | | | |
| | | | | | | | | | | | | 63,295,556 | |
| | |
| | |
| 86 | | The accompanying notes are an integral part of these financial statements. |
GOLDMAN SACHS HIGH YIELD FLOATING RATE FUND
| | | | | | | | | | | | | | |
Principal
Amount | | | Interest
Rate | | | Maturity
Date | | | Value | |
| | Corporate Obligations – (continued) | |
| | Automotive(b)(c) – 0.2% | |
| Schaeffler Finance BV (BB-/Ba2) | |
| $ | 7,475,000 | | | | 4.750 | % | | | 05/15/23 | | | $ | 7,232,063 | |
| | |
| | Chemicals – 0.2% | |
| Momentive Performance Materials, Inc. (B/B3)(b) | |
| | 10,000,000 | | | | 3.880 | | | | 10/24/21 | | | | 7,700,000 | |
| MPM Escrow LLC (NR/NR)(d) | |
| | 10,000,000 | | | | 8.875 | | | | 10/15/20 | | | | — | |
| WR Grace & Co. (BB-/Ba3)(c) | |
| | 750,000 | | | | 5.125 | | | | 10/01/21 | | | | 738,750 | |
| | | | | | | | | | | | | | |
| | | | | | | | | | | | | 8,438,750 | |
| | |
| | Consumer Products – Industrial(b)(c) – 0.1% | |
| HD Supply, Inc. (BB-/B1) | |
| | 3,275,000 | | | | 5.250 | | | | 12/15/21 | | | | 3,295,469 | |
| | |
| | Energy(b)(c)(e) – 0.1% | |
| FTS International, Inc. (B+/B1) | |
| | 5,950,000 | | | | 7.837 | | | | 06/15/20 | | | | 4,432,750 | |
| | |
| | Energy – Exploration & Production(b)(c) – 0.2% | |
| Antero Resources Corp. (BB/Ba3) | |
| | 10,150,000 | | | | 5.625 | | | | 06/01/23 | | | | 8,881,250 | |
| | |
| | Finance(c) – 0.2% | |
| CIT Group, Inc. (BB-/B1) | |
| | 1,425,000 | | | | 5.500 | | | | 02/15/19 | | | | 1,478,438 | |
| HRG Group, Inc. (B+/Ba3)(b) | |
| | 4,900,000 | | | | 7.875 | | | | 07/15/19 | | | | 5,059,250 | |
| International Lease Finance Corp. (BBB-/Ba1) | |
| | 1,000,000 | | | | 7.125 | | | | 09/01/18 | | | | 1,098,700 | |
| | | | | | | | | | | | | | |
| | | | | | | | | | | | | 7,636,388 | |
| | |
| | Food and Beverage(b) – 0.4% | |
| Shearer’s Foods LLC/Chip Finance Corp. (B/B1)(c) | |
| | 900,000 | | | | 9.000 | | | | 11/01/19 | | | | 954,000 | |
| US Foods, Inc. (CCC+/Caa2) | |
| | 12,000,000 | | | | 8.500 | | | | 06/30/19 | | | | 12,405,000 | |
| | | | | | | | | | | | | | |
| | | | | | | | | | | | | 13,359,000 | |
| | |
| | Gaming(b)(d) ��� 0.3% | |
| Caesars Entertainment Operating Co., Inc. (D/WR) | |
| | 14,850,000 | | | | 9.000 | | | | 02/15/20 | | | | 12,139,875 | |
| | |
| | Health Care – 1.6% | |
| CHS/Community Health Systems, Inc. (BB/Ba2)(b) | |
| | 9,000,000 | | | | 5.125 | | | | 08/15/18 | | | | 9,180,000 | |
| | 5,000,000 | | | | 5.125 | | | | 08/01/21 | | | | 5,125,000 | |
| CHS/Community Health Systems, Inc. (B-/B3)(b) | |
| | 8,800,000 | | | | 6.875 | | | | 02/01/22 | | | | 9,009,000 | |
| Crimson Merger Sub, Inc. (CCC+/Caa1)(b)(c) | |
| | 5,200,000 | | | | 6.625 | | | | 05/15/22 | | | | 4,485,000 | |
| HCA, Inc. (BBB-/Ba1) | |
| | 10,000,000 | | | | 3.750 | | | | 03/15/19 | | | | 9,975,000 | |
| | 8,150,000 | | | | 6.500 | | | | 02/15/20 | | | | 8,883,500 | |
| | 8,050,000 | | | | 5.000 | | | | 03/15/24 | | | | 8,070,125 | |
| | 3,275,000 | | | | 5.250 | | | | 04/15/25 | | | | 3,344,594 | |
| Tenet Healthcare Corp. (BB-/Ba2)(b)(c)(e) | |
| | 2,450,000 | | | | 3.837 | | | | 06/15/20 | | | | 2,431,625 | |
| | | | | | | | | | | | | | |
| | | | | | | | | | | | | 60,503,844 | |
| | |
Principal
Amount | | | Interest
Rate | | | Maturity
Date | | | Value | |
| | Corporate Obligations – (continued) | |
| | Lodging – 0.1% | |
| RHP Hotel Properties LP/RHP Finance Corp. (BB/B1) | |
| $ | 2,000,000 | | | | 5.000 | % | | | 04/15/23 | | | $ | 1,980,000 | |
| | |
| | Media – Broadcasting & Radio(b) – 0.8% | |
| iHeartCommunications, Inc. (CCC+/Caa1) | |
| | 3,153,000 | | | | 9.000 | | | | 12/15/19 | | | | 2,711,580 | |
| SBA Communications Corp. (B/B3) | |
| | 7,200,000 | | | | 4.875 | | | | 07/15/22 | | | | 7,056,000 | |
| Univision Communications, Inc. (CCC+/Caa1)(c) | |
| | 5,650,000 | | | | 8.500 | | | | 05/15/21 | | | | 5,876,000 | |
| Univision Communications, Inc. (B+/B2)(c) | |
| | 6,421,000 | | | | 6.750 | | | | 09/15/22 | | | | 6,629,682 | |
| | 10,200,000 | | | | 5.125 | | | | 02/15/25 | | | | 9,588,000 | |
| | | | | | | | | | | | | | |
| | | | | | | | | | | | | 31,861,262 | |
| | |
| | Media – Cable(b)(c) – 0.7% | |
| Altice US Finance I Corp. (BB-/Ba3) | |
| | 1,575,000 | | | | 5.375 | | | | 07/15/23 | | | | 1,519,875 | |
| Numericable – SFR SAS (B+/B1) | |
| | 13,000,000 | | | | 4.875 | | | | 05/15/19 | | | | 12,480,000 | |
| | 4,600,000 | | | | 6.250 | | | | 05/15/24 | | | | 4,393,000 | |
| Virgin Media Secured Finance PLC (BB-/Ba3) | |
| | 8,325,000 | | | | 5.375 | | | | 04/15/21 | | | | 8,377,031 | |
| | | | | | | | | | | | | | |
| | | | | | | | | | | | | 26,769,906 | |
| | |
| | Media – Non Cable(b)(c) – 0.1% | |
| Nielsen Finance LLC/Nielsen Finance Co. (BB+/B1) | |
| | 2,375,000 | | | | 5.000 | | | | 04/15/22 | | | | 2,309,688 | |
| | |
| | Packaging(b) – 0.4% | |
| Ardagh Packaging Finance PLC (CCC+/Caa1)(c) | |
| | 2,450,000 | | | | 6.250 | | | | 01/31/19 | | | | 2,437,750 | |
| Ardagh Packaging Finance PLC/Ardagh Holdings USA, Inc.
(B+/Ba3)(c) |
|
| EUR | 2,600,000 | | | | 4.250 | | | | 01/15/22 | | | | 2,854,397 | |
| Reynolds Group Issuer, Inc. (B+/B1) | |
| $ | 865,000 | | | | 7.875 | | | | 08/15/19 | | | | 896,356 | |
| | 4,275,000 | | | | 5.750 | | | | 10/15/20 | | | | 4,317,750 | |
| Reynolds Group Issuer, Inc. (CCC+/Caa2) | |
| | 3,075,000 | | | | 9.875 | | | | 08/15/19 | | | | 3,182,625 | |
| | | | | | | | | | | | | | |
| | | | | | | | | | | | | 13,688,878 | |
| | |
| | Pharmaceuticals(b)(c) – 0.0% | |
| Concordia Healthcare Corp. (CCC+/Caa2) | |
| | 1,400,000 | | | | 7.000 | | | | 04/15/23 | | | | 1,197,000 | |
| | |
| | Restaurants(b)(c) – 0.1% | |
| New Red Finance, Inc. (B+/Ba3) | |
| | 3,025,000 | | | | 4.625 | | | | 01/15/22 | | | | 2,956,937 | |
| New Red Finance, Inc. (B-/B3) | |
| | 2,050,000 | | | | 6.000 | | | | 04/01/22 | | | | 2,078,188 | |
| | | | | | | | | | | | | | |
| | | | | | | | | | | | | 5,035,125 | |
| | |
| | Retailers(b) – 0.2% | |
| American Apparel, Inc. (CC/Caa3)(d) | |
| | 9,986,469 | | | | 15.000 | | | | 04/15/20 | | | | 5,492,558 | |
| Dollar Tree, Inc. (B+/Ba3)(c) | |
| | 1,300,000 | | | | 5.750 | | | | 03/01/23 | | | | 1,347,125 | |
| | |
| | |
| The accompanying notes are an integral part of these financial statements. | | 87 |
GOLDMAN SACHS HIGH YIELD FLOATING RATE FUND
Schedule of Investments (continued)
September 30, 2015 (Unaudited)
| | | | | | | | | | | | | | |
Principal
Amount | | | Interest
Rate | | | Maturity
Date | | | Value | |
| | Corporate Obligations – (continued) | |
| | Retailers(b) – (continued) | |
| Family Tree Escrow LLC (B+/Ba3)(c) | |
| $ | 325,000 | | | | 5.250 | % | | | 03/01/20 | | | $ | 334,750 | |
| | | | | | | | | | | | | | |
| | | | | | | | | | | | | 7,174,433 | |
| | |
| | Services Cyclical – Business Services(b)(c) – 0.3% | |
| Altegrity, Inc. (D/WR) | |
| | 1,736,000 | | | | 9.500 | | | | 07/01/19 | | | | 1,640,520 | |
| First Data Corp. (BB-/B1) | |
| | 9,075,000 | | | | 6.750 | | | | 11/01/20 | | | | 9,483,375 | |
| | | | | | | | | | | | | | |
| | | | | | | | | | | | | 11,123,895 | |
| | |
| | Services Cyclical – Rental Equipment(b)(c) – 0.2% | |
| Ahern Rentals, Inc. (B/B3) | |
| | 7,150,000 | | | | 7.375 | | | | 05/15/23 | | | | 6,229,438 | |
| | |
| | Technology(b)(c) – 0.0% | |
| Brightstar Corp. (BB+/Ba1) | |
| | 1,025,000 | | | | 7.250 | | | | 08/01/18 | | | | 1,071,125 | |
| | |
| | Technology – Software/Services(b) – 0.1% | |
| Emdeon, Inc. (CCC+/Caa1) | |
| | 2,500,000 | | | | 11.000 | | | | 12/31/19 | | | | 2,662,500 | |
| | |
| | Telecommunications – Cellular – 1.1% | |
| Altice Financing SA (BB-/B1)(b)(c) | |
| | 2,175,000 | | | | 6.500 | | | | 01/15/22 | | | | 2,109,750 | |
| Sprint Communications, Inc. (BB/B1)(c) | |
| | 18,000,000 | | | | 9.000 | | | | 11/15/18 | | | | 18,900,000 | |
| Sprint Communications, Inc. (B+/Caa1) | |
| | 8,000,000 | | | | 8.375 | | | | 08/15/17 | | | | 7,940,000 | |
| | 1,575,000 | | | | 7.000 | | | | 08/15/20 | | | | 1,319,062 | |
| Sprint Corp. (B+/Caa1) | |
| | 9,850,000 | | | | 7.875 | | | | 09/15/23 | | | | 7,880,000 | |
| Wind Acquisition Finance SA (BB/Ba3)(b)(c) | |
| | 3,900,000 | | | | 4.750 | | | | 07/15/20 | | | | 3,831,750 | |
| | | | | | | | | | | | | | |
| | | | | | | | | | | | | 41,980,562 | |
| | |
| | Telecommunications – Internet & Data(b)(e) – 0.1% | |
| Level 3 Financing, Inc. (B/B1) | |
| | 4,650,000 | | | | 3.914 | | | | 01/15/18 | | | | 4,650,000 | |
| | |
| | Telecommunications – Satellites(b) – 0.3% | |
| Intelsat Jackson Holdings SA (B+/B3) | |
| | 7,450,000 | | | | 7.250 | | | | 04/01/19 | | | | 6,984,375 | |
| Intelsat Jackson Holdings SA (CCC+/Caa1)(f) | |
| | 6,700,000 | | | | 6.625 | (g) | | | 12/15/22 | | | | 5,226,000 | |
| | | | | | | | | | | | | | |
| | | | | | | | | | | | | 12,210,375 | |
| | |
| | Telecommunications – Wirelines – 0.2% | |
| Frontier Communications Corp. (BB-/Ba3) | |
| | 5,000,000 | | | | 8.250 | | | | 04/15/17 | | | | 5,275,000 | |
| | 4,050,000 | | | | 8.875 | (b)(c) | | | 09/15/20 | | | | 3,979,125 | |
| | | | | | | | | | | | | | |
| | | | | | | | | | | | | 9,254,125 | |
| | |
| | Transportation(b) – 0.2% | |
| Aguila 3 SA (B/B3) | |
| CHF | 750,000 | | | | 7.875 | | | | 01/31/18 | | | | 774,272 | |
| $ | 7,325,000 | | | | 7.875 | (c) | | | 01/31/18 | | | | 7,379,937 | |
| | | | | | | | | | | | | | |
| | | | | | | | | | | | | 8,154,209 | |
| | |
| | TOTAL CORPORATE OBLIGATIONS | | | | | |
| | (Cost $395,622,798) | | | $ | 376,567,466 | |
| | |
Principal
Amount | | | Interest
Rate | | | Maturity
Date | | | Value | |
| | Asset-Backed Securities(c)(e) – 0.2% | |
| | Collateralized Loan Obligation – 0.2% | |
| Zais CLO 1 Ltd. Series 2014-1A, Class B (A/NR) | |
| $ | 8,600,000 | | | | 2.905 | % | | | 04/15/26 | | | $ | 8,004,932 | |
| | (Cost $8,170,000) | | | | | |
| | |
| | | | | | | | | | | | | | |
| | | | | | |
| Shares | | Description | | Value | |
| Investment Companies(g) – 5.3% | |
Goldman Sachs Financial Square Government Fund – FST Shares | |
| 202,642,553 | | 0.006% | | $ | 202,642,553 | |
Goldman Sachs High Yield Fund | |
| 3,718 | | 0.006 | | | 23,350 | |
| |
| TOTAL INVESTMENT COMPANIES | |
| (Cost $202,666,754) | | $ | 202,665,903 | |
| |
| TOTAL INVESTMENTS – 98.5% | |
| (Cost $3,901,179,356) | | $ | 3,756,058,576 | |
| |
| | | | | | |
| | | | | | | | | | | | | | |
Principal
Amount | | | Interest Rate
(Paid) Received | | | Maturity
Date | | | Value | |
| | Reverse Repurchase Agreement – (0.1)% | |
| Barclays Reverse Repurchase Agreement (NR/NR) | |
| $ | (4,500,000 | ) | | | 0.100 | % | | | 08/05/16 | | | $ | (4,500,000 | ) |
| | (Cost $(4,500,000)) | | | | | |
| | |
| OTHER ASSETS IN EXCESS OF
LIABILITIES – 1.6% |
| | | 62,481,500 | |
| | |
| | NET ASSETS – 100.0% | | | $ | 3,814,040,076 | |
| | |
| | |
| The percentage shown for each investment category reflects the value of investments in that category as a percentage of net assets. |
(a) | | Senior Term Loans often require prepayments from excess cash flows or permit the borrower to repay at its election. The degree to which borrowers repay, whether as a contractual requirement or at their election, cannot be predicted with accuracy. As a result, the actual remaining maturity may be substantially less than the stated maturities shown. The stated interest rate represents the weighted average interest rate of all contracts within the senior loan facility on September 30, 2015. Senior Term Loans typically have rates of interest which are predetermined either daily, monthly, quarterly or semi-annually by reference to a base lending rate, plus a premium. These base lending rates are primarily the London-Interbank Offered Rate (“LIBOR”), and secondarily the prime rate offered by one or more major United States banks (the “Prime Rate”) and the certificate of deposit (“CD”) rate or other base lending rates used by commercial lenders. |
(b) | | Security with “Call” features with resetting interest rates. Maturity dates disclosed are the final maturity dates. |
(c) | | Exempt from registration under Rule 144A of the Securities Act of 1933. Under procedures approved by the Board of Trustees, such securities have been determined to be liquid by the investment adviser and may be resold, normally to qualified institutional buyers in transactions exempt from registration. Total market value of Rule 144A securities amounts to $221,862,226, which represents approximately 5.8% of net assets as of September 30, 2015. |
(d) | | Security is currently in default and/or non-income producing. |
| | |
| 88 | | The accompanying notes are an integral part of these financial statements. |
GOLDMAN SACHS HIGH YIELD FLOATING RATE FUND
| | |
(e) | | Variable rate security. Interest rate or distribution rate disclosed is that which is in effect on September 30, 2015. |
(f) | | All or a portion of the security was pledged as collateral against open reverse repurchase agreements. As of September 30, 2015, the value of securities pledged amounted to $3,900,000. |
(g) | | Represents Affiliated Funds. |
Security ratings disclosed, if any, are obtained from Standard & Poor’s/Moody’s Investors Service and are unaudited. A description of the ratings is available in the Fund’s Statement of Additional Information.
| | |
|
Currency Abbreviations: |
CHF | | —Swiss Franc |
EUR | | —Euro |
USD | | —U.S. Dollar |
| | |
Investment Abbreviations: |
CLO | | —Collateralized Loan Obligation |
LIBOR | | —London Interbank Offered Rate |
LLC | | —Limited Liability Company |
LP | | —Limited Partnership |
WR | | —Withdrawn Rating |
|
|
| ADDITIONAL INVESTMENT INFORMATION |
UNFUNDED LOAN COMMITMENTS — At September 30, 2015, the Fund had unfunded loan commitments which could be extended at the option of the borrowers, pursuant to the following loan agreements:
| | | | | | | | | | |
| Borrower | | Principal
Amount | | | Current
Value | | | Unrealized
Gain (Loss) |
American Apparel (USA) LLC (CCC/Ca3), due 04/04/18 | | $ | 1,510,067 | | | $ | 1,510,067 | | | $ — |
FORWARD FOREIGN CURRENCY EXCHANGE CONTRACTS — At September 30, 2015, the Fund had the following forward foreign currency exchange contracts:
FORWARD FOREIGN CURRENCY EXCHANGE CONTRACTS WITH UNREALIZED GAIN
| | | | | | | | | | | | | | | | | | | | | | | | | | |
| Counterparty | | Currency
Purchased | | | Currency
Sold | | | Current
Value | | | Settlement
Date | | | Unrealized
Gain | |
Citibank NA | | USD | | | 13,234,865 | | | | EUR | | | | 11,745,261 | | | $ | 13,125,072 | | | | 10/05/15 | | | $ | 109,793 | |
Credit Suisse International (London) | | USD | | | 2,267,987 | | | | CHF | | | | 2,182,525 | | | | 2,239,750 | | | | 10/05/15 | | | | 28,237 | |
| TOTAL | | | | | | | | | | | | | | | | | | | | | | | | $ | 138,030 | |
FORWARD FOREIGN CURRENCY EXCHANGE CONTRACTS WITH UNREALIZED LOSS
| | | | | | | | | | | | | | | | | | | | | | | | |
| Counterparty | | Currency
Purchased | | | Currency
Sold | | Current
Value | | | Settlement
Date | | | Unrealized
Loss | |
BNP Paribas SA | | | CHF | | | | 1,437,537 | | | USD | | 1,477,721 | | $ | 1,475,230 | | | | 10/05/15 | | | $ | (2,492 | ) |
SWAP CONTRACTS — At September 30, 2015, the Fund had the following swap contracts:
CENTRALLY CLEARED INTEREST RATE SWAP CONTRACTS
| | | | | | | | | | | | | | | | | | |
| | | | | | Rates Exchanged | | Market Value | |
Notional
Amount
(000s)(a) | | | Termination
Date | | Payments
Received | | | Payments
Made | | Upfront
Payments
Made (Received) | | | Unrealized
Gain (Loss) | |
| $ | 35,100 | | | 12/16/20 | | | 3 month LIBOR | | | 2.000% | | $ | (483,931 | ) | | $ | (407,978 | ) |
| | 34,100 | | | 12/16/22 | | | 3 month LIBOR | | | 2.250 | | | (500,327 | ) | | | (585,437 | ) |
| | TOTAL | | | | | | | | | | | $ | (984,258 | ) | | $ | (993,415 | ) |
| | (a) | | Represents forward starting interest rate swaps whose effective dates of commencement of accruals and cash flows occur subsequent to September 30, 2015. |
| | |
| The accompanying notes are an integral part of these financial statements. | | 89 |
GOLDMAN SACHS INVESTMENT GRADE CREDIT FUND
Schedule of Investments
September 30, 2015 (Unaudited)
| | | | | | | | | | | | | | |
Principal
Amount | | | Interest
Rate | | | Maturity
Date | | | Value | |
| | Corporate Obligations – 83.8% | |
| | Automotive – 2.5% | |
| Ford Motor Credit Co. LLC | |
| $ | 2,175,000 | | | | 3.984 | % | | | 06/15/16 | | | $ | 2,213,641 | |
| | 4,325,000 | | | | 5.875 | | | | 08/02/21 | | | | 4,880,794 | |
| General Motors Co. | |
| | 3,700,000 | | | | 3.500 | | | | 10/02/18 | | | | 3,755,838 | |
| | | | | | | | | | | | | | |
| | | | | | | | | | | | | 10,850,273 | |
| | |
| | Banks – 16.6% | |
| American Express Co.(a)(b) | |
| | 3,055,000 | | | | 6.800 | | | | 09/01/66 | | | | 3,085,550 | |
| Bank of America Corp. | |
| | 3,750,000 | | | | 5.000 | | | | 05/13/21 | | | | 4,123,540 | |
| | 8,300,000 | | | | 4.000 | | | | 04/01/24 | | | | 8,565,797 | |
| Barclays Bank PLC | |
| | 3,575,000 | | | | 2.500 | | | | 02/20/19 | | | | 3,636,047 | |
| Citigroup, Inc. | |
| | 1,350,000 | | | | 4.450 | | | | 09/29/27 | | | | 1,346,263 | |
| Compass Bank(a) | |
| | 1,025,000 | | | | 2.750 | | | | 09/29/19 | | | | 1,020,165 | |
| Credit Suisse AG(c) | |
| | 2,500,000 | | | | 6.500 | | | | 08/08/23 | | | | 2,690,625 | |
| Discover Financial Services(a) | |
| | 2,400,000 | | | | 3.750 | | | | 03/04/25 | | | | 2,314,770 | |
| HSBC Holdings PLC(a)(b) | |
| | 600,000 | | | | 6.375 | | | | 03/30/49 | | | | 572,250 | |
| | 1,275,000 | | | | 6.375 | | | | 09/17/49 | | | | 1,219,219 | |
| ING Bank NV(a)(b) | |
| | 3,675,000 | | | | 4.125 | | | | 11/21/23 | | | | 3,761,535 | |
| Intesa Sanpaolo SPA | |
| | 1,600,000 | | | | 3.125 | | | | 01/15/16 | | | | 1,608,651 | |
| | 4,075,000 | | | | 3.875 | | | | 01/16/18 | | | | 4,201,600 | |
| | 3,400,000 | | | | 5.017 | (c) | | | 06/26/24 | | | | 3,354,273 | |
| JPMorgan Chase & Co. | |
| | 3,700,000 | | | | 3.875 | | | | 09/10/24 | | | | 3,649,011 | |
| | 2,175,000 | | | | 5.300 | (a)(b) | | | 05/01/49 | | | | 2,136,937 | |
| KBC Bank NV(a)(b) | |
| | 2,000,000 | | | | 8.000 | | | | 01/25/23 | | | | 2,185,300 | |
| LBG Capital No.1 PLC(a)(b)(c) | |
| | 1,250,000 | | | | 8.000 | | | | 06/15/49 | | | | 1,412,500 | |
| Morgan Stanley, Inc. | |
| | 5,125,000 | | | | 4.000 | | | | 07/23/25 | | | | 5,237,577 | |
| Nationwide Building Society(c) | |
| | 1,600,000 | | | | 3.900 | | | | 07/21/25 | | | | 1,636,110 | |
| PNC Preferred Funding Trust II(a)(b)(c) | |
| | 3,800,000 | | | | 1.560 | | | | 03/29/49 | | | | 3,510,250 | |
| Royal Bank of Scotland Group PLC | |
| | 1,875,000 | | | | 5.125 | | | | 05/28/24 | | | | 1,891,217 | |
| Royal Bank of Scotland PLC(a)(b) | |
| | 1,150,000 | | | | 9.500 | | | | 03/16/22 | | | | 1,253,500 | |
| Santander Holdings USA, Inc.(a) | |
| | 975,000 | | | | 3.450 | | | | 08/27/18 | | | | 998,187 | |
| Santander UK Group Holdings PLC(c) | |
| | 1,100,000 | | | | 4.750 | | | | 09/15/25 | | | | 1,087,133 | |
| The Bank of Nova Scotia(c) | |
| | 300,000 | | | | 1.650 | | | | 10/29/15 | | | | 300,238 | |
| UBS Group Funding Jersey Ltd.(c) | |
| | 1,850,000 | | | | 4.125 | | | | 09/24/25 | | | | 1,841,109 | |
| | |
Principal
Amount | | | Interest
Rate | | | Maturity
Date | | | Value | |
| | Corporate Obligations – (continued) | |
| | Banks – (continued) | |
| Wells Fargo & Co.(a)(b) | |
| $ | 3,625,000 | | | | 5.900 | % | | | 06/15/49 | | | $ | 3,625,000 | |
| | | | | | | | | | | | | | |
| | | | | | | | | | | | | 72,264,354 | |
| | |
| | Brokerage – 1.5% | |
| KKR Group Finance Co. LLC(c) | |
| | 1,850,000 | | | | 6.375 | | | | 09/29/20 | | | | 2,170,594 | |
| Morgan Stanley, Inc. | |
| | 4,425,000 | | | | 3.700 | | | | 10/23/24 | | | | 4,472,524 | |
| | | | | | | | | | | | | | |
| | | | | | | | | | | | | 6,643,118 | |
| | |
| | Chemicals – 1.8% | |
| Albemarle Corp.(a) | |
| | 900,000 | | | | 3.000 | | | | 12/01/19 | | | | 899,074 | |
| Ecolab, Inc. | |
| | 1,667,000 | | | | 5.500 | | | | 12/08/41 | | | | 1,857,990 | |
| Incitec Pivot Ltd.(c) | |
| | 3,700,000 | | | | 4.000 | | | | 12/07/15 | | | | 3,716,938 | |
| Monsanto Co.(a) | |
| | 1,675,000 | | | | 4.700 | | | | 07/15/64 | | | | 1,392,489 | |
| | | | | | | | | | | | | | |
| | | | | | | | | | | | | 7,866,491 | |
| | |
| | Consumer Cyclical Services(a) – 0.7% | |
| The Priceline Group, Inc. | |
| | 3,275,000 | | | | 3.650 | | | | 03/15/25 | | | | 3,259,935 | |
| | |
| | Distributor(c) – 0.3% | |
| Southern Star Central Gas Pipeline, Inc. | |
| | 1,100,000 | | | | 6.000 | | | | 06/01/16 | | | | 1,129,170 | |
| | |
| | Electric – 4.2% | |
| Exelon Corp.(a) | |
| | 1,550,000 | | | | 2.850 | | | | 06/15/20 | | | | 1,558,285 | |
| Florida Power & Light Co.(a) | |
| | 2,600,000 | | | | 5.250 | | | | 02/01/41 | | | | 3,039,920 | |
| Kentucky Utilities Co.(a) | |
| | 1,700,000 | | | | 5.125 | | | | 11/01/40 | | | | 1,916,750 | |
| PPL WEM Holdings PLC(a)(c) | |
| | 1,750,000 | | | | 5.375 | | | | 05/01/21 | | | | 1,947,337 | |
| Progress Energy, Inc. | |
| | 1,000,000 | | | | 7.000 | | | | 10/30/31 | | | | 1,259,844 | |
| Public Service Electric & Gas Co.(a) | |
| | 2,525,000 | | | | 3.950 | | | | 05/01/42 | | | | 2,459,260 | |
| Puget Sound Energy, Inc.(a)(b) | |
| | 2,000,000 | | | | 6.974 | | | | 06/01/67 | | | | 1,707,500 | |
| Ruwais Power Co. PJSC(c) | |
| | 670,000 | | | | 6.000 | | | | 08/31/36 | | | | 747,050 | |
| Southern California Edison Co.(a) | |
| | 1,550,000 | | | | 4.050 | | | | 03/15/42 | | | | 1,525,045 | |
| Virginia Electric and Power Co.(a) | |
| | 2,030,000 | | | | 4.000 | | | | 01/15/43 | | | | 1,979,872 | |
| | | | | | | | | | | | | | |
| | | | | | | | | | | | | 18,140,863 | |
| | |
| | Energy – 6.4% | |
| Anadarko Petroleum Corp. | |
| | 3,125,000 | | | | 8.700 | | | | 03/15/19 | | | | 3,685,679 | |
| | 1,840,000 | | | | 3.450 | (a)(d) | | | 07/15/24 | | | | 1,770,834 | |
| | |
| | |
| 90 | | The accompanying notes are an integral part of these financial statements. |
GOLDMAN SACHS INVESTMENT GRADE CREDIT FUND
| | | | | | | | | | | | | | |
Principal
Amount | | | Interest
Rate | | | Maturity
Date | | | Value | |
| | Corporate Obligations – (continued) | |
| | Energy – (continued) | |
| Apache Corp.(a) | |
| $ | 675,000 | | | | 5.100 | % | | | 09/01/40 | | | $ | 635,810 | |
| | 1,395,000 | | | | 4.250 | | | | 01/15/44 | | | | 1,184,759 | |
| Canadian Natural Resources Ltd.(a) | |
| | 1,740,000 | | | | 3.450 | | | | 11/15/21 | | | | 1,672,332 | |
| | 750,000 | | | | 3.900 | | | | 02/01/25 | | | | 689,642 | |
| Cimarex Energy Co.(a) | |
| | 1,125,000 | | | | 4.375 | | | | 06/01/24 | | | | 1,094,063 | |
| ConocoPhillips Co.(a) | |
| | 2,410,000 | | | | 3.350 | | | | 11/15/24 | | | | 2,356,083 | |
| | 1,375,000 | | | | 4.150 | | | | 11/15/34 | | | | 1,299,856 | |
| Continental Resources, Inc.(a) | |
| | 435,000 | | | | 4.500 | | | | 04/15/23 | | | | 374,412 | |
| | 575,000 | | | | 3.800 | | | | 06/01/24 | | | | 468,979 | |
| Corp Financiera de Desarrollo SA(c) | |
| | 360,000 | | | | 4.750 | | | | 02/08/22 | | | | 364,500 | |
| Devon Energy Corp.(a) | |
| | 2,345,000 | | | | 3.250 | | | | 05/15/22 | | | | 2,242,168 | |
| | 700,000 | | | | 4.750 | | | | 05/15/42 | | | | 617,973 | |
| Dolphin Energy Ltd.(c) | |
| | 141,831 | | | | 5.888 | | | | 06/15/19 | | | | 151,936 | |
| Ensco PLC(a) | |
| | 450,000 | | | | 5.200 | | | | 03/15/25 | | | | 342,869 | |
| Marathon Oil Corp.(a) | |
| | 2,400,000 | | | | 2.700 | | | | 06/01/20 | | | | 2,265,784 | |
| Noble Energy, Inc.(a) | |
| | 1,325,000 | | | | 4.150 | | | | 12/15/21 | | | | 1,326,663 | |
| Suncor Energy, Inc.(a) | |
| | 2,875,000 | | | | 3.600 | | | | 12/01/24 | | | | 2,824,165 | |
| Valero Energy Corp. | |
| | 2,300,000 | | | | 3.650 | | | | 03/15/25 | | | | 2,209,025 | |
| Weatherford International Ltd. | |
| | 135,000 | | | | 9.625 | | | | 03/01/19 | | | | 143,100 | |
| | | | | | | | | | | | | | |
| | | | | | | | | | | | | 27,720,632 | |
| | |
| | Food & Beverage – 4.0% | |
| Beam Suntory, Inc.(a) | |
| | 3,400,000 | | | | 3.250 | | | | 05/15/22 | | | | 3,338,203 | |
| Kraft Heinz Foods Co.(a)(c) | |
| | 3,300,000 | | | | 3.500 | | | | 07/15/22 | | | | 3,367,308 | |
| Pernod-Ricard SA(c) | |
| | 2,300,000 | | | | 4.450 | | | | 01/15/22 | | | | 2,415,970 | |
| SABMiller Holdings, Inc.(c) | |
| | 925,000 | | | | 4.950 | | | | 01/15/42 | | | | 941,518 | |
| Sysco, Corp.(a) | |
| | 1,650,000 | | | | 3.750 | | | | 10/01/25 | | | | 1,662,367 | |
| The J.M. Smucker Co.(c) | |
| | 2,750,000 | | | | 3.000 | | | | 03/15/22 | | | | 2,741,023 | |
| WM Wrigley Jr Co.(a)(c) | |
| | 2,650,000 | | | | 3.375 | | | | 10/21/20 | | | | 2,760,081 | |
| | | | | | | | | | | | | | |
| | | | | | | | | | | | | 17,226,470 | |
| | |
| | Health Care – 1.9% | |
| AmerisourceBergen Corp.(a) | |
| | 2,975,000 | | | | 3.250 | | | | 03/01/25 | | | | 2,890,070 | |
| Medtronic, Inc. | |
| | 2,450,000 | | | | 3.150 | | | | 03/15/22 | | | | 2,484,943 | |
| | |
Principal
Amount | | | Interest
Rate | | | Maturity
Date | | | Value | |
| | Corporate Obligations – (continued) | |
| | Health Care – (continued) | |
| UnitedHealth Group, Inc. | |
| $ | 1,125,000 | | | | 4.625 | % | | | 07/15/35 | | | $ | 1,191,619 | |
| | 1,475,000 | | | | 4.750 | | | | 07/15/45 | | | | 1,557,189 | |
| | | | | | | | | | | | | | |
| | | | | | | | | | | | | 8,123,821 | |
| | |
| | Home Construction – 0.6% | |
| MDC Holdings, Inc. | |
| | 2,275,000 | | | | 5.625 | | | | 02/01/20 | | | | 2,386,323 | |
| | 475,000 | | | | 6.000 | (a) | | | 01/15/43 | | | | 384,178 | |
| | | | | | | | | | | | | | |
| | | | | | | | | | | | | 2,770,501 | |
| | |
| | Life Insurance – 2.4% | |
| AIA Group Ltd.(a)(c) | |
| | 3,025,000 | | | | 3.200 | | | | 03/11/25 | | | | 2,903,271 | |
| Genworth Financial, Inc. | |
| | 1,000,000 | | | | 8.625 | | | | 12/15/16 | | | | 1,048,830 | |
| Prudential Financial, Inc.(a)(b) | |
| | 1,550,000 | | | | 5.375 | | | | 05/15/45 | | | | 1,542,250 | |
| Reliance Standard Life Global Funding II(c) | |
| | 2,350,000 | | | | 2.500 | | | | 01/15/20 | | | | 2,353,586 | |
| Teachers Insurance & Annuity Association of America(c) | |
| | 2,440,000 | | | | 4.900 | | | | 09/15/44 | | | | 2,510,021 | |
| | | | | | | | | | | | | | |
| | | | | | | | | | | | | 10,357,958 | |
| | |
| | Lodging – 0.4% | |
| Marriott International, Inc. | |
| | 1,600,000 | | | | 2.875 | | | | 03/01/21 | | | | 1,610,240 | |
| | |
| | Media – Cable – 2.6% | |
| CCO Safari II LLC(a)(c) | |
| | 700,000 | | | | 4.464 | | | | 07/23/22 | | | | 699,111 | |
| | 2,325,000 | | | | 4.908 | | | | 07/23/25 | | | | 2,311,956 | |
| Comcast Corp. | |
| | 1,375,000 | | | | 4.250 | | | | 01/15/33 | | | | 1,364,649 | |
| | 2,075,000 | | | | 6.450 | | | | 03/15/37 | | | | 2,587,794 | |
| DIRECTV Holdings LLC/DIRECTV Financing Co., Inc.(a) | |
| | 2,025,000 | | | | 3.950 | | | | 01/15/25 | | | | 1,983,232 | |
| | 300,000 | | | | 6.000 | | | | 08/15/40 | | | | 315,450 | |
| Time Warner Cable, Inc. | |
| | 890,000 | | | | 6.750 | | | | 07/01/18 | | | | 988,096 | |
| | 275,000 | | | | 5.000 | | | | 02/01/20 | | | | 294,572 | |
| | 500,000 | | | | 5.875 | (a) | | | 11/15/40 | | | | 468,500 | |
| | 300,000 | | | | 5.500 | (a) | | | 09/01/41 | | | | 270,210 | |
| | | | | | | | | | | | | | |
| | | | | | | | | | | | | 11,283,570 | �� |
| | |
| | Media – Non Cable – 0.9% | |
| 21st Century Fox America, Inc. | |
| | 2,200,000 | | | | 6.150 | | | | 02/15/41 | | | | 2,515,920 | |
| | 675,000 | | | | 5.400 | | | | 10/01/43 | | | | 712,193 | |
| Time Warner, Inc.(a) | |
| | 550,000 | | | | 4.850 | | | | 07/15/45 | | | | 537,059 | |
| | | | | | | | | | | | | | |
| | | | | | | | | | | | | 3,765,172 | |
| | |
| | Metals & Mining – 1.2% | |
| Freeport-McMoRan, Inc. | |
| | 425,000 | | | | 4.000 | | | | 11/14/21 | | | | 327,250 | |
| | 2,300,000 | | | | 3.550 | (a) | | | 03/01/22 | | | | 1,719,250 | |
| | |
| | |
| The accompanying notes are an integral part of these financial statements. | | 91 |
GOLDMAN SACHS INVESTMENT GRADE CREDIT FUND
Schedule of Investments (continued)
September 30, 2015 (Unaudited)
| | | | | | | | | | | | | | |
Principal
Amount | | | Interest
Rate | | | Maturity
Date | | | Value | |
| | Corporate Obligations – (continued) | |
| | Metals & Mining – (continued) | |
| Glencore Funding LLC(c) | |
| $ | 1,550,000 | | | | 1.700 | % | | | 05/27/16 | | | $ | 1,472,500 | |
| | 1,975,000 | | | | 2.500 | | | | 01/15/19 | | | | 1,683,687 | |
| | | | | | | | | | | | | | |
| | | | | | | | | | | | | 5,202,687 | |
| | |
| | Noncaptive – Financial – 3.4% | |
| Air Lease Corp. | |
| | 800,000 | | | | 4.500 | | | | 01/15/16 | | | | 804,000 | |
| | 1,100,000 | | | | 5.625 | | | | 04/01/17 | | | | 1,149,525 | |
| GE Capital Trust I(a)(b) | |
| | 3,280,000 | | | | 6.375 | | | | 11/15/67 | | | | 3,550,600 | |
| General Electric Capital Corp. | |
| | 725,000 | | | | 6.150 | | | | 08/07/37 | | | | 940,377 | |
| | 1,025,000 | | | | 5.875 | | | | 01/14/38 | | | | 1,292,248 | |
| | 975,000 | | | | 6.375 | (a)(b) | | | 11/15/67 | | | | 1,055,437 | |
| International Lease Finance Corp. | |
| | 3,225,000 | | | | 5.750 | | | | 05/15/16 | | | | 3,281,437 | |
| | 2,500,000 | | | | 7.125 | (c) | | | 09/01/18 | | | | 2,746,750 | |
| | | | | | | | | | | | | | |
| | | | | | | | | | | | | 14,820,374 | |
| | |
| | Pharmaceuticals – 3.5% | |
| AbbVie, Inc.(a) | |
| | 3,475,000 | | | | 2.500 | | | | 05/14/20 | | | | 3,456,043 | |
| | 975,000 | | | | 3.200 | | | | 11/06/22 | | | | 970,327 | |
| Actavis Funding SCS(a) | |
| | 1,150,000 | | | | 3.450 | | | | 03/15/22 | | | | 1,134,523 | |
| | 1,400,000 | | | | 4.850 | | | | 06/15/44 | | | | 1,278,354 | |
| Actavis, Inc.(a) | |
| | 1,200,000 | | | | 4.625 | | | | 10/01/42 | | | | 1,103,461 | |
| EMD Finance LLC(a)(c) | |
| | 3,475,000 | | | | 2.950 | | | | 03/19/22 | | | | 3,433,648 | |
| Forest Laboratories, Inc.(c) | |
| | 2,075,000 | | | | 4.375 | | | | 02/01/19 | | | | 2,196,215 | |
| | 1,550,000 | | | | 5.000 | (a) | | | 12/15/21 | | | | 1,681,412 | |
| | | | | | | | | | | | | | |
| | | | | | | | | | | | | 15,253,983 | |
| | |
| | Pipelines – 4.8% | |
| Columbia Pipeline Group, Inc.(a)(c) | |
| | 1,175,000 | | | | 3.300 | | | | 06/01/20 | | | | 1,173,657 | |
| Enbridge, Inc.(a) | |
| | 1,000,000 | | | | 3.500 | | | | 06/10/24 | | | | 888,300 | |
| Energy Transfer Partners LP(a) | |
| | 1,065,000 | | | | 5.200 | | | | 02/01/22 | | | | 1,066,056 | |
| Enterprise Products Operating LLC(a)(b) | |
| | 3,725,000 | | | | 8.375 | | | | 08/01/66 | | | | 3,664,469 | |
| | 1,765,000 | | | | 7.000 | | | | 06/01/67 | | | | 1,606,150 | |
| Kinder Morgan, Inc.(a) | |
| | 1,200,000 | | | | 5.050 | | | | 02/15/46 | | | | 917,710 | |
| Tennessee Gas Pipeline Co. | |
| | 1,825,000 | | | | 8.375 | | | | 06/15/32 | | | | 1,904,028 | |
| The Williams Cos., Inc.(a) | |
| | 1,825,000 | | | | 4.550 | | | | 06/24/24 | | | | 1,441,801 | |
| TransCanada PipeLines Ltd.(a)(b) | |
| | 3,875,000 | | | | 6.350 | | | | 05/15/67 | | | | 3,255,000 | |
| Western Gas Partners LP(a) | |
| | 2,450,000 | | | | 5.450 | | | | 04/01/44 | | | | 2,202,106 | |
| | |
Principal
Amount | | | Interest
Rate | | | Maturity
Date | | | Value | |
| | Corporate Obligations – (continued) | |
| | Pipelines – (continued) | |
| Williams Partners LP(a) | |
| $ | 3,000,000 | | | | 3.600 | % | | | 03/15/22 | | | $ | 2,754,125 | |
| | | | | | | | | | | | | | |
| | | | | | | | | | | | | 20,873,402 | |
| | |
| | Property/Casualty Insurance – 1.5% | |
| American International Group, Inc.(a) | |
| | 2,100,000 | | | | 3.750 | | | | 07/10/25 | | | | 2,131,960 | |
| | 975,000 | | | | 4.500 | | | | 07/16/44 | | | | 951,593 | |
| Arch Capital Group Ltd. | |
| | 1,245,000 | | | | 7.350 | | | | 05/01/34 | | | | 1,590,727 | |
| The Chubb Corp.(a)(b) | |
| | 1,943,000 | | | | 6.375 | | | | 03/29/67 | | | | 1,923,570 | |
| | | | | | | | | | | | | | |
| | | | | | | | | | | | | 6,597,850 | |
| | |
| | Real Estate Investment Trusts – 6.8% | |
| American Campus Communities Operating Partnership LP(a) | |
| | 3,200,000 | | | | 4.125 | | | | 07/01/24 | | | | 3,215,040 | |
| ARC Properties Operating Partnership LP | |
| | 5,075,000 | | | | 2.000 | | | | 02/06/17 | | | | 4,977,996 | |
| Camden Property Trust | |
| | 2,575,000 | | | | 5.700 | | | | 05/15/17 | | | | 2,741,525 | |
| CubeSmart LP(a) | |
| | 1,625,000 | | | | 4.800 | | | | 07/15/22 | | | | 1,761,338 | |
| Developers Diversified Realty Corp. | |
| | 590,000 | | | | 9.625 | | | | 03/15/16 | | | | 610,842 | |
| | 3,750,000 | | | | 7.500 | | | | 04/01/17 | | | | 4,056,389 | |
| HCP, Inc.(a) | |
| | 2,475,000 | | | | 2.625 | | | | 02/01/20 | | | | 2,459,808 | |
| Kilroy Realty LP | |
| | 1,125,000 | | | | 6.625 | | | | 06/01/20 | | | | 1,302,300 | |
| Select Income REIT(a) | |
| | 650,000 | | | | 2.850 | | | | 02/01/18 | | | | 653,250 | |
| | 1,125,000 | | | | 3.600 | | | | 02/01/20 | | | | 1,146,038 | |
| | 1,625,000 | | | | 4.150 | | | | 02/01/22 | | | | 1,602,413 | |
| Trust F/1401(c) | |
| | 230,000 | | | | 5.250 | | | | 12/15/24 | | | | 238,050 | |
| UDR, Inc. | |
| | 1,900,000 | | | | 4.250 | | | | 06/01/18 | | | | 2,006,830 | |
| WEA Finance LLC/Westfield UK & Europe Finance PLC(a)(c) | |
| | 2,150,000 | | | | 2.700 | | | | 09/17/19 | | | | 2,139,830 | |
| Welltower, Inc.(a) | |
| | 775,000 | | | | 4.125 | | | | 04/01/19 | | | | 818,425 | |
| | | | | | | | | | | | | | |
| | | | | | | | | | | | | 29,730,074 | |
| | |
| | Retailers(a) – 2.3% | |
| Amazon.com, Inc. | |
| | 2,325,000 | | | | 3.300 | | | | 12/05/21 | | | | 2,399,850 | |
| CVS Health Corp. | |
| | 4,150,000 | | | | 2.800 | | | | 07/20/20 | | | | 4,215,098 | |
| | 1,925,000 | | | | 3.875 | | | | 07/20/25 | | | | 1,981,581 | |
| | 1,075,000 | | | | 5.750 | | | | 05/15/41 | | | | 1,226,195 | |
| | | | | | | | | | | | | | |
| | | | | | | | | | | | | 9,822,724 | |
| | |
| | Technology – Hardware – 1.9% | |
| Hewlett-Packard Co. | |
| | 4,400,000 | | | | 2.600 | | | | 09/15/17 | | | | 4,531,941 | |
| Intel Corp.(a) | |
| | 2,225,000 | | | | 4.900 | | | | 07/29/45 | | | | 2,309,132 | |
| | |
| | |
| 92 | | The accompanying notes are an integral part of these financial statements. |
GOLDMAN SACHS INVESTMENT GRADE CREDIT FUND
| | | | | | | | | | | | | | |
Principal
Amount | | | Interest
Rate | | | Maturity
Date | | | Value | |
| | Corporate Obligations – (continued) | |
| | Technology – Hardware – (continued) | |
| Oracle Corp.(a) | |
| $ | 800,000 | | | | 4.300 | % | | | 07/08/34 | | | $ | 796,713 | |
| QUALCOMM, Inc. | |
| | 600,000 | | | | 3.000 | | | | 05/20/22 | | | | 588,540 | |
| | | | | | | | | | | | | | |
| | | | | | | | | | | | | 8,226,326 | |
| | |
| | Technology – Software/Services – 1.8% | |
| Apple, Inc. | |
| | 4,300,000 | | | | 3.850 | | | | 05/04/43 | | | | 3,903,813 | |
| Automatic Data Processing, Inc. | |
| | 650,000 | | | | 3.375 | | | | 09/15/25 | | | | 661,609 | |
| Fiserv, Inc.(a) | |
| | 3,100,000 | | | | 2.700 | | | | 06/01/20 | | | | 3,123,195 | |
| | | | | | | | | | | | | | |
| | | | | | | | | | | | | 7,688,617 | |
| | |
| | Tobacco – 3.4% | |
| Altria Group, Inc. | |
| | 1,650,000 | | | | 2.850 | | | | 08/09/22 | | | | 1,610,679 | |
| BAT International Finance PLC(c) | |
| | 3,300,000 | | | | 2.750 | | | | 06/15/20 | | | | 3,363,439 | |
| | 2,950,000 | | | | 3.950 | | | | 06/15/25 | | | | 3,068,272 | |
| Reynolds American, Inc. | |
| | 1,600,000 | | | | 3.250 | | | | 06/12/20 | | | | 1,643,822 | |
| | 3,725,000 | | | | 4.450 | (a) | | | 06/12/25 | | | | 3,903,551 | |
| | 950,000 | | | | 5.850 | (a) | | | 08/15/45 | | | | 1,057,537 | |
| | | | | | | | | | | | | | |
| | | | | | | | | | | | | 14,647,300 | |
| | |
| | Trucking & Leasing(c) – 1.3% | |
| ERAC USA Finance LLC | |
| | 1,525,000 | | | | 5.625 | | | | 03/15/42 | | | | 1,635,366 | |
| Penske Truck Leasing Co. LP/PTL Finance Corp. | |
| | 3,400,000 | | | | 3.375 | (a) | | | 02/01/22 | | | | 3,322,966 | |
| | 650,000 | | | | 4.875 | | | | 07/11/22 | | | | 690,722 | |
| | | | | | | | | | | | | | |
| | | | | | | | | | | | | 5,649,054 | |
| | |
| | Wirelines Telecommunications – 5.1% | |
| AT&T, Inc.(a) | |
| | 3,775,000 | | | | 2.450 | | | | 06/30/20 | | | | 3,717,159 | |
| Telefonica Emisiones SAU | |
| | 625,000 | | | | 6.221 | | | | 07/03/17 | | | | 670,301 | |
| | 1,750,000 | | | | 3.192 | | | | 04/27/18 | | | | 1,792,240 | |
| Verizon Communications, Inc. | |
| | 5,425,000 | | | | 4.500 | | | | 09/15/20 | | | | 5,868,273 | |
| | 2,000,000 | | | | 5.150 | | | | 09/15/23 | | | | 2,206,934 | |
| | 3,420,000 | | | | 4.150 | (a) | | | 03/15/24 | | | | 3,523,229 | |
| | 675,000 | | | | 3.500 | (a) | | | 11/01/24 | | | | 664,136 | |
| | 1,423,000 | | | | 4.862 | | | | 08/21/46 | | | | 1,330,379 | |
| | 2,685,000 | | | | 4.522 | | | | 09/15/48 | | | | 2,352,901 | |
| | | | | | | | | | | | | | |
| | | | | | | | | | | | | 22,125,552 | |
| | |
| | TOTAL CORPORATE OBLIGATIONS | | | | | |
| | (Cost $368,064,560) | | | $ | 363,650,511 | |
| | |
| | | | | | | | | | | | | | |
Principal
Amount | | | Interest
Rate | | | Maturity
Date | | | Value | |
| | Mortgage-Backed Obligations(b) – 2.2% | |
| | Commercial Mortgage-Backed Securities – 2.2% | |
| | Sequential Floating Rate – 2.2% | |
| GS Mortgage Securities Trust Series 2007-GG10, Class A4 | |
| $ | 8,969,346 | | | | 5.988 | % | | | 08/10/45 | | | $ | 9,470,085 | |
| | (Cost $9,988,208) | |
| | |
| | | | | | | | | | | | | | |
| | Agency Debenture(d) – 0.1% | |
| FHLB | |
| $ | 600,000 | | | | 3.000 | % | | | 09/10/21 | | | $ | 642,069 | |
| | (Cost $610,919) | | | | | | | | | | | | | |
| | |
| | | | | | | | | | | | | | |
| | Foreign Debt Obligations – 4.3% | |
| | Sovereign – 4.3% | |
| Federal Republic of Brazil | |
| $ | 395,000 | | | | 7.125 | % | | | 01/20/37 | | | $ | 370,313 | |
| Republic of Chile | |
| | 935,000 | | | | 3.625 | | | | 10/30/42 | | | | 801,762 | |
| Republic of Colombia | |
| | 3,851,000 | | | | 4.000 | | | | 02/26/24 | | | | 3,731,619 | |
| | 522,000 | | | | 6.125 | | | | 01/18/41 | | | | 516,780 | |
| Republic of Indonesia | |
| | 387,000 | | | | 5.875 | | | | 01/15/24 | | | | 409,253 | |
| | 1,180,000 | | | | 4.125 | | | | 01/15/25 | | | | 1,112,150 | |
| Republic of Panama(e) | |
| | 820,000 | | | | 9.375 | | | | 04/01/29 | | | | 1,179,775 | |
| Republic of Peru | |
| | 570,000 | | | | 6.550 | | | | 03/14/37 | | | | 661,200 | |
| Republic of Turkey | |
| | 2,040,000 | | | | 6.250 | | | | 09/26/22 | | | | 2,180,760 | |
| | 1,550,000 | | | | 5.750 | | | | 03/22/24 | | | | 1,606,575 | |
| | 180,000 | | | | 7.375 | | | | 02/05/25 | | | | 205,920 | |
| Republic of Uruguay | |
| | 311,876 | | | | 5.100 | | | | 06/18/50 | | | | 270,552 | |
| United Mexican States | |
| | 1,810,000 | | | | 6.050 | | | | 01/11/40 | | | | 1,981,950 | |
| | 980,000 | | | | 4.750 | | | | 03/08/44 | | | | 894,250 | |
| | 1,335,000 | | | | 5.550 | | | | 01/21/45 | | | | 1,368,375 | |
| | 1,706,000 | | | | 4.600 | | | | 01/23/46 | | | | 1,518,340 | |
| | |
| | TOTAL FOREIGN DEBT OBLIGATIONS | |
| | (Cost $19,360,112) | | | $ | 18,809,574 | |
| | |
| | |
| | Municipal Debt Obligations – 3.6% | |
| | California – 2.2% | |
| California State GO Bonds Build America Taxable Series 2009 | |
| $ | 1,450,000 | | | | 7.500 | % | | | 04/01/34 | | | $ | 2,031,580 | |
| | 455,000 | | | | 7.300 | | | | 10/01/39 | | | | 630,407 | |
| California State GO Bonds Build America Taxable Series 2010 | |
| | 2,320,000 | | | | 7.625 | | | | 03/01/40 | | | | 3,328,922 | |
| California State University RB Build America Bonds Series 2010 | |
| | 2,825,000 | | | | 6.484 | | | | 11/01/41 | | | | 3,533,708 | |
| | | | | | | | | | | | | | |
| | | | | | | | | | | | | 9,524,617 | |
| | |
| | |
| The accompanying notes are an integral part of these financial statements. | | 93 |
GOLDMAN SACHS INVESTMENT GRADE CREDIT FUND
Schedule of Investments (continued)
September 30, 2015 (Unaudited)
| | | | | | | | | | | | | | |
Principal
Amount | | | Interest
Rate | | | Maturity
Date | | | Value | |
| | Municipal Debt Obligations – (continued) | |
| | Illinois – 1.3% | |
| Chicago Illinois Metropolitan Water Reclamation District GO
Bonds Build America Taxable Direct Payment Series 2009 |
|
| $ | 1,775,000 | | | | 5.720 | % | | | 12/01/38 | | | $ | 2,138,893 | |
| Illinois State GO Bonds Build America Series 2010 | |
| | 3,225,000 | | | | 6.630 | | | | 02/01/35 | | | | 3,334,682 | |
| | | | | | | | | | | | | | |
| | | | | | | | | | | | | 5,473,575 | |
| | |
| | New Jersey – 0.1% | |
| New Jersey State Turnpike Authority RB Build America Bonds
Taxable Series 2009 F |
|
| | 350,000 | | | | 7.414 | | | | 01/01/40 | | | | 486,738 | |
| | |
| | TOTAL MUNICIPAL DEBT OBLIGATIONS | |
| | (Cost $12,543,705) | | | $ | 15,484,930 | |
| | |
| | | | | | | | | | | | | | |
| | U.S. Treasury Obligations – 2.5% | |
| United States Treasury Bond | |
| $ | 1,600,000 | | | | 2.875 | % | | | 08/15/45 | | | $ | 1,599,008 | |
| United States Treasury Notes | |
| | 2,900,000 | | | | 1.625 | | | | 06/30/20 | | | | 2,936,888 | |
| | 1,500,000 | | | | 1.750 | | | | 02/28/22 | | | | 1,505,355 | |
| | 1,000,000 | | | | 1.875 | | | | 05/31/22 | | | | 1,009,620 | |
| | 700,000 | | | | 2.000 | | | | 07/31/22 | | | | 712,152 | |
| | 3,200,000 | | | | 1.750 | | | | 09/30/22 | | | | 3,198,752 | |
| | |
| | TOTAL U.S. TREASURY OBLIGATIONS | |
| | (Cost $10,889,343) | | | $ | 10,961,775 | |
| | |
| | | | | | | | |
| Shares | | Rate | | | Value | |
| Preferred Stock(b) – 0.4% | |
| Banks – 0.4% | |
CoBank ACB | |
| 17,603 | | | 6.200 | % | | $ | 1,760,300 | |
| (Cost $1,760,300) | | | | | |
| |
| | | | | | | | | | | | |
| Shares | | | | | Rate | | | Value | |
| | Investment Company(f) – 0.9% | |
| | 3,747,934 | | | Goldman Sachs Financial Square Government Fund – FST Shares | | | | | | | | |
| | (Cost $3,747,934) | | | 0.006 | % | | $ | 3,747,934 | |
| | |
| | TOTAL INVESTMENTS – 97.8% | |
| | (Cost $426,965,081) | | | $ | 424,527,178 | |
| | |
| OTHER ASSETS IN EXCESS OF
LIABILITIES – 2.2% |
| | | 9,665,459 | |
| | |
| | NET ASSETS – 100.0% | | | $ | 434,192,637 | |
| | |
| | |
| The percentage shown for each investment category reflects the value of investments in that category as a percentage of net assets. |
(a) | | Security with “Call” features with resetting interest rates. Maturity dates disclosed are the final maturity dates. |
(b) | | Variable rate security. Interest rate or distribution rate disclosed is that which is in effect on September 30, 2015. |
(c) | | Exempt from registration under Rule 144A of the Securities Act of 1933. Under procedures approved by the Board of Trustees, such securities have been determined to be liquid by the investment adviser and may be resold, normally to qualified institutional buyers in transactions exempt from registration. Total market value of Rule 144A securities amounts to $77,910,122, which represents approximately 17.9% of net assets as of September 30, 2015. |
(d) | | All or a portion of security is segregated as collateral for initial margin requirements on futures transactions. |
(e) | | Security with “Put” features and resetting interest rates. Maturity dates disclosed are the puttable dates. Interest rate disclosed is that which is in effect at September 30, 2015. |
(f) | | Represents Affiliated Funds. |
| | |
|
Investment Abbreviations: |
FHLB | | —Federal Home Loan Bank |
GO | | —General Obligation |
LIBOR | | —London Interbank Offered Rate |
LLC | | —Limited Liability Company |
LP | | —Limited Partnership |
RB | | —Revenue Bond |
REIT | | —Real Estate Investment Trust |
SPA | | —Stand-by Purchase Agreement |
|
| | |
| 94 | | The accompanying notes are an integral part of these financial statements. |
GOLDMAN SACHS INVESTMENT GRADE CREDIT FUND
|
| ADDITIONAL INVESTMENT INFORMATION |
FUTURES CONTRACTS — At September 30, 2015, the Fund had the following futures contracts:
| | | | | | | | | | | | | | |
| Type | | Number of
Contracts
Long (Short) | | | Expiration Date | | Current
Value | | | Unrealized
Gain (Loss) | |
Ultra Long U.S. Treasury Bonds | | | 142 | | | December 2015 | | $ | 22,777,688 | | | $ | 144,629 | |
2 Year U.S. Treasury Notes | | | 119 | | | December 2015 | | | 26,064,719 | | | | 34,666 | |
5 Year U.S. Treasury Notes | | | 263 | | | December 2015 | | | 31,695,609 | | | | 190,794 | |
10 Year U.S. Treasury Notes | | | (51 | ) | | December 2015 | | | (6,565,453 | ) | | | (51,654 | ) |
20 Year U.S. Treasury Bonds | | | (70 | ) | | December 2015 | | | (11,014,063 | ) | | | (131,635 | ) |
| TOTAL | | | | | | | | | | | | $ | 186,800 | |
SWAP CONTRACTS — At September 30, 2015, the Fund had the following swap contracts:
CENTRALLY CLEARED INTEREST RATE SWAP CONTRACTS
| | | | | | | | | | | | | | | | | | |
| | | | | | Rates Exchanged | | Market Value | |
Notional
Amount
(000s)(a) | | | Termination
Date | | Payments
Received | | | Payments
Made | | Upfront
Payments
Made (Received) | | | Unrealized
Gain (Loss) | |
| $ | 9,800 | | | 12/16/20 | | | 3 month LIBOR | | | 2.000% | | $ | (135,505 | ) | | $ | (113,518 | ) |
| | 17,600 | | | 06/24/21 | | | 2.923% | | | 3 month LIBOR | | | (3,860 | ) | | | 231,931 | |
| | 22,050 | | | 09/02/22 | | | 2.810 | | | 3 month LIBOR | | | 45,335 | | | | 75,497 | |
| | 16,800 | | | 12/16/22 | | | 3 month LIBOR | | | 2.250 | | | (247,102 | ) | | | (287,820 | ) |
| | 2,900 | | | 12/16/25 | | | 3 month LIBOR | | | 2.500 | | | (51,868 | ) | | | (64,947 | ) |
| | 4,500 | | | 06/24/29 | | | 3 month LIBOR | | | 3.218 | | | 12,938 | | | | (209,129 | ) |
| | 5,170 | | | 09/02/30 | | | 3 month LIBOR | | | 3.005 | | | (16,410 | ) | | | (64,806 | ) |
| | TOTAL | | | | | | | | | | | $ | (396,472 | ) | | $ | (432,792 | ) |
| | (a) | | Represents forward starting interest rate swaps whose effective dates of commencement of accruals and cash flows occur subsequent to September 30, 2015. |
OVER THE COUNTER CREDIT DEFAULT SWAP CONTRACTS
| | | | | | | | | | | | | | | | | | | | | | | | | | |
| | | | | | | | | | | | | | | | | Market Value | |
| Counterparty | | Referenced
Obligation | | Notional
Amount
(000s) | | | Rates Received
(Paid) | | | Termination
Date | | | Credit
Spread at
September 30,
2015(b) | | | Upfront
Payments
Made (Received) | | | Unrealized
Gain (Loss) | |
Protection Sold: | | | | | | | | | | | | | | | | | | | | | | | | | | |
Credit Suisse International (London) | | Markit CMBX Series 7 | | $ | 300 | | | | 0.500 | % | | | 01/17/47 | | | | 106.328 | % | | $ | (11,449 | ) | | $ | (1,135 | ) |
| | (b) | | Credit spread on the Referenced Obligation, together with the term of the swap contract, are indicators of payment/performance risk. The likelihood of a credit event occurring which would require a fund to make a payment or otherwise be required to perform under the swap contract is generally greater as the credit spread and the term of the swap contract increase. |
| | |
| The accompanying notes are an integral part of these financial statements. | | 95 |
GOLDMAN SACHS LOCAL EMERGING MARKETS DEBT FUND
Schedule of Investments
September 30, 2015 (Unaudited)
| | | | | | | | | | | | | | |
Principal
Amount | | | Interest
Rate | | | Maturity
Date | | | Value | |
| | Sovereign Debt Obligations – 69.3% | |
| | Brazil – 10.2% | |
| Brazil Letras do Tesouro Nacional (BBB-/Baa3)(a) | |
| BRL | 98,977,000 | | | | 0.000 | % | | | 01/01/16 | | | $ | 24,123,946 | |
| | 57,600,000 | | | | 0.000 | | | | 07/01/17 | | | | 11,268,408 | |
| Brazil Notas do Tesouro Nacional (BBB-/Baa3) | |
| | 5,573,932 | | | | 6.000 | | | | 08/15/16 | | | | 1,396,608 | |
| | 37,256,000 | | | | 10.000 | | | | 01/01/18 | | | | 8,453,292 | |
| | 24,246,000 | | | | 10.000 | | | | 01/01/19 | | | | 5,294,318 | |
| | 88,468,000 | | | | 10.000 | | | | 01/01/23 | | | | 17,318,920 | |
| | 93,625,000 | | | | 10.000 | | | | 01/01/25 | | | | 17,634,905 | |
| | 70,049,672 | | | | 6.000 | | | | 08/15/40 | | | | 14,992,088 | |
| | | | | | | | | | | | | | |
| | | | | | | | | | | | | 100,482,485 | |
| | |
| | Chile – 0.3% | |
| Bonos del Banco Central de Chile en Pesos (NR/NR) | |
| CLP | 1,622,200,960 | | | | 3.000 | | | | 03/01/22 | | | | 2,581,982 | |
| | |
| | Colombia – 7.5% | |
| Republic of Colombia (NR/Baa2) | |
| COP | 1,851,000,000 | | | | 4.375 | | | | 03/21/23 | | | | 490,600 | |
| Republic of Colombia (BBB/Baa2) | |
| | 7,417,000,000 | | | | 12.000 | | | | 10/22/15 | | | | 2,409,164 | |
| $ | 1,850,000 | | | | 5.000 | | | | 06/15/45 | | | | 1,581,750 | |
| Republic of Colombia (BBB+/Baa2) | |
| COP | 3,238,400,000 | | | | 8.000 | | | | 10/28/15 | | | | 1,051,290 | |
| | 7,894,400,000 | | | | 7.250 | | | | 06/15/16 | | | | 2,582,077 | |
| | 3,424,300,000 | | | | 11.250 | | | | 10/24/18 | | | | 1,231,694 | |
| | 155,773,700,000 | | | | 7.000 | | | | 05/04/22 | | | | 48,679,329 | |
| | 15,715,200,000 | | | | 10.000 | | | | 07/24/24 | | | | 5,694,880 | |
| | 15,005,000,000 | | | | 7.500 | | | | 08/26/26 | | | | 4,534,148 | |
| | 100,000 | | | | 6.000 | | | | 04/28/28 | | | | 26 | |
| | 21,903,400,000 | | | | 7.750 | | | | 09/18/30 | | | | 6,399,985 | |
| | | | | | | | | | | | | | |
| | | | | | | | | | | | | 74,654,943 | |
| | |
| | Costa Rica(b) – 0.2% | |
| Republic of Costa Rica (BB/Ba1) | |
| $ | 2,430,000 | | | | 7.158 | | | | 03/12/45 | | | | 2,168,775 | |
| | |
| | Croatia – 2.0% | |
| Republic of Croatia (BB/Ba1) | |
| | 2,950,000 | | | | 6.625 | | | | 07/14/20 | | | | 3,200,750 | |
| | 2,620,000 | | | | 6.375 | | | | 03/24/21 | | | | 2,816,500 | |
| EUR | 9,980,000 | | | | 3.875 | | | | 05/30/22 | | | | 11,175,122 | |
| $ | 1,501,000 | | | | 6.000 | | | | 01/26/24 | | | | 1,583,555 | |
| EUR | 600,000 | | | | 3.000 | | | | 03/11/25 | | | | 606,748 | |
| | | | | | | | | | | | | | |
| | | | | | | | | | | | | 19,382,675 | |
| | |
| | Czech Republic(c) – 0.5% | |
| Czech Republic Government Bond (AA/NR) | |
| CZK | 128,980,000 | | | | 0.380 | | | | 10/27/16 | | | | 5,332,366 | |
| | |
| | Dominican Republic – 2.2% | |
| Dominican Republic (NR/NR) | |
| DOP | 161,600,000 | | | | 16.950 | | | | 02/04/22 | | | | 4,749,801 | |
| | 167,900,000 | | | | 11.500 | | | | 05/10/24 | | | | 3,937,516 | |
| | 199,200,000 | | | | 11.375 | | | | 07/06/29 | | | | 4,563,267 | |
| Dominican Republic (BB-/B1) | |
| $ | 3,453,807 | | | | 9.040 | | | | 01/23/18 | | | | 3,661,035 | |
| | 4,640,000 | | | | 6.850 | (b) | | | 01/27/45 | | | | 4,460,200 | |
| | | | | | | | | | | | | | |
| | | | | | | | | | | | | 21,371,819 | |
| | |
Principal
Amount | | | Interest
Rate | | | Maturity
Date | | | Value | |
| | Sovereign Debt Obligations – (continued) | |
| | Hungary – 1.2% | |
| Hungary Government Bond (BB+/Ba1) | |
| $ | 11,180,000 | | | | 4.125 | % | | | 02/19/18 | | | $ | 11,593,660 | |
| | |
| | Indonesia – 0.1% | |
| Republic of Indonesia (NR/Baa3) | |
| IDR | 9,000,000 | | | | 6.125 | | | | 05/15/28 | | | | 455 | |
| Republic of Indonesia (BB+/Baa3) | |
| $ | 230,000 | | | | 5.250 | | | | 01/17/42 | | | | 205,275 | |
| | 580,000 | | | | 4.625 | | | | 04/15/43 | | | | 484,300 | |
| | 230,000 | | | | 5.125 | | | | 01/15/45 | | | | 201,537 | |
| | | | | | | | | | | | | | |
| | | | | | | | | | | | | 891,567 | |
| | |
| | Israel(a) – 0.8% | |
| Republic of Israel (NR/NR) | |
| ILS | 30,000,000 | | | | 0.000 | | | | 12/02/15 | | | | 7,645,777 | |
| | |
| | Latvia – 0.2% | |
| Republic of Latvia (A-/A3) | |
| $ | 1,510,000 | | | | 5.250 | | | | 02/22/17 | | | | 1,592,537 | |
| | |
| | Malaysia – 1.2% | |
| Malaysia Government Bond (NR/NR) | |
| MYR | 3,210,000 | | | | 3.889 | | | | 07/31/20 | | | | 725,796 | |
| | 18,540,000 | | | | 4.048 | | | | 09/30/21 | | | | 4,173,424 | |
| Malaysia Government Bond (NR/A3) | |
| | 11,000,000 | | | | 4.160 | | | | 07/15/21 | | | | 2,494,910 | |
| | 21,130,000 | | | | 4.498 | | | | 04/15/30 | | | | 4,754,040 | |
| | | | | | | | | | | | | | |
| | | | | | | | | | | | | 12,148,170 | |
| | |
| | Mexico – 8.9% | |
| Mexican Udibonos (A/A3) | |
| MXN | 76,783,272 | | | | 4.500 | | | | 12/04/25 | | | | 5,141,546 | |
| United Mexican States (NR/A3) | |
| | 600,429,000 | | | | 4.750 | | | | 06/14/18 | | | | 35,664,379 | |
| United Mexican States (A/A3) | |
| | 199,375,800 | | | | 8.500 | | | | 12/13/18 | | | | 13,084,873 | |
| | 51,788,100 | | | | 5.000 | | | | 12/11/19 | | | | 3,050,921 | |
| | 160,000,000 | | | | 6.500 | | | | 06/10/21 | | | | 9,918,308 | |
| | 117,500,100 | | | | 6.500 | | | | 06/09/22 | | | | 7,211,894 | |
| | 161,170,900 | | | | 10.000 | | | | 12/05/24 | | | | 12,167,879 | |
| | 12,647,500 | | | | 7.750 | | | | 11/23/34 | | | | 830,468 | |
| United Mexican States (BBB+/A3) | |
| $ | 1,610,000 | | | | 4.600 | | | | 01/23/46 | | | | 1,432,900 | |
| | | | | | | | | | | | | | |
| | | | | | | | | | | | | 88,503,168 | |
| | |
| | Peru – 1.9% | |
| Republic of Peru (NR/NR) | |
| PEN | 2,168,000 | | | | 5.200 | | | | 09/12/23 | | | | 589,772 | |
| Republic of Peru (NR/A3) | |
| | 1,969,000 | | | | 6.850 | | | | 02/12/42 | | | | 533,267 | |
| Republic of Peru (A-/A3) | |
| | 37,903,000 | | | | 5.700 | (b) | | | 08/12/24 | | | | 10,524,940 | |
| | 9,882,000 | | | | 8.200 | | | | 08/12/26 | | | | 3,179,243 | |
| | 12,699,000 | | | | 6.950 | | | | 08/12/31 | | | | 3,629,907 | |
| | | | | | | | | | | | | | |
| | | | | | | | | | | | | 18,457,129 | |
| | |
| | Philippines – 0.4% | |
| Republic of Philippines (BBB/Baa2) | |
| PHP | 88,000,000 | | | | 4.950 | | | | 01/15/21 | | | | 1,916,645 | |
| | |
| | |
| 96 | | The accompanying notes are an integral part of these financial statements. |
GOLDMAN SACHS LOCAL EMERGING MARKETS DEBT FUND
| | | | | | | | | | | | | | |
Principal
Amount | | | Interest
Rate | | | Maturity
Date | | | Value | |
| | Sovereign Debt Obligations – (continued) | |
| | Philippines – (continued) | |
| Republic of Philippines (BBB/Baa2) – (continued) | |
| PHP | 41,000,000 | | | | 3.900 | % | | | 11/26/22 | | | $ | 846,491 | |
| | 67,000,000 | | | | 6.250 | | | | 01/14/36 | | | | 1,569,641 | |
| | | | | | | | | | | | | | |
| | | | | | | | | | | | | 4,332,777 | |
| | |
| | Poland – 4.9% | |
| Poland Government Bond (A/NR) | |
| PLN | 12,260,000 | | | | 0.000 | (a) | | | 07/25/16 | | | | 3,183,151 | |
| | 21,440,000 | | | | 1.500 | | | | 04/25/20 | | | | 5,435,164 | |
| Poland Government Bond (A/A2) | |
| | 128,420,000 | | | | 5.750 | | | | 09/23/22 | | | | 40,418,938 | |
| | | | | | | | | | | | | | |
| | | | | | | | | | | | | 49,037,253 | |
| | |
| | Romania – 1.5% | |
| Republic of Romania (NR/NR) | |
| RON | 51,060,000 | | | | 5.900 | | | | 07/26/17 | | | | 13,872,445 | |
| | 2,510,000 | | | | 4.750 | | | | 06/24/19 | | | | 689,037 | |
| | | | | | | | | | | | | | |
| | | | | | | | | | | | | 14,561,482 | |
| | |
| | Russia – 7.3% | |
| Russian Federation Bond (BBB-/Ba1) | |
| RUB | 601,130,000 | | | | 6.200 | | | | 01/31/18 | | | | 8,314,880 | |
| | 1,125,000,000 | | | | 7.850 | | | | 03/10/18 | | | | 16,033,446 | |
| | 206,820,000 | | | | 7.500 | | | | 03/15/18 | | | | 2,933,248 | |
| | 565,740,000 | | | | 7.500 | | | | 02/27/19 | | | | 7,809,948 | |
| | 115,870,000 | | | | 6.700 | | | | 05/15/19 | | | | 1,546,979 | |
| | 40,950,000 | | | | 7.600 | | | | 04/14/21 | | | | 540,467 | |
| | 355,410,000 | | | | 7.600 | | | | 07/20/22 | | | | 4,580,616 | |
| | 422,140,000 | | | | 7.000 | | | | 01/25/23 | | | | 5,197,821 | |
| | 882,490,000 | | | | 7.000 | | | | 08/16/23 | | | | 10,745,900 | |
| | 427,820,000 | | | | 8.150 | | | | 02/03/27 | | | | 5,465,723 | |
| | 772,010,000 | | | | 7.050 | | | | 01/19/28 | | | | 8,900,390 | |
| | | | | | | | | | | | | | |
| | | | | | | | | | | | | 72,069,418 | |
| | |
| | South Africa – 4.0% | |
| Republic of South Africa (NR/NR) | |
| ZAR | 39,730,000 | | | | 8.875 | | | | 02/28/35 | | | | 2,818,412 | |
| Republic of South Africa (NR/Baa2) | |
| | 11,430,000 | | | | 7.750 | | | | 02/28/23 | | | | 799,685 | |
| | 121,570,000 | | | | 8.000 | | | | 01/31/30 | | | | 8,168,025 | |
| | 91,230,000 | | | | 8.250 | | | | 03/31/32 | | | | 6,206,166 | |
| | 91,480,000 | | | | 8.500 | | | | 01/31/37 | | | | 6,247,097 | |
| | 76,350,000 | | | | 8.750 | | | | 01/31/44 | | | | 5,313,003 | |
| | 74,100,000 | | | | 8.750 | | | | 02/28/48 | | | | 5,160,920 | |
| Republic of South Africa (BBB+/Baa2) | |
| | 920,000 | | | | 8.000 | | | | 12/21/18 | | | | 67,081 | |
| | 62,810,000 | | | | 10.500 | | | | 12/21/26 | | | | 5,196,131 | |
| | | | | | | | | | | | | | |
| | | | | | | | | | | | | 39,976,520 | |
| | |
| | Thailand – 5.8% | |
| Thailand Government Bond (NR/Baa1) | |
| THB | 193,205,000 | | | | 3.580 | | | | 12/17/27 | | | | 5,618,719 | |
| | 432,355,857 | | | | 1.250 | | | | 03/12/28 | | | | 9,871,508 | |
| | 97,800,000 | | | | 3.775 | | | | 06/25/32 | | | | 2,815,172 | |
| Thailand Government Bond (A-/Baa1) | |
| | 666,527,240 | | | | 1.200 | | | | 07/14/21 | | | | 17,037,498 | |
| | 749,645,000 | | | | 3.650 | | | | 12/17/21 | | | | 21,937,283 | |
| | | | | | | | | | | | | | |
| | | | | | | | | | | | | 57,280,180 | |
| | |
Principal
Amount | | | Interest
Rate | | | Maturity
Date | | | Value | |
| | Sovereign Debt Obligations – (continued) | |
| | Turkey – 7.8% | |
| Republic of Turkey (NR/NR) | |
| TRY | 103,790,000 | | | | 8.500 | % | | | 07/10/19 | | | $ | 31,662,765 | |
| | 32,850,000 | | | | 9.000 | | | | 07/24/24 | | | | 9,610,557 | |
| | 3,870,000 | | | | 8.000 | | | | 03/12/25 | | | | 1,072,451 | |
| Turkey Government Bond (NR/NR) | |
| | 19,120,000 | | | | 8.800 | | | | 11/14/18 | | | | 5,934,394 | |
| | 37,230,000 | | | | 10.400 | | | | 03/27/19 | | | | 12,077,495 | |
| | 24,550,000 | | | | 7.400 | | | | 02/05/20 | | | | 7,096,996 | |
| | 5,920,000 | | | | 7.100 | | | | 03/08/23 | | | | 1,579,351 | |
| | 25,710,000 | | | | 10.400 | | | | 03/20/24 | | | | 8,252,378 | |
| | | | | | | | | | | | | | |
| | | | | | | | | | | | | 77,286,387 | |
| | |
| | Venezuela – 0.4% | |
| Republic of Venezuela (CCC/Caa3) | |
| $ | 2,340,000 | | | | 7.750 | | | | 10/13/19 | | | | 801,450 | |
| | 340,000 | | | | 6.000 | | | | 12/09/20 | | | | 112,200 | |
| | 310,000 | | | | 12.750 | | | | 08/23/22 | | | | 132,525 | |
| | 940,000 | | | | 9.000 | | | | 05/07/23 | | | | 321,950 | |
| | 4,680,000 | | | | 8.250 | | | | 10/13/24 | | | | 1,567,800 | |
| | 330,000 | | | | 7.650 | | | | 04/21/25 | | | | 109,725 | |
| | 540,000 | | | | 11.750 | | | | 10/21/26 | | | | 207,900 | |
| | 350,000 | | | | 9.250 | (d) | | | 09/15/27 | | | | 135,625 | |
| | 550,000 | | | | 9.250 | | | | 05/07/28 | | | | 184,250 | |
| | 1,210,000 | | | | 11.950 | | | | 08/05/31 | | | | 471,900 | |
| | 340,000 | | | | 7.000 | | | | 03/31/38 | | | | 109,650 | |
| | | | | | | | | | | | | | |
| | | | | | | | | | | | | 4,154,975 | |
| | |
| | TOTAL SOVEREIGN DEBT OBLIGATIONS | |
| | (Cost $952,900,838) | | | $ | 685,506,045 | |
| | |
| | | | | | | | | | | | | | |
| | Corporate Obligations – 5.4% | |
| | Australia – 0.2% | |
| Toyota Finance Australia Ltd. (NR/NR) | |
| MXN | 27,460,000 | | | | 3.760 | % | | | 07/20/17 | | | $ | 1,584,746 | |
| | |
| | Azerbaijan – 0.3% | |
| State Oil Company of the Azerbaijan Republic (BB+/Ba1) | |
| $ | 2,731,000 | | | | 5.450 | | | | 02/09/17 | | | | 2,771,965 | |
| | |
| | Brazil(b) – 0.3% | |
| Banco Santander Brasil SA (BB+/Baa2) | |
| BRL | 12,900,000 | | | | 8.000 | | | | 03/18/16 | | | | 3,095,382 | |
| | |
| | Hong Kong – 1.1% | |
| China Unicom Ltd. (NR/NR) | |
| CNH | 39,190,000 | | | | 4.000 | | | | 04/16/17 | | | | 6,030,084 | |
| CITIC Ltd. (BBB+/A3) | |
| $ | 4,110,000 | | | | 6.800 | | | | 01/17/23 | | | | 4,656,168 | |
| | | | | | | | | | | | | | |
| | | | | | | | | | | | | 10,686,252 | |
| | |
| | Mexico – 1.1% | |
| America Movil SAB de CV (A-/A2) | |
| MXN | 115,550,000 | | | | 6.000 | | | | 06/09/19 | | | | 6,801,439 | |
| Petroleos Mexicanos (NR/A3) | |
| | 79,774,900 | | | | 7.470 | | | | 11/12/26 | | | | 4,341,517 | |
| | | | | | | | | | | | | | |
| | | | | | | | | | | | | 11,142,956 | |
| | |
| | |
| The accompanying notes are an integral part of these financial statements. | | 97 |
GOLDMAN SACHS LOCAL EMERGING MARKETS DEBT FUND
Schedule of Investments (continued)
September 30, 2015 (Unaudited)
| | | | | | | | | | | | | | |
Principal
Amount | | | Interest
Rate | | | Maturity
Date | | | Value | |
| | Corporate Obligations – (continued) | |
| | Philippines – 0.1% | |
| Alliance Global Group Cayman Islands, Inc. (NR/NR) | |
| $ | 1,320,000 | | | | 6.500 | % | | | 08/18/17 | | | $ | 1,386,000 | |
| | |
| | South Africa – 2.1% | |
| Transnet Ltd. (NR/NR) | |
| ZAR | 18,000,000 | | | | 10.800 | | | | 11/06/23 | | | | 1,339,134 | |
| | 93,000,000 | | | | 9.500 | | | | 08/19/25 | | | | 6,339,098 | |
| | 61,000,000 | | | | 8.900 | | | | 11/14/27 | | | | 3,953,201 | |
| Transnet Ltd. (BBB+/Baa2) | |
| | 136,000,000 | | | | 10.000 | | | | 03/30/29 | | | | 8,990,612 | |
| | | | | | | | | | | | | | |
| | | | | | | | | | | | | 20,622,045 | |
| | |
| | Venezuela – 0.2% | |
| Petroleos de Venezuela SA (CCC/NR) | |
| $ | 1,100,000 | | | | 9.000 | | | | 11/17/21 | | | | 394,900 | |
| | 620,000 | | | | 6.000 | | | | 05/16/24 | | | | 201,500 | |
| | 2,990,000 | | | | 6.000 | | | | 11/15/26 | | | | 945,886 | |
| | 1,700,000 | | | | 5.375 | | | | 04/12/27 | | | | 537,625 | |
| | 350,000 | | | | 5.500 | | | | 04/12/37 | | | | 109,375 | |
| | | | | | | | | | | | | | |
| | | | | | | | | | | | | 2,189,286 | |
| | |
| | TOTAL CORPORATE OBLIGATIONS | |
| | (Cost $77,402,847) | | | $ | 53,478,632 | |
| | |
| | | | | | | | | | | | | | |
| | Structured Notes – 10.8% | |
| | Brazil – 0.2% | |
| Notas do Tesouro Nacional Series B (Issuer HSBC Corp.)
(NR/NR) |
|
| BRL | 845,000 | | | | 10.000 | %(c) | | | 01/05/17 | | | $ | 200,741 | |
| | 8,475,615 | | | | 6.000 | | | | 08/15/40 | | | | 1,813,958 | |
| | | | | | | | | | | | | | |
| | | | | | | | | | | | | 2,014,699 | |
| | |
| | Colombia – 2.1% | |
| Republic of Columbia (Issuer Citigroup Funding, Inc.) (NR/NR) | |
| COP | 24,676,000,000 | | | | 11.250 | (b) | | | 10/25/18 | | | | 8,875,765 | |
| | 15,491,000,000 | | | | 11.250 | (b) | | | 10/25/18 | | | | 5,571,992 | |
| | 12,492,000,000 | | | | 11.000 | | | | 07/27/20 | | | | 4,632,972 | |
| | 4,226,000,000 | | | | 11.000 | | | | 07/25/24 | | | | 1,531,419 | |
| | | | | | | | | | | | | | |
| | | | | | | | | | | | | 20,612,148 | |
| | |
| | Indonesia – 8.5% | |
| Republic of Indonesia (Issuer Deutsche Bank AG (London)
(NR/NR)(b) |
|
| IDR | 42,400,000,000 | | | | 7.875 | | | | 04/18/19 | | | | 2,756,724 | |
| | 35,400,000,000 | | | | 7.000 | | | | 05/17/27 | | | | 1,938,519 | |
| | 29,500,000,000 | | | | 8.250 | | | | 06/17/32 | | | | 1,756,911 | |
| Republic of Indonesia (Issuer Deutsche Bank AG (London))
(NR/NR)(b) |
|
| | 68,100,000,000 | | | | 8.375 | | | | 03/20/24 | | | | 4,339,341 | |
| | 108,400,000,000 | | | | 9.000 | | | | 03/20/29 | | | | 6,992,355 | |
| Republic of Indonesia (Issuer JPMorgan Chase Bank NA)
(NR/NR) |
|
| | 50,100,000,000 | | | | 10.000 | | | | 07/17/17 | | | | 3,461,294 | |
| | 46,000,000,000 | | | | 10.000 | (b) | | | 07/18/17 | | | | 3,178,035 | |
| | 44,600,000,000 | | | | 7.875 | (b) | | | 04/17/19 | | | | 2,899,761 | |
| | 66,250,000,000 | | | | 7.000 | (b) | | | 05/17/27 | | | | 3,627,877 | |
| | |
Principal
Amount | | | Interest
Rate | | | Maturity
Date | | | Value | |
| | Structured Notes – (continued) | |
| | Indonesia – (continued) | |
| Republic of Indonesia (Issuer JPMorgan Chase Bank NA)
(NR/NR) – (continued) |
|
| IDR | 161,824,000,000 | | | | 6.125 | %(b) | | | 05/17/28 | | | $ | 8,174,045 | |
| | 45,220,000,000 | | | | 9.000 | (b) | | | 03/19/29 | | | | 2,916,921 | |
| | 288,650,000,000 | | | | 6.625 | (b) | | | 05/17/33 | | | | 14,187,591 | |
| | 74,554,000,000 | | | | 6.625 | (b) | | | 05/17/33 | | | | 3,664,444 | |
| Republic of Indonesia (Issuer Standard Chartered Bank)
(NR/NR)(b) |
|
| | 11,805,000,000 | | | | 9.000 | | | | 03/19/29 | | | | 761,483 | |
| | 16,032,000,000 | | | | 9.000 | | | | 03/19/29 | | | | 1,034,146 | |
| | 17,000,000,000 | | | | 9.000 | | | | 03/19/29 | | | | 1,096,587 | |
| | 72,800,000,000 | | | | 9.000 | | | | 03/19/29 | | | | 4,695,973 | |
| | 190,946,000,000 | | | | 9.000 | | | | 03/19/29 | | | | 12,316,995 | |
| | 34,721,000,000 | | | | 9.000 | | | | 03/19/29 | | | | 2,239,682 | |
| | 37,708,000,000 | | | | 9.000 | | | | 03/19/29 | | | | 2,432,359 | |
| | | | | | | | | | | | | | |
| | | | | | | | | | | | | 84,471,043 | |
| | |
| | TOTAL STRUCTURED NOTES | |
| | (Cost $181,437,324) | | | $ | 107,097,890 | |
| | |
| | | | | | | | | | | | | | |
| | Municipal Debt Obligations – 0.8% | |
| | Puerto Rico – 0.8% | |
| Puerto Rico Commonwealth Aqueduct & Sewer Authority RB
(Senior Lien) Series 2008 A (CCC-/Caa3) |
|
| $ | 215,000 | | | | 6.000 | % | | | 07/01/38 | | | $ | 149,696 | |
| | 415,000 | | | | 6.000 | | | | 07/01/44 | | | | 287,392 | |
| Puerto Rico Commonwealth Aqueduct & Sewer Authority RB
(Senior Lien) Series 2012 A (CCC-/Caa3) |
|
| | 320,000 | | | | 5.750 | | | | 07/01/37 | | | | 219,603 | |
| Puerto Rico Commonwealth GO Bonds for Public Improvement
Series 2011 A (CC/Caa3) |
|
| | 120,000 | | | | 5.750 | | | | 07/01/41 | | | | 78,000 | |
| Puerto Rico Commonwealth GO Bonds Refunding for Public
Improvement Series 2008 A (CC/Caa3) |
|
| | 70,000 | | | | 5.500 | | | | 07/01/32 | | | | 45,588 | |
| Puerto Rico Commonwealth GO Bonds Refunding for Public
Improvement Series 2009 B (CC/Caa3) |
|
| | 45,000 | | | | 5.875 | | | | 07/01/36 | | | | 29,306 | |
| | 170,000 | | | | 5.750 | | | | 07/01/38 | | | | 110,500 | |
| Puerto Rico Commonwealth GO Bonds Refunding for Public
Improvement Series 2009 C (CC/Caa3) |
|
| | 705,000 | | | | 6.000 | | | | 07/01/39 | | | | 460,012 | |
| Puerto Rico Commonwealth GO Bonds Refunding for Public
Improvement Series 2011 A (CC/Caa3) |
|
| | 45,000 | | | | 6.000 | | | | 07/01/34 | | | | 29,475 | |
| Puerto Rico Commonwealth GO Bonds Refunding for Public
Improvement Series 2011 E (CC/Caa3) |
|
| | 40,000 | | | | 5.625 | | | | 07/01/32 | | | | 26,100 | |
| Puerto Rico Commonwealth GO Bonds Refunding for Public
Improvement Series 2012 A (CC/Caa3) |
|
| | 20,000 | | | | 5.500 | | | | 07/01/26 | | | | 13,175 | |
| | 130,000 | | | | 5.750 | | | | 07/01/28 | | | | 85,476 | |
| | 265,000 | | | | 5.000 | | | | 07/01/41 | | | | 170,262 | |
| Puerto Rico Commonwealth GO Bonds Series 2007 A (CC/Caa3) | |
| | 285,000 | | | | 5.250 | | | | 07/01/37 | | | | 183,825 | |
| | |
| | |
| 98 | | The accompanying notes are an integral part of these financial statements. |
GOLDMAN SACHS LOCAL EMERGING MARKETS DEBT FUND
| | | | | | | | | | | | | | |
Principal
Amount | | | Interest
Rate | | | Maturity
Date | | | Value | |
| | Municipal Debt Obligations – (continued) | |
| | Puerto Rico – (continued) | |
| Puerto Rico Commonwealth GO Bonds Series 2014 A (CC/Caa3) | |
| $ | 1,810,000 | | | | 8.000 | % | | | 07/01/35 | | | $ | 1,357,500 | |
| Puerto Rico Commonwealth GO Bonds Unrefunded Balance for
Public Improvement Series 2001 A (CC/Caa3) |
|
| | 80,000 | | | | 5.125 | | | | 07/01/31 | | | | 51,901 | |
| Puerto Rico Commonwealth GO Bonds Unrefunded Balance for
Public Improvement Series 2004 A (CC/Caa3) |
|
| | 20,000 | | | | 5.000 | | | | 07/01/34 | | | | 12,875 | |
| Puerto Rico Commonwealth GO Bonds Unrefunded Balance for
Public Improvement Series 2006 A (CC/Caa3) |
|
| | 30,000 | | | | 5.250 | | | | 07/01/27 | | | | 19,650 | |
| Puerto Rico Sales Tax Financing Corp. Sales Tax RB Capital
Appreciation Series 2010 A (CC/Ca)(a) |
|
| | 85,000 | | | | 0.000 | | | | 08/01/35 | | | | 9,197 | |
| Puerto Rico Sales Tax Financing Corp. Sales Tax RB Capital
Appreciation SubSeries 2010 C (CC/Ca)(a) |
|
| | 215,000 | | | | 0.000 | | | | 08/01/37 | | | | 21,223 | |
| | 175,000 | | | | 0.000 | | | | 08/01/38 | | | | 16,219 | |
| Puerto Rico Sales Tax Financing Corp. Sales Tax RB
SubSeries 2009 A (CC/Ca) |
|
| | 90,000 | | | | 5.250 | | | | 08/01/27 | | | | 38,588 | |
| | 1,690,000 | | | | 0.000 | (e) | | | 08/01/32 | | | | 686,698 | |
| | 215,000 | | | | 5.750 | | | | 08/01/37 | | | | 90,838 | |
| | 160,000 | | | | 6.375 | | | | 08/01/39 | | | | 68,200 | |
| | 200,000 | | | | 6.000 | | | | 08/01/42 | | | | 84,500 | |
| | 15,000 | | | | 6.500 | | | | 08/01/44 | | | | 6,413 | |
| Puerto Rico Sales Tax Financing Corp. Sales Tax RB
SubSeries 2010 A (CC/Ca) |
|
| | 475,000 | | | | 0.000 | (e) | | | 08/01/33 | | | | 146,081 | |
| | 840,000 | | | | 5.500 | | | | 08/01/37 | | | | 353,850 | |
| | 710,000 | | | | 5.375 | | | | 08/01/39 | | | | 299,087 | |
| | 1,795,000 | | | | 5.500 | | | | 08/01/42 | | | | 756,144 | |
| Puerto Rico Sales Tax Financing Corp. Sales Tax RB
SubSeries 2010 C (CC/Ca) |
|
| | 240,000 | | | | 5.375 | | | | 08/01/38 | | | | 101,100 | |
| | 1,120,000 | | | | 5.250 | | | | 08/01/41 | | | | 471,800 | |
| Puerto Rico Sales Tax Financing Corp. Sales Tax RB
SubSeries 2011 A-1 (CC/Ca) |
|
| | 485,000 | | | | 5.000 | | | | 08/01/43 | | | | 204,306 | |
| | 175,000 | | | | 5.250 | | | | 08/01/43 | | | | 73,719 | |
| Puerto Rico Sales Tax Financing Corp. Sales Tax RB Unrefunded
SubSeries 2009 A (CC/Ca) |
|
| | 1,200,000 | | | | 5.500 | | | | 08/01/28 | | | | 517,500 | |
| | |
| | TOTAL MUNICIPAL DEBT OBLIGATIONS | |
| | (Cost $10,621,121) | | | $ | 7,275,799 | |
| | |
| | | | | | | | | | | | | | |
| | U.S. Treasury Obligations – 8.5% | |
| United States Treasury Bonds | |
| $ | 14,600,000 | | | | 3.000 | % | | | 05/15/45 | | | $ | 14,942,078 | |
| | 7,800,000 | | | | 2.875 | | | | 08/15/45 | | | | 7,795,164 | |
| United States Treasury Notes | |
| | 5,800,000 | | | | 1.625 | | | | 06/30/20 | | | | 5,873,776 | |
| | 21,600,000 | | | | 2.125 | (f) | | | 12/31/21 | | | | 22,186,872 | |
| | 7,200,000 | | | | 1.750 | | | | 02/28/22 | | | | 7,225,705 | |
| | 7,000,000 | | | | 1.875 | | | | 05/31/22 | | | | 7,067,340 | |
| | |
Principal
Amount | | | Interest
Rate | | | Maturity
Date | | | Value | |
| | U.S. Treasury Obligations – (continued) | |
| United States Treasury Notes – (continued) | |
| $ | 1,900,000 | | | | 2.125 | % | | | 06/30/22 | | | $ | 1,949,628 | |
| | 3,600,000 | | | | 2.000 | | | | 07/31/22 | | | | 3,662,496 | |
| | 13,500,000 | | | | 1.750 | | | | 09/30/22 | | | | 13,494,735 | |
| | |
| | TOTAL U.S. TREASURY OBLIGATIONS | |
| | (Cost $82,553,160) | | | $ | 84,197,794 | |
| | |
| | | | | | | | | | |
| Shares | | | | Rate | | | Value | |
| Investment Company(g) – 2.2% | |
| 21,654,935 | | Goldman Sachs Financial
Square Government Fund –
FST Shares | | | 0.006 | % | | | 21,654,935 | |
| (Cost $21,654,935) | | | | | | | | |
| |
| TOTAL INVESTMENTS – 97.0% | | | | | |
| (Cost $1,326,570,225) | | | $ | 959,211,095 | |
| |
| | | | | | | | | | | | | | |
Principal
Amount | | | Interest Rate
(Paid) Received | | | Maturity
Date | | | Value | |
| | Reverse Repurchase Agreement – (0.0)% | |
| Citigroup Reverse Repurchase Agreement (NR/NR) | |
| $ | (154,438 | ) | | | 0.750 | % | | | 08/04/16 | | | $ | (154,438 | ) |
| | (Cost $(154,438)) | | | | | |
| | |
| OTHER ASSETS IN EXCESS OF
LIABILITIES – 3.0% |
| | | 29,633,686 | |
| | |
| | NET ASSETS – 100.0% | | | $ | 988,690,343 | |
| | |
| | |
| The percentage shown for each investment category reflects the value of investments in that category as a percentage of net assets. |
(a) | | Issued with a zero coupon. Income is recognized through the accretion of discount. |
(b) | | Exempt from registration under Rule 144A of the Securities Act of 1933. Under procedures approved by the Board of Trustees, such securities have been determined to be liquid by the investment adviser and may be resold, normally to qualified institutional buyers in transactions exempt from registration. Total market value of Rule 144A securities amounts to $115,706,803, which represents approximately 11.7% of net assets as of September 30, 2015. |
(c) | | Variable rate security. Interest rate or distribution rate disclosed is that which is in effect on September 30, 2015. |
(d) | | All or a portion of the security was pledged as collateral against open reverse repurchase agreements. As of September 30, 2015, the value of securities pledged amounted to $135,625. |
(e) | | Coupon changes periodically based upon a predetermined schedule. Interest rate disclosed is that which is in effect on September 30, 2015. |
(f) | | All or a portion of security is segregated as collateral for initial margin requirement on futures transactions. |
(g) | | Represents an Affiliated Fund. |
Security ratings disclosed, if any, are obtained from by Standard & Poor’s /Moody’s Investor Service and are unaudited. A brief description of the ratings is available in the Fund’s Statement of Additional Information.
| | |
| The accompanying notes are an integral part of these financial statements. | | 99 |
GOLDMAN SACHS LOCAL EMERGING MARKETS DEBT FUND
Schedule of Investments (continued)
September 30, 2015 (Unaudited)
| | |
|
Currency Abbreviations: |
AED | | —United Arab Emirates Dirham |
BRL | | —Brazilian Real |
CLP | | —Chilean Peso |
CNH | | —Chinese Yuan Renminbi Offshore |
COP | | —Colombian Peso |
CZK | | —Czech Koruna |
DOP | | —Dominican Peso |
EUR | | —Euro |
HUF | | —Hungarian Forint |
IDR | | —Indonesian Rupiah |
ILS | | —Israeli Shekel |
INR | | —Indian Rupee |
KRW | | —South Korean Won |
MXN | | —Mexican Peso |
MYR | | —Malaysian Ringgit |
NGN | | —Nigerian Naira |
PEN | | —Peruvian Nuevo Sol |
PHP | | —Philippine Peso |
PLN | | —Polish Zloty |
RON | | —New Romanian Leu |
RUB | | —Russian Ruble |
SGD | | —Singapore Dollar |
THB | | —Thai Baht |
TRY | | —Turkish Lira |
TWD | | —Taiwan Dollar |
USD | | —U.S. Dollar |
ZAR | | —South African Rand |
| | |
|
Investment Abbreviations: |
BUBOR | | —Budapest Interbank Offered Rate |
CLICP | | —Sinacofi Chile Interbank Rate |
EURO | | —Euro Offered Rate |
GO | | —General Obligation |
JIBAR | | —Johannesburg Interbank Agreed Rate |
KWCDC | | —South Korean Won Certificate of Deposit |
LIBOR | | —London Interbank Offered Rate |
LLC | | —Limited Liability Company |
MIBOR | | —Mumbai Interbank Offered Rate |
NR | | —Not Rated |
RB | | —Revenue Bond |
TIIE | | —La Tasa de Interbank Equilibrium Interest Rate |
WIBOR | | —Warsaw Interbank Offered Rate |
|
| | |
| 100 | | The accompanying notes are an integral part of these financial statements. |
GOLDMAN SACHS LOCAL EMERGING MARKETS DEBT FUND
|
| ADDITIONAL INVESTMENT INFORMATION |
FORWARD FOREIGN CURRENCY EXCHANGE CONTRACTS — At September 30, 2015, the Fund had the following forward foreign currency exchange contracts:
FORWARD FOREIGN CURRENCY EXCHANGE CONTRACTS WITH UNREALIZED GAIN
| | | | | | | | | | | | | | | | | | | | | | | | |
| Counterparty | | Currency
Purchased | | | Currency
Sold | | | Current
Value | | | Settlement
Date | | | Unrealized
Gain | |
Barclays Bank PLC | | BRL | | | 15,200,659 | | | USD | | | 3,697,000 | | | $ | 3,831,211 | | | | 10/02/15 | | | $ | 134,211 | |
| | INR | | | 268,157,273 | | | USD | | | 4,066,069 | | | | 4,077,143 | | | | 10/19/15 | | | | 11,074 | |
| | USD | | | 3,835,000 | | | TRY | | | 11,692,033 | | | | 3,772,490 | | | | 12/16/15 | | | | 62,510 | |
| | USD | | | 3,972,121 | | | TWD | | | 129,292,539 | | | | 3,923,433 | | | | 10/02/15 | | | | 48,688 | |
| | USD | | | 4,109,086 | | | TWD | | | 133,935,669 | | | | 4,048,602 | | | | 10/26/15 | | | | 60,485 | |
| | ZAR | | | 296,012,173 | | | USD | | | 20,882,251 | | | | 21,063,475 | | | | 12/17/15 | | | | 181,224 | |
BNP Paribas SA | | EUR | | | 4,881,000 | | | PLN | | | 20,710,942 | | | | 5,461,410 | | | | 12/16/15 | | | | 23,620 | |
| | USD | | | 30,889,965 | | | AED | | | 113,645,015 | | | | 30,871,686 | | | | 08/11/16 | | | | 18,279 | |
| | USD | | | 21,973,912 | | | AED | | | 80,874,981 | | | | 21,969,107 | | | | 08/15/16 | | | | 4,804 | |
| | USD | | | 5,433,074 | | | CZK | | | 129,714,649 | | | | 5,344,162 | | | | 12/16/15 | | | | 88,913 | |
| | USD | | | 5,290,438 | | | TWD | | | 172,283,126 | | | | 5,221,718 | | | | 10/05/15 | | | | 68,720 | |
| | USD | | | 8,941,204 | | | TWD | | | 295,864,432 | | | | 8,938,502 | | | | 11/30/15 | | | | 2,701 | |
Citibank NA | | USD | | | 3,842,574 | | | CNH | | | 25,127,744 | | | | 3,838,748 | | | | 09/01/16 | | | | 3,826 | |
| | USD | | | 4,050,639 | | | KRW | | | 4,789,394,211 | | | | 4,039,443 | | | | 10/05/15 | | | | 11,196 | |
| | USD | | | 7,885,026 | | | KRW | | | 9,365,045,461 | | | | 7,883,645 | | | | 12/04/15 | | | | 1,381 | |
| | USD | | | 9,534,517 | | | SGD | | | 13,535,677 | | | | 9,486,955 | | | | 12/16/15 | | | | 47,562 | |
Credit Suisse International (London) | | COP | | | 8,797,711,000 | | | USD | | | 2,821,362 | | | | 2,848,544 | | | | 10/02/15 | | | | 27,183 | |
| | COP | | | 12,828,478,552 | | | USD | | | 4,103,800 | | | | 4,140,314 | | | | 10/29/15 | | | | 36,514 | |
| | USD | | | 1,615,345 | | | COP | | | 3,393,839,499 | | | | 1,098,866 | | | | 10/02/15 | | | | 516,479 | |
| | USD | | | 34,691,231 | | | COP | | | 94,699,123,946 | | | | 30,585,689 | | | | 10/23/15 | | | | 4,105,542 | |
Deutsche Bank AG | | HUF | | | 5,973,442,926 | | | USD | | | 21,194,447 | | | | 21,288,783 | | | | 12/16/15 | | | | 94,336 | |
| | ILS | | | 26,591,470 | | | USD | | | 6,750,000 | | | | 6,778,462 | | | | 10/02/15 | | | | 28,462 | |
| | ILS | | | 26,591,470 | | | USD | | | 6,764,728 | | | | 6,785,901 | | | | 12/16/15 | | | | 21,172 | |
| | MYR | | | 91,654,241 | | | USD | | | 20,703,465 | | | | 20,869,898 | | | | 10/20/15 | | | | 166,433 | |
| | TWD | | | 255,802,139 | | | USD | | | 7,744,539 | | | | 7,762,417 | | | | 10/02/15 | | | | 17,878 | |
| | USD | | | 1,211,931 | | | COP | | | 2,546,267,444 | | | | 824,437 | | | | 10/02/15 | | | | 387,495 | |
| | USD | | | 1,913,999 | | | COP | | | 5,597,490,000 | | | | 1,807,863 | | | | 10/23/15 | | | | 106,135 | |
| | USD | | | 11,622,393 | | | ILS | | | 45,003,068 | | | | 11,484,373 | | | | 12/16/15 | | | | 138,020 | |
| | USD | | | 3,848,000 | | | SGD | | | 5,392,476 | | | | 3,779,506 | | | | 12/16/15 | | | | 68,494 | |
| | USD | | | 3,895,000 | | | TWD | | | 126,509,600 | | | | 3,838,984 | | | | 10/02/15 | | | | 56,016 | |
HSBC Bank PLC | | PHP | | | 151,884,000 | | | USD | | | 3,218,563 | | | | 3,246,501 | | | | 10/19/15 | | | | 27,937 | |
| | TRY | | | 9,675,297 | | | USD | | | 3,111,626 | | | | 3,121,780 | | | | 12/16/15 | | | | 10,154 | |
| | USD | | | 3,821,000 | | | BRL | | | 14,709,302 | | | | 3,707,369 | | | | 10/02/15 | | | | 113,631 | |
| | USD | | | 11,732,093 | | | ILS | | | 45,709,407 | | | | 11,664,624 | | | | 12/16/15 | | | | 67,469 | |
| | USD | | | 1,744,081 | | | PHP | | | 81,623,000 | | | | 1,743,522 | | | | 10/30/15 | | | | 559 | |
| | USD | | | 2,328,000 | | | PLN | | | 8,824,284 | | | | 2,316,872 | | | | 12/16/15 | | | | 11,128 | |
| | USD | | | 2,631,000 | | | RON | | | 10,390,608 | | | | 2,624,003 | | | | 12/16/15 | | | | 6,997 | |
| | USD | | | 3,895,000 | | | TWD | | | 126,050,769 | | | | 3,820,465 | | | | 10/05/15 | | | | 74,535 | |
| | USD | | | 19,052 | | | TWD | | | 616,861 | | | | 18,659 | | | | 10/19/15 | | | | 393 | |
JPMorgan Chase Bank NA | | BRL | | | 57,075,059 | | | USD | | | 13,910,568 | | | | 14,385,337 | | | | 10/02/15 | | | | 474,770 | |
| | CNH | | | 67,566,699 | | | USD | | | 10,425,000 | | | | 10,516,857 | | | | 12/16/15 | | | | 91,857 | |
| | COP | | | 7,970,241,000 | | | USD | | | 2,462,459 | | | | 2,580,624 | | | | 10/02/15 | | | | 118,165 | |
| | HUF | | | 5,827,229,597 | | | USD | | | 20,719,775 | | | | 20,767,693 | | | | 12/16/15 | | | | 47,918 | |
| | INR | | | 266,600,633 | | | USD | | | 4,030,244 | | | | 4,043,263 | | | | 11/03/15 | | | | 13,019 | |
| | KRW | | | 9,320,880,689 | | | USD | | | 7,818,875 | | | | 7,862,784 | | | | 10/02/15 | | | | 43,909 | |
| | MXN | | | 202,241,950 | | | USD | | | 11,781,199 | | | | 11,889,461 | | | | 12/16/15 | | | | 108,262 | |
| | RUB | | | 237,754,332 | | | USD | | | 3,600,000 | | | | 3,601,962 | | | | 10/21/15 | | | | 1,962 | |
| | USD | | | 3,975,237 | | | KRW | | | 4,708,032,189 | | | | 3,971,539 | | | | 10/02/15 | | | | 3,698 | |
| | USD | | | 8,046,214 | | | TWD | | | 265,605,513 | | | | 8,024,174 | | | | 12/04/15 | | | | 22,040 | |
| | |
| The accompanying notes are an integral part of these financial statements. | | 101 |
GOLDMAN SACHS LOCAL EMERGING MARKETS DEBT FUND
Schedule of Investments (continued)
September 30, 2015 (Unaudited)
|
| ADDITIONAL INVESTMENT INFORMATION (continued) |
FORWARD FOREIGN CURRENCY EXCHANGE CONTRACTS WITH UNREALIZED GAIN (continued)
| | | | | | | | | | | | | | | | | | | | | | | | |
| Counterparty | | Currency
Purchased | | | Currency
Sold | | | Current
Value | | | Settlement
Date | | | Unrealized
Gain | |
Morgan Stanley & Co. | | BRL | | | 41,616,787 | | | USD | | | 10,367,000 | | | $ | 10,489,196 | | | | 10/02/15 | | | $ | 122,196 | |
| | USD | | | 7,630,000 | | | BRL | | | 29,654,408 | | | | 7,474,170 | | | | 10/02/15 | | | | 155,830 | |
| | USD | | | 3,184,928 | | | RUB | | | 186,955,279 | | | | 2,829,596 | | | | 10/23/15 | | | | 355,332 | |
Royal Bank of Canada | | MXN | | | 23,246,000 | | | USD | | | 1,362,922 | | | | 1,366,593 | | | | 12/16/15 | | | | 3,671 | |
| | USD | | | 33,131,928 | | | BRL | | �� | 115,930,297 | | | | 29,219,355 | | | | 10/02/15 | | | | 3,912,573 | |
Royal Bank of Scotland PLC | | BRL | | | 30,904,574 | | | USD | | | 7,533,108 | | | | 7,701,448 | | | | 11/04/15 | | | | 168,340 | |
| | CLP | | | 6,655,549,096 | | | USD | | | 9,520,000 | | | | 9,538,537 | | | | 10/26/15 | | | | 18,537 | |
| | COP | | | 14,911,260,420 | | | USD | | | 4,730,843 | | | | 4,826,391 | | | | 10/05/15 | | | | 95,548 | |
| | TRY | | | 11,695,329 | | | USD | | | 3,763,000 | | | | 3,773,553 | | | | 12/16/15 | | | | 10,553 | |
| | USD | | | 7,670,000 | | | TRY | | | 23,612,632 | | | | 7,618,728 | | | | 12/16/15 | | | | 51,272 | |
Standard Chartered Bank | | CNH | | | 60,603,119 | | | USD | | | 9,353,000 | | | | 9,432,965 | | | | 12/16/15 | | | | 79,965 | |
| | NGN | | | 1,178,888,895 | | | USD | | | 5,508,827 | | | | 5,908,981 | | | | 10/06/15 | | | | 400,154 | |
| | NGN | | | 893,317,000 | | | USD | | | 4,222,723 | | | | 4,406,727 | | | | 11/19/15 | | | | 184,004 | |
| | USD | | | 5,042,000 | | | CNH | | | 32,271,371 | | | | 5,023,086 | | | | 12/16/15 | | | | 18,914 | |
| | USD | | | 3,895,000 | | | KRW | | | 4,575,651,250 | | | | 3,859,169 | | | | 10/05/15 | | | | 35,831 | |
| | USD | | | 3,040,000 | | | KRW | | | 3,580,682,240 | | | | 3,017,864 | | | | 10/23/15 | | | | 22,136 | |
UBS AG (London) | | EUR | | | 4,841,000 | | | HUF | | | 1,517,847,140 | | | | 5,416,653 | | | | 12/16/15 | | | | 7,190 | |
| | INR | | | 292,198,089 | | | USD | | | 4,376,844 | | | | 4,442,667 | | | | 10/19/15 | | | | 65,824 | |
| | USD | | | 8,088,034 | | | BRL | | | 31,362,602 | | | | 7,904,706 | | | | 10/02/15 | | | | 183,327 | |
| | USD | | | 3,895,000 | | | KRW | | | 4,612,848,500 | | | | 3,891,245 | | | | 10/02/15 | | | | 3,755 | |
| | USD | | | 2,638,000 | | | KRW | | | 3,079,123,722 | | | | 2,595,331 | | | | 10/21/15 | | | | 42,668 | |
Westpac Banking Corp. | | USD | | | 61,278,999 | | | EUR | | | 54,254,649 | | | | 60,706,183 | | | | 12/16/15 | | | | 572,814 | |
| | | USD | | | 6,501,908 | | | TWD | | | 212,970,000 | | | | 6,454,894 | | | | 10/05/15 | | | | 47,013 | |
| TOTAL | | | | | | $ | 14,335,203 | |
FORWARD FOREIGN CURRENCY EXCHANGE CONTRACTS WITH UNREALIZED LOSS
| | | | | | | | | | | | | | | | | | | | | | | | |
| Counterparty | | Currency
Purchased | | | Currency
Sold | | | Current
Value | | | Settlement
Date | | | Unrealized
Loss | |
Bank of America Securities LLC | | CLP | | | 2,332,179,605 | | | USD | | | 3,385,859 | | | $ | 3,343,711 | | | | 10/22/15 | | | $ | (42,148 | ) |
| | MXN | | | 192,517,663 | | | USD | | | 11,400,685 | | | | 11,317,787 | | | | 12/16/15 | | | | (82,898 | ) |
| | PLN | | | 14,273,471 | | | EUR | | | 3,374,000 | | | | 3,747,591 | | | | 12/16/15 | | | | (27,618 | ) |
| | PLN | | | 95,184,521 | | | USD | | | 25,189,753 | | | | 24,991,306 | | | | 12/16/15 | | | | (198,447 | ) |
| | USD | | | 3,274,612 | | | ILS | | | 12,878,068 | | | | 3,285,430 | | | | 12/02/15 | | | | (10,818 | ) |
| | USD | | | 6,167,773 | | | RUB | | | 410,712,000 | | | | 6,222,259 | | | | 10/21/15 | | | | (54,486 | ) |
Barclays Bank PLC | | PHP | | | 257,454,000 | | | USD | | | 5,647,779 | | | | 5,499,391 | | | | 10/30/15 | | | | (148,388 | ) |
| | USD | | | 14,188,722 | | | CNH | | | 94,496,889 | | | | 14,436,225 | | | | 09/01/16 | | | | (247,503 | ) |
| | USD | | | 3,650,000 | | | INR | | | 242,431,540 | | | | 3,686,002 | | | | 10/19/15 | | | | (36,002 | ) |
| | ZAR | | | 51,710,712 | | | USD | | | 3,754,000 | | | | 3,679,603 | | | | 12/17/15 | | | | (74,397 | ) |
BNP Paribas SA | | IDR | | | 35,285,460,000 | | | USD | | | 2,436,000 | | | | 2,381,739 | | | | 10/30/15 | | | | (54,261 | ) |
| | PLN | | | 95,426,998 | | | USD | | | 25,298,243 | | | | 25,054,970 | | | | 12/16/15 | | | | (243,273 | ) |
| | USD | | | 14,347,226 | | | AED | | | 52,817,518 | | | | 14,347,499 | | | | 08/15/16 | | | | (273 | ) |
Citibank NA | | CLP | | | 3,691,407,000 | | | USD | | | 5,357,630 | | | | 5,297,109 | | | | 10/13/15 | | | | (60,520 | ) |
| | COP | | | 9,562,902,900 | | | USD | | | 3,111,000 | | | | 3,087,485 | | | | 10/26/15 | | | | (23,515 | ) |
| | HUF | | | 5,792,848,897 | | | USD | | | 20,678,038 | | | | 20,645,163 | | | | 12/16/15 | | | | (32,874 | ) |
| | KRW | | | 9,365,045,461 | | | USD | | | 7,901,658 | | | | 7,898,612 | | | | 10/05/15 | | | | (3,047 | ) |
| | USD | | | 13,196,729 | | | CNH | | | 85,347,204 | | | | 13,284,418 | | | | 12/16/15 | | | | (87,689 | ) |
| | USD | | | 3,776,000 | | | ZAR | | | 53,191,379 | | | | 3,784,964 | | | | 12/17/15 | | | | (8,964 | ) |
Credit Suisse International (London) | | USD | | | 3,921,265 | | | COP | | | 12,253,954,000 | | | | 3,957,752 | | | | 10/23/15 | | | | (36,486 | ) |
| | USD | | | 7,299,000 | | | RUB | | | 489,100,151 | | | | 7,409,834 | | | | 10/21/15 | | | | (110,834 | ) |
| | |
| 102 | | The accompanying notes are an integral part of these financial statements. |
GOLDMAN SACHS LOCAL EMERGING MARKETS DEBT FUND
|
| ADDITIONAL INVESTMENT INFORMATION (continued) |
FORWARD FOREIGN CURRENCY EXCHANGE CONTRACTS WITH UNREALIZED LOSS (continued)
| | | | | | | | | | | | | | | | | | | | | | | | |
| Counterparty | | Currency
Purchased | | | Currency
Sold | | | Current
Value | | | Settlement
Date | | | Unrealized
Loss | |
Deutsche Bank AG | | CNH | | | 12,768,636 | | | USD | | | 1,990,000 | | | $ | 1,987,457 | | | | 12/16/15 | | | $ | (2,543 | ) |
| | MXN | | | 248,025,688 | | | USD | | | 14,679,946 | | | | 14,581,009 | | | | 12/16/15 | | | | (98,936 | ) |
| | MYR | | | 30,421,891 | | | USD | | | 7,885,814 | | | | 6,926,523 | | | | 10/23/15 | | | | (959,291 | ) |
| | MYR | | | 13,561,289 | | | USD | | | 3,149,123 | | | | 3,087,022 | | | | 10/30/15 | | | | (62,101 | ) |
| | RON | | | 72,185,000 | | | USD | | | 18,464,470 | | | | 18,229,315 | | | | 12/16/15 | | | | (235,155 | ) |
| | THB | | | 1,190,234,000 | | | USD | | | 32,897,713 | | | | 32,732,833 | | | | 11/20/15 | | | | (164,880 | ) |
| | USD | | | 14,302,644 | | | CNH | | | 95,144,018 | | | | 14,535,087 | | | | 09/01/16 | | | | (232,442 | ) |
| | USD | | | 4,356,689 | | | ILS | | | 17,117,432 | | | | 4,366,970 | | | | 12/02/15 | | | | (10,280 | ) |
| | USD | | | 4,288,000 | | | INR | | | 283,982,405 | | | | 4,317,754 | | | | 10/19/15 | | | | (29,754 | ) |
| | USD | | | 3,529,000 | | | INR | | | 234,548,986 | | | | 3,557,168 | | | | 11/03/15 | | | | (28,168 | ) |
| | USD | | | 20,684,776 | | | MYR | | | 91,654,241 | | | | 20,870,149 | | | | 10/05/15 | | | | (185,373 | ) |
| | USD | | | 937,631 | | | PHP | | | 44,021,775 | | | | 940,335 | | | | 10/30/15 | | | | (2,704 | ) |
| | USD | | | 2,355,000 | | | SGD | | | 3,377,470 | | | | 2,367,219 | | | | 12/16/15 | | | | (12,219 | ) |
| | USD | | | 2,985,000 | | | THB | | | 109,310,700 | | | | 3,006,173 | | | | 11/20/15 | | | | (21,173 | ) |
| | USD | | | 7,719,998 | | | TWD | | | 255,802,139 | | | | 7,728,161 | | | | 11/30/15 | | | | (8,163 | ) |
| | ZAR | | | 53,113,215 | | | USD | | | 3,918,670 | | | | 3,779,401 | | | | 12/17/15 | | | | (139,267 | ) |
HSBC Bank PLC | | BRL | | | 45,550,086 | | | USD | | | 11,815,507 | | | | 11,480,555 | | | | 10/02/15 | | | | (334,952 | ) |
| | MYR | | | 91,654,241 | | | USD | | | 21,208,895 | | | | 20,870,149 | | | | 10/05/15 | | | | (338,746 | ) |
| | MYR | | | 36,082,220 | | | USD | | | 8,472,789 | | | | 8,218,696 | | | | 10/09/15 | | | | (254,093 | ) |
| | PEN | | | 6,659,934 | | | USD | | | 2,067,468 | | | | 2,045,198 | | | | 10/23/15 | | | | (22,270 | ) |
| | TRY | | | 11,611,729 | | | USD | | | 3,783,000 | | | | 3,746,580 | | | | 12/16/15 | | | | (36,420 | ) |
| | USD | | | 5,119,000 | | | BRL | | | 20,421,124 | | | | 5,146,990 | | | | 10/02/15 | | | | (27,990 | ) |
| | USD | | | 4,149,000 | | | MYR | | | 18,539,807 | | | | 4,220,307 | | | | 10/30/15 | | | | (71,307 | ) |
| | USD | | | 2,020,820 | | | PHP | | | 94,635,001 | | | | 2,021,467 | | | | 10/30/15 | | | | (647 | ) |
| | USD | | | 5,669,767 | | | PLN | | | 21,601,104 | | | | 5,671,508 | | | | 12/16/15 | | | | (1,741 | ) |
| | USD | | | 3,814,000 | | | TRY | | | 11,975,159 | | | | 3,863,842 | | | | 12/16/15 | | | | (49,842 | ) |
| | USD | | | 639,077 | | | ZAR | | | 8,986,065 | | | | 639,426 | | | | 12/17/15 | | | | (348 | ) |
| | ZAR | | | 22,931,366 | | | USD | | | 1,645,000 | | | | 1,631,738 | | | | 12/17/15 | | | | (13,262 | ) |
HSBC Securities, Inc. | | USD | | | 11,329,000 | | | CNH | | | 74,736,235 | | | | 11,417,404 | | | | 09/01/16 | | | | (88,404 | ) |
JPMorgan Securities, Inc. | | MXN | | | 65,174,675 | | | USD | | | 3,835,000 | | | | 3,831,508 | | | | 12/16/15 | | | | (3,492 | ) |
| | MYR | | | 20,827,370 | | | USD | | | 4,744,276 | | | | 4,741,036 | | | | 10/30/15 | | | | (3,240 | ) |
| | TWD | | | 511,303,895 | | | USD | | | 15,622,211 | | | | 15,497,076 | | | | 10/05/15 | | | | (125,135 | ) |
| | USD | | | 13,747,395 | | | BRL | | | 57,075,059 | | | | 14,223,156 | | | | 11/04/15 | | | | (475,761 | ) |
| | USD | | | 7,552,000 | | | CNH | | | 49,652,708 | | | | 7,585,410 | | | | 09/01/16 | | | | (33,410 | ) |
| | USD | | | 7,808,918 | | | KRW | | | 9,320,880,689 | | | | 7,853,378 | | | | 11/02/15 | | | | (44,460 | ) |
| | USD | | | 4,932,527 | | | RUB | | | 328,308,986 | | | | 4,973,859 | | | | 10/21/15 | | | | (41,332 | ) |
| | USD | | | 2,614,000 | | | TRY | | | 8,144,858 | | | | 2,627,977 | | | | 12/16/15 | | | | (13,977 | ) |
Morgan Stanley & Co. | | BRL | | | 25,123,782 | | | USD | | | 6,570,099 | | | | 6,332,260 | | | | 10/02/15 | | | | (237,839 | ) |
| | MXN | | | 63,184,468 | | | USD | | | 3,818,139 | | | | 3,714,508 | | | | 12/16/15 | | | | (103,631 | ) |
| | MYR | | | 42,696,076 | | | USD | | | 9,722,436 | | | | 9,704,756 | | | | 11/30/15 | | | | (17,679 | ) |
| | PLN | | | 7,384,150 | | | USD | | | 1,962,276 | | | | 1,938,756 | | | | 12/16/15 | | | | (23,520 | ) |
| | USD | | | 2,104,879 | | | BRL | | | 8,807,066 | | | | 2,194,729 | | | | 11/04/15 | | | | (89,850 | ) |
| | USD | | | 7,450,860 | | | TRY | | | 23,345,408 | | | | 7,532,507 | | | | 12/16/15 | | | | (81,647 | ) |
Royal Bank of Canada | | BRL | | | 12,888,509 | | | USD | | | 3,292,000 | | | | 3,248,451 | | | | 10/02/15 | | | | (43,549 | ) |
| | MXN | | | 192,945,176 | | | USD | | | 11,376,484 | | | | 11,342,919 | | | | 12/16/15 | | | | (33,565 | ) |
| | USD | | | 7,621,479 | | | MXN | | | 131,565,559 | | | | 7,734,516 | | | | 12/16/15 | | | | (113,037 | ) |
Royal Bank of Scotland PLC | | CLP | | | 2,380,204,591 | | | USD | | | 3,453,000 | | | | 3,415,555 | | | | 10/13/15 | | | | (37,445 | ) |
| | HUF | | | 5,795,021,290 | | | USD | | | 20,679,518 | | | | 20,652,906 | | | | 12/16/15 | | | | (26,612 | ) |
| | MXN | | | 255,907,940 | | | USD | | | 15,307,000 | | | | 15,044,394 | | | | 12/16/15 | | | | (262,606 | ) |
| | PLN | | | 55,171,000 | | | USD | | | 14,546,629 | | | | 14,485,500 | | | | 12/16/15 | | | | (61,129 | ) |
| | TRY | | | 14,371,000 | | | USD | | | 4,637,452 | | | | 4,636,871 | | | | 12/16/15 | | | | (581 | ) |
| | USD | | | 1,300,968 | | | COP | | | 4,022,307,461 | | | | 1,301,917 | | | | 10/05/15 | | | | (949 | ) |
| | |
| The accompanying notes are an integral part of these financial statements. | | 103 |
GOLDMAN SACHS LOCAL EMERGING MARKETS DEBT FUND
Schedule of Investments (continued)
September 30, 2015 (Unaudited)
|
| ADDITIONAL INVESTMENT INFORMATION (continued) |
FORWARD FOREIGN CURRENCY EXCHANGE CONTRACTS WITH UNREALIZED LOSS (continued)
| | | | | | | | | | | | | | | | | | | | | | | | |
| Counterparty | | Currency
Purchased | | | Currency
Sold | | | Current
Value | | | Settlement
Date | | | Unrealized
Loss | |
Royal Bank of Scotland PLC (continued) | | USD | | | 1,325,423 | | | HUF | | | 375,585,000 | | | $ | 1,338,549 | | | | 12/16/15 | | | $ | (13,127 | ) |
| | USD | | | 1,990,000 | | | IDR | | | 29,501,750,000 | | | | 1,991,343 | | | | 10/30/15 | | | | (1,343 | ) |
| | USD | | | 11,886,223 | | | ILS | | | 46,620,146 | | | | 11,897,036 | | | | 12/16/15 | | | | (10,813 | ) |
| | USD | | | 4,972,000 | | | MXN | | | 86,296,816 | | | | 5,073,243 | | | | 12/16/15 | | | | (101,243 | ) |
| | USD | | | 4,914,000 | | | TRY | | | 15,398,019 | | | | 4,968,244 | | | | 12/16/15 | | | | (54,244 | ) |
Standard Chartered Bank | | TWD | | | 208,411,715 | | | USD | | | 6,409,808 | | | | 6,304,210 | | | | 10/19/15 | | | | (105,598 | ) |
| | USD | | | 3,600,000 | | | CNH | | | 23,252,112 | | | | 3,619,225 | | | | 12/16/15 | | | | (19,225 | ) |
| | USD | | | 3,795,000 | | | CNH | | | 25,280,393 | | | | 3,862,068 | | | | 09/01/16 | | | | (67,068 | ) |
| | USD | | | 1,990,000 | | | NGN | | | 415,910,000 | | | | 1,992,116 | | | | 01/05/16 | | | | (2,116 | ) |
| | USD | | | 9,525,298 | | | SGD | | | 13,632,607 | | | | 9,554,891 | | | | 12/16/15 | | | | (29,593 | ) |
| | USD | | | 3,625,000 | | | TWD | | | 120,769,594 | | | | 3,649,539 | | | | 10/29/15 | | | | (24,539 | ) |
| | ZAR | | | 51,514,723 | | | USD | | | 3,843,000 | | | | 3,665,657 | | | | 12/17/15 | | | | (177,343 | ) |
State Street Bank and Trust | | EUR | | | 3,819,575 | | | USD | | | 4,278,000 | | | | 4,273,768 | | | | 12/16/15 | | | | (4,232 | ) |
UBS AG (London) | | BRL | | | 14,622,852 | | | USD | | | 3,878,000 | | | | 3,685,579 | | | | 10/02/15 | | | | (192,421 | ) |
| | MXN | | | 198,095,110 | | | USD | | | 11,751,156 | | | | 11,645,675 | | | | 12/16/15 | | | | (105,481 | ) |
| | USD | | | 13,535,434 | | | CNH | | | 88,339,011 | | | | 13,750,097 | | | | 12/16/15 | | | | (214,663 | ) |
Westpac Banking Corp. | | MYR | | | 144,024,000 | | | USD | | | 37,494,533 | | | | 32,784,885 | | | | 10/30/15 | | | | (4,709,648 | ) |
| | USD | | | 20,652,472 | | | CNH | | | 134,581,832 | | | | 20,947,860 | | | | 12/16/15 | | | | (295,388 | ) |
| | USD | | | 7,552,000 | | | CNH | | | 49,577,936 | | | | 7,573,987 | | | | 09/01/16 | | | | (21,987 | ) |
| | | USD | | | 8,123,125 | | | KRW | | | 9,678,947,155 | | | | 8,153,562 | | | | 11/09/15 | | | | (30,437 | ) |
| TOTAL | | | | | | | | | | | | | | | | | | | | | | $ | (13,071,867 | ) |
FUTURES CONTRACTS — At September 30, 2015, the Fund had the following futures contracts:
| | | | | | | | | | | | | | | | |
| Type | | Number of
Contracts
Long (Short) | | | Expiration
Date | | | Current
Value | | | Unrealized
Gain (Loss) | |
Ultra Long U.S. Treasury Bonds | | | (130 | ) | | | December 2015 | | | $ | (20,852,813 | ) | | $ | (237,722 | ) |
2 Year U.S. Treasury Notes | | | (47 | ) | | | December 2015 | | | | (10,294,469 | ) | | | (16,157 | ) |
5 Year U.S. Treasury Notes | | | (247 | ) | | | December 2015 | | | | (29,767,359 | ) | | | (258,699 | ) |
10 Year U.S. Treasury Notes | | | (83 | ) | | | December 2015 | | | | (10,684,953 | ) | | | (111,439 | ) |
20 Year U.S. Treasury Bonds | | | (113 | ) | | | December 2015 | | | | (17,779,844 | ) | | | (201,684 | ) |
| TOTAL | | | | | | | | | | | | | | $ | (825,701 | ) |
SWAP CONTRACTS — At September 30, 2015, the Fund had the following swap contracts:
OVER THE COUNTER INTEREST RATE SWAP CONTRACTS
| | | | | | | | | | | | | | | | | | | | |
| Counterparty | | Notional
Amount
(000s) | | | Termination
Date | | Payments
Received | | Payments
Made | | Upfront
Payments
Made (Received) | | | Unrealized
Gain (Loss)* | |
Bank of America Securities LLC | | INR | | | 3,533,255 | | | 05/28/16 | | 12 month MIBOR | | 7.369% | | $ | — | | | $ | (63,736 | ) |
| | COP | | | 20,906,520 | | | 12/11/16 | | Colombia IBR
Overnight
Interbank | | 4.340 | | | — | | | | 87,651 | |
| | BRL | | | 52,790 | | | 01/02/17 | | 11.890% | | 1 month Brazilian Interbank Deposit Average | | | — | | | | (554,188 | ) |
| | THB | | | 2,285,790 | | | 04/07/17 | | 1.778 | | 6 Month Thai Reuters | | | — | | | | 35,854 | |
| | |
| 104 | | The accompanying notes are an integral part of these financial statements. |
GOLDMAN SACHS LOCAL EMERGING MARKETS DEBT FUND
|
| ADDITIONAL INVESTMENT INFORMATION (continued) |
OVER THE COUNTER INTEREST RATE SWAP CONTRACTS (continued)
| | | | | | | | | | | | | | | | | | | | |
| Counterparty | | Notional
Amount
(000s) | | | Termination
Date | | Payments
Received | | Payments
Made | | Upfront
Payments
Made (Received) | | | Unrealized
Gain (Loss)* | |
Bank of America Securities LLC (continued) | | KRW | | | 7,833,870 | | | 11/04/17 | | 2.060 % | | 3 month KWCDC | | $ | — | | | $ | 80,434 | |
| | BRL | | | 92,070 | | | 01/02/18 | | 13.962 | | 1 month Brazilian Interbank Deposit Average | | | — | | | | (659,097 | ) |
| | CLP | | | 2,809,080 | | | 06/07/23 | | 6 month CLICP | | 5.360% | | | — | | | | (219,529 | ) |
| | MXN | | | 158,630 | (a) | | 09/03/27 | | 8.590 | | Mexico Interbank TIIE 28 Days | | | — | | | | 189,655 | |
Barclays Bank PLC | | KRW | | | 14,556,500 | | | 11/07/17 | | 2.034 | | 3 month KWCDC | | | — | | | | 141,876 | |
| | TWD | | | 649,625 | | | 07/30/18 | | 1.030 | | 3 month TWD | | | — | | | | 95,018 | |
| | | | | 196,875 | | | 07/31/18 | | 1.025 | | 3 month TWD | | | — | | | | 27,871 | |
| | KRW | | | 26,091,240 | (a) | | 09/18/22 | | 3 month KWCDC | | 3.300 | | | — | | | | (1,511,848 | ) |
| | | | | 6,345,000 | (a) | | 11/21/22 | | 3 month KWCDC | | 3.150 | | | — | | | | (323,082 | ) |
| | | | | 26,791,540 | (a) | | 12/05/22 | | 3 month KWCDC | | 3.275 | | | — | | | | (1,495,525 | ) |
| | MXN | | | 703,500 | (a) | | 06/29/27 | | 8.010 | | Mexico Interbank TIIE 28 Days | | | — | | | | 125,957 | |
| | KRW | | | 6,115,600 | | | 01/24/28 | | 3 month KWCDC | | 3.000 | | | 22 | | | | (637,909 | ) |
Citibank NA | | BRL | | | 67,890 | | | 01/04/16 | | 1 month Brazilian
Interbank Deposit
Average | | 12.640 | | | — | | | | (124,655 | ) |
| | COP | | | 20,669,680 | | | 12/11/16 | | Colombia IBR
Overnight
Interbank | | 4.330 | | | — | | | | 87,480 | |
| | BRL | | | 35,190 | | | 01/02/17 | | 11.500 | | 1 month Brazilian Interbank Deposit Average | | | — | | | | (427,738 | ) |
| | KRW | | | 26,353,510 | | | 03/07/17 | | 2.875 | | 3 month KWCDC | | | — | | | | 454,595 | |
| | | | | 50,242,550 | | | 07/29/17 | | 1.625 | | 3 month KWCDC | | | — | | | | 93,219 | |
| | | | | 7,346,590 | | | 10/14/17 | | 2.240 | | 3 month KWCDC | | | — | | | | 100,484 | |
| | BRL | | | 17,340 | | | 01/02/18 | | 14.460 | | 1 month Brazilian Interbank Deposit Average | | | — | | | | (88,338 | ) |
| | ZAR | | | 162,000 | | | 05/30/20 | | 6.623 | | 3 month JIBAR | | | — | | | | (525,487 | ) |
| | KRW | | | 20,189,970 | | | 07/11/24 | | 2.940 | | 3 month KWCDC | | | — | | | | 1,616,240 | |
| | MXN | | | 94,190 | (a) | | 09/03/27 | | 8.520 | | Mexico Interbank TIIE 28 Days | | | — | | | | 100,536 | |
| | KRW | | | 19,730,000 | | | 03/13/28 | | 3 month KWCDC | | 3.165 | | | — | | | | (708,328 | ) |
Credit Suisse International (London) | | CLP | | | 5,864,500 | | | 03/28/16 | | 6 month CLICP | | 3.860 | | | — | | | | (49,630 | ) |
| | | | | 4,742,700 | | | 03/31/16 | | 6 month CLICP | | 3.850 | | | — | | | | (39,020 | ) |
| | BRL | | | 45,140 | | | 01/02/17 | | 12.580 | | 1 month Brazilian Interbank Deposit Average | | | — | | | | (349,732 | ) |
| | CLP | | | 2,675,440 | | | 05/12/17 | | 6 month CLICP | | 3.950 | | | — | | | | (12,458 | ) |
| | | | | 2,269,050 | | | 07/28/17 | | 6 month CLICP | | 3.640 | | | — | | | | 17,883 | |
| | BRL | | | 17,400 | | | 01/02/18 | | 11.960 | | 1 month Brazilian Interbank Deposit Average | | | — | | | | (294,906 | ) |
| | | | | 23,240 | | | 01/02/18 | | 11.120 | | 1 month Brazilian Interbank Deposit Average | | | — | | | | (503,142 | ) |
| | |
| The accompanying notes are an integral part of these financial statements. | | 105 |
GOLDMAN SACHS LOCAL EMERGING MARKETS DEBT FUND
Schedule of Investments (continued)
September 30, 2015 (Unaudited)
|
| ADDITIONAL INVESTMENT INFORMATION (continued) |
OVER THE COUNTER INTEREST RATE SWAP CONTRACTS (continued)
| | | | | | | | | | | | | | | | | | | | |
| Counterparty | | Notional
Amount
(000s) | | | Termination
Date | | Payments
Received | | Payments
Made | | Upfront
Payments
Made (Received) | | | Unrealized
Gain (Loss)* | |
Credit Suisse International (London) (continued) | | COP | | | 20,678,330 | | | 04/15/19 | | 3 month COP | | 5.110% | | $ | — | | | $ | 195,270 | |
| | | | | 3,635,890 | | | 05/02/24 | | Colombia IBR
Overnight
Interbank | | 6.055 | | | — | | | | 85,939 | |
Deutsche Bank AG | | BRL | | | 17,110 | | | 01/04/16 | | 11.230% | | 1 month Brazilian Interbank Deposit Average | | | — | | | | (81,368 | ) |
| | | | | 38,650 | | | 01/04/16 | | 10.370 | | 1 month Brazilian Interbank Deposit Average | | | — | | | | (251,863 | ) |
| | | | | 56,320 | | | 01/04/16 | | 10.347 | | 1 month Brazilian Interbank Deposit Average | | | — | | | | (375,246 | ) |
| | | | | 71,300 | | | 01/04/16 | | 8.860 | | 1 month Brazilian Interbank Deposit Average | | | — | | | | (1,028,189 | ) |
| | | | | 185,660 | | | 01/04/16 | | 1 month Brazilian
Interbank Deposit
Average | | 13.155 | | | — | | | | 208,031 | |
| | INR | | | 3,806,240 | | | 03/03/16 | | 6 month MIBOR | | 7.660 | | | — | | | | 12,145 | |
| | BRL | | | 4,720 | | | 01/02/17 | | 15.715 | | 1 month Brazilian Interbank Deposit Average | | | — | | | | 1,652 | |
| | | | | 44,020 | | | 01/02/17 | | 16.860 | | 1 month Brazilian Interbank Deposit Average | | | — | | | | 134,111 | |
| | | | | 114,770 | | | 01/02/17 | | 13.945 | | 1 month Brazilian Interbank Deposit Average | | | — | | | | (456,865 | ) |
| | THB | | | 459,270 | | | 01/26/17 | | 1.990 | | 6 Month Thai Reuters | | | — | | | | 65,284 | |
| | KRW | | | 11,710,120 | | | 03/03/17 | | 2.850 | | 3 month KWCDC | | | — | | | | 198,109 | |
| | | | | 7,077,400 | | | 10/28/17 | | 2.173 | | 3 month KWCDC | | | — | | | | 87,801 | |
| | BRL | | | 9,840 | | | 01/02/18 | | 11.150 | | 1 month Brazilian Interbank Deposit Average | | | — | | | | (211,046 | ) |
| | | | | 24,990 | | | 01/02/18 | | 14.580 | | 1 month Brazilian Interbank Deposit Average | | | — | | | | (115,115 | ) |
| | | | | 31,520 | | | 01/02/18 | | 11.450 | | 1 month Brazilian Interbank Deposit Average | | | — | | | | (612,146 | ) |
| | | | | 75,180 | | | 01/02/18 | | 13.731 | | 1 month Brazilian Interbank Deposit Average | | | — | | | | (612,499 | ) |
| | | | | 127,930 | | | 01/02/18 | | 11.500 | | 1 month Brazilian Interbank Deposit Average | | | — | | | | (2,471,721 | ) |
| | ZAR | | | 66,000 | | | 06/07/18 | | 7.110 | | 3 month JIBAR | | | — | | | | (23,436 | ) |
| | | | | 168,500 | | | 06/07/18 | | 7.100 | | 3 month JIBAR | | | — | | | | (62,861 | ) |
| | CLP | | | 2,048,400 | | | 07/28/19 | | 6 month CLICP | | 4.000% | | | — | | | | 31,581 | |
| | ZAR | | | 190,000 | | | 01/02/20 | | 6.200 | | 3 month JIBAR | | | (913 | ) | | | (746,606 | ) |
| | | | | 7,820 | | | 05/23/21 | | 6.550 | | 3 month JIBAR | | | — | | | | (35,691 | ) |
| | |
| 106 | | The accompanying notes are an integral part of these financial statements. |
GOLDMAN SACHS LOCAL EMERGING MARKETS DEBT FUND
|
| ADDITIONAL INVESTMENT INFORMATION (continued) |
OVER THE COUNTER INTEREST RATE SWAP CONTRACTS (continued)
| | | | | | | | | | | | | | | | | | | | |
| Counterparty | | Notional
Amount
(000s) | | | Termination
Date | | Payments
Received | | Payments
Made | | Upfront
Payments
Made (Received) | | | Unrealized
Gain (Loss)* | |
Deutsche Bank AG (continued) | | KRW | | | 17,289,860 | | | 08/23/23 | | 3.620 % | | 3 month KWCDC | | $ | — | | | $ | 2,042,449 | |
| | BRL | | | 22,680 | | | 01/02/25 | | 1 month Brazilian
Interbank Deposit
Average | | 12.340% | | | — | | | | 550,232 | |
| | MXN | | | 94,990 | | | 09/22/27 | | 7.940 | | Mexico Interbank TIIE 28 Days | | | — | | | | (714 | ) |
JPMorgan Securities, Inc. | | BRL | | | 153,100 | | | 01/04/16 | | 9.980 | | 1 month Brazilian Interbank Deposit Average | | | — | | | | (1,214,913 | ) |
| | INR | | | 4,401,630 | | | 06/01/16 | | 12 month MIBOR | | 7.346 | | | — | | | | (19,298 | ) |
| | THB | | | 387,070 | | | 11/24/16 | | 1.810 | | 6 Month Thai Reuters | | | — | | | | 28,402 | |
| | BRL | | | 75,160 | | | 01/02/17 | | 1 month Brazilian
Interbank Deposit
Average | | 12.290 | | | — | | | | 693,605 | |
| | | | | 266,920 | | | 01/02/17 | | 1 month Brazilian
Interbank Deposit
Average | | 9.040 | | | — | | | | 6,939,933 | |
| | | | | 25,640 | | | 01/02/18 | | 14.830 | | 1 month Brazilian Interbank Deposit Average | | | — | | | | (92,304 | ) |
| | | | | 31,050 | | | 01/02/18 | | 13.910 | | 1 month Brazilian Interbank Deposit Average | | | — | | | | (229,188 | ) |
| | COP | | | 10,159,090 | | | 04/22/19 | | 3 month COP | | 5.190 | | | — | | | | 88,868 | |
| | ZAR | | | 125,000 | | | 12/20/21 | | 7.760 | | 3 month JIBAR | | | (1,240 | ) | | | (112,791 | ) |
Morgan Stanley & Co. International PLC | | BRL | | | 46,050 | | | 01/04/16 | | 10.190 | | 1 month Brazilian Interbank Deposit Average | | | — | | | | (331,273 | ) |
| | THB | | | 136,160 | | | 11/28/16 | | 1.820 | | 6 Month Thai Reuters | | | — | | | | 11,179 | |
| | BRL | | | 5,160 | | | 01/02/17 | | 16.490 | | 1 month Brazilian Interbank Deposit Average | | | — | | | | 11,216 | |
| | | | | 54,300 | | | 01/02/17 | | 15.954 | | 1 month Brazilian Interbank Deposit Average | | | — | | | | 49,654 | |
| | | | | 58,030 | | | 01/02/17 | | 15.575 | | 1 month Brazilian Interbank Deposit Average | | | — | | | | (1,263 | ) |
| | KRW | | | 5,518,900 | | | 10/13/17 | | 2.250 | | 3 month KWCDC | | | — | | | | 76,385 | |
| | | | | 6,738,260 | | | 10/14/17 | | 2.245 | | 3 month KWCDC | | | — | | | | 92,801 | |
| | | | | 6,738,270 | | | 10/14/17 | | 2.250 | | 3 month KWCDC | | | — | | | | 93,440 | |
| | BRL | | | 56,730 | | | 01/04/21 | | 1 month Brazilian
Interbank Deposit
Average | | 11.980 | | | — | | | | 1,400,372 | |
| | MXN | | | 310,000 | | | 06/17/21 | | 5.630 | | Mexico Interbank TIIE 28 Days | | | — | | | | 11,203 | |
| | COP | | | 3,635,890 | | | 05/02/24 | | 6.055 | | | | | (5,860 | ) | | | (80,426 | ) |
| | | KRW | | | 28,000,000 | (a) | | 03/03/28 | | 3 month KWCDC | | 3.135 | | | — | | | | (972,613 | ) |
| TOTAL | | | | | | | | | | | | | | $ | (7,991 | ) | | $ | (2,363,368 | ) |
| | * | | There are no upfront payments on the swap contracts, therefore the unrealized gain (loss) on the swap contracts is equal to their market value. |
| | (a) | | Represents forward starting interest rate swaps whose effective dates of commencement of accruals and cash flows occur subsequent to September 30, 2015. |
| | |
| The accompanying notes are an integral part of these financial statements. | | 107 |
GOLDMAN SACHS LOCAL EMERGING MARKETS DEBT FUND
Schedule of Investments (continued)
September 30, 2015 (Unaudited)
|
| ADDITIONAL INVESTMENT INFORMATION (continued) |
CENTRALLY CLEARED INTEREST RATE SWAP CONTRACTS
| | | | | | | | | | | | | | | | |
| | | | | | Rates Exchanged | | Market Value | |
Notional
Amount
(000s) | | | Termination
Date | | Payments
Received | | Payments
Made | | Upfront
Payments
Made (Received) | | | Unrealized
Gain (Loss) | |
| MXN | 677,100 | | | 09/15/16 | | 3.958% | | Mexico Interbank TIIE
28 Days | | $ | 71 | | | $ | 95,790 | |
| | 205,600 | | | 09/16/16 | | 3.975 | | Mexico Interbank TIIE
28 Days | | | 22 | | | | 29,198 | |
| | 206,210 | | | 09/19/16 | | 3.980 | | Mexico Interbank TIIE
28 Days | | | 37 | | | | 25,899 | |
| $ | 57,860 | | | 09/21/16 | | 3 month LIBOR | | 0.592% | | | 182 | | | | (62,263 | ) |
| MXN | 218,520 | | | 09/22/16 | | 3.850 | | Mexico Interbank TIIE
28 Days | | | 23 | | | | 6,034 | |
| ZAR | 103,550 | | | 06/13/19 | | 7.640 | | 3 month JIBAR | | | 37 | | | | 16,232 | |
| | 135,580 | | | 09/08/19 | | 7.310 | | 3 month JIBAR | | | (276 | ) | | | (104,456 | ) |
| HUF | 2,554,920 | (a) | | 12/16/20 | | 2.415 | | 6 month BUBOR | | | 95 | | | | (170,824 | ) |
| MXN | 259,850 | | | 12/07/22 | | 5.250 | | Mexico Interbank TIIE
28 Days | | | (908,000 | ) | | | 146,802 | |
| $ | 9,400 | (a) | | 12/16/22 | | 3 month LIBOR | | 2.250 | | | (138,214 | ) | | | (161,088 | ) |
| MXN | 54,290 | | | 11/20/24 | | Mexico Interbank TIIE
28 Days | | 5.955 | | | 26 | | | | 74,481 | |
| ZAR | 52,850 | | | 12/18/24 | | 3 month JIBAR | | 7.890 | | | 32 | | | | 106,801 | |
| MXN | 88,930 | | | 01/24/25 | | Mexico Interbank TIIE
28 Days | | 5.660 | | | 72 | | | | 257,699 | |
| PLN | 73,250 | | | 06/24/25 | | 3.000 | | 6 month WIBOR | | | 285 | | | | 935,140 | |
| EUR | 6,770 | (a) | | 12/16/25 | | 6 month EURO | | 0.750 | | | 220,893 | | | | (33,529 | ) |
| $ | 9,100 | | | 12/16/30 | | 3 month LIBOR | | 2.500 | | | 61,096 | | | | (262,195 | ) |
| | TOTAL | | | | | | | | | $ | (763,619 | ) | | $ | 899,721 | |
| | (a) | | Represents forward starting interest rate swaps whose effective dates of commencement of accruals and cash flows occur subsequent to September 30, 2015. |
| | |
| 108 | | The accompanying notes are an integral part of these financial statements. |
GOLDMAN SACHS LOCAL EMERGING MARKETS DEBT FUND
|
| ADDITIONAL INVESTMENT INFORMATION (continued) |
OVER THE COUNTER CREDIT DEFAULT SWAP CONTRACTS
| | | | | | | | | | | | | | | | | | | | | | | | | | |
| | | | | | | | | | | | | | | | | Market Value | |
| Counterparty | | Referenced
Obligation | | Notional
Amount
(000s) | | | Rates Received
(Paid) | | | Termination
Date | | | Credit
Spread at
September 30,
2015(b) | | | Upfront
Payments
Made (Received) | | | Unrealized
Gain (Loss) | |
Protection Purchased: | | | | | | | | | | | | | | | | | | | | | | | | | | |
Bank of America Securities LLC | | People’s Republic of China 4.250%, 10/28/14 | | $ | 600 | | | | (1.000 | )% | | | 06/20/19 | | | | 0.965 | % | | $ | (2,664 | ) | | $ | 1,732 | |
| | | | | 560 | | | | (1.000 | ) | | | 06/20/19 | | | | 0.965 | | | | (2,769 | ) | | | 1,900 | |
Barclays Bank PLC | | | | | 3,170 | | | | (1.000 | ) | | | 03/20/19 | | | | 0.904 | | | | (8,423 | ) | | | (2,802 | ) |
Citibank NA | | | | | 29,550 | | | | (1.000 | ) | | | 03/20/19 | | | | 0.904 | | | | (99,174 | ) | | | (5,463 | ) |
| | | | | 44,310 | | | | (1.000 | ) | | | 06/20/19 | | | | 0.965 | | | | (197,608 | ) | | | 128,792 | |
JPMorgan Securities, Inc. | | | | | 3,310 | | | | (1.000 | ) | | | 03/20/19 | | | | 0.904 | | | | (8,173 | ) | | | (3,548 | ) |
| | | | | | 1,630 | | | | (1.000 | ) | | | 06/20/19 | | | | 0.965 | | | | (8,199 | ) | | | 5,668 | |
| TOTAL | | | | | | | | | | | | | | | | | | | | $ | (327,010 | ) | | $ | 126,279 | |
| | (b) | | Credit spread on the Referenced Obligation, together with the term of the swap contract, are indicators of payment/performance risk. The likelihood of a credit event occurring which would require a fund to make a payment or otherwise be required to perform under the swap contract is generally greater as the credit spread and the term of the swap contract increase. |
OVER THE COUNTER CROSS CURRENCY SWAP CONTRACTS
| | | | | | | | | | | | | | | | | | | | | | | | |
| | | | | | | | | | Rates Exchanged | | | Market Value | |
| Counterparty | | Notional Amount
of Currency
Received | | | Notional Amount
of Currency
Delivered | | Termination
Date(c) | | Receive | | Pay | | | Upfront Payments
Made (Received) | | | Unrealized
Gain (Loss) | |
Citibank NA | | TRY | | | 12,250,000 | | | 5,573,248 | | 03/10/16 | | 11.070% | | | 3 Month LIBOR | | | $ | 43,956 | | | $ | (1,330,132 | ) |
Deutsche Bank AG | | | | | 25,510,000 | | | 11,452,301 | | 03/13/16 | | 11.480 | | | 3 Month LIBOR | | | | (89,778 | ) | | | (2,409,538 | ) |
| | ZAR | | | 54,520,000 | | | 5,245,039 | | 05/12/24 | | 3 Month JBAR | | | 3 Month LIBOR | | | | 29,057 | | | | (1,323,267 | ) |
Citibank NA | | | | | 26,400,000 | | | 2,540,263 | | 05/13/24 | | 3 Month JBAR | | | 3 Month LIBOR | | | | 1,169 | | | | (636,871 | ) |
Morgan Stanley & Co. International PLC | | | | | 54,542,000 | | | 5,262,132 | | 05/13/24 | | 3 Month JBAR | | | 3 Month LIBOR | | | | 4,955 | | | | (1,314,539 | ) |
Deutsche Bank AG | | | | | 42,202,250 | | | 4,054,984 | | 05/23/19 | | 3 Month JBAR | | | 3 Month LIBOR | | | | 8,688 | | | | (1,004,938 | ) |
| | | | | 38,520,000 | | | 3,594,289 | | 07/15/24 | | 3 Month JBAR | | | 3 Month LIBOR | | | | 4,617 | | | | (790,149 | ) |
Morgan Stanley & Co. International PLC | | | | | 29,540,000 | | | 2,768,510 | | 07/17/24 | | 3 Month JBAR | | | 3 month LIBOR | | | | (5,244 | ) | | | (614,165 | ) |
| | | | | 55,121,000 | | | 5,153,904 | | 08/12/24 | | 3 Month JBAR | | | 3 month LIBOR | | | | 16,437 | | | | (1,169,602 | ) |
Deutsche Bank AG | | TRY | | | 6,600,000 | | | 2,960,969 | | 12/04/16 | | 8.05 | | | 3 Month LIBOR | | | | (2,257 | ) | | | (715,630 | ) |
| TOTAL | | | | | | | | | | | | | | | | | | $ | 11,600 | | | $ | (11,308,831 | ) |
| | (c) | | At the termination date, the notional amount of the currency received will be exchanged back for the notional amount of the currency delivered. |
| | |
| The accompanying notes are an integral part of these financial statements. | | 109 |
GOLDMAN SACHS LOCAL EMERGING MARKETS DEBT FUND
Schedule of Investments (continued)
September 30, 2015 (Unaudited)
|
| ADDITIONAL INVESTMENT INFORMATION (continued) |
NON-DELIVERABLE BOND FORWARD CONTRACTS#
| | | | | | | | | | | | |
| Counterparty | | Notional
Amount
(000s) | | | Reference
Obligation | | Settlement
Date | | Unrealized
Gain (Loss)* | |
Deutsche Bank AG | | COP | 8,508,900 | | | Titulos de Tesoreria 7.750%, 09/18/30 | | 10/14/15 | | $ | 27,115 | |
| | | 21,429,300 | | | Titulos de Tesoreria 10.000%, 07/24/24 | | 10/14/15 | | | 11,694 | |
| | | 4,447,900 | | | Titulos de Tesoreria 7.750%, 09/18/30 | | 10/14/15 | | | 16,220 | |
Bank of America Securities LLC | | | 5,445,600 | | | Titulos de Tesoreria 10.000%, 07/24/24 | | 10/18/15 | | | (42,635 | ) |
HSBC Bank PLC | | | 7,000,000 | | | Titulos de Tesoreria 7.750%, 09/18/30 | | 10/20/15 | | | (39,128 | ) |
Deutsche Bank AG | | | 7,525,200 | | | Titulos de Tesoreria 7.750%, 09/18/30 | | 10/15/15 | | | 11,454 | |
| | | 4,239,900 | | | Titulos de Tesoreria 10.000%, 07/24/24 | | 10/15/15 | | | 3,797 | |
| | | | 10,105,800 | | | Titulos de Tesoreria 7.500%, 08/26/26 | | 10/15/15 | | | 13,255 | |
| TOTAL | | | | | | | | | | $ | 1,772 | |
| | # | | Represents a short term forward contract to purchase the referenced obligation denominated in a non-deliverable foreign currency. |
| | * | | There are no upfront payments on the bond forward contracts, therefore the unrealized gain (loss) of the bond forward contracts is equal to their market value. |
| | |
| 110 | | The accompanying notes are an integral part of these financial statements. |
GOLDMAN SACHS U.S. MORTGAGES FUND
Schedule of Investments
September 30, 2015 (Unaudited)
| | | | | | | | | | | | | | |
Principal
Amount | | | Interest
Rate | | | Maturity
Date | | | Value | |
| | Mortgage-Backed Obligations – 111.1% | |
| | Collateralized Mortgage Obligations – 5.7% | |
| | Adjustable Rate Non-Agency(a) – 0.9% | |
| Adjustable Rate Mortgage Trust Series 2004-5, Class 2A1 | |
| $ | 146,273 | | | | 2.704 | % | | | 04/25/35 | | | $ | 141,162 | |
| Bear Stearns Alt-A Trust Series 2005-5, Class 21A1 | |
| | 883,492 | | | | 2.353 | | | | 07/25/35 | | | | 844,074 | |
| Countrywide Alternative Loan Trust Series 2005-16, Class A1 | |
| | 638,431 | | | | 1.829 | | | | 06/25/35 | | | | 554,666 | |
| Countrywide Alternative Loan Trust Series 2005-38, Class A1 | |
| | 175,046 | | | | 1.684 | | | | 09/25/35 | | | | 157,050 | |
| Harborview Mortgage Loan Trust Series 2005-16, Class 2A1A | |
| | 277,950 | | | | 0.456 | | | | 01/19/36 | | | | 176,878 | |
| Impac CMB Trust Series 2004-08, Class 1A | |
| | 63,290 | | | | 0.919 | | | | 10/25/34 | | | | 51,452 | |
| Morgan Stanley Mortgage Loan Trust Series 2004-8AR,
Class 4A1 |
|
| | 647,692 | | | | 2.481 | | | | 10/25/34 | | | | 643,973 | |
| | | | | | | | | | | | | | |
| | | | | | | | | | | | | 2,569,255 | |
| | |
| | Interest Only(b) – 0.6% | |
| CS First Boston Mortgage Securities Corp. Series 2003-19,
Class 1A2 |
|
| | 3,766 | | | | 5.250 | | | | 07/25/33 | | | | 115 | |
| FHLMC REMIC Series 4273, Class PS(a) | |
| | 575,209 | | | | 5.893 | | | | 11/15/43 | | | | 90,087 | |
| FHLMC REMIC Series 4456, Class IO | |
| | 553,268 | | | | 4.500 | | | | 10/15/44 | | | | 106,650 | |
| FHLMC STRIPS Series 329, Class C1 | |
| | 1,509,134 | | | | 4.000 | | | | 12/15/41 | | | | 283,481 | |
| FNMA REMIC Series 2010-126, Class LS(a) | |
| | 975,523 | | | | 4.803 | | | | 11/25/40 | | | | 197,773 | |
| FNMA REMIC Series 2012-146, Class IO | |
| | 3,502,059 | | | | 3.500 | | | | 01/25/43 | | | | 760,899 | |
| GNMA REMIC Series 2013-113, Class SD(a) | |
| | 396,859 | | | | 6.491 | | | | 08/16/43 | | | | 74,599 | |
| GNMA REMIC Series 2014-11, Class KI | |
| | 627,498 | | | | 4.500 | | | | 12/20/42 | | | | 90,572 | |
| GNMA REMIC Series 2015-72, Class JI | |
| | 271,127 | | | | 3.500 | | | | 05/20/45 | | | | 40,321 | |
| GNMA REMIC Series 2015-83, Class PI | |
| | 445,021 | | | | 3.500 | | | | 06/20/45 | | | | 67,153 | |
| Master Adjustable Rate Mortgages Trust Series 2003-2,
Class 3AX(a) |
|
| | 14,945 | | | | 0.123 | | | | 08/25/33 | | | | 92 | |
| Master Adjustable Rate Mortgages Trust Series 2003-2,
Class 4AX(a) |
|
| | 2,175 | | | | 0.320 | | | | 07/25/33 | | | | 25 | |
| | | | | | | | | | | | | | |
| | | | | | | | | | | | | 1,711,767 | |
| | |
| | Inverse Floaters(a) – 0.5% | |
| FNMA REMIC Series 2013-96, Class SW | |
| | 478,816 | | | | 5.906 | | | | 09/25/43 | | | | 77,642 | |
| FNMA REMIC Series 2015-20, Class ES | |
| | 959,556 | | | | 5.956 | | | | 04/25/45 | | | | 230,897 | |
| GNMA REMIC Series 2010-1, Class SD | |
| | 36,195 | | | | 5.574 | | | | 01/20/40 | | | | 6,168 | |
| GNMA REMIC Series 2010-31, Class SA | |
| | 590,384 | | | | 5.534 | | | | 03/20/40 | | | | 87,433 | |
| | |
| | | | | | | | | | | | | | |
Principal
Amount | | | Interest
Rate | | | Maturity
Date | | | Value | |
| | Mortgage-Backed Obligations – (continued) | |
| | Inverse Floaters(a) – (continued) | |
| GNMA REMIC Series 2010-85, Class SN | |
| $ | 90,904 | | | | 5.724 | % | | | 07/20/40 | | | $ | 16,179 | |
| GNMA REMIC Series 2010-98, Class QS | |
| | 321,989 | | | | 6.384 | | | | 01/20/40 | | | | 47,171 | |
| GNMA REMIC Series 2011-17, Class SA | |
| | 377,483 | | | | 5.884 | | | | 09/20/40 | | | | 56,089 | |
| GNMA REMIC Series 2011-61, Class CS | |
| | 265,729 | | | | 6.464 | | | | 12/20/35 | | | | 23,200 | |
| GNMA REMIC Series 2011-79, Class AS | |
| | 131,988 | | | | 5.894 | | | | 07/20/37 | | | | 4,248 | |
| GNMA REMIC Series 2015-110, Class MS | |
| | 1,181,472 | | | | 5.494 | | | | 08/20/45 | | | | 190,240 | |
| GNMA REMIC Series 2015-111, Class SM | |
| | 993,075 | | | | 5.984 | | | | 08/20/45 | | | | 183,167 | |
| GNMA REMIC Series 2015-112, Class SB | |
| | 984,560 | | | | 5.524 | | | | 08/20/45 | | | | 161,843 | |
| GNMA REMIC Series 2015-126, Class HS | |
| | 2,000,000 | | | | 6.001 | | | | 09/20/45 | | | | 371,180 | |
| GNMA REMIC Series 2015-90, Class PI | |
| | 370,876 | | | | 3.500 | | | | 04/20/45 | | | | 54,365 | |
| | | | | | | | | | | | | | |
| | | | | | | | | | | | | 1,509,822 | |
| | |
| | Planned Amortization Class – 0.4% | |
| FHLMC REMIC Series 3748 | |
| | 1,000,000 | | | | 4.000 | | | | 11/15/39 | | | | 1,069,295 | |
| | |
| | Sequential Fixed Rate – 1.6% | |
| FHLMC REMIC Series 2042, Class N | |
| | 118,082 | | | | 6.500 | | | | 03/15/28 | | | | 133,263 | |
| FNMA REMIC Series 2000-16, Class ZG | |
| | 251,682 | | | | 8.500 | | | | 06/25/30 | | | | 298,608 | |
| FNMA REMIC Series 2011-52, Class GB | |
| | 1,107,014 | | | | 5.000 | | | | 06/25/41 | | | | 1,226,676 | |
| FNMA REMIC Series 2011-99, Class DB | |
| | 1,075,000 | | | | 5.000 | | | | 10/25/41 | | | | 1,192,589 | |
| FNMA REMIC Series 2012-111, Class B | |
| | 201,737 | | | | 7.000 | | | | 10/25/42 | | | | 230,618 | |
| FNMA REMIC Series 2012-153, Class B | |
| | 707,003 | | | | 7.000 | | | | 07/25/42 | | | | 829,134 | |
| FNMA REMIC Series 2015 | |
| | 1,000,000 | | | | 6.054 | | | | 10/01/45 | | | | 158,218 | |
| FNMA REMIC Series 2015-79 | |
| | 3,075,000 | | | | 5.506 | | | | 10/01/45 | | | | 412,242 | |
| | | | | | | | | | | | | | |
| | | | | | | | | | | | | 4,481,348 | |
| | |
| | Sequential Floating Rate(a) – 1.1% | |
| FHLMC REMIC Series 4103, Class BF | |
| | 1,974,711 | | | | 0.557 | | | | 12/15/38 | | | | 1,979,783 | |
| FNMA REMIC Series 2011-63, Class FG | |
| | 259,823 | | | | 0.644 | | | | 07/25/41 | | | | 261,485 | |
| New Residential Mortgage Loan Trust Series 2015-1A,
Class A1(c) |
|
| | 732,509 | | | | 3.750 | | | | 04/25/52 | | | | 758,706 | |
| | | | | | | | | | | | | | |
| | | | | | | | | | | | | 2,999,974 | |
| | |
| | |
| The accompanying notes are an integral part of these financial statements. | | 111 |
GOLDMAN SACHS U.S. MORTGAGES FUND
Schedule of Investments (continued)
September 30, 2015 (Unaudited)
| | | | | | | | | | | | | | |
Principal
Amount | | | Interest
Rate | | | Maturity
Date | | | Value | |
| | Mortgage-Backed Obligations – (continued) | |
| | Support – 0.6% | |
| FNMA REMIC Series 2005-59, Class KZ | |
| $ | 1,501,337 | | | | 5.500 | % | | | 07/25/35 | | | $ | 1,672,228 | |
| | |
| TOTAL COLLATERALIZED
MORTGAGE OBLIGATIONS |
| | $ | 16,013,689 | |
| | |
| | Commercial Mortgage-Backed Securities – 13.1% | |
| | Sequential Fixed Rate – 4.5% | |
| Bear Stearns Commercial Mortgage Securities Trust
Series 2007-PW18, Class A1A |
|
| $ | 3,873,706 | | | | 5.602 | % | | | 06/11/50 | | | $ | 4,133,488 | |
| FHLMC Multifamily Structured Pass-Through Certificates
Series K005, Class A2 |
|
| | 2,000,000 | | | | 4.317 | | | | 11/25/19 | | | | 2,208,542 | |
| FHLMC Multifamily Structured Pass-Through Certificates
Series K027, Class A2 |
|
| | 1,400,000 | | | | 2.637 | | | | 01/25/23 | | | | 1,429,425 | |
| FHLMC Multifamily Structured Pass-Through Certificates
Series K028, Class A2 |
|
| | 3,450,000 | | | | 3.111 | | | | 02/25/23 | | | | 3,631,235 | |
| FHLMC Multifamily Structured Pass-Through Certificates
Series K044, Class A2 |
|
| | 1,400,000 | | | | 2.811 | | | | 01/25/25 | | | | 1,417,146 | |
| | | | | | | | | | | | | | |
| | | | | | | | | | | | | 12,819,836 | |
| | |
| | Sequential Floating Rate(a) – 8.6% | |
| Banc of America Commercial Mortgage, Inc. Series 2007-2,
Class AM |
|
| | 150,000 | | | | 5.794 | | | | 04/10/49 | | | | 157,470 | |
| Citigroup Commercial Mortgage Trust Series 2008-C7,
Class A1A |
|
| | 2,249,692 | | | | 6.263 | | | | 12/10/49 | | | | 2,421,681 | |
| Commercial Mortgage Trust Series 2007-C9, Class A1A | |
| | 2,282,285 | | | | 5.989 | | | | 12/10/49 | | | | 2,415,940 | |
| Credit Suisse Commercial Mortgage Trust Series 2006-C3,
Class A3 |
|
| | 5,739,171 | | | | 5.998 | | | | 06/15/38 | | | | 5,801,430 | |
| FHLMC Multifamily Structured Pass-Through Certificates
Series K714, Class A2 |
|
| | 700,000 | | | | 3.034 | | | | 10/25/20 | | | | 736,292 | |
| GS Mortgage Securities Trust Series 2007-GG10, Class A4 | |
| | 3,587,738 | | | | 5.988 | | | | 08/10/45 | | | | 3,788,034 | |
| LB-UBS Commercial Mortgage Trust Series 2007-C7, Class A3 | |
| | 746,705 | | | | 5.866 | | | | 09/15/45 | | | | 800,702 | |
| ML-CFC Commercial Mortgage Trust Series 2006-2, Class A4 | |
| | 3,423,816 | | | | 5.879 | | | | 06/12/46 | | | | 3,483,787 | |
| Morgan Stanley Capital I Trust Series 2007-HQ11, Class AM | |
| | 50,000 | | | | 5.478 | | | | 02/12/44 | | | | 51,924 | |
| Morgan Stanley Capital I Trust Series 2007-HQ13, Class AM | |
| | 50,000 | | | | 5.931 | | | | 12/15/44 | | | | 51,425 | |
| Morgan Stanley Capital I Trust Series 2007-T25, Class A1A | |
| | 1,095,859 | | | | 5.509 | | | | 11/12/49 | | | | 1,139,522 | |
| Wachovia Bank Commercial Mortgage Trust Series 2006-C26,
Class A1A |
|
| | 2,045,838 | | | | 6.009 | | | | 06/15/45 | | | | 2,090,694 | |
| | |
| | | | | | | | | | | | | | |
Principal
Amount | | | Interest
Rate | | | Maturity
Date | | | Value | |
| | Mortgage-Backed Obligations – (continued) | |
| | Sequential Floating Rate(a) – (continued) | |
| WF-RBS Commercial Mortgage Trust Series 2011-C2,
Class A4(c) |
|
| $ | 1,300,000 | | | | 4.869 | % | | | 02/15/44 | | | $ | 1,461,311 | |
| | | | | | | | | | | | | | |
| | | | | | | | | | | | | 24,400,212 | |
| | |
| TOTAL COMMERCIAL
MORTGAGE-BACKED SECURITIES |
| | $ | 37,220,048 | |
| | |
| | Federal Agencies – 92.3% | |
| | Adjustable Rate FHLMC(a) – 0.1% | |
| $ | 95,718 | | | | 2.493 | % | | | 04/01/33 | | | $ | 101,981 | |
| | 44,788 | | | | 2.360 | | | | 09/01/33 | | | | 47,723 | |
| | 22,075 | | | | 2.232 | | | | 10/01/34 | | | | 23,445 | |
| | 37,209 | | | | 2.375 | | | | 11/01/34 | | | | 39,744 | |
| | 37,456 | | | | 2.465 | | | | 02/01/35 | | | | 40,014 | |
| | 126,233 | | | | 2.451 | | | | 06/01/35 | | | | 134,753 | |
| | | | | | | | | | | | | | |
| | | | | | | | | | | | | 387,660 | |
| | |
| | Adjustable Rate FNMA(a) – 0.5% | |
| | 4,813 | | | | 1.930 | | | | 07/01/22 | | | | 4,919 | |
| | 15,091 | | | | 1.909 | | | | 07/01/27 | | | | 15,585 | |
| | 14,563 | | | | 1.909 | | | | 11/01/27 | | | | 15,034 | |
| | 6,326 | | | | 1.909 | | | | 01/01/31 | | | | 6,574 | |
| | 7,952 | | | | 1.909 | | | | 06/01/32 | | | | 8,275 | |
| | 9,710 | | | | 1.930 | | | | 08/01/32 | | | | 10,076 | |
| | 38,156 | | | | 1.930 | | | | 05/01/33 | | | | 39,633 | |
| | 14,301 | | | | 1.806 | | | | 06/01/33 | | | | 14,827 | |
| | 184,212 | | | | 2.492 | | | | 06/01/33 | | | | 196,350 | |
| | 10,941 | | | | 2.440 | | | | 07/01/33 | | | | 11,647 | |
| | 177,005 | | | | 1.937 | | | | 08/01/33 | | | | 183,324 | |
| | 499 | | | | 2.625 | | | | 09/01/33 | | | | 533 | |
| | 969 | | | | 2.199 | | | | 12/01/33 | | | | 1,013 | |
| | 94,261 | | | | 2.266 | | | | 12/01/33 | | | | 99,779 | |
| | 3,438 | | | | 2.510 | | | | 04/01/34 | | | | 3,673 | |
| | 256,632 | | | | 2.780 | | | | 08/01/34 | | | | 274,500 | |
| | 43,566 | | | | 2.301 | | | | 11/01/34 | | | | 46,193 | |
| | 58,739 | | | | 2.322 | | | | 02/01/35 | | | | 62,634 | |
| | 78,029 | | | | 2.244 | | | | 03/01/35 | | | | 82,554 | |
| | 48,757 | | | | 2.437 | | | | 04/01/35 | | | | 51,973 | |
| | 105,650 | | | | 2.484 | | | | 05/01/35 | | | | 112,617 | |
| | 12,868 | | | | 1.909 | | | | 11/01/35 | | | | 13,299 | |
| | 44,274 | | | | 1.909 | | | | 12/01/37 | | | | 45,768 | |
| | 32,444 | | | | 1.909 | | | | 01/01/38 | | | | 33,525 | |
| | 18,486 | | | | 1.909 | | | | 11/01/40 | | | | 19,208 | |
| | | | | | | | | | | | | | |
| | | | | | | | | | | | | 1,353,513 | |
| | |
| | Adjustable Rate GNMA(a) – 0.5% | |
| | 27,015 | | | | 1.750 | | | | 06/20/23 | | | | 27,541 | |
| | 13,287 | | | | 1.625 | | | | 07/20/23 | | | | 13,566 | |
| | 13,414 | | | | 1.625 | | | | 08/20/23 | | | | 13,698 | |
| | 34,495 | | | | 1.625 | | | | 09/20/23 | | | | 35,232 | |
| | 10,470 | | | | 1.750 | | | | 03/20/24 | | | | 10,699 | |
| | 92,486 | | | | 1.750 | | | | 04/20/24 | | | | 94,501 | |
| | 10,248 | | | | 1.750 | | | | 05/20/24 | | | | 10,473 | |
| | 75,159 | | | | 1.750 | | | | 06/20/24 | | | | 76,824 | |
| | 17,047 | | | | 2.000 | | | | 06/20/24 | | | | 17,504 | |
| | 26,067 | | | | 1.625 | | | | 07/20/24 | | | | 26,671 | |
| | |
| | |
| 112 | | The accompanying notes are an integral part of these financial statements. |
GOLDMAN SACHS U.S. MORTGAGES FUND
| | | | | | | | | | | | | | |
Principal
Amount | | | Interest
Rate | | | Maturity
Date | | | Value | |
| | Mortgage-Backed Obligations – (continued) | |
| | Adjustable Rate GNMA(a) – (continued) | |
| $ | 27,143 | | | | 2.000 | % | | | 07/20/24 | | | $ | 27,884 | |
| | 47,725 | | | | 1.625 | | | | 08/20/24 | | | | 48,838 | |
| | 24,109 | | | | 2.000 | | | | 08/20/24 | | | | 24,771 | |
| | 22,874 | | | | 1.625 | | | | 09/20/24 | | | | 23,411 | |
| | 27,966 | | | | 2.000 | | | | 11/20/24 | | | | 28,751 | |
| | 11,180 | | | | 2.000 | | | | 12/20/24 | | | | 11,496 | |
| | 17,288 | | | | 2.500 | | | | 12/20/24 | | | | 18,029 | |
| | 19,415 | | | | 2.000 | | | | 01/20/25 | | | | 19,967 | |
| | 10,395 | | | | 2.000 | | | | 02/20/25 | | | | 10,693 | |
| | 36,064 | | | | 2.000 | | | | 05/20/25 | | | | 37,118 | |
| | 30,844 | | | | 2.000 | | | | 07/20/25 | | | | 31,759 | |
| | 13,553 | | | | 1.750 | | | | 02/20/26 | | | | 13,903 | |
| | 727 | | | | 1.625 | | | | 07/20/26 | | | | 747 | |
| | 18,592 | | | | 1.750 | | | | 01/20/27 | | | | 19,102 | |
| | 16,295 | | | | 2.000 | | | | 01/20/27 | | | | 16,813 | |
| | 13,935 | | | | 1.750 | | | | 02/20/27 | | | | 14,320 | |
| | 101,903 | | | | 1.750 | | | | 04/20/27 | | | | 104,718 | |
| | 10,783 | | | | 1.750 | | | | 05/20/27 | | | | 11,083 | |
| | 12,581 | | | | 1.750 | | | | 06/20/27 | | | | 12,932 | |
| | 4,638 | | | | 1.625 | | | | 11/20/27 | | | | 4,772 | |
| | 16,293 | | | | 1.625 | | | | 12/20/27 | | | | 16,767 | |
| | 33,569 | | | | 1.750 | | | | 01/20/28 | | | | 34,548 | |
| | 12,383 | | | | 1.750 | | | | 02/20/28 | | | | 12,746 | |
| | 13,838 | | | | 1.750 | | | | 03/20/28 | | | | 14,246 | |
| | 57,451 | | | | 1.625 | | | | 07/20/29 | | | | 59,220 | |
| | 31,925 | | | | 1.625 | | | | 08/20/29 | | | | 32,911 | |
| | 7,757 | | | | 1.625 | | | | 09/20/29 | | | | 8,008 | |
| | 31,940 | | | | 1.625 | | | | 10/20/29 | | | | 32,960 | |
| | 39,598 | | | | 1.625 | | | | 11/20/29 | | | | 40,868 | |
| | 8,635 | | | | 1.625 | | | | 12/20/29 | | | | 8,908 | |
| | 12,170 | | | | 1.750 | | | | 01/20/30 | | | | 12,563 | |
| | 5,626 | | | | 1.750 | | | | 02/20/30 | | | | 5,809 | |
| | 32,313 | | | | 1.750 | | | | 03/20/30 | | | | 33,362 | |
| | 35,973 | | | | 1.750 | | | | 04/20/30 | | | | 37,138 | |
| | 55,328 | | | | 1.750 | | | | 05/20/30 | | | | 57,122 | |
| | 40,134 | | | | 2.000 | | | | 05/20/30 | | | | 41,706 | |
| | 8,432 | | | | 1.750 | | | | 06/20/30 | | | | 8,695 | |
| | 79,195 | | | | 2.000 | | | | 07/20/30 | | | | 82,192 | |
| | 15,612 | | | | 2.000 | | | | 09/20/30 | | | | 16,233 | |
| | 27,705 | | | | 1.625 | | | | 10/20/30 | | | | 28,631 | |
| | | | | | | | | | | | | | |
| | | | | | | | | | | | | 1,392,449 | |
| | |
| | FHLMC – 15.1% | |
| | 636 | | | | 6.000 | | | | 03/01/16 | | | | 641 | |
| | 117 | | | | 5.000 | | | | 09/01/16 | | | | 119 | |
| | 1,035 | | | | 5.000 | | | | 11/01/16 | | | | 1,077 | |
| | 4,445 | | | | 5.000 | | | | 01/01/17 | | | | 4,611 | |
| | 6,686 | | | | 5.000 | | | | 02/01/17 | | | | 6,946 | |
| | 6,335 | | | | 5.000 | | | | 03/01/17 | | | | 6,571 | |
| | 12,273 | | | | 5.000 | | | | 04/01/17 | | | | 12,747 | |
| | 397 | | | | 5.000 | | | | 05/01/17 | | | | 413 | |
| | 517 | | | | 5.000 | | | | 08/01/17 | | | | 537 | |
| | 40,862 | | | | 5.000 | | | | 09/01/17 | | | | 42,484 | |
| | 52,826 | | | | 5.000 | | | | 10/01/17 | | | | 54,920 | |
| | 32,759 | | | | 5.000 | | | | 11/01/17 | | | | 34,058 | |
| | 31,569 | | | | 5.000 | | | | 12/01/17 | | | | 32,820 | |
| | |
| | | | | | | | | | | | | | |
Principal
Amount | | | Interest
Rate | | | Maturity
Date | | | Value | |
| | Mortgage-Backed Obligations – (continued) | |
| | FHLMC – (continued) | |
| $ | 39,543 | | | | 5.000 | % | | | 01/01/18 | | | $ | 41,145 | |
| | 92,261 | | | | 5.000 | | | | 02/01/18 | | | | 96,047 | |
| | 87,738 | | | | 5.000 | | | | 03/01/18 | | | | 91,432 | |
| | 87,416 | | | | 5.000 | | | | 04/01/18 | | | | 91,060 | |
| | 10,682 | | | | 4.500 | | | | 05/01/18 | | | | 11,116 | |
| | 65,759 | | | | 5.000 | | | | 05/01/18 | | | | 68,588 | |
| | 18,435 | | | | 5.000 | | | | 06/01/18 | | | | 19,225 | |
| | 18,887 | | | | 5.000 | | | | 07/01/18 | | | | 19,742 | |
| | 7,806 | | | | 5.000 | | | | 08/01/18 | | | | 8,139 | |
| | 6,581 | | | | 5.000 | | | | 09/01/18 | | | | 6,863 | |
| | 23,071 | | | | 5.000 | | | | 10/01/18 | | | | 24,122 | |
| | 28,340 | | | | 5.000 | | | | 11/01/18 | | | | 29,618 | |
| | 12,516 | | | | 5.000 | | | | 12/01/18 | | | | 13,061 | |
| | 1,968 | | | | 5.000 | | | | 01/01/19 | | | | 2,058 | |
| | 467 | | | | 5.000 | | | | 02/01/19 | | | | 493 | |
| | 96,452 | | | | 5.500 | | | | 04/01/20 | | | | 102,681 | |
| | 357,712 | | | | 5.000 | | | | 11/01/22 | | | | 391,287 | |
| | 331,516 | | | | 4.500 | | | | 08/01/23 | | | | 358,649 | |
| | 94,272 | | | | 2.500 | | | | 03/01/30 | | | | 96,327 | |
| | 871,551 | | | | 2.500 | | | | 06/01/30 | | | | 891,093 | |
| | 50,767 | | | | 7.000 | | | | 04/01/31 | | | | 59,819 | |
| | 740,888 | | | | 7.000 | | | | 09/01/31 | | | | 850,945 | |
| | 244,746 | | | | 7.000 | | | | 04/01/32 | | | | 289,603 | |
| | 519,208 | | | | 7.000 | | | | 05/01/32 | | | | 612,216 | |
| | 162,592 | | | | 5.000 | | | | 10/01/33 | | | | 178,974 | |
| | 16,332 | | | | 5.500 | | | | 12/01/33 | | | | 18,354 | |
| | 249,522 | | | | 5.500 | | | | 04/01/35 | | | | 278,938 | |
| | 7,858 | | | | 5.000 | | | | 07/01/35 | | | | 8,646 | |
| | 174,723 | | | | 5.000 | | | | 12/01/35 | | | | 193,861 | |
| | 120,257 | | | | 5.500 | | | | 01/01/36 | | | | 134,698 | |
| | 343 | | | | 5.500 | | | | 02/01/36 | | | | 384 | |
| | 2,263 | | | | 5.000 | | | | 02/01/37 | | | | 2,510 | |
| | 55,000 | | | | 6.000 | | | | 08/01/37 | | | | 61,966 | |
| | 60,572 | | | | 6.000 | | | | 09/01/37 | | | | 68,214 | |
| | 22,400 | | | | 6.000 | | | | 10/01/37 | | | | 25,206 | |
| | 163,518 | | | | 6.000 | | | | 11/01/37 | | | | 183,999 | |
| | 172,615 | | | | 6.000 | | | | 12/01/37 | | | | 194,237 | |
| | 6,066 | | | | 5.500 | | | | 01/01/38 | | | | 6,731 | |
| | 165,937 | | | | 6.000 | | | | 01/01/38 | | | | 186,755 | |
| | 49,387 | | | | 6.000 | | | | 02/01/38 | | | | 55,578 | |
| | 8,416 | | | | 6.000 | | | | 03/01/38 | | | | 9,534 | |
| | 52,357 | | | | 6.000 | | | | 04/01/38 | | | | 59,097 | |
| | 20,965 | | | | 6.000 | | | | 05/01/38 | | | | 23,954 | |
| | 41,367 | | | | 6.000 | | | | 06/01/38 | | | | 47,035 | |
| | 28,004 | | | | 6.000 | | | | 07/01/38 | | | | 31,930 | |
| | 17,960 | | | | 6.000 | | | | 08/01/38 | | | | 20,374 | |
| | 183,260 | | | | 6.000 | | | | 09/01/38 | | | | 206,256 | |
| | 38,010 | | | | 6.000 | | | | 10/01/38 | | | | 42,777 | |
| | 2,499 | | | | 6.000 | | | | 11/01/38 | | | | 2,857 | |
| | 2,988 | | | | 6.000 | | | | 12/01/38 | | | | 3,363 | |
| | 135,999 | | | | 6.000 | | | | 01/01/39 | | | | 153,053 | |
| | 14,884 | | | | 6.000 | | | | 02/01/39 | | | | 16,976 | |
| | 680,551 | | | | 7.000 | | | | 02/01/39 | | | | 798,325 | |
| | 10,586 | | | | 6.000 | | | | 03/01/39 | | | | 11,914 | |
| | 4,331 | | | | 6.000 | | | | 04/01/39 | | | | 4,930 | |
| | 557,169 | | | | 5.000 | | | | 05/01/39 | | | | 610,799 | |
| | |
| | |
| The accompanying notes are an integral part of these financial statements. | | 113 |
GOLDMAN SACHS U.S. MORTGAGES FUND
Schedule of Investments (continued)
September 30, 2015 (Unaudited)
| | | | | | | | | | | | | | |
Principal
Amount | | | Interest
Rate | | | Maturity
Date | | | Value | |
| | Mortgage-Backed Obligations – (continued) | |
| | FHLMC – (continued) | |
| $ | 991,540 | | | | 5.000 | % | | | 07/01/39 | | | $ | 1,091,469 | |
| | 62,322 | | | | 6.000 | | | | 04/01/40 | | | | 70,133 | |
| | 138,125 | | | | 6.000 | | | | 05/01/40 | | | | 155,433 | |
| | 46,946 | | | | 5.000 | | | | 08/01/40 | | | | 51,553 | |
| | 66,672 | | | | 5.000 | | | | 10/01/40 | | | | 73,308 | |
| | 115,803 | | | | 4.500 | | | | 02/01/41 | | | | 125,547 | |
| | 5,809 | | | | 5.000 | | | | 06/01/41 | | | | 6,389 | |
| | 485,286 | | | | 4.000 | | | | 10/01/41 | | | | 523,749 | |
| | 77,089 | | | | 3.000 | | | | 05/01/42 | | | | 78,102 | |
| | 308,679 | | | | 3.500 | | | | 06/01/42 | | | | 324,185 | |
| | 199,238 | | | | 3.000 | | | | 08/01/42 | | | | 202,614 | |
| | 3,236,414 | | | | 4.000 | | | | 09/01/42 | | | | 3,485,845 | |
| | 77,233 | | | | 3.000 | | | | 10/01/42 | | | | 78,600 | |
| | 505,162 | | | | 3.500 | | | | 10/01/42 | | | | 527,066 | |
| | 877,437 | | | | 4.000 | | | | 10/01/42 | | | | 945,062 | |
| | 7,603,762 | | | | 3.000 | | | | 11/01/42 | | | | 7,739,242 | |
| | 409,377 | | | | 3.500 | | | | 11/01/42 | | | | 427,128 | |
| | 1,827,249 | | | | 3.000 | | | | 12/01/42 | | | | 1,864,723 | |
| | 4,292,049 | | | | 3.000 | | | | 01/01/43 | | | | 4,376,279 | |
| | 290,222 | | | | 3.000 | | | | 02/01/43 | | | | 294,954 | |
| | 256,974 | | | | 4.000 | | | | 03/01/43 | | | | 276,779 | |
| | 4,659,099 | | | | 3.500 | | | | 04/01/43 | | | | 4,862,571 | |
| | 4,755,733 | | | | 3.500 | | | | 08/01/43 | | | | 4,954,592 | |
| | 912,649 | | | | 3.500 | | | | 06/01/44 | | | | 956,071 | |
| | 381,183 | | | | 4.000 | | | | 08/01/44 | | | | 411,097 | |
| | 32,995 | | | | 4.000 | | | | 11/01/44 | | | | 35,585 | |
| | 148,353 | | | | 3.500 | | | | 02/01/45 | | | | 155,527 | |
| | 538,908 | | | | 3.500 | | | | 03/01/45 | | | | 564,547 | |
| | | | | | | | | | | | | | |
| | | | | | | | | | | | | 42,673,648 | |
| | |
| | FNMA – 38.5% | |
| | 74 | | | | 5.500 | | | | 04/01/16 | | | | 74 | |
| | 116 | | | | 5.500 | | | | 08/01/16 | | | | 117 | |
| | 2,337 | | | | 5.500 | | | | 11/01/16 | | | | 2,372 | |
| | 1,648 | | | | 5.500 | | | | 12/01/16 | | | | 1,677 | |
| | 2,863 | | | | 5.500 | | | | 01/01/17 | | | | 2,922 | |
| | 303 | | | | 5.500 | | | | 05/01/17 | | | | 311 | |
| | 1,309 | | | | 5.500 | | | | 07/01/17 | | | | 1,341 | |
| | 192 | | | | 5.500 | | | | 09/01/17 | | | | 197 | |
| | 3,238 | | | | 5.500 | | | | 01/01/18 | | | | 3,330 | |
| | 2,841 | | | | 5.500 | | | | 02/01/18 | | | | 2,922 | |
| | 818,045 | | | | 2.800 | | | | 03/01/18 | | | | 846,222 | |
| | 89,530 | | | | 5.000 | | | | 03/01/18 | | | | 93,058 | |
| | 7,004 | | | | 5.500 | | | | 04/01/18 | | | | 7,319 | |
| | 2,530,000 | | | | 3.840 | | | | 05/01/18 | | | | 2,688,565 | |
| | 1,544 | | | | 5.500 | | | | 05/01/18 | | | | 1,619 | |
| | 129,797 | | | | 5.000 | | | | 06/01/18 | | | | 135,375 | |
| | 377,721 | | | | 4.000 | | | | 08/01/18 | | | | 395,574 | |
| | 6,494 | | | | 5.000 | | | | 09/01/18 | | | | 6,775 | |
| | 7,561 | | | | 7.000 | | | | 11/01/18 | | | | 7,771 | |
| | 1,488 | | | | 5.500 | | | | 02/01/19 | | | | 1,553 | |
| | 10,409 | | | | 5.500 | | | | 04/01/19 | | | | 10,978 | |
| | 1,188 | | | | 5.500 | | | | 05/01/19 | | | | 1,241 | |
| | 9,555 | | | | 5.500 | | | | 07/01/19 | | | | 10,103 | |
| | 27,922 | | | | 5.500 | | | | 08/01/19 | | | | 29,637 | |
| | 13,474 | | | | 5.500 | | | | 09/01/19 | | | | 14,352 | |
| | |
| | | | | | | | | | | | | | |
Principal
Amount | | | Interest
Rate | | | Maturity
Date | | | Value | |
| | Mortgage-Backed Obligations – (continued) | |
| | FNMA – (continued) | |
| $ | 26,934 | | | | 5.500 | % | | | 10/01/19 | | | $ | 28,623 | |
| | 10,183 | | | | 5.500 | | | | 11/01/19 | | | | 10,848 | |
| | 7,275 | | | | 5.500 | | | | 12/01/19 | | | | 7,673 | |
| | 39,211 | | | | 5.500 | | | | 02/01/20 | | | | 41,496 | |
| | 145,701 | | | | 4.500 | | | | 03/01/20 | | | | 151,855 | |
| | 799,802 | | | | 3.416 | | | | 10/01/20 | | | | 858,036 | |
| | 15,127 | | | | 5.500 | | | | 01/01/21 | | | | 16,121 | |
| | 22,053 | | | | 7.000 | | | | 09/01/21 | | | | 24,392 | |
| | 48,442 | | | | 6.000 | | | | 04/01/22 | | | | 54,585 | |
| | 80,129 | | | | 7.000 | | | | 06/01/22 | | | | 90,370 | |
| | 30,703 | | | | 7.000 | | | | 07/01/22 | | | | 33,919 | |
| | 2,895 | | | | 4.500 | | | | 04/01/23 | | | | 3,056 | |
| | 2,527,565 | | | | 5.000 | | | | 06/01/25 | | | | 2,781,152 | |
| | 199,650 | | | | 5.000 | | | | 07/01/27 | | | | 219,680 | |
| | 486 | | | | 7.000 | | | | 01/01/29 | | | | 488 | |
| | 1,792 | | | | 7.000 | | | | 09/01/29 | | | | 1,866 | |
| | 583,226 | | | | 3.000 | | | | 08/01/30 | | | | 607,809 | |
| | 30,799 | | | | 5.000 | | | | 08/01/30 | | | | 33,889 | |
| | 4,403,215 | | | | 3.000 | | | | 09/01/30 | | | | 4,588,811 | |
| | 11,648 | | | | 7.000 | | | | 08/01/31 | | | | 13,447 | |
| | 798 | | | | 7.000 | | | | 03/01/32 | | | | 936 | |
| | 1,536 | | | | 7.000 | | | | 04/01/32 | | | | 1,713 | |
| | 3,024 | | | | 7.000 | | | | 06/01/32 | | | | 3,082 | |
| | 823 | | | | 7.000 | | | | 07/01/32 | | | | 867 | |
| | 59,489 | | | | 6.000 | | | | 01/01/33 | | | | 68,013 | |
| | 2,094 | | | | 6.000 | | | | 02/01/33 | | | | 2,453 | |
| | 1,293 | | | | 5.500 | | | | 07/01/33 | | | | 1,452 | |
| | 26,670 | | | | 5.000 | | | | 08/01/33 | | | | 29,497 | |
| | 7,290 | | | | 5.500 | | | | 09/01/33 | | | | 8,189 | |
| | 27,720 | | | | 5.500 | | | | 02/01/34 | | | | 31,143 | |
| | 7,428 | | | | 5.500 | | | | 03/01/34 | | | | 8,346 | |
| | 13,598 | | | | 5.000 | | | | 04/01/34 | | | | 15,045 | |
| | 12,045 | | | | 5.500 | | | | 04/01/34 | | | | 13,548 | |
| | 68 | | | | 5.500 | | | | 06/01/34 | | | | 77 | |
| | 60,054 | | | | 5.500 | | | | 07/01/34 | | | | 67,638 | |
| | 7,540 | | | | 5.500 | | | | 08/01/34 | | | | 8,531 | |
| | 35,543 | | | | 5.500 | | | | 10/01/34 | | | | 40,100 | |
| | 4,769 | | | | 5.500 | | | | 11/01/34 | | | | 5,380 | |
| | 200,673 | | | | 5.500 | | | | 12/01/34 | | | | 226,338 | |
| | 208,561 | | | | 6.000 | | | | 04/01/35 | | | | 238,402 | |
| | 15,878 | | | | 5.500 | | | | 05/01/35 | | | | 17,832 | |
| | 6,134 | | | | 5.500 | | | | 06/01/35 | | | | 6,920 | |
| | 9,915 | | | | 5.000 | | | | 07/01/35 | | | | 11,030 | |
| | 15,216 | | | | 5.500 | | | | 07/01/35 | | | | 17,208 | |
| | 8,248 | | | | 5.500 | | | | 08/01/35 | | | | 9,311 | |
| | 12,298 | | | | 5.500 | | | | 09/01/35 | | | | 13,885 | |
| | 389,389 | | | | 5.000 | | | | 10/01/35 | | | | 429,305 | |
| | 5,388 | | | | 5.500 | | | | 10/01/35 | | | | 6,033 | |
| | 104,586 | | | | 6.000 | | | | 10/01/35 | | | | 121,693 | |
| | 3,545 | | | | 5.500 | | | | 12/01/35 | | | | 4,028 | |
| | 2,902 | | | | 6.000 | | | | 12/01/35 | | | | 3,347 | |
| | 634,061 | | | | 5.000 | | | | 01/01/36 | | | | 699,057 | |
| | 160 | | | | 5.500 | | | | 02/01/36 | | | | 180 | |
| | 21,119 | | | | 5.500 | | | | 04/01/36 | | | | 23,651 | |
| | 3,046 | | | | 6.000 | | | | 04/01/36 | | | | 3,511 | |
| | 41,639 | | | | 5.500 | | | | 07/01/36 | | | | 46,492 | |
| | |
| | |
| 114 | | The accompanying notes are an integral part of these financial statements. |
GOLDMAN SACHS U.S. MORTGAGES FUND
| | | | | | | | | | | | | | |
Principal
Amount | | | Interest
Rate | | | Maturity
Date | | | Value | |
| | Mortgage-Backed Obligations – (continued) | |
| | FNMA – (continued) | |
| $ | 3,929 | | | | 5.500 | % | | | 02/01/37 | | | $ | 4,418 | |
| | 17,248 | | | | 5.500 | | | | 04/01/37 | | | | 19,456 | |
| | 67,092 | | | | 6.000 | | | | 04/01/37 | | | | 76,984 | |
| | 316 | | | | 5.500 | | | | 05/01/37 | | | | 356 | |
| | 61,435 | | | | 5.000 | | | | 06/01/37 | | | | 68,262 | |
| | 463 | | | | 5.500 | | | | 06/01/37 | | | | 521 | |
| | 7,122 | | | | 5.500 | | | | 07/01/37 | | | | 8,007 | |
| | 600,589 | | | | 5.500 | | | | 08/01/37 | | | | 672,559 | |
| | 104,726 | | | | 6.500 | | | | 10/01/37 | | | | 123,062 | |
| | 79,352 | | | | 6.000 | | | | 11/01/37 | | | | 90,911 | |
| | 230 | | | | 5.500 | | | | 12/01/37 | | | | 259 | |
| | 586 | | | | 5.500 | | | | 02/01/38 | | | | 659 | |
| | 8,012 | | | | 5.500 | | | | 03/01/38 | | | | 9,010 | |
| | 90,055 | | | | 5.000 | | | | 04/01/38 | | | | 99,149 | |
| | 28,510 | | | | 5.500 | | | | 04/01/38 | | | | 32,141 | |
| | 7,111 | | | | 5.500 | | | | 05/01/38 | | | | 8,021 | |
| | 2,826 | | | | 5.500 | | | | 06/01/38 | | | | 3,177 | |
| | 1,521 | | | | 5.500 | | | | 07/01/38 | | | | 1,711 | |
| | 3,508 | | | | 5.500 | | | | 08/01/38 | | | | 3,929 | |
| | 3,791 | | | | 5.500 | | | | 09/01/38 | | | | 4,267 | |
| | 112,902 | | | | 6.000 | | | | 09/01/38 | | | | 129,429 | |
| | 24,555 | | | | 5.500 | | | | 12/01/38 | | | | 27,579 | |
| | 749,737 | | | | 5.000 | | | | 01/01/39 | | | | 839,501 | |
| | 234,925 | | | | 6.000 | | | | 01/01/39 | | | | 269,486 | |
| | 415,402 | | | | 6.500 | | | | 01/01/39 | | | | 485,575 | |
| | 499,584 | | | | 4.500 | | | | 02/01/39 | | | | 541,427 | |
| | 5,486 | | | | 5.500 | | | | 02/01/39 | | | | 6,200 | |
| | 10,647 | | | | 4.500 | | | | 03/01/39 | | | | 11,687 | |
| | 468,267 | | | | 7.000 | | | | 03/01/39 | | | | 534,714 | |
| | 15,107 | | | | 4.500 | | | | 05/01/39 | | | | 16,583 | |
| | 12,182 | | | | 5.500 | | | | 06/01/39 | | | | 13,695 | |
| | 13,155 | | | | 4.500 | | | | 07/01/39 | | | | 14,451 | |
| | 9,943 | | | | 4.000 | | | | 08/01/39 | | | | 10,609 | |
| | 10,866 | | | | 5.500 | | | | 11/01/39 | | | | 12,219 | |
| | 82,202 | | | | 4.500 | | | | 02/01/40 | | | | 90,335 | |
| | 18,054 | | | | 3.500 | | | | 04/01/40 | | | | 18,877 | |
| | 67,903 | | | | 4.500 | | | | 06/01/40 | | | | 74,632 | |
| | 657,381 | | | | 5.000 | | | | 06/01/40 | | | | 724,966 | |
| | 38,165 | | | | 5.000 | | | | 07/01/40 | | | | 42,088 | |
| | 11,915 | | | | 4.500 | | | | 09/01/40 | | | | 13,095 | |
| | 333,097 | | | | 4.500 | | | | 08/01/41 | | | | 362,284 | |
| | 287,754 | | | | 3.500 | | | | 10/01/41 | | | | 302,063 | |
| | 258,837 | | | | 3.500 | | | | 01/01/42 | | | | 271,627 | |
| | 35,583 | | | | 3.000 | | | | 04/01/42 | | | | 36,170 | |
| | 121,581 | | | | 3.500 | | | | 04/01/42 | | | | 127,064 | |
| | 29,113 | | | | 3.500 | | | | 05/01/42 | | | | 30,423 | |
| | 788,039 | | | | 3.500 | | | | 06/01/42 | | | | 823,538 | |
| | 318,338 | | | | 3.500 | | | | 07/01/42 | | | | 332,877 | |
| | 471,985 | | | | 3.000 | | | | 08/01/42 | | | | 481,407 | |
| | 518,241 | | | | 3.000 | | | | 09/01/42 | | | | 528,492 | |
| | 151,397 | | | | 3.500 | | | | 09/01/42 | | | | 158,606 | |
| | 705,135 | | | | 3.000 | | | | 10/01/42 | | | | 719,605 | |
| | 372,972 | | | | 3.500 | | | | 10/01/42 | | | | 391,320 | |
| | 511,922 | | | | 4.000 | | | | 10/01/42 | | | | 551,836 | |
| | 788,112 | | | | 3.000 | | | | 11/01/42 | | | | 804,586 | |
| | 42,558 | | | | 3.500 | | | | 11/01/42 | | | | 44,514 | |
| | |
| | | | | | | | | | | | | | |
Principal
Amount | | | Interest
Rate | | | Maturity
Date | | | Value | |
| | Mortgage-Backed Obligations – (continued) | |
| | FNMA – (continued) | |
| $ | 3,142,214 | | | | 3.000 | % | | | 12/01/42 | | | $ | 3,205,513 | |
| | 197,281 | | | | 3.500 | | | | 12/01/42 | | | | 207,029 | |
| | 4,239,192 | | | | 3.000 | | | | 01/01/43 | | | | 4,327,264 | |
| | 22,056 | | | | 3.500 | | | | 01/01/43 | | | | 23,070 | |
| | 936,591 | | | | 4.000 | | | | 01/01/43 | | | | 1,009,616 | |
| | 1,006,279 | | | | 3.000 | | | | 02/01/43 | | | | 1,027,819 | |
| | 983,927 | | | | 3.500 | | | | 02/01/43 | | | | 1,031,002 | |
| | 2,344,012 | | | | 3.000 | | | | 03/01/43 | | | | 2,394,135 | |
| | 3,764,677 | | | | 3.500 | | | | 03/01/43 | | | | 3,942,021 | |
| | 2,288,761 | | | | 3.000 | | | | 04/01/43 | | | | 2,336,557 | |
| | 832,300 | | | | 2.500 | | | | 05/01/43 | | | | 816,204 | |
| | 2,897,609 | | | | 3.000 | | | | 05/01/43 | | | | 2,957,174 | |
| | 35,682 | | | | 3.500 | | | | 05/01/43 | | | | 37,323 | |
| | 531,311 | | | | 3.000 | | | | 06/01/43 | | | | 540,193 | |
| | 963,157 | | | | 3.500 | | | | 06/01/43 | | | | 1,010,236 | |
| | 789,608 | | | | 3.000 | | | | 07/01/43 | | | | 806,224 | |
| | 3,047,533 | | | | 3.500 | | | | 07/01/43 | | | | 3,191,585 | |
| | 97,989 | | | | 3.000 | | | | 08/01/43 | | | | 99,543 | |
| | 1,433,804 | | | | 3.500 | | | | 08/01/43 | | | | 1,498,355 | |
| | 434,457 | | | | 3.000 | | | | 09/01/43 | | | | 441,348 | |
| | 47,873 | | | | 3.000 | | | | 10/01/43 | | | | 48,632 | |
| | 955,602 | | | | 5.000 | | | | 03/01/44 | | | | 1,053,105 | |
| | 72,783 | | | | 3.500 | | | | 08/01/44 | | | | 75,981 | |
| | 235,975 | | | | 3.500 | | | | 09/01/44 | | | | 246,542 | |
| | 1,208,099 | | | | 4.000 | | | | 10/01/44 | | | | 1,301,327 | |
| | 29,071 | | | | 3.500 | | | | 12/01/44 | | | | 30,407 | |
| | 131,071 | | | | 5.000 | | | | 12/01/44 | | | | 144,445 | |
| | 76,685 | | | | 3.500 | | | | 01/01/45 | | | | 80,571 | |
| | 507,005 | | | | 3.500 | | | | 02/01/45 | | | | 531,734 | |
| | 933,509 | | | | 4.000 | | | | 02/01/45 | | | | 1,001,626 | |
| | 405,361 | | | | 3.500 | | | | 03/01/45 | | | | 425,478 | |
| | 53,358 | | | | 3.500 | | | | 07/01/45 | | | | 55,712 | |
| | 8,282,120 | | | | 3.500 | | | | 08/01/45 | | | | 8,647,126 | |
| | 14,831,589 | | | | 3.500 | | | | 09/01/45 | | | | 15,481,927 | |
| | 10,000,000 | | | | 3.000 | | | | TBA-30yr | (d) | | | 10,132,812 | |
| | 11,000,000 | | | | 4.500 | | | | TBA-30yr | (d) | | | 11,924,688 | |
| | | | | | | | | | | | | | |
| | | | | | | | | | | | | 109,172,497 | |
| | |
| | GNMA – 37.6% | | | | | |
| | 78,018 | | | | 5.500 | | | | 07/15/20 | | | | 82,504 | |
| | 254,850 | | | | 3.950 | | | | 07/15/25 | | | | 277,961 | |
| | 7,186 | | | | 6.000 | | | | 04/15/26 | | | | 8,124 | |
| | 687 | | | | 6.500 | | | | 01/15/32 | | | | 788 | |
| | 1,661 | | | | 6.500 | | | | 02/15/32 | | | | 1,905 | |
| | 788,089 | | | | 5.500 | | | | 04/15/33 | | | | 897,886 | |
| | 7,777 | | | | 5.000 | | | | 11/15/33 | | | | 8,691 | |
| | 1,796 | | | | 6.500 | | | | 08/15/34 | | | | 2,112 | |
| | 1,457 | | | | 6.500 | | | | 02/15/36 | | | | 1,706 | |
| | 4,055 | | | | 6.500 | | | | 03/15/36 | | | | 4,751 | |
| | 7,616 | | | | 6.500 | | | | 04/15/36 | | | | 8,841 | |
| | 22,773 | | | | 6.500 | | | | 05/15/36 | | | | 26,678 | |
| | 15,906 | | | | 6.500 | | | | 06/15/36 | | | | 18,633 | |
| | 100,925 | | | | 6.500 | | | | 07/15/36 | | | | 119,773 | |
| | 91,165 | | | | 6.500 | | | | 08/15/36 | | | | 106,731 | |
| | 137,671 | | | | 6.500 | | | | 09/15/36 | | | | 160,622 | |
| | 61,494 | | | | 6.500 | | | | 10/15/36 | | | | 71,392 | |
| | |
| | |
| The accompanying notes are an integral part of these financial statements. | | 115 |
GOLDMAN SACHS U.S. MORTGAGES FUND
Schedule of Investments (continued)
September 30, 2015 (Unaudited)
| | | | | | | | | | | | | | |
Principal
Amount | | | Interest
Rate | | | Maturity
Date | | | Value | |
| | Mortgage-Backed Obligations – (continued) | |
| | GNMA – (continued) | | | | | |
| $ | 88,097 | | | | 6.500 | % | | | 11/15/36 | | | $ | 102,546 | |
| | 34,409 | | | | 6.500 | | | | 12/15/36 | | | | 39,979 | |
| | 15,561 | | | | 6.500 | | | | 01/15/37 | | | | 18,035 | |
| | 4,073 | | | | 6.500 | | | | 03/15/37 | | | | 4,773 | |
| | 11,000 | | | | 6.500 | | | | 04/15/37 | | | | 12,848 | |
| | 8,157 | | | | 6.500 | | | | 05/15/37 | | | | 9,441 | |
| | 4,894 | | | | 6.500 | | | | 08/15/37 | | | | 5,689 | |
| | 28,093 | | | | 6.500 | | | | 09/15/37 | | | | 32,549 | |
| | 29,144 | | | | 6.500 | | | | 10/15/37 | | | | 33,418 | |
| | 16,066 | | | | 6.500 | | | | 11/15/37 | | | | 18,821 | |
| | 5,852 | | | | 6.500 | | | | 05/15/38 | | | | 6,807 | |
| | 7,650 | | | | 6.500 | | | | 11/15/38 | | | | 8,936 | |
| | 4,994 | | | | 6.500 | | | | 02/15/39 | | | | 5,825 | |
| | 222,110 | | | | 4.500 | | | | 12/20/39 | | | | 241,288 | |
| | 890,803 | | | | 5.000 | | | | 01/20/40 | | | | 977,183 | |
| | 59,445 | | | | 4.500 | | | | 02/20/40 | | | | 64,796 | |
| | 172,144 | | | | 4.500 | | | | 05/20/40 | | | | 187,640 | |
| | 597,232 | | | | 5.000 | | | | 07/15/40 | | | | 666,884 | |
| | 349,550 | | | | 3.500 | | | | 09/15/42 | | | | 366,955 | |
| | 1,756,475 | | | | 3.500 | | | | 10/15/44 | | | | 1,839,692 | |
| | 323,258 | | | | 3.500 | | | | 01/15/45 | | | | 338,702 | |
| | 1,343,658 | | | | 3.500 | | | | 02/15/45 | | | | 1,407,851 | |
| | 993,605 | | | | 4.000 | | | | 07/20/45 | | | | 1,061,799 | |
| | 18,961,135 | | | | 3.500 | | | | 08/20/45 | | | | 19,895,860 | |
| | 8,979,881 | | | | 4.000 | | | | 08/20/45 | | | | 9,599,002 | |
| | 9,000,000 | | | | 3.500 | | | | 09/20/45 | | | | 9,443,672 | |
| | 11,000,000 | | | | 4.000 | | | | 09/20/45 | | | | 11,758,398 | |
| | 7,000,000 | | | | 3.500 | | | | TBA-30yr | (d) | | | 7,330,156 | |
| | 37,000,000 | | | | 4.000 | | | | TBA-30yr | (d) | | | 39,394,842 | |
| | | | | | | | | | | | | | |
| | | | | | | | | | | | | 106,673,485 | |
| | |
| | TOTAL FEDERAL AGENCIES | | | $ | 261,653,252 | |
| | |
| | TOTAL MORTGAGE-BACKED OBLIGATIONS | |
| | (Cost $312,820,164) | | | $ | 314,886,989 | |
| | |
| | | | | | | | | | | | | | |
| | Asset-Backed Securities – 8.1% | |
| | Auto(c) – 0.4% | |
| Ford Credit Auto Owner Trust Series 2015-1, Class A | |
| $ | 1,200,000 | | | | 2.120 | % | | | 07/15/26 | | | $ | 1,204,795 | |
| | |
| | Collateralized Loan Obligations(a)(c) – 4.4% | |
| ARES XII CLO Ltd. Series 2007-12A, Class A | |
| | 1,052,142 | | | | 0.912 | | | | 11/25/20 | | | | 1,040,918 | |
| Brentwood CLO Corp. Series 2006-1A, Class A1B | |
| | 562,719 | | | | 0.548 | | | | 02/01/22 | | | | 553,265 | |
| Four Corners CLO II Ltd. Series 2006-2A, Class A | |
| | 1,143,420 | | | | 0.565 | | | | 01/26/20 | | | | 1,129,276 | |
| Halcyon Loan Advisors Funding Ltd. Series 2015-2A, Class A | |
| | 1,450,000 | | | | 1.727 | | | | 07/25/27 | | | | 1,428,988 | |
| OFSI Fund VI Ltd. Series 2014-6A, Class A1 | |
| | 2,100,000 | | | | 1.300 | | | | 03/20/25 | | | | 2,042,128 | |
| Parallel Ltd. Series 2015-1A, Class A | |
| | 1,050,000 | | | | 1.752 | | | | 07/20/27 | | | | 1,041,918 | |
| | |
| | | | | | | | | | | | | | |
Principal
Amount | | | Interest
Rate | | | Maturity
Date | | | Value | |
| | Asset-Backed Securities – (continued) | |
| | Collateralized Loan Obligations(a)(c) – (continued) | |
| Parallel Ltd. Series 2015-1A, Class B | |
| $ | 250,000 | | | | 2.352 | % | | | 07/20/27 | | | $ | 243,746 | |
| Shackleton CLO Ltd. Series 2014-5A, Class A | |
| | 1,600,000 | | | | 1.811 | | | | 05/07/26 | | | | 1,586,309 | |
| Trinitas CLO III Ltd. Series 2015-3A, Class A2 | |
| | 1,800,000 | | | | 1.702 | | | | 07/15/27 | | | | 1,784,342 | |
| Z Capital Credit Partners CLO Ltd. Series 2015-1A, Class ACOM | |
| | 1,550,000 | | | | 1.737 | | | | 07/16/27 | | | | 1,516,675 | |
| | | | | | | | | | | | | | |
| | | | | | | | | | | | | 12,367,565 | |
| | |
| | Home Equity(a) – 0.1% | |
| Countrywide Home Equity Loan Trust Series 2004-G, Class 2A | |
| | 20,912 | | | | 0.427 | | | | 12/15/29 | | | | 19,579 | |
| Countrywide Home Equity Loan Trust Series 2004-O, Class 1A | |
| | 104,553 | | | | 0.487 | | | | 02/15/34 | | | | 94,123 | |
| Residential Asset Mortgage Products, Inc. Series 2004-RZ1,
Class AII |
|
| | 108,858 | | | | 0.679 | | | | 03/25/34 | | | | 105,395 | |
| | | | | | | | | | | | | | |
| | | | | | | | | | | | | 219,097 | |
| | |
| | Student Loan(a) – 3.2% | |
| Education Loan Asset-Backed Trust I Series 2013-1, Class A1(c) | |
| | 1,526,726 | | | | 0.994 | | | | 06/25/26 | | | | 1,508,663 | |
| Goal Capital Funding Trust Series 2007-1, Class A3 | |
| | 629,928 | | | | 0.416 | | | | 09/25/28 | | | | 623,286 | |
| Nelnet Student Loan Trust Series 2006-2, Class A5 | |
| | 2,400,000 | | | | 0.395 | | | | 01/25/30 | | | | 2,345,712 | |
| SLM Student Loan Trust Series 2006-2, Class A5 | |
| | 2,685,540 | | | | 0.405 | | | | 07/25/25 | | | | 2,666,875 | |
| SLM Student Loan Trust Series 2006-4, Class A5 | |
| | 1,148,617 | | | | 0.395 | | | | 10/27/25 | | | | 1,137,956 | |
| SLM Student Loan Trust Series 2014-2, Class A2 | |
| | 800,000 | | | | 0.544 | | | | 10/25/21 | | | | 793,726 | |
| | | | | | | | | | | | | | |
| | | | | | | | | | | | | 9,076,218 | |
| | |
| | TOTAL ASSET-BACKED SECURITIES | | | | | |
| | (Cost $22,993,651) | | | $ | 22,867,675 | |
| | |
| | | | | | | | |
| Shares | | Rate | | | Value | |
| | | | | | | | |
| Investment Company(e) – 2.5% | |
Goldman Sachs Financial Square Government Fund – FST Shares | |
| 7,164,780 | | | 0.006 | % | | $ | 7,164,780 | |
| (Cost $7,164,780) | |
| |
| TOTAL INVESTMENTS – 121.7% | |
| (Cost $342,978,595) | | | $ | 344,919,444 | |
| |
LIABILITIES IN EXCESS OF
OTHER ASSETS – (21.7)% | | | | (61,579,408 | ) |
| |
| NET ASSETS – 100.0% | | | $ | 283,340,036 | |
| |
| | |
| 116 | | The accompanying notes are an integral part of these financial statements. |
GOLDMAN SACHS U.S. MORTGAGES FUND
| | |
| The percentage shown for each investment category reflects the value of investments in that category as a percentage of net assets. |
(a) | | Variable rate security. Interest rate or distribution rate disclosed is that which is in effect on September 30, 2015. |
(b) | | Security with a notional or nominal principal amount. The actual effective yield of this security is different than the stated interest rate. |
(c) | | Exempt from registration under Rule 144A of the Securities Act of 1933. Under procedures approved by the Board of Trustees, such securities have been determined to be liquid by the investment adviser and may be resold, normally to qualified institutional buyers in transactions exempt from registration. Total market value of Rule 144A securities amounts to $17,301,040, which represents approximately 6.1% of net assets as of September 30, 2015. |
(d) | | TBA (To Be Announced) Securities are purchased on a forward commitment basis with an approximate principal amount and no defined maturity date. The actual principal and maturity date will be determined upon settlement when the specific mortgage pools are assigned. Total market value of TBA securities (excluding forward sales contracts, if any) amounts to $68,782,498 which represents approximately 24.3% of net assets as of September 30, 2015. |
(e) | | Represents an Affiliated Fund. |
| | |
|
Investment Abbreviations: |
CLO | | —Collateralized Loan Obligation |
FHLMC | | —Federal Home Loan Mortgage Corp. |
FNMA | | —Federal National Mortgage Association |
GNMA | | —Government National Mortgage Association |
LIBOR | | —London Interbank Offered Rate |
REMIC | | —Real Estate Mortgage Investment Conduit |
STRIPS | | —Separate Trading of Registered Interest and Principal of Securities |
|
|
| ADDITIONAL INVESTMENT INFORMATION |
FORWARD SALES CONTRACTS — At September 30, 2015, the Fund had the following forward sales contracts:
| | | | | | | | | | | | | | | | | | |
| Description | | Interest
Rate | | | Maturity
Date(a) | | Settlement
Date | | | Principal
Amount | | | Value | |
FHLMC | | | 3.500 | % | | TBA-30yr | | | 10/14/15 | | | $ | (7,000,000 | ) | | $ | (7,282,187 | ) |
FNMA | | | 3.000 | | | TBA-15yr | | | 10/19/15 | | | | (3,000,000 | ) | | | (3,123,750 | ) |
FNMA | | | 3.500 | | | TBA-30yr | | | 10/14/15 | | | | (17,000,000 | ) | | | (17,730,470 | ) |
| TOTAL (Proceeds Receivable: $27,956,523) | | | | | | | $ | (28,136,407 | ) |
| | (a) | | TBA (To Be Announced) Securities are purchased on a forward commitment basis with an approximate principal amount and no defined maturity date. The actual principal and maturity date will be determined upon settlement when the specific mortgage pools are assigned. |
FUTURES CONTRACTS — At September 30, 2015, the Fund had the following futures contracts:
| | | | | | | | | | | | | | |
| Type | | Number of
Contracts
Long (Short) | | | Expiration
Date | | Current
Value | | | Unrealized
Gain (Loss) | |
Ultra Long U.S. Treasury Bonds | | | 33 | | | December 2015 | | $ | 5,293,406 | | | $ | 93,952 | |
2 Year U.S. Treasury Notes | | | (12 | ) | | December 2015 | | | (2,628,375 | ) | | | 69 | |
5 Year U.S. Treasury Notes | | | (13 | ) | | December 2015 | | | (1,566,703 | ) | | | 384 | |
10 Year U.S. Treasury Notes | | | 117 | | | December 2015 | | | 15,061,922 | | | | 167,112 | |
20 Year U.S. Treasury Bonds | | | (40 | ) | | December 2015 | | | (6,293,750 | ) | | | (74,158 | ) |
| TOTAL | | | | | | | | | | | | $ | 187,359 | |
| | |
| The accompanying notes are an integral part of these financial statements. | | 117 |
GOLDMAN SACHS U.S. MORTGAGES FUND
Schedule of Investments (continued)
September 30, 2015 (Unaudited)
|
| ADDITIONAL INVESTMENT INFORMATION (continued) |
SWAP CONTRACTS — At September 30, 2015, the Fund had the following swap contracts:
CENTRALLY CLEARED INTEREST RATE SWAP CONTRACTS
| | | | | | | | | | | | | | | | | | |
| | | | | | Rates Exchanged | | Market Value | |
Notional
Amount
(000s) | | | Termination
Date | | Payments
Received | | | Payments
Made | | Upfront
Payments
Made (Received) | | | Unrealized
Gain (Loss) | |
| $ | 10,100 | (b) | | 06/24/21 | | | 2.923% | | | 3 month LIBOR | | $ | (9,961 | ) | | $ | 140,843 | |
| | 12,720 | | | 09/02/22 | | | 2.810 | | | 3 month LIBOR | | | 5,727 | | | | 63,977 | |
| | 4,100 | (b) | | 12/16/22 | | | 3 month LIBOR | | | 2.250% | | | (61,543 | ) | | | (69,004 | ) |
| | 3,300 | (b) | | 12/16/25 | | | 3 month LIBOR | | | 2.500 | | | (64,977 | ) | | | (67,951 | ) |
| | 2,600 | (b) | | 06/24/29 | | | 3 month LIBOR | | | 3.218 | | | 16,361 | | | | (129,716 | ) |
| | 3,040 | (b) | | 09/02/30 | | | 3 month LIBOR | | | 3.005 | | | 13,358 | | | | (61,113 | ) |
| | 8,000 | | | 12/16/30 | | | 2.500 | | | 3 month LIBOR | | | (59,960 | ) | | | 236,751 | |
| | 2,600 | (b) | | 12/16/35 | | | 3 month LIBOR | | | 2.500 | | | 73,155 | | | | (91,439 | ) |
| | TOTAL | | | | | | | | | | | $ | (87,840 | ) | | $ | 22,348 | |
| | (b) | | Represents forward starting interest rate swaps whose effective dates of commencement of accruals and cash flows occur subsequent to September 30, 2015. |
OVER THE COUNTER CREDIT DEFAULT SWAP CONTRACTS
| | | | | | | | | | | | | | | | | | | | | | | | | | |
| | | | | | | | | | | | | | | | | Market Value | |
| Counterparty | | Referenced
Obligation | | Notional
Amount
(000s) | | | Rates Received
(Paid) | | | Termination
Date | | | Credit
Spread at
September 30,
2015(c) | | | Upfront
Payments
Made (Received) | | | Unrealized
Gain (Loss) | |
Protection Sold: | | | | | | | | | | | | | | | | | | | | | | | | | | |
Barclays Bank PLC | | Tranches of Commercial Mortgage-Backed Index AAA Series 7 | | $ | 7,000 | | | | 0.500 | % | | | 01/17/47 | | | | 0.849 | % | | $ | (224,341 | ) | | $ | (69,294 | ) |
Deutsche Bank Securities, Inc. | | | | | 7,500 | | | | 0.500 | | | | 01/17/47 | | | | 0.849 | | | | (214,588 | ) | | | (100,020 | ) |
Morgan Stanley & Co. International PLC | | | | | 10,000 | | | | 0.500 | | | | 01/17/47 | | | | 106.328 | | | | (413,044 | ) | | | (6,435 | ) |
| TOTAL | | | | | | | | | | | | | | | | | | | | $ | (851,973 | ) | | $ | (175,749 | ) |
| | (c) | | Credit spread on the Referenced Obligation, together with the term of the swap contract, are indicators of payment/performance risk. The likelihood of a credit event occurring which would require a fund to make a payment or otherwise be required to perform under the swap contract is generally greater as the credit spread and the term of the swap contract increase. |
| | |
| 118 | | The accompanying notes are an integral part of these financial statements. |
GOLDMAN SACHS SINGLE SECTOR FIXED INCOME FUNDS
Schedule of Investments
September 30, 2015 (Unaudited)
|
| ADDITIONAL INVESTMENT INFORMATION |
JOINT REPURCHASE AGREEMENT ACCOUNT II — At September 30, 2015, certain Funds had undivided interests in the Joint Repurchase Agreement Account II, with a maturity date of October 1, 2015, as follows:
| | | | | | | | | | | | |
| Fund | | Principal
Amount | | | Maturity
Value | | | Collateral
Allocation
Value | |
Dynamic Emerging Markets Debt | | $ | 5,600,000 | | | $ | 5,600,019 | | | $ | 5,714,593 | |
Emerging Markets Debt | | | 3,100,000 | | | | 3,100,010 | | | | 3,163,435 | |
REPURCHASE AGREEMENTS — At September 30, 2015, the Principal Amounts of certain Funds’ interest in the Joint Repurchase Agreement Account II were as follows:
| | | | | | | | | | | | |
| Counterparty | | Interest Rate | | | Dynamic
Emerging Markets Debt | | | Emerging
Markets Debt | |
BNP Paribas Securities Co. | | | 0.110 | % | | $ | 2,220,517 | | | $ | 1,229,215 | |
Citigroup Global Markets, Inc. | | | 0.120 | | | | 1,823,689 | | | | 1,009,542 | |
Merrill Lynch & Co., Inc. | | | 0.140 | | | | 1,555,794 | | | | 861,243 | |
| TOTAL | | | | | | $ | 5,600,000 | | | $ | 3,100,000 | |
At September 30, 2015, the Joint Repurchase Agreement Account II was fully collateralized by:
| | | | | | | | |
| Issuer | | Interest Rates | | | Maturity Dates | |
Federal Farm Credit Banks | | | 0.270 | % | | | 05/14/18 | |
Federal Home Loan Banks | | | 1.625 to 5.625 | | | | 06/13/16 to 09/07/32 | |
Federal Home Loan Mortgage Corp. | | | 2.500 to 8.000 | | | | 10/01/16 to 07/01/45 | |
Federal National Mortgage Association | | | 1.250 to 6.500 | | | | 04/01/16 to 10/01/45 | |
Government National Mortgage Association | | | 3.000 to 7.000 | | | | 05/15/18 to 09/20/45 | |
United States Inflation Indexed Bonds | | | 0.125 | | | | 07/15/22 | |
United States Treasury Note | | | 0.500 to 2.375 | | | | 09/30/16 to 12/31/20 | |
United States Treasury Stripped Securities | | | 0.000 | | | | 02/15/27 to 05/15/44 | |
| | |
| The accompanying notes are an integral part of these financial statements. | | 119 |
GOLDMAN SACHS SINGLE SECTOR FIXED INCOME FUNDS
Statements of Assets and Liabilities
September 30, 2015 (Unaudited)
| | | | | | |
| | | | | Dynamic Emerging
Markets Debt Fund | |
| | Assets: | | | | |
| | Investments of unaffiliated issuers, at value (cost $32,037,802, $1,124,345,784, $4,732,223,244, $3,698,512,602, $423,217,147, $1,304,915,290 and $335,813,815) | | $ | 29,308,386 | |
| | Investments of affiliated issuers, at value (cost $0, $0, $114,348,213, $202,666,754, $3,747,934, $21,654,935 and $7,164,780) | | | — | |
| | Repurchase agreement, at value which equals cost | | | 5,600,000 | |
| | Cash | | | 719,893 | |
| | Foreign currencies, at value (cost $141,283, $491,817, $0, $0, $15,114, $11,511,927 and $0, respectively) | | | 141,832 | |
| | Unrealized gain on swap contracts | | | 53,368 | |
| | Unrealized gain on non-deliverable bond forwards contracts | | | 1,022 | |
| | Unrealized gain on forward foreign currency exchange contracts | | | 240,129 | |
| | Variation margin on certain derivative contracts | | | — | |
| | Receivables: | | | | |
| | Fund shares sold | | | 475,561 | |
| | Interest | | | 409,532 | |
| | Investments sold | | | 312,356 | |
| | Investments sold on an extended-settlement basis | | | — | |
| | Collateral on certain derivative contracts(a) | | | 83,303 | |
| | Reimbursement from investment adviser | | | 39,560 | |
| | Due from broker — upfront payment | | | 2,128 | |
| | Foreign tax reclaims | | | — | |
| | Collateral on Reverse Repurchase agreements | | | — | |
| | Upfront payments made on swap contracts | | | — | |
| | Other assets | | | 3,165 | |
| | Total assets | | | 37,390,235 | |
| | | | | | |
| | Liabilities: | | | | |
| | Reverse Repurchase Agreement, at value | | | — | |
| | Forward sale contracts, at value (proceeds received $27,956,523 for U.S. Mortgages Fund) | | | — | |
| | Unrealized loss on swap contracts | | | 102,240 | |
| | Unrealized loss on forward foreign currency exchange contracts | | | 415,431 | |
| | Variation margin on certain derivative contracts | | | 484 | |
| | Payables: | | | | |
| | Investments purchased | | | 2,213,360 | |
| | Investments purchased on an extended — settlement basis | | | — | |
| | Upfront payments received on swap contracts | | | 38,933 | |
| | Management fees | | | 16,672 | |
| | Distributions payable | | | 12,778 | |
| | Fund shares redeemed | | | 9,223 | |
| | Distribution and Service fees and Transfer Agency fees | | | 1,019 | |
| | Collateral on certain derivative contracts | | | — | |
| | Interest Payable on Borrowings | | | — | |
| | Due to broker — upfront payment | | | — | |
| | Payable for Unfunded Loan Commitments | | | — | |
| | Accrued expenses and other liabilities | | | 135,159 | |
| | Total liabilities | | | 2,945,299 | |
| | | | | | |
| | Net Assets: | | | | |
| | Paid-in capital | | $ | 39,599,374 | |
| | Undistributed (distributions in excess of) net investment income | | | (1,379,981 | ) |
| | Accumulated net realized gain (loss) | | | (821,326 | ) |
| | Net unrealized gain (loss) | | | (2,953,131 | ) |
| | | NET ASSETS | | $ | 34,444,936 | |
| | | Net Assets: | | | | |
| | | Class A | | $ | 576,279 | |
| | | Class C | | | 56,822 | |
| | | Institutional | | | 33,768,549 | |
| | | Service | | | — | |
| | | Separate Account Institutional | | | — | |
| | | Class IR | | | 21,740 | |
| | | Class R | | | 21,546 | |
| | | Class R6(b) | | | — | |
| | | Total Net Assets | | $ | 34,444,936 | |
| | | Shares Outstanding $0.001 par value (unlimited shares authorized): | | | | |
| | | Class A | | | 73,342 | |
| | | Class C | | | 7,209 | |
| | | Institutional | | | 4,283,839 | |
| | | Service | | | — | |
| | | Separate Account Institutional | | | — | |
| | | Class IR | | | 2,764 | |
| | | Class R | | | 2,734 | |
| | | Class R6(b) | | | — | |
| | | Net asset value, offering and redemption price per share:(c) | | | | |
| | | Class A | | | $7.86 | |
| | | Class C | | | 7.88 | |
| | | Institutional | | | 7.88 | |
| | | Service | | | — | |
| | | Separate Account Institutional | | | — | |
| | | Class IR | | | 7.86 | |
| | | Class R | | | 7.88 | |
| | | Class R6(b) | | | — | |
| | (a) | | Includes segregated cash of $13,315, $2,881,532, $595,000, $647,008 and $520,000 for the Dynamic Emerging Markets Debt, Emerging Markets Debt, Investment Grade Credit, Local Emerging Markets Debt and U.S. Mortgages Funds, respectively, relating to initial margin requirements and collateral on futures transactions. Also includes amounts segregated for initial margin on swap transactions of $69,988, $6,038,805, $2,228,383, $1,127,503, $22,993,005 and $1,133,918 for the Dynamic Emerging Markets Debt, Emerging Markets Debt, High Yield Floating Rate, Investment Grade Credit, Local Emerging Markets Debt and U.S. Mortgages Funds, respectively. |
| | (b) | | Commenced operations on July 31, 2015. |
| | (c) | | Maximum public offering price per share for Class A Shares of Dynamic Emerging Markets Debt, Emerging Markets Debt, High Yield, High Yield Floating Rate, Investment Grade Credit, Local Emerging Markets Debt and U.S. Mortgages Funds is $8.23, $12.40, $6.55, $9.86, $9.38, $6.26 and $11.08, respectively. At redemption, Class C Shares may be subject to a contingent deferred sales charge, assessed on the amount equal to the lesser of the current net asset value (“NAV”) or the original purchase price of the shares. |
| | |
| 120 | | The accompanying notes are an integral part of these financial statements. |
GOLDMAN SACHS SINGLE SECTOR FIXED INCOME FUNDS
| | | | | | | | | | | | | | | | | | | | | | | | | | | | | | | | | | |
| | | Emerging Markets
Debt Fund | | | | | High Yield Fund | | | | | High Yield
Floating Rate Fund | | | | | Investment Grade
Credit Fund | | | | | Local Emerging
Markets Debt Fund | | | | | U.S. Mortgages
Fund | |
| | | | | | | | | | | | | | | | | | | | | | | | | | | | | | | | | | |
| |
$ |
1,031,590,369 |
| | | | $ | 4,352,867,210 | | | | | $ | 3,553,392,673 | | | | | $ | 420,779,244 | | | | | $ | 937,556,160 | | | | | $ | 337,754,664 | |
| | | — | | | | | | 114,348,213 | | | | | | 202,665,903 | | | | | | 3,747,934 | | | | | | 21,654,935 | | | | | | 7,164,780 | |
| | | 3,100,000 | | | | | | — | | | | | | — | | | | | | — | | | | | | — | | | | | | — | |
| | | 508,518 | | | | | | 51,679,010 | | | | | | 52,451,727 | | | | | | 4,166,050 | | | | | | 9,647,304 | | | | | | 2,925,790 | |
| | | 508,939 | | | | | | — | | | | | | — | | | | | | 14,858 | | | | | | 11,503,693 | | | | | | — | |
| | | 2,695,190 | | | | | | — | | | | | | — | | | | | | — | | | | | | 16,502,507 | | | | | | — | |
| | | — | | | | | | — | | | | | | — | | | | | | — | | | | | | 1,772 | | | | | | — | |
| | | 9,460,848 | | | | | | 239,515 | | | | | | 138,030 | | | | | | — | | | | | | 14,335,203 | | | | | | — | |
| | | — | | | | | | 1,756,983 | | | | | | 29,554 | | | | | | 16,335 | | | | | | 347,779 | | | | | | 3,584 | |
| | | | | | | | | | | | | | | | | | | | | | | | | | | | | | | | | | |
| | | 3,637,984 | | | | | | 17,771,458 | | | | | | 5,503,281 | | | | | | 395,141 | | | | | | 3,201,722 | | | | | | 120,718 | |
| | | 17,190,364 | | | | | | 85,433,702 | | | | | | 22,103,546 | | | | | | 4,298,014 | | | | | | 14,823,580 | | | | | | 851,012 | |
| | | 9,869,186 | | | | | | 63,166,053 | | | | | | 3,329,642 | | | | | | 933,175 | | | | | | 21,815,398 | | | | | | 5,918 | |
| | | — | | | | | | 14,406,655 | | | | | | 104,687,272 | | | | | | — | | | | | | — | | | | | | 84,400,542 | |
| | | 8,920,337 | | | | | | — | | | | | | 2,228,383 | | | | | | 1,722,503 | | | | | | 23,640,013 | | | | | | 1,653,918 | |
| | | 43,314 | | | | | | — | | | | | | — | | | | | | 42,649 | | | | | | — | | | | | | 74,783 | |
| | | — | | | | | | — | | | | | | — | | | | | | — | | | | | | — | | | | | | — | |
| | | — | | | | | | 23,278 | | | | | | — | | | | | | — | | | | | | — | | | | | | — | |
| | | 494,000 | | | | | | 10,558,829 | | | | | | 399,000 | | | | | | — | | | | | | — | | | | | | — | |
| | | — | | | | | | — | | | | | | — | | | | | | — | | | | | | 108,901 | | | | | | — | |
| | | 10,827 | | | | | | 36,860 | | | | | | 25,108 | | | | | | 3,891 | | | | | | 9,399 | | | | | | 2,314 | |
| | | 1,088,029,876 | | | | | | 4,712,287,766 | | | | | | 3,946,954,119 | | | | | | 436,119,794 | | | | | | 1,075,148,366 | | | | | | 434,958,023 | |
| | | | | | | | | | | | | | | | | | | | | | | | | | | | | | | | | | |
| | | | | | | | | | | | | | | | | | | | | | | | | | | | | | | | | | |
| | | 8,123,805 | | | | | | 119,075,938 | | | | | | 4,500,000 | | | | | | — | | | | | | 154,438 | | | | | | — | |
| | | — | | | | | | — | | | | | | — | | | | | | — | | | | | | — | | | | | | 28,136,407 | |
| | | 3,737,026 | | | | | | — | | | | | | — | | | | | | 1,135 | | | | | | 30,048,427 | | | | | | 175,749 | |
| | | 2,582,859 | | | | | | 35,844 | | | | | | 2,492 | | | | | | — | | | | | | 13,071,867 | | | | | | — | |
| | | 68,919 | | | | | | — | | | | | | — | | | | | | 72,840 | | | | | | — | | | | | | 15,410 | |
| | | | | | | | | | | | | | | | | | | | | | | | | | | | | | | | | | |
| | | 7,954,373 | | | | | | 8,275,810 | | | | | | 7,202 | | | | | | 346 | | | | | | 143,239 | | | | | | 121,486,113 | |
| | | 373,282 | | | | | | 17,219,462 | | | | | | 91,794,002 | | | | | | — | | | | | | — | | | | | | 501,802 | |
| | | 2,591,392 | | | | | | — | | | | | | — | | | | | | 11,449 | | | | | | 432,302 | | | | | | 851,973 | |
| | | 701,006 | | | | | | 2,580,275 | | | | | | 1,712,057 | | | | | | 120,466 | | | | | | 700,790 | | | | | | 76,107 | |
| | | 268,253 | | | | | | 1,173,603 | | | | | | 70,100 | | | | | | 104,313 | | | | | | 106,175 | | | | | | 92,772 | |
| | | 31,451,334 | | | | | | 139,085,936 | | | | | | 33,044,064 | | | | | | 1,494,825 | | | | | | 35,030,699 | | | | | | 84,332 | |
| | | 87,217 | | | | | | 319,311 | | | | | | 133,228 | | | | | | 21,906 | | | | | | 90,500 | | | | | | 18,708 | |
| | | — | | | | | | — | | | | | | — | | | | | | — | | | | | | 6,110,000 | | | | | | 40,000 | |
| | | 54,364 | | | | | | 363,220 | | | | | | 1,891 | | | | | | — | | | | | | 148 | | | | | | — | |
| | | — | | | | | | — | | | | | | — | | | | | | — | | | | | | 42,924 | | | | | | — | |
| | | — | | | | | | — | | | | | | 1,510,067 | | | | | | — | | | | | | — | | | | | | — | |
| | | 306,605 | | | | | | 581,662 | | | | | | 138,940 | | | | | | 99,877 | | | | | | 526,514 | | | | | | 138,614 | |
| | | 58,300,435 | | | | | | 288,711,061 | | | | | | 132,914,043 | | | | | | 1,927,157 | | | | | | 86,458,023 | | | | | | 151,617,987 | |
| | | | | | | | | | | | | | | | | | | | | | | | | | | | | | | | | | |
| | | | | | | | | | | | | | | | | | | | | | | | | | | | | | | | | | |
| | $ | 1,140,613,898 | | | | | $ | 4,882,621,806 | | | | | $ | 4,005,441,449 | | | | | $ | 435,237,431 | | | | | $ | 1,663,153,106 | | | | | $ | 283,419,138 | |
| | | 22,905,969 | | | | | | (5,801,234 | ) | | | | | 1,776,038 | | | | | | 802,135 | | | | | | (94,194,507 | ) | | | | | 949,533 | |
| | | (48,243,072 | ) | | | | | (72,125,122 | ) | | | | | (47,198,857 | ) | | | | | 838,357 | | | | | | (199,317,261 | ) | | | | | (2,823,559 | ) |
| | | (85,547,354 | ) | | | | | (381,118,745 | ) | | | | | (145,978,554 | ) | | | | | (2,685,286 | ) | | | | | (380,950,995 | ) | | | | | 1,794,924 | |
| | | $ | 1,029,729,441 | | | | | $ | 4,423,576,705 | | | | | $ | 3,814,040,076 | | | | | $ | 434,192,637 | | | | | $ | 988,690,343 | | | | | $ | 283,340,036 | |
| | | | | | | | | | | | | | | | | | | | | | | | | | | | | | | | | | | |
| | | $ | 90,928,812 | | | | | $ | 338,621,576 | | | | | $ | 6,838,780 | | | | | $ | 26,625,431 | | | | | $ | 169,989,182 | | | | | $ | 33,701,241 | |
| | | | 27,531,764 | | | | | | 59,155,369 | | | | | | 1,862,249 | | | | | | — | | | | | | 7,055,908 | | | | | | — | |
| | | | 897,149,191 | | | | | | 3,983,236,865 | | | | | | 3,804,051,060 | | | | | | 159,974,679 | | | | | | 806,229,348 | | | | | | 50,853,562 | |
| | | | — | | | | | | 15,851,706 | | | | | | — | | | | | | — | | | | | | — | | | | | | — | |
| | | | — | | | | | | — | | | | | | — | | | | | | 246,483,593 | | | | | | — | | | | | | 196,621,709 | |
| | | | 14,109,851 | | | | | | 10,827,264 | | | | | | 1,276,827 | | | | | | 1,098,985 | | | | | | 5,415,905 | | | | | | 2,153,469 | |
| | | | — | | | | | | 15,874,386 | | | | | | 11,160 | | | | | | — | | | | | | — | | | | | | — | |
| | | | 9,823 | | | | | | 9,539 | | | | | | — | | | | | | 9,949 | | | | | | — | | | | | | 10,055 | |
| | | $ | 1,029,729,441 | | | | | $ | 4,423,576,705 | | | | | $ | 3,814,040,076 | | | | | $ | 434,192,637 | | | | | $ | 988,690,343 | | | | | $ | 283,340,036 | |
| | | | | | | | | | | | | | | | | | | | | | | | | | | | | | | | | | | |
| | | | 7,677,019 | | | | | | 54,094,654 | | | | | | 709,400 | | | | | | 2,948,326 | | | | | | 28,444,129 | | | | | | 3,161,906 | |
| | | | 2,325,440 | | | | | | 9,439,022 | | | | | | 193,138 | | | | | | — | | | | | | 1,178,683 | | | | | | — | |
| | | | 75,645,001 | | | | | | 634,481,161 | | | | | | 394,232,477 | | | | | | 17,710,496 | | | | | | 135,036,364 | | | | | | 4,759,757 | |
| | | | — | | | | | | 2,534,160 | | | | | | — | | | | | | — | | | | | | — | | | | | | — | |
| | | | — | | | | | | — | | | | | | — | | | | | | 27,280,719 | | | | | | — | | | | | | 18,445,052 | |
| | | | 1,189,721 | | | | | | 1,726,067 | | | | | | 132,201 | | | | | | 121,620 | | | | | | 907,591 | | | | | | 201,500 | |
| | | | — | | | | | | 2,536,657 | | | | | | 1,157 | | | | | | — | | | | | | — | | | | | | — | |
| | | | 828 | | | | | | 1,518 | | | | | | — | | | | | | 1,101 | | | | | | — | | | | | | 941 | |
| | | | | | | | | | | | | | | | | | | | | | | | | | | | | | | | | | | |
| | | | $11.84 | | | | | | $6.26 | | | | | | $9.64 | | | | | | $9.03 | | | | | | $5.98 | | | | | | $10.66 | |
| | | | 11.84 | | | | | | 6.27 | | | | | | 9.64 | | | | | | — | | | | | | 5.99 | | | | | | — | |
| | | | 11.86 | | | | | | 6.28 | | | | | | 9.65 | | | | | | 9.03 | | | | | | 5.97 | | | | | | 10.68 | |
| | | | — | | | | | | 6.26 | | | | | | — | | | | | | — | | | | | | — | | | | | | — | |
| | | | — | | | | | | — | | | | | | — | | | | | | 9.04 | | | | | | — | | | | | | 10.66 | |
| | | | 11.86 | | | | | | 6.27 | | | | | | 9.66 | | | | | | 9.04 | | | | | | 5.97 | | | | | | 10.69 | |
| | | | — | | | | | | 6.26 | | | | | | 9.65 | | | | | | — | | | | | | — | | | | | | — | |
| | | | 11.86 | | | | | | 6.29 | | | | | | — | | | | | | 9.03 | | | | | | — | | | | | | 10.68 | |
| | |
| The accompanying notes are an integral part of these financial statements. | | 121 |
GOLDMAN SACHS SINGLE SECTOR FIXED INCOME FUNDS
Statements of Operations
For the Six Months Ended September 30, 2015 (Unaudited)
| | | | | | |
| | | | | Dynamic
Emerging Markets
Debt Fund | |
| | Investment income: | | | | |
| | Interest, net of allowances — (net of foreign withholding taxes of $5,819, $671, $0, $0, $0, $393,348 and $0, respectively) | | $ | 560,594 | |
| | Dividends — unaffiliated issuers | | | — | |
| | Dividends — affiliated issuers | | | — | |
| | Total investment income | | | 560,594 | |
| | | | | | |
| | Expenses: | | | | |
| | Management fees | | | 94,521 | |
| | Transfer Agency fees(a) | | | 4,555 | |
| | Distribution and Service fees(a) | | | 1,215 | |
| | Custody, accounting and administrative services | | | 100,379 | |
| | Professional fees | | | 53,748 | |
| | Registration fees | | | 36,140 | |
| | Printing and mailing costs | | | 17,946 | |
| | Trustee fees | | | 6,107 | |
| | Service Share fees — Shareholder Administration Plan | | | — | |
| | Service Share fees — Service Plan | | | — | |
| | Other | | | 3,087 | |
| | Total expenses | | | 317,698 | |
| | Less — expense reductions | | | (222,238 | ) |
| | Net expenses | | | 95,460 | |
| | NET INVESTMENT INCOME | | | 465,134 | |
| | | | | | |
| | Realized and unrealized gain (loss): | | | | |
| | Net realized gain (loss) from: | | | | |
| | Investments — unaffiliated issuers | | | (371,512 | ) |
| | Investments — affiliated issuers | | | — | |
| | Futures contracts | | | (1,295 | ) |
| | Written options | | | — | |
| | Swap contracts | | | (59,616 | ) |
| | Non-deliverable bond forward contracts | | | (2,239 | ) |
| | Forward foreign currency exchange contracts | | | (24,812 | ) |
| | Foreign currency transactions | | | (33,372 | ) |
| | Net change in unrealized gain (loss) on: | | | | |
| | Investments — unaffiliated issuers | | | (1,648,830 | ) |
| | Investments — affiliated issuers | | | — | |
| | Futures contracts | | | 9,979 | |
| | Non-deliverable bond forward contracts | | | 1,022 | |
| | Swap contracts | | | 28,898 | |
| | Forward foreign currency exchange contracts | | | (109,594 | ) |
| | Foreign currency translation | | | 8,002 | |
| | Net realized and unrealized loss | | | (2,203,369 | ) |
| | NET INCREASE (DECREASE) IN NET ASSETS RESULTING FROM OPERATIONS | | $ | (1,738,235 | ) |
| | (a) | | Class specific Distribution and Service and Transfer Agency fees were as follows: |
| | | | | | | | | | | | | | | | | | | | | | | | | | | | | | | | | | | | | | | | | | |
| Distribution and Service Fees | | | Transfer Agency Fees | |
Class A | | | Class C | | | Class R | | | Class A | | | Class C | | | Institutional | | | Service | | | Separate Account
Institutional | | | Class IR | | | Class R | | | Class R6(b) | |
| $ | 854 | | | $ | 304 | | | $ | 57 | | | $ | 444 | | | $ | 39 | | | $ | 4,043 | | | $ | — | | | $ | — | | | $ | 14 | | | $ | 15 | | | $ | — | |
| | 120,158 | | | | 149,579 | | | | — | | | | 62,482 | | | | 19,445 | | | | 236,803 | | | | — | | | | — | | | | 9,394 | | | | — | | | | 1 | |
| | 523,710 | | | | 334,875 | | | | 42,980 | | | | 272,329 | | | | 43,534 | | | | 965,819 | | | | 3,474 | | | | — | | | | 8,241 | | | | 11,175 | | | | 1 | |
| | 19,253 | | | | 9,594 | | | | 28 | | | | 10,012 | | | | 1,247 | | | | 836,855 | | | | — | | | | — | | | | 641 | | | | 7 | | | | — | |
| | 35,280 | | | | — | | | | — | | | | 18,345 | | | | — | | | | 33,882 | | | | — | | | | 50,364 | | | | 694 | | | | — | | | | 1 | |
| | 217,222 | | | | 42,811 | | | | — | | | | 112,956 | | | | 5,565 | | | | 217,348 | | | | — | | | | — | | | | 2,497 | | | | — | | | | — | |
| | 40,480 | | | | — | | | | — | | | | 21,049 | | | | — | | | | 9,642 | | | | — | | | | 39,325 | | | | 1,260 | | | | — | | | | 1 | |
| | (b) | | Commenced operations on July 31, 2015. |
| | |
| 122 | | The accompanying notes are an integral part of these financial statements. |
GOLDMAN SACHS SINGLE SECTOR FIXED INCOME FUNDS
| | | | | | | | | | | | | | | | | | | | | | | | | | | | | | | | | | |
| | | Emerging Markets
Debt Fund | | | | | High Yield Fund | | | | | High Yield
Floating Rate
Fund | | | | | Investment Grade
Credit Fund | | | | | Local Emerging
Markets Debt
Fund | | | | | U.S. Mortgages
Fund | |
| | | | | | | | | | | | | | | | | | | | | | | | | | | | | | | | | | |
| | $ | 40,264,348 | | | | | $ | 173,029,945 | | | | | $ | 98,001,050 | | | | | $ | 8,972,905 | | | | | $ | 41,383,454 | | | | | $ | 3,629,707 | |
| | | — | | | | | | 131,695 | | | | | | — | | | | | | 54,569 | | | | | | — | | | | | | — | |
| | | — | | | | | | 8,716 | | | | | | 680,766 | | | | | | 566 | | | | | | 1,521 | | | | | | 2,009 | |
| | | 40,264,348 | | | | | | 173,170,356 | | | | | | 98,681,816 | | | | | | 9,028,040 | | | | | | 41,384,975 | | | | | | 3,631,716 | |
| | | | | | | | | | | | | | | | | | | | | | | | | | | | | | | | | | |
| | | | | | | | | | | | | | | | | | | | | | | | | | | | | | | | | | |
| | | 5,298,062 | | | | | | 17,531,854 | | | | | | 11,316,610 | | | | | | 901,045 | | | | | | 5,728,143 | | | | | | 558,319 | |
| | | 328,125 | | | | | | 1,304,573 | | | | | | 848,762 | | | | | | 103,286 | | | | | | 338,366 | | | | | | 71,277 | |
| | | 269,737 | | | | | | 901,565 | | | | | | 28,875 | | | | | | 35,280 | | | | | | 260,033 | | | | | | 40,480 | |
| | | 199,043 | | | | | | 206,492 | | | | | | 537,873 | | | | | | 53,205 | | | | | | 477,266 | | | | | | 134,156 | |
| | | 54,665 | | | | | | 69,187 | | | | | | 70,669 | | | | | | 54,925 | | | | | | 56,511 | | | | | | 62,093 | |
| | | 46,219 | | | | | | 77,201 | | | | | | 53,794 | | | | | | 21,749 | | | | | | 53,998 | | | | | | 31,281 | |
| | | 180,603 | | | | | | 90,653 | | | | | | 20,518 | | | | | | 12,317 | | | | | | 28,267 | | | | | | 9,876 | |
| | | 10,313 | | | | | | 26,490 | | | | | | 20,045 | | | | | | 10,642 | | | | | | 9,690 | | | | | | 8,626 | |
| | | — | | | | | | 21,716 | | | | | | — | | | | | | — | | | | | | — | | | | | | — | |
| | | — | | | | | | 21,716 | | | | | | — | | | | | | — | | | | | | — | | | | | | — | |
| | | 29,684 | | | | | | 49,159 | | | | | | 44,486 | | | | | | 15,442 | | | | | | 27,647 | | | | | | 5,923 | |
| | | 6,416,451 | | | | | | 20,300,606 | | | | | | 12,941,632 | | | | | | 1,207,891 | | | | | | 6,979,921 | | | | | | 922,031 | |
| | | (162,875 | ) | | | | | (117,396 | ) | | | | | (345,131 | ) | | | | | (299,084 | ) | | | | | (842,248 | ) | | | | | (329,926 | ) |
| | | 6,253,576 | | | | | | 20,183,210 | | | | | | 12,596,501 | | | | | | 908,807 | | | | | | 6,137,673 | | | | | | 592,105 | |
| | | 34,010,772 | | | | | | 152,987,146 | | | | | | 86,085,315 | | | | | | 8,119,233 | | | | | | 35,247,302 | | | | | | 3,039,611 | |
| | | | | | | | | | | | | | | | | | | | | | | | | | | | | | | | | | |
| | | | | | | | | | | | | | | | | | | | | | | | | | | | | | | | | | |
| | | | | | | | | | | | | | | | | | | | | | | | | | | | | | | | | | |
| | | (35,466,143 | ) | | | | | (55,903,592 | ) | | | | | (9,067,889 | ) | | | | | (1,579,368 | ) | | | | | (89,196,462 | ) | | | | | 139,699 | |
| | | — | | | | | | — | | | | | | (696,892 | ) | | | | | — | | | | | | — | | | | | | — | |
| | | 4,505,745 | | | | | | (5,056,615 | ) | | | | | — | | | | | | 88,705 | | | | | | 82,961 | | | | | | 959,109 | |
| | | — | | | | | | — | | | | | | — | | | | | | — | | | | | | — | | | | | | (126,530 | ) |
| | | (5,415,952 | ) | | | | | (1,627,583 | ) | | | | | (1,597,008 | ) | | | | | 1,193,911 | | | | | | (5,457,181 | ) | | | | | 37,372 | |
| | | — | | | | | | — | | | | | | — | | | | | | — | | | | | | (1,002,857 | ) | | | | | — | |
| | | 900,388 | | | | | | (287,990 | ) | | | | | (1,054,497 | ) | | | | | — | | | | | | 1,051,703 | | | | | | — | |
| | | 2,293,455 | | | | | | 1,026,354 | | | | | | 1,175,402 | | | | | | — | | | | | | (4,775,461 | ) | | | | | — | |
| | | | | | | | | | | | | | | | | | | | | | | | | | | | | | | | | | |
| | | (22,014,841 | ) | | | | | (355,213,026 | ) | | | | | (106,587,907 | ) | | | | | (19,936,569 | ) | | | | | (84,396,999 | ) | | | | | (2,302,311 | ) |
| | | — | | | | | | — | | | | | | (21,352 | ) | | | | | — | | | | | | — | | | | | | — | |
| | | (50,079 | ) | | | | | 781,597 | | | | | | — | | | | | | (227,715 | ) | | | | | (425,412 | ) | | | | | 308,477 | |
| | | — | | | | | | — | | | | | | — | | | | | | — | | | | | | 1,772 | | | | | | — | |
| | | 7,164,837 | | | | | | 1,098,882 | | | | | | 330,099 | | | | | | (1,326,638 | ) | | | | | 862,739 | | | | | | (378,197 | ) |
| | | 1,797,064 | | | | | | (1,248,256 | ) | | | | | (773,038 | ) | | | | | — | | | | | | (2,516,709 | ) | | | | | — | |
| | | 184,421 | | | | | | 44,685 | | | | | | (50,096 | ) | | | | | 276 | | | | | | 1,152,222 | | | | | | — | |
| | | (46,101,105 | ) | | | | | (416,385,544 | ) | | | | | (118,343,178 | ) | | | | | (21,787,398 | ) | | | | | (184,619,684 | ) | | | | | (1,362,381 | ) |
| | $ | (12,090,333 | ) | | | | $ | (263,398,398 | ) | | | | $ | (32,257,863 | ) | | | | $ | (13,668,165 | ) | | | | $ | (149,372,382 | ) | | | | $ | 1,677,230 | |
| | |
| The accompanying notes are an integral part of these financial statements. | | 123 |
GOLDMAN SACHS SINGLE SECTOR FIXED INCOME FUNDS
Statements of Changes in Net Assets
| | | | | | | | | | |
| | | | | Dynamic Emerging Markets Debt Fund | |
| | | | | For the
Six Months Ended
September 30, 2015
(Unaudited) | | | For the Fiscal
Year Ended
March 31, 2015 | |
| | From operations: | |
| | Net investment income | | $ | 465,134 | | | $ | 1,223,040 | |
| | Net realized gain (loss) | | | (492,846 | ) | | | (1,541,219 | ) |
| | Net change in unrealized loss | | | (1,710,523 | ) | | | (1,117,846 | ) |
| | Net increase (decrease) in net assets resulting from operations | | | (1,738,235 | ) | | | (1,436,025 | ) |
| | | | | | | | | | |
| | Distributions to shareholders: | | | | | | | | |
| | From net investment income | | | | | | | | |
| | Class A Shares | | | (13,263 | ) | | | (9,355 | ) |
| | Class B Shares(a) | | | — | | | | — | |
| | Class C Shares | | | (954 | ) | | | (2,955 | ) |
| | Institutional Shares | | | (422,756 | ) | | | (1,084,108 | ) |
| | Service Shares | | | — | | | | — | |
| | Class IR Shares | | | (476 | ) | | | (963 | ) |
| | Class R Shares | | | (416 | ) | | | (846 | ) |
| | Class R6 Shares(b) | | | — | | | | — | |
| | From net realized gains | | | | | | | | |
| | Class A Shares | | | — | | | | — | |
| | Class C Shares | | | — | | | | — | |
| | Institutional Shares | | | — | | | | — | |
| | Service Shares | | | — | | | | — | |
| | Class IR Shares | | | — | | | | — | |
| | Class R Shares | | | — | | | | — | |
| | Return of capital | | | | | | | | |
| | Class A Shares | | | — | | | | (677 | ) |
| | Class B Shares(a) | | | — | | | | — | |
| | Class C Shares | | | — | | | | (214 | ) |
| | Institutional Shares | | | — | | | | (78,456 | ) |
| | Service Shares | | | — | | | | — | |
| | Class IR Shares | | | — | | | | (70 | ) |
| | Class R Shares | | | — | | | | (61 | ) |
| | Total distributions to shareholders | | | (437,865 | ) | | | (1,177,705 | ) |
| | | | | | | | | | |
| | From share transactions: | | | | | | | | |
| | Proceeds from sales of shares | | | 20,479,315 | | | | 11,813,819 | |
| | Reinvestment of distributions | | | 424,176 | | | | 714,613 | |
| | Cost of shares redeemed(c) | | | (626,272 | ) | | | (17,897,771 | ) |
| | Net increase (decrease) in net assets resulting from share transactions | | | 20,277,219 | | | | (5,369,339 | ) |
| | TOTAL INCREASE (DECREASE) | | | 18,101,119 | | | | (7,983,069 | ) |
| | | | | | | | | | |
| | Net assets: | | | | | | | | |
| | Beginning of period | | | 16,343,817 | | | | 24,326,886 | |
| | End of period | | $ | 34,444,936 | | | $ | 16,343,817 | |
| | Distribution in excess of net investment income | | $ | (1,379,981 | ) | | $ | (1,407,250 | ) |
| | (a) | | Class B Shares were converted into Class A Shares at the close of business on November 14, 2014. |
| | (b) | | Commenced operations on July 31, 2015. |
| | (c) | | Net of $1,578 and $1,483, $22,254 and $23,053, and $98,815 and $223,350 of redemption fees for Dynamic Emerging Markets Debt, Emerging Markets Debt and High Yield Funds, respectively, for the six months ended September 30, 2015 and the fiscal year ended March 31, 2015, respectively. |
| | |
| 124 | | The accompanying notes are an integral part of these financial statements. |
GOLDMAN SACHS SINGLE SECTOR FIXED INCOME FUNDS
| | | | | | | | | | | | | | | | | | | | | | |
| | | Emerging Markets Debt Fund | | | | | High Yield Fund | |
| | | For the
Six Months Ended
September 30, 2015
(Unaudited) | | | | | For the Fiscal
Year Ended
March 31, 2015 | | | | | For the
Six Months Ended
September 30, 2015
(Unaudited) | | | | | For the Fiscal
Year Ended
March 31, 2015 | |
| | | | | | | | | | | | | | | | | | | | | | |
| | $ | 34,010,772 | | | | | $ | 74,591,633 | | | | | $ | 152,987,146 | | | | | $ | 282,475,705 | |
| | | (33,182,507 | ) | | | | | 51,452,944 | | | | | | (61,849,426 | ) | | | | | 25,338,002 | |
| | | (12,918,598 | ) | | | | | (69,951,184 | ) | | | | | (354,536,118 | ) | | | | | (228,603,218 | ) |
| | | (12,090,333 | ) | | | | | 56,093,393 | | | | | | (263,398,398 | ) | | | | | 79,210,489 | |
| | | | | | | | | | | | | | | | | | | | | | |
| | | | | | | | | | | | | | | | | | | | | | |
| | | | | | | | | | | | | | | | | | | | | | |
| | | (2,339,709 | ) | | | | | (4,003,181 | ) | | | | | (11,335,495 | ) | | | | | (25,025,943 | ) |
| | | — | | | | | | — | | | | | | — | | | | | | (284,014 | ) |
| | | (615,552 | ) | | | | | (1,082,903 | ) | | | | | (1,565,842 | ) | | | | | (3,635,326 | ) |
| | | (30,480,352 | ) | | | | | (67,829,030 | ) | | | | | (139,089,758 | ) | | | | | (248,965,574 | ) |
| | | — | | | | | | — | | | | | | (457,147 | ) | | | | | (851,009 | ) |
| | | (369,827 | ) | | | | | (703,551 | ) | | | | | (359,976 | ) | | | | | (828,194 | ) |
| | | — | | | | | | — | | | | | | (444,605 | ) | | | | | (892,063 | ) |
| | | (93 | ) | | | | | — | | | | | | (93 | ) | | | | | — | |
| | | | | | | | | | | | | | | | | | | | | | |
| | | — | | | | | | — | | | | | | — | | | | | | (9,750,531 | ) |
| | | — | | | | | | — | | | | | | — | | | | | | (1,497,617 | ) |
| | | — | | | | | | — | | | | | | — | | | | | | (90,622,036 | ) |
| | | — | | | | | | — | | | | | | — | | | | | | (331,483 | ) |
| | | — | | | | | | — | | | | | | — | | | | | | (291,362 | ) |
| | | — | | | | | | — | | | | | | — | | | | | | (342,096 | ) |
| | | | | | | | | | | | | | | | | | | | | | |
| | | — | | | | | | — | | | | | | — | | | | | | (296,537 | ) |
| | | — | | | | | | — | | | | | | — | | | | | | (3,365 | ) |
| | | — | | | | | | — | | | | | | — | | | | | | (43,076 | ) |
| | | — | | | | | | — | | | | | | — | | | | | | (2,950,042 | ) |
| | | — | | | | | | — | | | | | | — | | | | | | (10,084 | ) |
| | | — | | | | | | — | | | | | | — | | | | | | (9,813 | ) |
| | | — | | | | | | — | | | | | | — | | | | | | (10,570 | ) |
| | | (33,805,533 | ) | | | | | (73,618,665 | ) | | | | | (153,252,916 | ) | | | | | (386,640,735 | ) |
| | | | | | | | | | | | | | | | | | | | | | |
| | | | | | | | | | | | | | | | | | | | | | |
| | | 235,728,371 | | | | | | 817,379,947 | | | | | | 608,194,117 | | | | | | 2,381,930,006 | |
| | | 32,179,429 | | | | | | 71,347,084 | | | | | | 146,027,416 | | | | | | 365,387,845 | |
| | | (899,004,541 | ) | | | | | (609,926,689 | ) | | | | | (1,493,410,873 | ) | | | | | (1,996,852,634 | ) |
| | | (631,096,741 | ) | | | | | 278,800,342 | | | | | | (739,189,340 | ) | | | | | 750,465,217 | |
| | | (676,992,607 | ) | | | | | 261,275,070 | | | | | �� | (1,155,840,654 | ) | | | | | 443,034,971 | |
| | | | | | | | | | | | | | | | | | | | | | |
| | | | | | | | | | | | | | | | | | | | | | |
| | | 1,706,722,048 | | | | | | 1,445,446,978 | | | | | | 5,579,417,359 | | | | | | 5,136,382,388 | |
| | $ | 1,029,729,441 | | | | | $ | 1,706,722,048 | | | | | $ | 4,423,576,705 | | | | | $ | 5,579,417,359 | |
| | $ | 22,905,969 | | | | | $ | 22,700,730 | | | | | $ | (5,801,234 | ) | | | | $ | (5,535,464 | ) |
| | |
| The accompanying notes are an integral part of these financial statements. | | 125 |
GOLDMAN SACHS SINGLE SECTOR FIXED INCOME FUNDS
Statements of Changes in Net Assets (continued)
| | | | | | | | | | |
| | | | | High Yield Floating Rate Fund | |
| | | | | For the
Six Months Ended
September 30, 2015
(Unaudited) | | | For the Fiscal
Year Ended
March 31, 2015 | |
| | From operations: | |
| | Net investment income | | $ | 86,085,315 | | | $ | 164,221,651 | |
| | Net realized gain (loss) | | | (11,240,884 | ) | | | (31,551,633 | ) |
| | Net change in unrealized gain (loss) | | | (107,102,294 | ) | | | (45,046,641 | ) |
| | Net increase (decrease) in net assets resulting from operations | | | (32,257,863 | ) | | | 87,623,377 | |
| | | | | | | | | | |
| | Distributions to shareholders: | | | | | | | | |
| | From net investment income | | | | | | | | |
| | Class A Shares | | | (287,870 | ) | | | (414,673 | ) |
| | Class C Shares | | | (28,890 | ) | | | (59,907 | ) |
| | Institutional Shares | | | (85,741,673 | ) | | | (164,500,555 | ) |
| | Separate Account Institutional Shares | | | — | | | | — | |
| | Class IR Shares | | | (19,768 | ) | | | (36,691 | ) |
| | Class R Shares | | | (198 | ) | | | (362 | ) |
| | Class R6 Shares(a) | | | — | | | | — | |
| | From net realized gains | | | | | | | | |
| | Class A Shares | | | — | | | | (745 | ) |
| | Class C Shares | | | — | | | | (243 | ) |
| | Institutional Shares | | | — | | | | (503,521 | ) |
| | Separate Account Institutional Shares | | | — | | | | — | |
| | Class IR Shares | | | — | | | | (106 | ) |
| | Class R Shares | | | — | | | | (1 | ) |
| | Return of capital | | | | | | | | |
| | Class A Shares | | | — | | | | — | |
| | Class C Shares | | | — | | | | — | |
| | Institutional Shares | | | — | | | | — | |
| | Class IR Shares | | | — | | | | — | |
| | Total distributions to shareholders | | | (86,078,399 | ) | | | (165,516,804 | ) |
| | | | | | | | | | |
| | From share transactions: | | | | | | | | |
| | Proceeds from sales of shares | | | 815,839,339 | | | | 2,105,568,828 | |
| | Reinvestment of distributions | | | 85,666,238 | | | | 164,611,767 | |
| | Cost of shares redeemed | | | (1,065,096,239 | ) | | | (2,297,042,086 | ) |
| | Net increase (decrease) in net assets resulting from share transactions | | | (163,590,662 | ) | | | (26,861,491 | ) |
| | TOTAL INCREASE (DECREASE) | | | (281,926,924 | ) | | | (104,754,918 | ) |
| | | | | | | | | | |
| | Net assets: | | | | | | | | |
| | Beginning of period | | | 4,095,967,000 | | | | 4,200,721,918 | |
| | End of period | | $ | 3,814,040,076 | | | $ | 4,095,967,000 | |
| | Undistributed net investment income | | $ | 1,776,038 | | | $ | 1,769,122 | |
| | (a) | | Commenced operations on July 31, 2015. |
| | (b) | | Net of $31,073 and $110,728 of redemption fees for Local Emerging Markets Debt Fund for the six months ended September 30, 2015, and for fiscal year ended March 31, 2015, respectively. |
| | |
| 126 | | The accompanying notes are an integral part of these financial statements. |
GOLDMAN SACHS SINGLE SECTOR FIXED INCOME FUNDS
| | | | | | | | | | | | | | | | | | | | | | | | | | | | | | | | | | |
| | | Investment Grade Credit Fund | | | | | Local Emerging Markets Debt Fund | | | | | U.S. Mortgages Fund | |
| | | For the
Six Months Ended
September 30, 2015
(Unaudited) | | | | | For the Fiscal
Year Ended
March 31, 2015 | | | | | For the
Six Months Ended
September 30, 2015
(Unaudited) | | | | | For the Fiscal
Year Ended
March 31, 2015 | | | | | For the
Six Months Ended
September 30, 2015
(Unaudited) | | | | | For the Fiscal
Year Ended
March 31, 2015 | |
| | | | | | | | | | | | | | | | | | | | | | | | | | | | | | | | | | |
| | $ | 8,119,233 | | | | | $ | 16,206,086 | | | | | $ | 35,247,302 | | | | | $ | 90,787,502 | | | | | $ | 3,039,611 | | | | | $ | 4,639,878 | |
| | | (296,752 | ) | | | | | 10,622,770 | | | | | | (99,297,297 | ) | | | | | (132,303,398 | ) | | | | | 1,009,650 | | | | | | 5,632,371 | |
| | | (21,490,646 | ) | | | | | 3,122,983 | | | | | | (85,322,387 | ) | | | | | (183,094,157 | ) | | | | | (2,372,031 | ) | | | | | 2,707,661 | |
| | | (13,668,165 | ) | | | | | 29,951,839 | | | | | | (149,372,382 | ) | | | | | (224,610,053 | ) | | | | | 1,677,230 | | | | | | 12,979,910 | |
| | | | | | | | | | | | | | | | | | | | | | | | | | | | | | | | | | |
| | | | | | | | | | | | | | | | | | | | | | | | | | | | | | | | | | |
| | | | | | | | | | | | | | | | | | | | | | | | | | | | | | | | | | |
| | | (463,561 | ) | | | | | (808,807 | ) | | | | | (4,499,673 | ) | | | | | — | | | | | | (399,132 | ) | | | | | (212,519 | ) |
| | | — | | | | | | — | | | | | | (192,452 | ) | | | | | — | | | | | | — | | | | | | — | |
| | | (3,073,513 | ) | | | | | (5,947,438 | ) | | | | | (30,344,808 | ) | | | | | — | | | | | | (674,711 | ) | | | | | (975,492 | ) |
| | | (4,565,466 | ) | | | | | (9,498,885 | ) | | | | | — | | | | | | — | | | | | | — | | | | | | — | |
| | | (18,880 | ) | | | | | (25,838 | ) | | | | | (103,346 | ) | | | | | — | | | | | | (26,255 | ) | | | | | (22,895 | ) |
| | | — | | | | | | — | | | | | | — | | | | | | — | | | | | | (2,754,914 | ) | | | | | (5,034,660 | ) |
| | | (60 | ) | | | | | — | | | | | | — | | | | | | — | | | | | | (47 | ) | | | | | — | |
| | | | | | | | | | | | | | | | | | | | | | | | | | | | | | | | | | |
| | | — | | | | | | (490,118 | ) | | | | | — | | | | | | — | | | | | | — | | | | | | — | |
| | | — | | | | | | — | | | | | | — | | | | | | — | | | | | | — | | | | | | — | |
| | | — | | | | | | (3,426,260 | ) | | | | | — | | | | | | — | | | | | | — | | | | | | — | |
| | | — | | | | | | (5,274,687 | ) | | | | | — | | | | | | — | | | | | | — | | | | | | — | |
| | | — | | | | | | (14,072 | ) | | | | | — | | | | | | — | | | | | | — | | | | | | — | |
| | | — | | | | | | — | | | | | | — | | | | | | — | | | | | | — | | | | | | — | |
| | | | | | | | | | | | | | | | | | | | | | | | | | | | | | | | | | |
| | | — | | | | | | — | | | | | | — | | | | | | (5,527,377 | ) | | | | | — | | | | | | — | |
| | | — | | | | | | — | | | | | | — | | | | | | (659,120 | ) | | | | | — | | | | | | — | |
| | | — | | | | | | — | | | | | | — | | | | | | (93,999,207 | ) | | | | | — | | | | | | — | |
| | | — | | | | | | — | | | | | | — | | | | | | (296,968 | ) | | | | | — | | | | | | — | |
| | | (8,121,480 | ) | | | | | (25,486,105 | ) | | | | | (35,140,279 | ) | | | | | (100,482,672 | ) | | | | | (3,855,059 | ) | | | | | (6,245,566 | ) |
| | | | | | | | | | | | | | | | | | | | | | | | | | | | | | | | | | |
| | | | | | | | | | | | | | | | | | | | | | | | | | | | | | | | | | |
| | | 30,387,352 | | | | | | 117,910,821 | | | | | | 206,314,889 | | | | | | 787,207,165 | | | | | | 33,005,396 | | | | | | 109,326,915 | |
| | | 7,487,912 | | | | | | 23,690,592 | | | | | | 33,696,381 | | | | | | 95,950,913 | | | | | | 3,335,643 | | | | | | 5,327,191 | |
| | | (49,441,775 | ) | | | | | (156,510,008 | ) | | | | | (454,781,811 | )(b) | | | | | (1,090,151,515 | )(b) | | | | | (25,781,614 | ) | | | | | (73,294,927 | ) |
| | | (11,566,511 | ) | | | | | (14,908,595 | ) | | | | | (214,770,541 | ) | | | | | (206,993,437 | ) | | | | | 10,559,425 | | | | | | 41,359,179 | |
| | | (33,356,156 | ) | | | | | (10,442,861 | ) | | | | | (399,283,202 | ) | | | | | (532,086,162 | ) | | | | | 8,381,596 | | | | | | 48,093,523 | |
| | | | | | | | | | | | | | | | | | | | | | | | | | | | | | | | | | |
| | | | | | | | | | | | | | | | | | | | | | | | | | | | | | | | | | |
| | | 467,548,793 | | | | | | 477,991,654 | | | | | | 1,387,973,545 | | | | | | 1,920,059,707 | | | | | | 274,958,440 | | | | | | 226,864,917 | |
| | $ | 434,192,637 | | | | | $ | 467,548,793 | | | | | $ | 988,690,343 | | | | | $ | 1,387,973,545 | | | | | $ | 283,340,036 | | | | | $ | 274,958,440 | |
| | $ | 802,135 | | | | | $ | 804,382 | | | | | $ | (94,194,507 | ) | | | | $ | (94,301,530 | ) | | | | $ | 949,533 | | | | | $ | 21,937 | |
| | |
| The accompanying notes are an integral part of these financial statements. | | 127 |
GOLDMAN SACHS DYNAMIC EMERGING MARKETS DEBT FUND
Financial Highlights
Selected Data for a Share Outstanding Throughout Each Period
| | | | | | | | | | | | | | | | | | | | | | | | | | | | | | |
| | | | | | | | From
investment operations | | | Distributions
to shareholders | |
| | | Year - Share Class | |
Net asset
value,
beginning
of period | | | Net
investment
income(a) | | | Net realized
and unrealized
gain (loss) | | | Total from
investment
operations | | | From net
investment
income | | | From
capital | | | Total
distributions | |
| | FOR THE SIX MONTHS ENDED SEPTEMBER 30, (UNAUDITED) | |
| | 2015 - A | | $ | 8.59 | | | $ | 0.17 | | | $ | (0.74 | ) | | $ | (0.57 | ) | | $ | (0.16 | ) | | $ | — | | | $ | (0.16 | ) |
| | 2015 - C | | | 8.61 | | | | 0.14 | | | | (0.74 | ) | | | (0.60 | ) | | | (0.13 | ) | | | — | | | | (0.13 | ) |
| | 2015 - Institutional | | | 8.62 | | | | 0.19 | | | | (0.75 | ) | | | (0.56 | ) | | | (0.18 | ) | | | — | | | | (0.18 | ) |
| | 2015 - IR | | | 8.60 | | | | 0.19 | | | | (0.76 | ) | | | (0.57 | ) | | | (0.17 | ) | | | — | | | | (0.17 | ) |
| | 2015 - R | | | 8.62 | | | | 0.16 | | | | (0.75 | ) | | | (0.59 | ) | | | (0.15 | ) | | | — | | | | (0.15 | ) |
| | | | | | | | | | | | | | | | | | | | | | | | | | | | | | |
| | FOR THE FISCAL YEAR ENDED MARCH 31, | |
| | 2015 - A | | | 9.45 | | | | 0.37 | | | | (0.86 | ) | | | (0.49 | ) | | | (0.34 | ) | | | (0.03 | ) | | | (0.37 | ) |
| | 2015 - C | | | 9.46 | | | | 0.32 | | | | (0.87 | ) | | | (0.55 | ) | | | (0.27 | ) | | | (0.03 | ) | | | (0.30 | ) |
| | 2015 - Institutional | | | 9.46 | | | | 0.42 | | | | (0.86 | ) | | | (0.44 | ) | | | (0.37 | ) | | | (0.03 | ) | | | (0.40 | ) |
| | 2015 - IR | | | 9.44 | | | | 0.41 | | | | (0.86 | ) | | | (0.45 | ) | | | (0.36 | ) | | | (0.03 | ) | | | (0.39 | ) |
| | 2015 - R | | | 9.46 | | | | 0.36 | | | | (0.85 | ) | | | (0.49 | ) | | | (0.32 | ) | | | (0.03 | ) | | | (0.35 | ) |
| | | | | | | | | | | | | | | | | | | | | | | | | | | | | | |
| | FOR THE PERIOD ENDED MARCH 31, | |
| | 2014 - A (Commenced May 31, 2013) | | | 10.00 | | | | 0.31 | | | | (0.52 | ) | | | (0.21 | ) | | | (0.23 | ) | | | (0.11 | ) | | | (0.34 | ) |
| | 2014 - C (Commenced May 31, 2013) | | | 10.00 | | | | 0.25 | | | | (0.51 | ) | | | (0.26 | ) | | | (0.17 | ) | | | (0.11 | ) | | | (0.28 | ) |
| | 2014 - Institutional (Commenced May 31, 2013) | | | 10.00 | | | | 0.32 | | | | (0.50 | ) | | | (0.18 | ) | | | (0.25 | ) | | | (0.11 | ) | | | (0.36 | ) |
| | 2014 - IR (Commenced May 31, 2013) | | | 10.00 | | | | 0.31 | | | | (0.52 | ) | | | (0.21 | ) | | | (0.24 | ) | | | (0.11 | ) | | | (0.35 | ) |
| | 2014 - R (Commenced May 31, 2013) | | | 10.00 | | | | 0.27 | | | | (0.49 | ) | | | (0.22 | ) | | | (0.21 | ) | | | (0.11 | ) | | | (0.32 | ) |
| | (a) | | Calculated based on the average shares outstanding methodology. |
| | (b) | | Assumes investment at the NAV at the beginning of the period, reinvestment of all dividends and distributions, a complete redemption of the investment at the NAV at the end of the period and no sales or redemption charges. Total returns would be reduced if a sales or redemption charge was taken into account. Returns do not reflect the deduction of taxes that a shareholder would pay on Fund distributions or the redemption of Fund shares. Total returns for periods less than one full year are not annualized. |
| | (c) | | The Fund’s portfolio turnover rate is calculated in accordance with regulatory requirements, without regard to transactions involving short term investments and certain derivatives. If such transactions were included, the Fund’s portfolio turnover rate may be higher. |
| | |
| 128 | | The accompanying notes are an integral part of these financial statements. |
GOLDMAN SACHS DYNAMIC EMERGING MARKETS DEBT FUND
| | | | | | | | | | | | | | | | | | | | | | | | | | | | | | | | | | | | | | | | |
| | | | | | | | | | | | | | | | | | | | | | | | | | | | | | | | | | |
| | | Net asset
value, end
of period | | | | | Total
return(b) | | | | | Net assets,
end of
period
(in 000s) | | | | | Ratio of
net expenses
to average
net assets | | | | | Ratio of
total expenses
to average
net assets | | | | | Ratio of
net investment
income
to average
net assets | | | | | Portfolio
turnover
rate(c) | |
| | | | | | | | | | | | | | | | | | | | | | | | | | | | | | | | | | | | | | | | |
| | $ | 7.86 | | | | | | (6.69 | )% | | | | $ | 576 | | | | | | 1.23 | %(d) | | | | | 3.37 | %(d) | | | | | 4.13 | %(d) | | | | | 50 | % |
| | | 7.88 | | | | | | (7.13 | ) | | | | | 57 | | | | | | 1.98 | (d) | | | | | 4.12 | (d) | | | | | 3.38 | (d) | | | | | 50 | |
| | | 7.88 | | | | | | (6.62 | ) | | | | | 33,769 | | | | | | 0.89 | (d) | | | | | 3.01 | (d) | | | | | 4.45 | (d) | | | | | 50 | |
| | | 7.86 | | | | | | (6.68 | ) | | | | | 22 | | | | | | 0.98 | (d) | | | | | 3.12 | (d) | | | | | 4.39 | (d) | | | | | 50 | |
| | | 7.88 | | | | | | (6.90 | ) | | | | | 22 | | | | | | 1.48 | (d) | | | | | 3.62 | (d) | | | | | 3.88 | (d) | | | | | 50 | |
| | | | | | | | | | | | | | | | | | | | | | | | | | | | | | | | | | | | | | | | |
| | | | | | | | | | | | | | | | | | | | | | | | | | | | | | | | | | | | | | | | |
| | | 8.59 | | | | | | (5.43 | ) | | | | | 665 | | | | | | 1.24 | | | | | | 3.45 | | | | | | 4.13 | | | | | | 179 | |
| | | 8.61 | | | | | | (5.91 | ) | | | | | 62 | | | | | | 1.99 | | | | | | 3.66 | | | | | | 3.37 | | | | | | 179 | |
| | | 8.62 | | | | | | (4.87 | ) | | | | | 15,571 | | | | | | 0.90 | | | | | | 2.57 | | | | | | 4.47 | | | | | | 179 | |
| | | 8.60 | | | | | | (4.98 | ) | | | | | 23 | | | | | | 1.00 | | | | | | 2.77 | | | | | | 4.37 | | | | | | 179 | |
| | | 8.62 | | | | | | (5.44 | ) | | | | | 23 | | | | | | 1.49 | | | | | | 3.27 | | | | | | 3.87 | | | | | | 179 | |
| | | | | | | | | | | | | | | | | | | | | | | | | | | | | | | | | | | | | | | | |
| | | | | | | | | | | | | | | | | | | | | | | | | | | | | | | | | | | | | | | | |
| | | 9.45 | | | | | | (2.03 | ) | | | | | 99 | | | | | | 1.27 | (d) | | | | | 3.67 | (d) | | | | | 3.97 | (d) | | | | | 140 | |
| | | 9.46 | | | | | | (2.52 | ) | | | | | 59 | | | | | | 2.01 | (d) | | | | | 5.31 | (d) | | | | | 3.27 | (d) | | | | | 140 | |
| | | 9.46 | | | | | | (1.67 | ) | | | | | 24,119 | | | | | | 0.93 | (d) | | | | | 4.21 | (d) | | | | | 4.17 | (d) | | | | | 140 | |
| | | 9.44 | | | | | | (1.98 | ) | | | | | 24 | | | | | | 1.03 | (d) | | | | | 4.19 | (d) | | | | | 4.00 | (d) | | | | | 140 | |
| | | 9.46 | | | | | | (2.14 | ) | | | | | 24 | | | | | | 1.52 | (d) | | | | | 5.22 | (d) | | | | | 3.50 | (d) | | | | | 140 | |
| | |
| The accompanying notes are an integral part of these financial statements. | | 129 |
GOLDMAN SACHS EMERGING MARKETS DEBT FUND
Financial Highlights
Selected Data for a Share Outstanding Throughout Each Period
| | | | | | | | | | | | | | | | | | | | | | | | | | | | | | | | | | |
| | | | | | | | From
investment operations | | | Distributions
to shareholders | |
| | | Year - Share Class | |
Net asset
value,
beginning
of period | | | Net
investment
income(a) | | | Net realized
and unrealized
gain (loss) | | | Total from
investment
operations | | | From net
investment
income | | | From net
realized
gains | | | From
capital | | | Total
distributions | |
| | FOR THE SIX MONTHS ENDED SEPTEMBER 30, (UNAUDITED) | |
| | 2015 - A | | $ | 12.33 | | | $ | 0.30 | | | $ | (0.49 | ) | | $ | (0.19 | ) | | $ | (0.30 | ) | | $ | — | | | $ | — | | | $ | (0.30 | ) |
| | 2015 - C | | | 12.33 | | | | 0.25 | | | | (0.49 | ) | | | (0.24 | ) | | | (0.25 | ) | | | — | | | | — | | | | (0.25 | ) |
| | 2015 - Institutional | | | 12.35 | | | | 0.32 | | | | (0.49 | ) | | | (0.17 | ) | | | (0.32 | ) | | | — | | | | — | | | | (0.32 | ) |
| | 2015 - IR | | | 12.35 | | | | 0.32 | | | | (0.50 | ) | | | (0.18 | ) | | | (0.31 | ) | | | — | | | | — | | | | (0.31 | ) |
| | 2015 - R6 (Commenced July 31, 2015) | | | 12.18 | | | | 0.11 | | | | (0.32 | ) | | | (0.21 | ) | | | (0.11 | ) | | | — | | | | — | | | | (0.11 | ) |
| | | | | | | | | | | | | | | | | | | | | | | | | | | | | | | | | | |
| | FOR THE FISCAL YEARS ENDED MARCH 31, | | | | | |
| | 2015 - A | | | 12.40 | | | | 0.52 | | | | (0.07 | ) | | | 0.45 | | | | (0.52 | ) | | | — | | | | — | | | | (0.52 | ) |
| | 2015 - C | | | 12.39 | | | | 0.43 | | | | (0.07 | ) | | | 0.36 | | | | (0.42 | ) | | | — | | | | — | | | | (0.42 | ) |
| | 2015 - Institutional | | | 12.41 | | | | 0.57 | | | | (0.07 | ) | | | 0.50 | | | | (0.56 | ) | | | — | | | | — | | | | (0.56 | ) |
| | 2015 - IR | | | 12.41 | | | | 0.56 | | | | (0.07 | ) | | | 0.49 | | | | (0.55 | ) | | | — | | | | — | | | | (0.55 | ) |
| | 2014 - A | | | 13.28 | | | | 0.55 | | | | (0.70 | ) | | | (0.15 | ) | | | (0.50 | ) | | | (0.20 | ) | | | (0.03 | ) | | | (0.73 | ) |
| | 2014 - C | | | 13.27 | | | | 0.46 | | | | (0.70 | ) | | | (0.24 | ) | | | (0.41 | ) | | | (0.20 | ) | | | (0.03 | ) | | | (0.64 | ) |
| | 2014 - Institutional | | | 13.29 | | | | 0.59 | | | | (0.69 | ) | | | (0.10 | ) | | | (0.55 | ) | | | (0.20 | ) | | | (0.03 | ) | | | (0.78 | ) |
| | 2014 - IR | | | 13.29 | | | | 0.58 | | | | (0.69 | ) | | | (0.11 | ) | | | (0.54 | ) | | | (0.20 | ) | | | (0.03 | ) | | | (0.77 | ) |
| | 2013 - A | | | 12.95 | | | | 0.61 | | | | 0.76 | | | | 1.37 | | | | (0.65 | ) | | | (0.39 | ) | | | — | | | | (1.04 | ) |
| | 2013 - C | | | 12.94 | | | | 0.50 | | | | 0.77 | | | | 1.27 | | | | (0.55 | ) | | | (0.39 | ) | | | — | | | | (0.94 | ) |
| | 2013 - Institutional | | | 12.96 | | | | 0.65 | | | | 0.77 | | | | 1.42 | | | | (0.70 | ) | | | (0.39 | ) | | | — | | | | (1.09 | ) |
| | 2013 - IR | | | 12.96 | | | | 0.64 | | | | 0.77 | | | | 1.41 | | | | (0.69 | ) | | | (0.39 | ) | | | — | | | | (1.08 | ) |
| | 2012 - A | | | 12.28 | | | | 0.61 | | | | 0.81 | | | | 1.42 | | | | (0.61 | ) | | | (0.14 | ) | | | — | | | | (0.75 | ) |
| | 2012 - C | | | 12.27 | | | | 0.52 | | | | 0.80 | | | | 1.32 | | | | (0.51 | ) | | | (0.14 | ) | | | — | | | | (0.65 | ) |
| | 2012 - Institutional | | | 12.29 | | | | 0.65 | | | | 0.81 | | | | 1.46 | | | | (0.65 | ) | | | (0.14 | ) | | | — | | | | (0.79 | ) |
| | 2012 - IR | | | 12.29 | | | | 0.63 | | | | 0.82 | | | | 1.45 | | | | (0.64 | ) | | | (0.14 | ) | | | — | | | | (0.78 | ) |
| | 2011 - A | | | 11.99 | | | | 0.59 | | | | 0.42 | | | | 1.01 | | | | (0.71 | ) | | | (0.01 | ) | | | — | | | | (0.72 | ) |
| | 2011 - C | | | 11.98 | | | | 0.49 | | | | 0.43 | | | | 0.92 | | | | (0.62 | ) | | | (0.01 | ) | | | — | | | | (0.63 | ) |
| | 2011 - Institutional | | | 12.00 | | | | 0.63 | | | | 0.42 | | | | 1.05 | | | | (0.75 | ) | | | (0.01 | ) | | | — | | | | (0.76 | ) |
| | 2011 - IR (Commenced July 30, 2010) | | | 12.44 | | | | 0.41 | | | | (0.04 | ) | | | 0.37 | | | | (0.51 | ) | | | (0.01 | ) | | | — | | | | (0.52 | ) |
| | (a) | | Calculated based on the average shares outstanding methodology. |
| | (b) | | Assumes investment at the NAV at the beginning of the period, reinvestment of all dividends and distributions, a complete redemption of the investment at the NAV at the end of the period and no sales or redemption charges. Total returns would be reduced if a sales or redemption charge was taken into account. Returns do not reflect the deduction of taxes that a shareholder would pay on Fund distributions or the redemption of Fund shares. Total returns for periods less than one full year are not annualized. |
| | (c) | | The Fund’s portfolio turnover rate is calculated in accordance with regulatory requirements, without regard to transactions involving short term investments and certain derivatives. If such transactions were included, the Fund’s portfolio turnover rate may be higher. |
| | (e) | | Portfolio turnover rates exclude portfolio securities received as a result of in-kind subscriptions. |
| | |
| 130 | | The accompanying notes are an integral part of these financial statements. |
GOLDMAN SACHS EMERGING MARKETS DEBT FUND
| | | | | | | | | | | | | | | | | | | | | | | | | | | | | | | | | | | | | | | | |
| | | | | | | | | | | | | | | | | | | | | | | | | | | | | | | | | | |
| | | Net asset
value, end
of period | | | | | Total
return(b) | | | | | Net assets,
end of
period
(in 000s) | | | | | Ratio of
net expenses
to average
net assets | | | | | Ratio of
total expenses
to average
net assets | | | | | Ratio of
net investment
income
to average
net assets | | | | | Portfolio
turnover
rate(c) | |
| | | | | | | | | | | | | | | | | | | | | | | | | | | | | | | | | | | | | | | | |
| | $ | 11.84 | | | | | | (1.60 | )% | | | | $ | 90,929 | | | | | | 1.23 | %(d) | | | | | 1.26 | %(d) | | | | | 4.90 | %(d) | | | | | 55 | % |
| | | 11.84 | | | | | | (1.97 | ) | | | | | 27,532 | | | | | | 1.98 | (d) | | | | | 2.01 | (d) | | | | | 4.15 | (d) | | | | | 55 | |
| | | 11.86 | | | | | | (1.43 | ) | | | | | 897,149 | | | | | | 0.89 | (d) | | | | | 0.92 | (d) | | | | | 5.18 | (d) | | | | | 55 | |
| | | 11.86 | | | | | | (1.47 | ) | | | | | 14,110 | | | | | | 0.98 | (d) | | | | | 1.01 | (d) | | | | | 5.15 | (d) | | | | | 55 | |
| | | 11.86 | | | | | | (1.71 | ) | | | | | 10 | | | | | | 0.89 | (d) | | | | | 0.93 | (d) | | | | | 5.65 | (d) | | | | | 55 | |
| | | | | | | | | | | | | | | | | | | | | | | | | | | | | | | | | | | | | | | | |
| | | | | | | | | | | | | | | | | | | | | | | | | | | | | | | | | | | | | | | | |
| | | 12.33 | | | | | | 3.60 | | | | | | 94,832 | | | | | | 1.24 | | | | | | 1.25 | | | | | | 4.17 | | | | | | 113 | |
| | | 12.33 | | | | | | 2.92 | | | | | | 30,935 | | | | | | 1.99 | | | | | | 2.00 | | | | | | 3.42 | | | | | | 113 | |
| | | 12.35 | | | | | | 4.04 | | | | | | 1,566,532 | | | | | | 0.90 | | | | | | 0.91 | | | | | | 4.52 | | | | | | 113 | |
| | | 12.35 | | | | | | 3.94 | | | | | | 14,423 | | | | | | 0.99 | | | | | | 1.00 | | | | | | 4.41 | | | | | | 113 | |
| | | 12.40 | | | | | | (0.88 | ) | | | | | 100,723 | | | | | | 1.25 | | | | | | 1.26 | | | | | | 4.38 | | | | | | 121 | |
| | | 12.39 | | | | | | (1.63 | ) | | | | | 32,020 | | | | | | 2.00 | | | | | | 2.01 | | | | | | 3.65 | | | | | | 121 | |
| | | 12.41 | | | | | | (0.54 | ) | | | | | 1,296,153 | | | | | | 0.91 | | | | | | 0.92 | | | | | | 4.76 | | | | | | 121 | |
| | | 12.41 | | | | | | (0.63 | ) | | | | | 16,552 | | | | | | 1.00 | | | | | | 1.01 | | | | | | 4.65 | | | | | | 121 | |
| | | 13.28 | | | | | | 10.64 | | | | | | 211,379 | | | | | | 1.23 | | | | | | 1.26 | | | | | | 4.48 | | | | | | 97 | |
| | | 13.27 | | | | | | 9.82 | | | | | | 49,527 | | | | | | 1.98 | | | | | | 2.01 | | | | | | 3.73 | | | | | | 97 | |
| | | 13.29 | | | | | | 11.04 | | | | | | 1,329,643 | | | | | | 0.89 | | | | | | 0.92 | | | | | | 4.83 | | | | | | 97 | |
| | | 13.29 | | | | | | 10.91 | | | | | | 23,970 | | | | | | 0.97 | | | | | | 1.01 | | | | | | 4.69 | | | | | | 97 | |
| | | 12.95 | | | | | | 11.87 | | | | | | 169,491 | | | | | | 1.22 | | | | | | 1.27 | | | | | | 4.84 | | | | | | 86 | |
| | | 12.94 | | | | | | 11.05 | | | | | | 31,893 | | | | | | 1.97 | | | | | | 2.02 | | | | | | 4.11 | | | | | | 86 | |
| | | 12.96 | | | | | | 12.24 | | | | | | 720,098 | | | | | | 0.88 | | | | | | 0.93 | | | | | | 5.18 | | | | | | 86 | |
| | | 12.96 | | | | | | 12.14 | | | | | | 6,515 | | | | | | 0.97 | | | | | | 1.02 | | | | | | 5.05 | | | | | | 86 | |
| | | 12.28 | | | | | | 8.46 | | | | | | 156,901 | | | | | | 1.22 | | | | | | 1.29 | | | | | | 4.75 | | | | | | 116 | (e) |
| | | 12.27 | | | | | | 7.65 | | | | | | 31,205 | | | | | | 1.97 | | | | | | 2.04 | | | | | | 4.00 | | | | | | 116 | (e) |
| | | 12.29 | | | | | | 8.82 | | | | | | 436,068 | | | | | | 0.88 | | | | | | 0.95 | | | | | | 5.12 | | | | | | 116 | (e) |
| | | 12.29 | | | | | | 2.96 | | | | | | 1,392 | | | | | | 0.97 | (d) | | | | | 1.05 | (d) | | | | | 4.96 | (d) | | | | | 116 | (e) |
| | |
| The accompanying notes are an integral part of these financial statements. | | 131 |
GOLDMAN SACHS HIGH YIELD FUND
Financial Highlights
Selected Data for a Share Outstanding Throughout Each Period
| | | | | | | | | | | | | | | | | | | | | | | | | | | | | | | | | | |
| | | | | | | | From
investment operations | | | Distributions
to shareholders | |
| | | Year - Share Class | |
Net asset
value,
beginning
of period | | | Net
investment
income(a) | | | Net realized
and unrealized
gain (loss) | | | Total from
investment
operations | | | From net
investment
income | | | From net
realized
gains | | | From
capital | | | Total
distributions | |
| | FOR THE SIX MONTHS ENDED SEPTEMBER 30, (UNAUDITED) | |
| | 2015 - A | | $ | 6.80 | | | $ | 0.18 | | | $ | (0.54 | ) | | $ | (0.36 | ) | | $ | (0.18 | ) | | $ | — | | | $ | — | | | $ | (0.18 | ) |
| | 2015 - C | | | 6.81 | | | | 0.16 | | | | (0.54 | ) | | | (0.38 | ) | | | (0.16 | ) | | | — | | | | — | | | | (0.16 | ) |
| | 2015 - Institutional | | | 6.82 | | | | 0.19 | | | | (0.54 | ) | | | (0.35 | ) | | | (0.19 | ) | | | — | | | | — | | | | (0.19 | ) |
| | 2015 - Service | | | 6.79 | | | | 0.18 | | | | (0.53 | ) | | | (0.35 | ) | | | (0.18 | ) | | | — | | | | — | | | | (0.18 | ) |
| | 2015 - IR | | | 6.81 | | | | 0.19 | | | | (0.54 | ) | | | (0.35 | ) | | | (0.19 | ) | | | — | | | | — | | | | (0.19 | ) |
| | 2015 - R | | | 6.80 | | | | 0.17 | | | | (0.54 | ) | | | (0.37 | ) | | | (0.17 | ) | | | — | | | | — | | | | (0.17 | ) |
| | 2015 - R6 (Commenced July 31, 2015) | | | 6.65 | | | | 0.06 | | | | (0.36 | ) | | | (0.30 | ) | | | (0.06 | ) | | | — | | | | — | | | | (0.06 | ) |
| | | | | | | | | | | | | | | | | | | | | | | | | | | | | | | | | | |
| | FOR THE FISCAL YEARS ENDED MARCH 31, | |
| | 2015 - A | | | 7.23 | | | | 0.37 | | | | (0.28 | ) | | | 0.09 | | | | (0.38 | ) | | | (0.14 | ) | | | — | (e) | | | (0.52 | ) |
| | 2015 - C | | | 7.24 | | | | 0.32 | | | | (0.29 | ) | | | 0.03 | | | | (0.32 | ) | | | (0.14 | ) | | | — | (e) | | | (0.46 | ) |
| | 2015 - Institutional | | | 7.25 | | | | 0.40 | | | | (0.29 | ) | | | 0.11 | | | | (0.40 | ) | | | (0.14 | ) | | | — | (e) | | | (0.54 | ) |
| | 2015 - Service | | | 7.23 | | | | 0.36 | | | | (0.30 | ) | | | 0.06 | | | | (0.36 | ) | | | (0.14 | ) | | | — | (e) | | | (0.50 | ) |
| | 2015 - IR | | | 7.25 | | | | 0.39 | | | | (0.30 | ) | | | 0.09 | | | | (0.39 | ) | | | (0.14 | ) | | | — | (e) | | | (0.53 | ) |
| | 2015 - R | | | 7.23 | | | | 0.35 | | | | (0.28 | ) | | | 0.07 | | | | (0.36 | ) | | | (0.14 | ) | | | — | (e) | | | (0.50 | ) |
| | 2014 - A | | | 7.40 | | | | 0.43 | | | | 0.09 | | | | 0.52 | | | | (0.43 | ) | | | (0.26 | ) | | | — | | | | (0.69 | ) |
| | 2014 - C | | | 7.41 | | | | 0.38 | | | | 0.08 | | | | 0.46 | | | | (0.37 | ) | | | (0.26 | ) | | | — | | | | (0.63 | ) |
| | 2014 - Institutional | | | 7.42 | | | | 0.46 | | | | 0.08 | | | | 0.54 | | | | (0.45 | ) | | | (0.26 | ) | | | — | | | | (0.71 | ) |
| | 2014 - Service | | | 7.40 | | | | 0.42 | | | | 0.09 | | | | 0.51 | | | | (0.42 | ) | | | (0.26 | ) | | | — | | | | (0.68 | ) |
| | 2014 - IR | | | 7.41 | | | | 0.45 | | | | 0.10 | | | | 0.55 | | | | (0.45 | ) | | | (0.26 | ) | | | — | | | | (0.71 | ) |
| | 2014 - R | | | 7.40 | | | | 0.41 | | | | 0.09 | | | | 0.50 | | | | (0.41 | ) | | | (0.26 | ) | | | — | | | | (0.67 | ) |
| | 2013 - A | | | 7.12 | | | | 0.45 | | | | 0.42 | | | | 0.87 | | | | (0.46 | ) | | | (0.13 | ) | | | — | | | | (0.59 | ) |
| | 2013 - C | | | 7.13 | | | | 0.40 | | | | 0.42 | | | | 0.82 | | | | (0.41 | ) | | | (0.13 | ) | | | — | | | | (0.54 | ) |
| | 2013 - Institutional | | | 7.14 | | | | 0.48 | | | | 0.42 | | | | 0.90 | | | | (0.49 | ) | | | (0.13 | ) | | | — | | | | (0.62 | ) |
| | 2013 - Service | | | 7.11 | | | | 0.44 | | | | 0.43 | | | | 0.87 | | | | (0.45 | ) | | | (0.13 | ) | | | — | | | | (0.58 | ) |
| | 2013 - IR | | | 7.13 | | | | 0.47 | | | | 0.42 | | | | 0.89 | | | | (0.48 | ) | | | (0.13 | ) | | | — | | | | (0.61 | ) |
| | 2013 - R | | | 7.12 | | | | 0.44 | | | | 0.41 | | | | 0.85 | | | | (0.44 | ) | | | (0.13 | ) | | | — | | | | (0.57 | ) |
| | 2012 - A | | | 7.38 | | | | 0.49 | | | | (0.18 | ) | | | 0.31 | | | | (0.50 | ) | | | (0.07 | ) | | | — | | | | (0.57 | ) |
| | 2012 - C | | | 7.39 | | | | 0.44 | | | | (0.19 | ) | | | 0.25 | | | | (0.44 | ) | | | (0.07 | ) | | | — | | | | (0.51 | ) |
| | 2012 - Institutional | | | 7.40 | | | | 0.51 | | | | (0.18 | ) | | | 0.33 | | | | (0.52 | ) | | | (0.07 | ) | | | — | | | | (0.59 | ) |
| | 2012 - Service | | | 7.38 | | | | 0.48 | | | | (0.19 | ) | | | 0.29 | | | | (0.49 | ) | | | (0.07 | ) | | | — | | | | (0.56 | ) |
| | 2012 - IR | | | 7.39 | | | | 0.50 | | | | (0.17 | ) | | | 0.33 | | | | (0.52 | ) | | | (0.07 | ) | | | — | | | | (0.59 | ) |
| | 2012 - R | | | 7.38 | | | | 0.47 | | | | (0.18 | ) | | | 0.29 | | | | (0.48 | ) | | | (0.07 | ) | | | — | | | | (0.55 | ) |
| | 2011 - A | | | 7.07 | | | | 0.55 | | | | 0.30 | | | | 0.85 | | | | (0.54 | ) | | | — | | | | — | | | | (0.54 | ) |
| | 2011 - C | | | 7.08 | | | | 0.49 | | | | 0.31 | | | | 0.80 | | | | (0.49 | ) | | | — | | | | — | | | | (0.49 | ) |
| | 2011 - Institutional | | | 7.09 | | | | 0.57 | | | | 0.31 | | | | 0.88 | | | | (0.57 | ) | | | — | | | | — | | | | (0.57 | ) |
| | 2011 - Service | | | 7.06 | | | | 0.53 | | | | 0.32 | | | | 0.85 | | | | (0.53 | ) | | | — | | | | — | | | | (0.53 | ) |
| | 2011 - IR | | | 7.07 | | | | 0.56 | | | | 0.32 | | | | 0.88 | | | | (0.56 | ) | | | — | | | | — | | | | (0.56 | ) |
| | 2011 - R | | | 7.07 | | | | 0.53 | | | | 0.31 | | | | 0.84 | | | | (0.53 | ) | | | — | | | | — | | | | (0.53 | ) |
| | (a) | | Calculated based on the average shares outstanding methodology. |
| | (b) | | Assumes investment at the NAV at the beginning of the period, reinvestment of all dividends and distributions, a complete redemption of the investment at the NAV at the end of the period and no sales or redemption charges. Total returns would be reduced if a sales or redemption charge was taken into account. Returns do not reflect the deduction of taxes that a shareholder would pay on Fund distributions or the redemption of Fund shares. Total returns for periods less than one full year are not annualized. |
| | (c) | | The Fund’s portfolio turnover rate is calculated in accordance with regulatory requirements, without regard to transactions involving short term investments and certain derivatives. If such transactions were included, the Fund’s portfolio turnover rate may be higher. |
| | (e) | | Amount is less than $0.005 per share. |
| | |
| 132 | | The accompanying notes are an integral part of these financial statements. |
GOLDMAN SACHS HIGH YIELD FUND
| | | | | | | | | | | | | | | | | | | | | | | | | | | | | | | | | | | | | | | | |
| | | | | | | | | | | | | | | | | | | | | | | | | | | | | | | | | | |
| | | Net asset
value, end
of period | | | | | Total
return(b) | | | | | Net assets,
end of
period
(in 000s) | | | | | Ratio of
net expenses
to average
net assets | | | | | Ratio of
total expenses
to average
net assets | | | | | Ratio of
net investment
income
to average
net assets | | | | | Portfolio
turnover
rate(c) | |
| | | | | | | | | | | | | | | | | | | | | | | | | | | | | | | | | | | | | | | | |
| | $ | 6.26 | | | | | | (5.39 | )% | | | | $ | 338,622 | | | | | | 1.05 | %(d) | | | | | 1.05 | %(d) | | | | | 5.40 | %(d) | | | | | 20 | % |
| | | 6.27 | | | | | | (5.73 | ) | | | | | 59,155 | | | | | | 1.80 | (d) | | | | | 1.80 | (d) | | | | | 4.67 | (d) | | | | | 20 | |
| | | 6.28 | | | | | | (5.21 | ) | | | | | 3,983,237 | | | | | | 0.71 | (d) | | | | | 0.71 | (d) | | | | | 5.75 | (d) | | | | | 20 | |
| | | 6.26 | | | | | | (5.33 | ) | | | | | 15,852 | | | | | | 1.21 | (d) | | | | | 1.21 | (d) | | | | | 5.26 | (d) | | | | | 20 | |
| | | 6.27 | | | | | | (5.26 | ) | | | | | 10,827 | | | | | | 0.80 | (d) | | | | | 0.80 | (d) | | | | | 5.67 | (d) | | | | | 20 | |
| | | 6.26 | | | | | | (5.51 | ) | | | | | 15,874 | | | | | | 1.30 | (d) | | | | | 1.30 | (d) | | | | | 5.17 | (d) | | | | | 20 | |
| | | 6.29 | | | | | | (4.50 | ) | | | | | 10 | | | | | | 0.72 | (d) | | | | | 0.73 | (d) | | | | | 5.92 | (d) | | | | | 20 | |
| | | | | | | | | | | | | | | | | | | | | | | | | | | | | | | | | | | | | | | | |
| | | | | | | | | | | | | | | | | | | | | | | | | | | | | | | | | | | | | | | | |
| | | 6.80 | | | | | | 1.21 | | | | | | 483,328 | | | | | | 1.06 | | | | | | 1.06 | | | | | | 5.30 | | | | | | 55 | |
| | | 6.81 | | | | | | 0.46 | | | | | | 71,577 | | | | | | 1.81 | | | | | | 1.81 | | | | | | 4.54 | | | | | | 55 | |
| | | 6.82 | | | | | | 1.56 | | | | | | 4,975,618 | | | | | | 0.72 | | | | | | 0.72 | | | | | | 5.62 | | | | | | 55 | |
| | | 6.79 | | | | | | 0.90 | | | | | | 17,506 | | | | | | 1.22 | | | | | | 1.22 | | | | | | 5.12 | | | | | | 55 | |
| | | 6.81 | | | | | | 1.32 | | | | | | 13,971 | | | | | | 0.81 | | | | | | 0.81 | | | | | | 5.54 | | | | | | 55 | |
| | | 6.80 | | | | | | 0.95 | | | | | | 17,417 | | | | | | 1.31 | | | | | | 1.31 | | | | | | 5.03 | | | | | | 55 | |
| | | 7.23 | | | | | | 7.41 | | | | | | 549,354 | | | | | | 1.05 | | | | | | 1.05 | | | | | | 5.95 | | | | | | 48 | |
| | | 7.24 | | | | | | 6.61 | | | | | | 88,607 | | | | | | 1.81 | | | | | | 1.81 | | | | | | 5.21 | | | | | | 48 | |
| | | 7.25 | | | | | | 7.77 | | | | | | 4,436,484 | | | | | | 0.72 | | | | | | 0.72 | | | | | | 6.30 | | | | | | 48 | |
| | | 7.23 | | | | | | 7.24 | | | | | | 17,066 | | | | | | 1.22 | | | | | | 1.22 | | | | | | 5.79 | | | | | | 48 | |
| | | 7.25 | | | | | | 7.68 | | | | | | 15,142 | | | | | | 0.81 | | | | | | 0.81 | | | | | | 6.22 | | | | | | 48 | |
| | | 7.23 | | | | | | 7.14 | | | | | | 18,075 | | | | | | 1.31 | | | | | | 1.31 | | | | | | 5.70 | | | | | | 48 | |
| | | 7.40 | | | | | | 12.67 | | | | | | 576,060 | | | | | | 1.05 | | | | | | 1.05 | | | | | | 6.27 | | | | | | 68 | |
| | | 7.41 | | | | | | 11.83 | | | | | | 106,063 | | | | | | 1.80 | | | | | | 1.80 | | | | | | 5.52 | | | | | | 68 | |
| | | 7.42 | | | | | | 13.03 | | | | | | 5,167,948 | | | | | | 0.71 | | | | | | 0.71 | | | | | | 6.61 | | | | | | 68 | |
| | | 7.40 | | | | | | 12.65 | | | | | | 17,512 | | | | | | 1.21 | | | | | | 1.21 | | | | | | 6.11 | | | | | | 68 | |
| | | 7.41 | | | | | | 13.09 | | | | | | 19,711 | | | | | | 0.80 | | | | | | 0.80 | | | | | | 6.55 | | | | | | 68 | |
| | | 7.40 | | | | | | 12.39 | | | | | | 18,565 | | | | | | 1.30 | | | | | | 1.30 | | | | | | 6.01 | | | | | | 68 | |
| | | 7.12 | | | | | | 4.53 | | | | | | 630,049 | | | | | | 1.06 | | | | | | 1.06 | | | | | | 6.97 | | | | | | 71 | |
| | | 7.13 | | | | | | 3.76 | | | | | | 108,682 | | | | | | 1.81 | | | | | | 1.81 | | | | | | 6.21 | | | | | | 71 | |
| | | 7.14 | | | | | | 4.89 | | | | | | 4,988,221 | | | | | | 0.72 | | | | | | 0.72 | | | | | | 7.25 | | | | | | 71 | |
| | | 7.11 | | | | | | 4.22 | | | | | | 21,420 | | | | | | 1.22 | | | | | | 1.22 | | | | | | 6.81 | | | | | | 71 | |
| | | 7.13 | | | | | | 4.79 | | | | | | 37,059 | | | | | | 0.81 | | | | | | 0.81 | | | | | | 7.13 | | | | | | 71 | |
| | | 7.12 | | | | | | 4.28 | | | | | | 17,087 | | | | | | 1.31 | | | | | | 1.31 | | | | | | 6.69 | | | | | | 71 | |
| | | 7.38 | | | | | | 12.56 | | | | | | 862,655 | | | | | | 1.05 | | | | | | 1.06 | | | | | | 7.63 | | | | | | 46 | |
| | | 7.39 | | | | | | 11.72 | | | | | | 114,921 | | | | | | 1.80 | | | | | | 1.81 | | | | | | 6.85 | | | | | | 46 | |
| | | 7.40 | | | | | | 12.93 | | | | | | 4,492,556 | | | | | | 0.71 | | | | | | 0.72 | | | | | | 7.94 | | | | | | 46 | |
| | | 7.38 | | | | | | 12.54 | | | | | | 23,208 | | | | | | 1.21 | | | | | | 1.22 | | | | | | 7.44 | | | | | | 46 | |
| | | 7.39 | | | | | | 12.99 | | | | | | 3,081 | | | | | | 0.80 | | | | | | 0.81 | | | | | | 7.79 | | | | | | 46 | |
| | | 7.38 | | | | | | 12.29 | | | | | | 13,279 | | | | | | 1.30 | | | | | | 1.31 | | | | | | 7.36 | | | | | | 46 | |
| | |
| The accompanying notes are an integral part of these financial statements. | | 133 |
GOLDMAN SACHS HIGH YIELD FLOATING RATE FUND
Financial Highlights
Selected Data for a Share Outstanding Throughout Each Period
| | | | | | | | | | | | | | | | | | | | | | | | | | | | | | | | | | |
| | | | | | | | From
investment operations | | | Distributions
to shareholders | |
| | | Year - Share Class | |
Net asset
value,
beginning
of period | | | Net
investment
income(a) | | | Net realized
and unrealized
gain (loss) | | | Total from
investment
operations | | | From net
investment
income | | | From net
realized
gains | | | From
capital | | | Total
distributions | |
| | FOR THE SIX MONTHS ENDED SEPTEMBER 30, (UNAUDITED) | |
| | 2015 - A | | $ | 9.92 | | | $ | 0.18 | | | $ | (0.27 | ) | | $ | (0.09 | ) | | $ | (0.19 | ) | | $ | — | | | $ | — | | | $ | (0.19 | ) |
| | 2015 - C | | | 9.92 | | | | 0.15 | | | | (0.28 | ) | | | (0.13 | ) | | | (0.15 | ) | | | — | | | | — | | | | (0.15 | ) |
| | 2015 - Institutional | | | 9.93 | | | | 0.20 | | | | (0.28 | ) | | | (0.08 | ) | | | (0.20 | ) | | | — | | | | — | | | | (0.20 | ) |
| | 2015 - IR | | | 9.94 | | | | 0.20 | | | | (0.28 | ) | | | (0.08 | ) | | | (0.20 | ) | | | — | | | | — | | | | (0.20 | ) |
| | 2015 - R | | | 9.92 | | | | 0.17 | | | | (0.27 | ) | | | (0.10 | ) | | | (0.17 | ) | | | — | | | | — | | | | (0.17 | ) |
| | | | | | | | | | | | | | | | | | | | | | | | | | | | | | | | | | |
| | FOR THE FISCAL YEARS ENDED MARCH 31, | | | | | |
| | 2015 - A | | | 10.07 | | | | 0.34 | | | | (0.14 | ) | | | 0.20 | | | | (0.35 | ) | | | — | (e) | | | — | | | | (0.35 | ) |
| | 2015 - C | | | 10.08 | | | | 0.27 | | | | (0.15 | ) | | | 0.12 | | | | (0.28 | ) | | | — | (e) | | | — | | | | (0.28 | ) |
| | 2015 - Institutional | | | 10.09 | | | | 0.38 | | | | (0.16 | ) | | | 0.22 | | | | (0.38 | ) | | | — | (e) | | | — | | | | (0.38 | ) |
| | 2015 - IR | | | 10.09 | | | | 0.37 | | | | (0.14 | ) | | | 0.23 | | | | (0.38 | ) | | | — | (e) | | | — | | | | (0.38 | ) |
| | 2015 - R | | | 10.08 | | | | 0.32 | | | | (0.15 | ) | | | 0.17 | | | | (0.33 | ) | | | — | (e) | | | — | | | | (0.33 | ) |
| | 2014 - A | | | 10.11 | | | | 0.33 | | | | (0.02 | ) | | | 0.31 | | | | (0.33 | ) | | | (0.02 | ) | | | — | | | | (0.35 | ) |
| | 2014 - C | | | 10.12 | | | | 0.26 | | | | (0.03 | ) | | | 0.23 | | | | (0.25 | ) | | | (0.02 | ) | | | — | | | | (0.27 | ) |
| | 2014 - Institutional | | | 10.13 | | | | 0.37 | | | | (0.03 | ) | | | 0.34 | | | | (0.36 | ) | | | (0.02 | ) | | | — | | | | (0.38 | ) |
| | 2014 - IR | | | 10.13 | | | | 0.36 | | | | (0.03 | ) | | | 0.33 | | | | (0.35 | ) | | | (0.02 | ) | | | — | | | | (0.37 | ) |
| | 2014 - R | | | 10.12 | | | | 0.31 | | | | (0.03 | ) | | | 0.28 | | | | (0.30 | ) | | | (0.02 | ) | | | — | | | | (0.32 | ) |
| | 2013 - A | | | 9.91 | | | | 0.37 | | | | 0.20 | | | | 0.57 | | | | (0.36 | ) | | | — | | | | (0.01 | ) | | | (0.37 | ) |
| | 2013 - C | | | 9.90 | | | | 0.29 | | | | 0.23 | | | | 0.52 | | | | (0.29 | ) | | | — | | | | (0.01 | ) | | | (0.30 | ) |
| | 2013 - Institutional | | | 9.91 | | | | 0.40 | | | | 0.23 | | | | 0.63 | | | | (0.40 | ) | | | — | | | | (0.01 | ) | | | (0.41 | ) |
| | 2013 - IR | | | 9.91 | | | | 0.40 | | | | 0.22 | | | | 0.62 | | | | (0.39 | ) | | | — | | | | (0.01 | ) | | | (0.40 | ) |
| | 2013 - R | | | 9.91 | | | | 0.35 | | | | 0.21 | | | | 0.56 | | | | (0.34 | ) | | | — | | | | (0.01 | ) | | | (0.35 | ) |
| | 2012 - A | | | 10.00 | | | | 0.33 | | | | (0.11 | ) | | | 0.22 | | | | (0.31 | ) | | | — | | | | — | | | | (0.31 | ) |
| | 2012 - C | | | 9.99 | | | | 0.26 | | | | (0.12 | ) | | | 0.14 | | | | (0.23 | ) | | | — | | | | — | | | | (0.23 | ) |
| | 2012 - Institutional | | | 9.99 | | | | 0.35 | | | | (0.09 | ) | | | 0.26 | | | | (0.34 | ) | | | — | | | | — | | | | (0.34 | ) |
| | 2012 - IR | | | 10.00 | | | | 0.34 | | | | (0.10 | ) | | | 0.24 | | | | (0.33 | ) | | | — | | | | — | | | | (0.33 | ) |
| | 2012 - R | | | 10.00 | | | | 0.28 | | | | (0.09 | ) | | | 0.19 | | | | (0.28 | ) | | | — | | | | — | | | | (0.28 | ) |
| | | | | | | | | | | | | | | | | | | | | | | | | | | | | | | | | | |
| | FOR THE PERIOD ENDED March 31, | | | | | |
| | 2011 - A (Commenced March 31, 2011) | | | 10.00 | | | | — | (e) | | | — | (e) | | | — | (e) | | | — | | | | — | | | | — | | | | — | |
| | 2011 - C (Commenced March 31, 2011) | | | 10.00 | | | | — | (e) | | | (0.01 | ) | | | (0.01 | ) | | | — | | | | — | | | | — | | | | — | |
| | 2011 - Institutional (Commenced March 31, 2011) | | | 10.00 | | | | — | (e) | | | (0.01 | ) | | | (0.01 | ) | | | — | | | | — | | | | — | | | | — | |
| | 2011 - IR (Commenced March 31, 2011) | | | 10.00 | | | | — | (e) | | | — | (e) | | | — | (e) | | | — | | | | — | | | | — | | | | — | |
| | 2011 - R (Commenced March 31, 2011) | | | 10.00 | | | | — | (e) | | | — | (e) | | | — | (e) | | | — | | | | — | | | | — | | | | — | |
| | (a) | | Calculated based on the average shares outstanding methodology. |
| | (b) | | Assumes investment at the NAV at the beginning of the period, reinvestment of all dividends and distributions, a complete redemption of the investment at the NAV at the end of the period and no sales or redemption charges. Total returns would be reduced if a sales or redemption charge was taken into account. Returns do not reflect the deduction of taxes that a shareholder would pay on Fund distributions or the redemption of Fund shares. Total returns for periods less than one full year are not annualized. |
| | (c) | | The Fund’s portfolio turnover rate is calculated in accordance with regulatory requirements, without regard to transactions involving short term investments and certain derivatives. If such transactions were included, the Fund’s portfolio turnover rate may be higher. |
| | (e) | | Amount is less than $0.005 per share. |
| | |
| 134 | | The accompanying notes are an integral part of these financial statements. |
GOLDMAN SACHS HIGH YIELD FLOATING RATE FUND
| | | | | | | | | | | | | | | | | | | | | | | | | | | | | | | | | | | | | | | | |
| | | | | | | | | | | | | | | | | | | | | | | | | | | | | | | | | | |
| | | Net asset
value, end
of period | | | | | Total
return(b) | | | | | Net assets,
end of
period
(in 000s) | | | | | Ratio of
net expenses
to average
net assets | | | | | Ratio of
total expenses
to average
net assets | | | | | Ratio of
net investment
income (loss)
to average
net assets | | | | | Portfolio
turnover
rate(c) | |
| | | | | | | | | | | | | | | | | | | | | | | | | | | | | | | | | | | | | | | | |
| | $ | 9.64 | | | | | | (0.98 | )% | | | | $ | 6,839 | | | | | | 0.94 | %(d) | | | | | 0.95 | %(d) | | | | | 3.74 | %(d) | | | | | 24 | % |
| | | 9.64 | | | | | | (1.35 | ) | | | | | 1,862 | | | | | | 1.69 | (d) | | | | | 1.70 | (d) | | | | | 3.01 | (d) | | | | | 24 | |
| | | 9.65 | | | | | | (0.80 | ) | | | | | 3,804,051 | | | | | | 0.60 | (d) | | | | | 0.61 | (d) | | | | | 4.10 | (d) | | | | | 24 | |
| | | 9.66 | | | | | | (0.85 | ) | | | | | 1,277 | | | | | | 0.69 | (d) | | | | | 0.70 | (d) | | | | | 4.00 | (d) | | | | | 24 | |
| | | 9.65 | | | | | | (0.99 | ) | | | | | 11 | | | | | | 1.17 | (d) | | | | | 1.19 | (d) | | | | | 3.51 | (d) | | | | | 24 | |
| | | | | | | | | | | | | | | | | | | | | | | | | | | | | | | | | | | | | | | | |
| | | | | | | | | | | | | | | | | | | | | | | | | | | | | | | | | | | | | | | | |
| | | 9.92 | | | | | | 2.01 | | | | | | 6,193 | | | | | | 0.94 | | | | | | 0.95 | | | | | | 3.38 | | | | | | 55 | |
| | | 9.92 | | | | | | 1.15 | | | | | | 1,936 | | | | | | 1.69 | | | | | | 1.70 | | | | | | 2.71 | | | | | | 55 | |
| | | 9.93 | | | | | | 2.26 | | | | | | 4,087,016 | | | | | | 0.60 | | | | | | 0.61 | | | | | | 3.81 | | | | | | 55 | |
| | | 9.94 | | | | | | 2.27 | | | | | | 811 | | | | | | 0.70 | | | | | | 0.71 | | | | | | 3.72 | | | | | | 55 | |
| | | 9.92 | | | | | | 1.67 | | | | | | 11 | | | | | | 1.16 | | | | | | 1.17 | | | | | | 3.23 | | | | | | 55 | |
| | | 10.07 | | | | | | 3.09 | | | | | | 24,741 | | | | | | 0.96 | | | | | | 0.97 | | | | | | 3.28 | | | | | | 44 | |
| | | 10.08 | | | | | | 2.33 | | | | | | 2,465 | | | | | | 1.72 | | | | | | 1.73 | | | | | | 2.58 | | | | | | 44 | |
| | | 10.09 | | | | | | 3.45 | | | | | | 4,171,873 | | | | | | 0.63 | | | | | | 0.63 | | | | | | 3.65 | | | | | | 44 | |
| | | 10.09 | | | | | | 3.36 | | | | | | 1,631 | | | | | | 0.72 | | | | | | 0.73 | | | | | | 3.59 | | | | | | 44 | |
| | | 10.08 | | | | | | 2.83 | | | | | | 11 | | | | | | 1.21 | | | | | | 1.22 | | | | | | 3.08 | | | | | | 44 | |
| | | 10.11 | | | | | | 5.89 | | | | | | 8,367 | | | | | | 1.04 | | | | | | 1.04 | | | | | | 3.69 | | | | | | 72 | |
| | | 10.12 | | | | | | 5.31 | | | | | | 1,648 | | | | | | 1.79 | | | | | | 1.79 | | | | | | 2.93 | | | | | | 72 | |
| | | 10.13 | | | | | | 6.47 | | | | | | 1,710,411 | | | | | | 0.70 | | | | | | 0.70 | | | | | | 3.99 | | | | | | 72 | |
| | | 10.13 | | | | | | 6.36 | | | | | | 4,116 | | | | | | 0.80 | | | | | | 0.80 | | | | | | 4.00 | | | | | | 72 | |
| | | 10.12 | | | | | | 5.73 | | | | | | 11 | | | | | | 1.28 | | | | | | 1.29 | | | | | | 3.47 | | | | | | 72 | |
| | | 9.91 | | | | | | 2.24 | | | | | | 1,910 | | | | | | 1.08 | | | | | | 1.13 | | | | | | 3.41 | | | | | | 73 | |
| | | 9.90 | | | | | | 1.40 | | | | | | 517 | | | | | | 1.83 | | | | | | 1.88 | | | | | | 2.69 | | | | | | 73 | |
| | | 9.91 | | | | | | 2.58 | | | | | | 644,969 | | | | | | 0.74 | | | | | | 0.79 | | | | | | 3.63 | | | | | | 73 | |
| | | 9.91 | | | | | | 2.48 | | | | | | 116 | | | | | | 0.83 | | | | | | 0.88 | | | | | | 3.51 | | | | | | 73 | |
| | | 9.91 | | | | | | 1.99 | | | | | | 10 | | | | | | 1.33 | | | | | | 1.38 | | | | | | 2.86 | | | | | | 73 | |
| | | | | | | | | | | | | | | | | | | | | | | | | | | | | | | | | | | | | | | | |
| | | | | | | | | | | | | | | | | | | | | | | | | | | | | | | | | | | | | | | | |
| | | 10.00 | | | | | | — | | | | | | 10 | | | | | | 1.08 | (d) | | | | | 1.47 | (d) | | | | | (1.08 | )(d) | | | | | — | |
| | | 9.99 | | | | | | — | | | | | | 10 | | | | | | 1.83 | (d) | | | | | 2.22 | (d) | | | | | (1.83 | )(d) | | | | | — | |
| | | 9.99 | | | | | | — | | | | | | 118,817 | | | | | | 0.74 | (d) | | | | | 1.13 | (d) | | | | | (0.74 | )(d) | | | | | — | |
| | | 10.00 | | | | | | — | | | | | | 10 | | | | | | 0.83 | (d) | | | | | 1.22 | (d) | | | | | (0.83 | )(d) | | | | | — | |
| | | 10.00 | | | | | | — | | | | | | 10 | | | | | | 1.33 | (d) | | | | | 1.72 | (d) | | | | | (1.33 | )(d) | | | | | — | |
| | |
| The accompanying notes are an integral part of these financial statements. | | 135 |
GOLDMAN SACHS INVESTMENT GRADE CREDIT FUND
Financial Highlights
Selected Data for a Share Outstanding Throughout Each Period
| | | | | | | | | | | | | | | | | | | | | | | | | | | | | | |
| | | | | | | | From
investment operations | | | Distributions
to shareholders | |
| | | Year - Share Class | |
Net asset
value,
beginning
of period | | | Net
investment
income(a) | | | Net realized
and unrealized
gain (loss) | | | Total from
investment
operations | | | From net
investment
income | | | From net
realized
gains | | | Total
distributions | |
| | FOR THE SIX MONTHS ENDED SEPTEMBER 30, (UNAUDITED) | |
| | 2015 - A | | $ | 9.47 | | | $ | 0.15 | | | $ | (0.44 | ) | | $ | (0.29 | ) | | $ | (0.15 | ) | | $ | — | | | $ | (0.15 | ) |
| | 2015 - Institutional | | | 9.48 | | | | 0.17 | | | | (0.45 | ) | | | (0.28 | ) | | | (0.17 | ) | | | — | | | | (0.17 | ) |
| | 2015 - Separate Account Institutional | | | 9.48 | | | | 0.17 | | | | (0.44 | ) | | | (0.27 | ) | | | (0.17 | ) | | | — | | | | (0.17 | ) |
| | 2015 - IR | | | 9.48 | | | | 0.16 | | | | (0.44 | ) | | | (0.28 | ) | | | (0.16 | ) | | | — | | | | (0.16 | ) |
| | 2015 - R6 (Commenced July 31, 2015) | | | 9.13 | | | | 0.05 | | | | (0.10 | ) | | | (0.05 | ) | | | (0.05 | ) | | | — | | | | (0.05 | ) |
| | | | | | | | | | | | | | | | | | | | | | | | | | | | | | |
| | FOR THE FISCAL YEARS ENDED MARCH 31, | |
| | 2015 - A | | | 9.39 | | | | 0.29 | | | | 0.26 | | | | 0.55 | | | | (0.29 | ) | | | (0.18 | ) | | | (0.47 | ) |
| | 2015 - Institutional | | | 9.39 | | | | 0.32 | | | | 0.27 | | | | 0.59 | | | | (0.32 | ) | | | (0.18 | ) | | | (0.50 | ) |
| | 2015 - Separate Account Institutional | | | 9.39 | | | | 0.32 | | | | 0.27 | | | | 0.59 | | | | (0.32 | ) | | | (0.18 | ) | | | (0.50 | ) |
| | 2015 - IR | | | 9.39 | | | | 0.31 | | | | 0.27 | | | | 0.58 | | | | (0.31 | ) | | | (0.18 | ) | | | (0.49 | ) |
| | 2014 - A | | | 9.71 | | | | 0.30 | | | | (0.18 | ) | | | 0.12 | | | | (0.30 | ) | | | (0.14 | ) | | | (0.44 | ) |
| | 2014 - Institutional | | | 9.71 | | | | 0.34 | | | | (0.18 | ) | | | 0.16 | | | | (0.34 | ) | | | (0.14 | ) | | | (0.48 | ) |
| | 2014 - Separate Account Institutional | | | 9.71 | | | | 0.33 | | | | (0.17 | ) | | | 0.16 | | | | (0.34 | ) | | | (0.14 | ) | | | (0.48 | ) |
| | 2014 - IR | | | 9.71 | | | | 0.32 | | | | (0.17 | ) | | | 0.15 | | | | (0.33 | ) | | | (0.14 | ) | | | (0.47 | ) |
| | 2013 - A | | | 9.53 | | | | 0.31 | | | | 0.51 | | | | 0.82 | | | | (0.31 | ) | | | (0.33 | ) | | | (0.64 | ) |
| | 2013 - Institutional | | | 9.53 | | | | 0.34 | | | | 0.52 | | | | 0.86 | | | | (0.35 | ) | | | (0.33 | ) | | | (0.68 | ) |
| | 2013 - Separate Account Institutional | | | 9.53 | | | | 0.34 | | | | 0.52 | | | | 0.86 | | | | (0.35 | ) | | | (0.33 | ) | | | (0.68 | ) |
| | 2013 - IR | | | 9.53 | | | | 0.34 | | | | 0.51 | | | | 0.85 | | | | (0.34 | ) | | | (0.33 | ) | | | (0.67 | ) |
| | 2012 - A | | | 9.50 | | | | 0.37 | | | | 0.50 | | | | 0.87 | | | | (0.37 | ) | | | (0.47 | ) | | | (0.84 | ) |
| | 2012 - Institutional | | | 9.51 | | | | 0.40 | | | | 0.50 | | | | 0.90 | | | | (0.41 | ) | | | (0.47 | ) | | | (0.88 | ) |
| | 2012 - Separate Account Institutional | | | 9.51 | | | | 0.40 | | | | 0.50 | | | | 0.90 | | | | (0.41 | ) | | | (0.47 | ) | | | (0.88 | ) |
| | 2012 - IR (Commenced July 29, 2011) | | | 9.86 | | | | 0.25 | | | | 0.15 | | | | 0.40 | | | | (0.26 | ) | | | (0.47 | ) | | | (0.73 | ) |
| | 2011 - A | | | 9.14 | | | | 0.38 | | | | 0.37 | | | | 0.75 | | | | (0.38 | ) | | | (0.01 | ) | | | (0.39 | ) |
| | 2011 - Institutional | | | 9.14 | | | | 0.41 | | | | 0.38 | | | | 0.79 | | | | (0.41 | ) | | | (0.01 | ) | | | (0.42 | ) |
| | 2011 - Separate Account Institutional | | | 9.14 | | | | 0.41 | | | | 0.38 | | | | 0.79 | | | | (0.41 | ) | | | (0.01 | ) | | | (0.42 | ) |
| | (a) | | Calculated based on the average shares outstanding methodology. |
| | (b) | | Assumes investment at the NAV at the beginning of the period, reinvestment of all dividends and distributions, a complete redemption of the investment at the NAV at the end of the period and no sales or redemption charges. Total returns would be reduced if a sales or redemption charge was taken into account. Returns do not reflect the deduction of taxes that a shareholder would pay on Fund distributions or the redemption of Fund shares. Total returns for periods less than one full year are not annualized. |
| | (c) | | The Fund’s portfolio turnover rate is calculated in accordance with regulatory requirements, without regard to transactions involving short term investments and certain derivatives. If such transactions were included, the Fund’s portfolio turnover rate may be higher. |
| | (e) | | Portfolio turnover rates exclude portfolio securities received as a result of in-kind subscriptions. |
| | |
| 136 | | The accompanying notes are an integral part of these financial statements. |
GOLDMAN SACHS INVESTMENT GRADE CREDIT FUND
| | | | | | | | | | | | | | | | | | | | | | | | | | | | | | | | | | | | | | | | |
| | | | | | | | | | | | | | | | | | | | | | | | | | | | | | | | | | |
| | | Net asset
value, end
of period | | | | | Total
return(b) | | | | | Net assets,
end of
period
(in 000s) | | | | | Ratio of
net expenses
to average
net assets | | | | | Ratio of
total expenses
to average
net assets | | | | | Ratio of
net investment
income
to average
net assets | | | | | Portfolio
turnover
rate(c) | |
| | | | | | | | | | | | | | | | | | | | | | | | | | | | | | | | | | | | | | | | |
| | $ | 9.03 | | | | | | (3.06 | )% | | | | $ | 26,625 | | | | | | 0.72 | %(d) | | | | | 0.85 | %(d) | | | | | 3.29 | %(d) | | | | | 35 | % |
| | | 9.03 | | | | | | (3.00 | ) | | | | | 159,975 | | | | | | 0.38 | (d) | | | | | 0.52 | (d) | | | | | 3.63 | (d) | | | | | 35 | |
| | | 9.04 | | | | | | (2.89 | ) | | | | | 246,484 | | | | | | 0.38 | (d) | | | | | 0.51 | (d) | | | | | 3.63 | (d) | | | | | 35 | |
| | | 9.04 | | | | | | (2.94 | ) | | | | | 1,099 | | | | | | 0.47 | (d) | | | | | 0.61 | (d) | | | | | 3.54 | (d) | | | | | 35 | |
| | | 9.03 | | | | | | (0.49 | ) | | | | | 10 | | | | | | 0.37 | (d) | | | | | 0.52 | (d) | | | | | 3.62 | (d) | | | | | 35 | |
| | | | | | | | | | | | | | | | | | | | | | | | | | | | | | | | | | | | | | | | |
| | | | | | | | | | | | | | | | | | | | | | | | | | | | | | | | | | | | | | | | |
| | | 9.47 | | | | | | 5.94 | | | | | | 29,522 | | | | | | 0.72 | | | | | | 0.86 | | | | | | 3.07 | | | | | | 84 | |
| | | 9.48 | | | | | | 6.41 | | | | | | 177,283 | | | | | | 0.38 | | | | | | 0.52 | | | | | | 3.41 | | | | | | 84 | |
| | | 9.48 | | | | | | 6.41 | | | | | | 259,668 | | | | | | 0.38 | | | | | | 0.52 | | | | | | 3.40 | | | | | | 84 | |
| | | 9.48 | | | | | | 6.32 | | | | | | 1,075 | | | | | | 0.47 | | | | | | 0.61 | | | | | | 3.31 | | | | | | 84 | |
| | | 9.39 | | | | | | 1.41 | | | | | | 24,839 | | | | | | 0.72 | | | | | | 0.85 | | | | | | 3.22 | | | | | | 86 | |
| | | 9.39 | | | | | | 1.76 | | | | | | 165,755 | | | | | | 0.38 | | | | | | 0.51 | | | | | | 3.57 | | | | | | 86 | |
| | | 9.39 | | | | | | 1.76 | | | | | | 286,845 | | | | | | 0.38 | | | | | | 0.51 | | | | | | 3.56 | | | | | | 86 | |
| | | 9.39 | | | | | | 1.66 | | | | | | 552 | | | | | | 0.47 | | | | | | 0.60 | | | | | | 3.37 | | | | | | 86 | |
| | | 9.71 | | | | | | 8.73 | | | | | | 30,216 | | | | | | 0.71 | | | | | | 0.84 | | | | | | 3.17 | | | | | | 162 | |
| | | 9.71 | | | | | | 9.09 | | | | | | 274,095 | | | | | | 0.37 | | | | | | 0.50 | | | | | | 3.51 | | | | | | 162 | |
| | | 9.71 | | | | | | 9.09 | | | | | | 289,032 | | | | | | 0.37 | | | | | | 0.50 | | | | | | 3.51 | | | | | | 162 | |
| | | 9.71 | | | | | | 8.99 | | | | | | 723 | | | | | | 0.47 | | | | | | 0.59 | | | | | | 3.46 | | | | | | 162 | |
| | | 9.53 | | | | | | 9.34 | | | | | | 155,684 | | | | | | 0.71 | | | | | | 0.85 | | | | | | 3.78 | | | | | | 120 | |
| | | 9.53 | | | | | | 9.71 | | | | | | 163,886 | | | | | | 0.37 | | | | | | 0.51 | | | | | | 4.12 | | | | | | 120 | |
| | | 9.53 | | | | | | 9.71 | | | | | | 237,266 | | | | | | 0.37 | | | | | | 0.51 | | | | | | 4.13 | | | | | | 120 | |
| | | 9.53 | | | | | | 4.26 | | | | | | 1,300 | | | | | | 0.46 | (d) | | | | | 0.60 | (d) | | | | | 3.91 | (d) | | | | | 120 | |
| | | 9.50 | | | | | | 8.37 | | | | | | 147,820 | | | | | | 0.74 | | | | | | 0.87 | | | | | | 3.98 | | | | | | 100 | (e) |
| | | 9.51 | | | | | | 8.73 | | | | | | 143,057 | | | | | | 0.40 | | | | | | 0.53 | | | | | | 4.33 | | | | | | 100 | (e) |
| | | 9.51 | | | | | | 8.77 | | | | | | 262,907 | | | | | | 0.37 | | | | | | 0.50 | | | | | | 4.36 | | | | | | 100 | (e) |
| | |
| The accompanying notes are an integral part of these financial statements. | | 137 |
GOLDMAN SACHS LOCAL EMERGING MARKETS DEBT FUND
Financial Highlights
Selected Data for a Share Outstanding Throughout Each Period
| | | | | | | | | | | | | | | | | | | | | | | | | | | | | | | | | | |
| | | | | | | | From
investment operations | | | Distributions
to shareholders | |
| | | Year - Share Class | |
Net asset
value,
beginning
of period | | | Net
investment
income(a) | | | Net realized
and unrealized
gain (loss) | | | Total from
investment
operations | | | From net
investment
income | | | From net
realized
gains | | | From
capital | | | Total
distributions | |
| | FOR THE SIX MONTHS ENDED SEPTEMBER 30, (UNAUDITED) | |
| | 2015 - A | | $ | 6.96 | | | $ | 0.17 | | | $ | (0.98 | ) | | $ | (0.81 | ) | | $ | (0.17 | ) | | $ | — | | | $ | — | | | $ | (0.17 | ) |
| | 2015 - C | | | 6.98 | | | | 0.15 | | | | (0.99 | ) | | | (0.84 | ) | | | (0.15 | ) | | | — | | | | — | | | | (0.15 | ) |
| | 2015 - Institutional | | | 6.97 | | | | 0.19 | | | | (1.00 | ) | | | (0.81 | ) | | | (0.19 | ) | | | — | | | | — | | | | (0.19 | ) |
| | 2015 - IR | | | 6.96 | | | | 0.18 | | | | (0.99 | ) | | | (0.81 | ) | | | (0.18 | ) | | | — | | | | — | | | | (0.18 | ) |
| | | | | | | | | | | | | | | | | | | | | | | | | | | | | | | | | | |
| | FOR THE FISCAL YEARS ENDED MARCH 31, | | | | | |
| | 2015 - A | | | 8.43 | | | | 0.37 | | | | (1.41 | ) | | | (1.04 | ) | | | — | | | | — | | | | (0.43 | ) | | | (0.43 | ) |
| | 2015 - C | | | 8.44 | | | | 0.33 | | | | (1.42 | ) | | | (1.09 | ) | | | — | | | | — | | | | (0.37 | ) | | | (0.37 | ) |
| | 2015 - Institutional | | | 8.43 | | | | 0.41 | | | | (1.41 | ) | | | (1.00 | ) | | | — | | | | — | | | | (0.46 | ) | | | (0.46 | ) |
| | 2015 - IR | | | 8.43 | | | | 0.41 | | | | (1.43 | ) | | | (1.02 | ) | | | — | | | | — | | | | (0.45 | ) | | | (0.45 | ) |
| | 2014 - A | | | 9.71 | | | | 0.40 | | | | (1.27 | ) | | | (0.87 | ) | | | (0.03 | ) | | | (0.13 | ) | | | (0.25 | ) | | | (0.41 | ) |
| | 2014 - C | | | 9.72 | | | | 0.34 | | | | (1.28 | ) | | | (0.94 | ) | | | — | | | | (0.13 | ) | | | (0.21 | ) | | | (0.34 | ) |
| | 2014 - Institutional | | | 9.71 | | | | 0.43 | | | | (1.27 | ) | | | (0.84 | ) | | | (0.06 | ) | | | (0.13 | ) | | | (0.25 | ) | | | (0.44 | ) |
| | 2014 - IR | | | 9.71 | | | | 0.42 | | | | (1.27 | ) | | | (0.85 | ) | | | (0.05 | ) | | | (0.13 | ) | | | (0.25 | ) | | | (0.43 | ) |
| | 2013 - A | | | 9.38 | | | | 0.45 | | | | 0.38 | | | | 0.83 | | | | (0.46 | ) | | | (0.04 | ) | | | — | | | | (0.50 | ) |
| | 2013 - C | | | 9.40 | | | | 0.38 | | | | 0.37 | | | | 0.75 | | | | (0.39 | ) | | | (0.04 | ) | | | — | | | | (0.43 | ) |
| | 2013 - Institutional | | | 9.38 | | | | 0.48 | | | | 0.38 | | | | 0.86 | | | | (0.49 | ) | | | (0.04 | ) | | | — | | | | (0.53 | ) |
| | 2013 - IR | | | 9.38 | | | | 0.47 | | | | 0.38 | | | | 0.85 | | | | (0.48 | ) | | | (0.04 | ) | | | — | | | | (0.52 | ) |
| | 2012 - A | | | 9.59 | | | | 0.42 | | | | (0.16 | ) | | | 0.26 | | | | (0.44 | ) | | | (0.03 | ) | | | — | | | | (0.47 | ) |
| | 2012 - C | | | 9.61 | | | | 0.37 | | | | (0.18 | ) | | | 0.19 | | | | (0.37 | ) | | | (0.03 | ) | | | — | | | | (0.40 | ) |
| | 2012 - Institutional | | | 9.59 | | | | 0.48 | | | | (0.19 | ) | | | 0.29 | | | | (0.47 | ) | | | (0.03 | ) | | | — | | | | (0.50 | ) |
| | 2012 - IR | | | 9.59 | | | | 0.46 | | | | (0.18 | ) | | | 0.28 | | | | (0.46 | ) | | | (0.03 | ) | | | — | | | | (0.49 | ) |
| | 2011 - A | | | 9.31 | | | | 0.41 | | | | 0.60 | | | | 1.01 | | | | (0.64 | ) | | | (0.09 | ) | | | — | | | | (0.73 | ) |
| | 2011 - C | | | 9.33 | | | | 0.32 | | | | 0.61 | | | | 0.93 | | | | (0.56 | ) | | | (0.09 | ) | | | — | | | | (0.65 | ) |
| | 2011 - Institutional | | | 9.31 | | | | 0.44 | | | | 0.60 | | | | 1.04 | | | | (0.67 | ) | | | (0.09 | ) | | | — | | | | (0.76 | ) |
| | 2011 - IR (Commenced July 30, 2010) | | | 9.43 | | | | 0.28 | | | | 0.46 | | | | 0.74 | | | | (0.49 | ) | | | (0.09 | ) | | | — | | | | (0.58 | ) |
| | (a) | | Calculated based on the average shares outstanding methodology. |
| | (b) | | Assumes investment at the NAV at the beginning of the period, reinvestment of all dividends and distributions, a complete redemption of the investment at the NAV at the end of the period and no sales or redemption charges. Total returns would be reduced if a sales or redemption charge was taken into account. Returns do not reflect the deduction of taxes that a shareholder would pay on Fund distributions or the redemption of Fund shares. Total returns for periods less than one full year are not annualized. |
| | (c) | | The Fund’s portfolio turnover rate is calculated in accordance with regulatory requirements, without regard to transactions involving short term investments and certain derivatives. If such transactions were included, the Fund’s portfolio turnover rate may be higher. |
| | |
| 138 | | The accompanying notes are an integral part of these financial statements. |
GOLDMAN SACHS LOCAL EMERGING MARKETS DEBT FUND
| | | | | | | | | | | | | | | | | | | | | | | | | | | | | | | | | | | | | | | | |
| | | | | | | | | | | | | | | | | | | | | | | | | | | | | | | | | | |
| | | Net asset
value, end
of period | | | | | Total
return(b) | | | | | Net assets,
end of
period
(in 000s) | | | | | Ratio of
net expenses
to average
net assets | | | | | Ratio of
total expenses
to average
net assets | | | | | Ratio of
net investment
income
to average
net assets | | | | | Portfolio
turnover
rate(c) | |
| | | | | | | | | | | | | | | | | | | | | | | | | | | | | | | | | | | | | | | | |
| | $ | 5.98 | | | | | | (11.93 | )% | | | | $ | 169,989 | | | | | | 1.25 | %(d) | | | | | 1.37 | %(d) | | | | | 5.23 | %(d) | | | | | 49 | % |
| | | 5.99 | | | | | | (12.37 | ) | | | | | 7,056 | | | | | | 2.00 | (d) | | | | | 2.14 | (d) | | | | | 4.51 | (d) | | | | | 49 | |
| | | 5.97 | | | | | | (11.90 | ) | | | | | 806,229 | | | | | | 0.91 | (d) | | | | | 1.05 | (d) | | | | | 5.60 | (d) | | | | | 49 | |
| | | 5.97 | | | | | | (11.82 | ) | | | | | 5,416 | | | | | | 0.99 | (d) | | | | | 1.09 | (d) | | | | | 5.44 | (d) | | | | | 49 | |
| | | | | | | | | | | | | | | | | | | | | | | | | | | | | | | | | | | | | | | | |
| | | | | | | | | | | | | | | | | | | | | | | | | | | | | | | | | | | | | | | | |
| | | 6.96 | | | | | | (12.92 | ) | | | | | 140,301 | | | | | | 1.25 | | | | | | 1.36 | | | | | | 4.76 | | | | | | 145 | |
| | | 6.98 | | | | | | (13.43 | ) | | | | | 9,734 | | | | | | 2.01 | | | | | | 2.14 | | | | | | 4.04 | | | | | | 145 | |
| | | 6.97 | | | | | | (12.50 | ) | | | | | 1,234,553 | | | | | | 0.92 | | | | | | 1.05 | | | | | | 5.11 | | | | | | 145 | |
| | | 6.96 | | | | | | (12.70 | ) | | | | | 3,386 | | | | | | 1.01 | | | | | | 1.14 | | | | | | 5.06 | | | | | | 145 | |
| | | 8.43 | | | | | | (9.01 | ) | | | | | 96,925 | | | | | | 1.25 | | | | | | 1.36 | | | | | | 4.55 | | | | | | 146 | |
| | | 8.44 | | | | | | (9.68 | ) | | | | | 17,641 | | | | | | 2.01 | | | | | | 2.12 | | | | | | 3.80 | | | | | | 146 | |
| | | 8.43 | | | | | | (8.70 | ) | | | | | 1,797,975 | | | | | | 0.92 | | | | | | 1.02 | | | | | | 4.88 | | | | | | 146 | |
| | | 8.43 | | | | | | (8.78 | ) | | | | | 7,518 | | | | | | 1.01 | | | | | | 1.11 | | | | | | 4.73 | | | | | | 146 | |
| | | 9.71 | | | | | | 9.07 | | | | | | 190,480 | | | | | | 1.26 | | | | | | 1.38 | | | | | | 4.78 | | | | | | 115 | |
| | | 9.72 | | | | | | 8.14 | | | | | | 32,071 | | | | | | 2.00 | | | | | | 2.13 | | | | | | 3.98 | | | | | | 115 | |
| | | 9.71 | | | | | | 9.46 | | | | | | 3,252,343 | | | | | | 0.91 | | | | | | 1.04 | | | | | | 5.05 | | | | | | 115 | |
| | | 9.71 | | | | | | 9.34 | | | | | | 20,878 | | | | | | 1.00 | | | | | | 1.12 | | | | | | 4.91 | | | | | | 115 | |
| | | 9.38 | | | | | | 2.71 | | | | | | 166,407 | | | | | | 1.27 | | | | | | 1.38 | | | | | | 4.31 | | | | | | 183 | |
| | | 9.40 | | | | | | 1.96 | | | | | | 20,704 | | | | | | 2.02 | | | | | | 2.13 | | | | | | 3.98 | | | | | | 183 | |
| | | 9.38 | | | | | | 3.06 | | | | | | 1,586,055 | | | | | | 0.93 | | | | | | 1.04 | | | | | | 5.18 | | | | | | 183 | |
| | | 9.38 | | | | | | 2.97 | | | | | | 7,393 | | | | | | 1.02 | | | | | | 1.13 | | | | | | 4.91 | | | | | | 183 | |
| | | 9.59 | | | | | | 11.30 | | | | | | 1,055,640 | | | | | | 1.35 | | | | | | 1.43 | | | | | | 4.30 | | | | | | 154 | |
| | | 9.61 | | | | | | 10.45 | | | | | | 16,724 | | | | | | 2.10 | | | | | | 2.18 | | | | | | 3.37 | | | | | | 154 | |
| | | 9.59 | | | | | | 11.68 | | | | | | 1,048,186 | | | | | | 1.01 | | | | | | 1.09 | | | | | | 4.63 | | | | | | 154 | |
| | | 9.59 | | | | | | 8.13 | | | | | | 8,247 | | | | | | 1.10 | (d) | | | | | 1.16 | (d) | | | | | 4.40 | (d) | | | | | 154 | |
| | |
| The accompanying notes are an integral part of these financial statements. | | 139 |
GOLDMAN SACHS U.S. MORTGAGES FUND
Financial Highlights
Selected Data for a Share Outstanding Throughout Each Period
| | | | | | | | | | | | | | | | | | | | | | | | | | | | | | |
| | | | | | | | From
investment operations | | | Distributions
to shareholders | |
| | | Year - Share Class | |
Net asset
value,
beginning
of period | | | Net
investment
income(a) | | | Net realized
and unrealized
gain (loss) | | | Total from
investment
operations | | | From net
investment
income | | | From net
realized
gains | | | Total
distributions | |
| | FOR THE SIX MONTHS ENDED SEPTEMBER 30, (UNAUDITED) | |
| | 2015 - A | | $ | 10.74 | | | $ | 0.10 | | | $ | (0.05 | ) | | $ | 0.05 | | | $ | (0.13 | ) | | $ | — | | | $ | (0.13 | ) |
| | 2015 - Institutional | | | 10.77 | | | | 0.12 | | | | (0.06 | ) | | | 0.06 | | | | (0.15 | ) | | | — | | | | (0.15 | ) |
| | 2015 - Separate Account Institutional | | | 10.75 | | | | 0.12 | | | | (0.06 | ) | | | 0.06 | | | | (0.15 | ) | | | — | | | | (0.15 | ) |
| | 2015 - IR | | | 10.77 | | | | 0.11 | | | | (0.05 | ) | | | 0.06 | | | | (0.14 | ) | | | — | | | | (0.14 | ) |
| | 2015 - R6 (Commenced July 31, 2015) | | | 10.67 | | | | 0.04 | | | | 0.02 | | | | 0.06 | | | | (0.05 | ) | | | — | | | | (0.05 | ) |
| | | | | | | | | | | | | | | | | | | | | | | | | | | | | | |
| | FOR THE FISCAL YEARS ENDED MARCH 31, | |
| | 2015 - A | | | 10.45 | | | | 0.17 | | | | 0.35 | | | | 0.52 | | | | (0.23 | ) | | | — | | | | (0.23 | ) |
| | 2015 - Institutional | | | 10.47 | | | | 0.19 | | | | 0.38 | | | | 0.57 | | | | (0.27 | ) | | | — | | | | (0.27 | ) |
| | 2015 - Separate Account Institutional | | | 10.45 | | | | 0.20 | | | | 0.37 | | | | 0.57 | | | | (0.27 | ) | | | — | | | | (0.27 | ) |
| | 2015 - IR | | | 10.48 | | | | 0.18 | | | | 0.37 | | | | 0.55 | | | | (0.26 | ) | | | — | | | | (0.26 | ) |
| | 2014 - A | | | 10.60 | | | | 0.13 | | | | (0.06 | ) | | | 0.07 | | | | (0.22 | ) | | | — | | | | (0.22 | ) |
| | 2014 - Institutional | | | 10.62 | | | | 0.18 | | | | (0.08 | ) | | | 0.10 | | | | (0.25 | ) | | | — | | | | (0.25 | ) |
| | 2014 - Separate Account Institutional | | | 10.60 | | | | 0.16 | | | | (0.06 | ) | | | 0.10 | | | | (0.25 | ) | | | — | | | | (0.25 | ) |
| | 2014 - IR | | | 10.63 | | | | 0.20 | | | | (0.11 | ) | | | 0.09 | | | | (0.24 | ) | | | — | | | | (0.24 | ) |
| | 2013 - A | | | 10.58 | | | | 0.12 | | | | 0.31 | | | | 0.43 | | | | (0.22 | ) | | | (0.19 | ) | | | (0.41 | ) |
| | 2013 - Institutional | | | 10.60 | | | | 0.16 | | | | 0.30 | | | | 0.46 | | | | (0.25 | ) | | | (0.19 | ) | | | (0.44 | ) |
| | 2013 - Separate Account Institutional | | | 10.58 | | | | 0.16 | | | | 0.30 | | | | 0.46 | | | | (0.25 | ) | | | (0.19 | ) | | | (0.44 | ) |
| | 2013 - IR | | | 10.60 | | | | 0.17 | | | | 0.31 | | | | 0.48 | | | | (0.26 | ) | | | (0.19 | ) | | | (0.45 | ) |
| | 2012 - A | | | 10.20 | | | | 0.17 | | | | 0.42 | | | | 0.59 | | | | (0.21 | ) | | | — | | | | (0.21 | ) |
| | 2012 - Institutional | | | 10.21 | | | | 0.20 | | | | 0.44 | | | | 0.64 | | | | (0.25 | ) | | | — | | | | (0.25 | ) |
| | 2012 - Separate Account Institutional | | | 10.20 | | | | 0.21 | | | | 0.42 | | | | 0.63 | | | | (0.25 | ) | | | — | | | | (0.25 | ) |
| | 2012 - IR (Commenced July 29, 2011) | | | 10.45 | | | | 0.14 | | | | 0.19 | | | | 0.33 | | | | (0.18 | ) | | | — | | | | (0.18 | ) |
| | 2011 - A | | | 9.99 | | | | 0.22 | | | | 0.22 | | | | 0.44 | | | | (0.23 | ) | | | — | | | | (0.23 | ) |
| | 2011 - Institutional | | | 10.00 | | | | 0.25 | | | | 0.23 | | | | 0.48 | | | | (0.27 | ) | | | — | | | | (0.27 | ) |
| | 2011 - Separate Account Institutional | | | 9.99 | | | | 0.25 | | | | 0.23 | | | | 0.48 | | | | (0.27 | ) | | | — | | | | (0.27 | ) |
| | (a) | | Calculated based on the average shares outstanding methodology. |
| | (b) | | Assumes investment at the NAV at the beginning of the period, reinvestment of all dividends and distributions, a complete redemption of the investment at the NAV at the end of the period and no sales or redemption charges. Total returns would be reduced if a sales or redemption charge was taken into account. Returns do not reflect the deduction of taxes that a shareholder would pay on Fund distributions or the redemption of Fund shares. Total returns for periods less than one full year are not annualized. |
| | (c) | | The Fund’s portfolio turnover rate is calculated in accordance with regulatory requirements, without regard to transactions involving short term investments and certain derivatives. If such transactions were included, the Fund’s portfolio turnover rate may be higher. |
| | (e) | | Portfolio turnover rates exclude portfolio securities received as a result of in-kind subscriptions. |
| | |
| 140 | | The accompanying notes are an integral part of these financial statements. |
GOLDMAN SACHS U.S. MORTGAGES FUND
| | | | | | | | | | | | | | | | | | | | | | | | | | | | | | | | | | | | | | | | |
| | | | | | | | | | | | | | | | | | | | | | | | | | | | | | | | | | |
| | | Net asset
value, end
of period | | | | | Total
return(b) | | | | | Net assets,
end of
period
(in 000s) | | | | | Ratio of
net expenses
to average
net assets | | | | | Ratio of
total expenses
to average
net assets | | | | | Ratio of
net investment
income
to average
net assets | | | | | Portfolio
turnover
rate(c) | |
| | | | | | | | | | | | | | | | | | | | | | | | | | | | | | | | | | | | | | | | |
| | $ | 10.66 | | | | | | 0.48 | % | | | | $ | 33,701 | | | | | | 0.72 | %(d) | | | | | 0.96 | %(d) | | | | | 1.88 | %(d) | | | | | 518 | % |
| | | 10.68 | | | | | | 0.56 | | | | | | 50,854 | | | | | | 0.38 | (d) | | | | | 0.62 | (d) | | | | | 2.22 | (d) | | | | | 518 | |
| | | 10.66 | | | | | | 0.56 | | | | | | 196,622 | | | | | | 0.38 | (d) | | | | | 0.62 | (d) | | | | | 2.22 | (d) | | | | | 518 | |
| | | 10.69 | | | | | | 0.61 | | | | | | 2,153 | | | | | | 0.48 | (d) | | | | | 0.71 | (d) | | | | | 2.12 | (d) | | | | | 518 | |
| | | 10.68 | | | | | | 0.56 | | | | | | 10 | | | | | | 0.43 | (d) | | | | | 0.72 | (d) | | | | | 2.16 | (d) | | | | | 518 | |
| | | | | | | | | | | | | | | | | | | | | | | | | | | | | | | | | | | | | | | | |
| | | | | | | | | | | | | | | | | | | | | | | | | | | | | | | | | | | | | | | | |
| | | 10.74 | | | | | | 5.01 | | | | | | 31,690 | | | | | | 0.71 | | | | | | 0.95 | | | | | | 1.60 | | | | | | 1,367 | |
| | | 10.77 | | | | | | 5.46 | | | | | | 45,891 | | | | | | 0.37 | | | | | | 0.62 | | | | | | 1.82 | | | | | | 1,367 | |
| | | 10.75 | | | | | | 5.46 | | | | | | 195,609 | | | | | | 0.37 | | | | | | 0.63 | | | | | | 1.86 | | | | | | 1,367 | |
| | | 10.77 | | | | | | 5.26 | | | | | | 1,768 | | | | | | 0.46 | | | | | | 0.71 | | | | | | 1.68 | | | | | | 1,367 | |
| | | 10.45 | | | | | | 0.64 | | | | | | 3,850 | | | | | | 0.72 | | | | | | 0.96 | | | | | | 1.22 | | | | | | 1,399 | |
| | | 10.47 | | | | | | 0.99 | | | | | | 11,692 | | | | | | 0.38 | | | | | | 0.63 | | | | | | 1.71 | | | | | | 1,399 | |
| | | 10.45 | | | | | | 0.98 | | | | | | 211,306 | | | | | | 0.38 | | | | | | 0.62 | | | | | | 1.58 | | | | | | 1,399 | |
| | | 10.48 | | | | | | 0.88 | | | | | | 16 | | | | | | 0.49 | | | | | | 0.73 | | | | | | 1.91 | | | | | | 1,399 | |
| | | 10.60 | | | | | | 4.07 | | | | | | 4,488 | | | | | | 0.71 | | | | | | 0.91 | | | | | | 1.13 | | | | | | 1,617 | |
| | | 10.62 | | | | | | 4.42 | | | | | | 13,664 | | | | | | 0.37 | | | | | | 0.56 | | | | | | 1.47 | | | | | | 1,617 | |
| | | 10.60 | | | | | | 4.42 | | | | | | 295,322 | | | | | | 0.37 | | | | | | 0.56 | | | | | | 1.49 | | | | | | 1,617 | |
| | | 10.63 | | | | | | 4.61 | | | | | | 1 | | | | | | 0.30 | | | | | | 0.49 | | | | | | 1.57 | | | | | | 1,617 | |
| | | 10.58 | | | | | | 5.82 | | | | | | 5,437 | | | | | | 0.71 | | | | | | 0.91 | | | | | | 1.62 | | | | | | 1,342 | |
| | | 10.60 | | | | | | 6.28 | | | | | | 9,984 | | | | | | 0.37 | | | | | | 0.57 | | | | | | 1.89 | | | | | | 1,342 | |
| | | 10.58 | | | | | | 6.18 | | | | | | 375,451 | | | | | | 0.37 | | | | | | 0.57 | | | | | | 1.97 | | | | | | 1,342 | |
| | | 10.60 | | | | | | 3.20 | | | | | | 1 | | | | | | 0.46 | (d) | | | | | 0.66 | (d) | | | | | 2.06 | (d) | | | | | 1,342 | |
| | | 10.20 | | | | | | 4.46 | | | | | | 5,511 | | | | | | 0.74 | | | | | | 0.92 | | | | | | 2.14 | | | | | | 905 | (e) |
| | | 10.21 | | | | | | 4.81 | | | | | | 54,096 | | | | | | 0.40 | | | | | | 0.58 | | | | | | 2.41 | | | | | | 905 | (e) |
| | | 10.20 | | | | | | 4.84 | | | | | | 348,447 | | | | | | 0.37 | | | | | | 0.55 | | | | | | 2.42 | | | | | | 905 | (e) |
| | |
| The accompanying notes are an integral part of these financial statements. | | 141 |
GOLDMAN SACHS SINGLE SECTOR FIXED INCOME FUNDS
Notes to Financial Statements
September 30, 2015 (Unaudited)
Goldman Sachs Trust (the “Trust”) is a Delaware statutory trust registered under the Investment Company Act of 1940, as amended (the “Act”), as an open-end management investment company. The following table lists those series of the Trust that are included in this report (collectively, the “Funds” or individually a “Fund”), along with their corresponding share classes and respective diversification status under the Act:
| | | | |
| Fund | | Share Classes Offered | | Diversified/
Non-diversified |
Dynamic Emerging Markets Debt | | A, C, Institutional, IR and R | | Non-diversified |
Emerging Markets Debt | | A, C, Institutional, IR and R6* | | Non-diversified |
Local Emerging Markets Debt | | A, C, Institutional and IR | | Non-diversified |
High Yield | | A, C, Institutional, Service, IR, R and R6* | | Diversified |
High Yield Floating Rate | | A, C, Institutional, IR and R | | Diversified |
Investment Grade Credit, U.S. Mortgages | | A, Institutional, IR, Separate Account Institutional and R6* | | Diversified |
| * | | Class R6 Shares commenced operations on July 31, 2015. |
Class A Shares of the Dynamic Emerging Markets Debt, Emerging Markets Debt, High Yield, High Yield Floating Rate, Investment Grade Credit, Local Emerging Markets Debt and U.S. Mortgages Funds are sold with a front-end sales charge of up to 4.50%, 4.50%, 4.50%, 2.25%, 3.75%, 4.50% and 3.75%, respectively. Class C Shares are sold with a contingent deferred sales charge (“CDSC”) of 1.00%, which is imposed on redemptions made within 12 months of purchase. Institutional, Service, Separate Account Institutional, Class IR, Class R and Class R6 Shares are not subject to a sales charge.
At the close of business on November 14, 2014, Class B Shares of the High Yield Fund were converted to Class A Shares of the Fund.
Goldman Sachs Asset Management, L.P. (“GSAM”), an affiliate of Goldman, Sachs & Co. (“Goldman Sachs”), serves as investment adviser to the Funds pursuant to a management agreement (the “Agreement”) with the Trust.
|
| 2. SIGNIFICANT ACCOUNTING POLICIES |
The financial statements have been prepared in accordance with accounting principles generally accepted in the United States of America (“GAAP”) and require management to make estimates and assumptions that may affect the reported amounts and disclosures. Actual results may differ from those estimates and assumptions.
A. Investment Valuation — The Funds’ valuation policy is to value investments at fair value.
B. Investment Income and Investments — Investment income includes interest income and dividend income, net of any foreign withholding taxes, less any amounts reclaimable. Interest income is accrued daily and adjusted for amortization of premiums and accretion of discounts. Dividend income is recognized on ex-dividend date or, for certain foreign securities, as soon as such information is obtained subsequent to the ex-dividend date. Investment transactions are reflected on trade date. Realized gains and losses are calculated using identified cost. Investment transactions are recorded on the following business day for daily net asset value (“NAV”) calculations. Any foreign capital gains tax is accrued daily based upon net unrealized gains, and is payable upon sale of such investments. Distributions received from the Funds’ investments in U.S. real estate investment trusts (“REITs”) may be characterized as ordinary income, net capital gain or a return of capital. A return of capital is recorded by the Funds as a reduction to the cost basis of the REIT. Income distributions are recognized in accordance with the character that is distributed. Capital gain distributions are recorded as capital gains in the financial statements. Income distributions are recorded in income.
For derivative contracts, realized gains and losses are recorded upon settlement of the contract. Upfront payments are made or received upon entering into a swap agreement and are reflected in the Statement of Assets and Liabilities. Upfront payments are
142
GOLDMAN SACHS SINGLE SECTOR FIXED INCOME FUNDS
|
| 2. SIGNIFICANT ACCOUNTING POLICIES (continued) |
recognized over the contract’s term/event as realized gains or losses, with the exception of forward starting interest rate swaps whose realized gains or losses are recognized from the effective start date.
For securities with paydown provisions, principal payments received are treated as a proportionate reduction to the cost basis of the securities, and excess or shortfall amounts are recorded as income.
For treasury inflation protected securities (“TIPS”), adjustments to principal due to inflation/deflation are reflected as increases/decreases to interest income with a corresponding adjustment to cost.
C. Class Allocations and Expenses — Investment income, realized and unrealized gain (loss), and non-class specific expenses of each Fund are allocated daily based upon the proportion of net assets of each class. Class specific expenses, where applicable, are borne by the respective share classes and include Distribution and Service, Transfer Agency and Service and Shareholder Administration fees. Non-class specific expenses directly incurred by a Fund are charged to that Fund, while such expenses incurred by the Trust are allocated across the applicable Funds on a straight-line and/or pro-rata basis depending upon the nature of the expenses.
D. Redemption Fees — A 2% redemption fee will be imposed on the redemption of shares (including by exchange) held for 60 calendar days or less with respect to the High Yield Fund and 30 calendar days or less with respect to the Dynamic Emerging Markets Debt, Emerging Markets Debt and Local Emerging Markets Debt Funds. For this purpose, the Funds use a first-in first-out method so that shares held longest will be treated as being redeemed first and shares held shortest will be treated as being redeemed last. Redemption fees are reimbursed to a Fund and are reflected as a reduction in share redemptions. Redemption fees are credited to Paid-in Capital and are allocated to each share class of a Fund on a pro-rata basis.
E. Federal Taxes and Distributions to Shareholders — It is each Fund’s policy to comply with the requirements of the Internal Revenue Code of 1986, as amended (the “Code”), applicable to regulated investment companies (mutual funds) and to distribute each year substantially all of its investment company taxable income and capital gains to its shareholders. Accordingly, the Funds are not required to make any provisions for the payment of federal income tax. Distributions to shareholders are recorded on the ex-dividend date. Income and capital gains distributions, if any, are declared and paid annually.
Net capital losses are carried forward to future fiscal years and may be used to the extent allowed by the Code to offset any future capital gains. Utilization of capital loss carryforwards will reduce the requirement of future capital gains distributions.
Under the Regulated Investment Company Modernization Act of 2010, the Funds are permitted to carry forward capital losses incurred in taxable years beginning after December 22, 2010 for an unlimited period. However, any losses incurred during those future taxable years will be required to be utilized prior to the losses incurred in pre-enactment taxable years. As a result of this ordering rule, pre-enactment capital loss carryforwards may be more likely to expire unused. Additionally, post-enactment capital losses that are carried forward will retain their character as either short-term or long-term capital losses rather than being considered all short-term as under previous law.
The characterization of distributions to shareholders for financial reporting purposes is determined in accordance with federal income tax rules, which may differ from GAAP. The source of each Fund’s distributions may be shown in the accompanying financial statements as either from net investment income, net realized gain or capital. Certain components of the Funds’ net assets on the Statements of Assets and Liabilities reflect permanent GAAP/tax differences based on the appropriate tax character.
F. Foreign Currency Translation — The accounting records and reporting currency of the Funds are maintained in U.S. dollars. Assets and liabilities denominated in foreign currencies are translated into U.S. dollars using the current exchange rates at the close of each business day. The effect of changes in foreign currency exchange rates on investments is included within net realized and unrealized gain (loss) on investments. Changes in the value of other assets and liabilities as a result of fluctuations in foreign exchange rates are included in the Statements of Operations within net change in unrealized gain (loss) on foreign currency translations. Transactions denominated in foreign currencies are translated into U.S. dollars on the date the transaction occurred, the effects of which are included within net realized gain (loss) on foreign currency transactions.
143
GOLDMAN SACHS SINGLE SECTOR FIXED INCOME FUNDS
Notes to Financial Statements (continued)
September 30, 2015 (Unaudited)
|
| 3. INVESTMENTS AND FAIR VALUE MEASUREMENTS |
The fair value of a financial instrument is the amount that would be received to sell an asset or paid to transfer a liability in an orderly transaction between market participants at the measurement date (i.e., the exit price). GAAP establishes a fair value hierarchy that prioritizes the inputs to valuation techniques used to measure fair value. The hierarchy gives the highest priority to unadjusted quoted prices in active markets for identical assets or liabilities (Level 1 measurements) and the lowest priority to unobservable inputs (Level 3 measurements). The levels used for classifying investments are not necessarily an indication of the risk associated with investing in these investments. The three levels of the fair value hierarchy are described below:
Level 1 — Unadjusted quoted prices in active markets that are accessible at the measurement date for identical, unrestricted assets or liabilities;
Level 2 — Quoted prices in markets that are not active or financial instruments for which significant inputs are observable (including, but not limited to, quoted prices for similar investments, interest rates, foreign exchange rates, volatility and credit spreads), either directly or indirectly;
Level 3 — Prices or valuations that require significant unobservable inputs (including GSAM’s assumptions in determining fair value measurement).
Changes in valuation techniques may result in transfers into or out of an assigned level within the hierarchy. In accordance with the Funds’ policy, transfers between different levels of the fair value hierarchy resulting from such changes are deemed to have occurred as of the beginning of the reporting period.
The Board of Trustees (“Trustees”) has adopted Valuation Procedures that govern the valuation of the portfolio investments held by the Funds, including investments for which market quotations are not readily available. The Trustees have delegated to GSAM day-to-day responsibility for implementing and maintaining internal controls and procedures related to the valuation of the Funds’ portfolio investments. To assess the continuing appropriateness of pricing sources and methodologies, GSAM regularly performs price verification procedures and issues challenges as necessary to third party pricing vendors or brokers, and any differences are reviewed in accordance with the Valuation Procedures.
A. Level 1 and Level 2 Fair Value Investments — The valuation techniques and significant inputs used in determining the fair values for investments classified as Level 1 and Level 2 are as follows:
Equity Securities — Equity securities and investment companies traded on a United States (“U.S.”) securities exchange or the NASDAQ system, or those located on certain foreign exchanges, including but not limited to the Americas, are valued daily at their last sale price or official closing price on the principal exchange or system on which they are traded. If there is no sale or official closing price or it is believed by GSAM to not represent fair value, equity securities and exchange traded investment companies are valued at the last bid price for long positions and at the last ask price for short positions. Investments in investment companies (other than those that are exchange traded) are valued at the NAV on the valuation date. To the extent these investments are actively traded, they are classified as Level 1 of the fair value hierarchy, otherwise they are generally classified as Level 2.
Unlisted equity securities for which market quotations are available are valued at the last sale price on the valuation date, or if no sale occurs, at the last bid price. Securities traded on certain foreign securities exchanges are valued daily at fair value determined by an independent fair value service (if available) under Valuation Procedures approved by the Trustees and consistent with applicable regulatory guidance. The independent fair value service takes into account multiple factors including, but not limited to, movements in the securities markets, certain depositary receipts, futures contracts and foreign currency exchange rates that have occurred subsequent to the close of the foreign securities exchange. These investments are generally classified as Level 2 of the fair value hierarchy.
144
GOLDMAN SACHS SINGLE SECTOR FIXED INCOME FUNDS
|
| 3. INVESTMENTS AND FAIR VALUE MEASUREMENTS (continued) |
Debt Securities — Debt securities for which market quotations are readily available are valued daily on the basis of quotations supplied by dealers or an independent pricing service approved by the Trustees. The pricing services may use valuation models or matrix pricing, which consider: (i) yield or price with respect to bonds that are considered comparable in characteristics such as rating, interest rate and maturity date or (ii) quotations from securities dealers to determine current value. Short-term debt obligations that mature in sixty days or less and that do not exhibit signs of credit deterioration are valued at amortized cost, which approximates fair value. With the exception of treasury securities of G8 countries (not held in money market funds), which are generally classified as Level 1, these investments are generally classified as Level 2 of the fair value hierarchy.
i. Inverse Floaters — The interest rate on inverse floating rate securities (“inverse floaters”) resets in the opposite direction from the market rate of interest to which the inverse floaters are indexed. An inverse floater may be considered to be leveraged to the extent that its interest rate varies by a magnitude that exceeds the magnitude of the change in the index rate of interest. The higher the degree of leverage of an inverse floater, the greater the volatility of its market value.
ii. Mortgage-Backed and Asset-Backed Securities — Mortgage-backed securities represent direct or indirect participations in, or are collateralized by and payable from, mortgage loans secured by residential and/or commercial real estate property. Asset-backed securities include securities whose principal and interest payments are collateralized by pools of other assets or receivables. The value of certain mortgage-backed and asset-backed securities (including adjustable rate mortgage loans) may be particularly sensitive to changes in prevailing interest rates. The value of these securities may also fluctuate in response to the market’s perception of the creditworthiness of the issuers.
Asset-backed securities may present credit risks that are not presented by mortgage-backed securities because they generally do not have the benefit of a security interest in collateral that is comparable to mortgage assets. Some asset-backed securities may only have a subordinated claim on collateral.
Stripped mortgage-backed securities are usually structured with two different classes: one that receives substantially all interest payments (interest-only, or “IO” and/or high coupon rate with relatively low principal amount, or “IOette”), and the other that receives substantially all principal payments (principal-only, or “PO”) from a pool of mortgage loans. Little to no principal will be received at the maturity of an IO; as a result, periodic adjustments are recorded to reduce the cost of the security until maturity. These adjustments are included in interest income.
iii. Mortgage Dollar Rolls — Mortgage dollar rolls are transactions whereby a Fund sells mortgage-backed-securities and simultaneously contracts with the same counterparty to repurchase similar securities on a specified future date. During the settlement period, a Fund will not be entitled to accrue interest and receive principal payments on the securities sold.
iv. Senior Term Loans — Senior term loans (“Loans”) are interests in amounts owed by corporate, governmental, or other borrowers to lenders or lending syndicates. Loans are arranged through private negotiations between the borrower and one or more financial institutions (“Lenders”). A Fund’s investments in Loans are in the form of either participations in Loans (“Participations”) or assignments of all or a portion of Loans from third parties (“Assignments”). With respect to Participations, a Fund has the right to receive payments of principal, interest and any fees to which it is entitled from the Lender selling the Participations and only upon receipt by the Lender of the payments from the borrower. A Fund generally has no right to enforce compliance by the borrower with the terms of the loan agreement with respect to Participations. Conversely, Assignments result in a Fund having a direct contractual relationship with the borrower, and the Fund may be permitted to enforce compliance by the borrower with the terms of the loan agreement.
The High Yield and High Yield Floating Rate Funds may also enter into certain credit arrangements, all or a portion of which may be unfunded. Unfunded loan commitments represent the remaining obligation of a Fund to the borrower. A Fund is obligated to fund these commitments at the borrower’s discretion. A Fund may receive a commitment fee based on the undrawn portion of the underlying line of credit of a Loan. All Loans and unfunded loan commitments involve interest rate risk, liquidity risk and credit risk, including the potential default or insolvency of the borrower. Loans, including unfunded loan commitments, are marked to market daily using pricing vendor quotations and the change in value, if any, is recorded as an unrealized gain or loss.
145
GOLDMAN SACHS SINGLE SECTOR FIXED INCOME FUNDS
Notes to Financial Statements (continued)
September 30, 2015 (Unaudited)
|
| 3. INVESTMENTS AND FAIR VALUE MEASUREMENTS (continued) |
v. Treasury Inflation Protected Securities — TIPS are treasury securities in which the principal amount is adjusted daily to keep pace with inflation, as measured by the U.S. Consumer Pricing Index for Urban Consumers. The repayment of the original bond principal upon maturity is guaranteed by the full faith and credit of the U.S. Government.
vi. Structured Notes — The values of structured notes are based on the price movements of a reference security or index. Upon termination, a Fund will receive a payment from the issuer based on the value of the referenced instrument (notional amount multiplied by price of the referenced instrument) and record a realized gain or loss.
vii. When-Issued Securities and Forward Commitments — When-issued securities, including TBA (“To Be Announced”) securities, are securities that are authorized but not yet issued in the market and purchased in order to secure what is considered to be an advantageous price or yield to a Fund. A forward commitment involves entering into a contract to purchase or sell securities, typically on an extended settlement basis, for a fixed price at a future date. The purchase of securities on a when-issued or forward commitment basis involves a risk of loss if the value of the security to be purchased declines before the settlement date. Conversely, the sale of securities on a forward commitment basis involves the risk that the value of the securities sold may increase before the settlement date. Although a Fund will generally purchase securities on a when-issued or forward commitment basis with the intention of acquiring the securities for its portfolio, the Fund may dispose of when-issued securities or forward commitments prior to settlement which may result in a realized gain or loss.
Underlying Funds (including Money Market Funds) — Underlying Funds (“Underlying Funds”) include other investment companies and exchange-traded funds (“ETFs”). Investments in the Underlying Funds (except ETFs) are valued at the NAV per share of the Institutional Share class (the FST Share class for Money Market Funds) on the day of valuation. ETFs are valued daily at the last sale price or official closing price on the principal exchange or system on which the investment is traded. Because the Funds invest in Underlying Funds that fluctuate in value, the Funds’ shares will correspondingly fluctuate in value. To the extent these investments are actively traded, they are classified as Level 1 of the fair value hierarchy, otherwise they are generally classified as Level 2.
The Underlying Funds may invest in debt securities which, if market quotations are readily available, are valued daily on the basis of quotations supplied by dealers or an independent pricing service approved by the Trustees. The pricing services may use valuation models or matrix pricing, which consider: (i) yield or price with respect to bonds that are considered comparable in characteristics such as rating, interest rate and maturity date or (ii) quotations from securities dealers to determine current value. Short-term debt obligations that mature in sixty days or less and that do not exhibit signs of credit deterioration are valued at amortized cost, which approximates fair value. With the exception of treasury securities of G8 countries (not held in money market funds), which are generally classified as Level 1, these investments are generally classified as Level 2 of the fair value hierarchy.
The Underlying Funds may invest in equity securities and investment companies. Investments in equity securities and investment companies traded on a U.S. securities exchange or the NASDAQ system, or those located on certain foreign exchanges, including but not limited to the Americas, are valued daily at their last sale price or official closing price on the principal exchange or system on which they are traded. If there is no sale or official closing price, or it is believed by the investment adviser to not represent fair value, equity securities and exchange traded investment companies are valued at the last bid price for long positions and at the last ask price for short positions. Investments in investment companies (other than those that are exchange traded) are valued at the NAV on the valuation date. To the extent these investments are actively traded, they are classified as Level 1 of the fair value hierarchy, otherwise they are generally classified as Level 2.
The Underlying Funds may invest in unlisted equity securities for which market quotations are available are valued at the last sale price on the valuation date, or if no sale occurs, at the last bid price. Securities traded on certain foreign securities exchanges are valued daily at fair value determined by an independent fair value service (if available) under Valuation Procedures approved by the Trustees and consistent with applicable regulatory guidance. The independent fair value service takes into account multiple factors including, but not limited to, movements in the securities markets, certain depositary receipts, futures contracts and foreign currency exchange rates that have occurred subsequent to the close of the foreign securities exchange. These investments are generally classified as Level 2 of the fair value hierarchy.
146
GOLDMAN SACHS SINGLE SECTOR FIXED INCOME FUNDS
|
| 3. INVESTMENTS AND FAIR VALUE MEASUREMENTS (continued) |
Derivative Contracts — A derivative is an instrument whose value is derived from underlying assets, indices, reference rates or a combination of these factors. The Funds enter into derivative transactions to hedge against changes in interest rates, securities prices, and/or currency exchange rates, to increase total return, or to gain access to certain markets or attain exposure to other underliers.
Exchange-traded derivatives, including futures and options contracts, are valued at the last sale or settlement price and typically fall within Level 1 of the fair value hierarchy. Over-the-counter (“OTC”) and centrally cleared derivatives are valued using market transactions and other market evidence, including market-based inputs to models, calibration to market-clearing transactions, broker or dealer quotations, or other alternative pricing sources. Where models are used, the selection of a particular model to value OTC and centrally cleared derivatives depends upon the contractual terms of, and specific risks inherent in, the instrument, as well as the availability of pricing information in the market. Valuation models require a variety of inputs, including contractual terms, market prices, yield curves, credit curves, measures of volatility, voluntary and involuntary prepayment rates, loss severity rates and correlations of such inputs. For OTC and centrally cleared derivatives that trade in liquid markets, model inputs can generally be verified and model selection does not involve significant management judgment. OTC and centrally cleared derivatives are classified within Level 2 of the fair value hierarchy when significant inputs are corroborated by market evidence.
i. Forward Contracts — A forward contract is a contract between two parties to buy or sell an asset at a specified price on a future date. A forward contract settlement can occur on a cash or delivery basis. Forward contracts are marked-to-market daily using independent vendor prices, and the change in value, if any, is recorded as an unrealized gain or loss.
A forward foreign currency contract is a forward contract in which a Fund agrees to receive or deliver a fixed quantity of one currency for another, at a pre-determined price at a future date. All forward foreign currency exchange contracts are marked-to-market daily at the applicable forward rate. Non-deliverable forward foreign currency exchange contracts are settled with the counterparty in cash without the delivery of foreign currency.
A non-deliverable bond forward is a short term forward contract between two parties to buy or sell a bond denominated in a non-deliverable foreign currency at a specified future time and price. Non-deliverable bond forwards are marked-to-market daily using market quotations. Unrealized gains or losses on non-deliverable bond forwards are recorded by a Fund on a daily basis, and realized gains or losses are recorded on the termination date or sale of a contract.
ii. Futures Contracts — Futures contracts are contracts to buy or sell a standardized quantity of a specified commodity or security and are valued based on exchanged settlement prices or independent market quotes. Futures contracts are valued at the last settlement price, or in the absence of a sale, the last bid price for long positions and at the last ask price for short positions, at the end of each day on the board of trade or exchange upon which they are traded. Upon entering into a futures contract, a Fund deposits cash or securities in an account on behalf of the broker in an amount sufficient to meet the initial margin requirement. Subsequent payments are made or received by a Fund equal to the daily change in the contract value and are recorded as variation margin receivable or payable with a corresponding offset to unrealized gains or losses.
iii. Options — When a Fund writes call or put options, an amount equal to the premium received is recorded as a liability and is subsequently marked-to-market to reflect the current value of the option written. Swaptions are options on interest rate swap contracts.
Upon the purchase of a call option or a put option by a Fund, the premium paid is recorded as an investment and subsequently marked-to-market to reflect the current value of the option. Certain options may be purchased with premiums to be determined on a future date. The premiums for these options are based upon implied volatility parameters at specified terms.
iv. Swap Contracts — Bilateral swap contracts are agreements in which a Fund and a counterparty agree to exchange periodic payments on a specified notional amount or make a net payment upon termination. Bilateral swap transactions are privately negotiated in the OTC market and payments are settled through direct payments between a Fund and the counterparty. By contrast, certain swap transactions are subject to mandatory central clearing. These swaps are executed
147
GOLDMAN SACHS SINGLE SECTOR FIXED INCOME FUNDS
Notes to Financial Statements (continued)
September 30, 2015 (Unaudited)
|
| 3. INVESTMENTS AND FAIR VALUE MEASUREMENTS (continued) |
through a derivatives clearing member (“DCM”), acting in an agency capacity, and submitted to a central counterparty (“CCP”) (“centrally cleared swaps”), in which case all payments are settled with the CCP through the DCM. Swaps are marked-to-market daily using pricing vendor quotations, counterparty or clearinghouse prices or model prices, and the change in value, if any, is recorded as an unrealized gain or loss. Upon entering into a swap contract, a Fund is required to satisfy an initial margin requirement by delivering cash or securities to the counterparty (or in some cases, segregated in a triparty account on behalf of the counterparty), which can be adjusted by any mark-to-market gains or losses pursuant to bilateral or centrally cleared arrangements. For centrally cleared swaps the daily change in valuation, if any, is recorded as a receivable or payable for variation margin.
An interest rate swap is an agreement that obligates two parties to exchange a series of cash flows at specified intervals, based upon or calculated by reference to changes in interest rates on a specified notional principal amount. The payment flows are usually netted against each other, with the difference being paid by one party to the other.
A credit default swap is an agreement that involves one party (the buyer of protection) making a stream of payments to another party (the seller of protection) in exchange for the right to receive protection on a reference security or obligation, including a group of assets or exposure to the performance of an index. A Fund’s investment in credit default swaps may involve greater risks than if the Fund had invested in the referenced obligation directly. Credit events are contract specific but may include bankruptcy, failure to pay, restructuring and obligation acceleration. If a Fund buys protection through a credit default swap and no credit event occurs, its payments are limited to the periodic payments previously made to the counterparty. Upon the occurrence of a specified credit event, a Fund, as a buyer of credit protection, is entitled to receive an amount equal to the notional amount of the swap and deliver to the seller the defaulted reference obligation in a physically settled trade. A Fund may also receive a net settlement amount in the form of cash or securities equal to the notional amount of the swap reduced by the recovery value of the reference obligation in a cash settled trade.
As a seller of protection, a Fund generally receives a payment stream throughout the term of the swap, provided that there is no credit event. In addition, if a Fund sells protection through a credit default swap, a Fund could suffer a loss because the value of the referenced obligation and the premium payments received may be less than the notional amount of the swap paid to the buyer of protection. Upon the occurrence of a specified credit event, a Fund, as a seller of credit protection, may be required to take possession of the defaulted reference obligation and pay the buyer an amount equal to the notional amount of the swap in a physically settled trade. A Fund may also pay a net settlement amount in the form of cash or securities equal to the notional amount of the swap reduced by the recovery value of the reference obligation in cash settled trade. Recovery values are at times established through the credit event auction process in which market participants are ensured that a transparent price has been set for the defaulted security or obligation. In addition, a Fund is entitled to a return of any assets, which have been pledged as collateral to the counterparty.
The maximum potential amount of future payments (undiscounted) that a Fund as seller of protection could be required to make under a credit default swap would be an amount equal to the notional amount of the agreement. These potential amounts would be partially offset by any recovery values of the respective referenced obligations or net amounts received from a settlement of a credit default swap for the same reference security or obligation where a Fund bought credit protection.
A cross currency swap is an agreement which a Fund may enter into to gain or mitigate exposure to currency risk. A cross currency swap is an agreement to exchange cash flows on a notional amount of two or more currencies based on the relative value differential among them. Such swaps may involve initial and final exchanges that correspond to the agreed upon notional amount. Cross currency swaps usually involve the delivery of the entire principle value of one designated currency in exchange for other designated currency. Therefore, the entire principle value of a cross currency swap is subject to risk that the other party to the swap will default on its contractual delivery obligations. If there is a default by the counterparty, the Fund may have contractual remedies pursuant to the agreements related to the transaction.
A total return swap is an agreement that gives a Fund the right to receive the appreciation in the value of a specified security, index or other instrument in return for a fee paid to the counterparty, which will typically be an agreed upon interest rate. If the underlying asset declines in value over the term of the swap, a Fund may also be required to pay the dollar value of that decline to the counterparty.
148
GOLDMAN SACHS SINGLE SECTOR FIXED INCOME FUNDS
|
| 3. INVESTMENTS AND FAIR VALUE MEASUREMENTS (continued) |
Short Term Investments — Short-term investments having a maturity of 60 days or less are generally valued at amortized cost which approximates fair market value. These investments are classified as Level 2 of the fair value hierarchy.
i. Repurchase Agreements — Repurchase agreements involve the purchase of securities subject to the seller’s agreement to repurchase the securities at a mutually agreed upon date and price, under the terms of a Master Repurchase Agreement (“MRA”). During the term of a repurchase agreement, the value of the underlying securities held as collateral on behalf of a Fund, including accrued interest, is required to exceed the value of the repurchase agreement, including accrued interest. The gross value of repurchase agreements is included in the Statements of Assets and Liabilities for financial reporting purposes. The underlying securities for all repurchase agreements are held at the Funds’ custodian or designated sub-custodians under tri-party repurchase agreements.
An MRA governs transactions between a Fund and select counterparties. An MRA contains provisions for, among other things, initiation of the transaction, income payments, events of default and maintenance of securities for both repurchase and reverse repurchase agreements. An MRA also permits offsetting with collateral to create one single net payment in the event of default or similar events, including the bankruptcy or insolvency of a counterparty.
If the seller defaults, a Fund could suffer a loss to the extent that the proceeds from the sale of the underlying securities and other collateral held by the Fund are less than the repurchase price and the Fund’s costs associated with delay and enforcement of the repurchase agreement. In addition, in the event of default or insolvency of the seller, a court could determine that a Fund’s interest in the collateral is not enforceable, resulting in additional losses to the Fund.
Pursuant to exemptive relief granted by the Securities and Exchange Commission (“SEC”) and terms and conditions contained therein, the Funds, together with other funds of the Trust and registered investment companies having management agreements with GSAM or its affiliates, may transfer uninvested cash into joint accounts, the daily aggregate balance of which is invested in one or more repurchase agreements. Under these joint accounts, the Funds maintain pro-rata credit exposure to the underlying repurchase agreements’ counterparties. With the exception of certain transaction fees, the Funds are not subject to any expenses in relation to these investments.
Secured Borrowings — Secured borrowings are valued at their contractual amounts, which approximates fair value and are generally classified as Level 2 of the fair value hierarchy.
i. Reverse Repurchase Agreements — Reverse repurchase agreements involve the sale of securities held by the Funds subject to the Funds’ agreement to repurchase the securities at a mutually agreed upon date and price (including interest), under the terms of an MRA.
The Funds are required to deliver securities as collateral to the counterparty that exceeds the value of the reverse repurchase agreement. The gross value of reverse repurchase agreements is included in the Statements of Assets and Liabilities for financial reporting purposes.
If the buyer defaults on its commitment to sell back the securities, a Fund could suffer a loss to the extent that the amount borrowed is less than the replacement cost of similar securities and the Fund’s costs associated with delay and enforcement of the reverse repurchase agreement. In addition, in the event of default or insolvency of the buyer, a court could determine that a Fund’s interest in the amount borrowed is not enforceable, resulting in additional losses to the Fund.
B. Level 3 Fair Value Investments — To the extent that significant inputs to valuation models and other alternative pricing sources are unobservable, or if quotations are not readily available, or if GSAM believes that such quotations do not accurately reflect fair value, the fair value of the Funds’ investments may be determined under Valuation Procedures approved by the Trustees. GSAM, consistent with its procedures and applicable regulatory guidance, may make an adjustment to the most recent valuation prices of either domestic or foreign securities in light of significant events to reflect what it believes to be the fair value of the securities at the time of determining a Fund’s NAV. Significant events which could affect a large number of securities in a
149
GOLDMAN SACHS SINGLE SECTOR FIXED INCOME FUNDS
Notes to Financial Statements (continued)
September 30, 2015 (Unaudited)
|
| 3. INVESTMENTS AND FAIR VALUE MEASUREMENTS (continued) |
particular market may include, but are not limited to: significant fluctuations in U.S. or foreign markets; market dislocations; market disruptions; or unscheduled market closings. Significant events which could also affect a single issuer may include, but are not limited to: corporate actions such as reorganizations, mergers and buy-outs; ratings downgrades; and bankruptcies. To the extent investments are valued using single source broker quotations obtained directly from the broker or passed through from third party pricing vendors, such investments are classified as Level 3 investments.
GSAM did not develop the unobservable inputs (examples include but are not limited to single source broker quotations, third party pricing, etc.) for the valuation of Level 3 Assets and Liabilities.
C. Fair Value Hierarchy — The following is a summary of the Funds’ investments and derivatives classified in the fair value hierarchy as of September 30, 2015:
| | | | | | | | | | | | |
|
| DYNAMIC EMERGING MARKETS DEBT | |
| | | |
| Investment Type | | Level 1 | | | Level 2 | | | Level 3 | |
| Assets | | | | | | | | | | | | |
Fixed Income | | | | | | | | | | | | |
Sovereign Debt Obligations | | $ | — | | | $ | 21,566,409 | | | $ | — | |
Corporate Obligations | | | — | | | | 4,881,358 | | | | — | |
Structured Notes | | | — | | | | 1,145,440 | | | | — | |
Municipal Debt Obligations | | | — | | | | 386,847 | | | | — | |
U.S. Treasury Obligations | | | 1,328,332 | | | | — | | | | — | |
Short-term Investments | | | — | | | | 5,600,000 | | | | — | |
| Total | | $ | 1,328,332 | | | $ | 33,580,054 | | | $ | — | |
150
GOLDMAN SACHS SINGLE SECTOR FIXED INCOME FUNDS
|
| 3. INVESTMENTS AND FAIR VALUE MEASUREMENTS (continued) |
| | | | | | | | | | | | |
|
| DYNAMIC EMERGING MARKETS DEBT (continued) | |
| | | |
| Derivative Type | | Level 1 | | | Level 2 | | | Level 3 | |
| Assets(a) | | | | | | | | | | | | |
Forward Foreign Currency Exchange Contracts | | $ | — | | | $ | 240,129 | | | $ | — | |
Futures Contracts | | | 8,618 | | | | — | | | | — | |
Interest Rate Swap Contracts | | | — | | | | 53,998 | | | | — | |
Credit Default Swap Contracts | | | — | | | | 4,002 | | | | — | |
Non-Deliverable Bond Forward Contracts | | | — | | | | 1,022 | | | | — | |
| Total | | $ | 8,618 | | | $ | 299,151 | | | $ | — | |
| Liabilities(a) | | | | | | | | | | | | |
Forward Foreign Currency Exchange Contracts | | $ | — | | | $ | (415,431 | ) | | $ | — | |
Futures Contracts | | | (3,227 | ) | | | — | | | | — | |
Interest Rate Swap Contracts | | | — | | | | (104,150 | ) | | | — | |
Credit Default Swap Contracts | | | — | | | | (4,690 | ) | | | — | |
| Total | | $ | (3,227 | ) | | $ | (524,271 | ) | | $ | — | |
| | | |
| EMERGING MARKETS DEBT | | | | | | | | | | | | |
| | | |
| Investment Type | | Level 1 | | | Level 2 | | | Level 3 | |
| Assets | | | | | | | | | | | | |
Fixed Income | | | | | | | | | | | | |
Sovereign Debt Obligations | | $ | — | | | $ | 696,334,566 | | | $ | — | |
Foreign Debt Obligation | | | — | | | | 4,680,095 | | | | — | |
Corporate Obligations | | | — | | | | 270,228,674 | | | | — | |
U.S. Treasury Obligations and/or Other U.S. Government Agencies | | | 19,491,429 | | | | 24,999,575 | | | | — | |
Structured Note | | | — | | | | 3,119,546 | | | | — | |
Municipal Debt Obligations | | | — | | | | 12,736,484 | | | | — | |
Short-term Investments | | | — | | | | 3,100,000 | | | | — | |
| Total | | $ | 19,491,429 | | | $ | 1,015,198,940 | | | $ | — | |
| Liabilities | | | | | | | | | | | | |
Reverse Repurchase Agreements | | $ | — | | | $ | (8,123,805 | ) | | $ | — | |
151
GOLDMAN SACHS SINGLE SECTOR FIXED INCOME FUNDS
Notes to Financial Statements (continued)
September 30, 2015 (Unaudited)
|
| 3. INVESTMENTS AND FAIR VALUE MEASUREMENTS (continued) |
| | | | | | | | | | | | |
| | | |
| EMERGING MARKETS DEBT (continued) | | | | | | | | | | | | |
| | | |
| Derivative Type | | Level 1 | | | Level 2 | | | Level 3 | |
| Assets(a) | | | | | | | | | | | | |
Forward Foreign Currency Exchange Contracts | | $ | — | | | $ | 9,460,848 | | | $ | — | |
Futures Contracts | | | 2,478,263 | | | | — | | | | — | |
Interest Rate Swap Contracts | | | — | | | | 2,392,059 | | | | — | |
Credit Default Swap Contracts | | | — | | | | 303,131 | | | | — | |
| Total | | $ | 2,478,263 | | | $ | 12,156,038 | | | $ | — | |
| Liabilities(a) | | | | | | | | | | | | |
Forward Foreign Currency Exchange Contracts | | $ | — | | | $ | (2,582,859 | ) | | $ | — | |
Futures Contracts | | | (727,283 | ) | | | — | | | | — | |
Interest Rate Swap Contracts | | | — | | | | (3,669,745 | ) | | | — | |
Credit Default Swap Contracts | | | — | | | | (459,041 | ) | | | — | |
| Total | | $ | (727,283 | ) | | $ | (6,711,645 | ) | | $ | — | |
| | | |
| HIGH YIELD | | | | | | | | | | | | |
| | | |
| Investment Type | | Level 1 | | | Level 2 | | | Level 3 | |
| Assets | | | | | | | | | | | | |
Fixed Income | | | | | | | | | | | | |
Corporate Obligations | | $ | — | | | $ | 4,098,942,167 | | | $ | — | |
Senior Term Loans | | | — | | | | 231,076,689 | | | | 10,348,625 | |
Common Stock and/or Other Equity Investments(b) | | | | | | | | | | | | |
North America | | | 6,803,801 | | | | 3,526,380 | | | | 39 | |
Warrants | | | — | | | | 2,169,509 | | | | — | |
Investment Company | | | 114,348,213 | | | | — | | | | — | |
| Total | | $ | 121,152,014 | | | $ | 4,335,714,745 | | | $ | 10,348,664 | |
| Liabilities | | | | | | | | | | | | |
Reverse Repurchase Agreements | | $ | — | | | $ | (119,075,938 | ) | | $ | — | |
| | | |
| Derivative Type | | | | | | | | | |
| Assets(a) | | | | | | | | | | | | |
Forward Foreign Currency Exchange Contracts | | $ | — | | | $ | 239,515 | | | $ | — | |
Futures Contracts | | | 1,452,986 | | | | — | | | | — | |
| Total | | $ | 1,452,986 | | | $ | 239,515 | | | $ | — | |
| Liabilities(a) | | | | | | | | | | | | |
Forward Foreign Currency Exchange Contracts | | $ | — | | | $ | (35,844 | ) | | $ | — | |
Futures Contracts | | | (3,411,763 | ) | | | — | | | | — | |
| Total | | $ | (3,411,763 | ) | | $ | (35,844 | ) | | $ | — | |
152
GOLDMAN SACHS SINGLE SECTOR FIXED INCOME FUNDS
|
| 3. INVESTMENTS AND FAIR VALUE MEASUREMENTS (continued) |
| | | | | | | | | | | | |
| | | |
| HIGH YIELD FLOATING RATE | | | | | | | | | | | | |
| | | |
| Investment Type | | Level 1 | | | Level 2 | | | Level 3 | |
| Assets | | | | | | | | | | | | |
Fixed Income | | | | | | | | | | | | |
Senior Term Loans | | $ | — | | | $ | 3,121,171,498 | | | $ | 47,648,777 | |
Corporate Obligations | | | — | | | | 376,567,466 | | | | — | |
Asset-Backed Securities | | | — | | | | 8,004,932 | | | | — | |
Investment Companies | | | 202,665,903 | | | | — | | | | — | |
| Total | | $ | 202,665,903 | | | $ | 3,505,743,896 | | | $ | 47,648,777 | |
| Liabilities | | | | | | | | | | | | |
Reverse Repurchase Agreements | | $ | — | | | $ | (4,500,000 | ) | | $ | — | |
| | | |
| Derivative Type | | | | | | | | | |
| Assets(a) | | | | | | | | | | | | |
Forward Foreign Currency Exchange Contracts | | $ | — | | | $ | 138,030 | | | $ | — | |
| Liabilities(a) | | | | | | | | | | | | |
Forward Foreign Currency Exchange Contracts | | $ | — | | | $ | (2,492 | ) | | $ | — | |
Interest Rate Swap Contracts | | | — | | | | (993,415 | ) | | | — | |
| Total | | $ | — | | | $ | (995,907 | ) | | $ | — | |
The following is a reconciliation of Level 3 investments for the six months ended September 30, 2015:
| | | | |
| |
| | | Senior Term Loans | |
Beginning Balance as of April 1, 2015 | | $ | 79,279,669 | |
Realized gain (loss) | | | 51,079 | |
Net change in unrealized gain (loss) relating to instruments still held at reporting date | | | (5,410,260 | ) |
Purchases | | | 12,970,581 | |
Sales | | | (5,591,575 | ) |
Amortization | | | 96,346 | |
Transfers into Level 3 | | | 33,055,114 | |
Transfers out of Level 3 | | | (66,802,177 | ) |
| Ending Balance as of September 30, 2015 | | $ | 47,648,777 | |
Securities transferred in and out of Level 3 were primarily due to pricing of floating rate bank loans based on single broker quotes.
153
GOLDMAN SACHS SINGLE SECTOR FIXED INCOME FUNDS
Notes to Financial Statements (continued)
September 30, 2015 (Unaudited)
|
| 3. INVESTMENTS AND FAIR VALUE MEASUREMENTS (continued) |
| | | | | | | | | | | | |
|
| INVESTMENT GRADE CREDIT | |
| | | |
| Investment Type | | Level 1 | | | Level 2 | | | Level 3 | |
| Assets | | | | | | | | | | | | |
Fixed Income | | | | | | | | | | | | |
Corporate Obligations | | $ | — | | | $ | 363,650,511 | | | $ | — | |
Mortgage-Backed Obligations | | | — | | | | 9,470,085 | | | | — | |
U.S. Treasury Obligations and/or Other U.S. Government Agencies | | | 10,961,775 | | | | 642,069 | | | | — | |
Foreign Debt Obligations | | | — | | | | 18,809,574 | | | | — | |
Municipal Debt Obligations | | | — | | | | 15,484,930 | | | | — | |
Common Stock and/or Other Equity Investments(b) | | | | | | | | | | | | |
North America | | | — | | | | 1,760,300 | | | | — | |
Investment Company | | | 3,747,934 | | | | — | | | | — | |
| Total | | $ | 14,709,709 | | | $ | 409,817,469 | | | $ | — | |
| | | |
| Derivative Type | | | | | | | | | |
| Assets(a) | | | | | | | | | | | | |
Futures Contracts | | $ | 370,089 | | | $ | — | | | $ | — | |
Interest Rate Swap Contracts | | | — | | | | 307,428 | | | | — | |
| Total | | $ | 370,089 | | | $ | 307,428 | | | $ | — | |
| Liabilities(a) | | | | | | | | | | | | |
Futures Contracts | | $ | (183,289 | ) | | $ | — | | | $ | — | |
Interest Rate Swap Contracts | | | — | | | | (740,220 | ) | | | — | |
Credit Default Swap Contracts | | | — | | | | (1,135 | ) | | | — | |
| Total | | $ | (183,289 | ) | | $ | (741,355 | ) | | $ | — | |
| | | |
| LOCAL EMERGING MARKETS DEBT | | | | | | | | | | | | |
| | | |
| Investment Type | | Level 1 | | | Level 2 | | | Level 3 | |
| Assets | | | | | | | | | | | | |
Fixed Income | | | | | | | | | | | | |
Sovereign Debt Obligations | | $ | — | | | $ | 685,506,045 | | | $ | — | |
Corporate Obligations | | | — | | | | 53,478,632 | | | | — | |
Structured Notes | | | — | | | | 107,097,890 | | | | — | |
Municipal Debt Obligations | | | — | | | | 7,275,799 | | | | — | |
U.S. Treasury Obligations | | | 84,197,794 | | | | — | | | | — | |
Investment Company | | | 21,654,935 | | | | — | | | | — | |
| Total | | $ | 105,852,729 | | | $ | 853,358,366 | | | $ | — | |
| Liabilities | | | | | | | | | | | | |
Reverse Repurchase Agreements | | $ | — | | | $ | (154,438 | ) | | $ | — | |
154
GOLDMAN SACHS SINGLE SECTOR FIXED INCOME FUNDS
|
| 3. INVESTMENTS AND FAIR VALUE MEASUREMENTS (continued) |
| | | | | | | | | | | | |
| | | |
| LOCAL EMERGING MARKETS DEBT (continued) | | | | | | | | | | | | |
| | | |
| Derivative Type | | Level 1 | | | Level 2 | | | Level 3 | |
| Assets(a) | | | | | | | | | | | | |
Forward Foreign Currency Exchange Contracts | | $ | — | | | $ | 14,335,203 | | | $ | — | |
Interest Rate Swap Contracts | | | — | | | | 18,058,491 | | | | — | |
Credit Default Swap Contracts | | | — | | | | 138,092 | | | | — | |
Non-Deliverable Bond Forward Contracts | | | — | | | | 83,535 | | | | — | |
| Total | | $ | — | | | $ | 32,615,321 | | | $ | — | |
| Liabilities(a) | | | | | | | | | | | | |
Forward Foreign Currency Exchange Contracts | | $ | — | | | $ | (13,071,867 | ) | | $ | — | |
Futures Contracts | | | (825,701 | ) | | | — | | | | — | |
Interest Rate Swap Contracts | | | — | | | | (19,522,138 | ) | | | — | |
Credit Default Swap Contracts | | | — | | | | (11,813 | ) | | | — | |
Cross Currency Swap Contracts | | | — | | | | (11,308,831 | ) | | | — | |
Non-Deliverable Bond Forward Contracts | | | | | | | (81,763 | ) | | | | |
| Total | | $ | (825,701 | ) | | $ | (43,996,412 | ) | | $ | — | |
| | | |
| U.S. MORTGAGES | | | | | | | | | | | | |
| | | |
| Investment Type | | Level 1 | | | Level 2 | | | Level 3 | |
| Assets | | | | | | | | | | | | |
Fixed Income | | | | | | | | | | | | |
Mortgage-Backed Obligations | | $ | — | | | $ | 314,886,989 | | | $ | — | |
Asset-Backed Securities | | | — | | | | 22,867,675 | | | | — | |
Investment Company | | | 7,164,780 | | | | — | | | | — | |
| Total | | $ | 7,164,780 | | | $ | 337,754,664 | | | $ | — | |
| Liabilities | | | | | | | | | | | | |
Fixed Income | | | | | | | | | | | | |
Mortgage-Backed Obligations — Forward Sales Contracts | | $ | — | | | $ | (28,136,407 | ) | | $ | — | |
| | | |
| Derivative Type | | | | | | | | | |
| Assets(a) | | | | | | | | | | | | |
Futures Contracts | | $ | 261,517 | | | $ | — | | | $ | — | |
Interest Rate Swap Contracts | | | — | | | | 441,571 | | | | — | |
| Total | | $ | 261,517 | | | $ | 441,571 | | | $ | — | |
| Liabilities(a) | | | | | | | | | | | | |
Futures Contracts | | $ | (74,158 | ) | | $ | — | | | $ | — | |
Interest Rate Swap Contracts | | | — | | | | (419,223 | ) | | | — | |
Credit Default Swap Contracts | | | — | | | | (175,749 | ) | | | — | |
| Total | | $ | (74,158 | ) | | $ | (594,972 | ) | | $ | — | |
| (a) | | Amount shown represents unrealized gain (loss) at period end. |
| (b) | | To adjust for the time difference between local market close and the calculation of NAV. The Fund utilizes fair value model prices for international equities provided by an independent fair value service resulting in a Level 2 classification. |
For further information regarding security characteristics, see the Schedules of Investments.
155
GOLDMAN SACHS SINGLE SECTOR FIXED INCOME FUNDS
Notes to Financial Statements (continued)
September 30, 2015 (Unaudited)
|
| 4. INVESTMENTS IN DERIVATIVES |
The following tables set forth, by certain risk types, the gross value of derivative contracts as of September 30, 2015. These instruments were used to meet the Funds’ investment objectives and to obtain and/or manage exposure related to the risks below. The values in the tables below exclude the effects of cash collateral received or posted pursuant to these derivative contracts, and therefore are not representative of the Funds’ net exposure.
| | | | | | | | | | | | |
|
| Dynamic Emerging Markets Debt | |
| Risk | | Statements of Assets
and Liabilities | | Assets | | | Statements of Assets
and Liabilities | | Liabilities | |
Interest rate | | Receivable for unrealized gain on swap contracts; Variation margin on certain derivative contracts | | $ | 63,638 | (a) | | Payable for unrealized loss on swap contracts; Variation margin on certain derivative contracts | | $ | (107,377) | (a)(b) |
Credit | | Receivable for unrealized gain on swap contracts | | | 4,002 | | | Payable for unrealized loss on swap contracts | | | (4,690) | (b) |
Currency | | Receivable for unrealized gain on forward foreign currency exchange contracts | | | 240,129 | | | Payable for unrealized loss on forward foreign currency exchange contracts | | | (415,431) | |
| Total | | | | $ | 307,769 | | | | | $ | (527,498) | |
| | | |
| Emerging Markets Debt | | | | | | | | | | |
| Risk | | Statements of Assets
and Liabilities | | Assets | | | Statements of Assets
and Liabilities | | Liabilities | |
Interest rate | | Receivable for unrealized gain on swap contracts; Variation margin on certain derivative contracts | | $ | 4,870,322 | (a) | | Payable for unrealized loss on swap contracts; Variation margin on certain derivative contracts | | $ | (4,397,028) | (a)(b) |
Credit | | Receivable for unrealized gain on swap contracts | | | 303,131 | | | Payable for unrealized loss on swap contracts | | | (459,041) | |
Currency | | Receivable for unrealized gain on forward foreign currency exchange contracts | | | 9,460,848 | | | Payable for unrealized loss on forward foreign currency exchange contracts | | | (2,582,859) | |
| Total | | | | $ | 14,634,301 | | | | | $ | (7,438,928) | |
| | | | | | | | | | | | |
| | | |
| High Yield | | | | | | | | | | |
| Risk | | Statements of Assets
and Liabilities | | Assets | | | Statements of Assets
and Liabilities | | Liabilities | |
Interest rate | | Variation margin on certain derivative contracts | | $ | 1,452,986 | (a) | | Variation margin on certain derivative contracts | | $ | (3,215,040) | (a) |
Currency | | Receivable for unrealized gain on forward foreign currency exchange contracts | | | 239,515 | | | Payable for unrealized loss on forward foreign currency exchange contracts | | | (35,844) | |
| Total | | | | $ | 1,692,501 | | | | | $ | (3,250,884) | |
| | |
| High Yield Floating Rate | | | | | | | |
| Risk | | Statements of Assets
and Liabilities | | Assets | | | Statements of Assets
and Liabilities | | Liabilities | |
Interest rate | | Receivable for unrealized gain on swap contracts | | | — | | | Payable for unrealized loss on swap contracts | | $ | (993,415) | (a) |
Currency | | Receivable for unrealized gain on forward foreign currency exchange contracts | | | 138,030 | | | Payable for unrealized loss on forward foreign currency exchange contracts | | | (2,492) | |
| Total | | | | $ | 138,030 | | | | | $ | (995,907) | |
156
GOLDMAN SACHS SINGLE SECTOR FIXED INCOME FUNDS
|
| 4. INVESTMENTS IN DERIVATIVES (continued) |
| | | | | | | | | | | | |
| | |
| Investment Grade Credit | | | | | | | |
| Risk | | Statements of Assets
and Liabilities | | Assets | | | Statements of Assets
and Liabilities | | Liabilities | |
Interest rate | | Receivable for unrealized gain on swap contracts; Variation margin on certain derivative contracts | | $ | 677,517 | (a) | | Payable for unrealized loss on swap contracts; Variation margin on certain derivative contracts | | $ | (923,509) | (a) |
Credit | | Receivable for unrealized gain on swap contracts | | | — | | | Payable for unrealized loss on swap contracts | | | (1,135) | (a)(b) |
| Total | | | | $ | 677,517 | | | | | $ | (924,644) | |
| | |
| Local Emerging Markets Debt | | | | | | | |
| Risk | | Statements of Assets
and Liabilities | | Assets | | | Statements of Assets
and Liabilities | | Liabilities | |
Interest rate | | Receivable for unrealized gain on swap contracts; Variation margin on certain derivative contracts | | $ | 18,142,026 | (a) | | Payable for unrealized loss on swap contracts; Variation margin on certain derivative contracts | | $ | (20,429,602) | (a)(b) |
Credit | | Receivable for unrealized gain on swap contracts | | | 138,092 | | | Payable for unrealized loss on swap contracts | | | (11,813) | (b) |
Currency | | Receivable for unrealized gain on forward foreign currency exchange contracts | | | 14,335,203 | | | Payable for unrealized loss on forward foreign currency exchange contracts | | | (24,380,698) | |
| Total | | | | $ | 32,615,321 | | | | | $ | (44,822,113) | |
| | |
| U.S. Mortgages | | | | | | | |
| Risk | | Statements of Assets
and Liabilities | | Assets | | | Statements of Assets
and Liabilities | | Liabilities | |
Interest rate | | Receivable for unrealized gain on swap contracts; Variation margin on certain derivative contracts | | $ | 703,088 | (a) | | Payable for unrealized loss on swap contracts; Variation margin on certain derivative contracts | | $ | (493,381) | (a)(b) |
Credit | | Receivable for unrealized gain on swap contracts | | | — | | | Payable for unrealized loss on swap contracts | | | (175,749) | (b) |
| Total | | | | $ | 703,088 | | | | | $ | (669,130) | |
| (a) | | Includes unrealized gain (loss) on futures contracts and centrally cleared swaps described in the Additional Investment Information sections of the Schedules of Investments. Only current day’s variation margin is reported within the Statements of Assets and Liabilities. |
| (b) | | Aggregate of amounts include $112,891, $4,128,786, $0, $993,415, $741,380, $0 and $597,014 for Dynamic Emerging Markets Debt, Emerging Markets Debt, High Yield, High Yield Floating Rate, Investment Grade Credit, Local Emerging Markets Debt and U.S. Mortgages Funds, respectively, which represent the payments to be made pursuant to bilateral agreements should counterparties exercise their “right to terminate” provisions based on, among others, the Funds’ performance, their failure to pay on their obligations or failure to pledge collateral. Such amounts do not include incremental charges directly associated with the close-out of the agreements. They also do not reflect the fair value of any assets pledged as collateral which, through the daily margining process, substantially offsets the aforementioned amounts and for which the Funds are entitled to a full return. |
The following tables set forth, by certain risk types, the Funds’ gains (losses) related to these derivatives and their indicative volumes for the six months ended September 30, 2015. These gains (losses) should be considered in the context that these derivative contracts may have been executed to create investment opportunities and/or economically hedge certain investments, and accordingly, certain gains (losses) on such derivative contracts may offset certain (losses) gains attributable to investments.
157
GOLDMAN SACHS SINGLE SECTOR FIXED INCOME FUNDS
Notes to Financial Statements (continued)
September 30, 2015 (Unaudited)
|
| 4. INVESTMENTS IN DERIVATIVES (continued) |
These gains (losses) are included in “Net realized gain (loss)” or “Net change in unrealized gain (loss)” on the Statements of Operations:
| | | | | | | | | | | | | | |
|
| Dynamic Emerging Markets Debt | |
| Risk | | Statements of Operations | | Net
Realized
Gain (Loss) | | | Net Change in
Unrealized
Gain (Loss) | | | Average
Number of
Contracts(a) | |
| Interest rate | | Net realized gain (loss) from futures contracts and swap contracts/Net change in
unrealized gain (loss) on futures contracts and swap contracts | | $ | (58,600 | ) | | $ | 34,197 | | | | 82 | |
| Credit | | Net realized gain (loss) from swap contracts/Net change in unrealized gain (loss) on
swap contracts | | | (4,550 | ) | | | 5,702 | | | | 40 | |
| Currency | | Net realized gain (loss) from forward foreign currency exchange contracts/Net change in
unrealized gain (loss) on forward foreign currency exchange contracts | | | (24,812 | ) | | | (109,594 | ) | | | 230 | |
| Total | | | | $ | (87,962 | ) | | $ | (69,695 | ) | | | 352 | |
|
| Emerging Markets Debt | |
| Risk | | Statements of Operations | | Net
Realized
Gain (Loss) | | | Net Change in
Unrealized
Gain (Loss) | | | Average
Number of
Contracts(a) | |
| Interest rate | | Net realized gain (loss) from futures contracts and swap contracts/Net change in
unrealized gain (loss) on futures contracts and swap contracts | | $ | (258,420 | ) | | $ | 6,042,284 | | | | 2,636 | |
| Credit | | Net realized gain (loss) from swap contracts/Net change in unrealized gain (loss) on
swap contracts | | | (651,787 | ) | | | 1,072,474 | | | | 37 | |
| Currency | | Net realized gain (loss) from forward foreign currency exchange contracts/Net change in
unrealized gain (loss) on forward foreign currency exchange contracts | | | 900,388 | | | | 1,797,064 | | | | 169 | |
| Total | | | | $ | (9,819 | ) | | $ | 8,911,822 | | | | 2,842 | |
|
| High Yield | |
| Risk | | Statements of Operations | | Net
Realized
Gain (Loss) | | | Net Change in
Unrealized
Gain (Loss) | | | Average
Number of
Contracts(a) | |
| Interest rate | | Net realized gain (loss) from futures contracts and swap contracts/Net change in
unrealized gain (loss) on futures contracts and swap contracts | | $ | (1,006,373 | ) | | $ | 1,880,479 | | | | 5,308 | |
| Credit | | Net realized gain (loss) from swap contracts/Net change in unrealized gain (loss) on
swap contracts | | | (621,210 | ) | | | — | | | | 1 | |
| Currency | | Net realized gain (loss) from forward foreign currency exchange contracts/Net change in
unrealized gain (loss) on forward foreign currency exchange contracts | | | 1,051,703 | | | | (1,248,256 | ) | | | 4 | |
| Total | | | | $ | (575,880 | ) | | $ | 632,223 | | | | 5,313 | |
158
GOLDMAN SACHS SINGLE SECTOR FIXED INCOME FUNDS
|
| 4. INVESTMENTS IN DERIVATIVES (continued) |
| | | | | | | | | | | | | | |
|
| High Yield Floating Rate | |
| Risk | | Statements of Operations | | Net
Realized
Gain (Loss) | | | Net Change in
Unrealized
Gain (Loss) | | | Average
Number of
Contracts(a) | |
| Interest rate | | Net realized gain (loss) from swap contracts/Net change in unrealized gain (loss) on
swap contracts | | $ | (1,597,008 | ) | | $ | 330,099 | | | | 2 | |
| Currency | | Net realized gain (loss) from forward foreign currency exchange contracts/Net change in
unrealized gain (loss) on forward foreign currency exchange contracts | | | (1,054,497 | ) | | | (773,038 | ) | | | 4 | |
| Total | | | | $ | (2,651,505 | ) | | $ | (442,939 | ) | | | 6 | |
|
| Investment Grade Credit | |
| Risk | | Statements of Operations | | Net
Realized
Gain (Loss) | | | Net Change in
Unrealized
Gain (Loss) | | | Average
Number of
Contracts(a) | |
| Interest rate | | Net realized gain (loss) from investments, futures contracts and swap contracts/Net change in unrealized gain (loss) on investments, futures contracts and swap contracts | | $ | 1,014,040 | | | $ | (1,413,797 | ) | | | 643 | |
| Credit | | Net realized gain (loss) from swap contracts/Net change in unrealized gain (loss) on
swap contracts | | | 171 | | | | (1,135 | ) | | | 1 | |
| Total | | | | $ | 1,014,211 | | | $ | (1,414,932 | ) | | | 644 | |
| | | | | | | | | | | | | | |
|
| Local Emerging Markets Debt | |
| Risk | | Statements of Operations | | Net
Realized
Gain (Loss) | | | Net Change in
Unrealized
Gain (Loss) | | | Average
Number of
Contracts(a) | |
| Interest rate | | Net realized gain (loss) from swap contracts/Net change in unrealized gain (loss) on swap contracts | | $ | (5,418,667 | ) | | $ | 4,677,176 | | | | 822 | |
| Credit | | Net realized gain (loss) from swap contracts/Net change in unrealized gain (loss) on
swap contracts | | | (424,560 | ) | | | 789,917 | | | | 40 | |
| Currency | | Net realized gain (loss) from forward foreign currency exchange contracts/Net change in
unrealized gain (loss) on forward foreign currency exchange contracts | | | 347,001 | | | | (7,544,703 | ) | | | 231 | |
| Total | | | | $ | (5,496,226 | ) | | $ | (2,077,610 | ) | | | 1,093 | |
|
| U.S. Mortgages | |
| Risk | | Statements of Operations | | Net
Realized
Gain (Loss) | | | Net Change in
Unrealized
Gain (Loss) | | | Average
Number of
Contracts(a) | |
| Interest rate | | Net realized gain (loss) from investments, futures contracts, swap contracts and written options/Net change in unrealized gain (loss) on futures contracts and swap contracts | | $ | 817,679 | | | $ | 204,385 | | | | 154 | |
| Credit | | Net realized gain (loss) from swap contracts/Net change in unrealized gain (loss) on
swap contracts | | | 48,067 | | | | (274,106 | ) | | | 2 | |
| Currency | | Net realized gain (loss) from forward foreign currency exchange contracts/Net change in
unrealized gain (loss) on forward foreign currency exchange contracts | | | (126,530 | ) | | | — | | | | 1 | |
| Total | | | | $ | 739,216 | | | $ | (69,721 | ) | | | 157 | |
| (a) | | Average number of contracts is based on the average of month end balances for the six months ended September 30, 2015. |
159
GOLDMAN SACHS SINGLE SECTOR FIXED INCOME FUNDS
Notes to Financial Statements (continued)
September 30, 2015 (Unaudited)
|
| 4. INVESTMENTS IN DERIVATIVES (continued) |
In order to better define its contractual rights and to secure rights that will help a Fund mitigate its counterparty risk, a Fund may enter into an International Swaps and Derivatives Association, Inc. Master Agreement (“ISDA Master Agreement”) or similar agreement with its derivatives counterparties. An ISDA Master Agreement is a bilateral agreement between a Fund and a counterparty that governs OTC derivatives, (including forward foreign currency exchange contracts, and certain options and swaps) and typically contains, among other things, collateral posting terms and netting provisions in the event of a default and/or termination event. The provisions of the ISDA Master Agreement typically permit a single net payment in the event of a default (close-out netting) or similar event, including the bankruptcy or insolvency of the counterparty.
Collateral and margin requirements differ between exchange traded derivatives and OTC derivatives. Margin requirements are established by the broker or clearing house for exchange-traded and centrally cleared derivatives (financial futures contracts, options and centrally cleared swaps) pursuant to governing agreements for those instrument types. Brokers can ask for margin in excess of the minimum in certain circumstances. Collateral terms are contract-specific for OTC derivatives. For derivatives traded under an ISDA Master Agreement, the collateral requirements are typically calculated by netting the marked to market amount for each transaction under such agreement and comparing that amount to the value of any collateral currently pledged by a Fund and the counterparty. Additionally, a Fund may be required to post initial margin to the counterparty, the terms of which would be outlined in the confirmation of the OTC transaction.
For financial reporting purposes, cash collateral that has been pledged to cover obligations of a Fund and cash collateral received from the counterparty, if any, is reported separately on the Statements of Assets and Liabilities as receivables/payables for collateral on certain derivative contracts. Non-cash collateral pledged by a Fund, if any, is noted in the Schedules of Investments. Generally, the amount of collateral due from or to a counterparty must exceed a minimum transfer amount threshold before a transfer is required to be made. To the extent amounts due to a Fund from its counterparties are not fully collateralized, contractually or otherwise, the Fund bears the risk of loss from counterparty nonperformance. A Fund attempts to mitigate counterparty risk by only entering into agreements with counterparties that it believes to be of good standing and by monitoring the financial stability of those counterparties.
Additionally, the netting of assets and liabilities and the offsetting of collateral pledged or received are based on contractual netting/set-off provisions in the ISDA Master Agreement or similar agreements. However, in the event of a default or insolvency of a counterparty, a court could determine that such rights are not enforceable due the restrictions or prohibitions against the right of setoff that may be imposed due to a particular jurisdiction’s bankruptcy or insolvency laws.
The following tables set forth the Funds’ net exposure for derivative instruments that are subject to enforceable master netting arrangements or similar agreements as of September 30, 2015:
| | | | | | | | | | | | | | | | | | | | | | | | | | | | | | | | | | | | |
|
| Dynamic Emerging Markets Debt Fund | |
| | | Derivative Assets(1) | | | Derivative Liabilities(1) | | | Net Derivative
Asset
(Liabilities) | | | Collateral
(Received)
Pledged(1) | | | Net
Amount(2) | |
| Counterparty | | Swaps | | | Forward
Currency
Contracts | | | Total | | | Swaps | | | Forward
Currency
Contracts | | | Total | | | | |
Bank of America Securities LLC | | $ | 1,725 | | | $ | 3,706 | | | $ | 5,431 | | | $ | (10,792 | ) | | $ | (2,497 | ) | | $ | (13,289 | ) | | $ | (7,858 | ) | | $ | — | | | $ | (7,858 | ) |
Barclays Bank PLC | | | — | | | | 6,215 | | | | 6,215 | | | | (8,820 | ) | | | (7,358 | ) | | | (16,178 | ) | | | (9,963 | ) | | | — | | | | (9,963 | ) |
BNP Paribas SA | | | — | | | | 9,419 | | | | 9,419 | | | | — | | | | (2,830 | ) | | | (2,830 | ) | | | 6,589 | | | | — | | | | 6,589 | |
Citibank NA | | | 5,040 | | | | 832 | | | | 5,872 | | | | (13,730 | ) | | | (55,141 | ) | | | (68,871 | ) | | | (62,999 | ) | | | — | | | | (62,999 | ) |
Credit Suisse International (London) | | | 900 | | | | 28,700 | | | | 29,600 | | | | (12,638 | ) | | | (2,475 | ) | | | (15,113 | ) | | | 14,487 | | | | — | | | | 14,487 | |
Deutsche Bank AG | | | 23,584 | | | | 29,965 | * | | | 53,549 | | | | (48,322 | ) | | | (64,574 | )* | | | (112,896 | ) | | | (59,347 | ) | | | — | | | | (59,347 | ) |
HSBC Bank PLC | | | — | | | | 5,293 | | | | 5,293 | | | | — | | | | (34,809 | ) | | | (34,809 | ) | | | (29,516 | ) | | | — | | | | (29,516 | ) |
HSBC Securities, Inc. | | | — | | | | — | | | | — | | | | — | | | | (1,280 | ) | | | (1,280 | ) | | | (1,280 | ) | | | — | | | | (1,280 | ) |
JPMorgan Securities, Inc. | | | 15,750 | | | | 52,344 | | | | 68,094 | | | | (3,114 | ) | | | (3,218 | ) | | | (6,332 | ) | | | 61,762 | | | | — | | | | 61,762 | |
160
GOLDMAN SACHS SINGLE SECTOR FIXED INCOME FUNDS
|
| 4. INVESTMENTS IN DERIVATIVES (continued) |
| | | | | | | | | | | | | | | | | | | | | | | | | | | | | | | | | | | | |
|
| Dynamic Emerging Markets Debt Fund (continued) | |
| | | Derivative Assets(1) | | | Derivative Liabilities(1) | | | Net Derivative
Asset
(Liabilities) | | | Collateral
(Received)
Pledged(1) | | | Net
Amount(2) | |
| Counterparty | | Swaps | | | Forward
Currency
Contracts | | | Total | | | Swaps | | | Forward
Currency
Contracts | | | Total | | | | |
Morgan Stanley & Co. | | $ | — | | | $ | 5,189 | | | $ | 5,189 | | | $ | — | | | $ | (48,316 | ) | | $ | (48,316 | ) | | $ | (43,127 | ) | | $ | — | | | $ | (43,127 | ) |
Morgan Stanley & Co. International PLC | | | 6,149 | | | | — | | | | 6,149 | | | | (4,604 | ) | | | — | | | | (4,604 | ) | | | 1,545 | | | | — | | | | 1,545 | |
Royal Bank of Canada | | | — | | | | 25,576 | | | | 25,576 | | | | — | | | | (2,561 | ) | | | (2,561 | ) | | | 23,015 | | | | — | | | | 23,015 | |
Royal Bank of Scotland PLC | | | — | | | | 2,993 | | | | 2,993 | | | | — | | | | (104,437 | ) | | | (104,437 | ) | | | (101,444 | ) | | | — | | | | (101,444 | ) |
Standard Chartered Bank | | | — | | | | 41,893 | | | | 41,893 | | | | — | | | | (25,069 | ) | | | (25,069 | ) | | | 16,824 | | | | — | | | | 16,824 | |
UBS AG (London) | | | — | | | | 12,772 | | | | 12,772 | | | | — | | | | (13,055 | ) | | | (13,055 | ) | | | (283 | ) | | | — | | | | (283 | ) |
Westpac Banking Corp. | | | — | | | | 16,254 | | | | 16,254 | | | | — | | | | (47,811 | ) | | | (47,811 | ) | | | (31,557 | ) | | | — | | | | (31,557 | ) |
Total | | $ | 53,148 | | | $ | 241,151 | | | $ | 294,299 | | | $ | (102,020 | ) | | $ | (415,431 | ) | | $ | (517,451 | ) | | $ | (223,152 | ) | | $ | — | | | $ | (223,152 | ) |
| * | | Includes Non-Deliverable Bond Forward Contracts assets of $1,022 and liabilities of $0. |
| (1) | | Gross amounts available for offset but not netted in the Statement of Assets and Liabilities. |
| (2) | | Net amount represents the net amount due (to) from counterparty in the event of a default based on the contractual set-off rights under the agreement. Net amount excludes any over-collateralized amounts. |
| | | | | | | | | | | | | | | | | | | | | | | | | | | | | | | | | | | | |
|
| Emerging Markets Debt Fund | |
| | | Derivative Assets(1) | | | Derivative Liabilities(1) | | | | | | | | | | |
| Counterparty | | Swaps | | | Forward
Currency
Contracts | | | Total | | | Swaps | | | Forward
Currency
Contracts | | | Total | | | Net Derivative
Asset (Liabilities) | | | Collateral
(Received) Pledged(1) | | | Net Amount(2) | |
Bank of America Securities LLC | | $ | 238,711 | | | $ | 1,932,726 | | | $ | 2,171,437 | | | $ | (265,174 | ) | | $ | (229,494 | ) | | $ | (494,668 | ) | | $ | 1,676,769 | | | $ | — | | | $ | 1,676,769 | |
Barclays Bank PLC | | | 139,955 | | | | 183,488 | | | | 323,443 | | | | (482,364 | ) | | | (256,955 | ) | | | (739,319 | ) | | | (415,876 | ) | | | 415,876 | | | | — | |
BNP Paribas SA | | | — | | | | 8,813 | | | | 8,813 | | | | — | | | | (21,954 | ) | | | (21,954 | ) | | | (13,141 | ) | | | — | | | | (13,141 | ) |
Citibank NA | | | 727,970 | | | | 430,466 | | | | 1,158,436 | | | | (268,945 | ) | | | (112,086 | ) | | | (381,031 | ) | | | 777,405 | | | | — | | | | 777,405 | |
Credit Suisse International (London) | | | — | | | | 16,312 | | | | 16,312 | | | | — | | | | (54,453 | ) | | | (54,453 | ) | | | (38,141 | ) | | | — | | | | (38,141 | ) |
Deutsche Bank AG | | | 543,072 | | | | 374,762 | | | | 917,834 | | | | (402,854 | ) | | | (219,078 | ) | | | (621,932 | ) | | | 295,902 | | | | — | | | | 295,902 | |
HSBC Bank PLC | | | — | | | | 179,312 | | | | 179,312 | | | | — | | | | (101,571 | ) | | | (101,571 | ) | | | 77,741 | | | | — | | | | 77,741 | |
HSBC Securities, Inc. | | | — | | | | — | | | | — | | | | — | | | | (41,763 | ) | | | (41,763 | ) | | | (41,763 | ) | | | — | | | | (41,763 | ) |
JPMorgan Securities, Inc. | | | 817,626 | | | | 328,540 | | | | 1,146,166 | | | | (678,221 | ) | | | (359,917 | ) | | | (1,038,138 | ) | | | 108,028 | | | | — | | | | 108,028 | |
Morgan Stanley & Co. | | | — | | | | 301,051 | | | | 301,051 | | | | — | | | | (239,486 | ) | | | (239,486 | ) | | | 61,565 | | | | — | | | | 61,565 | |
Morgan Stanley & Co. International PLC | | | 217,587 | | | | — | | | | 217,587 | | | | (1,629,199 | ) | | | — | | | | (1,629,199 | ) | | | (1,411,612 | ) | | | 1,180,000 | | | | (231,612 | ) |
Royal Bank of Canada | | | — | | | | 2,924,335 | | | | 2,924,335 | | | | — | | | | (99,373 | ) | | | (99,373 | ) | | | 2,824,962 | | | | — | | | | 2,824,962 | |
Royal Bank of Scotland PLC | | | — | | | | 82,965 | | | | 82,965 | | | | — | | | | (203,225 | ) | | | (203,225 | ) | | | (120,260 | ) | | | — | | | | (120,260 | ) |
Standard Chartered Bank | | | — | | | | 152,510 | | | | 152,510 | | | | — | | | | (199,344 | ) | | | (199,344 | ) | | | (46,834 | ) | | | — | | | | (46,834 | ) |
State Street Bank and Trust | | | — | | | | 1,970,843 | | | | 1,970,843 | | | | — | | | | (1,876 | ) | | | (1,876 | ) | | | 1,968,967 | | | | — | | | | 1,968,967 | |
UBS AG (London) | | | — | | | | 153,928 | | | | 153,928 | | | | — | | | | (275,035 | ) | | | (275,035 | ) | | | (121,107 | ) | | | — | | | | (121,107 | ) |
Westpac Banking Corp. | | | — | | | | 420,797 | | | | 420,797 | | | | — | | | | (167,249 | ) | | | (167,249 | ) | | | 253,548 | | | | — | | | | 253,548 | |
Total | | $ | 2,684,921 | | | $ | 9,460,848 | | | $ | 12,145,769 | | | $ | (3,726,757 | ) | | $ | (2,582,859 | ) | | $ | (6,309,616 | ) | | $ | 5,836,153 | | | $ | 1,595,876 | | | $ | 7,432,029 | |
| (1) | | Gross amounts available for offset but not netted in the Statement of Assets and Liabilities. |
| (2) | | Net amount represents the net amount due (to) from counterparty in the event of a default based on the contractual set-off rights under the agreement. Net amount excludes any over-collateralized amounts. |
161
GOLDMAN SACHS SINGLE SECTOR FIXED INCOME FUNDS
Notes to Financial Statements (continued)
September 30, 2015 (Unaudited)
|
| 4. INVESTMENTS IN DERIVATIVES (continued) |
| | | | | | | | | | | | | | | | | | | | | | | | | | | | | | | | | | | | |
|
| Local Emerging Markets Debt Fund | |
| | | Derivative Assets(1) | | | Derivative Liabilities(1) | | | | | | | | | | |
| Counterparty | | Swaps | | | Forward
Currency
Contracts | | | Total | | | Swaps | | | Forward
Currency
Contracts | | | Total | | | Net Derivative
Asset
(Liabilities) | | | Collateral
(Received)
Pledged(1) | | | Net
Amount(2) | |
Bank of America Securities LLC | | $ | 397,226 | | | $ | — | | | $ | 397,226 | | | $ | (1,496,550 | ) | | $ | (459,050 | )* | | $ | (1,955,600 | ) | | $ | (1,558,374 | ) | | $ | — | | | $ | (1,558,374 | ) |
Barclays Bank PLC | | | 390,722 | | | | 498,192 | | | | 888,914 | | | | (3,971,166 | ) | | | (506,290 | ) | | | (4,477,456 | ) | | | (3,588,542 | ) | | | — | | | | (3,588,542 | ) |
BNP Paribas SA | | | — | | | | 207,037 | | | | 207,037 | | | | — | | | | (297,807 | ) | | | (297,807 | ) | | | (90,770 | ) | | | — | | | | (90,770 | ) |
Citibank NA | | | 2,575,883 | | | | 63,965 | | | | 2,639,848 | | | | (3,841,549 | ) | | | (216,609 | ) | | | (4,058,158 | ) | | | (1,418,310 | ) | | | — | | | | (1,418,310 | ) |
Credit Suisse International (London) | | | 299,092 | | | | 4,685,718 | | | | 4,984,810 | | | | (1,248,888 | ) | | | (147,320 | ) | | | (1,396,208 | ) | | | 3,588,602 | | | | — | | | | 3,588,602 | |
Deutsche Bank AG | | | 3,331,395 | | | | 1,167,976 | * | | | 4,499,371 | | | | (13,328,888 | ) | | | (2,192,449 | ) | | | (15,521,337 | ) | | | (11,021,966 | ) | | | — | | | | (11,021,966 | ) |
HSBC Bank PLC | | | — | | | | 312,803 | | | | 312,803 | | | | — | | | | (1,190,746 | )* | | | (1,190,746 | ) | | | (877,943 | ) | | | — | | | | (877,943 | ) |
HSBC Securities, Inc. | | | — | | | | — | | | | — | | | | — | | | | (88,404 | ) | | | (88,404 | ) | | | (88,404 | ) | | | — | | | | (88,404 | ) |
JPMorgan Chase Bank NA | | | — | | | | 925,600 | | | | 925,600 | | | | — | | | | — | | | | — | | | | 925,600 | | | | — | | | | 925,600 | |
JPMorgan Securities, Inc. | | | 7,752,928 | | | | — | | | | 7,752,928 | | | | (1,668,494 | ) | | | (740,807 | ) | | | (2,409,301 | ) | | | 5,343,627 | | | | — | | | | 5,343,627 | |
Morgan Stanley & Co. | | | — | | | | 633,358 | | | | 633,358 | | | | — | | | | (554,166 | ) | | | (554,166 | ) | | | 79,192 | | | | — | | | | 79,192 | |
Morgan Stanley & Co. International PLC | | | 1,746,250 | | | | — | | | | 1,746,250 | | | | (4,483,881 | ) | | | — | | | | (4,483,881 | ) | | | (2,737,631 | ) | | | — | | | | (2,737,631 | ) |
Royal Bank of Canada | | | — | | | | 3,916,244 | | | | 3,916,244 | | | | — | | | | (190,151 | ) | | | (190,151 | ) | | | 3,726,093 | | | | — | | | | 3,726,093 | |
Royal Bank of Scotland PLC | | | — | | | | 344,250 | | | | 344,250 | | | | — | | | | (570,092 | ) | | | (570,092 | ) | | | (225,842 | ) | | | — | | | | (225,842 | ) |
Standard Chartered Bank | | | — | | | | 741,004 | | | | 741,004 | | | | — | | | | (425,482 | ) | | | (425,482 | ) | | | 315,522 | | | | — | | | | 315,522 | |
State Street Bank and Trust | | | — | | | | — | | | | — | | | | — | | | | (4,232 | ) | | | (4,232 | ) | | | (4,232 | ) | | | — | | | | (4,232 | ) |
UBS AG (London) | | | — | | | | 302,764 | | | | 302,764 | | | | — | | | | (512,565 | ) | | | (512,565 | ) | | | (209,801 | ) | | | — | | | | (209,801 | ) |
Westpac Banking Corp. | | | — | | | | 619,827 | | | | 619,827 | | | | — | | | | (5,057,460 | ) | | | (5,057,460 | ) | | | (4,437,633 | ) | | | — | | | | (4,437,633 | ) |
Total | | $ | 16,493,496 | | | $ | 14,418,738 | | | $ | 30,912,234 | | | $ | (30,039,416 | ) | | $ | (13,153,630 | ) | | $ | (43,193,046 | ) | | $ | (12,280,812 | ) | | $ | — | | | $ | (12,280,812 | ) |
| * | | Includes Non-Deliverable Bond Forward Contracts assets of $83,535 and liabilities of $81,763. |
| (1) | | Gross amounts available for offset but not netted in the Statement of Assets and Liabilities. |
| (2) | | Net amount represents the net amount due (to) from counterparty in the event of a default based on the contractual set-off rights under the agreement. Net amount excludes any over-collateralized amounts. |
|
| 5. AGREEMENTS AND AFFILIATED TRANSACTIONS |
A. Management Agreement — Under the Agreement, GSAM manages the Funds, subject to the general supervision of the Trustees.
As compensation for the services rendered pursuant to the Agreement, the assumption of the expenses related thereto and administration of the Funds’ business affairs, including providing facilities, GSAM is entitled to a management fee, accrued daily and paid monthly, equal to an annual percentage rate of each Fund’s average daily net assets.
162
GOLDMAN SACHS SINGLE SECTOR FIXED INCOME FUNDS
|
| 5. AGREEMENTS AND AFFILIATED TRANSACTIONS (continued) |
For the six months ended September 30, 2015, contractual and effective net management fees with GSAM were at the following rates:
| | | | | | | | | | | | | | | | | | | | | | | | | | | | | | |
| | | | | Contractual Management Rate | | | Effective Net
Management
Rate^ | |
| Fund | | | | First
$1 Billion | | | Next
$1 Billion | | | Next
$3 Billion | | | Next
$3 Billion | | | Over
$8 Billion | | | Effective
Rate | | |
Dynamic Emerging Markets Debt | | | | | 0.90 | % | | | 0.90 | % | | | 0.81 | % | | | 0.77 | % | | | 0.75 | % | | | 0.90 | % | | | 0.80 | %# |
Emerging Markets Debt | | | | | 0.80 | | | | 0.80 | | | | 0.72 | | | | 0.68 | | | | 0.67 | | | | 0.80 | | | | 0.80 | |
High Yield | | | | | 0.70 | | | | 0.70 | | | | 0.63 | | | | 0.60 | | | | 0.59 | | | | 0.65 | | | | 0.65 | |
High Yield Floating Rate | | | | | 0.60 | | | | 0.54 | | | | 0.51 | | | | 0.50 | | | | 0.49 | | | | 0.55 | | | | 0.54 | |
Investment Grade Credit | | | | | 0.40 | | | | 0.36 | | | | 0.34 | | | | 0.33 | | | | 0.32 | | | | 0.40 | | | | 0.34 | # |
Local Emerging Markets Debt | | | | | 0.90 | | | | 0.90 | | | | 0.81 | | | | 0.77 | | | | 0.75 | | | | 0.90 | | | | 0.80 | # |
U.S. Mortgages | | | | | 0.40 | | | | 0.36 | | | | 0.34 | | | | 0.33 | | | | 0.32 | | | | 0.40 | | | | 0.34 | # |
| # | | GSAM has agreed to waive a portion of its management fee in order to achieve the effective net management fee rates shown above through at least July 29, 2016 for the Dynamic Emerging Markets Debt, Investment Grade Credit, Local Emerging Markets Debt and U.S. Mortgages Funds. Prior to such date GSAM may not terminate the arrangements without the approval of the Trustees. Where the application of the above contractual management fee breakpoint schedule of a Fund would result in a lower management fee rate, the breakpoint schedule will be applied to the Fund’s assets. |
| ^ | | Effective Net Management Rate includes the impact of management fee waivers of affiliated underlying funds, if any. |
The High Yield, High Yield Floating Rate, Investment Grade Credit, Local Emerging Markets Debt and U.S. Mortgages Funds invest in the Institutional Shares of the Goldman Sachs Financial Square Government Fund. This Underlying Fund is considered to be affiliated with the Funds. GSAM has contractually agreed to waive irrevocably a portion of any underlying fund’s management fee in an amount equal to the management fee paid to GSAM due to the Funds’ investment in an affiliated fund for which it also serves as investment advisor. For the six months ended September 30, 2015, GSAM waived $17,396, $345,131, $5,009, $28,474 and $34,357, of such Fund’s management fee for the High Yield, High Yield Floating Rate, Investment Grade Credit, Local Emerging Markets Debt and U.S. Mortgages Funds, respectively.
B. Distribution and Service Plans — The Trust, on behalf of each Fund, has adopted Distribution and Service Plans (the “Plans”). Under the Plans, Goldman Sachs, which serves as distributor (the “Distributor”), is entitled to a fee accrued daily and paid monthly, for distribution services and personal and account maintenance services, which may then be paid by Goldman Sachs to authorized dealers, at the following annual rates calculated on a Fund’s average daily net assets of each respective share class:
| | | | | | | | | | | | |
| | | Distribution and Service Plan Rates | |
| | | Class A* | | | Class C | | | Class R* | |
Distribution Plan | | | 0.25 | % | | | 0.75 | % | | | 0.50 | % |
Service Plan | | | — | | | | 0.25 | | | | — | |
| * | | With respect to Class A and Class R Shares, the Distributor at its discretion may use compensation for distribution services paid under the Distribution Plan to compensate service organizations for personal and account maintenance services and expenses as long as such total compensation does not exceed the maximum cap on “service fees” imposed by the Financial Industry Regulatory Authority. |
163
GOLDMAN SACHS SINGLE SECTOR FIXED INCOME FUNDS
Notes to Financial Statements (continued)
September 30, 2015 (Unaudited)
|
| 5. AGREEMENTS AND AFFILIATED TRANSACTIONS (continued) |
C. Distribution Agreement — Goldman Sachs, as Distributor of the shares of the Funds pursuant to a Distribution Agreement, may retain a portion of the Class A Shares front end sales charge and Class C Shares’ CDSC. During the six months ended September 30, 2015, Goldman Sachs advised that it retained the following amounts:
| | | | | | | | | | |
| | | | | Front End
Sales Charge | | | Contingent Deferred
Sales Charge | |
| Fund | | | | Class A | | | Class C | |
Emerging Market Debt | | | | $ | 3,984 | | | $ | 10 | |
High Yield | | | | | 7,700 | | | | 5 | |
High Yield Floating Rate | | | | | 317 | | | | — | |
Investment Grade Credit | | | | | 1,046 | | | | N/A | |
Local Emerging Markets Debt | | | | | 656 | | | | — | |
U.S. Mortgages | | | | | 205 | | | | N/A | |
D. Service Plan and Shareholder Administration Plan — The Trust, on behalf of each Fund that offers Service Shares, has adopted a Service Plan and a Shareholder Administration Plan. These plans allow for service organizations to provide varying levels of personal and account maintenance and shareholder administration services to their customers who are beneficial owners of such shares. The Service Plan and Shareholder Administration Plan each provide for compensation to the service organizations which is accrued daily and paid monthly at an annual rate of 0.25% (0.50% in aggregate) of the average daily net assets of the Service Shares.
E. Transfer Agency Agreement — Goldman Sachs also serves as the transfer agent of the Funds for a fee pursuant to the Transfer Agency Agreement. The fees charged for such transfer agency services are accrued daily and paid monthly at annual rates as follows: 0.13% of the average daily net assets of Class A, Class C, Class IR and Class R Shares; 0.02% of the average daily net assets of Class R6 Shares; and 0.04% of the average daily net assets of Institutional, Separate Account Institutional and Service Shares.
F. Other Expense Agreements and Affiliated Transactions — GSAM has agreed to limit certain “Other Expenses” of the Funds (excluding acquired fund fees and expenses, transfer agency fees and expenses, service fees and shareholder administration
fees (as applicable), taxes, interest, brokerage fees, shareholder meeting, litigation, indemnification and extraordinary expenses) to the extent such expenses exceed, on an annual basis, a percentage rate of the average daily net assets of each Fund. Such Other Expense reimbursements, if any, are accrued daily and paid monthly. In addition, the Funds are not obligated to reimburse GSAM for prior fiscal year expense reimbursements, if any. The Other Expense limitations as an annual percentage rate of average daily net assets for the Dynamic Emerging Markets Debt, Emerging Markets Debt, High Yield, High Yield Floating Rate, Investment Grade Credit, Local Emerging Markets Debt and U.S. Mortgages Funds are 0.054%, 0.054%, 0.024%, 0.104%, 0.004%, 0.074% and 0.074%, respectively. These Other Expense limitations will remain in place through at least July 29, 2016, and prior to such date GSAM may not terminate the arrangements without the approval of the Trustees. In addition, the Funds have entered into certain offset arrangements with the transfer agent, which may result in a reduction of the Funds’ expenses and are received irrespective of the application of the “Other Expense” limitations described above.
164
GOLDMAN SACHS SINGLE SECTOR FIXED INCOME FUNDS
|
| 5. AGREEMENTS AND AFFILIATED TRANSACTIONS (continued) |
For the six months ended September 30, 2015, these expense reductions, including any fee waivers and Other Expense reimbursements, were as follows:
| | | | | | | | | | | | | | |
| Fund | | | | Management
Fees Waivers | | | Other
Expense
Reimbursements | | | Total
Expense
Reductions | |
Dynamic Emerging Markets Debt | | | | $ | 10,502 | | | $ | 211,736 | | | $ | 222,238 | |
Emerging Markets Debt | | | | | — | | | | 162,875 | | | | 162,875 | |
High Yield | | | | | 117,396 | | | | — | | | | 117,396 | |
High Yield Floating Rate | | | | | 345,131 | | | | — | | | | 345,131 | |
Investment Grade Credit | | | | | 135,157 | | | | 163,927 | | | | 299,084 | |
Local Emerging Markets Debt | | | | | 636,457 | | | | 205,791 | | | | 842,248 | |
U.S. Mortgages | | | | | 83,748 | | | | 246,178 | | | | 329,926 | |
G. Line of Credit Facility — As of September 30, 2015, the Funds participated in a $1,205,000,000 committed, unsecured revolving line of credit facility (the “facility”) together with other funds of the Trust and registered investment companies having management agreements with GSAM or its affiliates (“Other Borrowers”). Pursuant to the terms of the facility, the Funds and Other Borrowers could increase the credit amount by up to an additional $115,000,000, for a total of up to $1,320,000,000. This facility is to be used for temporary emergency purposes, or to allow for an orderly liquidation of securities to meet redemption requests. The interest rate on borrowings is based on the federal funds rate. The facility also requires a fee to be paid by the Funds based on the amount of the commitment that has not been utilized. For the six months ended September 30, 2015, the Funds did not have any borrowings under the facility.
H. Other Transactions with Affiliates — For the six months ended September 30, 2015, Goldman Sachs earned $382, $44,955, $59,131, $9,946, $20,449 and $5,192 in brokerage commissions from portfolio transactions, including futures transactions executed with Goldman Sachs as the Futures Commission Merchant on behalf of the Dynamic Emerging Markets Debt, Emerging Markets Debt, High Yield, Investment Grade Credit, Local Emerging Markets Debt and U.S. Mortgages Funds, respectively.
As of September 30, 2015, the Goldman Sachs Satellite Strategies Portfolio was the beneficial owner of 10% and 5% of total outstanding shares of the Emerging Markets Debt and Local Emerging Markets Debt Funds, respectively.
As of September 30, 2015, the Goldman Sachs Group, Inc. was the beneficial owner of 5% or more of outstanding Class C, Institutional, Class IR, Class R and Class R6 Shares of the following Funds:
| | | | | | | | | | | | | | | | | | | | |
| | | Class C | | | Institutional | | | Class IR | | | Class R | | | Class R6 | |
Dynamic Emerging Markets Debt | | | 15 | % | | | 26 | % | | | 100 | % | | | 100 | % | | | — | % |
Emerging Markets Debt | | | — | | | | — | | | | — | | | | — | | | | 100 | |
High Yield | | | — | | | | — | | | | — | | | | — | | | | 99 | |
High Yield Floating Rate | | | — | | | | — | | | | — | | | | 100 | | | | — | |
Investment Grade Credit | | | — | | | | — | | | | — | | | | 100 | | | | — | |
U.S. Mortgages | | | — | | | | — | | | | — | | | | — | | | | 100 | |
165
GOLDMAN SACHS SINGLE SECTOR FIXED INCOME FUNDS
Notes to Financial Statements (continued)
September 30, 2015 (Unaudited)
|
| 5. AGREEMENTS AND AFFILIATED TRANSACTIONS (continued) |
The table below shows the transactions in and earnings from investments in the Underlying Fund for the six months ended September 30, 2015:
| | | | | | | | | | | | | | | | | | | | | | | | | | | | | | |
| Fund | | Underlying Fund | | Market
Value
3/31/15 | | | Purchases
at Cost | | | Proceeds
from Sales | | | Net
Realized
Gain (Loss) | | | Net
Change in
Unrealized
Gain (Loss) | | | Market
Value
9/30/15 | | | Dividend
Income | |
High Yield | | Goldman Sachs Financial Square Government Fund | | $ | 9,991,607 | | | $ | 1,213,877,375 | | | $ | (1,109,520,769 | ) | | $ | — | | | $ | — | | | $ | 114,348,213 | | | $ | 8,716 | |
High Yield Floating Rate | | Goldman Sachs Financial Square Government Fund | | | 343,301,170 | | | | 867,316,288 | | | | (1,007,974,905 | ) | | | — | | | | — | | | | 202,642,553 | | | | 18,180 | |
High Yield Floating Rate | | High Yield Fund | | | 47,234,307 | | | | 662,586 | | | | (47,155,299 | ) | | | (696,892 | ) | | | (21,352 | ) | | | 23,350 | | | | 662,586 | |
Investment Grade Credit | | Goldman Sachs Financial Square Government Fund | | | 1,996,322 | | | | 89,507,269 | | | | (87,755,657 | ) | | | — | | | | — | | | | 3,747,934 | | | | 566 | |
Local Emerging Markets Debt | | Goldman Sachs Financial Square Government Fund | | | 19 | | | | 390,138,360 | | | | (368,483,444 | ) | | | — | | | | — | | | | 21,654,935 | | | | 1,521 | |
U.S. Mortgages | | Goldman Sachs Financial Square Government Fund | | | 82,588,296 | | | | 104,271,345 | | | | (179,694,861 | ) | | | — | | | | — | | | | 7,164,780 | | | | 2,009 | |
166
GOLDMAN SACHS SINGLE SECTOR FIXED INCOME FUNDS
|
| 6. PORTFOLIO SECURITIES TRANSACTIONS |
The cost of purchases and proceeds from sales and maturities of long-term securities for the six months ended September 30, 2015, were as follows:
| | | | | | | | | | | | | | | | | | |
| Fund | | | | Purchases of
U.S. Government and
Agency Obligations | | | Purchased (Excluding
U.S. Government and
Agency Obligations) | | | Sales and
Maturities of
U.S. Government and
Agency Obligations | | | Sales and
Maturities (Excluding
U.S. Government and
Agency Obligations) | |
Dynamic Emerging Markets Debt | | | | $ | 4,106,259 | | | $ | 20,656,302 | | | $ | 3,283,103 | | | $ | 6,162,200 | |
Emerging Markets Debt | | | | | 231,676,046 | | | | 443,765,470 | | | | 381,782,935 | | | | 835,414,697 | |
High Yield | | | | | — | | | | 1,023,475,609 | | | | — | | | | 1,831,006,158 | |
High Yield Floating Rate | | | | | — | | | | 931,959,985 | | | | — | | | | 1,058,996,648 | |
Investment Grade Credit | | | | | 30,799,456 | | | | 122,597,154 | | | | 29,584,589 | | | | 133,769,665 | |
Local Emerging Markets Debt | | | | | 229,411,348 | | | | 336,274,063 | | | | 221,903,968 | | | | 555,188,902 | |
U.S. Mortgages | | | | | 1,733,379,447 | | | | 22,013,868 | | | | 1,703,577,150 | | | | 3,483,909 | |
The table below summarizes the reverse repurchase agreement activity for the six months ended September 30, 2015:
| | | | | | | | | | | | |
| Fund | | Average amount of
borrowings | | | Weighted average
interest rate
(Paid) Received | | | Number of days
outstanding during
the period | |
Emerging Markets Debt | | $ | 9,190,934 | | | | 1.32 | % | | | 19 | |
High Yield | | | 93,930,640 | | | | 0.98 | | | | 35 | |
High Yield Floating Rate | | | 425,137 | | | | 1.21 | | | | 8 | |
Local Emerging Markets Debt | | | 40,441 | | | | 1.53 | | | | 23 | |
The following tables set forth the Funds’ different types of investments pledged as collateral and the remaining contractual maturities of the reverse repurchase agreements as of September 30, 2015:
| | | | | | | | | | | | | | | | | | | | |
|
| Emerging Markets Debt Fund | |
| | | Remaining Contractual Maturity of the Agreements
As of September 30, 2015 | |
| | | Overnight | | | Up to
30 days | | | 30-60 days | | | Greater Than
90 days | | | Total | |
| Reverse Repurchase Agreements | | | | | | | | | | | | | | | | | | | | |
Corporate Obligations | | $ | — | | | $ | — | | | $ | — | | | $ | 2,621,905 | | | $ | 2,621,905 | |
Sovereign Debt Obligations | | | — | | | | — | | | | — | | | | 5,501,900 | | | | 5,501,900 | |
| Total Borrowings | | $ | — | | | $ | — | | | $ | — | | | $ | 8,123,805 | | | $ | 8,123,805 | |
| | | | | |
| High Yield Fund | | | | | | | | | | | | | | | | | | | | |
| | | Remaining Contractual Maturity of the Agreements
As of September 30, 2015 | |
| | | Overnight | | | Up to
30 days | | | 30-60 days | | | Greater Than
90 days | | | Total | |
| Reverse Repurchase Agreements | | | | | | | | | | | | | | | | | | | | |
Corporate Obligations | | $ | — | | | $ | 4,679,000 | | | $ | — | | | $ | 114,396,938 | | | $ | 119,075,938 | |
| Total Borrowings | | $ | — | | | $ | 4,679,000 | | | $ | — | | | $ | 114,396,938 | | | $ | 119,075,938 | |
167
GOLDMAN SACHS SINGLE SECTOR FIXED INCOME FUNDS
Notes to Financial Statements (continued)
September 30, 2015 (Unaudited)
|
| 6. PORTFOLIO SECURITIES TRANSACTIONS (continued) |
| | | | | | | | | | | | | | | | | | | | |
| | | | | |
| High Yield Floating Rate Fund | | | | | | | | | | | | | | | | | | | | |
| | | Remaining Contractual Maturity of the Agreements
As of September 30, 2015 | |
| | | Overnight | | | Up to
30 days | | | 30-60 days | | | Greater Than
90 days | | | Total | |
| Reverse Repurchase Agreements | | | | | | | | | | | | | | | | | | | | |
Corporate Obligations | | $ | — | | | $ | — | | | $ | — | | | $ | 4,500,000 | | | $ | 4,500,000 | |
| Total Borrowings | | $ | — | | | $ | — | | | $ | — | | | $ | 4,500,000 | | | $ | 4,500,000 | |
| | | | | |
| Local Emerging Markets Debt Fund | | | | | | | | | | | | | | | | | | | | |
| | | Remaining Contractual Maturity of the Agreements
As of September 30, 2015 | |
| | | Overnight | | | Up to
30 days | | | 30-60 days | | | Greater Than
90 days | | | Total | |
| Reverse Repurchase Agreements | | | | | | | | | | | | | | | | | | | | |
Sovereign Debt Obligations | | $ | — | | | $ | — | | | $ | — | | | $ | 154,438 | | | $ | 154,438 | |
| Total Borrowings | | $ | — | | | $ | — | | | $ | — | | | $ | 154,438 | | | $ | 154,438 | |
As the Fund’s most recent fiscal year ended March 31,2015, the Fund’s timing differences, on tax basis were as follows:
| | | | | | | | | | | | | | | | | | | | | | | | | | | | |
| | | Dynamic
Emerging
Markets Debt | | | Emerging
Markets Debt | | | High Yield | | | High Yield
Floating Rate | | | Investment
Grade
Credit | | | Local
Emerging
Markets Debt | | | U.S.
Mortgages | |
Capital loss carryforwards: | | | | | | | | | | | | | | | | | | | | | | | | | | | | |
Perpetual Short-Term | | $ | — | | | $ | (8,640,181 | ) | | $ | — | | | $ | (9,846,677 | ) | | $ | — | | | $ | (61,512,159 | ) | | $ | (2,122,943 | ) |
Perpetual Long-Term | | | (57,537 | ) | | | (348,847 | ) | | | — | | | | (2,603,172 | ) | | | — | | | | (15,656,599 | ) | | | — | |
Total capital loss carryforwards | | $ | (57,537 | ) | | $ | (8,989,028 | ) | | $ | — | | | $ | (12,449,849 | ) | | $ | — | | | $ | (77,168,758 | ) | | $ | (2,122,943 | ) |
Timing differences (Qualified Late Year Loss Deferral, Straddle Loss Deferral, Distributions Payable) | | $ | (1,601,352 | ) | | $ | (2,167,235 | ) | | $ | (16,477,166 | ) | | $ | (21,547,317 | ) | | $ | (207,357 | ) | | $ | (96,299,862 | ) | | $ | (106,411 | ) |
As of September 30,2015, the Fund’s aggregate security unrealized gains and losses based on cost for U.S. federal income tax purposes were as follows:
| | | | | | | | | | | | | | | | | | | | | | | | | | | | |
| | | Dynamic
Emerging
Markets Debt | | | Emerging
Markets Debt | | | High Yield | | | High Yield
Floating Rate | | | Investment
Grade Credit | | | Local
Emerging
Markets Debt | | | U.S.
Mortgages | |
Tax Cost | | $ | 37,727,878 | | | $ | 1,130,947,131 | | | $ | 4,847,193,898 | | | $ | 3,903,208,055 | | | $ | 427,004,011 | | | $ | 1,339,724,305 | | | $ | 343,034,298 | |
Gross unrealized gain | | | 98,890 | | | | 8,538,775 | | | | 37,447,996 | | | | 4,874,879 | | | | 8,900,918 | | | | 2,233,450 | | | | 4,358,964 | |
Gross unrealized loss | | | (2,918,382 | ) | | | (104,795,537 | ) | | | (417,426,471 | ) | | | (152,024,358 | ) | | | (11,377,751 | ) | | | (382,746,660 | ) | | | (2,473,818 | ) |
Net unrealized gains (losses) | | $ | (2,819,492 | ) | | $ | (96,256,762 | ) | | $ | (379,978,475 | ) | | $ | (147,149,479 | ) | | $ | (2,476,833 | ) | | $ | (380,513,210 | ) | | $ | 1,885,146 | |
168
GOLDMAN SACHS SINGLE SECTOR FIXED INCOME FUNDS
|
| 7. TAX INFORMATION (continued) |
The difference between GAAP-basis and tax-basis unrealized gains (losses) is attributable primarily to wash sales, differences related to the tax treatment of inflation protected securities, underlying fund investments, swap transactions, and material modification of debt securities.
GSAM has reviewed the Funds’ tax provisions for all open tax years (the current and prior three years, as applicable) and has concluded that no provision for income tax is required in the Funds’ financial statements. Such open tax years remain subject to examination and adjustment by tax authorities.
The Funds’ risks include, but are not limited to, the following:
Foreign Custody Risk — A Fund that invests in foreign securities may hold such securities and cash with foreign banks, agents, and securities depositories appointed by the Fund’s custodian (each a “Foreign Custodian”). Some foreign custodians may be recently organized or new to the foreign custody business. In some countries, Foreign Custodians may be subject to little or no regulatory oversight over or independent evaluation of their operations. Further, the laws of certain countries may place limitations on a Fund’s ability to recover its assets if a Foreign Custodian enters bankruptcy. Investments in emerging markets may be subject to even greater custody risks than investments in more developed markets. Custody services in emerging market countries are very often undeveloped and may be considerably less well regulated than in more developed countries, and thus may not afford the same level of investor protection as would apply in developed countries.
Large Shareholder Transactions Risk — A Fund may experience adverse effects when certain large shareholders, such as other funds, institutional investors (including those trading by use of non-discretionary mathematical formulas), financial intermediaries (who may make investment decisions on behalf of underlying clients and/or include a Fund in their investment model), individuals, accounts and Goldman Sachs affiliates, purchase or redeem large amounts of shares of a Fund. Such large shareholder redemptions may cause the Fund to sell portfolio securities at times when it would not otherwise do so, which may negatively impact a Fund’s NAV and liquidity. These transactions may also accelerate the realization of taxable income to shareholders if such sales of investments resulted in gains, and may also increase transaction costs. In addition, a large redemption could result in a Fund’s current expenses being allocated over a smaller asset base, leading to an increase in the Fund’s expense ratio. Similarly, large Fund share purchases may adversely affect a Fund’s performance to the extent that a Fund is delayed in investing new cash and, as a result, maintains a larger cash position than it ordinarily would.
Leverage Risk — Leverage creates exposure to potential gains and losses in excess of the initial amount invested. Borrowings and the use of derivatives may result in leverage and may make the Funds more volatile. When the Funds use leverage, the sum of each Fund’s investment exposure may significantly exceed the amount of assets invested in each Fund, although these exposures may vary over time. Relatively small market movements may result in large changes in the value of a leveraged investment. Each Fund will identify liquid assets on its books or otherwise cover transactions that may give rise to such risk, to the extent required by applicable law. The use of leverage may cause the Funds to liquidate portfolio positions to satisfy their obligations or to meet segregation requirements when it may not be advantageous to do so. The use of leverage by each Fund can substantially increase the adverse impact to which each Fund’s investment portfolio may be subject.
Interest Rate Risk — When interest rates increase, fixed income securities or instruments held by the Fund will generally decline in value. Long-term fixed income securities or instruments will normally have more price volatility because of this risk than short-term fixed income securities or instruments.
Investments in Other Investment Companies — As a shareholder of another investment company, including an exchange-traded fund (“ETF”), a Fund will directly bear its proportionate share of any net management fees and other expenses paid by such other investment companies, in addition to the fees and expenses regularly borne by the Fund. ETFs are subject to risks that do not apply to conventional mutual funds, including but not limited to the following: (i) the market price of the ETF’s shares may trade at a premium or a discount to their NAV; and (ii) an active trading market for an ETF’s shares may not develop or be maintained.
169
GOLDMAN SACHS SINGLE SECTOR FIXED INCOME FUNDS
Notes to Financial Statements (continued)
September 30, 2015 (Unaudited)
|
| 8. OTHER RISKS (continued) |
Liquidity Risk — The Funds may make investments that are illiquid or that may become less liquid in response to market developments or adverse investor perceptions. Illiquid investments may be more difficult to value. Liquidity risk may also refer to the risk that a Fund will not be able to pay redemption proceeds within the allowable time period because of unusual market conditions, an unusually high volume of redemption requests, or other reasons. To meet redemption requests, a Fund may be forced to sell investments at an unfavorable time and/or under unfavorable conditions. Liquidity risk may be the result of, among other things, the reduced number and capacity of traditional market participants to make a market in fixed income securities or the lack of an active market. The potential for liquidity risk may be magnified by a rising interest rate environment or other circumstances where investor redemptions from fixed income mutual funds may be higher than normal, potentially causing increased supply in the market due to selling activity.
Market and Credit Risks — In the normal course of business, the Funds trade financial instruments and enter into financial transactions where risk of potential loss exists due to changes in the market (market risk). Additionally, the Funds may also be exposed to credit risk in the event that an issuer or guarantor fails to perform or that an institution or entity with which the Funds have unsettled or open transactions defaults.
Investing in foreign markets may involve special risks and considerations not typically associated with investing in the U.S. Foreign securities may be subject to risk of loss because of more or less foreign government regulation, less public information and less economic, political and social stability in the countries in which the Funds invest. Loss may also result from the imposition of exchange controls, confiscations and other government restrictions by the United States or other governments, or from problems in registration, settlement or custody. Foreign risk also involves the risk of negative foreign currency rate fluctuations, which may cause the value of securities denominated in such foreign currency (or other instruments through which the Funds have exposure to foreign currencies) to decline in value. Currency exchange rates may fluctuate significantly over short periods of time. To the extent that the Funds also invest in securities of issuers located in emerging markets, these risks may be more pronounced.
Non-Diversification Risk — Each of the Dynamic Emerging Markets Debt Fund, Emerging Markets Debt Fund and Local Emerging Markets Debt Fund is non-diversified, meaning that it is permitted to invest a larger percentage of its assets in fewer issuers than diversified mutual funds. Thus, a Fund may be more susceptible to adverse developments affecting any single issuer held in its portfolio, and may be more susceptible to greater losses because of these developments.
Portfolio Concentration Risk — As a result of certain Funds’ ability to invest a large percentage of their assets in obligations of issuers within the same country, state, region, currency or economic sector, an adverse economic, business or political development may affect the value of the Funds’ investments more than if its investments were not so concentrated.
Redemption Proceeds Risk — The High Yield Floating Rate Fund may at times purchase securities with settlement periods that are longer than the time period required to pay redemption proceeds. In unusual circumstances, the High Yield Floating Rate Fund may pay redemption proceeds up to seven calendar days following receipt of a properly executed redemption request.
Under the Trust’s organizational documents, its Trustees, officers, employees and agents are indemnified, to the extent permitted by the Act and state law, against certain liabilities that may arise out of performance of their duties to the Funds. Additionally, in the course of business, the Funds enter into contracts that contain a variety of indemnification clauses. The Funds’ maximum exposure under these arrangements is unknown, as this would involve future claims that may be made against the Funds that have not yet occurred. However, GSAM believes the risk of loss under these arrangements to be remote.
Subsequent events after the Statement of Assets and Liabilities date have been evaluated through the date the financial statements were issued. GSAM has concluded that there is no impact requiring adjustment or disclosure in the financial statements.
170
GOLDMAN SACHS SINGLE SECTOR FIXED INCOME FUNDS
|
| 11. SUMMARY OF SHARE TRANSACTIONS |
Share activity is as follows:
| | | | | | | | | | | | | | | | |
| | | Dynamic Emerging Markets Debt Fund | |
| | | | |
| | | For the Six Months Ended
September 30, 2015
(Unaudited) | | | For the Fiscal Year Ended
March 31, 2015 | |
| | | | |
| | | Shares | | | Dollars | | | Shares | | | Dollars | |
| | | | |
| Class A Shares | | | | | | | | | | | | | | | | |
Shares sold | | | 8,674 | | | $ | 73,236 | | | | 83,224 | | | $ | 746,648 | |
Reinvestment of distributions | | | 1,587 | | | | 13,263 | | | | 1,126 | | | | 9,998 | |
Shares redeemed | | | (14,386 | ) | | | (114,101 | ) | | | (17,396 | ) | | | (159,747 | ) |
| | | | (4,125 | ) | | | (27,602 | ) | | | 66,954 | | | | 596,899 | |
| Class C Shares | | | | | | | | | | | | | | | | |
Shares sold | | | — | | | | — | | | | 6,046 | | | | 57,386 | |
Reinvestment of distributions | | | 114 | | | | 953 | | | | 339 | | | | 3,169 | |
Shares redeemed | | | (67 | ) | | | (556 | ) | | | (5,488 | ) | | | (48,905 | ) |
| | | | 47 | | | | 397 | | | | 897 | | | | 11,650 | |
| Institutional Shares | | | | | | | | | | | | | | | | |
Shares sold | | | 2,489,203 | | | | 20,406,079 | | | | 1,193,549 | | | | 11,009,785 | |
Reinvestment of distributions | | | 48,911 | | | | 409,064 | | | | 75,352 | | | | 699,506 | |
Shares redeemed | | | (61,403 | ) | | | (511,615 | ) | | | (2,011,428 | ) | | | (17,689,119 | ) |
| | | | 2,476,711 | | | | 20,303,528 | | | | (742,527 | ) | | | (5,979,828 | ) |
| Class IR Shares | | | | | | | | | | | | | | | | |
Reinvestment of distributions | | | 57 | | | | 478 | | | | 111 | | | | 1,033 | |
| | | | 57 | | | | 478 | | | | 111 | | | | 1,033 | |
| Class R Shares | | | | | | | | | | | | | | | | |
Reinvestment of distributions | | | 50 | | | | 418 | | | | 98 | | | | 907 | |
| | | | 50 | | | | 418 | | | | 98 | | | | 907 | |
NET INCREASE (DECREASE) | | | 2,472,740 | | | $ | 20,277,219 | | | | (674,467 | ) | | $ | (5,369,339 | ) |
171
GOLDMAN SACHS SINGLE SECTOR FIXED INCOME FUNDS
Notes to Financial Statements (continued)
September 30, 2015 (Unaudited)
|
| 11. SUMMARY OF SHARE TRANSACTIONS (continued) |
Share activity is as follows:
| | | | | | | | | | | | | | | | |
| | | Emerging Markets Debt Fund | |
| | | | |
| | | For the Six Months Ended
September 30, 2015
(Unaudited) | | | For the Fiscal Year Ended
March 31, 2015 | |
| | | | |
| | | Shares | | | Dollars | | | Shares | | | Dollars | |
| | | | |
| Class A Shares | | | | | | | | | | | | | | | | |
Shares sold | | | 1,373,673 | | | $ | 16,857,075 | | | | 5,480,596 | | | $ | 68,967,346 | |
Reinvestment of distributions | | | 187,130 | | | | 2,279,358 | | | | 306,625 | | | | 3,864,644 | |
Shares redeemed | | | (1,571,924 | ) | | | (19,118,847 | ) | | | (6,225,076 | ) | | | (78,511,124 | ) |
| | | | (11,121 | ) | | | 17,586 | | | | (437,855 | ) | | | (5,679,134 | ) |
| Class C Shares | | | | | | | | | | | | | | | | |
Shares sold | | | 167,081 | | | | 2,059,396 | | | | 621,261 | | | | 7,784,884 | |
Reinvestment of distributions | | | 43,578 | | | | 530,737 | | | | 70,856 | | | | 892,311 | |
Shares redeemed | | | (394,240 | ) | | | (4,813,082 | ) | | | (767,711 | ) | | | (9,603,101 | ) |
| | | | (183,581 | ) | | | (2,222,949 | ) | | | (75,594 | ) | | | (925,906 | ) |
| Institutional Shares | | | | | | | | | | | | | | | | |
Shares sold | | | 17,497,155 | | | | 215,179,514 | | | | 58,091,034 | | | | 733,756,282 | |
Reinvestment of distributions | | | 2,368,035 | | | | 28,999,515 | | | | 5,223,093 | | | | 65,886,452 | |
Shares redeemed | | | (71,056,749 | ) | | | (873,356,924 | ) | | | (40,922,189 | ) | | | (512,115,905 | ) |
| | | | (51,191,559 | ) | | | (629,177,895 | ) | | | 22,391,938 | | | | 287,526,829 | |
| Class IR Shares | | | | | | | | | | | | | | | | |
Shares sold | | | 132,704 | | | | 1,622,381 | | | | 543,341 | | | | 6,871,435 | |
Reinvestment of distributions | | | 30,313 | | | | 369,734 | | | | 55,699 | | | | 703,677 | |
Shares redeemed | | | (141,113 | ) | | | (1,715,683 | ) | | | (765,154 | ) | | | (9,696,559 | ) |
| | | | 21,904 | | | | 276,432 | | | | (166,114 | ) | | | (2,121,447 | ) |
| Class R6 Shares(a) | | | | | | | | | | | | | | | | |
Shares sold | | | 822 | | | | 10,005 | | | | — | | | | — | |
Reinvestment of distributions | | | 7 | | | | 85 | | | | — | | | | — | |
Shares redeemed | | | (1 | ) | | | (5 | ) | | | — | | | | — | |
| | | | 828 | | | | 10,085 | | | | — | | | | — | |
NET INCREASE (DECREASE) | | | (51,363,529 | ) | | $ | (631,096,741 | ) | | | 21,712,375 | | | $ | 278,800,342 | |
| (a) | | Commenced operations on July 31, 2015. |
172
GOLDMAN SACHS SINGLE SECTOR FIXED INCOME FUNDS
|
| 11. SUMMARY OF SHARE TRANSACTIONS (continued) |
Share activity is as follows:
| | | | | | | | | | | | | | | | |
| | | High Yield Fund | |
| | | | |
| | | For the Six Months Ended
September 30, 2015
(Unaudited) | | | For the Fiscal Year Ended
March 31, 2015 | |
| | | | |
| | | Shares | | | Dollars | | | Shares | | | Dollars | |
| | | | |
| Class A Shares | | | | | | | | | | | | | | | | |
Shares sold | | | 4,327,246 | | | $ | 29,010,861 | | | | 39,958,551 | | | $ | 276,716,359 | |
Reinvestment of distributions | | | 1,652,030 | | | | 10,962,130 | | | | 4,906,817 | | | | 33,949,036 | |
Shares converted from Class B(a) | | | — | | | | — | | | | 245,694 | | | | 1,734,547 | |
Shares redeemed | | | (22,969,449 | ) | | | (153,420,655 | ) | | | (49,989,159 | ) | | | (347,321,401 | ) |
| | | | (16,990,173 | ) | | | (113,447,664 | ) | | | (4,878,097 | ) | | | (34,921,459 | ) |
| Class B Shares(a) | | | | | | | | | | | | | | | | |
Shares sold | | | — | | | | — | | | | 14,821 | | | | 106,884 | |
Reinvestment of distributions | | | — | | | | — | | | | 34,315 | | | | 246,511 | |
Shares converted to Class A | | | — | | | | — | | | | (245,017 | ) | | | (1,734,547 | ) |
Shares redeemed | | | — | | | | — | | | | (1,411,801 | ) | | | (10,016,371 | ) |
| | | | — | | | | — | | | | (1,607,682 | ) | | | (11,397,523 | ) |
| Class C Shares | | | | | | | | | | | | | | | | |
Shares sold | | | 185,932 | | | | 1,248,345 | | | | 926,449 | | | | 6,542,861 | |
Reinvestment of distributions | | | 190,005 | | | | 1,259,273 | | | | 603,595 | | | | 4,179,897 | |
Shares redeemed | | | (1,451,616 | ) | | | (9,674,407 | ) | | | (3,249,436 | ) | | | (22,799,136 | ) |
| | | | (1,075,679 | ) | | | (7,166,789 | ) | | | (1,719,392 | ) | | | (12,076,378 | ) |
| Institutional Shares | | | | | | | | | | | | | | | | |
Shares sold | | | 85,567,578 | | | | 574,185,679 | | | | 300,506,357 | | | | 2,086,719,807 | |
Reinvestment of distributions | | | 19,973,214 | | | | 132,668,322 | | | | 46,674,753 | | | | 323,636,798 | |
Shares redeemed | | | (200,708,574 | ) | | | (1,322,843,384 | ) | | | (229,051,072 | ) | | | (1,603,158,563 | ) |
| | | | (95,167,782 | ) | | | (615,989,383 | ) | | | 118,130,038 | | | | 807,198,042 | |
| Service Shares | | | | | | | | | | | | | | | | |
Shares sold | | | 230,284 | | | | 1,543,147 | | | | 655,753 | | | | 4,542,455 | |
Reinvestment of distributions | | | 50,998 | | | | 337,097 | | | | 147,834 | | | | 1,020,779 | |
Shares redeemed | | | (323,587 | ) | | | (2,141,597 | ) | | | (587,740 | ) | | | (4,125,478 | ) |
| | | | (42,305 | ) | | | (261,353 | ) | | | 215,847 | | | | 1,437,756 | |
| Class IR Shares | | | | | | | | | | | | | | | | |
Shares sold | | | 134,367 | | | | 890,379 | | | | 563,770 | | | | 4,005,197 | |
Reinvestment of distributions | | | 54,137 | | | | 359,364 | | | | 162,720 | | | | 1,129,338 | |
Shares redeemed | | | (512,874 | ) | | | (3,426,202 | ) | | | (764,994 | ) | | | (5,356,176 | ) |
| | | | (324,370 | ) | | | (2,176,459 | ) | | | (38,504 | ) | | | (221,641 | ) |
| Class R Shares | | | | | | | | | | | | | | | | |
Shares sold | | | 195,648 | | | | 1,305,701 | | | | 468,959 | | | | 3,296,443 | |
Reinvestment of distributions | | | 66,726 | | | | 441,141 | | | | 177,172 | | | | 1,225,486 | |
Shares redeemed | | | (288,069 | ) | | | (1,904,623 | ) | | | (582,783 | ) | | | (4,075,509 | ) |
| | | | (25,695 | ) | | | (157,781 | ) | | | 63,348 | | | | 446,420 | |
| Class R6 Shares(b) | | | | | | | | | | | | | | | | |
Shares sold | | | 1,505 | | | | 10,005 | | | | — | | | | — | |
Reinvestment of distributions | | | 14 | | | | 89 | | | | — | | | | — | |
Shares redeemed | | | (1 | ) | | | (5 | ) | | | — | | | | — | |
| | | | 1,518 | | | | 10,089 | | | | — | | | | — | |
NET INCREASE (DECREASE) | | | (113,624,486 | ) | | $ | (739,189,340 | ) | | | 110,165,558 | | | $ | 750,465,217 | |
| (a) | | Class B Shares were converted into Class A Shares at the close of business on November 14, 2014. |
| (b) | | Commenced operations on July 31, 2015. |
173
GOLDMAN SACHS SINGLE SECTOR FIXED INCOME FUNDS
Notes to Financial Statements (continued)
September 30, 2015 (Unaudited)
|
| 11. SUMMARY OF SHARE TRANSACTIONS (continued) |
Share activity is as follows:
| | | | | | | | | | | | | | | | |
| | | High Yield Floating Rate Fund | |
| | | | |
| | | For the Six Months Ended
September 30, 2015
(Unaudited) | | | For the Fiscal Year Ended
March 31, 2015 | |
| | | | |
| | | Shares | | | Dollars | | | Shares | | | Dollars | |
| | | | |
| Class A Shares | | | | | | | | | | | | | | | | |
Shares sold | | | 1,635,948 | | | $ | 16,292,173 | | | | 457,661 | | | $ | 4,574,505 | |
Reinvestment of distributions | | | 29,010 | | | | 285,915 | | | | 41,231 | | | | 412,356 | |
Shares redeemed | | | (1,580,042 | ) | | | (15,546,029 | ) | | | (2,330,202 | ) | | | (23,313,468 | ) |
| | | | 84,916 | | | | 1,032,059 | | | | (1,831,310 | ) | | | (18,326,607 | ) |
| Class C Shares | | | | | | | | | | | | | | | | |
Shares sold | | | 13,559 | | | | 133,095 | | | | 50,989 | | | | 509,881 | |
Reinvestment of distributions | | | 2,927 | | | | 28,760 | | | | 5,673 | | | | 56,497 | |
Shares redeemed | | | (18,491 | ) | | | (181,611 | ) | | | (106,112 | ) | | | (1,054,285 | ) |
| | | | (2,005 | ) | | | (19,756 | ) | | | (49,450 | ) | | | (487,907 | ) |
| Institutional Shares | | | | | | | | | | | | | | | | |
Shares sold | | | 80,750,394 | | | | 798,869,089 | | | | 210,661,401 | | | | 2,100,478,441 | |
Reinvestment of distributions | | | 8,677,825 | | | | 85,331,593 | | | | 16,464,494 | | | | 164,105,775 | |
Shares redeemed | | | (106,846,405 | ) | | | (1,049,303,984 | ) | | | (229,072,256 | ) | | | (2,271,827,355 | ) |
| | | | (17,418,186 | ) | | | (165,103,302 | ) | | | (1,946,361 | ) | | | (7,243,139 | ) |
| Class IR Shares | | | | | | | | | | | | | | | | |
Shares sold | | | 55,145 | | | | 544,982 | | | | 598 | | | | 6,001 | |
Reinvestment of distributions | | | 2,014 | | | | 19,772 | | | | 3,683 | | | | 36,777 | |
Shares redeemed | | | (6,519 | ) | | | (64,615 | ) | | | (84,289 | ) | | | (846,978 | ) |
| | | | 50,640 | | | | 500,139 | | | | (80,008 | ) | | | (804,200 | ) |
| Class R Shares | | | | | | | | | | | | | | | | |
Reinvestment of distributions | | | 20 | | | | 198 | | | | 37 | | | | 362 | |
| | | | 20 | | | | 198 | | | | 37 | | | | 362 | |
NET DECREASE | | | (17,284,615 | ) | | $ | (163,590,662 | ) | | | (3,907,092 | ) | | $ | (26,861,491 | ) |
174
GOLDMAN SACHS SINGLE SECTOR FIXED INCOME FUNDS
|
| 11. SUMMARY OF SHARE TRANSACTIONS (continued) |
Share activity is as follows:
| | | | | | | | | | | | | | | | |
| | | Investment Grade Credit Fund | |
| | | | |
| | | For the Six Months Ended
September 30, 2015
(Unaudited) | | | For the Fiscal Year Ended
March 31, 2015 | |
| | | | |
| | | Shares | | | Dollars | | | Shares | | | Dollars | |
| | | | |
| Class A Shares | | | | | | | | | | | | | | | | |
Shares sold | | | 329,360 | | | $ | 3,041,158 | | | | 1,190,648 | | | $ | 11,277,131 | |
Reinvestment of distributions | | | 49,490 | | | | 453,498 | | | | 134,424 | | | | 1,271,629 | |
Shares redeemed | | | (546,712 | ) | | | (5,011,335 | ) | | | (854,822 | ) | | | (8,111,154 | ) |
| | | | (167,862 | ) | | | (1,516,679 | ) | | | 470,250 | | | | 4,437,606 | |
| Institutional Shares | | | | | | | | | | | | | | | | |
Shares sold | | | 1,095,142 | | | | 10,026,692 | | | | 5,165,029 | | | | 49,252,878 | |
Reinvestment of distributions | | | 334,543 | | | | 3,065,281 | | | | 984,707 | | | | 9,319,224 | |
Shares redeemed | | | (2,427,567 | ) | | | (22,178,211 | ) | | | (5,093,194 | ) | | | (48,305,536 | ) |
| | | | (997,882 | ) | | | (9,086,238 | ) | | | 1,056,542 | | | | 10,266,566 | |
| Separate Account Institutional Shares | | | | | | | | | | | | | | | | |
Shares sold | | | 1,871,860 | | | | 17,122,945 | | | | 5,965,384 | | | | 56,771,992 | |
Reinvestment of distributions | | | 430,954 | | | | 3,950,198 | | | | 1,379,298 | | | | 13,059,830 | |
Shares redeemed | | | (2,416,722 | ) | | | (22,121,060 | ) | | | (10,488,332 | ) | | | (99,963,643 | ) |
| | | | (113,908 | ) | | | (1,047,917 | ) | | | (3,143,650 | ) | | | (30,131,821 | ) |
| Class IR Shares | | | | | | | | | | | | | | | | |
Shares sold | | | 20,248 | | | | 186,552 | | | | 64,077 | | | | 608,820 | |
Reinvestment of distributions | | | 2,060 | | | | 18,880 | | | | 4,215 | | | | 39,909 | |
Shares redeemed | | | (14,114 | ) | | | (131,164 | ) | | | (13,656 | ) | | | (129,675 | ) |
| | | | 8,194 | | | | 74,268 | | | | 54,636 | | | | 519,054 | |
| Class R6 Shares(a) | | | | | | | | | | | | | | | | |
Shares sold | | | 1,096 | | | | 10,005 | | | | — | | | | — | |
Reinvestment of distributions | | | 6 | | | | 55 | | | | — | | | | — | |
Shares redeemed | | | (1 | ) | | | (5 | ) | | | — | | | | — | |
| | | | 1,101 | | | | 10,055 | | | | — | | | | — | |
NET DECREASE | | | (1,270,357 | ) | | $ | (11,566,511 | ) | | | (1,562,222 | ) | | $ | (14,908,595 | ) |
| (a) | | Commenced operations on July 31, 2015. |
175
GOLDMAN SACHS SINGLE SECTOR FIXED INCOME FUNDS
Notes to Financial Statements (continued)
September 30, 2015 (Unaudited)
|
| 11. SUMMARY OF SHARE TRANSACTIONS (continued) |
Share activity is as follows:
| | | | | | | | | | | | | | | | |
| | | Local Emerging Markets Debt Fund | |
| | | | |
| | | For the Six Months Ended
September 30, 2015
(Unaudited) | | | For the Fiscal Year Ended
March 31, 2015 | |
| | | | |
| | | Shares | | | Dollars | | | Shares | | | Dollars | |
| | | | |
| Class A Shares | | | | | | | | | | | | | | | | |
Shares sold | | | 11,544,526 | | | $ | 79,940,945 | | | | 16,069,534 | | | $ | 126,076,171 | |
Reinvestment of distributions | | | 683,667 | | | | 4,490,808 | | | | 695,776 | | | | 5,432,141 | |
Shares redeemed | | | (3,931,233 | ) | | | (25,797,363 | ) | | | (8,119,852 | ) | | | (64,506,760 | ) |
| | | | 8,296,960 | | | | 58,634,390 | | | | 8,645,458 | | | | 67,001,552 | |
| Class C Shares | | | | | | | | | | | | | | | | |
Shares sold | | | 84,864 | | | | 575,338 | | | | 155,906 | | | | 1,242,741 | |
Reinvestment of distributions | | | 25,613 | | | | 170,057 | | | | 67,940 | | | | 547,360 | |
Shares redeemed | | | (327,092 | ) | | | (2,210,400 | ) | | | (918,147 | ) | | | (7,285,782 | ) |
| | | | (216,615 | ) | | | (1,465,005 | ) | | | (694,301 | ) | | | (5,495,681 | ) |
| Institutional Shares | | | | | | | | | | | | | | | | |
Shares sold | | | 18,348,676 | | | | 121,821,144 | | | | 83,380,084 | | | | 659,418,229 | |
Reinvestment of distributions | | | 4,365,616 | | | | 28,954,293 | | | | 11,170,642 | | | | 89,721,804 | |
Shares redeemed | | | (64,905,726 | ) | | | (425,387,508 | ) | | | (130,608,217 | ) | | | (1,014,278,781 | ) |
| | | | (42,191,434 | ) | | | (274,612,071 | ) | | | (36,057,491 | ) | | | (265,138,748 | ) |
| Class IR Shares | | | | | | | | | | | | | | | | |
Shares sold | | | 625,598 | | | | 3,977,462 | | | | 57,192 | | | | 470,024 | |
Reinvestment of distributions | | | 12,429 | | | | 81,223 | | | | 30,754 | | | | 249,608 | |
Shares redeemed | | | (216,744 | ) | | | (1,386,540 | ) | | | (494,051 | ) | | | (4,080,192 | ) |
| | | | 421,283 | | | | 2,672,145 | | | | (406,105 | ) | | | (3,360,560 | ) |
NET DECREASE | | | (33,689,806 | ) | | $ | (214,770,541 | ) | | | (28,512,439 | ) | | $ | (206,993,437 | ) |
176
GOLDMAN SACHS SINGLE SECTOR FIXED INCOME FUNDS
|
| 11. SUMMARY OF SHARE TRANSACTIONS (continued) |
Share activity is as follows:
| | | | | | | | | | | | | | | | |
| | | U.S. Mortgages Fund | |
| | | | |
| | | For the Six Months Ended
September 30, 2015
(Unaudited) | | | For the Fiscal Year Ended
March 31, 2015 | |
| | | | |
| | | Shares | | | Dollars | | | Shares | | | Dollars | |
| | | | |
| Class A Shares | | | | | | | | | | | | | | | | |
Shares sold | | | 630,914 | | | $ | 6,722,962 | | | | 3,325,832 | | | $ | 35,532,187 | |
Reinvestment of distributions | | | 37,436 | | | | 399,062 | | | | 19,884 | | | | 212,482 | |
Shares redeemed | | | (455,921 | ) | | | (4,856,171 | ) | | | (764,578 | ) | | | (8,162,992 | ) |
| | | | 212,429 | | | | 2,265,853 | | | | 2,581,138 | | | | 27,581,677 | |
| Institutional Shares | | | | | | | | | | | | | | | | |
Shares sold | | | 1,086,920 | | | | 11,607,252 | | | | 4,837,392 | | | | 51,479,259 | |
Reinvestment of distributions | | | 60,579 | | | | 647,196 | | | | 87,568 | | | | 935,781 | |
Shares redeemed | | | (648,596 | ) | | | (6,923,388 | ) | | | (1,780,772 | ) | | | (19,044,650 | ) |
| | | | 498,903 | | | | 5,331,060 | | | | 3,144,188 | | | | 33,370,390 | |
| Class IR Shares | | | | | | | | | | | | | | | | |
Shares sold | | | 55,061 | | | | 587,160 | | | | 175,347 | | | | 1,864,094 | |
Reinvestment of distributions | | | 2,457 | | | | 26,255 | | | | 2,119 | | | | 22,718 | |
Shares redeemed | | | (20,153 | ) | | | (215,547 | ) | | | (14,878 | ) | | | (159,478 | ) |
| | | | 37,365 | | | | 397,868 | | | | 162,588 | | | | 1,727,334 | |
| Separate Account Institutional Shares | | | | | | | | | | | | | | | | |
Shares sold | | | 1,324,454 | | | | 14,078,017 | | | | 1,921,086 | | | | 20,451,375 | |
Reinvestment of distributions | | | 212,239 | | | | 2,263,087 | | | | 390,503 | | | | 4,156,210 | |
Shares redeemed | | | (1,295,087 | ) | | | (13,786,503 | ) | | | (4,325,419 | ) | | | (45,927,807 | ) |
| | | | 241,606 | | | | 2,554,601 | | | | (2,013,830 | ) | | | (21,320,222 | ) |
| Class R6 Shares(a) | | | | | | | | | | | | | | | | |
Shares sold | | | 938 | | | | 10,005 | | | | — | | | | — | |
Reinvestment of distributions | | | 4 | | | | 43 | | | | — | | | | — | |
Shares redeemed | | | (1 | ) | | | (5 | ) | | | — | | | | — | |
| | | | 941 | | | | 10,043 | | | | — | | | | — | |
NET INCREASE | | | 991,244 | | | $ | 10,559,425 | | | | 3,874,084 | | | $ | 41,359,179 | |
| (a) | | Commenced operations on July 31, 2015. |
177
GOLDMAN SACHS SINGLE SECTOR FIXED INCOME FUNDS
Fund Expenses — Six Month Period Ended September 30, 2015 (Unaudited)
As a shareholder of Class A, Class C, Institutional, Service, Separate Account Institutional, Class IR, Class R and Class R6 Shares of a Fund, you incur two types of costs: (1) transaction costs, including sales charges on purchase payments (with respect to Class A Shares), contingent deferred sales charges on redemptions (with respect to Class C Shares), and (2) ongoing costs, including management fees; distribution and service (12b-1) fees (with respect to Class A, Class C and Class R Shares); and other Fund expenses. This Example is intended to help you understand your ongoing costs (in dollars) of investing in Class A, Class C, Institutional, Service, Separate Account Institutional, Class IR, Class R or Class R6 Shares of the Funds and to compare these costs with the ongoing costs of investing in other mutual funds.
The Example is based on an investment of $1,000 invested at the beginning of the period and held for the entire period from April 1, 2015 through September 30, 2015, which represents a period of 183 out of 366 days.
Actual Expenses — The first line under each share class in the table below provides information about actual account values and actual expenses. You may use the information in this line, together with the amount you invested, to estimate the expenses that you paid over the period. Simply divide your account value by $1,000 (for example, an $8,600 account value divided by $1,000=8.6), then multiply the result by the number in the first line under the heading entitled “Expenses Paid” to estimate the expenses you paid on your account during this period.
Hypothetical Example for Comparison Purposes — The second line under each share class in the table below provides information about hypothetical account values and hypothetical expenses based on the Funds’ actual net expense ratios and an assumed rate of return of 5% per year before expenses, which is not the Funds’ actual return. The hypothetical account values and expenses may not be used to estimate the actual ending account balance or expenses you paid for the period. You may use this information to compare the ongoing costs of investing in the Funds and other funds. To do so, compare this 5% hypothetical example with the 5% hypothetical examples that appear in the shareholder reports of the other funds.
Please note that the expenses shown in the table are meant to highlight your ongoing costs only and do not reflect any transactional costs, such as sales charges, redemption fees, or exchange fees. Therefore, the second line of the table is useful in comparing ongoing costs only, and will not help you determine the relative total costs of owning different funds. In addition, if these transactional costs were included, your costs would have been higher.
| | | | | | | | | | | | | | | | | | | | | | | | | | | | | | | | | | | | | | | | | | | | | | | | |
| | | Dynamic Emerging Markets Debt Fund | | | Emerging Markets Debt Fund | | | High Yield Fund | | | High Yield Floating Rate Fund | |
| Share Class | | Beginning
Account
Value
4/1/15 | | | Ending
Account
Value
9/30/15 | | | Expenses
Paid for the
6 months ended
9/30/15* | | | Beginning
Account
Value
4/1/15 | | | Ending
Account
Value
9/30/15 | | | Expenses
Paid for the
6 months ended
9/30/15* | | | Beginning
Account
Value
4/1/15 | | | Ending
Account
Value
9/30/15 | | | Expenses
Paid for the
6 months ended
9/30/15* | | | Beginning
Account
Value
4/1/15 | | | Ending
Account
Value
9/30/15 | | | Expenses
Paid for the
6 months ended
9/30/15* | |
| Class A | | | | | | | | | | | | | | | | | | | | | | | | | | | | | | | | | | | | | | | | | | | | | | | | |
Actual | | $ | 1,000.00 | | | $ | 933.10 | | | $ | 5.94 | | | $ | 1,000.00 | | | $ | 984.00 | | | $ | 6.10 | | | $ | 1,000.00 | | | $ | 946.10 | | | $ | 5.11 | | | $ | 1,000.00 | | | $ | 990.20 | | | $ | 4.68 | |
Hypothetical 5% return | | | 1,000.00 | | | | 1,018.85 | + | | | 6.21 | | | | 1,000.00 | | | | 1,018.85 | + | | | 6.21 | | | | 1,000.00 | | | | 1,019.75 | + | | | 5.30 | | | | 1,000.00 | | | | 1,020.30 | + | | | 4.75 | |
| Class C | | | | | | | | | | | | | | | | | | | | | | | | | | | | | | | | | | | | | | | | | | | | | | | | |
Actual | | | 1,000.00 | | | | 928.70 | | | | 9.55 | | | | 1,000.00 | | | | 980.30 | | | | 9.80 | | | | 1,000.00 | | | | 942.70 | | | | 8.74 | | | | 1,000.00 | | | | 986.50 | | | | 8.39 | |
Hypothetical 5% return | | | 1,000.00 | | | | 1,015.10 | + | | | 9.97 | | | | 1,000.00 | | | | 1,015.10 | + | | | 9.97 | | | | 1,000.00 | | | | 1,016.00 | + | | | 9.07 | | | | 1,000.00 | | | | 1,016.55 | + | | | 8.52 | |
| Institutional | | | | | | | | | | | | | | | | | | | | | | | | | | | | | | | | | | | | | | | | | | | | | | | | |
Actual | | | 1,000.00 | | | | 933.80 | | | | 4.30 | | | | 1,000.00 | | | | 985.70 | | | | 4.42 | | | | 1,000.00 | | | | 947.90 | | | | 3.46 | | | | 1,000.00 | | | | 992.00 | | | | 2.99 | |
Hypothetical 5% return | | | 1,000.00 | | | | 1,020.55 | + | | | 4.50 | | | | 1,000.00 | | | | 1,020.55 | + | | | 4.50 | | | | 1,000.00 | | | | 1,021.45 | + | | | 3.59 | | | | 1,000.00 | | | | 1,022.00 | + | | | 3.03 | |
| Service | | | | | | | | | | | | | | | | | | | | | | | | | | | | | | | | | | | | | | | | | | | | | | | | |
Actual | | | N/A | | | | N/A | | | | N/A | | | | N/A | | | | N/A | | | | N/A | | | | 1,000.00 | | | | 946.70 | | | | 5.89 | | | | N/A | | | | N/A | | | | N/A | |
Hypothetical 5% return | | | N/A | | | | N/A | | | | N/A | | | | N/A | | | | N/A | | | | N/A | | | | 1,000.00 | | | | 1,018.95 | + | | | 6.11 | | | | N/A | | | | N/A | | | | N/A | |
| Class IR | | | | | | | | | | | | | | | | | | | | | | | | | | | | | | | | | | | | | | | | | | | | | | | | |
Actual | | | 1,000.00 | | | | 933.20 | | | | 4.74 | | | | 1,000.00 | | | | 985.30 | | | | 4.86 | | | | 1,000.00 | | | | 947.40 | | | | 3.89 | | | | 1,000.00 | | | | 991.50 | | | | 3.44 | |
Hypothetical 5% return | | | 1,000.00 | | | | 1,020.10 | + | | | 4.95 | | | | 1,000.00 | | | | 1,020.10 | + | | | 4.95 | | | | 1,000.00 | | | | 1,021.00 | + | | | 4.04 | | | | 1,000.00 | | | | 1,021.55 | + | | | 3.49 | |
| Class R | | | | | | | | | | | | | | | | | | | | | | | | | | | | | | | | | | | | | | | | | | | | | | | | |
Actual | | | 1,000.00 | | | | 931.00 | | | | 7.14 | | | | N/A | | | | N/A | | | | N/A | | | | 1,000.00 | | | | 944.90 | | | | 6.32 | | | | 1,000.00 | | | | 990.10 | | | | 5.82 | |
Hypothetical 5% return | | | 1,000.00 | | | | 1,017.60 | + | | | 7.47 | | | | N/A | | | | N/A | | | | N/A | | | | 1,000.00 | | | | 1,018.50 | + | | | 6.56 | | | | 1,000.00 | | | | 1,019.15 | + | | | 5.91 | |
| Class R6(a) | | | | | | | | | | | | | | | | | | | | | | | | | | | | | | | | | | | | | | | | | | | | | | | | |
Actual | | | N/A | | | | N/A | | | | N/A | | | | 1,000.00 | | | | 982.90 | | | | 1.47 | | | | 1,000.00 | | | | 955.00 | | | | 1.17 | | | | N/A | | | | N/A | | | | N/A | |
Hypothetical 5% return | | | N/A | | | | N/A | | | | N/A | | | | 1,000.00 | | | | 1,006.85 | + | | | 1.49 | | | | 1,000.00 | | | | 1,007.13 | + | | | 1.20 | | | | N/A | | | | N/A | | | | N/A | |
178
GOLDMAN SACHS SINGLE SECTOR FIXED INCOME FUNDS
Fund Expenses — Six Month Period Ended September 30, 2015 (Unaudited) (continued)
| | | | | | | | | | | | | | | | | | | | | | | | | | | | | | | | | | | | |
| | | Investment Grade Credit Fund | | | Local Emerging Markets Debt Fund | | | U.S. Mortgages Fund | |
| Share Class | | Beginning
Account
Value
4/1/15 | | | Ending
Account
Value
9/30/15 | | | Expenses
Paid for the
6 months ended
9/30/15* | | | Beginning
Account
Value
4/1/15 | | | Ending
Account
Value
9/30/15 | | | Expenses
Paid for the
6 months ended
9/30/15* | | | Beginning
Account
Value
4/1/15 | | | Ending
Account
Value
9/30/15 | | | Expenses
Paid for the
6 months ended
9/30/15* | |
| Class A | | | | | | | | | | | | | | | | | | | | | | | | | | | | | | | | | | | | |
Actual | | $ | 1,000.00 | | | $ | 969.40 | | | $ | 3.54 | | | $ | 1,000.00 | | | $ | 880.70 | | | $ | 5.88 | | | $ | 1,000.00 | | | $ | 1,004.80 | | | $ | 3.61 | |
Hypothetical 5% return | | | 1,000.00 | | | | 1,021.40 | + | | | 3.64 | | | | 1,000.00 | | | | 1,018.75 | + | | | 6.31 | | | | 1,000.00 | | | | 1,021.40 | + | | | 3.64 | |
| Class C | | | | | | | | | | | | | | | | | | | | | | | | | | | | | | | | | | | | |
Actual | | | N/A | | | | N/A | | | | N/A | | | | 1,000.00 | | | | 876.30 | | | | 9.38 | | | | N/A | | | | N/A | | | | N/A | |
Hypothetical 5% return | | | N/A | | | | N/A | | | | N/A | | | | 1,000.00 | | | | 1,015.00 | + | | | 10.08 | | | | N/A | | | | N/A | | | | N/A | |
| Institutional | | | | | | | | | | | | | | | | | | | | | | | | | | | | | | | | | | | | |
Actual | | | 1,000.00 | | | | 970.00 | | | | 1.87 | | | | 1,000.00 | | | | 881.00 | | | | 4.28 | | | | 1,000.00 | | | | 1,005.60 | | | | 1.91 | |
Hypothetical 5% return | | | 1,000.00 | | | | 1,023.10 | + | | | 1.92 | | | | 1,000.00 | | | | 1,020.45 | + | | | 4.60 | | | | 1,000.00 | | | | 1,023.10 | + | | | 1.92 | |
| Class IR | | | | | | | | | | | | | | | | | | | | | | | | | | | | | | | | | | | | |
Actual | | | 1,000.00 | | | | 970.60 | | | | 2.32 | | | | 1,000.00 | | | | 881.80 | | | | 4.66 | | | | 1,000.00 | | | | 1,006.10 | | | | 2.41 | |
Hypothetical 5% return | | | 1,000.00 | | | | 1,022.65 | + | | | 2.38 | | | | 1,000.00 | | | | 1,020.05 | + | | | 5.00 | | | | 1,000.00 | | | | 1,022.60 | + | | | 2.43 | |
| Separate Account Institutional | | | | | | | | | | | | | | | | | | | | | | | | | | | | | | | | | | | | |
Actual | | | 1,000.00 | | | | 971.10 | | | | 1.87 | | | | N/A | | | | N/A | | | | N/A | | | | 1,000.00 | | | | 1,005.60 | | | | 1.91 | |
Hypothetical 5% return | | | 1,000.00 | | | | 1,023.10 | + | | | 1.92 | | | | N/A | | | | N/A | | | | N/A | | | | 1,000.00 | | | | 1,023.10 | + | | | 1.92 | |
| Class R6(a) | | | | | | | | | | | | | | | | | | | | | | | | | | | | | | | | | | | | |
Actual | | | 1,000.00 | | | | 995.10 | | | | 0.62 | | | | N/A | | | | N/A | | | | N/A | | | | 1,000.00 | | | | 1,000.00 | | | | 0.72 | |
Hypothetical 5% return | | | 1,000.00 | | | | 1,007.72 | + | | | 0.62 | | | | N/A | | | | N/A | | | | N/A | | | | 1,000.00 | | | | 1,007.62 | + | | | 0.72 | |
| * | | Expenses for each share class are calculated using each Fund’s annualized net expense ratio for each class, which represents the ongoing expenses as a percentage of net assets for the six months ended September 30, 2015. Expenses are calculated by multiplying the annualized net expense ratio by the average account value for the period; then multiplying the result by the number of days in the most recent fiscal half year; and then dividing that result by the number of days in the fiscal year. The annualized net expense ratios for the period were as follows: |
| | | | | | | | | | | | | | | | | | | | | | | | | | | | | | | | |
| Fund | | Class A | | | Class C | | | Institutional | | | Service | | | Separate Account Institutional | | | Class IR | | | Class R | | | R6(a) | |
Dynamic Emerging Markets Debt | | | 1.23 | % | | | 1.98 | % | | | 0.89 | % | | | N/A | | | | N/A | | | | 0.98 | % | | | 1.48 | % | | | N/A | |
Emerging Markets Debt | | | 1.23 | | | | 1.98 | | | | 0.89 | | | | N/A | | | | N/A | | | | 0.98 | | | | N/A | | | | 0.89 | % |
High Yield | | | 1.05 | | | | 1.80 | | | | 0.71 | | | | 1.21 | % | | | N/A | | | | 0.80 | | | | 1.30 | | | | 0.72 | |
High Yield Floating Rate | | | 0.94 | | | | 1.69 | | | | 0.60 | | | | N/A | | | | N/A | | | | 0.69 | | | | 1.17 | | | | N/A | |
Investment Grade Credit | | | 0.72 | | | | N/A | | | | 0.38 | | | | N/A | | | | 0.47 | % | | | 0.47 | | | | N/A | | | | 0.37 | |
Local Emerging Markets Debt | | | 1.25 | | | | 2.00 | | | | 0.91 | | | | N/A | | | | N/A | | | | 0.99 | | | | N/A | | | | N/A | |
U.S. Mortgages | | | 0.72 | | | | N/A | | | | 0.38 | | | | N/A | | | | 0.48 | | | | 0.48 | | | | N/A | | | | 0.43 | |
| + | | Hypothetical expenses are based on each Fund’s actual annualized net expense ratios and an assumed rate of return of 5% per year before expenses |
| (a) | | Commenced operations on July 31, 2015. |
179
GOLDMAN SACHS SINGLE SECTOR FIXED INCOME FUNDS
Statement Regarding Basis for Approval of Management Agreement (Unaudited)
Background
The Goldman Sachs Dynamic Emerging Markets Debt Fund, Goldman Sachs Emerging Markets Debt Fund, Goldman Sachs High Yield Fund, Goldman Sachs High Yield Floating Rate Fund, Goldman Sachs Investment Grade Credit Fund, Goldman Sachs Local Emerging Markets Debt Fund, and Goldman Sachs U.S. Mortgages Fund (the “Funds”) are investment portfolios of Goldman Sachs Trust (the “Trust”). The Board of Trustees oversees the management of the Trust and reviews the investment performance and expenses of the Funds at regularly scheduled meetings held throughout the year. In addition, the Board of Trustees determines annually whether to approve the continuance of the Trust’s investment management agreement (the “Management Agreement”) with Goldman Sachs Asset Management, L.P. (the “Investment Adviser”) on behalf of the Funds.
The Management Agreement was most recently approved for continuation until June 30, 2016 by the Board of Trustees, including those Trustees who are not parties to the Management Agreement or “interested persons” (as defined in the Investment Company Act of 1940, as amended) of any party thereto (the “Independent Trustees”), at a meeting held on June 10-11, 2015 (the “Annual Meeting”).
The review process undertaken by the Trustees spans the course of the year and culminates with the Annual Meeting. To assist the Trustees in their deliberations, the Trustees have established a Contract Review Committee (the “Committee”), comprised of the Independent Trustees. The Committee held three meetings over the course of the year since the Management Agreement was last approved. At those Committee meetings, regularly scheduled Board or other committee meetings, and/or the Annual Meeting, matters relevant to the renewal of the Management Agreement were considered by the Board, or the Independent Trustees, as applicable. Such matters included:
| | (a) | | the nature and quality of the advisory, administrative, and other services provided to the Funds by the Investment Adviser and its affiliates, including information about: |
| | (i) | | the structure, staff, and capabilities of the Investment Adviser and its portfolio management teams; |
| | (ii) | | the groups within the Investment Adviser and its affiliates that support the portfolio management teams or provide other types of necessary services, including fund services groups (e.g., accounting and financial reporting, tax, shareholder services and operations); controls and risk management groups (e.g., legal, compliance, valuation oversight, credit risk management, internal audit, compliance testing, market risk analysis, finance and strategy and central funding); sales and distribution support groups and others (e.g., information technology and training); |
| | (iii) | | trends in employee headcount; |
| | (iv) | | the Investment Adviser’s financial resources and ability to hire and retain talented personnel and strengthen its operations; and |
| | (v) | | the parent company’s support of the Investment Adviser and its mutual fund business, as expressed by the firm’s senior management; |
| | (b) | | information on the investment performance of each Fund, including comparisons to the performance of similar mutual funds, as provided by a third-party mutual fund data provider engaged as part of the contract review process (the “Outside Data Provider”), benchmark performance indices, and composites of accounts with comparable investment strategies managed by the Investment Adviser (with the exception of the Investment Grade Credit Fund), and general investment outlooks in the markets in which the Funds invest; |
| | (c) | | information provided by the Investment Adviser indicating the Investment Adviser’s views on whether a Fund’s peer group and/or benchmark index had high, medium, or low relevance given the Fund’s particular investment strategy; |
| | (d) | | the terms of the Management Agreement and other agreements with affiliated service providers entered into by the Trust on behalf of the Funds; |
| | (e) | | fee and expense information for the Funds, including: |
| | (i) | | the relative management fee and expense levels of each Fund as compared to those of comparable funds managed by other advisers, as provided by the Outside Data Provider; |
| | (ii) | | the expense trends over time of each Fund; and |
| | (iii) | | to the extent the Investment Adviser manages other types of accounts (such as bank collective trusts, private wealth management accounts, institutional separate accounts, sub-advised mutual funds, and non-U.S. funds) having investment objectives and policies similar to those of the Funds, comparative information on the advisory fees charged and services provided to those accounts by the Investment Adviser; |
| | (f) | | with respect to the extensive investment performance and expense comparison data provided by the Outside Data Provider, its processes in producing that data for the Funds; |
| | (g) | | the undertakings of the Investment Adviser to waive a portion of its management fees (with respect to the Dynamic Emerging Markets Debt, Investment Grade Credit, Local Emerging Markets Debt, and U.S. Mortgages Funds) and to |
180
GOLDMAN SACHS SINGLE SECTOR FIXED INCOME FUNDS
Statement Regarding Basis for Approval of Management Agreement (Unaudited) (continued)
| | limit certain expenses of each Fund that exceed specified levels, and a summary of contractual fee reductions made by the Investment Adviser and/or its affiliates over the past several years with respect to the Funds; |
| | (h) | | information relating to the profitability of the Management Agreement and the transfer agency and distribution and service arrangements of each Fund and the Trust as a whole to the Investment Adviser and its affiliates; |
| | (i) | | whether each Fund’s existing management fee schedule adequately addressed any economies of scale; |
| | (j) | | a summary of the “fall-out” benefits derived by the Investment Adviser and its affiliates from their relationships with the Funds, including the fees received by the Investment Adviser’s affiliates from the Funds for transfer agency, portfolio trading, distribution and other services; |
| | (k) | | a summary of potential benefits derived by the Funds as a result of their relationship with the Investment Adviser; |
| | (l) | | information regarding portfolio trading and how the Investment Adviser carries out its duty to seek best execution; |
| | (m) | | portfolio manager ownership of Fund shares; the manner in which portfolio manager compensation is determined; and the number and types of accounts managed by the portfolio managers; |
| | (n) | | the nature and quality of the services provided to the Funds by their unaffiliated service providers, and the Investment Adviser’s general oversight and evaluation (including reports on due diligence) of those service providers as part of the administration services provided under the Management Agreement; and |
| | (o) | | the Investment Adviser’s processes and policies addressing various types of potential conflicts of interest; its approach to risk management; the annual review of the effectiveness of the Funds’ compliance program; and periodic compliance reports. |
The Trustees also received an overview of the Funds’ distribution arrangements. They received information regarding the Funds’ assets, share purchase and redemption activity and the payment of Rule 12b-1 distribution and service fees by the Funds and non-Rule 12b-1 shareholder service and/or administration fees by the Dynamic Emerging Markets Debt, Emerging Markets Debt, High Yield, High Yield Floating Rate, and Local Emerging Markets Debt Funds. Information was also provided to the Trustees relating to revenue sharing payments made by and services provided by the Investment Adviser and its affiliates to intermediaries that promote the sale, distribution, and/or servicing of Fund shares.
The presentations made at the Board and Committee meetings and at the Annual Meeting encompassed the Funds and other mutual fund portfolios for which the Board of Trustees has responsibility. In evaluating the Management Agreement at the Annual Meeting, the Trustees relied upon their knowledge, resulting from their meetings and other interactions throughout the year, of the Investment Adviser and its affiliates, their services, and the Funds. In conjunction with these meetings, the Trustees received written materials and oral presentations on the topics covered, and were advised by their independent legal counsel regarding their responsibilities and other regulatory requirements related to the approval and continuation of mutual fund investment management agreements under applicable law. In addition, the Investment Adviser and its affiliates provided the Independent Trustees with a written response to a formal request for information sent on behalf of the Independent Trustees by their independent legal counsel. During the course of their deliberations, the Independent Trustees met in executive sessions with their independent legal counsel, without representatives of the Investment Adviser or its affiliates present. The Independent Trustees also discussed the broad range of other investment choices that are available to Fund investors, including the availability of comparable funds managed by other advisers.
Nature, Extent, and Quality of the Services Provided Under the Management Agreement
As part of their review, the Trustees considered the nature, extent, and quality of the services provided to the Funds by the Investment Adviser. In this regard, the Trustees considered both the investment advisory services and non-advisory services that are provided by the Investment Adviser and its affiliates. The Trustees noted the transition in the leadership and changes in personnel of various of the Investment Adviser’s portfolio management teams that had occurred in recent periods, and the ongoing recruitment efforts aimed at bringing high quality investment talent to the Investment Adviser. They also noted the Investment Adviser’s commitment to maintaining high quality systems. The Trustees concluded that the Investment Adviser continued to commit substantial financial and operational resources to the Funds and expressed confidence that the Investment Adviser would continue to do so in the future. The Trustees also recognized that the Investment Adviser had made significant commitments to address regulatory compliance requirements applicable to the Funds and the Investment Adviser.
Investment Performance
The Trustees also considered the investment performance of the Funds. In this regard, they compared the investment performance of each Fund to its peers using rankings and ratings (rankings only with respect to the Dynamic Emerging Markets Debt Fund, which commenced operations in 2013) compiled by the Outside Data Provider as of December 31, 2014, and updated performance information prepared by the Investment Adviser using the peer groups identified by the Outside Data Provider as of
181
GOLDMAN SACHS SINGLE SECTOR FIXED INCOME FUNDS
Statement Regarding Basis for Approval of Management Agreement (Unaudited) (continued)
March 31, 2015. The information on each Fund’s investment performance was provided for the one-, three-, five-, and ten-year periods ending on the applicable dates, to the extent that each Fund had been in existence for those periods. The Trustees also reviewed each Fund’s investment performance over time (including on a year-by-year basis) relative to its performance benchmark. As part of this review, they considered the investment performance trends of the Funds over time, and reviewed the investment performance of each Fund in light of its investment objective and policies and market conditions. The Trustees also received information comparing the Funds’ performance (with the exception of the Investment Grade Credit Fund) to that of composites of accounts with comparable investment strategies managed by the Investment Adviser.
In addition, the Trustees considered materials prepared and presentations made by the Investment Adviser’s senior management and portfolio management personnel, in which Fund performance was assessed. The Trustees also considered the Investment Adviser’s periodic reports with respect to the Funds’ risk profiles, and how the Investment Adviser’s approach to risk monitoring and management influences portfolio management.
The Trustees observed that the Dynamic Emerging Markets Debt Fund’s Institutional Shares had placed in the third quartile of the Fund’s peer group and had underperformed the Fund’s benchmark index for the one-year period ended March 31, 2015. They noted that the Emerging Markets Debt Fund’s Institutional Shares had placed in the first quartile of the Fund’s peer group for the one-, three-, five-, and ten-year periods, and had outperformed the Fund’s benchmark index for the ten-year period and underperformed for the one-, three-, and five-year periods ended March 31, 2015. They also noted changes to the Fund’s permissible investments in July 2014 that allow the Fund to invest in municipal securities. The Trustees noted that the High Yield Fund’s Institutional Shares had placed in the top half of the Fund’s peer group and had underperformed the Fund’s benchmark index for the one-, three-, five-, and ten-year periods ended March 31, 2015. They observed that the High Yield Floating Rate Fund’s Institutional Shares had placed in the first quartile of the Fund’s peer group for the one-year period and in the third quartile for the three-year period, and had underperformed the Fund’s benchmark index for the one- and three-year periods ended March 31, 2015. The Trustees noted that the Investment Grade Credit Fund’s Institutional Shares had placed in the second quartile of the Fund’s peer group for the one-, three-, and five-year periods and in the third quartile for the ten-year period, and had outperformed the Fund’s benchmark index for the three- and five-year periods and underperformed for the one- and ten-year periods ended March 31, 2015. They noted that the Local Emerging Markets Debt Fund’s Institutional Shares had placed in the fourth quartile of the Fund’s peer group and had underperformed the Fund’s benchmark index for the one-, three-, and five-year periods ended March 31, 2015. The Trustees considered that the U.S. Mortgages Fund’s Institutional Shares had placed in the first quartile of the Fund’s peer group for the one-, three-, five-, and ten-year periods, and had outperformed the Fund’s benchmark index for the one-, three-, and five-year periods and underperformed for the ten-year period ended March 31, 2015. They also noted changes to the Fund’s permissible investments in July 2014 that allow the Fund to invest in collateralized loan obligations.
Costs of Services Provided and Competitive Information
The Trustees considered the contractual terms of the Management Agreement and the fee rates payable by each Fund thereunder. In this regard, the Trustees considered information on the services rendered by the Investment Adviser to the Funds, which included both advisory and administrative services that were directed to the needs and operations of the Funds as registered mutual funds.
In particular, the Trustees reviewed analyses prepared by the Outside Data Provider regarding the expense rankings of the Funds. The analyses provided a comparison of the Funds’ management fees and breakpoints to those of relevant peer groups and category universes; an expense analysis which compared each Fund’s overall net and gross expenses to a peer group and a category universe; and a five-year history (or, in the case of Funds that commenced investment operations within a shorter period, since the year in which it commenced operations) comparing each Fund’s net expenses to the peer and category medians. The analyses also compared each Fund’s transfer agency, custody, and distribution fees, other expenses and fee waivers/reimbursements to those of the peer group and category medians. The Trustees concluded that the comparisons provided by the Outside Data Provider were useful in evaluating the reasonableness of the management fees and total expenses paid by the Funds.
In addition, the Trustees considered the Investment Adviser’s undertakings to waive a portion of its management fees (with respect to the Dynamic Emerging Markets Debt, Investment Grade Credit, Local Emerging Markets Debt, and U.S. Mortgages Funds) and to limit certain expenses of each Fund that exceed specified levels. They also considered, to the extent that the Investment Adviser manages other types of accounts having investment objectives and policies similar to those of the Funds, comparative fee information for services provided by the Investment Adviser to those accounts, and information that indicated that services provided to the Funds differed in various significant respects from the services provided to other types of accounts which, in many cases, operated under less stringent legal and regulatory structures, required fewer services from the Investment Adviser to a smaller number of client contact points, and were less time-intensive.
182
GOLDMAN SACHS SINGLE SECTOR FIXED INCOME FUNDS
Statement Regarding Basis for Approval of Management Agreement (Unaudited) (continued)
In addition, the Trustees noted that shareholders are able to redeem their Fund shares at any time if shareholders believe that the Fund fees and expenses are too high or if they are dissatisfied with the performance of the Fund.
Profitability
The Trustees reviewed the Investment Adviser’s revenues and pre-tax profit margins with respect to the Trust and each of the Funds. In this regard the Trustees noted that they had received, among other things, profitability analyses and summaries, revenue and expense schedules by Fund and by function (i.e., investment management, transfer agency and distribution and service), and information on the Investment Adviser’s expense allocation methodology. They observed that the profitability and expense figures are substantially similar to those used by the Investment Adviser for many internal purposes, including compensation decisions among various business groups, and are thus subject to a vigorous internal debate about how certain revenue and expenses should be allocated. The Trustees also noted that the internal audit group within the Goldman Sachs organization had audited the expense allocation methodology and was satisfied with the reasonableness, consistency, and accuracy of the Investment Adviser’s expense allocation methodology and profitability analysis calculations. Profitability data for the Trust and each Fund were provided for 2014 and 2013, and the Trustees considered this information in relation to the Investment Adviser’s overall profitability. The Trustees considered the Investment Adviser’s revenues and pre-tax profit margins both in absolute terms and in comparison to information on the reported pre-tax profit margins earned by certain other asset management firms.
Economies of Scale
The Trustees considered the information that had been provided regarding the Investment Adviser’s profitability. The Trustees also considered the breakpoints in the fee rate payable under the Management Agreement for each of the Funds at the following annual percentage rates of the average daily net assets of the Funds:
| | | | | | | | | | | | | | | | | | | | | | | | | | | | |
Average Daily Net Assets | | Dynamic
Emerging
Markets
Debt Fund | | | Emerging
Markets
Debt Fund | | | High Yield
Fund | | | High Yield
Floating
Rate Fund | | | Investment
Grade
Credit Fund | | | Local
Emerging
Markets
Debt Fund | | | U.S.
Mortgages
Fund | |
| First $1 billion | | | 0.90 | % | | | 0.80 | % | | | 0.70 | % | | | 0.60 | % | | | 0.40 | % | | | 0.90 | % | | | 0.40 | % |
| Next $1 billion | | | 0.90 | | | | 0.80 | | | | 0.70 | | | | 0.54 | | | | 0.36 | | | | 0.90 | | | | 0.36 | |
| Next $3 billion | | | 0.81 | | | | 0.72 | | | | 0.63 | | | | 0.51 | | | | 0.34 | | | | 0.81 | | | | 0.34 | |
| Next $3 billion | | | 0.77 | | | | 0.68 | | | | 0.60 | | | | 0.50 | | | | 0.33 | | | | 0.77 | | | | 0.33 | |
| Over $8 billion | | | 0.75 | | | | 0.67 | | | | 0.59 | | | | 0.49 | | | | 0.32 | | | | 0.75 | | | | 0.32 | |
The Trustees noted that the breakpoints were designed to share potential economies of scale, if any, with the Funds and their shareholders as assets under management reach those asset levels. The Trustees considered the amounts of assets in the Funds; the Funds’ recent share purchase and redemption activity; the information provided by the Investment Adviser relating to the costs of the services provided by the Investment Adviser and its affiliates and their realized profits; information comparing fee rates charged by the Investment Adviser with fee rates charged to other funds in the peer groups; and the Investment Adviser’s undertakings to waive a portion of its management fees (with respect to the Dynamic Emerging Markets Debt, Investment Grade Credit, Local Emerging Markets Debt, and U.S. Mortgages Funds) and to limit certain expenses of each Fund that exceed specified levels. Upon reviewing these matters at the Annual Meeting, the Trustees concluded that the fee breakpoints represented a means of assuring that benefits of scalability, if any, would be passed along to shareholders at the specified asset levels. They also noted that the Investment Adviser had passed along savings to shareholders of the High Yield and High Yield Floating Rate Funds, which each had asset levels above at least the first breakpoint during the prior fiscal year.
Other Benefits to the Investment Adviser and Its Affiliates
The Trustees also considered the other benefits derived by the Investment Adviser and its affiliates from their relationships with the Funds as stated above, including: (a) transfer agency fees received by Goldman, Sachs & Co. (“Goldman Sachs”); (b) futures commissions earned by Goldman Sachs for executing futures transactions on behalf of the Funds; (c) trading efficiencies resulting from aggregation of orders of the Funds with those for other funds or accounts managed by the Investment Adviser; (d) the Investment Adviser’s ability to leverage the infrastructure designed to service the Funds on behalf of its other clients; (e) the Investment Adviser’s ability to cross-market other products and services to Fund shareholders; (f) Goldman Sachs’ retention of certain fees as Fund Distributor; (g) the Investment Adviser’s ability to negotiate better pricing with custodians on behalf of its other clients, as a result of the relationship with the Funds; and (h) the possibility that the working relationship between the Investment Adviser and the Funds’ third-party service providers may cause those service providers to be more likely
183
GOLDMAN SACHS SINGLE SECTOR FIXED INCOME FUNDS
Statement Regarding Basis for Approval of Management Agreement (Unaudited) (continued)
to do business with other areas of Goldman Sachs. In the course of considering the foregoing, the Independent Trustees requested and received further information quantifying certain of these fall-out benefits.
Other Benefits to the Funds and Their Shareholders
The Trustees also noted that the Funds receive certain potential benefits as a result of their relationship with the Investment Adviser, including: (a) trading efficiencies resulting from aggregation of orders of the Funds with those of other funds or accounts managed by the Investment Adviser; (b) enhanced servicing from vendors because of the volume of business generated by the Investment Adviser and its affiliates; (c) enhanced servicing from broker-dealers because of the volume of business generated by the Investment Adviser and its affiliates; (d) the Investment Adviser’s ability to negotiate favorable terms with derivatives counterparties on behalf of the Funds as a result of the size and reputation of the Goldman Sachs organization; (e) the Investment Adviser’s knowledge and experience gained from managing other accounts and products; (f) the Investment Adviser’s ability to hire and retain qualified personnel to provide services to the Funds because of the reputation of the Goldman Sachs organization; (g) the Funds’ access, through the Investment Adviser, to certain firmwide resources (e.g., proprietary risk management systems and databases), subject to certain restrictions; and (h) the Funds’ access to certain affiliated distribution channels. In addition, the Trustees noted the competitive nature of the mutual fund marketplace, and considered that many of the Funds’ shareholders invested in the Funds in part because of the Funds’ relationship with the Investment Adviser and that those shareholders have a general expectation that the relationship will continue.
Conclusion
In connection with their consideration of the Management Agreement, the Trustees gave weight to each of the factors described above, but did not identify any particular factor as controlling their decision. After deliberation and consideration of all of the information provided, including the factors described above, the Trustees concluded, in the exercise of their business judgment, that the management fees paid by each of the Funds were reasonable in light of the services provided to it by the Investment Adviser, the Investment Adviser’s costs and each Fund’s current and reasonably foreseeable asset levels. The Trustees unanimously concluded that the Investment Adviser’s continued management likely would benefit each Fund and its shareholders and that the Management Agreement should be approved and continued with respect to each Fund until June 30, 2016.
184
FUNDS PROFILE
Goldman Sachs Funds

Goldman Sachs is a premier financial services firm, known since 1869 for creating thoughtful and customized investment solutions in complex global markets.
Today, the Investment Management Division of Goldman Sachs serves a diverse set of clients worldwide, including private institutions, public entities and individuals. With approximately $1.02 trillion in assets under supervision as of September 30, 2015, Goldman Sachs Asset Management (“GSAM”) has portfolio management teams located around the world and our investment professionals bring firsthand knowledge of local markets to every investment decision. Assets under supervision includes assets under management and other client assets for which Goldman Sachs does not have full discretion. GSAM leverages the resources of Goldman, Sachs & Co. subject to legal, internal and regulatory restrictions.

Money Market1
Financial Square FundsSM
| n | | Financial Square Tax-Exempt Funds |
| n | | Financial Square Treasury Solutions Fund2 |
| n | | Financial Square Government Fund |
| n | | Financial Square Money Market Fund |
| n | | Financial Square Prime Obligations Fund |
| n | | Financial Square Treasury Instruments Fund |
| n | | Financial Square Treasury Obligations Fund |
| n | | Financial Square Federal Instruments Fund |
Fixed Income
Short Duration and Government
| n | | High Quality Floating Rate Fund |
| n | | Limited Maturity Obligations Fund |
| n | | Short Duration Government Fund |
| n | | Short Duration Income Fund |
| n | | Inflation Protected Securities Fund |
Multi-Sector
Municipal and Tax-Free
| n | | High Yield Municipal Fund |
| n | | Dynamic Municipal Income Fund3 |
| n | | Short Duration Tax-Free Fund |
Single Sector
| n | | Investment Grade Credit Fund |
| n | | High Yield Floating Rate Fund |
| n | | Emerging Markets Debt Fund |
| n | | Local Emerging Markets Debt Fund |
| n | | Dynamic Emerging Markets Debt Fund |
Fixed Income Alternatives
| n | | Long Short Credit Strategies Fund |
| n | | Fixed Income Macro Strategies Fund |
Fundamental Equity
| n | | Small/Mid Cap Value Fund |
| n | | Small/Mid Cap Growth Fund |
| n | | Flexible Cap Growth Fund |
| n | | Concentrated Growth Fund |
| n | | Technology Opportunities Fund4 |
| n | | Growth Opportunities Fund |
| n | | Rising Dividend Growth Fund |
| n | | Dynamic U.S. Equity Fund5 |
Tax-Advantaged Equity
| n | | U.S. Tax-Managed Equity Fund |
| n | | International Tax-Managed Equity Fund |
| n | | U.S. Equity Dividend and Premium Fund |
| n | | International Equity Dividend and Premium Fund |
Equity Insights
| n | | Small Cap Equity Insights Fund |
| n | | U.S. Equity Insights Fund |
| n | | Small Cap Growth Insights Fund |
| n | | Large Cap Growth Insights Fund |
| n | | Large Cap Value Insights Fund |
| n | | Small Cap Value Insights Fund |
| n | | International Small Cap Insights Fund |
| n | | International Equity Insights Fund |
| n | | Emerging Markets Equity Insights Fund |
Fundamental Equity International
| n | | Strategic International Equity Fund |
| n | | Focused International Equity Fund |
| n | | International Small Cap Fund |
| n | | Emerging Markets Equity Fund6 |
Select Satellite7
| n | | Real Estate Securities Fund |
| n | | International Real Estate Securities Fund |
| n | | Global Real Estate Securities Fund |
| n | | Commodity Strategy Fund |
| n | | Dynamic Commodity Strategy Fund |
| n | | Dynamic Allocation Fund |
| n | | Absolute Return Tracker Fund |
| n | | Managed Futures Strategy Fund |
| n | | MLP Energy Infrastructure Fund |
| n | | Multi-Manager Alternatives Fund |
| n | | Multi-Asset Real Return Fund |
| n | | Retirement Portfolio Completion Fund |
| n | | Absolute Return Multi-Asset Fund |
Total Portfolio Solutions7
| n | | Global Managed Beta Fund |
| n | | Multi-Manager Non-Core Fixed Income Fund |
| n | | Multi-Manager U.S. Dynamic Equity Fund |
| n | | Multi-Manager Global Equity Fund |
| n | | Multi-Manager International Equity Fund |
| n | | Tactical Tilt Implementation Fund |
| n | | Balanced Strategy Portfolio |
| n | | Multi-Manager Real Assets Strategy Fund |
| n | | Growth and Income Strategy Portfolio |
| n | | Growth Strategy Portfolio |
| n | | Equity Growth Strategy Portfolio |
| n | | Satellite Strategies Portfolio |
| n | | Enhanced Dividend Global Equity Portfolio |
| n | | Tax Advantaged Global Equity Portfolio |
| 1 | | An investment in a money market fund is neither insured nor guaranteed by the Federal Deposit Insurance Corporation (“FDIC”) or any other government agency. Although the Funds seek to preserve the value of your investment at $1.00 per share, it is possible to lose money by investing in the Funds. |
| 2 | | Effective on September 30, 2015, the Goldman Sachs Financial Square Federal Fund was renamed the Goldman Sachs Financial Square Treasury Solutions Fund. |
| 3 | | Effective on December 18, 2014, the Goldman Sachs Municipal Income Fund was renamed the Goldman Sachs Dynamic Municipal Income Fund. |
| 4 | | Effective on July 31, 2015, the Goldman Sachs Technology Tollkeeper Fund was renamed the Goldman Sachs Technology Opportunities Fund. |
| 5 | | Effective on April 30, 2015, the Goldman Sachs U.S. Equity Fund was renamed the Goldman Sachs Dynamic U.S. Equity Fund. |
| 6 | | Effective at the close of business on October 23, 2015, the Goldman Sachs BRIC Fund (Brazil, Russia, India, China) was reorganized with and into the Goldman Sachs Emerging Markets Equity Fund. |
| 7 | | Individual Funds within the Total Portfolio Solutions and Select Satellite categories will have various placement on the risk/return spectrum and may have greater or lesser risk than that indicated by the placement of the general Total Portfolio Solutions or Select Satellite category. |
Financial Square FundsSM is a registered service mark of Goldman, Sachs & Co.
| *This | | list covers open-end funds only. Please visit our website at www.GSAMFUNDS.com to learn about our closed-end funds and exchange-traded funds. |
| | |
TRUSTEES Ashok N. Bakhru, Chairman Kathryn A. Cassidy John P. Coblentz, Jr. Diana M. Daniels Joseph P. LoRusso Herbert J. Markley James A. McNamara Jessica Palmer Alan A. Shuch Richard P. Strubel Roy W. Templin Gregory G. Weaver | | OFFICERS James A. McNamara, President Scott M. McHugh, Principal Financial Officer and Treasurer Caroline Kraus, Secretary |
| |
GOLDMAN, SACHS & CO. Distributor and Transfer Agent | | GOLDMAN SACHS ASSET MANAGEMENT, L.P. Investment Adviser |
Visit our web site at www.GSAMFUNDS.com to obtain the most recent month-end returns.
Goldman Sachs Asset Management, L.P., 200 West Street, New York, New York 10282
The reports concerning the Funds included in this shareholder report may contain certain forward-looking statements about the factors that may affect the performance of the Funds in the future. These statements are based on Fund management’s predictions and expectations concerning certain future events and their expected impact on the Funds, such as performance of the economy as a whole and of specific industry sectors, changes in the levels of interest rates, the impact of developing world events, and other factors that may influence the future performance of the Funds. Management believes these forward-looking statements to be reasonable, although they are inherently uncertain and difficult to predict. Actual events may cause adjustments in portfolio management strategies from those currently expected to be employed.
A description of the policies and procedures that the Funds use to determine how to vote proxies relating to portfolio securities and information regarding how a Fund voted proxies relating to portfolio securities during the most recent 12-month period ended June 30 is available (i) without charge, upon request by calling 1-800-526-7384 (for Retail Shareholders) or 1-800-621-2550 (for Institutional Shareholders); and (ii) on the Securities and Exchange Commission (“SEC”) web site at http://www.sec.gov.
The Funds file their complete schedule of portfolio holdings with the SEC for the first and third quarters of each fiscal year on Form N-Q. The Funds’ Forms N-Q are available on the SEC’s web site at http://www.sec.gov within 60 days after the Funds’ first and third fiscal quarters. The Funds’ Forms N-Q may be reviewed and copied at the SEC’s Public Reference Room in Washington, D.C. and information on the operation of the Public Reference Room may also be obtained by calling 1-800-SEC-0330. Forms N-Q may be obtained upon request and without charge by calling 1-800-526-7384 (for Retail Shareholders) or 1-800-621-2550 (for Institutional Shareholders).
Goldman, Sachs & Co. (‘‘Goldman Sachs’’) does not provide legal, tax or accounting advice. Any statement contained in this communication (including any attachments) concerning U.S. tax matters was not intended or written to be used, and cannot be used, for the purpose of avoiding penalties under the Internal Revenue Code, and was written to support the promotion or marketing of the transaction(s) or matter(s) addressed. Clients of Goldman Sachs should obtain their own independent tax advice based on their particular circumstances.
Fund holdings and allocations shown are as of September 30, 2015 and may not be representative of future investments. Fund holdings should not be relied on in making investment decisions and should not be construed as research or investment advice regarding particular securities. Current and future holdings are subject to risk.
The Global Industry Classification Standard (GICS) was developed by and is the exclusive property and a service mark of Morgan Stanley Capital International Inc. (MSCI) and Standard & Poor’s, a division of The McGraw-Hill Companies, Inc. (S&P) and is licensed for use by Goldman Sachs. Neither MSCI, S&P nor any other party involved in making or compiling the GICS or any GICS classifications makes any express or implied warranties or representations with respect to such standard or classification (or the results to be obtained by the use thereof), and all such parties hereby expressly disclaim all warranties of originality, accuracy, completeness, merchantability or fitness for a particular purpose with respect to any of such standard or classification. Without limiting any of the foregoing, in no event shall MSCI, S&P, any of their affiliates or any third party involved in making or compiling the GICS or any GICS classifications have any liability for any direct, indirect, special, punitive, consequential or any other damages (including lost profits) even if notified of the possibility of such damages.
The portfolio risk management process includes an effort to monitor and manage risk, but does not imply low risk.
This material is not authorized for distribution to prospective investors unless preceded or accompanied by a current Prospectus or summary prospectus, if applicable. Investors should consider a Fund’s objective, risks, and charges and expenses, and read the summary prospectus, if available, and/or the Prospectus carefully before investing or sending money. The summary prospectus, if available, and the Prospectus contain this and other information about a Fund and may be obtained from your Authorized Institution or from Goldman, Sachs & Co. by calling (retail – 1-800-526-7384) (institutional – 1-800-621-2550).
© 2015 Goldman Sachs. All rights reserved. 172506.MF.MED.TMPL/11/2015 SSFISAR-15/76.9k
(a) As of the end of the period covered by this report, the registrant has adopted a code of ethics that applies to the registrant’s principal executive officer, principal financial officer, principal accounting officer or controller, or persons performing similar functions, regardless of whether these individuals are employed by the registrant or a third party (the “Code of Ethics”).
(b) During the period covered by this report, no amendments were made to the provisions of the Code of Ethics.
(c) During the period covered by this report, the registrant did not grant any waivers, including an implicit waiver, from any provision of the Code of Ethics.
(d) A copy of the Code of Ethics is available as provided in Item 12(a)(1) of this report.
| ITEM 3. | AUDIT COMMITTEE FINANCIAL EXPERT. |
The registrant’s board of trustees has determined that the registrant has at least one “audit committee financial expert” (as defined in Item 3 of Form N-CSR) serving on its audit committee. John P. Coblentz, Jr. is the “audit committee financial expert” and is “independent” (as each term is defined in Item 3 of Form N-CSR).
| ITEM 4. | PRINCIPAL ACCOUNTANT FEES AND SERVICES. |
Table 1 — Items 4(a) - 4(d). The accountant fees below reflect the aggregate fees billed by all of the Funds of the Goldman Sachs Trust and includes the Goldman Sachs Funds to which this certified shareholder report relates.
| | | | | | | | | | | | |
| | | 2015 | | 2014 | | Description of Services Rendered |
| | | |
| | | | | | | | | | | | |
| | | |
Audit Fees: | | | | | | | | | | | | |
| | | |
• PricewaterhouseCoopers LLP
(“PwC”) | | | $ | 3,570,472 | | | | $ | 2,208,710 | | | Financial Statement audits. |
| | | |
Audit-Related Fees: | | | | | | | | | | | | |
| | | |
• PwC | | | $ | 0 | | | | $ | 0 | | | Other attest services. |
| | | |
Tax Fees: | | | | | | | | | | | | |
| | | |
• PwC | | | $ | 659,410 | | | | $ | 723,485 | | | Tax compliance services provided in connection with the preparation and review of registrant’s tax returns. |
Table 2 — Items 4(b)(c) & (d). Non-Audit Services to the Goldman Sachs Trust’s service affiliates * that were pre-approved by the Audit Committee of the Goldman Sachs Trust pursuant to Rule 2-01(c)(7)(ii) of Regulation S-X.
| | | | | | | | | | | | |
| | | 2015 | | 2014 | | Description of Services Rendered |
| | | |
| | | | | | | | | | | | |
| | | |
Audit-Related Fees: | | | | | | | | | | | | |
| | | |
• PwC | | | $ | 1,568,616 | | | | $ | 1,486,420 | | | Internal control review performed in accordance with Statement on Standards for Attestation Engagements No. 16. These fees are borne by the Funds’ Adviser. |
| * | These include the advisor (excluding sub-advisors) and any entity controlling, controlled by or under common control with the advisor that provides ongoing services to the registrant (hereinafter referred to as “service affiliates”). |
Item 4(e)(1) — Audit Committee Pre-Approval Policies and Procedures
Pre-Approval of Audit and Non-Audit Services Provided to the Funds of the Goldman Sachs Trust. The Audit and Non-Audit Services Pre-Approval Policy (the “Policy”) adopted by the Audit Committee of Goldman Sachs Trust (“GST”) sets forth the procedures and the conditions pursuant to which services performed by an independent auditor for GST may be pre-approved. Services may be pre-approved specifically by the Audit Committee as a whole or, in certain circumstances, by the Audit Committee Chairman or the person designated as the Audit Committee Financial Expert. In addition, subject to specified cost limitations, certain services may be pre-approved under the provisions of the Policy. The Policy provides that the Audit Committee will consider whether the services provided by an independent auditor are consistent with the Securities and Exchange Commission’s rules on auditor independence. The Policy provides for periodic review and pre-approval by the Audit Committee of the services that may be provided by the independent auditor.
De Minimis Waiver. The pre-approval requirements of the Policy may be waived with respect to the provision of non-audit services that are permissible for an independent auditor to perform, provided (1) the aggregate amount of all such services provided constitutes no more than five percent of the total amount of revenues subject to pre-approval that was paid to the independent auditors during the fiscal year in which the services are provided; (2) such services were not recognized by GST at the time of the engagement to be non-audit services; and (3) such services are promptly brought to the attention of the Audit Committee and approved prior to the completion of the audit by the Audit Committee or by one or more members of the Audit Committee to whom authority to grant such approvals has been delegated by the Audit Committee, pursuant to the pre-approval provisions of the Policy.
Pre-Approval of Non-Audit Services Provided to GST’s Investment Advisers. The Policy provides that, in addition to requiring pre-approval of audit and non-audit services provided to GST, the Audit Committee will pre-approve those non-audit services provided to GST’s investment advisers (and entities controlling, controlled by or under common control with the investment advisers that provide ongoing services to GST) where the engagement relates directly to the operations or financial reporting of GST.
Item 4(e)(2) – 0% of the audit-related fees, tax fees and other fees listed in Table 1 were approved by GST’s Audit Committee pursuant to the “de minimis” exception of Rule 2-01(c)(7)(i)(C) of Regulation S-X. In addition, 0% of the non-audit services to the GST’s service affiliates listed in Table 2 were approved by GST’s Audit Committee pursuant to the “de minimis” exception of Rule 2-01(c)(7)(i)(C) of Regulation S-X.
Item 4(f) – Not applicable.
Item 4(g) Aggregate Non-Audit Fees Disclosure
The aggregate non-audit fees billed to GST by PwC for the twelve months ended March 31, 2015 and March 31, 2014 were approximately $659,410 and $723,485 respectively. The aggregate non-audit fees billed to GST’s adviser and service affiliates by PwC for non-audit services for the twelve months ended December 31, 2014 and December 31, 2013 were approximately $10.2 million and $9.8 million respectively. With regard to the aggregate non-audit fees billed to GST’s adviser and service affiliates, the 2014 and 2013 amounts include fees for non-audit services required to be pre-approved [see Table 2] and fees for non-audit services that did not require pre-approval since they did not directly relate to GST’s operations or financial reporting.
Item 4(h) — GST’s Audit Committee has considered whether the provision of non-audit services to GST’s investment adviser and service affiliates that did not require pre-approval pursuant to paragraph (c)(7)(ii) of Rule 2-01 of Regulation S-X is compatible with maintaining the auditors’ independence.
| ITEM 5. | AUDIT COMMITTEE OF LISTED REGISTRANTS. |
| ITEM 6. | SCHEDULE OF INVESTMENTS. |
| | Schedule of Investments is included as part of the Report to Stockholders filed under Item 1. |
| ITEM 7. | DISCLOSURE OF PROXY VOTING POLICIES AND PROCEDURES FOR CLOSED-END MANAGEMENT INVESTMENT COMPANIES. |
| ITEM 8. | PORTFOLIO MANAGERS OF CLOSED-END MANAGEMENT INVESTMENT COMPANIES. |
| ITEM 9. | PURCHASES OF EQUITY SECURITIES BY CLOSED-END MANAGEMENT INVESTMENT COMPANY AND AFFILIATED PURCHASERS. |
| ITEM 10. | SUBMISSION OF MATTERS TO A VOTE OF SECURITY HOLDERS. |
| | There have been no material changes to the procedures by which shareholders may recommend nominees to the registrant’s board of trustees. |
| ITEM 11. | CONTROLS AND PROCEDURES. |
| | (a) | The registrant’s principal executive and principal financial officers, or persons performing similar functions have concluded that the registrant’s disclosure controls and procedures (as defined in Rule 30a-3(c) under the Investment Company Act of 1940, as amended (the “1940 Act”)) are effective as of a date within 90 days of the filing of this report that includes the disclosure required by this paragraph, based on the evaluation of these controls and procedures required by Rule 30a-3(b) under the 1940 Act and 15d-15(b) under the Securities Exchange Act of 1934, as amended. |
| | (b) | There were no changes in the registrant’s internal control over financial reporting (as defined in Rule 30a-3(d) under the 1940 Act) that occurred during the registrant’s second fiscal quarter of the period covered by this report that have materially affected, or are reasonably likely to materially affect, the registrant’s internal control over financial reporting. |
| | | | |
| (a)(1) | | Goldman Sachs Trust’s Code of Ethics for Principal Executive and Senior Financial Officers is incorporated by reference to Exhibit 12(a)(1) of the registrant’s Form N-CSR filed on July 8, 2015 for its International Equity Insights Funds. |
| | |
| (a)(2) | | Exhibit 99.CERT | | Certifications pursuant to Section 302 of the Sarbanes-Oxley Act of 2002 filed herewith. |
| | |
| (b) | | Exhibit 99.906CERT | | Certifications pursuant to Section 906 of the Sarbanes-Oxley Act of 2002 filed herewith. |
SIGNATURES
Pursuant to the requirements of the Securities Exchange Act of 1934 and the Investment Company Act of 1940, the registrant has duly caused this report to be signed on its behalf by the undersigned, thereunto duly authorized.
| | |
| | | Goldman Sachs Trust |
| |
| By: | | /s/ James A. McNamara |
| |
| | |
| | James A. McNamara |
| | President/Chief Executive Officer |
| | Goldman Sachs Trust |
| |
| Date: | | December 7, 2015 |
Pursuant to the requirements of the Securities Exchange Act of 1934 and the Investment Company Act of 1940, this report has been signed below by the following persons on behalf of the registrant and in the capacities and on the dates indicated.
| | |
| By: | | /s/ James A. McNamara |
| |
| | |
| | James A. McNamara |
| | President/Chief Executive Officer |
| | Goldman Sachs Trust |
| |
| Date: | | December 7, 2015 |
| |
| By: | | /s/ Scott McHugh |
| |
| | |
| | Scott McHugh |
| | Principal Financial Officer |
| | Goldman Sachs Trust |
| |
| Date: | | December 7, 2015 |