UNITED STATES
SECURITIES AND EXCHANGE COMMISSION
Washington, D.C. 20549
FORM N-CSR
CERTIFIED SHAREHOLDER REPORT OF REGISTERED
MANAGEMENT INVESTMENT COMPANIES
Investment Company Act file number 811-05349
Goldman Sachs Trust
(Exact name of registrant as specified in charter)
71 South Wacker Drive, Chicago, Illinois 60606
(Address of principal executive offices) (Zip code)
| | |
| Caroline Kraus, Esq. | | Copies to: |
| Goldman, Sachs & Co. | | Geoffrey R.T. Kenyon, Esq. |
| 200 West Street | | Dechert LLP |
| New York, New York 10282 | | 100 Oliver Street |
| | 40th Floor |
| | Boston, MA 02110-2605 |
(Name and address of agents for service)
Registrant’s telephone number, including area code: (312) 655-4400
Date of fiscal year end: August 31
Date of reporting period: February 29, 2016
| ITEM 1. | REPORTS TO STOCKHOLDERS. |
| | The Semi-Annual Report to Shareholders is filed herewith. |
Goldman Sachs Funds

| | | | |
| | |
| Semi-Annual Report | | | | February 29, 2016 |
| | |
| | | | Fundamental Equity Growth Funds |
| | | | Capital Growth |
| | | | Concentrated Growth |
| | | | Dynamic U.S. Equity* |
| | | | Flexible Cap Growth |
| | | | Focused Growth |
| | | | Growth Opportunities |
| | | | Small/Mid Cap Growth |
| | | | Strategic Growth |
| | | | Technology Opportunities** |
*Effective after the close of business on April 30, 2015, the Goldman Sachs U.S Equity Fund was renamed the Goldman Sachs Dynamic U.S. Equity Fund.
**Effective after the close of business on July 31, 2015, the Goldman Sachs Technology Tollkeeper Fund was renamed the Goldman Sachs Technology Opportunities Fund

Goldman Sachs Fundamental Equity Growth Funds
| n | | TECHNOLOGY OPPORTUNITIES |
| | | | |
TABLE OF CONTENTS | | | | |
| |
Investment Process | | | 1 | |
| |
Market Review | | | 2 | |
| |
Portfolio Management Discussions | | | 5 | |
| |
Schedules of Investments | | | 59 | |
| |
Financial Statements | | | 78 | |
| |
Financial Highlights | | | 88 | |
| |
Notes to Financial Statements | | | 106 | |
| |
Other Information | | | 126 | |
| | | | |
| | | |
| NOT FDIC-INSURED | | May Lose Value | | No Bank Guarantee |
GOLDMAN SACHS FUNDAMENTAL EQUITY GROWTH FUNDS
What Differentiates the Goldman Sachs Growth Team’s Investment Process?
For over 30 years, the Goldman Sachs Growth Team has consistently applied a three-step investment process based on our belief that wealth is created through the long-term ownership of growing businesses.


| n | | Make decisions as long-term business owners rather than as stock traders |
| n | | Perform in-depth, fundamental research |
| n | | Focus on long-term structural and competitive advantages |
Result
Performance driven by the compounding growth of businesses over time — not short-term market movements
Long-term participation in growing businesses — less reliance on macroeconomic predictions, market timing, sector rotation or momentum

Identify high quality growth businesses. Some required investment criteria include:
| n | | Established brand names |
| n | | Recurring revenue streams |
| n | | Long product life cycles |
| n | | Favorable long-term growth prospects |
Result
Investments in businesses that we believe are strategically positioned for consistent, sustainable long-term growth

| n | | Perform rigorous valuation analysis of every potential investment |
| n | | Use valuation tools and analytics to ensure that the high-quality business franchises we have identified also represent sound investments |
Result
Good investment decisions based on solid understanding of what each business is worth
Attractive buying opportunities as the stock prices of quality growth businesses fluctuate over time
1
MARKET REVIEW
Goldman Sachs Fundamental Equity Growth Funds
Market Review
Overall, U.S. equities struggled during the six months ended February 29, 2016 (the “Reporting Period”) amidst persistent volatility. The Standard & Poor’s 500® Index (the “S&P 500 Index”) ended the Reporting Period with a decline of 0.92%. The Russell 3000® Index generated a return of -2.20%. Central bank policy, a commodity price sell-off, geopolitical tensions, and China and global economic growth concerns were the key themes impacting U.S. equities throughout the Reporting Period.
Following a volatile summer, U.S. equities tumbled further in September 2015, alongside other global equity markets. Equity markets continued to fret about weak macroeconomic data from China and the global implications of that data. Further, the U.S. Federal Reserve (the “Fed”) elected not to raise interest rates in September 2015, thus seemingly reaffirming persistent concerns about the many sources of economic instability and slowing economic growth. Still, domestic economic news was rather positive. U.S. economic growth for the second quarter of 2015 was revised up to an annualized rate of 3.9%, led by stronger consumer and construction spending. Job growth for August 2015 was slightly below consensus expectations, but the unemployment rate continued to decline.
October 2015 saw a strong rebound for U.S. equities. U.S. equity markets maintained their focus on the timing of the Fed’s initial rate hike, and expectations of “lift off,” the term used for that initial rate hike, in December 2015 increased following comments from the Fed regarding solid consumer spending and strength in the housing market. U.S. Gross Domestic Product (“GDP”) growth for the third quarter of 2015 came in at 1.5%, which was generally in line with consensus expectations.
The S&P 500 Index finished November 2015 roughly flat, although this masked a mid-month sell-off, as market expectations of a December 2015 rate hike rose significantly and dampened investor sentiment following a strong October 2015 non-farm payrolls report and hawkish comments from Fed members at the Fed’s October 2015 meeting. However, the message that the U.S. economy was strong enough to withstand higher interest rates, along with an emphasis by the Fed that any tightening would be gradual, sparked a rally in the U.S. equity markets. Economic data was also relatively strong in November 2015, with third quarter 2015 GDP revised up to 2.1%. In December 2015, the Fed finally delivered, as largely expected by markets, and voted unanimously for a 25 basis point hike in the targeted federal funds rate, its first rate hike since 2006. (A basis point is 1/100th of a percentage point.) The fairly dovish language in the Fed’s announcement, which re-emphasized “gradual” adjustments to policy going forward, helped to somewhat assuage the markets. (Dovish language or action tends to be that which is not strong or aggressive (opposite of hawkish).)
Early in 2016, U.S. equities were embroiled in what was a global rout, triggered by investor concerns of an intensifying economic slowdown in China and exacerbated by a plunge in oil prices to less than $30 per barrel, the lowest level since 2003. The Fed’s statement in January 2016 acknowledged the risks from international markets and tightening financial conditions on the U.S. economy. Its statement was also somewhat bearish on economic growth, noting that activity had slowed in 2015. Indeed, U.S. GDP economic growth had slowed in the fourth quarter of 2015 according to preliminary estimates, expanding by just 0.7%, thus bringing the 2015 annual growth rate to 2.4%. While the Fed acknowledged further recovery in the U.S. labor market, its language on its inflation outlook was more dovish.
Market sentiment appeared to improve in February 2016 as central banks outside of the U.S. increasingly acknowledged rising economic risks and sent a more dovish signal, fueling
2
MARKET REVIEW
market expectations of further easing. For example, European Central Bank president Mario Draghi hinted at further stimulus. The People’s Bank of China signaled further monetary easing and a 50 basis point cut in its reserve requirement ratio for banks. Fed Chair Janet Yellen similarly released generally dovish remarks, stressing that the Fed was not on a “pre-set” path for hikes. U.S. equities were also supported during the month by strong U.S. economic data, rallying as fourth quarter 2015 GDP was revised up to 1.0%, coming in above consensus expectations. Also, the U.S. unemployment rate declined to an eight-year low of 4.9%, while retail sales increased 0.2% in January 2016, with the less volatile core retail sales figure increasing 0.6%. Further adding support to the U.S. equity market in the latter half of February 2016 was the oil price recovery, albeit modest, from its trough point on news of talks between oil producers to cap production.
For the Reporting Period overall, all market capitalizations posted negative returns, but large-cap companies performed least poorly, followed by mid-cap companies. Small-cap companies were weakest. Growth stocks outpaced value stocks within the large-cap segment of the U.S. equity market, but value stocks outperformed growth stocks in the mid-cap and small-cap segments of the U.S. equity market. (All as measured by Russell Investments indices.)
Looking Ahead
At the end of the Reporting Period, we expected positive, but below average, returns for global equities in 2016 overall in light of modest economic growth forecasts and rising valuations in some areas of the market. However, in our view, equities still looked more attractive than other asset classes in a persistently low-return environment.
After dipping in 2015, we expect global economic growth to increase modestly in 2016, which we think will be enough to sustain corporate profitability and allow stock prices to move higher. In our view, central banks are likely to remain accommodative given still-fragile global economic growth, which we also see as helpful for equity markets. Even in the U.S., where Fed policy has moved toward normalization, we do not expect to see much negative impact from what are likely to be gradual interest rate increases given continued strength in the housing and labor markets. However, the strong U.S. dollar may well remain a headwind for U.S. multinational markets.
While the macro outlook remains benign, U.S. credit and equities reflect some typical late-cycle signs, such as more shareholder-friendly actions, an increase in merger and acquisition activity and a pick-up in leverage, all of which tend to coincide with an environment lacking top-line, or revenue, growth. Higher equity valuations are also consistent with late-cycle indicators. In part due to years of ultra-low interest rates, U.S. equity market valuations have risen toward fair value, in our opinion, with some areas looking particularly vulnerable if companies cannot deliver growth.
One common theme across the developed markets is that we believe domestically-focused companies in the major regions could benefit from increasing domestic consumption while being more insulated from currency volatility. In the U.S., we expect that the strong dollar could continue to be a headwind for many globally-exposed companies but believe the consumer remains healthy.
We also believe that some extraordinary dynamics in the U.S. equity market in 2015 may have set up investment opportunities for 2016. The extremely narrow trading breadth of the market hit a 30-year low. For example, just ten stocks accounted for approximately 40% of the total positive contribution to the S&P 500 Index return in 2015. Also, value stocks notably
3
MARKET REVIEW
underperformed growth stocks in 2015. We expect some broadening of the market and reversal of these trends in 2016, as investors focus on the risk of high-priced stocks as well as on the relative attractiveness of the hundreds of stocks trading below the market multiple.
Regardless of market direction, our fundamental, bottom-up stock selection continues to drive our process, rather than headlines or sentiment. We maintain confidence in the companies the Funds own and believe they have the potential to outperform relative to the broader market regardless of economic growth conditions. As always, we maintain our focus on seeking to invest in companies that we believe will generate long-term growth in today’s ever-changing market conditions.
|
| |
| Changes to the Funds’ Portfolio Management Team during the Reporting Period |
| |
| In September 2015, as part of our ongoing commitment to identify strong talent and invest in our team, we added three new members to the investment team. Jessica Katz joins the firm as a Vice President, serving as a Sector Portfolio Manager in the industrials sector across the market capitalization range. Jessica has 10 years of industry experience and joins us from Eaton Vance, where she served as a member on the Large Cap Growth Team, covering the industrials and energy sectors. Prior to Eaton Vance, she held a variety of roles at Fidelity Investments, including equity research. Jessica now works alongside our current Sector Portfolio Managers, Gerald Maris and Diego Lozada-Ghirardi. Additionally, we took the opportunity to deepen the talent on our team by inviting Himanshu Gupta and Juhi Kashyap to join us as Research Analysts. Both Himanshu and Juhi join as Associates from within the firm. Himanshu has supported the Growth Team in a broader research capacity within GSAM over the past five years. He continues to work with our health care Sector Portfolio Managers, Timothy Leahy and Anant Padmanabhan. Juhi now works directly with Daniel Zimmerman to cover the financials sector. She started her career in the firm’s Investment Banking Division covering financial institutions. |
4
PORTFOLIO RESULTS
Goldman Sachs Capital Growth Fund
Portfolio Composition
The Fund invests primarily in U.S. equity investments. Since the Fund’s inception, the Goldman Sachs Growth Equity Investment Team has focused on several key investment criteria that it believes can drive a company’s growth over the long term. These characteristics are: dominant market share, established brand name, pricing power, recurring revenue stream, free cash flow, high returns on invested capital, predictable growth, sustainable growth, long product life cycle, enduring competitive advantage, favorable demographic trends and excellent management. The Team strives to purchase these companies at reasonable valuations in order to capture the full benefits of their growth.
Portfolio Management Discussion and Analysis
Below, the Goldman Sachs Growth Equity Investment Team discusses the Goldman Sachs Capital Growth Fund’s (the “Fund”) performance and positioning for the six-month period ended February 29, 2016 (the “Reporting Period”).
| Q | | How did the Fund perform during the Reporting Period? |
| A | | During the Reporting Period, the Fund’s Class A, C, Institutional, Service, IR, R and R6 Shares generated cumulative total returns, without sales charges, of -4.97%, -5.35%, -4.83%, -5.03%, -4.89%, -5.10% and -4.80%, respectively. These returns compare to the -1.22% cumulative total return of the Fund’s benchmark, the Russell 1000® Growth Index (with dividends reinvested) (the “Russell Index”), during the same period. |
| Q | | What key factors were responsible for the Fund’s performance during the Reporting Period? |
| A | | Stock selection overall detracted from the Fund’s performance relative to the Russell Index during the Reporting Period. Sector allocation as a whole also detracted, albeit much more modestly. |
| Q | | Which equity market sectors most significantly affected Fund performance? |
| A | | Detracting from the Fund’s relative results most was weak stock selection in the health care, information technology and consumer staples sectors. The only two sectors to contribute positively to the Fund’s relative performance during the Reporting Period were energy and materials, wherein effective stock selection drove results. |
| Q | | Which stocks detracted significantly from the Fund’s performance during the Reporting Period? |
| A | | Detracting most from the Fund’s results relative to its benchmark index were positions in global apparel company PVH, biotechnology firm Vertex Pharmaceuticals and molecular diagnostics company Cepheid. |
| | PVH was the top detractor from the Fund’s results during the Reporting Period. Weakness in the U.S. retail environment, high promotions in the industry, and currency headwinds pressured the company’s results. Despite these concerns, which we see as short-term in nature, we believed at the end of the Reporting Period that PVH remained a leading franchise with dominant market share, strong pricing power and solid fundamentals. Particularly, we believe that established brand names Tommy Hilfiger and Calvin Klein have demonstrated international strength and have been a key source of growth. In our view, PVH was undervalued relative to its peers at the end of the Reporting Period, and we remained optimistic on what we see as the company’s significant free cash flow generation ability, quality of management and return potential. |
| | Vertex Pharmaceuticals was a top detractor from the Fund’s performance during the Reporting Period. Primarily, its weakness was driven, in our view, by fourth quarter 2015 results that were below consensus expectations. The company attributed part of the miss to a slowdown in new patient growth due to clinic capacity restraints, creating a patient backlog. We believe Vertex Pharmaceuticals boasts strong underlying fundamentals and a promising product pipeline with significant short-term and long-term catalysts. At the end of the Reporting Period, we believed the company, led by what we consider to be a capable management team, could continue to see growth given its dominant market share in its space and given geographic expansionary efforts that have contributed to meaningful profitability. |
5
PORTFOLIO RESULTS
| | Cepheid’s release of its third quarter 2015 earnings negatively pressured its share price during the Reporting Period. Its management cited the integration and productivity implications of doubling its U.S. salesforce as the primary driver behind its earnings miss. By the end of the Reporting Period, we believed the company had more time to train and integrate its new salesforce and thus further believed the company was poised well for growth. We maintained confidence in the actions its management was taking to accelerate the company’s growth profile. In our view, Cepheid remained the dominant molecular diagnostics platform at the end of the Reporting Period. |
| Q | | What were some of the Fund’s best-performing individual stocks? |
| A | | The Fund benefited most relative to the Russell Index from positions in data center real estate investment trust (“REIT”) Equinix, flavor food products manufacturer McCormick and tobacco company Philip Morris International. |
| | Equinix was a strong contributor to the Fund’s performance during the Reporting Period. The company announced high quality results for the second and third quarters of 2015, as secular growth in enterprise spending helped drive organic revenue growth and bookings to record levels. Also, solid performance in all regions in which the REIT operates led Equinix to raise guidance across key metrics during the Reporting Period, which was well received by the markets. In our view, Equinix continued at the end of the Reporting Period to present a favorable outlook, as pricing has been net positive in the low churn rate, or turnover, environment. Going forward, we believe Equinix may further benefit from its recurring revenue business model, steady demand environment, and integration of recent acquisitions that we believe could unlock significant synergies. |
| | Shares of McCormick rose, as the company benefited from strong fourth quarter 2015 results, with earnings coming in slightly above consensus estimates. The positive results were driven by a broad improvement in organic growth across its consumer and industrial businesses. At the end of the Reporting Period, we were encouraged by the better earnings visibility and improving momentum in McCormick’s consumer business. We believed the company might benefit from the secular growth in healthy cooking and the stabilization of private label competitors across many of its core spice categories. We further believed the company had the ability to continue to unlock growth given its global expansion efforts and product popularity. Finally, in our view, |
| | McCormick is led by a quality management team, which is capable of producing strong results moving forward. |
| | Philip Morris International was a top contributor to the Fund’s results, as the company executed well and reported solid third and fourth quarter 2015 earnings. At the end of the Reporting Period, we thought Philip Morris International was back on track fundamentally, with underlying momentum continuing to build. In our view, the company is among the highest quality large-cap consumer staples companies, with strong pricing power driving faster profit growth, what we consider to be an attractive margin and return profile, and a compelling dividend yield. |
| Q | | How did the Fund use derivatives and similar instruments during the Reporting Period? |
| A | | During the Reporting Period, we did not use derivatives as part of an active management strategy. |
| Q | | Did the Fund make any significant purchases or sales during the Reporting Period? |
| A | | We initiated a Fund position in fast-food retail giant McDonald’s. We believe improving sales and reductions in costs should lead to earnings upside and margin expansion. We further think that McDonald’s reduction in capital expenditures and further refranchising could lead to improving return on invested capital and free up additional capital to repurchase stock. In our view, McDonald’s is a high quality franchise with a proficient management team and what we consider to be attractive opportunities to drive top-line growth and earnings. |
| | We established a Fund position in Reynolds American, which is a holding company that manufactures and sells cigarettes in the U.S. We believe the industry backdrop remains favorable for tobacco companies. In our view, Reynolds American is well positioned to benefit from this industry backdrop during the next few years. |
| | Conversely, we exited the Fund’s position in research-based biopharmaceutical company AbbVie. While we continue to like the company, we believe the risk/reward opportunities are greater within others in the industry. |
| | We sold the Fund’s position in consumer products company Colgate-Palmolive. While we believe Colgate-Palmolive to be a quality business, we think there are better opportunities with more encouraging catalysts elsewhere in the industry. Additionally, we believe it is possible that Colgate-Palmolive could see an earnings decrease in the near term, as foreign |
6
PORTFOLIO RESULTS
| | currency pressures continue to impact the company. As a result, we decided to exit the position and pursue higher conviction ideas. |
| Q | | Were there any notable changes in the Fund’s weightings during the Reporting Period? |
| A | | In constructing the Fund’s portfolio, we focus on picking stocks rather than on making industry or sector bets. We seek to outpace the benchmark index by overweighting stocks that we expect to outperform and underweighting those that we think may lag. Consequently, changes in its sector weights are generally the direct result of individual stock selection or of stock appreciation or depreciation. That said, during the Reporting Period, the Fund’s exposure to information technology increased and its allocations to consumer staples and financials decreased relative to the Russell Index. |
| Q | | How was the Fund positioned relative to its benchmark index at the end of the Reporting Period? |
| A | | At the end of the Reporting Period, the Fund had an overweighted position relative to the Russell Index in the consumer discretionary sector. On the same date, the Fund had underweighted positions compared to the Russell Index in consumer staples, health care and industrials. The Fund was rather neutrally weighted to the Russell Index in energy, financials, information technology and materials and had no position at all in utilities or telecommunication services at the end of the Reporting Period. |
7
FUND BASICS
Capital Growth Fund
as of February 29, 2016
| | | | | | | | | | |
| | PERFORMANCE REVIEW | |
| | | September 1, 2015–February 29, 2016 | | Fund Total Return
(based on NAV)1 | | | Russell 1000®
Growth Index2 | |
| | Class A | | | -4.97 | % | | | -1.22 | % |
| | Class C | | | -5.35 | | | | -1.22 | |
| | Institutional | | | -4.83 | | | | -1.22 | |
| | Service | | | -5.03 | | | | -1.22 | |
| | Class IR | | | -4.89 | | | | -1.22 | |
| | Class R | | | -5.10 | | | | -1.22 | |
| | | Class R6 | | | -4.80 | | | | -1.22 | |
| | 1 | | The net asset value (“NAV”) represents the net assets of the class of the Fund (ex-dividend) divided by the total number of shares of the class outstanding. The Fund’s performance reflects the reinvestment of dividends and other distributions. The Fund’s performance does not reflect the deduction of any applicable sales charges. |
| | 2 | | The Russell 1000® Growth Index (with dividends reinvested) is an unmanaged index that measures the performance of those Russell 1000 companies with higher price-to-book ratios and higher forecasted growth values. The Index figures do not reflect any deduction for fees, expenses or taxes. It is not possible to invest directly in an index. |
| | | | | | | | | | | | | | | | | | | | |
| | STANDARDIZED TOTAL RETURNS3 |
| | | For the period ended 12/31/15 | | One Year | | | Five Years | | | Ten Years | | | Since Inception | | | Inception Date |
| | Class A | | | -3.66 | % | | | 10.99 | % | | | 6.49 | % | | | 9.04 | % | | 4/20/90 |
| | Class C | | | 0.17 | | | | 11.41 | | | | 6.30 | | | | 5.21 | | | 8/15/97 |
| | Institutional | | | 2.36 | | | | 12.69 | | | | 7.52 | | | | 6.41 | | | 8/15/97 |
| | Service | | | 1.79 | | | | 12.13 | | | | 6.98 | | | | 5.89 | | | 8/15/97 |
| | Class IR | | | 2.19 | | | | 12.53 | | | | N/A | | | | 6.93 | | | 11/30/07 |
| | Class R | | | 1.66 | | | | 11.96 | | | | N/A | | | | 6.40 | | | 11/30/07 |
| | | Class R6 | | | N/A | | | | N/A | | | | N/A | | | | -3.96 | | | 7/31/15 |
| | 3 | | The Standardized Total Returns are average annual total returns as of the most recent calendar quarter-end or cumulative total returns for periods less than 1 year. They assume reinvestment of all distributions at NAV. These returns reflect a maximum initial sales charge of 5.5% for Class A Shares and the assumed contingent deferred sales charge for Class C Shares (1% if redeemed within 12 months of purchase). Because Institutional, Service, Class IR, Class R and Class R6 Shares do not involve a sales charge, such a charge is not applied to their Standardized Total Returns. |
The returns set forth in the tables above represent past performance. Past performance does not guarantee future results. The Fund’s investment return and principal value will fluctuate so that an investor’s shares, when redeemed, may be worth more or less than their original cost. Current performance may be lower or higher than the performance quoted above. Please visit our web site at www.GSAMFUNDS.com to obtain the most recent month-end returns. Performance reflects applicable fee waivers and/or expense limitations in effect during the periods shown. In their absence, performance would be reduced. Returns do not reflect the deduction of taxes that a shareholder would pay on Fund distributions or the redemption of Fund shares.
8
FUND BASICS
| | | | | | | | | | |
| | EXPENSE RATIOS4 | |
| | | | | Net Expense Ratio (Current) | | | Gross Expense Ratio (Before Waivers) | |
| | Class A | | | 1.15 | % | | | 1.49 | % |
| | Class C | | | 1.90 | | | | 2.25 | |
| | Institutional | | | 0.75 | | | | 1.09 | |
| | Service | | | 1.25 | | | | 1.60 | |
| | Class IR | | | 0.90 | | | | 1.24 | |
| | Class R | | | 1.40 | | | | 1.74 | |
| | | Class R6 | | | 0.73 | | | | 1.07 | |
| | 4 | | The expense ratios of the Fund, both current (net of applicable fee waivers and/or expense limitations) and before waivers (gross of applicable fee waivers and/or expense limitations) are as set forth above according to the most recent publicly available Prospectus for the Fund and may differ from the expense ratios disclosed in the Financial Highlights in this report. Pursuant to a contractual arrangement, the Fund’s waivers and/or expense limitations will remain in place through at least December 29, 2016, and prior to such date the investment adviser may not terminate the arrangements without the approval of the Fund’s Board of Trustees. If these arrangements are discontinued in the future, the expense ratios may change without shareholder approval. |
| | | | | | | | |
| | TOP TEN HOLDINGS AS OF 2/29/165 |
| | | Holding | | % of Net Assets | | | Line of Business |
| | Apple, Inc. | | | 6.0 | % | | Computers & Peripherals |
| | MasterCard, Inc. Class A | | | 2.8 | | | IT Services |
| | Facebook, Inc. Class A | | | 2.7 | | | Internet Software & Services |
| | Amazon.com, Inc. | | | 2.6 | | | Internet & Catalog Retail |
| | The Home Depot, Inc. | | | 2.4 | | | Specialty Retail |
| | The Walt Disney Co. | | | 2.3 | | | Media |
| | Alphabet, Inc. Class A | | | 2.2 | | | Internet Software & Services |
| | Alphabet, Inc. Class C | | | 2.2 | | | Internet Software & Services |
| | Honeywell International, Inc. | | | 2.0 | | | Aerospace & Defense |
| | | The Coca-Cola Co. | | | 1.9 | | | Beverages |
| | 5 | | The top 10 holdings may not be representative of the Fund’s future investments. |
9
FUND BASICS
| | |
| FUND VS. BENCHMARK SECTOR ALLOCATION6 |
| As of February 29, 2016 | | |
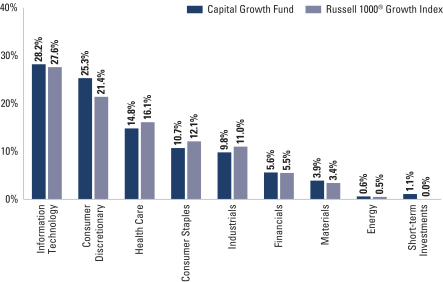
| | 6 | | The Fund is actively managed and, as such, its composition may differ over time. Consequently, the Fund’s overall sector allocations may differ from the percentages contained in the graph above. The graph categorizes investments using the Global Industry Classification Standard (“GICS”), however, the sector classifications used by the portfolio management team may differ from GICS. The percentage shown for each investment category reflects the value of investments in that category as a percentage of market value. Short-term investments represent repurchase agreements. The graph depicts the Fund’s investments but may not represent the Fund’s market exposure due to the exclusion of certain derivatives, if any, as listed in the Additional Investment Information section of the Schedule of Investments. |
10
PORTFOLIO RESULTS
Goldman Sachs Concentrated Growth Fund
Portfolio Composition
The Fund invests primarily in U.S. equity investments. The Fund typically holds 30-45 high quality growth companies and tends to be more concentrated in individual holdings, industries and sectors than the typical broadly diversified large-cap growth fund. Since the Fund’s inception, the Goldman Sachs Growth Equity Investment Team has focused on several key investment criteria that it believes can drive a company’s growth over the long term. These characteristics are: dominant market share, established brand name, pricing power, recurring revenue stream, free cash flow, high returns on invested capital, predictable growth, sustainable growth, long product life cycle, enduring competitive advantage, favorable demographic trends and excellent management. The Team strives to purchase these companies at reasonable valuations in order to capture the full benefits of their growth.
Portfolio Management Discussion and Analysis
Below, the Goldman Sachs Growth Equity Investment Team discusses the Goldman Sachs Concentrated Growth Fund’s (the “Fund”) performance and positioning for the six-month period ended February 29, 2016 (the “Reporting Period”).
| Q | | How did the Fund perform during the Reporting Period? |
| A | | During the Reporting Period, the Fund’s Class A, C, Institutional, IR, R and R6 Shares generated cumulative total returns, without sales charges, of -5.49%, -5.87%, -5.30%, -5.36%, -5.55% and -5.28%, respectively. These returns compare to the -1.22% cumulative total return of the Fund’s benchmark, the Russell 1000® Growth Index (with dividends reinvested) (the “Russell Index”), during the same period. |
| Q | | What key factors were responsible for the Fund’s performance during the Reporting Period? |
| A | | Stock selection overall detracted from the Fund’s performance relative to the Russell Index during the Reporting Period. Sector allocation as a whole also detracted, albeit much more modestly. |
| Q | | Which equity market sectors most significantly affected Fund performance? |
| A | | Challenging stock selection in the information technology, health care and consumer staples sectors detracted from the Fund’s relative results most during the Reporting Period. The only sector to contribute positively to the Fund’s relative performance during the Reporting Period was financials, wherein effective stock selection drove results. |
| Q | | Which stocks detracted significantly from the Fund’s performance during the Reporting Period? |
| A | | Detracting most from the Fund’s results relative to its benchmark index were positions in global apparel company PVH, education loan provider SLM (“Sallie Mae”) and biotechnology firm Vertex Pharmaceuticals. |
| | PVH was the top detractor from the Fund’s results during the Reporting Period. Weakness in the U.S. retail environment, high promotions in the industry, and currency headwinds, including a strong U.S. dollar, pressured the company’s results. Despite these concerns, which we see as short-term in nature, we believed at the end of the Reporting Period that PVH remained a leading franchise with dominant market share, strong pricing power and solid fundamentals. Particularly, we believe that established brand names Tommy Hilfiger and Calvin Klein have demonstrated international strength and have been a key source of growth. In our view, PVH was undervalued relative to its peers at the end of the Reporting Period, and we remained optimistic on what we see as the company’s significant free cash flow generation ability, quality of management and return potential. |
| | Shares of Sallie Mae were weak during the Reporting Period because of political uncertainty around policies in education financing. However, the company reported third quarter 2015 results with earnings ahead of market estimates. At the end of the Reporting Period, we believed Sallie Mae continued to demonstrate dominant and growing share in its market, with |
11
PORTFOLIO RESULTS
| | a quality and tenured management team. The company was also well positioned, in our view, to benefit from macro-oriented trends, such as the rise in interest rates and in financial activity. |
| | Vertex Pharmaceuticals was a top detractor from the Fund’s performance during the Reporting Period. Primarily, its weakness was driven, in our view, by fourth quarter 2015 results that were below consensus expectations. The company attributed part of the miss to a slowdown in new patient growth due to clinic capacity restraints, creating a patient backlog. We believe Vertex Pharmaceuticals boasts strong underlying fundamentals and a promising product pipeline with significant short-term and long-term catalysts. At the end of the Reporting Period, we believed the company, led by what we consider to be a capable management team, could continue to see growth given its dominant market share in its space and given geographic expansionary efforts that have contributed to meaningful profitability. |
| Q | | What were some of the Fund’s best-performing individual stocks? |
| A | | The Fund benefited most relative to the Russell Index from positions in data center real estate investment trust (“REIT”) Equinix, online social media platform Facebook and flavor food products manufacturer McCormick. |
| | Equinix was a strong contributor to the Fund’s performance during the Reporting Period. The company announced high quality results for the second and third quarters of 2015, as secular growth in enterprise spending helped drive organic revenue growth and bookings to record levels. Also, solid performance in all regions in which the REIT operates led Equinix to raise guidance across key metrics during the Reporting Period, which was well received by the markets. In our view, Equinix continued at the end of the Reporting Period to present a favorable outlook, as pricing has been net positive in the low churn rate, or turnover, environment. Going forward, we believe Equinix may further benefit from its recurring revenue business model, steady demand environment, and integration of recent acquisitions that we believe could unlock significant synergies. |
| | Facebook was a top positive contributor to the Fund’s relative results during the Reporting Period. The company reported strong fourth quarter 2015 results in January 2016, underpinned by advertisement revenue growth well above market expectations. At the end of the Reporting Period, we remained positive on Facebook’s high operating expenditures, at what we consider to be manageable levels, which we think should allow the company to invest aggressively in substantial growth opportunities and simultaneously increase expected earnings. We think additional tailwinds in the form of lower and decreasing tax rates may further benefit the company in coming years. In our view, Facebook’s strong fundamentals, high barriers to entry, robust contribution from Instagram, and strong demand for its business across most segments and geographies warrant a constructive outlook on its long-term growth prospects. |
| | Shares of McCormick rose, as the company benefited from strong fourth quarter 2015 results, with earnings coming in slightly above consensus estimates. According to the company management, the positive results were driven by a broad improvement in organic growth across its consumer and industrial businesses. At the end of the Reporting Period, we were encouraged by the better earnings visibility and improving momentum in McCormick’s consumer business. We believed the company might benefit from the secular growth in healthy cooking and the stabilization of private label competitors across many of its core spice categories. We further believed the company had the ability to continue to unlock growth given its global expansion efforts and product popularity. Finally, in our view, McCormick is led by a quality management team, which is capable of producing strong results moving forward. |
| Q | | How did the Fund use derivatives and similar instruments during the Reporting Period? |
| A | | During the Reporting Period, we did not use derivatives as part of an active management strategy. |
| Q | | Did the Fund make any significant purchases or sales during the Reporting Period? |
| A | | We initiated a Fund position in Stryker, a medical technology company. We believe there are numerous earnings and growth levers during the next two years that could yield meaningful upside. Notably, we see potential benefit from its powerful new product cycle, the Mako robotics platform for knee implants, competitors going through merger integrations, and its recent European investments. In our view, Stryker may also benefit from plans to significantly reduce its selling, general and administrative costs in early 2016. With what we consider to be substantial drivers to growth and momentum across its business, we are positive on Stryker’s long-term outlook. |
12
PORTFOLIO RESULTS
| | We established a Fund position in Danaher, a medical and industrial products manufacturer. Danaher released third quarter 2015 results that beat market expectations, reaffirmed its 2015 earnings guidance and released 2016 guidance that was in line with then-current consensus estimates. At the time of purchase, we believed Danaher’s near-term to medium-term earnings were depressed relative to the synergies from its acquisition of Pall. We also believed the company’s organic growth should garner a scarcity premium. Further, in our view, the company should merit a higher premium relative to its peers as so much of its earnings growth is anticipated to come from self-help, i.e. synergies, rather than macroeconomic factors. |
| | Conversely, we eliminated the Fund’s position in information storage company EMC. While we continue to like the company, near-term volatility around its acquisition by Dell and long-term issues driven by a backlog of orders led us to use our proceeds toward other opportunities where we believe the risk/reward profile is more compelling. |
| | We sold the Fund’s position in consumer products company Colgate-Palmolive. While we believe Colgate-Palmolive to be a quality business, we think there are better opportunities with more encouraging catalysts elsewhere in the industry. Additionally, we believe it is possible that Colgate-Palmolive could see an earnings decrease in the near term, as foreign currency pressures continue to impact the company. As a result, we decided to exit the position and pursue higher conviction ideas. |
| Q | | Were there any notable changes in the Fund’s weightings during the Reporting Period? |
| A | | In constructing the Fund’s portfolio, we focus on picking stocks rather than on making industry or sector bets. We seek to outpace the benchmark index by overweighting stocks that we expect to outperform and underweighting those that we think may lag. Consequently, changes in its sector weights are generally the direct result of individual stock selection or of stock appreciation or depreciation. That said, during the Reporting Period, the Fund’s exposure to consumer discretionary increased as did its position in cash and its allocations to consumer staples, energy, financials and information technology decreased relative to the Russell Index. |
| Q | | How was the Fund positioned relative to its benchmark index at the end of the Reporting Period? |
| A | | At the end of the Reporting Period, the Fund had overweighted positions relative to the Russell Index in the financials, consumer discretionary and information technology sectors. On the same date, the Fund had underweighted positions compared to the Russell Index in industrials, materials and health care. The Fund was rather neutrally weighted relative to the Russell Index in consumer staples and energy and had no position at all in the utilities and telecommunication services sectors at the end of the Reporting Period. |
13
FUND BASICS
Concentrated Growth Fund
as of February 29, 2016
| | | | | | | | | | |
| | PERFORMANCE REVIEW | |
| | | September 1, 2015–February 29, 2016 | | Fund Total Return
(based on NAV)1 | | | Russell 1000®
Growth Index2 | |
| | Class A | | | -5.49 | % | | | -1.22 | % |
| | Class C | | | -5.87 | | | | -1.22 | |
| | Institutional | | | -5.30 | | | | -1.22 | |
| | Class IR | | | -5.36 | | | | -1.22 | |
| | Class R | | | -5.55 | | | | -1.22 | |
| | | Class R6 | | | -5.28 | | | | -1.22 | |
| | 1 | | The net asset value (“NAV”) represents the net assets of the class of the Fund (ex-dividend) divided by the total number of shares of the class outstanding. The Fund’s performance reflects the reinvestment of dividends and other distributions. The Fund’s performance does not reflect the deduction of any applicable sales charges. |
| | 2 | | The Russell 1000® Growth Index (with dividends reinvested) is an unmanaged index that measures the performance of those Russell 1000 companies with higher price-to-book ratios and higher forecasted growth values. The Index figures do not reflect any deduction for fees, expenses or taxes. It is not possible to invest directly in an index. |
| | | | | | | | | | | | | | | | | | | | |
| | STANDARDIZED TOTAL RETURNS3 |
| | | For the period ended 12/31/15 | | One Year | | | Five Years | | | Ten Years | | | Since Inception | | | Inception Date |
| | Class A | | | -4.20 | % | | | 9.83 | % | | | 6.15 | % | | | 6.93 | % | | 9/03/02 |
| | Class C | | | -0.45 | | | | 10.27 | | | | 5.96 | | | | 6.57 | | | 9/03/02 |
| | Institutional | | | 1.75 | | | | 11.53 | | | | 7.19 | | | | 7.81 | | | 9/03/02 |
| | Class IR | | | 1.65 | | | | 11.37 | | | | N/A | | | | 5.88 | | | 11/30/07 |
| | Class R | | | 1.06 | | | | 10.81 | | | | N/A | | | | 5.37 | | | 11/30/07 |
| | | Class R6 | | | N/A | | | | N/A | | | | N/A | | | | -3.14 | | | 7/31/15 |
| | 3 | | The Standardized Total Returns are average annual total returns as of the most recent calendar quarter-end or cumulative total returns for periods less than 1 year. They assume reinvestment of all distributions at NAV. These returns reflect a maximum initial sales charge of 5.5% for Class A Shares and the assumed contingent deferred sales charge for Class C Shares (1% if redeemed within 12 months of purchase). Because Institutional, Class IR, Class R and Class R6 Shares do not involve a sales charge, such a charge is not applied to their Standardized Total Returns. |
The returns set forth in the table above represent past performance. Past performance does not guarantee future results. The Fund’s investment return and principal value will fluctuate so that an investor’s shares, when redeemed, may be worth more or less than their original cost. Current performance may be lower or higher than the performance quoted above. Please visit our Web site at www.GSAMFUNDS.com to obtain the most recent month-end returns. Performance reflects applicable fee waivers and/or expense limitations in effect during the periods shown. In their absence, performance would be reduced. Returns do not reflect the deduction of taxes that a shareholder would pay on Fund distributions or the redemption of Fund shares.
14
FUND BASICS
| | | | | | | | | | |
| | EXPENSE RATIOS4 | |
| | | | | Net Expense Ratio (Current) | | | Gross Expense Ratio (Before Waivers) | |
| | Class A | | | 1.22 | % | | | 1.60 | % |
| | Class C | | | 1.97 | | | | 2.35 | |
| | Institutional | | | 0.82 | | | | 1.20 | |
| | Class IR | | | 0.97 | | | | 1.35 | |
| | Class R | | | 1.47 | | | | 1.87 | |
| | | Class R6 | | | 0.80 | | | | 1.18 | |
| | 4 | | The expense ratios of the Fund, both current (net of applicable fee waivers and/or expense limitations) and before waivers (gross of applicable fee waivers and/or expense limitations) are as set forth above according to the most recent publicly available Prospectus for the Fund and may differ from the expense ratios disclosed in the Financial Highlights in this report. Pursuant to a contractual arrangement, the Fund’s waivers and/or expense limitations will remain in place through at least December 29, 2016, and prior to such date the investment adviser may not terminate the arrangements without the approval of the Fund’s Board of Trustees. If these arrangements are discontinued in the future, the expense ratios may change without shareholder approval. |
| | | | | | | | |
| | TOP TEN HOLDINGS AS OF 2/29/165 |
| | | Holding | | % of Net Assets | | | Line of Business |
| | Apple, Inc. | | | 7.5 | % | | Computers & Peripherals |
| | Facebook, Inc. Class A | | | 4.9 | | | Internet Software & Services |
| | Alphabet, Inc. Class A | | | 4.1 | | | Internet Software & Services |
| | Costco Wholesale Corp. | | | 3.9 | | | Food & Staples Retailing |
| | American Tower Corp. | | | 3.6 | | | Real Estate Investment Trusts |
| | Amazon.com, Inc. | | | 3.3 | | | Internet & Catalog Retail |
| | Starbucks Corp. | | | 3.1 | | | Hotels, Restaurants & Leisure |
| | Equinix, Inc. | | | 3.0 | | | Real Estate Investment Trusts |
| | MasterCard, Inc. Class A | | | 3.0 | | | IT Services |
| | | Allergan PLC | | | 2.9 | | | Pharmaceuticals |
| | 5 | | The top 10 holdings may not be representative of the Fund’s future investments. |
15
FUND BASICS
| | |
| FUND VS. BENCHMARK SECTOR ALLOCATION6 |
| As of February 29, 2016 | | |
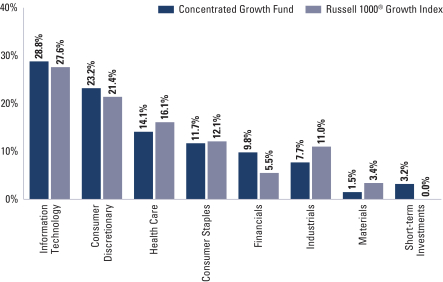
| | 6 | | The Fund is actively managed and, as such, its composition may differ over time. Consequently, the Fund’s overall sector allocations may differ from the percentages contained in the graph above. The graph categorizes investments using the Global Industry Classification Standard (“GICS”), however, the sector classifications used by the portfolio management team may differ from GICS. The percentage shown for each investment category reflects the value of investments in that category as a percentage of market value. Short-term investments represent repurchase agreements. The graph depicts the Fund’s investments but may not represent the Fund’s market exposure due to the exclusion of certain derivatives, if any, as listed in the Additional Investment Information section of the Schedule of Investments. |
16
PORTFOLIO RESULTS
Goldman Sachs Dynamic U.S. Equity Fund
Portfolio Composition
The Fund invests primarily in U.S. equity investments. Since the Fund’s inception, the Goldman Sachs Growth Equity Investment Team and the Goldman Sachs Fundamental Equity Value Investment Team have focused on several key investment criteria that they believe can drive a company’s growth over the long term. These characteristics are: dominant market share, established brand name, pricing power, recurring revenue stream, free cash flow, high returns on invested capital, predictable growth, sustainable growth, long product life cycle, enduring competitive advantage, favorable demographic trends and excellent management. The Teams strive to purchase these companies at reasonable valuations in order to capture the full benefits of their growth.
Portfolio Management Discussion and Analysis
Below, the Goldman Sachs Growth Equity Investment Team and the Goldman Sachs Value Equity Investment Team discuss the Goldman Sachs Dynamic U.S. Equity Fund’s (the “Fund”) performance and positioning for the six-month period ended February 29, 2016 (the “Reporting Period”).
| Q | | How did the Fund perform during the Reporting Period? |
| A | | During the Reporting Period, the Fund’s Class A, C, Institutional, Service, IR, R and R6 Shares generated cumulative total returns, without sales charges, of -7.33%, -7.61%, -7.09%, -7.17%, -7.35% and -7.07%, respectively. These returns compare to the -0.92% cumulative total return of the Fund’s benchmark, the Standard & Poor’s 500® Index (the “S&P 500 Index”), during the same period. |
| Q | | What key factors were responsible for the Fund’s performance during the Reporting Period? |
| A | | Stock selection overall detracted from the Fund’s performance relative to the S&P 500 Index during the Reporting Period. Sector allocation as a whole also detracted, albeit more modestly. |
| Q | | Which equity market sectors most significantly affected Fund performance? |
| A | | Challenging stock selection in energy, information technology and financials detracted from the Fund’s relative results most. Having an overweighted allocation to financials, which significantly lagged the S&P 500 Index during the Reporting Period, and having an underweighted exposure to information technology, which outpaced the S&P 500 Index during the Reporting Period, also hurt performance. The only sector to contribute positively to the Fund’s relative performance during the Reporting Period was materials, wherein effective stock selection drove results. |
| Q | | Which stocks detracted significantly from the Fund’s performance during the Reporting Period? |
| A | | Detracting most from the Fund’s results relative to its benchmark index were positions in oil and gas exploration and production company Southwestern Energy, car rental company Hertz Global Holdings and financial institution Bank of America. |
| | Southwestern Energy was a top detractor from the Fund’s relative performance during the Reporting Period. Exceptionally warm fall and winter weather that added to concerns of an oversupplied natural gas market was the major headwind that led to the stock’s poor performance, as natural gas prices declined substantially. Broad-based declines in global commodities weakened investor appetite for stocks with direct commodity exposure. The company’s third quarter 2015 earnings came in ahead of consensus expectations, driven by higher than expected production metrics coupled with lower operating costs. However, challenging natural gas liquid and natural gas pricing caused shares to underperform following the earnings release. The company similarly reported fourth quarter 2015 earnings that beat consensus due to better than expected gas price realizations and midstream revenues. However, further capital expenditure cuts in 2016 led investors to anticipate a |
17
PORTFOLIO RESULTS
| | larger decline in production than previously expected, and Southwestern Energy’s shares fell following the release. At the end of the Reporting Period, we continued to believe that Southwestern Energy has an underappreciated resource base, specifically in the Marcellus and Fayetteville shales, and that its newly acquired assets from Chesapeake Energy further strengthen the company’s position and growth opportunities. Additionally, we remained positive on the company’s operational leverage to higher natural gas prices and encouraged by its management team’s commitment to capital efficiency amidst challenging macro fundamentals. |
| | Hertz Global Holdings was a top detractor from the Fund’s relative results during the Reporting Period. Its shares initially came under pressure after the company reported third quarter 2015 results that were below market expectations, driven by weaker than expected pricing trends in the U.S. caused by increased airport competition. Its sharp decline in share price in the latter half of the Reporting Period seemed to be driven more by investor fears related to macroeconomic conditions than by industry or stock-specific fundamentals. If the U.S. were to enter a span of slower economic growth, travel trends would likely soften and pressure car rental volumes and prices. A weaker demand environment could also pressure used car prices, which might cause the company to dispose of cars at lower residual values. Despite our positive long-term view of the company’s operational improvement initiatives, available capital deployment options and cost reduction opportunities, we sold the Fund’s position in Hertz Global Holdings by the end of the Reporting Period in favor of stocks with what we believed to have less economic sensitivity. |
| | Banks underperformed broadly during the Reporting Period, in our opinion due to a decline in credit quality in the energy industry and concerns of contagion into other industries, such as metals/mining and industrials, moving forward. In addition, the 10-year U.S. Treasury yield moved below 2% during the Reporting Period, leading to a flattening of the yield curve, or a narrowing of yield differentials between the yields of long-term and shorter-term securities. Bank of America, impacted by these trends, was no exception to the industry’s broad underperformance. That said, at the end of the Reporting Period, we believed Bank of America could benefit from rising long-term and short-term rates. While we are aware of the macro risks present, we continued to be optimistic regarding Bank of America and positive on the stock’s discounted valuation. Overall, we were also positive on Bank of America’s leverage to a strengthening U.S. economy, and we continued to find the stock compelling from a risk/reward perspective. |
| Q | | What were some of the Fund’s best-performing individual stocks? |
| A | | The Fund benefited most relative to the S&P 500 Index from positions in industrial conglomerate General Electric, athletic footwear, apparel and equipment company Nike and data center real estate investment trust (“REIT”) Equinix. |
| | General Electric was the top positive contributor to the Fund’s relative results during the Reporting Period. The company reported third quarter 2015 earnings results that exceeded consensus expectations, driven by strong organic revenue growth and operating margin improvement. Additionally, its shares rose after General Electric’s long-awaited announcement about spinning off its majority stake in Synchrony Financial to existing shareholders. Further, in December 2015, General Electric held its 2016 outlook meeting, which included a projection of high single-digit earnings growth through 2018, achieved through above-average organic revenue growth, share repurchases, divestitures, and synergies from the company’s acquisition of Alstom Energy. At the end of the Reporting Period, we remained optimistic on the company’s growth prospects, as a strong backlog of orders and accretive synergies from recent transactions could be supportive to earnings in a potentially slow global economic growth environment, in our view. |
| | Towards the end of December 2015, Nike reported solid fiscal second quarter results with accelerated growth in orders from the previous quarter. In our view, the company also continued to see broad-based momentum, notably in China, where its business remains strong. This worldwide growth, along with Nike’s introduction of new footwear, has allowed it to gain market share in an otherwise difficult macroeconomic and secular environment. Despite an inventory build-up from a port strike earlier in 2015, which we view as a near-term headwind, we expected, at the end of the Reporting Period, room for margin expansion through the company’s rising average selling prices. We also maintained our belief in the strength and quality of Nike’s franchise and remained positive at the end of the Reporting Period on the company’s long-term growth potential. |
| | Equinix was a strong contributor to the Fund’s performance during the Reporting Period. The company announced high quality results for the second and third quarters of 2015, as secular growth in enterprise spending helped drive organic revenue growth and bookings to record levels. Also, solid |
18
PORTFOLIO RESULTS
| | performance in all regions in which the REIT operates led Equinix to raise guidance across key metrics during the Reporting Period, which was well received by the markets. In our view, Equinix continued at the end of the Reporting Period to present a favorable outlook, as pricing has been net positive in the low churn rate, or turnover, environment. Going forward, we believe Equinix may further benefit from its recurring revenue business model, steady demand environment, and integration of recent acquisitions that could unlock significant synergies. |
| Q | | How did the Fund use derivatives and similar instruments during the Reporting Period? |
| A | | During the Reporting Period, we did not use derivatives as part of an active management strategy. |
| Q | | Did the Fund make any significant purchases or sales during the Reporting Period? |
| A | | We initiated a Fund position in online social media platform Facebook during the Reporting Period. The company reported strong fourth quarter 2015 results in January 2016, underpinned by advertisement revenue growth well above market expectations. At the end of the Reporting Period, we remained positive on Facebook’s high operating expenditures, at what we consider to be manageable levels, which we think should allow the company to invest aggressively in substantial growth opportunities and simultaneously increase expected earnings. We think additional tailwinds in the form of lower and decreasing tax rates may further benefit the company in coming years. In our view, Facebook’s strong fundamentals, high barriers to entry, robust contribution from Instagram, and strong demand for its business across most segments and geographies warrant a constructive outlook on its long-term growth prospects. |
| | We established a Fund position in MasterCard. We believe current macro trends are supportive of financial services and that MasterCard could be a key beneficiary. In particular, the company has deep exposure to emerging markets, where consumer card spending has seen recovery and is supported by promotional government efforts. In our view, MasterCard has a high quality management team and, given what we consider to be a favorable industry backdrop, a high quality business franchise. Given what we view as MasterCard’s attractive valuation, we sought to take advantage of what we view as a favorable risk/reward opportunity. |
| | Conversely, we sold the Fund’s position in financial services company American International Group (“AIG”). We believe any complications with respect to its newly announced strategic plan could add negative pressure to the stock, as major changes within such a complex organization take time to harmonize, in our view. We took the opportunity to exit the Fund’s position in AIG to pursue higher conviction ideas. |
| | We exited the Fund’s position in Boeing, a designer and manufacturer of commercial jetliners, military defense and spaceflight worldwide. During the Reporting Period, Boeing issued 2016 revenue and earnings guidance that was below consensus expectations, driven by commercial aircraft delivery timing and lower margins. Boeing has historically been conservative when issuing forward guidance, so this is not unusual. Though we continue to like the company, we believe the risk/reward profile for Boeing is less compelling and thus we felt it prudent to eliminate the position and pursue higher conviction investment opportunities. |
| Q | | Were there any notable changes in the Fund’s weightings during the Reporting Period? |
| A | | In constructing the Fund’s portfolio, we focus on picking stocks rather than on making industry or sector bets. We seek to outpace the benchmark index by overweighting stocks that we expect to outperform and underweighting those that we think may lag. Consequently, changes in its sector weights are generally the direct result of individual stock selection or of stock appreciation or depreciation. That said, during the Reporting Period, the Fund’s exposure to consumer discretionary, energy, health care, information technology and materials increased and its allocations to consumer staples, financials, industrials and telecommunication services decreased compared to the S&P 500 Index. |
| Q | | How was the Fund positioned relative to its benchmark index at the end of the Reporting Period? |
| A | | At the end of the Reporting Period, the Fund had overweighted positions relative to the S&P 500 Index in financials and consumer discretionary. On the same date, the Fund had underweighted positions compared to the S&P 500 Index in industrials, utilities, health care, and was rather neutrally weighted to the S&P 500 Index in information technology, materials, energy and consumer staples. The Fund had no position at all in telecommunication services at the end of the Reporting Period. |
19
FUND BASICS
Dynamic U.S. Equity Fund
as of February 29, 2016

| | | | | | | | | | |
| | PERFORMANCE REVIEW | |
| | | September 1, 2015–February 29, 2016 | | Fund Total Return
(based on NAV)1 | | | S&P 500® Index2 | |
| | Class A | | | -7.33 | % | | | -0.92 | % |
| | Class C | | | -7.61 | | | | -0.92 | |
| | Institutional | | | -7.09 | | | | -0.92 | |
| | Class IR | | | -7.17 | | | | -0.92 | |
| | Class R | | | -7.35 | | | | -0.92 | |
| | | Class R6 | | | -7.07 | | | | -0.92 | |
| | 1 | | The net asset value (“NAV”) represents the net assets of the class of the Fund (ex-dividend) divided by the total number of shares of the class outstanding. The Fund’s performance reflects the reinvestment of dividends and other distributions. The Fund’s performance does not reflect the deduction of any applicable sales charges. |
| | 2 | | The S&P 500® Index is the Standard & Poor’s 500 Composite Index of 500 stocks, an unmanaged index of common stock prices. The Index figures do not reflect any deduction for fees, expenses or taxes. It is not possible to invest directly in an index. |
| | | | | | | | | | | | | | | | |
| | STANDARDIZED TOTAL RETURNS3 |
| | | For the period ended 12/31/15 | | One Year | | | Five Years | | | Since Inception | | | Inception Date |
| | Class A | | | -7.55 | % | | | 9.16 | % | | | 10.09 | % | | 11/30/09 |
| | Class C | | | -3.85 | | | | 9.58 | | | | 10.28 | | | 11/30/09 |
| | Institutional | | | -1.79 | | | | 10.84 | | | | 11.56 | | | 11/30/09 |
| | Class IR | | | -2.02 | | | | 10.66 | | | | 11.37 | | | 11/30/09 |
| | Class R | | | -2.41 | | | | 10.13 | | | | 10.84 | | | 11/30/09 |
| | | Class R6 | | | N/A | | | | N/A | | | | -4.31 | | | 7/31/15 |
| | 3 | | The Standardized Total Returns are average annual total returns as of the most recent calendar quarter-end or cumulative total returns for periods less than 1 year. They assume reinvestment of all distributions at NAV. These returns reflect a maximum initial sales charge of 5.5% for Class A Shares and the assumed contingent deferred sales charge for Class C Shares (1% if redeemed within 12 months of purchase). Because Institutional, Class IR, Class R and Class R6 Shares do not involve a sales charge, such a charge is not applied to their Standardized Total Returns. |
The returns set forth in the tables above represent past performance. Past performance does not guarantee future results. The Fund’s investment return and principal value will fluctuate so that an investor’s shares, when redeemed, may be worth more or less than their original cost. Current performance may be lower or higher than the performance quoted above. Please visit our web site at www.GSAMFUNDS.com to obtain the most recent month-end returns. Performance reflects applicable fee waivers and/or expense limitations in effect during the periods shown. In their absence, performance would be reduced. Returns do not reflect the deduction of taxes that a shareholder would pay on Fund distributions or the redemption of Fund shares.
20
FUND BASICS
| | | | | | | | | | |
| | EXPENSE RATIOS4 | |
| | | | | Net Expense Ratio (Current) | | | Gross Expense Ratio (Before Waivers) | |
| | Class A | | | 1.22 | % | | | 2.81 | % |
| | Class C | | | 1.97 | | | | 3.56 | |
| | Institutional | | | 0.82 | | | | 2.42 | |
| | Class IR | | | 0.97 | | | | 2.63 | |
| | Class R | | | 1.47 | | | | 3.10 | |
| | | Class R6 | | | 0.80 | | | | 2.40 | |
| | 4 | | The expense ratios of the Fund, both current (net of applicable fee waivers and/or expense limitations) and before waivers (gross of applicable fee waivers and/or expense limitations) are as set forth above according to the most recent publicly available Prospectus for the Fund and may differ from the expense ratios disclosed in the Financial Highlights in this report. Pursuant to a contractual arrangement, the Fund’s waivers and/or expense limitations will remain in place through at least December 29, 2016, and prior to such date the investment adviser may not terminate the arrangements without the approval of the Fund’s Board of Trustees. If these arrangements are discontinued in the future, the expense ratios may change without shareholder approval. |
| | | | | | | | |
| | TOP TEN HOLDINGS AS OF 2/29/165 |
| | | Holding | | % of Net Assets | | | Line of Business |
| | JPMorgan Chase & Co. | | | 4.7 | % | | Commercial Banks |
| | Bank of America Corp. | | | 3.8 | | | Commercial Banks |
| | EMC Corp. | | | 3.6 | | | Computers & Peripherals |
| | Amazon.com, Inc. | | | 3.4 | | | Internet & Catalog Retail |
| | Pfizer, Inc. | | | 3.4 | | | Pharmaceuticals |
| | Whole Foods Market, Inc. | | | 3.4 | | | Food & Staples Retailing |
| | Apple, Inc. | | | 3.4 | | | Computers & Peripherals |
| | Facebook, Inc. Class A | | | 3.1 | | | Internet Software & Services |
| | Allergan PLC | | | 3.0 | | | Pharmaceuticals |
| | | MasterCard, Inc. Class A | | | 3.0 | | | IT Services |
| | 5 | | The top 10 holdings may not be representative of the Fund’s future investments. |
21
FUND BASICS
|
| FUND VS. BENCHMARK SECTOR ALLOCATION6 |
| As of February 29, 2016 |
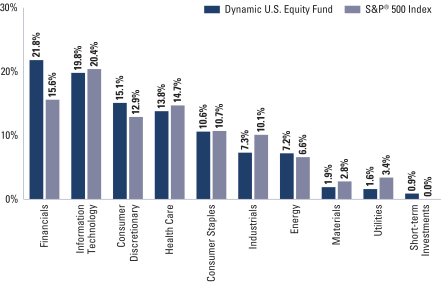
| | 6 | | The Fund is actively managed and, as such, its composition may differ over time. Consequently, the Fund’s overall sector allocations may differ from the percentages contained in the graph above. The graph categorizes investments using the Global Industry Classification Standard (“GICS”), however, the sector classifications used by the portfolio management team may differ from GICS. The percentage shown for each investment category reflects the value of investments in that category as a percentage of market value. Short-term investments represent repurchase agreements. The graph depicts the Fund’s investments but may not represent the Fund’s market exposure due to the exclusion of certain derivatives, if any, as listed in the Additional Investment Information section of the Schedule of Investments. |
22
PORTFOLIO RESULTS
Goldman Sachs Flexible Cap Growth Fund
Portfolio Composition
The Fund invests primarily in U.S. equity investments in small-, mid- and large-capitalization issuers. Since the Fund’s inception, the Goldman Sachs Growth Equity Investment Team has focused on several key investment criteria that it believes can drive a company’s growth over the long term. These characteristics are: dominant market share, established brand name, pricing power, recurring revenue stream, free cash flow, high returns on invested capital, predictable growth, sustainable growth, long product life cycle, enduring competitive advantage, favorable demographic trends and excellent management. The Team strives to purchase these companies at reasonable valuations in order to capture the full benefits of their growth.
Portfolio Management Discussion and Analysis
Below, the Goldman Sachs Growth Equity Investment Team discusses the Goldman Sachs Flexible Cap Growth Fund’s (the “Fund”) performance and positioning for the six-month period ended February 29, 2016 (the “Reporting Period”).
| Q | | How did the Fund perform during the Reporting Period? |
| A | | During the Reporting Period, the Fund’s Class A, C, Institutional, IR, R and R6 Shares generated cumulative total returns, without sales charges, of -6.95%, -7.34%, -6.80%, -6.81%, -7.11% and -6.80%, respectively. These returns compare to the -2.20% cumulative total return of the Fund’s benchmark, the Russell 3000® Growth Index (with dividends reinvested) (the “Russell Index”), during the same period. |
| Q | | What key factors were responsible for the Fund’s performance during the Reporting Period? |
| A | | Stock selection overall detracted from the Fund’s performance relative to the Russell Index during the Reporting Period. Sector allocation as a whole also detracted, albeit much more modestly. |
| Q | | Which equity market sectors most significantly affected Fund performance? |
| A | | The sectors that detracted most from the Fund’s relative results during the Reporting Period were information technology, consumer staples, industrials and health care, wherein stock selection proved challenging. The only sector to contribute positively to the Fund’s relative performance during the Reporting Period was financials, wherein effective stock selection drove results. |
| Q | | Which stocks detracted significantly from the Fund’s performance during the Reporting Period? |
| A | | Detracting most from the Fund’s results relative to its benchmark index were positions in home furnishing retailer Restoration Hardware Holdings, global apparel company PVH and molecular diagnostics company Cepheid. |
| | Restoration Hardware Holdings was the top detractor from the Fund’s relative performance during the Reporting Period. The company’s share price declined after it reported disappointing third quarter 2015 revenues, citing weaker performance in oil-exposed regions as the main driver. The company’s shares experienced further declines in the fourth quarter of 2015 when the company missed on its previous earnings guidance, reporting a significant decline in earnings per share year over year. Despite this recent weakness, we believed at the end of the Reporting Period that Restoration Hardware Holdings was poised for greater sales growth moving forward. We also believed the company could benefit from some of its ongoing initiatives, such as promotions and new store openings. |
| | PVH was a top detractor from the Fund’s results during the Reporting Period. Weakness in the U.S. retail environment, high promotions in the industry, and currency headwinds pressured the company’s results. Despite these concerns, which we see as short-term in nature, we believed at the end of the Reporting Period that PVH remained a leading franchise with dominant market share, strong pricing power and solid fundamentals. Particularly, established brand |
23
PORTFOLIO RESULTS
| | names Tommy Hilfiger and Calvin Klein have demonstrated international strength and have been a key source of growth. In our view, PVH was undervalued relative to its peers at the end of the Reporting Period, and we remained optimistic on what we see as the company’s significant free cash flow generation ability, quality of management and return potential. |
| | Cepheid’s release of its third quarter 2015 earnings negatively pressured its share price during the Reporting Period. Its management cited the integration and productivity implications of doubling its U.S. salesforce as the primary driver behind its earnings miss. By the end of the Reporting Period, we believed the company had more time to train and integrate its new salesforce and thus further believed the company was poised well for growth. We maintained confidence in the actions its management was taking to accelerate the company’s growth profile. In our view, Cepheid remained the dominant molecular diagnostics platform at the end of the Reporting Period. |
| Q | | What were some of the Fund’s best-performing individual stocks? |
| A | | The Fund benefited most relative to the Russell Index from positions in retail bakery café Panera Bread, data center real estate investment trust (“REIT”) Equinix and flavor food products manufacturer McCormick. |
| | Panera Bread Company was the top positive contributor to the Fund’s relative returns during the Reporting Period. The company’s share price declined early in the Reporting Period after its management decided to not provide commentary on 2016 guidance when it released its third quarter 2015 earnings. However, its share price recovered later in the Reporting Period, as fourth quarter 2015 results were released, highlighting better sales and restaurant margins. Additionally, Panera Bread guided 2016 earnings upward, which included consensus estimates at the high end of guidance. At the end of the Reporting Period, we remained positive on the company and believed store upgrades and increased marketing efforts should continue to drive traffic to a company that we believe has a strong secular opportunity in the fast-casual dining industry. |
| | Equinix was a strong contributor to the Fund’s performance during the Reporting Period. The company announced high quality results for the second and third quarters of 2015, as secular growth in enterprise spending helped drive organic revenue growth and bookings to record levels. Also, solid performance in all regions in which the REIT operates led Equinix to raise guidance across key metrics during the Reporting Period, which was well received by the markets. In our view, Equinix continued at the end of the Reporting Period to present a favorable outlook, as pricing has been net positive in the low churn rate, or turnover, environment. Going forward, we believe Equinix may further benefit from its recurring revenue business model, steady demand environment, and integration of recent acquisitions that could unlock significant synergies. |
| | Shares of McCormick rose, as the company benefited from strong fourth quarter 2015 results, with earnings coming in slightly above consensus estimates. According to the company management, the positive results were driven by a broad improvement in organic growth across its consumer and industrial businesses. At the end of the Reporting Period, we were encouraged by the better earnings visibility and improving momentum in McCormick’s consumer business. We believed the company might benefit from the secular growth in healthy cooking and the stabilization of private label competitors across many of its core spice categories. We further believed the company had the ability to continue to unlock growth given its global expansion efforts and product popularity. Finally, in our view, McCormick is led by a quality management team, which is capable of producing strong results moving forward. |
| Q | | How did the Fund use derivatives and similar instruments during the Reporting Period? |
| A | | During the Reporting Period, we did not use derivatives as part of an active management strategy. |
| Q | | Did the Fund make any significant purchases or sales during the Reporting Period? |
| A | | We established a Fund position in beverage company Coca-Cola. We view Coca-Cola as a high quality, large-cap consumer staples franchise, with iconic brands and a structurally advantaged global supply chain. However, the stock has been pressured in recent years by international macro headwinds and health concerns about soft drinks. We see meaningful positive incremental change occurring at Coca-Cola, with core category pricing improving sustainably, more aggressive cost cutting, productivity driving higher marketing reinvestment, and structural improvements from bottler refranchising. We expect the turnaround at the company to be increasingly appreciated by |
24
PORTFOLIO RESULTS
| | the market over time. We also see room for earnings multiple expansion relative to other high quality consumer staples peers. These factors, combined with a stabilizing global macro and currency backdrop, could lead to faster growth and higher returns, in our view. |
| | We initiated a Fund position in Boeing, a designer and manufacturer of commercial jetliners, military defense and spaceflight worldwide. In our view, the company is well positioned in the duopolistic commercial aerospace industry, as demand for its 787 aircraft remains healthy and execution improving. Additionally, we believe Boeing may well benefit from a cyclical recovery in the defense industry. We believe Boeing’s management team is shareholder friendly, as evidenced by a recent increase in buyback authorization and dividends, and we remain optimistic on its long-term growth prospects. |
| | Conversely, we exited the Fund’s position in biotechnology company Amgen. Speculation around a possible acquisition drove up its share price, and while its performance had been strong, we opted to allocate our sales proceeds toward relatively higher conviction ideas. |
| | We sold the Fund’s position in global media company Twenty-First Century Fox. Shares of the company had declined after a challenging 2015 earnings season in the media industry. During the earnings season, market fears were stoked by additional losses of subscribers to cord cutting, which pressured media stocks downward. (Cord cutting refers to the practice of stopping a cable or satellite television service or getting rid of a landline phone in favor of less expensive options.) As a result of the uncertainty around the media industry, we decided to exit the position in favor of opportunities where we believe the risk/reward profile is more compelling. |
| Q | | Were there any notable changes in the Fund’s weightings during the Reporting Period? |
| A | | In constructing the Fund’s portfolio, we focus on picking stocks rather than on making industry or sector bets. We seek to outpace the benchmark index by overweighting stocks that we expect to outperform and underweighting those that we think may lag. Consequently, changes in its sector weights are generally the direct result of individual stock selection or of stock appreciation or depreciation. That said, during the Reporting Period, the Fund’s exposure to consumer discretionary and information technology increased and its allocations to financials and consumer staples decreased relative to the Russell Index. |
| Q | | How was the Fund positioned relative to its benchmark index at the end of the Reporting Period? |
| A | | At the end of the Reporting Period, the Fund had an overweighted position relative to the Russell Index in the consumer discretionary, information technology, financials and energy sectors. On the same date, the Fund had underweighted positions compared to the Russell Index in health care, consumer staples, materials and industrials and was rather neutrally weighted to the Russell Index in telecommunication services. The Fund had no position at all in the utilities sector on at the end of the Reporting Period. |
25
FUND BASICS
Flexible Cap Growth Fund
as of February 29, 2016
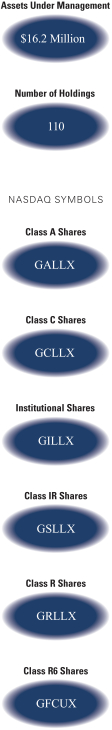
| | | | | | | | | | |
| | PERFORMANCE REVIEW | |
| | | September 1, 2015–February 29, 2016 | | Fund Total Return
(based on NAV)1 | | | Russell 3000®
Growth Index2 | |
| | Class A | | | -6.95 | % | | | -2.20 | % |
| | Class C | | | -7.34 | | | | -2.20 | |
| | Institutional | | | -6.80 | | | | -2.20 | |
| | Class IR | | | -6.81 | | | | -2.20 | |
| | Class R | | | -7.11 | | | | -2.20 | |
| | | Class R6 | | | -6.80 | | | | -2.20 | |
| | 1 | | The net asset value (“NAV”) represents the net assets of the class of the Fund (ex-dividend) divided by the total number of shares of the class outstanding. The Fund’s performance reflects the reinvestment of dividends and other distributions. The Fund’s performance does not reflect the deduction of any applicable sales charges. |
| | 2 | | The unmanaged Russell 3000® Growth Index (with dividends reinvested) measures the performance of the 3,000 largest U.S. companies based on total market capitalization. The Index figures do not reflect any deduction for fees, expenses or taxes. It is not possible to invest directly in an index. |
| | | | | | | | | | | | | | | | |
| | STANDARDIZED TOTAL RETURNS3 |
| | | For the period ended 12/31/15 | | One Year | | | Five Years | | | Since Inception | | | Inception Date |
| | Class A | | | -3.82 | % | | | 10.33 | % | | | 8.48 | % | | 1/31/08 |
| | Class C | | | 0.00 | | | | 10.77 | | | | 8.48 | | | 1/31/08 |
| | Institutional | | | 2.12 | | | | 12.04 | | | | 9.72 | | | 1/31/08 |
| | Class IR | | | 1.98 | | | | 11.87 | | | | 9.55 | | | 1/31/08 |
| | Class R | | | 1.48 | | | | 11.34 | | | | 9.02 | | | 1/31/08 |
| | | Class R6 | | | N/A | | | | N/A | | | | -5.82 | | | 7/31/15 |
| | 3 | | The Standardized Total Returns are average annual total returns as of the most recent calendar quarter-end or cumulative total returns for periods less than 1 year. They assume reinvestment of all distributions at NAV. These returns reflect a maximum initial sales charge of 5.5% for Class A Shares and the assumed contingent deferred sales charge for Class C Shares (1% if redeemed within 12 months of purchase). Because Institutional, Class IR, Class R and Class R6 Shares do not involve a sales charge, such a charge is not applied to their Standardized Total Returns. |
The returns set forth in the tables above represent past performance. Past performance does not guarantee future results. The Fund’s investment return and principal value will fluctuate so that an investor’s shares, when redeemed, may be worth more or less than their original cost. Current performance may be lower or higher than the performance quoted above. Please visit our web site at www.GSAMFUNDS.com to obtain the most recent month-end returns. Performance reflects applicable fee waivers and/or expense limitations in effect during the periods shown. In their absence, performance would be reduced. Returns do not reflect the deduction of taxes that a shareholder would pay on Fund distributions or the redemption of Fund shares.
26
FUND BASICS
| | | | | | | | | | |
| | EXPENSE RATIOS4 | |
| | | | | Net Expense Ratio (Current) | | | Gross Expense Ratio (Before Waivers) | |
| | Class A | | | 1.22 | % | | | 2.97 | % |
| | Class C | | | 1.97 | | | | 3.71 | |
| | Institutional | | | 0.82 | | | | 2.57 | |
| | Class IR | | | 0.97 | | | | 2.66 | |
| | Class R | | | 1.47 | | | | 3.24 | |
| | | Class R6 | | | 0.80 | | | | 4.34 | |
| | 4 | | The expense ratios of the Fund, both current (net of applicable fee waivers and/or expense limitations) and before waivers (gross of applicable fee waivers and/or expense limitations) are as set forth above according to the most recent publicly available Prospectus for the Fund and may differ from the expense ratios disclosed in the Financial Highlights in this report. Pursuant to a contractual arrangement, the Fund’s waivers and/or expense limitations will remain in place through at least December 29, 2016, and prior to such date the investment adviser may not terminate the arrangements without the approval of the Fund’s Board of Trustees. If these arrangements are discontinued in the future, the expense ratios may change without shareholder approval. |
| | | | | | | | |
| | TOP TEN HOLDINGS AS OF 2/29/165 |
| | | Holding | | % of Net Assets | | | Line of Business |
| | Apple, Inc. | | | 6.3 | % | | Computers & Peripherals |
| | Facebook, Inc. Class A | | | 3.1 | | | Internet Software & Services |
| | Alphabet, Inc. Class A | | | 2.8 | | | Internet Software & Services |
| | Amazon.com, Inc. | | | 2.6 | | | Internet & Catalog Retail |
| | Alphabet, Inc. Class C | | | 2.4 | | | Internet Software & Services |
| | MasterCard, Inc. Class A | | | 2.1 | | | IT Services |
| | NIKE, Inc. Class B | | | 2.0 | | | Textiles, Apparel & Luxury Goods |
| | Panera Bread Co. Class A | | | 1.9 | | | Hotels, Restaurants & Leisure |
| | Costco Wholesale Corp. | | | 1.9 | | | Food & Staples Retailing |
| | | Starbucks Corp. | | | 1.7 | | | Hotels, Restaurants & Leisure |
| | 5 | | The top 10 holdings may not be representative of the Fund’s future investments. |
27
FUND BASICS
|
| FUND VS. BENCHMARK SECTOR ALLOCATION6 |
| As of February 29, 2016 |
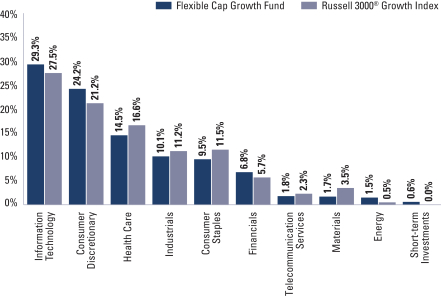
| | 6 | | The Fund is actively managed and, as such, its composition may differ over time. Consequently, the Fund’s overall sector allocations may differ from the percentages contained in the graph above. The graph categorizes investments using the Global Industry Classification Standard (“GICS”), however, the sector classifications used by the portfolio management team may differ from GICS. The percentage shown for each investment category reflects the value of investments in that category as a percentage of market value. Short-term investments represent repurchase agreements. The graph depicts the Fund’s investments but may not represent the Fund’s market exposure due to the exclusion of certain derivatives, if any, as listed in the Additional Investment Information section of the Schedule of Investments. |
28
PORTFOLIO RESULTS
Goldman Sachs Focused Growth Fund
Portfolio Composition
The Fund invests primarily in U.S. equity investments. Since the Fund’s inception, the Goldman Sachs Growth Equity Investment Team has focused on several key investment criteria that it believes can drive a company’s growth over the long term. These characteristics are: dominant market share, established brand name, pricing power, recurring revenue stream, free cash flow, high returns on invested capital, predictable growth, sustainable growth, long product life cycle, enduring competitive advantage, favorable demographic trends and excellent management. The Team strives to purchase these companies at reasonable valuations in order to capture the full benefits of their growth.
Portfolio Management Discussion and Analysis
Below, the Goldman Sachs Growth Equity Investment Team discusses the Goldman Sachs Focused Growth Fund’s (the “Fund”) performance and positioning for the six-month period ended February 29, 2016 (the “Reporting Period”).
| Q | | How did the Fund perform during the Reporting Period? |
| A | | During the Reporting Period, the Fund’s Class A, C, Institutional, IR, R and R6 Shares generated cumulative total returns, without sales charges, of -5.45%, -5.87%, -5.26%, -5.30%, -5.56% and -5.24%, respectively. These returns compare to the -1.22% cumulative total return of the Fund’s benchmark, the Russell 1000® Growth Index (with dividends reinvested) (the “Russell Index”), during the same period. |
| Q | | What key factors were responsible for the Fund’s performance during the Reporting Period? |
| A | | Stock selection overall detracted from the Fund’s performance relative to the Russell Index during the Reporting Period. Sector allocation as a whole contributed positively during the Reporting Period. |
| Q | | Which equity market sectors most significantly affected Fund performance? |
| A | | Challenging stock selection in consumer discretionary, consumer staples and health care detracted from the Fund’s relative results most. Effective stock selection in the financials and information technology sectors and not having any exposure to the energy sector, which was by far the weakest performer in the Russell Index during the Reporting Period, helped the Fund’s performance most relative to the Russell Index. |
| Q | | Which stocks detracted significantly from the Fund’s performance during the Reporting Period? |
| A | | Detracting most from the Fund’s results relative to its benchmark index were positions in global apparel company PVH, online travel company The Priceline Group and biotechnology firm Vertex Pharmaceuticals. |
| | PVH was the top detractor from the Fund’s results during the Reporting Period. Weakness in the U.S. retail environment, high promotions in the industry, and currency headwinds pressured the company’s results. Despite these concerns, which we see as short-term in nature, we believed at the end of the Reporting Period that PVH remained a leading franchise with dominant market share, strong pricing power and solid fundamentals. Particularly, established brand names Tommy Hilfiger and Calvin Klein have demonstrated international strength and have been a key source of growth. In our view, PVH was undervalued relative to its peers at the end of the Reporting Period, and we remained optimistic on what we see as the company’s significant free cash flow generation ability, quality of management and return potential. |
| | Vertex Pharmaceuticals was a top detractor from the Fund’s performance during the Reporting Period. Primarily, its weakness was driven, in our view, by fourth quarter 2015 results that were below consensus expectations. The company attributed part of the miss to a slowdown in new patient growth due to clinic capacity restraints, creating a patient backlog. We believe Vertex Pharmaceuticals boasts strong underlying fundamentals and a promising product |
29
PORTFOLIO RESULTS
| | pipeline with significant short-term and long-term catalysts. At the end of the Reporting Period, we believed the company, led by what we consider to be a capable management team, could continue to see growth given its dominant market share in its space and given geographic expansionary efforts that have contributed to meaningful profitability. |
| | Shares of The Priceline Group declined during the Reporting Period, as a deceleration in bookings and an unfavorable outlook for the travel industry weighed on the stock. While we believe The Priceline Group is a quality business, our confidence in the company was tested and as a result, we exited the position in favor of higher conviction ideas. |
| Q | | What were some of the Fund’s best-performing individual stocks? |
| A | | The Fund benefited most relative to the Russell Index from positions in data center real estate investment trust (“REIT”) Equinix, Google’s parent company Alphabet and online social media platform Facebook. |
| | Equinix was a strong contributor to the Fund’s performance during the Reporting Period. The company announced high quality results for the second and third quarters of 2015, as secular growth in enterprise spending helped drive organic revenue growth and bookings to record levels. Also, solid performance in all regions in which the REIT operates led Equinix to raise guidance across key metrics during the Reporting Period, which was well received by the markets. In our view, Equinix continued at the end of the Reporting Period to present a favorable outlook, as pricing has been net positive in the low churn rate, or turnover, environment. Going forward, we believe Equinix may further benefit from its recurring revenue business model, steady demand environment, and integration of recent acquisitions that could unlock significant synergies. |
| | Substantial growth in Alphabet’s core business and momentum in its mobile search and video advertisement revenue were key drivers of its positive returns during the Reporting Period. Additionally, the addition of Chief Financial Officer Ruth Porat increased final accountability among business unit managers, which we view as a constructive step toward the company becoming more shareholder-aligned. At the end of the Reporting Period, we believed Alphabet was a fairly valued, dominant business, with an experienced management team and an innovative product suite. |
| | Facebook, a new purchase for the Fund during the Reporting Period, was a top positive contributor to the Fund’s relative results. The company reported strong fourth quarter 2015 results in January 2016, underpinned by advertisement revenue growth well above market expectations. At the end of the Reporting Period, we remained positive on Facebook’s high operating expenditures, at what we consider to be manageable levels, which should allow the company to invest aggressively in substantial growth opportunities and simultaneously increase expected earnings. We think additional tailwinds in the form of lower and decreasing tax rates may further benefit the company in coming years. In our view, Facebook’s strong fundamentals, high barriers to entry, robust contribution from Instagram, and strong demand for its business across most segments and geographies warrant a constructive outlook on its long-term growth prospects. |
| Q | | How did the Fund use derivatives and similar instruments during the Reporting Period? |
| A | | During the Reporting Period, we did not use derivatives as part of an active management strategy. |
| Q | | Did the Fund make any significant purchases or sales during the Reporting Period? |
| A | | In addition to the purchase of Facebook, already mentioned, we initiated a Fund position in fast-food retail giant McDonald’s. We believe improving sales and reduction in costs should lead to earnings upside and margin expansion. We further think that McDonald’s reduction in capital expenditures and further refranchising could lead to improving return on invested capital and free up additional capital to repurchase stock. In our view, McDonald’s is a high quality franchise with a proficient management team and what we consider to be attractive opportunities to drive top-line growth and earnings. |
| | Conversely, in addition to the sale of The Priceline Group, mentioned earlier, we exited the Fund’s position in information storage company EMC. While we continue to like the company, near-term volatility around its acquisition |
30
PORTFOLIO RESULTS
| | by Dell and long-term issues driven by a backlog of orders led us to use our proceeds toward other opportunities where we believe the risk/reward profile is more compelling. |
| Q | | Were there any notable changes in the Fund’s weightings during the Reporting Period? |
| A | | In constructing the Fund’s portfolio, we focus on picking stocks rather than on making industry or sector bets. We seek to outpace the benchmark index by overweighting stocks that we expect to outperform and underweighting those that we think may lag. Consequently, changes in its sector weights are generally the direct result of individual stock selection or of stock appreciation or depreciation. That said, during the Reporting Period, the Fund’s exposure to health care increased and its allocations to financials, industrials and information technology decreased relative to the Russell Index. |
| Q | | How was the Fund positioned relative to its benchmark index at the end of the Reporting Period? |
| A | | At the end of the Reporting Period, the Fund had overweighted positions relative to the Russell Index in the financials and consumer staples sectors. On the same date, the Fund had an underweighted position compared to the Russell Index in industrials. The Fund was rather neutrally weighted to the Russell Index in consumer discretionary, health care and information technology and had no positions at all in the energy, utilities, telecommunication services or materials sectors at the end of the Reporting Period. |
31
FUND BASICS
Focused Growth Fund
as of February 29, 2016
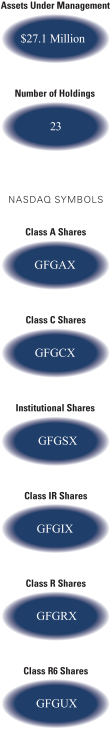
| | | | | | | | | | |
| | PERFORMANCE REVIEW | |
| | | September 1, 2015–February 29, 2016 | | Fund Total Return
(based on NAV)1 | | | Russell 1000®
Growth Index2 | |
| | Class A | | | -5.45 | % | | | -1.22 | % |
| | Class C | | | -5.87 | | | | -1.22 | |
| | Institutional | | | -5.26 | | | | -1.22 | |
| | Class IR | | | -5.30 | | | | -1.22 | |
| | Class R | | | -5.56 | | | | -1.22 | |
| | | Class R6 | | | -5.24 | | | | -1.22 | |
| | 1 | | The net asset value (“NAV”) represents the net assets of the class of the Fund (ex-dividend) divided by the total number of shares of the class outstanding. The Fund’s performance reflects the reinvestment of dividends and other distributions. The Fund’s performance does not reflect the deduction of any applicable sales charges. |
| | 2 | | The Russell 1000® Growth Index (with dividends reinvested) is an unmanaged market capitalization weighted index of the 1000 largest U.S. companies with higher price-to-book ratios and higher forecasted growth values. The Index figures do not include any deduction for fees, expenses or taxes. It is not possible to invest directly in an unmanaged index. |
| | | | | | | | | | | | |
| | STANDARDIZED TOTAL RETURNS3 |
| | | For the period ended 12/31/15 | | One Year | | | Since Inception | | | Inception Date |
| | Class A | | | -3.15 | % | | | 13.07 | % | | 1/31/12 |
| | Class C | | | -0.30 | | | | 13.87 | | | 1/31/12 |
| | Institutional | | | 2.84 | | | | 15.17 | | | 1/31/12 |
| | Class IR | | | 2.74 | | | | 15.02 | | | 1/31/12 |
| | Class R | | | 2.23 | | | | 14.44 | | | 1/31/12 |
| | | Class R6 | | | N/A | | | | -1.45 | | | 7/31/15 |
| | 3 | | The Standardized Total Returns are average annual total returns as of the most recent calendar quarter-end or cumulative total returns for periods less than 1 year. They assume reinvestment of all distributions at NAV. These returns reflect a maximum initial sales charge of 5.5% for Class A Shares and the assumed contingent deferred sales charge for Class C Shares (1% if redeemed within 12 months of purchase). Because Institutional, Class IR, Class R and Class R6 Shares do not involve a sales charge, such a charge is not applied to their Standardized Total Returns. |
The returns set forth in the tables above represent past performance. Past performance does not guarantee future results. The Fund’s investment return and principal value will fluctuate so that an investor’s shares, when redeemed, may be worth more or less than their original cost. Current performance may be lower or higher than the performance quoted above. Please visit our web site at www.GSAMFUNDS.com to obtain the most recent month-end returns. Performance reflects applicable fee waivers and/or expense limitations in effect during the periods shown. In their absence, performance would be reduced. Returns do not reflect the deduction of taxes that a shareholder would pay on Fund distributions or the redemption of Fund shares.
32
FUND BASICS
| | | | | | | | | | |
| | EXPENSE RATIOS4 | | | | | | | | |
| | | | | Net Expense Ratio (Current) | | | Gross Expense Ratio (Before Waivers) | |
| | Class A | | | 1.20 | % | | | 2.22 | % |
| | Class C | | | 1.95 | | | | 3.00 | |
| | Institutional | | | 0.80 | | | | 1.85 | |
| | Class IR | | | 0.97 | | | | 2.02 | |
| | Class R | | | 1.45 | | | | 2.50 | |
| | | Class R6 | | | 0.78 | | | | 1.83 | |
| | 4 | | The expense ratios of the Fund, both current (net of applicable fee waivers and/or expense limitations) and before waivers (gross of applicable fee waivers and/or expense limitations) are as set forth above according to the most recent publicly available Prospectus for the Fund and may differ from the expense ratios disclosed in the Financial Highlights in this report. Pursuant to a contractual arrangement, the Fund’s waivers and/or expense limitations will remain in place through at least December 29, 2016, and prior to such date the investment adviser may not terminate the arrangements without the approval of the Fund’s Board of Trustees. If these arrangements are discontinued in the future, the expense ratios may change without shareholder approval. |
| | | | | | | | |
| | TOP TEN HOLDINGS AS OF 2/29/165 |
| | | Holding | | % of Net Assets | | | Line of Business |
| | Apple, Inc. | | | 9.6 | % | | Computers & Peripherals |
| | Alphabet, Inc. Class A | | | 6.7 | | | Internet Software & Services |
| | Costco Wholesale Corp. | | | 6.2 | | | Food & Staples Retailing |
| | Facebook, Inc. Class A | | | 5.8 | | | Internet Software & Services |
| | American Tower Corp. | | | 5.5 | | | Real Estate Investment Trusts |
| | Equinix, Inc. | | | 5.2 | | | Real Estate Investment Trusts |
| | MasterCard, Inc. Class A | | | 5.1 | | | IT Services |
| | Walgreens Boots Alliance, Inc. | | | 5.0 | | | Food & Staples Retailing |
| | McDonald’s Corp. | | | 4.5 | | | Hotels, Restaurants & Leisure |
| | | Abbott Laboratories | | | 4.4 | | | Health Care Equipment & Supplies |
| | 5 | | The top 10 holdings may not be representative of the Fund’s future investments. |
33
FUND BASICS
|
| FUND VS. BENCHMARK SECTOR ALLOCATION6 |
| As of February 29, 2016 |
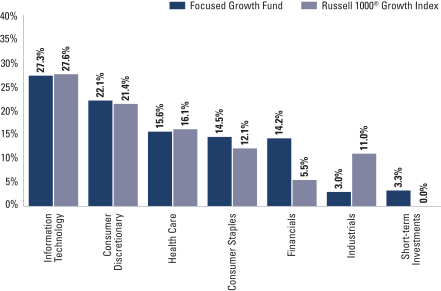
| | 6 | | The Fund is actively managed and, as such, its composition may differ over time. Consequently, the Fund’s overall sector allocations may differ from the percentages contained in the graph above. The graph categorizes investments using the Global Industry Classification Standard (“GICS”), however, the sector classifications used by the portfolio management team may differ from GICS. The percentage shown for each investment category reflects the value of investments in that category as a percentage of market value. Short-term investments represent repurchase agreements. The graph depicts the Fund’s investments but may not represent the Fund’s market exposure due to the exclusion of certain derivatives, if any, as listed in the Additional Investment Information section of the Schedule of Investments. |
34
PORTFOLIO RESULTS
Goldman Sachs Growth Opportunities Fund
Portfolio Composition
The Fund invests primarily in medium-sized growth companies with a market capitalization between $1 and $10 billion. Since the Fund’s inception, the Goldman Sachs Growth Equity Investment Team has focused on several key investment criteria that it believes can drive a company’s growth over the long term. These characteristics are: dominant market share, established brand name, pricing power, recurring revenue stream, free cash flow, high returns on invested capital, predictable growth, sustainable growth, long product life cycle, enduring competitive advantage, favorable demographic trends and excellent management. The Team strives to purchase these companies at reasonable valuations in order to capture the full benefits of their growth.
Portfolio Management Discussion and Analysis
Below, the Goldman Sachs Growth Equity Investment Team discusses the Goldman Sachs Growth Opportunities Fund’s (the “Fund”) performance and positioning for the six-month period ended February 29, 2016 (the “Reporting Period”).
| Q | | How did the Fund perform during the Reporting Period? |
| A | | During the Reporting Period, the Fund’s Class A, C, Institutional, Service, IR, R and R6 Shares generated cumulative total returns, without sales charges, of -10.08%, -10.38%, -9.89%, -10.10%, -9.96%, -10.19% and -9.89%, respectively. These returns compare to the -6.03% cumulative total return of the Fund’s benchmark, the Russell Midcap® Growth Index (with dividends reinvested) (the “Russell Index”), during the same period. |
| Q | | What key factors were responsible for the Fund’s performance during the Reporting Period? |
| A | | Stock selection overall detracted from the Fund’s performance relative to the Russell Index during the Reporting Period. Sector allocation as a whole also detracted, albeit much more modestly. |
| Q | | Which equity market sectors most significantly affected Fund performance? |
| A | | Detracting most from the Fund’s relative results was challenging stock selection in the consumer discretionary, information technology and health care sectors. The only two sectors to contribute positively to the Fund’s relative performance during the Reporting Period were financials and energy, wherein effective stock selection drove results. |
| Q | | Which stocks detracted significantly from the Fund’s performance during the Reporting Period? |
| A | | Detracting most from the Fund’s results relative to its benchmark index were positions in home furnishing retailer Restoration Hardware Holdings, molecular diagnostics company Cepheid and hospital and medical services provider holding company Adeptus Health. |
| | Restoration Hardware Holdings was the top detractor from the Fund’s relative performance during the Reporting Period. The company’s share price declined after it reported disappointing third quarter 2015 revenues, citing weaker performance in oil-exposed regions as the main driver. The company’s shares experienced further declines in the fourth quarter of 2015 when the company missed on its previous earnings guidance, reporting a significant decline in earnings per share year over year. Despite this recent weakness, we believed at the end of the Reporting Period that Restoration Hardware Holdings was poised for greater sales growth moving forward. We also believed the company could benefit from some of its ongoing initiatives, such as promotions and new store openings. |
| | Cepheid’s release of its third quarter 2015 earnings negatively pressured its share price during the Reporting Period. Its management cited the integration and productivity implications of doubling its U.S. salesforce as the primary driver behind its earnings miss. By the end of the Reporting Period, we believed the company had more time to train and integrate its new salesforce and thus further believed the |
35
PORTFOLIO RESULTS
| | company was poised well for growth. We maintained confidence in the actions its management was taking to accelerate the company’s growth profile. In our view, Cepheid remained the dominant molecular diagnostics platform at the end of the Reporting Period. |
| | Despite strong third quarter 2015 results, Adeptus Health’s shares traded lower during the Reporting Period, partly due to the industry-broad brush of other health services companies, which performed below market expectations. Additionally, the company’s results reflected some seasonal slowdown from the prior quarter, which may have impacted investor sentiment. At the end of the Reporting Period, we believed Adeptus Health remained one of the fastest growing players in the health care services industry with good visibility on new facility openings during the next few years. In our view, the company’s growth story has also been driven by its joint venture strategy that focuses on partnering with not-for-profit health care systems. Adeptus Health maintains a dominant position in a rapidly expanding industry, and we believe it presents significant upside potential should it continue to expand both organically and through its joint venture strategy. |
| Q | | What were some of the Fund’s best-performing individual stocks? |
| A | | The Fund benefited most relative to the Russell Index from positions in retail bakery café Panera Bread, data center real estate investment trust (“REIT”) Equinix and flavor food products manufacturer McCormick. |
| | Panera Bread Company was the top positive contributor to the Fund’s relative returns during the Reporting Period. The company’s share price declined early in the Reporting Period after its management decided to not provide commentary on 2016 guidance when it released its third quarter 2015 earnings. However, its share price recovered later in the Reporting Period, as fourth quarter 2015 results were released, highlighting better sales and restaurant margins. Additionally, Panera Bread guided 2016 earnings upward, which included consensus estimates at the high end of guidance. At the end of the Reporting Period, we remained positive on the company and believed store upgrades and increased marketing efforts should continue to drive traffic to a company that we believe has a strong secular opportunity in the fast-casual dining industry. |
| | Equinix was a strong contributor to the Fund’s performance during the Reporting Period. The company announced high quality results for the second and third quarters of 2015, as secular growth in enterprise spending helped drive organic revenue growth and bookings to record levels. Also, solid performance in all regions in which the REIT operates led Equinix to raise guidance across key metrics during the Reporting Period, which was well received by the markets. In our view, Equinix continued at the end of the Reporting Period to present a favorable outlook, as pricing has been net positive in the low churn rate, or turnover, environment. Going forward, we believe Equinix may further benefit from its recurring revenue business model, steady demand environment, and integration of recent acquisitions that could unlock significant synergies. |
| | Shares of McCormick rose, as the company benefited from strong fourth quarter 2015 results, with earnings coming in slightly above consensus estimates. According to company management, the positive results were driven by a broad improvement in organic growth across its consumer and industrial businesses. At the end of the Reporting Period, we were encouraged by the better earnings visibility and improving momentum in McCormick’s consumer business. We believed the company might benefit from the secular growth in healthy cooking and the stabilization of private label competitors across many of its core spice categories. We further believed the company had the ability to continue to unlock growth given its global expansion efforts and product popularity. Finally, in our view, McCormick is led by a quality management team, which is capable of producing strong results moving forward. |
| Q | | How did the Fund use derivatives and similar instruments during the Reporting Period? |
| A | | During the Reporting Period, we did not use derivatives as part of an active management strategy. |
| Q | | Did the Fund make any significant purchases or sales during the Reporting Period? |
| A | | We initiated a Fund position in Expedia. We believe the online travel agency industry should continue to experience a healthy growth rate moving forward. We see Expedia as a market share gainer within this industry and expect the company to continue to be able to generate bookings and revenue growth. |
| | We established a Fund position in Xylem, a water technology company, during the Reporting Period. In our view, Xylem is poised to benefit from secular growth and a cyclical recovery of water utility spending. The company’s exposure to oil is minimal, and we believe there are merger and acquisition opportunities to move up the water technology curve if needed. We are optimistic on Xylem’s margin expansion |
36
PORTFOLIO RESULTS
| | prospects and believe its management team has done well to position the company for sustainable long-term growth. |
| | Conversely, we exited the Fund’s position in surgical systems manufacturer Intuitive Surgical. Its stock held up relatively well during the market sell-off during the Reporting Period, but with what we perceive as increased competitive risk in the robotic surgery space, we opted to move proceeds to more compelling ideas. |
| | We sold the Fund’s position in Hilton Worldwide Holdings, a holding company that provides hospitality services through its subsidiaries. We believe the company to be a strong growth franchise with a skilled management team. We also believe the company could benefit from upcoming catalysts, especially the real estate investment trust spin-out set to take place in 2016. However, we ultimately feel there are better opportunities in the industry with higher risk/reward potential. |
| Q | | Were there any notable changes in the Fund’s weightings during the Reporting Period? |
| A | | In constructing the Fund’s portfolio, we focus on picking stocks rather than on making industry or sector bets. We seek to outpace the benchmark index by overweighting stocks that we expect to outperform and underweighting those that we think may lag. Consequently, changes in its sector weights are generally the direct result of individual stock selection or of stock appreciation or depreciation. That said, during the Reporting Period, the Fund’s exposure to consumer staples, industrials and materials increased as did its position in cash and its allocations to consumer discretionary and financials decreased relative to the Russell Index. |
| Q | | How was the Fund positioned relative to its benchmark index at the end of the Reporting Period? |
| A | | At the end of the Reporting Period, the Fund had overweighted positions relative to the Russell Index in the telecommunication services and health care sectors. On the same date, the Fund had underweighted positions compared to the Russell Index in financials, industrials and consumer discretionary. The Fund was rather neutrally weighted to the Index in consumer staples, energy, information technology and materials and had no position at all in utilities at the end of the Reporting Period. |
37
FUND BASICS
Growth Opportunities Fund
as of February 29, 2016
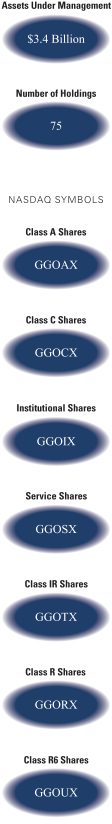
| | | | | | | | | | |
| | PERFORMANCE REVIEW | |
| | | September 1, 2015–February 29, 2016 | | Fund Total Return
(based on NAV)1 | | | Russell Midcap®
Growth Index2 | |
| | Class A | | | -10.08 | % | | | -6.03 | % |
| | Class C | | | -10.38 | | | | -6.03 | |
| | Institutional | | | -9.89 | | | | -6.03 | |
| | Service | | | -10.10 | | | | -6.03 | |
| | Class IR | | | -9.96 | | | | -6.03 | |
| | Class R | | | -10.19 | | | | -6.03 | |
| | | Class R6 | | | -9.89 | | | | -6.03 | |
| | 1 | | The net asset value (“NAV”) represents the net assets of the class of the Fund (ex-dividend) divided by the total number of shares of the class outstanding. The Fund’s performance reflects the reinvestment of dividends and other distributions. The Fund’s performance does not reflect the deduction of any applicable sales charges. |
| | 2 | | The Russell Midcap® Growth Index (with dividends reinvested) is an unmanaged market capitalization weighted index that measures the performance of those Russell Midcap companies with higher price-to-book ratios and higher forecasted growth values. The Index figures do not reflect any deduction for fees, expenses or taxes. It is not possible to invest directly in an index. |
| | | | | | | | | | | | | | | | | | | | |
| | STANDARDIZED TOTAL RETURNS3 |
| | | For the period ended 12/31/15 | | One Year | | | Five Years | | | Ten Years | | | Since Inception | | | Inception Date |
| | Class A | | | -10.82 | % | | | 8.31 | % | | | 7.75 | % | | | 10.20 | % | | 5/24/99 |
| | Class C | | | -7.26 | | | | 8.73 | | | | 7.55 | | | | 9.75 | | | 5/24/99 |
| | Institutional | | | -5.24 | | | | 9.98 | | | | 8.80 | | | | 11.01 | | | 5/24/99 |
| | Service | | | -5.71 | | | | 9.43 | | | | 8.26 | | | | 10.46 | | | 5/24/99 |
| | Class IR | | | -5.39 | | | | 9.82 | | | | N/A | | | | 7.79 | | | 11/30/07 |
| | Class R | | | -5.88 | | | | 9.26 | | | | N/A | | | | 7.25 | | | 11/30/07 |
| | | Class R6 | | | N/A | | | | N/A | | | | N/A | | | | -7.70 | | | 7/31/15 |
| | 3 | | The Standardized Total Returns are average annual total returns as of the most recent calendar quarter-end or cumulative total returns for periods less than 1 year. They assume reinvestment of all distributions at NAV. These returns reflect a maximum initial sales charge of 5.5% for Class A Shares and the assumed contingent deferred sales charge for Class C Shares (1% if redeemed within 12 months of purchase). Because Institutional, Service, Class IR, Class R and Class R6 Shares do not involve a sales charge, such a charge is not applied to their Standardized Total Returns. |
The returns set forth in the tables above represent past performance. Past performance does not guarantee future results. The Fund’s investment return and principal value will fluctuate so that an investor’s shares, when redeemed, may be worth more or less than their original cost. Current performance may be lower or higher than the performance quoted above. Please visit our web site at www.GSAMFUNDS.com to obtain the most recent month-end returns. Performance reflects applicable fee waivers and/or expense limitations in effect during the periods shown. In their absence, performance would be reduced. Returns do not reflect the deduction of taxes that a shareholder would pay on Fund distributions or the redemption of Fund shares.
38
FUND BASICS
| | | | | | | | | | |
| | EXPENSE RATIOS4 | |
| | | | | Net Expense Ratio (Current) | | | Gross Expense Ratio (Before Waivers) | |
| | Class A | | | 1.30 | % | | | 1.40 | % |
| | Class C | | | 2.05 | | | | 2.15 | |
| | Institutional | | | 0.95 | | | | 1.00 | |
| | Service | | | 1.45 | | | | 1.50 | |
| | Class IR | | | 1.05 | | | | 1.15 | |
| | Class R | | | 1.55 | | | | 1.65 | |
| | | Class R6 | | | 0.93 | | | | 0.98 | |
| | 4 | | The expense ratios of the Fund, both current (net of applicable fee waivers and/or expense limitations) and before waivers (gross of applicable fee waivers and/or expense limitations) are as set forth above according to the most recent publicly available Prospectus for the Fund and may differ from the expense ratios disclosed in the Financial Highlights in this report. Pursuant to a contractual arrangement, the Fund’s waivers and/or expense limitations will remain in place through at least December 29, 2016, and prior to such date the investment adviser may not terminate the arrangements without the approval of the Fund’s Board of Trustees. If these arrangements are discontinued in the future, the expense ratios may change without shareholder approval. |
| | | | | | | | |
| | TOP TEN HOLDINGS AS OF 2/29/165 |
| | | Holding | | % of
Net Assets | | | Line of Business |
| | McCormick & Co., Inc. | | | 2.7 | % | | Food Products |
| | Amphenol Corp. Class A | | | 2.7 | | | Electronic Equipment, Instruments &
Components |
| | Panera Bread Co. Class A | | | 2.7 | | | Hotels, Restaurants & Leisure |
| | Equinix, Inc. | | | 2.6 | | | Real Estate Investment Trusts |
| | Tractor Supply Co. | | | 2.5 | | | Specialty Retail |
| | Henry Schein, Inc. | | | 2.2 | | | Health Care Providers & Services |
| | The Middleby Corp. | | | 2.1 | | | Machinery |
| | SBA Communications Corp. Class A | | | 2.1 | | | Diversified Telecommunication Services |
| | Ulta Salon, Cosmetics & Fragrance, Inc. | | | 2.1 | | | Specialty Retail |
| | | The Sherwin-Williams Co. | | | 2.0 | | | Chemicals |
| | 5 | | The top 10 holdings may not be representative of the Fund’s future investments. |
39
FUND BASICS
|
| FUND VS. BENCHMARK SECTOR ALLOCATION6 |
| As of February 29, 2016 |
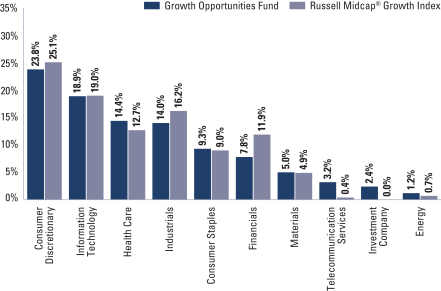
| | 6 | | The Fund is actively managed and, as such, its composition may differ over time. Consequently, the Fund’s overall sector allocations may differ from the percentages contained in the graph above. The graph categorizes investments using the Global Industry Classification Standard (“GICS”), however, the sector classifications used by the portfolio management team may differ from GICS. The percentage shown for each investment category reflects the value of investments in that category as a percentage of market value. The graph depicts the Fund’s investments but may not represent the Fund’s market exposure due to the exclusion of certain derivatives, if any, as listed in the Additional Investment Information section of the Schedule of Investments. |
40
PORTFOLIO RESULTS
Goldman Sachs Small/Mid Cap Growth Fund
Portfolio Composition
The Fund invests primarily in small and medium-sized growth companies with a market capitalization between $200 million and $10 billion. Since the Fund’s inception, the Goldman Sachs Growth Equity Investment Team has focused on several key investment criteria that it believes can drive a company’s growth over the long term. These characteristics are: dominant market share, established brand name, pricing power, recurring revenue stream, free cash flow, high returns on invested capital, predictable growth, sustainable growth, long product life cycle, enduring competitive advantage, favorable demographic trends and excellent management. The Team strives to purchase these companies at reasonable valuations in order to capture the full benefits of their growth.
Portfolio Management Discussion and Analysis
Below, the Goldman Sachs Growth Equity Investment Team discusses the Goldman Sachs Small/Mid Cap Growth Fund’s (the “Fund”) performance and positioning for the six-month period ended February 29, 2016 (the “Reporting Period”).
| Q | | How did the Fund perform during the Reporting Period? |
| A | | During the Reporting Period, the Fund’s Class A, C, Institutional, Service, IR, R and R6 Shares generated cumulative total returns, without sales charges, of -14.34%, -14.69%, -14.21%, -14.41%, -14.24%, -14.47% and -14.21%, respectively. These returns compare to the -11.30% cumulative total return of the Fund’s benchmark, the Russell 2500® Growth Index (with dividends reinvested) (the “Russell Index”), during the same period. |
| Q | | What key factors were responsible for the Fund’s performance during the Reporting Period? |
| A | | Stock selection overall detracted from the Fund’s performance relative to the Russell Index during the Reporting Period. Sector allocation as a whole contributed positively during the Reporting Period. |
| Q | | Which equity market sectors most significantly affected Fund performance? |
| A | | Detracting from relative results most during the Reporting Period were information technology, health care and industrials, wherein stock selection was challenging. Effective stock selection in the financials, energy and materials sectors helped the Fund’s performance most relative to the Russell Index. |
| Q | | Which stocks detracted significantly from the Fund’s performance during the Reporting Period? |
| A | | Detracting most from the Fund’s results relative to its benchmark index were positions in home furnishing retailer Restoration Hardware Holdings, clinical-stage pharmaceutical company Cempra and hospital and medical services provider holding company Adeptus Health. |
| | Restoration Hardware Holdings was the top detractor from the Fund’s relative performance during the Reporting Period. The company’s share price declined after it reported disappointing third quarter 2015 revenues, citing weaker performance in oil-exposed regions as the main driver. The company’s shares experienced further declines in the fourth quarter of 2015 when the company missed on its previous earnings guidance, reporting a significant decline in earnings per share year over year. Despite this recent weakness, we believed at the end of the Reporting Period that Restoration Hardware Holdings was poised for greater sales growth moving forward. We also believed the company could benefit from some of its ongoing initiatives, such as promotions and new store openings. |
| | Cempra was a top detractor from the Fund’s relative results during the Reporting Period. Cempra develops antibiotics to meet critical medical needs in the treatment of bacterial infectious diseases and currently has two antibiotic candidates, Solithromycin and Taksta. Despite positive progress in the drugs’ clinical trials, shares of the company declined during the Reporting Period amid negative |
41
PORTFOLIO RESULTS
| | sentiment in the pharmaceuticals industry broadly and around the latest drug pricing debate. Cempra’s share price was also pressured downward following its third quarter 2015 earnings release, despite the results being generally positive. We believe this was due to the market’s focus on Solithromycin’s side effects. We believe the company accomplished all it needed for the Food and Drug Administration’s approval and that concerns over side effects may have been an overreaction. At the end of the Reporting Period, we believed in the overall potential of Cempra’s antibiotic candidates and the attractiveness of novel antibiotics as a class. |
| | Despite strong third quarter 2015 results, Adeptus Health’s shares traded lower during the Reporting Period, partly due to the industry-broad brush of other health services companies, which performed below market expectations. Additionally, the company’s results reflected some seasonal slowdown from the prior quarter, which may have impacted investor sentiment. At the end of the Reporting Period, we believed Adeptus Health remained one of the fastest growing players in the health care services industry with good visibility on new facility openings during the next few years. In our view, the company’s growth story has also been driven by its joint venture strategy that focuses on partnering with not-for-profit health care systems. Adeptus Health maintains a dominant position in a rapidly expanding industry, and we believe it presents significant upside potential should it continue to expand both organically and through its joint venture strategy. |
| Q | | What were some of the Fund’s best-performing individual stocks? |
| A | | The Fund benefited most relative to the Russell Index from positions in retail bakery café Panera Bread, data center real estate investment trust (“REIT”) Equinix and flavor food products manufacturer McCormick. |
| | Panera Bread Company was the top positive contributor to the Fund’s relative returns during the Reporting Period. The company’s share price declined early in the Reporting Period after its management decided to not provide commentary on 2016 guidance when it released its third quarter 2015 earnings. However, its share price recovered later in the Reporting Period, as fourth quarter 2015 results were released, highlighting better sales and restaurant margins. Additionally, Panera Bread guided 2016 earnings upward, which included consensus estimates at the high end of guidance. At the end of the Reporting Period, we remained positive on the company and believed store upgrades and increased marketing efforts should continue to drive traffic to a company that we believe has a strong secular opportunity in the fast-casual dining industry. |
| | Equinix was a strong contributor to the Fund’s performance during the Reporting Period. The company announced high quality results for the second and third quarters of 2015, as secular growth in enterprise spending helped drive organic revenue growth and bookings to record levels. Also, solid performance in all regions in which the REIT operates led Equinix to raise guidance across key metrics during the Reporting Period, which was well received by the markets. In our view, Equinix continued at the end of the Reporting Period to present a favorable outlook, as pricing has been net positive in the low churn rate, or turnover, environment. Going forward, we believe Equinix may further benefit from its recurring revenue business model, steady demand environment, and integration of recent acquisitions that could unlock significant synergies. |
| | Shares of McCormick rose, as the company benefited from strong fourth quarter 2015 results, with earnings coming in slightly above consensus estimates. According to company management, the positive results were driven by a broad improvement in organic growth across its consumer and industrial businesses. At the end of the Reporting Period, we were encouraged by the better earnings visibility and improving momentum in McCormick’s consumer business. We believed the company might benefit from the secular growth in healthy cooking and the stabilization of private label competitors across many of its core spice categories. We further believed the company had the ability to continue to unlock growth given its global expansion efforts and product popularity. Finally, in our view, McCormick is led by a quality management team, which is capable of producing strong results moving forward. |
| Q | | How did the Fund use derivatives and similar instruments during the Reporting Period? |
| A | | During the Reporting Period, we did not use derivatives as part of an active management strategy. |
42
PORTFOLIO RESULTS
| Q | | Did the Fund make any significant purchases or sales during the Reporting Period? |
| A | | During the Reporting Period, we initiated a Fund position in Xylem, a water technology company, during the Reporting Period. In our view, Xylem is poised to benefit from secular growth and a cyclical recovery of water utility spending. The company’s exposure to oil is minimal, and we believe there are merger and acquisition opportunities to move up the water technology curve if needed. We are optimistic on Xylem’s margin expansion prospects and believe its management team has done well to position the company for sustainable long-term growth. |
| | We established a Fund position in Whole Foods Market, an organic foods supermarket chain. We are optimistic on the company and its dominant market position. Of note are the significant steps that Whole Foods Market’s management has actively taken to improve the company’s pricing and marketing. We believe these efforts could potentially drive sales growth in the coming quarters. We also like what we consider to be the company’s good earnings visibility from cost-reduction efforts and its potential share buybacks. |
| | Conversely, we exited the Fund’s position in Jarden, a multi-brand consumer products company. Jarden has been a strong performer, and while we continue to like the business, we believe it is too large to own in this Fund for the long term. As a result, we decided to sell the position in favor of other compelling opportunities. |
| | We eliminated the Fund’s position in Roadrunner Transportation Systems, a leading asset-light transportation and logistics service provider. Our confidence in the company was tested by an overall weak outlook for freight volumes across the transportation industry. In turn, we opted to sell the position and pursue higher conviction ideas. |
| Q | | Were there any notable changes in the Fund’s weightings during the Reporting Period? |
| A | | In constructing the Fund’s portfolio, we focus on picking stocks rather than on making industry or sector bets. We seek to outpace the benchmark index by overweighting stocks that we expect to outperform and underweighting those that we think may lag. Consequently, changes in its sector weights are generally the direct result of individual stock selection or of stock appreciation or depreciation. That said, during the Reporting Period, the Fund’s exposure to consumer discretionary, consumer staples, health care and telecommunication services increased and its allocations to financials, industrials and information technology decreased relative to the Russell Index. |
| Q | | How was the Fund positioned relative to its benchmark index at the end of the Reporting Period? |
| A | | At the end of the Reporting Period, the Fund had overweighted positions relative to the Russell Index in the consumer staples, telecommunication services and consumer discretionary sectors. On the same date, the Fund had underweighted positions compared to the Russell Index in financials, information technology, materials and industrials. The Fund was rather neutrally weighted to the Index in energy and health care and had no position at all in utilities at the end of the Reporting Period. |
43
FUND BASICS
Small/Mid Cap Growth Fund
as of February 29, 2016
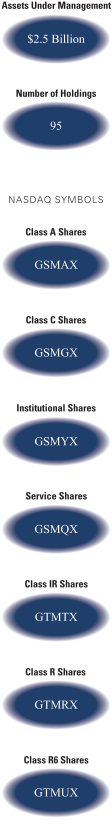
| | | | | | | | | | |
| | PERFORMANCE REVIEW | |
| | | September 1, 2015–February 29, 2016 | | Fund Total Return
(based on NAV)1 | | | Russell 2500®
Growth Index2 | |
| | Class A | | | -14.34 | % | | | -11.30 | % |
| | Class C | | | -14.69 | | | | -11.30 | |
| | Institutional | | | -14.21 | | | | -11.30 | |
| | Service | | | -14.41 | | | | -11.30 | |
| | Class IR | | | -14.24 | | | | -11.30 | |
| | Class R | | | -14.47 | | | | -11.30 | |
| | | Class R6 | | | -14.21 | | | | -11.30 | |
| | 1 | | The net asset value (“NAV”) represents the net assets of the class of the Fund (ex-dividend) divided by the total number of shares of the class outstanding. The Fund’s performance reflects the reinvestment of dividends and other distributions. The Fund’s performance does not reflect the deduction of any applicable sales charges. |
| | 2 | | The Russell 2500® Growth Index (with dividends reinvested) is an unmanaged index that measures the performance of the small- to mid-cap growth segment of the US equity universe. The Russell 2500® Growth Index is constructed to provide a comprehensive and unbiased barometer of the small- to mid-cap growth market. Based on ongoing empirical research of investment manager behavior, the methodology used to determine growth probability approximates the aggregate small- to mid-cap growth manager’s opportunity set. The Index figures do not reflect any deduction for fees, expenses or taxes. It is not possible to invest directly in an index. |
| | | | | | | | | | | | | | | | | | | | |
| | STANDARDIZED TOTAL RETURNS3 |
| | | For the period ended 12/31/15 | | One Year | | | Five Years | | | Ten Years | | | Since Inception | | | Inception Date |
| | Class A | | | -6.59 | % | | | 10.12 | % | | | 9.56 | % | | | 9.65 | % | | 6/30/05 |
| | Class C | | | -2.91 | | | | 10.54 | | | | 9.35 | | | | 9.38 | | | 6/30/05 |
| | Institutional | | | -0.79 | | | | 11.81 | | | | 10.62 | | | | 10.64 | | | 6/30/05 |
| | Service | | | -1.33 | | | | 11.24 | | | | 10.05 | | | | 10.08 | | | 6/30/05 |
| | Class IR | | | -0.95 | | | | 11.65 | | | | N/A | | | | 9.21 | | | 11/30/07 |
| | Class R | | | -1.44 | | | | 11.09 | | | | N/A | | | | 8.67 | | | 11/30/07 |
| | | Class R6 | | | N/A | | | | N/A | | | | N/A | | | | -10.38 | | | 7/31/15 |
| | 3 | | The Standardized Total Returns are average annual total returns as of the most recent calendar quarter-end or cumulative total returns for periods less than 1 year. They assume reinvestment of all distributions at NAV. These returns reflect a maximum initial sales charge of 5.5% for Class A Shares and the assumed contingent deferred sales charge for Class C Shares (1% if redeemed within 12 months of purchase). Because Institutional, Service, Class IR, Class R and Class R6 Shares do not involve a sales charge, such a charge is not applied to their Standardized Total Returns. |
The returns set forth in the tables above represent past performance. Past performance does not guarantee future results. The Fund’s investment return and principal value will fluctuate so that an investor’s shares, when redeemed, may be worth more or less than their original cost. Current performance may be lower or higher than the performance quoted above. Please visit our web site at www.GSAMFUNDS.com to obtain the most recent month-end returns. Performance reflects applicable fee waivers and/or expense limitations in effect during the periods shown. In their absence, performance would be reduced. Returns do not reflect the deduction of taxes that a shareholder would pay on Fund distributions or the redemption of Fund shares.
44
FUND BASICS
| | | | | | | | | | |
| | EXPENSE RATIOS4 | |
| | | | | Net Expense Ratio (Current) | | | Gross Expense Ratio (Before Waivers) | |
| | Class A | | | 1.30 | % | | | 1.45 | % |
| | Class C | | | 2.05 | | | | 2.20 | |
| | Institutional | | | 0.93 | | | | 1.05 | |
| | Service | | | 1.42 | | | | 1.55 | |
| | Class IR | | | 1.05 | | | | 1.20 | |
| | Class R | | | 1.55 | | | | 1.70 | |
| | | Class R6 | | | 0.91 | | | | 1.03 | |
| | 4 | | The expense ratios of the Fund, both current (net of applicable fee waivers and/or expense limitations) and before waivers (gross of applicable fee waivers and/or expense limitations) are as set forth above according to the most recent publicly available Prospectus for the Fund and may differ from the expense ratios disclosed in the Financial Highlights in this report. Pursuant to a contractual arrangement, the Fund’s waivers and/or expense limitations will remain in place through at least December 29, 2016, and prior to such date the investment adviser may not terminate the arrangements without the approval of the Fund’s Board of Trustees. If these arrangements are discontinued in the future, the expense ratios may change without shareholder approval. |
| | | | | | | | |
| | TOP TEN HOLDINGS AS OF 2/29/165 |
| | | Holding | | % of
Net Assets | | | Line of Business |
| | Panera Bread Co. Class A | | | 2.7 | % | | Hotels, Restaurants & Leisure |
| | Tractor Supply Co. | | | 2.6 | | | Specialty Retail |
| | Eagle Bancorp, Inc. | | | 2.5 | | | Commercial Banks |
| | Ulta Salon, Cosmetics & Fragrance, Inc. | | | 2.1 | | | Specialty Retail |
| | The Middleby Corp. | | | 2.1 | | | Machinery |
| | Black Knight Financial Services, Inc. Class A | | | 2.1 | | | IT Services |
| | Xylem, Inc. | | | 1.9 | | | Machinery |
| | Under Armour, Inc. Class A | | | 1.9 | | | Textiles, Apparel & Luxury Goods |
| | Fortune Brands Home & Security, Inc. | | | 1.8 | | | Building Products |
| | | Healthcare Services Group, Inc. | | | 1.8 | | | Commercial Services & Supplies |
| | 5 | | The top 10 holdings may not be representative of the Fund’s future investments. |
45
FUND BASICS
|
| FUND VS. BENCHMARK SECTOR ALLOCATION6 |
| As of February 29, 2016 |
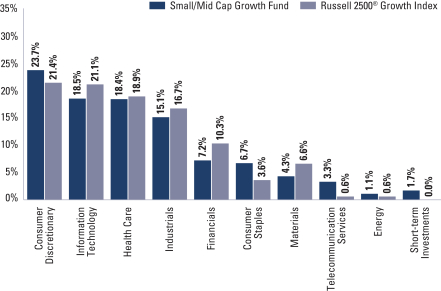
| | 6 | | The Fund is actively managed and, as such, its composition may differ over time. Consequently, the Fund’s overall sector allocations may differ from the percentages contained in the graph above. The graph categorizes investments using the Global Industry Classification Standard (“GICS”), however, the sector classifications used by the portfolio management team may differ from GICS. The percentage shown for each investment category reflects the value of investments in that category as a percentage of market value. Short-term investments represent repurchase agreements. The graph depicts the Fund’s investments but may not represent the Fund’s market exposure due to the exclusion of certain derivatives, if any, as listed in the Additional Investment Information section of the Schedule of Investments. |
46
PORTFOLIO RESULTS
Goldman Sachs Strategic Growth Fund
Portfolio Composition
The Fund invests primarily in U.S. equity investments. The Fund is more selective and focused than many mutual funds and there are typically 50 to 70 holdings in the portfolio. Since the Fund’s inception, the Goldman Sachs Growth Equity Investment Team has focused on several key investment criteria that it believes can drive a company’s growth over the long term. These characteristics are: dominant market share, established brand name, pricing power, recurring revenue stream, free cash flow, high returns on invested capital, predictable growth, sustainable growth, long product life cycle, enduring competitive advantage, favorable demographic trends and excellent management. The Team strives to purchase these companies at reasonable valuations in order to capture the full benefits of their growth.
Portfolio Management Discussion and Analysis
Below, the Goldman Sachs Growth Equity Investment Team discusses the Goldman Sachs Strategic Growth Fund’s (the “Fund”) performance and positioning for the six-month period ended February 29, 2016 (the “Reporting Period”).
| Q | | How did the Fund perform during the Reporting Period? |
| A | | During the Reporting Period, the Fund’s Class A, C, Institutional, Service, IR, R and R6 Shares generated cumulative total returns, without sales charges, of -4.41%, -4.75%, -4.17%, -4.45%, -4.28%, -4.47% and -4.23%, respectively. These returns compare to the -1.22% cumulative total return of the Fund’s benchmark, the Russell 1000® Growth Index (with dividends reinvested) (the “Russell Index”), during the same period. |
| Q | | What key factors were responsible for the Fund’s performance during the Reporting Period? |
| A | | Stock selection overall detracted from the Fund’s performance relative to the Russell Index during the Reporting Period. Sector allocation as a whole also detracted, albeit more modestly. |
| Q | | Which equity market sectors most significantly affected Fund performance? |
| A | | Challenging stock selection in health care, information technology and consumer staples detracted from the Fund’s relative results most during the Reporting Period. The only sector to contribute positively to the Fund’s relative performance during the Reporting Period was financials, wherein effective stock selection drove results. |
| Q | | Which stocks detracted significantly from the Fund’s performance during the Reporting Period? |
| A | | Detracting most from the Fund’s results relative to its benchmark index were positions in global apparel company PVH, oil and gas exploration and production company Anadarko Petroleum and biotechnology firm Vertex Pharmaceuticals. |
| | PVH was the top detractor from the Fund’s results during the Reporting Period. Weakness in the U.S. retail environment, high promotions in the industry, and currency headwinds pressured the company’s results. Despite these concerns, which we see as short-term in nature, we believed at the end of the Reporting Period that PVH remained a leading franchise with dominant market share, strong pricing power and solid fundamentals. Particularly, established brand names Tommy Hilfiger and Calvin Klein have demonstrated international strength and have been a key source of growth. In our view, PVH was undervalued relative to its peers at the end of the Reporting Period, and we remained optimistic on what we see as the company’s significant free cash flow generation ability, quality of management and return potential. |
| | During the Reporting Period, the energy sector continued to demonstrate an unfavorable macro-economic backdrop, leading to secular underperformance. Despite strong underlying fundamentals, Anadarko Petroleum’s stock price was impacted by this volatility in the industry. In early 2016, the company announced fourth quarter 2015 results with higher production and cash flows than market expectations. |
47
PORTFOLIO RESULTS
| | At the end of the Reporting Period, we believed Anadarko Petroleum’s core business remained solid. Further, in our view, what we consider to be the company’s capable management team and its dominant market share position it well for long-term outperformance. |
| | Vertex Pharmaceuticals was a top detractor from the Fund’s performance during the Reporting Period. Primarily, its weakness was driven, in our view, by fourth quarter 2015 results that were below consensus expectations. The company attributed part of the miss to a slowdown in new patient growth due to clinic capacity restraints, creating a patient backlog. We believe Vertex Pharmaceuticals boasts strong underlying fundamentals and a promising product pipeline with significant short-term and long-term catalysts. At the end of the Reporting Period, we believed the company, led by what we consider to be a capable management team, could continue to see growth given its dominant market share in its space and given geographic expansionary efforts that have contributed to meaningful profitability. |
| Q | | What were some of the Fund’s best-performing individual stocks? |
| A | | The Fund benefited most relative to the Russell Index from positions in data center real estate investment trust (“REIT”) Equinix, online social media platform Facebook and flavor food products manufacturer McCormick. |
| | Equinix was a strong contributor to the Fund’s performance during the Reporting Period. The company announced high quality results for the second and third quarters of 2015, as secular growth in enterprise spending helped drive organic revenue growth and bookings to record levels. Also, solid performance in all regions in which the REIT operates led Equinix to raise guidance across key metrics during the Reporting Period, which was well received by the markets. In our view, Equinix continued at the end of the Reporting Period to present a favorable outlook, as pricing has been net positive in the low churn rate, or turnover, environment. Going forward, we believe Equinix may further benefit from its recurring revenue business model, steady demand environment, and integration of recent acquisitions that could unlock significant synergies. |
| | Facebook was a top positive contributor to the Fund’s relative results during the Reporting Period. The company reported strong fourth quarter 2015 results in January 2016, underpinned by advertisement revenue growth well above market expectations. At the end of the Reporting Period, we remained positive on Facebook’s high operating expenditures, at what we consider to be manageable levels, which should allow the company to invest aggressively in substantial growth opportunities and simultaneously increase expected earnings. We think additional tailwinds in the form of lower and decreasing tax rates may further benefit the company in coming years. In our view, Facebook’s strong fundamentals, high barriers to entry, robust contribution from Instagram, and strong demand for its business across most segments and geographies warrant a constructive outlook on its long-term growth prospects. |
| | Shares of McCormick rose, as the company benefited from strong fourth quarter 2015 results, with earnings coming in slightly above consensus estimates. According to company management, the positive results were driven by a broad improvement in organic growth across its consumer and industrial businesses. At the end of the Reporting Period, we were encouraged by the better earnings visibility and improving momentum in McCormick’s consumer business. We believed the company might benefit from the secular growth in healthy cooking and the stabilization of private label competitors across many of its core spice categories. We further believed the company had the ability to continue to unlock growth given its global expansion efforts and product popularity. Finally, in our view, McCormick is led by a quality management team, which is capable of producing strong results moving forward. |
| Q | | How did the Fund use derivatives and similar instruments during the Reporting Period? |
| A | | During the Reporting Period, we did not use derivatives as part of an active management strategy. |
| Q | | Did the Fund make any significant purchases or sales during the Reporting Period? |
| A | | We initiated a Fund position in fast-food retail giant McDonald’s. We believe improving sales and reduction in costs should lead to earnings upside and margin expansion. We further think that McDonald’s reduction in capital expenditures and further refranchising could lead to improving return on invested capital and free up additional capital to repurchase stock. In our view, McDonald’s is a high quality franchise with a proficient management team and what we consider to be attractive opportunities to drive top-line growth and earnings. |
| | We established a Fund position in Reynolds American, which is a holding company that manufactures and sells cigarettes in the U.S. We believe the industry backdrop |
48
PORTFOLIO RESULTS
| | remains favorable for tobacco companies. In our view, Reynolds American is well positioned to benefit from this industry backdrop during the next few years. |
| | Conversely, we eliminated the Fund’s position in information storage company EMC. While we continue to like the company, near-term volatility around its acquisition by Dell and long-term issues driven by a backlog of orders led us to use our proceeds toward other opportunities where we believe the risk/reward profile is more compelling. |
| | We sold the Fund’s position in consumer products company Colgate-Palmolive. While we believe Colgate-Palmolive to be a quality business, we think there are better opportunities with more encouraging catalysts elsewhere in the industry. Additionally, we believe it is possible that Colgate-Palmolive could see an earnings decrease in the near term, as foreign currency pressures continue to impact the company. As a result, we decided to exit the position and pursue higher conviction ideas. |
| Q | | Were there any notable changes in the Fund’s weightings during the Reporting Period? |
| A | | In constructing the Fund’s portfolio, we focus on picking stocks rather than on making industry or sector bets. We seek to outpace the benchmark index by overweighting stocks that we expect to outperform and underweighting those that we think may lag. Consequently, changes in its sector weights are generally the direct result of individual stock selection or of stock appreciation or depreciation. That said, during the Reporting Period, the Fund’s exposure to consumer discretionary increased and its allocations to financials and industrials decreased relative to the Russell Index. |
| Q | | How was the Fund positioned relative to its benchmark index at the end of the Reporting Period? |
| A | | At the end of the Reporting Period, the Fund had overweighted positions relative to the Russell Index in the financials and consumer discretionary sectors. On the same date, the Fund had underweighted positions compared to the Russell Index in industrials, health care and materials. The Fund was rather neutrally weighted to the Russell Index in consumer staples, energy and information technology and had no positions at all in utilities and telecommunication services at the end of the Reporting Period. |
49
FUND BASICS
Strategic Growth Fund
as of February 29, 2016
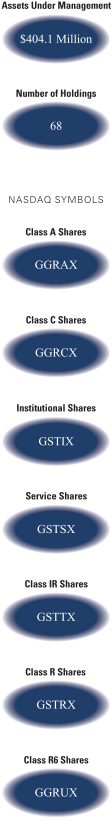
| | | | | | | | | | |
| | PERFORMANCE REVIEW | |
| | | September 1, 2015–February 29, 2016 | | Fund Total Return
(based on NAV)1 | | | Russell 1000®
Growth Index2 | |
| | Class A | | | -4.41 | % | | | -1.22 | % |
| | Class C | | | -4.75 | | | | -1.22 | |
| | Institutional | | | -4.17 | | | | -1.22 | |
| | Service | | | -4.45 | | | | -1.22 | |
| | Class IR | | | -4.28 | | | | -1.22 | |
| | Class R | | | -4.47 | | | | -1.22 | |
| | | Class R6 | | | -4.23 | | | | -1.22 | |
| | 1 | | The net asset value (“NAV”) represents the net assets of the class of the Fund (ex-dividend) divided by the total number of shares of the class outstanding. The Fund’s performance reflects the reinvestment of dividends and other distributions. The Fund’s performance does not reflect the deduction of any applicable sales charges. |
| | 2 | | The Russell 1000® Growth Index (with dividends reinvested) is an unmanaged market capitalization weighted index that measures the performance of those Russell 1000 companies with higher price-to-book ratios and higher forecasted growth values. The Index figures do not reflect any deduction for fees, expenses or taxes. It is not possible to invest directly in an index. |
| | | | | | | | | | | | | | | | | | | | |
| | STANDARDIZED TOTAL RETURNS3 |
| | | For the period ended 12/31/15 | | One Year | | | Five Years | | | Ten Years | | | Since Inception | | | Inception Date |
| | Class A | | | -2.52 | % | | | 11.01 | % | | | 6.70 | % | | | 3.32 | % | | 5/24/99 |
| | Class C | | | 1.16 | | | | 11.42 | | | | 6.49 | | | | 2.90 | | | 5/24/99 |
| | Institutional | | | 3.45 | | | | 12.72 | | | | 7.73 | | | | 4.09 | | | 5/24/99 |
| | Service | | | 3.02 | | | | 12.20 | | | | 7.25 | | | | 3.66 | | | 5/24/99 |
| | Class IR | | | 3.26 | | | | 12.52 | | | | N/A | | | | 15.31 | | | 01/06/09 |
| | Class R | | | 2.88 | | | | 12.04 | | | | N/A | | | | 14.82 | | | 01/06/09 |
| | | Class R6 | | | N/A | | | | N/A | | | | N/A | | | | -2.64 | | | 7/31/15 |
| | 3 | | The Standardized Total Returns are average annual total returns as of the most recent calendar quarter-end or cumulative total returns for periods less than 1 year. They assume reinvestment of all distributions at NAV. These returns reflect a maximum initial sales charge of 5.5% for Class A Shares and the assumed contingent deferred sales charge for Class C Shares (1% if redeemed within 12 months of purchase). Because Institutional, Service, Class IR, Class R and Class R6 Shares do not involve a sales charge, such a charge is not applied to their Standardized Total Returns. |
The returns set forth in the tables above represent past performance. Past performance does not guarantee future results. The Fund’s investment return and principal value will fluctuate so that an investor’s shares, when redeemed, may be worth more or less than their original cost. Current performance may be lower or higher than the performance quoted above. Please visit our web site at www.GSAMFUNDS.com to obtain the most recent month-end returns. Performance reflects applicable fee waivers and/or expense limitations in effect during the periods shown. In their absence, performance would be reduced. Returns do not reflect the deduction of taxes that a shareholder would pay on Fund distributions or the redemption of Fund shares.
50
FUND BASICS
| | | | | | | | | | |
| | EXPENSE RATIOS4 | |
| | | | | Net Expense Ratio (Current) | | | Gross Expense Ratio (Before Waivers) | |
| | Class A | | | 1.15 | % | | | 1.52 | % |
| | Class C | | | 1.90 | | | | 2.27 | |
| | Institutional | | | 0.75 | | | | 1.12 | |
| | Service | | | 1.25 | | | | 1.62 | |
| | Class IR | | | 0.90 | | | | 1.27 | |
| | Class R | | | 1.40 | | | | 1.76 | |
| | | Class R6 | | | 0.73 | | | | 1.10 | |
| | 4 | | The expense ratios of the Fund, both current (net of applicable fee waivers and/or expense limitations) and before waivers (gross of applicable fee waivers and/or expense limitations) are as set forth above according to the most recent publicly available Prospectus for the Fund and may differ from the expense ratios disclosed in the Financial Highlights in this report. Pursuant to a contractual arrangement, the Fund’s waivers and/or expense limitations will remain in place through at least December 29, 2016, and prior to such date the investment adviser may not terminate the arrangements without the approval of the Fund’s Board of Trustees. If these arrangements are discontinued in the future, the expense ratios may change without shareholder approval. |
| | | | | | | | |
| | TOP TEN HOLDINGS AS OF 2/29/165 |
| | | Holding | | % of Net Assets | | | Line of Business |
| | Apple, Inc. | | | 6.7 | % | | Computers & Peripherals |
| | Facebook, Inc. Class A | | | 3.6 | | | Internet Software & Services |
| | Alphabet, Inc. Class A | | | 3.1 | | | Internet Software & Services |
| | Amazon.com, Inc. | | | 2.9 | | | Internet & Catalog Retail |
| | Costco Wholesale Corp. | | | 2.7 | | | Food & Staples Retailing |
| | The Coca-Cola Co. | | | 2.4 | | | Beverages |
| | American Tower Corp. | | | 2.3 | | | Real Estate Investment Trusts |
| | Alphabet, Inc. Class C | | | 2.3 | | | Internet Software & Services |
| | Equinix, Inc. | | | 2.3 | | | Real Estate Investment Trusts |
| | | Starbucks Corp. | | | 2.3 | | | Hotels, Restaurants & Leisure |
| | 5 | | The top 10 holdings may not be representative of the Fund’s future investments. |
51
FUND BASICS
|
| FUND VS. BENCHMARK SECTOR ALLOCATION6 |
| As of February 29, 2016 |
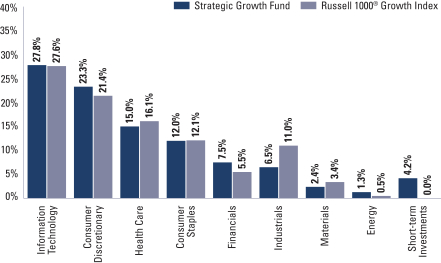
| | 6 | | The Fund is actively managed and, as such, its composition may differ over time. Consequently, the Fund’s overall sector allocations may differ from the percentages contained in the graph above. The graph categorizes investments using the Global Industry Classification Standard (“GICS”), however, the sector classifications used by the portfolio management team may differ from GICS. The percentage shown for each investment category reflects the value of investments in that category as a percentage of market value. Short-term investments represent repurchase agreements. The graph depicts the Fund’s investments but may not represent the Fund’s market exposure due to the exclusion of certain derivatives, if any, as listed in the Additional Investment Information section of the Schedule of Investments. |
52
PORTFOLIO RESULTS
Goldman Sachs Technology Opportunities Fund
Portfolio Composition
The Fund invests, under normal circumstances, at least 80% of its net assets plus any borrowing for investment purposes (measured at time of purchase) in equity investments in technology companies. The Fund seeks to achieve its investment objective by investing, under normal circumstances, in approximately 30-40 companies that are considered by the Investment Adviser to benefit from the proliferation of technology. Although the Fund invests primarily in publicly traded U.S. securities, it may invest up to 25% of its total assets measured at the time of purchase in foreign securities, including securities of issuers in countries with emerging markets or economies and securities quoted in foreign currencies. The Fund may also invest in privately held companies and companies that only recently began to trade publicly.
Portfolio Management Discussion and Analysis
Below, the Goldman Sachs Growth Equity Investment Team discusses the Goldman Sachs Technology Opportunities Fund’s (the “Fund”) performance and positioning for the six-month period ended February 29, 2016 (the “Reporting Period”).
| Q | | How did the Fund perform during the Reporting Period? |
| A | | During the Reporting Period, the Fund’s Class A, C, Institutional, Service and IR Shares generated cumulative total returns, without sales charges, of -5.44%, -5.78%, -5.23%, -5.52% and -5.32%, respectively. These returns compare to the 1.18% cumulative total return of the Fund’s benchmark, the S&P North American Technology Sector Index (the “S&P Technology Index”), during the same period. |
| Q | | What key factors were responsible for the Fund’s performance during the Reporting Period? |
| A | | Stock selection overall detracted from the Fund’s performance relative to the S&P Technology Index during the Reporting Period. Sector allocation as a whole also detracted, albeit much more modestly. |
| Q | | Which equity market sectors most significantly affected Fund performance? |
| A | | As both the Fund and the S&P Technology Index have the majority of their respective assets allocated to the information technology sector, broad equity market sector performance generally does not have a meaningful impact on relative performance. That said, detracting most from the Fund’s relative results was weak stock selection in information technology and having exposure to the telecommunication services sector, which is not a component of the S&P Technology Index but which lagged the S&P Technology Index during the Reporting Period. Effective stock selection in the financials and consumer discretionary sectors buoyed the Fund’s relative results most. |
| Q | | Which stocks detracted significantly from the Fund’s performance during the Reporting Period? |
| A | | Detracting most from the Fund’s results relative to its benchmark index were positions in cloud-based digital commerce solutions provider Demandware, data software provider Splunk and cloud-based software-as-a-service (“SaaS”) provider ServiceNow. |
| | Demandware reported earnings results with revenues, margins and free cash flow higher than expectations, but guidance for contracts widened to account for large deal risk, macroeconomic concerns and exposure to consumers through its vertical. (The term “vertical” in business refers to a vertical market. Basically, a vertical market is one where businesses and marketers cater to the needs of a specific group of people within an industry. This concept is in contrast to a horizontal market, where the focus is diverted to a large amount of people regardless of industry.) These concerns led to the company’s stock price declining, but we believe the company is poised for an attractive risk/reward dynamic during the next year. In our view, Demandware’s underlying fundamentals remained solid at the end of the Reporting Period, and we believe the company remains a merger and acquisition target given its unique asset as a primary customer web-facing platform. |
53
PORTFOLIO RESULTS
| | Splunk was a top detractor from the Fund’s relative returns during the Reporting Period. Broader market and secular volatility, alongside competition concerns, which we think are near term, led to a stock price decline despite the company’s accelerating growth during the Reporting Period. We believe Splunk’s ability to monitor events in real time, provide forensics, and integrate with third party providers, gives it a significant competitive advantage. In our view, our overall investment thesis for Splunk remained intact at the end of the Reporting Period, as we believe the company is attractively valued relative to its peers and well positioned to benefit from growing demand for web analytics and cybersecurity. |
| | ServiceNow is a provider of cloud-based services to automate enterprise information technology operations. The company reported mixed fourth quarter 2015 results, with billings that missed market estimates. Its management guided on the low end for 2016, which we think was driven by a sales mix of lower margin products. Despite this, ServiceNow beat market expectations for top and bottom line results, driven by gross margin improvements and higher operating cash flows. At the end of the Reporting Period, we believed that ServiceNow remained a high quality growth business in the software industry and that the company may well generate shareholder value through its product pipeline and acquisition synergies. |
| Q | | What were some of the Fund’s best-performing individual stocks? |
| A | | The Fund benefited most relative to the S&P Technology Index from positions in data center real estate investment trust (“REIT”) Equinix, software company Intuit and leading information storage company EMC. |
| | Equinix was a strong contributor to the Fund’s performance during the Reporting Period. The company announced high quality results for the second and third quarters of 2015, as secular growth in enterprise spending helped drive organic revenue growth and bookings to record levels. Also, solid performance in all regions in which the REIT operates led Equinix to raise guidance across key metrics during the Reporting Period, which was well received by the markets. In our view, Equinix continued at the end of the Reporting Period to present a favorable outlook, as pricing has been net positive in the low churn rate, or turnover, environment. Going forward, we believe Equinix may further benefit from its steady recurring revenue business model, steady demand environment, and integration of recent acquisitions that could unlock significant synergies. |
| | Intuit is a software company that develops financial and tax preparation programs. The company held its “investor day,” or annual investor meeting, in September 2015, reporting growth in the underlying metrics of the business. Specifically, the high proportion of new QuickBooks online subscribers and their growth highlighted Intuit’s meaningful market expansion, with the potential for further monetization in the future. The company also reported fiscal first quarter results toward the end of 2015, with better than expected revenues and earnings and continued momentum in its underlying metrics. In our view, Intuit is a solid franchise, with improving and accelerating product offers and healthy trends in its core business and subscription growth. |
| | EMC was a top positive contributor to the Fund’s relative results during the Reporting Period. Toward the end of 2015, Dell announced plans to acquire EMC, and developments in the acquisition negatively affected its share price in the near term. Longer term, however, EMC’s management stated it is confident that growth and the overall storage market should be stronger moving forward, driving EMC’s stock to a positive total return for the Reporting Period overall. EMC is a market leader in storage and, in our view, has the opportunity to continue to take share in a relatively fragmented market. In addition, we believe the company is well positioned to take advantage of future technological changes, as what we consider to be its forward-looking management team has a history of embracing and driving change. |
| Q | | How did the Fund use derivatives and similar instruments during the Reporting Period? |
| A | | During the Reporting Period, we did not use derivatives as part of an active management strategy. |
| Q | | Did the Fund make any significant purchases or sales during the Reporting Period? |
| A | | We initiated a Fund position in MasterCard. We believe current macro trends are supportive of financial services and that MasterCard could be a key beneficiary. In particular, the company has deep exposure to emerging markets, where consumer card spending has seen recovery and is supported by promotional government efforts. In our view, MasterCard has a high quality management team and, given what we consider to be a favorable industry backdrop, a high quality business franchise. Given what we view as MasterCard’s |
54
PORTFOLIO RESULTS
| | attractive valuation, we sought to take advantage of what we view as a favorable risk/reward opportunity. |
| | We established a Fund position in Electronic Arts, a developer and distributor of video games on consoles, personal computers, mobile phones and tablets. We believe video game publishers are the new big media content companies without cord cutting threats. (Cord cutting refers to the practice of stopping a cable or satellite television service or getting rid of a landline phone in favor of less expensive options.) We are positive on Electronic Arts’ transition from a hit-driven, console-cycle dependent business to a more stable, recurring revenue business with increasing digitization in offerings. We see growth catalysts through the company’s strong gaming pipeline for its fiscal year 2017 and medium-term growth drivers from eSports and virtual reality. With what we view as sustainable margin expansion capability and capital structure opportunities to enhance shareholder returns, we are optimistic on Electronic Arts’ long-term performance. |
| | Conversely, we exited the Fund’s position in payment solutions provider Global Payments. Management of the company raised its 2016 earnings guidance after reporting impressive first fiscal quarter earnings results that beat consensus expectations. Following the strong performance, we believed its shares were fully valued and decided to allocate proceeds into other opportunities with what we considered more compelling risk/reward profiles. |
| | We sold the Fund’s position in Internet radio services provider Pandora Media. We believe Pandora Media has a capable management team that remains focused on driving growth. However, the company’s weak quarterly results during the Reporting Period made us cautious on its long-term prospects. As a result, we decided to eliminate the Fund’s position in the company to fund other ideas with more attractive risk/reward profiles, in our view. |
| Q | | Were there any notable changes in the Fund’s weightings during the Reporting Period? |
| A | | In constructing the Fund’s portfolio, we focus on picking stocks rather than on making industry or sector bets. We seek to outpace the benchmark index by overweighting stocks that we expect to outperform and underweighting those that we think may lag. Consequently, changes in its sector weights are generally the direct result of individual stock selection or of stock appreciation or depreciation. That said, during the Reporting Period, the Fund’s exposure to consumer discretionary and information technology increased relative to the S&P Technology Index. The Fund’s position in cash decreased during the Reporting Period. |
| Q | | How was the Fund positioned relative to its benchmark index at the end of the Reporting Period? |
| A | | At the end of the Reporting Period, the Fund’s was underweighted relative to the S&P Technology Index in the information technology sector and was rather neutrally weighted to the S&P Technology Index in the consumer discretionary sector, the only other component of the S&P Technology Index. On the same date, the Fund had exposure to the financials and telecommunication services sectors. |
55
FUND BASICS
Technology Opportunities Fund
as of February 29, 2016
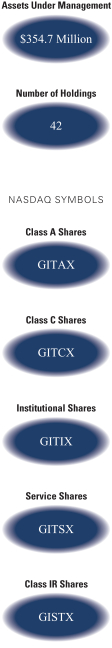
| | | | | | | | | | |
| | PERFORMANCE REVIEW | |
| | | September 1, 2015–February 29, 2016 | | Fund Total Return
(based on NAV)1 | | | S&P North American
Technology Sector
Index2 | |
| | Class A | | | -5.44 | % | | | 1.18 | % |
| | Class C | | | -5.78 | | | | 1.18 | |
| | Institutional | | | -5.23 | | | | 1.18 | |
| | Service | | | -5.52 | | | | 1.18 | |
| | | Class IR | | | -5.32 | | | | 1.18 | |
| | 1 | | The net asset value (“NAV”) represents the net assets of the class of the Fund (ex-dividend) divided by the total number of shares of the class outstanding. The Fund’s performance reflects the reinvestment of dividends and other distributions. The Fund’s performance does not reflect the deduction of any applicable sales charges. |
| | 2 | | The S&P North American Technology Sector Index provides investors with a benchmark that represents U.S. securities classified under the Global Industry Classification Standard (“GICS”)® technology sector and Internet retail sub-industry. |
| | | | | | | | | | | | | | | | | | | | |
| | STANDARDIZED TOTAL RETURNS3 |
| | | For the period ended 12/31/15 | | One Year | | | Five Years | | | Ten Years | | | Since Inception | | | Inception Date |
| | Class A | | | 1.72 | % | | | 8.51 | % | | | 9.49 | % | | | 4.41 | % | | 10/1/99 |
| | Class C | | | 5.79 | | | | 8.92 | | | | 9.29 | | | | 3.98 | | | 10/1/99 |
| | Institutional | | | 8.12 | | | | 10.19 | | | | 10.55 | | | | 5.20 | | | 10/1/99 |
| | Service | | | 7.54 | | | | 9.64 | | | | 10.01 | | | | 4.69 | | | 10/1/99 |
| | | Class IR | | | 7.91 | | | | 10.00 | | | | N/A | | | | 11.95 | | | 9/30/10 |
| | 3 | | The Standardized Total Returns are average annual total returns as of the most recent calendar quarter-end. They assume reinvestment of all distributions at NAV. These returns reflect a maximum initial sales charge of 5.5% for Class A Shares and the assumed contingent deferred sales charge for Class C Shares (1% if redeemed within 12 months of purchase). Because Institutional, Service and Class IR Shares do not involve a sales charge, such a charge is not applied to their Standardized Total Returns. |
The returns set forth in the tables above represent past performance. Past performance does not guarantee future results. The Fund’s investment return and principal value will fluctuate so that an investor’s shares, when redeemed, may be worth more or less than their original cost. Current performance may be lower or higher than the performance quoted above. Please visit our web site at www.GSAMFUNDS.com to obtain the most recent month-end returns. Performance reflects applicable fee waivers and/or expense limitations in effect during the periods shown. In their absence, performance would be reduced. Returns do not reflect the deduction of taxes that a shareholder would pay on Fund distributions or the redemption of Fund shares.
56
FUND BASICS
| | | | | | | | | | |
| | EXPENSE RATIOS4 | |
| | | | | Net Expense Ratio (Current) | | | Gross Expense Ratio (Before Waivers) | |
| | Class A | | | 1.47 | % | | | 1.54 | % |
| | Class C | | | 2.22 | | | | 2.29 | |
| | Institutional | | | 1.07 | | | | 1.14 | |
| | Service | | | 1.57 | | | | 1.64 | |
| | | Class IR | | | 1.22 | | | | 1.29 | |
| | 4 | | The expense ratios of the Fund, both current (net of applicable fee waivers and/or expense limitations) and before waivers (gross of applicable fee waivers and/or expense limitations) are as set forth above according to the most recent publicly available Prospectus for the Fund and may differ from the expense ratios disclosed in the Financial Highlights in this report. Pursuant to a contractual arrangement, the Fund’s waivers and/or expense limitations will remain in place through at least December 29, 2016, and prior to such date the investment adviser may not terminate the arrangements without the approval of the Fund’s Board of Trustees. If these arrangements are discontinued in the future, the expense ratios may change without shareholder approval. |
| | | | | | | | |
| | TOP TEN HOLDINGS AS OF 2/29/165 |
| | | Holding | | % of
Net Assets | | | Line of Business |
| | Apple, Inc. | | | 7.6 | % | | Computers & Peripherals |
| | Facebook, Inc. Class A | | | 5.5 | | | Internet Software & Services |
| | Amazon.com, Inc. | | | 4.7 | | | Internet & Catalog Retail |
| | Alphabet, Inc. Class A | | | 4.5 | | | Internet Software & Services |
| | Alphabet, Inc. Class C | | | 4.1 | | | Internet Software & Services |
| | NXP Semiconductors NV | | | 3.8 | | | Semiconductors & Semiconductor
Equipment |
| | ServiceNow, Inc. | | | 3.6 | | | Software |
| | Amphenol Corp. Class A | | | 3.3 | | | Electronic Equipment,
Instruments & Components |
| | Salesforce.com, Inc. | | | 3.3 | | | Software |
| | | American Tower Corp. | | | 3.2 | | | Real Estate Investment Trusts |
| | 5 | | The top 10 holdings may not be representative of the Fund’s future investments. |
57
FUND BASICS
|
| FUND VS. BENCHMARK SECTOR ALLOCATION6 |
| As of February 29, 2016 |
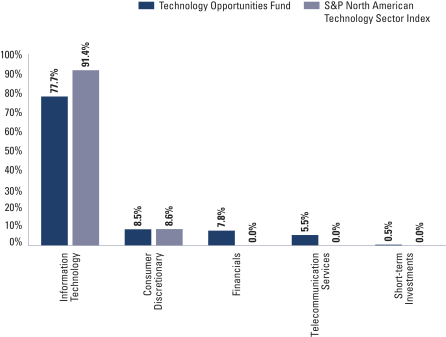
| | 6 | | The Fund is actively managed and, as such, its composition may differ over time. Consequently, the Fund’s overall sector allocations may differ from the percentages contained in the graph above. The graph categorizes investments using the GICS, however, the sector classifications used by the portfolio management team may differ from GICS. The percentage shown for each investment category reflects the value of investments in that category as a percentage of market value. Short-term investments represent repurchase agreements. The graph depicts the Fund’s investments but may not represent the Fund’s market exposure due to the exclusion of certain derivatives, if any, as listed in the Additional Investment Information section of the Schedule of Investments. |
58
GOLDMAN SACHS CAPITAL GROWTH FUND
Schedule of Investments
February 29, 2016 (Unaudited)
| | | | | | | | |
Shares | | | Description | | Value | |
| | | | | | | | |
| | Common Stocks – 99.1% | |
| | | | | | | | |
| | Aerospace & Defense – 3.8% | |
| | 162,947 | | | Honeywell International, Inc. | | $ | 16,514,678 | |
| | 97,356 | | | The Boeing Co. | | | 11,505,532 | |
| | 26,754 | | | United Technologies Corp. | | | 2,584,972 | |
| | | | | | | | |
| | | | | | | 30,605,182 | |
| | |
| | Airlines* – 0.6% | |
| | 85,392 | | | United Continental Holdings, Inc. | | | 4,889,546 | |
| | |
| | Auto Components – 0.9% | |
| | 232,228 | | | BorgWarner, Inc. | | | 7,589,211 | |
| | |
| | Beverages – 3.4% | |
| | 23,905 | | | Brown-Forman Corp. Class B | | | 2,353,925 | |
| | 52,377 | | | Molson Coors Brewing Co. Class B | | | 4,466,187 | |
| | 62,055 | | | PepsiCo., Inc. | | | 6,070,220 | |
| | 349,971 | | | The Coca-Cola Co. | | | 15,094,249 | |
| | | | | | | | |
| | | | | | | 27,984,581 | |
| | |
| | Biotechnology – 5.5% | |
| | 31,506 | | | Alexion Pharmaceuticals, Inc.* | | | 4,436,045 | |
| | 40,965 | | | Alkermes PLC* | | | 1,321,941 | |
| | 41,348 | | | Biogen, Inc.* | | | 10,726,498 | |
| | 14,851 | | | BioMarin Pharmaceutical, Inc.* | | | 1,215,851 | |
| | 43,443 | | | Celgene Corp.* | | | 4,380,358 | |
| | 94,822 | | | Cepheid, Inc.* | | | 2,814,317 | |
| | 131,218 | | | Gilead Sciences, Inc. | | | 11,448,770 | |
| | 11,226 | | | Ultragenyx Pharmaceutical, Inc.* | | | 684,674 | |
| | 86,505 | | | Vertex Pharmaceuticals, Inc.* | | | 7,395,312 | |
| | | | | | | | |
| | | | | | | 44,423,766 | |
| | |
| | Building Products – 1.6% | |
| | 257,422 | | | Fortune Brands Home & Security, Inc. | | | 12,927,733 | |
| | |
| | Capital Markets* – 0.8% | |
| | 47,092 | | | Affiliated Managers Group, Inc. | | | 6,531,190 | |
| | |
| | Chemicals – 3.4% | |
| | 68,381 | | | Ashland, Inc. | | | 6,516,025 | |
| | 366,321 | | | Axalta Coating Systems Ltd.* | | | 9,509,693 | |
| | 98,163 | | | RPM International, Inc. | | | 4,009,959 | |
| | 28,081 | | | The Sherwin-Williams Co. | | | 7,595,911 | |
| | | | | | | | |
| | | | | | | 27,631,588 | |
| | |
| | Commercial Banks – 0.8% | |
| | 101,637 | | | First Republic Bank | | | 6,254,741 | |
| | |
| | Computers & Peripherals – 6.8% | |
| | 505,562 | | | Apple, Inc. | | | 48,882,790 | |
| | 243,304 | | | EMC Corp. | | | 6,357,533 | |
| | | | | | | | |
| | | | | | | 55,240,323 | |
| | |
| | Consumer Finance – 0.7% | |
| | 28,099 | | | American Express Co. | | | 1,561,742 | |
| | 676,232 | | | SLM Corp.* | | | 3,949,195 | |
| | | | | | | | |
| | | | | | | 5,510,937 | |
| | |
| | Containers & Packaging – 0.5% | |
| | 57,565 | | | Avery Dennison Corp. | | | 3,748,633 | |
| | |
| | Distributors* – 0.4% | |
| | 125,887 | | | LKQ Corp. | | | 3,474,481 | |
| | |
| | | | | | | | |
| Common Stocks – (continued) | |
| | Diversified Financial Services – 1.0% | |
| | 32,647 | | | Intercontinental Exchange, Inc. | | $ | 7,785,004 | |
| | |
| | Electrical Equipment* – 0.5% | |
| | 131,177 | | | Sensata Technologies Holding NV | | | 4,474,447 | |
| | |
| | Electronic Equipment, Instruments & Components – 0.6% | |
| | 91,413 | | | Amphenol Corp. Class A | | | 4,851,288 | |
| | |
| | Energy Equipment & Services – 0.1% | |
| | 25,257 | | | Baker Hughes, Inc. | | | 1,082,768 | |
| | |
| | Food & Staples Retailing – 3.7% | |
| | 83,621 | | | Costco Wholesale Corp. | | | 12,545,659 | |
| | 162,146 | | | Walgreens Boots Alliance, Inc. | | | 12,799,805 | |
| | 152,454 | | | Whole Foods Market, Inc. | | | 4,773,335 | |
| | | | | | | | |
| | | | | | | 30,118,799 | |
| | |
| | Food Products – 1.0% | |
| | 89,619 | | | McCormick & Co., Inc. | | | 8,357,868 | |
| | |
| | Health Care Equipment & Supplies – 1.6% | |
| | 147,597 | | | Abbott Laboratories | | | 5,717,907 | |
| | 7,114 | | | Intuitive Surgical, Inc.* | | | 4,005,609 | |
| | 35,660 | | | Stryker Corp. | | | 3,561,721 | |
| | | | | | | | |
| | | | | | | 13,285,237 | |
| | |
| | Health Care Providers & Services – 2.6% | |
| | 55,224 | | | Aetna, Inc. | | | 5,998,983 | |
| | 42,528 | | | Cardinal Health, Inc. | | | 3,474,538 | |
| | 19,210 | | | Henry Schein, Inc.* | | | 3,178,294 | |
| | 53,079 | | | McKesson Corp. | | | 8,260,154 | |
| | | | | | | | |
| | | | | | | 20,911,969 | |
| | |
| | Health Care Technology* – 0.6% | |
| | 100,654 | | | Cerner Corp. | | | 5,139,393 | |
| | |
| | Hotels, Restaurants & Leisure – 4.9% | |
| | 6,961 | | | Chipotle Mexican Grill, Inc.* | | | 3,544,263 | |
| | 175,117 | | | Hilton Worldwide Holdings, Inc. | | | 3,638,931 | |
| | 105,259 | | | McDonald’s Corp. | | | 12,335,302 | |
| | 16,295 | | | Panera Bread Co. Class A* | | | 3,376,324 | |
| | 183,304 | | | Starbucks Corp. | | | 10,670,126 | |
| | 89,152 | | | Yum! Brands, Inc. | | | 6,460,846 | |
| | | | | | | | |
| | | | | | | 40,025,792 | |
| | |
| | Household Durables* – 0.3% | |
| | 41,775 | | | Jarden Corp. | | | 2,209,062 | |
| | |
| | Industrial Conglomerates – 0.6% | |
| | 52,494 | | | Danaher Corp. | | | 4,686,139 | |
| | |
| | Internet & Catalog Retail* – 4.7% | |
| | 37,655 | | | Amazon.com, Inc. | | | 20,805,141 | |
| | 95,059 | | | Netflix, Inc. | | | 8,879,461 | |
| | 6,487 | | | The Priceline Group, Inc. | | | 8,207,417 | |
| | | | | | | | |
| | | | | | | 37,892,019 | |
| | |
| | Internet Software & Services* – 8.0% | |
| | 24,576 | | | Alphabet, Inc. Class A | | | 17,626,399 | |
| | 25,181 | | | Alphabet, Inc. Class C | | | 17,570,546 | |
| | 90,291 | | | eBay, Inc. | | | 2,148,926 | |
| | 206,016 | | | Facebook, Inc. Class A | | | 22,027,231 | |
| | |
| | |
| The accompanying notes are an integral part of these financial statements. | | 59 |
GOLDMAN SACHS CAPITAL GROWTH FUND
Schedule of Investments (continued)
February 29, 2016 (Unaudited)
| | | | | | | | |
Shares | | | Description | | Value | |
| | | | | | | | |
| Common Stocks – (continued) | |
| | Internet Software & Services* – (continued) | |
| | 22,756 | | | LinkedIn Corp. Class A | | $ | 2,666,776 | |
| | 232,739 | | | OPOWER, Inc. | | | 1,924,751 | |
| | 28,949 | | | Twitter, Inc. | | | 524,556 | |
| | | | | | | | |
| | | | | | | 64,489,185 | |
| | |
| | IT Services – 5.2% | |
| | 11,045 | | | Alliance Data Systems Corp.* | | | 2,320,886 | |
| | 75,584 | | | Black Knight Financial Services, Inc. Class A* | | | 2,215,367 | |
| | 23,669 | | | Fidelity National Information Services, Inc. | | | 1,378,719 | |
| | 36,965 | | | Fiserv, Inc.* | | | 3,534,963 | |
| | 20,719 | | | FleetCor Technologies, Inc.* | | | 2,645,609 | |
| | 25,323 | | | Global Payments, Inc. | | | 1,543,437 | |
| | 258,546 | | | MasterCard, Inc. Class A | | | 22,472,818 | |
| | 104,262 | | | PayPal Holdings, Inc.* | | | 3,976,553 | |
| | 85,846 | | | Sabre Corp. | | | 2,330,719 | |
| | | | | | | | |
| | | | | | | 42,419,071 | |
| | |
| | Life Sciences Tools & Services – 0.7% | |
| | 87,321 | | | Agilent Technologies, Inc. | | | 3,261,439 | |
| | 15,845 | | | Illumina, Inc.* | | | 2,380,553 | |
| | | | | | | | |
| | | | | | | 5,641,992 | |
| | |
| | Machinery – 1.3% | |
| | 50,512 | | | The Middleby Corp.* | | | 4,677,411 | |
| | 146,391 | | | Xylem, Inc. | | | 5,476,488 | |
| | | | | | | | |
| | | | | | | 10,153,899 | |
| | |
| | Media – 4.2% | |
| | 260,647 | | | Comcast Corp. Class A | | | 15,047,151 | |
| | 195,115 | | | The Walt Disney Co. | | | 18,637,385 | |
| | | | | | | | |
| | | | | | | 33,684,536 | |
| | |
| | Oil, Gas & Consumable Fuels – 0.5% | |
| | 23,308 | | | Anadarko Petroleum Corp. | | | 884,538 | |
| | 19,849 | | | Concho Resources, Inc.* | | | 1,791,174 | |
| | 24,158 | | | Valero Energy Corp. | | | 1,451,413 | |
| | | | | | | | |
| | | | | | | 4,127,125 | |
| | |
| | Pharmaceuticals – 3.8% | |
| | 39,867 | | | Allergan PLC* | | | 11,565,816 | |
| | 151,865 | | | Eli Lilly & Co. | | | 10,934,280 | |
| | 14,638 | | | Shire PLC ADR | | | 2,285,138 | |
| | 141,535 | | | Zoetis, Inc. | | | 5,811,427 | |
| | | | | | | | |
| | | | | | | 30,596,661 | |
| | |
| | Real Estate Investment Trusts – 2.4% | |
| | 94,070 | | | American Tower Corp. | | | 8,673,254 | |
| | 36,289 | | | Equinix, Inc. | | | 11,020,606 | |
| | | | | | | | |
| | | | | | | 19,693,860 | |
| | |
| | Road & Rail – 1.5% | |
| | 148,667 | | | Kansas City Southern | | | 12,147,581 | |
| | |
| | Semiconductors & Semiconductor Equipment – 1.5% | |
| | 105,452 | | | Applied Materials, Inc. | | | 1,989,879 | |
| | 81,005 | | | NXP Semiconductors NV* | | | 5,770,796 | |
| | |
| | | | | | | | |
| Common Stocks – (continued) | |
| | Semiconductors & Semiconductor Equipment – (continued) | |
| | 58,870 | | | Qorvo, Inc.* | | $ | 2,653,860 | |
| | 40,289 | | | QUALCOMM, Inc. | | | 2,046,278 | |
| | | | | | | | |
| | | | | | | 12,460,813 | |
| | |
| | Software – 6.1% | |
| | 48,713 | | | Electronic Arts, Inc.* | | | 3,129,323 | |
| | 79,541 | | | Intuit, Inc. | | | 7,686,842 | |
| | 174,450 | | | Microsoft Corp. | | | 8,876,016 | |
| | 379,002 | | | Oracle Corp. | | | 13,939,694 | |
| | 79,323 | | | salesforce.com, Inc.* | | | 5,374,133 | |
| | 82,867 | | | ServiceNow, Inc.* | | | 4,556,856 | |
| | 117,699 | | | Splunk, Inc.* | | | 5,131,677 | |
| | 22,048 | | | Tableau Software, Inc. Class A* | | | 1,006,491 | |
| | | | | | | | |
| | | | | | | 49,701,032 | |
| | |
| | Specialty Retail – 6.8% | |
| | 14,157 | | | Advance Auto Parts, Inc. | | | 2,101,465 | |
| | 83,366 | | | L Brands, Inc. | | | 7,068,603 | |
| | 20,531 | | | O’Reilly Automotive, Inc.* | | | 5,344,630 | |
| | 120,545 | | | Ross Stores, Inc. | | | 6,627,564 | |
| | 153,876 | | | The Home Depot, Inc. | | | 19,099,089 | |
| | 73,352 | | | Tractor Supply Co. | | | 6,203,379 | |
| | 50,773 | | | Ulta Salon, Cosmetics & Fragrance, Inc.* | | | 8,387,192 | |
| | | | | | | | |
| | | | | | | 54,831,922 | |
| | |
| | Textiles, Apparel & Luxury Goods – 3.2% | |
| | 382,008 | | | Kate Spade & Co.* | | | 7,571,399 | |
| | 184,972 | | | NIKE, Inc. Class B | | | 11,392,425 | |
| | 30,519 | | | PVH Corp. | | | 2,415,579 | |
| | 67,229 | | | VF Corp. | | | 4,377,280 | |
| | | | | | | | |
| | | | | | | 25,756,683 | |
| | |
| | Tobacco – 2.5% | |
| | 93,618 | | | Altria Group, Inc. | | | 5,764,060 | |
| | 82,208 | | | Philip Morris International, Inc. | | | 7,483,394 | |
| | 139,143 | | | Reynolds American, Inc. | | | 7,016,982 | |
| | | | | | | | |
| | | | | | | 20,264,436 | |
| | |
| | TOTAL COMMON STOCKS | | | | |
| | (Cost $655,139,341) | | $ | 803,600,493 | |
| | |
| | |
| 60 | | The accompanying notes are an integral part of these financial statements. |
GOLDMAN SACHS CAPITAL GROWTH FUND
| | | | | | | | | | | | | | |
Principal
Amount | | | Interest
Rate | | | Maturity
Date | | | Value | |
| | | | | | | | | | | | | | |
| | Short-term Investment(a) – 1.1% | |
| | Repurchase Agreements – 1.1% | | | | | |
| Joint Repurchase Agreement Account II | | | | | |
| $ | 8,800,000 | | | | 0.312 | % | | | 03/01/16 | | | $ | 8,800,000 | |
| | (Cost $8,800,000) | | | | | | | | | |
| | |
| | TOTAL INVESTMENTS – 100.2% | | | | | |
| | (Cost $663,939,341) | | | | | | | $ | 812,400,493 | |
| | |
| LIABILITIES IN EXCESS OF
OTHER ASSETS – (0.2)% |
| | | (1,699,870 | ) |
| | |
| | NET ASSETS – 100.0% | | | $ | 810,700,623 | |
| | |
| | |
| The percentage shown for each investment category reflects the value of investments in that category as a percentage of net assets. |
* | | Non-income producing security. |
(a) | | Joint repurchase agreement was entered into on February 29, 2016. Additional information appears on page 78. |
| | |
|
Investment Abbreviations: |
ADR | | —American Depositary Receipt |
PLC | | —Public Limited Company |
|
| | |
| The accompanying notes are an integral part of these financial statements. | | 61 |
GOLDMAN SACHS CONCENTRATED GROWTH FUND
Schedule of Investments
February 29, 2016 (Unaudited)
| | | | | | | | |
Shares | | | Description | | Value | |
| | Common Stocks – 97.7% | |
| | Aerospace & Defense – 2.8% | |
| | 40,703 | | | Honeywell International, Inc. | | $ | 4,125,249 | |
| | |
| | Auto Components – 1.6% | |
| | 74,256 | | | BorgWarner, Inc. | | | 2,426,686 | |
| | |
| | Beverages – 1.5% | |
| | 22,774 | | | Brown-Forman Corp. Class B | | | 2,242,556 | |
| | |
| | Biotechnology* – 3.4% | |
| | 9,504 | | | Biogen, Inc. | | | 2,465,528 | |
| | 29,036 | | | Vertex Pharmaceuticals, Inc. | | | 2,482,287 | |
| | | | | | | | |
| | | | | | | 4,947,815 | |
| | |
| | Building Products – 1.0% | |
| | 29,160 | | | Fortune Brands Home & Security, Inc. | | | 1,464,415 | |
| | |
| | Chemicals – 1.5% | |
| | 8,137 | | | The Sherwin-Williams Co. | | | 2,201,058 | |
| | |
| | Computers & Peripherals – 7.5% | |
| | 114,524 | | | Apple, Inc. | | | 11,073,326 | |
| | |
| | Consumer Finance* – 1.4% | |
| | 356,005 | | | SLM Corp. | | | 2,079,069 | |
| | |
| | Diversified Financial Services – 1.9% | |
| | 11,556 | | | Intercontinental Exchange, Inc. | | | 2,755,644 | |
| | |
| | Food & Staples Retailing – 8.4% | |
| | 38,293 | | | Costco Wholesale Corp. | | | 5,745,099 | |
| | 50,404 | | | Walgreens Boots Alliance, Inc. | | | 3,978,892 | |
| | 82,371 | | | Whole Foods Market, Inc. | | | 2,579,036 | |
| | | | | | | | |
| | | | | | | 12,303,027 | |
| | |
| | Food Products – 1.9% | |
| | 30,625 | | | McCormick & Co., Inc. | | | 2,856,087 | |
| | |
| | Health Care Equipment & Supplies – 4.2% | |
| | 74,117 | | | Abbott Laboratories | | | 2,871,292 | |
| | 33,418 | | | Stryker Corp. | | | 3,337,790 | |
| | | | | | | | |
| | | | | | | 6,209,082 | |
| | |
| | Health Care Providers & Services – 2.0% | |
| | 18,838 | | | McKesson Corp. | | | 2,931,570 | |
| | |
| | Health Care Technology* – 1.8% | |
| | 51,423 | | | Cerner Corp. | | | 2,625,658 | |
| | |
| | Hotels, Restaurants & Leisure – 6.8% | |
| | 23,899 | | | McDonald’s Corp. | | | 2,800,724 | |
| | 78,576 | | | Starbucks Corp. | | | 4,573,909 | |
| | 35,408 | | | Yum! Brands, Inc. | | | 2,566,018 | |
| | | | | | | | |
| | | | | | | 9,940,651 | |
| | |
| | Industrial Conglomerates – 2.1% | |
| | 34,529 | | | Danaher Corp. | | | 3,082,404 | |
| | |
| | Internet & Catalog Retail* – 5.8% | |
| | 8,779 | | | Amazon.com, Inc. | | | 4,850,573 | |
| | 2,855 | | | The Priceline Group, Inc. | | | 3,612,175 | |
| | | | | | | | |
| | | | | | | 8,462,748 | |
| | |
| | Internet Software & Services* – 10.9% | |
| | 8,455 | | | Alphabet, Inc. Class A | | | 6,064,095 | |
| | |
| | Common Stocks – (continued) | |
| | Internet Software & Services* – (continued) | |
| | 3,981 | | | Alphabet, Inc. Class C | | $ | 2,777,823 | |
| | 67,360 | | | Facebook, Inc. Class A | | | 7,202,131 | |
| | | | | | | | |
| | | | | | | 16,044,049 | |
| | |
| | IT Services – 3.0% | |
| | 50,049 | | | MasterCard, Inc. Class A | | | 4,350,259 | |
| | |
| | Pharmaceuticals* – 2.9% | |
| | 14,503 | | | Allergan PLC | | | 4,207,465 | |
| | |
| | Real Estate Investment Trusts – 6.6% | |
| | 57,686 | | | American Tower Corp. | | | 5,318,649 | |
| | 14,410 | | | Equinix, Inc. | | | 4,376,173 | |
| | | | | | | | |
| | | | | | | 9,694,822 | |
| | |
| | Road & Rail – 1.9% | |
| | 34,035 | | | Kansas City Southern | | | 2,781,000 | |
| | |
| | Semiconductors & Semiconductor Equipment* – 1.8% | |
| | 37,691 | | | NXP Semiconductors NV | | | 2,685,107 | |
| | |
| | Software – 5.8% | |
| | 33,433 | | | Electronic Arts, Inc.* | | | 2,147,736 | |
| | 92,338 | | | Oracle Corp. | | | 3,396,192 | |
| | 20,674 | | | salesforce.com, Inc.* | | | 1,400,663 | |
| | 30,193 | | | ServiceNow, Inc.* | | | 1,660,313 | |
| | | | | | | | |
| | | | | | | 8,604,904 | |
| | |
| | Specialty Retail – 2.9% | |
| | 33,171 | | | L Brands, Inc. | | | 2,812,569 | |
| | 25,997 | | | Ross Stores, Inc. | | | 1,429,315 | |
| | | | | | | | |
| | | | | | | 4,241,884 | |
| | |
| | Textiles, Apparel & Luxury Goods – 6.3% | |
| | 134,735 | | | Kate Spade & Co.* | | | 2,670,448 | |
| | 63,534 | | | NIKE, Inc. Class B | | | 3,913,059 | |
| | 33,495 | | | PVH Corp. | | | 2,651,129 | |
| | | | | | | | |
| | | | | | | 9,234,636 | |
| | |
| | TOTAL COMMON STOCKS | | | | |
| | (Cost $122,539,059) | | $ | 143,571,171 | |
| | |
| | |
| 62 | | The accompanying notes are an integral part of these financial statements. |
GOLDMAN SACHS CONCENTRATED GROWTH FUND
| | | | | | | | | | | | | | |
Principal
Amount | | | Interest
Rate | | | Maturity
Date | | | Value | |
| | Short-term Investment(a) – 3.2% | |
| | Repurchase Agreements – 3.2% | | | | | |
| Joint Repurchase Agreement Account II | | | | | |
| $ | 4,700,000 | | | | 0.312 | % | | | 03/01/16 | | | $ | 4,700,000 | |
| | (Cost $4,700,000) | | | | | | | | | |
| | |
| | TOTAL INVESTMENTS – 100.9% | |
| | (Cost $127,239,059) | | | $ | 148,271,171 | |
| | |
| LIABILITIES IN EXCESS OF
OTHER ASSETS – (0.9)% |
| | | (1,296,823 | ) |
| | |
| | NET ASSETS – 100.0% | | | $ | 146,974,348 | |
| | |
| | |
| The percentage shown for each investment category reflects the value of investments in that category as a percentage of net assets. |
* | | Non-income producing security. |
(a) | | Joint repurchase agreement was entered into on February 29, 2016. Additional information appears on page 78. |
| | |
| The accompanying notes are an integral part of these financial statements. | | 63 |
GOLDMAN SACHS DYNAMIC U.S. EQUITY FUND
Schedule of Investments
February 29, 2016 (Unaudited)
| | | | | | | | |
Shares | | | Description | | Value | |
| | | | | | | | |
| Common Stocks – 96.7% | |
| | Airlines* – 1.7% | |
| | 3,324 | | | United Continental Holdings, Inc. | | $ | 190,332 | |
| | |
| | Biotechnology* – 1.9% | |
| | 424 | | | Biogen, Inc. | | | 109,994 | |
| | 1,144 | | | Vertex Pharmaceuticals, Inc. | | | 97,801 | |
| | | | | | | | |
| | | | | | | 207,795 | |
| | |
| | Capital Markets – 1.0% | |
| | 4,566 | | | Morgan Stanley | | | 112,780 | |
| | |
| | Chemicals – 1.8% | |
| | 3,337 | | | E.I. du Pont de Nemours & Co. | | | 203,123 | |
| | |
| | Commercial Banks – 8.5% | |
| | 33,877 | | | Bank of America Corp. | | | 424,140 | |
| | 9,228 | | | JPMorgan Chase & Co. | | | 519,537 | |
| | | | | | | | |
| | | | | | | 943,677 | |
| | |
| | Computers & Peripherals – 7.0% | |
| | 3,876 | | | Apple, Inc. | | | 374,770 | |
| | 15,151 | | | EMC Corp. | | | 395,896 | |
| | | | | | | | |
| | | | | | | 770,666 | |
| | |
| | Diversified Financial Services – 2.1% | |
| | 985 | | | Intercontinental Exchange, Inc. | | | 234,883 | |
| | |
| | Electric Utilities – 1.5% | |
| | 5,069 | | | FirstEnergy Corp. | | | 169,659 | |
| | |
| | Food & Staples Retailing – 7.9% | |
| | 1,682 | | | Costco Wholesale Corp. | | | 252,350 | |
| | 3,085 | | | Walgreens Boots Alliance, Inc. | | | 243,530 | |
| | 12,077 | | | Whole Foods Market, Inc. | | | 378,131 | |
| | | | | | | | |
| | | | | | | 874,011 | |
| | |
| | Health Care Equipment & Supplies – 2.7% | |
| | 7,713 | | | Abbott Laboratories | | | 298,802 | |
| | |
| | Hotels, Restaurants & Leisure – 2.3% | |
| | 4,416 | | | Starbucks Corp. | | | 257,055 | |
| | |
| | Household Products – 2.4% | |
| | 3,360 | | | The Procter & Gamble Co. | | | 269,774 | |
| | |
| | Industrial Conglomerates – 2.7% | |
| | 10,388 | | | General Electric Co. | | | 302,706 | |
| | |
| | Insurance – 5.8% | |
| | 4,195 | | | MetLife, Inc. | | | 165,954 | |
| | 4,492 | | | Prudential Financial, Inc. | | | 296,876 | |
| | 4,223 | | | The Hartford Financial Services Group, Inc. | | | 177,873 | |
| | | | | | | | |
| | | | | | | 640,703 | |
| | |
| | Internet & Catalog Retail* – 5.2% | |
| | 692 | | | Amazon.com, Inc. | | | 382,344 | |
| | 154 | | | The Priceline Group, Inc. | | | 194,842 | |
| | | | | | | | |
| | | | | | | 577,186 | |
| | |
| | Internet Software & Services* – 7.2% | |
| | 381 | | | Alphabet, Inc. Class A | | | 273,261 | |
| | 267 | | | Alphabet, Inc. Class C | | | 186,305 | |
| | |
| | Internet Software & Services* – (continued) | |
| | 3,198 | | | Facebook, Inc. Class A | | $ | 341,930 | |
| | | | | | | | |
| | | | | | | 801,496 | |
| | |
| | IT Services – 3.0% | |
| | 3,821 | | | MasterCard, Inc. Class A | | | 332,121 | |
| | |
| | Media – 1.5% | |
| | 4,464 | | | Viacom, Inc. Class B | | | 164,498 | |
| | |
| | Oil, Gas & Consumable Fuels – 7.1% | |
| | 4,336 | | | Apache Corp. | | | 165,982 | |
| | 6,669 | | | ConocoPhillips | | | 225,612 | |
| | 3,132 | | | Exxon Mobil Corp. | | | 251,030 | |
| | 24,144 | | | Southwestern Energy Co.* | | | 139,553 | |
| | | | | | | | |
| | | | | | | 782,177 | |
| | |
| | Pharmaceuticals – 9.0% | |
| | 1,155 | | | Allergan PLC* | | | 335,077 | |
| | 6,140 | | | Mylan NV* | | | 276,730 | |
| | 12,815 | | | Pfizer, Inc. | | | 380,221 | |
| | | | | | | | |
| | | | | | | 992,028 | |
| | |
| | Real Estate Investment Trusts – 3.8% | |
| | 2,612 | | | American Tower Corp. | | | 240,826 | |
| | 604 | | | Equinix, Inc. | | | 183,429 | |
| | | | | | | | |
| | | | | | | 424,255 | |
| | |
| | Road & Rail – 2.7% | |
| | 3,627 | | | Kansas City Southern | | | 296,362 | |
| | |
| | Semiconductors & Semiconductor Equipment – 2.2% | |
| | 4,772 | | | QUALCOMM, Inc. | | | 242,370 | |
| | |
| | Specialty Retail – 1.7% | |
| | 6,953 | | | The Gap, Inc. | | | 192,251 | |
| | |
| | Textiles, Apparel & Luxury Goods – 4.0% | |
| | 4,764 | | | NIKE, Inc. Class B | | | 293,415 | |
| | 1,905 | | | PVH Corp. | | | 150,781 | |
| | | | | | | | |
| | | | | | | 444,196 | |
| | |
| | TOTAL COMMON STOCKS | | | | |
| | (Cost $10,132,221) | | $ | 10,724,906 | |
| | |
| | |
| 64 | | The accompanying notes are an integral part of these financial statements. |
GOLDMAN SACHS DYNAMIC U.S. EQUITY FUND
| | | | | | | | | | | | | | |
Principal
Amount | | | Interest
Rate | | | Maturity
Date | | | Value | |
| | | | | | | | | | | | | | |
| | Short-term Investment(a) – 0.9% | |
| | Repurchase Agreements – 0.9% | | | | | |
| Joint Repurchase Agreement Account II | | | | | |
| $ | 100,000 | | | | 0.312 | % | | | 03/01/16 | | | $ | 100,000 | |
| | (Cost $100,000) | | | | | | | | | |
| | |
| | TOTAL INVESTMENTS – 97.6% | | | | | |
| | (Cost $10,232,221) | | | $ | 10,824,906 | |
| | |
| OTHER ASSETS IN EXCESS OF
LIABILITIES – 2.4% |
| | | 264,212 | |
| | |
| | NET ASSETS – 100.0% | | | $ | 11,089,118 | |
| | |
| | |
| The percentage shown for each investment category reflects the value of investments in that category as a percentage of net assets. |
* | | Non-income producing security. |
(a) | | Joint repurchase agreement was entered into on February 29, 2016. Additional information appears on page 78. |
| | |
| The accompanying notes are an integral part of these financial statements. | | 65 |
GOLDMAN SACHS FLEXIBLE CAP GROWTH FUND
Schedule of Investments
February 29, 2016 (Unaudited)
| | | | | | | | |
Shares | | | Description | | Value | |
| | | | | | | | |
| Common Stocks – 98.5% | |
| | Aerospace & Defense – 2.6% | |
| | 2,633 | | | Honeywell International, Inc. | | $ | 266,854 | |
| | 1,366 | | | The Boeing Co. | | | 161,434 | |
| | | | | | | | |
| | | | | | | 428,288 | |
| | |
| | Auto Components – 0.4% | |
| | 2,152 | | | BorgWarner, Inc. | | | 70,327 | |
| | |
| | Beverages – 2.2% | |
| | 804 | | | Brown-Forman Corp. Class B | | | 79,170 | |
| | 6,358 | | | The Coca-Cola Co. | | | 274,220 | |
| | | | | | | | |
| | | | | | | 353,390 | |
| | |
| | Biotechnology – 5.7% | |
| | 1,453 | | | AbbVie, Inc. | | | 79,348 | |
| | 758 | | | Alexion Pharmaceuticals, Inc.* | | | 106,726 | |
| | 1,520 | | | Alkermes PLC* | | | 49,050 | |
| | 640 | | | Biogen, Inc.* | | | 166,029 | |
| | 1,426 | | | Celgene Corp.* | | | 143,784 | |
| | 2,827 | | | Cepheid, Inc.* | | | 83,905 | |
| | 1,650 | | | Gilead Sciences, Inc. | | | 143,963 | |
| | 1,163 | | | Medivation, Inc.* | | | 41,601 | |
| | 1,247 | | | Vertex Pharmaceuticals, Inc.* | | | 106,606 | |
| | | | | | | | |
| | | | | | | 921,012 | |
| | |
| | Building Products – 0.8% | |
| | 2,734 | | | Fortune Brands Home & Security, Inc. | | | 137,301 | |
| | |
| | Capital Markets* – 0.4% | |
| | 498 | | | Affiliated Managers Group, Inc. | | | 69,068 | |
| | |
| | Chemicals – 1.7% | |
| | 839 | | | Ashland, Inc. | | | 79,948 | |
| | 5,282 | | | Axalta Coating Systems Ltd.* | | | 137,121 | |
| | 1,421 | | | RPM International, Inc. | | | 58,048 | |
| | | | | | | | |
| | | | | | | 275,117 | |
| | |
| | Commercial Banks – 1.3% | |
| | 2,694 | | | Eagle Bancorp, Inc.* | | | 123,493 | |
| | 1,353 | | | First Republic Bank | | | 83,264 | |
| | | | | | | | |
| | | | | | | 206,757 | |
| | |
| | Commercial Services & Supplies – 0.9% | |
| | 4,236 | | | Healthcare Services Group, Inc. | | | 150,293 | |
| | |
| | Computers & Peripherals – 7.0% | |
| | 10,664 | | | Apple, Inc. | | | 1,031,102 | |
| | 3,930 | | | EMC Corp. | | | 102,691 | |
| | | | | | | | |
| | | | | | | 1,133,793 | |
| | |
| | Consumer Finance* – 0.7% | |
| | 18,645 | | | SLM Corp. | | | 108,887 | |
| | |
| | Distributors* – 0.5% | |
| | 3,125 | | | LKQ Corp. | | | 86,250 | |
| | |
| | Diversified Financial Services – 1.5% | |
| | 1,003 | | | Intercontinental Exchange, Inc. | | | 239,175 | |
| | |
| | Diversified Telecommunication Services* – 1.8% | |
| | 2,608 | | | Level 3 Communications, Inc. | | | 126,618 | |
| | |
| | | | | | | | |
| Common Stocks – (continued) | |
| | Diversified Telecommunication Services* – (continued) | |
| | 1,755 | | | SBA Communications Corp. Class A | | $ | 166,532 | |
| | | | | | | | |
| | | | | | | 293,150 | |
| | |
| | Electrical Equipment – 1.4% | |
| | 692 | | | Hubbell, Inc. | | | 68,757 | |
| | 4,533 | | | Sensata Technologies Holding NV* | | | 154,621 | |
| | | | | | | | |
| | | | | | | 223,378 | |
| | |
| | Electronic Equipment, Instruments & Components – 1.1% | |
| | 3,466 | | | Amphenol Corp. Class A | | | 183,941 | |
| | |
| | Energy Equipment & Services – 1.1% | |
| | 943 | | | Dril-Quip, Inc.* | | | 51,158 | |
| | 3,898 | | | Halliburton Co. | | | 125,827 | |
| | | | | | | | |
| | | | | | | 176,985 | |
| | |
| | Food & Staples Retailing – 4.5% | |
| | 2,054 | | | Costco Wholesale Corp. | | | 308,162 | |
| | 3,353 | | | Walgreens Boots Alliance, Inc. | | | 264,686 | |
| | 4,991 | | | Whole Foods Market, Inc. | | | 156,268 | |
| | | | | | | | |
| | | | | | | 729,116 | |
| | |
| | Food Products – 2.7% | |
| | 3,007 | | | Blue Buffalo Pet Products, Inc.* | | | 55,028 | |
| | 6,358 | | | Freshpet, Inc.* | | | 42,281 | |
| | 1,530 | | | McCormick & Co., Inc. | | | 142,688 | |
| | 1,092 | | | The Hain Celestial Group, Inc.* | | | 40,371 | |
| | 1,885 | | | TreeHouse Foods, Inc.* | | | 159,132 | |
| | | | | | | | |
| | | | | | | 439,500 | |
| | |
| | Health Care Equipment & Supplies – 1.9% | |
| | 3,760 | | | Abbott Laboratories | | | 145,662 | |
| | 1,007 | | | DexCom, Inc.* | | | 65,516 | |
| | 689 | | | Teleflex, Inc. | | | 98,403 | |
| | | | | | | | |
| | | | | | | 309,581 | |
| | |
| | Health Care Providers & Services – 3.2% | |
| | 1,332 | | | Acadia Healthcare Co., Inc.* | | | 73,806 | |
| | 1,745 | | | Adeptus Health, Inc. Class A* | | | 99,326 | |
| | 868 | | | Aetna, Inc. | | | 94,291 | |
| | 818 | | | Henry Schein, Inc.* | | | 135,338 | |
| | 802 | | | McKesson Corp. | | | 124,807 | |
| | | | | | | | |
| | | | | | | 527,568 | |
| | |
| | Health Care Technology* – 0.7% | |
| | 1,409 | | | Cerner Corp. | | | 71,944 | |
| | 4,408 | | | Evolent Health, Inc. Class A | | | 44,300 | |
| | | | | | | | |
| | | | | | | 116,244 | |
| | |
| | Hotels, Restaurants & Leisure – 5.7% | |
| | 130 | | | Chipotle Mexican Grill, Inc.* | | | 66,191 | |
| | 1,497 | | | Panera Bread Co. Class A* | | | 310,178 | |
| | 4,716 | | | Starbucks Corp. | | | 274,518 | |
| | 2,584 | | | Yum! Brands, Inc. | | | 187,263 | |
| | 2,348 | | | Zoe’s Kitchen, Inc.* | | | 82,016 | |
| | | | | | | | |
| | | | | | | 920,166 | |
| | |
| | |
| 66 | | The accompanying notes are an integral part of these financial statements. |
GOLDMAN SACHS FLEXIBLE CAP GROWTH FUND
| | | | | | | | |
Shares | | | Description | | Value | |
| | | | | | | | |
| Common Stocks – (continued) | |
| | Household Durables* – 0.3% | |
| | 2,694 | | | M/I Homes, Inc. | | $ | 47,334 | |
| | |
| | Industrial Conglomerates – 0.8% | |
| | 1,521 | | | Danaher Corp. | | | 135,780 | |
| | |
| | Internet & Catalog Retail* – 4.3% | |
| | 775 | | | Amazon.com, Inc. | | | 428,203 | |
| | 972 | | | Netflix, Inc. | | | 90,794 | |
| | 142 | | | The Priceline Group, Inc. | | | 179,660 | |
| | | | | | | | |
| | | | | | | 698,657 | |
| | |
| | Internet Software & Services* – 9.5% | |
| | 625 | | | Alphabet, Inc. Class A | | | 448,262 | |
| | 559 | | | Alphabet, Inc. Class C | | | 390,053 | |
| | 4,701 | | | Facebook, Inc. Class A | | | 502,631 | |
| | 848 | | | LinkedIn Corp. Class A | | | 99,377 | |
| | 6,364 | | | Match Group, Inc. | | | 69,304 | |
| | 4,550 | | | OPOWER, Inc. | | | 37,629 | |
| | | | | | | | |
| | | | | | | 1,547,256 | |
| | |
| | IT Services – 6.5% | |
| | 5,536 | | | Black Knight Financial Services, Inc. Class A* | | | 162,260 | |
| | 1,054 | | | Fidelity National Information Services, Inc. | | | 61,395 | |
| | 752 | | | FleetCor Technologies, Inc.* | | | 96,023 | |
| | 2,468 | | | Global Payments, Inc. | | | 150,425 | |
| | 3,898 | | | MasterCard, Inc. Class A | | | 338,814 | |
| | 2,387 | | | PayPal Holdings, Inc.* | | | 91,040 | |
| | 5,804 | | | Sabre Corp. | | | 157,579 | |
| | | | | | | | |
| | | | | | | 1,057,536 | |
| | |
| | Life Sciences Tools & Services – 0.8% | |
| | 2,250 | | | Agilent Technologies, Inc. | | | 84,038 | |
| | 1,066 | | | PerkinElmer, Inc. | | | 50,379 | |
| | | | | | | | |
| | | | | | | 134,417 | |
| | |
| | Machinery – 2.3% | |
| | 1,481 | | | Graco, Inc. | | | 115,992 | |
| | 1,403 | | | The Middleby Corp.* | | | 129,918 | |
| | 3,312 | | | Xylem, Inc. | | | 123,902 | |
| | | | | | | | |
| | | | | | | 369,812 | |
| | |
| | Media – 1.2% | |
| | 3,306 | | | Comcast Corp. Class A | | | 190,855 | |
| | |
| | Oil, Gas & Consumable Fuels* – 0.4% | |
| | 762 | | | Concho Resources, Inc. | | | 68,763 | |
| | |
| | Pharmaceuticals – 2.0% | |
| | 588 | | | Allergan PLC* | | | 170,584 | |
| | 363 | | | Shire PLC ADR | | | 56,668 | |
| | 2,445 | | | Zoetis, Inc. | | | 100,392 | |
| | | | | | | | |
| | | | | | | 327,644 | |
| | |
| | Real Estate Investment Trusts – 2.9% | |
| | 2,624 | | | American Tower Corp. | | | 241,933 | |
| | 770 | | | Equinix, Inc. | | | 233,841 | |
| | | | | | | | |
| | | | | | | 475,774 | |
| | |
| | | | | | | | |
| Common Stocks – (continued) | |
| | Road & Rail – 0.8% | |
| | 1,548 | | | Kansas City Southern | | $ | 126,487 | |
| | |
| | Semiconductors & Semiconductor Equipment* – 0.7% | |
| | 2,484 | | | Qorvo, Inc. | | | 111,979 | |
| | |
| | Software – 4.2% | |
| | 1,254 | | | Intuit, Inc. | | | 121,186 | |
| | 6,619 | | | Oracle Corp. | | | 243,447 | |
| | 1,230 | | | Red Hat, Inc.* | | | 80,380 | |
| | 2,117 | | | ServiceNow, Inc.* | | | 116,414 | |
| | 1,673 | | | Splunk, Inc.* | | | 72,943 | |
| | 1,000 | | | Tableau Software, Inc. Class A* | | | 45,650 | |
| | | | | | | | |
| | | | | | | 680,020 | |
| | |
| | Specialty Retail – 7.0% | |
| | 910 | | | Advance Auto Parts, Inc. | | | 135,081 | |
| | 2,167 | | | Burlington Stores, Inc.* | | | 121,482 | |
| | 2,682 | | | Five Below, Inc.* | | | 102,855 | |
| | 1,333 | | | L Brands, Inc. | | | 113,025 | |
| | 1,160 | | | Restoration Hardware Holdings, Inc.* | | | 44,068 | |
| | 1,184 | | | Ross Stores, Inc. | | | 65,096 | |
| | 1,973 | | | The Home Depot, Inc. | | | 244,889 | |
| | 2,119 | | | Tractor Supply Co. | | | 179,204 | |
| | 781 | | | Ulta Salon, Cosmetics & Fragrance, Inc.* | | | 129,013 | |
| | | | | | | | |
| | | | | | | 1,134,713 | |
| | |
| | Textiles, Apparel & Luxury Goods – 4.6% | |
| | 8,935 | | | Kate Spade & Co.* | | | 177,092 | |
| | 5,228 | | | NIKE, Inc. Class B | | | 321,992 | |
| | 1,716 | | | PVH Corp. | | | 135,821 | |
| | 1,285 | | | Under Armour, Inc. Class A* | | | 107,542 | |
| | | | | | | | |
| | | | | | | 742,447 | |
| | |
| | Trading Companies & Distributors – 0.4% | |
| | 278 | | | W.W. Grainger, Inc. | | | 60,298 | |
| | |
| | TOTAL COMMON STOCKS | | | | |
| | (Cost $13,368,806) | | $ | 16,009,059 | |
| | |
| | |
| The accompanying notes are an integral part of these financial statements. | | 67 |
GOLDMAN SACHS FLEXIBLE CAP GROWTH FUND
Schedule of Investments (continued)
February 29, 2016 (Unaudited)
| | | | | | | | | | | | | | |
Principal
Amount | | | Interest
Rate | | | Maturity
Date | | | Value | |
| | | | | | | | | | | | | | |
| | Short-term Investment(a) – 0.6% | |
| | Repurchase Agreements – 0.6% | | | | | |
| Joint Repurchase Agreement Account II | | | | | |
| $ | 100,000 | | | | 0.312 | % | | | 03/01/16 | | | $ | 100,000 | |
| | (Cost $100,000) | | | | | | | | | |
| | |
| | TOTAL INVESTMENTS – 99.1% | | | | | |
| | (Cost $13,468,806) | | | | | | | $ | 16,109,059 | |
| | |
| OTHER ASSETS IN EXCESS OF
LIABILITIES – 0.9% |
| | | 139,265 | |
| | |
| | NET ASSETS – 100.0% | | | $ | 16,248,324 | |
| | |
| | |
| The percentage shown for each investment category reflects the value of investments in that category as a percentage of net assets. |
* | | Non-income producing security. |
(a) | | Joint repurchase agreement was entered into on February 29, 2016. Additional information appears on page 78. |
| | |
|
Investment Abbreviations: |
ADR | | —American Depositary Receipt |
PLC | | —Public Limited Company |
|
| | |
| 68 | | The accompanying notes are an integral part of these financial statements. |
GOLDMAN SACHS FOCUSED GROWTH FUND
Schedule of Investments
February 29, 2016 (Unaudited)
| | | | | | | | |
Shares | | | Description | | Value | |
| | Common Stocks – 96.5% | |
| | Auto Components – 2.2% | |
| | 18,511 | | | BorgWarner, Inc. | | $ | 604,939 | |
| | |
| | Biotechnology* – 4.4% | |
| | 2,427 | | | Biogen, Inc. | | | 629,612 | |
| | 6,501 | | | Vertex Pharmaceuticals, Inc. | | | 555,771 | |
| | | | | | | | |
| | | | | | | 1,185,383 | |
| | |
| | Computers & Peripherals – 9.6% | |
| | 26,846 | | | Apple, Inc. | | | 2,595,740 | |
| | |
| | Diversified Financial Services – 3.5% | |
| | 3,928 | | | Intercontinental Exchange, Inc. | | | 936,671 | |
| | |
| | Food & Staples Retailing – 14.5% | |
| | 11,219 | | | Costco Wholesale Corp. | | | 1,683,187 | |
| | 17,031 | | | Walgreens Boots Alliance, Inc. | | | 1,344,427 | |
| | 28,890 | | | Whole Foods Market, Inc. | | | 904,546 | |
| | | | | | | | |
| | | | | | | 3,932,160 | |
| | |
| | Health Care Equipment & Supplies – 4.4% | |
| | 30,948 | | | Abbott Laboratories | | | 1,198,926 | |
| | |
| | Health Care Technology* – 2.6% | |
| | 13,974 | | | Cerner Corp. | | | 713,512 | |
| | |
| | Hotels, Restaurants & Leisure – 4.5% | |
| | 10,298 | | | McDonald’s Corp. | | | 1,206,823 | |
| | |
| | Internet & Catalog Retail* – 3.7% | |
| | 1,822 | | | Amazon.com, Inc. | | | 1,006,691 | |
| | |
| | Internet Software & Services* – 12.5% | |
| | 2,537 | | | Alphabet, Inc. Class A | | | 1,819,587 | |
| | 14,736 | | | Facebook, Inc. Class A | | | 1,575,573 | |
| | | | | | | | |
| | | | | | | 3,395,160 | |
| | |
| | IT Services – 5.1% | |
| | 15,853 | | | MasterCard, Inc. Class A | | | 1,377,943 | |
| | |
| | Pharmaceuticals* – 4.2% | |
| | 3,866 | | | Allergan PLC | | | 1,121,565 | |
| | |
| | Real Estate Investment Trusts – 10.7% | |
| | 16,185 | | | American Tower Corp. | | | 1,492,257 | |
| | 4,618 | | | Equinix, Inc. | | | 1,402,440 | |
| | | | | | | | |
| | | | | | | 2,894,697 | |
| | |
| | Road & Rail – 3.0% | |
| | 9,919 | | | Kansas City Southern | | | 810,482 | |
| | |
| | Textiles, Apparel & Luxury Goods – 11.6% | |
| | 47,267 | | | Kate Spade & Co.* | | | 936,832 | |
| | 17,462 | | | NIKE, Inc. Class B | | | 1,075,484 | |
| | 14,391 | | | PVH Corp. | | | 1,139,048 | |
| | | | | | | | |
| | | | | | | 3,151,364 | |
| | |
| | TOTAL COMMON STOCKS | | | | |
| | (Cost $26,183,304) | | $ | 26,132,056 | |
| | |
| | | | | | | | | | | | | | |
Principal
Amount | | | Interest
Rate | | | Maturity
Date | | | Value | |
| | Short-term Investment(a) – 3.3% | |
| | Repurchase Agreements – 3.3% | | | | | |
| Joint Repurchase Agreement Account II | | | | | |
| $ | 900,000 | | | | 0.312 | % | | | 03/01/16 | | | $ | 900,000 | |
| | (Cost $900,000) | | | | | | | | | |
| | |
| | TOTAL INVESTMENTS – 99.8% | | | | | |
| | (Cost $27,083,304) | | | $ | 27,032,056 | |
| | |
| OTHER ASSETS IN EXCESS OF
LIABILITIES – 0.2% |
| | | 46,720 | |
| | |
| | NET ASSETS – 100.0% | | | $ | 27,078,776 | |
| | |
| | |
| The percentage shown for each investment category reflects the value of investments in that category as a percentage of net assets. |
* | | Non-income producing security. |
(a) | | Joint repurchase agreement was entered into on February 29, 2016. Additional information appears on page 78. |
| | |
| The accompanying notes are an integral part of these financial statements. | | 69 |
GOLDMAN SACHS GROWTH OPPORTUNITIES FUND
Schedule of Investments
February 29, 2016 (Unaudited)
| | | | | | | | |
Shares | | | Description | | Value | |
| | | | | | | | |
| | Common Stocks – 98.7% | |
| | Auto Components – 0.7% | |
| | 729,133 | | | BorgWarner, Inc. | | $ | 23,828,066 | |
| | |
| | Beverages – 1.7% | |
| | 590,374 | | | Brown-Forman Corp. Class B | | | 58,134,128 | |
| | |
| | Biotechnology* – 2.1% | |
| | 556,683 | | | Alkermes PLC | | | 17,964,160 | |
| | 916,709 | | | Cepheid, Inc. | | | 27,207,923 | |
| | 276,752 | | | Medivation, Inc. | | | 9,899,419 | |
| | 215,475 | | | Vertex Pharmaceuticals, Inc. | | | 18,420,958 | |
| | | | | | | | |
| | | | | | | 73,492,460 | |
| | |
| | Building Products – 1.6% | |
| | 1,078,669 | | | Fortune Brands Home &
Security, Inc. | | | 54,170,757 | |
| | |
| | Capital Markets* – 1.0% | |
| | 248,969 | | | Affiliated Managers Group, Inc. | | | 34,529,511 | |
| | |
| | Chemicals – 5.1% | |
| | 445,612 | | | Ashland, Inc. | | | 42,462,367 | |
| | 1,084,711 | | | Axalta Coating Systems Ltd.* | | | 28,159,098 | |
| | 852,369 | | | RPM International, Inc. | | | 34,819,274 | |
| | 253,777 | | | The Sherwin-Williams Co. | | | 68,646,678 | |
| | | | | | | | |
| | | | | | | 174,087,417 | |
| | |
| | Commercial Banks – 2.2% | |
| | 745,999 | | | Eagle Bancorp, Inc.* | | | 34,196,594 | |
| | 681,440 | | | First Republic Bank | | | 41,935,818 | |
| | | | | | | | |
| | | | | | | 76,132,412 | |
| | |
| | Computers & Peripherals* – 0.2% | |
| | 573,497 | | | Pure Storage, Inc. Class A | | | 8,246,887 | |
| | |
| | Consumer Finance* – 0.7% | |
| | 4,113,533 | | | SLM Corp. | | | 24,023,033 | |
| | |
| | Distributors* – 1.4% | |
| | 1,697,331 | | | LKQ Corp. | | | 46,846,336 | |
| | |
| | Diversified Financial Services – 1.4% | |
| | 206,845 | | | Intercontinental Exchange, Inc. | | | 49,324,259 | |
| | |
| | Diversified Telecommunication Services* – 3.2% | |
| | 790,123 | | | Level 3 Communications, Inc. | | | 38,360,472 | |
| | 763,368 | | | SBA Communications Corp. Class A | | | 72,435,989 | |
| | | | | | | | |
| | | | | | | 110,796,461 | |
| | |
| | Electrical Equipment – 4.0% | |
| | 1,124,425 | | | AMETEK, Inc. | | | 52,184,564 | |
| | 318,466 | | | Hubbell, Inc. | | | 31,642,782 | |
| | 1,611,747 | | | Sensata Technologies Holding NV* | | | 54,976,690 | |
| | | | | | | | |
| | | | | | | 138,804,036 | |
| | |
| | Electronic Equipment, Instruments & Components – 2.7% | |
| | 1,727,395 | | | Amphenol Corp. Class A | | | 91,672,853 | |
| | |
| | Energy Equipment & Services* – 0.6% | |
| | 357,016 | | | Dril-Quip, Inc. | | | 19,368,118 | |
| | |
| | Food & Staples Retailing – 1.6% | |
| | 1,793,274 | | | Whole Foods Market, Inc. | | | 56,147,409 | |
| | |
| | | | | | | | |
| | Common Stocks – (continued) | |
| | Food Products – 6.1% | |
| | 2,150,047 | | | Blue Buffalo Pet Products, Inc.* | | $ | 39,345,860 | |
| | 989,948 | | | McCormick & Co., Inc. | | | 92,322,550 | |
| | 588,744 | | | The Hain Celestial Group, Inc.* | | | 21,765,866 | |
| | 661,145 | | | TreeHouse Foods, Inc.* | | | 55,813,861 | |
| | | | | | | | |
| | | | | | | 209,248,137 | |
| | |
| | Health Care Equipment & Supplies – 2.5% | |
| | 132,684 | | | C.R. Bard, Inc. | | | 25,525,748 | |
| | 376,146 | | | DexCom, Inc.* | | | 24,472,059 | |
| | 252,011 | | | Teleflex, Inc. | | | 35,992,211 | |
| | | | | | | | |
| | | | | | | 85,990,018 | |
| | |
| | Health Care Providers & Services – 3.9% | |
| | 335,335 | | | Adeptus Health, Inc. Class A* | | | 19,087,268 | |
| | 481,151 | | | Cardinal Health, Inc. | | | 39,310,037 | |
| | 465,820 | | | Henry Schein, Inc.* | | | 77,069,919 | |
| | | | | | | | |
| | | | | | | 135,467,224 | |
| | |
| | Health Care Technology* – 1.4% | |
| | 961,870 | | | Cerner Corp. | | | 49,113,082 | |
| | |
| | Hotels, Restaurants & Leisure* – 4.0% | |
| | 88,032 | | | Chipotle Mexican Grill, Inc. | | | 44,822,373 | |
| | 439,436 | | | Panera Bread Co. Class A | | | 91,051,139 | |
| | | | | | | | |
| | | | | | | 135,873,512 | |
| | |
| | Internet & Catalog Retail – 1.8% | |
| | 587,629 | | | Expedia, Inc. | | | 61,178,055 | |
| | |
| | Internet Software & Services* – 1.8% | |
| | 361,331 | | | LinkedIn Corp. Class A | | | 42,344,380 | |
| | 1,316,727 | | | Match Group, Inc. | | | 14,339,157 | |
| | 198,071 | | | Twitter, Inc. | | | 3,589,046 | |
| | | | | | | | |
| | | | | | | 60,272,583 | |
| | |
| | IT Services – 7.7% | |
| | 1,993,421 | | | Black Knight Financial Services, Inc. Class A* | | | 58,427,170 | |
| | 954,344 | | | Fidelity National Information Services, Inc. | | | 55,590,538 | |
| | 421,744 | | | FleetCor Technologies, Inc.* | | | 53,852,491 | |
| | 672,721 | | | Global Payments, Inc. | | | 41,002,345 | |
| | 2,017,987 | | | Sabre Corp. | | | 54,788,347 | |
| | | | | | | | |
| | | | | | | 263,660,891 | |
| | |
| | Life Sciences Tools & Services – 2.8% | |
| | 1,225,690 | | | Agilent Technologies, Inc. | | | 45,779,521 | |
| | 158,281 | | | Mettler-Toledo International, Inc.* | | | 49,844,270 | |
| | | | | | | | |
| | | | | | | 95,623,791 | |
| | |
| | Machinery – 5.7% | |
| | 776,871 | | | Graco, Inc. | | | 60,844,537 | |
| | 792,696 | | | The Middleby Corp.* | | | 73,403,649 | |
| | 1,624,363 | | | Xylem, Inc. | | | 60,767,420 | |
| | | | | | | | |
| | | | | | | 195,015,606 | |
| | |
| | Oil, Gas & Consumable Fuels* – 0.6% | |
| | 235,470 | | | Concho Resources, Inc. | | | 21,248,813 | |
| | |
| | |
| 70 | | The accompanying notes are an integral part of these financial statements. |
GOLDMAN SACHS GROWTH OPPORTUNITIES FUND
| | | | | | | | |
Shares | | | Description | | Value | |
| | | | | | | | |
| | Common Stocks – (continued) | |
| | Pharmaceuticals – 1.8% | |
| | 1,466,610 | | | Zoetis, Inc. | | $ | 60,219,006 | |
| | |
| | Real Estate Investment Trusts – 2.5% | |
| | 288,259 | | | Equinix, Inc. | | | 87,541,376 | |
| | |
| | Road & Rail – 1.6% | |
| | 656,350 | | | Kansas City Southern | | | 53,630,358 | |
| | |
| | Semiconductors & Semiconductor Equipment* – 1.2% | |
| | 926,772 | | | Qorvo, Inc. | | | 41,778,882 | |
| | |
| | Software – 5.6% | |
| | 922,313 | | | Electronic Arts, Inc.* | | | 59,249,387 | |
| | 699,506 | | | Intuit, Inc. | | | 67,600,260 | |
| | 747,977 | | | ServiceNow, Inc.* | | | 41,131,255 | |
| | 528,828 | | | Splunk, Inc.* | | | 23,056,901 | |
| | | | | | | | |
| | | | | | | 191,037,803 | |
| | |
| | Specialty Retail – 11.1% | |
| | 271,142 | | | Advance Auto Parts, Inc. | | | 40,248,319 | |
| | 918,677 | | | Five Below, Inc.* | | | 35,231,263 | |
| | 586,874 | | | L Brands, Inc. | | | 49,761,047 | |
| | 73,073 | | | O’Reilly Automotive, Inc.* | | | 19,022,363 | |
| | 492,370 | | | Restoration Hardware Holdings, Inc.* | | | 18,705,136 | |
| | 1,056,632 | | | Ross Stores, Inc. | | | 58,093,627 | |
| | 1,031,201 | | | Tractor Supply Co. | | | 87,208,669 | |
| | 434,402 | | | Ulta Salon, Cosmetics & Fragrance, Inc.* | | | 71,758,866 | |
| | | | | | | | |
| | | | | | | 380,029,290 | |
| | |
| | Textiles, Apparel & Luxury Goods – 5.1% | |
| �� | 3,343,767 | | | Kate Spade & Co.* | | | 66,273,462 | |
| | 674,617 | | | PVH Corp. | | | 53,395,936 | |
| | 670,447 | | | Under Armour, Inc. Class A* | | | 56,109,709 | |
| | | | | | | | |
| | | | | | | 175,779,107 | |
| | |
| | Trading Companies & Distributors – 1.3% | |
| | 205,406 | | | W.W. Grainger, Inc. | | | 44,552,562 | |
| | |
| | TOTAL COMMON STOCKS | | | | |
| | (Cost $3,111,204,944) | | $ | 3,386,864,239 | |
| | |
| | | | | | | | |
Shares | | | Rate | | Value | |
| | | | | | | | |
| | Investment Company(a) – 2.4% | |
| Goldman Sachs Financial Square Government Fund – FST
Institutional Shares |
|
| | 82,010,369 | | | 0.233% | | $ | 82,010,369 | |
| | (Cost $82,010,369) | | | | |
| | |
| | TOTAL INVESTMENTS – 101.1% | | | | |
| | (Cost $3,193,215,313) | | $ | 3,468,874,608 | |
| | |
| LIABILITIES IN EXCESS OF
OTHER ASSETS – (1.1)% | | | (36,082,341 | ) |
| | |
| | NET ASSETS – 100.0% | | $ | 3,432,792,267 | |
| | |
| | |
| The percentage shown for each investment category reflects the value of investments in that category as a percentage of net assets. |
* | | Non-income producing security. |
(a) | | Represents an Affiliated Fund. |
| | |
| The accompanying notes are an integral part of these financial statements. | | 71 |
GOLDMAN SACHS SMALL/MID CAP GROWTH FUND
Schedule of Investments
February 29, 2016 (Unaudited)
| | | | | | | | |
Shares | | | Description | | Value | |
| | | | | | | | |
| Common Stocks – 97.9% | |
| | Aerospace & Defense* – 0.6% | |
| | 590,095 | | | Aerovironment, Inc. | | $ | 14,681,564 | |
| | |
| | Auto Components – 0.7% | |
| | 520,859 | | | BorgWarner, Inc. | | | 17,021,672 | |
| | |
| | Biotechnology* – 5.1% | |
| | 959,871 | | | Achillion Pharmaceuticals, Inc. | | | 7,093,447 | |
| | 197,412 | | | Alder Biopharmaceuticals, Inc. | | | 3,748,854 | |
| | 473,845 | | | Alkermes PLC | | | 15,290,978 | |
| | 952,989 | | | Amicus Therapeutics, Inc. | | | 5,870,412 | |
| | 1,040,635 | | | Cepheid, Inc. | | | 30,886,047 | |
| | 300,860 | | | Cidara Therapeutics, Inc. | | | 3,014,617 | |
| | 363,126 | | | Dynavax Technologies Corp. | | | 5,853,591 | |
| | 379,864 | | | Galapagos NV ADR | | | 15,585,820 | |
| | 268,229 | | | Medivation, Inc. | | | 9,594,551 | |
| | 189,320 | | | Ophthotech Corp. | | | 8,526,973 | |
| | 354,777 | | | Otonomy, Inc. | | | 4,495,025 | |
| | 181,976 | | | Ultragenyx Pharmaceutical, Inc. | | | 11,098,716 | |
| | 766,517 | | | Voyager Therapeutics, Inc. | | | 7,335,568 | |
| | | | | | | | |
| | | | | | | 128,394,599 | |
| | |
| | Building Products – 1.8% | |
| | 917,716 | | | Fortune Brands Home & Security, Inc. | | | 46,087,697 | |
| | |
| | Capital Markets* – 0.8% | |
| | 138,388 | | | Affiliated Managers Group, Inc. | | | 19,193,032 | |
| | |
| | Chemicals – 3.7% | |
| | 310,863 | | | Ashland, Inc. | | | 29,622,135 | |
| | 1,452,399 | | | Axalta Coating Systems Ltd.* | | | 37,704,278 | |
| | 614,028 | | | RPM International, Inc. | | | 25,083,044 | |
| | | | | | | | |
| | | | | | | 92,409,457 | |
| | |
| | Commercial Banks – 3.7% | |
| | 1,358,890 | | | Eagle Bancorp, Inc.* | | | 62,291,518 | |
| | 490,895 | | | First Republic Bank | | | 30,209,678 | |
| | | | | | | | |
| | | | | | | 92,501,196 | |
| | |
| | Commercial Services & Supplies – 3.1% | |
| | 1,245,361 | | | Healthcare Services Group, Inc. | | | 44,185,408 | |
| | 301,279 | | | Stericycle, Inc.* | | | 34,324,717 | |
| | | | | | | | |
| | | | | | | 78,510,125 | |
| | |
| | Computers & Peripherals* – 1.8% | |
| | 983,631 | | | Electronics for Imaging, Inc. | | | 38,961,624 | |
| | 411,733 | | | Pure Storage, Inc. Class A | | | 5,920,720 | |
| | | | | | | | |
| | | | | | | 44,882,344 | |
| | |
| | Consumer Finance* – 0.9% | |
| | 3,967,553 | | | SLM Corp. | | | 23,170,510 | |
| | |
| | Containers & Packaging – 0.6% | |
| | 239,961 | | | Avery Dennison Corp. | | | 15,626,260 | |
| | |
| | Distributors* – 1.3% | |
| | 1,174,885 | | | LKQ Corp. | | | 32,426,826 | |
| | |
| | Diversified Telecommunication Services* – 3.3% | |
| | 866,292 | | | Level 3 Communications, Inc. | | | 42,058,477 | |
| | |
| | | | | | | | |
| Common Stocks – (continued) | |
| | Diversified Telecommunication Services* – (continued) | |
| | 436,206 | | | SBA Communications Corp. Class A | | $ | 41,391,587 | |
| | | | | | | | |
| | | | | | | 83,450,064 | |
| | |
| | Electrical Equipment – 2.0% | |
| | 180,898 | | | Hubbell, Inc. | | | 17,974,025 | |
| | 950,120 | | | Sensata Technologies Holding NV* | | | 32,408,593 | |
| | | | | | | | |
| | | | | | | 50,382,618 | |
| | |
| | Electronic Equipment, Instruments & Components – 1.5% | |
| | 700,527 | | | Amphenol Corp. Class A | | | 37,176,968 | |
| | |
| | Energy Equipment & Services* – 0.6% | |
| | 269,361 | | | Dril-Quip, Inc. | | | 14,612,834 | |
| | |
| | Food & Staples Retailing – 1.6% | |
| | 1,242,731 | | | Whole Foods Market, Inc. | | | 38,909,908 | |
| | |
| | Food Products – 5.1% | |
| | 1,034,681 | | | Blue Buffalo Pet Products, Inc.* | | | 18,934,662 | |
| | 1,074,809 | | | Freshpet, Inc.* | | | 7,147,480 | |
| | 417,049 | | | McCormick & Co., Inc. | | | 38,893,990 | |
| | 531,863 | | | The Hain Celestial Group, Inc.* | | | 19,662,975 | |
| | 513,209 | | | TreeHouse Foods, Inc.* | | | 43,325,104 | |
| | | | | | | | |
| | | | | | | 127,964,211 | |
| | |
| | Health Care Equipment & Supplies – 4.3% | |
| | 178,965 | | | ABIOMED, Inc.* | | | 14,318,990 | |
| | 172,401 | | | C.R. Bard, Inc. | | | 33,166,504 | |
| | 382,722 | | | DexCom, Inc.* | | | 24,899,893 | |
| | 254,084 | | | Teleflex, Inc. | | | 36,288,277 | |
| | | | | | | | |
| | | | | | | 108,673,664 | |
| | |
| | Health Care Providers & Services* – 4.7% | |
| | 477,813 | | | Acadia Healthcare Co., Inc. | | | 26,475,618 | |
| | 643,601 | | | Adeptus Health, Inc. Class A | | | 36,633,769 | |
| | 220,859 | | | Henry Schein, Inc. | | | 36,541,122 | |
| | 283,446 | | | MEDNAX, Inc. | | | 19,002,220 | |
| | | | | | | | |
| | | | | | | 118,652,729 | |
| | |
| | Health Care Technology* – 0.3% | |
| | 834,025 | | | Evolent Health, Inc. Class A | | | 8,381,951 | |
| | |
| | Hotels, Restaurants & Leisure – 6.1% | |
| | 867,255 | | | Bloomin’ Brands, Inc. | | | 14,994,839 | |
| | 554,598 | | | Jack in the Box, Inc. | | | 38,128,612 | |
| | 327,158 | | | Panera Bread Co. Class A* | | | 67,787,138 | |
| | 176,962 | | | Shake Shack, Inc. Class A* | | | 7,366,928 | |
| | 723,747 | | | Zoe’s Kitchen, Inc.* | | | 25,280,483 | |
| | | | | | | | |
| | | | | | | 153,558,000 | |
| | |
| | Household Durables* – 0.7% | |
| | 942,930 | | | M/I Homes, Inc. | | | 16,567,280 | |
| | |
| | Internet Software & Services* – 2.2% | |
| | 433,236 | | | Demandware, Inc. | | | 15,028,957 | |
| | 451,583 | | | GoDaddy, Inc. Class A | | | 14,157,127 | |
| | 968,407 | | | Match Group, Inc. | | | 10,545,952 | |
| | |
| | |
| 72 | | The accompanying notes are an integral part of these financial statements. |
GOLDMAN SACHS SMALL/MID CAP GROWTH FUND
| | | | | | | | |
Shares | | | Description | | Value | |
| | | | | | | | |
| Common Stocks – (continued) | |
| | Internet Software & Services* – (continued) | |
| | 1,740,028 | | | OPOWER, Inc. | | $ | 14,390,032 | |
| | | | | | | | |
| | | | | | | 54,122,068 | |
| | |
| | IT Services – 7.9% | |
| | 1,756,426 | | | Black Knight Financial Services, Inc. Class A* | | | 51,480,846 | |
| | 230,609 | | | FleetCor Technologies, Inc.* | | | 29,446,463 | |
| | 564,525 | | | Global Payments, Inc. | | | 34,407,799 | |
| | 1,275,325 | | | InterXion Holding NV* | | | 39,815,647 | |
| | 1,536,176 | | | Sabre Corp. | | | 41,707,178 | |
| | | | | | | | |
| | | | | | | 196,857,933 | |
| | |
| | Life Sciences Tools & Services – 2.5% | |
| | 107,319 | | | Mettler-Toledo International, Inc.* | | | 33,795,826 | |
| | 626,942 | | | PerkinElmer, Inc. | | | 29,629,279 | |
| | | | | | | | |
| | | | | | | 63,425,105 | |
| | |
| | Machinery – 5.9% | |
| | 425,890 | | | Graco, Inc. | | | 33,355,705 | |
| | 1,328,068 | | | Kornit Digital Ltd.* | | | 15,405,589 | |
| | 561,317 | | | The Middleby Corp.* | | | 51,977,954 | |
| | 1,292,579 | | | Xylem, Inc. | | | 48,355,380 | |
| | | | | | | | |
| | | | | | | 149,094,628 | |
| | |
| | Media* – 0.4% | |
| | 144,708 | | | AMC Networks, Inc. Class A | | | 9,484,162 | |
| | |
| | Oil, Gas & Consumable Fuels* – 0.5% | |
| | 145,420 | | | Concho Resources, Inc. | | | 13,122,701 | |
| | |
| | Pharmaceuticals* – 1.3% | |
| | 1,239,416 | | | Cempra, Inc. | | | 20,859,371 | |
| | 1,288,303 | | | Corium International, Inc.(a) | | | 5,900,428 | |
| | 272,964 | | | Revance Therapeutics, Inc. | | | 4,827,368 | |
| | | | | | | | |
| | | | | | | 31,587,167 | |
| | |
| | Real Estate Investment Trusts – 1.8% | |
| | 144,758 | | | Equinix, Inc. | | | 43,961,557 | |
| | |
| | Road & Rail – 1.5% | |
| | 451,712 | | | Kansas City Southern | | | 36,909,387 | |
| | |
| | Semiconductors & Semiconductor Equipment* – 1.5% | |
| | 139,621 | | | Cavium, Inc. | | | 8,306,053 | |
| | 632,275 | | | Qorvo, Inc. | | | 28,502,957 | |
| | | | | | | | |
| | | | | | | 36,809,010 | |
| | |
| | Software* – 3.6% | |
| | 344,549 | | | Guidewire Software, Inc. | | | 16,962,147 | |
| | 241,594 | | | Red Hat, Inc. | | | 15,788,168 | |
| | 484,887 | | | ServiceNow, Inc. | | | 26,663,936 | |
| | 422,246 | | | Splunk, Inc. | | | 18,409,926 | |
| | 275,866 | | | Tableau Software, Inc. Class A | | | 12,593,283 | |
| | | | | | | | |
| | | | | | | 90,417,460 | |
| | |
| | Specialty Retail – 9.6% | |
| | 180,094 | | | Advance Auto Parts, Inc. | | | 26,733,153 | |
| | 580,644 | | | Burlington Stores, Inc.* | | | 32,550,903 | |
| | 1,039,212 | | | Five Below, Inc.* | | | 39,853,780 | |
| | |
| | | | | | | | |
| Common Stocks – (continued) | |
| | Specialty Retail – (continued) | |
| | 623,561 | | | Restoration Hardware Holdings, Inc.* | | $ | 23,689,082 | |
| | 769,217 | | | Tractor Supply Co. | | | 65,052,682 | |
| | 319,825 | | | Ulta Salon, Cosmetics & Fragrance, Inc.* | | | 52,831,892 | |
| | | | | | | | |
| | | | | | | 240,711,492 | |
| | |
| | Textiles, Apparel & Luxury Goods – 4.9% | |
| | 2,198,272 | | | Kate Spade & Co.* | | | 43,569,751 | |
| | 389,916 | | | PVH Corp. | | | 30,861,852 | |
| | 566,638 | | | Under Armour, Inc. Class A* | | | 47,421,934 | |
| | | | | | | | |
| | | | | | | 121,853,537 | |
| | |
| | TOTAL COMMON STOCKS | |
| | (Cost $2,334,370,146) | | $ | 2,451,591,716 | |
| | |
| | | | | | | | | | | | | | |
Principal
Amount | | | Interest
Rate | | | Maturity
Date | | | Value | |
| | | | | | | | | | | | | | |
| | Short-term Investment(b) – 1.7% | |
| | Repurchase Agreements – 1.7% | | | | | |
| Joint Repurchase Agreement Account II | | | | | |
| $ | 41,700,000 | | | | 0.312 | % | | | 03/01/16 | | | $ | 41,700,000 | |
| | (Cost $41,700,000) | | | | | | | | | |
| | |
| | TOTAL INVESTMENTS – 99.6% | | | | | |
| | (Cost $2,376,070,146) | | | $ | 2,493,291,716 | |
| | |
| OTHER ASSETS IN EXCESS OF
LIABILITIES – 0.4% |
| | | 11,180,915 | |
| | |
| | NET ASSETS – 100.0% | | | $ | 2,504,472,631 | |
| | |
| | |
| The percentage shown for each investment category reflects the value of investments in that category as a percentage of net assets. |
* | | Non-income producing security. |
(a) | | Represents an Affiliated Issuer. |
(b) | | Joint repurchase agreement was entered into on February 29, 2016. Additional information appears on page 78. |
| | |
|
Investment Abbreviations: |
ADR | | —American Depositary Receipt |
PLC | | —Public Limited Company |
|
| | |
| The accompanying notes are an integral part of these financial statements. | | 73 |
GOLDMAN SACHS STRATEGIC GROWTH FUND
Schedule of Investments
February 29, 2016 (Unaudited)
| | | | | | | | |
| Shares | | | Description | |
Value | |
| | | | | | | | |
| | Common Stocks – 96.3% | |
| | Aerospace & Defense – 2.3% | |
| | 71,969 | | | Honeywell International, Inc. | | $ | 7,294,058 | |
| | 17,283 | | | The Boeing Co. | | | 2,042,505 | |
| | | | | | | | |
| | | | | | | 9,336,563 | |
| | |
| | Auto Components – 1.1% | |
| | 139,310 | | | BorgWarner, Inc. | | | 4,552,651 | |
| | |
| | Beverages – 3.4% | |
| | 43,101 | | | Brown-Forman Corp. Class B | | | 4,244,155 | |
| | 222,998 | | | The Coca-Cola Co. | | | 9,617,904 | |
| | | | | | | | |
| | | | | | | 13,862,059 | |
| | |
| | Biotechnology – 4.4% | |
| | 16,333 | | | Alexion Pharmaceuticals, Inc.* | | | 2,299,686 | |
| | 24,469 | | | Biogen, Inc.* | | | 6,347,748 | |
| | 57,978 | | | Gilead Sciences, Inc. | | | 5,058,581 | |
| | 46,706 | | | Vertex Pharmaceuticals, Inc.* | | | 3,992,896 | |
| | | | | | | | |
| | | | | | | 17,698,911 | |
| | |
| | Building Products – 1.1% | |
| | 86,687 | | | Fortune Brands Home & Security, Inc. | | | 4,353,421 | |
| | |
| | Chemicals – 2.5% | |
| | 25,946 | | | Ashland, Inc. | | | 2,472,394 | |
| | 131,978 | | | Axalta Coating Systems Ltd.* | | | 3,426,149 | |
| | 14,923 | | | The Sherwin-Williams Co. | | | 4,036,672 | |
| | | | | | | | |
| | | | | | | 9,935,215 | |
| | |
| | Commercial Banks – 1.1% | |
| | 69,495 | | | First Republic Bank | | | 4,276,722 | |
| | |
| | Computers & Peripherals – 6.7% | |
| | 281,428 | | | Apple, Inc. | | | 27,211,273 | |
| | |
| | Consumer Finance* – 0.6% | |
| | 436,166 | | | SLM Corp. | | | 2,547,209 | |
| | |
| | Diversified Financial Services – 1.2% | |
| | 20,443 | | | Intercontinental Exchange, Inc. | | | 4,874,838 | |
| | |
| | Energy Equipment & Services – 0.8% | |
| | 102,485 | | | Halliburton Co. | | | 3,308,216 | |
| | |
| | Food & Staples Retailing – 5.6% | |
| | 73,693 | | | Costco Wholesale Corp. | | | 11,056,161 | |
| | 80,471 | | | Walgreens Boots Alliance, Inc. | | | 6,352,381 | |
| | 167,784 | | | Whole Foods Market, Inc. | | | 5,253,317 | |
| | | | | | | | |
| | | | | | | 22,661,859 | |
| | |
| | Food Products – 1.2% | |
| | 53,310 | | | McCormick & Co., Inc. | | | 4,971,691 | |
| | |
| | Health Care Equipment & Supplies – 2.9% | |
| | 175,429 | | | Abbott Laboratories | | | 6,796,119 | |
| | 47,928 | | | Stryker Corp. | | | 4,787,049 | |
| | | | | | | | |
| | | | | | | 11,583,168 | |
| | |
| | Health Care Providers & Services – 2.0% | |
| | 28,071 | | | Aetna, Inc. | | | 3,049,353 | |
| | 31,153 | | | McKesson Corp. | | | 4,848,030 | |
| | | | | | | | |
| | | | | | | 7,897,383 | |
| | |
| | | | | | | | |
| | Common Stocks – (continued) | |
| | Health Care Technology* – 1.1% | |
| | 90,542 | | | Cerner Corp. | | $ | 4,623,074 | |
| | |
| | Hotels, Restaurants & Leisure – 6.0% | |
| | 76,884 | | | McDonald’s Corp. | | | 9,010,036 | |
| | 157,167 | | | Starbucks Corp. | | | 9,148,691 | |
| | 81,757 | | | Yum! Brands, Inc. | | | 5,924,930 | |
| | | | | | | | |
| | | | | | | 24,083,657 | |
| | |
| | Industrial Conglomerates – 1.2% | |
| | 53,580 | | | Danaher Corp. | | | 4,783,087 | |
| | |
| | Internet & Catalog Retail* – 5.7% | |
| | 20,920 | | | Amazon.com, Inc. | | | 11,558,718 | |
| | 44,399 | | | Netflix, Inc. | | | 4,147,311 | |
| | 5,851 | | | The Priceline Group, Inc. | | | 7,402,744 | |
| | | | | | | | |
| | | | | | | 23,108,773 | |
| | |
| | Internet Software & Services* – 9.1% | |
| | 17,670 | | | Alphabet, Inc. Class A | | | 12,673,277 | |
| | 13,433 | | | Alphabet, Inc. Class C | | | 9,373,144 | |
| | 137,641 | | | Facebook, Inc. Class A | | | 14,716,576 | |
| | | | | | | | |
| | | | | | | 36,762,997 | |
| | |
| | IT Services – 4.1% | |
| | 28,379 | | | FleetCor Technologies, Inc.* | | | 3,623,715 | |
| | 101,899 | | | MasterCard, Inc. Class A | | | 8,857,061 | |
| | 155,375 | | | Sabre Corp. | | | 4,218,431 | |
| | | | | | | | |
| | | | | | | 16,699,207 | |
| | |
| | Life Sciences Tools & Services – 1.6% | |
| | 65,447 | | | Agilent Technologies, Inc. | | | 2,444,445 | |
| | 25,820 | | | Illumina, Inc.* | | | 3,879,197 | |
| | | | | | | | |
| | | | | | | 6,323,642 | |
| | |
| | Machinery – 1.0% | |
| | 109,731 | | | Xylem, Inc. | | | 4,105,037 | |
| | |
| | Media – 1.7% | |
| | 118,481 | | | Comcast Corp. Class A | | | 6,839,908 | |
| | |
| | Oil, Gas & Consumable Fuels – 0.5% | |
| | 56,162 | | | Anadarko Petroleum Corp. | | | 2,131,348 | |
| | |
| | Pharmaceuticals – 3.2% | |
| | 26,786 | | | Allergan PLC* | | | 7,770,886 | |
| | 11,891 | | | Shire PLC ADR | | | 1,856,304 | |
| | 78,875 | | | Zoetis, Inc. | | | 3,238,608 | |
| | | | | | | | |
| | | | | | | 12,865,798 | |
| | |
| | Real Estate Investment Trusts – 4.6% | |
| | 101,932 | | | American Tower Corp. | | | 9,398,130 | |
| | 30,726 | | | Equinix, Inc. | | | 9,331,179 | |
| | | | | | | | |
| | | | | | | 18,729,309 | |
| | |
| | Road & Rail – 0.9% | |
| | 46,016 | | | Kansas City Southern | | | 3,759,967 | |
| | |
| | Semiconductors & Semiconductor Equipment* – 1.2% | |
| | 67,361 | | | NXP Semiconductors NV | | | 4,798,798 | |
| | |
| | |
| 74 | | The accompanying notes are an integral part of these financial statements. |
GOLDMAN SACHS STRATEGIC GROWTH FUND
| | | | | | | | |
| Shares | | | Description | |
Value | |
| | | | | | | | |
| | Common Stocks – (continued) | |
| | Software – 6.8% | |
| | 61,051 | | | Electronic Arts, Inc.* | | $ | 3,921,916 | |
| | 57,127 | | | Intuit, Inc. | | | 5,520,753 | |
| | 128,005 | | | Microsoft Corp. | | | 6,512,894 | |
| | 160,048 | | | Oracle Corp. | | | 5,886,566 | |
| | 39,660 | | | salesforce.com, Inc.* | | | 2,686,965 | |
| | 51,486 | | | ServiceNow, Inc.* | | | 2,831,215 | |
| | | | | | | | |
| | | | | | | 27,360,309 | |
| | |
| | Specialty Retail – 4.3% | |
| | 61,063 | | | L Brands, Inc. | | | 5,177,532 | |
| | 35,844 | | | Ross Stores, Inc. | | | 1,970,703 | |
| | 63,663 | | | The Home Depot, Inc. | | | 7,901,851 | |
| | 29,633 | | | Tractor Supply Co. | | | 2,506,063 | |
| | | | | | | | |
| | | | | | | 17,556,149 | |
| | |
| | Textiles, Apparel & Luxury Goods – 4.6% | |
| | 254,390 | | | Kate Spade & Co.* | | | 5,042,010 | |
| | 135,082 | | | NIKE, Inc. Class B | | | 8,319,701 | |
| | 63,249 | | | PVH Corp. | | | 5,006,158 | |
| | | | | | | | |
| | | | | | | 18,367,869 | |
| | |
| | Tobacco – 1.8% | |
| | 31,672 | | | Philip Morris International, Inc. | | | 2,883,102 | |
| | 87,977 | | | Reynolds American, Inc. | | | 4,436,680 | |
| | | | | | | | |
| | | | | | | 7,319,782 | |
| | |
| | TOTAL COMMON STOCKS | | | | |
| | (Cost $320,302,290) | | $ | 389,289,890 | |
| | |
| | | | | | | | | | | | | | |
Principal
Amount | | | Interest
Rate | | | Maturity
Date | | | Value | |
| | Short-term Investment(a) – 4.2% | |
| | Repurchase Agreements – 4.2% | |
| Joint Repurchase Agreement Account II | | | | | |
| $ | 16,900,000 | | | | 0.312 | % | | | 03/01/16 | | | $ | 16,900,000 | |
| | (Cost $16,900,000) | | | | | |
| | |
| | TOTAL INVESTMENTS – 100.5% | | | | | |
| | (Cost $337,202,290) | | | $ | 406,189,890 | |
| | |
| LIABILITIES IN EXCESS OF
OTHER ASSETS – (0.5)% |
| | | (2,045,616 | ) |
| | |
| | NET ASSETS – 100.0% | | | | | | | $ | 404,144,274 | |
| | |
| | |
| The percentage shown for each investment category reflects the value of investments in that category as a percentage of net assets. |
* | | Non-income producing security. |
(a) | | Joint repurchase agreement was entered into on February 29, 2016. Additional information appears on page 78. |
| | |
|
Investment Abbreviations: |
ADR | | —American Depositary Receipt |
PLC | | —Public Limited Company |
|
| | |
| The accompanying notes are an integral part of these financial statements. | | 75 |
GOLDMAN SACHS TECHNOLOGY OPPORTUNITIES FUND
Schedule of Investments
February 29, 2016 (Unaudited)
| | | | | | | | |
Shares | | | Description | | Value | |
| | | | | | | | |
| | Common Stocks – 99.6% | |
| | Computers & Peripherals – 11.2% | |
| | 279,808 | | | Apple, Inc. | | $ | 27,054,635 | |
| | 165,216 | | | Electronics for Imaging, Inc.* | | | 6,544,206 | |
| | 214,584 | | | EMC Corp. | | | 5,607,080 | |
| | 45,278 | | | Pure Storage, Inc. Class A* | | | 651,098 | |
| | | | | | | | |
| | | | | | | 39,857,019 | |
| | |
| | Diversified Financial Services – 1.5% | |
| | 21,991 | | | Intercontinental Exchange, Inc. | | | 5,243,974 | |
| | |
| | Diversified Telecommunication Services* – 5.5% | |
| | 193,618 | | | Level 3 Communications, Inc. | | | 9,400,154 | |
| | 107,372 | | | SBA Communications Corp. Class A | | | 10,188,529 | |
| | | | | | | | |
| | | | | | | 19,588,683 | |
| | |
| | Electronic Equipment, Instruments & Components – 3.3% | |
| | 219,287 | | | Amphenol Corp. Class A | | | 11,637,561 | |
| | |
| | Internet & Catalog Retail – 8.5% | |
| | 29,863 | | | Amazon.com, Inc.* | | | 16,499,905 | |
| | 30,261 | | | Expedia, Inc. | | | 3,150,472 | |
| | 8,304 | | | The Priceline Group, Inc.* | | | 10,506,304 | |
| | | | | | | | |
| | | | | | | 30,156,681 | |
| | |
| | Internet Software & Services* – 17.3% | |
| | 22,178 | | | Alphabet, Inc. Class A | | | 15,906,505 | |
| | 21,067 | | | Alphabet, Inc. Class C | | | 14,699,921 | |
| | 112,712 | | | Demandware, Inc. | | | 3,909,979 | |
| | 181,211 | | | Facebook, Inc. Class A | | | 19,375,080 | |
| | 49,110 | | | LinkedIn Corp. Class A | | | 5,755,201 | |
| | 144,118 | | | Match Group, Inc. | | | 1,569,445 | |
| | | | | | | | |
| | | | | | | 61,216,131 | |
| | |
| | IT Services – 14.4% | |
| | 20,260 | | | Alliance Data Systems Corp.* | | | 4,257,234 | |
| | 196,601 | | | Black Knight Financial Services, Inc. Class A* | | | 5,762,375 | |
| | 100,869 | | | Cognizant Technology Solutions Corp. Class A* | | | 5,747,516 | |
| | 115,226 | | | Fidelity National Information
Services, Inc. | | | 6,711,914 | |
| | 212,261 | | | First Data Corp. Class A* | | | 2,653,263 | |
| | 41,797 | | | FleetCor Technologies, Inc.* | | | 5,337,059 | |
| | 125,554 | | | MasterCard, Inc. Class A | | | 10,913,154 | |
| | 357,036 | | | Sabre Corp. | | | 9,693,527 | |
| | | | | | | | |
| | | | | | | 51,076,042 | |
| | |
| | Real Estate Investment Trusts – 6.3% | |
| | 121,778 | | | American Tower Corp. | | | 11,227,931 | |
| | 36,427 | | | Equinix, Inc. | | | 11,062,516 | |
| | | | | | | | |
| | | | | | | 22,290,447 | |
| | |
| | Semiconductors & Semiconductor Equipment – 10.8% | |
| | 321,618 | | | Applied Materials, Inc. | | | 6,068,932 | |
| | 186,776 | | | NXP Semiconductors NV* | | | 13,305,922 | |
| | 136,371 | | | Qorvo, Inc.* | | | 6,147,605 | |
| | 130,259 | | | QUALCOMM, Inc. | | | 6,615,854 | |
| | 116,764 | | | Texas Instruments, Inc. | | | 6,190,827 | |
| | | | | | | | |
| | | | | | | 38,329,140 | |
| | |
| | Common Stocks – (continued) | |
| | | | | | | | |
| | Software – 20.8% | |
| | 20,752 | | | Adobe Systems, Inc.* | | $ | 1,767,033 | |
| | 120,739 | | | Electronic Arts, Inc.* | | | 7,756,273 | |
| | 106,920 | | | Intuit, Inc. | | | 10,332,749 | |
| | 298,843 | | | Oracle Corp. | | | 10,991,446 | |
| | 65,265 | | | Red Hat, Inc.* | | | 4,265,068 | |
| | 171,695 | | | Salesforce.com, Inc.* | | | 11,632,336 | |
| | 230,466 | | | ServiceNow, Inc.* | | | 12,673,325 | |
| | 233,490 | | | Splunk, Inc.* | | | 10,180,164 | |
| | 71,877 | | | Workday, Inc. Class A* | | | 4,344,965 | |
| | | | | | | | |
| | | | | | | 73,943,359 | |
| | |
| | TOTAL COMMON STOCKS | | | | |
| | (Cost $268,984,885) | | $ | 353,339,037 | |
| | |
| | | | | | | | | | | | | | |
Principal
Amount | | | Interest
Rate | | | Maturity
Date | | | Value | |
| | Short-term Investment(a) – 0.6% | |
| | Repurchase Agreements – 0.6% | | | | | |
| Joint Repurchase Agreement Account II | | | | | |
| $ | 1,900,000 | | | | 0.312 | % | | | 03/01/16 | | | $ | 1,900,000 | |
| | (Cost $1,900,000) | | | | | | | | | |
| | |
| | TOTAL INVESTMENTS – 100.2% | | | | | |
| | (Cost $270,884,885) | | | $ | 355,239,037 | |
| | |
| LIABILITIES IN EXCESS OF
OTHER ASSETS – (0.2)% |
| | | (539,906 | ) |
| | |
| | NET ASSETS – 100.0% | | | $ | 354,699,131 | |
| | |
| | |
| The percentage shown for each investment category reflects the value of investments in that category as a percentage of net assets. |
* | | Non-income producing security. |
(a) | | Joint repurchase agreement was entered into on February 29, 2016. Additional information appears on page 78. |
| | |
| 76 | | The accompanying notes are an integral part of these financial statements. |
GOLDMAN SACHS FUNDAMENTAL EQUITY GROWTH FUNDS
Schedule of Investments
February 29, 2016 (Unaudited)
|
| ADDITIONAL INVESTMENT INFORMATION |
JOINT REPURCHASE AGREEMENT ACCOUNT II — At February 29, 2016, certain Funds had undivided interests in the Joint Repurchase Agreement Account II, with a maturity date of March 1, 2016, as follows:
| | | | | | | | | | | | |
| Fund | | Principal
Amount | | | Maturity
Value | | | Collateral
Allocation
Value | |
Capital Growth | | $ | 8,800,000 | | | $ | 8,800,076 | | | $ | 8,976,001 | |
Concentrated Growth | | | 4,700,000 | | | | 4,700,041 | | | | 4,794,001 | |
Dynamic U.S. Equity | | | 100,000 | | | | 100,001 | | | | 102,000 | |
Flexible Cap Growth | | | 100,000 | | | | 100,001 | | | | 102,000 | |
Focused Growth | | | 900,000 | | | | 900,008 | | | | 918,000 | |
Small/Mid Cap Growth | | | 41,700,000 | | | | 41,700,362 | | | | 42,534,005 | |
Strategic Growth | | | 16,900,000 | | | | 16,900,147 | | | | 17,238,002 | |
Technology Opportunities | | | 1,900,000 | | | | 1,900,016 | | | | 1,938,000 | |
REPURCHASE AGREEMENTS — At February 29, 2016, the Principal Amounts of certain Funds’ interest in the Joint Repurchase Agreement Account II were as follows:
| | | | | | | | | | | | | | | | | | | | | | | | | | | | | | | | | | | | |
| Counterparty | | Interest
Rate | | | Capital
Growth | | | Concentrated
Growth | | | Dynamic U.S.
Equity | | | Flexible Cap
Growth | | | Focused
Growth | | | Small/Mid Cap
Growth | | | Strategic
Growth | | | Technology
Opportunities | |
BNP Paribas Securities Co. | | | 0.310 | % | | $ | 2,497,372 | | | $ | 1,333,824 | | | $ | 28,379 | | | $ | 28,379 | | | $ | 255,413 | | | $ | 11,834,139 | | | $ | 4,796,090 | | | $ | 539,205 | |
Citigroup Global Markets, Inc. | | | 0.320 | | | | 1,988,648 | | | | 1,062,119 | | | | 22,598 | | | | 22,598 | | | | 203,384 | | | | 9,423,481 | | | | 3,819,109 | | | | 429,367 | |
Merrill Lynch & Co., Inc. | | | 0.320 | | | | 2,140,341 | | | | 1,143,136 | | | | 24,323 | | | | 24,323 | | | | 218,899 | | | | 10,142,296 | | | | 4,110,426 | | | | 462,120 | |
Merrill Lynch & Co., Inc. | | | 0.300 | | | | 2,173,639 | | | | 1,160,921 | | | | 24,700 | | | | 24,700 | | | | 222,304 | | | | 10,300,084 | | | | 4,174,375 | | | | 469,308 | |
| TOTAL | | | | | | $ | 8,800,000 | | | $ | 4,700,000 | | | $ | 100,000 | | | $ | 100,000 | | | $ | 900,000 | | | $ | 41,700,000 | | | $ | 16,900,000 | | | $ | 1,900,000 | |
At February 29, 2016, the Joint Repurchase Agreement Account II was fully collateralized by:
| | | | | | | | |
| Issuer | | Interest Rates | | | Maturity Dates | |
Federal Home Loan Mortgage Corp. | | | 0.000% to 6.000 | % | | | 06/01/16 to 05/01/45 | |
Federal National Mortgage Association | | | 2.500 to 7.500 | | | | 08/01/18 to 02/01/46 | |
Government National Mortgage Association | | | 4.000 to 6.500 | | | | 07/15/24 to 05/15/45 | |
United States Treasury Inflation Protected Securities | | | 0.125 | | | | 04/15/17 | |
United States Treasury Stripped Securities | | | 0.000 | | | | 05/15/22 | |
United States Treasury Notes | | | 0.500 to 2.375 | | | | 01/31/17 to 08/15/25 | |
United States Treasury Bonds | | | 3.375 to 3.875 | | | | 08/15/40 to 05/15/44 | |
| | |
| The accompanying notes are an integral part of these financial statements. | | 77 |
GOLDMAN SACHS FUNDAMENTAL EQUITY GROWTH FUNDS
Statements of Assets and Liabilities
February 29, 2016 (Unaudited)
| | | | | | |
| | | | | Capital Growth
Fund | |
| | Assets: | | | | |
| | Investments of unaffiliated issuers, at value (cost $663,939,341, $127,239,059, $10,232,221, $13,468,806, $27,083,304, $3,111,204,944, $2,364,253,597, $337,202,290 and $270,884,885) | | $ | 812,400,493 | |
| | Investments of affiliated issuers, at value (cost $0, $0, $0, $0, $0, $82,010,369, $11,816,549, $0 and $0) | | | — | |
| | Cash | | | 79,854 | |
| | Receivables: | | | | |
| | Dividends and interest | | | 993,783 | |
| | Fund shares sold | | | 252,696 | |
| | Foreign tax reclaims | | | 44,457 | |
| | Reimbursement from investment adviser | | | 38,999 | |
| | Investments sold | | | — | |
| | Other assets | | | 11,658 | |
| | Total assets | | | 813,821,940 | |
| | | | | | |
| | Liabilities: | | | | |
| | Payables: | | | | |
| | Fund shares redeemed | | | 2,242,462 | |
| | Management fees | | | 450,605 | |
| | Distribution and Service fees and Transfer Agency fees | | | 275,049 | |
| | Investments purchased | | | — | |
| | Accrued expenses | | | 153,201 | |
| | Total liabilities | | | 3,121,317 | |
| | | | | | |
| | Net Assets: | | | | |
| | Paid-in capital | | | 664,014,698 | |
| | Undistributed (distributions in excess of) net investment income (loss) | | | 609,608 | |
| | Accumulated net realized gain (loss) | | | (2,384,835 | ) |
| | Net unrealized gain (loss) | | | 148,461,152 | |
| | | NET ASSETS | | $ | 810,700,623 | |
| | | Net Assets: | | | | |
| | | Class A | | $ | 603,733,960 | |
| | | Class C | | | 66,597,745 | |
| | | Institutional | | | 131,337,564 | |
| | | Service | | | 1,566,242 | |
| | | Class IR | | | 3,835,467 | |
| | | Class R | | | 3,620,797 | |
| | | Class R6 | | | 8,848 | |
| | | Total Net Assets | | $ | 810,700,623 | |
| | | Shares Outstanding $0.001 par value (unlimited number of shares authorized): | | | | |
| | | Class A | | | 27,839,334 | |
| | | Class C | | | 3,954,736 | |
| | | Institutional | | | 5,561,627 | |
| | | Service | | | 74,493 | |
| | | Class IR | | | 174,699 | |
| | | Class R | | | 171,745 | |
| | | Class R6 | | | 375 | |
| | | Net asset value, offering and redemption price per share:(a) | | | | |
| | | Class A | | | $21.69 | |
| | | Class C | | | 16.84 | |
| | | Institutional | | | 23.61 | |
| | | Service | | | 21.03 | |
| | | Class IR | | | 21.95 | |
| | | Class R | | | 21.08 | |
| | | Class R6 | | | 23.61 | |
| | (a) | | Maximum public offering price per share for Class A Shares of the Capital Growth, Concentrated Growth, Dynamic U.S. Equity, Flexible Cap Growth, Focus Growth, Growth Opportunities,Small/Mid Cap Growth, Strategic Growth and Technology Opportunities Funds is $22.95, $14.33, $12.29, $11.02, $13.62, $19.97, $18.10, $11.31 and $16.48, respectively. At redemption, Class C Shares may be subject to a contingent deferred sales charge, assessed on the amount equal to the lesser of the current net asset value (“NAV”) or the original purchase price of the shares. |
| | |
| 78 | | The accompanying notes are an integral part of these financial statements. |
GOLDMAN SACHS FUNDAMENTAL EQUITY GROWTH FUNDS
| | | | | | | | | | | | | | | | | | | | | | | | | | | | | | | | | | | | | | | | | | | | | | |
| | | Concentrated
Growth Fund | | | | | Dynamic U.S.
Equity Fund | | | | | Flexible Cap
Growth Fund | | | | | Focused
Growth Fund | | | | | Growth
Opportunities
Fund | | | | | Small/Mid Cap
Growth Fund | | | | | Strategic
Growth Fund | | | | | Technology
Opportunities
Fund | |
| | | | | | | | | | | | | | | | | | | | | | | | | | | | | | | | | | | | | | | | | | | | | | |
| | $ | 148,271,171 | | | | | $ | 10,824,906 | | | | | $ | 16,109,059 | | | | | $ | 27,032,056 | | | | | $ | 3,386,864,239 | | | | | $ | 2,487,391,288 | | | | | $ | 406,189,890 | | | | | $ | 355,239,037 | |
| | | — | | | | | | — | | | | | | — | | | | | | — | | | | | | 82,010,369 | | | | | | 5,900,428 | | | | | | — | | | | | | — | |
| | | 62,594 | | | | | | 26,033 | | | | | | 14,666 | | | | | | 32,000 | | | | | | 118,574 | | | | | | 81,009 | | | | | | 23,132 | | | | | | 92,460 | |
| | | | | | | | | | | | | | | | | | | | | | | | | | | | | | | | | | | | | | | | | | | | | | |
| | | 182,558 | | | | | | 22,475 | | | | | | 12,332 | | | | | | 18,300 | | | | | | 3,157,466 | | | | | | 1,317,291 | | | | | | 522,871 | | | | | | 94,703 | |
| | | 7,091 | | | | | | 7,765 | | | | | | 2,328 | | | | | | 30,378 | | | | | | 3,219,451 | | | | | | 4,393,863 | | | | | | 113,598 | | | | | | 298,866 | |
| | | 2,361 | | | | | | 233 | | | | | | — | | | | | | — | | | | | | — | | | | | | — | | | | | | 31,343 | | | | | | — | |
| | | 8,492 | | | | | | 37,661 | | | | | | 33,328 | | | | | | 54,183 | | | | | | 78,276 | | | | | | — | | | | | | 41,282 | | | | | | 44,861 | |
| | | 921,063 | | | | | | 214,976 | | | | | | 181,810 | | | | | | — | | | | | | 14,724,714 | | | | | | 29,757,346 | | | | | | 13,430,906 | | | | | | 752,514 | |
| | | 1,239 | | | | | | 40,367 | | | | | | 3,561 | | | | | | 3,027 | | | | | | 21,277 | | | | | | 9,903 | | | | | | 1,776 | | | | | | 1,861 | |
| | | 149,456,569 | | | | | | 11,174,416 | | | | | | 16,357,084 | | | | | | 27,169,944 | | | | | | 3,490,194,366 | | | | | | 2,528,851,128 | | | | | | 420,354,798 | | | | | | 356,524,302 | |
| | | | | | | | | | | | | | | | | | | | | | | | | | | | | | | | | | | | | | | | | | | | | | |
| | | | | | | | | | | | | | | | | | | | | | | | | | | | | | | | | | | | | | | | | | | | | | |
| | | | | | | | | | | | | | | | | | | | | | | | | | | | | | | | | | | | | | | | | | | | | | |
| | | 90,354 | | | | | | 1,000 | | | | | | 41,361 | | | | | | — | | | | | | 14,196,518 | | | | | | 5,812,335 | | | | | | 11,796,798 | | | | | | 616,685 | |
| | | 89,698 | | | | | | 6,072 | | | | | | 9,968 | | | | | | 16,187 | | | | | | 2,398,803 | | | | | | 1,645,063 | | | | | | 229,359 | | | | | | 273,661 | |
| | | 9,082 | | | | | | 1,574 | | | | | | 4,059 | | | | | | 1,165 | | | | | | 475,278 | | | | | | 582,168 | | | | | | 36,721 | | | | | | 119,323 | |
| | | 2,217,974 | | | | | | — | | | | | | — | | | | | | — | | | | | | 40,052,449 | | | | | | 16,196,949 | | | | | | 4,067,622 | | | | | | 671,725 | |
| | | 75,113 | | | | | | 76,652 | | | | | | 53,372 | | | | | | 73,816 | | | | | | 279,051 | | | | | | 141,982 | | | | | | 80,024 | | | | | | 143,777 | |
| | | 2,482,221 | | | | | | 85,298 | | | | | | 108,760 | | | | | | 91,168 | | | | | | 57,402,099 | | | | | | 24,378,497 | | | | | | 16,210,524 | | | | | | 1,825,171 | |
| | | | | | | | | | | | | | | | | | | | | | | | | | | | | | | | | | | | | | | | | | | | | | |
| | | | | | | | | | | | | | | | | | | | | | | | | | | | | | | | | | | | | | | | | | | | | | |
| | | 127,991,055 | | | | | | 11,010,096 | | | | | | 13,903,650 | | | | | | 27,324,052 | | | | | | 3,269,802,060 | | | | | | 2,470,934,665 | | | | | | 341,539,378 | | | | | | 265,201,241 | |
| | | 396,593 | | | | | | 20,377 | | | | | | (26,172 | ) | | | | | 92,509 | | | | | | (19,273,424 | ) | | | | | (7,792,881 | ) | | | | | 1,195,501 | | | | | | (2,687,733 | ) |
| | | (2,445,412 | ) | | | | | (534,040 | ) | | | | | (269,407 | ) | | | | | (286,537 | ) | | | | | (93,395,664 | ) | | | | | (75,890,723 | ) | | | | | (7,578,205 | ) | | | | | 7,831,471 | |
| | | 21,032,112 | | | | | | 592,685 | | | | | | 2,640,253 | | | | | | (51,248 | ) | | | | | 275,659,295 | | | | | | 117,221,570 | | | | | | 68,987,600 | | | | | | 84,354,152 | |
| | | $ | 146,974,348 | | | | | $ | 11,089,118 | | | | | $ | 16,248,324 | | | | | $ | 27,078,776 | | | | | $ | 3,432,792,267 | | | | | $ | 2,504,472,631 | | | | | $ | 404,144,274 | | | | | $ | 354,699,131 | |
| | | | | | | | | | | | | | | | | | | | | | | | | | | | | | | | | | | | | | | | | | | | | | | |
| | | $ | 6,367,296 | | | | | $ | 2,786,632 | | | | | $ | 6,329,289 | | | | | $ | 282,078 | | | | | $ | 658,229,461 | | | | | $ | 799,461,312 | | | | | $ | 44,684,360 | | | | | $ | 212,873,268 | |
| | | | 2,563,976 | | | | | | 287,358 | | | | | | 1,664,313 | | | | | | 239,769 | | | | | | 129,006,935 | | | | | | 240,384,269 | | | | | | 10,865,859 | | | | | | 47,149,084 | |
| | | | 137,666,025 | | | | | | 7,303,548 | | | | | | 8,145,297 | | | | | | 26,516,684 | | | | | | 2,400,000,004 | | | | | | 1,162,234,055 | | | | | | 347,538,909 | | | | | | 78,696,548 | |
| | | | — | | | | | | — | | | | | | — | | | | | | — | | | | | | 37,053,627 | | | | | | 11,878,041 | | | | | | 215,711 | | | | | | 10,398,018 | |
| | | | 340,416 | | | | | | 650,418 | | | | | | 61,519 | | | | | | 15,785 | | | | | | 134,680,963 | | | | | | 257,492,684 | | | | | | 760,686 | | | | | | 5,582,213 | |
| | | | 27,771 | | | | | | 52,503 | | | | | | 39,240 | | | | | | 15,464 | | | | | | 63,261,125 | | | | | | 32,233,807 | | | | | | 69,767 | | | | | | — | |
| | | | 8,864 | | | | |
| 8,659
|
| | | | | 8,666 | | | | | | 8,996 | | | | | | 10,560,152 | | | | | | 788,463 | | | | | | 8,982 | | | | | | — | |
| | | $ | 146,974,348 | | | | | $ | 11,089,118 | | | | | $ | 16,248,324 | | | | | $ | 27,078,776 | | | | | $ | 3,432,792,267 | | | | | $ | 2,504,472,631 | | | | | $ | 404,144,274 | | | | | $ | 354,699,131 | |
| | | | | | | | | | | | | | | | | | | | | | | | | | | | | | | | | | | | | | | | | | | | | | | |
| | | | 470,127 | | | | | | 239,974 | | | | | | 607,988 | | | | | | 21,925 | | | | | | 34,880,766 | | | | | | 46,764,097 | | | | | | 4,179,795 | | | | | | 13,671,912 | |
| | | | 221,155 | | | | | | 25,408 | | | | | | 174,613 | | | | | | 19,191 | | | | | | 8,948,382 | | | | | | 15,667,778 | | | | | | 1,205,940 | | | | | | 3,515,743 | |
| | | | 9,619,460 | | | | | | 625,778 | | | | | | 745,092 | | | | | | 2,037,320 | | | | | | 111,641,437 | | | | | | 64,718,377 | | | | | | 30,683,103 | | | | | | 4,675,902 | |
| | | | — | | | | | | — | | | | | | — | | | | | | — | | | | | | 2,035,024 | | | | | | 708,246 | | | | | | 20,264 | | | | | | 678,081 | |
| | | | 24,795 | | | | | | 55,736 | | | | | | 5,713 | | | | | | 1,214 | | | | | | 6,902,793 | | | | | | 14,682,189 | | | | | | 67,154 | | | | | | 334,848 | |
| | | | 2,105 | | | | | | 4,512 | | | | | | 3,871 | | | | | | 1,209 | | | | | | 3,460,651 | | | | | | 1,932,934 | | | | | | 6,602 | | | | | | — | |
| | | | 619 | | | | | | 742 | | | | | | 793 | | | | | | 691 | | | | | | 491,206 | | | | | | 43,894 | | | | | | 793 | | | | | | — | |
| | | | | | | | | | | | | | | | | | | | | | | | | | | | | | | | | | | | | | | | | | | | | | | |
| | | | $13.54 | | | | | | $11.61 | | | | | | $10.41 | | | | | | $12.87 | | | | | | $18.87 | | | | | | $17.10 | | | | | | $10.69 | | | | | | $15.57 | |
| | | | 11.59 | | | | | | 11.31 | | | | | | 9.53 | | | | | | 12.49 | | | | | | 14.42 | | | | | | 15.34 | | | | | | 9.01 | | | | | | 13.41 | |
| | | | 14.31 | | | | | | 11.67 | | | | | | 10.93 | | | | | | 13.02 | | | | | | 21.50 | | | | | | 17.96 | | | | | | 11.33 | | | | | | 16.83 | |
| | | | — | | | | | | — | | | | | | — | | | | | | — | | | | | | 18.21 | | | | | | 16.77 | | | | | | 10.65 | | | | | | 15.33 | |
| | | | 13.73 | | | | | | 11.67 | | | | | | 10.77 | | | | | | 13.00 | | | | | | 19.51 | | | | | | 17.54 | | | | | | 11.33 | | | | | | 16.67 | |
| | | | 13.20 | | | | | | 11.64 | | | | | | 10.14 | | | | | | 12.80 | | | | | | 18.28 | | | | | | 16.68 | | | | | | 10.57 | | | | | | — | |
| | | | 14.31 | | | | | | 11.67 | | | | | | 10.93 | | | | | | 13.02 | | | | | | 21.50 | | | | | | 17.96 | | | | | | 11.32 | | | | | | — | |
| | |
| The accompanying notes are an integral part of these financial statements. | | 79 |
GOLDMAN SACHS FUNDAMENTAL EQUITY GROWTH FUNDS
Statements of Operations
For the Six Months Ended February 29, 2016 (Unaudited)
| | | | | | |
| | | | | Capital Growth
Fund | |
| | Investment income: | |
| | Dividends — unaffiliated issuers (net of foreign withholding taxes of $0, $0, $0, $0, $0, $0, $9,043, $0 and $0) | | $ | 5,685,585 | |
| | Dividends — affiliated issuers | | | — | |
| | Interest | | | 6,139 | |
| | Total investment income | | | 5,691,724 | |
| | | | | | |
| | Expenses: | |
| | Management fees | | | 4,468,301 | |
| | Distribution and Service fees(a) | | | 1,182,053 | |
| | Transfer Agency fees(a) | | | 725,096 | |
| | Printing and mailing costs | | | 93,637 | |
| | Professional fees | | | 53,771 | |
| | Custody, accounting and administrative services | | | 45,390 | |
| | Registration fees | | | 43,713 | |
| | Trustee fees | | | 13,619 | |
| | Service Share fees — Service Plan | | | 2,190 | |
| | Service Share fees — Shareholder Administration Plan | | | 2,190 | |
| | Other | | | 15,396 | |
| | Total expenses | | | 6,645,356 | |
| | Less — expense reductions | | | (1,543,460 | ) |
| | Net expenses | | | 5,101,896 | |
| | NET INVESTMENT INCOME (LOSS) | | | 589,828 | |
| | | | | | |
| | Realized and unrealized gain (loss): | |
| | Net realized gain (loss) from: | | | | |
| | Investments — unaffiliated issuers (including commission recapture of $20,567, $5,558, $112, $209, $938, $135,666, $0, $11,090 and $4,261) | | | 2,150,778 | |
| | Investments — affiliated issuers | | | — | |
| | Net change in unrealized gain (loss) on: | | | | |
| | Investments — unaffiliated issuers | | | (46,653,626 | ) |
| | Investments — affiliated issuers | | | — | |
| | Net realized and unrealized loss | | | (44,502,848 | ) |
| | NET DECREASE IN NET ASSETS RESULTING FROM OPERATIONS | | $ | (43,913,020 | ) |
| | (a) | | Class specific Distribution and Service and Transfer Agency fees were as follows: |
| | | | | | | | | | | | | | | | | | | | | | | | | | | | | | | | | | | | | | | | |
| | | Distribution and Service Fees | | | Transfer Agency Fees | |
Fund | | Class A | | | Class C | | | Class R | | | Class A | | | Class C | | | Institutional | | | Service | | | Class IR | | | Class R | | | Class R6 | |
Capital Growth | | $ | 810,079 | | | $ | 362,994 | | | $ | 8,980 | | | $ | 615,660 | | | $ | 68,969 | | | $ | 32,682 | | | $ | 351 | | | $ | 4,020 | | | $ | 3,413 | | | $ | 1 | |
Concentrated Growth | | | 9,141 | | | | 15,953 | | | | 71 | | | | 6,947 | | | | 3,031 | | | | 30,089 | | | | — | | | | 323 | | | | 27 | | | | 1 | |
Dynamic U.S. Equity | | | 3,729 | | | | 1,646 | | | | 213 | | | | 2,834 | | | | 313 | | | | 1,853 | | | | — | | | | 646 | | | | 81 | | | | 1 | |
Flexible Cap Growth | | | 8,989 | | | | 8,888 | | | | 90 | | | | 6,832 | | | | 1,689 | | | | 1,684 | | | | — | | | | 182 | | | | 34 | | | | 1 | |
Focused Growth | | | 280 | | | | 774 | | | | 41 | | | | 213 | | | | 147 | | | | 6,309 | | | | — | | | | 16 | | | | 16 | | | | 1 | |
Growth Opportunities | | | 1,009,338 | | | | 753,025 | | | | 178,914 | | | | 767,097 | | | | 143,075 | | | | 563,665 | | | | 8,868 | | | | 149,415 | | | | 67,987 | | | | 800 | |
Small/Mid Cap Growth | | | 1,094,151 | | | | 1,301,025 | | | | 83,149 | | | | 831,555 | | | | 247,195 | | | | 261,186 | | | | 2,474 | | | | 246,835 | | | | 31,596 | | | | 23 | |
Strategic Growth | | | 56,708 | | | | 55,377 | | | | 180 | | | | 43,098 | | | | 10,522 | | | | 69,666 | | | | 47 | | | | 782 | | | | 68 | | | | 1 | |
Technology Opportunities | | | 309,557 | | | | 263,804 | | | | — | | | | 235,263 | | | | 50,123 | | | | 17,411 | | | | 2,174 | | | | 5,859 | | | | — | | | | — | |
| | |
| 80 | | The accompanying notes are an integral part of these financial statements. |
GOLDMAN SACHS FUNDAMENTAL EQUITY GROWTH FUNDS
| | | | | | | | | | | | | | | | | | | | | | | | | | | | | | | | | | | | | | | | | | | | | | |
| | | Concentrated
Growth Fund | | | | | Dynamic U.S.
Equity Fund | | | | | Flexible Cap
Growth Fund | | | | | Focused
Growth Fund | | | | | Growth
Opportunities
Fund | | | | | Small/Mid Cap
Growth Fund | | | | | Strategic
Growth Fund | | | | | Technology
Opportunities
Fund | |
| | | | | | | | | | | | | | | | | | | | | | | | | | | | | | | | | | | | | | | | | | | | | | |
| | $ | 1,086,317 | | | | | $ | 132,330 | | | | | $ | 87,814 | | | | | $ | 226,389 | | | | | $ | 19,244,098 | | | | | $ | 7,800,834 | | | | | $ | 2,858,608 | | | | | $ | 1,774,862 | |
| | | — | | | | | | — | | | | | | — | | | | | | — | | | | | | 22,578 | | | | | | — | | | | | | — | | | | | | — | |
| | | 2,898 | | | | | | 395 | | | | | | 312 | | | | | | 930 | | | | | | — | | | | | | 39,711 | | | | | | 13,384 | | | | | | 3,832 | |
| | | 1,089,215 | | | | | | 132,725 | | | | | | 88,126 | | | | | | 227,319 | | | | | | 19,266,676 | | | | | | 7,840,545 | | | | | | 2,871,992 | | | | | | 1,778,694 | |
| | | | | | | | | | | | | | | | | | | | | | | | | | | | | | | | | | | | | | | | | | | | | | |
| | | | | | | | | | | | | | | | | | | | | | | | | | | | | | | | | | | | | | | | | | | | | | |
| | | 806,624 | | | | | | 46,731 | | | | | | 88,126 | | | | | | 159,828 | | | | | | 19,253,660 | | | | | | 13,356,669 | | | | | | 2,029,544 | | | | | | 2,022,475 | |
| | | 25,165 | | | | | | 5,588 | | | | | | 17,967 | | | | | | 1,095 | | | | | | 1,941,277 | | | | | | 2,478,325 | | | | | | 112,265 | | | | | | 573,361 | |
| | | 40,418 | | | | | | 5,728 | | | | | | 10,422 | | | | | | 6,702 | | | | | | 1,700,907 | | | | | | 1,620,864 | | | | | | 124,184 | | | | | | 310,830 | |
| | | 24,465 | | | | | | 24,466 | | | | | | 21,563 | | | | | | 15,809 | | | | | | 245,028 | | | | | | 187,503 | | | | | | 34,680 | | | | | | 85,487 | |
| | | 43,399 | | | | | | 58,730 | | | | | | 42,673 | | | | | | 46,210 | | | | | | 45,971 | | | | | | 18,933 | | | | | | 44,860 | | | | | | 39,588 | |
| | | 19,328 | | | | | | 12,462 | | | | | | 26,503 | | | | | | 18,692 | | | | | | 111,645 | | | | | | 90,744 | | | | | | 35,513 | | | | | | 34,120 | |
| | | 23,580 | | | | | | 44,014 | | | | | | 37,260 | | | | | | 63,016 | | | | | | 110,791 | | | | | | 123,859 | | | | | | 54,266 | | | | | | 44,407 | |
| | | 11,615 | | | | | | 12,075 | | | | | | 11,682 | | | | | | 11,938 | | | | | | 18,830 | | | | | | 16,579 | | | | | | 12,663 | | | | | | 12,747 | |
| | | — | | | | | | — | | | | | | — | | | | | | — | | | | | | 55,421 | | | | | | 15,465 | | | | | | 292 | | | | | | 13,584 | |
| | | — | | | | | | — | | | | | | — | | | | | | — | | | | | | 55,421 | | | | | | 15,465 | | | | | | 292 | | | | | | 13,584 | |
| | | 6,651 | | | | | | 5,153 | | | | | | 4,506 | | | | | | 3,382 | | | | | | 56,483 | | | | | | 30,794 | | | | | | 6,957 | | | | | | 6,042 | |
| | | 1,001,245 | | | | | | 214,947 | | | | | | 260,702 | | | | | | 326,672 | | | | | | 23,595,434 | | | | | | 17,955,200 | | | | | | 2,455,516 | | | | | | 3,156,225 | |
| | | (303,269 | ) | | | | | (151,294 | ) | | | | | (163,224 | ) | | | | | (192,284 | ) | | | | | (1,415,567 | ) | | | | | (1,751,107 | ) | | | | | (769,387 | ) | | | | | (153,628 | ) |
| | | 697,976 | | | | | | 63,653 | | | | | | 97,478 | | | | | | 134,388 | | | | | | 22,179,867 | | | | | | 16,204,093 | | | | | | 1,686,129 | | | | | | 3,002,597 | |
| | | 391,239 | | | | | | 69,072 | | | | | | (9,352 | ) | | | | | 92,931 | | | | | | (2,913,191 | ) | | | | | (8,363,548 | ) | | | | | 1,185,863 | | | | | | (1,223,903 | ) |
| | | | | | | | | | | | | | | | | | | | | | | | | | | | | | | | | | | | | | | | | | | | | | |
| | | | | | | | | | | | | | | | | | | | | | | | | | | | | | | | | | | | | | | | | | | | | | |
| | | | | | | | | | | | | | | | | | | | | | | | | | | | | | | | | | | | | | | | | | | | | | |
| | | | | | | | | | | | | | | |
| | | (2,372,256 | ) | | | | | (177,887 | ) | | | | | 12,122 | | | | | | (198,819 | ) | | | | | 43,112,421 | | | | | | (60,418,546 | ) | | | | | (5,361,582 | ) | | | | | 10,137,863 | |
| | | — | | | | | | — | | | | | | — | | | | | | — | | | | | | — | | | | | | (98,602 | ) | | | | | — | | | | | | — | |
| | | | | | | | | | | | | | | | | | | | | | | | | | | | | | | | | | | | | | | | | | | | | | |
| | | (6,161,882 | ) | | | | | (625,166 | ) | | | | | (1,263,339 | ) | | | | | (1,296,252 | ) | | | | | (443,674,733 | ) | | | | | (353,167,835 | ) | | | | | (14,601,162 | ) | | | | | (30,252,076 | ) |
| | | — | | | | | | — | | | | | | — | | | | | | — | | | | | | — | | | | | | (6,983,404 | ) | | | | | — | | | | | | — | |
| | | (8,534,138 | ) | | | | | (803,053 | ) | | | | | (1,251,217 | ) | | | | | (1,495,071 | ) | | | | | (400,562,312 | ) | | | | | (420,668,387 | ) | | | | | (19,962,744 | ) | | | | | (20,114,213 | ) |
| | $ | (8,142,899 | ) | | | | $ | (733,981 | ) | | | | $ | (1,260,569 | ) | | | | $ | (1,402,140 | ) | | | | $ | (403,475,503 | ) | | | | $ | (429,031,935 | ) | | | | $ | (18,776,881 | ) | | | | $ | (21,338,116 | ) |
| | |
| The accompanying notes are an integral part of these financial statements. | | 81 |
GOLDMAN SACHS FUNDAMENTAL EQUITY GROWTH FUNDS
Statements of Changes in Net Assets
| | | | | | | | | | |
| | | | | Capital Growth Fund | |
| | | | | For the
Six Months Ended
February 29, 2016
(Unaudited) | | | For the Fiscal
Year Ended
August 31, 2015 | |
| | From operations: | | | | | | | | |
| | Net investment income (loss) | | $ | 589,828 | | | $ | 424,086 | |
| | Net realized gain (loss) | | | 2,150,778 | | | | 106,908,367 | |
| | Net change in unrealized gain (loss) | | | (46,653,626 | ) | | | (73,811,938 | ) |
| | Net increase (decrease) in net assets resulting from operations | | | (43,913,020 | ) | | | 33,520,515 | |
| | | | | | | | | | |
| | Distributions to shareholders: | | | | | | | | |
| | From net investment income | | | | | | | | |
| | Class A Shares | | | — | | | | — | |
| | Class C Shares | | | — | | | | — | |
| | Institutional Shares | | | (262,248 | ) | | | — | |
| | Service Shares | | | — | | | | — | |
| | Class IR Shares | | | (3,425 | ) | | | — | |
| | Class R Shares | | | — | | | | — | |
| | Class R6 Shares(a) | | | (18 | ) | | | — | |
| | From net realized gains | | | | | | | | |
| | Class A Shares | | | (53,960,447 | ) | | | (109,107,619 | ) |
| | Class C Shares | | | (7,608,296 | ) | | | (14,781,808 | ) |
| | Institutional Shares | | | (13,105,148 | ) | | | (22,936,412 | ) |
| | Service Shares | | | (152,819 | ) | | | (181,082 | ) |
| | Class IR Shares | | | (374,339 | ) | | | (451,620 | ) |
| | Class R Shares | | | (304,242 | ) | | | (557,137 | ) |
| | Class R6 Shares(a) | | | (712 | ) | | | — | |
| | Total distributions to shareholders | | | (75,771,694 | ) | | | (148,015,678 | ) |
| | | | | | | | | | |
| | From share transactions: | | | | | | | | |
| | Proceeds from sales of shares | | | 22,234,850 | | | | 82,471,266 | |
| | Reinvestment of distributions | | | 71,646,768 | | | | 140,089,222 | |
| | Cost of shares redeemed | | | (91,569,292 | ) | | | (134,901,119 | ) |
| | Net increase (decrease) in net assets resulting from share transactions | | | 2,312,326 | | | | 87,659,369 | |
| | TOTAL INCREASE (DECREASE) | | | (117,372,388 | ) | | | (26,835,794 | ) |
| | | | | | | | | | |
| | Net assets: | | | | | | | | |
| | Beginning of period | | | 928,073,011 | | | | 954,908,805 | |
| | End of period | | $ | 810,700,623 | | | $ | 928,073,011 | |
| | Undistributed net investment income | | $ | 609,608 | | | $ | 285,471 | |
| | (a) | | Commenced operations on July 31, 2015. |
| | |
| 82 | | The accompanying notes are an integral part of these financial statements. |
GOLDMAN SACHS FUNDAMENTAL EQUITY GROWTH FUNDS
| | | | | | | | | | | | | | | | | | | | | | |
| | | Concentrated Growth Fund | | | | | Dynamic U.S. Equity Fund | |
| | | For the
Six Months Ended
February 29, 2016
(Unaudited) | | | | | For the Fiscal
Year Ended
August 31, 2015 | | | | | For the
Six Months Ended
February 29, 2016
(Unaudited) | | | | | For the Fiscal
Year Ended
August 31, 2015 | |
| | | | | | | | | | | | | | | | | | | | | | |
| | $ | 391,239 | | | | | $ | 686,366 | | | | | $ | 69,072 | | | | | $ | 109,603 | |
| | | (2,372,256 | ) | | | | | 20,209,855 | | | | | | (177,887 | ) | | | | | 1,495,944 | |
| | | (6,161,882 | ) | | | | | (14,930,145 | ) | | | | | (625,166 | ) | | | | | (1,792,239 | ) |
| | | (8,142,899 | ) | | | | | 5,966,076 | | | | | | (733,981 | ) | | | | | (186,692 | ) |
| | | | | | | | | | | | | | | | | | | | | | |
| | | | | | | | | | | | | | | | | | | | | | |
| | | | | | | | | | | | | | | | | | | | | | |
| | | — | | | | | | — | | | | | | (17,622 | ) | | | | | (22,274 | ) |
| | | — | | | | | | — | | | | | | — | | | | | | — | |
| | | (373,404 | ) | | | | | (366,604 | ) | | | | | (103,664 | ) | | | | | (71,169 | ) |
| | | — | | | | | | — | | | | | | — | | | | | | — | |
| | | (483 | ) | | | | | (283 | ) | | | | | (2,981 | ) | | | | | (1,481 | ) |
| | | — | | | | | | — | | | | | | — | | | | | | (255 | ) |
| | | (26 | ) | | | | | — | | | | | | (102 | ) | | | | | — | |
| | | | | | | | | | | | | | | | | | | | | | |
| | | (842,410 | ) | | | | | (1,407,056 | ) | | | | | (290,672 | ) | | | | | (745,006 | ) |
| | | (395,561 | ) | | | | | (700,153 | ) | | | | | (33,918 | ) | | | | | (46,987 | ) |
| | | (16,282,694 | ) | | | | | (28,939,818 | ) | | | | | (976,319 | ) | | | | | (1,330,442 | ) |
| | | — | | | | | | — | | | | | | — | | | | | | — | |
| | | (36,485 | ) | | | | | (67,917 | ) | | | | | (40,105 | ) | | | | | (33,295 | ) |
| | | (3,309 | ) | | | | | (2,664 | ) | | | | | (5,478 | ) | | | | | (17,289 | ) |
| | | (1,002 | ) | | | | | — | | | | | | (901 | ) | | | | | — | |
| | | (17,935,374 | ) | | | | | (31,484,495 | ) | | | | | (1,471,762 | ) | | | | | (2,268,198 | ) |
| | | | | | | | | | | | | | | | | | | | | | |
| | | | | | | | | | | | | | | | | | | | | | |
| | | 4,475,773 | | | | | | 10,807,640 | | | | | | 1,088,694 | | | | | | 4,955,313 | |
| | | 17,572,645 | | | | | | 30,851,758 | | | | | | 1,161,930 | | | | | | 2,266,646 | |
| | | (15,980,319 | ) | | | | | (30,269,597 | ) | | | | | (4,179,001 | ) | | | | | (3,643,418 | ) |
| | | 6,068,099 | | | | | | 11,389,801 | | | | | | (1,928,377 | ) | | | | | 3,578,541 | |
| | | (20,010,174 | ) | | | | | (14,128,618 | ) | | | | | (4,134,120 | ) | | | | | 1,123,651 | |
| | | | | | | | | | | | | | | | | | | | | | |
| | | | | | | | | | | | | | | | | | | | | | |
| | | 166,984,522 | | | | | | 181,113,140 | | | | | | 15,223,238 | | | | | | 14,099,587 | |
| | $ | 146,974,348 | | | | | $ | 166,984,522 | | | | | $ | 11,089,118 | | | | | $ | 15,223,238 | |
| | $ | 396,593 | | | | | $ | 379,267 | | | | | $ | 20,377 | | | | | $ | 75,674 | |
| | |
| The accompanying notes are an integral part of these financial statements. | | 83 |
GOLDMAN SACHS FUNDAMENTAL EQUITY GROWTH FUNDS
Statements of Changes in Net Assets (continued)
| | | | | | | | | | |
| | | | | Flexible Cap Growth Fund | |
| | | | | For the
Six Months Ended
February 29, 2016
(Unaudited) | | | For the Fiscal
Year Ended
August 31, 2015 | |
| | From operations: | | | | | | | | |
| | Net investment income (loss) | | $ | (9,352 | ) | | $ | (29,361 | ) |
| | Net realized gain (loss) | | | 12,122 | | | | 1,341,552 | |
| | Net change in unrealized gain (loss) | | | (1,263,339 | ) | | | (561,111 | ) |
| | Net increase (decrease) in net assets resulting from operations | | | (1,260,569 | ) | | | 751,080 | |
| | | | | | | | | | |
| | Distributions to shareholders: | | | | | | | | |
| | From net investment income | | | | | | | | |
| | Class A Shares | | | — | | | | — | |
| | Class C Shares | | | — | | | | — | |
| | Institutional Shares | | | — | | | | — | |
| | Service Shares | | | — | | | | — | |
| | Class IR Shares | | | — | | | | — | |
| | Class R Shares | | | — | | | | — | |
| | Class R6 Shares(a) | | | — | | | | — | |
| | From net realized gains | | | | | | | | |
| | Class A Shares | | | (458,035 | ) | | | (897,010 | ) |
| | Class C Shares | | | (116,932 | ) | | | (182,809 | ) |
| | Institutional Shares | | | (497,675 | ) | | | (1,118,730 | ) |
| | Service Shares | | | — | | | | — | |
| | Class IR Shares | | | (13,475 | ) | | | (32,793 | ) |
| | Class R Shares | | | (2,254 | ) | | | (8,089 | ) |
| | Class R6 Shares(a) | | | (544 | ) | | | — | |
| | Total distributions to shareholders | | | (1,088,915 | ) | | | (2,239,431 | ) |
| | | | | | | | | | |
| | From share transactions: | | | | | | | | |
| | Proceeds from sales of shares | | | 2,372,311 | | | | 5,135,583 | |
| | Reinvestment of distributions | | | 1,088,915 | | | | 2,237,814 | |
| | Cost of shares redeemed | | | (2,594,996 | ) | | | (3,380,014 | ) |
| | Net increase (decrease) in net assets resulting from share transactions | | | 866,230 | | | | 3,993,383 | |
| | TOTAL INCREASE (DECREASE) | | | (1,483,254 | ) | | | 2,505,032 | |
| | | | | | | | | | |
| | Net assets: | | | | | | | | |
| | Beginning of period | | | 17,731,578 | | | | 15,226,546 | |
| | End of period | | $ | 16,248,324 | | | $ | 17,731,578 | |
| | Undistributed (distributions in excess of) net investment income (loss) | | $ | (26,172 | ) | | $ | (16,820 | ) |
| | (a) | | Commenced operations on July 31, 2015. |
| | |
| 84 | | The accompanying notes are an integral part of these financial statements. |
GOLDMAN SACHS FUNDAMENTAL EQUITY GROWTH FUNDS
| | | | | | | | | | | | | | | | | | | | | | |
| | Focused Growth Fund | | | | | Growth Opportunities Fund | |
| | | For the
Six Months Ended
February 29, 2016
(Unaudited) | | | | | For the Fiscal Year Ended August 31, 2015 | | | | | For the Six Months Ended
February 29, 2016
(Unaudited) | | | | | For the Fiscal Year Ended August 31, 2015 | |
| | | | | | | | | | | | | | | | | | | | | | |
| | $ | 92,931 | | | | | $ | 136,615 | | | | | $ | (2,913,191 | ) | | | | $ | (19,979,892 | ) |
| | | (198,819 | ) | | | | | 1,794,517 | | | | | | 43,112,421 | | | | | | 540,219,024 | |
| | | (1,296,252 | ) | | | | | (809,233 | ) | | | | | (443,674,733 | ) | | | | | (555,005,131 | ) |
| | | (1,402,140 | ) | | | | | 1,121,899 | | | | | | (403,475,503 | ) | | | | | (34,765,999 | ) |
| | | | | | | | | | | | | | | | | | | | | | |
| | | | | | | | | | | | | | | | | | | | | | |
| | | | | | | | | | | | | | | | | | | | | | |
| | | (451 | ) | | | | | — | | | | | | — | | | | | | — | |
| | | (262 | ) | | | | | — | | | | | | — | | | | | | — | |
| | | (76,800 | ) | | | | | (76,654 | ) | | | | | — | | | | | | — | |
| | | — | | | | | | — | | | | | | — | | | | | | — | |
| | | (21 | ) | | | | | (18 | ) | | | | | — | | | | | | — | |
| | | — | | | | | | — | | | | | | — | | | | | | — | |
| | | (24 | ) | | | | | — | | | | | | — | | | | | | — | |
| | | | | | | | | | | | | | | | | | | | | | |
| | | (14,231 | ) | | | | | (3,858 | ) | | | | | (97,819,693 | ) | | | | | (213,956,510 | ) |
| | | (14,215 | ) | | | | | (2,722 | ) | | | | | (23,532,031 | ) | | | | | (45,806,967 | ) |
| | | (1,744,722 | ) | | | | | (1,977,313 | ) | | | | | (309,058,210 | ) | | | | | (674,995,963 | ) |
| | | — | | | | | | — | | | | | | (5,746,888 | ) | | | | | (11,651,811 | ) |
| | | (872 | ) | | | | | (1,099 | ) | | | | | (18,674,510 | ) | | | | | (30,389,606 | ) |
| | | (868 | ) | | | | | (1,094 | ) | | | | | (9,066,946 | ) | | | | | (17,292,249 | ) |
| | | (495 | ) | | | | | — | | | | | | (1,081,229 | ) | | | | | — | |
| | | (1,852,961 | ) | | | | | (2,062,758 | ) | | | | | (464,979,507 | ) | | | | | (994,093,106 | ) |
| | | | | | | | | | | | | | | | | | | | | | |
| | | | | | | | | | | | | | | | | | | | | | |
| | | 1,429,601 | | | | | | 12,758,032 | | | | | | 404,303,821 | | | | | | 1,354,546,446 | |
| | | 1,852,961 | | | | | | 2,062,758 | | | | | | 390,089,513 | | | | | | 802,333,312 | |
| | | (6,527,109 | ) | | | | | (4,759,978 | ) | | | | | (1,077,896,809 | ) | | | | | (1,884,231,470 | ) |
| | | (3,244,547 | ) | | | | | 10,060,812 | | | | | | (283,503,475 | ) | | | | | 272,648,288 | |
| | | (6,499,648 | ) | | | | | 9,119,953 | | | | | | (1,151,958,485 | ) | | | | | (756,210,817 | ) |
| | | | | | | | | | | | | | | | | | | | | | |
| | | | | | | | | | | | | | | | | | | | | | |
| | | 33,578,424 | | | | | | 24,458,471 | | | | | | 4,584,750,752 | | | | | | 5,340,961,569 | |
| | $ | 27,078,776 | | | | | $ | 33,578,424 | | | | | $ | 3,432,792,267 | | | | | $ | 4,584,750,752 | |
| | $ | 92,509 | | | | | $ | 77,136 | | | | | $ | (19,273,424 | ) | | | | $ | (16,360,233 | ) |
| | |
| The accompanying notes are an integral part of these financial statements. | | 85 |
GOLDMAN SACHS FUNDAMENTAL EQUITY GROWTH FUNDS
Statements of Changes in Net Assets (continued)
| | | | | | | | | | |
| | | | | Small/Mid Cap Growth Fund | |
| | | | | For the
Six Months Ended
February 29, 2016
(Unaudited) | | | For the Fiscal
Year Ended
August 31, 2015 | |
| | From operations: | | | | | | | | |
| | Net investment income (loss) | | $ | (8,363,548 | ) | | $ | (18,094,472 | ) |
| | Net realized gain (loss) | | | (60,517,148 | ) | | | 158,512,531 | |
| | Net change in unrealized gain (loss) | | | (360,151,239 | ) | | | 23,699,445 | |
| | Net increase (decrease) in net assets resulting from operations | | | (429,031,935 | ) | | | 164,117,504 | |
| | | | | | | | | | |
| | Distributions to shareholders: | | | | | | | | |
| | From net investment income | | | | | | | | |
| | Class A Shares | | | — | | | | — | |
| | Class C Shares | | | — | | | | — | |
| | Institutional Shares | | | — | | | | — | |
| | Service Shares | | | — | | | | — | |
| | Class IR Shares | | | — | | | | — | |
| | Class R Shares | | | — | | | | — | |
| | Class R6 Shares(a) | | | — | | | | — | |
| | From net realized gains | | | | | | | | |
| | Class A Shares | | | (33,875,139 | ) | | | (59,422,373 | ) |
| | Class C Shares | | | (10,986,288 | ) | | | (19,729,913 | ) |
| | Institutional Shares | | | (47,806,277 | ) | | | (89,205,827 | ) |
| | Service Shares | | | (475,742 | ) | | | (662,911 | ) |
| | Class IR Shares | | | (10,051,807 | ) | | | (13,778,175 | ) |
| | Class R Shares | | | (1,254,158 | ) | | | (2,780,547 | ) |
| | Class R6 Shares(a) | | | (313 | ) | | | — | |
| | Total distributions to shareholders | | | (104,449,724 | ) | | | (185,579,746 | ) |
| | | | | | | | | | |
| | From share transactions: | | | | | | | | |
| | Proceeds from sales of shares | | | 662,547,689 | | | | 1,088,106,213 | |
| | Reinvestment of distributions | | | 93,324,634 | | | | 164,354,586 | |
| | Cost of shares redeemed | | | (516,445,352 | ) | | | (691,041,765 | ) |
| | Net increase (decrease) in net assets resulting from share transactions | | | 239,426,971 | | | | 561,419,034 | |
| | TOTAL INCREASE (DECREASE) | | | (294,054,688 | ) | | | 539,956,792 | |
| | | | | | | | | | |
| | Net assets: | | | | | | | | |
| | Beginning of period | | | 2,798,527,319 | | | | 2,258,570,527 | |
| | End of period | | $ | 2,504,472,631 | | | $ | 2,798,527,319 | |
| | Undistributed (distributions in excess of) net investment income (loss) | | $ | (7,792,881 | ) | | $ | 570,667 | |
| | (a) | | Commenced operations on July 31, 2015. |
| | |
| 86 | | The accompanying notes are an integral part of these financial statements. |
GOLDMAN SACHS FUNDAMENTAL EQUITY GROWTH FUNDS
| | | | | | | | | | | | | | | | | | | | | | |
| | | Strategic Growth Fund | | | | | Technology Opportunities Fund | |
| | | For the
Six Months Ended
February 29, 2016
(Unaudited) | | | | | For the Fiscal
Year Ended
August 31, 2015 | | | | | For the
Six Months Ended
February 29, 2016
(Unaudited) | | | | | For the Fiscal
Year Ended
August 31, 2015 | |
| | | | | | | | | | | | | | | | | | | | | | |
| | $ | 1,185,863 | | | | | $ | 1,796,891 | | | | | $ | (1,223,903 | ) | | | | $ | (3,232,312 | ) |
| | | (5,361,582 | ) | | | | | 29,207,245 | | | | | | 10,137,863 | | | | | | 45,968,161 | |
| | | (14,601,162 | ) | | | | | (15,744,519 | ) | | | | | (30,252,076 | ) | | | | | (33,789,050 | ) |
| | | (18,776,881 | ) | | | | | 15,259,617 | | | | | | (21,338,116 | ) | | | | | 8,946,799 | |
| | | | | | | | | | | | | | | | | | | | | | |
| | | | | | | | | | | | | | | | | | | | | | |
| | | | | | | | | | | | | | | | | | | | | | |
| | | (72,760 | ) | | | | | — | | | | | | — | | | | | | — | |
| | | — | | | | | | — | | | | | | — | | | | | | — | |
| | | (1,396,604 | ) | | | | | (991,937 | ) | | | | | — | | | | | | — | |
| | | (299 | ) | | | | | — | | | | | | — | | | | | | — | |
| | | (2,572 | ) | | | | | (1,531 | ) | | | | | — | | | | | | — | |
| | | (106 | ) | | | | | — | | | | | | — | | | | | | — | |
| | | (42 | ) | | | | | — | | | | | | — | | | | | | — | |
| | | | | | | | | | | | | | | | | | | | | | |
| | | (2,662,084 | ) | | | | | (7,853,382 | ) | | | | | (21,931,581 | ) | | | | | (19,398,872 | ) |
| | | (747,201 | ) | | | | | (2,031,017 | ) | | | | | (5,298,231 | ) | | | | | (4,987,729 | ) |
| | | (18,504,227 | ) | | | | | (47,665,788 | ) | | | | | (6,969,643 | ) | | | | | (7,490,876 | ) |
| | | (12,977 | ) | | | | | (26,879 | ) | | | | | (975,553 | ) | | | | | (853,327 | ) |
| | | (47,249 | ) | | | | | (147,162 | ) | | | | | (511,029 | ) | | | | | (226,844 | ) |
| | | (4,036 | ) | | | | | (2,673 | ) | | | | | — | | | | | | — | |
| | | (516 | ) | | | | | — | | | | | | — | | | | | | — | |
| | | (23,450,673 | ) | | | | | (58,720,369 | ) | | | | | (35,686,037 | ) | | | | | (32,957,648 | ) |
| | | | | | | | | | | | | | | | | | | | | | |
| | | | | | | | | | | | | | | | | | | | | | |
| | | 84,720,514 | | | | | | 85,773,465 | | | | | | 39,614,252 | | | | | | 106,814,338 | |
| | | 22,818,630 | | | | | | 56,900,752 | | | | | | 32,425,459 | | | | | | 29,561,009 | |
| | | (45,164,143 | ) | | | | | (112,960,044 | ) | | | | | (72,874,062 | ) | | | | | (136,669,644 | ) |
| | | 62,375,001 | | | | | | 29,714,173 | | | | | | (834,351 | ) | | | | | (294,297 | ) |
| | | 20,147,447 | | | | | | (13,746,579 | ) | | | | | (57,858,504 | ) | | | | | (24,305,146 | ) |
| | | | | | | | | | | | | | | | | | | | | | |
| | | | | | | | | | | | | | | | | | | | | | |
| | | 383,996,827 | | | | | | 397,743,406 | | | | | | 412,557,635 | | | | | | 436,862,781 | |
| | $ | 404,144,274 | | | | | $ | 383,996,827 | | | | | $ | 354,699,131 | | | | | $ | 412,557,635 | |
| | $ | 1,195,501 | | | | | $ | 1,482,021 | | | | | $ | (2,687,733 | ) | | | | $ | (1,463,830 | ) |
| | |
| The accompanying notes are an integral part of these financial statements. | | 87 |
GOLDMAN SACHS CAPITAL GROWTH FUND
Financial Highlights
Selected Data for a Share Outstanding Throughout Each Period
| | | | | | | | | | | | | | | | | | | | | | | | | | | | | | |
| | | | | | Income (loss) from
investment operations | | | Distributions
to shareholders | |
| | | Year - Share Class | |
Net asset
value,
beginning
of period | | | Net
investment
income (loss)(a) | | | Net realized
and unrealized
gain (loss) | | | Total from
investment
operations | | | From net
investment
income | | | From net
realized
gains | | | Total
distributions | |
| | FOR THE SIX MONTHS ENDED FEBRUARY 29, (UNAUDITED) | |
| | 2016 - A | | $ | 24.80 | | | $ | 0.01 | (d) | | $ | (1.07 | ) | | $ | (1.06 | ) | | $ | — | | | $ | (2.05 | ) | | $ | (2.05 | ) |
| | 2016 - C | | | 19.77 | | | | (0.06 | )(d) | | | (0.82 | ) | | | (0.88 | ) | | | — | | | | (2.05 | ) | | | (2.05 | ) |
| | 2016 - Institutional | | | 26.82 | | | | 0.07 | (d) | | | (1.19 | ) | | | (1.12 | ) | | | (0.04 | ) | | | (2.05 | ) | | | (2.09 | ) |
| | 2016 - Service | | | 24.12 | | | | — | (d)(f) | | | (1.04 | ) | | | (1.04 | ) | | | — | | | | (2.05 | ) | | | (2.05 | ) |
| | 2016 - IR | | | 25.07 | | | | 0.04 | (d) | | | (1.09 | ) | | | (1.05 | ) | | | (0.02 | ) | | | (2.05 | ) | | | (2.07 | ) |
| | 2016 - R | | | 24.19 | | | | (0.01 | )(d) | | | (1.05 | ) | | | (1.06 | ) | | | — | | | | (2.05 | ) | | | (2.05 | ) |
| | 2016 - R6 | | | 26.82 | | | | 0.07 | (d) | | | (1.18 | ) | | | (1.11 | ) | | | (0.05 | ) | | | (2.05 | ) | | | (2.10 | ) |
| | | | | | | | | | | | | | | | | | | | | | | | | | | | | | |
| | FOR THE FISCAL YEARS ENDED AUGUST 31, | |
| | 2015 - A | | | 28.16 | | | | 0.01 | | | | 1.00 | | | | 1.01 | | | | — | | | | (4.37 | ) | | | (4.37 | ) |
| | 2015 - C | | | 23.45 | | | | (0.15 | ) | | | 0.84 | | | | 0.69 | | | | — | | | | (4.37 | ) | | | (4.37 | ) |
| | 2015 - Institutional | | | 30.01 | | | | 0.12 | | | | 1.06 | | | | 1.18 | | | | — | | | | (4.37 | ) | | | (4.37 | ) |
| | 2015 - Service | | | 27.53 | | | | (0.02 | ) | | | 0.98 | | | | 0.96 | | | | — | | | | (4.37 | ) | | | (4.37 | ) |
| | 2015 - IR | | | 28.36 | | | | 0.07 | | | | 1.01 | | | | 1.08 | | | | — | | | | (4.37 | ) | | | (4.37 | ) |
| | 2015 - R | | | 27.64 | | | | (0.06 | ) | | | 0.98 | | | | 0.92 | | | | — | | | | (4.37 | ) | | | (4.37 | ) |
| | 2015 - R6 (Commenced July 31, 2015) | | | 28.86 | | | | 0.01 | | | | (2.05 | ) | | | (2.04 | ) | | | — | | | | — | | | | — | |
| | 2014 - A | | | 28.13 | | | | (0.01 | ) | | | 6.41 | | | | 6.40 | | | | (0.08 | ) | | | (6.29 | ) | | | (6.37 | ) |
| | 2014 - C | | | 24.46 | | | | (0.18 | ) | | | 5.46 | | | | 5.28 | | | | — | | | | (6.29 | ) | | | (6.29 | ) |
| | 2014 - Institutional | | | 29.57 | | | | 0.10 | | | | 6.79 | | | | 6.89 | | | | (0.16 | ) | | | (6.29 | ) | | | (6.45 | ) |
| | 2014 - Service | | | 27.62 | | | | (0.04 | ) | | | 6.29 | | | | 6.25 | | | | (0.05 | ) | | | (6.29 | ) | | | (6.34 | ) |
| | 2014 - IR | | | 28.28 | | | | 0.06 | | | | 6.44 | | | | 6.50 | | | | (0.13 | ) | | | (6.29 | ) | | | (6.42 | ) |
| | 2014 - R | | | 27.75 | | | | (0.08 | ) | | | 6.31 | | | | 6.23 | | | | (0.05 | ) | | | (6.29 | ) | | | (6.34 | ) |
| | 2013 - A | | | 24.40 | | | | 0.10 | (g) | | | 3.66 | | | | 3.76 | | | | (0.03 | ) | | | — | | | | (0.03 | ) |
| | 2013 - C | | | 21.35 | | | | (0.08 | )(g) | | | 3.19 | | | | 3.11 | | | | — | | | | — | | | | — | |
| | 2013 - Institutional | | | 25.64 | | | | 0.21 | (g) | | | 3.84 | | | | 4.05 | | | | (0.12 | ) | | | — | | | | (0.12 | ) |
| | 2013 - Service | | | 23.96 | | | | 0.07 | (g) | | | 3.60 | | | | 3.67 | | | | (0.01 | ) | | | — | | | | (0.01 | ) |
| | 2013 - IR | | | 24.53 | | | | 0.18 | (g) | | | 3.67 | | | | 3.85 | | | | (0.10 | ) | | | — | | | | (0.10 | ) |
| | 2013 - R | | | 24.14 | | | | 0.03 | (g) | | | 3.62 | | | | 3.65 | | | | (0.04 | ) | | | — | | | | (0.04 | ) |
| | 2012 - A | | | 20.49 | | | | 0.02 | | | | 3.93 | | | | 3.95 | | | | (0.04 | ) | | | — | | | | (0.04 | ) |
| | 2012 - C | | | 18.03 | | | | (0.13 | ) | | | 3.45 | | | | 3.32 | | | | — | | | | — | | | | — | |
| | 2012 - Institutional | | | 21.54 | | | | 0.10 | | | | 4.12 | | | | 4.22 | | | | (0.12 | ) | | | — | | | | (0.12 | ) |
| | 2012 - Service | | | 20.13 | | | | — | (f) | | | 3.85 | | | | 3.85 | | | | (0.02 | ) | | | — | | | | (0.02 | ) |
| | 2012 - IR | | | 20.66 | | | | 0.08 | | | | 3.93 | | | | 4.01 | | | | (0.14 | ) | | | — | | | | (0.14 | ) |
| | 2012 - R | | | 20.31 | | | | (0.03 | ) | | | 3.88 | | | | 3.85 | | | | (0.02 | ) | | | — | | | | (0.02 | ) |
| | 2011 - A | | | 17.68 | | | | 0.03 | | | | 2.78 | | | | 2.81 | | | | — | | | | — | | | | — | |
| | 2011 - C | | | 15.68 | | | | (0.12 | ) | | | 2.47 | | | | 2.35 | | | | — | | | | — | | | | — | |
| | 2011 - Institutional | | | 18.57 | | | | 0.12 | | | | 2.91 | | | | 3.03 | | | | (0.06 | ) | | | — | | | | (0.06 | ) |
| | 2011 - Service | | | 17.39 | | | | 0.01 | | | | 2.73 | | | | 2.74 | | | | — | | | | — | | | | — | |
| | 2011 - IR | | | 17.81 | | | | 0.31 | | | | 2.58 | | | | 2.89 | | | | (0.04 | ) | | | — | | | | (0.04 | ) |
| | 2011 - R | | | 17.57 | | | | (0.03 | ) | | | 2.77 | | | | 2.74 | | | | — | | | | — | | | | — | |
| | (a) | | Calculated based on the average shares outstanding methodology. |
| | (b) | | Assumes investment at the NAV at the beginning of the period, reinvestment of all dividends and distributions, a complete redemption of the investment at the NAV at the end of the period and no sales or redemption charges. Total returns would be reduced if a sales or redemption charge was taken into account. Returns do not reflect the deduction of taxes that a shareholder would pay on Fund distributions or the redemption of Fund shares. Total returns for periods less than one full year are not annualized. |
| | (c) | | The Fund’s portfolio turnover rate is calculated in accordance with regulatory requirements, without regard to transactions involving short term investments. If such transactions were included, the Fund’s portfolio turnover rate may be higher. |
| | (d) | | Reflects income recognized from special dividends which amounted to $0.02 per share and 0.13% of average net assets. |
| | (f) | | Amount is less than $0.005 per share. |
| | (g) | | Reflects income recognized from special dividends which amounted to $0.06 per share and 0.21% of average net assets. |
| | |
| 88 | | The accompanying notes are an integral part of these financial statements. |
GOLDMAN SACHS CAPITAL GROWTH FUND
| | | | | | | | | | | | | | | | | | | | | | | | | | | | | | | | | | | | | | | | |
| | | | | | | | | | | | | |
| | | Net asset
value, end
of period | | | | | Total
return(b) | | | | | Net assets,
end of
period
(in 000s) | | | | | Ratio of
net expenses
to average
net assets | | | | | Ratio of
total expenses
to average
net assets | | | | | Ratio of
net investment
income (loss)
to average
net assets | | | | | Portfolio
turnover
rate(c) | |
| | | | | | | | | | | | | | | | | | | | | | | | | | | | | | | | | | | | | | | | |
| | $ | 21.69 | | | | | | (4.97 | )% | | | | $ | 603,734 | | | | | | 1.16 | %(e) | | | | | 1.50 | %(e) | | | | | 0.12 | %(d)(e) | | | | | 23 | % |
| | | 16.84 | | | | | | (5.35 | ) | | | | | 66,598 | | | | | | 1.91 | (e) | | | | | 2.25 | (e) | | | | | (0.63 | )(d)(e) | | | | | 23 | |
| | | 23.61 | | | | | | (4.83 | ) | | | | | 131,338 | | | | | | 0.75 | (e) | | | | | 1.10 | (e) | | | | | 0.51 | (d)(e) | | | | | 23 | |
| | | 21.03 | | | | | | (5.03 | ) | | | | | 1,566 | | | | | | 1.26 | (e) | | | | | 1.60 | (e) | | | | | 0.02 | (d)(e) | | | | | 23 | |
| | | 21.95 | | | | | | (4.89 | ) | | | | | 3,835 | | | | | | 0.90 | (e) | | | | | 1.25 | (e) | | | | | 0.36 | (d)(e) | | | | | 23 | |
| | | 21.08 | | | | | | (5.10 | ) | | | | | 3,621 | | | | | | 1.41 | (e) | | | | | 1.75 | (e) | | | | | (0.12 | )(d)(e) | | | | | 23 | |
| | | 23.61 | | | | | | (4.80 | ) | | | | | 9 | | | | | | 0.73 | (e) | | | | | 1.07 | (e) | | | | | 0.55 | (d)(e) | | | | | 23 | |
| | | | | | | | | | | | | | | | | | | | | | | | | | | | | | | | | | | | | | | | |
| | | | | | | | | | | | | | | | | | | | | | | | | | | | | | | | | | | | | | | | |
| | | 24.80 | | | | | | 3.34 | | | | | | 669,345 | | | | | | 1.15 | | | | | | 1.49 | | | | | | 0.04 | | | | | | 55 | |
| | | 19.77 | | | | | | 2.55 | | | | | | 75,941 | | | | | | 1.90 | | | | | | 2.25 | | | | | | (0.71 | ) | | | | | 55 | |
| | | 26.82 | | | | | | 3.75 | | | | | | 173,539 | | | | | | 0.75 | | | | | | 1.09 | | | | | | 0.44 | | | | | | 55 | |
| | | 24.12 | | | | | | 3.23 | | | | | | 1,917 | | | | | | 1.25 | | | | | | 1.60 | | | | | | (0.08 | ) | | | | | 55 | |
| | | 25.07 | | | | | | 3.59 | | | | | | 3,823 | | | | | | 0.90 | | | | | | 1.24 | | | | | | 0.28 | | | | | | 55 | |
| | | 24.19 | | | | | | 3.05 | | | | | | 3,500 | | | | | | 1.40 | | | | | | 1.74 | | | | | | (0.21 | ) | | | | | 55 | |
| | | 26.82 | | | | | | (7.07 | ) | | | | | 9 | | | | | | 0.76 | (e) | | | | | 1.11 | (e) | | | | | 0.54 | (e) | | | | | 55 | |
| | | 28.16 | | | | | | 25.50 | | | | | | 702,534 | | | | | | 1.16 | | | | | | 1.51 | | | | | | (0.05 | ) | | | | | 75 | |
| | | 23.45 | | | | | | 24.57 | | | | | | 81,954 | | | | | | 1.91 | | | | | | 2.26 | | | | | | (0.80 | ) | | | | | 75 | |
| | | 30.01 | | | | | | 26.03 | | | | | | 147,642 | | | | | | 0.76 | | | | | | 1.11 | | | | | | 0.35 | | | | | | 75 | |
| | | 27.53 | | | | | | 25.39 | | | | | | 1,135 | | | | | | 1.26 | | | | | | 1.61 | | | | | | (0.15 | ) | | | | | 75 | |
| | | 28.36 | | | | | | 25.80 | | | | | | 2,951 | | | | | | 0.91 | | | | | | 1.26 | | | | | | 0.20 | | | | | | 75 | |
| | | 27.64 | | | | | | 25.18 | | | | | | 3,571 | | | | | | 1.41 | | | | | | 1.76 | | | | | | (0.30 | ) | | | | | 75 | |
| | | 28.13 | | | | | | 15.41 | | | | | | 630,495 | | | | | | 1.14 | | | | | | 1.50 | | | | | | 0.38 | (g) | | | | | 52 | |
| | | 24.46 | | | | | | 14.57 | | | | | | 75,375 | | | | | | 1.89 | | | | | | 2.25 | | | | | | (0.37 | )(g) | | | | | 52 | |
| | | 29.57 | | | | | | 15.89 | | | | | | 124,795 | | | | | | 0.74 | | | | | | 1.10 | | | | | | 0.75 | (g) | | | | | 52 | |
| | | 27.62 | | | | | | 15.32 | | | | | | 980 | | | | | | 1.24 | | | | | | 1.60 | | | | | | 0.27 | (g) | | | | | 52 | |
| | | 28.28 | | | | | | 15.75 | | | | | | 2,112 | | | | | | 0.89 | | | | | | 1.25 | | | | | | 0.67 | (g) | | | | | 52 | |
| | | 27.75 | | | | | | 15.15 | | | | | | 2,480 | | | | | | 1.39 | | | | | | 1.75 | | | | | | 0.13 | (g) | | | | | 52 | |
| | | 24.40 | | | | | | 19.24 | | | | | | 662,127 | | | | | | 1.14 | | | | | | 1.48 | | | | | | 0.09 | | | | | | 55 | |
| | | 21.35 | | | | | | 18.36 | | | | | | 73,162 | | | | | | 1.89 | | | | | | 2.23 | | | | | | (0.66 | ) | | | | | 55 | |
| | | 25.64 | | | | | | 19.64 | | | | | | 83,466 | | | | | | 0.74 | | | | | | 1.08 | | | | | | 0.42 | | | | | | 55 | |
| | | 23.96 | | | | | | 19.08 | | | | | | 1,072 | | | | | | 1.24 | | | | | | 1.58 | | | | | | (0.02 | ) | | | | | 55 | |
| | | 24.53 | | | | | | 19.48 | | | | | | 2,415 | | | | | | 0.89 | | | | | | 1.23 | | | | | | 0.36 | | | | | | 55 | |
| | | 24.14 | | | | | | 18.92 | | | | | | 1,475 | | | | | | 1.39 | | | | | | 1.73 | | | | | | (0.12 | ) | | | | | 55 | |
| | | 20.49 | | | | | | 15.89 | | | | | | 662,256 | | | | | | 1.14 | | | | | | 1.47 | | | | | | 0.13 | | | | | | 58 | |
| | | 18.03 | | | | | | 14.99 | | | | | | 72,314 | | | | | | 1.89 | | | | | | 2.22 | | | | | | (0.62 | ) | | | | | 58 | |
| | | 21.54 | | | | | | 16.33 | | | | | | 299,223 | | | | | | 0.74 | | | | | | 1.07 | | | | | | 0.53 | | | | | | 58 | |
| | | 20.13 | | | | | | 15.76 | | | | | | 953 | | | | | | 1.24 | | | | | | 1.57 | | | | | | 0.03 | | | | | | 58 | |
| | | 20.66 | | | | | | 16.20 | | | | | | 1,472 | | | | | | 0.89 | | | | | | 1.22 | | | | | | 1.64 | | | | | | 58 | |
| | | 20.31 | | | | | | 15.59 | | | | | | 567 | | | | | | 1.39 | | | | | | 1.72 | | | | | | (0.12 | ) | | | | | 58 | |
| | |
| The accompanying notes are an integral part of these financial statements. | | 89 |
GOLDMAN SACHS CONCENTRATED GROWTH FUND
Financial Highlights
Selected Data for a Share Outstanding Throughout Each Period
| | | | | | | | | | | | | | | | | | | | | | | | | | | | | | |
| | | | | | Income (loss) from
investment operations | | | Distributions
to shareholders | |
| | | Year - Share Class | | Net asset
value,
beginning
of period | | | Net
investment
income (loss)(a) | | | Net realized
and unrealized
gain (loss) | | | Total from
investment
operations | | | From net
investment
income | | | From net
realized
gains | | | Total
distributions | |
| | FOR THE SIX MONTHS ENDED FEBRUARY 29, (UNAUDITED) | | | | | | | | | | | | | |
| | 2016 - A | | $ | 16.06 | | | $ | 0.01 | (d) | | $ | (0.72 | ) | | $ | (0.71 | ) | | $ | — | | | $ | (1.81 | ) | | $ | (1.81 | ) |
| | 2016 - C | | | 14.05 | | | | (0.04 | )(d) | | | (0.61 | ) | | | (0.65 | ) | | | — | | | | (1.81 | ) | | | (1.81 | ) |
| | 2016 - Institutional | | | 16.88 | | | | 0.04 | (d) | | | (0.76 | ) | | | (0.72 | ) | | | (0.04 | ) | | | (1.81 | ) | | | (1.85 | ) |
| | 2016 - IR | | | 16.26 | | | | 0.03 | (d) | | | (0.73 | ) | | | (0.70 | ) | | | (0.02 | ) | | | (1.81 | ) | | | (1.83 | ) |
| | 2016 - R | | | 15.71 | | | | (0.01 | )(d) | | | (0.69 | ) | | | (0.70 | ) | | | — | | | | (1.81 | ) | | | (1.81 | ) |
| | 2016 - R6 | | | 16.88 | | | | 0.04 | (d) | | | (0.76 | ) | | | (0.72 | ) | | | (0.04 | ) | | | (1.81 | ) | | | (1.85 | ) |
| | | | | | | | | | | | | | | | | | | | | | | | | | | | | | |
| | FOR THE FISCAL YEARS ENDED AUGUST 31, | | | | | | | | | | | | | |
| | 2015 - A | | | 18.94 | | | | — | (f)(g) | | | 0.55 | | | | 0.55 | | | | — | | | | (3.43 | ) | | | (3.43 | ) |
| | 2015 - C | | | 17.09 | | | | (0.11 | )(g) | | | 0.50 | | | | 0.39 | | | | — | | | | (3.43 | ) | | | (3.43 | ) |
| | 2015 - Institutional | | | 19.71 | | | | 0.08 | (g) | | | 0.57 | | | | 0.65 | | | | (0.05 | ) | | | (3.43 | ) | | | (3.48 | ) |
| | 2015 - IR | | | 19.10 | | | | 0.05 | (g) | | | 0.56 | | | | 0.61 | | | | (0.02 | ) | | | (3.43 | ) | | | (3.45 | ) |
| | 2015 - R | | | 18.64 | | | | (0.05 | )(g) | | | 0.55 | | | | 0.50 | | | | — | | | | (3.43 | ) | | | (3.43 | ) |
| | 2015 - R6 (Commenced July 31, 2015) | | | 18.04 | | | | 0.01 | (g) | | | (1.17 | ) | | | (1.16 | ) | | | — | | | | — | | | | — | |
| | 2014 - A | | | 17.05 | | | | (0.06 | ) | | | 3.78 | | | | 3.72 | | | | — | | | | (1.83 | ) | | | (1.83 | ) |
| | 2014 - C | | | 15.65 | | | | (0.17 | ) | | | 3.44 | | | | 3.27 | | | | — | | | | (1.83 | ) | | | (1.83 | ) |
| | 2014 - Institutional | | | 17.63 | | | | 0.02 | | | | 3.92 | | | | 3.94 | | | | (0.03 | ) | | | (1.83 | ) | | | (1.86 | ) |
| | 2014 - IR | | | 17.15 | | | | (0.01 | ) | | | 3.81 | | | | 3.80 | | | | (0.02 | ) | | | (1.83 | ) | | | (1.85 | ) |
| | 2014 - R | | | 16.84 | | | | (0.10 | ) | | | 3.73 | | | | 3.63 | | | | — | | | | (1.83 | ) | | | (1.83 | ) |
| | 2013 - A | | | 14.97 | | | | 0.11 | (h) | | | 2.03 | | | | 2.14 | | | | (0.06 | ) | | | — | | | | (0.06 | ) |
| | 2013 - C | | | 13.79 | | | | (0.06 | )(h) | | | 1.93 | | | | 1.87 | | | | (0.01 | ) | | | — | | | | (0.01 | ) |
| | 2013 - Institutional | | | 15.48 | | | | 0.09 | (h) | | | 2.18 | | | | 2.27 | | | | (0.12 | ) | | | — | | | | (0.12 | ) |
| | 2013 - IR | | | 15.07 | | | | 0.12 | (h) | | | 2.07 | | | | 2.19 | | | | (0.11 | ) | | | — | | | | (0.11 | ) |
| | 2013 - R | | | 14.80 | | | | 0.01 | (h) | | | 2.06 | | | | 2.07 | | | | (0.03 | ) | | | — | | | | (0.03 | ) |
| | 2012 - A | | | 12.64 | | | | — | (f) | | | 2.33 | | | | 2.33 | | | | — | | | | — | | | | — | |
| | 2012 - C | | | 11.73 | | | | (0.09 | ) | | | 2.15 | | | | 2.06 | | | | — | | | | — | | | | — | |
| | 2012 - Institutional | | | 13.07 | | | | 0.05 | | | | 2.41 | | | | 2.46 | | | | (0.05 | ) | | | — | | | | (0.05 | ) |
| | 2012 - IR | | | 12.73 | | | | 0.04 | | | | 2.34 | | | | 2.38 | | | | (0.04 | ) | | | — | | | | (0.04 | ) |
| | 2012 - R | | | 12.52 | | | | (0.03 | ) | | | 2.31 | | | | 2.28 | | | | — | | | | — | | | | — | |
| | 2011 - A | | | 10.91 | | | | (0.01 | ) | | | 1.74 | | | | 1.73 | | | | — | | | | — | | | | — | |
| | 2011 - C | | | 10.20 | | | | (0.10 | ) | | | 1.63 | | | | 1.53 | | | | — | | | | — | | | | — | |
| | 2011 - Institutional | | | 11.25 | | | | 0.04 | | | | 1.80 | | | | 1.84 | | | | (0.02 | ) | | | — | | | | (0.02 | ) |
| | 2011 - IR | | | 10.97 | | | | 0.04 | | | | 1.73 | | | | 1.77 | | | | (0.01 | ) | | | — | | | | (0.01 | ) |
| | 2011 - R | | | 10.83 | | | | (0.04 | ) | | | 1.73 | | | | 1.69 | | | | — | | | | — | | | | — | |
| | (a) | | Calculated based on the average shares outstanding methodology. |
| | (b) | | Assumes investment at the NAV at the beginning of the period, reinvestment of all dividends and distributions, a complete redemption of the investment at the NAV at the end of the period and no sales or redemption charges. Total returns would be reduced if a sales or redemption charge was taken into account. Returns do not reflect the deduction of taxes that a shareholder would pay on Fund distributions or the redemption of Fund shares. Total returns for periods less than one full year are not annualized. |
| | (c) | | The Fund’s portfolio turnover rate is calculated in accordance with regulatory requirements, without regard to transactions involving short term investments. If such transactions were included, the Fund’s portfolio turnover rate may be higher. |
| | (d) | | Reflects income recognized from special dividends which amounted to $0.03 per share and 0.37% of average net assets. |
| | (f) | | Amount is less than $0.005 per share. |
| | (g) | | Reflects income recognized from a special dividend which amounted to $0.05 per share and 0.30% of average net assets. |
| | (h) | | Reflects income recognized from a special dividend which amounted to $0.06 per share and 0.35% of average net assets. |
| | |
| 90 | | The accompanying notes are an integral part of these financial statements. |
GOLDMAN SACHS CONCENTRATED GROWTH FUND
| | | | | | | | | | | | | | | | | | | | | | | | | | | | | | | | | | | | | | | | |
| | | Net asset
value, end
of period | | | | | Total
return(b) | | | | | Net assets,
end of
period
(in 000s) | | | | | Ratio of
net expenses
to average
net assets | | | | | Ratio of
total expenses
to average
net assets | | | | | Ratio of
net investment
income (loss)
to average
net assets | | | | | Portfolio
turnover
rate(c) | |
| | | | | | | | | | | | | | | | | | | | | | | | | | | | | | | | | | | | | | | | |
| | $ | 13.54 | | | | | | (5.49 | )% | | | | $ | 6,367 | | | | | | 1.23 | %(e) | | | | | 1.60 | %(e) | | | | | 0.12 | %(d)(e) | | | | | 24 | % |
| | | 11.59 | | | | | | (5.87 | ) | | | | | 2,564 | | | | | | 1.98 | (e) | | | | | 2.35 | (e) | | | | | (0.62 | )(d)(e) | | | | | 24 | |
| | | 14.31 | | | | | | (5.30 | ) | | | | | 137,666 | | | | | | 0.83 | (e) | | | | | 1.20 | (e) | | | | | 0.53 | (d)(e) | | | | | 24 | |
| | | 13.73 | | | | | | (5.36 | ) | | | | | 340 | | | | | | 0.98 | (e) | | | | | 1.35 | (e) | | | | | 0.38 | (d)(e) | | | | | 24 | |
| | | 13.20 | | | | | | (5.55 | ) | | | | | 28 | | | | | | 1.48 | (e) | | | | | 1.85 | (e) | | | | | (0.13 | )(d)(e) | | | | | 24 | |
| | | 14.31 | | | | | | (5.28 | ) | | | | | 9 | | | | | | 0.80 | (e) | | | | | 1.18 | (e) | | | | | 0.55 | (d)(e) | | | | | 24 | |
| | | | | | | | | | | | | | | | | | | | | | | | | | | | | | | | | | | | | | | | |
| | | | | | | | | | | | | | | | | | | | | | | | | | | | | | | | | | | | | | | | |
| | | 16.06 | | | | | | 2.54 | | | | | | 7,350 | | | | | | 1.24 | | | | | | 1.60 | | | | | | 0.02 | (g) | | | | | 47 | |
| | | 14.05 | | | | | | 1.78 | | | | | | 3,604 | | | | | | 1.99 | | | | | | 2.35 | | | | | | (0.74 | )(g) | | | | | 47 | |
| | | 16.88 | | | | | | 2.97 | | | | | | 155,652 | | | | | | 0.84 | | | | | | 1.20 | | | | | | 0.42 | (g) | | | | | 47 | |
| | | 16.26 | | | | | | 2.84 | | | | | | 342 | | | | | | 0.99 | | | | | | 1.35 | | | | | | 0.29 | (g) | | | | | 47 | |
| | | 15.71 | | | | | | 2.28 | | | | | | 27 | | | | | | 1.49 | | | | | | 1.87 | | | | | | (0.31 | )(g) | | | | | 47 | |
| | | 16.88 | | | | | | (6.43 | ) | | | | | 9 | | | | | | 0.77 | (e) | | | | | 1.48 | (e) | | | | | 0.46 | (e)(g) | | | | | 47 | |
| | | 18.94 | | | | | | 22.88 | | | | | | 7,564 | | | | | | 1.27 | | | | | | 1.60 | | | | | | (0.32 | ) | | | | | 60 | |
| | | 17.09 | | | | | | 21.98 | | | | | | 3,460 | | | | | | 2.02 | | | | | | 2.35 | | | | | | (1.06 | ) | | | | | 60 | |
| | | 19.71 | | | | | | 23.44 | | | | | | 169,387 | | | | | | 0.87 | | | | | | 1.20 | | | | | | 0.09 | | | | | | 60 | |
| | | 19.10 | | | | | | 23.20 | | | | | | 385 | | | | | | 1.02 | | | | | | 1.35 | | | | | | (0.06 | ) | | | | | 60 | |
| | | 18.64 | | | | | | 22.61 | | | | | | 14 | | | | | | 1.50 | | | | | | 1.84 | | | | | | (0.55 | ) | | | | | 60 | |
| | | 17.05 | | | | | | 14.36 | | | | | | 8,476 | | | | | | 1.26 | | | | | | 1.62 | | | | | | 0.69 | (h) | | | | | 57 | |
| | | 15.65 | | | | | | 13.57 | | | | | | 2,561 | | | | | | 2.01 | | | | | | 2.37 | | | | | | (0.39 | )(h) | | | | | 57 | |
| | | 17.63 | | | | | | 14.81 | | | | | | 146,183 | | | | | | 0.86 | | | | | | 1.23 | | | | | | 0.56 | (h) | | | | | 57 | |
| | | 17.15 | | | | | | 14.61 | | | | | | 346 | | | | | | 1.01 | | | | | | 1.38 | | | | | | 0.76 | (h) | | | | | 57 | |
| | | 16.84 | | | | | | 14.13 | | | | | | 12 | | | | | | 1.51 | | | | | | 1.87 | | | | | | 0.09 | (h) | | | | | 57 | |
| | | 14.97 | | | | | | 18.38 | | | | | | 92,207 | | | | | | 1.26 | | | | | | 1.57 | | | | | | 0.01 | | | | | | 33 | |
| | | 13.79 | | | | | | 17.51 | | | | | | 2,877 | | | | | | 2.01 | | | | | | 2.32 | | | | | | (0.72 | ) | | | | | 33 | |
| | | 15.48 | | | | | | 18.80 | | | | | | 56,118 | | | | | | 0.86 | | | | | | 1.17 | | | | | | 0.39 | | | | | | 33 | |
| | | 15.07 | | | | | | 18.69 | | | | | | 584 | | | | | | 1.01 | | | | | | 1.32 | | | | | | 0.28 | | | | | | 33 | |
| | | 14.80 | | | | | | 18.08 | | | | | | 10 | | | | | | 1.51 | | | | | | 1.82 | | | | | | (0.22 | ) | | | | | 33 | |
| | | 12.64 | | | | | | 15.86 | | | | | | 109,826 | | | | | | 1.30 | | | | | | 1.56 | | | | | | (0.08 | ) | | | | | 35 | |
| | | 11.73 | | | | | | 15.00 | | | | | | 2,000 | | | | | | 2.05 | | | | | | 2.31 | | | | | | (0.82 | ) | | | | | 35 | |
| | | 13.07 | | | | | | 16.35 | | | | | | 126,113 | | | | | | 0.90 | | | | | | 1.16 | | | | | | 0.33 | | | | | | 35 | |
| | | 12.73 | | | | | | 16.13 | | | | | | 437 | | | | | | 1.05 | | | | | | 1.31 | | | | | | 0.28 | | | | | | 35 | |
| | | 12.52 | | | | | | 15.60 | | | | | | 9 | | | | | | 1.55 | | | | | | 1.81 | | | | | | (0.29 | ) | | | | | 35 | |
| | |
| The accompanying notes are an integral part of these financial statements. | | 91 |
GOLDMAN SACHS DYNAMIC U.S. EQUITY FUND
Financial Highlights
Selected Data for a Share Outstanding Throughout Each Period
| | | | | | | | | | | | | | | | | | | | | | | | | | | | | | |
| | | | | | Income (loss) from
investment operations | | | Distributions
to shareholders | |
| | | Year - Share Class | | Net asset
value,
beginning
of period | | | Net
investment
income (loss)(a) | | | Net realized
and unrealized
gain (loss) | | | Total from
investment
operations | | | From net
investment
income | | | From net
realized
gains | | | Total
distributions | |
| FOR THE SIX MONTHS ENDED FEBRUARY 29, (UNAUDITED) | |
| | 2016 - A | | $ | 13.92 | | | $ | 0.05 | | | $ | (0.93 | ) | | $ | (0.88 | ) | | $ | (0.07 | ) | | $ | (1.36 | ) | | $ | (1.43 | ) |
| | 2016 - C | | | 13.56 | | | | — | (e) | | | (0.89 | ) | | | (0.89 | ) | | | — | | | | (1.36 | ) | | | (1.36 | ) |
| | 2016 - Institutional | | | 14.01 | | | | 0.08 | | | | (0.93 | ) | | | (0.85 | ) | | | (0.13 | ) | | | (1.36 | ) | | | (1.49 | ) |
| | 2016 - IR | | | 13.98 | | | | 0.07 | | | | (0.93 | ) | | | (0.86 | ) | | | (0.09 | ) | | | (1.36 | ) | | | (1.45 | ) |
| | 2016 - R | | | 13.88 | | | | 0.04 | | | | (0.92 | ) | | | (0.88 | ) | | | — | | | | (1.36 | ) | | | (1.36 | ) |
| | 2016 - R6 | | | 14.01 | | | | 0.08 | | | | (0.93 | ) | | | (0.85 | ) | | | (0.13 | ) | | | (1.36 | ) | | | (1.49 | ) |
| | | | | | | | | | | | | | | | | | | | | | | | | | | | | | |
| FOR THE FISCAL YEARS ENDED AUGUST 31, | |
| | 2015 - A | | | 16.66 | | | | 0.09 | | | | (0.17 | ) | | | (0.08 | ) | | | (0.07 | ) | | | (2.59 | ) | | | (2.66 | ) |
| | 2015 - C | | | 16.33 | | | | (0.03 | ) | | | (0.15 | ) | | | (0.18 | ) | | | — | | | | (2.59 | ) | | | (2.59 | ) |
| | 2015 - Institutional | | | 16.75 | | | | 0.14 | | | | (0.16 | ) | | | (0.02 | ) | | | (0.13 | ) | | | (2.59 | ) | | | (2.72 | ) |
| | 2015 - IR | | | 16.72 | | | | 0.11 | | | | (0.15 | ) | | | (0.04 | ) | | | (0.11 | ) | | | (2.59 | ) | | | (2.70 | ) |
| | 2015 - R | | | 16.62 | | | | 0.04 | | | | (0.16 | ) | | | (0.12 | ) | | | (0.03 | ) | | | (2.59 | ) | | | (2.62 | ) |
| | 2015 - R6 (Commenced July 31, 2015) | | | 15.04 | | | | 0.01 | | | | (1.04 | ) | | | (1.03 | ) | | | — | | | | — | | | | — | |
| | 2014 - A | | | 14.79 | | | | 0.06 | | | | 3.23 | | | | 3.29 | | | | (0.05 | ) | | | (1.37 | ) | | | (1.42 | ) |
| | 2014 - C | | | 14.58 | | | | (0.06 | ) | | | 3.18 | | | | 3.12 | | | | — | | | | (1.37 | ) | | | (1.37 | ) |
| | 2014 - Institutional | | | 14.85 | | | | 0.12 | | | | 3.25 | | | | 3.37 | | | | (0.10 | ) | | | (1.37 | ) | | | (1.47 | ) |
| | 2014 - IR | | | 14.83 | | | | 0.10 | | | | 3.24 | | | | 3.34 | | | | (0.08 | ) | | | (1.37 | ) | | | (1.45 | ) |
| | 2014 - R | | | 14.78 | | | | 0.02 | | | | 3.23 | | | | 3.25 | | | | (0.04 | ) | | | (1.37 | ) | | | (1.41 | ) |
| | 2013 - A | | | 12.30 | | | | 0.09 | | | | 2.48 | | | | 2.57 | | | | (0.08 | ) | | | — | | | | (0.08 | ) |
| | 2013 - C | | | 12.13 | | | | (0.01 | ) | | | 2.46 | | | | 2.45 | | | | — | | | | — | | | | — | |
| | 2013 - Institutional | | | 12.35 | | | | 0.14 | | | | 2.50 | | | | 2.64 | | | | (0.14 | ) | | | — | | | | (0.14 | ) |
| | 2013 - IR | | | 12.34 | | | | 0.12 | | | | 2.50 | | | | 2.62 | | | | (0.13 | ) | | | — | | | | (0.13 | ) |
| | 2013 - R | | | 12.29 | | | | 0.04 | | | | 2.51 | | | | 2.55 | | | | (0.06 | ) | | | — | | | | (0.06 | ) |
| | 2012 - A | | | 10.71 | | | | 0.08 | | | | 1.66 | | | | 1.74 | | | | (0.04 | ) | | | (0.11 | ) | | | (0.15 | ) |
| | 2012 - C | | | 10.61 | | | | (0.01 | ) | | | 1.64 | | | | 1.63 | | | | — | | | | (0.11 | ) | | | (0.11 | ) |
| | 2012 - Institutional | | | 10.76 | | | | 0.13 | | | | 1.65 | | | | 1.78 | | | | (0.08 | ) | | | (0.11 | ) | | | (0.19 | ) |
| | 2012 - IR | | | 10.73 | | | | 0.11 | | | | 1.65 | | | | 1.76 | | | | (0.04 | ) | | | (0.11 | ) | | | (0.15 | ) |
| | 2012 - R | | | 10.70 | | | | 0.05 | | | | 1.65 | | | | 1.70 | | | | — | (e) | | | (0.11 | ) | | | (0.11 | ) |
| | 2011 - A | | | 9.55 | | | | 0.03 | | | | 1.21 | | | | 1.24 | | | | (0.05 | ) | | | (0.03 | ) | | | (0.08 | ) |
| | 2011 - C | | | 9.49 | | | | (0.05 | ) | | | 1.21 | | | | 1.16 | | | | (0.01 | ) | | | (0.03 | ) | | | (0.04 | ) |
| | 2011 - Institutional | | | 9.57 | | | | 0.08 | | | | 1.22 | | | | 1.30 | | | | (0.08 | ) | | | (0.03 | ) | | | (0.11 | ) |
| | 2011 - IR | | | 9.56 | | | | 0.06 | | | | 1.22 | | | | 1.28 | | | | (0.08 | ) | | | (0.03 | ) | | | (0.11 | ) |
| | 2011 - R | | | 9.53 | | | | 0.01 | | | | 1.20 | | | | 1.21 | | | | (0.01 | ) | | | (0.03 | ) | | | (0.04 | ) |
| | (a) | | Calculated based on the average shares outstanding methodology. |
| | (b) | | Assumes investment at the NAV at the beginning of the period, reinvestment of all dividends and distributions, a complete redemption of the investment at the NAV at the end of the period and no sales or redemption charges. Total returns would be reduced if a sales or redemption charge was taken into account. Returns do not reflect the deduction of taxes that a shareholder would pay on Fund distributions or the redemption of Fund shares. Total returns for periods less than one full year are not annualized. |
| | (c) | | The Fund’s portfolio turnover rate is calculated in accordance with regulatory requirements, without regard to transactions involving short term investments. If such transactions were included, the Fund’s portfolio turnover rate may be higher. |
| | (e) | | Amount is less than $0.005 per share. |
| | |
| 92 | | The accompanying notes are an integral part of these financial statements. |
GOLDMAN SACHS DYNAMIC U.S. EQUITY FUND
| | | | | | | | | | | | | | | | | | | | | | | | | | | | | | | | | | | | | | | | |
| | | | | | | | | | | | | | | | | | | | | | | | | | | | | | | | | | |
| | | Net asset
value, end
of period | | | | | Total
return(b) | | | | | Net assets,
end of
period (in 000s) | | | | | Ratio of
net expenses
to average
net assets | | | | | Ratio of
total expenses
to average
net assets | | | | | Ratio of
net investment
income (loss)
to average
net assets | | | | | Portfolio
turnover
rate(c) | |
| |
| | $ | 11.61 | | | | | | (7.33 | )% | | | | $ | 2,787 | | | | | | 1.23 | %(d) | | | | | 3.60 | %(d) | | | | | 0.77 | %(d) | | | | | 25 | % |
| | | 11.31 | | | | | | (7.61 | ) | | | | | 287 | | | | | | 1.98 | (d) | | | | | 4.29 | (d) | | | | | — | (d) | | | | | 25 | |
| | | 11.67 | | | | | | (7.09 | ) | | | | | 7,304 | | | | | | 0.82 | (d) | | | | | 3.05 | (d) | | | | | 1.16 | (d) | | | | | 25 | |
| | | 11.67 | | | | | | (7.17 | ) | | | | | 650 | | | | | | 0.97 | (d) | | | | | 3.35 | (d) | | | | | 1.06 | (d) | | | | | 25 | |
| | | 11.64 | | | | | | (7.35 | ) | | | | | 53 | | | | | | 1.47 | (d) | | | | | 3.52 | (d) | | | | | 0.57 | (d) | | | | | 25 | |
| | | 11.67 | | | | | | (7.07 | ) | | | | | 9 | | | | | | 0.81 | (d) | | | | | 3.20 | (d) | | | | | 1.18 | (d) | | | | | 25 | |
| | | | | | | | | | | | | | | | | | | | | | | | | | | | | | | | | | | | | | | | |
| |
| | | 13.92 | | | | | | (1.22 | ) | | | | | 3,086 | | | | | | 1.21 | | | | | | 2.81 | | | | | | 0.57 | | | | | | 67 | |
| | | 13.56 | | | | | | (1.96 | ) | | | | | 355 | | | | | | 1.97 | | | | | | 3.56 | | | | | | (0.21 | ) | | | | | 67 | |
| | | 14.01 | | | | | | (0.82 | ) | | | | | 10,855 | | | | | | 0.81 | | | | | | 2.42 | | | | | | 0.93 | | | | | | 67 | |
| | | 13.98 | | | | | | (0.98 | ) | | | | | 800 | | | | | | 0.96 | | | | | | 1.06 | | | | | | 0.73 | | | | | | 67 | |
| | | 13.88 | | | | | | (1.48 | ) | | | | | 118 | | | | | | 1.46 | | | | | | 3.10 | | | | | | 0.28 | | | | | | 67 | |
| | | 14.01 | | | | | | (6.85 | ) | | | | | 9 | | | | | | 0.76 | (d) | | | | | 1.65 | (d) | | | | | 1.08 | (d) | | | | | 67 | |
| | | 16.66 | | | | | | 23.41 | | | | | | 4,542 | | | | | | 1.20 | | | | | | 3.04 | | | | | | 0.37 | | | | | | 67 | |
| | | 16.33 | | | | | | 22.44 | | | | | | 247 | | | | | | 1.95 | | | | | | 3.78 | | | | | | (0.37 | ) | | | | | 67 | |
| | | 16.75 | | | | | | 23.92 | | | | | | 8,995 | | | | | | 0.80 | | | | | | 2.65 | | | | | | 0.76 | | | | | | 67 | |
| | | 16.72 | | | | | | 23.71 | | | | | | 205 | | | | | | 0.95 | | | | | | 2.80 | | | | | | 0.61 | | | | | | 67 | |
| | | 16.62 | | | | | | 23.06 | | | | | | 110 | | | | | | 1.45 | | | | | | 3.30 | | | | | | 0.11 | | | | | | 67 | |
| | | 14.79 | | | | | | 21.05 | | | | | | 2,869 | | | | | | 1.18 | | | | | | 3.66 | | | | | | 0.68 | | | | | | 61 | |
| | | 14.58 | | | | | | 20.20 | | | | | | 126 | | | | | | 1.93 | | | | | | 4.41 | | | | | | (0.09 | ) | | | | | 61 | |
| | | 14.85 | | | | | | 21.56 | | | | | | 8,646 | | | | | | 0.78 | | | | | | 3.24 | | | | | | 1.06 | | | | | | 61 | |
| | | 14.83 | | | | | | 21.39 | | | | | | 174 | | | | | | 0.93 | | | | | | 3.39 | | | | | | 0.90 | | | | | | 61 | |
| | | 14.78 | | | | | | 20.83 | | | | | | 51 | | | | | | 1.43 | | | | | | 3.80 | | | | | | 0.29 | | | | | | 61 | |
| | | 12.30 | | | | | | 16.37 | | | | | | 3,331 | | | | | | 1.18 | | | | | | 3.63 | | | | | | 0.69 | | | | | | 76 | |
| | | 12.13 | | | | | | 15.45 | | | | | | 158 | | | | | | 1.93 | | | | | | 4.38 | | | | | | (0.05 | ) | | | | | 76 | |
| | | 12.35 | | | | | | 16.71 | | | | | | 7,142 | | | | | | 0.78 | | | | | | 3.23 | | | | | | 1.11 | | | | | | 76 | |
| | | 12.34 | | | | | | 16.52 | | | | | | 70 | | | | | | 0.93 | | | | | | 3.38 | | | | | | 0.97 | | | | | | 76 | |
| | | 12.29 | | | | | | 16.02 | | | | | | 12 | | | | | | 1.43 | | | | | | 3.88 | | | | | | 0.45 | | | | | | 76 | |
| | | 10.71 | | | | | | 12.94 | | | | | | 3,110 | | | | | | 1.18 | | | | | | 4.88 | | | | | | 0.29 | | | | | | 51 | |
| | | 10.61 | | | | | | 12.19 | | | | | | 139 | | | | | | 1.93 | | | | | | 5.63 | | | | | | (0.42 | ) | | | | | 51 | |
| | | 10.76 | | | | | | 13.54 | | | | | | 5,945 | | | | | | 0.78 | | | | | | 4.48 | | | | | | 0.72 | | | | | | 51 | |
| | | 10.73 | | | | | | 13.32 | | | | | | 241 | | | | | | 0.93 | | | | | | 4.63 | | | | | | 0.56 | | | | | | 51 | |
| | | 10.70 | | | | | | 12.70 | | | | | | 11 | | | | | | 1.43 | | | | | | 5.13 | | | | | | 0.08 | | | | | | 51 | |
| | |
| The accompanying notes are an integral part of these financial statements. | | 93 |
GOLDMAN SACHS FLEXIBLE CAP GROWTH FUND
Financial Highlights
Selected Data for a Share Outstanding Throughout Each Period
| | | | | | | | | | | | | | | | | | | | | | | | | | | | | | |
| | | | | | Income (loss) from
investment operations | | | Distributions
to shareholders | |
| | | Year - Share Class | | ��
Net asset
value,
beginning
of period | | | Net
investment
income (loss)(a) | | | Net realized
and unrealized
gain (loss) | | | Total from
investment
operations | | | From net
investment
income | | | From net
realized
gains | | | Total
distributions | |
| | FOR THE SIX MONTHS ENDED FEBRUARY 29, (UNAUDITED) | |
| | 2016 - A | | $ | 11.90 | | | $ | (0.01 | ) | | $ | (0.75 | ) | | $ | (0.76 | ) | | $ | — | | | $ | (0.73 | ) | | $ | (0.73 | ) |
| | 2016 - C | | | 11.00 | | | | (0.05 | ) | | | (0.69 | ) | | | (0.74 | ) | | | — | | | | (0.73 | ) | | | (0.73 | ) |
| | 2016 - Institutional | | | 12.44 | | | | 0.01 | | | | (0.79 | ) | | | (0.78 | ) | | | — | | | | (0.73 | ) | | | (0.73 | ) |
| | 2016 - IR | | | 12.27 | | | | — | (e) | | | (0.77 | ) | | | (0.77 | ) | | | — | | | | (0.73 | ) | | | (0.73 | ) |
| | 2016 - R | | | 11.63 | | | | (0.03 | ) | | | (0.73 | ) | | | (0.76 | ) | | | — | | | | (0.73 | ) | | | (0.73 | ) |
| | 2016 - R6 | | | 12.44 | | | | 0.01 | | | | (0.79 | ) | | | (0.78 | ) | | | — | | | | (0.73 | ) | | | (0.73 | ) |
| | | | | | | | | | | | | | | | | | | | | | | | | | | | | | |
| | FOR THE FISCAL YEARS ENDED AUGUST 31, | |
| | 2015 - A | | | 13.21 | | | | (0.04 | )(f) | | | 0.63 | | | | 0.59 | | | | — | | | | (1.90 | ) | | | (1.90 | ) |
| | 2015 - C | | | 12.43 | | | | (0.12 | )(f) | | | 0.59 | | | | 0.47 | | | | — | | | | (1.90 | ) | | | (1.90 | ) |
| | 2015 - Institutional | | | 13.68 | | | | 0.01 | (f) | | | 0.65 | | | | 0.66 | | | | — | | | | (1.90 | ) | | | (1.90 | ) |
| | 2015 - IR | | | 13.53 | | | | — | (e)(f) | | | 0.64 | | | | 0.64 | | | | — | | | | (1.90 | ) | | | (1.90 | ) |
| | 2015 - R | | | 12.97 | | | | (0.07 | )(f) | | | 0.63 | | | | 0.56 | | | | — | | | | (1.90 | ) | | | (1.90 | ) |
| | 2015 - R6 (Commenced July 31, 2015) | | | 13.38 | | | | — | (e)(f) | | | (0.94 | ) | | | (0.94 | ) | | | — | | | | — | | | | — | |
| | 2014 - A | | | 11.83 | | | | (0.05 | ) | | | 3.01 | | | | 2.96 | | | | — | | | | (1.58 | ) | | | (1.58 | ) |
| | 2014 - C | | | 11.29 | | | | (0.14 | ) | | | 2.86 | | | | 2.72 | | | | — | | | | (1.58 | ) | | | (1.58 | ) |
| | 2014 - Institutional | | | 12.17 | | | | — | (e) | | | 3.11 | | | | 3.11 | | | | (0.02 | ) | | | (1.58 | ) | | | (1.60 | ) |
| | 2014 - IR | | | 12.05 | | | | (0.02 | ) | | | 3.08 | | | | 3.06 | | | | — | | | | (1.58 | ) | | | (1.58 | ) |
| | 2014 - R | | | 11.66 | | | | (0.08 | ) | | | 2.97 | | | | 2.89 | | | | — | | | | (1.58 | ) | | | (1.58 | ) |
| | 2013 - A | | | 11.48 | | | | — | (e)(h) | | | 1.71 | | | | 1.71 | | | | — | | | | (1.36 | ) | | | (1.36 | ) |
| | 2013 - C | | | 11.09 | | | | (0.08 | )(h) | | | 1.64 | | | | 1.56 | | | | — | | | | (1.36 | ) | | | (1.36 | ) |
| | 2013 - Institutional | | | 11.73 | | | | 0.04 | (h) | | | 1.76 | | | | 1.80 | | | | — | | | | (1.36 | ) | | | (1.36 | ) |
| | 2013 - IR | | | 11.64 | | | | 0.03 | (h) | | | 1.74 | | | | 1.77 | | | | — | | | | (1.36 | ) | | | (1.36 | ) |
| | 2013 - R | | | 11.36 | | | | (0.02 | )(h) | | | 1.68 | | | | 1.66 | | | | — | | | | (1.36 | ) | | | (1.36 | ) |
| | 2012 - A | | | 10.38 | | | | (0.02 | ) | | | 1.71 | | | | 1.69 | | | | — | | | | (0.59 | ) | | | (0.59 | ) |
| | 2012 - C | | | 10.12 | | | | (0.10 | ) | | | 1.66 | | | | 1.56 | | | | — | | | | (0.59 | ) | | | (0.59 | ) |
| | 2012 - Institutional | | | 10.55 | | | | 0.02 | | | | 1.75 | | | | 1.77 | | | | — | | | | (0.59 | ) | | | (0.59 | ) |
| | 2012 - IR | | | 10.49 | | | | 0.01 | | | | 1.73 | | | | 1.74 | | | | — | | | | (0.59 | ) | | | (0.59 | ) |
| | 2012 - R | | | 10.30 | | | | (0.05 | ) | | | 1.70 | | | | 1.65 | | | | — | | | | (0.59 | ) | | | (0.59 | ) |
| | 2011 - A | | | 9.41 | | | | (0.04 | ) | | | 1.51 | | | | 1.47 | | | | — | | | | (0.50 | ) | | | (0.50 | ) |
| | 2011 - C | | | 9.25 | | | | (0.12 | ) | | | 1.49 | | | | 1.37 | | | | — | | | | (0.50 | ) | | | (0.50 | ) |
| | 2011 - Institutional | | | 9.53 | | | | — | (f) | | | 1.52 | | | | 1.52 | | | | — | | | | (0.50 | ) | | | (0.50 | ) |
| | 2011 - IR | | | 9.49 | | | | — | (f) | | | 1.50 | | | | 1.50 | | | | — | | | | (0.50 | ) | | | (0.50 | ) |
| | 2011 - R | | | 9.37 | | | | (0.07 | ) | | | 1.50 | | | | 1.43 | | | | — | | | | (0.50 | ) | | | (0.50 | ) |
| | (a) | | Calculated based on the average shares outstanding methodology. |
| | (b) | | Assumes investment at the NAV at the beginning of the period, reinvestment of all dividends and distributions, a complete redemption of the investment at the NAV at the end of the period and no sales or redemption charges. Total returns would be reduced if a sales or redemption charge was taken into account. Returns do not reflect the deduction of taxes that a shareholder would pay on Fund distributions or the redemption of Fund shares. Total returns for periods less than one full year are not annualized. |
| | (c) | | The Fund’s portfolio turnover rate is calculated in accordance with regulatory requirements, without regard to transactions involving short term investments. If such transactions were included, the Fund’s portfolio turnover rate may be higher. |
| | (e) | | Amount is less than $0.005 per share. |
| | (f) | | Reflects income recognized from special dividends which amounted to $0.02 per share and 0.13% of average net assets. |
| | (g) | | Amount is less than 0.005% of average net assets. |
| | (h) | | Reflects income recognized from special dividends which amounted to $0.02 per share and 0.20% of average net assets. |
| | |
| 94 | | The accompanying notes are an integral part of these financial statements. |
GOLDMAN SACHS FLEXIBLE CAP GROWTH FUND
| | | | | | | | | | | | | | | | | | | | | | | | | | | | | | | | | | | | | | | | |
| | | | | | | | | | | | | |
| | | Net asset
value, end
of period | | | | | Total
return(b) | | | | | Net assets,
end of
period
(in 000s) | | | | | Ratio of
net expenses
to average
net assets | | | | | Ratio of
total expenses
to average
net assets | | | | | Ratio of
net investment
income (loss)
to average
net assets | | | | | Portfolio
turnover
rate(c) | |
| | | | | | | | | | | | | | | | | | | | | | | | | | | | | | | | | | | | | | | | |
| | $ | 10.41 | | | | | | (6.95 | )% | | | | $ | 6,329 | | | | | | 1.23 | %(d) | | | | | 3.07 | %(d) | | | | | (0.23 | )%(d) | | | | | 20 | % |
| | | 9.53 | | | | | | (7.34 | ) | | | | | 1,664 | | | | | | 1.98 | (d) | | | | | 3.83 | (d) | | | | | (0.98 | )(d) | | | | | 20 | |
| | | 10.93 | | | | | | (6.80 | ) | | | | | 8,145 | | | | | | 0.82 | (d) | | | | | 2.69 | (d) | | | | | 0.18 | (d) | | | | | 20 | |
| | | 10.77 | | | | | | (6.81 | ) | | | | | 62 | | | | | | 0.97 | (d) | | | | | 2.70 | (d) | | | | | 0.02 | (d) | | | | | 20 | |
| | | 10.14 | | | | | | (7.11 | ) | | | | | 39 | | | | | | 1.47 | (d) | | | | | 3.36 | (d) | | | | | (0.48 | )(d) | | | | | 20 | |
| | | 10.93 | | | | | | (6.80 | ) | | | | | 9 | | | | | | 0.80 | (d) | | | | | 2.66 | (d) | | | | | 0.20 | (d) | | | | | 20 | |
| | | | | | | | | | | | | | | | | | | | | | | | | | | | | | | | | | | | | | | | |
| | | | | | | | | | | | | | | | | | | | | | | | | | | | | | | | | | | | | | | | |
| | | 11.90 | | | | | | 4.59 | | | | | | 7,048 | | | | | | 1.24 | | | | | | 2.97 | | | | | | (0.30 | )(f) | | | | | 41 | |
| | | 11.00 | | | | | | 3.83 | | | | | | 1,802 | | | | | | 1.98 | | | | | | 3.71 | | | | | | (1.04 | )(f) | | | | | 41 | |
| | | 12.44 | | | | | | 4.99 | | | | | | 8,586 | | | | | | 0.84 | | | | | | 2.57 | | | | | | 0.09 | (f) | | | | | 41 | |
| | | 12.27 | | | | | | 4.88 | | | | | | 253 | | | | | | 0.98 | | | | | | 2.66 | | | | | | (0.03 | )(f) | | | | | 41 | |
| | | 11.63 | | | | | | 4.43 | | | | | | 33 | | | | | | 1.49 | | | | | | 3.24 | | | | | | (0.55 | )(f) | | | | | 41 | |
| | | 12.44 | | | | | | (7.03 | ) | | | | | 9 | | | | | | 0.84 | (d) | | | | | 4.34 | (d) | | | | | 0.24 | (d)(f) | | | | | 41 | |
| | | 13.21 | | | | | | 26.62 | | | | | | 5,665 | | | | | | 1.28 | | | | | | 3.32 | | | | | | (0.40 | ) | | | | | 56 | |
| | | 12.43 | | | | | | 25.68 | | | | | | 1,119 | | | | | | 2.03 | | | | | | 4.09 | | | | | | (1.15 | ) | | | | | 56 | |
| | | 13.68 | | | | | | 27.21 | | | | | | 8,262 | | | | | | 0.88 | | | | | | 2.92 | | | | | | — | (g) | | | | | 56 | |
| | | 13.53 | | | | | | 26.98 | | | | | | 126 | | | | | | 1.03 | | | | | | 3.04 | | | | | | (0.17 | ) | | | | | 56 | |
| | | 12.97 | | | | | | 26.38 | | | | | | 55 | | | | | | 1.53 | | | | | | 3.56 | | | | | | (0.65 | ) | | | | | 56 | |
| | | 11.83 | | | | | | 16.78 | | | | | | 4,584 | | | | | | 1.26 | | | | | | 3.62 | | | | | | 0.03 | (h) | | | | | 40 | |
| | | 11.29 | | | | | | 15.94 | | | | | | 1,005 | | | | | | 2.01 | | | | | | 4.32 | | | | | | (0.75 | )(h) | | | | | 40 | |
| | | 12.17 | | | | | | 17.23 | | | | | | 6,215 | | | | | | 0.86 | | | | | | 3.18 | | | | | | 0.37 | (h) | | | | | 40 | |
| | | 12.05 | | | | | | 17.08 | | | | | | 167 | | | | | | 1.01 | | | | | | 3.35 | | | | | | 0.26 | (h) | | | | | 40 | |
| | | 11.66 | | | | | | 16.50 | | | | | | 41 | | | | | | 1.51 | | | | | | 3.91 | | | | | | (0.19 | )(h) | | | | | 40 | |
| | | 11.48 | | | | | | 17.11 | | | | | | 7,423 | | | | | | 1.26 | | | | | | 3.14 | | | | | | (0.22 | ) | | | | | 32 | |
| | | 11.09 | | | | | | 16.23 | | | | | | 975 | | | | | | 2.01 | | | | | | 3.89 | | | | | | (0.95 | ) | | | | | 32 | |
| | | 11.73 | | | | | | 17.61 | | | | | | 4,640 | | | | | | 0.86 | | | | | | 2.74 | | | | | | 0.21 | | | | | | 32 | |
| | | 11.64 | | | | | | 17.41 | | | | | | 179 | | | | | | 1.01 | | | | | | 2.89 | | | | | | 0.06 | | | | | | 32 | |
| | | 11.36 | | | | | | 16.84 | | | | | | 63 | | | | | | 1.51 | | | | | | 3.39 | | | | | | (0.43 | ) | | | | | 32 | |
| | | 10.38 | | | | | | 15.42 | | | | | | 15,853 | | | | | | 1.34 | | | | | | 2.59 | | | | | | (0.37 | ) | | | | | 51 | |
| | | 10.12 | | | | | | 14.58 | | | | | | 974 | | | | | | 2.09 | | | | | | 3.34 | | | | | | (1.10 | ) | | | | | 51 | |
| | | 10.55 | | | | | | 15.77 | | | | | | 4,142 | | | | | | 0.94 | | | | | | 2.19 | | | | | | 0.04 | | | | | | 51 | |
| | | 10.49 | | | | | | 15.62 | | | | | | 116 | | | | | | 1.09 | | | | | | 2.34 | | | | | | (0.04 | ) | | | | | 51 | |
| | | 10.30 | | | | | | 15.05 | | | | | | 11 | | | | | | 1.59 | | | | | | 2.84 | | | | | | (0.61 | ) | | | | | 51 | |
| | |
| The accompanying notes are an integral part of these financial statements. | | 95 |
GOLDMAN SACHS FOCUSED GROWTH FUND
Financial Highlights
Selected Data for a Share Outstanding Throughout Each Period
| | | | | | | | | | | | | | | | | | | | | | | | | | | | | | |
| | | | | | Income (loss) from
investment operations | | | Distributions
to shareholders | |
| | | Year - Share Class | | Net asset
value,
beginning
of period | | | Net
investment
income (loss)(a) | | | Net realized
and unrealized
gain (loss) | | | Total from
investment
operations | | | From net
investment
income | | | From net
realized
gains | | | Total
distributions | |
| | FOR THE SIX MONTHS ENDED FEBRUARY 29, (UNAUDITED) | | | | | | | | | | | | | |
| | 2016 - A | | $ | 14.36 | | | $ | — | (d)(e) | | $ | (0.71 | ) | | $ | (0.71 | ) | | $ | (0.02 | ) | | $ | (0.76 | ) | | $ | (0.78 | ) |
| | 2016 - C | | | 14.01 | | | | (0.05 | )(d) | | | (0.70 | ) | | | (0.75 | ) | | | (0.01 | ) | | | (0.76 | ) | | | (0.77 | ) |
| | 2016 - Institutional | | | 14.50 | | | | 0.04 | (d) | | | (0.73 | ) | | | (0.69 | ) | | | (0.03 | ) | | | (0.76 | ) | | | (0.79 | ) |
| | 2016 - IR | | | 14.47 | | | | 0.03 | (d) | | | (0.73 | ) | | | (0.70 | ) | | | (0.01 | ) | | | (0.76 | ) | | | (0.77 | ) |
| | 2016 - R | | | 14.28 | | | | (0.01 | )(d) | | | (0.71 | ) | | | (0.72 | ) | | | — | | | | (0.76 | ) | | | (0.76 | ) |
| | 2016 - R6 | | | 14.50 | | | | 0.04 | (d) | | | (0.73 | ) | | | (0.69 | ) | | | (0.03 | ) | | | (0.76 | ) | | | (0.79 | ) |
| | | | | | | | | | | | | | | | | | | | | | | | | | | | | | |
| | FOR THE FISCAL YEARS ENDED AUGUST 31, | | | | | | | | | | | | | |
| | 2015 - A | | | 14.74 | | | | (0.01 | )(g) | | | 0.65 | | | | 0.64 | | | | — | | | | (1.02 | ) | | | (1.02 | ) |
| | 2015 - C | | | 14.51 | | | | (0.10 | )(g) | | | 0.62 | | | | 0.52 | | | | — | | | | (1.02 | ) | | | (1.02 | ) |
| | 2015 - Institutional | | | 14.85 | | | | 0.07 | (g) | | | 0.64 | | | | 0.71 | | | | (0.04 | ) | | | (1.02 | ) | | | (1.06 | ) |
| | 2015 - IR | | | 14.83 | | | | 0.04 | (g) | | | 0.64 | | | | 0.68 | | | | (0.02 | ) | | | (1.02 | ) | | | (1.04 | ) |
| | 2015 - R | | | 14.70 | | | | (0.03 | )(g) | | | 0.63 | | | | 0.60 | | | | — | | | | (1.02 | ) | | | (1.02 | ) |
| | 2015 - R6 (Commenced July 31, 2015) | | | 15.27 | | | | — | (e)(g) | | | (0.77 | ) | | | (0.77 | ) | | | — | | | | — | | | | — | |
| | 2014 - A | | | 12.95 | | | | (0.05 | ) | | | 2.77 | | | | 2.72 | | | | — | | | | (0.93 | ) | | | (0.93 | ) |
| | 2014 - C | | | 12.85 | | | | (0.15 | ) | | | 2.74 | | | | 2.59 | | | | — | | | | (0.93 | ) | | | (0.93 | ) |
| | 2014 - Institutional | | | 13.02 | | | | 0.01 | | | | 2.78 | | | | 2.79 | | | | (0.03 | ) | | | (0.93 | ) | | | (0.96 | ) |
| | 2014 - IR | | | 13.01 | | | | (0.01 | ) | | | 2.77 | | | | 2.76 | | | | (0.01 | ) | | | (0.93 | ) | | | (0.94 | ) |
| | 2014 - R | | | 12.95 | | | | (0.08 | ) | | | 2.76 | | | | 2.68 | | | | — | | | | (0.93 | ) | | | (0.93 | ) |
| | 2013 - A | | | 11.35 | | | | 0.01 | (h) | | | 1.66 | | | | 1.67 | | | | (0.05 | ) | | | (0.02 | ) | | | (0.07 | ) |
| | 2013 - C | | | 11.31 | | | | (0.06 | )(h) | | | 1.63 | | | | 1.57 | | | | (0.01 | ) | | | (0.02 | ) | | | (0.03 | ) |
| | 2013 - Institutional | | | 11.38 | | | | 0.07 | (h) | | | 1.66 | | | | 1.73 | | | | (0.07 | ) | | | (0.02 | ) | | | (0.09 | ) |
| | 2013 - IR | | | 11.38 | | | | 0.06 | (h) | | | 1.65 | | | | 1.71 | | | | (0.06 | ) | | | (0.02 | ) | | | (0.08 | ) |
| | 2013 - R | | | 11.34 | | | | — | (e)(h) | | | 1.64 | | | | 1.64 | | | | (0.01 | ) | | | (0.02 | ) | | | (0.03 | ) |
| | | | | | | | | | | | | | | | | | | | | | | | | | | | | | |
| | FOR THE PERIOD ENDED AUGUST 31, | | | | | | | | | | | | | |
| | 2012 - A (Commenced January 31, 2012) | | | 10.00 | | | | — | (e) | | | 1.35 | | | | 1.35 | | | | — | | | | — | | | | — | |
| | 2012 - C (Commenced January 31, 2012) | | | 10.00 | | | | (0.05 | ) | | | 1.36 | | | | 1.31 | | | | — | | | | — | | | | — | |
| | 2012 - Institutional (Commenced January 31, 2012) | | | 10.00 | | | | 0.02 | | | | 1.36 | | | | 1.38 | | | | — | | | | — | | | | — | |
| | 2012 - IR (Commenced January 31, 2012) | | | 10.00 | | | | 0.01 | | | | 1.37 | | | | 1.38 | | | | — | | | | — | | | | — | |
| | 2012 - R (Commenced January 31, 2012) | | | 10.00 | | | | (0.02 | ) | | | 1.36 | | | | 1.34 | | | | — | | | | — | | | | — | |
| | (a) | | Calculated based on the average shares outstanding methodology. |
| | (b) | | Assumes investment at the NAV at the beginning of the period, reinvestment of all dividends and distributions, a complete redemption of the investment at the NAV at the end of the period and no sales or redemption charges. Total returns would be reduced if a sales or redemption charge was taken into account. Returns do not reflect the deduction of taxes that a shareholder would pay on Fund distributions or the redemption of Fund shares. Total returns for periods less than one full year are not annualized. |
| | (c) | | The Fund’s portfolio turnover rate is calculated in accordance with regulatory requirements, without regard to transactions involving short term investments. If such transactions were included, the Fund’s portfolio turnover rate may be higher. |
| | (d) | | Reflects income recognized from special dividends which amounted to $0.03 per share and 0.46% of average net assets |
| | (e) | | Amount is less than $0.005 per share. |
| | (g) | | Reflects income recognized from special dividends which amounted to $0.05 per share and 0.31% of average net assets. |
| | (h) | | Reflects income recognized from special dividends which amounted to $0.02 per share and 0.18% of average net assets. |
| | |
| 96 | | The accompanying notes are an integral part of these financial statements. |
GOLDMAN SACHS FOCUSED GROWTH FUND
| | | | | | | | | | | | | | | | | | | | | | | | | | | | | | | | | | | | | | | | |
| | | Net asset
value, end
of period | | | | | Total
return(b) | | | | | Net assets,
end of
period
(in 000s) | | | | | Ratio of
net expenses
to average
net assets | | | | | Ratio of
total expenses
to average
net assets | | | | | Ratio of
net investment
income (loss)
to average
net assets | | | | | Portfolio
turnover
rate(c) | |
| | | | | | | | | | | | | | | | | | | | | | | | | | | | | | | | | | | | | | | | |
| | $ | 12.87 | | | | | | (5.45 | )% | | | | $ | 282 | | | | | | 1.23 | %(f) | | | | | 2.57 | %(f) | | | | | 0.05 | %(d)(f) | | | | | 25 | % |
| | | 12.49 | | | | | | (5.87 | ) | | | | | 240 | | | | | | 1.98 | (f) | | | | | 3.41 | (f) | | | | | (0.77 | )(d)(f) | | | | | 25 | |
| | | 13.02 | | | | | | (5.26 | ) | | | | | 26,517 | | | | | | 0.83 | (f) | | | | | 2.03 | (f) | | | | | 0.59 | (d)(f) | | | | | 25 | |
| | | 13.00 | | | | | | (5.30 | ) | | | | | 16 | | | | | | 0.98 | (f) | | | | | 2.22 | (f) | | | | | 0.42 | (d)(f) | | | | | 25 | |
| | | 12.80 | | | | | | (5.56 | ) | | | | | 15 | | | | | | 1.49 | (f) | | | | | 2.73 | (f) | | | | | (0.09 | )(d)(f) | | | | | 25 | |
| | | 13.02 | | | | | | (5.24 | ) | | | | | 9 | | | | | | 0.79 | (f) | | | | | 2.03 | (f) | | | | | 0.63 | (d)(f) | | | | | 25 | |
| | | | | | | | | | | | | | | | | | | | | | | | | | | | | | | | | | | | | | | | |
| | | | | | | | | | | | | | | | | | | | | | | | | | | | | | | | | | | | | | | | |
| | | 14.36 | | | | | | 4.27 | | | | | | 148 | | | | | | 1.24 | | | | | | 2.22 | | | | | | (0.05 | )(g) | | | | | 67 | |
| | | 14.01 | | | | | | 3.47 | | | | | | 53 | | | | | | 1.99 | | | | | | 3.00 | | | | | | (0.70 | )(g) | | | | | 67 | |
| | | 14.50 | | | | | | 4.72 | | | | | | 33,335 | | | | | | 0.84 | | | | | | 1.85 | | | | | | 0.45 | (g) | | | | | 67 | |
| | | 14.47 | | | | | | 4.50 | | | | | | 17 | | | | | | 1.01 | | | | | | 2.02 | | | | | | 0.30 | (g) | | | | | 67 | |
| | | 14.28 | | | | | | 3.99 | | | | | | 16 | | | | | | 1.49 | | | | | | 2.50 | | | | | | (0.19 | )(g) | | | | | 67 | |
| | | 14.50 | | | | | | (5.04 | ) | | | | | 9 | | | | | | 0.81 | (f) | | | | | 2.05 | (f) | | | | | 0.24 | (g)(f) | | | | | 67 | |
| | | 14.74 | | | | | | 21.60 | | | | | | 42 | | | | | | 1.26 | | | | | | 2.83 | | | | | | (0.37 | ) | | | | | 97 | |
| | | 14.51 | | | | | | 20.71 | | | | | | 39 | | | | | | 2.01 | | | | | | 3.49 | | | | | | (1.05 | ) | | | | | 97 | |
| | | 14.85 | | | | | | 22.00 | | | | | | 24,346 | | | | | | 0.86 | | | | | | 2.31 | | | | | | 0.10 | | | | | | 97 | |
| | | 14.83 | | | | | | 21.83 | | | | | | 16 | | | | | | 1.01 | | | | | | 2.51 | | | | | | (0.08 | ) | | | | | 97 | |
| | | 14.70 | | | | | | 21.28 | | | | | | 16 | | | | | | 1.51 | | | | | | 3.01 | | | | | | (0.58 | ) | | | | | 97 | |
| | | 12.95 | | | | | | 14.79 | | | | | | 56 | | | | | | 1.24 | | | | | | 6.12 | | | | | | 0.08 | (h) | | | | | 87 | |
| | | 12.85 | | | | | | 13.94 | | | | | | 23 | | | | | | 1.99 | | | | | | 6.91 | | | | | | (0.52 | )(h) | | | | | 87 | |
| | | 13.02 | | | | | | 15.33 | | | | | | 12,838 | | | | | | 0.84 | | | | | | 4.59 | | | | | | 0.53 | (h) | | | | | 87 | |
| | | 13.01 | | | | | | 15.08 | | | | | | 13 | | | | | | 1.00 | | | | | | 6.58 | | | | | | 0.52 | (h) | | | | | 87 | |
| | | 12.95 | | | | | | 14.53 | | | | | | 13 | | | | | | 1.49 | | | | | | 7.08 | | | | | | 0.02 | (h) | | | | | 87 | |
| | | | | | | | | | | | | | | | | | | | | | | | | | | | | | | | | | | | | | | | |
| | | | | | | | | | | | | | | | | | | | | | | | | | | | | | | | | | | | | | | | |
| | | 11.35 | | | | | | 13.50 | | | | | | 35 | | | | | | 1.24 | (f) | | | | | 17.07 | (f) | | | | | 0.04 | (f) | | | | | 23 | |
| | | 11.31 | | | | | | 13.10 | | | | | | 11 | | | | | | 1.99 | (f) | | | | | 17.82 | (f) | | | | | (0.81 | )(f) | | | | | 23 | |
| | | 11.38 | | | | | | 13.80 | | | | | | 3,417 | | | | | | 0.84 | (f) | | | | | 16.67 | (f) | | | | | 0.36 | (f) | | | | | 23 | |
| | | 11.38 | | | | | | 13.80 | | | | | | 11 | | | | | | 0.99 | (f) | | | | | 16.82 | (f) | | | | | 0.22 | (f) | | | | | 23 | |
| | | 11.34 | | | | | | 13.40 | | | | | | 11 | | | | | | 1.49 | (f) | | | | | 17.32 | (f) | | | | | (0.30 | )(f) | | | | | 23 | |
| | |
| The accompanying notes are an integral part of these financial statements. | | 97 |
GOLDMAN SACHS GROWTH OPPORTUNITIES FUND
Financial Highlights
Selected Data for a Share Outstanding Throughout Each Period
| | | | | | | | | | | | | | | | | | | | | | |
| | | | | | Income (loss) from
investment operations | | | | |
| | | Year - Share Class | | Net asset
value,
beginning
of period | | | Net investment
income (loss)(a) | | | Net realized
and unrealized
gain (loss) | | | Total from
investment
operations | | | Distributions
to shareholders from net
realized gains | |
| FOR THE SIX MONTHS ENDED FEBRUARY 29, (UNAUDITED) | |
| | 2016 - A | | $ | 23.84 | | | $ | (0.04 | )(d) | | $ | (2.12 | ) | | $ | (2.16 | ) | | $ | (2.81 | ) |
| | 2016 - C | | | 18.95 | | | | (0.10 | )(d) | | | (1.62 | ) | | | (1.72 | ) | | | (2.81 | ) |
| | 2016 - Institutional | | | 26.71 | | | | — | (d)(f) | | | (2.40 | ) | | | (2.40 | ) | | | (2.81 | ) |
| | 2016 - Service | | | 23.11 | | | | (0.05 | )(d) | | | (2.04 | ) | | | (2.09 | ) | | | (2.81 | ) |
| | 2016 - IR | | | 24.52 | | | | (0.02 | )(d) | | | (2.18 | ) | | | (2.20 | ) | | | (2.81 | ) |
| | 2016 - R | | | 23.21 | | | | (0.07 | )(d) | | | (2.05 | ) | | | (2.12 | ) | | | (2.81 | ) |
| | 2016 - R6 | | | 26.71 | | | | — | (d)(f) | | | (2.40 | ) | | | (2.40 | ) | | | (2.81 | ) |
| | | | | | | | | | | | | | | | | | | | | | |
| FOR THE FISCAL YEARS ENDED AUGUST 31, | |
| | 2015 - A | | | 30.22 | | | | (0.17 | )(g) | | | (0.05 | ) | | | (0.22 | ) | | | (6.16 | ) |
| | 2015 - C | | | 25.42 | | | | (0.30 | )(g) | | | (0.01 | ) | | | (0.31 | ) | | | (6.16 | ) |
| | 2015 - Institutional | | | 33.02 | | | | (0.07 | )(g) | | | (0.08 | ) | | | (0.15 | ) | | | (6.16 | ) |
| | 2015 - Service | | | 29.51 | | | | (0.19 | )(g) | | | (0.05 | ) | | | (0.24 | ) | | | (6.16 | ) |
| | 2015 - IR | | | 30.85 | | | | (0.11 | )(g) | | | (0.06 | ) | | | (0.17 | ) | | | (6.16 | ) |
| | 2015 - R | | | 29.65 | | | | (0.23 | )(g) | | | (0.05 | ) | | | (0.28 | ) | | | (6.16 | ) |
| | 2015 - R6 (Commenced July 31, 2015) | | | 28.49 | | | | (0.01 | )(g) | | | (1.77 | ) | | | (1.78 | ) | | | — | |
| | 2014 - A | | | 26.65 | | | | (0.19 | ) | | | 5.95 | | | | 5.76 | | | | (2.19 | ) |
| | 2014 - C | | | 22.89 | | | | (0.34 | ) | | | 5.06 | | | | 4.72 | | | | (2.19 | ) |
| | 2014 - Institutional | | | 28.83 | | | | (0.08 | ) | | | 6.46 | | | | 6.38 | | | | (2.19 | ) |
| | 2014 - Service | | | 26.10 | | | | (0.21 | ) | | | 5.81 | | | | 5.60 | | | | (2.19 | ) |
| | 2014 - IR | | | 27.10 | | | | (0.12 | ) | | | 6.06 | | | | 5.94 | | | | (2.19 | ) |
| | 2014 - R | | | 26.25 | | | | (0.25 | ) | | | 5.84 | | | | 5.59 | | | | (2.19 | ) |
| | 2013 - A | | | 23.88 | | | | (0.11 | )(h) | | | 4.53 | | | | 4.42 | | | | (1.65 | ) |
| | 2013 - C | | | 20.89 | | | | (0.26 | )(h) | | | 3.91 | | | | 3.65 | | | | (1.65 | ) |
| | 2013 - Institutional | | | 25.59 | | | | (0.01 | )(h) | | | 4.90 | | | | 4.89 | | | | (1.65 | ) |
| | 2013 - Service | | | 23.44 | | | | (0.13 | )(h) | | | 4.44 | | | | 4.31 | | | | (1.65 | ) |
| | 2013 - IR | | | 24.19 | | | | (0.05 | )(h) | | | 4.61 | | | | 4.56 | | | | (1.65 | ) |
| | 2013 - R | | | 23.59 | | | | (0.17 | )(h) | | | 4.48 | | | | 4.31 | | | | (1.65 | ) |
| | 2012 - A | | | 21.36 | | | | (0.15 | ) | | | 4.06 | | | | 3.91 | | | | (1.39 | ) |
| | 2012 - C | | | 18.99 | | | | (0.28 | ) | �� | | 3.57 | | | | 3.29 | | | | (1.39 | ) |
| | 2012 - Institutional | | | 22.71 | | | | (0.06 | ) | | | 4.33 | | | | 4.27 | | | | (1.39 | ) |
| | 2012 - Service | | | 21.01 | | | | (0.17 | ) | | | 3.99 | | | | 3.82 | | | | (1.39 | ) |
| | 2012 - IR | | | 21.57 | | | | (0.09 | ) | | | 4.10 | | | | 4.01 | | | | (1.39 | ) |
| | 2012 - R | | | 21.17 | | | | (0.20 | ) | | | 4.01 | | | | 3.81 | | | | (1.39 | ) |
| | 2011 - A | | | 19.09 | | | | (0.16 | ) | | | 2.65 | | | | 2.49 | | | | (0.22 | ) |
| | 2011 - C | | | 17.11 | | | | (0.30 | ) | | | 2.40 | | | | 2.10 | | | | (0.22 | ) |
| | 2011 - Institutional | | | 20.21 | | | | (0.07 | ) | | | 2.79 | | | | 2.72 | | | | (0.22 | ) |
| | 2011 - Service | | | 18.80 | | | | (0.18 | ) | | | 2.61 | | | | 2.43 | | | | (0.22 | ) |
| | 2011 - IR | | | 19.23 | | | | (0.10 | ) | | | 2.66 | | | | 2.56 | | | | (0.22 | ) |
| | 2011 - R | | | 18.97 | | | | (0.22 | ) | | | 2.64 | | | | 2.42 | | | | (0.22 | ) |
| | (a) | | Calculated based on the average shares outstanding methodology. |
| | (b) | | Assumes investment at the NAV at the beginning of the period, reinvestment of all dividends and distributions, a complete redemption of the investment at the NAV at the end of the period and no sales or redemption charges. Total returns would be reduced if a sales or redemption charge was taken into account. Returns do not reflect the deduction of taxes that a shareholder would pay on Fund distributions or the redemption of Fund shares. Total returns for periods less than one full year are not annualized. |
| | (c) | | The Fund’s portfolio turnover rate is calculated in accordance with regulatory requirements, without regard to transactions involving short term investments. If such transactions were included, the Fund’s portfolio turnover rate may be higher. |
| | (d) | | Reflects income recognized from special dividends which amounted to $0.03 per share and 0.29% of average net assets. |
| | (f) | | Amount is less than $0.005 per share. |
| | (g) | | Reflects income recognized from special dividends which amounted to $0.03 per share and 0.10% of average net assets. |
| | (h) | | Reflects income recognized from special dividends which amounted to $0.04 per share and 0.17% of average net assets. |
| | (i) | | Portfolio turnover rates exclude portfolio securities received as a result of in-kind redemptions. |
| | |
| 98 | | The accompanying notes are an integral part of these financial statements. |
GOLDMAN SACHS GROWTH OPPORTUNITIES FUND
| | | | | | | | | | | | | | | | | | | | | | | | | | | | | | | | | | | | | | | | |
| | | | | | | | | | | | | | | | | | | | | | | | | | | | | | | | | | |
| | | Net asset
value, end
of period | | | | | Total
return(b) | | | | | Net assets,
end of
period
(in 000s) | | | | | Ratio of
net expenses
to average
net assets | | | | | Ratio of
total expenses
to average
net assets | | | | | Ratio of
net investment
income (loss)
to average
net assets | | | | | Portfolio
turnover
rate(c) | |
| |
| | $ | 18.87 | | | | | | (10.08 | )% | | | | $ | 658,229 | | | | | | 1.34 | %(e) | | | | | 1.42 | %(e) | | | | | (0.39 | )%(d)(e) | | | | | 30 | % |
| | | 14.42 | | | | | | (10.38 | ) | | | | | 129,007 | | | | | | 2.09 | (e) | | | | | 2.17 | (e) | | | | | (1.14 | )(d)(e) | | | | | 30 | |
| | | 21.50 | | | | | | (9.89 | ) | | | | | 2,400,000 | | | | | | 0.95 | (e) | | | | | 1.02 | (e) | | | | | — | (d)(e) | | | | | 30 | |
| | | 18.21 | | | | | | (10.10 | ) | | | | | 37,054 | | | | | | 1.45 | (e) | | | | | 1.52 | (e) | | | | | (0.51 | )(d)(e) | | | | | 30 | |
| | | 19.51 | | | | | | (9.96 | ) | | | | | 134,681 | | | | | | 1.09 | (e) | | | | | 1.17 | (e) | | | | | (0.14 | )(d)(e) | | | | | 30 | |
| | | 18.28 | | | | | | (10.19 | ) | | | | | 63,261 | | | | | | 1.59 | (e) | | | | | 1.67 | (e) | | | | | (0.64 | )(d)(e) | | | | | 30 | |
| | | 21.50 | | | | | | (9.89 | ) | | | | | 10,560 | | | | | | 0.93 | (e) | | | | | 1.00 | (e) | | | | | 0.04 | (d)(e) | | | | | 30 | |
| | | | | | | | | | | | | | | | | | | | | | | | | | | | | | | | | | | | | | | | |
| |
| | | 23.84 | | | | | | (1.47 | ) | | | | | 946,463 | | | | | | 1.35 | | | | | | 1.40 | | | | | | (0.65 | )(g) | | | | | 51 | |
| | | 18.95 | | | | | | (2.23 | ) | | | | | 168,461 | | | | | | 2.10 | | | | | | 2.15 | | | | | | (1.40 | )(g) | | | | | 51 | |
| | | 26.71 | | | | | | (1.08 | ) | | | | | 3,171,058 | | | | | | 0.95 | | | | | | 1.00 | | | | | | (0.24 | )(g) | | | | | 51 | |
| | | 23.11 | | | | | | (1.59 | ) | | | | | 49,105 | | | | | | 1.45 | | | | | | 1.50 | | | | | | (0.75 | )(g) | | | | | 51 | |
| | | 24.52 | | | | | | (1.25 | ) | | | | | 171,980 | | | | | | 1.10 | | | | | | 1.15 | | | | | | (0.41 | )(g) | | | | | 51 | |
| | | 23.21 | | | | | | (1.74 | ) | | | | | 77,673 | | | | | | 1.60 | | | | | | 1.65 | | | | | | (0.90 | )(g) | | | | | 51 | |
| | | 26.71 | | | | | | (6.25 | ) | | | | | 9 | | | | | | 0.97 | (e) | | | | | 1.02 | (e) | | | | | (0.32 | )(e)(g) | | | | | 51 | |
| | | 30.22 | | | | | | 22.57 | | | | | | 1,110,320 | | | | | | 1.36 | | | | | | 1.40 | | | | | | (0.66 | ) | | | | | 59 | |
| | | 25.42 | | | | | | 21.67 | | | | | | 191,125 | | | | | | 2.11 | | | | | | 2.15 | | | | | | (1.41 | ) | | | | | 59 | |
| | | 33.02 | | | | | | 23.04 | | | | | | 3,750,790 | | | | | | 0.96 | | | | | | 1.00 | | | | | | (0.26 | ) | | | | | 59 | |
| | | 29.51 | | | | | | 22.42 | | | | | | 57,643 | | | | | | 1.46 | | | | | | 1.50 | | | | | | (0.76 | ) | | | | | 59 | |
| | | 30.85 | | | | | | 22.87 | | | | | | 143,249 | | | | | | 1.11 | | | | | | 1.15 | | | | | | (0.41 | ) | | | | | 59 | |
| | | 29.65 | | | | | | 22.25 | | | | | | 80,542 | | | | | | 1.61 | | | | | | 1.65 | | | | | | (0.91 | ) | | | | | 59 | |
| | | 26.65 | | | | | | 19.84 | | | | | | 1,130,449 | | | | | | 1.35 | | | | | | 1.41 | | | | | | (0.44 | )(h) | | | | | 41 | |
| | | 22.89 | | | | | | 18.94 | | | | | | 172,010 | | | | | | 2.10 | | | | | | 2.16 | | | | | | (1.19 | )(h) | | | | | 41 | |
| | | 28.83 | | | | | | 20.38 | | | | | | 3,207,925 | | | | | | 0.95 | | | | | | 1.01 | | | | | | (0.05 | )(h) | | | | | 41 | |
| | | 26.10 | | | | | | 19.74 | | | | | | 60,977 | | | | | | 1.45 | | | | | | 1.51 | | | | | | (0.54 | )(h) | | | | | 41 | |
| | | 27.10 | | | | | | 20.18 | | | | | | 91,093 | | | | | | 1.10 | | | | | | 1.16 | | | | | | (0.21 | )(h) | | | | | 41 | |
| | | 26.25 | | | | | | 19.61 | | | | | | 71,263 | | | | | | 1.60 | | | | | | 1.66 | | | | | | (0.71 | )(h) | | | | | 41 | |
| | | 23.88 | | | | | | 19.15 | | | | | | 1,068,187 | | | | | | 1.35 | | | | | | 1.41 | | | | | | (0.67 | ) | | | | | 59 | |
| | | 20.89 | | | | | | 18.24 | | | | | | 157,901 | | | | | | 2.10 | | | | | | 2.16 | | | | | | (1.42 | ) | | | | | 59 | |
| | | 25.59 | | | | | | 19.61 | | | | | | 2,710,810 | | | | | | 0.95 | | | | | | 1.01 | | | | | | (0.27 | ) | | | | | 59 | |
| | | 23.44 | | | | | | 19.03 | | | | | | 59,834 | | | | | | 1.45 | | | | | | 1.51 | | | | | | (0.77 | ) | | | | | 59 | |
| | | 24.19 | | | | | | 19.43 | | | | | | 75,702 | | | | | | 1.10 | | | | | | 1.16 | | | | | | (0.42 | ) | | | | | 59 | |
| | | 23.59 | | | | | | 18.83 | | | | | | 54,071 | | | | | | 1.60 | | | | | | 1.66 | | | | | | (0.91 | ) | | | | | 59 | |
| | | 21.36 | | | | | | 12.97 | | | | | | 1,060,320 | | | | | | 1.36 | | | | | | 1.41 | | | | | | (0.70 | ) | | | | | 71 | (i) |
| | | 18.99 | | | | | | 12.18 | | | | | | 158,371 | | | | | | 2.11 | | | | | | 2.16 | | | | | | (1.46 | ) | | | | | 71 | (i) |
| | | 22.71 | | | | | | 13.39 | | | | | | 2,843,584 | | | | | | 0.96 | | | | | | 1.01 | | | | | | (0.30 | ) | | | | | 71 | (i) |
| | | 21.01 | | | | | | 12.85 | | | | | | 57,002 | | | | | | 1.46 | | | | | | 1.51 | | | | | | (0.81 | ) | | | | | 71 | (i) |
| | | 21.57 | | | | | | 13.24 | | | | | | 54,912 | | | | | | 1.11 | | | | | | 1.16 | | | | | | (0.43 | ) | | | | | 71 | (i) |
| | | 21.17 | | | | | | 12.68 | | | | | | 33,931 | | | | | | 1.61 | | | | | | 1.66 | | | | | | (0.94 | ) | | | | | 71 | (i) |
| | |
| The accompanying notes are an integral part of these financial statements. | | 99 |
GOLDMAN SACHS SMALL/MID CAP GROWTH FUND
Financial Highlights
Selected Data for a Share Outstanding Throughout Each Period
| | | | | | | | | | | | | | | | | | | | | | |
| | | | | | Income (loss) from
investment operations | | | | |
| | | Year - Share Class | | Net asset
value,
beginning
of period | | | Net
investment
income (loss)(a) | | | Net realized
and unrealized
gain (loss) | | | Total from
investment
operations | | | Distributions
to shareholders from net
realized gains | |
| | FOR THE SIX MONTHS ENDED FEBRUARY 29, (UNAUDITED) | | | | | |
| | 2016 - A | | $ | 20.72 | | | $ | (0.07 | )(d) | | $ | (2.82 | ) | | $ | (2.89 | ) | | $ | (0.73 | ) |
| | 2016 - C | | | 18.74 | | | | (0.13 | )(d) | | | (2.54 | ) | | | (2.67 | ) | | | (0.73 | ) |
| | 2016 - Institutional | | | 21.69 | | | | (0.04 | )(d) | | | (2.96 | ) | | | (3.00 | ) | | | (0.73 | ) |
| | 2016 - Service | | | 20.35 | | | | (0.08 | )(d) | | | (2.77 | ) | | | (2.85 | ) | | | (0.73 | ) |
| | 2016 - IR | | | 21.21 | | | | (0.05 | )(d) | | | (2.89 | ) | | | (2.94 | ) | | | (0.73 | ) |
| | 2016 - R | | | 20.26 | | | | (0.09 | )(d) | | | (2.76 | ) | | | (2.85 | ) | | | (0.73 | ) |
| | 2016 – R6 | | | 21.69 | | | | (0.03 | )(d) | | | (2.97 | ) | | | (3.00 | ) | | | (0.73 | ) |
| | | | | | | | | | | | | | | | | | | | | | |
| | FOR THE FISCAL YEARS ENDED AUGUST 31, | | | | | | | | | | | | | | | | | | | | |
| | 2015 - A | | | 20.90 | | | | (0.18 | )(f) | | | 1.71 | | | | 1.53 | | | | (1.71 | ) |
| | 2015 - C | | | 19.20 | | | | (0.31 | )(f) | | | 1.56 | | | | 1.25 | | | | (1.71 | ) |
| | 2015 - Institutional | | | 21.71 | | | | (0.10 | )(f) | | | 1.79 | | | | 1.69 | | | | (1.71 | ) |
| | 2015 - Service | | | 20.58 | | | | (0.20 | )(f) | | | 1.68 | | | | 1.48 | | | | (1.71 | ) |
| | 2015 - IR | | | 21.30 | | | | (0.13 | )(f) | | | 1.75 | | | | 1.62 | | | | (1.71 | ) |
| | 2015 - R | | | 20.51 | | | | (0.23 | )(f) | | | 1.69 | | | | 1.46 | | | | (1.71 | ) |
| | 2015 – R6 (Commenced July 31, 2015) | | | 23.47 | | | | (0.01 | )(f) | | | (1.77 | ) | | | (1.78 | ) | | | — | |
| | 2014 - A | | | 18.63 | | | | (0.16 | )(g) | | | 3.43 | | | | 3.27 | | | | (1.00 | ) |
| | 2014 - C | | | 17.31 | | | | (0.29 | )(g) | | | 3.18 | | | | 2.89 | | | | (1.00 | ) |
| | 2014 - Institutional | | | 19.25 | | | | (0.09 | )(g) | | | 3.55 | | | | 3.46 | | | | (1.00 | ) |
| | 2014 - Service | | | 18.38 | | | | (0.18 | )(g) | | | 3.38 | | | | 3.20 | | | | (1.00 | ) |
| | 2014 - IR | | | 18.93 | | | | (0.12 | )(g) | | | 3.49 | | | | 3.37 | | | | (1.00 | ) |
| | 2014 - R | | | 18.35 | | | | (0.21 | )(g) | | | 3.37 | | | | 3.16 | | | | (1.00 | ) |
| | 2013 - A | | | 15.52 | | | | (0.11 | )(h) | | | 3.99 | | | | 3.88 | | | | (0.77 | ) |
| | 2013 - C | | | 14.58 | | | | (0.23 | )(h) | | | 3.73 | | | | 3.50 | | | | (0.77 | ) |
| | 2013 - Institutional | | | 15.95 | | | | (0.06 | )(h) | | | 4.13 | | | | 4.07 | | | | (0.77 | ) |
| | 2013 - Service | | | 15.34 | | | | (0.13 | )(h) | | | 3.94 | | | | 3.81 | | | | (0.77 | ) |
| | 2013 - IR | | | 15.72 | | | | (0.08 | )(h) | | | 4.06 | | | | 3.98 | | | | (0.77 | ) |
| | 2013 - R | | | 15.34 | | | | (0.15 | )(h) | | | 3.93 | | | | 3.78 | | | | (0.77 | ) |
| | 2012 - A | | | 13.67 | | | | (0.12 | ) | | | 2.63 | | | | 2.51 | | | | (0.66 | ) |
| | 2012 - C | | | 12.98 | | | | (0.21 | ) | | | 2.47 | | | | 2.26 | | | | (0.66 | ) |
| | 2012 - Institutional | | | 13.98 | | | | (0.06 | ) | | | 2.69 | | | | 2.63 | | | | (0.66 | ) |
| | 2012 - Service | | | 13.53 | | | | (0.13 | ) | | | 2.60 | | | | 2.47 | | | | (0.66 | ) |
| | 2012 - IR | | | 13.81 | | | | (0.08 | ) | | | 2.65 | | | | 2.57 | | | | (0.66 | ) |
| | 2012 - R | | | 13.55 | | | | (0.15 | ) | | | 2.60 | | | | 2.45 | | | | (0.66 | ) |
| | 2011 - A | | | 12.08 | | | | (0.15 | ) | | | 2.01 | | | | 1.86 | | | | (0.27 | ) |
| | 2011 - C | | | 11.56 | | | | (0.24 | ) | | | 1.93 | | | | 1.69 | | | | (0.27 | ) |
| | 2011 - Institutional | | | 12.30 | | | | (0.09 | ) | | | 2.04 | | | | 1.95 | | | | (0.27 | ) |
| | 2011 - Service | | | 11.97 | | | | (0.16 | ) | | | 1.99 | | | | 1.83 | | | | (0.27 | ) |
| | 2011 - IR | | | 12.17 | | | | (0.10 | ) | | | 2.01 | | | | 1.91 | | | | (0.27 | ) |
| | 2011 - R | | | 12.01 | | | | (0.18 | ) | | | 1.99 | | | | 1.81 | | | | (0.27 | ) |
| | (a) | | Calculated based on the average shares outstanding methodology. |
| | (b) | | Assumes investment at the NAV at the beginning of the period, reinvestment of all dividends and distributions, a complete redemption of the investment at the NAV at the end of the period and no sales or redemption charges. Total returns would be reduced if a sales or redemption charge was taken into account. Returns do not reflect the deduction of taxes that a shareholder would pay on Fund distributions or the redemption of Fund shares. Total returns for periods less than one full year are not annualized. |
| | (c) | | The Fund’s portfolio turnover rate is calculated in accordance with regulatory requirements, without regard to transactions involving short term investments. If such transactions were included, the Fund’s portfolio turnover rate may be higher. |
| | (d) | | Reflects income recognized from special dividends which amounted to $0.01 per share and 0.15% of average net assets. |
| | (f) | | Reflects income recognized from special dividends which amounted to $0.01 per share and 0.05% of average net assets. |
| | (g) | | Reflects income recognized from special dividends which amounted to $0.01 per share and 0.12% of average net assets. |
| | (h) | | Reflects income recognized from special dividends which amounted to $0.02 per share and 0.14% of average net assets. |
| | |
| 100 | | The accompanying notes are an integral part of these financial statements. |
GOLDMAN SACHS SMALL/MID CAP GROWTH FUND
| | | | | | | | | | | | | | | | | | | | | | | | | | | | | | | | | | | | | | | | |
| | | | | | | | | | | | | | | | | | | | | | | | | | | | | | | | | | |
| | | Net asset
value, end
of period | | | | | Total
return(b) | | | | | Net assets,
end of
period
(in 000s) | | | | | Ratio of
net expenses
to average
net assets | | | | | Ratio of
total expenses
to average
net assets | | | | | Ratio of
net investment
income (loss)
to average
net assets | | | | | Portfolio
turnover
rate(c) | |
| | | | | | | | | | | | | | | | | | | | | | | | | | | | | | | | | | | | | | | | |
| | $ | 17.10 | | | | | | (14.34 | )% | | | | $ | 799,461 | | | | | | 1.32 | %(e) | | | | | 1.45 | %(e) | | | | | (0.74 | )%(d)(e) | | | | | 30 | % |
| | | 15.34 | | | | | | (14.69 | ) | | | | | 240,384 | | | | | | 2.07 | (e) | | | | | 2.20 | (e) | | | | | (1.50 | )(d)(e) | | | | | 30 | |
| | | 17.96 | | | | | | (14.21 | ) | | | | | 1,162,234 | | | | | | 0.93 | (e) | | | | | 1.05 | (e) | | | | | (0.35 | )(d)(e) | | | | | 30 | |
| | | 16.77 | | | | | | (14.41 | ) | | | | | 11,878 | | | | | | 1.43 | (e) | | | | | 1.55 | (e) | | | | | (0.86 | )(d)(e) | | | | | 30 | |
| | | 17.54 | | | | | | (14.24 | ) | | | | | 257,493 | | | | | | 1.07 | (e) | | | | | 1.20 | (e) | | | | | (0.49 | )(d)(e) | | | | | 30 | |
| | | 16.68 | | | | | | (14.47 | ) | | | | | 32,234 | | | | | | 1.57 | (e) | | | | | 1.70 | (e) | | | | | (0.99 | )(d)(e) | | | | | 30 | |
| | | 17.96 | | | | | | (14.21 | ) | | | | | 788 | | | | | | 0.91 | (e) | | | | | 1.04 | (e) | | | | | (0.39 | )(d)(e) | | | | | 30 | |
| | | | | | | | | | | | | | | | | | | | | | | | | | | | | | | | | | | | | | | | |
| | | | | | | | | | | | | | | | | | | | | | | | | | | | | | | | | | | | | | | | |
| | | 20.72 | | | | | | 7.67 | | | | | | 906,362 | | | | | | 1.33 | | | | | | 1.45 | | | | | | (0.85 | )(f) | | | | | 47 | |
| | | 18.74 | | | | | | 6.84 | | | | | | 268,384 | | | | | | 2.08 | | | | | | 2.20 | | | | | | (1.60 | )(f) | | | | | 47 | |
| | | 21.69 | | | | | | 8.15 | | | | | | 1,355,322 | | | | | | 0.93 | | | | | | 1.05 | | | | | | (0.45 | )(f) | | | | | 47 | |
| | | 20.35 | | | | | | 7.54 | | | | | | 12,695 | | | | | | 1.42 | | | | | | 1.55 | | | | | | (0.95 | )(f) | | | | | 47 | |
| | | 21.21 | | | | | | 7.97 | | | | | | 221,058 | | | | | | 1.08 | | | | | | 1.20 | | | | | | (0.60 | )(f) | | | | | 47 | |
| | | 20.26 | | | | | | 7.46 | | | | | | 34,697 | | | | | | 1.58 | | | | | | 1.70 | | | | | | (1.10 | )(f) | | | | | 47 | |
| | | 21.69 | | | | | | (7.58 | ) | | | | | 9 | | | | | | 0.92 | (e) | | | | | 1.05 | (e) | | | | | (0.34 | )(f)(e) | | | | | 47 | |
| | | 20.90 | | | | | | 17.97 | | | | | | 741,254 | | | | | | 1.33 | | | | | | 1.48 | | | | | | (0.82 | )(g) | | | | | 43 | |
| | | 19.20 | | | | | | 17.11 | | | | | | 221,451 | | | | | | 2.08 | | | | | | 2.23 | | | | | | (1.57 | )(g) | | | | | 43 | |
| | | 21.71 | | | | | | 18.39 | | | | | | 1,077,769 | | | | | | 0.93 | | | | | | 1.08 | | | | | | (0.42 | )(g) | | | | | 43 | |
| | | 20.58 | | | | | | 17.83 | | | | | | 8,692 | | | | | | 1.43 | | | | | | 1.58 | | | | | | (0.92 | )(g) | | | | | 43 | |
| | | 21.30 | | | | | | 18.22 | | | | | | 171,779 | | | | | | 1.08 | | | | | | 1.23 | | | | | | (0.57 | )(g) | | | | | 43 | |
| | | 20.51 | | | | | | 17.63 | | | | | | 34,118 | | | | | | 1.58 | | | | | | 1.73 | | | | | | (1.07 | )(g) | | | | | 43 | |
| | | 18.63 | | | | | | 26.18 | | | | | | 592,798 | | | | | | 1.34 | | | | | | 1.49 | | | | | | (0.68 | )(h) | | | | | 37 | |
| | | 17.31 | | | | | | 25.23 | | | | | | 150,744 | | | | | | 2.09 | | | | | | 2.24 | | | | | | (1.44 | )(h) | | | | | 37 | |
| | | 19.25 | | | | | | 26.68 | | | | | | 725,662 | | | | | | 0.94 | | | | | | 1.09 | | | | | | (0.32 | )(h) | | | | | 37 | |
| | | 18.38 | | | | | | 26.02 | | | | | | 8,495 | | | | | | 1.44 | | | | | | 1.59 | | | | | | (0.77 | )(h) | | | | | 37 | |
| | | 18.93 | | | | | | 26.49 | | | | | | 93,255 | | | | | | 1.09 | | | | | | 1.24 | | | | | | (0.45 | )(h) | | | | | 37 | |
| | | 18.35 | | | | | | 25.82 | | | | | | 24,420 | | | | | | 1.59 | | | | | | 1.74 | | | | | | (0.93 | )(h) | | | | | 37 | |
| | | 15.52 | | | | | | 18.97 | | | | | | 393,284 | | | | | | 1.35 | | | | | | 1.50 | | | | | | (0.83 | ) | | | | | 51 | |
| | | 14.58 | | | | | | 18.03 | | | | | | 87,185 | | | | | | 2.10 | | | | | | 2.25 | | | | | | (1.58 | ) | | | | | 51 | |
| | | 15.95 | | | | | | 19.42 | | | | | | 291,636 | | | | | | 0.95 | | | | | | 1.10 | | | | | | (0.43 | ) | | | | | 51 | |
| | | 15.34 | | | | | | 18.87 | | | | | | 6,774 | | | | | | 1.45 | | | | | | 1.60 | | | | | | (0.92 | ) | | | | | 51 | |
| | | 15.72 | | | | | | 19.22 | | | | | | 46,777 | | | | | | 1.10 | | | | | | 1.25 | | | | | | (0.57 | ) | | | | | 51 | |
| | | 15.34 | | | | | | 18.69 | | | | | | 19,156 | | | | | | 1.60 | | | | | | 1.75 | | | | | | (1.07 | ) | | | | | 51 | |
| | | 13.67 | | | | | | 15.30 | | | | | | 403,960 | | | | | | 1.47 | | | | | | 1.50 | | | | | | (0.99 | ) | | | | | 53 | |
| | | 12.98 | | | | | | 14.51 | | | | | | 79,875 | | | | | | 2.22 | | | | | | 2.25 | | | | | | (1.74 | ) | | | | | 53 | |
| | | 13.98 | | | | | | 15.77 | | | | | | 340,712 | | | | | | 1.07 | | | | | | 1.10 | | | | | | (0.59 | ) | | | | | 53 | |
| | | 13.53 | | | | | | 15.19 | | | | | | 5,879 | | | | | | 1.57 | | | | | | 1.60 | | | | | | (1.08 | ) | | | | | 53 | |
| | | 13.81 | | | | | | 15.60 | | | | | | 30,858 | | | | | | 1.22 | | | | | | 1.25 | | | | | | (0.71 | ) | | | | | 53 | |
| | | 13.55 | | | | | | 14.97 | | | | | | 15,370 | | | | | | 1.72 | | | | | | 1.75 | | | | | | (1.24 | ) | | | | | 53 | |
| | |
| The accompanying notes are an integral part of these financial statements. | | 101 |
GOLDMAN SACHS STRATEGIC GROWTH FUND
Financial Highlights
Selected Data for a Share Outstanding Throughout Each Period
| | | | | | | | | | | | | | | | | | | | | | | | | | | | | | |
| | | | | | | | Income (loss) from
investment operations | | | Distributions
to shareholders | |
| | | Year - Share Class | |
Net asset
value,
beginning
of period | | | Net
investment
income (loss)(a) | | | Net realized
and unrealized
gain (loss) | | | Total from
investment
operations | | | From net
investment
income | | | From net
realized
gains | | | Total
distributions | |
| | FOR THE SIX MONTHS ENDED FEBRUARY 29, (UNAUDITED) | |
| | 2016 - A | | $ | 11.86 | | | $ | 0.02 | (d) | | $ | (0.48 | ) | | $ | (0.46 | ) | | $ | (0.02 | ) | | $ | (0.69 | ) | | $ | (0.71 | ) |
| | 2016 - C | | | 10.12 | | | | (0.02 | )(d) | | | (0.40 | ) | | | (0.42 | ) | | | — | | | | (0.69 | ) | | | (0.69 | ) |
| | 2016 - Institutional | | | 12.53 | | | | 0.04 | (d) | | | (0.50 | ) | | | (0.46 | ) | | | (0.05 | ) | | | (0.69 | ) | | | (0.74 | ) |
| | 2016 - Service | | | 11.81 | | | | 0.01 | (d) | | | (0.47 | ) | | | (0.46 | ) | | | (0.01 | ) | | | (0.69 | ) | | | (0.70 | ) |
| | 2016 - IR | | | 12.53 | | | | 0.03 | (d) | | | (0.50 | ) | | | (0.47 | ) | | | (0.04 | ) | | | (0.69 | ) | | | (0.73 | ) |
| | 2016 - R | | | 11.74 | | | | — | (d) | | | (0.46 | ) | | | (0.46 | ) | | | (0.02 | ) | | | (0.69 | ) | | | (0.71 | ) |
| | 2016 - R6 | | | 12.53 | | | | 0.04 | (d) | | | (0.51 | ) | | | (0.47 | ) | | | (0.05 | ) | | | (0.69 | ) | | | (0.74 | ) |
| | | | | | | | | | | | | | | | | | | | | | | | | | | | | | |
| | FOR THE FISCAL YEARS ENDED AUGUST 31, | |
| | 2015 - A | | | 13.50 | | | | 0.02 | (f) | | | 0.42 | | | | 0.44 | | | | — | | | | (2.08 | ) | | | (2.08 | ) |
| | 2015 - C | | | 11.90 | | | | (0.07 | )(f) | | | 0.37 | | | | 0.30 | | | | — | | | | (2.08 | ) | | | (2.08 | ) |
| | 2015 - Institutional | | | 14.15 | | | | 0.07 | (f) | | | 0.43 | | | | 0.50 | | | | (0.04 | ) | | | (2.08 | ) | | | (2.12 | ) |
| | 2015 - Service | | | 13.47 | | | | — | (g)(f) | | | 0.42 | | | | 0.42 | | | | — | | | | (2.08 | ) | | | (2.08 | ) |
| | 2015 - IR | | | 14.14 | | | | 0.05 | (f) | | | 0.44 | | | | 0.49 | | | | (0.02 | ) | | | (2.08 | ) | | | (2.10 | ) |
| | 2015 - R | | | 13.42 | | | | (0.01 | )(f) | | | 0.41 | | | | 0.40 | | | | — | | | | (2.08 | ) | | | (2.08 | ) |
| | 2015 - R6 (Commenced July 31, 2015) | | | 13.36 | | | | 0.01 | (f) | | | (0.84 | ) | | | (0.83 | ) | | | — | | | | — | | | | — | |
| | 2014 - A | | | 12.29 | | | | (0.01 | ) | | | 3.06 | | | | 3.05 | | | | (0.01 | ) | | | (1.83 | ) | | | (1.84 | ) |
| | 2014 - C | | | 11.09 | | | | (0.10 | ) | | | 2.74 | | | | 2.64 | | | | — | | | | (1.83 | ) | | | (1.83 | ) |
| | 2014 - Institutional | | | 12.79 | | | | 0.04 | | | | 3.21 | | | | 3.25 | | | | (0.06 | ) | | | (1.83 | ) | | | (1.89 | ) |
| | 2014 - Service | | | 12.28 | | | | (0.02 | ) | | | 3.05 | | | | 3.03 | | | | (0.01 | ) | | | (1.83 | ) | | | (1.84 | ) |
| | 2014 - IR | | | 12.80 | | | | 0.02 | | | | 3.20 | | | | 3.22 | | | | (0.05 | ) | | | (1.83 | ) | | | (1.88 | ) |
| | 2014 - R | | | 12.26 | | | | (0.04 | ) | | | 3.05 | | | | 3.01 | | | | (0.02 | ) | | | (1.83 | ) | | | (1.85 | ) |
| | 2013 - A | | | 11.57 | | | | 0.06 | (h) | | | 1.58 | | | | 1.64 | | | | (0.05 | ) | | | (0.87 | ) | | | (0.92 | ) |
| | 2013 - C | | | 10.54 | | | | (0.04 | )(h) | | | 1.46 | | | | 1.42 | | | | — | | | | (0.87 | ) | | | (0.87 | ) |
| | 2013 - Institutional | | | 12.00 | | | | 0.10 | (h) | | | 1.66 | | | | 1.76 | | | | (0.10 | ) | | | (0.87 | ) | | | (0.97 | ) |
| | 2013 - Service | | | 11.59 | | | | 0.03 | (h) | | | 1.61 | | | | 1.64 | | | | (0.08 | ) | | | (0.87 | ) | | | (0.95 | ) |
| | 2013 - IR | | | 12.01 | | | | 0.07 | (h) | | | 1.68 | | | | 1.75 | | | | (0.09 | ) | | | (0.87 | ) | | | (0.96 | ) |
| | 2013 - R | | | 11.53 | | | | 0.03 | (h) | | | 1.60 | | | | 1.63 | | | | (0.03 | ) | | | (0.87 | ) | | | (0.90 | ) |
| | 2012 - A | | | 9.77 | | | | 0.01 | | | | 1.81 | | | | 1.82 | | | | (0.02 | ) | | | — | | | | (0.02 | ) |
| | 2012 - C | | | 8.95 | | | | (0.06 | ) | | | 1.65 | | | | 1.59 | | | | — | | | | — | | | | — | |
| | 2012 - Institutional | | | 10.14 | | | | 0.06 | | | | 1.86 | | | | 1.92 | | | | (0.06 | ) | | | — | | | | (0.06 | ) |
| | 2012 - Service | | | 9.80 | | | | 0.02 | | | | 1.79 | | | | 1.81 | | | | (0.02 | ) | | | — | | | | (0.02 | ) |
| | 2012 - IR | | | 10.10 | | | | 0.04 | | | | 1.87 | | | | 1.91 | | | | — | | | | — | | | | — | |
| | 2012 - R | | | 9.74 | | | | — | (g) | | | 1.79 | | | | 1.79 | | | | — | | | | — | | | | — | |
| | 2011 - A | | | 8.53 | | | | 0.02 | | | | 1.25 | | | | 1.27 | | | | (0.03 | ) | | | — | | | | (0.03 | ) |
| | 2011 - C | | | 7.86 | | | | (0.05 | ) | | | 1.14 | | | | 1.09 | | | | — | | | | — | | | | — | |
| | 2011 - Institutional | | | 8.85 | | | | 0.06 | | | | 1.30 | | | | 1.36 | | | | (0.07 | ) | | | — | | | | (0.07 | ) |
| | 2011 - Service | | | 8.55 | | | | 0.02 | | | | 1.25 | | | | 1.27 | | | | (0.02 | ) | | | — | | | | (0.02 | ) |
| | 2011 - IR | | | 8.84 | | | | 0.04 | | | | 1.29 | | | | 1.33 | | | | (0.07 | ) | | | — | | | | (0.07 | ) |
| | 2011 - R | | | 8.51 | | | | — | (g) | | | 1.24 | | | | 1.24 | | | | (0.01 | ) | | | — | | �� | | (0.01 | ) |
| | (a) | | Calculated based on the average shares outstanding methodology. |
| | (b) | | Assumes investment at the NAV at the beginning of the period, reinvestment of all dividends and distributions, a complete redemption of the investment at the NAV at the end of the period and no sales or redemption charges. Total returns would be reduced if a sales or redemption charge was taken into account. Returns do not reflect the deduction of taxes that a shareholder would pay on Fund distributions or the redemption of Fund shares. Total returns for periods less than one full year are not annualized. |
| | (c) | | The Fund’s portfolio turnover rate is calculated in accordance with regulatory requirements, without regard to transactions involving short term investments. If such transactions were included, the Fund’s portfolio turnover rate may be higher. |
| | (d) | | Reflects income recognized from special dividends which amounted to $0.02 per share and 0.26% of average net assets. |
| | (f) | | Reflects income recognized from special dividends which amounted to $0.02 per share and 0.18% of average net assets. |
| | (g) | | Amount is less than $0.005 per share. |
| | (h) | | Reflects income recognized from special dividends which amounted to $0.03 per share and 0.29% of average net assets. |
| | (i) | | Amount is less than 0.005% per share. |
| | |
| 102 | | The accompanying notes are an integral part of these financial statements. |
GOLDMAN SACHS STRATEGIC GROWTH FUND
| | | | | | | | | | | | | | | | | | | | | | | | | | | | | | | | | | | | | | | | |
| | | | | | | | | | | | | |
| | | Net asset
value, end
of period | | | | | Total
return(b) | | | | | Net assets,
end of
period
(in 000s) | | | | | Ratio of
net expenses
to average
net assets | | | | | Ratio of
total expenses
to average
net assets | | | | | Ratio of
net investment
income (loss)
to average
net assets | | | | | Portfolio
turnover
rate(c) | |
| | | | | | | | | | | | | | | | | | | | | | | | | | | | | | | | | | | | | | | | |
| | $ | 10.69 | | | | | | (4.41 | )% | | | | $ | 44,684 | | | | | | 1.15 | %(e) | | | | | 1.53 | %(e) | | | | | 0.26 | %(d)(e) | | | | | 26 | % |
| | | 9.01 | | | | | | (4.75 | ) | | | | | 10,866 | | | | | | 1.91 | (e) | | | | | 2.28 | (e) | | | | | (0.49 | )(d)(e) | | | | | 26 | |
| | | 11.33 | | | | | | (4.17 | ) | | | | | 347,539 | | | | | | 0.75 | (e) | | | | | 1.13 | (e) | | | | | 0.66 | (d)(e) | | | | | 26 | |
| | | 10.65 | | | | | | (4.45 | ) | | | | | 216 | | | | | | 1.25 | (e) | | | | | 1.63 | (e) | | | | | 0.18 | (d)(e) | | | | | 26 | |
| | | 11.33 | | | | | | (4.28 | ) | | | | | 761 | | | | | | 0.90 | (e) | | | | | 1.28 | (e) | | | | | 0.51 | (d)(e) | | | | | 26 | |
| | | 10.57 | | | | | | (4.47 | ) | | | | | 70 | | | | | | 1.40 | (e) | | | | | 1.78 | (e) | | | | | 0.03 | (d)(e) | | | | | 26 | |
| | | 11.32 | | | | | | (4.23 | ) | | | | | 9 | | | | | | 0.77 | (e) | | | | | 1.15 | (e) | | | | | 0.65 | (d)(e) | | | | | 26 | |
| | | | | | | | | | | | | | | | | | | | | | | | | | | | | | | | | | | | | | | | |
| | | | | | | | | | | | | | | | | | | | | | | | | | | | | | | | | | | | | | | | |
| | | 11.86 | | | | | | 3.09 | | | | | | 45,046 | | | | | | 1.15 | | | | | | 1.52 | | | | | | 0.13 | (f) | | | | | 52 | |
| | | 10.12 | | | | | | 2.23 | | | | | | 11,175 | | | | | | 1.90 | | | | | | 2.27 | | | | | | (0.63 | )(f) | | | | | 52 | |
| | | 12.53 | | | | | | 3.43 | | | | | | 326,619 | | | | | | 0.75 | | | | | | 1.12 | | | | | | 0.52 | (f) | | | | | 52 | |
| | | 11.81 | | | | | | 2.93 | | | | | | 254 | | | | | | 1.25 | | | | | | 1.62 | | | | | | (0.01 | )(f) | | | | | 52 | |
| | | 12.53 | | | | | | 3.34 | | | | | | 817 | | | | | | 0.90 | | | | | | 1.27 | | | | | | 0.37 | (f) | | | | | 52 | |
| | | 11.74 | | | | | | 2.78 | | | | | | 77 | | | | | | 1.40 | | | | | | 1.76 | | | | | | (0.07 | )(f) | | | | | 52 | |
| | | 12.53 | | | | | | (6.21 | ) | | | | | 9 | | | | | | 0.73 | (e) | | | | | 1.06 | (e) | | | | | 0.68 | (e)(f) | | | | | 52 | |
| | | 13.50 | | | | | | 26.74 | | | | | | 51,626 | | | | | | 1.16 | | | | | | 1.53 | | | | | | (0.10 | ) | | | | | 64 | |
| | | 11.90 | | | | | | 25.83 | | | | | | 11,717 | | | | | | 1.91 | | | | | | 2.28 | | | | | | (0.85 | ) | | | | | 64 | |
| | | 14.15 | | | | | | 27.32 | | | | | | 332,401 | | | | | | 0.76 | | | | | | 1.13 | | | | | | 0.30 | | | | | | 64 | |
| | | 13.47 | | | | | | 26.55 | | | | | | 156 | | | | | | 1.26 | | | | | | 1.63 | | | | | | (0.20 | ) | | | | | 64 | |
| | | 14.14 | | | | | | 27.03 | | | | | | 994 | | | | | | 0.91 | | | | | | 1.28 | | | | | | 0.15 | | | | | | 64 | |
| | | 13.42 | | | | | | 26.49 | | | | | | 15 | | | | | | 1.38 | | | | | | 1.75 | | | | | | (0.30 | ) | | | | | 64 | |
| | | 12.29 | | | | | | 15.53 | | | | | | 87,987 | | | | | | 1.15 | | | | | | 1.54 | | | | | | 0.49 | (h) | | | | | 55 | |
| | | 11.09 | | | | | | 14.68 | | | | | | 9,314 | | | | | | 1.90 | | | | | | 2.29 | | | | | | (0.35 | )(h) | | | | | 55 | |
| | | 12.79 | | | | | | 15.98 | | | | | | 242,865 | | | | | | 0.75 | | | | | | 1.14 | | | | | | 0.81 | (h) | | | | | 55 | |
| | | 12.28 | | | | | | 15.45 | | | | | | 82 | | | | | | 1.25 | | | | | | 1.64 | | | | | | 0.24 | (h) | | | | | 55 | |
| | | 12.80 | | | | | | 15.80 | | | | | | 884 | | | | | | 0.90 | | | | | | 1.29 | | | | | | 0.57 | (h) | | | | | 55 | |
| | | 12.26 | | | | | | 15.36 | | | | | | 6 | | | | | | 1.34 | | | | | | 1.73 | | | | | | 0.22 | (h) | | | | | 55 | |
| | | 11.57 | | | | | | 18.45 | | | | | | 181,257 | | | | | | 1.15 | | | | | | 1.51 | | | | | | 0.14 | | | | | | 54 | |
| | | 10.54 | | | | | | 17.71 | | | | | | 8,279 | | | | | | 1.90 | | | | | | 2.26 | | | | | | (0.61 | ) | | | | | 54 | |
| | | 12.00 | | | | | | 18.97 | | | | | | 256,389 | | | | | | 0.75 | | | | | | 1.11 | | | | | | 0.54 | | | | | | 54 | |
| | | 11.59 | | | | | | 18.50 | | | | | | 52 | | | | | | 1.25 | | | | | | 1.61 | | | | | | 0.18 | | | | | | 54 | |
| | | 12.01 | | | | | | 18.85 | | | | | | 321 | | | | | | 0.90 | | | | | | 1.26 | | | | | | 0.38 | | | | | | 54 | |
| | | 11.53 | | | | | | 18.32 | | | | | | 4 | | | | | | 1.40 | | | | | | 1.76 | | | | | | (0.05 | ) | | | | | 54 | |
| | | 9.77 | | | | | | 14.89 | | | | | | 199,185 | | | | | | 1.15 | | | | | | 1.51 | | | | | | 0.19 | | | | | | 40 | |
| | | 8.95 | | | | | | 13.87 | | | | | | 8,828 | | | | | | 1.90 | | | | | | 2.26 | | | | | | (0.56 | ) | | | | | 40 | |
| | | 10.14 | | | | | | 15.33 | | | | | | 260,481 | | | | | | 0.75 | | | | | | 1.11 | | | | | | 0.58 | | | | | | 40 | |
| | | 9.80 | | | | | | 14.90 | | | | | | 2 | | | | | | 1.25 | | | | | | 1.61 | | | | | | 0.21 | | | | | | 40 | |
| | | 10.10 | | | | | | 14.99 | | | | | | 125 | | | | | | 0.90 | | | | | | 1.26 | | | | | | 0.42 | | | | | | 40 | |
| | | 9.74 | | | | | | 14.52 | | | | | | 4 | | | | | | 1.40 | | | | | | 1.76 | | | | | | – | (i) | | | | | 40 | |
| | |
| The accompanying notes are an integral part of these financial statements. | | 103 |
GOLDMAN SACHS TECHNOLOGY OPPORTUNITIES FUND
Financial Highlights
Selected Data for a Share Outstanding Throughout Each Period
| | | | | | | | | | | | | | | | | | | | | | |
| | | | | | | | Income (loss) from
investment operations | | | | |
| | | Year - Share Class | | Net asset
value,
beginning
of period | | | Net
investment
income (loss)(a) | | | Net realized
and unrealized
gain (loss) | | | Total from
investment
operations | | | Distributions
to shareholders
from net
realized
gains | |
| | FOR THE SIX MONTHS ENDED FEBRUARY 29, (UNAUDITED) | |
| | 2016 - A | | $ | 17.93 | | | $ | (0.05 | )(d) | | $ | (0.73 | ) | | $ | (0.78 | ) | | $ | (1.58 | ) |
| | 2016 - C | | | 15.70 | | | | (0.10 | )(d) | | | (0.61 | ) | | | (0.71 | ) | | | (1.58 | ) |
| | 2016 - Institutional | | | 19.22 | | | | (0.02 | )(d) | | | (0.79 | ) | | | (0.81 | ) | | | (1.58 | ) |
| | 2016 - Service | | | 17.69 | | | | (0.06 | )(d) | | | (0.72 | ) | | | (0.78 | ) | | | (1.58 | ) |
| | 2016 - IR | | | 19.07 | | | | (0.03 | )(d) | | | (0.79 | ) | | | (0.82 | ) | | | (1.58 | ) |
| | | | | | | | | | | | | | | | | | | | | | |
| | FOR THE FISCAL YEARS ENDED AUGUST 31, | |
| | 2015 - A | | | 18.97 | | | | (0.14 | )(f) | | | 0.57 | | | | 0.43 | | | | (1.47 | ) |
| | 2015 - C | | | 16.91 | | | | (0.24 | )(f) | | | 0.50 | | | | 0.26 | | | | (1.47 | ) |
| | 2015 - Institutional | | | 20.16 | | | | (0.07 | )(f) | | | 0.60 | | | | 0.53 | | | | (1.47 | ) |
| | 2015 - Service | | | 18.76 | | | | (0.15 | )(f) | | | 0.55 | | | | 0.40 | | | | (1.47 | ) |
| | 2015 - IR | | | 20.04 | | | | (0.10 | )(f) | | | 0.60 | | | | 0.50 | | | | (1.47 | ) |
| | 2014 - A | | | 15.20 | | | | (0.15 | ) | | | 4.16 | | | | 4.01 | | | | (0.24 | ) |
| | 2014 - C | | | 13.68 | | | | (0.25 | ) | | | 3.72 | | | | 3.47 | | | | (0.24 | ) |
| | 2014 - Institutional | | | 16.08 | | | | (0.08 | ) | | | 4.40 | | | | 4.32 | | | | (0.24 | ) |
| | 2014 - Service | | | 15.04 | | | | (0.16 | ) | | | 4.12 | | | | 3.96 | | | | (0.24 | ) |
| | 2014 - IR | | | 16.01 | | | | (0.11 | ) | | | 4.38 | | | | 4.27 | | | | (0.24 | ) |
| | 2013 - A | | | 13.62 | | | | (0.12 | ) | | | 1.70 | | | | 1.58 | | | | — | |
| | 2013 - C | | | 12.34 | | | | (0.20 | ) | | | 1.54 | | | | 1.34 | | | | — | |
| | 2013 - Institutional | | | 14.34 | | | | (0.06 | ) | | | 1.80 | | | | 1.74 | | | | — | |
| | 2013 - Service | | | 13.49 | | | | (0.13 | ) | | | 1.68 | | | | 1.55 | | | | — | |
| | 2013 - IR | | | 14.30 | | | | (0.09 | ) | | | 1.80 | | | | 1.71 | | | | — | |
| | 2012 - A | | | 11.51 | | | | (0.13 | ) | | | 2.24 | | | | 2.11 | | | | — | |
| | 2012 - C | | | 10.51 | | | | (0.21 | ) | | | 2.04 | | | | 1.83 | | | | — | |
| | 2012 - Institutional | | | 12.08 | | | | (0.09 | ) | | | 2.35 | | | | 2.26 | | | | — | |
| | 2012 - Service | | | 11.41 | | | | (0.14 | ) | | | 2.22 | | | | 2.08 | | | | — | |
| | 2012 - IR | | | 12.06 | | | | (0.11 | ) | | | 2.35 | | | | 2.24 | | | | — | |
| | 2011 - A | | | 10.43 | | | | (0.14 | ) | | | 1.22 | | | | 1.08 | | | | — | |
| | 2011 - C | | | 9.59 | | | | (0.21 | ) | | | 1.13 | | | | 0.92 | | | | — | |
| | 2011 - Institutional | | | 10.90 | | | | (0.09 | ) | | | 1.27 | | | | 1.18 | | | | — | |
| | 2011 - Service | | | 10.34 | | | | (0.15 | ) | | | 1.22 | | | | 1.07 | | | | — | |
| | 2011 - IR (Commenced September 30, 2010) | | | 12.30 | | | | (0.07 | ) | | | (0.17 | ) | | | (0.24 | ) | | | — | |
| | (a) | | Calculated based on the average shares outstanding methodology. |
| | (b) | | Assumes investment at the NAV at the beginning of the period, reinvestment of all dividends and distributions, a complete redemption of the investment at the NAV at the end of the period and no sales or redemption charges. Total returns would be reduced if a sales or redemption charge was taken into account. Returns do not reflect the deduction of taxes that a shareholder would pay on Fund distributions or the redemption of Fund shares. Total returns for periods less than one full year are not annualized. |
| | (c) | | The Fund’s portfolio turnover rate is calculated in accordance with regulatory requirements, without regard to transactions involving short term investments. If such transactions were included, the Fund’s portfolio turnover rate may be higher. |
| | (d) | | Reflects income recognized from special dividends which amounted to $0.02 per share and 0.24% of average net assets. |
| | (f) | | Reflects income recognized from special dividends which amounted to $0.02 per share and 0.10% of average net assets. |
| | |
| 104 | | The accompanying notes are an integral part of these financial statements. |
GOLDMAN SACHS TECHNOLOGY OPPORTUNITIES FUND
| | | | | | | | | | | | | | | | | | | | | | | | | | | | | | | | | | | | | | | | |
| | | | | | | | | | | | | |
| | | Net asset
value, end
of period | | | | | Total
return(b) | | | | | Net assets,
end of
period
(in 000s) | | | | | Ratio of
net expenses
to average
net assets | | | | | Ratio of
total expenses
to average
net assets | | | | | Ratio of
net investment
income (loss)
to average
net assets | | | | | Portfolio
turnover
rate(c) | |
| | | | | | | | | | | | | | | | | | | | | | | | | | | | | | | | | | | | | | | | |
| | $ | 15.57 | | | | | | (5.44 | )% | | $ | | | 212,873 | | | | | | 1.48 | %(e) | | | | | 1.55 | %(e) | | | | | (0.60 | )%(d)(e) | | | | | 16 | % |
| | | 13.41 | | | | | | (5.78 | ) | | | | | 47,149 | | | | | | 2.23 | (e) | | | | | 2.30 | (e) | | | | | (1.35 | )(d)(e) | | | | | 16 | |
| | | 16.83 | | | | | | (5.23 | ) | | | | | 78,697 | | | | | | 1.08 | (e) | | | | | 1.15 | (e) | | | | | (0.18 | )(d)(e) | | | | | 16 | |
| | | 15.33 | | | | | | (5.52 | ) | | | | | 10,398 | | | | | | 1.58 | (e) | | | | | 1.65 | (e) | | | | | (0.71 | )(d)(e) | | | | | 16 | |
| | | 16.67 | | | | | | (5.32 | ) | | | | | 5,582 | | | | | | 1.23 | (e) | | | | | 1.30 | (e) | | | | | (0.35 | )(d)(e) | | | | | 16 | |
| | | | | | | | | | | | | | | | | | | | | | | | | | | | | | | | | | | | | | | | |
| | | | | | | | | | | | | | | | | | | | | | | | | | | | | | | | | | | | | | | | |
| | | 17.93 | | | | | | 2.31 | | | | | | 250,087 | | | | | | 1.48 | | | | | | 1.54 | | | | | | (0.74 | )(f) | | | | | 41 | |
| | | 15.70 | | | | | | 1.53 | | | | | | 53,556 | | | | | | 2.23 | | | | | | 2.29 | | | | | | (1.49 | )(f) | | | | | 41 | |
| | | 19.22 | | | | | | 2.68 | | | | | | 92,483 | | | | | | 1.08 | | | | | | 1.14 | | | | | | (0.33 | )(f) | | | | | 41 | |
| | | 17.69 | | | | | | 2.17 | | | | | | 10,329 | | | | | | 1.58 | | | | | | 1.64 | | | | | | (0.84 | )(f) | | | | | 41 | |
| | | 19.07 | | | | | | 2.54 | | | | | | 6,103 | | | | | | 1.23 | | | | | | 1.29 | | | | | | (0.52 | )(f) | | | | | 41 | |
| | | 18.97 | | | | | | 26.55 | | | | | | 260,982 | | | | | | 1.51 | | | | | | 1.55 | | | | | | (0.85 | ) | | | | | 39 | |
| | | 16.91 | | | | | | 25.54 | | | | | | 58,602 | | | | | | 2.26 | | | | | | 2.30 | | | | | | (1.60 | ) | | | | | 39 | |
| | | 20.16 | | | | | | 27.03 | | | | | | 99,039 | | | | | | 1.11 | | | | | | 1.15 | | | | | | (0.45 | ) | | | | | 39 | |
| | | 18.76 | | | | | | 26.49 | | | | | | 10,712 | | | | | | 1.61 | | | | | | 1.65 | | | | | | (0.96 | ) | | | | | 39 | |
| | | 20.04 | | | | | | 26.83 | | | | | | 3,228 | | | | | | 1.26 | | | | | | 1.30 | | | | | | (0.59 | ) | | | | | 39 | |
| | | 15.20 | | | | | | 11.60 | | | | | | 228,424 | | | | | | 1.50 | | | | | | 1.55 | | | | | | (0.85 | ) | | | | | 33 | |
| | | 13.68 | | | | | | 10.86 | | | | | | 50,278 | | | | | | 2.25 | | | | | | 2.30 | | | | | | (1.59 | ) | | | | | 33 | |
| | | 16.08 | | | | | | 12.13 | | | | | | 70,416 | | | | | | 1.10 | | | | | | 1.15 | | | | | | (0.43 | ) | | | | | 33 | |
| | | 15.04 | | | | | | 11.49 | | | | | | 10,167 | | | | | | 1.60 | | | | | | 1.65 | | | | | | (0.95 | ) | | | | | 33 | |
| | | 16.01 | | | | | | 11.96 | | | | | | 2,651 | | | | | | 1.25 | | | | | | 1.30 | | | | | | (0.59 | ) | | | | | 33 | |
| | | 13.62 | | | | | | 18.28 | | | | | | 239,355 | | | | | | 1.50 | | | | | | 1.55 | | | | | | (1.06 | ) | | | | | 43 | |
| | | 12.34 | | | | | | 17.36 | | | | | | 50,682 | | | | | | 2.25 | | | | | | 2.30 | | | | | | (1.81 | ) | | | | | 43 | |
| | | 14.34 | | | | | | 18.65 | | | | | | 49,238 | | | | | | 1.10 | | | | | | 1.15 | | | | | | (0.66 | ) | | | | | 43 | |
| | | 13.49 | | | | | | 18.18 | | | | | | 10,977 | | | | | | 1.60 | | | | | | 1.65 | | | | | | (1.15 | ) | | | | | 43 | |
| | | 14.30 | | | | | | 18.52 | | | | | | 2,569 | | | | | | 1.25 | | | | | | 1.30 | | | | | | (0.81 | ) | | | | | 43 | |
| | | 11.51 | | | | | | 10.35 | | | | | | 244,288 | | | | | | 1.50 | | | | | | 1.52 | | | | | | (1.07 | ) | | | | | 64 | |
| | | 10.51 | | | | | | 9.59 | | | | | | 50,424 | | | | | | 2.25 | | | | | | 2.27 | | | | | | (1.82 | ) | | | | | 64 | |
| | | 12.08 | | | | | | 10.83 | | | | | | 54,356 | | | | | | 1.10 | | | | | | 1.12 | | | | | | (0.66 | ) | | | | | 64 | |
| | | 11.41 | | | | | | 10.35 | | | | | | 10,826 | | | | | | 1.60 | | | | | | 1.62 | | | | | | (1.18 | ) | | | | | 64 | |
| | | 12.06 | | | | | | (1.95 | ) | | | | | 2,449 | | | | | | 1.25 | (e) | | | | | 1.27 | (e) | | | | | (0.59 | )(e) | | | | | 64 | |
| | |
| The accompanying notes are an integral part of these financial statements. | | 105 |
GOLDMAN SACHS FUNDAMENTAL EQUITY GROWTH FUNDS
Notes to Financial Statements
February 29, 2016 (Unaudited)
Goldman Sachs Trust (the “Trust”) is a Delaware statutory trust registered under the Investment Company Act of 1940, as amended (the “Act”), as an open-end management investment company. The following table lists those series of the Trust that are included in this report (collectively, the “Funds” or individually a “Fund”), along with their corresponding share classes and respective diversification status under the Act:
| | | | |
| Fund | | Share Classes Offered | | Diversified/ Non-diversified |
Capital Growth, Growth Opportunities, Small/Mid Cap Growth and Strategic Growth | | A, C, Institutional, Service, IR, R and R6* | | Diversified |
Concentrated Growth and Focused Growth | | A, C, Institutional, IR, R and R6* | | Non-diversified |
Dynamic U.S. Equity + and Flexible Cap Growth | | A, C, Institutional, IR, R and R6* | | Diversified |
Technology Opportunities^ | | A, C, Institutional, Service and IR | | Diversified |
| * | | Class R6 Shares commenced operations on July 31, 2015. |
| + | | Formerly, Goldman Sachs U.S. Equity Fund. Effective after the close of business on April 30, 2015, the Fund changed its name to Goldman Sachs Dynamic U.S. Equity Fund. |
| ^ | | Formerly, Goldman Sachs Technology Tollkeeper Fund. Effective after the close of business on July 31, 2015, the Fund changed its name to Goldman Sachs Technology Opportunities Fund. |
Class A Shares are sold with a front-end sales charge of up to 5.50%. Class C Shares are sold with a contingent deferred sales charge (“CDSC”) of 1.00%, which is imposed on redemptions made within 12 months of purchase. Institutional, Service, Class IR, Class R and Class R6 Shares are not subject to a sales charge.
Goldman Sachs Asset Management, L.P. (“GSAM”), an affiliate of Goldman, Sachs & Co. (“Goldman Sachs”), serves as investment adviser to the Funds pursuant to a management agreement (the “Agreement”) with the Trust.
106
GOLDMAN SACHS FUNDAMENTAL EQUITY GROWTH FUNDS
|
| 2. SIGNIFICANT ACCOUNTING POLICIES |
The financial statements have been prepared in accordance with accounting principles generally accepted in the United States of America (“GAAP”) and require management to make estimates and assumptions that may affect the reported amounts and disclosures. Actual results may differ from those estimates and assumptions.
A. Investment Valuation — The Funds’ valuation policy is to value investments at fair value.
B. Investment Income and Investments — Investment income includes interest income and dividend income, net of any foreign withholding taxes, less any amounts reclaimable. Interest income is accrued daily and adjusted for amortization of premiums and accretion of discounts. Dividend income is recognized on ex-dividend date or, for certain foreign securities, as soon as such information is obtained subsequent to the ex-dividend date. Investment transactions are reflected on trade date. Realized gains and losses are calculated using identified cost. Investment transactions are recorded on the following business day for daily net asset value (“NAV”) calculations. Any foreign capital gains tax is accrued daily based upon net unrealized gains, and is payable upon sale of such investments. Distributions received from the Funds’ investments in U.S. real estate investment trusts (“REITs”) may be characterized as ordinary income, net capital gain or a return of capital. A return of capital is recorded by the Funds as a reduction to the cost basis of the REIT.
C. Class Allocations and Expenses — Investment income, realized and unrealized gain (loss), and non-class specific expenses of each Fund are allocated daily based upon the proportion of net assets of each class. Non-class specific expenses directly incurred by a Fund are charged to that Fund, while such expenses incurred by the Trust are allocated across the applicable Funds on a straight-line and/or pro-rata basis depending upon the nature of the expenses. Class specific expenses, where applicable, are borne by the respective share classes and include Distribution and Service, Transfer Agency and Service and Shareholder Administration fees.
D. Federal Taxes and Distributions to Shareholders — It is each Fund’s policy to comply with the requirements of the Internal Revenue Code of 1986, as amended (the “Code”), applicable to regulated investment companies (mutual funds) and to distribute each year substantially all of its investment company taxable income and capital gains to its shareholders. Accordingly, the Funds are not required to make any provisions for the payment of federal income tax. Distributions to shareholders are recorded on the ex-dividend date. Income and capital gains distributions, if any, are declared and paid annually.
E. Commission Recapture — GSAM, on behalf of certain Funds, may direct portfolio trades, subject to seeking best execution, to various brokers who have agreed to rebate a portion of the commissions generated. Such rebates are made directly to a Fund as cash payments and are included in net realized gain (loss) from investments on the Statements of Operations.
107
GOLDMAN SACHS FUNDAMENTAL EQUITY GROWTH FUNDS
Notes to Financial Statements (continued)
February 29, 2016 (Unaudited)
|
| 3. INVESTMENTS AND FAIR VALUE MEASUREMENTS |
The fair value of a financial instrument is the amount that would be received to sell an asset or paid to transfer a liability in an orderly transaction between market participants at the measurement date (i.e., the exit price). GAAP establishes a fair value hierarchy that prioritizes the inputs to valuation techniques used to measure fair value. The hierarchy gives the highest priority to unadjusted quoted prices in active markets for identical assets or liabilities (Level 1 measurements) and the lowest priority to unobservable inputs (Level 3 measurements). The levels used for classifying investments are not necessarily an indication of the risk associated with investing in these investments. The three levels of the fair value hierarchy are described below:
Level 1 — Unadjusted quoted prices in active markets that are accessible at the measurement date for identical, unrestricted assets or liabilities;
Level 2 — Quoted prices in markets that are not active or financial instruments for which significant inputs are observable (including, but not limited to, quoted prices for similar investments, interest rates, foreign exchange rates, volatility and credit spreads), either directly or indirectly;
Level 3 — Prices or valuations that require significant unobservable inputs (including GSAM’s assumptions in determining fair value measurement).
Changes in valuation techniques may result in transfers into or out of an assigned level within the hierarchy. In accordance with the Funds’ policy, transfers between different levels of the fair value hierarchy resulting from such changes are deemed to have occurred as of the beginning of the reporting period.
The Board of Trustees (“Trustees”) has approved Valuation Procedures that govern the valuation of the portfolio investments held by the Funds, including investments for which market quotations are not readily available. The Trustees have delegated to GSAM day-to-day responsibility for implementing and maintaining internal controls and procedures related to the valuation of the Funds’ portfolio investments. To assess the continuing appropriateness of pricing sources and methodologies, GSAM regularly performs price verification procedures and issues challenges as necessary to third party pricing vendors or brokers, and any differences are reviewed in accordance with the Valuation Procedures.
A. Level 1 and Level 2 Fair Value Investments — The valuation techniques and significant inputs used in determining the fair values for investments classified as Level 1 and Level 2 are as follows:
Equity Securities — Equity securities traded on a United States (“U.S.”) securities exchange or the NASDAQ system, or those located on certain foreign exchanges, including but not limited to the Americas, are valued daily at their last sale price or official closing price on the principal exchange or system on which they are traded. If there is no sale or official closing price or such price is believed by GSAM to not represent fair value, equity securities are valued at the last bid price for long positions and at the last ask price for short positions. To the extent these investments are actively traded, they are classified as Level 1 of the fair value hierarchy, otherwise they are generally classified as Level 2.
108
GOLDMAN SACHS FUNDAMENTAL EQUITY GROWTH FUNDS
|
| 3. INVESTMENTS AND FAIR VALUE MEASUREMENTS (continued) |
Unlisted equity securities for which market quotations are available are valued at the last sale price on the valuation date, or if no sale occurs, at the last bid price. Securities traded on certain foreign securities exchanges are valued daily at fair value determined by an independent fair value service (if available) under Valuation Procedures approved by the Trustees and consistent with applicable regulatory guidance. The independent fair value service takes into account multiple factors including, but not limited to, movements in the securities markets, certain depositary receipts, futures contracts and foreign currency exchange rates that have occurred subsequent to the close of the foreign securities exchange. These investments are generally classified as Level 2 of the fair value hierarchy.
Money Market Funds — Investments in the Goldman Sachs Financial Square Government Fund (“Underlying Fund”) are valued at the NAV of the FST Institutional Share class on the day of valuation. These investments are generally classified as Level 1 of the fair value hierarchy. For information regarding an Underlying Fund’s accounting policies and investment holdings, please see the Underlying Fund’s shareholder report.
Short Term Investments — Short-term investments having a maturity of 60 days or less are generally valued at amortized cost which approximates fair market value. These investments are classified as Level 2 of the fair value hierarchy.
Repurchase Agreements — Repurchase agreements involve the purchase of securities subject to the seller’s agreement to repurchase the securities at a mutually agreed upon date and price, under the terms of a Master Repurchase Agreement (“MRA”). During the term of a repurchase agreement, the value of the underlying securities held as collateral on behalf of a Fund, including accrued interest, is required to exceed the value of the repurchase agreement, including accrued interest. The gross value of repurchase agreements is included in the Statements of Assets and Liabilities for financial reporting purposes. The underlying securities for all repurchase agreements are held at the Funds’ custodian or designated sub-custodians under tri-party repurchase agreements.
An MRA governs transactions between a Fund and select counterparties. An MRA contains provisions for, among other things, initiation of the transaction, income payments, events of default and maintenance of securities for repurchase agreements. An MRA also permits offsetting with collateral to create one single net payment in the event of default or similar events, including the bankruptcy or insolvency of a counterparty.
If the seller defaults, a Fund could suffer a loss to the extent that the proceeds from the sale of the underlying securities and other collateral held by the Fund are less than the repurchase price and the Fund’s costs associated with delay and enforcement of the repurchase agreement. In addition, in the event of default or insolvency of the seller, a court could determine that a Fund’s interest in the collateral is not enforceable, resulting in additional losses to the Fund.
Pursuant to exemptive relief granted by the Securities and Exchange Commission (“SEC”) and terms and conditions contained therein, the Funds, together with other funds of the Trust and registered investment companies having management agreements with GSAM or its affiliates, may transfer uninvested cash into joint accounts, the daily aggregate balance of which is invested in one or more repurchase agreements. Under these joint accounts, the Funds maintain pro-rata credit exposure to the underlying repurchase agreements’ counterparties. With the exception of certain transaction fees, the Funds are not subject to any expenses in relation to these investments.
B. Level 3 Fair Value Investments — To the extent that significant inputs to valuation models and other alternative pricing sources are unobservable, or if quotations are not readily available, or if GSAM believes that such quotations do not accurately reflect fair value, the fair value of the Funds’ investments may be determined under Valuation Procedures approved by the Trustees. GSAM, consistent with its procedures and applicable regulatory guidance, may make an adjustment to the most recent valuation prices of either domestic or foreign securities in light of significant events to reflect what it believes to be the fair value of the securities at the time of determining a Fund’s NAV. Significant events which could affect a large number of securities in a particular market may include, but are not limited to: significant fluctuations in U.S. or foreign markets; market dislocations; market disruptions; or unscheduled market closings. Significant events which could also affect a single issuer may include, but are not limited to: corporate actions such as reorganizations, mergers and buy-outs; ratings downgrades; and bankruptcies.
109
GOLDMAN SACHS FUNDAMENTAL EQUITY GROWTH FUNDS
Notes to Financial Statements (continued)
February 29, 2016 (Unaudited)
|
| 3. INVESTMENTS AND FAIR VALUE MEASUREMENTS (continued) |
C. Fair Value Hierarchy — The following is a summary of the Funds’ investments classified in the fair value hierarchy as of February 29, 2016:
| | | | | | | | | | | | |
| | | |
| CAPITAL GROWTH FUND | | | | | | | | | | | | |
| | | |
| Investment Type | | Level 1 | | | Level 2 | | | Level 3 | |
| Assets | | | | | | | | | | | | |
Common Stock and/or Other Equity Investments(a) | | | | | | | | | | | | |
Europe | | $ | 9,377,875 | | | $ | — | | | $ | — | |
North America | | | 794,222,618 | | | | — | | | | — | |
Short-term Investments | | | — | | | | 8,800,000 | | | | — | |
| Total | | $ | 803,600,493 | | | $ | 8,800,000 | | | $ | — | |
| | | |
| CONCENTRATED GROWTH FUND | | | | | | | | | | | | |
| | | |
| Investment Type | | Level 1 | | | Level 2 | | | Level 3 | |
| Assets | | | | | | | | | | | | |
Common Stock and/or Other Equity Investments(a) | | | | | | | | | | | | |
Europe | | $ | 2,685,107 | | | $ | — | | | $ | — | |
North America | | | 140,886,064 | | | | — | | | | — | |
Short-term Investments | | | — | | | | 4,700,000 | | | | — | |
| Total | | $ | 143,571,171 | | | $ | 4,700,000 | | | $ | — | |
| | | |
| DYNAMIC U.S. EQUITY FUND | | | | | | | | | | | | |
| | | |
| Investment Type | | Level 1 | | | Level 2 | | | Level 3 | |
| Assets | | | | | | | | | | | | |
Common Stock and/or Other Equity Investments(a) | | | | | | | | | | | | |
North America | | $ | 10,724,906 | | | $ | — | | | $ | — | |
Short-term Investments | | | — | | | | 100,000 | | | | — | |
| Total | | $ | 10,724,906 | | | $ | 100,000 | | | $ | — | |
| | | |
| FLEXIBLE CAP GROWTH FUND | | | | | | | | | | | | |
| | | |
| Investment Type | | Level 1 | | | Level 2 | | | Level 3 | |
| Assets | | | | | | | | | | | | |
Common Stock and/or Other Equity Investments(a) | | | | | | | | | | | | |
Europe | | $ | 105,718 | | | $ | — | | | $ | — | |
North America | | | 15,903,341 | | | | — | | | | — | |
Short-term Investments | | | — | | | | 100,000 | | | | — | |
| Total | | $ | 16,009,059 | | | $ | 100,000 | | | $ | — | |
110
GOLDMAN SACHS FUNDAMENTAL EQUITY GROWTH FUNDS
|
| 3. INVESTMENTS AND FAIR VALUE MEASUREMENTS (continued) |
| | | | | | | | | | | | |
| | | |
| FOCUSED GROWTH FUND | | | | | | | | | | | | |
| | | |
| Investment Type | | Level 1 | | | Level 2 | | | Level 3 | |
| Assets | | | | | | | | | | | | |
Common Stock and/or Other Equity Investments(a) | | | | | | | | | | | | |
North America | | $ | 26,132,056 | | | $ | — | | | $ | — | |
Short-term Investments | | | — | | | | 900,000 | | | | — | |
| Total | | $ | 26,132,056 | | | $ | 900,000 | | | $ | — | |
| | | |
| GROWTH OPPORTUNITIES FUND | | | | | | | | | | | | |
| | | |
| Investment Type | | Level 1 | | | Level 2 | | | Level 3 | |
| Assets | | | | | | | | | | | | |
Common Stock and/or Other Equity Investments(a) | | | | | | | | | | | | |
Europe | | $ | 17,964,160 | | | $ | — | | | $ | — | |
North America | | | 3,368,900,079 | | | | — | | | | — | |
Investment Company | | | 82,010,369 | | | | — | | | | — | |
| Total | | $ | 3,468,874,608 | | | $ | — | | | $ | — | |
| | | |
| SMALL/MID CAP GROWTH FUND | | | | | | | | | | | | |
| | | |
| Investment Type | | Level 1 | | | Level 2 | | | Level 3 | |
| Assets | | | | | | | | | | | | |
Common Stock and/or Other Equity Investments(a) | | | | | | | | | | | | |
Asia | | $ | 15,405,589 | | | $ | — | | | $ | — | |
Europe | | | 70,692,445 | | | | — | | | | — | |
North America | | | 2,365,493,682 | | | | — | | | | — | |
Short-term Investments | | | — | | | | 41,700,000 | | | | — | |
| Total | | $ | 2,451,591,716 | | | $ | 41,700,000 | | | $ | — | |
| | | |
| STRATEGIC GROWTH FUND | | | | | | | | | | | | |
| | | |
| Investment Type | | Level 1 | | | Level 2 | | | Level 3 | |
| Assets | | | | | | | | | | | | |
Common Stock and/or Other Equity Investments(a) | | | | | | | | | | | | |
Europe | | $ | 6,655,102 | | | $ | — | | | $ | — | |
North America | | | 382,634,788 | | | | — | | | | — | |
Short-term Investments | | | — | | | | 16,900,000 | | | | — | |
| Total | | $ | 389,289,890 | | | $ | 16,900,000 | | | $ | — | |
111
GOLDMAN SACHS FUNDAMENTAL EQUITY GROWTH FUNDS
Notes to Financial Statements (continued)
February 29, 2016 (Unaudited)
|
| 3. INVESTMENTS AND FAIR VALUE MEASUREMENTS (continued) |
| | | | | | | | | | | | |
| | | |
| TECHNOLOGY OPPORTUNITIES FUND | | | | | | | | | | | | |
| | | |
| Investment Type | | Level 1 | | | Level 2 | | | Level 3 | |
| Assets | | | | | | | | | | | | |
Common Stock and/or Other Equity Investments(a) | | | | | | | | | | | | |
Europe | | $ | 13,305,922 | | | $ | — | | | $ | — | |
North America | | | 340,033,115 | | | | — | | | | — | |
Short-term Investments | | | — | | | | 1,900,000 | | | | — | |
| Total | | $ | 353,339,037 | | | $ | 1,900,000 | | | $ | — | |
| (a) | | Amounts are disclosed by continent to highlight the impact of time zone differences between local market close and the calculation of net asset value. Security valuations are based on the principle exchange or system on which they are traded, which may differ from country of domicile. |
|
| 4. AGREEMENTS AND AFFILIATED TRANSACTIONS |
A. Management Agreement — Under the Agreement, GSAM manages the Funds, subject to the general supervision of the Trustees.
As compensation for the services rendered pursuant to the Agreement, the assumption of the expenses related thereto and administration of the Funds’ business affairs, including providing facilities, GSAM is entitled to a management fee, accrued daily and paid monthly, equal to an annual percentage rate of each Fund’s average daily net assets.
For the six months ended February 29, 2016, contractual and effective net management fees with GSAM were at the following rates:
| | | | | | | | | | | | | | | | | | | | | | | | | | | | | | |
| | | | | Contractual Management Rate | | | Effective Net
Management
Rate | |
| Fund | | | | First
$1 billion | | | Next
$1 billion | | | Next
$3 billion | | | Next
$3 billion | | | Over
$8 billion | | | Effective
Rate | | |
Capital Growth | | | | | 1.00 | % | | | 0.90 | % | | | 0.80 | % | | | 0.80 | % | | | 0.80 | % | | | 1.00 | % | | | 0.71 | %# |
Concentrated Growth | | | | | 1.00 | | | | 0.90 | | | | 0.86 | | | | 0.84 | | | | 0.82 | | | | 1.00 | | | | 0.78 | # |
Dynamic U.S. Equity | | | | | 0.70 | | | | 0.63 | | | | 0.60 | | | | 0.59 | | | | 0.58 | | | | 0.70 | | | | 0.70 | |
Flexible Cap Growth | | | | | 1.00 | | | | 0.90 | | | | 0.86 | | | | 0.84 | | | | 0.82 | | | | 1.00 | | | | 0.78 | # |
Focused Growth | | | | | 1.00 | | | | 0.90 | | | | 0.86 | | | | 0.84 | | | | 0.82 | | | | 1.00 | | | | 0.76 | #^ |
Growth Opportunities | | | | | 1.00 | | | | 1.00 | | | | 0.90 | | | | 0.86 | | | | 0.84 | | | | 0.94 | | | | 0.90 | # |
Small/Mid Cap Growth | | | | | 1.00 | | | | 1.00 | | | | 0.90 | | | | 0.86 | | | | 0.84 | | | | 0.99 | | | | 0.85 | # |
Strategic Growth | | | | | 1.00 | | | | 0.90 | | | | 0.86 | | | | 0.84 | | | | 0.82 | | | | 1.00 | | | | 0.71 | # |
Technology Opportunities | | | | | 1.00 | | | | 0.90 | | | | 0.86 | | | | 0.84 | | | | 0.82 | | | | 1.00 | | | | 1.00 | |
| # | | GSAM agreed to waive a portion of its management fee rates, set forth in the Funds’ most recent prospectuses. In addition, the Effective Net Management Rate includes the impact of management fee waivers of affiliated underlying funds, if any. These waivers will be effective through at least December 29, 2016, and prior to such date GSAM may not terminate the arrangements without the approval of the Trustees. |
| ^ | | Effective December 29, 2015, GSAM agreed to waive a portion of its management fee in order to achieve an Effective Net Management Rate of 0.76% for Focused Growth Fund. Prior to December 29, 2015, the Effective Net Management Rate for was 0.79%. |
112
GOLDMAN SACHS FUNDAMENTAL EQUITY GROWTH FUNDS
|
| 4. AGREEMENTS AND AFFILIATED TRANSACTIONS (continued) |
The Growth Opportunities Fund invests in the FST Institutional Shares of Goldman Sachs Financial Square Government Fund, which is an affiliated Underlying Fund. GSAM has agreed to waive a portion of its management fee payable by the Fund in an amount equal to the management fee it earns as an investment adviser to any of the affiliated Underlying Funds in which the Fund invests. For the six months ended February 29, 2016, GSAM waived $28,924 of the Fund’s management fee.
B. Distribution and Service Plans — The Trust, on behalf of each Fund, has adopted Distribution and Service Plans (the “Plans”). Under the Plans, Goldman Sachs, which serves as distributor (the “Distributor”), is entitled to a fee accrued daily and paid monthly, for distribution services and personal and account maintenance services, which may then be paid by Goldman Sachs to authorized dealers, at the following annual rates calculated on a Fund’s average daily net assets of each respective share class:
| | | | | | | | | | | | |
| | | Distribution and Service Plan Rates | |
| | | Class A* | | | Class C | | | Class R* | |
Distribution Plan | | | 0.25 | % | | | 0.75 | % | | | 0.50 | % |
Service Plan | | | — | | | | 0.25 | | | | — | |
| * | | With respect to Class A and Class R Shares, the Distributor at its discretion may use compensation for distribution services paid under the Distribution Plan to compensate service organizations for personal and account maintenance services and expenses as long as such total compensation does not exceed the maximum cap on “service fees” imposed by the Financial Industry Regulatory Authority. |
C. Distribution Agreement — Goldman Sachs, as Distributor of the shares of the Funds pursuant to a Distribution Agreement, may retain a portion of the Class A Shares’ front end sales charge and Class C Shares’ CDSC. During the six months ended February 29, 2016, Goldman Sachs advised that it retained the following amounts:
| | | | | | | | | | |
| | | | | Front End
Sales Charge | | | Contingent Deferred
Sales Charge | |
| Fund | | | | Class A | | | Class C | |
Capital Growth | | | | $ | 12,077 | | | $ | 372 | |
Concentrated Growth | | | | | 322 | | | | — | |
Dynamic U.S. Equity | | | | | 213 | | | | — | |
Flexible Cap Growth | | | | | 551 | | | | — | |
Focused Growth | | | | | 237 | | | | — | |
Growth Opportunities | | | | | 15,014 | | | | 466 | |
Small/Mid Cap Growth | | | | | 67,437 | | | | 10 | |
Strategic Growth | | | | | 2,177 | | | | 11 | |
Technology Opportunities | | | | | 6,553 | | | | 380 | |
D. Service Plan and Shareholder Administration Plan — The Trust, on behalf of each Fund that offers Service Shares, has adopted a Service Plan and a Shareholder Administration Plan. These plans allow for service organizations to provide varying levels of personal and account maintenance and shareholder administration services to their customers who are beneficial owners of such shares. The Service Plan and Shareholder Administration Plan each provide for compensation to the service organizations which is accrued daily and paid monthly at an annual rate of 0.25% (0.50% in aggregate) of the average daily net assets of the Service Shares.
113
GOLDMAN SACHS FUNDAMENTAL EQUITY GROWTH FUNDS
Notes to Financial Statements (continued)
February 29, 2016 (Unaudited)
|
| 4. AGREEMENTS AND AFFILIATED TRANSACTIONS (continued) |
E. Transfer Agency Agreement — Goldman Sachs also serves as the transfer agent of the Funds for a fee pursuant to the Transfer Agency Agreement. The fees charged for such transfer agency services are accrued daily and paid monthly at annual rates as follows: 0.19% of the average daily net assets of Class A, Class C, Class IR and Class R Shares; 0.02% of the average daily net assets of Class R6 Shares; and 0.04% of the average daily net assets of Institutional and Service Shares.
Effective December 29, 2015, Goldman Sachs agreed to waive a portion of its transfer agency fee equal to 0.05% as an annual percentage rate of the average daily net assets attributable to Class A, Class C, Class IR, and Class R Shares of the Growth Opportunities Fund. As a result of this waiver, a net transfer agency fee equal to 0.14% as an annual percentage rate of the average daily net assets attributable to Class A, Class C, Class IR, and Class R Shares of the Growth Opportunities Fund is being charged to those share classes. This arrangement will remain in effect through at least December 29, 2016, and prior to such date, the Investment Adviser may not terminate the arrangements without the approval of the Board of Trustees.
Effective December 29, 2015, Goldman Sachs agreed to waive a portion of its transfer agency fee equal to 0.03% as an annual percentage rate of the average daily net assets attributable to Class A, Class C, Class IR, and Class R Shares of the Small/Mid Cap Growth Fund. As a result of this waiver, a net transfer agency fee equal to 0.16% as an annual percentage rate of the average daily net assets attributable to Class A, Class C, Class IR, and Class R Shares of the Small/Mid Cap Growth Fund is being charged to those share classes. This arrangement will remain in effect through at least December 29, 2016, and prior to such date, the Investment Adviser may not terminate the arrangements without the approval of the Board of Trustees.
F. Other Expense Agreements and Affiliated Transactions — GSAM has agreed to limit certain “Other Expenses” of the Funds (excluding acquired fund fees and expenses, transfer agency fees and expenses, service fees, shareholder administration fees (as applicable), taxes, interest, brokerage fees, shareholder meeting, litigation, indemnification and extraordinary expenses) to the extent such expenses exceed, on an annual basis, a percentage rate of the average daily net assets of each Fund. Such Other Expense reimbursements, if any, are accrued daily and paid monthly. In addition, the Funds are not obligated to reimburse GSAM for prior fiscal year expense reimbursements, if any. The Other Expense limitations as an annual percentage rate of average daily net assets for Capital Growth, Concentrated Growth, Dynamic U.S. Equity, Flexible Cap Growth, Focused Growth, Growth Opportunities, Small/Mid Cap Growth, Strategic Growth, and Technology Opportunities Funds are 0.004%, 0.004%, 0.084%, 0.004%, 0.004%, 0.014%, 0.064%, 0.004%, and 0.034% respectively. Prior to December 29, 2015, the Other Expense limitation for Focused Growth Fund was 0.014%. These Other Expense limitations will remain in place through at least December 29, 2016, and prior to such date GSAM may not terminate the arrangements without the approval of the Trustees. In addition, the Funds have entered into certain offset arrangements with the transfer agent, which may result in a reduction of the Funds’ expenses and are received irrespective of the application of the “Other Expense” limitations described above.
114
GOLDMAN SACHS FUNDAMENTAL EQUITY GROWTH FUNDS
|
| 4. AGREEMENTS AND AFFILIATED TRANSACTIONS (continued) |
For the six months ended February 29, 2016, these expense reductions, including any fee waivers and Other Expense reimbursements, were as follows:
| | | | | | | | | | | | | | | | | | |
| Fund | | | | Management
Fee Waiver | | | Transfer Agency
Fee Waiver | | | Other Expense Reimbursements | | | Total Expense
Reductions | |
Capital Growth | | | | $ | 1,295,807 | | | $ | — | | | $ | 247,653 | | | $ | 1,543,460 | |
Concentrated Growth | | | | | 177,457 | | | | — | | | | 125,812 | | | | 303,269 | |
Dynamic U.S. Equity | | | | | — | | | | — | | | | 151,294 | | | | 151,294 | |
Flexible Cap Growth | | | | | 19,388 | | | | — | | | | 143,836 | | | | 163,224 | |
Focused Growth | | | | | 34,997 | | | | — | | | | 157,287 | | | | 192,284 | |
Growth Opportunities | | | | | 1,023,459 | | | | 87,390 | | | | 304,718 | | | | 1,415,567 | |
Small/Mid Cap Growth | | | | | 1,681,321 | | | | 69,786 | | | | — | | | | 1,751,107 | |
Strategic Growth | | | | | 588,568 | | | | — | | | | 180,819 | | | | 769,387 | |
Technology Opportunities | | | | | — | | | | — | | | | 153,628 | | | | 153,628 | |
G. Line of Credit Facility — As of February 29, 2016, the Funds participated in a $1,205,000,000 committed, unsecured revolving line of credit facility (the “facility”) together with other funds of the Trust and certain registered investment companies having management agreements with GSAM or its affiliates (“Other Borrowers”). Pursuant to the terms of the facility, the Funds and Other Borrowers could increase the credit amount by up to an additional $115,000,000 for a total of up to $1,320,000,000. This facility is to be used for temporary emergency purposes, or to allow for an orderly liquidation of securities to meet redemption requests. The interest rate on borrowings is based on the federal funds rate. The facility also requires a fee to be paid by the Funds based on the amount of the commitment that has not been utilized. For the six months ended February 29, 2016, the Funds did not have any borrowings under the facility.
H. Other Transactions with Affiliates — For the six months ended February 29, 2016, Goldman Sachs did not earn any brokerage commissions from portfolio transactions, on behalf of the Funds.
An investment by a Fund representing greater than 5% of the voting securities of an issuer makes that issuer an affiliated person (as defined by the Act) of such Fund. The following table provides information about the investment by the Small/Mid Cap Growth Fund in shares of issuers of which the Fund is an affiliate for the six months ended February 29, 2016:
| | | | | | | | | | | | | | | | | | | | | | | | | | | | | | |
| Fund | | Name of Affiliated Issuer | | Market Value 8/31/15 | | | Purchases
at Cost | | | Proceeds
from Sales | | | Net
Realized
Gain (Loss) | | | Net Change
in Unrealized
Gain (Loss) | | | Market
Value
2/29/16 | | | Dividend
Income | |
Small/Mid Cap Growth | | Corium International, Inc. | | $ | 12,559,016 | | | $ | 600,459 | | | $ | (177,041 | ) | | $ | (98,602 | ) | | $ | (6,983,404 | ) | | $ | 5,900,428 | | | $ | — | |
115
GOLDMAN SACHS FUNDAMENTAL EQUITY GROWTH FUNDS
Notes to Financial Statements (continued)
February 29, 2016 (Unaudited)
|
| 4. AGREEMENTS AND AFFILIATED TRANSACTIONS (continued) |
The table below shows the transactions in and earnings from investments by the Growth Opportunities Fund in the Underlying Fund for the six months ended February 29, 2016:
| | | | | | | | | | | | | | | | | | | | | | |
| Fund | | Underlying Fund | | Market Value 8/31/15 | | | Purchases at Cost | | | Proceeds from Sales | | | Market Value 2/29/16 | | | Dividend
Income | |
Growth Opportunities | | Goldman Sachs Financial Square Government Fund | | $ | 13,549,239 | | | $ | 944,596,734 | | | $ | (876,135,604 | ) | | $ | 82,010,369 | | | $ | 22,578 | |
As of February 29, 2016, the Goldman Sachs Group, Inc. was the beneficial owner of 5% or more of outstanding Class A, Class C, Institutional, Class IR, Class R and Class R6 Shares of the following funds:
| | | | | | | | | | | | | | | | | | | | | | |
| Fund | | | | Class C | | | Institutional | | | Class IR | | | Class R | | | Class R6 | |
Capital Growth | | | | | — | % | | | — | % | | | — | % | | | — | % | | | 100 | % |
Concentrated Growth | | | | | — | | | | — | | | | — | | | | 50 | | | | 100 | |
Dynamic U.S. Equity | | | | | 6 | | | | 26 | | | | — | | | | 32 | | | | 100 | |
Flexible Cap Growth | | | | | — | | | | — | | | | 30 | | | | 45 | | | | 100 | |
Focused Growth | | | | | 6 | | | | — | | | | 100 | | | | 100 | | | | 100 | |
Strategic Growth | | | | | — | | | | — | | | | — | | | | 9 | | | | 100 | |
|
| 5. PORTFOLIO SECURITIES TRANSACTIONS |
The cost of purchases and proceeds from sales and maturities of long-term securities for the six months ended February 29, 2016, were as follows:
| | | | | | | | | | |
| Fund | | | | Purchases | | | Sales and Maturities | |
Capital Growth | | | | $ | 203,137,604 | | | $ | 275,173,706 | |
Concentrated Growth | | | | | 38,754,085 | | | | 53,332,774 | |
Dynamic U.S. Equity | | | | | 3,254,515 | | | | 6,360,605 | |
Flexible Cap Growth | | | | | 3,469,980 | | | | 3,633,777 | |
Focused Growth | | | | | 7,719,963 | | | | 12,706,957 | |
Growth Opportunities | | | | | 1,221,206,481 | | | | 2,000,147,186 | |
Small/Mid Cap Growth | | | | | 972,358,318 | | | | 818,867,672 | |
Strategic Growth | | | | | 136,395,378 | | | | 103,118,380 | |
Technology Opportunities | | | | | 63,634,829 | | | | 93,744,310 | |
116
GOLDMAN SACHS FUNDAMENTAL EQUITY GROWTH FUNDS
As of the Funds’ most recent fiscal year end, August 31, 2015, the Funds’ certain timing differences, on a tax basis were as follows:
| | | | | | | | | | | | | | | | | | | | | | | | | | | | | | | | | | | | |
| | | Capital
Growth | | | Concentrated
Growth | | | Dynamic
U.S. Equity | | | Flexible
Cap Growth | | | Focused
Growth | | | Growth
Opportunities | | | Small/Mid
Cap Growth | | | Strategic
Growth | | | Technology
Opportunities | |
Timing differences (Qualified Late Year Loss Deferrals) | | $ | — | | | $ | — | | | $ | — | | | $ | (17,832 | ) | | $ | — | | | $ | (27,027,734 | ) | | $ | — | | | $ | — | | | $ | (1,512,054 | ) |
As of February 29, 2016, the Funds’ aggregate security unrealized gains and losses based on cost for U.S. federal income tax purposes were as follows:
| | | | | | | | | | | | | | | | | | | | | | | | | | | | | | | | | | | | |
| | | Capital Growth | | | Concentrated
Growth | | | Dynamic
U.S. Equity | | | Flexible
Cap Growth | | | Focused
Growth | | | Growth
Opportunities | | | Small/Mid
Cap Growth | | | Strategic
Growth | | | Technology
Opportunities | |
Tax Cost | | $ | 665,121,879 | | | $ | 127,289,299 | | | $ | 10,351,772 | | | $ | 13,539,176 | | | $ | 27,166,358 | | | $ | 3,205,299,829 | | | $ | 2,377,316,942 | | | $ | 337,861,697 | | | $ | 271,049,488 | |
Gross unrealized gain | | | 199,089,650 | | | | 30,077,942 | | | | 1,378,101 | | | | 3,779,029 | | | | 2,562,134 | | | | 527,155,719 | | | | 328,875,646 | | | | 89,298,474 | | | | 107,341,193 | |
Gross unrealized loss | | | (51,811,036 | ) | | | (9,096,070 | ) | | | (904,967 | ) | | | (1,209,146 | ) | | | (2,696,436 | ) | | | (263,580,940 | ) | | | (212,900,872 | ) | | | (20,970,281 | ) | �� | | (23,151,644 | ) |
Net unrealized gain (loss) | | $ | 147,278,614 | | | $ | 20,981,872 | | | $ | 473,134 | | | $ | 2,569,883 | | | $ | (134,302 | ) | | $ | 263,574,779 | | | $ | 115,974,774 | | | $ | 68,328,193 | | | $ | 84,189,549 | |
The difference between GAAP-basis and tax-basis unrealized gains (losses) is attributable primarily to wash sales and differences in tax treatment of underlying fund investments.
GSAM has reviewed the Funds’ tax positions for all open tax years (the current and prior three years, as applicable) and has concluded that no provision for income tax is required in the Funds’ financial statements. Such open tax years remain subject to examination and adjustment by tax authorities.
117
GOLDMAN SACHS FUNDAMENTAL EQUITY GROWTH FUNDS
Notes to Financial Statements (continued)
February 29, 2016 (Unaudited)
The Funds’ risks include, but are not limited to, the following:
Large Shareholder Transactions Risk — A Fund may experience adverse effects when certain large shareholders, such as other funds, institutional investors (including those trading by use of non-discretionary mathematical formulas), financial intermediaries (who may make investment decisions on behalf of underlying clients and/or include a Fund in their investment model), individuals, accounts and Goldman Sachs affiliates, purchase or redeem large amounts of shares of a Fund. Such large shareholder redemptions may cause the Fund to sell portfolio securities at times when it would not otherwise do so, which may negatively impact a Fund’s NAV and liquidity. These transactions may also accelerate the realization of taxable income to shareholders if such sales of investments resulted in gains, and may also increase transaction costs. In addition, a large redemption could result in a Fund’s current expenses being allocated over a smaller asset base, leading to an increase in the Fund’s expense ratio. Similarly, large Fund share purchases may adversely affect a Fund’s performance to the extent that the Fund is delayed in investing new cash and is required to maintain a larger cash position than it ordinarily would.
Liquidity Risk — The Funds may make investments that are illiquid or that may become less liquid in response to market developments or adverse investor perceptions. Illiquid investments may be more difficult to value. Liquidity risk may also refer to the risk that a Fund will not be able to pay redemption proceeds within the allowable time period because of unusual market conditions, an unusually high volume of redemption requests, or other reasons. To meet redemption requests, a Fund may be forced to sell investments at an unfavorable time and/or under unfavorable conditions.
Market and Credit Risks — In the normal course of business, the Funds trade financial instruments and enter into financial transactions where risk of potential loss exists due to changes in the market (market risk). Additionally, the Funds may also be exposed to credit risk in the event that an issuer or guarantor fails to perform or that an institution or entity with which the Funds have unsettled or open transactions defaults.
Non-Diversification Risk — The Concentrated Growth and Focused Growth Funds are non-diversified, meaning that they are permitted to invest a larger percentage of their assets in fewer issuers than diversified mutual funds. Thus, a Fund may be more susceptible to adverse developments affecting any single issuer held in its portfolio, and may be more susceptible to greater losses because of these developments.
Portfolio Concentration Risk — The Technology Opportunities Fund invests primarily in equity investments in high-quality technology, media or service companies that adopt or use technology to improve their cost structure, revenue opportunities or competitive advantage. Because of its focus on technology, media and service companies, the Technology Opportunities Fund is subject to greater risk of loss as a result of adverse economic, business or other developments than if its investments were diversified across different industry sectors. The Technology Opportunities Fund may also invest in a relatively few number of issuers. Thus, the Technology Opportunities Fund may be more susceptible to adverse developments affecting any single issuer held in its portfolio and may be more susceptible to greater losses because of these developments.
118
GOLDMAN SACHS FUNDAMENTAL EQUITY GROWTH FUNDS
Under the Trust’s organizational documents, its Trustees, officers, employees and agents are indemnified, to the extent permitted by the Act and state law, against certain liabilities that may arise out of performance of their duties to the Funds. Additionally, in the course of business, the Funds enter into contracts that contain a variety of indemnification clauses. The Funds’ maximum exposure under these arrangements is unknown, as this would involve future claims that may be made against the Funds that have not yet occurred. However, GSAM believes the risk of loss under these arrangements to be remote.
Subsequent events after the Statements of Assets and Liabilities date have been evaluated through the date the financial statements were issued. GSAM has concluded that there is no impact requiring adjustment or disclosure in the financial statements.
119
GOLDMAN SACHS FUNDAMENTAL EQUITY GROWTH FUNDS
Notes to Financial Statements (continued)
February 29, 2016 (Unaudited)
|
| 10. SUMMARY OF SHARE TRANSACTIONS (continued) |
Share activity is as follows:
| | | | | | | | | | | | | | | | |
| | | Capital Growth Fund | |
| | | For the Six Months Ended
February 29, 2016
(Unaudited) | | | For the Fiscal Year Ended
August 31, 2015 | |
| | | | |
| | | Shares | | | Dollars | | | Shares | | | Dollars | |
| | | | |
| Class A Shares | | | | | | | | | | | | | | | | |
Shares sold | | | 403,287 | | | $ | 9,584,088 | | | | 976,847 | | | $ | 25,917,436 | |
Reinvestment of distributions | | | 2,165,893 | | | | 51,418,306 | | | | 4,123,424 | | | | 103,869,050 | |
Shares converted from Class B(a) | | | — | | | | — | | | | 414,688 | | | | 12,024,309 | |
Shares redeemed | | | (1,718,980 | ) | | | (41,102,100 | ) | | | (3,471,469 | ) | | | (91,144,434 | ) |
| | | | 850,200 | | | | 19,900,294 | | | | 2,043,490 | | | | 50,666,361 | |
| Class B Shares(a) | | | | | | | | | | | | | | | | |
Shares sold | | | — | | | | — | | | | 46 | | | | (927 | ) |
Shares converted to Class A | | | — | | | | — | | | | (498,183 | ) | | | (12,024,309 | ) |
Shares redeemed | | | — | | | | — | | | | (145,865 | ) | | | (3,508,408 | ) |
| | | | — | | | | — | | | | (644,002 | ) | | | (15,533,644 | ) |
| Class C Shares | | | | | | | | | | | | | | | | |
Shares sold | | | 170,844 | | | | 3,186,331 | | | | 341,161 | | | | 7,154,847 | |
Reinvestment of distributions | | | 372,429 | | | | 6,878,768 | | | | 662,843 | | | | 13,382,800 | |
Shares redeemed | | | (429,832 | ) | | | (8,130,566 | ) | | | (658,000 | ) | | | (14,020,677 | ) |
| | | | 113,441 | | | | 1,934,533 | | | | 346,004 | | | | 6,516,970 | |
| Institutional Shares | | | | | | | | | | | | | | | | |
Shares sold | | | 268,320 | | | | 7,252,066 | | | | 1,585,630 | | | | 45,287,101 | |
Reinvestment of distributions | | | 485,148 | | | | 12,546,206 | | | | 799,639 | | | | 21,718,191 | |
Shares redeemed | | | (1,663,234 | ) | | | (40,488,267 | ) | | | (834,379 | ) | | | (23,663,917 | ) |
| | | | (909,766 | ) | | | (20,689,995 | ) | | | 1,550,890 | | | | 43,341,375 | |
| Service Shares | | | | | | | | | | | | | | | | |
Shares sold | | | 4,734 | | | | 111,872 | | | | 62,182 | | | | 1,605,801 | |
Reinvestment of distributions | | | 5,946 | | | | 136,873 | | | | 4,638 | | | | 113,688 | |
Shares redeemed | | | (15,659 | ) | | | (360,972 | ) | | | (28,570 | ) | | | (723,854 | ) |
| | | | (4,979 | ) | | | (112,227 | ) | | | 38,250 | | | | 995,635 | |
| Class IR Shares | | | | | | | | | | | | | | | | |
Shares sold | | | 35,344 | | | | 896,730 | | | | 53,066 | | | | 1,401,921 | |
Reinvestment of distributions | | | 15,716 | | | | 377,764 | | | | 17,638 | | | | 448,370 | |
Shares redeemed | | | (28,842 | ) | | | (642,873 | ) | | | (22,265 | ) | | | (590,653 | ) |
| | | | 22,218 | | | | 631,621 | | | | 48,439 | | | | 1,259,638 | |
| Class R Shares | | | | | | | | | | | | | | | | |
Shares sold | | | 50,289 | | | | 1,203,763 | | | | 42,000 | | | | 1,095,082 | |
Reinvestment of distributions | | | 12,478 | | | | 288,121 | | | | 22,629 | | | | 557,123 | |
Shares redeemed | | | (35,676 | ) | | | (844,514 | ) | | | (49,195 | ) | | | (1,249,171 | ) |
| | | | 27,091 | | | | 647,370 | | | | 15,434 | | | | 403,034 | |
| Class R6 Shares(b) | | | | | | | | | | | | | | | | |
Shares sold | | | — | | | | — | | | | 348 | | | | 10,005 | |
Reinvestment of distributions | | | 28 | | | | 730 | | | | — | | | | — | |
Shares redeemed | | | — | | | | — | | | | (1 | ) | | | (5 | ) |
| | | | 28 | | | | 730 | | | | 347 | | | | 10,000 | |
NET INCREASE (DECREASE) | | | 98,233 | | | $ | 2,312,326 | | | | 3,398,852 | | | $ | 87,659,369 | |
| (a) | | Class B Shares were converted into Class A Shares at the close of business on November 14, 2014. |
| (b) | | Commenced operations on July 31, 2015. |
120
GOLDMAN SACHS FUNDAMENTAL EQUITY GROWTH FUNDS
| | | | | | | | | | | | | | | | | | | | | | | | | | | | | | |
| Concentrated Growth Fund | | | Dynamic U.S. Equity Fund | |
For the Six Months Ended
February 29, 2016
(Unaudited) | | | For the Fiscal Year Ended
August 31, 2015 | | | For the Six Months Ended
February 29, 2016
(Unaudited) | | | For the Fiscal Year Ended
August 31, 2015 | |
| Shares | | | Dollars | | | Shares | | | Dollars | | | Shares | | | Dollars | | | Shares | | | Dollars | |
| | | | | | | | | | | | | | | | | | | | | | | | | | | | | | |
| | 37,137 | | | $ | 605,394 | | | | 55,670 | | | $ | 978,969 | | | | 9,589 | | | $ | 124,167 | | | | 52,789 | | | $ | 820,752 | |
| | 45,827 | | | | 684,660 | | | | 71,053 | | | | 1,165,979 | | | | 23,802 | | | | 308,204 | | | | 52,411 | | | | 765,728 | |
| | — | | | | — | | | | 7,520 | | | | 147,183 | | | | — | | | | — | | | | — | | | | — | |
| | (70,375 | ) | | | (1,031,125 | ) | | | (76,057 | ) | | | (1,307,935 | ) | | | (15,188 | ) | | | (207,823 | ) | | | (156,061 | ) | | | (2,319,211 | ) |
| | 12,589 | | | | 258,929 | | | | 58,186 | | | | 984,196 | | | | 18,203 | | | | 224,548 | | | | (50,861 | ) | | | (732,731 | ) |
| | | | | | | | | | | | | | | | | | | | | | | | | | | | | | |
| | — | | | | — | | | | 59 | | | | 1,022 | | | | — | | | | — | | | | — | | | | — | |
| | — | | | | — | | | | (8,332 | ) | | | (147,183 | ) | | | — | | | | — | | | | — | | | | — | |
| | — | | | | — | | | | (9,429 | ) | | | (164,840 | ) | | | — | | | | — | | | | — | | | | — | |
| | — | | | | — | | | | (17,702 | ) | | | (311,001 | ) | | | — | | | | — | | | | — | | | | — | |
| | | | | | | | | | | | | | | | | | | | | | | | | | | | | | |
| | 25,406 | | | | 340,558 | | | | 58,437 | | | | 871,637 | | | | 1,972 | | | | 24,750 | | | | 18,945 | | | | 278,664 | |
| | 20,916 | | | | 267,936 | | | | 27,141 | | | | 391,651 | | | | 2,696 | | | | 33,918 | | | | 3,284 | | | | 46,987 | |
| | (81,628 | ) | | | (1,091,471 | ) | | | (31,628 | ) | | | (480,372 | ) | | | (5,434 | ) | | | (67,826 | ) | | | (11,203 | ) | | | (163,428 | ) |
| | (35,306 | ) | | | (482,977 | ) | | | 53,950 | | | | 782,916 | | | | (766 | ) | | | (9,158 | ) | | | 11,026 | | | | 162,223 | |
| | | | | | | | | | | | | | | | | | | | | | | | | | | | | | |
| | 215,358 | | | | 3,497,468 | | | | 503,027 | | | | 8,885,577 | | | | 48,045 | | | | 651,608 | | | | 215,701 | | | | 3,227,428 | |
| | 1,049,110 | | | | 16,578,988 | | | | 1,700,015 | | | | 29,223,264 | | | | 59,033 | | | | 770,241 | | | | 95,608 | | | | 1,401,610 | |
| | (865,392 | ) | | | (13,842,426 | ) | | | (1,576,937 | ) | | | (28,212,893 | ) | | | (256,068 | ) | | | (3,419,225 | ) | | | (73,412 | ) | | | (1,136,708 | ) |
| | 399,076 | | | | 6,234,030 | | | | 626,105 | | | | 9,895,948 | | | | (148,990 | ) | | | (1,997,376 | ) | | | 237,897 | | | | 3,492,330 | |
| | | | | | | | | | | | | | | | | | | | | | | | | | | | | | |
| | — | | | | — | | | | — | | | | — | | | | — | | | | — | | | | — | | | | — | |
| | — | | | | — | | | | — | | | | — | | | | — | | | | — | | | | — | | | | — | |
| | — | | | | — | | | | — | | | | — | | | | — | | | | — | | | | — | | | | — | |
| | — | | | | — | | | | — | | | | — | | | | — | | | | — | | | | — | | | | — | |
| | | | | | | | | | | | | | | | | | | | | | | | | | | | | | |
| | 2,183 | | | | 30,000 | | | | 2,776 | | | | 47,194 | | | | 23,666 | | | | 286,221 | | | | 44,085 | | | | 607,385 | |
| | 2,439 | | | | 36,968 | | | | 4,113 | | | | 68,200 | | | | 3,311 | | | | 43,086 | | | | 2,374 | | | | 34,777 | |
| | (887 | ) | | | (15,297 | ) | | | (5,981 | ) | | | (103,552 | ) | | | (28,437 | ) | | | (417,347 | ) | | | (1,546 | ) | | | (23,165 | ) |
| | 3,735 | | | | 51,671 | | | | 908 | | | | 11,842 | | | | (1,460 | ) | | | (88,040 | ) | | | 44,913 | | | | 618,997 | |
| | | | | | | | | | | | | | | | | | | | | | | | | | | | | | |
| | 158 | | | | 2,353 | | | | 795 | | | | 13,236 | | | | 143 | | | | 1,948 | | | | 739 | | | | 11,079 | |
| | 210 | | | | 3,065 | | | | 166 | | | | 2,664 | | | | 424 | | | | 5,478 | | | | 1,202 | | | | 17,544 | |
| | — | | | | — | | | | — | | | | — | | | | (4,556 | ) | | | (66,780 | ) | | | (59 | ) | | | (901 | ) |
| | 368 | | | | 5,418 | | | | 961 | | | | 15,900 | | | | (3,989 | ) | | | (59,354 | ) | | | 1,882 | | | | 27,722 | |
| | | | | | | | | | | | | | | | | | | | | | | | | | | | | | |
| | — | | | | — | | | | 555 | | | | 10,005 | | | | — | | | | — | | | | 666 | | | | 10,005 | |
| | 65 | | | | 1,028 | | | | — | | | | — | | | | 77 | | | | 1,003 | | | | — | | | | — | |
| | — | | | | — | | | | (1 | ) | | | (5 | ) | | | — | | | | — | | | | (1 | ) | | | (5 | ) |
| | 65 | | | | 1,028 | | | | 554 | | | | 10,000 | | | | 77 | | | | 1,003 | | | | 665 | | | | 10,000 | |
| | 380,527 | | | $ | 6,068,099 | | | | 722,962 | | | $ | 11,389,801 | | | | (136,925 | ) | | $ | (1,928,377 | ) | | | 245,522 | | | $ | 3,578,541 | |
121
GOLDMAN SACHS FUNDAMENTAL EQUITY GROWTH FUNDS
Notes to Financial Statements (continued)
February 29, 2016 (Unaudited)
|
10. SUMMARY OF SHARE TRANSACTIONS (continued) |
Share activity is as follows:
| | | | | | | | | | | | | | | | |
| | | Flexible Cap Growth Fund | |
| | | | |
| | | For the Six Months Ended
February 29, 2016
(Unaudited) | | | For the Fiscal Year Ended
August 31, 2015 | |
| | | | |
| | | Shares | | | Dollars | | | Shares | | | Dollars | |
| | | | |
| Class A Shares | | | | | | | | | | | | | | | | |
Shares sold | | | 113,083 | | | $ | 1,329,858 | | | | 238,465 | | | $ | 2,970,412 | |
Reinvestment of distributions | | | 40,108 | | | | 458,035 | | | | 75,889 | | | | 897,010 | |
Shares converted from Class B(a) | | | — | | | | — | | | | — | | | | — | |
Shares redeemed | | | (137,285 | ) | | | (1,486,689 | ) | | | (151,050 | ) | | | (1,870,489 | ) |
| | | | 15,906 | | | | 301,204 | | | | 163,304 | | | | 1,996,933 | |
| Class B Shares(a) | | | | | | | | | | | | | | | | |
Shares sold | | | — | | | | — | | | | — | | | | — | |
Shares converted to Class A | | | — | | | | — | | | | — | | | | — | |
Shares redeemed | | | — | | | | — | | | | — | | | | — | |
| | | | — | | | | — | | | | — | | | | — | |
| Class C Shares | | | | | | | | | | | | | | | | |
Shares sold | | | 30,599 | | | | 325,650 | | | | 74,144 | | | | 824,538 | |
Reinvestment of distributions | | | 11,168 | | | | 116,932 | | | | 16,649 | | | | 182,809 | |
Shares redeemed | | | (30,983 | ) | | | (322,074 | ) | | | (16,985 | ) | | | (195,137 | ) |
| | | | 10,784 | | | | 120,508 | | | | 73,808 | | | | 812,210 | |
| Institutional Shares | | | | | | | | | | | | | | | | |
Shares sold | | | 63,179 | | | | 705,609 | | | | 82,904 | | | | 1,085,506 | |
Reinvestment of distributions | | | 41,542 | | | | 497,675 | | | | 90,749 | | | | 1,117,114 | |
Shares redeemed | | | (49,759 | ) | | | (601,862 | ) | | | (87,600 | ) | | | (1,156,663 | ) |
| | | | 54,962 | | | | 601,422 | | | | 86,053 | | | | 1,045,957 | |
| Service Shares | | | | | | | | | | | | | | | | |
Shares sold | | | — | | | | — | | | | — | | | | — | |
Reinvestment of distributions | | | — | | | | — | | | | — | | | | — | |
Shares redeemed | | | — | | | | — | | | | — | | | | — | |
| | | | — | | | | — | | | | — | | | | — | |
| Class IR Shares | | | | | | | | | | | | | | | | |
Shares sold | | | 131 | | | | 1,629 | | | | 18,873 | | | | 242,837 | |
Reinvestment of distributions | | | 1,142 | | | | 13,475 | | | | 2,697 | | | | 32,792 | |
Shares redeemed | | | (16,149 | ) | | | (184,280 | ) | | | (10,280 | ) | | | (131,753 | ) |
| | | | (14,876 | ) | | | (169,176 | ) | | | 11,290 | | | | 143,876 | |
| Class R Shares | | | | | | | | | | | | | | | | |
Shares sold | | | 850 | | | | 9,565 | | | | 187 | | | | 2,285 | |
Reinvestment of distributions | | | 203 | | | | 2,254 | | | | 700 | | | | 8,089 | |
Shares redeemed | | | (9 | ) | | | (91 | ) | | | (2,268 | ) | | | (25,967 | ) |
| | | | 1,044 | | | | 11,728 | | | | (1,381 | ) | | | (15,593 | ) |
| Class R6 Shares(b) | | | | | | | | | | | | | | | | |
Shares sold | | | — | | | | — | | | | 748 | | | | 10,005 | |
Reinvestment of distributions | | | 46 | | | | 544 | | | | — | | | | — | |
Shares redeemed | | | — | | | | — | | | | (1 | ) | | | (5 | ) |
| | | | 46 | | | | 544 | | | | 747 | | | | 10,000 | |
NET INCREASE (DECREASE) | | | 67,866 | | | $ | 866,230 | | | | 333,821 | | | $ | 3,993,383 | |
| (a) | | Class B Shares were converted into Class A Shares at the close of business on November 14, 2014. |
| (b) | | Commenced operations on July 31, 2015. |
122
GOLDMAN SACHS FUNDAMENTAL EQUITY GROWTH FUNDS
| | | | | | | | | | | | | | | | | | | | | | | | | | | | | | |
| Focused Growth Fund | | | Growth Opportunities Fund | |
For the Six Months Ended
February 29, 2016
(Unaudited) | | | For the Fiscal Year Ended
August 31, 2015 | | | For the Six Months Ended
February 29, 2016
(Unaudited) | | | For the Fiscal Year Ended
August 31, 2015 | |
| Shares | | | Dollars | | | Shares | | | Dollars | | | Shares | | | Dollars | | | Shares | | | Dollars | |
| | | | | | | | | | | | | | | | | | | | | | | | | | | | | | |
| | 12,024 | | | $ | 175,583 | | | | 9,436 | | | $ | 140,612 | | | | 3,550,652 | | | $ | 76,017,573 | | | | 10,162,774 | | | $ | 263,713,914 | |
| | 1,035 | | | | 14,682 | | | | 265 | | | | 3,858 | | | | 4,305,749 | | | | 89,085,946 | | | | 7,862,988 | | | | 194,608,943 | |
| | — | | | | — | | | | — | | | | — | | | | — | | | | — | | | | 34,936 | | | | 1,073,724 | |
| | (1,439 | ) | | | (18,200 | ) | | | (2,237 | ) | | | (33,745 | ) | | | (12,683,042 | ) | | | (275,716,234 | ) | | | (15,091,283 | ) | | | (398,553,720 | ) |
| | 11,620 | | | | 172,065 | | | | 7,464 | | | | 110,725 | | | | (4,826,641 | ) | | | (110,612,715 | ) | | | 2,969,415 | | | | 60,842,861 | |
| | | | | | | | | | | | | | | | | | | | | | | | | | | | | | |
| | — | | | | — | | | | — | | | | — | | | | — | | | | — | | | | 331 | | | | 9,731 | |
| | — | | | | — | | | | — | | | | — | | | | — | | | | — | | | | (41,101 | ) | | | (1,073,724 | ) |
| | — | | | | — | | | | — | | | | — | | | | — | | | | — | | | | (242,765 | ) | | | (6,335,557 | ) |
| | — | | | | — | | | | — | | | | — | | | | — | | | | — | | | | (283,535 | ) | | | (7,399,550 | ) |
| | | | | | | | | | | | | | | | | | | | | | | | | | | | | | |
| | 15,284 | | | | 224,437 | | | | 952 | | | | 13,553 | | | | 739,619 | | | | 11,826,893 | | | | 1,522,314 | | | | 31,339,481 | |
| | 1,049 | | | | 14,477 | | | | 191 | | | | 2,722 | | | | 1,130,439 | | | | 17,894,856 | | | | 1,727,078 | | | | 34,161,609 | |
| | (950 | ) | | | (11,982 | ) | | | — | | | | — | | | | (1,811,766 | ) | | | (29,942,689 | ) | | | (1,878,064 | ) | | | (39,006,240 | ) |
| | 15,383 | | | | 226,932 | | | | 1,143 | | | | 16,275 | | | | 58,292 | | | | (220,940 | ) | | | 1,371,328 | | | | 26,494,850 | |
| | | | | | | | | | | | | | | | | | | | | | | | | | | | | | |
| | 72,635 | | | | 1,029,581 | | | | 835,824 | | | | 12,593,862 | | | | 11,748,161 | | | | 278,137,355 | | | | 32,672,439 | | | | 942,723,382 | |
| | 126,942 | | | | 1,821,522 | | | | 140,298 | | | | 2,053,966 | | | | 10,632,111 | | | | 250,386,205 | | | | 18,723,667 | | | | 517,709,381 | |
| | (461,626 | ) | | | (6,496,927 | ) | | | (315,947 | ) | | | (4,726,228 | ) | | | (29,470,816 | ) | | | (711,404,839 | ) | | | (46,242,562 | ) | | | (1,348,789,303 | ) |
| | (262,049 | ) | | | (3,645,824 | ) | | | 660,175 | | | | 9,921,600 | | | | (7,090,544 | ) | | | (182,881,279 | ) | | | 5,153,544 | | | | 111,643,460 | |
| | | | | | | | | | | | | | | | | | | | | | | | | | | | | | |
| | — | | | | — | | | | — | | | | — | | | | 132,191 | | | | 2,692,585 | | | | 416,015 | | | | 10,428,771 | |
| | — | | | | — | | | | — | | | | — | | | | 224,585 | | | | 4,484,961 | | | | 373,257 | | | | 8,961,890 | |
| | — | | | | — | | | | — | | | | — | | | | (446,504 | ) | | | (8,799,489 | ) | | | (617,666 | ) | | | (15,639,616 | ) |
| | — | | | | — | | | | — | | | | — | | | | (89,728 | ) | | | (1,621,943 | ) | | | 171,606 | | | | 3,751,045 | |
| | | | | | | | | | | | | | | | | | | | | | | | | | | | | | |
| | — | | | | — | | | | — | | | | — | | | | 713,833 | | | | 16,086,009 | | | | 3,125,965 | | | | 83,299,492 | |
| | 62 | | | | 893 | | | | 76 | | | | 1,117 | | | | 873,457 | | | | 18,674,510 | | | | 1,195,970 | | | | 30,389,605 | |
| | — | | | | — | | | | — | | | | — | | | | (1,698,757 | ) | | | (37,361,991 | ) | | | (1,951,082 | ) | | | (52,078,172 | ) |
| | 62 | | | | 893 | | | | 76 | | | | 1,117 | | | | (111,467 | ) | | | (2,601,472 | ) | | | 2,370,853 | | | | 61,610,925 | |
| | | | | | | | | | | | | | | | | | | | | | | | | | | | | | |
| | — | | | | — | | | | — | | | | — | | | | 382,384 | | | | 7,954,999 | | | | 903,121 | | | | 23,021,670 | |
| | 62 | | | | 868 | | | | 76 | | | | 1,095 | | | | 423,033 | | | | 8,481,806 | | | | 683,591 | | | | 16,501,884 | |
| | — | | | | — | | | | — | | | | — | | | | (691,800 | ) | | | (14,256,115 | ) | | | (956,401 | ) | | | (23,828,857 | ) |
| | 62 | | | | 868 | | | | 76 | | | | 1,095 | | | | 113,617 | | | | 2,180,690 | | | | 630,311 | | | | 15,694,697 | |
| | | | | | | | | | | | | | | | | | | | | | | | | | | | | | |
| | — | | | | — | | | | 656 | | | | 10,005 | | | | 462,895 | | | | 11,588,407 | | | | 352 | | | | 10,005 | |
| | 36 | | | | 519 | | | | — | | | | — | | | | 45,912 | | | | 1,081,229 | | | | — | | | | — | |
| | — | | | | — | | | | (1 | ) | | | (5 | ) | | | (17,952 | ) | | | (415,452 | ) | | | (1 | ) | | | (5 | ) |
| | 36 | | | | 519 | | | | 655 | | | | 10,000 | | | | 490,855 | | | | 12,254,184 | | | | 351 | | | | 10,000 | |
| | (234,886 | ) | | $ | (3,244,547 | ) | | | 669,589 | | | $ | 10,060,812 | | | | (11,455,616 | ) | | $ | (283,503,475 | ) | | | 12,383,873 | | | $ | 272,648,288 | |
123
GOLDMAN SACHS FUNDAMENTAL EQUITY GROWTH FUNDS
Notes to Financial Statements (continued)
February 29, 2016 (Unaudited)
|
| 10. SUMMARY OF SHARE TRANSACTIONS (continued) |
Share activity is as follows:
| | | | | | | | | | | | | | | | |
| | | Small/Mid Cap Growth Fund | |
| | | | |
| | | For the Six Months Ended
February 29, 2016
(Unaudited) | | | For the Fiscal Year Ended
August 31, 2015 | |
| | | | |
| | | Shares | | | Dollars | | | Shares | | | Dollars | |
| | | | |
| Class A Shares | | | | | | | | | | | | | | | | |
Shares sold | | | 9,459,606 | | | $ | 181,019,011 | | | | 16,565,512 | | | $ | 349,968,548 | |
Reinvestment of distributions | | | 1,658,772 | | | | 32,113,833 | | | | 2,828,794 | | | | 56,179,848 | |
Shares converted from Class B(a) | | | — | | | | — | | | | 16,583 | | | | 355,101 | |
Shares redeemed | | | (8,093,807 | ) | | | (149,673,250 | ) | | | (11,141,305 | ) | | | (232,471,494 | ) |
| | | | 3,024,571 | | | | 63,459,594 | | | | 8,269,584 | | | | 174,032,003 | |
| Class B Shares(a) | | | | | | | | | | | | | | | | |
Shares sold | | | — | | | | — | | | | 429 | | | | 8,690 | |
Shares converted to Class A | | | — | | | | — | | | | (18,064 | ) | | | (355,101 | ) |
Shares redeemed | | | — | | | | — | | | | (165,032 | ) | | | (3,247,551 | ) |
| | | | — | | | | — | | | | (182,667 | ) | | | (3,593,962 | ) |
| Class C Shares | | | | | | | | | | | | | | | | |
Shares sold | | | 2,489,945 | | | | 43,395,882 | | | | 4,066,231 | | | | 78,124,640 | |
Reinvestment of distributions | | | 552,467 | | | | 9,612,934 | | | | 939,595 | | | | 16,969,081 | |
Shares redeemed | | | (1,693,451 | ) | | | (28,359,801 | ) | | | (2,223,521 | ) | | | (42,496,235 | ) |
| | | | 1,348,961 | | | | 24,649,015 | | | | 2,782,305 | | | | 52,597,486 | |
| Institutional Shares | | | | | | | | | | | | | | | | |
Shares sold | | | 15,233,407 | | | | 305,643,025 | | | | 25,380,718 | | | | 558,001,282 | |
Reinvestment of distributions | | | 1,970,711 | | | | 40,044,852 | | | | 3,594,511 | | | | 74,478,267 | |
Shares redeemed | | | (14,976,935 | ) | | | (286,534,439 | ) | | | (16,119,224 | ) | | | (349,393,249 | ) |
| | | | 2,227,183 | | | | 59,153,438 | | | | 12,856,005 | | | | 283,086,300 | |
| Service Shares | | | | | | | | | | | | | | | | |
Shares sold | | | 168,668 | | | | 3,160,158 | | | | 419,139 | | | | 8,644,070 | |
Reinvestment of distributions | | | 20,051 | | | | 380,769 | | | | 19,492 | | | | 380,479 | |
Shares redeemed | | | (104,181 | ) | | | (1,939,840 | ) | | | (237,304 | ) | | | (4,886,182 | ) |
| | | | 84,538 | | | | 1,601,087 | | | | 201,327 | | | | 4,138,367 | |
| Class IR Shares | | | | | | | | | | | | | | | | |
Shares sold | | | 6,137,186 | | | | 120,131,109 | | | | 3,779,029 | | | | 81,238,926 | |
Reinvestment of distributions | | | 506,347 | | | | 10,050,989 | | | | 679,062 | | | | 13,778,175 | |
Shares redeemed | | | (2,382,781 | ) | | | (44,511,056 | ) | | | (2,100,230 | ) | | | (44,705,893 | ) |
| | | | 4,260,752 | | | | 85,671,042 | | | | 2,357,861 | | | | 50,311,208 | |
| Class R Shares | | | | | | | | | | | | | | | | |
Shares sold | | | 449,849 | | | | 8,320,721 | | | | 590,027 | | | | 12,110,052 | |
Reinvestment of distributions | | | 59,341 | | | | 1,120,944 | | | | 132,069 | | | | 2,568,736 | |
Shares redeemed | | | (289,082 | ) | | | (5,405,966 | ) | | | (672,345 | ) | | | (13,841,156 | ) |
| | | | 220,108 | | | | 4,035,699 | | | | 49,751 | | | | 837,632 | |
| Class R6 Shares(b) | | | | | | | | | | | | | | | | |
Shares sold | | | 44,615 | | | | 877,783 | | | | 427 | | | | 10,005 | |
Reinvestment of distributions | | | 15 | | | | 313 | | | | — | | | | — | |
Shares redeemed | | | (1,162 | ) | | | (21,000 | ) | | | (1 | ) | | | (5 | ) |
| | | | 43,468 | | | | 857,096 | | | | 426 | | | | 10,000 | |
NET INCREASE (DECREASE) | | | 11,209,581 | | | $ | 239,426,971 | | | | 26,334,592 | | | $ | 561,419,034 | |
| (a) | | Class B Shares were converted into Class A Shares at the close of business on November 14, 2014. |
| (b) | | Commenced operations on July 31, 2015. |
124
GOLDMAN SACHS FUNDAMENTAL EQUITY GROWTH FUNDS
| | | | | | | | | | | | | | | | | | | | | | | | | | | | | | |
| Strategic Growth Fund | | | Technology Opportunities Fund | |
For the Six Months Ended
February 29, 2016
(Unaudited) | | | For the Fiscal Year Ended
August 31, 2015
| | | For the Six Months Ended
February 29, 2016
(Unaudited) | | | For the Fiscal Year Ended
August 31, 2015 | |
| Shares | | | Dollars | | | Shares | | | Dollars | | | Shares | | | Dollars | | | Shares | | | Dollars | |
| | | | | | | | | | | | | | | | | | | | | | | | | | | | | | |
| | 608,446 | | | $ | 7,145,124 | | | | 931,649 | | | $ | 11,624,508 | | | | 1,181,164 | | | $ | 21,082,281 | | | | 3,707,771 | | | $ | 68,710,401 | |
| | 219,495 | | | | 2,569,040 | | | | 623,276 | | | | 7,460,611 | | | | 1,154,064 | | | | 20,565,422 | | | | 1,001,763 | | | | 17,841,403 | |
| | — | | | | — | | | | 6,679 | | | | 92,424 | | | | — | | | | — | | | | 109,463 | | | | 2,114,732 | |
| | (446,875 | ) | | | (5,196,322 | ) | | | (1,585,906 | ) | | | (19,961,088 | ) | | | (2,614,404 | ) | | | (43,588,657 | ) | | | (4,623,826 | ) | | | (84,541,383 | ) |
| | 381,066 | | | | 4,517,842 | | | | (24,302 | ) | | | (783,545 | ) | | | (279,176 | ) | | | (1,940,954 | ) | | | 195,171 | | | | 4,125,153 | |
| | | | | | | | | | | | | | | | | | | | | | | | | | | | | | |
| | — | | | | — | | | | — | | | | — | | | | — | | | | — | | | | 72 | | | | 1,203 | |
| | — | | | | — | | | | (7,606 | ) | | | (92,424 | ) | | | — | | | | — | | | | (122,977 | ) | | | (2,114,732 | ) |
| | — | | | | — | | | | (62,687 | ) | | | (758,883 | ) | | | — | | | | — | | | | (131,293 | ) | | | (2,254,440 | ) |
| | — | | | | — | | | | (70,293 | ) | | | (851,307 | ) | | | — | | | | — | | | | (254,198 | ) | | | (4,367,969 | ) |
| | | | | | | | | | | | | | | | | | | | | | | | | | | | | | |
| | 133,642 | | | | 1,302,439 | | | | 155,852 | | | | 1,661,932 | | | | 206,299 | | | | 3,186,003 | | | | 361,936 | | | | 5,854,871 | |
| | 55,138 | | | | 544,217 | | | | 143,499 | | | | 1,473,731 | | | | 282,440 | | | | 4,341,104 | | | | 254,225 | | | | 3,986,258 | |
| | (87,047 | ) | | | (858,000 | ) | | | (180,100 | ) | | | (1,930,524 | ) | | | (384,281 | ) | | | (5,768,407 | ) | | | (669,583 | ) | | | (10,831,500 | ) |
| | 101,733 | | | | 988,656 | | | | 119,251 | | | | 1,205,139 | | | | 104,458 | | | | 1,758,700 | | | | (53,422 | ) | | | (990,371 | ) |
| | | | | | | | | | | | | | | | | | | | | | | | | | | | | | |
| | 6,308,632 | | | | 76,167,883 | | | | 5,625,401 | | | | 72,107,285 | | | | 554,084 | | | | 10,456,089 | | | | 1,165,921 | | | | 22,754,302 | |
| | 1,582,533 | | | | 19,641,430 | | | | 3,789,883 | | | | 47,790,420 | | | | 318,647 | | | | 6,130,770 | | | | 354,531 | | | | 6,750,272 | |
| | (3,273,983 | ) | | | (38,953,539 | ) | | | (6,845,084 | ) | | | (89,891,107 | ) | | | (1,008,109 | ) | | | (19,389,814 | ) | | | (1,621,145 | ) | | | (31,887,600 | ) |
| | 4,617,182 | | | | 56,855,774 | | | | 2,570,200 | | | | 30,006,598 | | | | (135,378 | ) | | | (2,802,955 | ) | | | (100,693 | ) | | | (2,383,026 | ) |
| | | | | | | | | | | | | | | | | | | | | | | | | | | | | | |
| | 1,395 | | | | 16,153 | | | | 12,295 | | | | 151,634 | | | | 228,963 | | | | 4,018,175 | | | | 281,564 | | | | 5,091,170 | |
| | 1,139 | | | | 13,276 | | | | 2,064 | | | | 24,623 | | | | 49,979 | | | | 877,134 | | | | 43,016 | | | | 756,231 | |
| | (3,773 | ) | | | (46,484 | ) | | | (4,409 | ) | | | (53,271 | ) | | | (184,883 | ) | | | (3,123,936 | ) | | | (311,692 | ) | | | (5,657,682 | ) |
| | (1,239 | ) | | | (17,055 | ) | | | 9,950 | | | | 122,986 | | | | 94,059 | | | | 1,771,373 | | | | 12,888 | | | | 189,719 | |
| | | | | | | | | | | | | | | | | | | | | | | | | | | | | | |
| | 6,018 | | | | 78,655 | | | | 10,875 | | | | 148,776 | | | | 44,622 | | | | 871,704 | | | | 223,598 | | | | 4,402,391 | |
| | 4,008 | | | | 49,728 | | | | 11,782 | | | | 148,694 | | | | 26,798 | | | | 511,029 | | | | 11,996 | | | | 226,845 | |
| | (8,079 | ) | | | (99,359 | ) | | | (27,752 | ) | | | (358,927 | ) | | | (56,669 | ) | | | (1,003,248 | ) | | | (76,561 | ) | | | (1,497,039 | ) |
| | 1,947 | | | | 29,024 | | | | (5,095 | ) | | | (61,457 | ) | | | 14,751 | | | | 379,485 | | | | 159,033 | | | | 3,132,197 | |
| | | | | | | | | | | | | | | | | | | | | | | | | | | | | | |
| | 900 | | | | 10,260 | | | | 5,711 | | | | 69,325 | | | | — | | | | — | | | | — | | | | — | |
| | 33 | | | | 381 | | | | 225 | | | | 2,673 | | | | — | | | | — | | | | — | | | | — | |
| | (882 | ) | | | (10,439 | ) | | | (516 | ) | | | (6,239 | ) | | | — | | | | — | | | | — | | | | — | |
| | 51 | | | | 202 | | | | 5,420 | | | | 65,759 | | | | — | | | | — | | | | — | | | | — | |
| | | | | | | | | | | | | | | | | | | | | | | | | | | | | | |
| | — | | | | — | | | | 750 | | | | 10,005 | | | | — | | | | — | | | | — | | | | — | |
| | 44 | | | | 558 | | | | — | | | | — | | | | — | | | | — | | | | — | | | | — | |
| | — | | | | — | | | | (1 | ) | | | (5 | ) | | | — | | | | — | | | | — | | | | — | |
| | 44 | | | | 558 | | | | 749 | | | | 10,000 | | | | — | | | | — | | | | — | | | | — | |
| | 5,100,784 | | | $ | 62,375,001 | | | | 2,605,880 | | | $ | 29,714,173 | | | | (201,286 | ) | | $ | (834,351 | ) | | | (41,221 | ) | | $ | (294,297 | ) |
125
GOLDMAN SACHS FUNDAMENTAL EQUITY GROWTH FUNDS
Fund Expenses — Six Month Period Ended February 29, 2016 (Unaudited)
As a shareholder of Class A, Class C, Institutional, Service, Class IR, Class R and Class R6 Shares of a Fund, you incur two types of costs: (1) transaction costs, including sales charges on purchase payments (with respect to Class A Shares), contingent deferred sales charges on redemptions (with respect to Class C Shares), and (2) ongoing costs, including management fees; distribution and service (12b-1) fees (with respect to Class A, Class C and Class R Shares); and other Fund expenses. This Example is intended to help you understand your ongoing costs (in dollars) of investing in Class A, Class C, Institutional, Service, Class IR, Class R or Class R6 Shares of the Funds and to compare these costs with the ongoing costs of investing in other mutual funds.
The Example is based on an investment of $1,000 invested at the beginning of the period and held for the entire period from September 1, 2015 through February 29, 2016, which represents a period of 182 days of a 366 day year.
Actual Expenses — The first line under each share class in the table below provides information about actual account values and actual expenses. You may use the information in this line, together with the amount you invested, to estimate the expenses that you paid over the period. Simply divide your account value by $1,000 (for example, an $8,600 account value divided by $1,000=8.6), then multiply the result by the number in the first line under the heading entitled “Expenses Paid” to estimate the expenses you paid on your account during this period.
Hypothetical Example for Comparison Purposes — The second line under each share class in the table below provides information about hypothetical account values and hypothetical expenses based on the Funds’ actual net expense ratios and an assumed rate of return of 5% per year before expenses, which is not the Funds’ actual return. The hypothetical account values and expenses may not be used to estimate the actual ending account balance or expenses you paid for the period. You may use this information to compare the ongoing costs of investing in the Funds and other funds. To do so, compare this 5% hypothetical example with the 5% hypothetical examples that appear in the shareholder reports of the other funds.
Please note that the expenses shown in the table are meant to highlight your ongoing costs only and do not reflect any transactional costs, such as sales charges, redemption fees, or exchange fees. Therefore, the second line of the table is useful in comparing ongoing costs only, and will not help you determine the relative total costs of owning different funds. In addition, if these transactional costs were included, your costs would have been higher.
| | | | | | | | | | | | | | | | | | | | | | | | | | | | | | | | | | | | | | | | | | | | | | | | | | | | | | | | | | | | |
| | | Capital Growth Fund | | | Concentrated Growth Fund | | | Dynamic U.S. Equity Fund | | | Flexible Cap Growth Fund | | | Focused Growth Fund | |
| Share Class | | Beginning
Account
Value
9/1/15 | | | Ending
Account
Value
2/29/16 | | | Expenses
Paid for the
6 months ended
2/29/16* | | | Beginning
Account
Value
9/1/15 | | | Ending
Account
Value
2/29/16 | | | Expenses
Paid for the
6 months ended
2/29/16* | | | Beginning
Account
Value
9/1/15 | | | Ending
Account
Value
2/29/16 | | | Expenses
Paid for the
6 months ended
2/29/16* | | | Beginning
Account
Value
9/1/15 | | | Ending
Account
Value
2/29/16 | | | Expenses
Paid for the
6 months ended
2/29/16* | | | Beginning
Account
Value
9/1/15 | | | Ending
Account
Value
2/29/16 | | | Expenses
Paid for the
6 months ended
2/29/16* | |
| Class A | | | | | | | | | | | | | | | | | | | | | | | | | | | | | | | | | | | | | | | | | | | | | | | | | | | | | | | | | | | | |
Actual | | $ | 1,000.00 | | | $ | 950.30 | | | $ | 5.62 | | | $ | 1,000.00 | | | $ | 945.10 | | | $ | 5.95 | | | $ | 1,000.00 | | | $ | 926.70 | | | $ | 5.89 | | | $ | 1,000.00 | | | $ | 930.50 | | | $ | 5.90 | | | $ | 1,000.00 | | | $ | 945.50 | | | $ | 5.95 | |
Hypothetical 5% return | | | 1,000.00 | | | | 1,019.10 | + | | | 5.82 | | | | 1,000.00 | | | | 1,018.75 | + | | | 6.17 | | | | 1,000.00 | | | | 1,018.75 | + | | | 6.17 | | | | 1,000.00 | | | | 1,018.75 | + | | | 6.17 | | | | 1,000.00 | | | | 1,018.75 | + | | | 6.17 | |
| Class C | | | | | | | | | | | | | | | | | | | | | | | | | | | | | | | | | | | | | | | | | | | | | | | | | | | | | | | | | | | | |
Actual | | | 1,000.00 | | | | 946.50 | | | | 9.24 | | | | 1,000.00 | | | | 941.30 | | | | 9.56 | | | | 1,000.00 | | | | 923.90 | | | | 9.47 | | | | 1,000.00 | | | | 926.60 | | | | 9.48 | | | | 1,000.00 | | | | 941.30 | | | | 9.56 | |
Hypothetical 5% return | | | 1,000.00 | | | | 1,015.37 | + | | | 9.57 | | | | 1,000.00 | | | | 1,015.02 | + | | | 9.92 | | | | 1,000.00 | | | | 1,015.02 | + | | | 9.92 | | | | 1,000.00 | | | | 1,015.02 | + | | | 9.92 | | | | 1,000.00 | | | | 1,015.02 | + | | | 9.92 | |
| Institutional | | | | | | | | | | | | | | | | | | | | | | | | | | | | | | | | | | | | | | | | | | | | | | | | | | | | | | | | | | | | |
Actual | | | 1,000.00 | | | | 951.70 | | | | 3.64 | | | | 1,000.00 | | | | 947.00 | | | | 4.02 | | | | 1,000.00 | | | | 929.10 | | | | 3.93 | | | | 1,000.00 | | | | 932.00 | | | | 3.94 | | | | 1,000.00 | | | | 947.40 | | | | 4.02 | |
Hypothetical 5% return | | | 1,000.00 | | | | 1,021.13 | + | | | 3.77 | | | | 1,000.00 | | | | 1,020.74 | + | | | 4.17 | | | | 1,000.00 | | | | 1,020.79 | + | | | 4.12 | | | | 1,000.00 | | | | 1,020.79 | + | | | 4.12 | | | | 1,000.00 | | | | 1,020.74 | + | | | 4.17 | |
| Service | | | | | | | | | | | | | | | | | | | | | | | | | | | | | | | | | | | | | | | | | | | | | | | | | | | | | | | | | | | | |
Actual | | | 1,000.00 | | | | 949.70 | | | | 6.11 | | | | N/A | | | | N/A | | | | N/A | | | | N/A | | | | N/A | | | | N/A | | | | N/A | | | | N/A | | | | N/A | | | | N/A | | | | N/A | | | | N/A | |
Hypothetical 5% return | | | 1,000.00 | | | | 1,018.60 | + | | | 6.32 | | | | N/A | | | | N/A | | | | N/A | | | | N/A | | | | N/A | | | | N/A | | | | N/A | | | | N/A | | | | N/A | | | | N/A | | | | N/A | | | | N/A | |
| Class IR | | | | | | | | | | | | | | | | | | | | | | | | | | | | | | | | | | | | | | | | | | | | | | | | | | | | | | | | | | | | |
Actual | | | 1,000.00 | | | | 951.10 | | | | 4.37 | | | | 1,000.00 | | | | 946.40 | | | | 4.74 | | | | 1,000.00 | | | | 928.30 | | | | 4.65 | | | | 1,000.00 | | | | 931.90 | | | | 4.66 | | | | 1,000.00 | | | | 947.00 | | | | 4.74 | |
Hypothetical 5% return | | | 1,000.00 | | | | 1,020.39 | + | | | 4.52 | | | | 1,000.00 | | | | 1,019.99 | + | | | 4.92 | | | | 1,000.00 | | | | 1,020.04 | + | | | 4.87 | | | | 1,000.00 | | | | 1,020.04 | + | | | 4.87 | | | | 1,000.00 | | | | 1,019.99 | + | | | 4.92 | |
| Class R | | | | | | | | | | | | | | | | | | | | | | | | | | | | | | | | | | | | | | | | | | | | | | | | | | | | | | | | | | | | |
Actual | | | 1,000.00 | | | | 949.00 | | | | 6.83 | | | | 1,000.00 | | | | 944.50 | | | | 7.16 | | | | 1,000.00 | | | | 926.50 | | | | 7.04 | | | | 1,000.00 | | | | 928.90 | | | | 7.05 | | | | 1,000.00 | | | | 944.40 | | | | 7.20 | |
Hypothetical 5% return | | | 1,000.00 | | | | 1,017.85 | + | | | 7.07 | | | | 1,000.00 | | | | 1,017.50 | + | | | 7.42 | | | | 1,000.00 | | | | 1,017.55 | + | | | 7.37 | | | | 1,000.00 | | | | 1,017.55 | + | | | 7.37 | | | | 1,000.00 | | | | 1,017.45 | + | | | 7.47 | |
| Class R6 | | | | | | | | | | | | | | | | | | | | | | | | | | | | | | | | | | | | | | | | | | | | | | | | | | | | | | | | | | | | |
Actual | | | 1,000.00 | | | | 952.00 | | | | 3.54 | | | | 1,000.00 | | | | 947.20 | | | | 3.87 | | | | 1,000.00 | | | | 929.30 | | | | 3.89 | | | | 1,000.00 | | | | 932.00 | | | | 3.84 | | | | 1,000.00 | | | | 947.60 | | | | 3.83 | |
Hypothetical 5% return | | | 1,000.00 | | | | 1,021.23 | + | | | 3.67 | | | | 1,000.00 | | | | 1,020.88 | + | | | 4.02 | | | | 1,000.00 | | | | 1,020.84 | + | | | 4.07 | | | | 1,000.00 | | | | 1,020.88 | + | | | 4.02 | | | | 1,000.00 | | | | 1,020.93 | + | | | 3.97 | |
126
GOLDMAN SACHS FUNDAMENTAL EQUITY GROWTH FUNDS
Fund Expenses — Six Month Period Ended February 29, 2016 (Unaudited) (continued)
| | | | | | | | | | | | | | | | | | | | | | | | | | | | | | | | | | | | | | | | | | | | | | | | |
| | | Growth Opportunities Fund | | | Small/Mid Cap Growth Fund | | | Strategic Growth Fund | | | Technology Opportunities Fund | |
| Share Class | | Beginning
Account
Value
9/1/15 | | | Ending
Account
Value
2/29/16 | | | Expenses
Paid for the
6 months ended
2/29/16* | | | Beginning
Account
Value
9/1/15 | | | Ending
Account
Value
2/29/16 | | | Expenses
Paid for the
6 months ended
2/29/16* | | | Beginning
Account
Value
9/1/15 | | | Ending
Account
Value
2/29/16 | | | Expenses
Paid for the
6 months ended
2/29/16* | | | Beginning
Account
Value
9/1/15 | | | Ending
Account
Value
2/29/16 | | | Expenses
Paid for the
6 months ended
2/29/16* | |
| Class A | | | | | | | | | | | | | | | | | | | | | | | | | | | | | | | | | | | | | | | | | | | | | | | | |
Actual | | $ | 1,000.00 | | | $ | 899.20 | | | $ | 6.33 | | | $ | 1,000.00 | | | $ | 856.60 | | | $ | 6.09 | | | $ | 1,000.00 | | | $ | 955.90 | | | $ | 5.59 | | | $ | 1,000.00 | | | $ | 945.60 | | | $ | 7.16 | |
Hypothetical 5% return | | | 1,000.00 | | | | 1,018.20 | + | | | 6.72 | | | | 1,000.00 | | | | 1,018.30 | + | | | 6.62 | | | | 1,000.00 | | | | 1,019.14 | + | | | 5.77 | | | | 1,000.00 | | | | 1,017.50 | + | | | 7.42 | |
| Class C | | | | | | | | | | | | | | | | | | | | | | | | | | | | | | | | | | | | | | | | | | | | | | | | |
Actual | | | 1,000.00 | | | | 896.20 | | | | 9.85 | | | | 1,000.00 | | | | 853.10 | | | | 9.54 | | | | 1,000.00 | | | | 952.50 | | | | 9.27 | | | | 1,000.00 | | | | 942.20 | | | | 10.77 | |
Hypothetical 5% return | | | 1,000.00 | | | | 1,014.47 | + | | | 10.47 | | | | 1,000.00 | | | | 1,014.57 | + | | | 10.37 | | | | 1,000.00 | | | | 1,015.37 | + | | | 9.57 | | | | 1,000.00 | | | | 1,013.77 | + | | | 11.17 | |
| Institutional | | | | | | | | | | | | | | | | | | | | | | | | | | | | | | | | | | | | | | | | | | | | | | | | |
Actual | | | 1,000.00 | | | | 901.10 | | | | 4.49 | | | | 1,000.00 | | | | 857.90 | | | | 4.30 | | | | 1,000.00 | | | | 958.30 | | | | 3.65 | | | | 1,000.00 | | | | 947.70 | | | | 5.23 | |
Hypothetical 5% return | | | 1,000.00 | | | | 1,020.14 | + | | | 4.77 | | | | 1,000.00 | | | | 1,020.24 | + | | | 4.67 | | | | 1,000.00 | | | | 1,021.13 | + | | | 3.77 | | | | 1,000.00 | | | | 1,019.49 | + | | | 5.42 | |
| Service | | | | | | | | | | | | | | | | | | | | | | | | | | | | | | | | | | | | | | | | | | | | | | | | |
Actual | | | 1,000.00 | | | | 899.00 | | | | 6.85 | | | | 1,000.00 | | | | 855.90 | | | | 6.60 | | | | 1,000.00 | | | | 955.50 | | | | 6.08 | | | | 1,000.00 | | | | 944.80 | | | | 7.64 | |
Hypothetical 5% return | | | 1,000.00 | | | | 1,017.65 | + | | | 7.27 | | | | 1,000.00 | | | | 1,017.75 | + | | | 7.17 | | | | 1,000.00 | | | | 1,018.65 | + | | | 6.27 | | | | 1,000.00 | | | | 1,017.01 | + | | | 7.92 | |
| Class IR | | | | | | | | | | | | | | | | | | | | | | | | | | | | | | | | | | | | | | | | | | | | | | | | |
Actual | | | 1,000.00 | | | | 900.40 | | | | 5.15 | | | | 1,000.00 | | | | 857.60 | | | | 4.94 | | | | 1,000.00 | | | | 957.20 | | | | 4.38 | | | | 1,000.00 | | | | 946.80 | | | | 5.95 | |
Hypothetical 5% return | | | 1,000.00 | | | | 1,019.44 | + | | | 5.47 | | | | 1,000.00 | | | | 1,019.54 | + | | | 5.37 | | | | 1,000.00 | | | | 1,020.39 | + | | | 4.52 | | | | 1,000.00 | | | | 1,018.75 | + | | | 6.17 | |
| Class R | | | | | | | | | | | | | | | | | | | | | | | | | | | | | | | | | | | | | | | | | | | | | | | | |
Actual | | | 1,000.00 | | | | 898.10 | | | | 7.50 | | | | 1,000.00 | | | | 855.30 | | | | 7.24 | | | | 1,000.00 | | | | 955.30 | | | | 6.81 | | | | N/A | | | | N/A | | | | N/A | |
Hypothetical 5% return | | | 1,000.00 | | | | 1,016.96 | + | | | 7.97 | | | | 1,000.00 | | | | 1,017.06 | + | | | 7.87 | | | | 1,000.00 | | | | 1,017.90 | + | | | 7.02 | | | | N/A | | | | N/A | | | | N/A | |
| Class R6 | | | | | | | | | | | | | | | | | | | | | | | | | | | | | | | | | | | | | | | | | | | | | | | | |
Actual | | | 1,000.00 | | | | 901.10 | | | | 4.40 | | | | 1,000.00 | | | | 857.90 | | | | 4.20 | | | | 1,000.00 | | | | 957.70 | | | | 3.75 | | | | N/A | | | | N/A | | | | N/A | |
Hypothetical 5% return | | | 1,000.00 | | | | 1,020.24 | + | | | 4.67 | | | | 1,000.00 | | | | 1,020.34 | + | | | 4.57 | | | | 1,000.00 | | | | 1,021.03 | + | | | 3.87 | | | | N/A | | | | N/A | | | | N/A | |
127
GOLDMAN SACHS FUNDAMENTAL EQUITY GROWTH FUNDS
Fund Expenses — Six Month Period Ended February 29, 2016 (Unaudited) (continued)
| * | | Expenses for each share class are calculated using each Fund’s annualized net expense ratio for each class, which represents the ongoing expenses as a percentage of net assets for the six months ended February 29, 2016. Expenses are calculated by multiplying the annualized net expense ratio by the average account value for the period; then multiplying the result by the number of days in the most recent fiscal half year; and then dividing that result by the number of days in the fiscal year. The annualized net expense ratios for the period were as follows: |
| | | | | | | | | | | | | | | | | | | | | | | | | | | | |
| Fund | | Class A | | | Class C | | | Institutional | | | Service | | | Class IR | | | Class R | | | Class R6 | |
Capital Growth | | | 1.16 | % | | | 1.91 | % | | | 0.75 | % | | | 1.26 | % | | | 0.90 | % | | | 1.41 | % | | | 0.73 | % |
Concentrated Growth | | | 1.23 | | | | 1.98 | | | | 0.83 | | | | N/A | | | | 0.98 | | | | 1.48 | | | | 0.80 | |
Dynamic U.S. Equity | | | 1.23 | | | | 1.98 | | | | 0.82 | | | | N/A | | | | 0.97 | | | | 1.47 | | | | 0.81 | |
Flexible Cap Growth | | | 1.23 | | | | 1.98 | | | | 0.82 | | | | N/A | | | | 0.97 | | | | 1.47 | | | | 0.80 | |
Focused Growth | | | 1.23 | | | | 1.98 | | | | 0.83 | | | | N/A | | | | 0.98 | | | | 1.49 | | | | 0.79 | |
Growth Opportunities | | | 1.34 | | | | 2.09 | | | | 0.95 | | | | 1.45 | | | | 1.09 | | | | 1.59 | | | | 0.93 | |
Small/Mid Cap Growth | | | 1.32 | | | | 2.07 | | | | 0.93 | | | | 1.43 | | | | 1.07 | | | | 1.57 | | | | 0.91 | |
Strategic Growth | | | 1.15 | | | | 1.91 | | | | 0.75 | | | | 1.25 | | | | 0.90 | | | | 1.40 | | | | 0.77 | |
Technology Opportunities | | | 1.48 | | | | 2.23 | | | | 1.08 | | | | 1.58 | | | | 1.23 | | | | N/A | | | | N/A | |
| + | | Hypothetical expenses are based on each Fund’s actual annualized net expense ratios and an assumed rate of return of 5% per year before expenses. |
128
FUNDS PROFILE
Goldman Sachs Funds

Goldman Sachs is a premier financial services firm, known since 1869 for creating thoughtful and customized investment solutions in complex global markets.
Today, the Investment Management Division of Goldman Sachs serves a diverse set of clients worldwide, including private institutions, public entities and individuals. With approximately $1.08 trillion in assets under supervision as of December 31, 2015, Goldman Sachs Asset Management (“GSAM”) has portfolio management teams located around the world and our investment professionals bring firsthand knowledge of local markets to every investment decision. Assets under supervision includes assets under management and other client assets for which Goldman Sachs does not have full discretion. GSAM leverages the resources of Goldman, Sachs & Co. subject to legal, internal and regulatory restrictions.

Money Market1
Financial Square FundsSM
| n | | Financial Square Tax-Exempt Funds |
| n | | Financial Square Treasury Solutions Fund2 |
| n | | Financial Square Government Fund |
| n | | Financial Square Money Market Fund |
| n | | Financial Square Prime Obligations Fund |
| n | | Financial Square Treasury Instruments Fund |
| n | | Financial Square Treasury Obligations Fund |
| n | | Financial Square Federal Instruments Fund |
| n | | Financial Square Tax-Exempt Money Market Fund |
Investor FundsSM
| n | | Investor Money Market Fund |
| n | | Investor Tax-Exempt Money Market Fund3 |
Fixed Income
Short Duration and Government
| n | | High Quality Floating Rate Fund |
| n | | Limited Maturity Obligations Fund |
| n | | Short Duration Government Fund |
| n | | Short Duration Income Fund |
| n | | Inflation Protected Securities Fund |
Multi-Sector
Municipal and Tax-Free
| n | | High Yield Municipal Fund |
| n | | Dynamic Municipal Income Fund |
| n | | Short Duration Tax-Free Fund |
Single Sector
| n | | Investment Grade Credit Fund |
| n | | High Yield Floating Rate Fund |
| n | | Emerging Markets Debt Fund |
| n | | Local Emerging Markets Debt Fund |
| n | | Dynamic Emerging Markets Debt Fund |
Fixed Income Alternatives
| n | | Long Short Credit Strategies Fund |
| n | | Fixed Income Macro Strategies Fund |
Fundamental Equity
| n | | Small/Mid Cap Value Fund |
| n | | Small/Mid Cap Growth Fund |
| n | | Flexible Cap Growth Fund |
| n | | Concentrated Growth Fund |
| n | | Technology Opportunities Fund4 |
| n | | Growth Opportunities Fund |
| n | | Rising Dividend Growth Fund |
| n | | Dynamic U.S. Equity Fund5 |
Tax-Advantaged Equity
| n | | U.S. Tax-Managed Equity Fund |
| n | | International Tax-Managed Equity Fund |
| n | | U.S. Equity Dividend and Premium Fund |
| n | | International Equity Dividend and Premium Fund |
Equity Insights
| n | | Small Cap Equity Insights Fund |
| n | | U.S. Equity Insights Fund |
| n | | Small Cap Growth Insights Fund |
| n | | Large Cap Growth Insights Fund |
| n | | Large Cap Value Insights Fund |
| n | | Small Cap Value Insights Fund |
| n | | International Small Cap Insights Fund6 |
| n | | International Equity Insights Fund |
| n | | Emerging Markets Equity Insights Fund |
Fundamental Equity International
| n | | Strategic International Equity Fund |
| n | | Focused International Equity Fund |
| n | | Emerging Markets Equity Fund7 |
Select Satellite8
| n | | Real Estate Securities Fund |
| n | | International Real Estate Securities Fund |
| n | | Commodity Strategy Fund |
| n | | Global Real Estate Securities Fund |
| n | | Dynamic Commodity Strategy Fund |
| n | | Dynamic Allocation Fund |
| n | | Absolute Return Tracker Fund |
| n | | Managed Futures Strategy Fund |
| n | | MLP Energy Infrastructure Fund |
| n | | Multi-Manager Alternatives Fund |
| n | | Multi-Asset Real Return Fund |
| n | | Absolute Return Multi-Asset Fund |
Total Portfolio Solutions8
| n | | Global Managed Beta Fund |
| n | | Multi-Manager Non-Core Fixed Income Fund |
| n | | Multi-Manager U.S. Dynamic Equity Fund |
| n | | Multi-Manager Global Equity Fund |
| n | | Multi-Manager International Equity Fund |
| n | | Tactical Tilt Implementation Fund |
| n | | Balanced Strategy Portfolio |
| n | | Multi-Manager Real Assets Strategy Fund |
| n | | Growth and Income Strategy Portfolio |
| n | | Growth Strategy Portfolio |
| n | | Equity Growth Strategy Portfolio |
| n | | Satellite Strategies Portfolio |
| n | | Enhanced Dividend Global Equity Portfolio |
| n | | Tax Advantaged Global Equity Portfolio |
| 1 | | An investment in a money market fund is neither insured nor guaranteed by the Federal Deposit Insurance Corporation (“FDIC”) or any other government agency. Although the Funds seek to preserve the value of your investment at $1.00 per share, it is possible to lose money by investing in the Funds. |
| 2 | | Effective on September 30, 2015, the Goldman Sachs Financial Square Federal Fund was renamed the Goldman Sachs Financial Square Treasury Solutions Fund. |
| 3 | | Effective on March 31, 2016, the Goldman Sachs Financial Square Tax-Free Money Market Fund was renamed the Goldman Sachs Investor Tax-Exempt Money Market Fund. |
| 4 | | Effective on July 31, 2015, the Goldman Sachs Technology Tollkeeper Fund was renamed the Goldman Sachs Technology Opportunities Fund. |
| 5 | | Effective on April 30, 2015, the Goldman Sachs U.S. Equity Fund was renamed the Goldman Sachs Dynamic U.S. Equity Fund. |
| 6 | | Effective at the close of business on February 5, 2016, the Goldman Sachs International Small Cap Fund was reorganized with and into the Goldman Sachs International Small Cap Insights Fund. |
| 7 | | Effective at the close of business on October 23, 2015, the Goldman Sachs BRIC Fund (Brazil, Russia, India, China) was reorganized with and into the Goldman Sachs Emerging Markets Equity Fund. |
| 8 | | Individual Funds within the Total Portfolio Solutions and Select Satellite categories will have various placement on the risk/return spectrum and may have greater or lesser risk than that indicated by the placement of the general Total Portfolio Solutions or Select Satellite category. |
| * | | This list covers open-end funds only. Please visit our website at www.GSAMFUNDS.com to learn about our closed-end funds and exchange-traded funds. |
| | |
TRUSTEES Ashok N. Bakhru, Chairman Kathryn A. Cassidy Diana M. Daniels Herbert J. Markley James A. McNamara Jessica Palmer Alan A. Shuch Roy W. Templin Gregory G. Weaver | | OFFICERS James A. McNamara, President Scott M. McHugh, Treasurer, Senior Vice President and Principal Financial Officer Caroline Kraus, Secretary |
| |
GOLDMAN, SACHS & CO. Distributor and Transfer Agent | | GOLDMAN SACHS ASSET MANAGEMENT, L.P. Investment Adviser++ |
Visit our web site at www.GSAMFUNDS.com to obtain the most recent month-end returns.
Goldman Sachs Asset Management, L.P. 200 West Street, New York, New York 10282
The reports concerning the Funds included in this shareholder report may contain certain forward-looking statements about the factors that may affect the performance of the Funds in the future. These statements are based on Fund management’s predictions and expectations concerning certain future events and their expected impact on the Funds, such as performance of the economy as a whole and of specific industry sectors, changes in the levels of interest rates, the impact of developing world events, and other factors that may influence the future performance of the Funds. Management believes these forward-looking statements to be reasonable, although they are inherently uncertain and difficult to predict. Actual events may cause adjustments in portfolio management strategies from those currently expected to be employed.
A description of the policies and procedures that the Funds use to determine how to vote proxies relating to portfolio securities and information regarding how a Fund voted proxies relating to portfolio securities during the most recent 12-month period ended June 30 is available (i) without charge, upon request by calling 1-800-526-7384 (for Retail Shareholders) or 1-800-621-2550 (for Institutional Shareholders); and (ii) on the Securities and Exchange Commission (“SEC”) web site at http://www.sec.gov.
The Funds file their complete schedule of portfolio holdings with the SEC for the first and third quarters of each fiscal year on Form N-Qs. The Funds’ Form N-Qs are available on the SEC’s web site at http://www.sec.gov within 60 days after the Funds’ first and third fiscal quarters. The Funds’ Form N-Qs may be reviewed and copied at the SEC’s Public Reference Room in Washington, D.C. and information on the operation of the Public Reference Room may also be obtained by calling 1-800-SEC-0330. Form N-Qs may be obtained upon request and without charge by calling 1-800-526-7384 (for Retail Shareholders) or 1-800-621-2550 (for Institutional Shareholders).
Goldman, Sachs & Co. (‘‘Goldman Sachs’’) does not provide legal, tax or accounting advice. Any statement contained in this communication (including any attachments) concerning U.S. tax matters was not intended or written to be used, and cannot be used, for the purpose of avoiding penalties under the Internal Revenue Code, and was written to support the promotion or marketing of the transaction(s) or matter(s) addressed. Clients of Goldman Sachs should obtain their own independent tax advice based on their particular circumstances.
Fund holdings and allocations shown are as of February 29, 2016 and may not be representative of future investments. Fund holdings should not be relied on in making investment decisions and should not be construed as research or investment advice regarding particular securities. Current and future holdings are subject to risk.
The Global Industry Classification Standard (GICS) was developed by and is the exclusive property and a service mark of Morgan Stanley Capital International Inc. (MSCI) and Standard & Poor’s, a division of The McGraw-Hill Companies, Inc. (S&P) and is licensed for use by Goldman Sachs. Neither MSCI, S&P nor any other party involved in making or compiling the GICS or any GICS classifications makes any express or implied warranties or representations with respect to such standard or classification (or the results to be obtained by the use thereof), and all such parties hereby expressly disclaim all warranties of originality, accuracy, completeness, merchantability or fitness for a particular purpose with respect to any of such standard or classification. Without limiting any of the foregoing, in no event shall MSCI, S&P, any of their affiliates or any third party involved in making or compiling the GICS or any GICS classifications have any liability for any direct, indirect, special, punitive, consequential or any other damages (including lost profits) even if notified of the possibility of such damages.
The portfolio risk management process includes an effort to monitor and manage risk, but does not imply low risk.
This material is not authorized for distribution to prospective investors unless preceded or accompanied by a current Prospectus or summary prospectus, if applicable. Investors should consider a Fund’s objective, risks, and charges and expenses, and read the summary prospectus, if available, and/or the Prospectus carefully before investing or sending money. The summary prospectus, if available, and the Prospectus contain this and other information about a Fund and may be obtained from your Authorized Institution or from Goldman, Sachs & Co. by calling (retail – 1-800-526-7384) (institutional – 1-800-621-2550).
© 2016 Goldman Sachs. All rights reserved. 40323-TMPL-04/2016 EQGRWSAR-16 / 174K
(a) As of the end of the period covered by this report, the registrant has adopted a code of ethics that applies to the registrant’s principal executive officer, principal financial officer, principal accounting officer or controller, or persons performing similar functions, regardless of whether these individuals are employed by the registrant or a third party (the “Code of Ethics”).
(b) During the period covered by this report, no amendments were made to the provisions of the Code of Ethics.
(c) During the period covered by this report, the registrant did not grant any waivers, including an implicit waiver, from any provision of the Code of Ethics.
(d) A copy of the Code of Ethics is available as provided in Item 12(a)(1) of this report.
| ITEM 3. | AUDIT COMMITTEE FINANCIAL EXPERT. |
The registrant’s board of trustees has determined that the registrant has at least one “audit committee financial expert” (as defined in Item 3 of Form N-CSR) serving on its audit committee. Gregory G. Weaver is the “audit committee financial expert” and is “independent” (as each term is defined in Item 3 of Form N-CSR).
| ITEM 4. | PRINCIPAL ACCOUNTANT FEES AND SERVICES. |
Table 1 — Items 4(a) - 4(d). The accountant fees below reflect the aggregate fees billed by all of the Funds of the Goldman Sachs Trust and includes the Goldman Sachs Funds to which this certified shareholder report relates.
| | | | | | | | | | | | |
| | | 2015 | | 2014 | | Description of Services Rendered |
| | | |
| | | | | | | | | | | | |
| | | |
Audit Fees: | | | | | | | | | | | | |
| | | |
• PricewaterhouseCoopers LLP
(“PwC”) | | | $ | 3,628,517 | | | | $ | 4,269,524 | | | Financial Statement audits. |
| | | |
Audit-Related Fees: | | | | | | | | | | | | |
| | | |
• PwC | | | $ | 113,000 | | | | $ | 0 | | | Other attest services. |
| | | |
Tax Fees: | | | | | | | | | | | | |
| | | |
• PwC | | | $ | 759,210 | | | | $ | 939,217 | | | Tax compliance services provided in connection with the preparation and review of registrant’s tax returns. |
Table 2 — Items 4(b)(c) & (d). Non-Audit Services to the Goldman Sachs Trust’s service affiliates * that were pre-approved by the Audit Committee of the Goldman Sachs Trust pursuant to Rule 2-01(c)(7)(ii) of Regulation S-X.
| | | | | | | | | | | | |
| | | 2015 | | 2014 | | Description of Services Rendered |
| | | |
| | | | | | | | | | | | |
| | | |
Audit-Related Fees: | | | | | | | | | | | | |
| | | |
• PwC | | | $ | 1,568,616 | | | | $ | 1,486,420 | | | Internal control review performed in accordance with Statement on Standards for Attestation Engagements No. 16. These fees are borne by the Funds’ Adviser. |
| * | These include the advisor (excluding sub-advisors) and any entity controlling, controlled by or under common control with the advisor that provides ongoing services to the registrant (hereinafter referred to as “service affiliates”). |
Item 4(e)(1) — Audit Committee Pre-Approval Policies and Procedures
Pre-Approval of Audit and Non-Audit Services Provided to the Funds of the Goldman Sachs Trust. The Audit and Non-Audit Services Pre-Approval Policy (the “Policy”) adopted by the Audit Committee of Goldman Sachs Trust (“GST”) sets forth the procedures and the conditions pursuant to which services performed by an independent auditor for GST may be pre-approved. Services may be pre-approved specifically by the Audit Committee as a whole or, in certain circumstances, by the Audit Committee Chairman or the person designated as the Audit Committee Financial Expert. In addition, subject to specified cost limitations, certain services may be pre-approved under the provisions of the Policy. The Policy provides that the Audit Committee will consider whether the services provided by an independent auditor are consistent with the Securities and Exchange Commission’s rules on auditor independence. The Policy provides for periodic review and pre-approval by the Audit Committee of the services that may be provided by the independent auditor.
De Minimis Waiver. The pre-approval requirements of the Policy may be waived with respect to the provision of non-audit services that are permissible for an independent auditor to perform, provided (1) the aggregate amount of all such services provided constitutes no more than five percent of the total amount of revenues subject to pre-approval that was paid to the independent auditors during the fiscal year in which the services are provided; (2) such services were not recognized by GST at the time of the engagement to be non-audit services; and (3) such services are promptly brought to the attention of the Audit Committee and approved prior to the completion of the audit by the Audit Committee or by one or more members of the Audit Committee to whom authority to grant such approvals has been delegated by the Audit Committee, pursuant to the pre-approval provisions of the Policy.
Pre-Approval of Non-Audit Services Provided to GST’s Investment Advisers. The Policy provides that, in addition to requiring pre-approval of audit and non-audit services provided to GST, the Audit Committee will pre-approve those non-audit services provided to GST’s investment advisers (and entities controlling, controlled by or under common control with the investment advisers that provide ongoing services to GST) where the engagement relates directly to the operations or financial reporting of GST.
Item 4(e)(2) – 0% of the audit-related fees, tax fees and other fees listed in Table 1 were approved by GST’s Audit Committee pursuant to the “de minimis” exception of Rule 2-01(c)(7)(i)(C) of Regulation S-X. In addition, 0% of the non-audit services to the GST’s service affiliates listed in Table 2 were approved by GST’s Audit Committee pursuant to the “de minimis” exception of Rule 2-01(c)(7)(i)(C) of Regulation S-X.
Item 4(f) – Not applicable.
Item 4(g) Aggregate Non-Audit Fees Disclosure
The aggregate non-audit fees billed to GST by PwC for the twelve months ended August 31, 2015 and August 31, 2014 were approximately $872,210 and $939,217 respectively. The aggregate non-audit fees billed to GST’s adviser and service affiliates by PwC for non-audit services for the twelve months ended December 31, 2014 and December 31, 2013 were approximately $10.2 million and $9.8 million respectively. With regard to the aggregate non-audit fees billed to GST’s adviser and service affiliates, the 2014 and 2013 amounts include fees for non-audit services required to be pre-approved [see Table 2] and fees for non-audit services that did not require pre-approval since they did not directly relate to GST’s operations or financial reporting.
Item 4(h) — GST’s Audit Committee has considered whether the provision of non-audit services to GST’s investment adviser and service affiliates that did not require pre-approval pursuant to paragraph (c)(7)(ii) of Rule 2-01 of Regulation S-X is compatible with maintaining the auditors’ independence.
| ITEM 5. | AUDIT COMMITTEE OF LISTED REGISTRANTS. |
| ITEM 6. | SCHEDULE OF INVESTMENTS. |
| | Schedule of Investments is included as part of the Report to Shareholders filed under Item 1. |
| ITEM 7. | DISCLOSURE OF PROXY VOTING POLICIES AND PROCEDURES FOR CLOSED-END MANAGEMENT INVESTMENT COMPANIES. |
| ITEM 8. | PORTFOLIO MANAGERS OF CLOSED-END MANAGEMENT INVESTMENT COMPANIES. |
| ITEM 9. | PURCHASES OF EQUITY SECURITIES BY CLOSED-END MANAGEMENT INVESTMENT COMPANY AND AFFILIATED PURCHASERS. |
| ITEM 10. | SUBMISSION OF MATTERS TO A VOTE OF SECURITY HOLDERS. |
| | There have been no material changes to the procedures by which shareholders may recommend nominees to the registrant’s board of trustees. |
| ITEM 11. | CONTROLS AND PROCEDURES. |
| | (a) | The registrant’s principal executive and principal financial officers, or persons performing similar functions have concluded that the registrant’s disclosure controls and procedures (as defined in Rule 30a-3(c) under the Investment Company Act of 1940, as amended (the “1940 Act”)) are effective as of a date within 90 days of the filing of this report that includes the disclosure required by this paragraph, based on the evaluation of these controls and procedures required by Rule 30a-3(b) under the 1940 Act and 15d-15(b) under the Securities Exchange Act of 1934, as amended. |
| | (b) | There were no changes in the registrant’s internal control over financial reporting (as defined in Rule 30a-3(d) under the 1940 Act) that occurred during the registrant’s second fiscal quarter of the period covered by this report that have materially affected, or are reasonably likely to materially affect, the registrant’s internal control over financial reporting. |
| | | | |
| (a)(1) | | Goldman Sachs Trust’s Code of Ethics for Principal Executive and Senior Financial Officers is incorporated by reference to Exhibit 12(a)(1) of the registrant’s Form N-CSR filed on July 8, 2015 for its International Equity Insights Funds. |
| | |
| (a)(2) | | Exhibit 99.CERT | | Certifications pursuant to Section 302 of the Sarbanes-Oxley Act of 2002 filed herewith. |
| | |
| (b) | | Exhibit 99.906CERT | | Certifications pursuant to Section 906 of the Sarbanes-Oxley Act of 2002 filed herewith. |
SIGNATURES
Pursuant to the requirements of the Securities Exchange Act of 1934 and the Investment Company Act of 1940, the registrant has duly caused this report to be signed on its behalf by the undersigned, thereunto duly authorized.
| | |
| | | Goldman Sachs Trust |
| |
| By: | | /s/ James A. McNamara |
| |
| | |
| | James A. McNamara |
| | President/Chief Executive Officer |
| | Goldman Sachs Trust |
| |
| Date: | | May 9, 2016 |
Pursuant to the requirements of the Securities Exchange Act of 1934 and the Investment Company Act of 1940, this report has been signed below by the following persons on behalf of the registrant and in the capacities and on the dates indicated.
| | |
| By: | | /s/ James A. McNamara |
| |
| | |
| | James A. McNamara |
| | President/Chief Executive Officer |
| | Goldman Sachs Trust |
| |
| Date: | | May 9, 2016 |
| |
| By: | | /s/ Scott McHugh |
| |
| | |
| | Scott McHugh |
| | Principal Financial Officer |
| | Goldman Sachs Trust |
| |
| Date: | | May 9, 2016 |