UNITED STATES
SECURITIES AND EXCHANGE COMMISSION
Washington, D.C. 20549
FORM N-CSR
CERTIFIED SHAREHOLDER REPORT OF REGISTERED
MANAGEMENT INVESTMENT COMPANIES
Investment Company Act file number 811-05349
Goldman Sachs Trust
(Exact name of registrant as specified in charter)
71 South Wacker Drive, Chicago, Illinois 60606
(Address of principal executive offices) (Zip code)
| | |
| Caroline Kraus, Esq. | | Copies to: |
| Goldman, Sachs & Co. | | Geoffrey R.T. Kenyon, Esq. |
| 200 West Street | | Dechert LLP |
| New York, New York 10282 | | 100 Oliver Street |
| | 40th Floor |
| | Boston, MA 02110-2605 |
(Name and address of agents for service)
Registrant’s telephone number, including area code: (312) 655-4400
Date of fiscal year end: October 31
Date of reporting period: April 30, 2015
| ITEM 1. | REPORTS TO STOCKHOLDERS. |
| | The Semi-Annual Report to Stockholders is filed herewith. |
Goldman Sachs Funds

| | | | |
| | |
| Semi-Annual Report | | | | April 30, 2015 |
| | |
| | | | Multi-Asset Real Return Fund |

Goldman Sachs Multi-Asset Real Return Fund
| | | | |
TABLE OF CONTENTS | | | | |
| |
Principal Investment Strategies and Risks | | | 1 | |
| |
Investment Process | | | 2 | |
| |
Portfolio Management Discussions and Performance Summaries | | | 3 | |
| |
Schedule of Investments | | | 11 | |
| |
Financial Statements | | | 17 | |
| |
Financial Highlights | | | 20 | |
| |
Notes to the Financial Statements | | | 22 | |
| |
Other Information | | | 32 | |
| | | | |
| | | |
| NOT FDIC-INSURED | | May Lose Value | | No Bank Guarantee |
GOLDMAN SACHS MULTI-ASSET REAL RETURN FUND
Principal Investment Strategies and Risks
This is not a complete list of risks that may affect the Fund. For additional information concerning the risks applicable to the Fund, please see the Fund’s Prospectus.
The Goldman Sachs Multi-Asset Real Return Fund seeks long-term real return by investing in inflation sensitive assets (i.e., investments that, in the judgment of the Investment Adviser, are expected to perform favorably in rising or high inflationary environments). The Fund invests primarily in a portfolio of equity, fixed income and commodity asset classes (the “Underlying Asset Classes”), including derivatives that provide exposure to the Underlying Asset Classes. Derivative instruments may involve a high degree of financial risk. These risks include the risk that a small movement in the price of the underlying security or benchmark may result in a disproportionately large movement, unfavorable or favorable, in the price of the derivative instrument; risk of default by a counterparty; and liquidity risk. The Fund’s equity investments are subject to market risk, which means that the value of its investments may go up or down in response to the prospects of individual companies, particular industry sectors and/or general economic conditions. Investing in real estate investment trusts (REITs) involves certain unique risks in addition to those risks associated with investing in the real estate industry in general. REITs whose underlying properties are concentrated in a particular industry or geographic region are also subject to risks affecting such industries and regions. The securities of REITs involve greater risks than those associated with larger, more established companies and may be subject to more abrupt or erratic price movements because of interest rate changes, economic conditions and other factors. The Fund may also invest in fixed income securities, which are subject to the risks associated with debt securities generally, including credit and interest rate risk. The Fund may invest in non-investment grade securities, which involve greater price volatility and present greater risks than higher rated fixed income securities. The value of the Fund’s treasury inflation protected securities (TIPS) generally fluctuates in response to inflationary concerns, and as inflationary concerns decrease, TIPS become less valuable. Any guarantee on U.S. government securities applies only to the underlying securities of the Fund if held to maturity and not to the value of the Fund’s shares. Foreign and emerging market investments may be more volatile and less liquid than investments in U.S. securities and are subject to the risks of currency fluctuations and adverse economic and political developments. Exposure to the commodities markets may subject the Fund to greater volatility than investments in traditional securities. The Fund’s investments in pooled investment vehicles (including other investment companies, exchange-traded funds, master limited partnerships (MLPs) and publicly traded partnerships (PTPs)) subject it to additional expenses. Investments in MLPs are subject to certain risks, including risks related to limited control and limited rights to vote, potential conflicts of interest, cash flow risks, dilution risks, limited liquidity and risks related to the general partner’s right to force sales at undesirable times or prices. MLPs are also subject to risks relating to their complex tax structure, including the risk that a distribution received by the Fund from an MLP is treated as a return of capital, which may increase the Fund’s tax liability and require the Fund to restate the character of its distributions and amend shareholder tax reporting previously issued, and the risk that an MLP could lose its tax status as a partnership, resulting in a reduction in the value of the Fund’s investment in the MLP and lower income to the Fund. Risks of PTPs may include potential lack of liquidity and limitations on voting and distribution rights.
1
GOLDMAN SACHS MULTI-ASSET REAL RETURN FUND
What Differentiates Goldman Sachs Multi-Asset Real Return Fund’s Investment Process?
The Goldman Sachs Multi-Asset Real Return Fund (the “Fund”) seeks to achieve long-term real return. The Fund invests primarily in a portfolio of equity, fixed income and commodity securities in an attempt to perform favorably in rising or high inflationary environments. The Fund seeks to provide exposure beyond traditional asset classes to protect against a broader set of inflation catalysts in various market environments.


| n | | Inflation-sensitive assets tend to move in the same direction as inflation which may preserve real portfolio returns. |
| n | | We seek to provide access to investments that have historically provided the necessary growth to protect purchasing power in periods of high or rising inflation. |

| n | | Traditional stocks and bonds may not be able to provide the necessary diversification to improve portfolio returns across changing market environments. |
| n | | The Fund invests in a diversified portfolio in an attempt to provide investors with lower volatility over the long-term. |

| n | | We utilize a comprehensive investment process that opportunistically shifts portfolio assets through long-term strategic allocation, tactical adjustments, underlying security selection and active risk management. |
| n | | The flexibility in our investment process helps us to respond to ever-changing markets and to balance the portfolio’s risk and potential return. |
| n | | We have a robust risk management framework, with multiple layers of oversight at the strategic allocation, security selection and firm levels. |
2
PORTFOLIO RESULTS
Goldman Sachs Multi-Asset Real Return Fund
Investment Objective
The Fund seeks to achieve long-term real return.
Portfolio Management Discussion and Analysis
Below, the Goldman Sachs Global Portfolio Solutions Team discusses the Goldman Sachs Multi-Asset Real Return Fund’s (the “Fund”) performance and positioning for the six-month period ended April 30, 2015 (the “Reporting Period”).
| Q | | How did the Fund perform during the Reporting Period? |
| A | | During the Reporting Period, the Fund’s Class A, C, Institutional, IR and R Shares generated cumulative total returns, without sales charges, of -2.39%, -2.75%, -2.28%, -2.26% and -2.51%, respectively. These returns compare to the 0.60% cumulative total return of the Fund’s benchmark, the Barclays 1-10 Year U.S. TIPS Index (the “Barclays Index”), during the same time period. |
| Q | | What economic and market factors most influenced the Fund during the Reporting Period? |
| A | | Unfolding divergence in central bank monetary policy and in economic growth across countries and regions around the globe, particularly in developed markets, was a dominant theme impacting the various asset classes through most of the Reporting Period. More specifically, central bank action across the globe surprised the financial markets early in 2015, with 14 central banks announcing quantitative easing measures in January 2015 alone. Such actions brought risk assets into favor for a time. Meanwhile, in the U.S., the Federal Reserve (the “Fed”) had ended its quantitative easing program asset purchases on schedule at the end of October 2014, but March 2015’s Fed meeting surprised to the dovish side, as it lowered forecasts for interest rates and U.S. Gross Domestic Product (“GDP”). (A dovish economy would tend to indicate lower interest rates; a dovish action or event is one that is not strong or aggressive (opposite of hawkish).) This led the U.S. Treasury yield curve to flatten modestly, meaning the differential between longer-term and shorter-term yields narrowed. The momentum in global monetary and economic divergence slowed only slightly in April 2015 on the heels of global economic growth concerns, including a lackluster first quarter 2015 report for U.S. GDP. |
| | On the inflation front, falling energy prices and a weaker global economic growth outlook, coupled with a strengthening U.S. dollar, led to more muted U.S. inflation expectations. Core inflation remained range-bound during the Reporting Period between 1.6% and 1.8%, but the market saw a slight pick-up from the lower end of the range in 2015, with March 2015 marking the third consecutive month of increases against expectations of a moderate decline. Commodities underperformed during the Reporting Period, as oil prices remained depressed due to unbalanced supply/ demand dynamics, with supply outpacing demand. We believe the relative strength in oil prices seen toward the end of the Reporting Period is likely to prove transient in nature, and we expect plentiful supply to maintain downward price pressures. The Reporting Period saw the U.S. dollar strengthen against most major global currencies, supported by improving macroeconomic data, improving budget deficit and trade balances, and widespread monetary easing outside the U.S. Accommodative economic policy and a generally positive growth outlook in Europe contributed positively to equity performance across the Eurozone (as measured by the Dow Jones Euro Stoxx 50 Index), though European equities still lagged developed market equities broadly (as measured by the MSCI World Index) due to ongoing negotiations over the Greek debt situation toward the end of the Reporting Period. Economic conditions in China also remained comparatively weaker, but expectations of further easing by the People’s Bank of China (“PBOC”) and domestic demand helped offset the impact of slower growth amidst a controlled slowdown. |
| | The 12-month percent change of the U.S. Consumer Price Index (“CPI”) for April 2015 was -0.2%. The core CPI, which excludes food and energy, for the same time period rose 1.8%. The food index advanced 2.0% during the |
3
PORTFOLIO RESULTS
| | Reporting Period, and the energy index of the CPI actually declined 19.4% over the same time span. |
| Q | | What key factors were responsible for the Fund’s performance during the Reporting Period? |
| A | | During the Reporting Period, the Fund posted negative absolute returns and underperformed the Barclays Index on a relative basis. U.S. Treasury inflation protected securities (“TIPS”) failed to keep pace with nominal, or non-inflation protected, U.S. Treasuries, as break-even inflation levels were negatively impacted by the drop in crude oil prices during the Reporting Period. (The break-even inflation rate is the difference between the nominal yield on a fixed-rate investment and the real yield on an inflation-linked investment of similar maturity and credit quality. If inflation averages more than the break-even, the inflation-linked investment will outperform the fixed-rate. Conversely, if inflation averages below the break-even, the fixed-rate will outperform the inflation-linked.) |
| | The Fund’s underperformance relative to the Barclays Index was primarily driven by strategic asset allocation, which reflects a longer-term perspective of diversifying and investing in inflation-sensitive asset classes beyond TIPS. These additional asset classes included equities, real estate securities, Master Limited Partnerships (“MLPs”), infrastructure, commodities and additional fixed income sectors. The Fund’s longer-term strategic asset allocation performance was partially offset by effective short-term tactical allocation positioning. Underlying security selection and implementation also contributed positively. |
| | More specifically, the Fund’s strategic asset allocation performance was driven most during the Reporting Period by its exposure to commodities and MLPs and, to a lesser extent, by its exposure to local emerging markets debt. Interest rate curve positioning, intended to protect against potential increases in real rates, was also a detractor. Conversely, the Fund’s exposure to global infrastructure equities, select equity sectors (i.e., health care, consumer staples, energy and materials) and U.S. real estate securities, via a variety of underlying investments, contributed positively to relative results. The Fund’s strategic asset allocation to an unconstrained multi-sector fixed income investment also boosted results. |
| | Tactical asset allocation overall contributed positively to the Fund’s relative results during the Reporting Period. As mentioned earlier, in seeking its objective to achieve long-term real return, the Fund invests in a diversified portfolio of inflation-sensitive equity, fixed income and commodity securities and exposures. The Fund’s portfolio managers allocate across these diversified exposures by addressing the multiple potential drivers of inflation in what we determine to be a balanced way. This sets the Fund’s strategic asset allocation. The Fund’s portfolio managers then adjust the relative sizing of these exposures based on a shorter investment horizon that reflects tactical market views. Relative to the strategic asset allocation set during the Reporting Period, the Fund was overweight equities and underweight fixed income. More specifically, within equities, the Fund favored U.S. large-cap equities broadly as well as non-U.S. equities, mainly through index exposure in Japan and Europe. The Fund had an underweighted allocation to inflation-sensitive U.S. equity sectors. Within fixed income, the Fund was underweight U.S. TIPS for the majority of the Reporting Period and was positioned for anticipated increases in U.S. rates. The Fund also had only modest exposure to local emerging markets debt. For the Reporting Period overall, the Fund’s allocation to equities and its local emerging markets debt positioning added value, partially offset by its fixed income exposure and interest rate curve positioning, which detracted. |
| | Underlying fund implementation and security selection overall contributed positively to the Fund’s results. Positive security selection in commodities, MLPs and U.S. real estate securities offset security selection in fixed income sectors, which detracted. |
| Q | | How was the Fund positioned during the Reporting Period? |
| A | | At the start of the Reporting Period, the Fund had approximately 13.4% of its total net assets invested in commodity-related investments; approximately 48.6% of its total net assets invested in equity-related investments; and 40.7% of its total net assets invested in fixed income-related investments. The strategic asset allocation of the Fund reflects a risk-based allocation approach to increase diversification across the portfolio. |
| Q | | How did you tactically manage the Fund’s allocations during the Reporting Period? |
| A | | During the Reporting Period, positioning within the Fund was adjusted to reflect what we considered to be modest signs of improvement in global economic growth sentiment. Tactically, this positioning translated into a positive view of risk assets, maintained through a broad tilt toward U.S. and |
4
PORTFOLIO RESULTS
| | other developed market equities, which was modulated based on regional and sector exposure views. |
| | Within the allocation to U.S. equity sectors, our team reduced the Fund’s allocation to energy-related equities during the Reporting Period, as we believed the sector would be negatively impacted by ongoing oil price volatility, uncertain supply/demand dynamics and geopolitical concerns. Instead, we favored the health care sector given what we viewed as a robust product pipeline and supportive reform environment. |
| | Our team also reduced the Fund’s allocation to commodities within the Fund during the Reporting Period. As inventory levels remained elevated and production had not significantly decelerated, we did not expect commodities to be a meaningful driver of rising inflation expectations. Similarly, the Fund maintained only a modest exposure to emerging markets debt denominated in local currencies. Such positioning proved prudent, as investors shied away from economies sensitive to plummeting commodity prices and currency depreciation relative to the U.S. dollar. |
| | Additionally, our team maintained a generally negative view on U.S. interest rates amidst the persistently low rate environment. The implementation of this view on U.S. interest rates was through a shorter duration stance than that of the Barclays Index. (Duration is a measure of sensitivity to changes in interest rates.) |
| Q | | How did the Fund use derivatives and similar instruments during the Reporting Period? |
| A | | During the Reporting Period, the Fund used interest rate swaps and Eurodollar futures in seeking tactical interest rate curve shape positions. (Different positions may be taken within the Fund based on expectations of changes in interest rates and expectations of changes in the yield curve. Changes in the shape of the yield curve will change the relative price of bonds represented by the curve.) The Fund also used equity index futures during the Reporting Period to tactically adjust the amount of risk incurred from exposure to equities in four markets — the U.S., the U.K., Europe and Japan. In addition, some of the Fund’s underlying fund investments used derivatives during the Reporting Period to manage duration along the yield curve, to apply their active investment views with greater versatility, seeking greater risk management precision, and to gain exposure to equity, fixed income and commodity asset classes. As market conditions warranted during the Reporting Period, some of these underlying funds engaged in interest rate swaps, swaptions (or options on interest rate swap contracts) and futures. |
| Q | | How was the Fund positioned at the end of the Reporting Period? |
| A | | At the end of the Reporting Period, the Fund had approximately 10.8% of its total net assets invested in commodity-related investments; 44.0% of its total net assets invested in equity-related investments; and 44.1% of its total net assets invested in fixed income-related investments. We believe that, fundamentally, U.S. rates were too low at the end of the Reporting Period and that as U.S. monetary policy moves away from quantitative easing and stimulation, interest rate volatility may re-enter the market. The above sector breakout is inclusive of derivative exposure across all asset classes. |
| Q | | What is the Fund’s tactical asset allocation view and strategy for the months ahead? |
| A | | Despite global economic growth concerns and weak first quarter 2015 U.S. GDP data released in April 2015, we maintained our conviction at the end of the Reporting Period that global output may improve modestly in aggregate, but ongoing divergence in economic activity and monetary policy may drive market performance. Falling energy prices and a weaker global economic growth outlook, coupled with a stronger U.S. dollar, resulted in downward pressure on U.S. inflation expectations during the Reporting Period. While we acknowledge the potential for this trend to continue in the near term, massive economic stimulus from major central banks outside the U.S., including the Bank of Japan (“BoJ”) and European Central Bank (“ECB”), may have larger implications for inflation on a long-term basis. Should economic growth return, as we anticipate, we expect to see a rise in U.S. interest rates, and we thus intend to maintain the Fund’s shorter duration relative to that of the Barclays Index. Further, in our view, the macroeconomic environment was still supportive of risk assets at the end of the Reporting Period, and we anticipate continued divergence in performance across regions, particularly in developed markets. |
| | At the end of the Reporting Period, we did not see deflationary risks, but we maintain our view that U.S. inflation may remain below target, with expectations of an interest rate hike in mid-2015 at the earliest. After the initial rate hike by the Fed, we believe monetary policy tightening may proceed at a more accelerated pace than that implied by the market at the end of April 2015. Ultimately, we believe |
5
PORTFOLIO RESULTS
| | timing for the first rate hike will depend on the two conditions set by the Fed in March 2015 — improvement in the labor market and inflation moving to its 2% objective over medium term. A stronger U.S. dollar and a renewed fall in oil prices may continue to weigh on inflation, although the rise in oil prices seen in April 2015 may be seen as a reprieve, helping to firm up U.S. inflation prospects. Overall, however, we expect core inflation to remain quiescent, or subdued. We further expect faster wage gains and a gradual recovery in oil prices, combined with a slower pace of U.S. dollar appreciation, to push headline inflation toward the Fed’s 2% target. (Headline inflation is the raw inflation figure as reported through the Consumer Price Index (“CPI”) that is released monthly by the Bureau of Labor Statistics. The CPI calculates the cost to purchase a fixed basket of goods as a way of determining how much inflation is occurring in the broad economy. The headline inflation figure is not adjusted for seasonality or for the often volatile elements of food and energy prices, which are removed in the core CPI.) |
| | Given this view, we believe the Fund was well positioned at the end of the Reporting Period to perform well in a variety of inflationary environments. We continue to seek opportunities to incorporate our tactical market views on a shorter-term basis. |
6
FUND BASICS
Multi-Asset Real Return Fund
as of April 30, 2015
| | | | | | | | | | |
| | PERFORMANCE REVIEW | |
| | | November 1, 2014–April 30, 2015 | | Fund Total Return
(based on NAV)1 | | | Barclays Index2 | |
| | Class A | | | -2.39 | % | | | 0.60 | % |
| | Class C | | | -2.75 | | | | 0.60 | |
| | Institutional | | | -2.28 | | | | 0.60 | |
| | Class IR | | | -2.26 | | | | 0.60 | |
| | | Class R | | | -2.51 | | | | 0.60 | |
| | 1 | | The net asset value (“NAV”) represents the net assets of the class of the Fund (ex-dividend) divided by the total number of shares of the class outstanding. The Fund’s performance assumes the reinvestment of dividends and other distributions. The Fund’s performance does not reflect the deduction of any applicable sales charges. |
| | 2 | | The Barclays 1-10 Year U.S. TIPS Index is an unmanaged index comprised of U.S. Treasury Inflation Protected securities having a maturity of at least 1 year and less than 10 years. It is not possible to invest in an unmanaged index. |
| | | | | | | | | | | | |
| | STANDARDIZED TOTAL RETURNS3 |
| | | For the period ended 3/31/15 | | One Year | | | Since Inception | | | Inception Date |
| | Class A | | | -8.28 | % | | | -1.14 | % | | 8/30/2013 |
| | Class C | | | -4.64 | | | | 1.64 | | | 8/30/2013 |
| | Institutional | | | -2.56 | | | | 2.81 | | | 8/30/2013 |
| | Class IR | | | -2.70 | | | | 2.67 | | | 8/30/2013 |
| | | Class R | | | -3.19 | | | | 2.12 | | | 8/30/2013 |
| | 3 | | The Standardized Total Returns are cumulative total returns (only if performance is one year or less) as of the most recent calendar quarter-end. They assume reinvestment of all distributions at NAV. These returns reflect a maximum initial sales charge of 5.50% for Class A Shares and the assumed contingent deferred sales charge for Class C Shares (1% if redeemed within 12 months of purchase). Because Institutional, Class IR and Class R Shares do not involve a sales charge, such a charge is not applied to their Standardized Total Returns. |
The returns set forth in the tables above represent past performance. Past performance does not guarantee future results. The Fund’s investment return and principal value will fluctuate so that an investor’s shares, when redeemed, may be worth more or less than their original cost. Current performance may be lower or higher than the performance quoted above. Please visit our web site at www.GSAMFUNDS.com to obtain the most recent month-end returns. Performance reflects applicable fee waivers and/or expense limitations in effect during the periods shown. In their absence, performance would be reduced. Returns do not reflect the deduction of taxes that a shareholder would pay on Fund distributions or the redemption of Fund shares.
7
FUND BASICS
| | | | | | | | | | |
| | EXPENSE RATIOS4 | |
| | | | | Net Expense Ratio (Current) | | | Gross Expense Ratio (Before Waivers) | |
| | Class A | | | 1.28 | % | | | 3.51 | % |
| | Class C | | | 2.05 | | | | 4.62 | |
| | Institutional | | | 0.88 | | | | 3.45 | |
| | Class IR | | | 1.02 | | | | 3.59 | |
| | | Class R | | | 1.53 | | | | 4.10 | |
| | 4 | | The expense ratios of the Fund, both current (net of applicable fee waivers and/or expense limitations) and before waivers (gross of applicable fee waivers and/or expense limitations) are as set forth above according to the most recent publicly available Prospectus for the Fund and may differ from the expense ratios disclosed in the Financial Highlights in this report. Pursuant to a contractual arrangement, the Fund’s waivers and/or expense limitations will remain in place through at least February 29, 2016, and prior to such date the investment adviser may not terminate the arrangements without the approval of the Fund’s Board of Trustees. If these arrangements are discontinued in the future, the expense ratios may change without shareholder approval. |
| | | | | | | | |
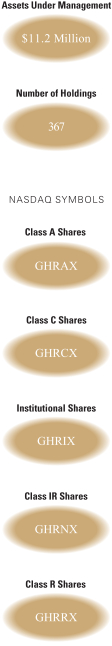
| | TOP TEN HOLDINGS AS OF 4/30/155 |
| | | Holding | | % of Net Assets | | | Line of Business |
| | Goldman Sachs Strategic Income Fund | | | 24.9 | % | | Investment Company |
| | Goldman Sachs Inflation Protected Securities Fund | | | 15.0 | | | Investment Company |
| | Goldman Sachs Commodity Strategy Fund | | | 10.9 | | | Investment Company |
| | iShares Global Infrastructure ETF | | | 4.7 | | | Exchange Traded Funds |
| | Goldman Sachs Local Emerging Markets Debt Fund | | | 4.6 | | | Investment Company |
| | Enterprise Products Partners LP | | | 0.9 | | | Oil, Gas & Consumable Fuels |
| | Simon Property Group, Inc. | | | 0.9 | | | Real Estate Investment Trusts |
| | Exxon Mobil Corp. | | | 0.8 | | | Oil, Gas & Consumable Fuels |
| | The Williams Cos., Inc. | | | 0.7 | | | Oil, Gas & Consumable Fuels |
| | | Plains All American Pipeline LP | | | 0.7 | | | Oil, Gas & Consumable Fuels |
| | 5 | | The top 10 holdings may not be representative of the Fund’s future investments. |
8
FUND BASICS
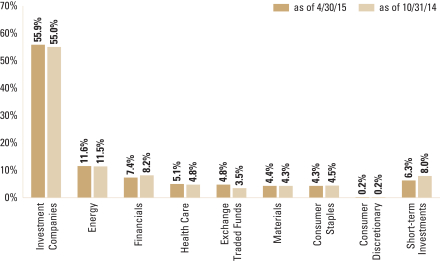
| | 6 | | The Fund is actively managed and, as such, its composition may differ over time. Consequently, the Fund’s overall sector allocations may differ from the percentages contained in the graph above. The graph categorizes investments using the Global Industry Classification Standard (“GICS”), however, the sector classifications used by the portfolio management team may differ from GICS. Underlying sector allocations of Exchange Traded Funds held by the Fund are not reflected in the graph above. The percentage shown for each investment category reflects the value of investments in that category as a percentage of market value. Short-term investments represent repurchase agreements. The graph depicts the Fund’s investments but may not represent the Fund’s market exposure due to the exclusion of certain derivatives, if any, as listed in the Additional Investment Information section of the Schedule of Investments. |
9
FUND BASICS
Index Definitions
The Dow Jones Euro Stoxx 50 Index is a market capitalization-weighted stock index of 50 large, blue-chip European companies operating within Eurozone nations.
The MSCI World Index is a market capitalization-weighted benchmark index made up of equities from 23 developed market countries, including the United States.
10
GOLDMAN SACHS MULTI-ASSET REAL RETURN FUND
Schedule of Investments
April 30, 2015 (Unaudited)
| | | | | | | | |
Shares | | | Description | | Value | |
| | | | | | | | |
| | Common Stocks – 32.7% | |
| | Beverages – 0.9% | |
| | 41 | | | Brown-Forman Corp. Class B | | $ | 3,699 | |
| | 56 | | | Coca-Cola Enterprises, Inc. | | | 2,487 | |
| | 46 | | | Constellation Brands, Inc. Class A* | | | 5,333 | |
| | 51 | | | Dr. Pepper Snapple Group, Inc. | | | 3,804 | |
| | 46 | | | Molson Coors Brewing Co. Class B | | | 3,382 | |
| | 38 | | | Monster Beverage Corp.* | | | 5,210 | |
| | 377 | | | PepsiCo., Inc. | | | 35,860 | |
| | 3 | | | The Boston Beer Co., Inc. Class A* | | | 743 | |
| | 1,000 | | | The Coca-Cola Co. | | | 40,560 | |
| | | | | | | | |
| | | | | | | 101,078 | |
| | |
| | Biotechnology – 1.0% | |
| | 42 | | | Alexion Pharmaceuticals, Inc.* | | | 7,108 | |
| | 148 | | | Amgen, Inc. | | | 23,371 | |
| | 46 | | | Biogen, Inc.* | | | 17,201 | |
| | 157 | | | Celgene Corp.* | | | 16,965 | |
| | 289 | | | Gilead Sciences, Inc.* | | | 29,047 | |
| | 15 | | | Regeneron Pharmaceuticals, Inc.* | | | 6,862 | |
| | 9 | | | United Therapeutics Corp.* | | | 1,437 | |
| | 50 | | | Vertex Pharmaceuticals, Inc.* | | | 6,164 | |
| | | | | | | | |
| | | | | | | 108,155 | |
| | |
| | Chemicals – 2.9% | |
| | 23 | | | A. Schulman, Inc. | | | 976 | |
| | 124 | | | Air Products & Chemicals, Inc. | | | 17,785 | |
| | 45 | | | Airgas, Inc. | | | 4,558 | |
| | 70 | | | Albemarle Corp. | | | 4,179 | |
| | 40 | | | Ashland, Inc. | | | 5,054 | |
| | 26 | | | Balchem Corp. | | | 1,363 | |
| | 41 | | | Cabot Corp. | | | 1,752 | |
| | 56 | | | Calgon Carbon Corp. | | | 1,243 | |
| | 31 | | | CF Industries Holdings, Inc. | | | 8,912 | |
| | 52 | | | Cytec Industries, Inc. | | | 2,875 | |
| | 584 | | | E.I. du Pont de Nemours and Co. | | | 42,749 | |
| | 97 | | | Eastman Chemical Co. | | | 7,393 | |
| | 171 | | | Ecolab, Inc. | | | 19,149 | |
| | 33 | | | Flotek Industries, Inc.* | | | 472 | |
| | 87 | | | FMC Corp. | | | 5,160 | |
| | 42 | | | H.B. Fuller Co. | | | 1,754 | |
| | 22 | | | Innophos Holdings, Inc. | | | 1,162 | |
| | 48 | | | International Flavors & Fragrances, Inc. | | | 5,508 | |
| | 47 | | | Intrepid Potash, Inc.* | | | 589 | |
| | 12 | | | LSB Industries, Inc.* | | | 509 | |
| | 256 | | | LyondellBasell Industries NV Class A | | | 26,501 | |
| | 29 | | | Minerals Technologies, Inc. | | | 1,964 | |
| | 312 | | | Monsanto Co. | | | 35,555 | |
| | 8 | | | NewMarket Corp. | | | 3,575 | |
| | 52 | | | Olin Corp. | | | 1,536 | |
| | 34 | | | OM Group, Inc. | | | 1,021 | |
| | 73 | | | PolyOne Corp. | | | 2,851 | |
| | 87 | | | PPG Industries, Inc. | | | 19,276 | |
| | 181 | | | Praxair, Inc. | | | 22,069 | |
| | 12 | | | Quaker Chemical Corp. | | | 999 | |
| | 90 | | | RPM International, Inc. | | | 4,279 | |
| | 34 | | | Sensient Technologies Corp. | | | 2,222 | |
| | 74 | | | Sigma-Aldrich Corp. | | | 10,280 | |
| | |
| | | | | | | | |
| | Common Stocks – (continued) | |
| | Chemicals – (continued) | |
| | 704 | | | The Dow Chemical Co. | | $ | 35,904 | |
| | 204 | | | The Mosaic Co. | | | 8,976 | |
| | 31 | | | The Scotts Miracle-Gro Co. Class A | | | 2,000 | |
| | 51 | | | The Sherwin-Williams Co. | | | 14,178 | |
| | 46 | | | The Valspar Corp. | | | 3,731 | |
| | | | | | | | |
| | | | | | | 330,059 | |
| | |
| | Construction Materials – 0.1% | |
| | 32 | | | Eagle Materials, Inc. | | | 2,668 | |
| | 62 | | | Headwaters, Inc.* | | | 1,090 | |
| | 38 | | | Martin Marietta Materials, Inc. | | | 5,421 | |
| | 86 | | | Vulcan Materials Co. | | | 7,355 | |
| | | | | | | | |
| | | | | | | 16,534 | |
| | |
| | Containers & Packaging – 0.4% | |
| | 42 | | | AptarGroup, Inc. | | | 2,607 | |
| | 62 | | | Avery Dennison Corp. | | | 3,447 | |
| | 83 | | | Ball Corp. | | | 6,093 | |
| | 56 | | | Bemis Co., Inc. | | | 2,520 | |
| | 24 | | | Greif, Inc. Class A | | | 978 | |
| | 109 | | | MeadWestvaco Corp. | | | 5,319 | |
| | 111 | | | Owens-Illinois, Inc.* | | | 2,654 | |
| | 65 | | | Packaging Corp. of America | | | 4,497 | |
| | 94 | | | Rock-Tenn Co. Class A | | | 5,920 | |
| | 129 | | | Sealed Air Corp. | | | 5,883 | |
| | 29 | | | Silgan Holdings, Inc. | | | 1,562 | |
| | 68 | | | Sonoco Products Co. | | | 3,039 | |
| | | | | | | | |
| | | | | | | 44,519 | |
| | |
| | Energy Equipment & Services – 0.7% | |
| | 27 | | | Atwood Oceanics, Inc. | | | 901 | |
| | 104 | | | Baker Hughes, Inc. | | | 7,120 | |
| | 10 | | | Bristow Group, Inc. | | | 621 | |
| | 49 | | | Cameron International Corp.* | | | 2,686 | |
| | 23 | | | Diamond Offshore Drilling, Inc. | | | 770 | |
| | 15 | | | Dresser-Rand Group, Inc.* | | | 1,240 | |
| | 14 | | | Dril-Quip, Inc.* | | | 1,116 | |
| | 53 | | | Ensco PLC Class A | | | 1,446 | |
| | 14 | | | Exterran Holdings, Inc. | | | 519 | |
| | 62 | | | FMC Technologies, Inc.* | | | 2,734 | |
| | 203 | | | Halliburton Co. | | | 9,937 | |
| | 37 | | | Helix Energy Solutions Group, Inc.* | | | 610 | |
| | 23 | | | Helmerich & Payne, Inc. | | | 1,793 | |
| | 84 | | | Nabors Industries Ltd. | | | 1,403 | |
| | 97 | | | National Oilwell Varco, Inc. | | | 5,278 | |
| | 64 | | | Noble Corp. PLC | | | 1,108 | |
| | 30 | | | Oceaneering International, Inc. | | | 1,653 | |
| | 16 | | | Oil States International, Inc.* | | | 761 | |
| | 36 | | | Patterson-UTI Energy, Inc. | | | 805 | |
| | 47 | | | Rowan Cos. PLC Class A | | | 996 | |
| | 310 | | | Schlumberger Ltd. | | | 29,329 | |
| | 43 | | | Superior Energy Services, Inc. | | | 1,097 | |
| | 92 | | | Transocean Ltd. | | | 1,731 | |
| | 15 | | | Unit Corp.* | | | 523 | |
| | 17 | | | US Silica Holdings, Inc. | | | 635 | |
| | | | | | | | |
| | | | | | | 76,812 | |
| | |
| | |
| The accompanying notes are an integral part of these financial statements. | | 11 |
GOLDMAN SACHS MULTI-ASSET REAL RETURN FUND
Schedule of Investments (continued)
April 30, 2015 (Unaudited)
| | | | | | | | |
Shares | | | Description | | Value | |
| | | | | | | | |
| | Common Stocks – (continued) | |
| | Food & Staples Retailing – 1.0% | |
| | 16 | | | Casey’s General Stores, Inc. | | $ | 1,315 | |
| | 108 | | | Costco Wholesale Corp. | | | 15,449 | |
| | 289 | | | CVS Health Corp. | | | 28,695 | |
| | 73 | | | Safeway Casa Ley | | | 74 | |
| | 73 | | | Safeway PDC, LLC | | | 4 | |
| | 52 | | | SUPERVALU, Inc.* | | | 457 | |
| | 158 | | | Sysco Corp. | | | 5,851 | |
| | 121 | | | The Kroger Co. | | | 8,338 | |
| | 20 | | | United Natural Foods, Inc.* | | | 1,349 | |
| | 398 | | | Wal-Mart Stores, Inc. | | | 31,064 | |
| | 221 | | | Walgreens Boots Alliance, Inc. | | | 18,328 | |
| | 103 | | | Whole Foods Market, Inc. | | | 4,919 | |
| | | | | | | | |
| | | | | | | 115,843 | |
| | |
| | Food Products – 0.8% | |
| | 163 | | | Archer-Daniels-Midland Co. | | | 7,967 | |
| | 50 | | | Campbell Soup Co. | | | 2,235 | |
| | 105 | | | ConAgra Foods, Inc. | | | 3,796 | |
| | 35 | | | Darling Ingredients, Inc.* | | | 478 | |
| | 45 | | | Flowers Foods, Inc. | | | 1,005 | |
| | 147 | | | General Mills, Inc. | | | 8,135 | |
| | 48 | | | Hormel Foods Corp. | | | 2,609 | |
| | 24 | | | Ingredion, Inc. | | | 1,906 | |
| | 61 | | | Kellogg Co. | | | 3,863 | |
| | 29 | | | Keurig Green Mountain, Inc. | | | 3,375 | |
| | 149 | | | Kraft Foods Group, Inc. | | | 12,628 | |
| | 9 | | | Lancaster Colony Corp. | | | 807 | |
| | 46 | | | McCormick & Co., Inc. | | | 3,464 | |
| | 52 | | | Mead Johnson Nutrition Co. | | | 4,988 | |
| | 414 | | | Mondelez International, Inc. Class A | | | 15,885 | |
| | 14 | | | Post Holdings, Inc.* | | | 657 | |
| | 8 | | | Sanderson Farms, Inc. | | | 601 | |
| | 13 | | | Snyder’s-Lance, Inc. | | | 384 | |
| | 26 | | | The Hain Celestial Group, Inc.* | | | 1,566 | |
| | 37 | | | The Hershey Co. | | | 3,401 | |
| | 22 | | | The J.M. Smucker Co. | | | 2,550 | |
| | 15 | | | TreeHouse Foods, Inc.* | | | 1,219 | |
| | 72 | | | Tyson Foods, Inc. Class A | | | 2,844 | |
| | 42 | | | WhiteWave Foods Co. Class A* | | | 1,847 | |
| | | | | | | | |
| | | | | | | 88,210 | |
| | |
| | Health Care Equipment & Supplies – 0.8% | |
| | 294 | | | Abbott Laboratories | | | 13,647 | |
| | 8 | | | ABIOMED, Inc.* | | | 506 | |
| | 20 | | | Align Technology, Inc.* | | | 1,177 | |
| | 98 | | | Baxter International, Inc. | | | 6,736 | |
| | 42 | | | Becton Dickinson & Co. | | | 5,917 | |
| | 278 | | | Boston Scientific Corp.* | | | 4,954 | |
| | 19 | | | C.R. Bard, Inc. | | | 3,165 | |
| | 30 | | | DENTSPLY International, Inc. | | | 1,530 | |
| | 23 | | | Edwards Lifesciences Corp.* | | | 2,913 | |
| | 11 | | | Haemonetics Corp.* | | | 446 | |
| | 12 | | | Halyard Health, Inc.* | | | 582 | |
| | 13 | | | Hill-Rom Holdings, Inc. | | | 649 | |
| | 53 | | | Hologic, Inc.* | | | 1,788 | |
| | 10 | | | IDEXX Laboratories, Inc.* | | | 1,254 | |
| | |
| | | | | | | | |
| | Common Stocks – (continued) | |
| | Health Care Equipment & Supplies – (continued) | |
| | 7 | | | Intuitive Surgical, Inc.* | | $ | 3,472 | |
| | 289 | | | Medtronic PLC | | | 21,516 | |
| | 12 | | | NuVasive, Inc.* | | | 537 | |
| | 9 | | | Sirona Dental Systems, Inc.* | | | 835 | |
| | 64 | | | St. Jude Medical, Inc. | | | 4,483 | |
| | 16 | | | STERIS Corp. | | | 1,064 | |
| | 62 | | | Stryker Corp. | | | 5,719 | |
| | 8 | | | Teleflex, Inc. | | | 984 | |
| | 11 | | | The Cooper Cos., Inc. | | | 1,959 | |
| | 12 | | | Thoratec Corp.* | | | 481 | |
| | 24 | | | Varian Medical Systems, Inc.* | | | 2,132 | |
| | 22 | | | West Pharmaceutical Services, Inc. | | | 1,172 | |
| | 30 | | | Zimmer Holdings, Inc. | | | 3,295 | |
| | | | | | | | |
| | | | | | | 92,913 | |
| | |
| | Health Care Providers & Services – 1.0% | |
| | 70 | | | Aetna, Inc. | | | 7,481 | |
| | 38 | | | AmerisourceBergen Corp. | | | 4,343 | |
| | 13 | | | Amsurg Corp.* | | | 815 | |
| | 55 | | | Anthem, Inc. | | | 8,301 | |
| | 68 | | | Cardinal Health, Inc. | | | 5,735 | |
| | 20 | | | Centene Corp.* | | | 1,240 | |
| | 52 | | | CIGNA Corp. | | | 6,481 | |
| | 28 | | | Community Health Systems, Inc.* | | | 1,503 | |
| | 38 | | | DaVita HealthCare Partners, Inc.* | | | 3,082 | |
| | 141 | | | Express Scripts Holding Co.* | | | 12,182 | |
| | 58 | | | HCA Holdings, Inc.* | | | 4,293 | |
| | 17 | | | Health Net, Inc.* | | | 895 | |
| | 17 | | | Henry Schein, Inc.* | | | 2,331 | |
| | 30 | | | Humana, Inc. | | | 4,968 | |
| | 19 | | | Laboratory Corp. of America Holdings* | | | 2,272 | |
| | 10 | | | LifePoint Hospitals, Inc.* | | | 749 | |
| | 47 | | | McKesson Corp. | | | 10,500 | |
| | 22 | | | MEDNAX, Inc.* | | | 1,557 | |
| | 9 | | | Molina Healthcare, Inc.* | | | 533 | |
| | 14 | | | Omnicare, Inc. | | | 1,232 | |
| | 20 | | | Owens & Minor, Inc. | | | 674 | |
| | 18 | | | Patterson Cos., Inc. | | | 845 | |
| | 32 | | | Quest Diagnostics, Inc. | | | 2,286 | |
| | 24 | | | Tenet Healthcare Corp.* | | | 1,149 | |
| | 186 | | | UnitedHealth Group, Inc. | | | 20,720 | |
| | 18 | | | Universal Health Services, Inc. Class B | | | 2,105 | |
| | 20 | | | VCA, Inc.* | | | 1,019 | |
| | 11 | | | WellCare Health Plans, Inc.* | | | 852 | |
| | | | | | | | |
| | | | | | | 110,143 | |
| | |
| | Health Care Technology* – 0.1% | |
| | 49 | | | Allscripts Healthcare Solutions, Inc. | | | 651 | |
| | 59 | | | Cerner Corp. | | | 4,237 | |
| | 14 | | | Medidata Solutions, Inc. | | | 748 | |
| | | | | | | | |
| | | | | | | 5,636 | |
| | |
| | Hotels, Restaurants & Leisure* – 0.2% | |
| | 353 | | | Hyatt Hotels Corp. Class A | | | 20,492 | |
| | |
| | Household Durables* – 0.1% | |
| | 179 | | | Toll Brothers, Inc. | | | 6,362 | |
| | |
| | |
| 12 | | The accompanying notes are an integral part of these financial statements. |
GOLDMAN SACHS MULTI-ASSET REAL RETURN FUND
| | | | | | | | |
Shares | | | Description | | Value | |
| | | | | | | | |
| | Common Stocks – (continued) | |
| | Household Products – 0.8% | |
| | 28 | | | Church & Dwight Co., Inc. | | $ | 2,273 | |
| | 215 | | | Colgate-Palmolive Co. | | | 14,465 | |
| | 19 | | | Energizer Holdings, Inc. | | | 2,596 | |
| | 88 | | | Kimberly-Clark Corp. | | | 9,652 | |
| | 41 | | | The Clorox Co. | | | 4,350 | |
| | 694 | | | The Procter & Gamble Co. | | | 55,180 | |
| | | | | | | | |
| | | | | | | 88,516 | |
| | |
| | Life Sciences Tools & Services – 0.2% | |
| | 75 | | | Agilent Technologies, Inc. | | | 3,103 | |
| | 7 | | | Bio-Techne Corp. | | | 672 | |
| | 11 | | | Charles River Laboratories International, Inc.* | | | 761 | |
| | 6 | | | Mettler-Toledo International, Inc.* | | | 1,902 | |
| | 16 | | | PAREXEL International Corp.* | | | 1,017 | |
| | 26 | | | PerkinElmer, Inc. | | | 1,333 | |
| | 79 | | | Thermo Fisher Scientific, Inc. | | | 9,928 | |
| | 16 | | | Waters Corp.* | | | 2,003 | |
| | | | | | | | |
| | | | | | | 20,719 | |
| | |
| | Metals & Mining – 0.6% | |
| | 122 | | | AK Steel Holding Corp.* | | | 620 | |
| | 772 | | | Alcoa, Inc. | | | 10,360 | |
| | 83 | | | Allegheny Technologies, Inc. | | | 2,821 | |
| | 33 | | | Carpenter Technology Corp. | | | 1,427 | |
| | 35 | | | Century Aluminum Co.* | | | 451 | |
| | 113 | | | Cliffs Natural Resources, Inc. | | | 671 | |
| | 102 | | | Commercial Metals Co. | | | 1,693 | |
| | 24 | | | Compass Minerals International, Inc. | | | 2,120 | |
| | 663 | | | Freeport-McMoRan, Inc. | | | 15,428 | |
| | 37 | | | Globe Specialty Metals, Inc. | | | 737 | |
| | 10 | | | Kaiser Aluminum Corp. | | | 804 | |
| | 12 | | | Materion Corp. | | | 480 | |
| | 318 | | | Newmont Mining Corp. | | | 8,424 | |
| | 193 | | | Nucor Corp. | | | 9,430 | |
| | 53 | | | Reliance Steel & Aluminum Co. | | | 3,430 | |
| | 46 | | | Royal Gold, Inc. | | | 2,969 | |
| | 17 | | | RTI International Metals, Inc.* | | | 640 | |
| | 165 | | | Steel Dynamics, Inc. | | | 3,652 | |
| | 92 | | | Stillwater Mining Co.* | | | 1,236 | |
| | 40 | | | SunCoke Energy, Inc. | | | 701 | |
| | 28 | | | TimkenSteel Corp. | | | 817 | |
| | 108 | | | United States Steel Corp. | | | 2,594 | |
| | 45 | | | Worthington Industries, Inc. | | | 1,216 | |
| | | | | | | | |
| | | | | | | 72,721 | |
| | |
| | Oil, Gas & Consumable Fuels – 10.8% | |
| | 119 | | | Anadarko Petroleum Corp. | | | 11,198 | |
| | 700 | | | Antero Midstream Partners LP | | | 17,500 | |
| | 91 | | | Apache Corp. | | | 6,224 | |
| | 650 | | | Buckeye Partners LP | | | 53,027 | |
| | 106 | | | Cabot Oil & Gas Corp. | | | 3,585 | |
| | 84 | | | California Resources Corp. | | | 781 | |
| | 14 | | | Carrizo Oil & Gas, Inc.* | | | 780 | |
| | 132 | | | Chesapeake Energy Corp. | | | 2,082 | |
| | 456 | | | Chevron Corp. | | | 50,643 | |
| | |
| | | | | | | | |
| | Common Stocks – (continued) | |
| | Oil, Gas & Consumable Fuels – (continued) | |
| | 20 | | | Cimarex Energy Co. | | $ | 2,488 | |
| | 400 | | | Columbia Pipeline Partners LP | | | 10,820 | |
| | 299 | | | ConocoPhillips | | | 20,308 | |
| | 62 | | | CONSOL Energy, Inc. | | | 2,014 | |
| | 800 | | | DCP Midstream Partners LP | | | 32,640 | |
| | 101 | | | Denbury Resources, Inc. | | | 890 | |
| | 96 | | | Devon Energy Corp. | | | 6,548 | |
| | 26 | | | Energen Corp. | | | 1,850 | |
| | 750 | | | Energy Transfer Equity LP | | | 49,995 | |
| | 2,900 | | | Enterprise Products Partners LP | | | 99,325 | |
| | 130 | | | EOG Resources, Inc. | | | 12,864 | |
| | 40 | | | EQT Corp. | | | 3,598 | |
| | 1,028 | | | Exxon Mobil Corp. | | | 89,816 | |
| | 950 | | | Genesis Energy LP | | | 47,224 | |
| | 20 | | | Gulfport Energy Corp.* | | | 979 | |
| | 64 | | | Hess Corp. | | | 4,922 | |
| | 54 | | | HollyFrontier Corp. | | | 2,094 | |
| | 410 | | | Kinder Morgan, Inc. | | | 17,610 | |
| | 800 | | | Magellan Midstream Partners LP | | | 66,800 | |
| | 161 | | | Marathon Oil Corp. | | | 5,007 | |
| | 63 | | | Marathon Petroleum Corp. | | | 6,210 | |
| | 325 | | | MarkWest Energy Partners LP | | | 21,925 | |
| | 350 | | | MPLX LP | | | 27,212 | |
| | 39 | | | Murphy Oil Corp. | | | 1,857 | |
| | 35 | | | Newfield Exploration Co.* | | | 1,373 | |
| | 91 | | | Noble Energy, Inc. | | | 4,616 | |
| | 184 | | | Occidental Petroleum Corp. | | | 14,738 | |
| | 750 | | | ONEOK Partners LP | | | 31,462 | |
| | 453 | | | ONEOK, Inc. | | | 21,789 | |
| | 13 | | | PDC Energy, Inc.* | | | 738 | |
| | 129 | | | Phillips 66 | | | 10,231 | |
| | 36 | | | Pioneer Natural Resources Co. | | | 6,220 | |
| | 1,491 | | | Plains All American Pipeline LP | | | 74,714 | |
| | 1,000 | | | Plains GP Holdings LP Class A | | | 29,400 | |
| | 60 | | | QEP Resources, Inc. | | | 1,350 | |
| | 41 | | | Range Resources Corp. | | | 2,606 | |
| | 30 | | | Rosetta Resources, Inc.* | | | 685 | |
| | 200 | | | SemGroup Corp. Class A | | | 16,838 | |
| | 22 | | | SM Energy Co. | | | 1,275 | |
| | 90 | | | Southwestern Energy Co.* | | | 2,523 | |
| | 852 | | | Spectra Energy Corp. | | | 31,737 | |
| | 1,300 | | | Sunoco Logistics Partners LP | | | 57,668 | |
| | 209 | | | Targa Resources Corp. | | | 21,939 | |
| | 600 | | | Targa Resources Partners LP | | | 27,264 | |
| | 500 | | | Teekay Offshore Partners LP | | | 11,730 | |
| | 28 | | | Tesoro Corp. | | | 2,403 | |
| | 550 | | | Tesoro Logistics LP | | | 30,816 | |
| | 1,460 | | | The Williams Cos., Inc. | | | 74,737 | |
| | 124 | | | Valero Energy Corp. | | | 7,056 | |
| | 17 | | | Western Refining, Inc. | | | 749 | |
| | 743 | | | Williams Partners LP | | | 36,704 | |
| | 24 | | | World Fuel Services Corp. | | | 1,332 | |
| | 66 | | | WPX Energy, Inc.* | | | 908 | |
| | | | | | | | |
| | | | | | | 1,206,417 | |
| | |
| | |
| The accompanying notes are an integral part of these financial statements. | | 13 |
GOLDMAN SACHS MULTI-ASSET REAL RETURN FUND
Schedule of Investments (continued)
April 30, 2015 (Unaudited)
| | | | | | | | |
Shares | | | Description | | Value | |
| | | | | | | | |
| | Common Stocks – (continued) | |
| | Paper & Forest Products – 0.2% | |
| | 30 | | | Boise Cascade Co.* | | $ | 1,041 | |
| | 18 | | | Clearwater Paper Corp.* | | | 1,151 | |
| | 48 | | | Domtar Corp. | | | 2,075 | |
| | 274 | | | International Paper Co. | | | 14,719 | |
| | 58 | | | KapStone Paper and Packaging Corp. | | | 1,621 | |
| | 96 | | | Louisiana-Pacific Corp.* | | | 1,463 | |
| | 10 | | | Neenah Paper, Inc. | | | 605 | |
| | 41 | | | PH Glatfelter Co. | | | 1,017 | |
| | 24 | | | Schweitzer-Mauduit International, Inc. | | | 1,061 | |
| | | | | | | | |
| | | | | | | 24,753 | |
| | |
| | Personal Products – 0.1% | |
| | 122 | | | Avon Products, Inc. | | | 997 | |
| | 57 | | | The Estee Lauder Cos., Inc. Class A | | | 4,633 | |
| | | | | | | | |
| | | | | | | 5,630 | |
| | |
| | Pharmaceuticals – 2.0% | |
| | 310 | | | AbbVie, Inc. | | | 20,045 | |
| | 76 | | | Actavis PLC* | | | 21,497 | |
| | 16 | | | Akorn, Inc.* | | | 666 | |
| | 323 | | | Bristol-Myers Squibb Co. | | | 20,585 | |
| | 193 | | | Eli Lilly & Co. | | | 13,871 | |
| | 37 | | | Endo International PLC* | | | 3,110 | |
| | 34 | | | Hospira, Inc.* | | | 2,968 | |
| | 16 | | | Impax Laboratories, Inc.* | | | 724 | |
| | 532 | | | Johnson & Johnson | | | 52,774 | |
| | 7 | | | Lannett Co., Inc.* | | | 403 | |
| | 24 | | | Mallinckrodt PLC* | | | 2,716 | |
| | 547 | | | Merck & Co., Inc. | | | 32,579 | |
| | 78 | | | Mylan NV* | | | 5,636 | |
| | 27 | | | Perrigo Co. PLC | | | 4,949 | |
| | 1,179 | | | Pfizer, Inc. | | | 40,004 | |
| | 11 | | | Prestige Brands Holdings, Inc.* | | | 432 | |
| | 17 | | | The Medicines Co.* | | | 435 | |
| | 94 | | | Zoetis, Inc. | | | 4,176 | |
| | | | | | | | |
| | | | | | | 227,570 | |
| | |
| | Real Estate Investment Trusts – 7.3% | |
| | 683 | | | Acadia Realty Trust | | | 21,105 | |
| | 161 | | | Alexandria Real Estate Equities, Inc. | | | 14,873 | |
| | 171 | | | American Tower Corp. | | | 16,165 | |
| | 295 | | | AvalonBay Communities, Inc. | | | 48,480 | |
| | 321 | | | Blackstone Mortgage Trust, Inc. Class A | | | 9,864 | |
| | 368 | | | Boston Properties, Inc. | | | 48,690 | |
| | 1,191 | | | Brixmor Property Group, Inc. | | | 27,929 | |
| | 358 | | | CBL & Associates Properties, Inc. | | | 6,448 | |
| | 960 | | | Chesapeake Lodging Trust | | | 30,480 | |
| | 473 | | | CyrusOne, Inc. | | | 15,363 | |
| | 1,463 | | | DDR Corp. | | | 24,944 | |
| | 1,391 | | | Empire State Realty Trust, Inc. Class A | | | 25,038 | |
| | 238 | | | Equity Residential | | | 17,579 | |
| | 50 | | | Essex Property Trust, Inc. | | | 11,098 | |
| | 214 | | | HCP, Inc. | | | 8,622 | |
| | 160 | | | Health Care REIT, Inc. | | | 11,523 | |
| | 480 | | | Highwoods Properties, Inc. | | | 20,659 | |
| | 570 | | | Liberty Property Trust | | | 19,859 | |
| | |
| | | | | | | | |
| | Common Stocks – (continued) | |
| | Real Estate Investment Trusts – (continued) | |
| | 119 | | | Mack-Cali Realty Corp. | | $ | 2,136 | |
| | 425 | | | Mid-America Apartment Communities, Inc. | | | 31,709 | |
| | 260 | | | National Health Investors, Inc. | | | 17,347 | |
| | 1,241 | | | Parkway Properties, Inc. | | | 20,191 | |
| | 326 | | | Pebblebrook Hotel Trust | | | 13,998 | |
| | 551 | | | Physicians Realty Trust | | | 9,147 | |
| | 493 | | | Post Properties, Inc. | | | 28,185 | |
| | 885 | | | ProLogis, Inc. | | | 35,577 | |
| | 231 | | | PS Business Parks, Inc. | | | 17,637 | |
| | 257 | | | Public Storage | | | 48,293 | |
| | 791 | | | RLJ Lodging Trust | | | 23,469 | |
| | 542 | | | Simon Property Group, Inc. | | | 98,368 | |
| | 39 | | | SL Green Realty Corp. | | | 4,772 | |
| | 182 | | | Sovran Self Storage, Inc. | | | 15,896 | |
| | 78 | | | The Macerich Co. | | | 6,377 | |
| | 621 | | | Ventas, Inc. | | | 42,787 | |
| | 158 | | | Vornado Realty Trust | | | 16,351 | |
| | | | | | | | |
| | | | | | | 810,959 | |
| | |
| | Real Estate Management & Development – 0.1% | |
| | 212 | | | RE/MAX Holdings, Inc. Class A | | | 7,163 | |
| | |
| | Tobacco – 0.6% | |
| | 500 | | | Altria Group, Inc. | | | 25,025 | |
| | 91 | | | Lorillard, Inc. | | | 6,357 | |
| | 388 | | | Philip Morris International, Inc. | | | 32,386 | |
| | 89 | | | Reynolds American, Inc. | | | 6,524 | |
| | 15 | | | Universal Corp. | | | 706 | |
| | | | | | | | |
| | | | | | | 70,998 | |
| | |
| | TOTAL COMMON STOCKS | |
| | (Cost $3,212,631) | | $ | 3,652,202 | |
| | |
| | | | | | | | |
| | Exchange Traded Fund – 4.7% | |
| | 12,057 | | | iShares Global Infrastructure ETF | | | | |
| | (Cost $445,790) | | $ | 527,011 | |
| | |
| | | | | | | | |
| Shares | | | Rate | | Value | |
| | Investment Companies(a) – 55.3% | |
| Goldman Sachs Commodity Strategy Fund —
Institutional Shares |
|
| | 305,062 | | | 0.000% | | $ | 1,214,146 | |
| Goldman Sachs Inflation Protected Securities Fund —
Institutional Shares |
|
| | 158,508 | | | 0.000 | | | 1,672,259 | |
| Goldman Sachs Local Emerging Markets Debt Fund —
Institutional Shares |
|
| | 71,878 | | | 0.001 | | | 513,211 | |
| Goldman Sachs Strategic Income Fund — Institutional
Shares |
|
| | 276,466 | | | 0.001 | | | 2,778,485 | |
| | |
| | TOTAL INVESTMENT COMPANIES | |
| | (Cost $6,763,882) | | $ | 6,178,101 | |
| | |
| | |
| 14 | | The accompanying notes are an integral part of these financial statements. |
GOLDMAN SACHS MULTI-ASSET REAL RETURN FUND
| | | | | | | | | | | | |
Principal
Amount | | | Interest
Rate | | Maturity
Date | | | Value | |
| | Short-term Investment(b) – 6.3% | | | | | |
| | Repurchase Agreement – 6.3% | | | | | |
| Joint Repurchase Agreement Account II | | | | | |
| $ | 700,000 | | | 0.127% | | | 05/01/15 | | | $ | 700,000 | |
| | (Cost $700,000) | | | | | | | | |
| | |
| | TOTAL INVESTMENTS – 99.0% | | | | | |
| | (Cost $11,122,303) | | | | | | $ | 11,057,314 | |
| | |
| OTHER ASSETS IN EXCESS OF
LIABILITIES – 1.0% |
| | | 115,036 | |
| | |
| | NET ASSETS – 100.0% | | | $ | 11,172,350 | |
| | |
| | |
| The percentage shown for each investment category reflects the value of investments in that category as a percentage of net assets. |
* | | Non-income producing security. |
(a) | | Represents an Affiliated Fund. |
(b) | | Joint repurchase agreement was entered into on April 30, 2015. Additional information appears on Page 16. |
| | |
|
Investment Abbreviations: |
ETF | | —Exchange Traded Fund |
GP | | —General Partnership |
LLC | | —Limited Liability Company |
LP | | —Limited Partnership |
REIT | | —Real Estate Investment Trust |
|
|
| ADDITIONAL INVESTMENT INFORMATION |
FUTURES CONTRACTS — At April 30, 2015, the Fund had the following futures contracts:
| | | | | | | | | | | | | | |
| Type | | Number of
Contracts
Long (Short) | | | Expiration Date | | Current Value | | | Unrealized Gain (Loss) | |
Eurodollar | | | (12 | ) | | December 2017 | | $ | (2,941,350 | ) | | $ | (29,562 | ) |
Euro Stoxx 50 Index | | | 9 | | | June 2015 | | | 360,570 | | | | (2,877 | ) |
S&P 500 E-Mini Index | | | 2 | | | June 2015 | | | 207,890 | | | | 4,687 | |
Topix Index | | | 1 | | | June 2015 | | | 133,040 | | | | 5,650 | |
| TOTAL | | | | | | | | | | | | $ | (22,102 | ) |
| | |
| The accompanying notes are an integral part of these financial statements. | | 15 |
GOLDMAN SACHS MULTI-ASSET REAL RETURN FUND
Schedule of Investments (continued)
April 30, 2015 (Unaudited)
|
| ADDITIONAL INVESTMENT INFORMATION (continued) |
JOINT REPURCHASE AGREEMENT ACCOUNT II — At April 30, 2015, the Fund had undivided interests in the Joint Repurchase Agreement Account II, with a maturity date of May 1, 2015, as follows:
| | | | |
| Principal Amount | | Maturity Value | | Collateral Allocation Value |
$700,000 | | $700,002 | | $714,001 |
REPURCHASE AGREEMENTS — At April 30, 2015, the Principal Amount of the Fund’s interest in the Joint Repurchase Agreement Account II was as follows:
| | | | | | |
| Counterparty | | Interest
Rate | | | Principal
Amounts |
Citigroup Global Markets, Inc. | | | 0.130 | % | | $225,370 |
Merrill Lynch & Co., Inc. | | | 0.130 | | | 262,782 |
BNP Paribas Securities Co. | | | 0.120 | | | 211,848 |
| TOTAL | | | | | | $700,000 |
At April 30, 2015, the Joint Repurchase Agreement Account II was fully collateralized by:
| | | | | | | | |
| Issuer | | Interest Rates | | | Maturity Dates | |
Federal Home Loan Bank Discount Notes | | | 0.000 | % | | | 07/29/15 | |
Federal Home Loan Mortgage Corp. | | | 3.000 to 6.000 | | | | 07/01/34 to 03/01/45 | |
Federal National Mortgage Association | | | 3.000 to 7.000 | | | | 10/01/15 to 04/01/45 | |
Government National Mortgage Association | | | 2.500 to 7.500 | | | | 05/20/42 to 10/20/44 | |
United States Treasury Inflation Protected Securities | | | 2.000 | | | | 01/15/21 | |
U.S. Treasury Notes | | | 2.250 to 2.630 | | | | 03/31/21 to 11/15/20 | |
| | |
| 16 | | The accompanying notes are an integral part of these financial statements. |
GOLDMAN SACHS MULTI-ASSET REAL RETURN FUND
Statement of Assets and Liabilities
April 30, 2015 (Unaudited)
| | | | | | |
| | | | | | |
| | Assets: | | | | |
| | Investments of unaffiliated issuers, at value (cost $4,358,421) | | $ | 4,879,213 | |
| | Investments of affiliated issuers, at value (cost $6,763,882) | | | 6,178,101 | |
| | Cash | | | 126,937 | |
| | Variation margin on certain derivative contracts | | | 44,294 | |
| | Receivables: | | | | |
| | Reimbursement from investment adviser | | | 32,569 | |
| | Dividends and interest | | | 17,748 | |
| | Other assets | | | 80 | |
| | Total assets | | | 11,278,942 | |
| | | | | | |
| | Liabilities: | | | | |
| | Payables: | | | | |
| | Investments purchased | | | 10,041 | |
| | Management fees | | | 4,093 | |
| | Distribution and service fees and transfer agent fees | | | 414 | |
| | Accrued expenses | | | 92,044 | |
| | Total liabilities | | | 106,592 | |
| | | | | | |
| | Net Assets: | | | | |
| | Paid-in capital | | | 11,093,227 | |
| | Undistributed net investment income | | | 87,046 | |
| | Accumulated net realized gain | | | 79,168 | |
| | Net unrealized loss | | | (87,091 | ) |
| | | NET ASSETS | | $ | 11,172,350 | |
| | | Net Assets: | | | | |
| | | Class A | | $ | 55,839 | |
| | | Class C | | | 10,402 | |
| | | Institutional | | | 11,048,375 | |
| | | Class IR | | | 31,516 | |
| | | Class R | | | 26,218 | |
| | | Total Net Assets | | $ | 11,172,350 | |
| | | Shares Outstanding $0.001 par value (unlimited number of shares authorized): | | | | |
| | | Class A | | | 5,523 | |
| | | Class C | | | 1,031 | |
| | | Institutional | | | 1,092,437 | |
| | | Class IR | | | 3,117 | |
| | | Class R | | | 2,595 | |
| | | Net asset value, offering and redemption price per share:(a) | | | | |
| | | Class A | | | $10.11 | |
| | | Class C | | | 10.09 | |
| | | Institutional | | | 10.11 | |
| | | Class IR | | | 10.11 | |
| | | Class R | | | 10.10 | |
| | (a) | | Maximum public offering price per share for Class A Shares of the fund is $10.70. At redemption, Class C shares may be subject to a contingent deferred sales charge assessed on the amount equal to the lesser of the current net asset value (“NAV”) or the original purchase price of the shares. |
| | |
| The accompanying notes are an integral part of these financial statements. | | 17 |
GOLDMAN SACHS MULTI-ASSET REAL RETURN FUND
Statement of Operations
For the Six Months Ended April 30, 2015 (Unaudited)
| | | | | | |
| | | | | | |
| | Investment income: | | | | |
| | Dividends — unaffiliated issuers | | $ | 111,507 | |
| | Dividends — affiliated issuers | | | 17,473 | |
| | Interest | | | 424 | |
| | Total investment income | | | 129,404 | |
| | | | | | |
| | Expenses: | | | | |
| | Professional fees | | | 47,572 | |
| | Management fees | | | 38,588 | |
| | Custody, accounting and administrative services | | | 36,039 | |
| | Registration fees | | | 25,618 | |
| | Printing and mailing costs | | | 20,084 | |
| | Trustee fees | | | 13,252 | |
| | Transfer Agent fees(a) | | | 2,304 | |
| | Distribution and Service fees(a) | | | 199 | |
| | Other | | | 11,463 | |
| | Total expenses | | | 195,119 | |
| | Less — expense reductions | | | (164,071 | ) |
| | Net expenses | | | 31,048 | |
| | NET INVESTMENT INCOME | | | 98,356 | |
| | | | | | |
| | Realized and unrealized gain (loss): | | | | |
| | Net realized gain (loss) from: | | | | |
| | Investments — unaffiliated issuers | | | 151,493 | |
| | Investments — affiliated issuers | | | (166,033 | ) |
| | Futures contracts | | | 116,757 | |
| | Swap contracts | | | 537 | |
| | Net change in unrealized loss on: | | | | |
| | Investments — unaffiliated issuers | | | (138,016 | ) |
| | Investments — affiliated issuers | | | (296,041 | ) |
| | Futures contracts | | | (18,309 | ) |
| | Net realized and unrealized loss | | | (349,612 | ) |
| | NET DECREASE IN NET ASSETS RESULTING FROM OPERATIONS | | $ | (251,256 | ) |
| | (a) | | Class specific Distribution and Service, and Transfer Agent fees were as follows: |
| | | | | | | | | | | | | | | | | | | | | | | | | | | | | | | | |
| | | Distribution and Service Fees | | | Transfer Agent Fees | |
Fund | | Class A | | | Class C | | | Class R | | | Class A | | | Class C | | | Institutional | | | Class IR | | | Class R | |
Multi-Asset Real Return | | $ | 83 | | | $ | 51 | | | $ | 65 | | | $ | 63 | | | $ | 9 | | | $ | 2,178 | | | $ | 29 | | | $ | 25 | |
| | |
| 18 | | The accompanying notes are an integral part of these financial statements. |
GOLDMAN SACHS MULTI-ASSET REAL RETURN FUND
Statement of Changes in Net Assets
| | | | | | | | | | |
| | | | | For the Six Months Ended April 30, 2015
(Unaudited) | | | For the Fiscal
Year Ended
October 31, 2014 | |
| | From operations: | | | | | | | | |
| | Net investment income | | $ | 98,356 | | | $ | 159,934 | |
| | Net realized gain | | | 102,754 | | | | 280,990 | |
| | Net change in unrealized gain (loss) | | | (452,366 | ) | | | 51,923 | |
| | Net increase (decrease) in net assets resulting from operations | | | (251,256 | ) | | | 492,847 | |
| | | | | | | | | | |
| | Distributions to shareholders: | | | | | | | | |
| | From net investment income | | | | | | | | |
| | Class A Shares | | | (319 | ) | | | (254 | ) |
| | Class C Shares | | | (14 | ) | | | (43 | ) |
| | Institutional Shares | | | (77,524 | ) | | | (162,202 | ) |
| | Class IR Shares | | | (199 | ) | | | (353 | ) |
| | Class R Shares | | | (100 | ) | | | (219 | ) |
| | From net realized gains | | | | | | | | |
| | Class A Shares | | | (1,311 | ) | | | (44 | ) |
| | Class C Shares | | | (219 | ) | | | (44 | ) |
| | Institutional Shares | | | (230,605 | ) | | | (44,596 | ) |
| | Class IR Shares | | | (660 | ) | | | (111 | ) |
| | Class R Shares | | | (551 | ) | | | (111 | ) |
| | Total distributions to shareholders | | | (311,502 | ) | | | (207,977 | ) |
| | | | | | | | | | |
| | From share transactions: | | | | | | | | |
| | Proceeds from sales of shares | | | 73,852 | | | | 407,789 | |
| | Reinvestment of distributions | | | 311,502 | | | | 207,977 | |
| | Cost of shares redeemed | | | (35,601 | ) | | | (1,048 | ) |
| | Net increase in net assets resulting from share transactions | | | 349,753 | | | | 614,718 | |
| | TOTAL INCREASE (DECREASE) | | | (213,005 | ) | | | 899,588 | |
| | | | | | | | | | |
| | Net assets: | | | | | | | | |
| | Beginning of period | | | 11,385,355 | | | | 10,485,767 | |
| | End of period | | $ | 11,172,350 | | | $ | 11,385,355 | |
| | Undistributed net investment income | | $ | 87,046 | | | $ | 66,846 | |
| | |
| The accompanying notes are an integral part of these financial statements. | | 19 |
GOLDMAN SACHS MULTI-ASSET REAL RETURN FUND
Financial Highlights
Selected Data for a Share Outstanding Throughout Each Period
| | | | | | | | | | | | | | | | | | | | | | | | | | | | | | |
| | | | | | | | Income (loss) from
investment operations | | | Distributions
to shareholders | |
| | | Year - Share Class | | Net asset
value,
beginning
of period | | | Net
investment
income(a) | | | Net realized
and unrealized
gain (loss) | | | Total from
investment
operations | | | From net
investment
income | | | From net
realized
gains | | | Total
distributions | |
| | FOR THE SIX MONTHS ENDED APRIL 30, (UNAUDITED) | |
| | 2015 - A | | $ | 10.63 | | | $ | 0.07 | (e) | | $ | (0.32 | ) | | $ | (0.25 | ) | | $ | (0.09 | ) | | $ | (0.18 | ) | | $ | (0.27 | ) |
| | 2015 - C | | | 10.61 | | | | 0.03 | (e) | | | (0.32 | ) | | | (0.29 | ) | | | (0.05 | ) | | | (0.18 | ) | | | (0.23 | ) |
| | 2015 - Institutional | | | 10.64 | | | | 0.09 | (e) | | | (0.33 | ) | | | (0.24 | ) | | | (0.11 | ) | | | (0.18 | ) | | | (0.29 | ) |
| | 2015 - IR | | | 10.63 | | | | 0.08 | (e) | | | (0.32 | ) | | | (0.24 | ) | | | (0.10 | ) | | | (0.18 | ) | | | (0.28 | ) |
| | 2015 - R | | | 10.62 | | | | 0.06 | (e) | | | (0.32 | ) | | | (0.26 | ) | | | (0.08 | ) | | | (0.18 | ) | | | (0.26 | ) |
| | | | | | | | | | | | | | | | | | | | | | | | | | | | | | |
| | FOR THE FISCAL ENDED OCTOBER 31, | |
| | 2014 - A | | | 10.35 | | | | 0.11 | | | | 0.33 | | | | 0.44 | | | | (0.12 | ) | | | (0.04 | ) | | | (0.16 | ) |
| | 2014 - C | | | 10.34 | | �� | | 0.03 | | | | 0.33 | | | | 0.36 | | | | (0.05 | ) | | | (0.04 | ) | | | (0.09 | ) |
| | 2014 - Institutional | | | 10.35 | | | | 0.15 | | | | 0.34 | | | | 0.49 | | | | (0.16 | ) | | | (0.04 | ) | | | (0.20 | ) |
| | 2014 - IR | | | 10.35 | | | | 0.14 | | | | 0.32 | | | | 0.46 | | | | (0.14 | ) | | | (0.04 | ) | | | (0.18 | ) |
| | 2014 - R | | | 10.34 | | | | 0.08 | | | | 0.33 | | | | 0.41 | | | | (0.09 | ) | | | (0.04 | ) | | | (0.13 | ) |
| | | | | | | | | | | | | | | | | | | | | | | | | | | | | | |
| | FOR THE PERIOD ENDED OCTOBER 31, | |
| | 2013 - A (Commenced August 30, 2013) | | | 10.00 | | | | 0.01 | | | | 0.34 | | | | 0.35 | | | | — | | | | — | | | | — | |
| | 2013 - C (Commenced August 30, 2013) | | | 10.00 | | | | — | (g) | | | 0.34 | | | | 0.34 | | | | — | | | | — | | | | — | |
| | 2013 - Institutional (Commenced August 30, 2013) | | | 10.00 | | | | 0.02 | | | | 0.33 | | | | 0.35 | | | | — | | | | — | | | | — | |
| | 2013 - IR (Commenced August 30, 2013) | | | 10.00 | | | | 0.02 | | | | 0.33 | | | | 0.35 | | | | — | | | | — | | | | — | |
| | 2013 - R (Commenced August 30, 2013) | | | 10.00 | | | | 0.01 | | | | 0.33 | | | | 0.34 | | | | — | | | | — | | | | — | |
| | (a) | | Calculated based on the average shares outstanding methodology. |
| | (b) | | Assumes investment at the net asset value at the beginning of the period, reinvestment of all dividends and distributions, a complete redemption of the investment at the net asset value at the end of the period and no sales or redemption charges. Total returns would be reduced if a sales or redemption charge was taken into account. Returns do not reflect the deduction of taxes that a shareholder would pay on Fund distributions or the redemption of Fund shares. Total returns for periods less than one full year are not annualized. |
| | (c) | | Expense ratios exclude the expenses of the Underlying Funds in which the Fund invests. |
| | (d) | | The Fund’s portfolio turnover rate is calculated in accordance with regulatory requirements, without regard to transactions involving short term investments and certain derivatives. If such transactions were included, the Fund’s portfolio turnover rate may be higher. |
| | (e) | | Reflects income recognized from special dividends which amounted to $0.02 per share and 0.38% of average net assets. |
| | (g) | | Amount is less than $0.005 per share. |
| | |
| 20 | | The accompanying notes are an integral part of these financial statements. |
GOLDMAN SACHS MULTI-ASSET REAL RETURN FUND
| | | | | | | | | | | | | | | | | | | | | | | | | | | | | | | | | | | | | | | | |
| | | | | | | | | | | | | | | | | | | | | | | | | | | | | | | | | | |
| | | Net asset
value, end
of period | | | | | Total
return(b) | | | | | Net assets,
end of
period (in 000s) | | | | | Ratio of
net expenses
to average
net assets(c) | | | | | Ratio of
total expenses
to average
net assets(c) | | | | | Ratio of
net investment
income
to average net assets | | | | | Portfolio
turnover
rate(d) | |
| | | | | | | | | | | | | | | | | | | | | | | | | | | | | | | | | | | | | | | | |
| | $ | 10.11 | | | | | | (2.39 | )% | | | | $ | 56 | | | | | | 0.96 | %(f) | | | | | 3.92 | %(f) | | | | | 1.33 | %(e)(f) | | | | | 11 | % |
| | | 10.09 | | | | | | (2.75 | ) | | | | | 10 | | | | | | 1.69 | (f) | | | | | 4.67 | (f) | | | | | 0.66 | (e)(f) | | | | | 11 | |
| | | 10.11 | | | | | | (2.28 | ) | | | | | 11,048 | | | | | | 0.56 | (f) | | | | | 3.54 | (f) | | | | | 1.79 | (e)(f) | | | | | 11 | |
| | | 10.11 | | | | | | (2.26 | ) | | | | | 32 | | | | | | 0.71 | (f) | | | | | 3.69 | (f) | | | | | 1.64 | (e)(f) | | | | | 11 | |
| | | 10.10 | | | | | | (2.51 | ) | | | | | 26 | | | | | | 1.21 | (f) | | | | | 4.18 | (f) | | | | | 1.14 | (e)(f) | | | | | 11 | |
| | | | | | | | | | | | | | | | | | | | | | | | | | | | | | | | | | | | | | | | |
| | | | | | | | | | | | | | | | | | | | | | | | | | | | | | | | | | | | | | | | |
| | | 10.63 | | | | | | 4.28 | | | | | | 49 | | | | | | 0.99 | | | | | | 4.75 | | | | | | 1.00 | | | | | | 34 | |
| | | 10.61 | | | | | | 3.47 | | | | | | 11 | | | | | | 1.76 | | | | | | 5.86 | | | | | | 0.28 | | | | | | 34 | |
| | | 10.64 | | | | | | 4.77 | | | | | | 11,272 | | | | | | 0.59 | | | | | | 4.69 | | | | | | 1.45 | | | | | | 34 | |
| | | 10.63 | | | | | | 4.51 | | | | | | 27 | | | | | | 0.73 | | | | | | 4.83 | | | | | | 1.31 | | | | | | 34 | |
| | | 10.62 | | | | | | 4.00 | | | | | | 27 | | | | | | 1.24 | | | | | | 5.34 | | | | | | 0.80 | | | | | | 34 | |
| | | | | | | | | | | | | | | | | | | | | | | | | | | | | | | | | | | | | | | | |
| | | | | | | | | | | | | | | | | | | | | | | | | | | | | | | | | | | | | | | | |
| | | 10.35 | | | | | | 3.50 | | | | | | 10 | | | | | | 0.97 | (f) | | | | | 5.91 | (f) | | | | | 0.80 | (f) | | | | | 4 | |
| | | 10.34 | | | | | | 3.40 | | | | | | 10 | | | | | | 1.72 | (f) | | | | | 6.66 | (f) | | | | | 0.06 | (f) | | | | | 4 | |
| | | 10.35 | | | | | | 3.50 | | | | | | 10,413 | | | | | | 0.61 | (f) | | | | | 5.54 | (f) | | | | | 1.16 | (f) | | | | | 4 | |
| | | 10.35 | | | | | | 3.50 | | | | | | 26 | | | | | | 0.79 | (f) | | | | | 5.71 | (f) | | | | | 0.98 | (f) | | | | | 4 | |
| | | 10.34 | | | | | | 3.40 | | | | | | 26 | | | | | | 1.25 | (f) | | | | | 6.18 | (f) | | | | | 0.52 | (f) | | | | | 4 | |
| | |
| The accompanying notes are an integral part of these financial statements. | | 21 |
GOLDMAN SACHS MULTI-ASSET REAL RETURN FUND
Notes to Financial Statements
April 30, 2015 (Unaudited)
Goldman Sachs Trust (the “Trust”) is a Delaware statutory trust registered under the Investment Company Act of 1940, as amended (the “Act”), as an open-end management investment company. The Trust includes the Goldman Sachs Multi-Asset Real Return Fund (the “Fund”). The Fund is a diversified fund and currently offers five classes of shares: Class A, Class C, Class IR, Class R and Institutional Shares.
Class A Shares are sold with a front-end sales charge of up to 5.50%. Class C Shares are sold with a contingent deferred sales charge (“CDSC”) of 1.00%, which is imposed on redemptions made within 12 months of purchase. Institutional, Class IR and Class R Shares are not subject to a sales charge.
Goldman Sachs Asset Management, L.P. (“GSAM”), an affiliate of Goldman, Sachs & Co. (“Goldman Sachs”), serves as investment adviser to the Fund pursuant to a management agreement (the “Agreement”) with the Trust.
|
| 2. SIGNIFICANT ACCOUNTING POLICIES |
The financial statements have been prepared in accordance with accounting principles generally accepted in the United States of America (“GAAP”) and require management to make estimates and assumptions that may affect the reported amounts and disclosures. Actual results may differ from those estimates and assumptions.
A. Investment Valuation — The Fund’s valuation policy is to value investments at fair value.
B. Investment Income and Investments — Investment income includes interest income and dividend income, net of any foreign withholding taxes, less any amounts reclaimable. Interest income is accrued daily and adjusted for amortization of premiums and accretion of discounts. Dividend income is recognized on ex-dividend date or, for certain foreign securities, as soon as such information is obtained subsequent to the ex-dividend date. Investment transactions are reflected on trade date. Realized gains and losses are calculated using identified cost. Investment transactions are recorded on the following business day for daily net asset value (“NAV”) calculations. Any foreign capital gains tax is accrued daily based upon net unrealized gains, and is payable upon sale of such investments. Distributions received from the Fund’s investments in United States (“U.S.”) real estate investment trusts (“REITs”) may be characterized as ordinary income, net capital gain or a return of capital. A return of capital is recorded by the Fund as a reduction to the cost basis of the REIT.
Distributions from Master Limited Partnerships (“MLPs”) are generally recorded based on the characterization reported on the MLP’s tax return.
For derivative contracts, realized gains and losses are recorded upon settlement of the contract. Upfront payments are made or received upon entering into a swap agreement and are reflected in the Statement of Assets and Liabilities. Upfront payments are recognized over the contract’s term/event as realized gains or losses, with the exception of forward starting interest rate swaps whose realized gains or losses are recognized from the effective start date. For securities with paydown provisions, principal payments received are treated as a proportionate reduction to the cost basis of the securities, and excess or shortfall amounts are recorded as income. For treasury inflation protected securities (“TIPS”), adjustments to principal due to inflation/deflation are reflected as increases/decreases to interest income with a corresponding adjustment to cost.
C. Class Allocations and Expenses — Investment income, realized and unrealized gain (loss), and non-class specific expenses of the Fund are allocated daily based upon the proportion of net assets of each class. Class specific expenses, where applicable, are borne by the respective share classes and include Distribution and Service, Transfer Agent and Service and Shareholder Administration fees. Non-class specific expenses directly incurred by the Fund are charged to the Fund, while such expenses incurred by the Trust are allocated across the Fund on a straight-line and/or pro-rata basis depending upon the nature of the expenses.
D. Federal Taxes and Distributions to Shareholders — It is the Fund’s policy to comply with the requirements of the Internal Revenue Code of 1986, as amended (the “Code”), applicable to regulated investment companies (mutual funds) and to distribute each year substantially all of its investment company taxable income and capital gains to its shareholders. Accordingly, the Fund is not required to make any provisions for the payment of federal income tax. Distributions to shareholders are recorded
22
GOLDMAN SACHS MULTI-ASSET REAL RETURN FUND
|
| 2. SIGNIFICANT ACCOUNTING POLICIES (continued) |
on the ex-dividend date. Distributions from net investment income are declared and paid quarterly, and distributions from net capital gains, if any, are declared and paid annually.
Net capital losses are carried forward to future fiscal years and may be used to the extent allowed by the Code to offset any future capital gains. Utilization of capital loss carryforwards will reduce the requirement of future capital gains distributions.
Under the Regulated Investment Company Modernization Act of 2010, the Fund is permitted to carry forward capital losses incurred in taxable years beginning after December 22, 2010 for an unlimited period. However, any losses incurred during those future taxable years will be required to be utilized prior to the losses incurred in pre-enactment taxable years. As a result of this ordering rule, pre-enactment capital loss carryforwards may be more likely to expire unused. Additionally, post-enactment capital losses that are carried forward will retain their character as either short-term or long-term capital losses rather than being considered all short-term as under previous law.
The characterization of distributions to shareholders for financial reporting purposes is determined in accordance with federal income tax rules, which may differ from GAAP. The source of the Fund’s distributions may be shown in the accompanying financial statements as either from net investment income, net realized gain or capital. Certain components of the Fund’s net assets on the Statement of Assets and Liabilities reflect permanent GAAP/tax differences based on the appropriate tax character.
| | |
| 3. INVESTMENTS AND FAIR VALUE MEASUREMENTS | | |
The fair value of a financial instrument is the amount that would be received to sell an asset or paid to transfer a liability in an orderly transaction between market participants at the measurement date (i.e., the exit price). GAAP establishes a fair value hierarchy that prioritizes the inputs to valuation techniques used to measure fair value. The hierarchy gives the highest priority to unadjusted quoted prices in active markets for identical assets or liabilities (Level 1 measurements) and the lowest priority to unobservable inputs (Level 3 measurements). The levels used for classifying investments are not necessarily an indication of the risk associated with investing in these investments. The three levels of the fair value hierarchy are described below:
Level 1 — Unadjusted quoted prices in active markets that are accessible at the measurement date for identical, unrestricted assets or liabilities;
Level 2 — Quoted prices in markets that are not active or financial instruments for which significant inputs are observable (including, but not limited to, quoted prices for similar investments, interest rates, foreign exchange rates, volatility and credit spreads), either directly or indirectly;
Level 3 — Prices or valuations that require significant unobservable inputs (including GSAM’s assumptions in determining fair value measurement).
The Trustees have adopted Valuation Procedures that govern the valuation of the portfolio investments held by the Fund, including investments for which market quotations are not readily available. The Trustees have delegated to GSAM day-to-day responsibility for implementing and maintaining internal controls and procedures related to the valuation of the Fund’s portfolio investments. To assess the continuing appropriateness of pricing sources and methodologies, GSAM regularly performs price verification procedures and issues challenges as necessary to third party pricing vendors or brokers, and any differences are reviewed in accordance with the Valuation Procedures.
A. Level 1 and Level 2 Fair Value Investments — The valuation techniques and significant inputs used in determining the fair values for investments classified as Level 1 and Level 2 are as follows:
Equity Securities — Equity securities and investment companies traded on a U.S. securities exchange or the NASDAQ system, or those located on certain foreign exchanges, including but not limited to the Americas, are valued daily at their last sale price or official closing price on the principal exchange or system on which they are traded. If there is no sale or official closing price or it is believed by the investment adviser to not represent fair value, equity securities and exchange traded investment companies are valued at the last bid price for long positions and at the last ask price for short positions. Investments in investment companies
23
GOLDMAN SACHS MULTI-ASSET REAL RETURN FUND
Notes to Financial Statements (continued)
April 30, 2015 (Unaudited)
|
| 3. INVESTMENTS AND FAIR VALUE MEASUREMENTS (continued) |
(other than those that are exchange traded) are valued at the NAV on the valuation date. To the extent these investments are actively traded, they are classified as Level 1 of the fair value hierarchy, otherwise they are generally classified as Level 2.
Unlisted equity securities for which market quotations are available are valued at the last sale price on the valuation date, or if no sale occurs, at the last bid price. Securities traded on certain foreign securities exchanges are valued daily at fair value determined by an independent fair value service (if available) under Valuation Procedures approved by the Trustees and consistent with applicable regulatory guidance. The independent fair value service takes into account multiple factors including, but not limited to, movements in the securities markets, certain depositary receipts, futures contracts and foreign currency exchange rates that have occurred subsequent to the close of the foreign securities exchange. These investments are generally classified as Level 2 of the fair value hierarchy.
Underlying Funds — Investments in the Underlying Funds are valued at the NAV per share of the Institutional Share class of each Underlying Fund on the day of valuation. Because the Fund invests in other mutual funds that fluctuate in value, the Fund’s shares may correspondingly fluctuate in value. These investments are generally classified as Level 1 of the fair value hierarchy.
The Underlying Funds may invest in debt securities which, if market quotations are readily available, are valued daily on the basis of quotations supplied by dealers or an independent pricing service approved by the Trustees. The pricing services may use valuation models or matrix pricing, which consider: (i) yield or price with respect to bonds that are considered comparable in characteristics such as rating, interest rate and maturity date or (ii) quotations from securities dealers to determine current value. Short-term debt obligations that mature in sixty days or less and that do not exhibit signs of credit deterioration are valued at amortized cost, which approximates fair value. With the exception of treasury securities of G8 countries (not held in money market funds), which are generally classified as Level 1, these investments are generally classified as Level 2 of the fair value hierarchy.
Derivative Contracts — A derivative is an instrument whose value is derived from underlying assets, indices, reference rates or a combination of these factors. The Fund enters into derivative transactions to hedge against changes in interest rates, securities prices, and/or currency exchange rates, to increase total return, or to gain access to certain markets or attain exposure to other underliers.
Exchange-traded derivatives, including futures contracts, are valued at the last sale or settlement price and typically fall within Level 1 of the fair value hierarchy. Over-the-counter (“OTC”) and centrally cleared derivatives are valued using market transactions and other market evidence, including market-based inputs to models, calibration to market-clearing transactions, broker or dealer quotations, or other alternative pricing sources. Where models are used, the selection of a particular model to value OTC and centrally cleared derivatives depends upon the contractual terms of, and specific risks inherent in, the instrument, as well as the availability of pricing information in the market. Valuation models require a variety of inputs, including contractual terms, market prices, yield curves, credit curves, measures of volatility, voluntary and involuntary prepayment rates, loss severity rates and correlations of such inputs. For OTC and centrally cleared derivatives that trade in liquid markets, model inputs can generally be verified and model selection does not involve significant management judgment. OTC and centrally cleared derivatives are classified within Level 2 of the fair value hierarchy when significant inputs are corroborated by market evidence.
i. Futures Contracts — Futures contracts are contracts to buy or sell a standardized quantity of a specified commodity or security and are valued based on exchanged settlement prices or independent market quotes. Futures contracts are valued at the last settlement price, or in the absence of a sale, the last bid price for long positions and at the last ask price for short positions, at the end of each day on the board of trade or exchange upon which they are traded. Upon entering into a futures contract, the Fund deposits cash or securities in an account on behalf of the broker in an amount sufficient to meet the initial margin requirement. Subsequent payments are made or received by the Fund equal to the daily change in the contract value and are recorded as variation margin receivable or payable with a corresponding offset to unrealized gains or losses.
ii. Swap Contracts — Bilateral swap contracts are agreements in which the Fund and a counterparty agree to exchange periodic payments on a specified notional amount or make a net payment upon termination. Bilateral swap transactions are privately negotiated in the OTC market and payments are settled through direct payments between the Fund and the counterparty. By contrast, certain swap transactions are subject to mandatory central clearing. These swaps are executed through a derivatives clearing member (“DCM”), acting in an agency capacity, and submitted to a central counterparty
24
GOLDMAN SACHS MULTI-ASSET REAL RETURN FUND
|
| 3. INVESTMENTS AND FAIR VALUE MEASUREMENTS (continued) |
(“CCP”) (“centrally cleared swaps”), in which case all payments are settled with the CCP through the DCM. Swaps are marked-to-market daily using pricing vendor quotations, counterparty or clearinghouse prices or model prices, and the change in value, if any, is recorded as an unrealized gain or loss. Upon entering into a swap contract, the Fund is required to satisfy an initial margin requirement by delivering cash or securities to the counterparty (or in some cases, segregated in a triparty account on behalf of the counterparty), which can be adjusted by any mark-to-market gains or losses pursuant to bilateral or centrally cleared arrangements. For centrally cleared swaps the daily change in valuation, if any, is recorded as a receivable or payable for variation margin.
An interest rate swap is an agreement that obligates two parties to exchange a series of cash flows at specified intervals, based upon or calculated by reference to changes in interest rates on a specified notional principal amount. The payment flows are usually netted against each other, with the difference being paid by one party to the other.
Short Term Investments — Short-term investments having a maturity of 60 days or less are generally valued at amortized cost which approximates fair market value. These investments are classified as Level 2 of the fair value hierarchy.
i. Repurchase Agreements — Repurchase agreements involve the purchase of securities subject to the seller’s agreement to repurchase the securities at a mutually agreed upon date and price, under the terms of a Master Repurchase Agreement (“MRA”). During the term of a repurchase agreement, the value of the underlying securities held as collateral on behalf of the Fund, including accrued interest, is required to exceed the value of the repurchase agreement, including accrued interest. The gross value of repurchase agreements is included in the Statement of Assets and Liabilities for financial reporting purposes. The underlying securities for all repurchase agreements are held at the Fund’s custodian or designated sub-custodians under tri-party repurchase agreements.
An MRA governs transactions between the Fund and select counterparties. An MRA contains provisions for, among other things, initiation, income payments, events of default and maintenance of securities for repurchase agreements. An MRA also permits offsetting with collateral to create one single net payment in the event of default or similar events, including the bankruptcy or insolvency of a counterparty.
If the seller defaults, the Fund could suffer a loss to the extent that the proceeds from the sale of the underlying securities and other collateral held by the Fund are less than the repurchase price and the Fund’s costs associated with delay and enforcement of the repurchase agreement. In addition, in the event of default or insolvency of the seller, a court could determine that the Fund’s interest in the collateral is not enforceable, resulting in additional losses to the Fund.
Pursuant to exemptive relief granted by the Securities and Exchange Commission (“SEC”) and terms and conditions contained therein, the Fund, together with other funds of the Trust and registered investment companies having management agreements with GSAM or its affiliates, may transfer uninvested cash into joint accounts, the daily aggregate balance of which is invested in one or more repurchase agreements. Under these joint accounts, the Fund maintains pro-rata credit exposure to the underlying repurchase agreements’ counterparties. With the exception of certain transaction fees, the Fund is not subject to any expenses in relation to these investments.
B. Level 3 Fair Value Investments — To the extent that significant inputs to valuation models and other alternative pricing sources are unobservable, or if quotations are not readily available, or if GSAM believes that such quotations do not accurately reflect fair value, the fair value of the Fund’s investments may be determined under Valuation Procedures approved by the Trustees. GSAM, consistent with its procedures and applicable regulatory guidance, may make an adjustment to the most recent valuation prices of either domestic or foreign securities in light of significant events to reflect what it believes to be the fair value of the securities at the time of determining the Fund’s NAV. Significant events which could affect a large number of securities in a particular market may include, but are not limited to: significant fluctuations in U.S. or foreign markets; market dislocations; market disruptions; or unscheduled market closings. Significant events which could also affect a single issuer may include, but are not limited to: corporate actions such as reorganizations, mergers and buy-outs; ratings downgrades; and bankruptcies.
25
GOLDMAN SACHS MULTI-ASSET REAL RETURN FUND
Notes to Financial Statements (continued)
April 30, 2015 (Unaudited)
|
| 3. INVESTMENTS AND FAIR VALUE MEASUREMENTS (continued) |
C. Fair Value Hierarchy — The following is a summary of the Fund’s investments and derivatives classified in the fair value hierarchy as of April 30, 2015:
| | | | | | | | | | | | |
| | | |
| Investment Type | | Level 1 | | | Level 2 | | | Level 3 | |
| Assets | | | | | | | | | | | | |
Common Stock and/or Other Equity Investments(a) | | | | | | | | | | | | |
Europe | | $ | 33,860 | | | $ | — | | | $ | — | |
North America | | | 4,145,275 | | | | 78 | | | | — | |
Investment Companies | | | 6,178,101 | | | | — | | | | — | |
Short-term Investment | | | — | | | | 700,000 | | | | — | |
| Total | | $ | 10,357,236 | | | $ | 700,078 | | | $ | — | |
| | | |
| Derivative Type(b) | | | | | | | | | |
| Assets | | | | | | | | | | | | |
Futures Contracts | | $ | 10,337 | | | $ | — | | | $ | — | |
| Liabilities | | | | | | | | | | | | |
Futures Contracts | | $ | (32,439 | ) | | $ | — | | | $ | — | |
| (a) | | Amounts are disclosed by continent to highlight the impact of time zone differences between local market close and the calculation of NAV. Security valuations are based on the principal exchange or system on which they are traded, which may differ from country of domicile. |
| (b) | | Amount shown represents unrealized gain (loss) at period end. |
For further information regarding security characteristics, see the Schedule of Investments.
|
| 4. INVESTMENTS IN DERIVATIVES |
The following table sets forth, by certain risk types, the gross value of derivative contracts as of April 30, 2015. These instruments were used to meet the Fund’s investment objectives and to obtain and/or manage exposure related to the risks below. The values in the table below exclude the effects of cash collateral received or posted pursuant to these derivative contracts, and therefore are not representative of the Fund’s net exposure.
| | | | | | | | | | | | |
| Risk | | Statement of Assets and Liabilities | | Assets(a) | | | Statement of Assets and Liabilities | | Liabilities(a) | |
Interest rate | | — | | $ | — | | | Variation margin on certain derivative contracts | | $ | (29,562) | |
Equity | | Variation margin on certain derivative contracts | | | 10,337 | | | Variation margin on certain derivative contracts | | | (2,877) | |
| Total | | | | $ | 10,337 | | | | | $ | (32,439) | |
| (a) | | Includes unrealized gain (loss) on futures contracts described in the Additional Investment Information sections of the Schedule of Investments. Only current day’s variation margin is reported within the Statement of Assets and Liabilities. |
26
GOLDMAN SACHS MULTI-ASSET REAL RETURN FUND
|
| 4. INVESTMENTS IN DERIVATIVES (continued) |
The following table sets forth, by certain risk types, the Fund’s gains (losses) related to these derivatives and their indicative volumes for the six months ended April 30, 2015. These gains (losses) should be considered in the context that these derivative contracts may have been executed to create investment opportunities and/or economically hedge certain investments, and accordingly, certain gains (losses) on such derivative contracts may offset certain (losses) gains attributable to investments. These gains (losses) are included in “Net realized gain (loss)” or “Net change in unrealized gain (loss)” on the Statement of Operations:
| | | | | | | | | | | | | | |
| Risk | | Statement of Operations | | Net Realized
Gain (Loss) | | | Net Change in
Unrealized
Gain (Loss) | | | Average
Number of
Contracts(a) | |
| Interest rate | | Net realized gain (loss) from futures contracts and swap contracts/Net change in unrealized gain (loss) on futures contracts and swap contracts | | $ | 537 | | | $ | (13,003 | ) | | | 13 | |
| Equity | | Net realized gain (loss) from futures contracts/Net change in unrealized gain (loss) on futures contracts | | | 116,757 | | | | (5,306 | ) | | | 17 | |
Total | | $ | 117,294 | | | $ | (18,309 | ) | | | 30 | |
| (a) | | Average number of contracts is based on the average of month end balances for the six months ended April 30, 2015. |
|
| 5. AGREEMENTS AND AFFILIATED TRANSACTIONS |
A. Management Agreement — Under the Agreement, GSAM manages the Fund, subject to the general supervision of the Trustees.
As compensation for the services rendered pursuant to the Agreement, the assumption of the expenses related thereto and administration of the Fund’s business affairs, including providing facilities, GSAM is entitled to a management fee, accrued daily and paid monthly, equal to an annual percentage rate of the Fund’s average daily net assets.
For the six months ended April 30, 2015, the contractual and effective net management fee with GSAM were at the following rates:
| | | | | | | | | | | | | | | | | | | | | | | | | | |
| Contractual Management Rate | | | Effective Net
Management
Rate*^ | |
First $1 billion | | | Next $1 billion | | | Next $3 billion | | | Next $3 billion | | | Over $8 billion | | | Effective
Rate | | |
| | 0.70% | | | | 0.63% | | | | 0.60% | | | | 0.59% | | | | 0.57% | | | | 0.70% | | | | 0.49% | * |
| * | | GSAM has agreed to waive a portion of its management fee payable by the Fund in an amount equal to any management fees it earns as an investment adviser to any of the affiliated funds in which the Fund invests. The management fee waiver will remain in effect through at least February 29, 2016, and prior to such date, GSAM may not terminate the arrangement without the approval of the Trustees. |
| ^ | | Effective Net Management Rate includes the impact of management fee waivers of affiliated underlying funds, if any. |
The Fund invests in the Institutional Shares of the Goldman Sachs Commodity Strategy, Goldman Sachs Inflation Protected Securities, Goldman Sachs Local Emerging Markets Debt and Goldman Sachs Strategic Income Funds. These Underlying Funds are considered to be affiliated with the Fund. GSAM has agreed to waive a portion of its management fee payable by the Funds in an amount equal to the management fee it earns as an investment advisor to any of the affiliated funds in which the Fund invests. For the six months ended April 30, 2015, GSAM waived $13,572 of the Fund’s management fee.
B. Distribution and Service Plans — The Trust, on behalf of the Fund, has adopted Distribution and Service Plans (the “Plans”). Under the Plans, Goldman Sachs, which serves as distributor (the “Distributor”), is entitled to a fee accrued daily and
27
GOLDMAN SACHS MULTI-ASSET REAL RETURN FUND
Notes to Financial Statements (continued)
April 30, 2015 (Unaudited)
|
| 5. AGREEMENTS AND AFFILIATED TRANSACTIONS (continued) |
paid monthly, for distribution services and personal and account maintenance services, which may then be paid by Goldman Sachs to authorized dealers, at the following annual rates calculated on the Fund’s average daily net assets of each respective share class:
| | | | | | | | | | | | |
| | | Distribution and Service Plan Rates | |
| | | Class A* | | | Class C | | | Class R* | |
Distribution Plan | | | 0.25 | % | | | 0.75 | % | | | 0.50 | % |
Service Plan | | | — | | | | 0.25 | | | | — | |
| * | | With respect to Class A and Class R Shares, the Distributor, at its discretion may use compensation for distribution services paid under the Distribution Plan to compensate service organizations for personal and account maintenance services and expenses as long as such total compensation does not exceed the maximum cap on “service fees” imposed by the Financial Industry Regulatory Authority. |
C. Distribution Agreement — Goldman Sachs, as Distributor of the shares of the Fund pursuant to a Distribution Agreement, may retain a portion of the Class A front end sales charge and Class C Shares’ CDSC. During the six months ended April 30, 2015, Goldman Sachs advised that it retained $293 of Class A and no CDSC of Class C shares.
D. Transfer Agency Agreement — Goldman Sachs also serves as the transfer agent of the Fund for a fee pursuant to Transfer Agency Agreement. The fees charged for such transfer agency services are accrued daily and paid monthly at annual rates as follows: 0.19% of the average daily net assets of Class A, Class C, Class IR and Class R Shares; and 0.04% of the average daily net assets of Institutional Shares.
E. Other Expense Agreements and Affiliated Transactions — GSAM has agreed to limit certain “Other Expenses” of the Fund (excluding acquired fund fees and expenses, transfer agency fees and expenses, service fees and shareholder administration fees (as applicable), taxes, interest, brokerage fees, shareholder meetings, litigation, indemnification and extraordinary expenses) to the extent such expenses exceed, on an annual basis, a percentage rate of the average daily net assets of the Fund. Such Other Expense reimbursements, if any, are accrued daily and paid monthly. In addition, the Fund is not obligated to reimburse GSAM for prior fiscal year expense reimbursements, if any. The Other Expense limitations as an annual percentage rate of average daily net assets for the Fund is 0.064%. These Other Expense limitations will remain in place through at least February 29, 2016, and prior to such date GSAM may not terminate the arrangements without the approval of the Trustees. The Fund bears its respective share of costs related to proxy and shareholder meetings, and GSAM has agreed to reimburse the Fund to the extent such expenses exceed a specified percentage of the Fund’s net assets. In addition, the Fund has entered into certain offset arrangements with the transfer agent, which may result in a reduction of the Fund’s expenses and are received irrespective of the application of the “Other Expense” limitations described above.
For the six months ended April 30, 2015, these expense reductions, including any fee waivers and Other Expense reimbursements, were as follows:
| | | | | | | | | | |
Management
Fee Waivers | | | Other Expense Reimbursements | | | Total Expense Reductions | |
| $ | 13,572 | | | $ | 150,499 | | | $ | 164,071 | |
F. Line of Credit Facility — As of April 30, 2015, the Fund participated in a $1,080,000,000 committed, unsecured revolving line of credit facility (the “facility”) together with other funds of the Trust and registered investment companies having management agreements with GSAM or its affiliates (“Other Borrowers”). Pursuant to the terms of the facility, the Fund and Other Borrowers could increase the credit amount by an additional $120,000,000, for a total of up to $1,200,000,000. This facility is to be used for temporary emergency purposes, or to allow for an orderly liquidation of securities to meet redemption requests. The interest rate on borrowings is based on the federal funds rate. The facility also requires a fee to be paid by the Fund based on the amount of the commitment that has not been utilized. For the six months ended April 30, 2015, the Fund did not have any borrowings under the facility. The facility was increased to $1,205,000,000 effective May 5, 2015.
28
GOLDMAN SACHS MULTI-ASSET REAL RETURN FUND
|
| 5. AGREEMENTS AND AFFILIATED TRANSACTIONS (continued) |
G. Other Transactions with Affiliates — For the six months ended April 30, 2015, Goldman Sachs earned $2,780 in brokerage commissions from portfolio transactions, including futures transactions executed with Goldman Sachs as the Futures Commission Merchant, on behalf of the Fund.
As of April 30, 2015, the Goldman Sachs Group (“GSG”), Inc. was the beneficial owner of approximately 19%, 100%, 95%, 84% and 100% of Class A, Class C, Institutional, Class IR and Class R, respectively of the Fund.
The table below shows the transactions in and earnings from investments in affiliated Funds for the six months ended April 30, 2015:
| | | | | | | | | | | | | | | | | | | | | | | | | | | | |
| Underlying Fund | | Market
Value 10/31/2014 | | | Purchases at Cost | | | Proceeds from Sales | | | Net Realized Gain (Loss) | | | Net Change in Unrealized Gain (Loss) | | | Market Value 4/30/2015 | | | Dividend
Income | |
Goldman Sachs Commodity Strategy Fund | | $ | 1,531,674 | | | $ | 274,118 | | | $ | (280,191 | ) | | $ | (163,571 | ) | | $ | (147,884 | ) | | $ | 1,214,146 | | | $ | 652 | |
Goldman Sachs Inflation Protected Securities Fund | | | 1,380,227 | | | | 277,238 | | | | — | | | | — | | | | 14,794 | | | | 1,672,259 | | | | — | |
Goldman Sachs Local Emerging Markets Debt Fund | | | 348,681 | | | | 211,017 | | | | — | | | | — | | | | (46,487 | ) | | | 513,211 | | | | — | |
Goldman Sachs Strategic Income Fund | | | 2,939,627 | | | | 84,208 | | | | (126,424 | ) | | | (2,462 | ) | | | (116,464 | ) | | | 2,778,485 | | | | 16,821 | |
Total | | $ | 6,200,209 | | | $ | 846,581 | | | $ | (406,615 | ) | | $ | (166,033 | ) | | $ | (296,041 | ) | | $ | 6,178,101 | | | $ | 17,473 | |
|
| 6. PORTFOLIO SECURITIES TRANSACTIONS |
The cost of purchases and proceeds from sales and maturities of long-term securities for the six months ended April 30, 2015, were $1,601,113 and $1,152,358, respectively.
As of the Fund’s most recent fiscal year end, October 31, 2014, the Fund’s timing differences, on a tax basis were as follows:
| | | | |
| Timing Differences (Deferred Passive Activity Losses on Partnerships) | | $ | (17,180) | |
As of April 30, 2015, the Fund’s aggregate security unrealized gains and losses based on cost for U.S. federal income tax purposes were as follows:
| | | | |
Tax Cost | | $ | 11,060,393 | |
Gross unrealized gain | | | 681,718 | |
Gross unrealized loss | | | (684,797 | ) |
Net unrealized loss | | $ | (3,079 | ) |
The difference between GAAP-basis and tax-basis unrealized gains (losses) is attributable primarily to wash sales, net mark-to-market gains (losses) on regulated futures, and differences related to the tax treatment of partnerships.
GSAM has reviewed the Fund’s tax positions for all open tax years (the current and prior three years, as applicable) and has concluded that no provision for income tax is required in the Fund’s financial statements. Such open tax years remain subject to examination and adjustment by tax authorities.
29
GOLDMAN SACHS MULTI-ASSET REAL RETURN FUND
Notes to Financial Statements (continued)
April 30, 2015 (Unaudited)
The Fund’s risks include, but are not limited to, the following:
Interest Rate Risk — When interest rates increase, fixed income securities or instruments held by the Fund will generally decline in value. Long-term fixed income securities or instruments will normally have more price volatility because of this risk than short-term fixed income securities or instruments.
Investments in Other Investment Companies — As a shareholder of another investment company, including an exchange traded fund (“ETF”), the Fund will directly bear its proportionate share of any net management fees and other expenses paid by such other investment companies, in addition to the fees and expenses regularly borne by the Fund. ETFs are subject to risks that do not apply to conventional mutual funds, including but not limited to the following: (i) the market price of the ETF’s shares may trade at a premium or a discount to their NAV; and (ii) an active trading market for an ETF’s shares may not develop or be maintained.
Large Shareholder Transactions Risk — The Fund may experience adverse effects when certain large shareholders, such as other funds, institutional investors (including those trading by use of non-discretionary mathematical formulas), financial intermediaries (who may make investment decisions on behalf of underlying clients and/or include the Fund in their investment model), individuals, accounts and Goldman Sachs affiliates, purchase or redeem large amounts of shares of the Fund. Such large shareholder redemptions may cause the Fund to sell portfolio securities at times when it would not otherwise do so, which may negatively impact the Fund’s NAV and liquidity. Similarly, large Fund share purchases may adversely affect the Fund’s performance to the extent that the Fund is delayed in investing new cash and is required to maintain a larger cash position than it ordinarily would. These transactions may also accelerate the realization of taxable income to shareholders if such sales of investments resulted in gains, and may also increase transaction costs. In addition, a large redemption could result in the Fund’s current expenses being allocated over a smaller asset base, leading to an increase in the Fund’s expense ratio.
Liquidity Risk — The Fund may make investments that are illiquid or that may become less liquid in response to market developments or adverse investor perceptions. Illiquid investments may be more difficult to value. Liquidity risk may also refer to the risk that the Fund will not be able to pay redemption proceeds within the allowable time period because of unusual market conditions, an unusually high volume of redemption requests, or other reasons. To meet redemption requests, the Fund may be forced to sell investments at an unfavorable time and/or under unfavorable conditions. Liquidity risk may be the result of, among other things, the reduced number and capacity of traditional market participants to make a market in fixed income securities or the lack of an active market. The potential for liquidity risk may be magnified by a rising interest rate environment or other circumstances where investor redemptions from fixed income mutual funds may be higher than normal, potentially causing increased supply in the market due to selling activity.
Market and Credit Risks — In the normal course of business, the Fund trades financial instruments and enters into financial transactions where risk of potential loss exists due to changes in the market (market risk). Additionally, the Fund may also be exposed to credit risk in the event that an issuer or guarantor fails to perform or that an institution or entity with which the Fund has unsettled or open transactions defaults.
Investing in foreign markets may involve special risks and considerations not typically associated with investing in the U.S. Foreign securities may be subject to risk of loss because of more or less foreign government regulation, less public information and less economic, political and social stability in the countries in which the Fund invests. Loss may also result from the imposition of exchange controls, confiscations and other government restrictions by the United States or other governments, or from problems in registration, settlement or custody. Foreign risk also involves the risk of negative foreign currency rate fluctuations, which may cause the value of securities denominated in such foreign currency (or other instruments through which the Fund has exposure to foreign currencies) to decline in value. Currency exchange rates may fluctuate significantly over short periods of time. To the extent that the Fund also invests in securities of issuers located in emerging markets, these risks may be more pronounced.
Master Limited Partnership Risk — Investments in securities of MLPs involve risks that differ from investments in common stock, including risks related to limited control and limited rights to vote on matters affecting the MLP, risks related to potential conflicts of interest between the MLP and the MLP’s general partner, cash flow risks, dilution risks, limited liquidity and risks related to the general partner’s right to require unit-holders to sell their common units at an undesirable time or price.
30
GOLDMAN SACHS MULTI-ASSET REAL RETURN FUND
Under the Trust’s organizational documents, its Trustees, officers, employees and agents are indemnified, to the extent permitted by the Act and state law, against certain liabilities that may arise out of performance of their duties to the Fund. Additionally, in the course of business, the Fund enters into contracts that contain a variety of indemnification clauses. The Fund’s maximum exposure under these arrangements is unknown, as this would involve future claims that may be made against the Fund that have not yet occurred. However, GSAM believes the risk of loss under these arrangements to be remote.
Subsequent events after the Statement of Assets and Liabilities date have been evaluated through the date the financial statements were issued. GSAM has concluded that there is no impact requiring adjustment or disclosure in the financial statements.
|
| 11. SUMMARY OF SHARE TRANSACTIONS |
Share activity is as follows:
| | | | | | | | | | | | | | | | |
| | | For the Six Months Ended
April 30, 2015
(Unaudited) | | | For the Fiscal
Year Ended
October 31, 2014 | |
| | | Shares | | | Dollars | | | Shares | | | Dollars | |
| | | | |
| Class A Shares | | | | | | | | | | | | | | | | |
Shares sold | | | 3,621 | | | $ | 37,152 | | | | 3,565 | | | $ | 37,784 | |
Reinvestment of distributions | | | 159 | | | | 1,630 | | | | 28 | | | | 299 | |
Shares redeemed | | | (2,849 | ) | | | (28,448 | ) | | | (1 | ) | | | (5 | ) |
| | | | 931 | | | | 10,334 | | | | 3,592 | | | | 38,078 | |
| Class C Shares | | | | | | | | | | | | | | | | |
Reinvestment of distributions | | | 22 | | | | 234 | | | | 9 | | | | 87 | |
| | | | 22 | | | | 234 | | | | 9 | | | | 87 | |
| Institutional Shares | | | | | | | | | | | | | | | | |
Shares sold | | | 3,167 | | | | 31,500 | | | | 34,638 | | | | 370,005 | |
Reinvestment of distributions | | | 30,121 | | | | 308,129 | | | | 19,610 | | | | 206,798 | |
Shares redeemed | | | (710 | ) | | | (7,153 | ) | | | (97 | ) | | | (1,043 | ) |
| | | | 32,578 | | | | 332,476 | | | | 54,151 | | | | 575,760 | |
| Class IR Shares | | | | | | | | | | | | | | | | |
Shares sold | | | 489 | | | | 5,200 | | | | — | | | | — | |
Reinvestment of distributions | | | 84 | | | | 859 | | | | 44 | | | | 463 | |
| | | | 573 | | | | 6,059 | | | | 44 | | | | 463 | |
| Class R Shares | | | | | | | | | | | | | | | | |
Reinvestment of distributions | | | 64 | | | | 650 | | | | 31 | | | | 330 | |
| | | | 64 | | | | 650 | | | | 31 | | | | 330 | |
NET INCREASE | | | 34,168 | | | $ | 349,753 | | | | 57,827 | | | $ | 614,718 | |
31
GOLDMAN SACHS MULTI-ASSET REAL RETURN FUND
| | |
Fund Expenses — Six Month Period Ended April 30, 2015 (Unaudited) | | |
As a shareholder of Class A, Class C, Institutional, Class IR or Class R Shares of the Fund, you incur two types of costs: (1) transaction costs, including sales charges on purchase payments (with respect to Class A Shares), contingent deferred sales charges on redemptions (with respect to Class C Shares), and (2) ongoing costs, including management fees; distribution and service (12b-1) fees (with respect to Class A, Class C and Class R Shares); and other Fund expenses. This Example is intended to help you understand your ongoing costs (in dollars) of investing in Class A, Class C, Institutional, Class IR or Class R Shares of the Fund and to compare these costs with the ongoing costs of investing in other mutual funds.
The Example is based on an investment of $1,000 invested at the beginning of the period and held for the entire period from November 1, 2014 through April 30, 2015.
Actual Expenses — The first line under each share class in the table below provides information about actual account values and actual expenses. You may use the information in this line, together with the amount you invested, to estimate the expenses that you paid over the period. Simply divide your account value by $1,000 (for example, an $8,600 account value divided by $1,000=8.6), then multiply the result by the number in the first line under the heading entitled “Expenses Paid” to estimate the expenses you paid on your account during this period.
Hypothetical Example for Comparison Purposes — The second line under each share class in the table below provides information about hypothetical account values and hypothetical expenses based on the Fund’s actual net expense ratios and an assumed rate of return of 5% per year before expenses, which is not the Fund’s actual return. The hypothetical account values and expenses may not be used to estimate the actual ending account balance or expenses you paid for the period. You may use this information to compare the ongoing costs of investing in the Fund and other funds. To do so, compare this 5% hypothetical example with the 5% hypothetical examples that appear in the shareholder reports of the other funds.
Please note that the expenses shown in the table are meant to highlight your ongoing costs only and do not reflect any transactional costs, such as sales charges, redemption fees, or exchange fees. Therefore, the second line of the table is useful in comparing ongoing costs only, and will not help you determine the relative total costs of owning different funds. In addition, if these transactional costs were included, your costs would have been higher.
| | | | | | | | | | | | |
| | | Multi-Asset Real Return Fund | |
| Share Class | | Beginning Account Value 11/1/14 | | | Ending Account Value 4/30/15 | | | Expenses Paid for the 6 months ended 4/30/15* | |
| Class A | | | | | | | | | | | | |
Actual | | $ | 1,000.00 | | | $ | 976.10 | | | $ | 4.70 | |
Hypothetical 5% return | | | 1,000.00 | | | | 1,020.03 | + | | | 4.81 | |
| Class C | | | | | | | | | | | | |
Actual | | | 1,000.00 | | | | 972.50 | | | | 8.27 | |
Hypothetical 5% return | | | 1,000.00 | | | | 1,016.41 | + | | | 8.45 | |
| Institutional | | | | | | | | | | | | |
Actual | | | 1,000.00 | | | | 977.20 | | | | 2.75 | |
Hypothetical 5% return | | | 1,000.00 | | | | 1,022.02 | + | | | 2.81 | |
| Class IR | | | | | | | | | | | | |
Actual | | | 1,000.00 | | | | 977.40 | | | | 3.48 | |
Hypothetical 5% return | | | 1,000.00 | | | | 1,021.27 | + | | | 3.56 | |
| Class R | | | | | | | | | | | | |
Actual | | | 1,000.00 | | | | 974.90 | | | | 5.92 | |
Hypothetical 5% return | | | 1,000.00 | | | | 1,018.79 | + | | | 6.06 | |
| | * | | Expenses for the share class are calculated using the Fund’s annualized net expense ratio for each class, which represents the ongoing expenses as a percentage of net assets for the six months ended April 30, 2015. Expenses are calculated by multiplying the annualized net expense ratio by the average account value for the period; then multiplying the result by the number of days in the most recent fiscal half year; and then dividing that result by the number of days in the fiscal year. The annualized net expense ratios for the period were as follows: | |
| | | | | | | | | | | | | | | | | | | | |
| Fund | | Class A | | | Class C | | | Institutional | | | Class IR | | | Class R | |
Multi-Asset Real Return | | | 0.96 | % | | | 1.69 | % | | | 0.56 | % | | | 0.71 | % | | | 1.21 | % |
| | + | | Hypothetical expenses are based on the Fund’s actual annualized net expense ratios and an assumed rate of return of 5% per year before expenses. | |
32
FUNDS PROFILE
Goldman Sachs Funds

Goldman Sachs is a premier financial services firm, known since 1869 for creating thoughtful and customized investment solutions in complex global markets.
Today, the Investment Management Division of Goldman Sachs serves a diverse set of clients worldwide, including private institutions, public entities and individuals. With approximately $1.02 trillion in assets under supervision as of March 31, 2015, Goldman Sachs Asset Management (“GSAM”) has portfolio management teams located around the world and our investment professionals bring firsthand knowledge of local markets to every investment decision. Assets under supervision includes assets under management and other client assets for which Goldman Sachs does not have full discretion. GSAM leverages the resources of Goldman, Sachs & Co. subject to legal, internal and regulatory restrictions.

Money Market1
Financial Square FundsSM
| n | | Financial Square Tax-Exempt Funds |
| n | | Financial Square Federal Fund |
| n | | Financial Square Government Fund |
| n | | Financial Square Money Market Fund |
| n | | Financial Square Prime Obligations Fund |
| n | | Financial Square Treasury Instruments Fund |
| n | | Financial Square Treasury Obligations Fund |
Fixed Income
Short Duration and Government
| n | | High Quality Floating Rate Fund |
| n | | Limited Maturity Obligations Fund |
| n | | Short Duration Government Fund |
| n | | Short Duration Income Fund |
| n | | Inflation Protected Securities Fund |
Multi-Sector
Municipal and Tax-Free
| n | | High Yield Municipal Fund |
| n | | Dynamic Municipal Income Fund3 |
| n | | Short Duration Tax-Free Fund |
Single Sector
| n | | Investment Grade Credit Fund |
| n | | High Yield Floating Rate Fund |
| n | | Emerging Markets Debt Fund |
| n | | Local Emerging Markets Debt Fund |
| n | | Dynamic Emerging Markets Debt Fund |
Fixed Income Alternatives
| n | | Long Short Credit Strategies Fund |
| n | | Fixed Income Macro Strategies Fund |
Fundamental Equity
| n | | Small/Mid Cap Value Fund |
| n | | Small/Mid Cap Growth Fund |
| n | | Flexible Cap Growth Fund |
| n | | Concentrated Growth Fund |
| n | | Technology Tollkeeper Fund |
| n | | Growth Opportunities Fund |
| n | | Rising Dividend Growth Fund |
| n | | Dynamic U.S. Equity Fund4 |
Tax-Advantaged Equity
| n | | U.S. Tax-Managed Equity Fund |
| n | | International Tax-Managed Equity Fund |
| n | | U.S. Equity Dividend and Premium Fund |
| n | | International Equity Dividend and Premium Fund |
Equity Insights
| n | | Small Cap Equity Insights Fund |
| n | | U.S. Equity Insights Fund |
| n | | Small Cap Growth Insights Fund |
| n | | Large Cap Growth Insights Fund |
| n | | Large Cap Value Insights Fund |
| n | | Small Cap Value Insights Fund |
| n | | International Small Cap Insights Fund |
| n | | International Equity Insights Fund |
| n | | Emerging Markets Equity Insights Fund |
Fundamental International Equity
| n | | Strategic International Equity Fund |
| n | | Focused International Equity Fund |
| n | | International Small Cap Fund |
| n | | Emerging Markets Equity Fund |
| n | | BRIC Fund (Brazil, Russia, India, China) |
Select Satellite5
| n | | Global Managed Beta Fund |
| n | | Multi-Manager Non-Core Fixed Income Fund |
| n | | Real Estate Securities Fund |
| n | | International Real Estate Securities Fund |
| n | | Commodity Strategy Fund |
| n | | Dynamic Commodity Strategy Fund |
| n | | Dynamic Allocation Fund |
| n | | Absolute Return Tracker Fund |
| n | | Managed Futures Strategy Fund |
| n | | MLP Energy Infrastructure Fund |
| n | | Multi-Manager Alternatives Fund |
| n | | Multi-Asset Real Return Fund |
| n | | Retirement Portfolio Completion Fund |
| n | | Tactical Tilt Implementation Fund |
Total Portfolio Solutions5
| n | | Balanced Strategy Portfolio |
| n | | Growth and Income Strategy Portfolio |
| n | | Growth Strategy Portfolio |
| n | | Equity Growth Strategy Portfolio |
| n | | Satellite Strategies Portfolio |
| n | | Enhanced Dividend Global Equity Portfolio |
| n | | Tax Advantaged Global Equity Portfolio |
| 1 | | An investment in a money market fund is neither insured nor guaranteed by the Federal Deposit Insurance Corporation (“FDIC”) or any other government agency. Although the Funds seek to preserve the value of your investment at $1.00 per share, it is possible to lose money by investing in the Funds. |
| 2 | | Effective on October 1, 2014, the Goldman Sachs Core Plus Fixed Income Fund was renamed the Goldman Sachs Bond Fund. |
| 3 | | Effective on December 18, 2014, the Goldman Sachs Municipal Income Fund was renamed the Goldman Sachs Dynamic Municipal Income Fund. |
| 4 | | Effective on April 30, 2015, the Goldman Sachs U.S. Equity Fund was renamed the Goldman Sachs Dynamic U.S. Equity Fund. |
| 5 | | Individual Funds within the Total Portfolio Solutions and Select Satellite categories will have various placement on the risk/return spectrum and may have greater or lesser risk than that indicated by the placement of the general Total Portfolio Solutions or Select Satellite category. |
Financial Square FundsSM is a registered service mark of Goldman, Sachs & Co.
| * | | This list covers open-end funds only. Please visit our website at www.GSAMFUNDS.com to learn about our closed-end funds. |
| | |
TRUSTEES Ashok N. Bakhru, Chairman Kathryn A. Cassidy John P. Coblentz, Jr. Diana M. Daniels Joseph P. LoRusso Herbert J. Markley James A. McNamara Jessica Palmer Alan A. Shuch Richard P. Strubel Roy W. Templin Gregory G. Weaver | | OFFICERS James A. McNamara, President Scott M. McHugh, Principal Financial Officer and Treasurer Caroline L. Kraus, Secretary |
| |
GOLDMAN, SACHS & CO. Distributor and Transfer Agent | | GOLDMAN SACHS ASSET MANAGEMENT, L.P. Investment Adviser |
Visit our web site at www.GSAMFUNDS.com to obtain the most recent month-end returns.
Goldman Sachs Asset Management, L.P., 200 West Street, New York, New York 10282
The reports concerning the Fund included in this shareholder report may contain certain forward-looking statements about the factors that may affect the performance of the Fund in the future. These statements are based on Fund management’s predictions and expectations concerning certain future events and their expected impact on the Fund, such as performance of the economy as a whole and of specific industry sectors, changes in the levels of interest rates, the impact of developing world events, and other factors that may influence the future performance of the Fund. Management believes these forward-looking statements to be reasonable, although they are inherently uncertain and difficult to predict. Actual events may cause adjustments in portfolio management strategies from those currently expected to be employed.
A description of the policies and procedures that the Fund uses to determine how to vote proxies relating to portfolio securities and information regarding how the Fund voted proxies relating to portfolio securities for the most recent 12-month period ended June 30, is available (I) without charge, upon request by calling 1-800-526-7384; and (II) on the Securities and Exchange Commission (“SEC’’) web site at http://www.sec.gov.
The Fund files its complete schedule of portfolio holdings with the SEC for the first and third quarters of each fiscal year on Form N-Qs. The Fund’s Form N-Qs are available on the SEC’s web site at http://www.sec.gov within 60 days after the Fund’s first and third fiscal quarters. The Fund’s Form N-Qs may be reviewed and copied at the SEC’s Public Reference Room in Washington, D.C., and information on the operation of the Public Reference Room may also be obtained by calling 1-800-SEC-0330. Form N-Qs may be obtained upon request and without charge by calling 1-800-526-7384 (for Retail Shareholders) or 1-800-621-2550 (for Institutional Shareholders).
The website links provided are for your convenience only and are not an endorsement or recommendation by GSAM of any of these websites or the products or services offered. GSAM is not responsible for the accuracy and validity of the content of these websites.
Fund holdings and allocations shown are as of April 30, 2015 and may not be representative of future investments. Fund holdings should not be relied on in making investment decisions and should not be construed as research or investment advice regarding particular securities. Current and future holdings are subject to risk
The Global Industry Classification Standard (GICS) was developed by and is the exclusive property and a service mark of Morgan Stanley Capital International Inc. (MSCI) and Standard & Poor’s, a division of The McGraw-Hill Companies, Inc. (S&P) and is licensed for use by Goldman Sachs. Neither MSCI, S&P nor any other party involved in making or compiling the GICS or any GICS classifications makes any express or implied warranties or representations with respect to such standard or classification (or the results to be obtained by the use thereof), and all such parties hereby expressly disclaim all warranties of originality, accuracy, completeness, merchantability or fitness for a particular purpose with respect to any of such standard or classification. Without limiting any of the foregoing, in no event shall MSCI, S&P, any of their affiliates or any third party involved in making or compiling the GICS or any GICS classifications have any liability for any direct, indirect, special, punitive, consequential or any other damages (including lost profits) even if notified of the possibility of such damages.
The portfolio risk management process includes an effort to monitor and manage risk, but does not imply low risk.
This material is not authorized for distribution to prospective investors unless preceded or accompanied by a current Prospectus or summary prospectus, if applicable. Investors should consider a Fund’s objective, risks, and charges and expenses, and read the summary prospectus, if available, and/or the Prospectus carefully before investing or sending money. The summary prospectus, if available, and the Prospectus contain this and other information about a Fund and may be obtained from your authorized dealer or from Goldman, Sachs & Co. by calling (retail – 1-800-526-7384) (institutional – 1-800-621-2550).
© 2015 Goldman Sachs. All rights reserved. 164909.MF.MED.TMPL/6/2015 MARRSAR-15/118
| | (a) | As of the end of the period covered by this report, the registrant has adopted a code of ethics that applies to the registrant’s principal executive officer, principal financial officer, principal accounting officer or controller, or persons performing similar functions, regardless of whether these individuals are employed by the registrant or a third party (the “Code of Ethics”). |
| | (b) | During the period covered by this report, no amendments were made to the provisions of the Code of Ethics. |
| | (c) | During the period covered by this report, the registrant did not grant any waivers, including an implicit waiver, from any provision of the Code of Ethics. |
| | (d) | A copy of the Code of Ethics is available as provided in Item 12(a)(1) of this report. |
| ITEM 3. | AUDIT COMMITTEE FINANCIAL EXPERT. |
| | The registrant’s board of trustees has determined that the registrant has at least one “audit committee financial expert” (as defined in Item 3 of Form N-CSR) serving on its audit committee. John P. Coblentz, Jr. is the “audit committee financial expert” and is “independent” (as each term is defined in Item 3 of Form N-CSR). |
| ITEM 4. | PRINCIPAL ACCOUNTANT FEES AND SERVICES. |
Table 1 — Items 4(a) - 4(d). The accountant fees below reflect the aggregate fees billed by all of the Funds of the Goldman Sachs Trust and includes the Goldman Sachs Funds to which this certified shareholder report relates.
| | | | | | | | | | | | |
| | | 2014 | | 2013 | | Description of Services Rendered |
| | | |
| | | | | | | | | | | | |
| | | |
Audit Fees: | | | | | | | | | | | | |
| | | |
• PricewaterhouseCoopers LLP
(“PwC”) | | | $ | 4,291,739 | | | | $ | 2,304,956 | | | Financial Statement audits. |
| | | |
Audit-Related Fees: | | | | | | | | | | | | |
| | | |
• PwC | | | $ | 0 | | | | $ | 2,340 | | | Other attest services. |
| | | |
Tax Fees: | | | | | | | | | | | | |
| | | |
• PwC | | | $ | 794,850 | | | | $ | 864,950 | | | Tax compliance services provided in connection with the preparation and review of registrant’s tax returns. |
Table 2 — Items 4(b)(c) & (d). Non-Audit Services to the Goldman Sachs Trust’s service affiliates * that were pre-approved by the Audit Committee of the Goldman Sachs Trust pursuant to Rule 2-01(c)(7)(ii) of Regulation S-X.
| | | | | | | | | | | | |
| | | 2014 | | 2013 | | Description of Services Rendered |
| | | |
| | | | | | | | | | | | |
| | | |
Audit-Related Fees: | | | | | | | | | | | | |
| | | |
• PwC | | | $ | 1,486,420 | | | | $ | 1,516,680 | | | Internal control review performed in accordance with Statement on Standards for Attestation Engagements No. 16. These fees are borne by the Funds’ Adviser. |
| * | These include the advisor (excluding sub-advisors) and any entity controlling, controlled by or under common control with the advisor that provides ongoing services to the registrant (hereinafter referred to as “service affiliates”). |
Item 4(e)(1) — Audit Committee Pre-Approval Policies and Procedures
Pre-Approval of Audit and Non-Audit Services Provided to the Funds of the Goldman Sachs Trust. The Audit and Non-Audit Services Pre-Approval Policy (the “Policy”) adopted by the Audit Committee of Goldman Sachs Trust (“GST”) sets forth the procedures and the conditions pursuant to which services performed by an independent auditor for GST may be pre-approved. Services may be pre-approved specifically by the Audit Committee as a whole or, in certain circumstances, by the Audit Committee Chairman or the person designated as the Audit Committee Financial Expert. In addition, subject to specified cost limitations, certain services may be pre-approved under the provisions of the Policy. The Policy provides that the Audit Committee will consider whether the services provided by an independent auditor are consistent with the Securities and Exchange Commission’s rules on auditor independence. The Policy provides for periodic review and pre-approval by the Audit Committee of the services that may be provided by the independent auditor.
De Minimis Waiver. The pre-approval requirements of the Policy may be waived with respect to the provision of non-audit services that are permissible for an independent auditor to perform, provided (1) the aggregate amount of all such services provided constitutes no more than five percent of the total amount of revenues subject to pre-approval that was paid to the independent auditors during the fiscal year in which the services are provided; (2) such services were not recognized by GST at the time of the engagement to be non-audit services; and (3) such services are promptly brought to the attention of the Audit Committee and approved prior to the completion of the audit by the Audit Committee or by one or more members of the Audit Committee to whom authority to grant such approvals has been delegated by the Audit Committee, pursuant to the pre-approval provisions of the Policy.
Pre-Approval of Non-Audit Services Provided to GST’s Investment Advisers. The Policy provides that, in addition to requiring pre-approval of audit and non-audit services provided to GST, the Audit Committee will pre-approve those non-audit services provided to GST’s investment advisers (and entities controlling, controlled by or under common control with the investment advisers that provide ongoing services to GST) where the engagement relates directly to the operations or financial reporting of GST.
Item 4(e)(2) – 0% of the audit-related fees, tax fees and other fees listed in Table 1 were approved by GST’s Audit Committee pursuant to the “de minimis” exception of Rule 2-01(c)(7)(i)(C) of Regulation S-X. In addition, 0% of the non-audit services to the GST’s service affiliates listed in Table 2 were approved by GST’s Audit Committee pursuant to the “de minimis” exception of Rule 2-01(c)(7)(i)(C) of Regulation S-X.
Item 4(f) – Not applicable.
Item 4(g) Aggregate Non-Audit Fees Disclosure
The aggregate non-audit fees billed to GST by PwC for the twelve months ended October 31, 2014 and October 31, 2013 were approximately $794,850 and $867,290 respectively. The aggregate non-audit fees billed to GST’s adviser and service affiliates by PwC for non-audit services for the twelve months ended December 31, 2013 and December 31, 2012 were approximately $9.8 million and $10.0 million respectively. With regard to the aggregate non-audit fees billed to GST’s adviser and service affiliates, the 2014 and 2013 amounts include fees for non-audit services required to be pre-approved [see Table 2] and fees for non-audit services that did not require pre-approval since they did not directly relate to GST’s operations or financial reporting.
Item 4(h) — GST’s Audit Committee has considered whether the provision of non-audit services to GST’s investment adviser and service affiliates that did not require pre-approval pursuant to paragraph (c)(7)(ii) of Rule 2-01 of Regulation S-X is compatible with maintaining the auditors’ independence.
| ITEM 5. | AUDIT COMMITTEE OF LISTED REGISTRANTS. |
| ITEM 6. | SCHEDULE OF INVESTMENTS. |
| | Schedule of Investments is included as part of the Report to Stockholders filed under Item 1. |
| ITEM 7. | DISCLOSURE OF PROXY VOTING POLICIES AND PROCEDURES FOR CLOSED-END MANAGEMENT INVESTMENT COMPANIES. |
| ITEM 8. | PORTFOLIO MANAGERS OF CLOSED-END MANAGEMENT INVESTMENT COMPANIES. |
| ITEM 9. | PURCHASES OF EQUITY SECURITIES BY CLOSED-END MANAGEMENT INVESTMENT COMPANY AND AFFILIATED PURCHASERS. |
| ITEM 10. | SUBMISSION OF MATTERS TO A VOTE OF SECURITY HOLDERS. |
| | There have been no material changes to the procedures by which shareholders may recommend nominees to the registrant’s board of trustees. |
| ITEM 11. | CONTROLS AND PROCEDURES. |
| | (a) | The registrant’s principal executive and principal financial officers, or persons performing similar functions have concluded that the registrant’s disclosure controls and procedures (as defined in Rule 30a-3(c) under the Investment Company Act of 1940, as amended (the “1940 Act”)) are effective as of a date within 90 days of the filing of this report that includes the disclosure required by this paragraph, based on the evaluation of these controls and procedures required by Rule 30a-3(b) under the 1940 Act and 15d-15(b) under the Securities Exchange Act of 1934, as amended. |
| | (b) | There were no changes in the registrant’s internal control over financial reporting (as defined in Rule 30a-3(d) under the 1940 Act) that occurred during the registrant’s fiscal quarter of the period covered by this report that have materially affected, or are reasonably likely to materially affect, the registrant’s internal control over financial reporting. |
| | | | |
| (a)(1) | | Goldman Sachs Trust’s Code of Ethics for Principal Executive and Senior Financial Officers is incorporated by reference to Exhibit 12(a)(1) of the registrant’s Form N-CSR filed on July 8, 2015 for its International Equity Insights Funds. |
| | |
| (a)(2) | | Exhibit 99.CERT | | Certifications pursuant to Section 302 of the Sarbanes-Oxley Act of 2002 filed herewith. |
| | |
| (b) | | Exhibit 99.906CERT | | Certifications pursuant to Section 906 of the Sarbanes-Oxley Act of 2002 filed herewith. |
SIGNATURES
Pursuant to the requirements of the Securities Exchange Act of 1934 and the Investment Company Act of 1940, the registrant has duly caused this report to be signed on its behalf by the undersigned, thereunto duly authorized.
| | |
| | | Goldman Sachs Trust |
| |
| By: | | /s/ James A. McNamara |
| |
| | |
| | James A. McNamara |
| | President/Principal Executive Officer |
| | Goldman Sachs Trust |
| |
| Date: | | July 8, 2015 |
Pursuant to the requirements of the Securities Exchange Act of 1934 and the Investment Company Act of 1940, this report has been signed below by the following persons on behalf of the registrant and in the capacities and on the dates indicated.
| | |
| By: | | /s/ James A. McNamara |
| |
| | |
| | James A. McNamara |
| | President/Principal Executive Officer |
| | Goldman Sachs Trust |
| |
| Date: | | July 8, 2015 |
| |
| By: | | /s/ Scott McHugh |
| |
| | |
| | Scott McHugh |
| | Principal Financial Officer |
| | Goldman Sachs Trust |
| |
| Date: | | July 8, 2015 |