UNITED STATES
SECURITIES AND EXCHANGE COMMISSION
Washington, D.C. 20549
FORM N-CSR
CERTIFIED SHAREHOLDER REPORT OF REGISTERED
MANAGEMENT INVESTMENT COMPANIES
Investment Company Act file number 811-05349
Goldman Sachs Trust
(Exact name of registrant as specified in charter)
71 South Wacker Drive, Chicago, Illinois 60606
(Address of principal executive offices) (Zip code)
| | |
| Caroline Kraus, Esq. | | Copies to: |
| Goldman, Sachs & Co. | | Geoffrey R.T. Kenyon, Esq. |
| 200 West Street | | Dechert LLP |
| New York, New York 10282 | | 100 Oliver Street |
| | 40th Floor |
| | Boston, MA 02110-2605 |
(Name and address of agents for service)
Registrant’s telephone number, including area code: (312) 655-4400
Date of fiscal year end: October 31
Date of reporting period: April 30, 2015
| ITEM 1. | REPORTS TO STOCKHOLDERS. |
| | The Semi-Annual Report to Stockholders is filed herewith. |
Goldman Sachs Funds

| | | | |
| | |
| Semi-Annual Report | | | | April 30, 2015 |
| | |
| | | | Tactical Tilt Implementation Fund |

Goldman Sachs Tactical Tilt Implementation Fund
| | | | |
TABLE OF CONTENTS | | | | |
| |
Principal Investment Strategies and Risks | | | 1 | |
| |
Portfolio Management Discussions and Performance Summaries | | | 3 | |
| |
Schedule of Investments | | | 9 | |
| |
Financial Statements | | | 13 | |
| |
Financial Highlights | | | 16 | |
| |
Notes to the Financial Statements | | | 18 | |
| |
Other Information | | | 32 | |
| | | | |
| | | |
| NOT FDIC-INSURED | | May Lose Value | | No Bank Guarantee |
GOLDMAN SACHS TACTICAL TILT IMPLEMENTATION FUND
Principal Investment Strategies and Risks
The Goldman Sachs Tactical Tilt Implementation Fund seeks long-term total return by investing in any one or in any combination of the following: U.S. and foreign equity securities, pooled investment vehicles, including affiliated domestic and international fixed income funds (“underlying funds”), fixed income instruments, including debt issued by U.S. and foreign governments, their agencies, instrumentalities, sponsored entities, and political subdivisions, notes, debt participations and non-investment grade securities (commonly known as “junk bonds”), derivatives and commodity investments, primarily through a wholly-owned subsidiary of the Portfolio organized as a company under the laws of the Cayman Islands (the “Subsidiary”).
Different investment styles (e.g., Tactical Tilt Recommendations) tend to shift in and out of favor, and at times the Portfolio may underperform other funds that invest in similar asset classes. The Portfolio’s equity investments are subject to market risk, which means that the value of the securities in which it invests may go up or down in response to the prospects of individual companies, particular sectors and/or general economic conditions. Foreign and emerging market investments may be more volatile and less liquid than investments in U.S. securities and are subject to the risks of currency fluctuations and adverse economic and political developments. The Portfolio’s investments in other investment companies (including exchange-traded funds, exchange-traded notes), publicly-traded partnerships and real estate investment trusts subject it to additional expenses. The Portfolio is subject to the risk factors of the underlying funds in direct proportion to its investments in those underlying funds. Because the Portfolio is subject to the underlying fund expenses as well as its own expenses, the cost of investing in the Portfolio may be higher than investing in a mutual fund that only invests directly in stocks and bonds. Investments in fixed income securities are subject to the risks associated with debt securities generally, including credit, liquidity and interest rate risk. High yield, lower rated investments can have greater price volatility, are less liquid and present greater risks (including risks of default) than higher rated fixed income securities. The Portfolio may be more sensitive to adverse economic, business or political developments if it invests a substantial portion of its assets in bonds of similar projects or in particular types of municipal securities. Any guarantee on U.S. government securities applies only to the underlying securities of the Portfolio if held to maturity and not to the value of the Portfolio’s shares. The Portfolio is also subject to the risk that the issuers of sovereign debt or the government authorities that control the payment of debt may be unable or unwilling to repay principal or interest when due. The Portfolio may invest in loans directly or indirectly, by purchasing participations or sub-participations from financial institutions. Indirect purchases may subject the Portfolio to greater delays, expenses and risks than direct obligations in the case that a borrower fails to pay scheduled principal and interest. At times, the Portfolio may be unable to sell certain of its illiquid investments without a substantial drop in price, if at all. The Portfolio may invest in non-investment grade securities, which involve greater price volatility and present greater risks than higher rated fixed income securities. The Portfolio may concentrate its investments in a specific industry (only in the event that that industry represents 20% or more of the Portfolio’s benchmark index at the time of investment), subjecting it to greater risk of loss as a result of adverse economic, business or other developments affecting that industry.
Derivative instruments may involve a high degree of financial risk. These risks include the risk that a small movement in the price of the underlying security or benchmark may result in a disproportionately large movement, unfavorable or favorable, in the price of the derivative instrument; the risk of default by a counterparty; and liquidity risk. Over-the-counter transactions are subject to less governmental regulation and supervision. Taking short positions involves leverage of the Portfolio’s assets and presents various other risks. Losses on short positions are potentially unlimited as a loss occurs when the value of an asset with respect to which the Portfolio has a short position increases. The Portfolio is “non-diversified” and may invest a larger percentage of its assets in fewer issuers than “diversified” funds. Accordingly, the Portfolio may be more susceptible to adverse developments affecting any single issuer held in its portfolio and to greater losses resulting from these developments. The Subsidiary primarily obtains its commodity exposure by investing in commodity index-linked derivative instruments
1
GOLDMAN SACHS TACTICAL TILT IMPLEMENTATION FUND
(which may include total return and excess return swaps). The Portfolio is subject to the risk that exposure to the commodities markets may subject the Portfolio to greater volatility than investments in traditional securities. The Portfolio is subject to tax risk as a result of its investments in the Subsidiary and in commodity index-linked structured notes, as the Portfolio has not received a private letter ruling from the Internal Revenue Service (“IRS”) concluding that income and gains from such investments are “qualifying income.” The IRS has suspended granting such private letter rulings, and the Portfolio cannot rely on private letter rulings granted to other taxpayers. The tax treatment of investments in the Subsidiary and in commodity index-linked structured notes may be adversely affected by future legislation and/or IRS guidance. While the Portfolio has obtained an opinion of counsel regarding such investments, if the IRS were to successfully assert that the Portfolio’s income from such investments was not “qualifying income,” in which case the Portfolio would fail to qualify as a regulated investment company, the Portfolio would be subject to federal and state income tax on all of its taxable income at regular corporate tax rates with no deduction for any distributions paid to shareholders, which would significantly adversely affect the returns to Portfolio shareholders.
The investment program of the Portfolio is speculative, entails substantial risks and includes asset classes and investment techniques not employed by more traditional mutual funds. The Portfolio should not be relied upon as a complete investment program. There can be no assurance that the investment objective of the Portfolio will be achieved.
2
PORTFOLIO RESULTS
Goldman Sachs Tactical Tilt Implementation Fund
Investment Objective and Principal Strategy
The Portfolio seeks long-term total return.
Portfolio Management Discussion and Analysis
Below, the Goldman Sachs Global Portfolio Solutions Team discusses the Goldman Sachs Tactical Tilt Implementation Fund’s (the “Portfolio”) performance and positioning for the six-month period ended April 30, 2015 (the “Reporting Period”).
| Q | | How did the Portfolio perform during the Reporting Period? |
| A | | During the Reporting Period, the Portfolio’s Class I shares generated a cumulative total return, without sales charges, of 7.29%. This return compares to the 0.13% cumulative total return of the Portfolio’s benchmark, the Bank of America Merrill Lynch U.S. Dollar Three-Month LIBOR Constant Maturity Index (the “Index”), during the same time period. |
| Q | | What economic and market factors most influenced the Portfolio during the Reporting Period? |
| A | | Unfolding divergence in central bank monetary policy and in economic growth across countries and regions around the globe, particularly in the developed markets, was a dominant theme impacting the various asset classes through most of the Reporting Period, moderating slightly in April 2015 on the heels of global economic growth concerns and a lackluster first quarter 2015 U.S. Gross Domestic Product (“GDP”) report. In early 2015, central bank actions around the world surprised the markets, bringing riskier asset classes back into favor for a time, with 14 global central banks announcing easing measures in January 2015 alone. In the U.S., the Federal Reserve (the “Fed”), which had ended its quantitative easing asset purchases on schedule at the end of October 2014, adopted a dovish tone at its March 2015 policy meeting, lowering its forecasts for interest rates and U.S. GDP. (A dovish tone tends to suggest lower interest rates.) In Europe, accommodative monetary policy and a generally positive economic growth outlook contributed positively to equity performance, though European stocks began to lag developed market equities toward the end of the Reporting Period as a result of ongoing Greek debt negotiations. Global government fixed income markets — as measured by the Citigroup World Government Bond Index (hedged to USD) — were up 3.28% for the Reporting Period overall, driven by weaker global economic data. Geopolitical events, including talks on the lifting of Iranian sanctions as well as ongoing crises in the Middle East, caused renewed turbulence in the commodities markets. Commodities declined during the Reporting Period, as oil prices remained depressed amid a global supply glut. Meanwhile, the U.S. dollar strengthened against major global currencies, propelled by falling U.S. jobless claims, a political power shift in Greece and the Chinese central bank’s cut in the daily reference rate for the Chinese yuan. At the end of the Reporting Period, economic conditions in China remained comparatively weaker but were offset somewhat by expectations of further easing and improved domestic demand. |
| Q | | What key factors were responsible for the Portfolio’s performance during the Reporting Period? |
| A | | The Portfolio benefited most from its currency allocations during the Reporting Period. More specifically, the Portfolio’s long position in the U.S. dollar relative to the Japanese yen added to relative returns. As mentioned previously, the U.S. dollar strengthened significantly versus other world currencies during the Reporting Period. Meanwhile, the Japanese yen continued to weaken after the Bank of Japan announced it would expand its purchases of Japanese government bonds and market participants anticipated further significant stimulus in 2015. In addition, the Portfolio’s short position in the euro relative to the U.S. dollar performed strongly, as the euro declined versus the U.S. dollar for a tenth consecutive month in April 2015. The euro’s slide persisted amidst worries about Greece’s financial situation and its continued membership in the European Union as well as amidst stimulus measures announced by the European Central Bank (“ECB”) in January 2015. |
3
PORTFOLIO RESULTS
| | | The largest detractor from Portfolio performance during the Reporting Period was a U.S. equity hedge, which was maintained because of potential downside risks we perceived, including weak European economic data, concern about upcoming elections in the Eurozone and ongoing Greek debt negotiations. Earlier in the Reporting Period, Ebola also posed a key tail risk to our economic and financial market outlook. While the probability of an Ebola outbreak in the U.S. was very low, any increase in likelihood could have had negative repercussions on the U.S. economy and the financial markets. This U.S. equity hedge positioning hampered results, as U.S. stocks, as represented by the S&P 500® Index, posted gains during the Reporting Period. In addition, the positive performance of the Portfolio’s long position in Spanish equities was offset by its short position in French equities, which detracted. |
| Q | | How was the Portfolio positioned at the beginning of the Reporting Period? |
| A | | At the beginning of the Reporting Period, the Portfolio had 29.39% of its total net assets invested in equity-related investments; 41.78% of its total net assets invested in fixed income-related investments; 28.60% of its total net assets invested in currency-related investments; and 0.23% of its total net assets invested in commodity-related investments. None of the Portfolio’s total net assets were invested in cash and cash equivalents at the beginning of the Reporting Period. The above sector breakout is inclusive of derivative exposure across all asset classes. |
| Q | | How did you tactically manage the Portfolio’s allocations during the Reporting Period? |
| A | | During the Reporting Period, in response to shifting macroeconomic and market dynamics, we made a number of changes to the Portfolio’s equity-related, currency-related and fixed income-related exposures. The Portfolio’s equity positioning was predicated largely on our geopolitical and macroeconomic views, particularly of Eurozone countries — predominantly Spain — and Japan, and was based on where we perceived improved risk/reward potential opportunities. A position was established in Taiwan because of what we considered low valuations and improving corporate earnings. We managed the Portfolio’s currency related-exposures based on our views of global divergence, with several positions established to maintain the Portfolio’s long positioning in the U.S. dollar, as it continued to appreciate relative to the currencies of other developed markets. Overall, the Portfolio’s positioning continued to express our positive views about U. S. economic fundamentals and the strengthening U.S. dollar, especially as concern increased about muted global economic growth and weak economic data in developed markets outside the U.S. Within the Portfolio’s fixed income- related exposures, we maintained the Portfolio’s long position in U.S. high yield corporate bonds and U.S. high yield loans because we believed low yields, an improving U.S. economy and potential Fed tightening were likely to push yields up slowly. We maintained a bearish view on commodities. That said, the Portfolio entered into positions to capture our views on the energy market, including how the drop in oil prices might affect certain economies. We also sought to take advantage of the potential mispricing of energy-related securities due to what we considered overly pessimistic default rate scenarios. |
| Q | | How did the Portfolio use derivatives and similar instruments during the Reporting Period? |
| A | | The Portfolio used equity futures and foreign currency forward contracts to express active investment views with greater versatility across regional equity markets, global market sectors and the currency markets. The Portfolio also employed options on equity indices to tactically adjust the amount of equity and downside risk in seeking greater risk management precision, primarily to express views on the U.S. and Japan during the Reporting Period. |
| Q | | How was the Portfolio positioned at the end of the Reporting Period? |
| A | | At the end of the Reporting Period, the Portfolio had 31.53% of its total net assets invested in equity-related investments; 44.47% of its total net assets invested in fixed income-related investments; and 40.42% of its total net assets invested in currency-related investments. The Portfolio’s equity-related and currency-related exposures were increased through the use of options on equity and equity indices and the use of currency forwards. Cash and cash equivalents, along with options positions, accounted for 16.40% of the Portfolio’s total net assets at the end of the Reporting Period.1 At the end of the Reporting Period, none of the Portfolio’s total net assets were invested in commodity-related investments. The above sector breakout is inclusive of derivative exposure across all asset classes. |
| | 1 | | The Portfolio also maintains a larger cash base, which it uses, as necessary, to cover options and other derivatives positions that are not fully funded. Thus, the Portfolio has significant cash positions that are not included in its strategic allocation so as to avoid double-counting its positions in cash and cash equivalents and the capital it has set aside to cover options and other derivatives positions. |
4
PORTFOLIO RESULTS
| Q | | What is the Portfolio’s tactical asset allocation view and strategy for the months ahead? |
| A | | At the end of the Reporting Period, we continued to position the Portfolio for a strengthening U.S. economic recovery in spite of what we considered short-term weakness. We maintain our view that the Fed will tighten monetary policy in the second half of this year, and we expect above-trend growth in the U.S. economy, gradually rising yields and slowly normalizing inflation. Amidst mixed European and Japanese economic data and a broad shift toward dovish central bank monetary policy (which stands in contrast to the potential of near-term Fed tightening), we believe the strong commitments of the European Central bank (ECB) and Bank of Japan bode well, and we continue to monitor signs of economic recovery. In the months ahead, we believe market volatility is likely to offer attractive tactical opportunities, which may allow us to take advantage of different market, economic and geopolitical dynamics. |
5
FUND BASICS
Tactical Tilt Implementation Fund
as of April 30, 2015
| | | | | | | | | | |
| | PERFORMANCE REVIEW | |
| | | November 1, 2014–April 30, 2015 | | Portfolio Total Return
(based on NAV)1 | | | LIBOR Index2 | |
| | | Institutional | | | 7.29 | % | | | 0.13 | % |
| | 1 | | The net asset value (“NAV”) represents the net assets of the class of the Portfolio (ex-dividend) divided by the total number of shares of the class outstanding. The Portfolio’s performance assumes the reinvestment of dividends and other distributions. The Portfolio’s performance does not reflect the deduction of any applicable sales charges. |
| | 2 | | The Bank of America Merrill Lynch U.S. Dollar Three-Month LIBOR Constant Maturity Index tracks the performance of a synthetic asset paying LIBOR to a stated maturity. The Index is based on the assumed purchase at par of a synthetic instrument having exactly its stated maturity and with a coupon equal to that day’s fixing rate. That issue is assumed to be sold the following day (priced at a yield equal to the current day fixing rate) and rolled into a new instrument. |
| | | | | | | | | | | | |
| | STANDARDIZED TOTAL RETURNS3 | |
| | | For the period ended 3/31/15 | | One Year | | Since Inception | | | Inception Date | |
| | | Institutional | | N/A | | | 6.00 | % | | | 7/31/14 | |
| | 3 | | The Standardized Total Returns are cumulative total returns as of the most recent calendar quarter-end. They assume reinvestment of all distributions at NAV. Because Institutional Shares do not involve a sales charge, such a charge is not applied to their Standardized Total Returns. |
The returns set forth in the tables above represent past performance. Past performance does not guarantee future results. The Portfolio’s investment return and principal value will fluctuate so that an investor’s shares, when redeemed, may be worth more or less than their original cost. Current performance may be lower or higher than the performance quoted above. Please visit our web site at www.GSAMFUNDS.com to obtain the most recent month-end returns. Performance reflects applicable fee waivers and/or expense limitations in effect during the periods shown. In their absence, performance would be reduced. Returns do not reflect the deduction of taxes that a shareholder would pay on Portfolio distributions or the redemption of Portfolio shares.
6
FUND BASICS
| | | | | | | | | | |
| | EXPENSE RATIOS4 | |
| | | | | Net Expense Ratio (Current) | | | Gross Expense Ratio (Before Waivers) | |
| | | Institutional | | | 0.91 | % | | | 1.17 | % |
| | 4 | | The expense ratios of the Portfolio, both current (net of applicable fee waivers and/or expense limitations) and before waivers (gross of applicable fee waivers and/or expense limitations) are as set forth above according to the most recent publicly available Prospectus for the Portfolio and may differ from the expense ratios disclosed in the Financial Highlights in this report. Pursuant to a contractual arrangement, the Portfolio’s waivers and/or expense limitations will remain in place through at least February 29, 2016, and prior to such date the Investment Adviser may not terminate the arrangements without the approval of the Portfolio’s Board of Trustees. If these arrangements are discontinued in the future, the expense ratios may change without shareholder approval. |
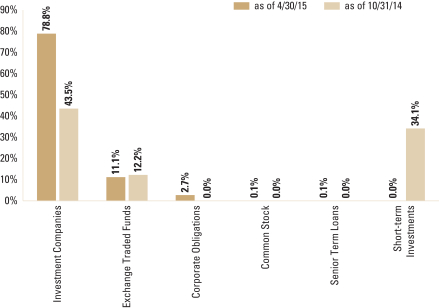
| | 5 | | The percentage shown for each investment category reflects the value of investments in that category as a percentage of the Portfolio’s Net Assets. Short-term investments represent repurchase agreements. Figures in the graph may not sum to 100% due to the exclusion of other assets and liabilities. The graph depicts the Portfolio’s investments but may not represent the Portfolio’s market exposure due to the exclusion of certain derivatives, if any, as listed in the Additional Investment Information section of the Schedule of Investments. |
7
GOLDMAN SACHS TACTICAL TILT IMPLEMENTATION FUND
Index Definitions
Bank of America Merrill Lynch U.S. Dollar Three-Month LIBOR Constant Maturity Index is based on the assumed purchase of a synthetic instrument having three months to maturity and with a coupon equal to the closing quote for three-month LIBOR. That issue is sold the following day (priced at a yield equal to the current day closing three-month LIBOR rate) and is rolled into a new three-month instrument. The index, therefore, will always have a constant maturity equal to exactly three months.
Citigroup World Government Bond Index (hedged to USD) measures the performance of fixed rate, local currency, investment grade sovereign bonds. It is a widely used benchmark that (on April 30, 2015) comprises sovereign debt from more than 20 countries, denominated in a variety of currencies.
S&P 500® Index is a U.S. stock market index based on the market capitalizations of 500 large companies having common stock listed on the New York Stock Exchange or NASDAQ. The S&P 500® Index components and their weightings are determined by S&P Dow Jones Indices.
8
GOLDMAN SACHS TACTICAL TILT IMPLEMENTATION FUND
Schedule of Investments
April 30, 2015 (Unaudited)
| | | | | | | | | | | | | | |
Principal Amount | | | Interest Rate | | | Maturity Date | | | Value | |
| | | | | | | | | | | | | | |
| | Corporate Obligations – 2.7% | |
| | Building Materials(a)(b) – 0.0% | |
| Zachry Holdings, Inc. | |
| $ | 350,000 | | | | 7.500 | % | | | 02/01/20 | | | $ | 346,938 | |
| | |
| | Energy – Coal(a)(b) – 0.1% | |
| Peabody Energy Corp. | |
| | 1,800,000 | | | | 10.000 | | | | 03/15/22 | | | | 1,521,000 | |
| | |
| | Energy – Exploration & Production – 2.2% | |
| Antero Resources Corp.(b) | |
| | 1,900,000 | | | | 5.375 | | | | 11/01/21 | | | | 1,919,000 | |
| Baytex Energy Corp.(a)(b) | |
| | 1,750,000 | | | | 5.125 | | | | 06/01/21 | | | | 1,706,250 | |
| Bonanza Creek Energy, Inc.(b) | |
| | 1,000,000 | | | | 6.750 | | | | 04/15/21 | | | | 1,015,000 | |
| California Resources Corp.(b) | |
| | 2,400,000 | | | | 6.000 | | | | 11/15/24 | | | | 2,259,120 | |
| Carrizo Oil & Gas, Inc.(b) | |
| | 2,050,000 | | | | 7.500 | | | | 09/15/20 | | | | 2,162,750 | |
| | 150,000 | | | | 6.250 | | | | 04/15/23 | | | | 152,063 | |
| Chaparral Energy, Inc.(b) | |
| | 3,400,000 | | | | 8.250 | | | | 09/01/21 | | | | 2,745,500 | |
| Chesapeake Energy Corp.(b) | |
| | 3,000,000 | | | | 5.375 | | | | 06/15/21 | | | | 2,880,000 | |
| Comstock Resources, Inc.(a)(b) | |
| | 1,800,000 | | | | 10.000 | | | | 03/15/20 | | | | 1,759,500 | |
| Concho Resources, Inc.(b) | |
| | 1,850,000 | | | | 5.500 | | | | 04/01/23 | | | | 1,884,687 | |
| CrownRock LP/CrownRock Finance, Inc.(a)(b) | |
| | 2,650,000 | | | | 7.750 | | | | 02/15/23 | | | | 2,802,375 | |
| Denbury Resources, Inc.(b) | |
| | 1,800,000 | | | | 5.500 | | | | 05/01/22 | | | | 1,714,500 | |
| Diamondback Energy, Inc.(b) | |
| | 2,800,000 | | | | 7.625 | | | | 10/01/21 | | | | 3,031,000 | |
| Endeavor Energy Resources LP/EER Finance, Inc.(a)(b) | |
| | 500,000 | | | | 8.125 | | | | 09/15/23 | | | | 517,500 | |
| EP Energy LLC/Everest Acquisition Finance, Inc.(b) | |
| | 1,900,000 | | | | 9.375 | | | | 05/01/20 | | | | 2,033,000 | |
| Gulfport Energy Corp.(b) | |
| | 1,850,000 | | | | 7.750 | | | | 11/01/20 | | | | 1,956,375 | |
| Halcon Resources Corp.(b) | |
| | 2,375,000 | | | | 9.750 | | | | 07/15/20 | | | | 1,953,437 | |
| Jones Energy Holdings LLC/Jones Energy Finance Corp.(b) | |
| | 2,400,000 | | | | 6.750 | | | | 04/01/22 | | | | 2,376,000 | |
| Laredo Petroleum, Inc.(b) | |
| | 2,400,000 | | | | 7.375 | | | | 05/01/22 | | | | 2,556,000 | |
| | 650,000 | | | | 6.250 | | | | 03/15/23 | | | | 671,125 | |
| Linn Energy LLC/Linn Energy Finance Corp.(b) | |
| | 3,100,000 | | | | 8.625 | | | | 04/15/20 | | | | 2,828,750 | |
| Magnum Hunter Resources Corp.(b) | |
| | 1,500,000 | | | | 9.750 | | | | 05/15/20 | | | | 1,365,000 | |
| Matador Resources Co.(a)(b) | |
| | 450,000 | | | | 6.875 | | | | 04/15/23 | | | | 462,375 | |
| MEG Energy Corp.(a)(b) | |
| | 3,750,000 | | | | 6.500 | | | | 03/15/21 | | | | 3,698,437 | |
| Memorial Production Partners LP/Memorial Production Finance
Corp.(b) |
|
| | 1,750,000 | | | | 7.625 | | | | 05/01/21 | | | | 1,715,000 | |
| | |
| | | | | | | | | | | | | | |
| | Corporate Obligations – (continued) | |
| | Energy – Exploration & Production – (continued) | |
| Newfield Exploration Co. | |
| $ | 1,000,000 | | | | 5.625 | % | | | 07/01/24 | | | $ | 1,062,500 | |
| | 450,000 | | | | 5.375 | (b) | | | 01/01/26 | | | | 466,875 | |
| Oasis Petroleum, Inc.(b) | |
| | 2,750,000 | | | | 6.875 | | | | 03/15/22 | | | | 2,805,000 | |
| Parsley Energy LLC/Parsley Finance Corp.(a)(b) | |
| | 1,850,000 | | | | 7.500 | | | | 02/15/22 | | | | 1,928,625 | |
| Penn Virginia Corp.(b) | |
| | 2,300,000 | | | | 8.500 | | | | 05/01/20 | | | | 2,248,250 | |
| Rice Energy, Inc.(b) | |
| | 1,850,000 | | | | 6.250 | | | | 05/01/22 | | | | 1,868,500 | |
| Rosetta Resources, Inc.(b) | |
| | 2,750,000 | | | | 5.875 | | | | 06/01/24 | | | | 2,739,687 | |
| Sanchez Energy Corp.(b) | |
| | 1,650,000 | | | | 7.750 | | | | 06/15/21 | | | | 1,722,188 | |
| Seven Generations Energy Ltd.(a)(b) | |
| | 1,750,000 | | | | 8.250 | | | | 05/15/20 | | | | 1,868,825 | |
| | 450,000 | | | | 6.750 | | | | 05/01/23 | | | | 456,278 | |
| SM Energy Co.(b) | |
| | 2,950,000 | | | | 6.500 | | | | 11/15/21 | | | | 3,068,000 | |
| Vanguard Natural Resourses LLC/VNR Finance Corp.(b) | |
| | 1,650,000 | | | | 7.875 | | | | 04/01/20 | | | | 1,637,625 | |
| Whiting Petroleum Corp.(b) | |
| | 1,850,000 | | | | 5.750 | | | | 03/15/21 | | | | 1,891,625 | |
| | 550,000 | | | | 6.250 | (a) | | | 04/01/23 | | | | 568,563 | |
| WPX Energy, Inc.(b) | |
| | 1,150,000 | | | | 6.000 | | | | 01/15/22 | | | | 1,132,750 | |
| | | | | | | | | | | | | | |
| | | | | | | | | | | | | 73,630,035 | |
| | |
| | Energy – Services – 0.2% | |
| Atwood Oceanics, Inc.(b) | |
| | 2,300,000 | | | | 6.500 | | | | 02/01/20 | | | | 2,242,500 | |
| CVR Refining LLC/Coffeyville Finance, Inc.(b) | |
| | 1,200,000 | | | | 6.500 | | | | 11/01/22 | | | | 1,212,000 | |
| Forum Energy Technologies, Inc.(b) | |
| | 872,000 | | | | 6.250 | | | | 10/01/21 | | | | 828,400 | |
| FTS International, Inc.(a)(b) | |
| | 850,000 | | | | 6.250 | | | | 05/01/22 | | | | 680,000 | |
| Transocean, Inc. | | | | | | | | | |
| | 3,350,000 | | | | 6.375 | | | | 12/15/21 | | | | 2,952,187 | |
| | | | | | | | | | | | | | |
| | | | | | | | | | | | | 7,915,087 | |
| | |
| | Pipelines(b) – 0.2% | |
| Sabine Pass Liquefaction LLC | |
| | 4,300,000 | | | | 5.625 | | | | 04/15/23 | | | | 4,364,500 | |
| Targa Resources Partners LP/Targa Resources Partners Finance
Corp. |
|
| | 3,100,000 | | | | 5.250 | | | | 05/01/23 | | | | 3,138,750 | |
| | | | | | | | | | | | | | |
| | | | | | | | | | | | | 7,503,250 | |
| | |
| | TOTAL CORPORATE OBLIGATIONS | |
| | (Cost $89,258,784) | | | | | | | $ | 90,916,310 | |
| | |
| | |
| The accompanying notes are an integral part of these financial statements. | | 9 |
GOLDMAN SACHS TACTICAL TILT IMPLEMENTATION FUND
Schedule of Investments (continued)
April 30, 2015 (Unaudited)
| | | | | | | | | | | | | | |
Principal Amount | | | Interest Rate | | | Maturity Date | | | Value | |
| | | | | | | | | | | | | | |
| | Senior Term Loans(c) – 0.1% | |
| | Energy – 0.1% | | | | | | | | | |
| American Energy – Marcellus LLC | |
| $ | 2,275,000 | | | | 8.500 | % | | | 08/04/21 | | | $ | 1,639,433 | |
| CITGO Holding, Inc. | |
| | 1,247,500 | | | | 9.500 | | | | 05/12/18 | | | | 1,256,856 | |
| Magnum Hunter Resources Corp. | |
| | 1,197,494 | | | | 8.500 | | | | 10/22/19 | | | | 1,191,507 | |
| | |
| | TOTAL SENIOR TERM LOANS | |
| | (Cost $4,171,885) | | | | | | | $ | 4,087,796 | |
| | |
| | | | | | | | |
| Shares | | | Description | | Value | |
| | | | | | | | |
| | Exchange Traded Funds – 11.1% | |
| | 10,185,442 | | | iShares MSCI Taiwan ETF | | $ | 167,448,666 | |
| | 6,169,648 | | | SPDR S&P Bank ETF | | | 209,212,764 | |
| | |
| | TOTAL EXCHANGE TRADED FUNDS | | | | |
| | (Cost $358,633,073) | | $ | 376,661,430 | |
| | |
| | | | | | | | |
| Shares | | Rate | | | Value | |
| | | | | | | | |
| Investment Companies(d) – 78.8% | |
Goldman Sachs Financial Square Government Fund – FST Shares | |
| 1,254,034,944 | | | 0.006 | % | | $ | 1,254,034,944 | |
| Goldman Sachs High Yield Floating Rate Fund – Institutional Shares | |
| 56,604,755 | | | 0.001 | % | | | 564,915,456 | |
| Goldman Sachs High Yield Fund – Institutional Shares | |
| 121,853,044 | | | 0.001 | % | | | 837,130,413 | |
| |
| TOTAL INVESTMENT COMPANIES | |
| (Cost $2,660,235,729) | | | $ | 2,656,080,813 | |
| |
| | | | | | | | |
| Shares | | | Description | | Value | |
| | | | | | | | |
| | Common Stock* – 0.1% | |
| | Oil, Gas & Consumable Fuels – 0.1% | |
| | 1,304,945 | | | Halcon Resources Corp. | | | | |
| | (Cost $1,785,470) | | $ | 1,944,368 | |
| | |
| | | | | | | | | | | | | | |
| Contracts | | | Exercise Rate | | | Expiration Date | | | Value | |
| | | | | | | | | | | | | | |
| | Options Purchased – 0.3% | |
| | Options on Equities | | | | | | | | | |
| Citibank NA Call – Topix Index Strike Price 1,575.67 | |
| | 13,340,978 | | | | 1,575.670 | % | | | 09/11/15 | | | | | |
| | (Cost $8,414,964) | | | $ | 9,250,123 | |
| | |
| | TOTAL INVESTMENTS – 93.1% | | | | | |
| | (Cost $3,122,499,905) | | | | | | | $ | 3,138,940,840 | |
| | |
| OTHER ASSETS IN EXCESS OF
LIABILITIES – 6.9% |
| | | 232,329,461 | |
| | |
| | NET ASSETS – 100.0% | | | $ | 3,371,270,301 | |
| | |
| | | | | | |
| The percentage shown for each investment category reflects the value of investments in that category as a percentage of net assets. |
* | | Non-income producing security. |
(a) | | Exempt from registration under Rule 144A of the Securities Act of 1933. Under procedures approved by the Board of Trustees, such securities have been determined to be liquid by the investment adviser and may be resold, normally to qualified institutional buyers in transactions exempt from registration. Total market value of Rule 144A securities amounts to $18,316,665, which represents approximately 0.5% of net assets as of April 30, 2015. |
(b) | | Security with “Call” features with resetting interest rates. Maturity dates disclosed are the final maturity dates. |
(c) | | Senior Term Loans often require prepayments from excess cash flows or permit the borrower to repay at its election. The degree to which borrowers repay, whether as a contractual requirement or at their election, cannot be predicted with accuracy. As a result, the actual remaining maturity may be substantially less than the stated maturities shown. The stated interest rate represents the weighted average interest rate of all contracts within the senior loan facility on April 30, 2015. Senior Term Loans typically have rates of interest which are predetermined either daily, monthly, quarterly or semi-annually by reference to a base lending rate, plus a premium. These base lending rates are primarily the London-Interbank Offered Rate (“LIBOR”), and secondarily the prime rate offered by one or more major United States banks (the “Prime Rate”) and the certificate of deposit (“CD”) rate or other base lending rates used by commercial lenders. |
(d) | | Represents Affiliated Funds. |
| | |
|
Currency Abbreviations: |
AUD | | —Australian Dollar |
CHF | | —Swiss Franc |
DKK | | —Danish Krone |
EUR | | —Euro |
GBP | | —British Pound |
HKD | | —Hong Kong Dollar |
ILS | | —Israeli Shekel |
INR | | —Indian Rupee |
JPY | | —Japanese Yen |
NOK | | —Norwegian Krone |
NZD | | —New Zealand Dollar |
SEK | | —Swedish Krona |
SGD | | —Singapore Dollar |
USD | | —U.S. Dollar |
| | |
Investment Abbreviations: |
ETF | | —Exchange Traded Fund |
LLC | | —Limited Liability Company |
LP | | —Limited Partnership |
|
| | |
| 10 | | The accompanying notes are an integral part of these financial statements. |
GOLDMAN SACHS TACTICAL TILT IMPLEMENTATION FUND
|
| ADDITIONAL INVESTMENT INFORMATION |
FORWARD FOREIGN CURRENCY EXCHANGE CONTRACTS — At April 30, 2015, the Fund had the following forward foreign currency exchange contracts:
FORWARD FOREIGN CURRENCY EXCHANGE CONTRACTS WITH UNREALIZED GAIN
| | | | | | | | | | | | | | |
| | |
| Counterparty | | Contracts to
Buy/Sell | | Settlement Date | | | Current Value | | | Unrealized Gain | |
Morgan Stanley & Co. International PLC | | AUD/USD | | | 06/17/15 | | | $ | 12,848,463 | | | $ | 470,263 | |
| | CHF/USD | | | 06/17/15 | | | | 16,707,858 | | | | 1,206,160 | |
| | DKK/USD | | | 06/17/15 | | | | 2,812,564 | | | | 155,935 | |
| | EUR/USD | | | 06/17/15 | | | | 135,478,926 | | | | 5,664,601 | |
| | GBP/USD | | | 06/17/15 | | | | 35,101,188 | | | | 1,181,680 | |
| | HKD/USD | | | 06/17/15 | | | | 40,528,725 | | | | 31,335 | |
| | ILS/USD | | | 06/17/15 | | | | 1,004,922 | | | | 36,841 | |
| | JPY/USD | | | 06/17/15 | | | | 30,024,485 | | | | 472,410 | |
| | NOK/USD | | | 06/17/15 | | | | 1,153,839 | | | | 103,219 | |
| | NZD/USD | | | 06/17/15 | | | | 265,872 | | | | 9,650 | |
| | SEK/USD | | | 06/17/15 | | | | 5,504,174 | | | | 196,882 | |
| | SGD/USD | | | 06/17/15 | | | | 2,514,376 | | | | 122,896 | |
| | | USD/JPY | | | 06/17/15 | | | | 13,583,503 | | | | 42,232 | |
| TOTAL | | | $ | 9,694,104 | |
FORWARD FOREIGN CURRENCY EXCHANGE CONTRACTS WITH UNREALIZED LOSS
| | | | | | | | | | | | | | |
| Counterparty | | Contracts to
Buy/Sell | | Settlement Date | | | Current Value | | | Unrealized Loss | |
Morgan Stanley & Co. International PLC | | INR/USD | | | 06/17/15 | | | $ | 206,526,485 | | | $ | (3,985,269 | ) |
| | USD/AUD | | | 06/17/15 | | | | 223,987,857 | | | | (6,411,589 | ) |
| | USD/CHF | | | 06/17/15 | | | | 16,707,858 | | | | (840,455 | ) |
| | USD/DKK | | | 06/17/15 | | | | 2,812,564 | | | | (79,426 | ) |
| | USD/EUR | | | 06/17/15 | | | | 565,746,421 | | | | (19,654,348 | ) |
| | USD/GBP | | | 06/17/15 | | | | 35,101,188 | | | | (632,365 | ) |
| | USD/HKD | | | 06/17/15 | | | | 5,302,848 | | | | (4,136 | ) |
| | USD/ILS | | | 06/17/15 | | | | 1,004,922 | | | | (32,932 | ) |
| | USD/JPY | | | 06/17/15 | | | | 744,826,025 | | | | (7,994,498 | ) |
| | USD/NOK | | | 06/17/15 | | | | 1,153,840 | | | | (53,417 | ) |
| | USD/NZD | | | 06/17/15 | | | | 265,872 | | | | (9,805 | ) |
| | USD/SEK | | | 06/17/15 | | | | 5,504,174 | | | | (94,029 | ) |
| | | USD/SGD | | | 06/17/15 | | | | 2,514,375 | | | | (92,267 | ) |
| TOTAL | | | $ | (39,884,536 | ) |
FUTURES CONTRACTS — At April 30, 2015, the Fund had the following futures contracts:
| | | | | | | | | | | | | | |
| Type | | Number of
Contracts
Long (Short) | | | Expiration Date | | Current Value | | | Unrealized Gain (Loss) | |
H-Shares Index | | | 453 | | | May 2015 | | $ | 42,277,974 | | | $ | (472,799 | ) |
IBEX 35 Index | | | 3,367 | | | May 2015 | | | 429,268,483 | | | | (12,732,612 | ) |
Mini MSCI Emerging Market | | | (3,952 | ) | | June 2015 | | | (205,247,120 | ) | | | (16,067,130 | ) |
Topix Index | | | 1,532 | | | June 2015 | | | 203,817,588 | | | | 7,627,224 | |
| TOTAL | | | $ | (21,645,317 | ) |
| | |
| The accompanying notes are an integral part of these financial statements. | | 11 |
GOLDMAN SACHS TACTICAL TILT IMPLEMENTATION FUND
Schedule of Investments (continued)
April 30, 2015 (Unaudited)
|
| ADDITIONAL INVESTMENT INFORMATION (continued) |
WRITTEN OPTIONS CONTRACTS — At April 30, 2015, the Fund had the following written options:
OPTIONS ON EQUITIES CONTRACTS
| | | | | | | | | | | | | | | | | | |
| Counterparty | | Description | | Contracts | | | Expiration
Date | | | Strike
Price | | | Value | |
Bank of America Securities LLC | | Put - SPDR Energy Select Sector ETF | | | 250,000 | | | | 01/15/16 | | | | 71.865 | % | | $ | (542,529 | ) |
Barclays Bank PLC | | Put - SPDR S&P Bank ETF | | | 1,133,800 | | | | 09/18/15 | | | | 33.510 | | | | (1,471,379 | ) |
Citibank NA | | Put - FTSE/MIB Index | | | 736 | | | | 06/19/15 | | | | 21,500 | | | | (805,757 | ) |
| | Call - Topix Index | | | 13,340,978 | | | | 09/11/15 | | | | 1,733.240 | | | | (2,703,711 | ) |
| | Put - SPDR S&P Bank ETF | | | 4,084,017 | | | | 09/18/15 | | | | 31.485 | | | | (2,648,910 | ) |
| | Put - SPDR Energy Select Sector ETF | | | 1,481,395 | | | | 01/15/16 | | | | 66.125 | | | | (1,814,901 | ) |
Deutsche Bank AG | | Put - SPDR Energy Select Sector ETF | | | 350,000 | | | | 01/15/16 | | | | 71.289 | | | | (718,066 | ) |
| | Put - SPDR Energy Select Sector ETF | | | 375,000 | | | | 01/15/16 | | | | 69.820 | | | | (665,856 | ) |
Morgan Stanley & Co. International PLC | | Put - FTSE/MIB Index | | | 668 | | | | 06/19/15 | | | | 19,000 | | | | (133,136 | ) |
| | Put - FTSE/MIB Index | | | 166 | | | | 06/19/15 | | | | 19,500 | | | | (46,132 | ) |
| | Put - FTSE/MIB Index | | | 1,427 | | | | 06/19/15 | | | | 17,500 | | | | (108,156 | ) |
| | | Put - SPDR S&P Bank ETF | | | 450,000 | | | | 09/18/15 | | | | 33.300 | | | | (544,540 | ) |
| TOTAL (Premium Received $33,319,448) | | | 21,468,187 | | | | | | | | | | | $ | (12,203,073 | ) |
WRITTEN OPTIONS CONTRACTS — For the period ended April 30, 2015, the Fund had the following written options activity:
OPTIONS ON EQUITY CONTRACTS
| | | | | | | | |
| | | Contracts | | | Premiums
Received | |
Contracts Outstanding October 31, 2014 | | | 1,086 | | | $ | 3,510,010 | |
Contracts Written | | | 21,467,101 | | | | 29,809,438 | |
Contracts Outstanding April 30, 2015 | | | 21,468,187 | | | $ | 33,319,448 | |
| | |
| 12 | | The accompanying notes are an integral part of these financial statements. |
GOLDMAN SACHS TACTICAL TILT IMPLEMENTATION FUND
Consolidated Statement of Assets and Liabilities(a)
April 30, 2015 (Unaudited)
| | | | | | |
| | | | | | |
| | Assets: | | | | |
| | Investments of unaffiliated issuers, at value (cost $462,264,176) | | $ | 482,860,027 | |
| | Investments of affiliated issuers, at value ($2,660,235,729) | | | 2,656,080,813 | |
| | Cash | | | 128,389,828 | |
| | Foreign currencies, at value (cost $1,732,039) | | | 1,805,066 | |
| | Unrealized gain on forward foreign currency exchange contracts | | | 9,694,104 | |
| | Receivables: | | | | |
| | Collateral on certain derivative contracts(b) | | | 107,115,762 | |
| | Fund shares sold | | | 42,221,177 | |
| | Dividends and interest | | | 7,274,927 | |
| | Deferred offering costs | | | 37,073 | |
| | Reimbursement from investment adviser | | | 28,502 | |
| | Total assets | | | 3,435,507,279 | |
| | | | | | |
| | Liabilities: | | | | |
| | Written option contracts, at value (premium received $33,319,448) | | | 12,203,073 | |
| | Unrealized loss on forward foreign currency exchange contracts | | | 39,884,536 | |
| | Variation margin on certain derivative contracts | | | 1,628,222 | |
| | Payables: | | | | |
| | Investments purchased | | | 5,426,786 | |
| | Collateral on certain derivative contracts(c) | | | 2,650,938 | |
| | Management fees | | | 1,106,985 | |
| | Investments purchased on an extended — settlement basis | | | 831,000 | |
| | Fund shares redeemed | | | 275,400 | |
| | Distribution and Service fees and Transfer Agent fees | | | 105,915 | |
| | Payable for offering costs | | | 62,000 | |
| | Accrued expenses and other liabilities | | | 62,123 | |
| | Total liabilities | | | 64,236,978 | |
| | | | | | |
| | Net Assets: | | | | |
| | Paid-in capital | | | 3,245,434,273 | |
| | Undistributed net investment income | | | 3,306,307 | |
| | Accumulated net realized gain | | | 136,735,134 | |
| | Net unrealized loss | | | (14,205,413 | ) |
| | NET ASSETS | | $ | 3,371,270,301 | |
| | Shares Outstanding $0.001 par value (unlimited shares authorized): | | | 321,950,942 | |
| | Net asset value, offering and redemption price per share: | | | $10.47 | |
| | (a) | | Statement of Assets and Liabilities for the Fund is consolidated and includes the balances of a wholly owned subsidiary, Goldman Sachs Cayman Commodity TTIF Fund Ltd. Accordingly, all interfund balances and transactions have been eliminated. |
| | (b) | | Includes amounts segregated for initial margin requirements and/or collateral on futures, options and forward foreign currency transactions of $51,270,000, $24,374,824 and $31,220,000, respectively. |
| | (c) | | Represents restricted cash relating to initial margin on options transactions. |
| | |
| The accompanying notes are an integral part of these financial statements. | | 13 |
GOLDMAN SACHS TACTICAL TILT IMPLEMENTATION FUND
Consolidated Statement of Operations(a)
For the Six Months Ended April 30, 2015 (Unaudited)
| | | | | | |
| | | | | | |
| | Investment income: | |
| | Dividends — affiliated issuers | | $ | 24,020,590 | |
| | Dividends — unaffiliated issuers | | | 1,745,697 | |
| | Interest | | | 975,597 | |
| | Total investment income | | | 26,741,884 | |
| | | | | | |
| | Expenses: | |
| | Management fees | | | 8,335,207 | |
| | Transfer Agent fees | | | 451,587 | |
| | Professional fees | | | 86,569 | |
| | Custody, accounting and administrative services | | | 80,752 | |
| | Amortization of offering costs | | | 74,549 | |
| | Printing and mailing costs | | | 27,643 | |
| | Trustee fees | | | 13,963 | |
| | Other | | | 22,299 | |
| | Total expenses | | | 9,092,569 | |
| | Less — expense reductions | | | (3,493,202 | ) |
| | Net expenses | | | 5,599,367 | |
| | NET INVESTMENT INCOME | | | 21,142,517 | |
| | | | | | |
| | Realized and unrealized gain (loss): | |
| | Capital gain distributions from Affiliated Underlying Funds | | | 8,648,766 | |
| | Net realized gain (loss) from: | | | | |
| | Investments — unaffiliated issuers | | | (19,993,733 | ) |
| | Investments — affiliated issuers | | | (734,242 | ) |
| | Futures contracts | | | 57,404,585 | |
| | Forward foreign currency exchange contracts | | | 111,092,460 | |
| | Foreign currency transactions | | | (160,286 | ) |
| | Net change in unrealized gain (loss) on: | | | | |
| | Investments — unaffiliated issuers | | | 32,809,961 | |
| | Investments — affiliated issuers | | | (5,163,924 | ) |
| | Futures contracts | | | (27,552,683 | ) |
| | Written options | | | 21,660,518 | |
| | Forward foreign currency exchange contracts | | | (40,096,147 | ) |
| | Foreign currency translation | | | 91,845 | |
| | Net realized and unrealized gain | | | 138,007,120 | |
| | NET INCREASE IN NET ASSETS RESULTING FROM OPERATIONS | | $ | 159,149,637 | |
| | (a) | | Statement of Operations for the Fund is consolidated and includes the balances of a wholly owned subsidiary, Goldman Sachs Cayman Commodity TTIF Fund Ltd. Accordingly, all interfund balances and transactions have been eliminated. |
| | |
| 14 | | The accompanying notes are an integral part of these financial statements. |
GOLDMAN SACHS TACTICAL TILT IMPLEMENTATION FUND
Consolidated Statements of Changes in Net Assets(a)
| | | | | | | | | | |
| | | | | For the
Six Months Ended
April 30, 2015
(Unaudited) | | | For the Fiscal
Year Ended
October 31, 2014(b) | |
| | From operations: | | | | | | | | |
| | Net investment income | | $ | 21,142,517 | | | $ | 4,457,148 | |
| | Net realized gain (loss) | | | 156,257,550 | | | | (20,730,489 | ) |
| | Net change in unrealized gain (loss) | | | (18,250,430 | ) | | | 4,045,017 | |
| | Net increase (decrease) in net assets resulting from operations | | | 159,149,637 | | | | (12,228,324 | ) |
| | | | | | | | | | |
| | Distributions to shareholders: | | | | | | | | |
| | From net investment income | | | (21,152,095 | ) | | | — | |
| | | | | | | | | | |
| | From share transactions: | | | | | | | | |
| | Proceeds from sales of shares | | | 1,777,993,480 | | | | 1,539,888,063 | |
| | Reinvestment of distributions | | | 21,045,722 | | | | — | |
| | Cost of shares redeemed | | | (88,317,392 | ) | | | (5,108,790 | ) |
| | Net increase in net assets resulting from share transactions | | | 1,710,721,810 | | | | 1,534,779,273 | |
| | TOTAL INCREASE | | | 1,848,719,352 | | | | 1,522,550,949 | |
| | | | | | | | | | |
| | Net assets: | | | | | | | | |
| | Beginning of period | | | 1,522,550,949 | | | | — | |
| | End of period | | $ | 3,371,270,301 | | | $ | 1,522,550,949 | |
| | Undistributed net investment income | | $ | 3,306,307 | | | $ | 3,315,885 | |
| | (a) | | Statement of Changes for the Fund is consolidated and includes the balances of a wholly owned subsidiary, Goldman Sachs Cayman Commodity TTIF Fund Ltd. Accordingly, all interfund balances and transactions have been eliminated. |
| | (b) | | Commenced operations on July 31, 2014 |
| | |
| The accompanying notes are an integral part of these financial statements. | | 15 |
GOLDMAN SACHS TACTICAL TILT IMPLEMENTATION FUND
Financial Highlights
Selected Data for a Share Outstanding Throughout Each Period
| | | | | | | | | | | | | | | | | | | | | | |
| | | | | | | | Income (loss) from
Investment Operations | | | | |
| | | Year - Share Class | | Net asset
value,
beginning
of period | | | Net
investment
income(a) | | | Net realized
and unrealized
gain (loss) | | | Total from
investment
operations | | | Distribution
to shareholders from net
investment
income | |
| | FOR THE SIX MONTHS ENDED APRIL 30, (UNAUDITED) | |
| | 2015 - Institutional | | $ | 9.87 | | | $ | 0.09 | | | $ | 0.62 | | | $ | 0.71 | | | $ | (0.11 | ) |
| | | | | | | | | | | | | | | | | | | | | | |
| | FOR THE PERIOD ENDED OCTOBER 31, | |
| | 2014 - Institutional (Commenced operations July 31, 2014) | | | 10.00 | | | | 0.04 | | | | (0.17 | ) | | | (0.13 | ) | | | — | |
| | (a) | | Calculated based on the average shares outstanding methodology. |
| | (b) | | Assumes investment at the net asset value at the beginning of the period, reinvestment of all dividends and distributions, a complete redemption of the investment at the net asset value at the end of the period and no sales or redemption charges. Total returns would be reduced if a sales or redemption charge was taken into account. Returns do not reflect the deduction of taxes that a shareholder would pay on Fund distributions or the redemption of Fund shares. Total returns for periods less than one full year are not annualized. |
| | (d) | | The Fund’s portfolio turnover rate is calculated in accordance with regulatory requirements, without regard to transactions involving short term investments and certain derivatives. If such transactions were included, the Fund’s portfolio turnover rate may be higher. |
| | |
| 16 | | The accompanying notes are an integral part of these financial statements. |
GOLDMAN SACHS TACTICAL TILT IMPLEMENTATION FUND
| | | | | | | | | | | | | | | | | | | | | | | | | | | | | | | | | | | | | | | | |
| | | | | | | | | | | | | | | | | | | | | | | | | | | | | | | | | | |
| | | Net asset
value, end
of period | | | | | Total
return(b) | | | | | Net assets,
end of
period
(in 000s) | | | | | Ratio of
net expenses
to average
net assets(c) | | | | | Ratio of
total expenses
to average
net assets(c) | | | | | Ratio of
net investment
income
to average
net assets(c) | | | | | Portfolio
turnover
rate(d) | |
| | | | | | | | | | | | | | | | | | | | | | | | | | | | | | | | | | | | | | | | |
| | $ | 10.47 | | | | | | 7.29 | % | | | | $ | 3,371,270 | | | | | | 0.50 | % | | | | | 0.80 | % | | | | | 1.87 | % | | | | | 20 | % |
| | | | | | | | | | | | | | | | | | | | | | | | | | | | | | | | | | | | | | | | |
| | | | | | | | | | | | | | | | | | | | | | | | | | | | | | | | | | | | | | | | |
| | | 9.87 | | | | | | (1.30 | ) | | | | | 1,522,551 | | | | | | 0.63 | | | | | | 0.86 | | | | | | 1.63 | | | | | | 45 | |
| | |
| The accompanying notes are an integral part of these financial statements. | | 17 |
GOLDMAN SACHS TACTICAL TILT IMPLEMENTATION FUND
Notes to Financial Statements
April 30, 2015 (Unaudited)
Goldman Sachs Trust (the “Trust”) is a Delaware statutory trust registered under the Investment Company Act of 1940, as amended (the “Act”), as an open-end management investment company. Goldman Sachs Tactical Tilt Implementation Fund (the “Portfolio”) is a non-diversified fund and currently offers one class of shares — Institutional Shares. The Portfolio commenced operations on July 31, 2014. Goldman Sachs Asset Management, L.P. (“GSAM”), an affiliate of Goldman, Sachs & Co. (“Goldman Sachs”), serves as investment adviser to the Portfolio pursuant to a management agreement (the “Agreement”) with the Trust.
|
| 2. SIGNIFICANT ACCOUNTING POLICIES |
The financial statements have been prepared in accordance with accounting principles generally accepted in the United States of America (“GAAP”) and require management to make estimates and assumptions that may affect the reported amounts and disclosures. Actual results may differ from those estimates and assumptions.
A. Basis of Consolidation for the Goldman Sachs Tactical Tilt Implementation Fund — The Goldman Sachs Cayman Commodity TTIF Fund Ltd. (the “Subsidiary”), a Cayman Islands exempted company, was incorporated on July 31, 2014 and is currently a wholly-owned subsidiary of the Tactical Tilt Implementation Fund. The Subsidiary acts as an investment vehicle for the Fund to enable the Fund to gain exposure to certain types of commodity-linked derivative instruments. The Fund is the sole shareholder of the Subsidiary pursuant to a subscription agreement dated as of July 31, 2014, and it is intended that the Fund will remain the sole shareholder and will continue to control the Subsidiary. Under the Articles of Association of the Subsidiary, shares issued by the Subsidiary confer upon a shareholder the right to vote at general meetings of the Subsidiary and certain rights in connection with any winding-up or repayment of capital, as well as the right to participate in the profits or assets of the Subsidiary. All inter-fund balances and transactions have been eliminated in consolidation. As of April 30, 2015, the Fund’s net assets were $3,371,270,301, of which, $51,868,786, or 1.5%, represented the Subsidiary’s net assets.
B. Investment Valuation — The Fund’s valuation policy is to value investments at fair value.
C. Investment Income and Investments — Investment income includes interest income and dividend income, net of any foreign withholding taxes, less any amounts reclaimable. Interest income is accrued daily and adjusted for amortization of premiums and accretion of discounts. Dividend income is recognized on ex-dividend date or, for certain foreign securities, as soon as such information is obtained subsequent to the ex-dividend date. Investment transactions are reflected on trade date. Realized gains and losses are calculated using identified cost. Investment transactions are recorded on the following business day for daily net asset value (“NAV”) calculations. Any foreign capital gains tax is accrued daily based upon net unrealized gains, and is payable upon sale of such investments. For derivative contracts, realized gains and losses are recorded upon settlement of the contract.
D. Expenses — Expenses incurred directly by the Fund are charged to the Fund, and certain expenses incurred by the Trust that may not solely relate to the Fund are allocated to the Fund and the other funds of the Trust on a straight-line and/or pro-rata basis depending upon the nature of the expenses and are accrued daily.
E. Offering Costs — Offering costs paid in connection with the offering of shares of the Portfolio are being amortized on a straight-line basis over 12 months from the date of commencement of operations.
F. Federal Taxes and Distributions to Shareholders — It is the Fund’s policy to comply with the requirements of the Internal Revenue Code of 1986, as amended (the “Code”), applicable to regulated investment companies (mutual funds) and to distribute each year substantially all of its investment company taxable income and capital gains to its shareholders. Accordingly, the Fund is not required to make any provisions for the payment of federal income tax. Distributions to shareholders are recorded on the ex-dividend date. Distributions from net investment income and distributions from net capital gains, if any, are declared and paid annually.
18
GOLDMAN SACHS TACTICAL TILT IMPLEMENTATION FUND
|
| 2. SIGNIFICANT ACCOUNTING POLICIES (continued) |
The Subsidiary is classified as a controlled foreign corporation under the Code. Therefore, the Tactical Tilt Implementation Fund is required to increase its taxable income by its share of the Subsidiary’s income. Net losses of the Subsidiary cannot be deducted by the Fund in the current period nor carried forward to offset taxable income in future periods.
Net capital losses are carried forward to future fiscal years and may be used to the extent allowed by the Code to offset any future capital gains. Losses that are carried forward will retain their character as either short-term or long-term capital losses. Utilization of capital loss carryforwards will reduce the requirement of future capital gains distributions. The characterization of distributions to shareholders for financial reporting purposes is determined in accordance with federal income tax rules, which may differ from GAAP. The source of the Fund’s distributions may be shown in the accompanying financial statements as either from net investment income, net realized gain or capital. Certain components of the Fund’s net assets on the Consolidated Statement of Assets and Liabilities reflect permanent GAAP/tax differences based on the appropriate tax character.
G. Foreign Currency Translation — The accounting records and reporting currency of the Fund is maintained in U.S. dollars. Assets and liabilities denominated in foreign currencies are translated into U.S. dollars using the current exchange rates at the close of each business day. The effect of changes in foreign currency exchange rates on investments is included within net realized and unrealized gain (loss) on investments. Changes in the value of other assets and liabilities as a result of fluctuations in foreign exchange rates are included in the Consolidated Statement of Operations within net change in unrealized gain (loss) on foreign currency transactions. Transactions denominated in foreign currencies are translated into U.S. dollars on the date the transaction occurred, the effects of which are included within net realized gain (loss) on foreign currency transactions.
|
| 3. INVESTMENTS AND FAIR VALUE MEASUREMENTS |
The fair value of a financial instrument is the amount that would be received to sell an asset or paid to transfer a liability in an orderly transaction between market participants at the measurement date (i.e., the exit price). GAAP establishes a fair value hierarchy that prioritizes the inputs to valuation techniques used to measure fair value. The hierarchy gives the highest priority to unadjusted quoted prices in active markets for identical assets or liabilities (Level 1 measurements) and the lowest priority to unobservable inputs (Level 3 measurements). The levels used for classifying investments are not necessarily an indication of the risk associated with investing in these investments. The three levels of the fair value hierarchy are described below:
Level 1 — Unadjusted quoted prices in active markets that are accessible at the measurement date for identical, unrestricted assets or liabilities;
Level 2 — Quoted prices in markets that are not active or financial instruments for which significant inputs are observable (including, but not limited to, quoted prices for similar investments, interest rates, foreign exchange rates, volatility and credit spreads), either directly or indirectly;
Level 3 — Prices or valuations that require significant unobservable inputs (including GSAM’s assumptions in determining fair value measurement).
The Trustees have adopted Valuation Procedures that govern the valuation of the portfolio investments held by the Funds, including investments for which market quotations are not readily available. The Trustees have delegated to GSAM day-to-day responsibility for implementing and maintaining internal controls and procedures related to the valuation of the Funds’ portfolio investments. To assess the continuing appropriateness of pricing sources and methodologies, GSAM regularly performs price verification procedures and issues challenges as necessary to third party pricing vendors or brokers, and any differences are reviewed in accordance with the Valuation Procedures.
A. Level 1 and Level 2 Fair Value Investments — The valuation techniques and significant inputs used in determining the fair values for investments classified as Level 1 and Level 2 are as follows:
Debt Securities — Debt securities for which market quotations are readily available are valued daily on the basis of quotations supplied by dealers or an independent pricing service approved by the Trustees. The pricing services may use valuation models or matrix pricing, which consider: (i) yield or price with respect to bonds that are considered comparable in characteristics such as
19
GOLDMAN SACHS TACTICAL TILT IMPLEMENTATION FUND
Notes to Financial Statements (continued)
April 30, 2015 (Unaudited)
|
| 3. INVESTMENTS AND FAIR VALUE MEASUREMENTS (continued) |
rating, interest rate and maturity date or (ii) quotations from securities dealers to determine current value. Short-term debt obligations that mature in sixty days or less and that do not exhibit signs of credit deterioration are valued at amortized cost, which approximates fair value. With the exception of treasury securities of G8 countries (not held in money market funds), which are generally classified as Level 1, these investments are generally classified as Level 2 of the fair value hierarchy.
i. Senior Term Loans — Senior term loans (“Loans”) are interests in amounts owed by corporate, governmental, or other borrowers to lenders or lending syndicates. Loans are arranged through private negotiations between the borrower and one or more financial institutions (“Lenders”). The Fund’s investments in Loans are in the form of either participations in Loans (“Participations”) or assignments of all or a portion of Loans from third parties (“Assignments”). With respect to Participations, the Fund has the right to receive payments of principal, interest and any fees to which it is entitled from the Lender selling the Participations and only upon receipt by the Lender of the payments from the borrower. The Fund generally has no right to enforce compliance by the borrower with the terms of the loan agreement with respect to Participations. Conversely, Assignments result in the Fund having a direct contractual relationship with the borrower, and the Fund may enforce compliance by the borrower with the terms of the loan agreement.
Equity Securities — Equity securities and investment companies traded on a United States (“U.S.”) securities exchange or the NASDAQ system, or those located on certain foreign exchanges, including but not limited to the Americas, are valued daily at their last sale price or official closing price on the principal exchange or system on which they are traded. If there is no sale or official closing price or it is believed by the investment adviser to not represent fair value, equity securities and exchange traded investment companies are valued at the last bid price for long positions and at the last ask price for short positions. Investments in investment companies (other than those that are exchange traded) are valued at the NAV on the valuation date. To the extent these investments are actively traded, they are classified as Level 1 of the fair value hierarchy, otherwise they are generally classified as Level 2.
Unlisted equity securities for which market quotations are available are valued at the last sale price on the valuation date, or if no sale occurs, at the last bid price. Securities traded on certain foreign securities exchanges are valued daily at fair value determined by an independent fair value service (if available) under Valuation Procedures approved by the Trustees and consistent with applicable regulatory guidance. The independent fair value service takes into account multiple factors including, but not limited to, movements in the securities markets, certain depositary receipts, futures contracts and foreign currency exchange rates that have occurred subsequent to the close of the foreign securities exchange. These investments are generally classified as Level 2 of the fair value hierarchy.
Underlying Funds (Including Money Market Funds) — Investments in the Underlying Funds are valued at the NAV per share of the Institutional Share class (FST for Money Market Funds) of each Underlying Fund on the day of valuation. Since certain underlying funds (exclusive of Money Market Funds) invest primarily in other mutual funds that fluctuate in value, the Funds’ shares will correspondingly fluctuate in value. These investments are generally classified as Level 1 of the fair value hierarchy.
The Underlying Funds may invest in debt securities which, if market quotations are readily available, are valued daily on the basis of quotations supplied by dealers or an independent pricing service approved by the Trustees. The pricing services may use valuation models or matrix pricing, which consider: (i) yield or price with respect to bonds that are considered comparable in characteristics such as rating, interest rate and maturity date or (ii) quotations from securities dealers to determine current value. Short-term debt obligations that mature in sixty days or less and that do not exhibit signs of credit deterioration are valued at amortized cost, which approximates fair value. With the exception of treasury securities of G8 countries (not held in money market funds), which are generally classified as Level 1, these investments are generally classified as Level 2 of the fair value hierarchy.
The Underlying Funds may invest in equity securities and investment companies. Investments in equity securities and investment companies traded on a U.S. securities exchange or the NASDAQ system, or those located on certain foreign exchanges, including but not limited to the Americas, are valued daily at their last sale price or official closing price on the principal exchange or system on which they are traded. If there is no sale or official closing price, or it is believed by the investment adviser to not represent fair value, equity securities and exchange traded investment companies are valued at the last bid price for long positions
20
GOLDMAN SACHS TACTICAL TILT IMPLEMENTATION FUND
|
| 3. INVESTMENTS AND FAIR VALUE MEASUREMENTS (continued) |
and at the last ask price for short positions. Investments in investment companies (other than those that are exchange traded) are valued at the NAV on the valuation date. To the extent these investments are actively traded, they are classified as Level 1 of the fair value hierarchy, otherwise they are generally classified as Level 2.
Unlisted equity securities for which market quotations are available are valued at the last sale price on the valuation date, or if no sale occurs, at the last bid price. Securities traded on certain foreign securities exchanges are valued daily at fair value determined by an independent fair value service (if available) under Valuation Procedures approved by the Trustees and consistent with applicable regulatory guidance. The independent fair value service takes into account multiple factors including, but not limited to, movements in the securities markets, certain depositary receipts, futures contracts and foreign currency exchange rates that have occurred subsequent to the close of the foreign securities exchange. These investments are generally classified as Level 2 of the fair value hierarchy.
Derivative Contracts — A derivative is an instrument whose value is derived from underlying assets, indices, reference rates or a combination of these factors. The Fund enters into derivative transactions to hedge against changes in interest rates, securities prices, and/or currency exchange rates, to increase total return, or to gain access to certain markets or attain exposure to other underliers.
Exchange-traded derivatives, including futures contracts, are valued at the last sale or settlement price and typically fall within Level 1 of the fair value hierarchy. Over-the-counter (“OTC”) and centrally cleared derivatives are valued using market transactions and other market evidence, including market-based inputs to models, calibration to market-clearing transactions, broker or dealer quotations, or other alternative pricing sources. Where models are used, the selection of a particular model to value OTC and centrally cleared derivatives depends upon the contractual terms of, and specific risks inherent in, the instrument, as well as the availability of pricing information in the market. Valuation models require a variety of inputs, including contractual terms, market prices, yield curves, credit curves, measures of volatility, voluntary and involuntary prepayment rates, loss severity rates and correlations of such inputs. For OTC and centrally cleared derivatives that trade in liquid markets, model inputs can generally be verified and model selection does not involve significant management judgment. OTC and centrally cleared derivatives are classified within Level 2 of the fair value hierarchy when significant inputs are corroborated by market evidence.
i. Forward Contracts — A forward contract is a contract between two parties to buy or sell an asset at a specified price on a future date. A forward contract settlement can occur on a cash or delivery basis. Forward contracts are marked-to-market daily using independent vendor prices, and the change in value, if any, is recorded as an unrealized gain or loss.
A forward foreign currency contract is a forward contract in which the Fund agrees to receive or deliver a fixed quantity of one currency for another, at a pre-determined price at a future date. All forward foreign currency exchange contracts are marked-to-market daily at the applicable forward rate. Non-deliverable forward foreign currency exchange contracts are settled with the counterparty in cash without the delivery of foreign currency.
ii. Futures Contracts — Futures contracts are contracts to buy or sell a standardized quantity of a specified commodity or security and are valued based on exchanged settlement prices or independent market quotes. Futures contracts are valued at the last settlement price, or in the absence of a sale, the last bid price for long positions and at the last ask price for short positions, at the end of each day on the board of trade or exchange upon which they are traded. Upon entering into a futures contract, the Fund deposits cash or securities in an account on behalf of the broker in an amount sufficient to meet the initial margin requirement. Subsequent payments are made or received by the Fund equal to the daily change in the contract value and are recorded as variation margin receivable or payable with a corresponding offset to unrealized gains or losses.
iii. Options — When the Fund writes call or put options, an amount equal to the premium received is recorded as a liability and is subsequently marked-to-market to reflect the current value of the option written. Swaptions are options on interest rate swap contracts.
Upon the purchase of a call option or a put option by the Fund, the premium paid is recorded as an investment and subsequently marked-to-market to reflect the current value of the option. Certain options may be purchased with premiums to be determined on a future date. The premiums for these options are based upon implied volatility parameters at specified terms.
21
GOLDMAN SACHS TACTICAL TILT IMPLEMENTATION FUND
Notes to Financial Statements (continued)
April 30, 2015 (Unaudited)
|
| 3. INVESTMENTS AND FAIR VALUE MEASUREMENTS (continued) |
Short Term Investments — Short-term investments having a maturity of 60 days or less are generally valued at amortized cost which approximates fair market value. These investments are classified as Level 2 of the fair value hierarchy.
i. Repurchase Agreements — Repurchase agreements involve the purchase of securities subject to the seller’s agreement to repurchase the securities at a mutually agreed upon date and price, under the terms of a Master Repurchase Agreement (“MRA”). During the term of a repurchase agreement, the value of the underlying securities held as collateral on behalf of the Fund, including accrued interest, is required to exceed the value of the repurchase agreement, including accrued interest. The gross value of repurchase agreements is included in the Consolidated Statements of Assets and Liabilities for financial reporting purposes. The underlying securities for all repurchase agreements are held at the Fund’s custodian or designated sub-custodians under tri-party repurchase agreements.
An MRA governs transactions between the Fund and select counterparties. An MRA contains provisions for, among other things, initiation, income payments, events of default and maintenance of securities for repurchase agreements. An MRA also permits offsetting with collateral to create one single net payment in the event of default or similar events, including the bankruptcy or insolvency of a counterparty.
If the seller defaults, the Fund could suffer a loss to the extent that the proceeds from the sale of the underlying securities and other collateral held by the Fund are less than the repurchase price and the Fund’s costs associated with delay and enforcement of the repurchase agreement. In addition, in the event of default or insolvency of the seller, a court could determine that the Fund’s interest in the collateral is not enforceable, resulting in additional losses to the Fund.
Pursuant to exemptive relief granted by the Securities and Exchange Commission (“SEC”) and terms and conditions contained therein, the Fund, together with other funds of the Trust and registered investment companies having management agreements with GSAM or its affiliates, may transfer uninvested cash into joint accounts, the daily aggregate balance of which is invested in one or more repurchase agreements. Under these joint accounts, the Fund maintains pro-rata credit exposure to the underlying repurchase agreements’ counterparties. With the exception of certain transaction fees, the Fund is not subject to any expenses in relation to these investments.
B. Level 3 Fair Value Investments — To the extent that significant inputs to valuation models and other alternative pricing sources are unobservable, or if quotations are not readily available, or if GSAM believes that such quotations do not accurately reflect fair value, the fair value of the Fund’s investments may be determined under Valuation Procedures approved by the Trustees. GSAM, consistent with its procedures and applicable regulatory guidance, may make an adjustment to the most recent valuation prices of either domestic or foreign securities in light of significant events to reflect what it believes to be the fair value of the securities at the time of determining the Fund’s NAV. Significant events which could affect a large number of securities in a particular market may include, but are not limited to: significant fluctuations in U.S. or foreign markets; market dislocations; market disruptions; or unscheduled market closings. Significant events which could also affect a single issuer may include, but are not limited to: corporate actions such as reorganizations, mergers and buy-outs; ratings downgrades; and bankruptcies. To the extent investments are valued using single source broker quotations obtained directly from the broker or passed through from third party pricing vendors, such investments are classified as Level 3 investments.
GSAM did not develop the unobservable inputs (examples include but are not limited to single source broker quotations, third party pricing, etc.) for the valuation of Level 3 Assets and Liabilities.
22
GOLDMAN SACHS TACTICAL TILT IMPLEMENTATION FUND
|
| 3. INVESTMENTS AND FAIR VALUE MEASUREMENTS (continued) |
C. Fair Value Hierarchy — The following is a summary of the Fund’s investments and derivatives classified in the fair value hierarchy as of April 30, 2015:
| | | | | | | | | | | | |
| | | |
| Investment Type | | Level 1 | | | Level 2 | | | Level 3 | |
| Assets | | | | | | | | | | | | |
Common Stock and/or Other Equity Investments(a) | | | | | | | | | | | | |
North America | | $ | 1,944,368 | | | $ | — | | | $ | — | |
Fixed Income | | | | | | | | | | | | |
Corporate Obligations | | | — | | | | 90,916,310 | | | | — | |
Senior Term Loans | | | — | | | | 4,087,796 | | | | — | |
Exchange Traded Funds | | | 376,661,430 | | | | — | | | | — | |
Investment Companies | | | 2,656,080,813 | | | | — | | | | — | |
| Total | | $ | 3,034,686,611 | | | $ | 95,004,106 | | | $ | — | |
| | | |
| Derivative Type | | | | | | | | | |
| Assets | | | | | | | | | | | | |
Options Purchased | | $ | — | | | $ | 9,250,123 | | | $ | — | |
Forward Foreign Currency Exchange Contracts(b) | | | — | | | | 9,694,104 | | | | — | |
Futures Contracts(b) | | | 7,627,224 | | | | — | | | | — | |
| Total | | $ | 7,627,224 | | | $ | 18,944,227 | | | $ | — | |
| Liabilities | | | | | | | | | | | | |
Forward Foreign Currency Exchange Contracts(b) | | $ | — | | | $ | (39,884,536 | ) | | $ | — | |
Futures Contracts(b) | | | (29,272,541 | ) | | | — | | | | — | |
Written Options Contracts | | | (287,424 | ) | | | (11,915,649 | ) | | | — | |
| Total | | $ | (29,559,965 | ) | | $ | (51,800,185 | ) | | $ | — | |
| (a) | | Amounts are disclosed by continent to highlight the impact of time zone differences between local market close and the calculation of NAV. Security valuations are based on the principle exchange or system on which they are traded, which may differ from country of domicile. |
| (b) | | Amount shown represents unrealized gain (loss) at period end. |
For further information regarding security characteristics, see the Schedule of Investments.
23
GOLDMAN SACHS TACTICAL TILT IMPLEMENTATION FUND
Notes to Financial Statements (continued)
April 30, 2015 (Unaudited)
|
| 4. INVESTMENTS IN DERIVATIVES |
The following table sets forth, by certain risk types, the gross value of derivative contracts as of April 30, 2015. These instruments were used to meet the Fund’s investment objectives and to obtain and/or manage exposure related to the risks below. The values in the table below exclude the effects of cash collateral received or posted pursuant to these derivative contracts, and therefore are not representative of the Fund’s net exposure.
| | | | | | | | | | | | |
| Risk | | Statement of Assets and Liabilities | | Assets | | | Statement of Assets and Liabilities | | Liabilities | |
Currency | | Receivable for unrealized gain on forward foreign currency exchange contracts | | $ | 9,694,103 | | | Payable for unrealized loss on forward foreign currency exchange contracts | | $ | (39,884,536) | |
Equity | | Variation margin on certain derivative contracts; Investments, at value | | | 16,877,347 | (a) | | Variation margin on certain derivative contracts; Written Options, at value | | | (41,475,614) | |
| Total | | | | $ | 26,571,450 | | | | | $ | (81,360,150) | |
| (a) | | Includes unrealized gain (loss) on futures contracts described in the Additional Investment Information sections of the Consolidated Schedule of Investments. Only current day’s variation margin is reported within the Consolidated Statement of Assets and Liabilities. |
The following table sets forth, by certain risk types, the Fund’s gains (losses) related to these derivatives and their indicative volumes for the six months ended April 30, 2015. These gains (losses) should be considered in the context that these derivative contracts may have been executed to create investment opportunities and/or economically hedge certain investments, and accordingly, certain gains (losses) on such derivative contracts may offset certain (losses) gains attributable to investments. These gains (losses) are included in “Net realized gain (loss)” or “Net change in unrealized gain (loss)” on the Consolidated Statement of Operations:
| | | | | | | | | | | | | | |
| Risk | | Statement of Operations | | Net Realized
Gain (Loss) | | | Unrealized
Gain (Loss) | | | Average
Number of
Contracts(a) | |
| Currency | | Net realized gain (loss) from forward foreign currency exchange contracts/Net
change in unrealized gain (loss) on forward foreign currency exchange contracts | | $ | 111,092,460 | | | $ | (40,096,147 | ) | | | 83 | |
| Equity | | Net realized gain (loss) from investments and futures contracts/Unrealized gain (loss) on investments, futures contracts and written options | | | 78,871,499 | | | | 14,861,105 | | | | 9,096 | |
| Commodity | | Net realized gain (loss) from investments/Unrealized gain (loss) on investments | | | (6,921,092 | ) | | | 88,068 | | | | 3 | |
| Total | | | | $ | 183,042,867 | | | $ | (25,146,974 | ) | | | 9,182 | |
| (a) | | Average number of contracts is based on the average of month end balances for the period ended April 30, 2015. |
In order to better define its contractual rights and to secure rights that will help the Fund mitigate its counterparty risk, the Fund may enter into an International Swaps and Derivatives Association, Inc. Master Agreement (“ISDA Master Agreement”) or similar agreement with its derivatives counterparties. An ISDA Master Agreement is a bilateral agreement between the Fund and a counterparty that governs OTC derivatives, including foreign exchange contracts, and typically contains, among other things, collateral posting terms and netting provisions in the event of a default and/or termination event. The provisions of the ISDA Master Agreement typically permit a single net payment in the event of a default (close-out netting) or similar event, including the bankruptcy or insolvency of the counterparty.
Collateral and margin requirements differ between exchange traded derivatives and OTC derivatives. Margin requirements are established by the broker or clearing house for exchange-traded and centrally cleared derivatives (financial futures contracts, options and centrally cleared swaps) pursuant to governing agreements for those instrument types. Brokers can ask for margin in excess of the minimum in certain circumstances. Collateral terms are contract-specific for OTC derivatives (foreign currency exchange contracts, and certain options and swaps). For derivatives traded under an ISDA Master Agreement, the collateral requirements are typically calculated by netting the marked to market amount for each transaction under such agreement and
24
GOLDMAN SACHS TACTICAL TILT IMPLEMENTATION FUND
|
| 4. INVESTMENTS IN DERIVATIVES (continued) |
comparing that amount to the value of any collateral currently pledged by the Fund and the counterparty. Additionally, the Fund may be required to post initial margin to the counterparty, the terms of which would be outlined in the confirmation of the OTC transaction.
For financial reporting purposes, cash collateral that has been pledged to cover obligations of the Fund and cash collateral received from the counterparty, if any, is reported separately on the Consolidated Statement of Assets and Liabilities as receivables/payables for collateral on certain derivative contracts. Non-cash collateral pledged by the Fund, if any, is noted in the Schedule of Investments. Generally, the amount of collateral due from or to a counterparty must exceed a minimum transfer amount threshold before a transfer is required to be made. To the extent amounts due to the Fund from its counterparties are not fully collateralized, contractually or otherwise, the Fund bears the risk of loss from counterparty nonperformance. The Fund attempts to mitigate counterparty risk by only entering into agreements with counterparties that it believes to be of good standing and by monitoring the financial stability of those counterparties.
Additionally, the netting of assets and liabilities and the offsetting of collateral pledged or received are based on contractual netting/set-off provisions in the ISDA Master Agreement or similar agreements. However, in the event of a default or insolvency of a counterparty, a court could determine that such rights are not enforceable due the restrictions or prohibitions against the right of setoff that may be imposed due to a particular jurisdiction’s bankruptcy or insolvency laws.
The following table sets forth the Fund’s net exposure for derivative instruments that are subject to enforceable master netting arrangements or similar agreements as of April 30, 2015:
| | | | | | | | | | | | | | | | | | | | | | | | | | | | | | | | | | | | |
| | | Derivative Assets(1) | | | Derivative Liabilities(1) | | | | | | | | | | |
| Counterparty | | Options
Purchased | | | Forward
Currency
Contracts | | | Total | | | Forward
Currency
Contracts | | | Options Written | | | Total | | | Net Derivative
Asset
(Liabilities) | | | Collateral
(Received)
Pledged(1) | | | Net
Amount(2) | |
Bank of America Securities LLC | | $ | — | | | $ | — | | | $ | — | | | $ | — | | | $ | (542,529 | ) | | $ | (542,529 | ) | | $ | (542,529 | ) | | $ | 542,529 | | | $ | — | |
Barclays Bank PLC | | | — | | | | — | | | | — | | | | — | | | | (1,471,379 | ) | | | (1,471,379 | ) | | | (1,471,379 | ) | | | 1,471,379 | | | | — | |
Citibank NA | | | 9,250,123 | | | | — | | | | 9,250,123 | | | | — | | | | (7,973,279 | ) | | | (7,973,279 | ) | | | 1,276,844 | | | | (1,276,844 | ) | | | — | |
Deutsche Bank AG | | | — | | | | — | | | | — | | | | — | | | | (1,383,922 | ) | | | (1,383,922 | ) | | | (1,383,922 | ) | | | 1,383,922 | | | | — | |
Morgan Stanley & Co. International PLC | | | — | | | | 9,694,104 | | | | 9,694,104 | | | | (39,884,536 | ) | | | (831,964 | ) | | | (40,716,500 | ) | | | (31,022,396 | ) | | | 3,730,000 | | | | (27,292,396 | ) |
Total | | $ | 9,250,123 | | | $ | 9,694,104 | | | $ | 18,944,227 | | | $ | (39,884,536 | ) | | $ | (12,203,073 | ) | | $ | (52,087,609 | ) | | $ | (33,143,382 | ) | | $ | 5,850,986 | | | $ | (27,292,396 | ) |
| (1) | | Gross amounts available for offset but not netted in the Consolidated Statement of Assets and Liabilities. |
| (2) | | Net amount represents the net amount due (to) from counterparty in the event of a default based on the contractual set-off rights under the agreement. Net amount excludes any over-collateralized amounts. |
|
| 5. AGREEMENTS AND AFFILIATED TRANSACTIONS |
A. Management Agreement — Under the Agreement, GSAM manages the Fund, subject to the general supervision of the Trustees.
As compensation for the services rendered pursuant to the Agreement, the assumption of the expenses related thereto and administration of the Fund’s business affairs, including providing facilities, GSAM is entitled to a management fee, accrued daily and paid monthly, equal to an annual percentage rate of the Fund’s average daily net assets.
25
GOLDMAN SACHS TACTICAL TILT IMPLEMENTATION FUND
Notes to Financial Statements (continued)
April 30, 2015 (Unaudited)
|
| 5. AGREEMENTS AND AFFILIATED TRANSACTIONS (continued) |
For the six months ended April 30, 2015, contractual and effective net management fees with GSAM were at the following rates:
| | | | | | | | | | | | | | | | | | | | | | |
| Contractual Management Rate | | | Effective
Management
Rate | | | Effective Net
Management
Rate*^ | |
First
$2 billion | | | Next
$3 billion | | | Next
$3 billion | | | Over
$8 billion | | | |
| | 0.75% | | | | 0.68% | | | | 0.64% | | | | 0.62% | | | | 0.74% | | | | 0.43% | |
| * | | GSAM has agreed to waive a portion of its management fee payable by the Fund in an amount equal to any management fee it earns as an investment adviser to any of the affiliated funds in which the Fund invests through at least February 29, 2016. Prior to such date GSAM may not terminate the arrangement without the approval of the Trustees. |
| ^ | | Effective Net Management Rate includes the impact of management fee waivers of affiliated underlying funds, if any. |
GSAM also provides management services to the Subsidiary pursuant to a Subsidiary Management Agreement (the “Subsidiary Agreement”) and is entitled to a management fee accrued daily and paid monthly, equal to an annual percentage rate of 0.42% of the Subsidiary’s average daily net assets. In consideration of the Subsidiary’s management fee, and for as long as the Subsidiary Agreement remains in effect, GSAM has contractually agreed to waive irrevocably a portion of the Fund’s management fee in an amount equal to the management fee paid to GSAM by the Subsidiary under the Subsidiary Agreement. For the six months ended April 30, 2015, GSAM waived $103,430 of the Fund’s management fee.
The Fund invests in the FST Shares of the Goldman Sachs Financial Square Government Fund and the Institutional Shares of the Goldman Sachs High Yield Floating Rate and the Goldman Sachs High Yield Funds. These Underlying Funds are considered to be affiliated with the Fund. GSAM has agreed to waive a portion of its management fee payable by the Fund in an amount equal to the management fee it earns as an adviser to any of the affiliated funds in which the Fund invests. For the six months ended April 30, 2015, GSAM waived $3,447,956 of the Fund’s management fees.
B. Transfer Agency Agreement — Goldman Sachs also serves as the transfer agent of the Fund for a fee pursuant to the Transfer Agency Agreement. The fees charged for such transfer agency services are accrued daily and paid monthly at annual rates of 0.04% of the average daily net assets of Institutional Shares.
C. Other Expense Agreements and Affiliated Transactions — GSAM has agreed to limit certain “Other Expenses” of the Fund (excluding acquired fund fees and expenses, transfer agency fees and expenses, service fees and shareholder administration fees (as applicable), taxes, interest, brokerage fees, shareholder meetings, litigation, indemnification and extraordinary expenses) to the extent such expenses exceed, on an annual basis, 0.164% of the average daily net assets of the Fund. Such Other Expense reimbursements, if any, are accrued daily and paid monthly and is disclosed in the Statement of Operations for the period ended April 30, 2015. In addition, the Fund is not obligated to reimburse GSAM for prior fiscal year expense reimbursements, if any. This Other Expense limitation will remain in place through at least February 29, 2016 and prior to such date GSAM may not terminate the arrangement without the approval of the Trustees. In addition, the Fund has entered into certain offset arrangements with the custodian and the transfer agent, which may result in a reduction of the Fund’s expenses and are received irrespective of the application of the “Other Expense” limitations described above.
For the six months ended April 30, 2015, these expense reductions, including any fee waivers and Other Expense reimbursements, were as follows:
| | | | | | | | | | |
Management
Fee Waiver | | | Other Expense
Reimbursements | | | Total Expense
Reductions | |
| $ | 3,447,956 | | | $ | 45,246 | | | $ | 3,493,202 | |
D. Line of Credit Facility — As of April 30, 2015, the Fund participated in a $1,080,000,000 committed, unsecured revolving
line of credit facility (the “facility”) together with other funds of the Trust and registered investment companies having
management agreements with GSAM or its affiliates (“Other Borrowers”). Pursuant to the terms of the facility, the Fund and
Other Borrowers could increase the credit amount by an additional $120,000,000, for a total of up to $1,200,000,000. This facility is to be used for temporary emergency purposes, or to allow for an orderly liquidation of securities to meet redemption requests.
26
GOLDMAN SACHS TACTICAL TILT IMPLEMENTATION FUND
|
| 5. AGREEMENTS AND AFFILIATED TRANSACTIONS (continued) |
The interest rate on borrowings is based on the federal funds rate. The facility also requires a fee to be paid by the Fund based on the amount of the commitment that has not been utilized. For the six months ended April 30, 2015, the Fund did not have any borrowings under the facility. The facility was increased to $1,205,000,000 effective May 5, 2015.
E. Other Transactions with Affiliates — For the six months ended April 30, 2015, Goldman Sachs earned $254,651 in brokerage commissions from portfolio transactions, including futures transactions executed with Goldman Sachs as the Futures Commission Merchant, on behalf of the Fund.
As of April 30, 2015, the Goldman Sachs Group (“GSG”), Inc. was the beneficial owner of 5% or more of the following outstanding shares of the fund:
| | | | | | |
| Fund | | | | Goldman Sachs
Tax Advantaged
Global Equity Portfolio | |
Tactical Tilt Implementation Fund | | | | | 5 | % |
The table below shows the transactions in and earnings from investments in the Underlying Funds for the period ended April 30, 2015:
| | | | | | | | | | | | | | | | | | | | | | | | | | | | |
| Underlying Funds | | Market Value 10/31/14 | | | Purchases at Cost | | | Proceeds from Sales | | | Net Realized Gain (Loss) | | | Net Change in Unrealized Gain (Loss) | | | Market Value 04/30/15 | | | Dividend Income | |
Financial Square Government Fund | | $ | — | | | $ | 1,964,076,602 | | | $ | (710,041,658 | ) | | $ | — | | | $ | — | | | $ | 1,254,034,944 | | | $ | 24,020,590 | |
High Yield Floating Rate Fund | | | 293,213,830 | | | | 336,286,936 | | | | (67,883,761 | ) | | | (734,242 | ) | | | 4,032,693 | | | | 564,915,456 | | | | — | |
High Yield Fund | | | 369,890,792 | | | | 476,436,238 | | | | — | | | | — | | | | (9,196,617 | ) | | | 837,130,413 | | | | — | |
Total | | $ | 663,104,622 | | | $ | 2,776,799,776 | | | $ | (777,925,419 | ) | | $ | (734,242 | ) | | $ | (5,163,924 | ) | | $ | 2,656,080,813 | | | $ | 24,020,590 | |
|
| 6. PORTFOLIO SECURITIES TRANSACTIONS |
The cost of purchases and proceeds from sales and maturities of long-term securities for the six months ended April 30, 2015, were $1,275,653,068 and $250,869,061, respectively.
As of the Fund’s most recent fiscal year end, October 31, 2014, the Fund’s capital loss carryfowards on a tax basis were as follows:
| | | | |
Capital loss carryforwards: | | | | |
Perpetual Short-term | | $ | (27,995,384 | ) |
Perpetual Long-term | | | (11,593,944 | ) |
Total capital loss carryovers | | $ | (39,589,328 | ) |
| (1) | | Expiration occurs on October 31 of the year indicated. |
27
GOLDMAN SACHS TACTICAL TILT IMPLEMENTATION FUND
Notes to Financial Statements (continued)
April 30, 2015 (Unaudited)
|
| 7. TAX INFORMATION (Continued) |
As of April 30, 2015, the Fund’s aggregate security unrealized gains and losses based on cost for U.S. federal income tax purposes were as follows:
| | | | |
Tax Cost | | $ | 3,125,336,051 | |
Gross unrealized gain | | | 23,654,205 | |
Gross unrealized loss | | | (10,049,416 | ) |
Net unrealized gain | | $ | 13,604,789 | |
The difference between GAAP-basis and tax-basis unrealized gains (losses) is attributable primarily to wash sales, net mark to market gains/(losses) on regulated futures and options contracts, and net mark to market gains/(losses) on foreign currency contracts.
GSAM has reviewed the Fund’s tax positions for all open tax years (the current and prior year) and has concluded that no provision for income tax is required in the Fund’s financial statements. Such open tax years remain subject to examination and adjustment by tax authorities.
The Fund’s risks include, but are not limited to, the following:
Foreign Custody Risk — To the extent that the Fund invests in foreign securities may hold such securities and foreign currency with foreign banks, agents, and securities depositories appointed by the Fund’s custodian (each a “Foreign Custodian”). Some foreign custodians may be recently organized or new to the foreign custody business. In some countries, Foreign Custodians may be subject to little or no regulatory oversight or independent evaluation of their operations. Further, the laws of certain countries may place limitations on the Fund’s ability to recover its assets if a Foreign Custodian enters bankruptcy. Investments in emerging markets may be subject to greater custody risks than investments in more developed markets. Custody services in emerging market countries are very often undeveloped and may be considerably less well regulated than in more developed countries, and thus may not afford the same level of investor protection as would apply in developed countries.
Investments in Other Investment Companies — As a shareholder of another investment company, including an exchange traded fund (“ETF”), the Fund will directly bear its proportionate share of any net management fees and other expenses paid by such other investment companies, in addition to the fees and expenses regularly borne by the Fund. ETFs are subject to risks that do not apply to conventional mutual funds, including but not limited to the following: (i) the market price of the ETF’s shares may trade at a premium or a discount to their NAV; and (ii) an active trading market for an ETF’s shares may not develop or be maintained.
Investments in the Underlying Funds — The Fund invests in Underlying Funds, and is subject to the risk factors associated with the investments of those Underlying Funds in direct proportion to the amount of assets allocated to each. As of April 30, 2015, the Portfolio invested 37.2%, 24.8% and 16.8% of its net assets in the Goldman Sachs Financial Square Government Fund (the “FSQ - Government Fund”), Goldman Sachs High Yield Fund (the “High Yield Fund”) and the Goldman Sachs High Yield Floating Rate Fund (the “High Yield Floating Rate Fund”), respectively. Because of the high concentration of its assets in these Underlying Funds, the Portfolio has significant exposure to the risks associated with these Underlying Funds. The FSQ - Government Fund intends to be a government money market fund which invests at least 99.5% of its Net Assets in cash, securities issued or guaranteed by the United States or certain U.S. government agencies or instrumentalities and/or repurchase agreements that are collateralized fully. The High Yield Fund invests, under normal circumstances, at least 80% of its Net Assets in high-yield, fixed income securities that, at the time of purchase, are non-investment grade securities. Under normal market conditions, the High Yield Fund may invest up to 20% of its Net Assets in investment grade fixed income securities, including securities issued or guaranteed by the U.S. government, its agencies, instrumentalities or sponsored enterprises. The High Yield Fund may also invest
28
GOLDMAN SACHS TACTICAL TILT IMPLEMENTATION FUND
|
| 8. OTHER RISKS (continued) |
in derivatives, including credit default swap indices, interest rate futures and swaps. The High Yield Floating Rate Fund invests, under normal circumstances, at least 80% of its Net Assets in domestic or foreign floating rate loans and other floating or variable rate obligations rated below investment grade. Under normal conditions, the High Yield Floating Rate Fund may invest up to 20% of its Net Assets in fixed income instruments, regardless of rating, including fixed rate corporate bonds, government bonds, convertible debt obligations, and mezzanine fixed income instruments. The High Yield Floating Rate Fund may also invest in floating or variable rate instruments that are rated investment grade, and in preferred stock, repurchase agreements, cash securities, and derivative instruments such as credit default swaps on credit and loan indices and forward contracts, among others.
The Fund does not invest in the Underlying Funds for the purpose of exercising management or control; however, investments by the Portfolio within its principal investment strategies may represent a significant portion of an Underlying Fund’s net assets.
Interest Rate Risk — When interest rates increase, fixed income securities or instruments held by the Fund will generally decline in value. Long-term fixed income securities or instruments will normally have more price volatility because of this risk than short-term fixed income securities or instruments.
Large Shareholder Transactions Risk — The Fund may experience adverse effects when certain large shareholders, such as other funds, institutional investors (including those trading by use of non-discretionary mathematical formulas), financial intermediaries (who may make investment decisions on behalf of underlying clients and/or include the Fund in their investment model), individuals, accounts and Goldman Sachs affiliates, purchase or redeem large amounts of shares of the Fund. Such large shareholder redemptions may cause the Fund to sell portfolio securities at times when it would not otherwise do so, which may negatively impact the Fund’s NAV and liquidity. Similarly, large Fund share purchases may adversely affect the Fund’s performance to the extent that the Fund is delayed in investing new cash and is required to maintain a larger cash position than it ordinarily would. These transactions may also accelerate the realization of taxable income to shareholders if such sales of investments resulted in gains, and may also increase transaction costs. In addition, a large redemption could result in the Fund’s current expenses being allocated over a smaller asset base, leading to an increase in the Fund’s expense ratio.
Liquidity Risk — The Fund may make investments that are illiquid or that may become less liquid in response to market developments or adverse investor perceptions. Illiquid investments may be more difficult to value. Liquidity risk may also refer to the risk that the Fund will not be able to pay redemption proceeds within the allowable time period because of unusual market conditions, an unusually high volume of redemption requests, or other reasons. To meet redemption requests, the Fund may be forced to sell investments at an unfavorable time and/or under unfavorable conditions. Liquidity risk may be the result of, among other things, the reduced number and capacity of traditional market participants to make a market in fixed income securities or the lack of an active market. The potential for liquidity risk may be magnified by a rising interest rate environment or other circumstances where investor redemptions from fixed income mutual funds may be higher than normal, potentially causing increased supply in the market due to selling activity.
Market and Credit Risks — In the normal course of business, the Fund trades financial instruments and enters into financial transactions where risk of potential loss exists due to changes in the market (market risk). Additionally, the Fund may also be exposed to credit risk in the event that an issuer or guarantor fails to perform or that an institution or entity with which the Fund has unsettled or open transactions defaults.
Investing in foreign markets may involve special risks and considerations not typically associated with investing in the U.S. Foreign securities may be subject to risk of loss because of more or less foreign government regulation, less public information and less economic, political and social stability in the countries in which the Fund invests. Loss may also result from the imposition of exchange controls, confiscations and other government restrictions by the United States or other governments, or from problems in registration, settlement or custody. Foreign risk also involves the risk of negative foreign currency rate fluctuations, which may cause the value of securities denominated in such foreign currency (or other instruments through which the Fund has exposure to foreign currencies) to decline in value. Currency exchange rates may fluctuate significantly over short periods of time. To the extent that the Fund also invests in securities of issuers located in emerging markets, these risks may be more pronounced.
29
GOLDMAN SACHS TACTICAL TILT IMPLEMENTATION FUND
Notes to Financial Statements (continued)
April 30, 2015 (Unaudited)
|
| 8. OTHER RISKS (continued) |
Non-Diversification Risk — The Fund is non-diversified, meaning that it is permitted to invest a larger percentage of its assets in fewer issuers than diversified mutual funds. Thus, the Fund may be more susceptible to adverse developments affecting any single issuer held in its portfolio, and may be more susceptible to greater losses because of these developments.
Portfolio Concentration Risk — As a result of the Fund’s ability to invest a large percentage of its assets in obligations of issuers within the same country, state, region, currency or economic sector, an adverse economic, business or political development may affect the value of the Fund’s investments more than if its investments were not so concentrated.
Tax Risk — The Fund will seek to gain exposure to the commodity markets primarily through investments in the Subsidiary and/or commodity index-linked structured notes, as applicable. Historically, the Internal Revenue Service (“IRS”) has issued private letter rulings (“PLRs”) in which the IRS concluded that income and gains from investments in commodity index-linked structured notes or a wholly-owned foreign subsidiary that invests in commodity-linked instruments are “qualifying income” for purposes of compliance with Subchapter M of the Code. However, the Portfolio has not received such a PLR, and is not able to rely on PLRs issued to other taxpayers. Additionally, the IRS has suspended the granting of such PLRs, pending review of its position on this matter. The tax treatment of Fund’s investment in a wholly owned subsidiary or commodity-linked instruments may be adversely affected by future legislation, Treasury Regulations, and/or guidance issued by the IRS (which may be retroactive) to the extent it ultimately concludes that income derived therefrom is not “qualifying income” under Subchapter M of the Code; the character, timing and/or amount of the Fund’s taxable income or any gains and distributions made by the Fund could also be affected. In connection with its investment in the Subsidiary, the Fund has obtained an opinion of counsel that its income from that investment should constitute “qualifying income.” However, should the IRS nevertheless successfully assert that the Fund’s income from such investment was not “qualifying income,” the Fund would likely fail to qualify as a registered investment company under the Code (i.e., to the extent that over 10% of the Fund’s gross income was derived from this investment), and would therefore become subject to federal and state income tax on all of its taxable income at regular corporate tax rates with no deduction for any distributions paid to shareholders, which would significantly adversely affect the returns to, and could cause substantial losses for, Fund shareholders.
Under the Trust’s organizational documents, its Trustees, officers, employees and agents are indemnified, to the extent permitted by the Act and state law, against certain liabilities that may arise out of performance of their duties to the Fund. Additionally, in the course of business, the Fund enters into contracts that contain a variety of indemnification clauses. The Fund’s maximum exposure under these arrangements is unknown, as this would involve future claims that may be made against the Fund that have not yet occurred. However, GSAM believes the risk of loss under these arrangements to be remote.
Subsequent events after the Consolidated Statement of Assets and Liabilities date have been evaluated through the date the financial statements were issued. GSAM has concluded that there is no impact requiring adjustment or disclosure in the financial statements.
30
GOLDMAN SACHS TACTICAL TILT IMPLEMENTATION FUND
|
| 11. SUMMARY OF SHARE TRANSACTIONS |
Share activity is as follows:
| | | | | | | | | | | | | | | | |
| | | For the Six Months Ended
April 30, 2015
(Unaudited) | | | For the Period Ended
October 31, 2014(a) | |
| Institutional Shares | |
Shares sold | | | 174,274,552 | | | $ | 1,777,993,480 | | | | 154,783,020 | | | $ | 1,539,888,063 | |
Reinvestment of distributions | | | 2,125,831 | | | | 21,045,722 | | | | — | | | | — | |
Shares redeemed | | | (8,716,161 | ) | | | (88,317,392 | ) | | | (516,300 | ) | | | (5,108,790 | ) |
NET INCREASE | | | 167,684,222 | | | $ | 1,710,721,810 | | | | 154,266,720 | | | $ | 1,534,779,273 | |
| (a) | | Commenced operations on July 31, 2014 |
31
GOLDMAN SACHS TACTICAL TILT IMPLEMENTATION FUND
| | |
Fund Expenses — Period Ended October April 30, (Unaudited) | | |
As a shareholder of Institutional Shares of the Portfolio, you incur two types of costs: (1) transaction costs, and (2) ongoing costs, including management fees; and other Fund expenses. This Example is intended to help you understand your ongoing costs (in dollars) of investing in the Portfolio and to compare these costs with the ongoing costs of investing in other mutual funds.
The Example is based on an investment of $1,000 invested at the beginning of the period and held for the entire period from November 1, 2014 through April 30, 2015.
Actual Expenses — The first line under each share class in the table below provides information about actual account values and actual expenses. You may use the information in this line, together with the amount you invested, to estimate the expenses that you paid over the period. Simply divide your account value by $1,000 (for example, an $8,600 account value divided by $1,000=8.6), then multiply the result by the number in the first line under the heading entitled “Expenses Paid” to estimate the expenses you paid on your account during this period.
Hypothetical Example for Comparison Purposes — The second line under each share class in the table below provides information about hypothetical account values and hypothetical expenses based on the Portfolio’s actual net expense ratios and an assumed rate of return of 5% per year before expenses, which is not the Portfolio’s actual return. The hypothetical account values and expenses may not be used to estimate the actual ending account balance or expenses you paid for the period. You may use this information to compare the ongoing costs of investing in the Portfolio and other funds. To do so, compare this 5% hypothetical example with the 5% hypothetical examples that appear in the shareholder reports of the other funds.
Please note that the expenses shown in the table are meant to highlight your ongoing costs only and do not reflect any transactional costs, such as sales charges, redemption fees, or exchange fees. Therefore, the second line of the table is useful in comparing ongoing costs only, and will not help you determine the relative total costs of owning different funds. In addition, if these transactional costs were included, your costs would have been higher.
| | | | | | | | | | | | |
| Share Class | | Beginning
Account Value
11/1/14 | | | Ending
Account Value
4/30/15 | | | Expenses Paid for the
6 months ended
4/30/15* | |
| Institutional | | | | | | | | | | | | |
Actual | | $ | 1,000.00 | | | $ | 1,072.90 | | | $ | 2.57 | |
Hypothetical 5% return | | | 1,000.00 | | | | 1,022.32 | + | | | 2.51 | |
| | * | | Expenses are calculated using the Portfolio’s annualized net expense ratio, which represents the ongoing expenses as a percentage of net assets for the period ended April 30, 2015. Expenses are calculated by multiplying the annualized net expense ratio by the average account value for the period; then multiplying the result by the number of days in the most recent fiscal half year; and then dividing that result by the number of days in the fiscal year. The annualized net expense ratio for the period was 0.50%. | |
| | + | | Hypothetical expenses are based on each Portfolio’s actual annualized net expense ratios and an assumed rate of return of 5% per year before expenses. | |
32
FUND PROFILE
Goldman Sachs Funds

Goldman Sachs is a premier financial services firm, known since 1869 for creating thoughtful and customized investment solutions in complex global markets.
Today, the Investment Management Division of Goldman Sachs serves a diverse set of clients worldwide, including private institutions, public entities and individuals. With approximately $1.02 trillion in assets under supervision as of March 31, 2015, Goldman Sachs Asset Management (“GSAM”) has portfolio management teams located around the world and our investment professionals bring firsthand knowledge of local markets to every investment decision. Assets under supervision includes assets under management and other client assets for which Goldman Sachs does not have full discretion. GSAM leverages the resources of Goldman, Sachs & Co. subject to legal, internal and regulatory restrictions.

Money Market1
Financial Square FundsSM
| n | | Financial Square Tax-Exempt Funds |
| n | | Financial Square Federal Fund |
| n | | Financial Square Government Fund |
| n | | Financial Square Money Market Fund |
| n | | Financial Square Prime Obligations Fund |
| n | | Financial Square Treasury Instruments Fund |
| n | | Financial Square Treasury Obligations Fund |
Fixed Income
Short Duration and Government
| n | | High Quality Floating Rate Fund |
| n | | Limited Maturity Obligations Fund |
| n | | Short Duration Government Fund |
| n | | Short Duration Income Fund |
| n | | Inflation Protected Securities Fund |
Multi-Sector
Municipal and Tax-Free
| n | | High Yield Municipal Fund |
| n | | Dynamic Municipal Income Fund3 |
| n | | Short Duration Tax-Free Fund |
Single Sector
| n | | Investment Grade Credit Fund |
| n | | High Yield Floating Rate Fund |
| n | | Emerging Markets Debt Fund |
| n | | Local Emerging Markets Debt Fund |
| n | | Dynamic Emerging Markets Debt Fund |
Fixed Income Alternatives
| n | | Long Short Credit Strategies Fund |
| n | | Fixed Income Macro Strategies Fund |
Fundamental Equity
| n | | Small/Mid Cap Value Fund |
| n | | Small/Mid Cap Growth Fund |
| n | | Flexible Cap Growth Fund |
| n | | Concentrated Growth Fund |
| n | | Technology Tollkeeper Fund |
| n | | Growth Opportunities Fund |
| n | | Rising Dividend Growth Fund |
| n | | Dynamic U.S. Equity Fund4 |
Tax-Advantaged Equity
| n | | U.S. Tax-Managed Equity Fund |
| n | | International Tax-Managed Equity Fund |
| n | | U.S. Equity Dividend and Premium Fund |
| n | | International Equity Dividend and Premium Fund |
Equity Insights
| n | | Small Cap Equity Insights Fund |
| n | | U.S. Equity Insights Fund |
| n | | Small Cap Growth Insights Fund |
| n | | Large Cap Growth Insights Fund |
| n | | Large Cap Value Insights Fund |
| n | | Small Cap Value Insights Fund |
| n | | International Small Cap Insights Fund |
| n | | International Equity Insights Fund |
| n | | Emerging Markets Equity Insights Fund |
Fundamental Equity International
| n | | Strategic International Equity Fund |
| n | | Focused International Equity Fund |
| n | | International Small Cap Fund |
| n | | Emerging Markets Equity Fund |
| n | | BRIC Fund (Brazil, Russia, India, China) |
Select Satellite5
| n | | Global Managed Beta Fund |
| n | | Multi-Manager Non-Core Fixed Income |
| n | | Real Estate Securities Fund |
| n | | International Real Estate Securities Fund |
| n | | Commodity Strategy Fund |
| n | | Dynamic Commodity Strategy Fund |
| n | | Dynamic Allocation Fund |
| n | | Absolute Return Tracker Fund |
| n | | Managed Futures Strategy Fund |
| n | | MLP Energy Infrastructure Fund |
| n | | Multi-Manager Alternatives Fund |
| n | | Multi-Asset Real Return Fund |
| n | | Retirement Portfolio Completion Fund |
| n | | Tactical Tilt Implementation Fund |
Total Portfolio Solutions5
| n | | Balanced Strategy Portfolio |
| n | | Growth and Income Strategy Portfolio |
| n | | Growth Strategy Portfolio |
| n | | Equity Growth Strategy Portfolio |
| n | | Satellite Strategies Portfolio |
| n | | Enhanced Dividend Global Equity Portfolio |
| n | | Tax Advantaged Global Equity Portfolio |
| 1 | | An investment in a money market fund is neither insured nor guaranteed by the Federal Deposit Insurance Corporation (“FDIC”) or any other government agency. Although the Funds seek to preserve the value of your investment at $1.00 per share, it is possible to lose money by investing in the Funds. |
| 2 | | Effective on October 1, 2014, the Goldman Sachs Core Plus Fixed Income Fund was renamed the Goldman Sachs Bond Fund. |
| 3 | | Effective on December 18, 2014, the Goldman Sachs Municipal Income Fund was renamed the Goldman Sachs Dynamic Municipal Income Fund. |
| 4 | | Effective on April 30, 2015, the Goldman Sachs U.S. Equity Fund was renamed the Goldman Sachs Dynamic U.S. Equity Fund. |
| 5 | | Individual Funds within the Total Portfolio Solutions and Select Satellite categories will have various placement on the risk/return spectrum and may have greater or lesser risk than that indicated by the placement of the general Total Portfolio Solutions or Select Satellite category. |
Financial Square FundsSM is a registered service mark of Goldman, Sachs & Co.
*This list covers open-end funds only. Please visit our website at www.GSAMFUNDS.com to learn about our closed-end funds.
| | |
TRUSTEES Ashok N. Bakhru, Chairman Kathryn A. Cassidy John P. Coblentz, Jr. Diana M. Daniels Joseph P. LoRusso Herbert J. Markley James A. McNamara Jessica Palmer Alan A. Shuch Richard P. Strubel Roy W. Templin Gregory G. Weaver | | OFFICERS James A. McNamara, President Scott M. McHugh, Principal Financial Officer and Treasurer Caroline L. Kraus, Secretary |
| |
GOLDMAN, SACHS & CO. Distributor and Transfer Agent | | GOLDMAN SACHS ASSET MANAGEMENT, L.P. Investment Adviser |
Visit our web site at www.GSAMFUNDS.com to obtain the most recent month-end returns.
Goldman Sachs Asset Management, L.P. 200 West Street, New York, New York 10282
The reports concerning the Portfolio included in this shareholder report may contain certain forward-looking statements about the factors that may affect the performance of the Portfolio in the future. These statements are based on Portfolio management’s predictions and expectations concerning certain future events and their expected impact on the Portfolio, such as performance of the economy as a whole and of specific industry sectors, changes in the levels of interest rates, the impact of developing world events, and other factors that may influence the future performance of the Portfolio. Management believes these forward-looking statements to be reasonable, although they are inherently uncertain and difficult to predict. Actual events may cause adjustments in portfolio management strategies from those currently expected to be employed.
A description of the policies and procedures that the Portfolio uses to determine how to vote proxies relating to portfolio securities and information regarding how the Portfolio voted proxies relating to portfolio securities for the most recent 12-month period ended June 30, is available (I) without charge, upon request by calling 1-800-526-7384; and (II) on the Securities and Exchange Commission (“SEC’’) web site at http://www.sec.gov.
The Portfolio files its complete schedule of portfolio holdings with the SEC for the first and third quarters of each fiscal year on Form N-Qs. The Portfolio’s Form N-Qs are available on the SEC’s web site at http://www.sec.gov within 60 days after the Portfolio’s first and third fiscal quarters. The Portfolio’s Form N-Qs may be reviewed and copied at the SEC’s Public Reference Room in Washington, D.C. and information on the operation of the Public Reference Room may also be obtained by calling 1-800-SEC-0330. Form N-Qs may be obtained upon request and without charge by calling 1-800-526-7384 (for Retail Shareholders) or 1-800-621-2550 (for Institutional Shareholders).
Portfolio holdings and allocations shown are as of April 30, 2015 and may not be representative of future investments. Portfolio holdings should not be relied on in making investment decisions and should not be construed as research or investment advice regarding particular securities. Current and future holdings are subject to risk.
The portfolio risk management process includes an effort to monitor and manage risk, but does not imply low risk.
This material is not authorized for distribution to prospective investors unless preceded or accompanied by a current Prospectus or summary prospectus, if applicable. Investors should consider a Portfolio’s objective, risks, and charges and expenses, and read the summary prospectus, if available, and/or the Prospectus carefully before investing or sending money. The summary prospectus, if available, and the Prospectus contain this and other information about a Portfolio and may be obtained from your authorized dealer or from Goldman, Sachs & Co. by calling (retail – 1-800-526-7384) (institutional – 1-800-621-2550).
© 2015 Goldman Sachs. All rights reserved. 164933.MF.MED.TMPL / 6 / 2015 TACTSAR-15 / 1K
| | (a) | As of the end of the period covered by this report, the registrant has adopted a code of ethics that applies to the registrant’s principal executive officer, principal financial officer, principal accounting officer or controller, or persons performing similar functions, regardless of whether these individuals are employed by the registrant or a third party (the “Code of Ethics”). |
| | (b) | During the period covered by this report, no amendments were made to the provisions of the Code of Ethics. |
| | (c) | During the period covered by this report, the registrant did not grant any waivers, including an implicit waiver, from any provision of the Code of Ethics. |
| | (d) | A copy of the Code of Ethics is available as provided in Item 12(a)(1) of this report. |
| ITEM 3. | AUDIT COMMITTEE FINANCIAL EXPERT. |
| | The registrant’s board of trustees has determined that the registrant has at least one “audit committee financial expert” (as defined in Item 3 of Form N-CSR) serving on its audit committee. John P. Coblentz, Jr. is the “audit committee financial expert” and is “independent” (as each term is defined in Item 3 of Form N-CSR). |
| ITEM 4. | PRINCIPAL ACCOUNTANT FEES AND SERVICES. |
Table 1 — Items 4(a) - 4(d). The accountant fees below reflect the aggregate fees billed by all of the Funds of the Goldman Sachs Trust and includes the Goldman Sachs Funds to which this certified shareholder report relates.
| | | | | | | | | | | | |
| | | 2014 | | 2013 | | Description of Services Rendered |
| | | |
| | | | | | | | | | | | |
| | | |
Audit Fees: | | | | | | | | | | | | |
| | | |
• PricewaterhouseCoopers LLP
(“PwC”) | | | $ | 4,291,739 | | | | $ | 2,304,956 | | | Financial Statement audits. |
| | | |
Audit-Related Fees: | | | | | | | | | | | | |
| | | |
• PwC | | | $ | 0 | | | | $ | 2,340 | | | Other attest services. |
| | | |
Tax Fees: | | | | | | | | | | | | |
| | | |
• PwC | | | $ | 794,850 | | | | $ | 864,950 | | | Tax compliance services provided in connection with the preparation and review of registrant’s tax returns. |
Table 2 — Items 4(b)(c) & (d). Non-Audit Services to the Goldman Sachs Trust’s service affiliates * that were pre-approved by the Audit Committee of the Goldman Sachs Trust pursuant to Rule 2-01(c)(7)(ii) of Regulation S-X.
| | | | | | | | | | | | |
| | | 2014 | | 2013 | | Description of Services Rendered |
| | | |
| | | | | | | | | | | | |
| | | |
Audit-Related Fees: | | | | | | | | | | | | |
| | | |
• PwC | | | $ | 1,486,420 | | | | $ | 1,516,680 | | | Internal control review performed in accordance with Statement on Standards for Attestation Engagements No. 16. These fees are borne by the Funds’ Adviser. |
| * | These include the advisor (excluding sub-advisors) and any entity controlling, controlled by or under common control with the advisor that provides ongoing services to the registrant (hereinafter referred to as “service affiliates”). |
Item 4(e)(1) — Audit Committee Pre-Approval Policies and Procedures
Pre-Approval of Audit and Non-Audit Services Provided to the Funds of the Goldman Sachs Trust. The Audit and Non-Audit Services Pre-Approval Policy (the “Policy”) adopted by the Audit Committee of Goldman Sachs Trust (“GST”) sets forth the procedures and the conditions pursuant to which services performed by an independent auditor for GST may be pre-approved. Services may be pre-approved specifically by the Audit Committee as a whole or, in certain circumstances, by the Audit Committee Chairman or the person designated as the Audit Committee Financial Expert. In addition, subject to specified cost limitations, certain services may be pre-approved under the provisions of the Policy. The Policy provides that the Audit Committee will consider whether the services provided by an independent auditor are consistent with the Securities and Exchange Commission’s rules on auditor independence. The Policy provides for periodic review and pre-approval by the Audit Committee of the services that may be provided by the independent auditor.
De Minimis Waiver. The pre-approval requirements of the Policy may be waived with respect to the provision of non-audit services that are permissible for an independent auditor to perform, provided (1) the aggregate amount of all such services provided constitutes no more than five percent of the total amount of revenues subject to pre-approval that was paid to the independent auditors during the fiscal year in which the services are provided; (2) such services were not recognized by GST at the time of the engagement to be non-audit services; and (3) such services are promptly brought to the attention of the Audit Committee and approved prior to the completion of the audit by the Audit Committee or by one or more members of the Audit Committee to whom authority to grant such approvals has been delegated by the Audit Committee, pursuant to the pre-approval provisions of the Policy.
Pre-Approval of Non-Audit Services Provided to GST’s Investment Advisers. The Policy provides that, in addition to requiring pre-approval of audit and non-audit services provided to GST, the Audit Committee will pre-approve those non-audit services provided to GST’s investment advisers (and entities controlling, controlled by or under common control with the investment advisers that provide ongoing services to GST) where the engagement relates directly to the operations or financial reporting of GST.
Item 4(e)(2) – 0% of the audit-related fees, tax fees and other fees listed in Table 1 were approved by GST’s Audit Committee pursuant to the “de minimis” exception of Rule 2-01(c)(7)(i)(C) of Regulation S-X. In addition, 0% of the non-audit services to the GST’s service affiliates listed in Table 2 were approved by GST’s Audit Committee pursuant to the “de minimis” exception of Rule 2-01(c)(7)(i)(C) of Regulation S-X.
Item 4(f) – Not applicable.
Item 4(g) Aggregate Non-Audit Fees Disclosure
The aggregate non-audit fees billed to GST by PwC for the twelve months ended October 31, 2014 and October 31, 2013 were approximately $794,850 and $867,290 respectively. The aggregate non-audit fees billed to GST’s adviser and service affiliates by PwC for non-audit services for the twelve months ended December 31, 2013 and December 31, 2012 were approximately $9.8 million and $10.0 million respectively. With regard to the aggregate non-audit fees billed to GST’s adviser and service affiliates, the 2014 and 2013 amounts include fees for non-audit services required to be pre-approved [see Table 2] and fees for non-audit services that did not require pre-approval since they did not directly relate to GST’s operations or financial reporting.
Item 4(h) — GST’s Audit Committee has considered whether the provision of non-audit services to GST’s investment adviser and service affiliates that did not require pre-approval pursuant to paragraph (c)(7)(ii) of Rule 2-01 of Regulation S-X is compatible with maintaining the auditors’ independence.
| ITEM 5. | AUDIT COMMITTEE OF LISTED REGISTRANTS. |
| ITEM 6. | SCHEDULE OF INVESTMENTS. |
| | Schedule of Investments is included as part of the Report to Stockholders filed under Item 1. |
| ITEM 7. | DISCLOSURE OF PROXY VOTING POLICIES AND PROCEDURES FOR CLOSED-END MANAGEMENT INVESTMENT COMPANIES. |
| ITEM 8. | PORTFOLIO MANAGERS OF CLOSED-END MANAGEMENT INVESTMENT COMPANIES. |
| ITEM 9. | PURCHASES OF EQUITY SECURITIES BY CLOSED-END MANAGEMENT INVESTMENT COMPANY AND AFFILIATED PURCHASERS. |
| ITEM 10. | SUBMISSION OF MATTERS TO A VOTE OF SECURITY HOLDERS. |
| | There have been no material changes to the procedures by which shareholders may recommend nominees to the registrant’s board of trustees. |
| ITEM 11. | CONTROLS AND PROCEDURES. |
| | (a) | The registrant’s principal executive and principal financial officers, or persons performing similar functions have concluded that the registrant’s disclosure controls and procedures (as defined in Rule 30a-3(c) under the Investment Company Act of 1940, as amended (the “1940 Act”)) are effective as of a date within 90 days of the filing of this report that includes the disclosure required by this paragraph, based on the evaluation of these controls and procedures required by Rule 30a-3(b) under the 1940 Act and 15d-15(b) under the Securities Exchange Act of 1934, as amended. |
| | (b) | There were no changes in the registrant’s internal control over financial reporting (as defined in Rule 30a-3(d) under the 1940 Act) that occurred during the registrant’s fiscal quarter of the period covered by this report that have materially affected, or are reasonably likely to materially affect, the registrant’s internal control over financial reporting. |
| | | | |
| (a)(1) | | Goldman Sachs Trust’s Code of Ethics for Principal Executive and Senior Financial Officers is incorporated by reference to Exhibit 12(a)(1) of the registrant’s Form N-CSR filed on July 8, 2015 for its International Equity Insights Funds. |
| | |
| (a)(2) | | Exhibit 99.CERT | | Certifications pursuant to Section 302 of the Sarbanes-Oxley Act of 2002 filed herewith. |
| | |
| (b) | | Exhibit 99.906CERT | | Certifications pursuant to Section 906 of the Sarbanes-Oxley Act of 2002 filed herewith. |
SIGNATURES
Pursuant to the requirements of the Securities Exchange Act of 1934 and the Investment Company Act of 1940, the registrant has duly caused this report to be signed on its behalf by the undersigned, thereunto duly authorized.
| | |
| | | Goldman Sachs Trust |
| |
| By: | | /s/ James A. McNamara |
| |
| | |
| | James A. McNamara |
| | President/Principal Executive Officer |
| | Goldman Sachs Trust |
| |
| Date: | | July 8, 2015 |
Pursuant to the requirements of the Securities Exchange Act of 1934 and the Investment Company Act of 1940, this report has been signed below by the following persons on behalf of the registrant and in the capacities and on the dates indicated.
| | |
| By: | | /s/ James A. McNamara |
| |
| | |
| | James A. McNamara |
| | President/Principal Executive Officer |
| | Goldman Sachs Trust |
| |
| Date: | | July 8, 2015 |
| |
| By: | | /s/ Scott McHugh |
| |
| | |
| | Scott McHugh |
| | Principal Financial Officer |
| | Goldman Sachs Trust |
| |
| Date: | | July 8, 2015 |