UNITED STATES
SECURITIES AND EXCHANGE COMMISSION
Washington, D.C. 20549
FORM N-CSR
CERTIFIED SHAREHOLDER REPORT OF REGISTERED
MANAGEMENT INVESTMENT COMPANIES
Investment Company Act file number 811-05349
Goldman Sachs Trust
(Exact name of registrant as specified in charter)
71 South Wacker Drive, Chicago, Illinois 60606
(Address of principal executive offices) (Zip code)
| | |
| Caroline Kraus, Esq. | | Copies to: |
| Goldman, Sachs & Co. | | Geoffrey R.T. Kenyon, Esq. |
| 200 West Street | | Dechert LLP |
| New York, New York 10282 | | 100 Oliver Street |
| | 40th Floor |
| | Boston, MA 02110-2605 |
(Name and address of agents for service)
Registrant’s telephone number, including area code: (312) 655-4400
Date of fiscal year end: March 31
Date of reporting period: September 30, 2015
| ITEM 1. | REPORTS TO STOCKHOLDERS. |
| | The Semi-Annual Report to Shareholders is filed herewith. |
Goldman Sachs Funds

| | | | |
| | |
| Semi-Annual Report | | | | September 30, 2015 |
| | |
| | | | Fixed Income Alternatives Funds |
| | | | Fixed Income Macro Strategies |
| | | | Long Short Credit Strategies |

Goldman Sachs Fixed Income Alternatives Funds
| n | | FIXED INCOME MACRO STRATEGIES FUND |
| n | | LONG SHORT CREDIT STRATEGIES FUND |
| | | | |
TABLE OF CONTENTS | | | | |
| |
Principal Investment Strategies and Risks | | | 1 | |
| |
Portfolio Management Discussion and Performance Summaries | | | 5 | |
| |
Schedule of Investments | | | 18 | |
| |
Financial Statements | | | 46 | |
| |
Financial Highlights | | | 50 | |
| |
Notes to Financial Statements | | | 54 | |
| |
Other Information | | | 75 | |
| | | | |
| | | |
| NOT FDIC-INSURED | | May Lose Value | | No Bank Guarantee |
GOLDMAN SACHS FIXED INCOME ALTERNATIVES FUNDS
Principal Investment Strategies and Risks
This is not a complete list of risks that may affect the Funds. For additional information concerning the risks applicable to the Funds, please see the Funds’ Prospectus.
Loss of money is a risk of investing in a Fund. The investment program of a Fund is speculative, entails substantial risks and includes alternative investment techniques not employed by traditional mutual funds. A Fund should not be relied upon as a complete investment program. A Fund’s investment techniques (if they do not perform as designed) may increase the volatility of performance and the risk of investment loss, including the loss of the entire amount that is invested, and there can be no assurance that the investment objective of a Fund will be achieved. Moreover, certain investment techniques which a Fund may employ in its investment program can substantially increase the adverse impact to which the Fund’s investments may be subject. There is no assurance that the investment processes of a Fund will be successful, that the techniques utilized therein will be implemented successfully or that they are adequate for their intended uses, or that the discretionary element of the investment processes of a Fund will be exercised in a manner that is successful or that is not adverse to the Fund.
The Goldman Sachs Fixed Income Macro Strategies Fund engages in alternative investment techniques not employed by traditional mutual funds, including leverage, shorting and other investment practices that are extremely speculative and involve a high degree of risk. Such practices may increase the volatility of performance and the risk of investment loss, including the loss of the entire amount that is invested.
The Fund seeks “absolute returns” in all markets. Absolute return funds are not designed to outperform stocks and bonds during periods of strong market rallies.
The Fund invests primarily in fixed income investments, including but not limited to: U.S. and foreign investment grade and non-investment grade fixed income investments (commonly known as “junk bonds”), U.S. government securities, non-U.S. sovereign debt, agency securities, corporate debt securities, agency and non-agency mortgage-backed securities, asset-backed securities, custodial receipts, municipal securities, loans and loan assignments and convertible securities, as well as pooled investment vehicles, derivatives and other instruments that provide exposure to such investments. The Fund also gains exposure to the commodities markets by investing in commodity index-linked structured notes and in a wholly-owned subsidiary of the Fund organized as a company under the laws of the Cayman Islands (the “Subsidiary”). The Subsidiary primarily obtains its commodity exposure by investing in commodity index-linked derivative instruments (which may include total return swaps). The Subsidiary also invests in other instruments, including fixed income securities, either as investments or to serve as margin or collateral for its swap positions. The Fund is subject to the risk that exposure to the commodities markets may subject the Fund to greater volatility than investments in traditional securities. The Fund is subject to tax risk as a result of its investments in the Subsidiary and in commodity index-linked structured notes, as the Fund has not received a private letter ruling from the Internal Revenue Service (“IRS”) concluding that income and gains from such investments are “qualifying income.” The IRS has suspended granting such private letter rulings, and the Fund cannot rely on private letter rulings granted to other taxpayers. The tax treatment of investments in the Subsidiary and in commodity index-linked structured notes may be adversely affected by future legislation and/or IRS guidance. While the Fund has obtained an opinion of counsel regarding such investments, if the IRS were to successfully assert that the Fund’s income from such investments was not “qualifying income,” in which case the Fund would fail to qualify as a regulated investment company, the Fund would be subject to federal and state income tax on all of its taxable income at regular corporate tax rates with no deduction for any distributions paid to shareholders, which would significantly adversely affect the returns to Fund shareholders.
Investments in fixed income securities are subject to the risks associated with debt securities generally, including credit, liquidity and interest rate risk. Investments in mortgage-backed securities are also subject to,
1
GOLDMAN SACHS FIXED INCOME ALTERNATIVES FUNDS
among other risks, prepayment risk (i.e., the risk that in a declining interest rate environment, issuers may pay principal more quickly than expected, causing the Fund to reinvest proceeds at lower prevailing interest rates). High yield, lower rated investments can have greater price volatility, are less liquid and present greater risks (including risks of default) than higher rated fixed income securities. Foreign and emerging markets investments may be more volatile and less liquid than investments in U.S. securities and are subject to the risks of currency fluctuations and adverse economic or political developments. The Fund is also subject to the risk that the issuers of sovereign debt or the government authorities that control the payment of debt may be unable or unwilling to repay principal or interest when due. The Fund may be more sensitive to adverse economic, business or political developments if it invests a substantial portion of its assets in bonds of similar projects or in particular types of municipal securities. The Fund may invest in loans directly or indirectly, by purchasing participations or sub-participations from financial institutions. Indirect purchases may subject the Fund to greater delays, expenses and risks than direct obligations in the case that a borrower fails to pay scheduled principal and interest. Derivative instruments may involve a high degree of financial risk. These risks include the risk that a small movement in the price of the underlying security or benchmark may result in a disproportionately large movement, unfavorable or favorable, in the price of the derivative instrument; risks of default by a counterparty; and liquidity risk. At times, the Fund may be unable to sell certain of its illiquid investments without a substantial drop in price, if at all. The Fund is subject to the risks associated with implementing short positions. Taking short positions involves leverage of the Fund’s assets and presents various other risks. Losses on short positions are potentially unlimited as a loss occurs when the value of an asset with respect to which the Fund has a short position increases. The Fund is “non-diversified” and may invest a larger percentage of its assets in fewer issuers than “diversified” mutual funds. Accordingly, the Fund may be more susceptible to adverse developments affecting any single issuer held in its portfolio and to greater losses resulting from these developments.
In addition, the Fund’s NAV may fluctuate substantially over time. Because the Fund attempts to exploit disparities or inefficiencies in the global fixed income, currency and commodities markets, the Fund’s performance may potentially be lower than the returns of the broader stock market. Accordingly, the Fund should be considered a speculative investment entailing a high degree of risk and is not suitable for all investors.
The Goldman Sachs Long Short Credit Strategies Fund invests primarily in credit related instruments, including debt securities, instruments and obligations of U.S. and non-U.S. government, corporate and other non-governmental entities and issuers, and preferred securities. The Fund’s investments in credit related instruments are subject to the risks associated with debt securities generally, including credit, liquidity and interest rate risk. Any guarantee on U.S. government securities applies only to the underlying securities of the Fund if held to maturity and not to the value of the Fund’s shares. The Fund may invest in non-investment grade securities (commonly known as “junk bonds”), including without limitation distressed securities, special situation investments and collateralized loan obligations. High yield, lower rated investments involve greater price volatility and present greater risks than higher rated fixed income securities. The Fund may purchase the securities of issuers that are in default. The Fund may invest in loans directly or indirectly, by purchasing participations or sub-participations from financial institutions. Indirect purchases may subject the Fund to greater delays, expenses and risks than direct obligations in the case that a borrower fails to pay scheduled principal and interest. The Fund will opportunistically seek short exposures to credit related instruments through the use of derivatives or synthetic instruments, including, but not limited to, credit default swaps (including credit default swaps on credit related indices). Derivative instruments may involve a high degree of financial and other risks.
2
GOLDMAN SACHS FIXED INCOME ALTERNATIVES FUNDS
These risks include the risk that a small movement in the price of the underlying security or benchmark may result in a disproportionately large movement, unfavorable or favorable, in the price of the derivative instrument; risks of default by a counterparty; and liquidity risk. Taking short positions may involve leverage of the Fund’s assets and presents various other risks. Losses on short positions may be disproportionate, may exceed the amount invested, and, with respect to certain instruments (e.g., equities, swap options) may be unlimited. Foreign securities may be more volatile and less liquid than investments in U.S. securities and are subject to the risks of currency fluctuations and adverse economic or political developments. At times, the Fund may be unable to sell certain of its illiquid investments without a substantial drop in price, if at all. The Fund is “non-diversified” and may invest more of its assets in fewer issuers than “diversified” funds. Accordingly, the Fund may be more susceptible to adverse developments affecting any single issuer held in its portfolio and to greater losses resulting from these developments.
3
GOLDMAN SACHS FIXED INCOME ALTERNATIVES FUNDS
What Differentiates Goldman Sachs’ Fixed Income Macro Strategies Fund Investment Process?
The Goldman Sachs Fixed Income Macro Strategies Fund (the “Fund”) seeks to generate long-term absolute return. Changes in global fixed income and currency markets have created opportunities for generating attractive returns through fixed income alternative and unconstrained investment strategies.
Our investment process seeks to create excess returns by:
| n | | Adopting a global perspective to compare and contrast investment opportunities around the world |
| n | | Employing eight specialist strategy teams that each conduct very detailed fundamental and quantitative research in their search for attractive investments |
| n | | Capturing the value in the inherent diversification benefits among the different investment strategies |
| n | | Using a disciplined risk-management approach to implement the strategy |
We believe the following characteristics drive the implementation and execution of the Fund’s investment process:

| n | | The Fund invests in a portfolio of fixed income, currency, and commodities in an attempt to generate returns different from traditional asset classes. |
| n | | Alternative investments do not necessarily move in tandem with traditional asset classes, such as stocks, bonds and credit. By adding them to the portfolio the Fund seeks to enhance its overall risk/return profile of its investors. |

| n | | The Fund seeks to generate returns in up and down markets when asset classes are in or out of favor. |
| n | | The Fund employs alternative investment techniques — such as hedging, leverage and shorting that may provide an opportunity for the Fund to achieve its goal of absolute returns. |

| n | | We have over 280 investment professionals covering multiple sectors of the global fixed income market who are focused on finding investment ideas for our portfolio. |
| n | | The senior professionals on the team have an average of over 20 years of investment experience through multiple market cycles. |
4
PORTFOLIO RESULTS
Goldman Sachs Fixed Income Macro Strategies Fund
Investment Objective
The Fund seeks to generate long-term absolute return.
Portfolio Management Discussion and Analysis
Below, the Goldman Sachs Fixed Income Investment Management Team discusses the Goldman Sachs Fixed Income Macro Strategies Fund’s (the “Fund”) performance and positioning for the six-month period ended September 30, 2015 (the “Reporting Period”).
| Q | | How did the Fund perform during the Reporting Period? |
| A | | During the Reporting Period, the Fund’s Class A, C, Institutional, IR and R Shares generated cumulative total returns, without sales charges, of 3.36%, 3.03%, 3.43%, 3.30% and 3.08%, respectively. These returns compare to the 0.14% cumulative total return of the Fund’s benchmark, the Bank of America Merrill Lynch U.S. Dollar Three-Month LIBOR Constant Maturity Index (“the Index”) during the same time period. |
| | | Because the composition of the Index (e.g., short-term cash securities) is not comparable to the range of instruments in which the Fund may transact (e.g., various fixed income, currency and commodities instruments), references to the Index are for informational purposes only and are not an indication of how the Fund is managed. |
| Q | | What economic and market factors most influenced the fixed income market as a whole during the Reporting Period? |
| A | | When the Reporting Period began in April 2015, the performance of spread, or non-government bond, sectors was mixed. U.S. Treasury yields rose, as U.S. economic data improved, including positive surprises in inflation and retail sales. First quarter 2015 U.S. Gross Domestic Product (“GDP”) was revised upwards from -0.7% to a seasonally adjusted annualized rate of -0.2%. The upward revision stemmed in part from stronger than estimated consumer spending and inventory data. U.S. dollar gains hit a roadblock during the second calendar quarter on uncertainty around the Fed’s plans for raising interest rates in 2015. The Eurozone’s economic progress took a back seat to the seemingly intractable challenges surrounding Greece. |
| | | In the third quarter of 2015, spread sectors underperformed U.S. Treasuries as the outlook for the global economy grew cloudy. Investors focused on slowing economic growth in China, the devaluation of the Chinese renminbi and an unexpected increase in market volatility. Oil and commodities prices dropped to new lows, partly because of falling demand from China. Uncertainty about the timing of potential Fed policy tightening became an increasingly key theme. Surprisingly to many, the Fed chose to leave rates unchanged at its September 2015 policy meeting, citing conditions in the global economy. Although the U.S. economy continued to improve, economic growth in other developed countries softened and emerging markets economies broadly weakened. Despite accommodative monetary policies by many global central banks, inflation remained subdued in the world’s major economies. |
| | | For the Reporting Period overall, U.S. Treasuries performed strongly, outpacing other fixed income sectors with the exception of asset-backed securities. High yield corporate bonds underperformed U.S. Treasuries the most, followed by investment grade corporate bonds, sovereign emerging market debt and agency securities. Commercial mortgage-backed securities and residential mortgage-backed securities also underperformed U.S. Treasuries, albeit more modestly. The U.S. Treasury yield curve, or spectrum of maturities, steepened during the Reporting Period, as longer-term yields rose more than intermediate-term yields, and shorter-term yields edged down. The yield on the bellwether 10-year U.S. Treasury rose approximately 18 basis points to 2.04%. (A basis point is 1/100th of a percentage point.) |
| Q | | What key factors were responsible for the Fund’s performance during the Reporting Period? |
| A | | The Fund seeks long-term absolute return through the implementation of relative value, macro and other strategies that aim to exploit disparities or inefficiencies in the global fixed income, currency and commodities markets. We believe absolute return performance may be uncorrelated to fixed income and equity markets over the long-term. Absolute return is the return of an investment and is not relative to a benchmark. Relative value strategy means to simultaneously take long and short positions within an |
5
PORTFOLIO RESULTS
| | investment portfolio. The Fund may also employ a macro hedge to seek to mitigate the risk of market movements (either up or down), potentially enabling the Fund to pursue returns in a variety of market cycles. In addition, the Fund may use derivatives instead of buying and selling bonds to manage duration, to gain exposure to or to short individual securities, or to gain exposure to an index. Duration is a measure of the Fund’s sensitivity to changes in interest rates. |
| | | Investment ideas for the Fund are generated through our specialized top-down and bottom-up strategy teams, in the following areas: Tactical Duration; Country Relative Value; Fundamental Currency; Commodities; Sector Allocation; Government and Swaps; Liquid Mortgages; and Emerging Markets Debt. |
| | | Derivatives are used in combination with cash securities to implement our views in the Fund. During the Reporting Period, the Fund outperformed the Index, largely because of its Government and Swaps strategy and its Country Relative Value strategy. Within the Fund’s Government and Swaps strategy, the Fund benefited from curve steepening positions in the European government bond curve and the U.S. Treasury curve, both of which steepened during the Reporting Period. (Curve steepening positions were implemented through interest rate swaps. Yield curve indicates a spectrum of maturities.) The Government and Swaps strategy is actively implemented via interest rate swaps and/or futures. Relative value positions within the Fund’s Country Relative Value strategy were also advantageous. More specifically, the Fund benefited from its long positions in Japanese 10-year and 20-year interest rates versus its short positions in European 10-year and 20-year interest rates and from its long positions in Japanese 30-year interest rates versus its short positions in U.K. 30-year interest rates. In addition, the Fund was helped during the Reporting Period by its long positions in Canadian interest rates versus its short positions in U.S. 10-year interest rates, as well as its long positions in Canadian two-year interest rates. The Fund’s Country Relative Value strategy is actively implemented via interest rate swaps and/or futures. Also, during the Reporting Period, the Fund employed a macro hedge wherein it held a short position in S&P 500® Index futures, a position that enhanced relative performance. |
| | | Conversely, the Fund was hurt during the Reporting Period by its Emerging Markets Debt strategy and its Sector Allocation strategy. In its Emerging Markets Debt strategy, the Fund’s long position in Brazilian local interest rates was the largest relative detractor. The Fund was also hampered by its long position in Colombian local interest rates and its short position in Hungarian local interest rates. In addition to employing cash bonds, the Fund’s Emerging Market Debt strategy utilizes derivatives like interest rate swaps, credit default swaps, total return swaps and cross-currency swaps, as well as forward foreign currency exchange contracts. Within the Fund’s Sector Allocation strategy, the Fund’s long position in corporate credit detracted from performance during the Reporting Period. The Sector Allocation strategy utilizes a blend of cash securities, interest rate swaps and credit default swaps. |
| Q | | How did the Fund use derivatives and similar instruments during the Reporting Period? |
| A | | During the Reporting Period, the Fund invested in interest rate futures, interest rate swaps, total return swaps, swaptions, options on futures, credit default swaps, equity index futures, non-deliverable forwards, forward foreign currency exchange contracts, currency options and cross currency swaps. The Fund used interest rate futures to hedge interest rate exposure, i.e., to manage exposure to fluctuations in interest rates, and to facilitate specific duration and yield curve strategies. Interest rate swaps were used to express our views on the direction of interest rates. Total return swaps were employed to manage the Fund’s yield curve exposures across various strategies. Swaptions (or options on interest rate swap contracts) were used to hedge interest rate exposure and manage the Fund’s exposure to potential market volatility. Options on futures were used within the Government/Swaps strategy to allow the Fund the right to enter into futures contracts. Credit default swaps were employed to implement specific credit-related investment strategies. Equity index futures were used as a means of reducing Fund volatility. Within the Fundamental Currency strategy, the Fund used non-deliverable currency forwards to gain exposure to a particular country and also to take advantage of relative value opportunities. The Fund also utilized forward foreign currency exchange contracts and currency options within the Fundamental Currency strategy to take long or short positions. Within the Emerging Markets Debt Strategy, the Fund employed cross currency swaps to express relative views on given currencies as well as our views on the direction of a country’s interest rates. Derivatives and similar instruments allow us to manage interest rate, credit and currency risks more effectively by allowing us both to apply active investment views with greater versatility and to afford greater risk management precision than we would otherwise be able to implement. |
6
PORTFOLIO RESULTS
| Q | | Were there any notable changes in the Fund’s weightings during the Reporting Period? |
| A | | During the Reporting Period, we increased the Fund’s yield curve steepening positions, particularly its curve steepening position in the European government bond yield curve. We also increased its exposure to certain emerging markets currencies, such as the Mexican peso, Colombian peso, Chilean peso and Russian ruble. |
| Q | | How was the Fund positioned at the end of the Reporting Period? |
| A | | At the end of the Reporting Period, within our Government and Swaps strategy, the Fund was positioned with a curve steepening position in the European government bond yield curve. Within our Country Relative Value strategy, it held a long position in peripheral European interest rates. It also held long positions in European, Australian and Canadian interest rates and short positions in U.S., U.K. and Swedish interest rates. In our Currency strategy, the Fund had short positions in developed markets currencies, expressed through short positions in the euro, Japanese yen and Swedish krona. Among emerging markets currencies, the Fund held long positions in the Mexican peso, Chilean peso and Colombian peso, while it had short positions in the Chinese renminbi, South Korean won and Israeli new shekel. To offset potential currency risk, the Fund employed a U.S. dollar hedge at the end of the Reporting Period. Within our Sector Allocation strategy, the Fund held a long position in non-agency mortgage-backed securities. In our Emerging Markets Debt strategy, the Fund held a long position in Puerto Rican external bonds and a short position in Chinese external bonds. It had a long position in Mexican local interest rates and short positions in Hungarian, Malaysian and South Korean local interest rates. Within our Commodities strategy, the Fund had short positions in agriculture and energy. At the end of the Reporting Period, we maintained the Fund’s macro hedge in which it held a short position in S&P 500® Index futures. |
| Q | | What is the Fund’s tactical view and strategy for the months ahead? |
| A | | At the end of the Reporting Period, we had not changed our broadly positive view for the global economy, though we did see less cause for optimism. We believe the economic slowdown in the emerging markets is constraining global economic growth overall. Further, in our view, U.S. and European economic momentum is moderating, and Japan is facing stronger headwinds. The risks of policy missteps in China have manifested, in our view, raising the prospect of further volatility in the fixed income markets. Additionally, we think the benefits of lower oil prices are fading, with no end in sight for the downward trend in the commodities markets. |
| | | We believed, at the end of the Reporting Period, that the U.S. economy was caught in the cross-currents of domestic strength and global weakness. In our view, the U.S. is likely to benefit from labor market tightening as well as from improvements in the housing market and in retail sales. Risks include tight financial conditions and weak global demand, while production cuts in the energy sector could have an impact on capital expenditures. Although the Fed may yet raise rates in 2015, we believe the odds of a delay are growing. |
| | | In the Eurozone, economic growth momentum appears to have flattened. The Syrian refugee crisis seems to have replaced worries about a potential Greek exit as the dominant policy challenge. We think the European Central Bank is likely to expand its quantitative easing in early 2016. In the U.K., we expect economic growth data to remain positive and believe an interest rate hike by the Bank of England in early 2016 is possible. However, we do not expect the U.K. central bank to move before the Fed acts. Japan faces a possible relapse into recession, and we believe the Bank of Japan will probably ease again in the near term. In the emerging markets we believe that, economic growth has weakened under the combined pressures of the commodities slump, China’s economic slowdown, U.S. dollar strength and fears of Fed policy tightening. |
|
| |
| Index Definition |
| |
| The Bank of America Merrill Lynch U.S. Dollar Three-Month LIBOR Constant Maturity Index (the “Index”) tracks the performance of a synthetic asset paying LIBOR to a stated maturity. The Index is based on the assumed purchase at par of a synthetic instrument having exactly its stated maturity and with a coupon equal to that day’s fixing rate. That issue is assumed to be sold the following business day (priced at yield equal to the current day fixing rate) and rolled into a new instrument. |
7
FUND BASICS
Fixed Income Macro Strategies Fund
as of September 30, 2015
| | | | | | | | | | |
| | PERFORMANCE REVIEW | |
| | | April 1, 2015–
September 30, 2015 | | Fund Total Return
(based on NAV)1 | | | Bank of America Merrill Lynch
U.S. Dollar Three-Month LIBOR
Constant Maturity Index2 | |
| | Class A | | | 3.36 | % | | | 0.14 | % |
| | Class C | | | 3.03 | | | | 0.14 | |
| | Institutional | | | 3.43 | | | | 0.14 | |
| | Class IR | | | 3.30 | | | | 0.14 | |
| | | Class R | | | 3.08 | | | | 0.14 | |
| | 1 | | The net asset value (“NAV”) represents the net assets of the class of the Fund (ex-dividend) divided by the total number of shares of the class outstanding. The Fund’s performance reflects the reinvestment of dividends and other distributions. The Fund’s performance does not reflect the deduction of any applicable sales charges. |
| | 2 | | The Bank of America Merrill Lynch U.S. Dollar Three-Month LIBOR Constant Maturity Index (the “Index”) tracks the performance of a synthetic asset paying LIBOR to a stated maturity. The Index is based on the assumed purchase at par of a synthetic instrument having exactly its stated maturity and with a coupon equal to that day’s fixing rate. That issue is assumed to be sold the following business day (priced at yield equal to the current day fixing rate) and rolled into a new instrument. |
| | | | | | | | | | | | |
| | STANDARDIZED TOTAL RETURNS3 |
| | | For the period ended 9/30/15 | | One Year | | | Since Inception | | | Inception Date |
| | Class A | | | -8.46 | % | | | -5.68 | % | | 12/16/13 |
| | Class C | | | -6.14 | | | | -3.84 | | | 12/16/13 |
| | Institutional | | | -4.67 | | | | -3.39 | | | 12/16/13 |
| | Class IR | | | -4.83 | | | | -3.61 | | | 12/16/13 |
| | | Class R | | | -5.10 | | | | -3.77 | | | 12/16/13 |
| | 3 | | The Standardized Total Returns are average annual total returns as of the most recent calendar quarter-end. They assume reinvestment of all distributions at NAV. These returns reflect a maximum initial sales charge of 3.75% for Class A Shares and the assumed contingent deferred sales charge for Class C Shares (1% if redeemed within 12 months of purchase). Because Institutional, Class IR and Class R Shares do not involve a sales charge, such a charge is not applied to their Standardized Total Returns. |
The returns set forth in the tables above represent past performance. Past performance does not guarantee future results. The Fund’s investment return and principal value will fluctuate so that an investor’s shares, when redeemed, may be worth more or less than their original cost. Current performance may be lower or higher than the performance quoted above. Please visit our web site at www.GSAMFUNDS.com to obtain the most recent month-end returns. Performance reflects applicable fee waivers and/or expense limitations in effect during the periods shown. In their absence, performance would be reduced. Returns do not reflect the deduction of taxes that a shareholder would pay on Fund distributions or the redemption of Fund shares.
8
FUND BASICS
| | | | | | | | | | |
| | EXPENSE RATIOS4 | |
| | | | | Net Expense Ratio (Current) | | | Gross Expense Ratio (Before Waivers) | |
| | Class A | | | 1.80 | % | | | 3.26 | % |
| | Class C | | | 2.55 | | | | 4.27 | |
| | Institutional | | | 1.46 | | | | 2.69 | |
| | Class IR | | | 1.54 | | | | 2.87 | |
| | | Class R | | | 2.05 | | | | 3.30 | |
| | 4 | | The expense ratios of the Fund, both current (net of applicable fee waivers and/or expense limitations) and before waivers (gross of applicable fee waivers and/or expense limitations) are as set forth above according to the most recent publicly available Prospectus for the Fund and may differ from the expense ratios disclosed in the Financial Highlights in this report. Pursuant to a contractual arrangement, the Fund’s waivers and/or expense limitations will remain in place through at least July 29, 2016, and prior to such date the Investment Adviser may not terminate the arrangements without the approval of the Fund’s Board of Trustees. If these arrangements are discontinued in the future, the expense ratios may change without shareholder approval. |
| | |
| | FUND COMPOSITION5 (%) |
| | | Percentage of Net Assets |
| | 5 | | The percentage shown for each investment category reflects the value of investments in that category as a percentage of net assets. Short-term investments represent repurchase agreements. Figures in the graph may not sum to 100% due to the exclusion of other assets and liabilities. The graph depicts the Fund’s investments but may not represent the Fund’s market exposure due to the exclusion of certain derivatives, if any, as listed in the Additional Investment Information section of the Schedule of Investments. |
| | 6 | | “Agency Debentures” include agency securities offered by companies such as Federal National Mortgage Association (“FNMA”) and Federal Home Loan Mortgage Corp. (“FHLMC”), which operate under a government charter. While they are required to report to a government regulator, their assets are not explicitly guaranteed by the government and they otherwise operate like any other publicly traded company. |
| | 7 | | “Federal Agencies” are mortgage-backed securities guaranteed by the Government National Mortgage Association (“GNMA”), FNMA and FHLMC. GNMA instruments are backed by the full faith and credit of the U.S. Government. |
9
GOLDMAN SACHS LONG SHORT CREDIT STRATEGIES FUND
What Differentiates Goldman Sachs’ Long Short Credit Strategies Fund Investment Process?
The Goldman Sachs Long Short Credit Strategies Fund (the “Fund”) seeks an absolute return comprised of income and capital appreciation.
The Fund uses a bottom-up, fundamental approach with a focus on high conviction ideas across the corporate credit spectrum. Inefficiencies in the credit markets may provide attractive opportunities for investors. The Fund seeks to capitalize on these through an unconstrained approach, security selection and providing active downside management.

| n | | The Fund is not limited by the traditional constraints of a benchmark strategy. |
| n | | The Fund uses a flexible and dynamic strategy that allows it to invest across the spectrum of corporate credit while seeking what we believe are the most attractive risk-adjusted return opportunities. |
| n | | The Fund invests across the spectrum of corporate credit including high yield, investment grade, bank loans, convertibles and preferred equity. |

| n | | The Fund seeks to identify issuers that offer compelling value through bottom-up security selection, with a focus on capital preservation. |
| n | | The Fund’s investment approach allows for flexibility in security selection, irrespective of industry, ratings and maturity constraints. |

| n | | The Fund manages long and short exposures to potentially generate absolute returns. A hedged approach allows the Fund to deploy tactical portfolio tilts via high yield index shorts. |
| n | | Dynamic portfolio management may enhance downside mitigation while providing investors access to security selection expertise. |
10
PORTFOLIO RESULTS
Goldman Sachs Long Short Credit Strategies Fund
Investment Objective
The Fund seeks an absolute return comprised of income and capital appreciation.
Portfolio Management Discussion and Analysis
Below, the Goldman Sachs Liberty Harbor Portfolio Management Team discusses the Goldman Sachs Long Short Credit Strategies Fund’s (the “Fund”) performance and positioning for the six-month period ended September 30, 2015 (the “Reporting Period”).
| Q | | How did the Fund perform during the Reporting Period? |
| A | | During the Reporting Period, the Fund’s Class A, C, Institutional, IR and R Shares generated cumulative total returns, without sales charges, of -1.53%, -1.90%, -1.26%, -1.41% and -1.56%. These returns compare to the 0.14% cumulative total return of the Fund’s benchmark, the Bank of America Merrill Lynch U.S. Dollar Three-Month LIBOR Constant Maturity Index (the “BofA/Merrill Lynch Index”), during the same time period. |
| | | Because the composition of the BofA/Merrill Lynch Index (e.g. short-term cash securities) is not comparable to the range of instruments in which the Fund may transact (e.g., various credit-related instruments), references to the BofA/Merrill Lynch Index are for informational purposes only and not an indication of how the Fund is managed. |
| Q | | What economic and market factors most influenced the corporate credit markets as a whole during the Reporting Period? |
| A | | During the Reporting Period, corporate credit market performance was influenced most by heightened market volatility, driven, in turn, by global market uncertainty, persistent weakness in commodity prices and speculation that the Federal Reserve (the “Fed”) may increase interest rates. Concern regarding China’s economic slowdown and Greece’s debt crisis were primary drivers of global market uncertainty. The energy sector continued to experience significant weakness on dramatically lower commodity prices. There was increased anticipation leading up to the Fed’s meeting in September 2015 about if and when the Fed would impose its first interest rate hike since 2006. The combination of these factors led to a sell-off in equity and credit markets during the third calendar quarter. |
| | | Amid a backdrop of market volatility, high yield mutual funds experienced year-to-date through September 30, 2015 net outflows of approximately $10 billion. Loan funds experienced negative flows, bringing year-to-date through September 30, 2015 outflows to approximately $13 billion. The increase in volatility in the third quarter of 2015 led to increased widening of spreads, or yield differentials compared to U.S. Treasuries. High yield mutual funds and exchange-traded funds (“ETFs”) experienced increased outflows in September 2015, as market liquidity retreated and spreads widened. Bank loans also saw negative performance amid weak supply and negative fund flows. Investment grade credit performance held rather steady during the third quarter of 2015, as higher quality credit generally outperformed lower rated credit. |
| Q | | What key factors were responsible for the Fund’s performance during the Reporting Period? |
| A | | As a part of our investment philosophy, we apply a value- oriented approach to credit market investing, with a focus on capital preservation via high conviction ideas. Consistent with the cornerstone of our fundamentally-based investment process focused on bottom-up security selection, the Fund’s performance during the Reporting Period was attributable to individual security selection and to tactical management of the Fund’s short index position. |
| | | We entered the Reporting Period with a cautious view, as there was, in our opinion, beginning to be greater dispersion among corporate credit securities. Corporate credit markets were mixed during the second quarter of 2015, but an increase in volatility, coupled with more negative sentiment and uncertainty, dominated the third quarter of 2015, driven |
11
PORTFOLIO RESULTS
| | primarily by technical, or supply/demand, shifts and spread widening in the high yield corporate bond sector. In such an environment, security selection proved to be paramount to navigating the current credit cycle. |
| | | Overall, the Fund’s long positioning detracted during the Reporting Period. Long positions in consumer cyclical/non- cyclicals and energy credits particularly detracted, though these were partially offset by select long positions in non- bank financials, which contributed modestly positively. |
| | | Tactical management of the Fund’s short position in a high yield credit default swap index was a positive contributor to the Fund’s performance, partially offsetting losses within long positions. |
| | | Importantly, since the Fund’s portfolio is constructed through bottom-up, fundamental research and not relative to a benchmark, there is no requirement to hold issues from any single company. |
| Q | | Which segments of the corporate credit sector most significantly affected Fund performance? |
| A | | The corporate credit markets, as mentioned earlier, broadly experienced volatility during the Reporting Period, driven, in our view, by a global economic slowdown in growth stemming China, persistent downward trends in energy prices and shifting macroeconomic policies. As a result, the Fund’s long positioning in select credits across a wide spectrum of market segments detracted from performance during the Reporting Period. |
| Q | | Did the Fund’s duration and yield curve positioning strategy help or hurt its results during the Reporting Period? |
| A | | The Fund does not use duration and yield curve positioning as active management strategies within its investment process. However, the Fund does implement interest rate swaps, which serve as a hedge to select long positions. The Fund’s interest rate swap positions modestly detracted from performance during the Reporting Period. |
| Q | | How did the Fund use derivatives and similar instruments during the Reporting Period? |
| A | | The Fund used credit default swaps via a short position in a credit default swap high yield index to tactically hedge market risk, which contributed positively to performance. The Fund used interest rate swaps to hedge the interest rate risk of certain bonds, thereby limiting the Fund’s exposure to changes in interest rates. Interest rate swaps modestly detracted from Fund performance during the Reporting |
| | Period. The Fund used foreign currency exchange forward contracts to hedge the currency risk in non-U.S. dollar- denominated issues to U.S. dollars. This had a rather neutral impact on the Fund’s performance during the Reporting Period. |
| Q | | Were there any notable changes in the Fund’s weightings during the Reporting Period? |
| A | | During the Reporting Period, we continued to pursue investment opportunities based on fundamental, bottom-up research, which, in our view, offered compelling risk-adjusted return potential. We maintained our favor toward short-dated high yield credit securities, which, in our view, offer attractive risk-adjusted yields and some insulation from a potential increase in interest rates. We modestly increased the Fund’s exposure to telecommunication services companies, as we believe these credits offer an attractive risk and yield profile. |
| Q | | How was the Fund positioned at the end of September 2015? |
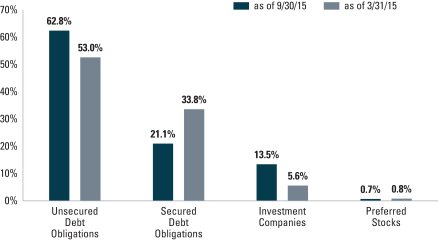
| A | | As of September 30, 2015, approximately 63% of the Fund’s total net assets was invested in unsecured debt obligations, 21% in secured debt obligations, 1% in preferred and other equity securities and 14% in cash and cash equivalents. The Fund’s notional derivative exposure, calculated as a percentage of total net assets, was -26% in a credit default swap high yield index. The Fund had a total of 110 holdings from 79 issuers at September 30, 2015, with the Fund’s top long corporate issuers, as measured by a percentage of total net assets invested, being Bombardier, Altice Financing and Windstream Services. |
| Q | | What is the Fund’s tactical view and strategy for the months ahead? |
| A | | At the end of the Reporting Period, we believed there may be greater periods of volatility in the corporate credit markets going forward, driven by changes in Fed policy and by growing concerns surrounding global economic growth. We remain focused on these factors and others that may potentially impact the markets. |
| | | Given this view, we believe a sound approach grounded in fundamentals with a focus on capital preservation may offer a compelling means to navigate the current and anticipated market environment in the months ahead. We believe heightened volatility may lead to periods of technical dislocations in the market, which may provide for attractive single-name investing opportunities. The Fund’s ability to be |
12
PORTFOLIO RESULTS
| | flexible across the corporate credit spectrum — high yield, loans, bank loans and investment grade credit — enables the Fund to step in and seek to take advantage of market opportunities when inefficiencies arise. |
| | | At the end of the Reporting Period, the Fund was defensively positioned given our cautious view of the market. The Fund continued to focus on higher quality issuers in the capital structure and companies with strong cash flow. Our investment team has been identifying several new investment opportunities amidst the increased market volatility. For example, recent activity in the U.S. telecommunications industry resulted in the addition of several credits within the segment. Overall, on the long side, the Fund was approximately 85% invested at the end of the Reporting Period and had a short notional position of approximately 26% in a credit default swap high yield index, reflecting our defensive positioning. |
| | | In short, we believe the Fund’s focus on individual security selection is increasingly important given the recent and anticipated market environment. We believe our single-name security selection approach should help mitigate the potential impact of volatility and provide for attractive risk-adjusted return opportunities as we navigate the credit cycle going forward. In the months ahead, our investment team will continue to perform rigorous fundamental analysis to identify what we believe to be the most attractive investment opportunities on a risk-adjusted basis. |
13
FUND BASICS
Long Short Credit Strategies Fund
as of September 30, 2015
| | | | | | | | | | | | | | | | | | |
| | PERFORMANCE REVIEW | |
| | | April 1, 2015–
September 30, 2015 | | Fund Total Return
(based on NAV)1 | | | Bank of America Merrill
Lynch U.S. Dollar Three-
Month LIBOR Constant
Maturity2 | | | 30-Day
Standardized
Subsidized
Yield3 | | | 30-Day
Standardized
Unsubsidized
Yield3 | |
| | Class A | | | -1.53 | % | | | 0.14 | % | | | 3.88 | % | | | 4.17 | % |
| | Class C | | | -1.90 | | | | 0.14 | | | | 3.27 | | | | 3.58 | |
| | Institutional | | | -1.26 | | | | 0.14 | | | | 4.37 | | | | 4.67 | |
| | Class IR | | | -1.41 | | | | 0.14 | | | | 4.29 | | | | 4.59 | |
| | | Class R | | | -1.56 | | | | 0.14 | | | | 3.77 | | | | 4.06 | |
| | 1 | | The net asset value (“NAV”) represents the net assets of the Fund (ex-dividend) divided by the total number of shares outstanding. The Fund’s performance assumes the reinvestment of dividends and other distributions. The Fund’s performance does not reflect the deduction of any applicable sales charges. |
| | 2 | | The Bank of America Merrill Lynch U.S. Dollar Three-Month LIBOR Constant Maturity Index (the “BofA/Merrill Lynch Index”) tracks the performance of a synthetic asset paying LIBOR to a stated maturity. The BofA/Merrill Lynch Index is based on the assumed purchase at par of a synthetic instrument having exactly its stated maturity and with a coupon equal to that day’s fixing rate. That issue is assumed to be sold the following business day (priced at a yield equal to the current day fixing rate) and rolled into a new instrument. |
| | 3 | | The method of calculation of the 30-Day Standardized Subsidized Yield is mandated by the Securities and Exchange Commission and is determined by dividing the net investment income per share earned during the last 30 days of the period by the maximum public offering price (“POP”) per share on the last day of the period. This number is then annualized. The 30-Day Standardized Subsidized Yield reflects fee waivers and/or expense reimbursements recorded by the Fund during the period. Without waivers and/or reimbursements, yields would be reduced. This yield does not necessarily reflect income actually earned and distributed by the Fund and, therefore, may not be correlated with the dividends or other distributions paid to shareholders. The 30-Day Standardized Unsubsidized Yield does not adjust for any fee waivers and/ or expense reimbursements in effect. If the Fund does not incur any fee waivers and/or expense reimbursements during the period, the 30-Day Standard Subsidized Yield and 30-Day Standardized Unsubsidized Yield will be identical. |
14
FUND BASICS
| | | | | | | | | | | | | | | | |
| | STANDARDIZED TOTAL RETURNS4 |
| | | For the period ended 9/30/15 | | One Year | | | Five Years | | | Since Inception | | | Inception Date |
| | Class A5 | | | -7.50 | % | | | N/A | | | | -5.94 | % | | 4/30/14 |
| | Class C5 | | | -5.59 | | | | N/A | | | | -4.10 | | | 4/30/14 |
| | Institutional6 | | | -3.60 | | | | 3.90 | % | | | 5.79 | | | 3/24/14 |
| | Class IR5 | | | -3.78 | | | | N/A | | | | -3.13 | | | 4/30/14 |
| | | Class R5 | | | -4.16 | | | | N/A | | | | -3.59 | | | 4/30/14 |
| | 4 | | Standardized Total Returns are average annual total returns as of the most recent calendar quarter-end. They assume reinvestment of all distributions at NAV. These returns reflect the maximum initial sales charge of 3.75% for Class A Shares and the assumed contingent deferred sales charge for Class C Shares (1.00% if redeemed within 12 months of purchase). Because Institutional, Class R and Class IR Shares do not involve a sales charge, such a charge is not applied to their Standardized Total Returns. |
| | 5 | | The Standardized Total Returns do not correlate to the average annual total returns provided in the Fund’s Prospectus, which reflect the performance of the Institutional Shares for the period between March 24, 2014 and April 30, 2014 and of the Predecessor Fund’s Common Shares prior to March 24, 2014. |
| | 6 | | The average annual total return figures for the Fund’s Institutional Shares, which do not impose an initial sales charge, do not reflect an initial sales charge for the periods shown. Prior to March 24, 2014 (the effective date of the reorganization of the Goldman Sachs Credit Strategies Fund (“the Predecessor Fund”) into the Fund), the maximum initial sales charge applicable to sales of Common Shares of the Predecessor Fund was 2.50%, which is not reflected in the average annual total return figures shown. The Predecessor Fund commenced operations on June 15, 2009. |
The returns set forth in the tables above represent past performance. Past performance does not guarantee future results. The Fund’s investment return and principal value will fluctuate so that an investor’s shares, when redeemed, may be worth more or less than their original cost. Current performance may be lower or higher than the performance quoted above. Please visit our web site at www.GSAMFUNDS.com to obtain the most recent month-end returns. Performance reflects applicable fee waivers and/or expense limitations in effect during the period shown. In their absence, performance would be reduced. Returns do not reflect the deduction of taxes that a shareholder would pay on Fund distributions or the redemption of Fund shares.
Effective at the close of business on March 21, 2014, the Goldman Sachs Credit Strategies Fund (the “Predecessor Fund”), a closed-end management investment company that was operated as an “interval fund,” was reorganized with and into the Fund. Because the Predecessor Fund is the accounting survivor, the Fund has assumed the Predecessor Fund’s historical performance. The performance information shown in this report is for the Predecessor Fund for the period prior to March 24, 2014, and reflects the Predecessor Fund’s investment strategies and policies. However, the Fund’s current investment strategies and policies, including the ability to implement short positions, are different from those of the Predecessor Fund, with shareholders of the Predecessor Fund receiving Institutional Shares of the Fund upon consummation of the reorganization. As a result, the Fund’s performance may differ substantially from what is shown for periods prior to March 24, 2014.
15
FUND BASICS
| | | | | | | | | | |
| | EXPENSE RATIOS6 | |
| | | | | Net Expense Ratio (Current) | | | Gross Expense Ratio (Before Waivers) | |
| | Class A | | | 1.48 | % | | | 1.62 | % |
| | Class C | | | 2.23 | | | | 2.39 | |
| | Institutional Shares | | | 1.13 | | | | 1.30 | |
| | Class IR | | | 1.22 | | | | 1.41 | |
| | | Class R | | | 1.73 | | | | 1.90 | |
| | 6 | | The expense ratios of the Fund, both current (net of applicable fee waivers and/or expense limitations) and before waivers (gross of applicable fee waivers and/or expense limitations) are as set forth above according to the most recent publicly available Prospectus for the Fund and may differ from the expense ratios disclosed in the Financial Highlights in this report. Pursuant to a contractual arrangement, the Fund’s waivers and/or expense limitations will remain in place through at least July 29, 2016, and prior to such date the Investment Adviser may not terminate the arrangements without the approval of the Fund’s Board of Trustees. If these arrangements are discontinued in the future, the expense ratios may change without shareholder approval. |
| | |
| | SECTOR ALLOCATIONS7 |
| | | Percentage of Net Assets |
| | 7 | | The percentage shown for each investment category reflects the value of investments in that category as a percentage of net assets. Short-term investments represent repurchase agreements. Figures in the graph may not sum to 100% due to the exclusion of other assets and liabilities. The graph depicts the Fund’s investments but may not represent the Fund’s market exposure due to the exclusion of certain derivatives, if any, as listed in the Additional Investment Information section of the Schedule of Investments. |
16
FUND BASICS
| | | | | | |
| | TOP TEN INDUSTRY ALLOCATIONS8 | |
| | | As of September 30, 2015 | | Percentage of Net Assets | |
| | Investment Companies | | | 13.5 | % |
| | Automotive | | | 9.2 | |
| | Finance | | | 7.5 | |
| | Energy – Exploration & Production | | | 6.3 | |
| | Media – Cable | | | 6.2 | |
| | Telecommunications – Wirelines | | | 6.2 | |
| | Media – Non Cable | | | 5.9 | |
| | Health Care – Services | | | 5.9 | |
| | Consumer Cyclical Services | | | 3.6 | |
| | | Aerospace & Defense | | | 3.6 | |
| | 8 | | The percentage shown for each investment category reflects the value of investments in that category as a percentage of net assets. The above table depicts the Fund’s investments but may not represent the Fund’s market exposure due to the exclusion of certain derivatives, if any, as listed in the Additional Investment Information section of the Schedule of Investments. |
17
GOLDMAN SACHS FIXED INCOME MACRO STRATEGIES FUND
Consolidated Schedule of Investments
September 30, 2015 (Unaudited)
| | | | | | | | | | | | | | |
Principal
Amount | | | Interest
Rate | | | Maturity
Date | | | Value | |
| | | | | | | | | | | | | | |
| | Foreign Sovereign Debt Obligations – 13.8% | |
| | Brazilian Real – 1.0% | |
| Brazil Letras do Tesouro Nacional(a) | |
| BRL | 1,905,000 | | | | 0.000 | % | | | 01/01/16 | | | $ | 464,311 | |
| Brazil Notas do Tesouro Nacional | |
| | 1,282,139 | | | | 6.000 | | | | 08/15/50 | | | | 269,264 | |
| | | | | | | | | | | | | | |
| | | | | | | | | | | | | 733,575 | |
| | |
| | British Pound – 1.8% | |
| United Kingdom Treasury | |
| GBP | 630,000 | | | | 4.750 | | | | 12/07/30 | | | | 1,278,655 | |
| | |
| | Dominican Peso – 0.9% | |
| Dominican Republic | |
| DOP | 3,900,000 | | | | 15.000 | | | | 04/05/19 | | | | 99,054 | |
| | 1,300,000 | | | | 16.000 | | | | 07/10/20 | | | | 35,471 | |
| | 23,000,000 | | | | 11.375 | | | | 07/06/29 | | | | 526,883 | |
| | | | | | | | | | | | | | |
| | | | | | | | | | | | | 661,408 | |
| | |
| | Euro – 6.2% | |
| Italy Buoni Poliennali Del Tesoro | |
| EUR | 331,123 | | | | 2.100 | | | | 09/15/16 | | | | 378,470 | |
| | 1,181,826 | | | | 2.350 | | | | 09/15/19 | | | | 1,440,876 | |
| | 610,000 | | | | 3.750 | | | | 05/01/21 | | | | 783,222 | |
| | 620,000 | | | | 5.500 | | | | 11/01/22 | | | | 885,618 | |
| Republic of Croatia | |
| | 220,000 | | | | 3.875 | | | | 05/30/22 | | | | 246,345 | |
| Spain Government Bond(b) | |
| | 420,000 | | | | 5.500 | | | | 04/30/21 | | | | 581,491 | |
| | 35,000 | | | | 3.800 | | | | 04/30/24 | | | | 45,499 | |
| | | | | | | | | | | | | | |
| | | | | | | | | | | | | 4,361,521 | |
| | |
| | Russian Ruble – 2.2% | |
| Russian Federation Bond | |
| RUB | 7,270,000 | | | | 7.000 | | | | 08/16/23 | | | | 88,525 | |
| | 63,900,000 | | | | 8.150 | | | | 02/03/27 | | | | 816,371 | |
| | 56,990,000 | | | | 7.050 | | | | 01/19/28 | | | | 657,029 | |
| | | | | | | | | | | | | | |
| | | | | | | | | | | | | 1,561,925 | |
| | |
| | United States Dollar – 1.7% | |
| Dominican Republic | |
| $ | 360,000 | | | | 5.875 | | | | 04/18/24 | | | | 356,850 | |
| | 400,000 | | | | 6.850 | (b) | | | 01/27/45 | | | | 384,500 | |
| Republic of Costa Rica | |
| | 200,000 | | | | 5.625 | | | | 04/30/43 | | | | 149,750 | |
| Republic of Venezuela | |
| | 70,000 | | | | 7.750 | | | | 10/13/19 | | | | 23,975 | |
| | 10,000 | | | | 6.000 | | | | 12/09/20 | | | | 3,300 | |
| | 40,000 | | | | 12.750 | | | | 08/23/22 | | | | 17,100 | |
| | 240,000 | | | | 9.000 | | | | 05/07/23 | | | | 82,200 | |
| | 90,000 | | | | 8.250 | | | | 10/13/24 | | | | 30,150 | |
| | 60,000 | | | | 7.650 | | | | 04/21/25 | | | | 19,950 | |
| | 30,000 | | | | 11.750 | | | | 10/21/26 | | | | 11,550 | |
| | 50,000 | | | | 9.250 | | | | 05/07/28 | | | | 16,750 | |
| | 60,000 | | | | 11.950 | | | | 08/05/31 | | | | 23,400 | |
| | 20,000 | | | | 9.375 | | | | 01/13/34 | | | | 6,900 | |
| | 10,000 | | | | 7.000 | | | | 03/31/38 | | | | 3,225 | |
| | |
| | | | | | | | | | | | | | |
| | Foreign Sovereign Debt Obligations – (continued) | |
| | United States Dollar – (continued) | |
| United Mexican States | |
| $ | 30,000 | | | | 4.000 | % | | | 10/02/23 | | | $ | 30,555 | |
| | 20,000 | | | | 5.550 | | | | 01/21/45 | | | | 20,500 | |
| | | | | | | | | | | | | | |
| | | | | | | | | | | | | 1,180,655 | |
| | |
| | TOTAL FOREIGN SOVEREIGN DEBT OBLIGATIONS | |
| | (Cost $10,351,691) | | | $ | 9,777,739 | |
| | |
| | | | | | | | | | | | | | |
| | Mortgage-Backed Obligations – 12.1% | |
| | Adjustable Rate Non-Agency(c) – 1.2% | |
| Countrywide Alternative Loan Trust Series 2007-HY6, Class A1 | |
| $ | 136,291 | | | | 0.409 | % | | | 08/25/47 | | | $ | 110,248 | |
| Countrywide Alternative Loan Trust Series 2007-OH1,
Class A1D |
|
| | 296,358 | | | | 0.409 | | | | 04/25/47 | | | | 221,935 | |
| Countrywide Home Loan Mortgage Pass-Through Trust
Series 2005-7, Class 2A1 |
|
| | 204,033 | | | | 0.819 | | | �� | 03/25/35 | | | | 170,976 | |
| JPMorgan Mortgage Trust Series 2007-A1, Class 2A2 | |
| | 138,238 | | | | 2.594 | | | | 07/25/35 | | | | 136,129 | |
| Master Adjustable Rate Mortgages Trust Series 2007-HF2,
Class A1 |
|
| | 203,898 | | | | 0.509 | | | | 09/25/37 | | | | 183,355 | |
| | | | | | | | | | | | | | |
| | | | | | | | | | | | | 822,643 | |
| | |
| | Collateralized Mortgage Obligations – 4.4% | |
| | Interest Only(d) – 0.8% | |
| FNMA REMIC Series 2015-34, Class LS(c) | |
| | 966,305 | | | | 5.906 | | | | 06/25/45 | | | | 211,554 | |
| GNMA REMIC Series 2013-183, Class NI | |
| | 1,303,121 | | | | 4.500 | | | | 10/20/42 | | | | 188,861 | |
| GNMA REMIC Series 2015-95, Class GI | |
| | 933,785 | | | | 4.500 | | | | 07/16/45 | | | | 197,745 | |
| | | | | | | | | | | | | | |
| | | | | | | | | | | | | 598,160 | |
| | |
| | Inverse Floaters(c) – 3.5% | |
| FHLMC REMIC Series 4431, Class ST | |
| | 962,284 | | | | 5.893 | | | | 01/15/45 | | | | 224,785 | |
| FNMA REMIC Series 2013-96, Class SW | |
| | 653,993 | | | | 5.906 | | | | 09/25/43 | | | | 106,048 | |
| FNMA REMIC Series 2014-19, Class MS | |
| | 541,286 | | | | 6.406 | | | | 11/25/39 | | | | 87,805 | |
| FNMA REMIC Series 2015 | |
| | 1,000,000 | | | | 6.054 | | | | 10/01/45 | | | | 158,218 | |
| FNMA REMIC Series 2015-20, Class ES | |
| | 959,556 | | | | 5.956 | | | | 04/25/45 | | | | 230,897 | |
| FNMA REMIC Series 2015-22, Class DS | |
| | 962,415 | | | | 6.006 | | | | 04/25/45 | | | | 224,066 | |
| GNMA REMIC Series 2010-1, Class SD | |
| | 144,781 | | | | 5.574 | | | | 01/20/40 | | | | 24,674 | |
| GNMA REMIC Series 2010-31, Class SA | |
| | 967,574 | | | | 5.534 | | | | 03/20/40 | | | | 143,293 | |
| GNMA REMIC Series 2010-37, Class SG | |
| | 671,614 | | | | 5.484 | | | | 03/20/40 | | | | 100,314 | |
| | |
| | |
| 18 | | The accompanying notes are an integral part of these financial statements. |
GOLDMAN SACHS FIXED INCOME MACRO STRATEGIES FUND
| | | | | | | | | | | | | | |
Principal
Amount | | | Interest
Rate | | | Maturity
Date | | | Value | |
| | | | | | | | | | | | | | |
| | Mortgage-Backed Obligations – (continued) | |
| | Inverse Floaters(c) – (continued) | |
| GNMA REMIC Series 2010-85, Class SN | |
| $ | 545,425 | | | | 5.724 | % | | | 07/20/40 | | | $ | 97,076 | |
| GNMA REMIC Series 2010-90, Class ES | |
| | 358,225 | | | | 5.734 | | | | 07/20/40 | | | | 56,572 | |
| GNMA REMIC Series 2013-113, Class SA | |
| | 604,348 | | | | 6.484 | | | | 08/20/43 | | | | 111,382 | |
| GNMA REMIC Series 2015-110, Class MS | |
| | 1,181,472 | | | | 5.494 | | | | 08/20/45 | | | | 190,240 | |
| GNMA REMIC Series 2015-111, Class SM | |
| | 993,075 | | | | 5.984 | | | | 08/20/45 | | | | 183,167 | |
| GNMA REMIC Series 2015-112, Class SB | |
| | 984,560 | | | | 5.524 | | | | 08/20/45 | | | | 161,843 | |
| GNMA REMIC Series 2015-126, Class HS | |
| | 2,000,000 | | | | 6.001 | | | | 09/20/45 | | | | 371,179 | |
| | | | | | | | | | | | | | |
| | | | | | | | | | | | | 2,471,559 | |
| | |
| | Regular Floater(c) – 0.1% | |
| Countrywide Alternative Loan Trust Series 2005-26CB, Class A1 | |
| | 15,143 | | | | 0.699 | | | | 07/25/35 | | | | 11,613 | |
| Countrywide Alternative Loan Trust Series 2005-77T1,
Class 1A3 |
|
| | 84,723 | | | | 0.599 | | | | 02/25/36 | | | | 57,762 | |
| Residential Accredit Loans, Inc. Series 2005-QS10, Class 3A1 | |
| | 15,620 | | | | 0.699 | | | | 08/25/35 | | | | 11,488 | |
| | | | | | | | | | | | | | |
| | | | | | | | | | | | | 80,863 | |
| | |
| TOTAL COLLATERALIZED MORTGAGE
OBLIGATIONS |
| | $ | 3,150,582 | |
| | |
| | Commercial Mortgage-Backed Securities – 5.0% | |
| | Sequential Fixed Rate – 2.6% | |
| FHLMC Multifamily Structured Pass-Through Certificates
Series K044, Class A2 |
|
| $ | 1,800,000 | | | | 2.811 | % | | | 01/25/25 | | | $ | 1,822,045 | |
| | |
| | Sequential Floating Rate(c) – 2.4% | |
| Credit Suisse Commercial Mortgage Trust Series 2007-C2,
Class A1A |
|
| | 410,732 | | | | 5.526 | | | | 01/15/49 | | | | 427,511 | |
| GS Mortgage Securities Trust Series 2007-GG10, Class A1A | |
| | 1,205,167 | | | | 5.988 | | | | 08/10/45 | | | | 1,279,213 | |
| | | | | | | | | | | | | | |
| | | | | | | | | | | | | 1,706,724 | |
| | |
| TOTAL COMMERCIAL
MORTGAGE-BACKED SECURITIES |
| | $ | 3,528,769 | |
| | |
| | Federal Agencies(e) – 1.5% | |
| | FNMA – 1.5% | |
| $ | 1,000,000 | | | | 3.500 | % | | | TBA-30yr | | | $ | 1,042,969 | |
| | |
| | TOTAL MORTGAGE-BACKED OBLIGATIONS | |
| | (Cost $8,607,848) | | | $ | 8,544,963 | |
| | |
| | | | | | | | | | | | | | |
| | Agency Debentures(a) – 15.5% | |
| FHLB | |
| $ | 6,000,000 | | | | 0.000 | % | | | 11/06/15 | | | $ | 5,999,610 | |
| | 2,000,000 | | | | 0.000 | | | | 11/27/15 | | | | 1,999,794 | |
| | 3,000,000 | | | | 0.000 | | | | 12/04/15 | | | | 2,999,412 | |
| | |
| | TOTAL AGENCY DEBENTURES | |
| | (Cost $10,997,853) | | | $ | 10,998,816 | |
| | |
| | | | | | | | | | | | | | |
| | Asset-Backed Securities(c) – 9.4% | |
| | Collateralized Loan Obligations(b) – 8.4% | |
| ACIS CLO Ltd. Series 2014-4A, Class ACOM(a) | |
| $ | 500,000 | | | | 0.000 | % | | | 05/01/26 | | | $ | 487,550 | |
| ACIS CLO Ltd. Series 2014-4A, Class C | |
| | 500,000 | | | | 2.828 | | | | 05/01/26 | | | | 462,618 | |
| Anchorage Capital CLO Ltd. Series 2014-4A, Class A1A | |
| | 750,000 | | | | 1.729 | | | | 07/28/26 | | | | 740,822 | |
| Anchorage Capital CLO Ltd. Series 2014-4A, Class A2 | |
| | 150,000 | | | | 2.439 | | | | 07/28/26 | | | | 145,973 | |
| Atrium X Series 2010-A, Class A | |
| | 750,000 | | | | 1.396 | | | | 07/16/25 | | | | 737,954 | |
| OFSI Fund V Ltd. Series 2014-7A, Class C | |
| | 100,000 | | | | 3.245 | | | | 10/18/26 | | | | 96,252 | |
| OFSI Fund VII Ltd. Series 2014-7A, Class ACOM | |
| | 750,000 | | | | 1.872 | | | | 10/18/26 | | | | 732,375 | |
| Silvermore CLO Ltd. Series 2014-1A, Class A1 | |
| | 600,000 | | | | 1.724 | | | | 05/15/26 | | | | 590,866 | |
| Sound Point CLO VI Ltd. Series 2014-2A, Class ACOM | |
| | 1,050,000 | | | | 1.725 | | | | 10/20/26 | | | | 1,029,315 | |
| Trinitas CLO Ltd. Series 2014-1A, Class B1 | |
| | 1,000,000 | | | | 2.175 | | | | 04/15/26 | | | | 955,464 | |
| | | | | | | | | | | | | | |
| | | | | | | | | | | | | 5,979,189 | |
| | |
| | Home Equity – 1.0% | |
| Citigroup Mortgage Loan Trust Series 2006-WFH1, Class M3 | |
| | 336,000 | | | | 0.599 | | | | 01/25/36 | | | | 276,393 | |
| Saxon Asset Securities Trust Series 2007-2, Class A2C | |
| | 587,161 | | | | 0.439 | | | | 05/25/47 | | | | 409,495 | |
| | | | | | | | | | | | | | |
| | | | | | | | | | | | | 685,888 | |
| | |
| | TOTAL ASSET-BACKED SECURITIES | |
| | (Cost $6,727,504) | | | $ | 6,665,077 | |
| | |
| | | | | | | | | | | | | | |
| | Municipal Debt Obligations – 1.7% | |
| | Puerto Rico – 1.7% | |
| Puerto Rico Commonwealth Aqueduct & Sewer Authority RB
(Senior Lien) Series 2008 A |
|
| $ | 20,000 | | | | 6.000 | % | | | 07/01/38 | | | $ | 13,925 | |
| | 20,000 | | | | 6.000 | | | | 07/01/44 | | | | 13,850 | |
| Puerto Rico Commonwealth Aqueduct & Sewer Authority RB
(Senior Lien) Series 2012 A |
|
| | 35,000 | | | | 5.125 | | | | 07/01/37 | | | | 23,713 | |
| | 45,000 | | | | 5.750 | | | | 07/01/37 | | | | 30,882 | |
| | |
| | |
| The accompanying notes are an integral part of these financial statements. | | 19 |
GOLDMAN SACHS FIXED INCOME MACRO STRATEGIES FUND
Consolidated Schedule of Investments (continued)
September 30, 2015 (Unaudited)
| | | | | | | | | | | | | | |
Principal
Amount | | | Interest
Rate | | | Maturity
Date | | | Value | |
| | | | | | | | | | | | | | |
| | Municipal Debt Obligations – (continued) | |
| | Puerto Rico – (continued) | |
| Puerto Rico Commonwealth GO Bonds for Public Improvement
Series 2011 A |
|
| $ | 25,000 | | | | 5.750 | % | | | 07/01/41 | | | $ | 16,250 | |
| Puerto Rico Commonwealth GO Bonds Refunding for Public
Improvement Series 2008 A |
|
| | 10,000 | | | | 5.500 | | | | 07/01/32 | | | | 6,513 | |
| Puerto Rico Commonwealth GO Bonds Refunding for Public
Improvement Series 2009 B |
|
| | 30,000 | | | | 5.750 | | | | 07/01/38 | | | | 19,500 | |
| Puerto Rico Commonwealth GO Bonds Refunding for Public
Improvement Series 2011 A |
|
| | 10,000 | | | | 6.000 | | | | 07/01/34 | | | | 6,550 | |
| Puerto Rico Commonwealth GO Bonds Refunding for Public
Improvement Series 2011 E |
|
| | 10,000 | | | | 5.625 | | | | 07/01/32 | | | | 6,525 | |
| Puerto Rico Commonwealth GO Bonds Refunding for Public
Improvement Series 2012 A |
|
| | 150,000 | | | | 5.500 | | | | 07/01/26 | | | | 98,812 | |
| | 20,000 | | | | 5.000 | | | | 07/01/41 | | | | 12,850 | |
| Puerto Rico Commonwealth GO Bonds Series 2007 A | |
| | 30,000 | | | | 5.250 | | | | 07/01/37 | | | | 19,350 | |
| Puerto Rico Commonwealth GO Bonds Series 2008 A | |
| | 140,000 | | | | 5.375 | | | | 07/01/33 | | | | 90,825 | |
| Puerto Rico Commonwealth GO Bonds Unrefunded Balance for
Public Improvement Series 2001 A |
|
| | 10,000 | | | | 5.125 | | | | 07/01/31 | | | | 6,488 | |
| Puerto Rico Commonwealth GO Bonds Unrefunded Balance for
Public Improvement Series 2004 A |
|
| | 10,000 | | | | 5.000 | | | | 07/01/34 | | | | 6,437 | |
| Puerto Rico Highways & Transportation Authority RB Refunding
Series 2007 CC |
|
| | 30,000 | | | | 5.250 | | | | 07/01/36 | | | | 28,188 | |
| Puerto Rico Sales Tax Financing Corp. Sales Tax RB Capital
Appreciation Series 2010 A(a) |
|
| | 10,000 | | | | 0.000 | | | | 08/01/35 | | | | 1,082 | |
| Puerto Rico Sales Tax Financing Corp. Sales Tax RB Capital
Appreciation SubSeries 2010 C(a) |
|
| | 25,000 | | | | 0.000 | | | | 08/01/37 | | | | 2,468 | |
| | 20,000 | | | | 0.000 | | | | 08/01/38 | | | | 1,854 | |
| Puerto Rico Sales Tax Financing Corp. Sales Tax RB
SubSeries 2009 A |
|
| | 10,000 | | | | 5.250 | | | | 08/01/27 | | | | 4,287 | |
| | 195,000 | | | | 0.000 | (f) | | | 08/01/32 | | | | 79,234 | |
| | 150,000 | | | | 0.000 | (a) | | | 08/01/34 | | | | 16,137 | |
| | 25,000 | | | | 5.750 | | | | 08/01/37 | | | | 10,562 | |
| | 10,000 | | | | 6.375 | | | | 08/01/39 | | | | 4,263 | |
| | 50,000 | | | | 6.000 | | | | 08/01/42 | | | | 21,125 | |
| Puerto Rico Sales Tax Financing Corp. Sales Tax RB
SubSeries 2010 A |
|
| | 30,000 | | | | 0.000 | (a) | | | 08/01/33 | | | | 3,443 | |
| | 50,000 | | | | 0.000 | (f) | | | 08/01/33 | | | | 15,377 | |
| | 165,000 | | | | 5.500 | | | | 08/01/37 | | | | 69,506 | |
| | 340,000 | | | | 5.375 | | | | 08/01/39 | | | | 143,225 | |
| | 145,000 | | | | 5.500 | | | | 08/01/42 | | | | 61,081 | |
| | |
| | | | | | | | | | | | | | |
| | Municipal Debt Obligations – (continued) | |
| | Puerto Rico – (continued) | |
| Puerto Rico Sales Tax Financing Corp. Sales Tax RB
SubSeries 2010 C |
|
| $ | 15,000 | | | | 5.000 | % | | | 08/01/35 | | | $ | 6,319 | |
| | 30,000 | | | | 5.375 | | | | 08/01/38 | | | | 12,637 | |
| | 25,000 | | | | 6.000 | | | | 08/01/39 | | | | 10,562 | |
| | 235,000 | | | | 5.250 | | | | 08/01/41 | | | | 98,994 | |
| Puerto Rico Sales Tax Financing Corp. Sales Tax RB
SubSeries 2011 A-1 |
|
| | 425,000 | | | | 5.000 | | | | 08/01/43 | | | | 179,031 | |
| | 10,000 | | | | 5.250 | | | | 08/01/43 | | | | 4,213 | |
| Puerto Rico Sales Tax Financing Corp. Sales Tax RB Unrefunded
SubSeries 2009 A |
|
| | 120,000 | | | | 5.500 | | | | 08/01/28 | | | | 51,750 | |
| | |
| | TOTAL MUNICIPAL DEBT OBLIGATIONS | |
| | (Cost $1,709,723) | | | $ | 1,197,808 | |
| | |
| | | | | | | | | | | | | | |
| | Corporate Obligations – 2.8% | |
| | Energy – 0.2% | |
| Petroleos de Venezuela SA | |
| $ | 60,000 | | | | 9.000 | % | | | 11/17/21 | | | $ | 21,540 | |
| | 200,000 | | | | 6.000 | | | | 05/16/24 | | | | 65,000 | |
| | 210,000 | | | | 6.000 | | | | 11/15/26 | | | | 66,433 | |
| | 50,000 | | | | 5.375 | | | | 04/12/27 | | | | 15,813 | |
| | 10,000 | | | | 5.500 | | | | 04/12/37 | | | | 3,125 | |
| | | | | | | | | | | | | | |
| | | | | | | | | | | | | 171,911 | |
| | |
| | Food & Drug Retailers(g) – 0.2% | |
| Walgreens Boots Alliance, Inc. | |
| | 175,000 | | | | 4.800 | | | | 11/18/44 | | | | 167,536 | |
| | |
| | Media – Cable – 0.1% | |
| Comcast Corp. | |
| | 50,000 | | | | 4.650 | | | | 07/15/42 | | | | 51,222 | |
| | |
| | Supranational – 2.3% | |
| European Investment Bank | |
| GBP | 120,000 | | | | 5.625 | | | | 06/07/32 | | | | 256,665 | |
| | 320,000 | | | | 3.875 | | | | 06/08/37 | | | | 576,568 | |
| | 370,000 | | | | 5.000 | | | | 04/15/39 | | | | 773,843 | |
| | | | | | | | | | | | | | |
| | | | | | | | | | | | | 1,607,076 | |
| | |
| | TOTAL CORPORATE OBLIGATIONS | |
| | (Cost $2,149,583) | | | $ | 1,997,745 | |
| | |
| | | | | | | | | | | | | | |
| | U.S. Treasury Obligations(a) – 14.1% | |
| United States Treasury Bills | |
| $ | 1,500,000 | | | | 0.000 | % | | | 10/15/15 | | | $ | 1,499,997 | |
| | 2,500,000 | | | | 0.000 | | | | 11/12/15 | | | | 2,500,000 | |
| | 3,000,000 | | | | 0.000 | | | | 01/07/16 | | | | 3,000,000 | |
| | 3,000,000 | | | | 0.000 | | | | 02/11/16 | | | | 2,999,723 | |
| | |
| | TOTAL U.S. TREASURY OBLIGATIONS | |
| | (Cost $9,995,737) | | | $ | 9,999,720 | |
| | |
| | |
| 20 | | The accompanying notes are an integral part of these financial statements. |
GOLDMAN SACHS FIXED INCOME MACRO STRATEGIES FUND
| | | | | | | | | | | | | | |
Notional
Amount | | | Exercise
Rate | | | Expiration
Date | | | Value | |
| | | | | | | | | | | | | | |
| | Options Purchased – 1.5% | |
| | Currency Options | |
| BNP Paribas SA Put
CNH 12,694,672
Call USD 2,028,000 |
| | | 6.260 | % | | | 10/26/15 | | | $ | 39,779 | |
| BNP Paribas SA Put
USD 2,028,000
Call CNH 12,694,672 |
| | | 6.260 | | | | 10/26/15 | | | | 1,683 | |
| | |
| Contracts | | | Exercise
Price | | | Expiration
Date | | | Value | |
| | |
| | Options on Futures | |
| Credit Suisse International (London) Call – Eurodollar | |
| $ | 165,000 | | | | 99.375 | % | | | 10/16/15 | | | $ | 413 | |
| | |
Notional
Amount | | | Exercise
Rate | | | Expiration
Date | | | Value | |
| | |
| | Interest Rate Swaptions | |
| Bank of America Securities LLC Put – OTC – 2 year Interest Rate
Swap |
|
| $ | 6,800,000 | | | | 0.750 | % | | | 05/24/16 | | | $ | 13,757 | |
| Bank of America Securities LLC Put – OTC – 2 year Interest Rate
Swap |
|
| | 6,800,000 | | | | 1.250 | | | | 05/24/16 | | | | 44,301 | |
| Deutsche Bank AG Put – OTC – 2 year Interest Rate Swap | |
| | 13,600,000 | | | | 1.200 | | | | 01/25/16 | | | | 91,750 | |
| Deutsche Bank AG Call – OTC – 2 year Interest Rate Swap | |
| | 3,495,800,000 | | | | 2.800 | | | | 08/19/16 | | | | 136 | |
| Deutsche Bank AG Call – OTC – 2 year Interest Rate Swap | |
| | 3,532,720,000 | | | | 3.050 | | | | 09/05/16 | | | | 87 | |
| Deutsche Bank AG Call – OTC – 3 year Interest Rate Swap | |
| | 13,900,000 | | | | 1.248 | | | | 02/25/16 | | | | 90,393 | |
| Deutsche Bank AG Call – OTC – 15 year Interest Rate Swap | |
| | 1,200,000 | | | | 2.935 | | | | 02/18/16 | | | | 30,766 | |
| JPMorgan Securities, Inc. Put – OTC – 2 year Interest Rate Swap | |
| | 6,800,000 | | | | 0.250 | | | | 12/10/15 | | | | 3,481 | |
| JPMorgan Securities, Inc. Put – OTC – 2 year Interest Rate Swap | |
| | 6,800,000 | | | | 0.750 | | | | 12/10/15 | | | | 47,758 | |
| JPMorgan Securities, Inc. Call – OTC – 2 year Interest Rate Swap | |
| | 2,810,000,000 | | | | 2.800 | | | | 08/08/16 | | | | 97 | |
| JPMorgan Securities, Inc. Call – OTC – 2 year Interest Rate Swap | |
| | 3,505,000,000 | | | | 2.750 | | | | 08/12/16 | | | | 146 | |
| Morgan Stanley Capital Services, Inc. Put – OTC – 1 year Interest
Rate Swap |
|
| | 14,000,000 | | | | 2.300 | | | | 01/04/16 | | | | 56,098 | |
| Morgan Stanley Capital Services, Inc. Call – OTC – 1 year
Interest Rate Swap |
|
| | 14,000,000 | | | | 2.300 | | | | 01/04/16 | | | | 2,380 | |
| Morgan Stanley Capital Services, Inc. Put – OTC – 1 year Interest
Rate Swap |
|
| | 14,000,000 | | | | 2.300 | | | | 01/04/16 | | | | 99,932 | |
| Morgan Stanley Capital Services, Inc. Call – OTC – 1 year
Interest Rate Swap |
|
| | 14,000,000 | | | | 2.300 | | | | 01/04/16 | | | | 8,737 | |
| | |
| | | | | | | | | | | | | | |
| | Options Purchased – (continued) | |
| | Interest Rate Swaptions – (continued) | |
| Morgan Stanley Capital Services, Inc. Put – OTC – 1 year Interest
Rate Swap |
|
| $ | 18,500,000 | | | | 2.190 | % | | | 02/17/16 | | | $ | 62,130 | |
| Morgan Stanley Capital Services, Inc. Call – OTC – 1 year
Interest Rate Swap |
|
| | 18,500,000 | | | | 2.190 | | | | 02/17/16 | | | | 25,913 | |
| Morgan Stanley Capital Services, Inc. Put – OTC – 1 year Interest
Rate Swap |
|
| | 18,500,000 | | | | 2.190 | | | | 02/17/16 | | | | 110,619 | |
| Morgan Stanley Capital Services, Inc. Call – OTC – 1 year
Interest Rate Swap |
|
| | 18,500,000 | | | | 2.190 | | | | 02/17/16 | | | | 10,097 | |
| Morgan Stanley Capital Services, Inc. Put – OTC – 2 year Interest
Rate Swap |
|
| | 1,847,000,000 | | | | 0.269 | | | | 04/03/17 | | | | 55,625 | |
| Morgan Stanley Capital Services, Inc. Put – OTC – 3 year Interest
Rate Swap |
|
| | 13,500,000 | | | | 0.950 | | | | 12/04/15 | | | | 24,098 | |
| Morgan Stanley Capital Services, Inc. Put – OTC – 3 year Interest
Rate Swap |
|
| | 13,500,000 | | | | 1.550 | | | | 12/04/15 | | | | 192,441 | |
| Morgan Stanley Capital Services, Inc. Put – OTC – 4 year Interest
Rate Swap |
|
| | 2,700,000 | | | | 0.550 | | | | 09/02/16 | | | | 26,232 | |
| Morgan Stanley Capital Services, Inc. Put – OTC – 15 year
Interest Rate Swap |
|
| | 1,400,000 | | | | 3.208 | | | | 01/22/16 | | | | 16,127 | |
| | |
| | TOTAL OPTIONS PURCHASED – 1.5% | |
| | (Cost $641,579) | | | $ | 1,054,976 | |
| | |
| | | | | | |
| | |
| Shares | | Rate | | Value | |
| | | | | | |
| Investment Company(h) – 16.9% | |
Goldman Sachs Financial Square Government Fund – FST Shares | |
| 11,996,350 | | 0.006% | | $ | 11,996,350 | |
| (Cost $11,996,350) | | | | |
| |
| | | | | | | | | | | | | | |
Principal
Amount | | | Interest
Rate | | | Maturity
Date | | | Value | |
| | Short-term Investment(i) – 9.3% | |
| | Repurchase Agreements – 9.3% | |
| Joint Repurchase Agreement Account II | |
| $ | 6,600,000 | | | | 0.122 | % | | | 10/01/15 | | | $ | 6,600,000 | |
| | (Cost $6,600,000) | | | | | |
| | |
| | TOTAL INVESTMENTS – 97.1% | |
| | (Cost $69,777,868) | | | $ | 68,833,194 | |
| | |
| OTHER ASSETS IN EXCESS OF
LIABILITIES – 2.9% |
| | | 2,055,319 | |
| | |
| | NET ASSETS – 100.0% | | | $ | 70,888,513 | |
| | |
| | |
| The accompanying notes are an integral part of these financial statements. | | 21 |
GOLDMAN SACHS FIXED INCOME MACRO STRATEGIES FUND
Consolidated Schedule of Investments (continued)
September 30, 2015 (Unaudited)
| | |
| The percentage shown for each investment category reflects the value of investments in that category as a percentage of net assets. |
(a) | | Issued with a zero coupon. Income is recognized through the accretion of discount. |
(b) | | Exempt from registration under Rule 144A of the Securities Act of 1933. Under procedures approved by the Board of Trustees, such securities have been determined to be liquid by the investment adviser and may be resold, normally to qualified institutional buyers in transactions exempt from registration. Total market value of Rule 144A securities amounts to $6,990,679, which represents approximately 9.9% of net assets as of September 30, 2015. |
(c) | | Variable rate security. Interest rate or distribution rate disclosed is that which is in effect on September 30, 2015. |
(d) | | Security with a notional or nominal principal amount. The actual effective yield of this security is different than the stated interest rate. |
(e) | | TBA (To Be Announced) Securities are purchased on a forward commitment basis with an approximate principal amount and no defined maturity date. The actual principal and maturity date will be determined upon settlement when the specific mortgage pools are assigned. Total market value of TBA securities (excluding forward sales contracts, if any) amounts to $1,042,969 which represents approximately 1.5% of net assets as of September 30, 2015. |
(f) | | Coupon changes periodically based upon a predetermined schedule. Interest rate disclosed is that which is in effect on September 30, 2015. |
(g) | | Security with “Call” features with resetting interest rates. Maturity dates disclosed are the final maturity dates. |
(h) | | Represents an Affiliated Issuer/Fund. |
(i) | | Joint repurchase agreement was entered into on September 30, 2015. Additional information appears on pages 44-45. |
| | |
|
Currency Abbreviations: |
AED | | —United Arab Emirates Dirham |
AUD | | —Australian Dollar |
BRL | | —Brazilian Real |
CAD | | —Canadian Dollar |
CHF | | —Swiss Franc |
CLP | | —Chilean Peso |
CNH | | —Chinese Yuan Renminbi Offshore |
COP | | —Colombian Peso |
CZK | | —Czech Koruna |
DOP | | —Dominican Peso |
EUR | | —Euro |
GBP | | —British Pound |
HUF | | —Hungarian Forint |
ILS | | —Israeli Shekel |
INR | | —Indian Rupee |
JPY | | —Japanese Yen |
KRW | | —South Korean Won |
MXN | | —Mexican Peso |
MYR | | —Malaysian Ringgit |
NOK | | —Norwegian Krone |
NZD | | —New Zealand Dollar |
PHP | | —Philippine Peso |
PLN | | —Polish Zloty |
RUB | | —Russian Ruble |
SEK | | —Swedish Krona |
SGD | | —Singapore Dollar |
TRY | | —Turkish Lira |
TWD | | —Taiwan Dollar |
USD | | —U.S. Dollar |
ZAR | | —South African Rand |
| | |
Investment Abbreviations: |
AUDOR | | —Australian Dollar Offered Rate |
BP | | —British Pound Offered Rate |
BUBOR | | —Budapest Interbank Offered Rate |
CDOR | | —Canadian Dollar Offered Rate |
CLICP | | —Sinacofi Chile Interbank Rate |
CLO | | —Collateralized Loan Obligation |
DTF | | —Depositos Termino Fijo |
EURO | | —Euro Offered Rate |
FHLB | | —Federal Home Loan Bank |
FHLMC | | —Federal Home Loan Mortgage Corp. |
FNMA | | —Federal National Mortgage Association |
GNMA | | —Government National Mortgage Association |
GO | | —General Obligation |
JIBAR | | —Johannesburg Interbank Agreed Rate |
JYOR | | —Japanese Yen Offered Rate |
KLIBOR | | —Kuala Lumpur Interbank Offered Rate |
KWCDC | | —South Korean Won Certificate of Deposit |
LIBOR | | —London Interbank Offered Rate |
LLC | | —Limited Liability Company |
MIBOR | | —Mumbai Interbank Offered Rate |
NIBOR | | —Norwegian Interbank Offered Rate |
NZDOR | | —New Zealand Dollar Offered Rate |
OTC | | —Over the Counter |
PRIBOR | | —Prague Interbank Offered Rate |
RB | | —Revenue Bond |
REMIC | | —Real Estate Mortgage Investment Conduit |
STIBOR | | —Stockholm Interbank Offered Rate |
TIIE | | —La Tasa de Interbank Equilibrium Interest Rate |
|
| | |
| 22 | | The accompanying notes are an integral part of these financial statements. |
GOLDMAN SACHS FIXED INCOME MACRO STRATEGIES FUND
|
| ADDITIONAL INVESTMENT INFORMATION |
FORWARD FOREIGN CURRENCY EXCHANGE CONTRACTS — At September 30, 2015, the Fund had the following forward foreign currency exchange contracts:
FORWARD FOREIGN CURRENCY EXCHANGE CONTRACTS WITH UNREALIZED GAIN
| | | | | | | | | | | | | | | | | | | | | | | | |
| Counterparty | | Currency Purchased | | | Currency Sold | | | Current Value | | | Settlement Date | | | Unrealized
Gain | |
Citibank NA | | AUD | | | 91,000 | | | USD | | | 63,543 | | | $ | 63,819 | | | | 10/15/15 | | | $ | 276 | |
| | AUD | | | 4,988,494 | | | USD | | | 3,461,643 | | | | 3,486,909 | | | | 12/16/15 | | | | 25,266 | |
| | BRL | | | 8,938,907 | | | USD | | | 2,222,478 | | | | 2,252,983 | | | | 10/02/15 | | | | 30,506 | |
| | BRL | | | 3,218,416 | | | USD | | | 780,173 | | | | 802,032 | | | | 11/04/15 | | | | 21,859 | |
| | CAD | | | 456,111 | | | USD | | | 339,946 | | | | 341,673 | | | | 12/16/15 | | | | 1,727 | |
| | CHF | | | 115,000 | | | USD | | | 118,062 | | | | 118,170 | | | | 11/12/15 | | | | 108 | |
| | CLP | | | 315,998,760 | | | USD | | | 452,000 | | | | 452,880 | | | | 10/26/15 | | | | 880 | |
| | CNH | | | 6,699,553 | | | USD | | | 1,013,898 | | | | 1,048,228 | | | | 10/28/15 | | | | 34,329 | |
| | CNH | | | 2,307,804 | | | USD | | | 356,000 | | | | 359,213 | | | | 12/16/15 | | | | 3,213 | |
| | CNH | | | 23,285,590 | | | USD | | | 3,521,184 | | | | 3,578,186 | | | | 05/26/16 | | | | 57,002 | |
| | CNH | | | 48,897,063 | | | USD | | | 7,397,000 | | | | 7,504,628 | | | | 06/13/16 | | | | 107,628 | |
| | CNH | | | 29,416,558 | | | USD | | | 4,507,000 | | | | 4,514,493 | | | | 06/14/16 | | | | 7,493 | |
| | COP | | | 482,599,276 | | | USD | | | 149,227 | | | | 156,257 | | | | 10/02/15 | | | | 7,030 | |
| | COP | | | 683,857,500 | | | USD | | | 217,091 | | | | 221,347 | | | | 10/05/15 | | | | 4,256 | |
| | COP | | | 552,120,000 | | | USD | | | 176,622 | | | | 178,193 | | | | 10/29/15 | | | | 1,572 | |
| | EUR | | | 477,000 | | | GBP | | | 346,756 | | | | 533,721 | | | | 12/16/15 | | | | 9,328 | |
| | EUR | | | 158,000 | | | HUF | | | 49,539,320 | | | | 176,788 | | | | 12/16/15 | | | | 235 | |
| | EUR | | | 2,142,375 | | | HUF | | | 669,106,560 | | | | 2,398,691 | | | | 01/14/16 | | | | 13,437 | |
| | EUR | | | 158,000 | | | PLN | | | 670,422 | | | | 176,788 | | | | 12/16/15 | | | | 765 | |
| | EUR | | | 159,000 | | | USD | | | 177,873 | | | | 177,907 | | | | 12/16/15 | | | | 34 | |
| | GBP | | | 233,166 | | | EUR | | | 315,000 | | | | 352,611 | | | | 12/16/15 | | | | 154 | |
| | HUF | | | 20,710,000 | | | USD | | | 73,455 | | | | 73,794 | | | | 10/26/15 | | | | 339 | |
| | HUF | | | 135,421,101 | | | USD | | | 480,995 | | | | 482,628 | | | | 12/16/15 | | | | 1,633 | |
| | ILS | | | 701,227 | | | USD | | | 178,000 | | | | 178,751 | | | | 10/02/15 | | | | 751 | |
| | ILS | | | 701,227 | | | USD | | | 178,388 | | | | 178,947 | | | | 12/16/15 | | | | 558 | |
| | INR | | | 24,180,129 | | | USD | | | 364,292 | | | | 367,642 | | | | 10/19/15 | | | | 3,350 | |
| | INR | | | 11,469,562 | | | USD | | | 173,387 | | | | 173,947 | | | | 11/03/15 | | | | 560 | |
| | JPY | | | 181,787,619 | | | USD | | | 1,510,631 | | | | 1,517,455 | | | | 12/16/15 | | | | 6,825 | |
| | KRW | | | 409,209,396 | | | USD | | | 343,268 | | | | 345,195 | | | | 10/02/15 | | | | 1,928 | |
| | KRW | | | 314,197,171 | | | USD | | | 264,922 | | | | 264,998 | | | | 10/05/15 | | | | 77 | |
| | NOK | | | 1,770,377 | | | USD | | | 206,874 | | | | 207,702 | | | | 12/16/15 | | | | 827 | |
| | NZD | | | 4,662,094 | | | USD | | | 2,920,856 | | | | 2,963,872 | | | | 12/16/15 | | | | 43,017 | |
| | PHP | | | 7,846,592 | | | USD | | | 166,277 | | | | 167,720 | | | | 10/19/15 | | | | 1,443 | |
| | RUB | | | 35,246,819 | | | USD | | | 531,051 | | | | 533,987 | | | | 10/21/15 | | | | 2,937 | |
| | SEK | | | 3,225,563 | | | EUR | | | 342,753 | | | | 386,098 | | | | 12/16/15 | | | | 2,588 | |
| | SEK | | | 7,520,000 | | | USD | | | 884,660 | | | | 898,564 | | | | 10/06/15 | | | | 13,904 | |
| | TRY | | | 1,932,152 | | | USD | | | 628,894 | | | | 633,157 | | | | 10/26/15 | | | | 4,263 | |
| | TRY | | | 1,105,458 | | | USD | | | 356,000 | | | | 356,681 | | | | 12/16/15 | | | | 681 | |
| | TWD | | | 11,230,338 | | | USD | | | 340,004 | | | | 340,789 | | | | 10/02/15 | | | | 785 | |
| | USD | | | 2,134,000 | | | AED | | | 7,850,639 | | | | 2,132,627 | | | | 08/11/16 | | | | 1,373 | |
| | USD | | | 754,086 | | | AUD | | | 1,063,225 | | | | 743,184 | | | | 12/16/15 | | | | 10,902 | |
| | USD | | | 3,389,627 | | | BRL | | | 11,682,132 | | | | 2,944,393 | | | | 10/02/15 | | | | 445,233 | |
| | USD | | | 427,000 | | | BRL | | | 1,712,133 | | | | 426,665 | | | | 11/04/15 | | | | 335 | |
| | USD | | | 1,025,074 | | | CAD | | | 1,359,301 | | | | 1,018,373 | | | | 11/12/15 | | | | 6,701 | |
| | USD | | | 1,372,999 | | | CAD | | | 1,819,715 | | | | 1,363,151 | | | | 12/16/15 | | | | 9,847 | |
| | USD | | | 355,000 | | | CNH | | | 2,272,181 | | | | 353,668 | | | | 12/16/15 | | | | 1,332 | |
| | USD | | | 3,595,000 | | | CNH | | | 23,529,095 | | | | 3,591,900 | | | | 09/14/16 | | | | 3,101 | |
| | USD | | | 4,853,073 | | | EUR | | | 4,289,459 | | | | 4,795,742 | | | | 11/06/15 | | | | 57,331 | |
| | USD | | | 5,498,707 | | | EUR | | | 4,869,411 | | | | 5,448,443 | | | | 12/16/15 | | | | 50,264 | |
| | |
| The accompanying notes are an integral part of these financial statements. | | 23 |
GOLDMAN SACHS FIXED INCOME MACRO STRATEGIES FUND
Consolidated Schedule of Investments (continued)
September 30, 2015 (Unaudited)
|
| ADDITIONAL INVESTMENT INFORMATION (continued) |
FORWARD FOREIGN CURRENCY EXCHANGE CONTRACTS WITH UNREALIZED GAIN (continued)
| | | | | | | | | | | | | | | | | | | | | | | | |
| Counterparty | | Currency Purchased | | | Currency Sold | | | Current Value | | | Settlement Date | | | Unrealized
Gain | |
Citibank NA (continued) | | USD | | | 6,200,379 | | | GBP | | | 3,966,493 | | | $ | 6,000,043 | | | | 10/08/15 | | | $ | 200,335 | |
| | USD | | | 1,813,600 | | | GBP | | | 1,173,912 | | | | 1,775,283 | | | | 12/16/15 | | | | 38,317 | |
| | USD | | | 990,372 | | | ILS | | | 3,846,759 | | | | 981,658 | | | | 12/16/15 | | | | 8,714 | |
| | USD | | | 883,383 | | | JPY | | | 105,683,000 | | | | 881,263 | | | | 10/29/15 | | | | 2,120 | |
| | USD | | | 1,281,253 | | | JPY | | | 153,028,693 | | | | 1,277,392 | | | | 12/16/15 | | | | 3,860 | |
| | USD | | | 345,523 | | | KRW | | | 409,209,396 | | | | 345,195 | | | | 10/02/15 | | | | 327 | |
| | USD | | | 266,794 | | | KRW | | | 314,197,171 | | | | 264,998 | | | | 10/05/15 | | | | 1,796 | |
| | USD | | | 178,000 | | | KRW | | | 207,764,982 | | | | 175,121 | | | | 10/21/15 | | | | 2,879 | |
| | USD | | | 178,000 | | | KRW | | | 209,658,368 | | | | 176,704 | | | | 10/23/15 | | | | 1,296 | |
| | USD | | | 526,910 | | | MXN | | | 8,871,955 | | | | 523,630 | | | | 10/26/15 | | | | 3,280 | |
| | USD | | | 148,134 | | | NOK | | | 1,224,232 | | | | 143,789 | | | | 10/06/15 | | | | 4,345 | |
| | USD | | | 854,498 | | | NOK | | | 7,040,624 | | | | 826,008 | | | | 12/16/15 | | | | 28,489 | |
| | USD | | | 547,377 | | | NZD | | | 842,000 | | | | 537,687 | | | | 10/15/15 | | | | 9,691 | |
| | USD | | | 1,659,000 | | | PHP | | | 75,019,980 | | | | 1,597,473 | | | | 12/10/15 | | | | 61,527 | |
| | USD | | | 308,625 | | | PLN | | | 1,166,827 | | | | 306,618 | | | | 11/16/15 | | | | 2,007 | |
| | USD | | | 1,155,742 | | | RUB | | | 70,355,154 | | | | 1,064,836 | | | | 10/23/15 | | | | 90,906 | |
| | USD | | | 2,483,909 | | | SEK | | | 20,666,441 | | | | 2,473,764 | | | | 12/16/15 | | | | 10,144 | |
| | USD | | | 606,262 | | | SGD | | | 857,340 | | | | 600,898 | | | | 12/16/15 | | | | 5,364 | |
| | USD | | | 513,000 | | | TRY | | | 1,574,211 | | | | 507,926 | | | | 12/16/15 | | | | 5,074 | |
| | USD | | | 345,386 | | | TWD | | | 11,230,338 | | | | 340,789 | | | | 10/02/15 | | | | 4,597 | |
| | USD | | | 667,698 | | | TWD | | | 21,770,991 | | | | 659,856 | | | | 10/05/15 | | | | 7,842 | |
| | USD | | | 97,796 | | | TWD | | | 3,166,446 | | | | 95,781 | | | | 10/19/15 | | | | 2,015 | |
| | USD | | | 171,586 | | | TWD | | | 5,592,847 | | | | 169,060 | | | | 10/26/15 | | | | 2,526 | |
| | USD | | | 413,706 | | | TWD | | | 13,689,530 | | | | 413,581 | | | | 11/30/15 | | | | 125 | |
| | USD | | | 307,766 | | | TWD | | | 10,159,352 | | | | 306,923 | | | | 12/04/15 | | | | 843 | |
| | USD | | | 153,491 | | | ZAR | | | 2,120,135 | | | | 152,284 | | | | 10/26/15 | | | | 1,207 | |
| | | ZAR | | | 2,463,112 | | | USD | | | 173,761 | | | | 175,269 | | | | 12/17/15 | | | | 1,508 | |
| TOTAL | | | | | | | | $ | 1,501,117 | |
FORWARD FOREIGN CURRENCY EXCHANGE CONTRACTS WITH UNREALIZED LOSS
| | | | | | | | | | | | | | | | | | | | | | | | |
| Counterparty | | Currency Purchased | | | Currency Sold | | | Current Value | | | Settlement Date | | | Unrealized Loss | |
Citibank NA | | AUD | | | 975,876 | | | USD | | | 694,597 | | | $ | 682,128 | | | | 12/16/15 | | | $ | (12,468 | ) |
| | BRL | | | 5,627,656 | | | USD | | | 1,477,885 | | | | 1,418,406 | | | | 10/02/15 | | | | (59,478 | ) |
| | CAD | | | 2,055,097 | | | EUR | | | 1,387,356 | | | | 1,539,475 | | | | 12/16/15 | | | | (12,854 | ) |
| | CAD | | | 1,396,029 | | | USD | | | 1,052,771 | | | | 1,045,888 | | | | 11/12/15 | | | | (6,882 | ) |
| | CAD | | | 2,171,203 | | | USD | | | 1,650,411 | | | | 1,626,451 | | | | 12/16/15 | | | | (23,962 | ) |
| | CLP | | | 343,320,805 | | | USD | | | 498,486 | | | | 492,660 | | | | 10/13/15 | | | | (5,826 | ) |
| | CLP | | | 97,188,841 | | | USD | | | 141,099 | | | | 139,342 | | | | 10/22/15 | | | | (1,756 | ) |
| | COP | | | 876,738,945 | | | USD | | | 285,000 | | | | 283,065 | | | | 10/26/15 | | | | (1,935 | ) |
| | EUR | | | 746,357 | | | USD | | | 842,873 | | | | 834,449 | | | | 11/06/15 | | | | (8,423 | ) |
| | EUR | | | 1,665,461 | | | USD | | | 1,881,447 | | | | 1,863,503 | | | | 12/16/15 | | | | (17,943 | ) |
| | GBP | | | 351,050 | | | EUR | | | 477,000 | | | | 530,887 | | | | 12/16/15 | | | | (2,834 | ) |
| | GBP | | | 2,044,000 | | | USD | | | 3,203,898 | | | | 3,091,923 | | | | 10/08/15 | | | | (111,975 | ) |
| | GBP | | | 677,034 | | | USD | | | 1,037,585 | | | | 1,023,863 | | | | 12/16/15 | | | | (13,720 | ) |
| | HUF | | | 445,355,224 | | | EUR | | | 1,428,107 | | | | 1,587,082 | | | | 10/14/15 | | | | (9,019 | ) |
| | HUF | | | 224,129,997 | | | EUR | | | 714,054 | | | | 799,064 | | | | 07/08/16 | | | | (3,775 | ) |
| | HUF | | | 132,980,231 | | | USD | | | 474,515 | | | | 473,929 | | | | 12/16/15 | | | | (586 | ) |
| | JPY | | | 101,594,000 | | | USD | | | 849,204 | | | | 847,166 | | | | 10/29/15 | | | | (2,038 | ) |
| | MXN | | | 8,129,210 | | | USD | | | 482,217 | | | | 479,793 | | | | 10/26/15 | | | | (2,424 | ) |
| | |
| 24 | | The accompanying notes are an integral part of these financial statements. |
GOLDMAN SACHS FIXED INCOME MACRO STRATEGIES FUND
|
| ADDITIONAL INVESTMENT INFORMATION (continued) |
FORWARD FOREIGN CURRENCY EXCHANGE CONTRACTS WITH UNREALIZED LOSS (continued)
| | | | | | | | | | | | | | | | | | | | | | | | |
| Counterparty | | Currency Purchased | | | Currency Sold | | | Current Value | | | Settlement Date | | | Unrealized Loss | |
Citibank NA (continued) | | MXN | | | 65,803,594 | | | USD | | | 3,904,712 | | | $ | 3,868,481 | | | | 12/16/15 | | | $ | (36,233 | ) |
| | NOK | | | 2,718,185 | | | EUR | | | 286,466 | | | | 318,899 | | | | 12/16/15 | | | | (1,631 | ) |
| | NOK | | | 1,081,000 | | | USD | | | 130,803 | | | | 126,966 | | | | 10/06/15 | | | | (3,837 | ) |
| | NOK | | | 18,140,303 | | | USD | | | 2,187,911 | | | | 2,128,229 | | | | 12/16/15 | | | | (59,683 | ) |
| | NZD | | | 863,000 | | | USD | | | 561,029 | | | | 551,097 | | | | 10/15/15 | | | | (9,932 | ) |
| | NZD | | | 552,000 | | | USD | | | 353,509 | | | | 350,928 | | | | 12/16/15 | | | | (2,581 | ) |
| | PHP | | | 75,019,980 | | | USD | | | 1,678,018 | | | | 1,597,472 | | | | 12/10/15 | | | | (80,545 | ) |
| | PLN | | | 672,638 | | | EUR | | | 159,000 | | | | 176,606 | | | | 12/16/15 | | | | (1,302 | ) |
| | PLN | | | 1,163,000 | | | USD | | | 307,613 | | | | 305,612 | | | | 11/16/15 | | | | (2,000 | ) |
| | PLN | | | 1,135,935 | | | USD | | | 300,879 | | | | 298,247 | | | | 12/16/15 | | | | (2,633 | ) |
| | SEK | | | 2,115,665 | | | USD | | | 256,297 | | | | 253,244 | | | | 12/16/15 | | | | (3,053 | ) |
| | TRY | | | 3,123,000 | | | USD | | | 1,026,104 | | | | 1,023,392 | | | | 10/26/15 | | | | (2,712 | ) |
| | TRY | | | 543,293 | | | USD | | | 177,000 | | | | 175,296 | | | | 12/16/15 | | | | (1,704 | ) |
| | TWD | | | 21,770,991 | | | USD | | | 665,607 | | | | 659,855 | | | | 10/05/15 | | | | (5,752 | ) |
| | TWD | | | 9,726,609 | | | USD | | | 299,147 | | | | 294,219 | | | | 10/19/15 | | | | (4,928 | ) |
| | USD | | | 601,203 | | | AED | | | 2,213,254 | | | | 601,215 | | | | 08/15/16 | | | | (11 | ) |
| | USD | | | 495,092 | | | AUD | | | 711,488 | | | | 497,323 | | | | 12/16/15 | | | | (2,231 | ) |
| | USD | | | 705,112 | | | BRL | | | 2,884,430 | | | | 726,998 | | | | 10/02/15 | | | | (21,886 | ) |
| | USD | | | 1,246,428 | | | BRL | | | 5,038,543 | | | | 1,255,610 | | | | 11/04/15 | | | | (9,182 | ) |
| | USD | | | 114,246 | | | CHF | | | 111,283 | | | | 114,351 | | | | 11/12/15 | | | | (104 | ) |
| | USD | | | 543,098 | | | CNH | | | 3,493,368 | | | | 546,581 | | | | 10/28/15 | | | | (3,483 | ) |
| | USD | | | 1,193,532 | | | CNH | | | 7,755,907 | | | | 1,207,219 | | | | 12/16/15 | | | | (13,686 | ) |
| | USD | | | 3,521,184 | | | CNH | | | 23,399,148 | | | | 3,575,877 | | | | 08/26/16 | | | | (54,693 | ) |
| | USD | | | 2,334,717 | | | CNH | | | 15,417,700 | | | | 2,355,351 | | | | 09/01/16 | | | | (20,634 | ) |
| | USD | | | 7,397,000 | | | CNH | | | 49,123,307 | | | | 7,501,162 | | | | 09/09/16 | | | | (104,162 | ) |
| | USD | | | 912,000 | | | CNH | | | 6,005,590 | | | | 916,800 | | | | 09/14/16 | | | | (4,800 | ) |
| | USD | | | 57,010 | | | COP | | | 176,262,378 | | | | 57,052 | | | | 10/05/15 | | | | (42 | ) |
| | USD | | | 372,189 | | | EUR | | | 333,031 | | | | 372,339 | | | | 11/06/15 | | | | (150 | ) |
| | USD | | | 156,895 | | | HUF | | | 44,177,108 | | | | 157,412 | | | | 10/26/15 | | | | (517 | ) |
| | USD | | | 504,048 | | | ILS | | | 1,976,977 | | | | 504,506 | | | | 12/16/15 | | | | (459 | ) |
| | USD | | | 383,000 | | | INR | | | 25,399,080 | | | | 386,175 | | | | 10/19/15 | | | | (3,175 | ) |
| | USD | | | 177,000 | | | INR | | | 11,764,004 | | | | 178,413 | | | | 11/03/15 | | | | (1,413 | ) |
| | USD | | | 2,988,093 | | | JPY | | | 360,149,074 | | | | 3,006,310 | | | | 12/16/15 | | | | (18,217 | ) |
| | USD | | | 342,831 | | | KRW | | | 409,209,396 | | | | 344,782 | | | | 11/02/15 | | | | (1,952 | ) |
| | USD | | | 390,086 | | | KRW | | | 464,798,866 | | | | 391,547 | | | | 11/09/15 | | | | (1,462 | ) |
| | USD | | | 264,342 | | | KRW | | | 314,197,171 | | | | 264,496 | | | | 12/04/15 | | | | (154 | ) |
| | USD | | | 248,000 | | | MXN | | | 4,308,355 | | | | 253,281 | | | | 12/16/15 | | | | (5,281 | ) |
| | USD | | | 818,164 | | | NZD | | | 1,295,166 | | | | 823,387 | | | | 12/16/15 | | | | (5,223 | ) |
| | USD | | | 355,000 | | | RUB | | | 23,809,850 | | | | 360,718 | | | | 10/21/15 | | | | (5,718 | ) |
| | USD | | | 519,878 | | | RUB | | | 36,146,211 | | | | 547,078 | | | | 10/23/15 | | | | (27,199 | ) |
| | USD | | | 946,135 | | | SEK | | | 8,038,000 | | | | 960,460 | | | | 10/06/15 | | | | (14,325 | ) |
| | USD | | | 413,931 | | | SEK | | | 3,472,985 | | | | 415,715 | | | | 12/16/15 | | | | (1,784 | ) |
| | USD | | | 605,788 | | | SGD | | | 867,532 | | | | 608,041 | | | | 12/16/15 | | | | (2,253 | ) |
| | USD | | | 867,687 | | | TRY | | | 2,715,042 | | | | 876,021 | | | | 12/16/15 | | | | (8,334 | ) |
| | USD | | | 177,000 | | | TWD | | | 5,896,888 | | | | 178,198 | | | | 10/29/15 | | | | (1,198 | ) |
| | USD | | | 338,927 | | | TWD | | | 11,230,338 | | | | 339,285 | | | | 11/30/15 | | | | (358 | ) |
| | USD | | | 178,000 | | | ZAR | | | 2,503,819 | | | | 178,165 | | | | 12/17/15 | | | | (165 | ) |
| | ZAR | | | 2,833,316 | | | USD | | | 207,860 | | | | 203,510 | | | | 10/26/15 | | | | (4,352 | ) |
| | | ZAR | | | 7,319,305 | | | USD | | | 534,000 | | | | 520,823 | | | | 12/17/15 | | | | (13,180 | ) |
| TOTAL | | | | | | | | $ | (868,207 | ) |
| | |
| The accompanying notes are an integral part of these financial statements. | | 25 |
GOLDMAN SACHS FIXED INCOME MACRO STRATEGIES FUND
Consolidated Schedule of Investments (continued)
September 30, 2015 (Unaudited)
|
| ADDITIONAL INVESTMENT INFORMATION (continued) |
FUTURES CONTRACTS — At September 30, 2015, the Fund had the following futures contracts:
| | | | | | | | | | | | | | |
| Type | | Number of
Contracts
Long (Short) | | | Expiration Date | | Current Value | | | Unrealized
Gain (Loss) | |
S&P 500 E-Mini Index | | | (58 | ) | | December 2015 | | $ | (5,535,230 | ) | | $ | 120,102 | |
5 Year German Euro-Bobl | | | (16 | ) | | December 2015 | | | (2,306,670 | ) | | | (7,891 | ) |
10 Year German Euro-Bund | | | (1 | ) | | December 2015 | | | (174,527 | ) | | | (3,197 | ) |
10 Year U.S. Treasury Notes | | | 37 | | | December 2015 | | | 4,763,172 | | | | 13,811 | |
20 Year U.S. Treasury Bonds | | | (11 | ) | | December 2015 | | | (1,730,781 | ) | | | (612 | ) |
| TOTAL | | | | | | | | | | | | $ | 122,213 | |
SWAP CONTRACTS — At September 30, 2015, the Fund had the following swap contracts:
OVER THE COUNTER INTEREST RATE SWAP CONTRACTS
| | | | | | | | | | | | | | | | | | | | |
| | | | | | | | | | | | Rates Exchanged | | | |
| Counterparty | | | | | Notional
Amount (000s) | | | Termination Date | | | Payments Received | | Payments Made | | Unrealized
Gain (Loss)* | |
Bank of America Securities LLC | | | INR | | | | 197,535 | | | | 05/30/16 | | | 6 month MIBOR | | 7.369% | | $ | (3,563 | ) |
| | | COP | | | | 1,611,010 | | | | 12/11/16 | | | Columbia 90 Days DTF | | 4.340 | | | 6,754 | |
| | | KRW | | | | 1,179,110 | | | | 11/04/17 | | | 2.060% | | 3 month KWCDC | | | 12,106 | |
| | | BRL | | | | 6,660 | (a) | | | 01/02/18 | | | 11.830 | | 1 month Brazilian
Interbank Deposit
Average | | | (48,533 | ) |
| | | | | | | 7,610 | | | | 01/02/18 | | | 13.962 | | 1 month Brazilian
Interbank Deposit
Average | | | (54,477 | ) |
| | | MYR | | | | 10,000 | | | | 01/22/19 | | | 3 month KLIBOR | | 4.060 | | | 22,430 | |
| | | BRL | | | | 3,710 | | | | 01/04/21 | | | 14.039 | | 1 month Brazilian
Interbank Deposit
Average | | | (33,064 | ) |
| | | GBP | | | | 1,290 | | | | 12/09/24 | | | 6 month BP | | 3.150 | | | (84,886 | ) |
| | | KRW | | | | 688,000 | (a) | | | 06/03/25 | | | 3 month KWCDC | | 2.427 | | | (8,498 | ) |
| | | | | | | 379,525 | (a) | | | 06/24/25 | | | 3 month KWCDC | | 2.562 | | | (6,674 | ) |
| | | GBP | | | | 1,290 | | | | 12/09/29 | | | 3.377 | | 6 month BP | | | 115,791 | |
| | | | | | | 1,000 | | | | 12/09/39 | | | 3.568 | | 6 month BP | | | 118,950 | |
| | | | | | | 1,000 | | | | 12/09/44 | | | 1 month BP | | 3.565 | | | (145,329 | ) |
Barclays Bank PLC | | | | | | | 6,800 | | | | 08/19/16 | | | 0.560 | | 3 month LIBOR | | | 4,153 | |
| | | | | | | 2,900 | | | | 08/17/17 | | | 3 month LIBOR | | 1.065 | | | (5,620 | ) |
| | | | | | | 6,800 | | | | 08/19/17 | | | 3 month LIBOR | | 1.034 | | | (9,754 | ) |
| | | KRW | | | | 1,198,490 | | | | 11/07/17 | | | 2.034 | | 3 month KWCDC | | | 11,681 | |
| | | TWD | | | | 50,100 | | | | 07/30/18 | | | 1.030 | | 3 month TWD | | | 7,328 | |
| | | | | | | 15,175 | | | | 07/31/18 | | | 1.025 | | 3 month TWD | | | 2,148 | |
| | | MYR | | | | 2,700 | | | | 03/04/20 | | | 3 month KLIBOR | | 3.815 | | | 17,578 | |
| | | KRW | | | | 1,948,440 | (a) | | | 09/23/24 | | | 3 month KWCDC | | 3.138 | | | (82,989 | ) |
| | | | | | | 352,150 | (a) | | | 06/25/25 | | | 3 month KWCDC | | 2.568 | | | (6,269 | ) |
| | | | | | | 176,475 | (a) | | | 07/15/25 | | | 3 month KWCDC | | 2.615 | | | (3,451 | ) |
Citibank NA | | | BRL | | | | 6,610 | | | | 01/04/16 | | | 13.760 | | 1 month Brazilian
Interbank Deposit
Average | | | (3,346 | ) |
| | | | | | | 6,610 | | | | 01/04/16 | | | 13.775 | | 1 month Brazilian
Interbank Deposit
Average | | | (3,214 | ) |
| | |
| 26 | | The accompanying notes are an integral part of these financial statements. |
GOLDMAN SACHS FIXED INCOME MACRO STRATEGIES FUND
|
| ADDITIONAL INVESTMENT INFORMATION (continued) |
OVER THE COUNTER INTEREST RATE SWAP CONTRACTS (continued)
| | | | | | | | | | | | | | | | | | | | |
| | | | | | | | | | | | Rates Exchanged | | | |
| Counterparty | | | | | Notional
Amount (000s) | | | Termination Date | | | Payments Received | | Payments Made | | Unrealized
Gain (Loss)* | |
Citibank NA (continued) | | | COP | | | | 1,592,820 | | | | 12/11/16 | | | Columbia 90 Days DTF | | 4.330% | | $ | 6,741 | |
| | | KRW | | | | 1,805,420 | | | | 03/07/17 | | | 2.875% | | 3 month KWCDC | | | 31,143 | |
| | | | | | | 909,000 | | | | 10/14/17 | | | 2.240 | | 3 month KWCDC | | | 12,433 | |
| | | | | | | 1,486,130 | | | | 10/28/17 | | | 2.173 | | 3 month KWCDC | | | 18,451 | |
| | | MYR | | | | 5,210 | | | | 01/15/24 | | | 3 month KLIBOR | | 4.575 | | | 21,989 | |
Credit Suisse International (London) | | | CLP | | | | 1,311,400 | | | | 03/28/16 | | | 6 month CLICP | | 3.860 | | | (11,098 | ) |
| | | | | | | 651,080 | | | | 04/28/17 | | | 6 month CLICP | | 3.980 | | | (4,043 | ) |
| | | | | | | 152,710 | | | | 05/12/17 | | | 6 month CLICP | | 3.950 | | | (711 | ) |
| | | | | | | 34,200 | | | | 07/28/17 | | | 6 month CLICP | | 3.640 | | | 270 | |
| | | BRL | | | | 1,370 | | | | 01/02/18 | | | 11.120 | | 1 month Brazilian
Interbank Deposit
Average | | | (29,660 | ) |
Deutsche Bank AG | | | | | | | 2,760 | | | | 01/04/16 | | | 1 month Brazilian
Interbank Deposit
Average | | 13.155 | | | 3,093 | |
| | | | | | | 13,150 | | | | 01/04/16 | | | 13.874 | | 1 month Brazilian
Interbank Deposit
Average | | | (5,253 | ) |
| | | INR | | | | 322,470 | | | | 03/03/16 | | | 6 month MIBOR | | 7.660 | | | 1,029 | |
| | | BRL | | | | 1,350 | | | | 01/02/17 | | | 15.575 | | 1 month Brazilian
Interbank Deposit
Average | | | 30 | |
| | | | | | | 5,170 | | | | 01/02/17 | | | 16.860 | | 1 month Brazilian
Interbank Deposit
Average | | | 15,751 | |
| | | KRW | | | | 640,300 | | | | 03/03/17 | | | 2.850 | | 3 month KWCDC | | | 10,832 | |
| | | | | | | 2,224,900 | | | | 10/13/17 | | | 2.248 | | 3 month KWCDC | | | 30,689 | |
| | | | | | | 704,320 | | | | 11/04/17 | | | 2.075 | | 3 month KWCDC | | | 7,432 | |
| | | BRL | | | | 50 | | | | 01/02/18 | | | 11.750 | | 1 month Brazilian
Interbank Deposit
Average | | | (875 | ) |
| | | | | | | 1,220 | | | | 01/02/18 | | | 11.150 | | 1 month Brazilian
Interbank Deposit
Average | | | (26,166 | ) |
| | | | | | | 1,520 | | | | 01/02/18 | | | 11.450 | | 1 month Brazilian
Interbank Deposit
Average | | | (29,520 | ) |
| | | CLP | | | | 119,230 | | | | 07/28/19 | | | 6 month CLICP | | 4.000 | | | 1,838 | |
| | | COP | | | | 2,311,520 | | | | 09/24/19 | | | Columbia 90 Days DTF | | 5.340 | | | 22,223 | |
| | | BRL | | | | 610 | | | | 01/04/21 | | | 13.360 | | 1 month Brazilian
Interbank Deposit
Average | | | (8,369 | ) |
| | | | | | | 650 | | | | 01/04/21 | | | 13.409 | | 1 month Brazilian
Interbank Deposit
Average | | | (8,684 | ) |
| | | | | | | 1,280 | | | | 01/04/21 | | | 14.644 | | 1 month Brazilian
Interbank Deposit
Average | | | (6,176 | ) |
| | |
| The accompanying notes are an integral part of these financial statements. | | 27 |
GOLDMAN SACHS FIXED INCOME MACRO STRATEGIES FUND
Consolidated Schedule of Investments (continued)
September 30, 2015 (Unaudited)
|
| ADDITIONAL INVESTMENT INFORMATION (continued) |
OVER THE COUNTER INTEREST RATE SWAP CONTRACTS (continued)
| | | | | | | | | | | | | | | | | | | | |
| | | | | | | | | | | | Rates Exchanged | | | |
| Counterparty | | | | | Notional
Amount (000s) | | | Termination Date | | | Payments Received | | Payments Made | | Unrealized
Gain (Loss)* | |
Deutsche Bank AG (continued) | | | BRL | | | | 1,800 | | | | 01/04/21 | | | 13.431% | | 1 month Brazilian
Interbank Deposit
Average | | $ | (23,754 | ) |
| | | | | | | 2,380 | | | | 01/04/21 | | | 15.676 | | 1 month Brazilian
Interbank Deposit
Average | | | 4,225 | |
| | | | | | | 3,830 | | | | 01/04/21 | | | 13.632 | | 1 month Brazilian
Interbank Deposit
Average | | | (45,069 | ) |
| | | | | | | 6,210 | | | | 01/04/21 | | | 14.395 | | 1 month Brazilian
Interbank Deposit
Average | | | (40,278 | ) |
| | | MXN | | | | 32,720 | (a) | | | 10/28/21 | | | 7.285 | | Mexico
Interbank TIIE
28 Days | | | 5,604 | |
| | | | | | | 7,370 | (a) | | | 11/04/21 | | | 7.380 | | Mexico
Interbank TIIE
28 Days | | | 1,862 | |
| | | | | | | 13,080 | | | | 12/05/23 | | | 6.710 | | Mexico
Interbank TIIE
28 Days | | | 30,952 | |
| | | MYR | | | | 1,270 | | | | 08/18/24 | | | 3 month KLIBOR | | 4.460% | | | 9,109 | |
| | | MXN | | | | 14,190 | (a) | | | 10/24/24 | | | Mexico Interbank
TIIE 28 Days | | 7.371 | | | 1,855 | |
| | | | | | | 3,220 | (a) | | | 10/31/24 | | | Mexico Interbank
TIIE 28 Days | | 7.460 | | | (170 | ) |
| | | BRL | | | | 1,680 | | | | 01/02/25 | | | 1 month Brazilian
Interbank Deposit
Average | | 12.340 | | | 40,758 | |
| | | KRW | | | | 175,400 | (a) | | | 07/14/25 | | | 3 month KWCDC | | 2.620 | | | (3,466 | ) |
| | | ZAR | | | | 14,640 | (a) | | | 02/27/35 | | | 9.040 | | 3 month JIBAR | | | (15,455 | ) |
| | | | | | | 3,350 | (a) | | | 04/14/35 | | | 9.120 | | 3 month JIBAR | | | (2,921 | ) |
| | | | | | | 45,320 | (a) | | | 02/27/45 | | | 3 month JIBAR | | 6.765 | | | 32,707 | |
| | | | | | | 10,420 | (a) | | | 04/13/45 | | | 3 month JIBAR | | 6.770 | | | 7,084 | |
JPMorgan Securities, Inc. | | | INR | | | | 312,970 | | | | 06/01/16 | | | 12 month MIBOR | | 7.346 | | | (1,372 | ) |
| | | BRL | | | | 1,660 | | | | 01/02/18 | | | 14.830 | | 1 month Brazilian
Interbank Deposit
Average | | | (5,976 | ) |
| | | | | | | 2,560 | | | | 01/02/18 | | | 13.910 | | 1 month Brazilian
Interbank Deposit
Average | | | (18,896 | ) |
| | | TWD | | | | 21,575 | | | | 08/07/18 | | | 1.010 | | 3 month TWD | | | 2,716 | |
| | | BRL | | | | 2,470 | | | | 01/02/19 | | | 13.935 | | 1 month Brazilian
Interbank Deposit
Average | | | (22,161 | ) |
| | | | | | | 270 | | | | 01/04/21 | | | 14.650 | | 1 month Brazilian
Interbank Deposit
Average | | | (1,292 | ) |
| | |
| 28 | | The accompanying notes are an integral part of these financial statements. |
GOLDMAN SACHS FIXED INCOME MACRO STRATEGIES FUND
|
| ADDITIONAL INVESTMENT INFORMATION (continued) |
OVER THE COUNTER INTEREST RATE SWAP CONTRACTS (continued)
| | | | | | | | | | | | | | | | | | | | |
| | | | | | | | | | | | Rates Exchanged | | | |
| Counterparty | | | | | Notional
Amount (000s) | | | Termination Date | | | Payments Received | | Payments Made | | Unrealized
Gain (Loss)* | |
JPMorgan Securities, Inc. (continued) | | | BRL | | | | 1,060 | | | | 01/04/21 | | | 14.660% | | 1 month Brazilian
Interbank Deposit
Average | | $ | (4,999 | ) |
| | | | | | | 2,130 | | | | 01/04/21 | | | 14.402 | | 1 month Brazilian
Interbank Deposit
Average | | | (13,714 | ) |
| | | | | | | 3,810 | | | | 01/04/21 | | | 1 month Brazilian
Interbank Deposit
Average | | 13.720% | | | 42,450 | |
| | | | | | | 1,690 | | | | 01/02/23 | | | 13.760 | | 1 month Brazilian
Interbank Deposit
Average | | | (20,019 | ) |
| | | KRW | | | | 150,550 | | | | 01/15/24 | | | 3 month KWCDC | | 3.445 | | | (16,905 | ) |
| | | | | | | 4,862,330 | (a) | | | 09/19/24 | | | 3 month KWCDC | | 3.126 | | | (204,967 | ) |
| | | | | | | 180,090 | (a) | | | 06/02/25 | | | 3 month KWCDC | | 2.428 | | | (2,230 | ) |
| | | | | | | 115,700 | (a) | | | 06/09/25 | | | 3 month KWCDC | | 2.645 | | | (2,429 | ) |
| | | | | | | 179,225 | (a) | | | 06/23/25 | | | 3 month KWCDC | | 2.534 | | | (2,954 | ) |
| | | | | | | 436,830 | (a) | | | 09/22/25 | | | 3 month KWCDC | | 2.250 | | | (2,006 | ) |
Morgan Stanley & Co. International PLC | | | BRL | | | | 2,490 | | | | 01/04/16 | | | 12.985 | | 1 month Brazilian
Interbank Deposit
Average | | | (2,300 | ) |
| | | | | | | 10,170 | | | | 01/04/16 | | | 13.835 | | 1 month Brazilian
Interbank Deposit
Average | | | (4,195 | ) |
| | | | | | $ | 1,400 | | | | 08/17/16 | | | 0.630 | | 3 month LIBOR | | | 1,673 | |
| | | BRL | | | | 610 | | | | 01/02/17 | | | 16.490 | | 1 month Brazilian
Interbank Deposit
Average | | | 1,326 | |
| | | | | | | 1,000 | | | | 01/02/17 | | | 15.700 | | 1 month Brazilian
Interbank Deposit
Average | | | 314 | |
| | | | | | | 4,580 | | | | 01/02/17 | | | 15.954 | | 1 month Brazilian
Interbank Deposit
Average | | | 4,188 | |
| | | | | | | 4,890 | | | | 01/02/17 | | �� | 15.575 | | 1 month Brazilian
Interbank Deposit
Average | | | (106 | ) |
| | | | | | | 1,400 | | | | 08/17/17 | | | 3 month LIBOR | | 1.075 | | | (2,993 | ) |
| | | KRW | | | | 387,270 | | | | 10/13/17 | | | 2.250 | | 3 month KWCDC | | | 5,360 | |
| | | | | | | 833,730 | | | | 10/14/17 | | | 2.245 | | 3 month KWCDC | | | 11,482 | |
| | | | | | | 833,730 | | | | 10/14/17 | | | 2.250 | | 3 month KWCDC | | | 11,561 | |
| | | | | | | 565,220 | | | | 10/28/17 | | | 2.168 | | 3 month KWCDC | | | 6,958 | |
| | | | | | | 963,930 | | | | 10/29/17 | | | 2.175 | | 3 month KWCDC | | | 11,989 | |
| | | BRL | | | | 550 | | | | 01/04/21 | | | 14.250 | | 1 month Brazilian
Interbank Deposit
Average | | | (4,110 | ) |
| | | | | | | 2,260 | | | | 01/04/21 | | | 1 month Brazilian
Interbank Deposit
Average | | 11.410 | | | 67,192 | |
| | | KRW | | | | 219,110 | (a) | | | 09/23/25 | | | 3 month KWCDC | | 2.250 | | | (1,005 | ) |
| | |
| The accompanying notes are an integral part of these financial statements. | | 29 |
GOLDMAN SACHS FIXED INCOME MACRO STRATEGIES FUND
Consolidated Schedule of Investments (continued)
September 30, 2015 (Unaudited)
|
| ADDITIONAL INVESTMENT INFORMATION (continued) |
OVER THE COUNTER INTEREST RATE SWAP CONTRACTS (continued)
| | | | | | | | | | | | | | | | | | | | |
| | | | | | | | | | | | Rates Exchanged | | | |
| Counterparty | | | | | Notional
Amount (000s) | | | Termination Date | | | Payments Received | | Payments Made | | Unrealized
Gain (Loss)* | |
Morgan Stanley & Co. International PLC (continued) | | | KRW | | | | 219,110 | (a) | | | 09/23/25 | | | 3 month KWCDC | | 2.260% | | $ | (1,092 | ) |
| | | | | | | | 219,110 | (a) | | | 09/23/25 | | | 3 month KWCDC | | 2.265 | | | (1,135 | ) |
| TOTAL | | | | | | | | | | | | | | | | | | $ | (293,963 | ) |
| | * | | There are no upfront payments on the swap contracts, therefore the unrealized gain (loss) on the swap contracts is equal to their market value. |
| | (a) | | Represents forward starting interest rate swaps whose effective dates of commencement of accruals and cash flows occur subsequent to September 30, 2015. |
CENTRALLY CLEARED INTEREST RATE SWAP CONTRACTS
| | | | | | | | | | | | | | | | |
| | | | | | Rates Exchanged | | Market Value | |
Notional Amount (000s) | | | Termination
Date | | Payments Received | | Payments Made | | Upfront Payments Made (Received) | | | Unrealized Gain (Loss) | |
| MXN | 62,000 | | | 09/15/16 | | 3.958% | | Mexico Interbank TIIE
28 Days | | $ | 21 | | | $ | 8,757 | |
| | 18,820 | | | 09/16/16 | | 3.975 | | Mexico Interbank TIIE
28 Days | | | 6 | | | | 2,668 | |
| | 18,880 | | | 09/19/16 | | 3.980 | | Mexico Interbank TIIE
28 Days | | | 6 | | | | 2,368 | |
| $ | 5,300 | | | 09/21/16 | | 3 month LIBOR | | 0.592% | | | 5 | | | | (5,691 | ) |
| MXN | 20,010 | | | 09/22/16 | | 3.850 | | Mexico Interbank TIIE
28 Days | | | 7 | | | | 548 | |
| | 26,650 | | | 09/28/16 | | 3.895 | | Mexico Interbank TIIE
28 Days | | | 6 | | | | 115 | |
| $ | 500 | | | 03/19/17 | | 3 month LIBOR | | 0.750 | | | 1,812 | | | | (2,804 | ) |
| MXN | 24,640 | (a) | | 12/13/17 | | Mexico Interbank TIIE
28 Days | | 4.500 | | | 5,525 | | | | (3,879 | ) |
| HUF | 130,750 | | | 06/09/18 | | 1.860 | | 6 month BUBOR | | | 1 | | | | (5,169 | ) |
| MXN | 17,800 | | | 11/22/18 | | Mexico Interbank TIIE
28 Days | | 4.620 | | | 6 | | | | 5,520 | |
| | 34,380 | (a) | | 12/12/18 | | 4.750 | | Mexico Interbank TIIE
28 Days | | | (20,663 | ) | | | 8,752 | |
| $ | 4,000 | (a) | | 12/16/18 | | 3 month LIBOR | | 1.750 | | | (54,701 | ) | | | (23,581 | ) |
| MXN | 21,960 | | | 09/23/19 | | Mexico Interbank TIIE
28 Days | | 5.480 | | | 8 | | | | (19,847 | ) |
| EUR | 5,020 | (a) | | 12/16/20 | | 0.500 | | 6 month EURO | | | 8,435 | | | | 23,215 | |
| CAD | 6,300 | (a) | | 12/16/20 | | 1.250 | | 3 month CDOR | | | 9,012 | | | | (1,971 | ) |
| NOK | 7,880 | (a) | | 12/16/20 | | 1.500 | | 6 month NIBOR | | | 2,024 | | | | 6,601 | |
| $ | 300 | (a) | | 12/16/20 | | 2.000 | | 3 month LIBOR | | | 4,130 | | | | 3,494 | |
| | 2,640 | | | 12/16/20 | | 3 month LIBOR | | 2.000 | | | (34,681 | ) | | | (32,403 | ) |
| SEK | 50,600 | (a) | | 12/16/20 | | 3 month STIBOR | | 0.500 | | | 16,646 | | | | 4,321 | |
| HUF | 763,240 | (a) | | 12/16/20 | | 6 month BUBOR | | 2.415 | | | (5,169 | ) | | | (45,834 | ) |
| EUR | 11,910 | | | 12/16/20 | | 6 month EURO | | 0.500 | | | (14,840 | ) | | | (60,249 | ) |
| $ | 61,400 | (a) | | 06/24/21 | | 2.923 | | 3 month LIBOR | | | (28,666 | ) | | | 824,324 | |
| MXN | 12,250 | (a) | | 11/02/21 | | 7.370 | | Mexico Interbank TIIE
28 Days | | | 5 | | | | 3,002 | |
| | 9,350 | (a) | | 01/17/22 | | 6.470 | | Mexico Interbank TIIE
28 Days | | | 4 | | | | (6,504 | ) |
| | |
| 30 | | The accompanying notes are an integral part of these financial statements. |
GOLDMAN SACHS FIXED INCOME MACRO STRATEGIES FUND
|
| ADDITIONAL INVESTMENT INFORMATION (continued) |
CENTRALLY CLEARED INTEREST RATE SWAP CONTRACTS (continued)
| | | | | | | | | | | | | | | | |
| | | | | | Rates Exchanged | | Market Value | |
Notional Amount (000s) | | | Termination
Date | | Payments Received | | Payments Made | | Upfront Payments Made (Received) | | | Unrealized Gain (Loss) | |
| MXN | 9,450 | (a) | | 01/21/22 | | 6.295% | | Mexico Interbank TIIE
28 Days | | $ | 4 | | | $ | (8,168 | ) |
| | 9,390 | (a) | | 01/26/22 | | 6.380 | | Mexico Interbank TIIE
28 Days | | | 4 | | | | (7,413 | ) |
| | 18,970 | (a) | | 02/16/22 | | 6.710 | | Mexico Interbank TIIE
28 Days | | | 8 | | | | (9,517 | ) |
| | 9,720 | (a) | | 03/04/22 | | 7.040 | | Mexico Interbank TIIE
28 Days | | | 4 | | | | (2,043 | ) |
| | 8,270 | (a) | | 04/05/22 | | 6.900 | | Mexico Interbank TIIE
28 Days | | | 4 | | | | (3,085 | ) |
| | 16,340 | (a) | | 08/08/22 | | 7.345 | | Mexico Interbank TIIE
28 Days | | | 7 | | | | (1,239 | ) |
| | 16,560 | (a) | | 08/11/22 | | 7.370 | | Mexico Interbank TIIE
28 Days | | | 7 | | | | (917 | ) |
| $ | 77,420 | (a) | | 09/02/22 | | 2.810 | | 3 month LIBOR | | | 111,440 | | | | 312,814 | |
| MXN | 94,220 | (a) | | 09/15/22 | | 7.500 | | Mexico Interbank TIIE
28 Days | | | 40 | | | | 3,338 | |
| | 34,610 | (a) | | 12/07/22 | | 5.250 | | Mexico Interbank TIIE
28 Days | | | (120,949 | ) | | | 19,563 | |
| $ | 1,600 | (a) | | 12/16/22 | | 2.250 | | 3 month LIBOR | | | 28,220 | | | | 22,725 | |
| | 3,160 | | | 12/16/22 | | 3 month LIBOR | | 2.250% | | | (46,690 | ) | | | (53,926 | ) |
| EUR | 610 | (a) | | 12/16/22 | | 6 month EURO | | 0.500 | | | 14,102 | | | | (6,716 | ) |
| MXN | 47,480 | (a) | | 11/29/23 | | Mexico Interbank TIIE
28 Days | | 7.240 | | | 17 | | | | 16,080 | |
| EUR | 16,660 | | | 05/15/24 | | 1.100 | | 6 month EURO | | | (65,288 | ) | | | 523,957 | |
| MXN | 16,740 | (a) | | 07/24/24 | | Mexico Interbank TIIE
28 Days | | 7.370 | | | 7 | | | | 4,313 | |
| | 5,310 | (a) | | 10/29/24 | | Mexico Interbank TIIE
28 Days | | 7.450 | | | 2 | | | | (183 | ) |
| | 3,320 | | | 11/20/24 | | Mexico Interbank TIIE
28 Days | | 5.955 | | | 2 | | | | 4,555 | |
| | 4,020 | (a) | | 01/13/25 | | Mexico Interbank TIIE
28 Days | | 6.470 | | | 2 | | | | 8,826 | |
| | 3,980 | (a) | | 01/17/25 | | Mexico Interbank TIIE
28 Days | | 6.315 | | | 2 | | | | 10,087 | |
| | 4,030 | (a) | | 01/22/25 | | Mexico Interbank TIIE
28 Days | | 6.405 | | | 2 | | | | 9,453 | |
| | 8,160 | (a) | | 02/12/25 | | Mexico Interbank TIIE
28 Days | | 6.730 | | | 4 | | | | 13,629 | |
| | 4,190 | (a) | | 02/28/25 | | Mexico Interbank TIIE
28 Days | | 7.065 | | | 2 | | | | 4,073 | |
| | 3,570 | (a) | | 04/01/25 | | Mexico Interbank TIIE
28 Days | | 6.920 | | | 2 | | | | 4,713 | |
| | 11,360 | | | 04/25/25 | | 6.309 | | Mexico Interbank TIIE
28 Days | | | 7 | | | | 374 | |
| EUR | 38,530 | (a) | | 05/11/25 | | 1.568 | | 6 month EURO | | | (119,094 | ) | | | 217,949 | |
| MXN | 11,210 | | | 05/26/25 | | 6.590 | | Mexico Interbank TIIE
28 Days | | | 7 | | | | 14,441 | |
| HUF | 86,620 | | | 06/02/25 | | 6 month BUBOR | | 2.985 | | | 4 | | | | (4,766 | ) |
| MXN | 4,160 | | | 06/03/25 | | 6.450 | | Mexico Interbank TIIE
28 Days | | | 3 | | | | 2,391 | |
| | |
| The accompanying notes are an integral part of these financial statements. | | 31 |
GOLDMAN SACHS FIXED INCOME MACRO STRATEGIES FUND
Consolidated Schedule of Investments (continued)
September 30, 2015 (Unaudited)
|
| ADDITIONAL INVESTMENT INFORMATION (continued) |
CENTRALLY CLEARED INTEREST RATE SWAP CONTRACTS (continued)
| | | | | | | | | | | | | | | | |
| | | | | | Rates Exchanged | | Market Value | |
Notional Amount (000s) | | | Termination
Date | | Payments Received | | Payments Made | | Upfront Payments Made (Received) | | | Unrealized Gain (Loss) | |
| EUR | 18,980 | (a) | | 06/08/25 | | 1.850% | | 6 month EURO | | $ | (54,281 | ) | | $ | 374,612 | |
| | 310 | | | 06/16/25 | | 1.225 | | 6 month EURO | | | 4 | | | | 10,413 | |
| CZK | 8,440 | | | 06/16/25 | | 6 month PRIBOR | | 1.365% | | | 4 | | | | (15,976 | ) |
| HUF | 51,240 | | | 06/19/25 | | 6 month BUBOR | | 3.380 | | | 2 | | | | (12,313 | ) |
| | 101,820 | | | 06/25/25 | | 6 month BUBOR | | 3.380 | | | 3 | | | | (17,874 | ) |
| | 79,720 | | | 07/09/25 | | 6 month BUBOR | | 3.280 | | | 3 | | | | (11,311 | ) |
| EUR | 2,880 | (a) | | 07/10/25 | | 1.700 | | 6 month EURO | | | (72,887 | ) | | | 95,168 | |
| CZK | 8,450 | | | 07/15/25 | | 6 month BUBOR | | 1.295 | | | 4 | | | | (13,067 | ) |
| MXN | 7,090 | (a) | | 08/04/25 | | Mexico Interbank TIIE
28 Days | | 7.405 | | | 4 | | | | 3,147 | |
| | 7,150 | (a) | | 08/07/25 | | Mexico Interbank TIIE
28 Days | | 7.430 | | | 4 | | | | 2,826 | |
| ZAR | 2,420 | (a) | | 08/24/25 | | 9.110 | | 3 month JIBAR | | | 2 | | | | (522 | ) |
| | 4,490 | (a) | | 08/24/25 | | 9.136 | | 3 month JIBAR | | | 4 | | | | (738 | ) |
| | 4,510 | (a) | | 08/24/25 | | 9.145 | | 3 month JIBAR | | | 4 | | | | (664 | ) |
| MXN | 41,000 | (a) | | 09/11/25 | | Mexico Interbank TIIE
28 Days | | 7.600 | | | 21 | | | | 3,424 | |
| EUR | 2,680 | (a) | | 09/16/25 | | 2.000 | | 6 month EURO | | | (34,737 | ) | | | 92,893 | |
| GBP | 2,020 | (a) | | 09/16/25 | | 6 month BP | | 2.750 | | | (23,538 | ) | | | (44,791 | ) |
| EUR | 260 | (a) | | 09/28/25 | | 1.500 | | 6 month EURO | | | (1,156 | ) | | | (283 | ) |
| $ | 210 | (a) | | 09/28/25 | | 2.750 | | 3 month LIBOR | | | (668 | ) | | | 1,222 | |
| GBP | 320 | (a) | | 09/28/25 | | 6 month BP | | 2.250 | | | 550 | | | | (421 | ) |
| JPY | 15,290 | (a) | | 12/16/25 | | 0.500 | | 6 month JYOR | | | (713 | ) | | | 340 | |
| EUR | 18,555 | (a) | | 12/16/25 | | 0.750 | | 6 month EURO | | | (586,675 | ) | | | 73,156 | |
| | 5,470 | (a) | | 12/16/25 | | 1.500 | | 6 month EURO | | | (207,218 | ) | | | 164,324 | |
| GBP | 440 | (a) | | 12/16/25 | | 2.000 | | 6 month BP | | | 1,473 | | | | 7,576 | |
| CAD | 1,810 | (a) | | 12/16/25 | | 3 month CDOR | | 2.500 | | | 32,369 | | | | (21,686 | ) |
| $ | 9,160 | (a) | | 12/16/25 | | 3 month LIBOR | | 2.500 | | | (155,838 | ) | | | (213,137 | ) |
| | 4,910 | (a) | | 12/16/25 | | 3 month LIBOR | | 3.000 | | | (45,682 | ) | | | (15,783 | ) |
| NZD | 470 | (a) | | 12/16/25 | | 3 month NZDOR | | 3.750 | | | (2,117 | ) | | | (3,509 | ) |
| | 570 | (a) | | 12/16/25 | | 3 month NZDOR | | 4.000 | | | 6,103 | | | | (5,037 | ) |
| SEK | 22,570 | (a) | | 12/16/25 | | 3 month STIBOR | | 1.500 | | | (21,830 | ) | | | 45 | |
| AUD | 4,740 | (a) | | 12/16/25 | | 3.000 | | 6 month
AUDOR | | | (17,252 | ) | | | 45,032 | |
| | 2,460 | (a) | | 12/16/25 | | 6 month AUDOR | | 3.500 | | | 7,447 | | | | (8,844 | ) |
| GBP | 2,090 | (a) | | 12/16/25 | | 6 month BP | | 2.750 | | | (45,307 | ) | | | (22,807 | ) |
| JPY | 442,100 | (a) | | 12/16/25 | | 6 month JYOR | | 1.000 | | | (26,662 | ) | | | 543 | |
| MXN | 20,410 | (a) | | 11/25/26 | | 7.707 | | Mexico
Interbank TIIE
28 Days | | | 7 | | | | (5,145 | ) |
| | 7,390 | (a) | | 07/21/27 | | 7.660 | | Mexico
Interbank TIIE
28 Days | | | 4 | | | | (3,567 | ) |
| $ | 15,700 | (a) | | 06/24/29 | | 3 month LIBOR | | 3.218 | | | 58,946 | | | | (743,435 | ) |
| EUR | 9,850 | (a) | | 06/08/30 | | 6 month EURO | | 2.100 | | | (30,980 | ) | | | (247,477 | ) |
| $ | 18,150 | (a) | | 09/02/30 | | 3 month LIBOR | | 3.004 | | | (26,211 | ) | | | (258,909 | ) |
| GBP | 710 | | | 12/07/30 | | 6 month BP | | 2.125 | | | 3,429 | | | | (24,444 | ) |
| $ | 1,000 | (a) | | 12/16/30 | | 2.500 | | 3 month LIBOR | | | (9,386 | ) | | | 31,485 | |
| | 600 | (a) | | 12/16/30 | | 3 month LIBOR | | 2.500 | | | 3,265 | | | | (16,524 | ) |
| EUR | 6,870 | (a) | | 12/16/30 | | 6 month EURO | | 1.000 | | | 447,534 | | | | (57,345 | ) |
| GBP | 140 | | | 06/07/32 | | 6 month BP | | 1.844 | | | (1,139 | ) | | | 6,228 | |
| | |
| 32 | | The accompanying notes are an integral part of these financial statements. |
GOLDMAN SACHS FIXED INCOME MACRO STRATEGIES FUND
|
| ADDITIONAL INVESTMENT INFORMATION (continued) |
CENTRALLY CLEARED INTEREST RATE SWAP CONTRACTS (continued)
| | | | | | | | | | | | | | | | |
| | | | | | Rates Exchanged | | Market Value | |
Notional Amount (000s) | | | Termination
Date | | Payments Received | | Payments Made | | Upfront Payments Made (Received) | | | Unrealized Gain (Loss) | |
| MXN | 6,130 | | | 04/13/35 | | Mexico Interbank TIIE
28 Days | | 6.890% | | $ | 5 | | | $ | 6,583 | |
| EUR | 14,370 | (a) | | 05/11/35 | | 6 month EURO | | 1.695 | | | 235,777 | | | | 178,507 | |
| MXN | 6,150 | | | 05/14/35 | | Mexico Interbank TIIE
28 Days | | 7.200 | | | 5 | | | | (7,124 | ) |
| | 2,290 | | | 05/22/35 | | Mexico Interbank TIIE
28 Days | | 7.055 | | | 2 | | | | (86 | ) |
| $ | 600 | (a) | | 12/16/35 | | 3 month LIBOR | | 2.500 | | | (978 | ) | | | 5,198 | |
| EUR | 4,200 | (a) | | 12/17/35 | | 2.250% | | 6 month EURO | | | 36,607 | | | | 24,005 | |
| $ | 360 | (a) | | 12/17/35 | | 3 month LIBOR | | 3.000 | | | 2,200 | | | | (3,223 | ) |
| GBP | 960 | (a) | | 12/17/35 | | 6 month BP | | 2.500 | | | (22,075 | ) | | | 7,103 | |
| JPY | 75,600 | (a) | | 12/17/35 | | 6 month JYOR | | 2.000 | | | (5,188 | ) | | | (3,307 | ) |
| GBP | 336 | | | 06/08/37 | | 6 month BP | | 2.100 | | | (18,825 | ) | | | 14,008 | |
| | 430 | | | 04/15/39 | | 6 month BP | | 2.060 | | | (22,470 | ) | | | 20,021 | |
| $ | 700 | (a) | | 12/16/45 | | 2.750 | | 3 month LIBOR | | | (7,148 | ) | | | 37,583 | |
| GBP | 2,000 | (a) | | 12/16/45 | | 6 month GBP | | 2.250 | | | (70,600 | ) | | | (49,984 | ) |
| $ | 100 | (a) | | 12/18/45 | | 3 month LIBOR | | 2.750 | | | (385 | ) | | | (3,963 | ) |
| EUR | 1,300 | (a) | | 12/19/45 | | 1.750 | | 6 month EURO | | | 3,274 | | | | 9,806 | |
| GBP | 870 | (a) | | 12/19/45 | | 6 month BP | | 2.500 | | | (27,690 | ) | | | (8,072 | ) |
| | TOTAL | | | | | | | | | $ | (1,009,759 | ) | | $ | 1,154,941 | |
| | (a) | | Represents forward starting interest rate swaps whose effective dates of commencement of accruals and cash flows occur subsequent to September 30, 2015. |
OVER THE COUNTER CREDIT DEFAULT SWAP CONTRACTS
| | | | | | | | | | | | | | | | | | | | | | | | | | |
| | | | | | | | | | | | | | | | | Market Value | |
| Counterparty | | Referenced Obligation | | Notional
Amount
(000s) | | | Rates Received
(Paid) | | | Termination
Date | | | Credit
Spread at
September 30,
2015(b) | | | Upfront
Payments
Made (Received) | | | Unrealized
Gain (Loss) | |
Protection Purchased: | | | | | | | | | | | | | | | | | | | | | | | | | | |
Barclays Bank PLC | | People’s Republic of China, 7.500%, 10/28/2027 | | $ | 40 | | | | (1.000 | )% | | | 03/20/19 | | | | 0.904 | % | | $ | (178 | ) | | $ | 37 | |
| | | | | 210 | | | | (1.000 | ) | | | 03/20/19 | | | | 0.904 | | | | (484 | ) | | | (260 | ) |
Citibank NA | | | | | 4,340 | | | | (1.000 | ) | | | 03/20/19 | | | | 0.904 | | | | (25,075 | ) | | | 9,706 | |
| | | | | 2,260 | | | | (1.000 | ) | | | 06/20/19 | | | | 0.965 | | | | (10,311 | ) | | | 6,802 | |
JPMorgan Securities, Inc. | | | | | 250 | | | | (1.000 | ) | | | 03/20/19 | | | | 0.904 | | | | (612 | ) | | | (273 | ) |
| | | | | 330 | | | | (1.000 | ) | | | 06/20/19 | | | | 0.965 | | | | (1,472 | ) | | | 959 | |
Protection Sold: | | | | | | | | | | | | | | | | | | | | | | | | | | |
Barclays Bank PLC | | Markit CMBX Series 6 | | | 200 | | | | 2.000 | % | | | 05/11/63 | | | | 2.388 | | | | 2,257 | | | | (7,096 | ) |
| | | | | | 200 | | | | 2.000 | | | | 05/11/63 | | | | 2.388 | | | | 1,189 | | | | (6,029 | ) |
| TOTAL | | | | | | | | | | | | | | | | | | | | $ | (34,686 | ) | | $ | 3,846 | |
| | (b) | | Credit spread on the Referenced Obligation, together with the term of the swap contract, are indicators of payment/performance risk. The likelihood of a credit event occurring which would require a fund to make a payment or otherwise be required to perform under the swap contract is generally greater as the credit spread and the term of the swap contract increase. |
| | |
| The accompanying notes are an integral part of these financial statements. | | 33 |
GOLDMAN SACHS FIXED INCOME MACRO STRATEGIES FUND
Consolidated Schedule of Investments (continued)
September 30, 2015 (Unaudited)
|
| ADDITIONAL INVESTMENT INFORMATION (continued) |
CENTRALLY CLEARED CREDIT DEFAULT SWAP CONTRACTS
| | | | | | | | | | | | | | | | | | | | | | |
| | | | | | | | | | | | | | Market Value | |
| Referenced Obligation | | Notional
Amount
(000s) | | Rates Received
(Paid) | | | Termination
Date | | | Credit Spread at
September 30,
2015(b) | | | Upfront
Payments
Made (Received) | | | Unrealized
Gain (Loss) | |
Protection Sold: | | | | | | | | | | | | | | | | | | | | | | |
CDX North America High Yield Index 24 | | $1,584 | | | 5.000 | % | | | 06/20/20 | | | | 4.282 | % | | $ | 108,434 | | | $ | (60,132 | ) |
CDX North America High Yield Index 25 | | 3,650 | | | 5.000 | | | | 12/20/20 | | | | 0.926 | | | | 14,137 | | | | 306 | |
| TOTAL | | | | | | | | | | | | | | | | $ | 122,571 | | | $ | (59,826 | ) |
| | (b) | | Credit spread on the Referenced Obligation, together with the term of the swap contract, are indicators of payment/performance risk. The likelihood of a credit event occurring which would require a fund to make a payment or otherwise be required to perform under the swap contract is generally greater as the credit spread and the term of the swap contract increase. |
OVER THE COUNTER CROSS CURRENCY SWAP CONTRACTS
| | | | | | | | | | | | | | | | | | | | | | | | |
| | | | | | | | | | | Rates Exchanged | | | Market Value | |
| Counterparty | | Notional Amount
of Currency
Received | | | Notional Amount
of Currency
Delivered | | | Termination
Date | | Receive | | Pay | | | Upfront
Payments
Made (Received) | | | Unrealized
Gain (Loss) | |
Bank of America Securities LLC | | $ | 400,771 | | | TRY | 1,040,000 | | | 04/07/20 | | 3 month LIBOR | | | 8.770% | | | $ | (1,597 | ) | | $ | 72,784 | |
Citibank NA | | | 931,649 | | | | 1,935,500 | | | 05/16/19 | | 3 month LIBOR | | | 9.370 | | | | (3,037 | ) | | | 308,534 | |
JPMorgan Securities, Inc. | | | 1,000,000 | | | | 3,030,000 | | | 09/17/20 | | 3 month LIBOR | | | 11.040 | | | | (479 | ) | | | (1,978 | ) |
Morgan Stanley & Co. International PLC | | TR | Y 990,000 | | | $ | 394,422 | | | 03/03/20 | | 8.930% | | | 3 month LIBOR | | | | 205 | | | | (75,554 | ) |
| TOTAL | | | | | | | | | | | | | | | | | | $ | (4,908 | ) | | $ | 303,786 | |
OVER THE COUNTER TOTAL RETURN SWAP CONTRACTS
| | | | | | | | | | | | | | | | | | | | |
| | | | | | | | | | | | | Market Value | |
| Counterparty | | Notional
Amount
(000s) | | | Reference Security | | Termination
Date | | | Financing Fee# | | Upfront
Payments
Made (Received) | | | Unrealized
Gain (Loss) | |
Bank of America Securities LLC | | BRL | 735 | | | Notas do Tesouro Nacional Series B, 6.000% 8/15/50 | | | 10/14/15 | | | 3 month LIBOR | | $ | 15 | | | $ | (193,275 | ) |
| | | 500 | | | Notas do Tesouro Nacional Series B, 6.000% 8/15/50 | | | 11/06/15 | | | 3 month LIBOR | | | (53 | ) | | | (82,060 | ) |
Credit Suisse International (London) | | $ | 3,660 | | | Markit IOS Fannie-Mae Index, 30yr Fixed Rate, 4.000%, Series 13 | | | 01/12/44 | | | One month LIBOR | | | (57,313) | | | | 22,139 | |
| TOTAL | | | | | | | | | | | | | | $ | (57,351 | ) | | $ | (253,196 | ) |
| | # | | The Fund receives annual coupon payments in accordance with the swap contracts. On the termination date of the swap contracts, the Fund will either receive from or pay to the counterparty an amount equal to the net of the accrued financing fees and the value of the reference security subtracted from the original notional cost (notional multiplied by the price change of the reference security, converted to U.S. Dollars). |
| | |
| 34 | | The accompanying notes are an integral part of these financial statements. |
GOLDMAN SACHS FIXED INCOME MACRO STRATEGIES FUND
|
| ADDITIONAL INVESTMENT INFORMATION (continued) |
OVER THE COUNTER TOTAL RETURN SWAP CONTRACTS ON COMMODITY INDICES
| | | | | | | | | | | | | | | | | | |
| Counterparty | | Referenced Obligation(c) | | Notional
Amount
(000s) | | | Paid
Rate | | | Termination
Date | | | Unrealized
Gain (Loss)* | |
Merrill Lynch International Bank Ltd. | | Dow Jones-UBS Brent Crude Subindex | | $ | 2,953 | | | | 0.000 | % | | | 10/07/15 | | | $ | (431 | ) |
| | Dow Jones-UBS Copper Subindex | | | 1,010 | | | | 0.000 | | | | 10/07/15 | | | | — | |
| | Dow Jones-UBS Corn Subindex | | | 2,500 | | | | 0.000 | | | | 10/07/15 | | | | — | |
| | Dow Jones-UBS Gold Subindex | | | 2,264 | | | | 0.000 | | | | 10/07/15 | | | | — | |
| | Dow Jones-UBS Platinum Subindex | | | 576 | | | | 0.000 | | | | 10/07/15 | | | | (98 | ) |
| | Dow Jones-UBS Soybeans Subindex | | | 1,063 | | | | 0.000 | | | | 10/07/15 | | | | — | |
| | Dow Jones-UBS Wheat Subindex | | | 396 | | | | 0.000 | | | | 10/07/15 | | | | — | |
| | Dow Jones-UBS WTI Crude Oil Subindex | | | 4,725 | | | | 0.000 | | | | 10/07/15 | | | | — | |
| | Dow Jones-UBS Zinc Subindex | | | 858 | | | | 0.000 | | | | 10/07/15 | | | | — | |
| | Merrill Lynch Extra Palladium Excess Return Index | | | 701 | | | | 0.000 | | | | 10/07/15 | | | | (99 | ) |
Morgan Stanley & Co. International PLC | | Dow Jones-UBS Natural Gas Subindex | | | 1,148 | | | | 0.000 | | | | 10/07/15 | | | | (40 | ) |
| | | Dow Jones-UBS Platinum Subindex | | | 1,287 | | | | 0.000 | | | | 10/07/15 | | | | (14 | ) |
| TOTAL | | | | | | | | | | | | | | | | $ | (682 | ) |
| | (c) | | The Fund receives quarterly payments based on any positive monthly return of the Referenced Obligation. The Fund makes payments on any negative monthly return of such referenced obligation. |
| | * | | There are no upfront payments on the swap contracts, therefore the unrealized gain/loss of the swap contracts is equal to their market value. |
NON-DELIVERABLE BOND FORWARD CONTRACTS
| | | | | | | | | | | | |
| Counterparty | | Notional Amount (000s) | | | Reference Obligation | | Settlement Date | | Unrealized Gain (Loss)* | |
Deutsche Bank AG | | | COP 2,162,000 | | | Titulos de Tesoreria 7.750% 09/18/30 | | 10/14/15 | | $ | 6,890 | |
| | | COP 1,558,700 | | | Titulos de Tesoreria 7.500% 07/24/24 | | 10/14/15 | | | 2,978 | |
| | | COP 3,476,400 | | | Titulos de Tesoreria 10.000% 07/24/24 | | 10/14/15 | | | 1,897 | |
| | | COP 1,091,400 | | | Titulos de Tesoreria 7.750% 09/18/30 | | 10/15/15 | | | 1,661 | |
| | | | COP 1,831,900 | | | Titulos de Tesoreria 7.500% 08/26/26 | | 10/15/15 | | | 2,403 | |
| TOTAL | | | | | | | | | | $ | 15,829 | |
| | * | | Represents a short term forward contract to purchase the referenced obligation denominated in a non-deliverable foreign currency. |
| | |
| The accompanying notes are an integral part of these financial statements. | | 35 |
GOLDMAN SACHS FIXED INCOME MACRO STRATEGIES FUND
Consolidated Schedule of Investments (continued)
September 30, 2015 (Unaudited)
|
| ADDITIONAL INVESTMENT INFORMATION (continued) |
WRITTEN OPTIONS CONTRACTS — For the six months ended September 30, 2015 the Fund had the following written options:
WRITTEN OPTION CURRENCY CONTRACTS
| | | | | | | | | | | | | | |
| Counterparty | | Description | | Notional
Amount
(000s) | | | Expiration
Date | | Exercise
Price | | Value | |
BNP Paribas SA (Premium Received $3,975) | | Put CNH/Call USD | | $ | 1,407 | | | 10/20/15 | | 6.500% | | $ | (2,706 | ) |
WRITTEN OPTION CURRENCY CONTRACTS — For the six months ended September 30, 2015, the Fund had the following written currency options activity:
| | | | | | | | |
| | | Notional Amount (000s) | | | Premiums Received | |
Contracts Outstanding March 31, 2015 | | | — | | | $ | — | |
Contracts Written | | | 3,836 | | | | 53,081 | |
Contracts Bought to Close | | | — | | | | — | |
Contracts Expired | | | (2,429 | ) | | | (49,106 | ) |
Contracts Outstanding September 30, 2015 | | | 1,407 | | | $ | 3,975 | |
INTEREST RATE SWAPTION CONTRACTS
| | | | | | | | | | | | | | | | | | |
| Counterparty | | Description | | Notional
Amount (000s) | | | Expiration
Date | | | Exercise
Rate | | | Value | |
Bank of America Securities LLC | | Put - OTC - 2 year Swap for the obligation to pay a fixed rate of 1.000% versus the 3 month LIBOR maturing on May 05, 2024 | | | CAD 13,600 | | | | 05/24/16 | | | | 1.000 | % | | $ | (53,287 | ) |
Citibank NA | | Call - OTC - 1 year Swap for the obligation to pay a fixed rate of 3.200% versus the 3 month LIBOR maturing on August 08, 2016 | | $ | 2,700 | | | | 08/08/16 | | | | 3.200 | | | | (124 | ) |
Citigroup Global Markets, Inc. | | Call - OTC - 1 year Swap for the obligation to pay a fixed rate of 3.100% versus the 3 month LIBOR maturing on January 7, 2020 | | | 3,400 | | | | 08/12/16 | | | | 3.100 | | | | (223 | ) |
| | Call - OTC - 1 year Swap for the obligation to pay a fixed rate of 3.550% versus the 3 month LIBOR maturing on January 7, 2020 | | | 3,400 | | | | 09/06/16 | | | | 3.550 | | | | (96 | ) |
Deutsche Bank AG | | Call - OTC - 5 year Swap for the obligation to pay a fixed rate of 2.913% versus the 3 month LIBOR maturing on February 22, 2026 | | | 3,200 | | | | 02/18/16 | | | | 2.913 | | | | (23,060 | ) |
| | Put - OTC - 2 year Swap for the obligation to pay a fixed rate of 0.700% versus the 3 month LIBOR maturing on January 27, 2018 | | | 13,600 | | | | 01/25/16 | | | | 0.700 | | | | (14,960 | ) |
| | Put - OTC - 2 year Swap for the obligation to pay a fixed rate of 0.950% versus the 3 month LIBOR maturing on January 27, 2018 | | | 13,600 | | | | 01/25/16 | | | | 0.950 | | | | (44,788 | ) |
| | Put - OTC - 3 year Swap for the obligation to pay a fixed rate of 0.748% versus the 3 month LIBOR maturing on February 28, 2019 | | | 13,900 | | | | 02/25/16 | | | | 0.748 | | | | (14,920 | ) |
| | |
| 36 | | The accompanying notes are an integral part of these financial statements. |
GOLDMAN SACHS FIXED INCOME MACRO STRATEGIES FUND
|
| ADDITIONAL INVESTMENT INFORMATION (continued) |
INTEREST RATE SWAPTION CONTRACTS (continued)
| | | | | | | | | | | | | | | | | | |
| Counterparty | | Description | | Notional
Amount (000s) | | | Expiration
Date | | | Exercise
Rate | | | Value | |
Deutsche Bank AG (continued) | | Put - OTC - 3 year Swap for the obligation to pay a fixed rate of 0.998% versus the 3 month LIBOR maturing on February 28, 2019 | | $ | 13,900 | | | | 02/25/16 | | | | 0.998 | | | $ | (41,943 | ) |
JPMorgan Securities, Inc. | | Call - OTC - 1 year Swap for the obligation to pay a fixed rate of 3.000% versus the 3 month LIBOR maturing on August 23, 2018 | | | 3,400 | | | | 08/19/16 | | | | 3.000 | | | | (321 | ) |
| | Put - OTC - 2 year Swap for the obligation to pay a fixed rate of 0.500% versus the 6 month LIBOR maturing on December 12, 2019 | | | EUR 13,600 | | | | 12/10/15 | | | | 0.500 | | | | (36,608 | ) |
| | Put - OTC - 3 year Swap for the obligation to pay a fixed rate of 1.250% versus the 3 month LIBOR maturing on December 8, 2018 | | $ | 27,000 | | | | 12/04/15 | | | | 1.250 | | | | (179,728 | ) |
Morgan Stanley Capital Services, Inc. | | Call - OTC - 2 year Swap for the obligation to pay a fixed rate of 2.300% versus the 3 month LIBOR maturing on January 08, 2020 | | | 14,000 | | | | 01/04/16 | | | | 2.300 | | | | (7,928 | ) |
| | Call - OTC - 5 year Swap for the obligation to pay a fixed rate of 3.168% versus the 3 month LIBOR maturing on January 26, 2026 | | | 3,600 | | | | 01/22/16 | | | | 3.168 | | | | (10,627 | ) |
| | Put - OTC - 10 year Swap for the obligation to pay a fixed rate of 0.925% versus the 3 month LIBOR maturing on September 06, 2026 | | | EUR 1,390 | | | | 09/02/16 | | | | 0.925 | | | | (23,509 | ) |
| | Put - OTC - 2 year Swap for the obligation to pay a fixed rate of 2.190% versus the 3 month LIBOR maturing on February 20, 2020 | | $ | 18,500 | | | | 02/17/16 | | | | 2.190 | | | | (166,968 | ) |
| | Call - OTC - 2 year Swap for the obligation to pay a fixed rate of 2.190% versus the 3 month LIBOR maturing on February 20, 2020 | | | 18,500 | | | | 02/17/16 | | | | 2.190 | | | | (30,227 | ) |
| | | Put - OTC - 2 year Swap for the obligation to pay a fixed rate of 2.300% versus the 3 month LIBOR maturing on January 08, 2020 | | | 14,000 | | | | 01/04/16 | | | | 2.300 | | | | (152,841 | ) |
| TOTAL (Premium Received $495,204) | | | | | | | | | | | | | | $ | (802,158 | ) |
INTEREST RATE SWAPTION CONTRACTS — For the six months ended September 30, 2015, the Fund had the following interest rate swaptions activity:
| | | | | | | | |
| | | Notional
Amount
(000s) | | | Premiums
Received | |
Contracts Outstanding March 31, 2015 | | | 133,700 | | | $ | 495,514 | |
Contracts Written | | | 146,530 | | | | 474,085 | |
Contracts Bought to Close | | | (37,340 | ) | | | (100,110 | ) |
Contracts Expired | | | (47,600 | ) | | | (374,285 | ) |
Contracts Outstanding September 30, 2015 | | | 195,290 | | | $ | 495,204 | |
| | |
| The accompanying notes are an integral part of these financial statements. | | 37 |
GOLDMAN SACHS FIXED INCOME MACRO STRATEGIES FUND
Consolidated Schedule of Investments (continued)
September 30, 2015 (Unaudited)
|
| ADDITIONAL INVESTMENT INFORMATION (continued) |
OPTIONS ON FUTURES CONTRACTS
| | | | | | | | | | | | | | | | | | |
| Counterparty | | Description | | Contracts | | | Expiration
Date | | | Exercise
Price | | | Value | |
Morgan Stanley Capital Services, Inc.
(Premium Received $676) | | Call – 4 Year Eurodollar Futures | | | 66 | | | | 10/16/15 | | | | 99.250 | | | $ | (412 | ) |
OPTIONS ON FUTURES CONTRACTS — For the six months ended September 30, 2015, the Fund had the following futures written options activity:
| | | | | | | | |
| | | Contracts | | | Premiums
Received | |
Contracts Outstanding March 31, 2015 | | | 514 | | | $ | 43,819 | |
Contracts Written | | | 66 | | | | 676 | |
Contracts Bought to Close | | | (514 | ) | | | (43,819 | ) |
Contracts Outstanding September 30, 2015 | | | 66 | | | $ | 676 | |
| | |
| 38 | | The accompanying notes are an integral part of these financial statements. |
GOLDMAN SACHS LONG SHORT CREDIT STRATEGIES FUND
Schedule of Investments
September 30, 2015 (Unaudited)
| | | | | | | | | | | | | | |
Principal Amount | | | Interest Rate | | | Maturity Date | | | Value | |
| | | | | | | | | | | | | | |
| | Secured Debt Obligations – 21.1% | |
| | Senior Term Loans(a) – 7.0% | |
| | Building Materials – 0.4% | |
| Hanson Building Products Ltd. (NR/NR) | |
| $ | 353,225 | | | | 6.500 | % | | | 03/13/22 | | | $ | 349,693 | |
| | 455,000 | | | | 0.000 | | | | 03/24/22 | | | | 450,450 | |
| | | | | | | | | | | | | | |
| | | | | | | | | | | | | 800,143 | |
| | |
| | Consumer Cyclical Services – 1.3% | |
| First Data Corp. (BB-/B1) | |
| | 2,676,000 | | | | 3.696 | | | | 09/24/18 | | | | 2,647,902 | |
| | |
| | Health Care - Services – 0.0% | |
| DaVita HealthCare Partners, Inc. (BB/Ba1) | |
| | 874 | | | | 3.500 | | | | 06/24/21 | | | | 871 | |
| | |
| | Media - Non Cable – 2.1% | |
| Cengage Learning Acquisitions, Inc. (B+/B2) | |
| | 2,684,720 | | | | 7.000 | | | | 03/31/20 | | | | 2,659,887 | |
| Univision Communications, Inc. (B+/B2) | |
| | 1,446,306 | | | | 4.000 | | | | 03/01/20 | | | | 1,435,907 | |
| | | | | | | | | | | | | | |
| | | | | | | | | | | | | 4,095,794 | |
| | |
| | Property/Casualty Insurance – 0.4% | |
| Hyperion Insurance Group Ltd. (B/B1) | |
| | 870,625 | | | | 5.500 | | | | 04/29/22 | | | | 869,537 | |
| | |
| | Retailers – 2.3% | |
| JC Penney Corp., Inc. (NR/NR) | |
| | 2,163,202 | | | | 5.000 | | | | 06/20/19 | | | | 2,153,165 | |
| Kate Spade & Co. (NR/NR) | |
| | 1,105,070 | | | | 4.000 | | | | 04/09/21 | | | | 1,094,848 | |
| Lands End, Inc. (NR/NR) | |
| | 1,032,701 | | | | 4.250 | | | | 04/04/21 | | | | 955,248 | |
| Michaels Stores, Inc. (NR/NR) | |
| | 272,544 | | | | 4.000 | | | | 01/28/20 | | | | 272,590 | |
| | | | | | | | | | | | | | |
| | | | | | | | | | | | | 4,475,851 | |
| | |
| | Telecommunications – Wireless – 0.5% | |
| Fairpoint Communications, Inc. (B/B2) | |
| | 939,514 | | | | 7.500 | | | | 02/14/19 | | | | 941,666 | |
| | |
| | TOTAL SENIOR TERM LOANS | | | $ | 13,831,764 | |
| | |
| | Other Secured Debt Obligations – 14.1% | |
| | Automotive(b)(c)(d) – 2.0% | |
| Schaeffler Holding Finance BV (B/B1) | |
| | 3,888,000 | | | | 6.875 | | | | 08/15/18 | | | | 4,024,080 | |
| | |
| | Building Materials(b)(c) – 1.5% | |
| Builders FirstSource, Inc. (BB-/B3) | |
| | 934,000 | | | | 7.625 | | | | 06/01/21 | | | | 970,192 | |
| HD Supply, Inc. (BB-/B1) | |
| | 1,975,000 | | | | 5.250 | | | | 12/15/21 | | | | 1,987,344 | |
| | | | | | | | | | | | | | |
| | | | | | | | | | | | | 2,957,536 | |
| | |
| | Consumer Cyclical Services(b) – 1.5% | |
| APX Group, Inc. (B/Ba3) | |
| | 3,066,000 | | | | 6.375 | | | | 12/01/19 | | | | 2,928,030 | |
| | |
| | Electric(b)(c) – 0.7% | |
| Calpine Corp. (BB/Ba3) | |
| | 1,386,000 | | | | 6.000 | | | | 01/15/22 | | | | 1,444,905 | |
| | |
| | Secured Debt Obligations – (continued) | |
| | Energy – Exploration & Production(b)(c)(e) – 0.4% | |
| FTS International, Inc. (NR/B1) | |
| $ | 968,000 | | | | 7.837 | % | | | 06/15/20 | | | $ | 721,160 | |
| | |
| | Gaming(b)(c) – 0.5% | |
| International Game Technology PLC (BB+/Ba2) | |
| | 554,000 | | | | 5.625 | | | | 02/15/20 | | | | 540,150 | |
| | 399,000 | | | | 6.250 | | | | 02/15/22 | | | | 368,078 | |
| | | | | | | | | | | | | | |
| | | | | | | | | | | | | 908,228 | |
| | |
| | Health Care – Services – 1.9% | |
| HCA, Inc. (BBB-/Ba1) | |
| | 473,000 | | | | 6.500 | | | | 02/15/20 | | | | 515,570 | |
| Tenet Healthcare Corp. (BB-/Ba2) | |
| | 1,815,000 | | | | 6.000 | | | | 10/01/20 | | | | 1,914,825 | |
| Universal Health Services, Inc. (BBB-/Ba1)(b)(c) | |
| | 1,279,000 | | | | 4.750 | | | | 08/01/22 | | | | 1,304,580 | |
| | | | | | | | | | | | | | |
| | | | | | | | | | | | | 3,734,975 | |
| | |
| | Media – Cable(b)(c) – 3.9% | |
| Altice Financing SA (BB-/B1) | |
| | 3,690,000 | | | | 6.500 | | | | 01/15/22 | | | | 3,579,300 | |
| | 1,166,000 | | | | 6.625 | | | | 02/15/23 | | | | 1,122,275 | |
| Numericable – SFR SAS (B+/Ba3) | |
| | 2,680,000 | | | | 4.875 | | | | 05/15/19 | | | | 2,572,800 | |
| | 476,000 | | | | 6.000 | | | | 05/15/22 | | | | 456,960 | |
| | | | | | | | | | | | | | |
| | | | | | | | | | | | | 7,731,335 | |
| | |
| | Tobacco(b) – 0.7% | |
| Vector Group Ltd. (B+/Ba3) | |
| | 1,372,000 | | | | 7.750 | | | | 02/15/21 | | | | 1,445,745 | |
| | |
| | Transportation(b)(c) – 1.0% | |
| Jack Cooper Holdings Corp. (CCC+/B3) | |
| | 2,103,000 | | | | 9.250 | | | | 06/01/20 | | | | 1,929,503 | |
| | |
| TOTAL OTHER SECURED DEBT
OBLIGATIONS |
| | $ | 27,825,497 | |
| | |
| | TOTAL SECURED DEBT OBLIGATIONS | |
| | (Cost $42,647,581) | | | $ | 41,657,261 | |
| | |
| | | | | | | | | | | | | | |
| | Unsecured Debt Obligations – 62.8% | |
| | Aerospace & Defense(c) – 3.6% | |
| Bombardier, Inc. (B/B2) | |
| $ | 6,229,000 | | | | 5.500 | % | | | 09/15/18 | | | $ | 5,388,085 | |
| | 241,000 | | | | 4.750 | | | | 04/15/19 | | | | 195,210 | |
| | 1,700,000 | | | | 7.750 | | | | 03/15/20 | | | | 1,445,000 | |
| | | | | | | | | | | | | | |
| | | | | | | | | | | | | 7,028,295 | |
| | |
| | Automotive – 7.1% | |
| Dana Holding Corp. (BB+/B2)(b) | |
| | 2,942,000 | | | | 5.375 | | | | 09/15/21 | | | | 2,912,580 | |
| Fiat Chrysler Automobiles NV (NR/B2) | |
| | 2,125,000 | | | | 4.500 | | | | 04/15/20 | | | | 2,016,094 | |
| | 1,535,000 | | | | 5.250 | | | | 04/15/23 | | | | 1,429,469 | |
| Gates Global LLC (B/Caa2)(b)(c) | |
| | 1,118,000 | | | | 6.000 | | | | 07/15/22 | | | | 905,580 | |
| | |
| | |
| The accompanying notes are an integral part of these financial statements. | | 39 |
GOLDMAN SACHS LONG SHORT CREDIT STRATEGIES FUND
Schedule of Investments (continued)
September 30, 2015 (Unaudited)
| | | | | | | | | | | | | | |
Principal Amount | | | Interest Rate | | | Maturity Date | | | Value | |
| | Unsecured Debt Obligations – (continued) | |
| | Automotive – (continued) | |
| Jaguar Land Rover Automotive PLC (BB/Ba2)(c) | |
| $ | 1,199,000 | | | | 4.250 | % | | | 11/15/19 | | | $ | 1,169,025 | |
| | 1,321,000 | | | | 5.625 | (b) | | | 02/01/23 | | | | 1,296,231 | |
| Lear Corp. (BB/Ba2)(b) | |
| | 505,000 | | | | 4.750 | | | | 01/15/23 | | | | 494,900 | |
| | 2,648,000 | | | | 5.250 | | | | 01/15/25 | | | | 2,588,420 | |
| ZF North America Capital, Inc. (BB/Ba2)(c) | |
| | 1,260,000 | | | | 4.000 | | | | 04/29/20 | | | | 1,203,300 | |
| | | | | | | | | | | | | | |
| | | | | | | | | | | | | 14,015,599 | |
| | |
| | Brokerage(b) – 1.5% | |
| E*Trade Financial Corp. (BBB-/Ba2) | |
| | 1,687,000 | | | | 5.375 | | | | 11/15/22 | | | | 1,788,220 | |
| | 1,091,000 | | | | 4.625 | | | | 09/15/23 | | | | 1,101,910 | |
| | | | | | | | | | | | | | |
| | | | | | | | | | | | | 2,890,130 | |
| | |
| | Building Materials(b)(c) – 0.1% | |
| Masonite International Corp. (NR/NR) | |
| | 258,000 | | | | 5.625 | | | | 03/15/23 | | | | 263,805 | |
| | |
| | Chemicals(b) – 2.6% | |
| Blue Cube Spinco, Inc. (BB+/Ba1)(c) | |
| | 1,241,000 | | | | 9.750 | | | | 10/15/23 | | | | 1,290,640 | |
| | 106,000 | | | | 10.000 | | | | 10/15/25 | | | | 110,107 | |
| Chemtura Corp. (BB-/B1) | |
| | 460,000 | | | | 5.750 | | | | 07/15/21 | | | | 453,100 | |
| INEOS Group Holdings SA (B-/B3)(c) | |
| | 2,833,000 | | | | 6.125 | | | | 08/15/18 | | | | 2,648,855 | |
| Rayonier AM Products, Inc. (BB/Ba3)(c) | |
| | 768,000 | | | | 5.500 | | | | 06/01/24 | | | | 570,240 | |
| | | | | | | | | | | | | | |
| | | | | | | | | | | | | 5,072,942 | |
| | |
| | Consumer Cyclical Services – 0.8% | |
| The ADT Corp. (BB-/Ba2) | |
| | 1,747,000 | | | | 3.500 | | | | 07/15/22 | | | | 1,539,544 | |
| | |
| | Electric(b) – 0.5% | |
| Calpine Corp. (B/B3) | |
| | 1,053,000 | | | | 5.375 | | | | 01/15/23 | | | | 971,393 | |
| | |
| | Energy – Exploration & Production(b) – 5.9% | |
| Bonanza Creek Energy, Inc. (CCC+/B3) | |
| | 2,236,000 | | | | 6.750 | | | | 04/15/21 | | | | 1,565,200 | |
| CrownRock LP/CrownRock Finance, Inc. (B/Caa1)(c) | |
| | 476,000 | | | | 7.125 | | | | 04/15/21 | | | | 456,960 | |
| Endeavor Energy Resources LP/EER Finance, Inc. (B/B3)(c) | |
| | 2,250,000 | | | | 7.000 | | | | 08/15/21 | | | | 2,025,000 | |
| Gulfport Energy Corp. (B+/B2) | |
| | 331,000 | | | | 7.750 | | | | 11/01/20 | | | | 321,070 | |
| | 642,000 | | | | 6.625 | (c) | | | 05/01/23 | | | | 590,640 | |
| Memorial Resource Development Corp. (B-/Caa1) | |
| | 1,904,000 | | | | 5.875 | | | | 07/01/22 | | | | 1,723,120 | |
| Parsley Energy LLC/Parsley Finance Corp. (B-/Caa1)(c) | |
| | 862,000 | | | | 7.500 | | | | 02/15/22 | | | | 836,140 | |
| RSP Permian, Inc. (B/B3) | |
| | 388,000 | | | | 6.625 | | | | 10/01/22 | | | | 372,480 | |
| | |
| | Unsecured Debt Obligations – (continued) | |
| | Energy – Exploration & Production(b) – (continued) | |
| Seven Generations Energy Ltd. (CCC+/B2)(c) | |
| $ | 2,193,000 | | | | 8.250 | % | | | 05/15/20 | | | $ | 2,110,762 | |
| | 1,131,000 | | | | 6.750 | | | | 05/01/23 | | | | 1,000,935 | |
| SM Energy Co. (BB/Ba2) | |
| | 709,000 | | | | 5.000 | | | | 01/15/24 | | | | 597,333 | |
| | | | | | | | | | | | | | |
| | | | | | | | | | | | | 11,599,640 | |
| | |
| | Entertainment(b) – 0.9% | |
| AMC Entertainment, Inc. (B/B2) | |
| | 612,000 | | | | 5.875 | | | | 02/15/22 | | | | 615,060 | |
| Cinemark USA, Inc. (BB/B2) | |
| | 1,158,000 | | | | 5.125 | | | | 12/15/22 | | | | 1,140,630 | |
| | | | | | | | | | | | | | |
| | | | | | | | | | | | | 1,755,690 | |
| | |
| | Finance – 7.5% | |
| Ally Financial, Inc. (BB+/B1) | |
| | 2,717,000 | | | | 4.750 | | | | 09/10/18 | | | | 2,764,548 | |
| | 598,000 | | | | 7.500 | | | | 09/15/20 | | | | 681,720 | |
| Ally Financial, Inc. (BB-/B2) | |
| | 952,000 | | | | 8.000 | | | | 12/31/18 | | | | 1,047,200 | |
| CIT Group, Inc. (BB-/B1) | |
| | 3,316,000 | | | | 5.250 | | | | 03/15/18 | | | | 3,423,770 | |
| Navient Corp. (BB/Ba3) | |
| | 3,269,000 | | | | 8.450 | | | | 06/15/18 | | | | 3,358,897 | |
| | 284,000 | | | | 8.000 | | | | 03/25/20 | | | | 271,930 | |
| Springleaf Finance Corp. (B/B2) | |
| | 3,294,000 | | | | 5.250 | | | | 12/15/19 | | | | 3,228,120 | |
| | | | | | | | | | | | | | |
| | | | | | | | | | | | | 14,776,185 | |
| | |
| | Food & Beverage(b)(c) – 1.0% | |
| Dean Foods Co. (BB-/B2) | |
| | 2,028,000 | | | | 6.500 | | | | 03/15/23 | | | | 2,060,955 | |
| | |
| | Food & Drug Retailers(b) – 2.7% | |
| Rite Aid Corp. (CCC+/B3) | |
| | 4,356,000 | | | | 6.750 | | | | 06/15/21 | | | | 4,497,570 | |
| | 821,000 | | | | 6.125 | (c) | | | 04/01/23 | | | | 812,790 | |
| | | | | | | | | | | | | | |
| | | | | | | | | | | | | 5,310,360 | |
| | |
| | Gaming(b) – 1.5% | |
| GLP Capital LP/GLP Financing II, Inc. (BBB-/Ba1) | |
| | 3,024,000 | | | | 4.875 | | | | 11/01/20 | | | | 3,061,800 | |
| | |
| | Health Care – Medical Products(b) – 0.7% | |
| Alere, Inc. (CCC+/Caa1) | |
| | 1,308,000 | | | | 6.500 | | | | 06/15/20 | | | | 1,330,890 | |
| | |
| | Health Care – Services(b) – 4.0% | |
| DaVita HealthCare Partners, Inc. (B+/B1) | |
| | 1,887,000 | | | | 5.750 | | | | 08/15/22 | | | | 1,962,480 | |
| Fresenius Medical Care US Finance II, Inc. (BB+/Ba2)(c) | |
| | 1,646,000 | | | | 4.125 | | | | 10/15/20 | | | | 1,641,885 | |
| Lifepoint Hospitals, Inc. (BB-/Ba2) | |
| | 4,220,000 | | | | 5.500 | | | | 12/01/21 | | | | 4,262,200 | |
| | | | | | | | | | | | | | |
| | | | | | | | | | | | | 7,866,565 | |
| | |
| | |
| 40 | | The accompanying notes are an integral part of these financial statements. |
GOLDMAN SACHS LONG SHORT CREDIT STRATEGIES FUND
| | | | | | | | | | | | | | |
Principal Amount | | | Interest Rate | | | Maturity Date | | | Value | |
| | Unsecured Debt Obligations – (continued) | |
| | Media – Cable(b)(c) – 2.3% | |
| Altice SA (B/B3) | |
| $ | 1,703,000 | | | | 7.750 | % | | | 05/15/22 | | | $ | 1,553,987 | |
| Cequel Communications Holdings I LLC/Cequel Capital Corp.
(B-/B3) |
|
| | 3,143,000 | | | | 6.375 | | | | 09/15/20 | | | | 2,954,420 | |
| | | | | | | | | | | | | | |
| | | | | | | | | | | | | 4,508,407 | |
| | |
| | Media – Non Cable(b) – 3.9% | |
| Gray Television, Inc. (B/Caa1) | |
| | 472,000 | | | | 7.500 | | | | 10/01/20 | | | | 483,800 | |
| Lamar Media Corp. (BB-/Ba1) | |
| | 3,997,000 | | | | 5.375 | | | | 01/15/24 | | | | 4,026,977 | |
| Nexstar Broadcasting, Inc. (B+/B3) | |
| | 2,076,000 | | | | 6.875 | | | | 11/15/20 | | | | 2,138,280 | |
| Sinclair Television Group, Inc. (B+/B1) | |
| | 993,000 | | | | 5.375 | | | | 04/01/21 | | | | 965,693 | |
| | | | | | | | | | | | | | |
| | | | | | | | | | | | | 7,614,750 | |
| | |
| | Packaging(b) – 3.3% | |
| Beverage Packaging Holdings Luxembourg II SA/Beverage
Packaging Holdings II Is (CCC+/Caa2)(c) |
|
| | 3,678,000 | | | | 5.625 | | | | 12/15/16 | | | | 3,632,025 | |
| | 1,546,000 | | | | 6.000 | | | | 06/15/17 | | | | 1,522,810 | |
| Graphic Packaging International, Inc. (BB+/Ba2) | |
| | 1,428,000 | | | | 4.750 | | | | 04/15/21 | | | | 1,428,000 | |
| | | | | | | | | | | | | | |
| | | | | | | | | | | | | 6,582,835 | |
| | |
| | Pharmaceuticals(b)(c) – 3.5% | |
| Mallinckrodt International Finance SA/Mallinckrodt CB LLC
(BB-/B1) |
|
| | 432,000 | | | | 4.875 | | | | 04/15/20 | | | | 412,560 | |
| | 2,185,000 | | | | 5.750 | | | | 08/01/22 | | | | 2,042,975 | |
| Mallinckrodt International Finance SA/Mallinckrodt CB LLC
(NR/B1) |
|
| | 953,000 | | | | 5.625 | | | | 10/15/23 | | | | 867,230 | |
| Valeant Pharmaceuticals International, Inc. (B/B1) | |
| | 2,577,000 | | | | 5.375 | | | | 03/15/20 | | | | 2,499,690 | |
| | 1,145,000 | | | | 6.375 | | | | 10/15/20 | | | | 1,143,569 | |
| | | | | | | | | | | | | | |
| | | | | | | | | | | | | 6,966,024 | |
| | |
| | Telecommunications – Wireless – 2.9% | |
| Sprint Communications, Inc. (B+/Caa1) | |
| | 476,000 | | | | 9.125 | | | | 03/01/17 | | | | 483,140 | |
| | 1,411,000 | | | | 8.375 | | | | 08/15/17 | | | | 1,400,417 | |
| T-Mobile USA, Inc. (BB/Ba3)(b) | |
| | 2,760,000 | | | | 6.542 | | | | 04/28/20 | | | | 2,801,400 | |
| | 1,028,000 | | | | 6.625 | | | | 11/15/20 | | | | 1,043,420 | |
| | | | | | | | | | | | | | |
| | | | | | | | | | | | | 5,728,377 | |
| | |
| | Telecommunications – Wirelines – 6.2% | |
| CenturyLink, Inc. (BB/Ba2)(b)(c) | |
| | 424,000 | | | | 5.625 | | | | 04/01/25 | | | | 338,126 | |
| Frontier Communications Corp. (BB-/Ba3) | |
| | 473,000 | | | | 8.500 | | | | 04/15/20 | | | | 459,993 | |
| | 3,699,000 | | | | 10.500 | (b)(c) | | | 09/15/22 | | | | 3,597,277 | |
| Neptune Finco Corp. (NR/B2)(b)(c) | |
| | 2,127,000 | | | | 10.125 | | | | 01/15/23 | | | | 2,148,270 | |
| | |
| | Unsecured Debt Obligations – (continued) | |
| | Telecommunications – Wirelines – (continued) | |
| Neptune Finco Corp. (B-/B2)(b)(c) | |
| $ | 309,000 | | | | 10.875 | % | | | 10/15/25 | | | $ | 312,090 | |
| Windstream Corp. (BB-/B2) | |
| | 465,000 | | | | 7.875 | | | | 11/01/17 | | | | 481,275 | |
| | 5,679,000 | | | | 7.750 | (b) | | | 10/15/20 | | | | 4,827,150 | |
| | | | | | | | | | | | | | |
| | | | | | | | | | | | | 12,164,181 | |
| | |
| | Transportation(b)(c) – 0.3% | |
| XPO Logistics, Inc. (B/B1) | |
| | 534,000 | | | | 7.875 | | | | 09/01/19 | | | | 520,650 | |
| | |
| | TOTAL UNSECURED DEBT OBLIGATIONS | |
| | (Cost $130,054,150) | | | $ | 123,629,017 | |
| | |
| | | | | | | | |
| Shares | | | Description | | Value | |
| | | | | | | | |
| | Common Stocks(f)(g)(h)(i) – 0.0% | |
| | Oil, Gas & Consumable Fuels – 0.0% | |
| | 1,815,521 | | | Lone Pine Resources CDA Ltd. (Cost $1,418,162) | | $ | 2 | |
| | |
| | | | | | |
| Shares | | Rate | | Value | |
| Preferred Stock(g)(h)(i) – 0.7% | |
| Oil, Gas & Consumable Fuels – 0.7% | |
Lone Pine Resources CDA Ltd. | |
| 1,194,849 | | 10.375% | | $ | 1,330,345 | |
| (Cost $1,528,269) | |
| |
| | | | | | |
| Investment Company(g) – 13.5% | |
Goldman Sachs Financial Square Government Fund – FST Shares | |
| 26,569,589 | | 0.006 | | | 26,569,589 | |
| (Cost $26,569,589) | |
| |
| TOTAL INVESTMENTS – 98.1% | |
| (Cost $202,217,751) | | $ | 193,186,214 | |
| |
OTHER ASSETS IN EXCESS OF LIABILITIES – 1.9% | | | 3,643,669 | |
| |
| NET ASSETS – 100.0% | | $ | 196,829,883 | |
| |
| | |
| The percentage shown for each investment category reflects the value of investments in that category as a percentage of net assets. |
(a) | | Senior Term Loans often require prepayments from excess cash flows or permit the borrower to repay at its election. The degree to which borrowers repay, whether as a contractual requirement or at their election, cannot be predicted with accuracy. As a result, the actual remaining maturity may be substantially less than the stated maturities shown. The stated interest rate represents the weighted average interest rate of all contracts within the senior loan facility on September 30, 2015. Senior Term Loans typically have rates of interest which are predetermined either daily, monthly, quarterly or semi-annually by reference to a base lending rate, plus a premium. These base lending |
| | |
| The accompanying notes are an integral part of these financial statements. | | 41 |
GOLDMAN SACHS LONG SHORT CREDIT STRATEGIES FUND
Schedule of Investments (continued)
September 30, 2015 (Unaudited)
| | |
| | rates are primarily the London-Interbank Offered Rate (“LIBOR”), and secondarily the prime rate offered by one or more major United States banks (the “Prime Rate”) and the certificate of deposit (“CD”) rate or other base lending rates used by commercial lenders. |
(b) | | Security with “Call” features with resetting interest rates. Maturity dates disclosed are the final maturity dates. |
(c) | | Exempt from registration under Rule 144A of the Securities Act of 1933. Under procedures approved by the Board of Trustees, such securities have been determined to be liquid by the investment adviser and may be resold, normally to qualified institutional buyers in transactions exempt from registration. Total market value of Rule 144A securities amounts to $72,589,151, which represents approximately 36.9% of net assets as of September 30, 2015. |
(d) | | Pay-in-kind securities. |
(e) | | Variable rate security. Interest rate or distribution rate disclosed is that which is in effect on September 30, 2015. |
(f) | | Restricted securities are not registered under the Securities Act of 1933 and are subject to legal restrictions on resale. These securities generally may be resold in transactions exempt from registration or to the public if the securities are subsequently registered and the registration statement is effective. Disposal of these securities may involve time consuming negotiations and prompt sale at an acceptable price may be difficult. Total market value of restricted securities amounts to $1,330,347, which represents approximately 0.7% of net assets as of September 30, 2015. |
| | | | | | | | | | |
| | | Restricted Security | | Acquisition
Date | | | Cost | |
| | Lone Pine Resources CDA Ltd. | | | 1/31/2014 | | | $ | 1,418,162 | |
| | (Common Stock) | | | | | | | | |
| | Lone Pine Resources CDA Ltd. | | | 1/31/2014 | | | | 1,528,269 | |
| | (Preferred Stock) | | | | | | | | |
| | |
(g) | | Represents an Affiliated Issuer/Fund. |
(h) | | In addition the Fund holds 1,505,185 shares of voting securities in an affiliated entity with zero cost and zero value. |
(i) | | Security is currently in default and/or non-income producing. |
Security ratings disclosed, if any, are issued by either Standard & Poor’s, Moody’s Investor Service or Fitch and are unaudited. A brief description of the ratings is available in the Fund’s Statement of Additional Information.
| | |
|
Currency Abbreviations: |
EUR | | —Euro |
USD | | —U.S. Dollar |
| | |
Investment Abbreviations: |
LIBOR | | —London Interbank Offered Rate |
LLC | | —Limited Liability Company |
LP | | —Limited Partnership |
|
|
| ADDITIONAL INVESTMENT INFORMATION |
FORWARD FOREIGN CURRENCY EXCHANGE CONTRACTS — At September 30, 2015, the Fund had the following forward foreign currency exchange contracts:
FORWARD FOREIGN CURRENCY EXCHANGE CONTRACTS WITH UNREALIZED GAIN
| | | | | | | | | | | | | | | | | | | | | | | | |
| Counterparty | | Currency Purchased | | | Currency Sold | | | Current Value | | | Settlement Date | | | Unrealized Gain | |
Citibank NA | | USD | | | 392,630 | | | EUR | | | 350,000 | | | $ | 391,304 | | | | 11/05/15 | | | $ | 1,326 | |
SWAP CONTRACTS — At September 30, 2015, the Fund had the following swap contracts:
CENTRALLY CLEARED INTEREST RATE SWAP CONTRACTS
| | | | | | | | | | | | | | | | |
| | | | | | Rates Exchanged | | Market Value | |
Notional
Amount
(000s)(a) | | | Termination Date | | Payments Received | | Payments Made | | Upfront Payments Made (Received) | | | Unrealized Gain (Loss) | |
| $ | 12,258 | | | 09/16/18 | | 3 month LIBOR | | 1.750% | | $ | (98,493 | ) | | $ | (174,383 | ) |
| | 12,634 | | | 09/16/20 | | 3 month LIBOR | | 2.250 | | | (185,924 | ) | | | (337,123 | ) |
| | 130 | | | 12/16/20 | | 2.000% | | 3 month LIBOR | | | 2,968 | | | | 278 | |
| | 54 | | | 09/16/22 | | 2.500 | | 3 month LIBOR | | | 2,027 | | | | 883 | |
| | 70 | | | 09/16/22 | | 3 month LIBOR | | 2.500 | | | (2,164 | ) | | | (1,609 | ) |
| | TOTAL | | | | | | | | | $ | (281,586 | ) | | $ | (511,954 | ) |
| | | | | | | | | | | | | | | | |
| | (a) | | Represents forward starting interest rate swaps whose effective dates of commencement of accruals and cash flows occur subsequent to September 30, 2015. |
| | |
| 42 | | The accompanying notes are an integral part of these financial statements. |
GOLDMAN SACHS LONG SHORT CREDIT STRATEGIES FUND
|
| ADDITIONAL INVESTMENT INFORMATION (continued) |
CENTRALLY CLEARED CREDIT DEFAULT SWAP CONTRACT
| | | | | | | | | | | | | | | | | | | | | | | | |
| | | | Market Value | |
| Referenced Obligation | | Notional Amount (000s) | | | Rates Received (Paid) | | | Termination Date | | | Credit Spread at September 30,
2015(b) | | | Upfront
Payments Made (Received) | | | Unrealized Gain (Loss) | |
Protection Purchased: | | | | | | | | | | | | | | | | | | | | | | | | |
CDX North America High Yield Index 25 | | $ | 50,500 | | | | (5.000 | )% | | | 12/20/20 | | | | 4.995 | % | | $ | 76,340 | | | $ | (155,808 | ) |
| | (b) | | Credit spread on the Referenced Obligation, together with the term of the swap contract, are indicators of payment/performance risk. The likelihood of a credit event occurring which would require a fund to make a payment or otherwise be required to perform under the swap contract is generally greater as the credit spread and the term of the swap contract increase. |
| | |
| The accompanying notes are an integral part of these financial statements. | | 43 |
GOLDMAN SACHS FIXED INCOME ALTERNATIVES FUNDS
Consolidated Schedule of Investments
September 30, 2015 (Unaudited)
|
| ADDITIONAL INVESTMENT INFORMATION |
JOINT REPURCHASE AGREEMENT ACCOUNT II — At September 30, 2015, the Fixed Income Macro Strategies Fund had undivided interests in the Joint Repurchase Agreement Account II, with a maturity date of October 1, 2015, as follows:
| | | | |
| Principal Amount | | Maturity Value | | Collateral Allocation Value |
| $ 6,600,000 | | $6,600,022 | | $6,735,056 |
REPURCHASE AGREEMENTS — At September 30, 2015, the Principal Amount of the Fund’s interest in the Joint Repurchase Agreement Account II was as follows:
| | | | | | | | |
| Counterparty | | Interest
Rate | | | Principal
Amount | |
BNP Paribas Securities Co. | | | 0.110 | % | | $ | 2,617,038 | |
Citigroup Global Markets, Inc. | | | 0.120 | | | | 2,149,348 | |
Merrill Lynch & Co., Inc. | | | 0.140 | | | | 1,833,614 | |
| TOTAL | | | | | | $ | 6,600,000 | |
| | |
| 44 | | The accompanying notes are an integral part of these financial statements. |
GOLDMAN SACHS FIXED INCOME ALTERNATIVES FUNDS
|
| ADDITIONAL INVESTMENT INFORMATION (continued) |
At September 30, 2015, the Joint Repurchase Agreement Account II was fully collateralized by:
| | | | | | | | |
| Issuer | | Interest Rates | | | Maturity Dates | |
Federal Farm Credit Banks | | | 0.270 | % | | | 05/14/18 | |
Federal Home Loan Banks | | | 1.625 to 5.625 | | | | 06/13/16 to 09/07/32 | |
Federal Home Loan Mortgage Corp. | | | 2.500 to 8.000 | | | | 10/01/16 to 07/01/45 | |
Federal National Mortgage Association | | | 1.250 to 6.500 | | | | 04/01/16 to 10/01/45 | |
Government National Mortgage Association | | | 3.000 to 7.000 | | | | 05/15/18 to 09/20/45 | |
United States Inflation Indexed Bonds | | | 0.125 | | | | 07/15/22 | |
United States Treasury Note | | | 0.500 to 2.375 | | | | 09/30/16 to 12/31/20 | |
United States Treasury Stripped Securities | | | 0.000 | | | | 02/15/27 to 05/15/44 | |
| | |
| The accompanying notes are an integral part of these financial statements. | | 45 |
GOLDMAN SACHS FIXED INCOME ALTERNATIVES FUNDS
Statements of Assets and Liabilities
September 30, 2015 (Unaudited)
| | | | | | | | | | |
| | | | | Fixed Income
Macro Strategies
Fund(a) | | | Long Short Credit
Strategies Fund | |
| | Assets: | | | | | | | | |
| | Investments of unaffiliated issuers, at value (cost $57,781,518 and $172,701,731) | | $ | 56,836,844 | | | $ | 165,286,278 | |
| | Investments of affiliated issuers, at value (cost $11,996,350 and $29,516,020) | | | 11,996,350 | | | | 27,899,936 | |
| | Cash | | | — | | | | 1,574,490 | |
| | Foreign currencies, at value (cost $525,465 and $579,794, respectively) | | | 525,129 | | | | 585,721 | |
| | Unrealized gain on swap contracts | | | 1,225,189 | | | | — | |
| | Unrealized gain on non-deliverable bond forwards contracts | | | 15,829 | | | | — | |
| | Unrealized gain on forward foreign currency exchange contracts | | | 1,501,117 | | | | 1,326 | |
| | Variation margin on certain derivative contracts | | | — | | | | 1,441,630 | |
| | Receivables: | | | | | | | | |
| | Collateral on certain derivative contracts(b) | | | 3,895,265 | | | | 2,733,935 | |
| | Dividends and interest | | | 277,119 | | | | 2,367,424 | |
| | Reimbursement from investment adviser | | | 60,913 | | | | — | |
| | Due from broker — upfront payment | | | 36,156 | | | | — | |
| | Fund shares sold | | | 21,356 | | | | 45,195 | |
| | Upfront payments made on swap contracts | | | 3,666 | | | | — | |
| | Investments sold | | | 83 | | | | 1,941,663 | |
| | Investments sold on an extended-settlement basis | | | — | | | | 5,042,466 | |
| | Other assets | | | 720 | | | | 155,971 | |
| | Total assets | | | 76,395,736 | | | | 209,076,035 | |
| | | | | | | | | | |
| | Liabilities: | | | | | | | | |
| | Due to custodian | | | 119,537 | | | | — | |
| | Unrealized loss on swap contracts | | | 1,465,398 | | | | — | |
| | Unrealized loss on forward foreign currency exchange contracts | | | 868,207 | | | | — | |
| | Variation margin on certain derivative contracts | | | 163,113 | | | | — | |
| | Written option contracts, at value (premium received $499,855 and $0, respectively | | | 805,276 | | | | — | |
| | Payables: | | | | | | | | |
| | Investments purchased on an extended — settlement basis | | | 1,190,937 | | | | 9,134,492 | |
| | Collateral on certain derivative contracts | | | 260,000 | | | | — | |
| | Investments purchased | | | 145,057 | | | | 716,579 | |
| | Upfront payments received on swap contracts | | | 100,611 | | | | — | |
| | Management fees | | | 67,984 | | | | 160,876 | |
| | Fund shares redeemed | | | 21,268 | | | | 487,706 | |
| | Distribution and Service fees and Transfer Agency fees | | | 2,825 | | | | 10,595 | |
| | Distributions payable | | | — | | | | 70,585 | |
| | Due to broker — upfront payment | | | — | | | | 1,347,704 | |
| | Accrued expenses | | | 297,010 | | | | 317,615 | |
| | Total liabilities | | | 5,507,223 | | | | 12,246,152 | |
| | | | | | | | | | |
| | Net Assets: | | | | | | | | |
| | Paid-in capital | | | 77,586,288 | | | | 215,430,029 | |
| | Undistributed (distributions in excess of) net investment income | | | (920,574 | ) | | | 2,232,618 | |
| | Accumulated net realized loss | | | (6,149,975 | ) | | | (11,140,719 | ) |
| | Net unrealized gain (loss) | | | 372,774 | | | | (9,692,045 | ) |
| | | NET ASSETS | | $ | 70,888,513 | | | $ | 196,829,883 | |
| | | Net Assets: | | | | | | | | |
| | | Class A | | $ | 208,253 | | | $ | 9,063,202 | |
| | | Class C | | | 174,923 | | | | 1,334,231 | |
| | | Institutional | | | 66,530,438 | | | | 182,566,390 | |
| | | Class IR | | | 3,951,545 | | | | 3,833,415 | |
| | | Class R | | | 23,354 | | | | 32,645 | |
| | | Total Net Assets | | $ | 70,888,513 | | | $ | 196,829,883 | |
| | | Shares Outstanding $0.001 par value (unlimited shares authorized): | | | | | | | | |
| | | Class A | | | 22,341 | | | | 949,656 | |
| | | Class C | | | 18,785 | | | | 139,835 | |
| | | Institutional | | | 7,122,708 | | | | 19,143,096 | |
| | | Class IR | | | 424,148 | | | | 401,731 | |
| | | Class R | | | 2,506 | | | | 3,422 | |
| | | Net asset value, offering and redemption price per share:(c) | | | | | | | | |
| | | Class A | | | $9.32 | | | | $9.54 | |
| | | Class C | | | 9.31 | | | | 9.54 | |
| | | Institutional | | | 9.34 | | | | 9.54 | |
| | | Class IR | | | 9.32 | | | | 9.54 | |
| | | Class R | | | 9.32 | | | | 9.54 | |
| | (a) | | Statement of Assets and Liabilities for the Fund is consolidated and includes the balances of a wholly-owned subsidiary, Cayman Commodity — FIMS Ltd. Accordingly, all interfund balances and transactions have been eliminated. |
| | (b) | | Includes amounts segregated for initial margin and/or collateral on futures transactions and swaps transactions of $340,728 and $3,554,537, respectively for Fixed Income Macro Strategies Fund and $— and $2,733,935, respectively for Long Short Credit Strategies Fund. |
| | (c) | | Maximum public offering price for Class A Shares of the Fixed Income Macro Strategies and the Long Short Credit Strategies Funds is $9.68 and $9.91, respectively. At redemption, Class C Shares may be subject to a contingent deferred sales charge, assessed on the amount equal to the lesser of the current net asset value or the original purchase price of the shares. |
| | |
| 46 | | The accompanying notes are an integral part of these financial statements. |
GOLDMAN SACHS FIXED INCOME ALTERNATIVES FUNDS
Statements of Operations
For the Six Months Ended September 30, 2015 (Unaudited)
| | | | | | | | | | |
| | | | | Fixed Income
Macro Strategies
Fund(a) | | | Long Short Credit
Strategies Fund | |
| | Investment income: | | | | | | | | |
| | Interest (net of foreign withholding taxes of $3,171 and $0, respectively) | | $ | 651,617 | | | $ | 4,464,294 | |
| | Dividends — affiliated issuers | | | 299 | | | | 1,417 | |
| | Total investment income | | | 651,916 | | | | 4,465,711 | |
| | | | | | | | | | |
| | Expenses: | | | | | | | | |
| | Management fees | | | 524,732 | | | | 967,199 | |
| | Custody, accounting and administrative services | | | 232,463 | | | | 25,863 | |
| | Professional fees | | | 124,947 | | | | 37,901 | |
| | Registration fees | | | 35,446 | | | | 14,799 | |
| | Transfer Agency fees(b) | | | 16,052 | | | | 44,396 | |
| | Trustee fees | | | 14,926 | | | | 14,253 | |
| | Printing and mailing costs | | | 13,023 | | | | 27,748 | |
| | Distribution and Service fees(b) | | | 1,747 | | | | 16,507 | |
| | Prime Broker Fees | | | 5,567 | | | | — | |
| | Other | | | 8,489 | | | | 3,454 | |
| | Total expenses | | | 977,392 | | | | 1,152,120 | |
| | Less — expense reductions | | | (468,091 | ) | | | (18,135 | ) |
| | Net expenses | | | 509,301 | | | | 1,133,985 | |
| | NET INVESTMENT INCOME | | | 142,615 | | | | 3,331,726 | |
| | | | | | | | | | |
| | Realized and unrealized gain (loss): | | | | | | | | |
| | Net realized gain (loss) from: | | | | | | | | |
| | Investments — unaffiliated issuers | | | (1,902,629 | ) | | | (895,111 | ) |
| | Futures contracts | | | 799,603 | | | | — | |
| | Written options | | | 544,432 | | | | — | |
| | Swap contracts | | | 881,569 | | | | 721,099 | |
| | Non-deliverable bond forward contracts | | | (132,368 | ) | | | — | |
| | Forward foreign currency exchange contracts | | | 383,484 | | | | 1,565,814 | |
| | Foreign currency transactions | | | 260,902 | | | | (1,060,545 | ) |
| | Net change in unrealized gain (loss) on: | | | | | | | | |
| | Investments — unaffiliated issuers | | | 433,667 | | | | (5,828,226 | ) |
| | Investments — affiliated issuers | | | — | | | | (316,639 | ) |
| | Futures contracts | | | 187,621 | | | | — | |
| | Non-deliverable bond forward contracts | | | (10,858 | ) | | | — | |
| | Written options | | | (514,721 | ) | | | — | |
| | Swap contracts | | | 1,167,010 | | | | 312,201 | |
| | Forward foreign currency exchange contracts | | | 37,690 | | | | (1,574,767 | ) |
| | Foreign currency translation | | | (4,797 | ) | | | 1,062,418 | |
| | Net realized and unrealized gain (loss) | | | 2,130,605 | | | | (6,013,756 | ) |
| | NET INCREASE (DECREASE) IN NET ASSETS RESULTING FROM OPERATIONS | | $ | 2,273,220 | | | $ | (2,682,030 | ) |
| | (a) | | Statement of Operations for the Fund is consolidated and includes the balances of a wholly-owned subsidiary, Cayman Commodity — FIMS Ltd. Accordingly, all interfund balances and transactions have been eliminated. |
| | (b) | | Class specific Distribution and Service and Transfer Agency fees were as follows: |
| | | | | | | | | | | | | | | | | | | | | | | | | | | | | | | | |
| | | Distribution and Service Fees | | | Transfer Agency Fees | |
Fund | | Class A | | | Class C | | | Class R | | | Class A | | | Class C | | | Institutional | | | Class IR | | | Class R | |
Fixed Income Macro Strategies | | $ | 285 | | | $ | 1,404 | | | $ | 58 | | | $ | 149 | | | $ | 182 | | | $ | 13,077 | | | $ | 2,629 | | | $ | 15 | |
Long Short Credit Strategies | | | 10,589 | | | | 5,836 | | | | 82 | | | | 5,506 | | | | 759 | | | | 36,151 | | | | 1,958 | | | | 22 | |
| | |
| The accompanying notes are an integral part of these financial statements. | | 47 |
GOLDMAN SACHS FIXED INCOME ALTERNATIVES FUNDS
Statements of Changes in Net Assets(a)
| | | | | | | | | | |
| | | | | Fixed Income Macro Strategies Fund | |
| | | | | For the Six Months Ended
September 30, 2015 (Unaudited) | | | For the Fiscal Year Ended
March 31, 2015 | |
| | From operations: | | | | | | | | |
| | Net investment income | | $ | 142,615 | | | $ | 264,189 | |
| | Net realized gain (loss) | | | 834,993 | | | | (6,959,676 | ) |
| | Net change in unrealized gain (loss) | | | 1,295,612 | | | | (1,748,756 | ) |
| | Net increase (decrease) in net assets resulting from operations | | | 2,273,220 | | | | (8,444,243 | ) |
| | | | | | | | | | |
| | Distributions to shareholders: | | | | | | | | |
| | From net investment income | | | | | | | | |
| | Class A Shares | | | (230 | ) | | | — | |
| | Class C Shares | | | (104 | ) | | | — | |
| | Institutional Shares | | | (140,963 | ) | | | — | |
| | Class IR Shares | | | (8,056 | ) | | | — | |
| | Class R Shares | | | (20 | ) | | | — | |
| | Return of capital | | | | | | | | |
| | Class A Shares | | | — | | | | (1,883 | ) |
| | Class C Shares | | | — | | | | (129 | ) |
| | Institutional Shares | | | — | | | | (235,132 | ) |
| | Class IR Shares | | | — | | | | (7,529 | ) |
| | Class R Shares | | | — | | | | (27 | ) |
| | Total distributions to shareholders | | | (149,373 | ) | | | (244,700 | ) |
| | | | | | | | | | |
| | From share transactions: | | | | | | | | |
| | Proceeds from sales of shares | | | 7,240,978 | | | | 46,038,444 | |
| | Reinvestment of distributions | | | 149,373 | | | | 244,700 | |
| | Cost of shares redeemed | | | (17,732,091 | ) | | | (58,333,014 | ) |
| | Net decrease in net assets resulting from share transactions | | | (10,341,740 | ) | | | (12,049,870 | ) |
| | TOTAL DECREASE | | | (8,217,893 | ) | | | (20,738,813 | ) |
| | | | | | | | | | |
| | Net assets: | | | | | | | | |
| | Beginning of period | | | 79,106,406 | | | | 99,845,219 | |
| | End of period | | $ | 70,888,513 | | | $ | 79,106,406 | |
| | Undistributed net investment loss | | $ | (920,574 | ) | | $ | (913,816 | ) |
| | (a) | | Statement of Changes in Net Assets for the Fixed Income Macro Strategies Fund is consolidated and includes the balances of wholly-owned subsidiary, Cayman Commodity — FIMS Ltd. Accordingly, all interfund balances and transactions have been eliminated. |
| | |
| 48 | | The accompanying notes are an integral part of these financial statements. |
GOLDMAN SACHS FIXED INCOME ALTERNATIVES FUNDS
Statements of Changes in Net Assets
| | | | | | | | | | |
| | | | | Long Short Credit Strategies Fund | |
| | | | | For the Six Months Ended
September 30, 2015
(Unaudited) | | | For the Fiscal
Year Ended
March 31, 2015 | |
| | From operations: | | | | | | | | |
| | Net investment income | | $ | 3,331,726 | | | $ | 9,404,739 | |
| | Net realized gain (loss) | | | 331,257 | | | | (11,718,821 | ) |
| | Net change in unrealized loss | | | (6,345,013 | ) | | | (7,031,042 | ) |
| | Net decrease in net assets resulting from operations | | | (2,682,030 | ) | | | (9,345,124 | ) |
| | | | | | | | | | |
| | Distributions to shareholders: | | | | | | | | |
| | From net investment income | | | | | | | | |
| | Class A Shares(a) | | | (88,112 | ) | | | (163,398 | ) |
| | Class C Shares(a) | | | (7,795 | ) | | | (17,863 | ) |
| | Institutional Shares | | | (2,192,354 | ) | | | (8,388,981 | ) |
| | Class IR Shares(a) | | | (35,355 | ) | | | (51,240 | ) |
| | Class R Shares(a) | | | (299 | ) | | | (793 | ) |
| | From net realized gains | | | | | | | | |
| | Class A Shares(a) | | | — | | | | (68,289 | ) |
| | Class C Shares(a) | | | — | | | | (9,420 | ) |
| | Institutional Shares | | | — | | | | (2,124,980 | ) |
| | Class IR Shares(a) | | | — | | | | (20,691 | ) |
| | Class R Shares(a) | | | — | | | | (218 | ) |
| | Total distributions to shareholders | | | (2,323,915 | ) | | | (10,845,873 | ) |
| | | | | | | | | | |
| | From share transactions: | | | | | | | | |
| | Proceeds from sales of shares | | | 42,341,776 | | | | 127,337,683 | |
| | Reinvestment of distributions | | | 2,075,069 | | | | 10,197,816 | |
| | Cost of shares redeemed | | | (43,195,190 | ) | | | (252,151,116 | ) |
| | Net increase (decrease) in net assets resulting from share transactions | | | 1,221,655 | | | | (114,615,617 | ) |
| | TOTAL DECREASE | | | (3,784,290 | ) | | | (134,806,614 | ) |
| | | | | | | | | | |
| | Net assets: | | | | | | | | |
| | Beginning of period | | | 200,614,173 | | | | 335,420,787 | |
| | End of period | | $ | 196,829,883 | | | $ | 200,614,173 | |
| | Undistributed net investment income | | $ | 2,232,618 | | | $ | 1,224,807 | |
| | (a) | | Commenced operations on April 30, 2014. |
| | |
| The accompanying notes are an integral part of these financial statements. | | 49 |
GOLDMAN SACHS FIXED INCOME MACRO STRATEGIES FUND
Financial Highlights
Selected Data for a Share Outstanding Throughout Each Period
| | | | | | | | | | | | | | | | | | | | | | | | | | | | | | |
| | | | | | | | From
investment operations | | | Distributions
to shareholders | |
| | | Year - Share Class | |
Net asset
value,
beginning
of period | | | Net
investment
income (loss)(a) | | | Net realized
and unrealized
gain (loss) | | | Total from
investment
operations | | | From net
investment
income | | | From
capital | | | Total
distributions | |
| | FOR THE SIX MONTHS ENDED SEPTEMBER 30, (UNAUDITED) | |
| | 2015 - A | | $ | 9.03 | | | $ | 0.02 | | | $ | 0.28 | | | $ | 0.30 | | | $ | (0.01 | ) | | $ | — | | | $ | (0.01 | ) |
| | 2015 - C | | | 9.04 | | | | (0.01 | ) | | | 0.28 | | | | 0.27 | | | | — | (e) | | | — | | | | — | (e) |
| | 2015 - Institutional | | | 9.05 | | | | 0.02 | | | | 0.29 | | | | 0.31 | | | | (0.02 | ) | | | — | | | | (0.02 | ) |
| | 2015 - IR | | | 9.03 | | | | 0.02 | | | | 0.29 | | | | 0.31 | | | | (0.02 | ) | | | — | | | | (0.02 | ) |
| | 2015 - R | | | 9.04 | | | | — | (e) | | | 0.29 | | | | 0.29 | | | | (0.01 | ) | | | — | | | | (0.01 | ) |
| | | | | | | | | | | | | | | | | | | | | | | | | | | | | | |
| | FOR THE FISCAL YEAR ENDED MARCH 31, | |
| | 2015 - A | | | 9.82 | | | | 0.03 | | | | (0.81 | ) | | | (0.78 | ) | | | — | | | | (0.01 | ) | | | (0.01 | ) |
| | 2015 - C | | | 9.82 | | | | 0.05 | | | | (0.82 | ) | | | (0.77 | ) | | | — | | | | (0.01 | ) | | | (0.01 | ) |
| | 2015 - Institutional | | | 9.84 | | | | 0.02 | | | | (0.79 | ) | | | (0.77 | ) | | | — | | | | (0.02 | ) | | | (0.02 | ) |
| | 2015 - IR | | | 9.81 | | | | 0.02 | | | | (0.78 | ) | | | (0.76 | ) | | | — | | | | (0.02 | ) | | | (0.02 | ) |
| | 2015 - R | | | 9.82 | | | | 0.01 | | | | (0.78 | ) | | | (0.77 | ) | | | — | | | | (0.01 | ) | | | (0.01 | ) |
| | | | | | | | | | | | | | | | | | | | | | | | | | | | | | |
| | FOR THE PERIOD ENDED MARCH 31, | |
| | 2014 - A (Commenced December 16, 2013) | | | 10.00 | | | | (0.01 | ) | | | (0.16 | ) | | | (0.17 | ) | | | — | | | | (0.01 | ) | | | (0.01 | ) |
| | 2014 - C (Commenced December 16, 2013) | | | 10.00 | | | | (0.02 | ) | | | (0.16 | ) | | | (0.18 | ) | | | — | | | | — | (e) | | | — | (e) |
| | 2014 - Institutional (Commenced December 16, 2013) | | | 10.00 | | | | — | (e) | | | (0.14 | ) | | | (0.14 | ) | | | — | | | | (0.02 | ) | | | (0.02 | ) |
| | 2014 - IR (Commenced December 16, 2013) | | | 10.00 | | | | — | (e) | | | (0.17 | ) | | | (0.17 | ) | | | — | | | | (0.02 | ) | | | (0.02 | ) |
| | 2014 - R (Commenced December 16, 2013) | | | 10.00 | | | | (0.01 | ) | | | (0.16 | ) | | | (0.17 | ) | | | — | | | | (0.01 | ) | | | (0.01 | ) |
| | (a) | | Calculated based on the average shares outstanding methodology. |
| | (b) | | Assumes investment at the net asset value at the beginning of the period, reinvestment of all dividends and distributions, a complete redemption of the investment at the net asset value at the end of the period and no sales or redemption charges. Total returns would be reduced if a sales or redemption charge was taken into account. Returns do not reflect the deduction of taxes that a shareholder would pay on Fund distributions or the redemption of Fund shares. Total returns for periods less than one full year are not annualized. |
| | (c) | | The Fund’s portfolio turnover rate is calculated in accordance with regulatory requirements, without regard to transactions involving short term investments and certain derivatives. If such transactions were included, the Fund’s portfolio turnover rate may be higher. |
| | (e) | | Amount is less than $0.005 per share. |
| | |
| 50 | | The accompanying notes are an integral part of these financial statements. |
GOLDMAN SACHS FIXED INCOME MACRO STRATEGIES FUND
| | | | | | | | | | | | | | | | | | | | | | | | | | | | | | | | | | | | | | | | |
| | | | | | | | | | | | | | | | | | | | | | | | | | | | | | | | | | |
| | | Net asset
value, end
of period | | | | | Total
return(b) | | | | | Net assets,
end of
period
(in 000s) | | | | | Ratio of
net expenses
to average
net assets | | | | | Ratio of
total expenses
to average
net assets | | | | | Ratio of
net investment
income (loss)
to average net assets | | | | | Portfolio
turnover
rate(c) | |
| | | | |
| | $ | 9.32 | | | | | | 3.36 | % | | | | $ | 208 | | | | | | 1.93 | %(d) | | | | | 3.70 | %(d) | | | | | 0.34 | %(d) | | | | | 277 | % |
| | | 9.31 | | | | | | 3.03 | | | | | | 175 | | | | | | 2.04 | (d) | | | | | 3.85 | (d) | | | | | (0.26 | )(d) | | | | | 277 | |
| | | 9.34 | | | | | | 3.43 | | | | | | 66,530 | | | | | | 1.45 | (d) | | | | | 2.78 | (d) | | | | | 0.41 | (d) | | | | | 277 | |
| | | 9.32 | | | | | | 3.30 | | | | | | 3,952 | | | | | | 1.52 | (d) | | | | | 2.87 | (d) | | | | | 0.35 | (d) | | | | | 277 | |
| | | 9.32 | | | | | | 3.08 | | | | | | 23 | | | | | | 1.89 | (d) | | | | | 3.37 | (d) | | | | | (0.02 | )(d) | | | | | 277 | |
| | | | | | | | | | | | | | | | | | | | | | | | | | | | | | | | | | | | | | | | |
| | | | |
| | | 9.03 | | | | | | (8.00 | ) | | | | | 2,562 | | | | | | 0.19 | | | | | | 3.06 | | | | | | 0.36 | | | | | | 487 | |
| | | 9.04 | | | | | | (7.97 | ) | | | | | 347 | | | | | | 0.88 | | | | | | 4.10 | | | | | | 0.60 | | | | | | 487 | |
| | | 9.05 | | | | | | (7.89 | ) | | | | | 72,251 | | | | | | 0.97 | | | | | | 2.65 | | | | | | 0.25 | | | | | | 487 | |
| | | 9.03 | | | | | | (7.85 | ) | | | | | 3,923 | | | | | | 0.72 | | | | | | 2.80 | | | | | | 0.20 | | | | | | 487 | |
| | | 9.04 | | | | | | (7.93 | ) | | | | | 23 | | | | | | 1.01 | | | | | | 3.25 | | | | | | 0.11 | | | | | | 487 | |
| | | | | | | | | | | | | | | | | | | | | | | | | | | | | | | | | | | | | | | | |
| | | | |
| | | 9.82 | | | | | | (1.60 | ) | | | | | 19 | | | | | | 1.79 | (d) | | | | | 3.34 | (d) | | | | | (0.29 | )(d) | | | | | 90 | |
| | | 9.82 | | | | | | (1.69 | ) | | | | | 10 | | | | | | 2.19 | (d) | | | | | 4.16 | (d) | | | | | (0.67 | )(d) | | | | | 90 | |
| | | 9.84 | | | | | | (1.32 | ) | | | | | 99,736 | | | | | | 1.45 | (d) | | | | | 2.72 | (d) | | | | | 0.11 | (d) | | | | | 90 | |
| | | 9.81 | | | | | | (1.64 | ) | | | | | 56 | | | | | | 1.55 | (d) | | | | | 2.90 | (d) | | | | | (0.01 | )(d) | | | | | 90 | |
| | | 9.82 | | | | | | (1.65 | ) | | | | | 25 | | | | | | 2.01 | (d) | | | | | 3.66 | (d) | | | | | (0.47 | )(d) | | | | | 90 | |
| | |
| The accompanying notes are an integral part of these financial statements. | | 51 |
GOLDMAN SACHS LONG SHORT CREDIT STRATEGIES FUND
Financial Highlights
Selected Data for a Share Outstanding Throughout Each Period
| | | | | | | | | | | | | | | | | | | | | | | | | | | | | | |
| | | | | | | | From
investment operations | | | Distributions
to shareholders | |
| | | Year - Share Class | |
Net asset
value,
beginning
of period | | | Net
investment
income(a) | | | Net realized
and unrealized
gain (loss) | | | Total from
investment
operations | | | From net
investment
income | | | From net
realized
gains | | | Total
distributions | |
| | FOR THE SIX MONTHS ENDED SEPTEMBER 30, (UNAUDITED) | |
| | 2015 - A | | $ | 9.79 | | | $ | 0.15 | | | $ | (0.30 | ) | | $ | (0.15 | ) | | $ | (0.10 | ) | | $ | — | | | $ | (0.10 | ) |
| | 2015 - C | | | 9.79 | | | | 0.12 | | | | (0.30 | ) | | | (0.18 | ) | | | (0.07 | ) | | | — | | | | (0.07 | ) |
| | 2015 - Institutional | | | 9.78 | | | | 0.17 | | | | (0.29 | ) | | | (0.12 | ) | | | (0.12 | ) | | | — | | | | (0.12 | ) |
| | 2015 - IR | | | 9.79 | | | | 0.17 | | | | (0.31 | ) | | | (0.14 | ) | | | (0.11 | ) | | | — | | | | (0.11 | ) |
| | 2015 - R | | | 9.78 | | | | 0.14 | | | | (0.29 | ) | | | (0.15 | ) | | | (0.09 | ) | | | — | | | | (0.09 | ) |
| | | | | | | | | | | | | | | | | | | | | | | | | | | | | | |
| | FOR THE FISCAL YEARS ENDED MARCH 31, | |
| | 2015 - A (Commenced April 30, 2014) | | | 10.52 | | | | 0.31 | | | | (0.65 | ) | | | (0.34 | ) | | | (0.30 | ) | | | (0.09 | ) | | | (0.39 | ) |
| | 2015 - C (Commenced April 30, 2014) | | | 10.52 | | | | 0.24 | | | | (0.66 | ) | | | (0.42 | ) | | | (0.22 | ) | | | (0.09 | ) | | | (0.31 | ) |
| | 2015 - Institutional | | | 10.51 | | | | 0.37 | | | | (0.66 | ) | | | (0.29 | ) | | | (0.35 | ) | | | (0.09 | ) | | | (0.44 | ) |
| | 2015 - IR (Commenced April 30, 2014) | | | 10.52 | | | | 0.33 | | | | (0.65 | ) | | | (0.32 | ) | | | (0.32 | ) | | | (0.09 | ) | | | (0.41 | ) |
| | 2015 - R (Commenced April 30, 2014) | | | 10.52 | | | | 0.28 | | | | (0.65 | ) | | | (0.37 | ) | | | (0.28 | ) | | | (0.09 | ) | | | (0.37 | ) |
| | 2014 - Institutional/Common Shares | | | 10.80 | | | | 0.39 | | | | 0.09 | | | | 0.48 | | | | (0.39 | ) | | | (0.38 | ) | | | (0.77 | ) |
| | 2013 - Common Shares | | | 10.58 | | | | 0.45 | | | | 0.45 | | | | 0.90 | | | | (0.47 | ) | | | (0.21 | ) | | | (0.68 | ) |
| | 2012 - Common Shares | | | 10.70 | | | | 0.51 | | | | 0.17 | | | | 0.68 | | | | (0.51 | ) | | | (0.29 | ) | | | (0.80 | ) |
| | 2011 - Common Shares | | | 10.75 | | | | 0.56 | | | | 0.26 | | | | 0.82 | | | | (0.56 | ) | | | (0.31 | ) | | | (0.87 | ) |
| | (a) | | Calculated based on the average shares outstanding methodology. |
| | (b) | | Assumes investment at the net asset value at the beginning of the period, reinvestment of all dividends and distributions, a complete redemption of the investment at the net asset value at the end of the period and no sales or redemption charges. Total returns would be reduced if a sales or redemption charge was taken into account. Returns do not reflect the deduction of taxes that a shareholder would pay on Fund distributions or the redemption of Fund shares. Total returns for periods less than one full year are not annualized. |
| | (c) | | The Fund’s portfolio turnover rate is calculated in accordance with regulatory requirements, without regard to transactions involving short term investments and certain derivatives. If such transactions were included, the Fund’s portfolio turnover rate may be higher. |
| | |
| 52 | | The accompanying notes are an integral part of these financial statements. |
GOLDMAN SACHS LONG SHORT CREDIT STRATEGIES FUND
| | | | | | | | | | | | | | | | | | | | | | | | | | | | | | | | | | | | | | | | |
| | | | | | | | | | | | | | | | | | | | | | | | | | | | | | | | | | |
| | | Net asset
value, end
of period | | | | | Total
return(b) | | | | | Net assets,
end of
period
(in 000s) | | | | | Ratio of
net expenses
to average
net assets | | | | | Ratio of
total expenses
to average
net assets | | | | | Ratio of
net investment
income to average net assets | | | | | Portfolio
turnover
rate(c) | |
| | | | |
| | $ | 9.54 | | | | | | (1.53 | )% | | | | $ | 9,063 | | | | | | 1.49 | %(d) | | | | | 1.49 | %(d) | | | | | 3.12 | %(d) | | | | | 101 | % |
| | | 9.54 | | | | | | (1.90 | ) | | | | | 1,334 | | | | | | 2.23 | (d) | | | | | 2.24 | (d) | | | | | 2.38 | (d) | | | | | 101 | |
| | | 9.54 | | | | | | (1.26 | ) | | | | | 182,566 | | | | | | 1.15 | (d) | | | | | 1.17 | (d) | | | | | 3.47 | (d) | | | | | 101 | |
| | | 9.54 | | | | | | (1.41 | ) | | | | | 3,833 | | | | | | 1.22 | (d) | | | | | 1.22 | (d) | | | | | 3.39 | (d) | | | | | 101 | |
| | | 9.54 | | | | | | (1.56 | ) | | | | | 33 | | | | | | 1.75 | (d) | | | | | 1.77 | (d) | | | | | 2.86 | (d) | | | | | 101 | |
| | | | | | | | | | | | | | | | | | | | | | | | | | | | | | | | | | | | | | | | |
| | | | |
| | | 9.79 | | | | | | (3.28 | ) | | | | | 6,943 | | | | | | 1.57 | (d) | | | | | 1.62 | (d) | | | | | 3.35 | (d) | | | | | 164 | |
| | | 9.79 | | | | | | (3.95 | ) | | | | | 1,016 | | | | | | 2.30 | (d) | | | | | 2.38 | (d) | | | | | 2.61 | (d) | | | | | 164 | |
| | | 9.78 | | | | | | (2.77 | ) | | | | | 190,148 | | | | | | 1.27 | | | | | | 1.35 | | | | | | 3.57 | | | | | | 164 | |
| | | 9.79 | | | | | | (3.05 | ) | | | | | 2,475 | | | | | | 1.30 | (d) | | | | | 1.40 | (d) | | | | | 3.60 | (d) | | | | | 164 | |
| | | 9.78 | | | | | | (3.57 | ) | | | | | 32 | | | | | | 1.84 | (d) | | | | | 1.93 | (d) | | | | | 2.98 | (d) | | | | | 164 | |
| | | 10.51 | | | | | | 4.61 | | | | | | 335,421 | | | | | | 1.49 | | | | | | 1.51 | | | | | | 3.67 | | | | | | 207 | |
| | | 10.80 | | | | | | 8.74 | | | | | | 506,996 | | | | | | 1.47 | | | | | | 1.47 | | | | | | 4.23 | | | | | | 204 | |
| | | 10.58 | | | | | | 6.69 | | | | | | 533,499 | | | | | | 1.48 | | | | | | 1.48 | | | | | | 4.81 | | | | | | 215 | |
| | | 10.70 | | | | | | 7.94 | | | | | | 531,797 | | | | | | 1.50 | | | | | | 1.50 | | | | | | 5.23 | | | | | | 204 | |
| | |
| The accompanying notes are an integral part of these financial statements. | | 53 |
GOLDMAN SACHS FIXED INCOME ALTERNATIVES FUNDS
Notes to Financial Statements
September 30, 2015 (Unaudited)
Goldman Sachs Trust (the “Trust”) is a Delaware statutory trust registered under the Investment Company Act of 1940, as amended (the “Act”), as an open-end management investment company. The Trust includes the Goldman Sachs Fixed Income Macro Strategies Fund and the Goldman Sachs Long Short Credit Strategies Fund (the “Funds”). The Funds are non-diversified portfolios and currently offer five classes of shares: Class A, Class C, Institutional, Class IR and Class R. Class A Shares are sold with a front-end sales charge of up to 3.75%. Class C Shares are sold with a contingent deferred sales charge (“CDSC”) of 1.00% which is imposed on redemptions made within 12 months of purchase.
Goldman Sachs Asset Management, L.P. (“GSAM”), an affiliate of Goldman, Sachs & Co. (“Goldman Sachs”), serves as investment adviser to the Funds pursuant to a management agreement (the “Agreement”) with the Trust.
Pursuant to an Agreement and Plan of Reorganization (the ‘‘Reorganization Agreement’’) approved by the Trust’s Board of Trustees (“Trustees”) and shareholders of the Goldman Sachs Credit Strategies Fund (the ‘‘Predecessor Fund’’), all of the assets and liabilities of the Predecessor Fund were transferred to the Goldman Sachs Long Short Credit Strategies Fund as of the close of business on March 21, 2014 (the “Reorganization”). GSAM agreed to reimburse the Fund for 50% of the expenses related to the Reorganization. As part of the reorganization, holders of common shares (the “Shares”) of the Predecessor Fund received Institutional Shares of the Goldman Sachs Long Short Credit Strategies Fund, in an amount equal to the aggregate net asset value of his or her investment in the Predecessor Fund. The exchange was a tax-free event to shareholders. The Predecessor Fund was the accounting survivor in the Reorganization and as such, the financial statements and financial highlights reflect the financial information of the Predecessor Fund through March 21, 2014. Prior to the Reorganization, the Predecessor Fund operated as an “interval fund” which made quarterly offers to repurchase between 5% and 25% of its outstanding Shares at net asset value (“NAV”), pursuant to Rule 23c-3 under the Act.
|
| 2. SIGNIFICANT ACCOUNTING POLICIES |
The financial statements have been prepared in accordance with accounting principles generally accepted in the United States of America (“GAAP”) and require management to make estimates and assumptions that may affect the reported amounts and disclosures. Actual results may differ from those estimates and assumptions.
A. Basis of Consolidation for Fixed Income Macro Strategies Fund — The Cayman Commodity — FIMS, Ltd. (the “Subsidiary”), a Cayman Islands exempted company, is currently a wholly-owned subsidiary of the Fixed Income Macro Strategies Fund (the “Fund”). The Subsidiary acts as an investment vehicle for the Fund to enable the Fund to gain exposure to certain types of commodity-linked derivative instruments. The Fund is the sole shareholder of the Subsidiary pursuant to a subscription agreement dated as of December 16, 2013, and it is intended that the Fund will remain the sole shareholder and will continue to control the Subsidiary. Under the Articles of Association of the Subsidiary, shares issued by the Subsidiary confer upon a shareholder the right to vote at general meetings of the Subsidiary and certain rights in connection with any winding-up or repayment of capital, as well as the right to participate in the profits or assets of the Subsidiary. All inter-fund balances and transactions have been eliminated in consolidation. As of September 30, 2015, the Fund’s net assets were $70,888,513, of which, $12,647,460, or 18%, represented the Subsidiary’s net assets.
B. Investment Valuation — The Funds’ valuation policy is to value investments at fair value.
C. Investment Income and Investments — Investment income includes interest income and dividend income, net of any foreign withholding taxes, less any amounts reclaimable. Interest income is accrued daily and adjusted for amortization of premiums and accretion of discounts. Dividend income is recognized on ex-dividend date or, for certain foreign securities, as soon as such information is obtained subsequent to the ex-dividend date. Investment transactions are reflected on trade date. Realized gains and losses are calculated using identified cost. Investment transactions are recorded on the following business day for daily net asset value (“NAV”) calculations. Any foreign capital gains tax is accrued daily based upon net unrealized gains, and is payable upon sale of such investments.
54
GOLDMAN SACHS FIXED INCOME ALTERNATIVES FUNDS
|
| 2. SIGNIFICANT ACCOUNTING POLICIES (continued) |
For derivative contracts, realized gains and losses are recorded upon settlement of the contract. Upfront payments are made or received upon entering into a swap agreement and are reflected in the Statement of Assets and Liabilities. Upfront payments are recognized over the contract’s term/event as realized gains or losses, with the exception of forward starting interest rate swaps whose realized gains or losses are recognized from the effective start date.
For securities with paydown provisions, principal payments received are treated as a proportionate reduction to the cost basis of the securities, and excess or shortfall amounts are recorded as income.
For treasury inflation protected securities (“TIPS”), adjustments to principal due to inflation/deflation are reflected as increases/decreases to interest income with a corresponding adjustment to cost.
D. Class Allocations and Expenses — Investment income, realized and unrealized gain (loss), and non-class specific expenses of each Fund are allocated daily based upon the proportion of net assets of each class. Class specific expenses, where applicable, are borne by the respective share classes and include Distribution and Service and Transfer Agency fees. Non-class specific expenses directly incurred by a Fund are charged to that Fund, while such expenses incurred by the Trust are allocated across the applicable Funds on a straight-line and/or pro-rata basis depending upon the nature of the expenses.
E. Federal Taxes and Distributions to Shareholders — It is each Fund’s policy to comply with the requirements of the Internal Revenue Code of 1986, as amended (the “Code”), applicable to regulated investment companies (mutual funds) and to distribute each year substantially all of its investment company taxable income and capital gains to its shareholders. Accordingly, the Funds are not required to make any provisions for the payment of federal income tax. Distributions to shareholders are recorded on the ex-dividend date. Income and capital gains distributions, if any, are declared and paid according to the following schedule:
| | | | | | |
| Fund | | | | Income Distributions Declared/Paid | | Capital Gains Distributions Declared/Paid |
Fixed Income Macro Strategies* | | | | Annually | | Annually |
Long Short Credit Strategies | | | | Daily/Monthly | | Annually |
| * | | Prior to August 1, 2015, the Fund’s distributions from net investment income were declared daily and paid monthly. |
The Subsidiary is classified as a controlled foreign corporation under the Code. Therefore, the Fixed Income Macro Strategies Fund is required to increase its taxable income by its share of the Subsidiary’s income. Net losses of the Subsidiary cannot be deducted by the Fund in the current period nor carried forward to offset taxable income in future periods.
Net capital losses are carried forward to future fiscal years and may be used to the extent allowed by the Code to offset any future capital gains. Utilization of capital loss carryforwards will reduce the requirement of future capital gains distributions.
Under the Regulated Investment Company Modernization Act of 2010, the Funds are permitted to carry forward capital losses incurred in taxable years beginning after December 22, 2010 for an unlimited period. However, any losses incurred during those future taxable years will be required to be utilized prior to the losses incurred in pre-enactment taxable years. As a result of this ordering rule, pre-enactment capital loss carryforwards may be more likely to expire unused. Additionally, post-enactment capital losses that are carried forward will retain their character as either short-term or long-term capital losses rather than being considered all short-term as under previous law.
The characterization of distributions to shareholders for financial reporting purposes is determined in accordance with federal income tax rules, which may differ from GAAP. The source of each Fund’s distributions may be shown in the accompanying financial statements as either from net investment income, net realized gain or capital. Certain components of the Funds’ net assets on the Statements of Assets and Liabilities reflect permanent GAAP/tax differences based on the appropriate tax character.
F. Foreign Currency Translation — The accounting records and reporting currency of the Funds are maintained in U.S. dollars. Assets and liabilities denominated in foreign currencies are translated into U.S. dollars using the current exchange rates at the close of each business day. The effect of changes in foreign currency exchange rates on investments is included within net realized and
55
GOLDMAN SACHS FIXED INCOME ALTERNATIVES FUNDS
Notes to Financial Statements (continued)
September 30, 2015 (Unaudited)
|
| 2. SIGNIFICANT ACCOUNTING POLICIES (continued) |
unrealized gain (loss) on investments. Changes in the value of other assets and liabilities as a result of fluctuations in foreign exchange rates are included in the Statements of Operations within net change in unrealized gain (loss) on foreign currency translations. Transactions denominated in foreign currencies are translated into U.S. dollars on the date the transaction occurred, the effects of which are included within net realized gain (loss) on foreign currency transactions.
|
| 3. INVESTMENTS AND FAIR VALUE MEASUREMENTS |
The fair value of a financial instrument is the amount that would be received to sell an asset or paid to transfer a liability in an orderly transaction between market participants at the measurement date (i.e., the exit price). GAAP establishes a fair value hierarchy that prioritizes the inputs to valuation techniques used to measure fair value. The hierarchy gives the highest priority to unadjusted quoted prices in active markets for identical assets or liabilities (Level 1 measurements) and the lowest priority to unobservable inputs (Level 3 measurements). The levels used for classifying investments are not necessarily an indication of the risk associated with investing in these investments. The three levels of the fair value hierarchy are described below:
Level 1 — Unadjusted quoted prices in active markets that are accessible at the measurement date for identical, unrestricted assets or liabilities;
Level 2 — Quoted prices in markets that are not active or financial instruments for which significant inputs are observable (including, but not limited to, quoted prices for similar investments, interest rates, foreign exchange rates, volatility and credit spreads), either directly or indirectly;
Level 3 — Prices or valuations that require significant unobservable inputs (including GSAM’s assumptions in determining fair value measurement).
Changes in valuation techniques may result in transfers into or out of an assigned level within the hierarchy. In accordance with the Funds’ policy, transfers between different levels of the fair value hierarchy resulting from such changes are deemed to have occurred as of the beginning of the reporting period.
The Trustees have approved Valuation Procedures that govern the valuation of the portfolio investments held by the Funds, including investments for which market quotations are not readily available. The Trustees have delegated to GSAM day-to-day responsibility for implementing and maintaining internal controls and procedures related to the valuation of the Funds’ portfolio investments. To assess the continuing appropriateness of pricing sources and methodologies, GSAM regularly performs price verification procedures and issues challenges as necessary to third party pricing vendors or brokers, and any differences are reviewed in accordance with the Valuation Procedures.
A. Level 1 and Level 2 Fair Value Investments — The valuation techniques and significant inputs used in determining the fair values for investments classified as Level 1 and Level 2 are as follows:
Debt Securities — Debt securities for which market quotations are readily available are valued daily on the basis of quotations supplied by dealers or an independent pricing service approved by the Trustees. The pricing services may use valuation models or matrix pricing, which consider: (i) yield or price with respect to bonds that are considered comparable in characteristics such as rating, interest rate and maturity date or (ii) quotations from securities dealers to determine current value. Short-term debt obligations that mature in sixty days or less and that do not exhibit signs of credit deterioration are valued at amortized cost, which approximates fair value. With the exception of treasury securities of G8 countries (not held in money market funds), which are generally classified as Level 1, these investments are generally classified as Level 2 of the fair value hierarchy.
i. Inverse Floaters — The interest rate on inverse floating rate securities (“inverse floaters”) resets in the opposite direction from the market rate of interest to which the inverse floaters are indexed. An inverse floater may be considered to be leveraged to the extent that its interest rate varies by a magnitude that exceeds the magnitude of the change in the index rate of interest. The higher the degree of leverage of an inverse floater, the greater the volatility of its market value.
56
GOLDMAN SACHS FIXED INCOME ALTERNATIVES FUNDS
|
| 3. INVESTMENTS AND FAIR VALUE MEASUREMENTS (continued) |
ii. Mortgage-Backed and Asset-Backed Securities — Mortgage-backed securities represent direct or indirect participations in, or are collateralized by and payable from, mortgage loans secured by residential and/or commercial real estate property. Asset-backed securities include securities whose principal and interest payments are collateralized by pools of other assets or receivables. The value of certain mortgage-backed and asset-backed securities (including adjustable rate mortgage loans) may be particularly sensitive to changes in prevailing interest rates. The value of these securities may also fluctuate in response to the market’s perception of the creditworthiness of the issuers.
Asset-backed securities may present credit risks that are not presented by mortgage-backed securities because they generally do not have the benefit of a security interest in collateral that is comparable to mortgage assets. Some asset-backed securities may only have a subordinated claim on collateral.
Stripped mortgage-backed securities are usually structured with two different classes: one that receives substantially all interest payments (interest-only, or “IO” and/or high coupon rate with relatively low principal amount, or “IOette”), and the other that receives substantially all principal payments (principal-only, or “PO”) from a pool of mortgage loans. Little to no principal will be received at the maturity of an IO; as a result, periodic adjustments are recorded to reduce the cost of the security until maturity. These adjustments are included in interest income.
iii. Senior Term Loans — Senior term loans (“Loans”) are interests in amounts owed by corporate, governmental, or other borrowers to lenders or lending syndicates. Loans are arranged through private negotiations between the borrower and one or more financial institutions (“Lenders”). A Fund’s investments in Loans are in the form of either participations in Loans (“Participations”) or assignments of all or a portion of Loans from third parties (“Assignments”). With respect to Participations, a Fund has the right to receive payments of principal, interest and any fees to which it is entitled from the Lender selling the Participations and only upon receipt by the Lender of the payments from the borrower. A Fund generally has no right to enforce compliance by the borrower with the terms of the loan agreement with respect to Participations. Conversely, Assignments result in a Fund having a direct contractual relationship with the borrower, and the Fund may be permitted to enforce compliance by the borrower with the terms of the loan agreement.
iv. Structured Notes — The values of structured notes are based on the price movements of a reference security or index. Upon termination, a Fund will receive a payment from the issuer based on the value of the referenced instrument (notional amount multiplied by price of the referenced instrument) and record a realized gain or loss.
v. When-Issued Securities and Forward Commitments — When-issued securities, including TBA (“To Be Announced”) securities, are securities that are authorized but not yet issued in the market and purchased in order to secure what is considered to be an advantageous price or yield to a Fund. A forward commitment involves entering into a contract to purchase or sell securities, typically on an extended settlement basis, for a fixed price at a future date. The purchase of securities on a when-issued or forward commitment basis involves a risk of loss if the value of the security to be purchased declines before the settlement date. Conversely, the sale of securities on a forward commitment basis involves the risk that the value of the securities sold may increase before the settlement date. Although a Fund will generally purchase securities on a when-issued or forward commitment basis with the intention of acquiring the securities for its portfolio, the Fund may dispose of when-issued securities or forward commitments prior to settlement which may result in a realized gain or loss.
Equity Securities — Equity securities and investment companies traded on a United States (“U.S.”) securities exchange or the NASDAQ system, or those located on certain foreign exchanges, including but not limited to the Americas, are valued daily at their last sale price or official closing price on the principal exchange or system on which they are traded. If there is no sale or official closing price or it is believed by GSAM to not represent fair value, equity securities and exchange traded investment companies are valued at the last bid price for long positions and at the last ask price for short positions. Investments in investment companies (other than those that are exchange traded) are valued at the NAV on the valuation date. To the extent these investments are actively traded, they are classified as Level 1 of the fair value hierarchy, otherwise they are generally classified as Level 2.
Unlisted equity securities for which market quotations are available are valued at the last sale price on the valuation date, or if no sale occurs, at the last bid price. Securities traded on certain foreign securities exchanges are valued daily at fair value determined by an independent fair value service (if available) under Valuation Procedures approved by the Trustees and consistent
57
GOLDMAN SACHS FIXED INCOME ALTERNATIVES FUNDS
Notes to Financial Statements (continued)
September 30, 2015 (Unaudited)
|
| 3. INVESTMENTS AND FAIR VALUE MEASUREMENTS (continued) |
with applicable regulatory guidance. The independent fair value service takes into account multiple factors including, but not limited to, movements in the securities markets, certain depositary receipts, futures contracts and foreign currency exchange rates that have occurred subsequent to the close of the foreign securities exchange. These investments are generally classified as Level 2 of the fair value hierarchy.
Money Market Funds — Investments in the Goldman Sachs Financial Square Government Fund (“Underlying Fund”) are valued at the NAV of the FST Share class on the day of valuation. These investments are generally classified as Level 1 of the fair value hierarchy.
The Underlying Fund may invest in debt securities which are valued daily on the basis of quotations supplied by dealers, if market quotations are readily available, or an independent pricing service approved by the Trustees. The pricing services may use valuation models or matrix pricing, which consider: (i) yield or price with respect to bonds that are considered comparable in characteristics such as rating, interest rate and maturity date or (ii) quotations from securities dealers to determine current value.
Derivative Contracts — A derivative is an instrument whose value is derived from underlying assets, indices, reference rates or a combination of these factors. The Funds enter into derivative transactions to hedge against changes in interest rates, securities prices, and/or currency exchange rates, to increase total return, or to gain access to certain markets or attain exposure to other underliers.
Exchange-traded derivatives, including futures and options contracts, are valued at the last sale or settlement price and typically fall within Level 1 of the fair value hierarchy. Over-the-counter (“OTC”) and centrally cleared derivatives are valued using market transactions and other market evidence, including market-based inputs to models, calibration to market-clearing transactions, broker or dealer quotations, or other alternative pricing sources. Where models are used, the selection of a particular model to value OTC and centrally cleared derivatives depends upon the contractual terms of, and specific risks inherent in, the instrument, as well as the availability of pricing information in the market. Valuation models require a variety of inputs, including contractual terms, market prices, yield curves, credit curves, measures of volatility, voluntary and involuntary prepayment rates, loss severity rates and correlations of such inputs. For OTC and centrally cleared derivatives that trade in liquid markets, model inputs can generally be verified and model selection does not involve significant management judgment. OTC and centrally cleared derivatives are classified within Level 2 of the fair value hierarchy when significant inputs are corroborated by market evidence.
i. Forward Contracts — A forward contract is a contract between two parties to buy or sell an asset at a specified price on a future date. A forward contract settlement can occur on a cash or delivery basis. Forward contracts are marked-to-market daily using independent vendor prices, and the change in value, if any, is recorded as an unrealized gain or loss.
A forward foreign currency contract is a forward contract in which a Fund agrees to receive or deliver a fixed quantity of one currency for another, at a pre-determined price at a future date. All forward foreign currency exchange contracts are marked-to-market daily at the applicable forward rate. Non-deliverable forward foreign currency exchange contracts are settled with the counterparty in cash without the delivery of foreign currency.
A non-deliverable bond forward is a short term forward contract between two parties to buy or sell a bond denominated in a non-deliverable foreign currency at a specified future time and price. Non-deliverable bond forwards are marked-to-market daily using market quotations. Unrealized gains or losses on non-deliverable bond forwards are recorded by a Fund on a daily basis, and realized gains or losses are recorded on the termination date or sale of a contract.
ii. Futures Contracts — Futures contracts are contracts to buy or sell a standardized quantity of a specified commodity or security and are valued based on exchanged settlement prices or independent market quotes. Futures contracts are valued at the last settlement price, or in the absence of a sale, the last bid price for long positions and at the last ask price for short positions, at the end of each day on the board of trade or exchange upon which they are traded. Upon entering into a futures contract, a Fund deposits cash or securities in an account on behalf of the broker in an amount sufficient to meet the initial margin requirement. Subsequent payments are made or received by a Fund equal to the daily change in the contract value and are recorded as variation margin receivable or payable with a corresponding offset to unrealized gains or losses.
58
GOLDMAN SACHS FIXED INCOME ALTERNATIVES FUNDS
|
| 3. INVESTMENTS AND FAIR VALUE MEASUREMENTS (continued) |
iii. Options — When a Fund writes call or put options, an amount equal to the premium received is recorded as a liability and is subsequently marked-to-market to reflect the current value of the option written. Swaptions are options on interest rate swap contracts.
Upon the purchase of a call option or a put option by a Fund, the premium paid is recorded as an investment and subsequently marked-to-market to reflect the current value of the option. Certain options may be purchased with premiums to be determined on a future date. The premiums for these options are based upon implied volatility parameters at specified terms.
iv. Swap Contracts — Bilateral swap contracts are agreements in which a Fund and a counterparty agree to exchange periodic payments on a specified notional amount or make a net payment upon termination. Bilateral swap transactions are privately negotiated in the OTC market and payments are settled through direct payments between a Fund and the counterparty. By contrast, certain swap transactions are subject to mandatory central clearing. These swaps are executed through a derivatives clearing member (“DCM”), acting in an agency capacity, and submitted to a central counterparty (“CCP”) (“centrally cleared swaps”), in which case all payments are settled with the CCP through the DCM. Swaps are marked-to-market daily using pricing vendor quotations, counterparty or clearinghouse prices or model prices, and the change in value, if any, is recorded as an unrealized gain or loss. Upon entering into a swap contract, a Fund is required to satisfy an initial margin requirement by delivering cash or securities to the counterparty (or in some cases, segregated in a triparty account on behalf of the counterparty), which can be adjusted by any mark-to-market gains or losses pursuant to bilateral or centrally cleared arrangements. For centrally cleared swaps the daily change in valuation, if any, is recorded as a receivable or payable for variation margin.
An interest rate swap is an agreement that obligates two parties to exchange a series of cash flows at specified intervals, based upon or calculated by reference to changes in interest rates on a specified notional principal amount. The payment flows are usually netted against each other, with the difference being paid by one party to the other.
A credit default swap is an agreement that involves one party (the buyer of protection) making a stream of payments to another party (the seller of protection) in exchange for the right to receive protection on a reference security or obligation, including a group of assets or exposure to the performance of an index. A Fund’s investment in credit default swaps may involve greater risks than if the Fund had invested in the referenced obligation directly. Credit events are contract specific but may include bankruptcy, failure to pay, restructuring and obligation acceleration. If a Fund buys protection through a credit default swap and no credit event occurs, its payments are limited to the periodic payments previously made to the counterparty. Upon the occurrence of a specified credit event, a Fund, as a buyer of credit protection, is entitled to receive an amount equal to the notional amount of the swap and deliver to the seller the defaulted reference obligation in a physically settled trade. A Fund may also receive a net settlement amount in the form of cash or securities equal to the notional amount of the swap reduced by the recovery value of the reference obligation in a cash settled trade.
As a seller of protection, a Fund generally receives a payment stream throughout the term of the swap, provided that there is no credit event. In addition, if a Fund sells protection through a credit default swap, a Fund could suffer a loss because the value of the referenced obligation and the premium payments received may be less than the notional amount of the swap paid to the buyer of protection. Upon the occurrence of a specified credit event, a Fund, as a seller of credit protection, may be required to take possession of the defaulted reference obligation and pay the buyer an amount equal to the notional amount of the swap in a physically settled trade. A Fund may also pay a net settlement amount in the form of cash or securities equal to the notional amount of the swap reduced by the recovery value of the reference obligation in cash settled trade. Recovery values are at times established through the credit event auction process in which market participants are ensured that a transparent price has been set for the defaulted security or obligation. In addition, a Fund is entitled to a return of any assets, which have been pledged as collateral to the counterparty.
The maximum potential amount of future payments (undiscounted) that a Fund as seller of protection could be required to make under a credit default swap would be an amount equal to the notional amount of the agreement. These potential amounts would be partially offset by any recovery values of the respective referenced obligations or net amounts received from a settlement of a credit default swap for the same reference security or obligation where a Fund bought credit protection.
59
GOLDMAN SACHS FIXED INCOME ALTERNATIVES FUNDS
Notes to Financial Statements (continued)
September 30, 2015 (Unaudited)
|
| 3. INVESTMENTS AND FAIR VALUE MEASUREMENTS (continued) |
A cross currency swap is an agreement which a Fund may enter into to gain or mitigate exposure to currency risk. A cross currency swap is an agreement to exchange cash flows on a notional amount of two or more currencies based on the relative value differential among them. Such swaps may involve initial and final exchanges that correspond to the agreed upon notional amount. Cross currency swaps usually involve the delivery of the entire principal value of one designated currency in exchange for other designated currency. Therefore, the entire principal value of a cross currency swap is subject to risk that the other party to the swap will default on its contractual delivery obligations. If there is a default by the counterparty, the Fund may have contractual remedies pursuant to the agreements related to the transaction.
A total return swap is an agreement that gives a Fund the right to receive the appreciation in the value of a specified security, index or other instrument in return for a fee paid to the counterparty, which will typically be an agreed upon interest rate. If the underlying asset declines in value over the term of the swap, a Fund may also be required to pay the dollar value of that decline to the counterparty.
Short Term Investments — Short-term investments having a maturity of 60 days or less are generally valued at amortized cost which approximates fair market value. These investments are classified as Level 2 of the fair value hierarchy.
i. Repurchase Agreements — Repurchase agreements involve the purchase of securities subject to the seller’s agreement to repurchase the securities at a mutually agreed upon date and price, under the terms of a Master Repurchase Agreement (“MRA”). During the term of a repurchase agreement, the value of the underlying securities held as collateral on behalf of a Fund, including accrued interest, is required to exceed the value of the repurchase agreement, including accrued interest. The gross value of repurchase agreements is included in the Statements of Assets and Liabilities for financial reporting purposes. The underlying securities for all repurchase agreements are held at the Funds’ custodian or designated sub-custodians under tri-party repurchase agreements.
An MRA governs transactions between a Fund and select counterparties. An MRA contains provisions for, among other things, initiation of the transaction, income payments, events of default and maintenance of securities for repurchase agreements. An MRA also permits offsetting with collateral to create one single net payment in the event of default or similar events, including the bankruptcy or insolvency of a counterparty.
If the seller defaults, a Fund could suffer a loss to the extent that the proceeds from the sale of the underlying securities and other collateral held by the Fund are less than the repurchase price and the Fund’s costs associated with delay and enforcement of the repurchase agreement. In addition, in the event of default or insolvency of the seller, a court could determine that a Fund’s interest in the collateral is not enforceable, resulting in additional losses to the Fund.
Pursuant to exemptive relief granted by the Securities and Exchange Commission (“SEC”) and terms and conditions contained therein, the Funds, together with other funds of the Trust and registered investment companies having management agreements with GSAM or its affiliates, may transfer uninvested cash into joint accounts, the daily aggregate balance of which is invested in one or more repurchase agreements. Under these joint accounts, the Funds maintain pro-rata credit exposure to the underlying repurchase agreements’ counterparties. With the exception of certain transaction fees, the Funds are not subject to any expenses in relation to these investments
B. Level 3 Fair Value Investments — To the extent that significant inputs to valuation models and other alternative pricing sources are unobservable, or if quotations are not readily available, or if GSAM believes that such quotations do not accurately reflect fair value, the fair value of the Funds’ investments may be determined under Valuation Procedures approved by the Trustees. GSAM, consistent with its procedures and applicable regulatory guidance, may make an adjustment to the most recent valuation prices of either domestic or foreign securities in light of significant events to reflect what it believes to be the fair value of the securities at the time of determining a Fund’s NAV. Significant events which could affect a large number of securities in a particular market may include, but are not limited to: significant fluctuations in U.S. or foreign markets; market dislocations; market disruptions; or unscheduled market closings. Significant events which could also affect a single issuer may include, but are not limited to: corporate actions such as reorganizations, mergers and buy-outs; ratings downgrades; and bankruptcies. To the extent investments are valued using single source broker quotations obtained directly from the broker or passed through from third party pricing vendors, such investments are classified as Level 3 investments.
60
GOLDMAN SACHS FIXED INCOME ALTERNATIVES FUNDS
|
| 3. INVESTMENTS AND FAIR VALUE MEASUREMENTS (continued) |
GSAM did not develop the unobservable inputs (examples include but are not limited to single source broker quotations, third party pricing, etc.) for the valuation of Level 3 Assets and Liabilities.
C. Fair Value Hierarchy — The following is a summary of the Funds’ investments and derivatives classified in the fair value hierarchy as of September 30, 2015:
| | | | | | | | | | | | |
| | | |
| FIXED INCOME MACRO STRATEGIES | | | | | | | | | | | | |
| | | |
| Investment Type | | Level 1 | | | Level 2 | | | Level 3 | |
| Assets | | | | | | | | | | | | |
Fixed Income | | | | | | | | | | | | |
Foreign Sovereign Debt Obligations | | $ | 4,766,841 | | | $ | 5,010,898 | | | $ | — | |
Mortgage-Backed Obligations | | | — | | | | 8,544,963 | | | | — | |
U.S. Treasury Obligations and/or Other U.S. Government Agencies | | | 9,999,720 | | | | 10,998,816 | | | | — | |
Asset-Backed Securities | | | — | | | | 6,665,077 | | | | — | |
Municipal Debt Obligations | | | — | | | | 1,197,808 | | | | — | |
Corporate Obligations | | | — | | | | 1,997,745 | | | | — | |
Investment Company | | | 11,996,350 | | | | — | | | | — | |
Short-term Investments | | | — | | | | 6,600,000 | | | | — | |
| Total | | $ | 26,762,911 | | | $ | 41,015,307 | | | $ | — | |
| | | |
| Derivative Type | | Level 1 | | | Level 2 | | | Level 3 | |
| Assets | | | | | | | | | | | | |
Options Purchased | | $ | 413 | | | $ | 1,054,563 | | | $ | — | |
Forward Foreign Currency Exchange Contracts(a) | | | — | | | | 1,501,117 | | | | — | |
Futures Contracts(a) | | | 133,913 | | | | — | | | | — | |
Interest Rate Swap Contracts(a) | | | — | | | | 4,106,442 | | | | — | |
Credit Default Swap Contracts(a) | | | — | | | | 17,810 | | | | — | |
Cross Currency Swap Contracts(a) | | | — | | | | 381,318 | | | | — | |
Total Return Swap Contracts(a) | | | — | | | | 22,139 | | | | — | |
Non-Deliverable Bond Forward Contracts(a) | | | — | | | | 15,829 | | | | — | |
| Total | | $ | 134,326 | | | $ | 7,099,218 | | | $ | — | |
| Liabilities | | | | | | | | | | | | |
Forward Foreign Currency Exchange Contracts(a) | | $ | — | | | $ | (868,207 | ) | | $ | — | |
Futures Contracts(a) | | | (11,700 | ) | | | — | | | | — | |
Interest Rate Swap Contracts(a) | | | — | | | | (3,245,464 | ) | | | — | |
Credit Default Swap Contracts(a) | | | — | | | | (73,790 | ) | | | — | |
Cross Currency Swap Contracts(a) | | | — | | | | (77,532 | ) | | | — | |
Total Return Swap Contracts(a) | | | — | | | | (276,017 | ) | | | — | |
Written Options Contracts | | | — | | | | (805,276 | ) | | | — | |
| Total | | $ | (11,700 | ) | | $ | (5,346,286 | ) | | $ | — | |
61
GOLDMAN SACHS FIXED INCOME ALTERNATIVES FUNDS
Notes to Financial Statements (continued)
September 30, 2015 (Unaudited)
|
| 3. INVESTMENTS AND FAIR VALUE MEASUREMENTS (continued) |
| | | | | | | | | | | | |
| | | |
| LONG SHORT CREDIT STRATEGIES | | | | | | | | | | | | |
| | | |
| Investment Type | | Level 1 | | | Level 2 | | | Level 3 | |
| Assets | | | | | | | | | | | | |
Fixed Income | | | | | | | | | | | | |
Senior Term Loans | | $ | — | | | $ | 13,831,764 | | | $ | — | |
Secured Debt Obligations | | | — | | | | 27,825,497 | | | | — | |
Unsecured Debt Obligations | | | — | | | | 123,629,017 | | | | — | |
Common Stock | | | | | | | | | | | | |
North America | | | — | | | | — | | | | 2 | |
Preferred Stock | | | | | | | | | | | | |
North America | | | — | | | | — | | | | 1,330,345 | |
Investment Company | | | 26,569,589 | | | | — | | | | — | |
| Total | | $ | 26,569,589 | | | $ | 165,286,278 | | | $ | 1,330,347 | |
| | | |
| Derivative Type | | Level 1 | | | Level 2 | | | Level 3 | |
| Assets(a) | | | | | | | | | | | | |
Forward Foreign Currency Exchange Contracts | | $ | — | | | $ | 1,326 | | | $ | — | |
Interest Rate Swap Contracts | | | — | | | | 1,161 | | | | — | |
| Total | | $ | — | | | $ | 2,487 | | | $ | — | |
| Liabilities(a) | | | | | | | | | | | | |
Interest Rate Swap Contracts | | $ | — | | | $ | (513,115 | ) | | $ | — | |
Credit Default Swap Contracts | | | — | | | | (155,808 | ) | | | — | |
| Total | | $ | — | | | $ | (668,923 | ) | | $ | — | |
| (a) | | Amount shown represents unrealized gain (loss) at period end. |
For further information regarding security characteristics, see the Schedules of Investments.
62
GOLDMAN SACHS FIXED INCOME ALTERNATIVES FUNDS
|
| 4. INVESTMENTS IN DERIVATIVES |
The following tables set forth, by certain risk types, the gross value of derivative contracts as of September 30, 2015. These instruments were used to meet the Funds’ investment objectives and to obtain and/or manage exposure related to the risks below. The values in the tables below exclude the effects of cash collateral received or posted pursuant to these derivative contracts, and therefore are not representative of the Funds’ net exposure.
| | | | | | | | | | | | |
|
| Fixed Income Macro Strategies | |
| Risk | | Statements of Assets and Liabilities | | Assets | | | Statements of Assets and Liabilities | | Liabilities | |
Interest rate | | Receivable for unrealized gain on swap contracts; Variation margin on certain derivative contracts; Receivable for unrealized gain on non-deliverable bond forward contracts; Investments, at value | | $ | 5,171,735 | (a) | | Payable for unrealized loss on swap contracts; Variation margin on certain derivative contracts; Written options, at value | | $ | (4,335,069) | (a)(b) |
Commodity | | — | | | | | | Payable for unrealized loss on swap contracts | | | (682) | (b) |
Credit | | Receivable for unrealized gain on swap contracts | | | 17,810 | | | Payable for unrealized loss on swap contracts; Variation margin on certain derivative contracts | | | (73,790) | (a)(b) |
Currency | | Receivable for unrealized gain on swap contracts; Receivable for unrealized gain on forward foreign currency exchange contracts; Investments, at value | | | 1,923,897 | | | Payable for unrealized loss on swap contracts; Payable for unrealized loss on forward foreign currency exchange contracts; Written options, at value | | | (948,445) | (b) |
Equity | | Variation margin on certain derivative contracts | | | 120,102 | (a) | | — | | | | |
| Total | | | | $ | 7,233,544 | | | | | $ | (5,357,986) | |
|
| Long Short Credit Strategies | |
| Risk | | Statements of Assets and Liabilities | | Assets | | | Statements of Assets and Liabilities | | Liabilities | |
Interest rate | | Variation margin on certain derivative contracts | | $ | 1,161 | (a) | | Variation margin on certain derivative contracts | | $ | (513,115) | (a) |
Credit | | — | | | — | | | Variation margin on certain derivative contracts | | | (155,808) | (a) |
Currency | | Receivable for unrealized gain on forward foreign currency exchange contracts | | | 1,326 | | | — | | | — | |
| Total | | | | $ | 2,487 | | | | | $ | (668,923) | |
| (a) | | Includes unrealized gain (loss) on futures contracts and centrally cleared swaps described in the Additional Investment Information sections of the Schedules of Investments. Only current day’s variation margin is reported within the Statements of Assets and Liabilities. |
| (b) | | Aggregate of amounts include $1,465,398 for Fixed Income Macro Strategies Fund, which represent the payments to be made pursuant to bilateral agreements should counterparties exercise their “right to terminate” provisions based on, among others, the Funds’ performance, its failure to pay on its obligations or failure to pledge collateral. Such amounts do not include incremental charges directly associated with the close-out of the agreements. They also do not reflect the fair value of any assets pledged as collateral which, through the daily margining process, substantially offsets the aforementioned amounts and for which the Fund is entitled to a full return. |
63
GOLDMAN SACHS FIXED INCOME ALTERNATIVES FUNDS
Notes to Financial Statements (continued)
September 30, 2015 (Unaudited)
|
| 4. INVESTMENTS IN DERIVATIVES (continued) |
The following tables set forth, by certain risk types, the Funds’ gains (losses) related to these derivatives and their indicative volumes for the six months ended September 30, 2015. These gains (losses) should be considered in the context that these derivative contracts may have been executed to create investment opportunities and/or economically hedge certain investments, and accordingly, certain gains (losses) on such derivative contracts may offset certain (losses) gains attributable to investments. These gains (losses) are included in “Net realized gain (loss)” or “Net change in unrealized gain (loss)” on the Statements of Operations:
| | | | | | | | | | | | | | |
| | | |
| Fixed Income Macro Strategies | | | | | | | | | | | | |
| Risk | | Statements of Operations | | Net Realized
Gain (Loss) | | | Net Change in
Unrealized
Gain (Loss) | | | Average
Number of
Contracts(a) | |
| Interest rate | | Net realized gain (loss) from investments, futures contracts, swap contracts, non-deliverable bond forward contracts and written options/Net change in unrealized gain (loss) on investments, futures contracts, swap contracts, non-deliverable bond forward contracts and written options | | $ | 984,337 | | | $ | 1,189,385 | | | | 337 | |
| Commodity | | Net realized gain (loss) from swap contracts/Net change in unrealized gain (loss) on swap contracts | | | 196,589 | | | | (657 | ) | | | 15 | |
| Credit | | Net realized gain (loss) from swap contracts/Net change in unrealized gain (loss) on swap contracts | | | (60,980 | ) | | | (2,328 | ) | | | 38 | |
| Currency | | Net realized gain (loss) from investments, swap contracts, forward foreign currency exchange contracts and written options/Net change in unrealized gain (loss) on investments, swap contracts, forward foreign currency exchange contracts and written options | | | (13,898 | ) | | | 95,941 | | | | 481 | |
| Equity | | Net realized gain (loss) from futures contracts/Net change in unrealized gain (loss) on futures contracts | | | 264,140 | | | | 169,817 | | | | 51 | |
| Total | | | | $ | 1,370,188 | | | $ | 1,452,158 | | | | 922 | |
| | | |
| Long Short Credit Strategies | | | | | | | | | | | | |
| Risk | | Statements of Operations | | Net Realized
Gain (Loss) | | | Net Change in
Unrealized
Gain (Loss) | | | Average
Number of
Contracts(a) | |
| Interest rate | | Net realized gain (loss) from swap contracts/Net change in unrealized gain (loss) on swap contracts | | $ | (454,473 | ) | | $ | 76,718 | | | | 4 | |
| Credit | | Net realized gain (loss) from swap contracts/Net change in unrealized gain (loss) on swap contracts | | | 1,175,572 | | | | 235,483 | | | | 1 | |
| Currency | | Net realized gain (loss) from Forward foreign currency exchange contracts/Net change in unrealized gain (loss) on Forward foreign currency exchange contracts | | | 1,565,814 | | | | (1,574,767 | ) | | | 1 | |
| Total | | | | $ | 2,286,913 | | | $ | (1,262,566 | ) | | | 6 | |
| (a) | | Average number of contracts is based on the average of month end balances for the six months ended September 30, 2015. |
64
GOLDMAN SACHS FIXED INCOME ALTERNATIVES FUNDS
|
| 4. INVESTMENTS IN DERIVATIVES (continued) |
In order to better define its contractual rights and to secure rights that will help a Fund mitigate its counterparty risk, a Fund may enter into an International Swaps and Derivatives Association, Inc. Master Agreement (“ISDA Master Agreement”) or similar agreement with its derivatives counterparties. An ISDA Master Agreement is a bilateral agreement between a Fund and a counterparty that governs OTC derivatives, including forward foreign currency exchange contracts, and certain options and swaps and typically contains, among other things, collateral posting terms and netting provisions in the event of a default and/or termination event. The provisions of the ISDA Master Agreement typically permit a single net payment in the event of a default (close-out netting) or similar event, including the bankruptcy or insolvency of the counterparty.
Collateral and margin requirements differ between exchange traded derivatives and OTC derivatives. Margin requirements are established by the broker or clearing house for exchange-traded and centrally cleared derivatives (financial futures contracts, options and centrally cleared swaps) pursuant to governing agreements for those instrument types. Brokers can ask for margin in excess of the minimum in certain circumstances. Collateral terms are contract-specific for OTC derivatives. For derivatives traded under an ISDA Master Agreement, the collateral requirements are typically calculated by netting the marked to market amount for each transaction under such agreement and comparing that amount to the value of any collateral currently pledged by a Fund and the counterparty. Additionally, a Fund may be required to post initial margin to the counterparty, the terms of which would be outlined in the confirmation of the OTC transaction.
For financial reporting purposes, cash collateral that has been pledged to cover obligations of a Fund and cash collateral received from the counterparty, if any, is reported separately on the Statements of Assets and Liabilities as receivables/payables for collateral on certain derivative contracts. Non-cash collateral pledged by a Fund, if any, is noted in the Schedules of Investments. Generally, the amount of collateral due from or to a counterparty must exceed a minimum transfer amount threshold before a transfer is required to be made. To the extent amounts due to a Fund from its counterparties are not fully collateralized, contractually or otherwise, the Fund bears the risk of loss from counterparty nonperformance. A Fund attempts to mitigate counterparty risk by only entering into agreements with counterparties that it believes to be of good standing and by monitoring the financial stability of those counterparties.
Additionally, the netting of assets and liabilities and the offsetting of collateral pledged or received are based on contractual netting/set-off provisions in the ISDA Master Agreement or similar agreements. However, in the event of a default or insolvency of a counterparty, a court could determine that such rights are not enforceable due the restrictions or prohibitions against the right of setoff that may be imposed due to a particular jurisdiction’s bankruptcy or insolvency laws.
65
GOLDMAN SACHS FIXED INCOME ALTERNATIVES FUNDS
Notes to Financial Statements (continued)
September 30, 2015 (Unaudited)
|
| 4. INVESTMENTS IN DERIVATIVES (continued) |
The following tables set forth the Funds’ net exposure for derivative instruments that are subject to enforceable master netting arrangements or similar agreements as of September 30, 2015:
| | | | | | | | | | | | | | | | | | | | | | | | | | | | | | | | | | | | | | | | | | | | |
| | | | | | | | |
| Fixed Income Macro Strategies Fund | | | | | | | | | | | | | | | | | | | | | | | | | | | | | | | | | |
| | | Derivative Assets(1) | | | Derivative Liabilities(1) | | | Net
Derivative
Asset
(Liabilities) | | | Collateral
(Received)
Pledged(1) | | | Net
Amount(2) | |
| Counterparty | | Options
Purchased | | | Swaps | | | Forward
Currency
Contracts | | | Total | | | Swaps | | | Forward
Currency
Contracts | | | Options | | | Total | | | | |
Bank of America Securities LLC | | $ | 58,058 | | | $ | 348,815 | | | $ | — | | | | 406,873 | | | $ | (660,359 | ) | | $ | — | | | | (53,287 | ) | | $ | (713,646 | ) | | $ | (306,773 | ) | | $ | 306,773 | | | $ | — | |
Barclays Bank PLC | | | — | | | | 42,925 | | | | — | | | | 42,925 | | | | (121,468 | ) | | | — | | | | — | | | | (121,468 | ) | | | (78,543 | ) | | | — | | | | (78,543 | ) |
BNP Paribas SA | | | 41,462 | | | | — | | | | — | | | | 41,462 | | | | — | | | | — | | | | (2,706 | ) | | | (2,706 | ) | | | 38,756 | | | | — | | | | 38,756 | |
Citibank NA | | | — | | | | 415,799 | | | | 1,501,117 | | | | 1,916,916 | | | | (6,560 | ) | | | (868,207 | ) | | | (124 | ) | | | (874,891 | ) | | | 1,042,025 | | | | — | | | | 1,042,025 | |
Citigroup Global Markets, Inc. | | | — | | | | — | | | | — | | | | — | | | | — | | | | — | | | | (319 | ) | | | (319 | ) | | | (319 | ) | | | — | �� | | | (319 | ) |
Credit Suisse International (London) | | | 413 | | | | 22,409 | | | | — | | | | 22,822 | | | | (45,512 | ) | | | — | | | | — | | | | (45,512 | ) | | | (22,690 | ) | | | — | | | | (22,690 | ) |
Deutsche Bank AG | | | 213,132 | | | | 227,073 | | | | 15,829 | * | | | 456,034 | | | | (216,156 | ) | | | — | | | | (139,671 | ) | | | (355,827 | ) | | | 100,207 | | | | — | | | | 100,207 | |
HSBC Bank PLC | | | — | | | | — | | | | — | | | | — | | | | — | | | | — | | | | — | | | | — | | | | — | | | | — | | | | — | |
HSBC Securities, Inc. | | | — | | | | — | | | | — | | | | — | | | | — | | | | — | | | | — | | | | — | | | | — | | | | — | | | | — | |
JPMorgan Securities, Inc. | | | 51,482 | | | | 46,125 | | | | — | | | | 97,607 | | | | (322,171 | ) | | | — | | | | (216,657 | ) | | | (538,828 | ) | | | (441,221 | ) | | | 120,000 | | | | (321,221 | ) |
Merrill Lynch International Bank Ltd | | | — | | | | — | | | | — | | | | — | | | | (628 | ) | | | — | | | | — | | | | (628 | ) | | | (628 | ) | | | 628 | | | | — | |
Morgan Stanley & Co. International PLC | | | — | | | | 122,043 | | | | — | | | | 122,043 | | | | (92,544 | ) | | | — | | | | — | | | | (92,544 | ) | | | 29,499 | | | | (29,499 | ) | | | — | |
Morgan Stanley Capital Services, Inc. | | | 690,429 | | | | — | | | | — | | | | 690,429 | | | | — | | | | — | | | | (392,512 | ) | | | (392,512 | ) | | | 297,917 | | | | (10,000 | ) | | | 287,917 | |
Total | | $ | 1,054,976 | | | $ | 1,225,189 | | | $ | 1,516,946 | | | $ | 3,797,111 | | | $ | (1,465,398 | ) | | $ | (868,207 | ) | | $ | (805,276 | ) | | $ | (3,138,881 | ) | | $ | 658,230 | | | $ | 387,902 | | | $ | 1,046,132 | |
| * | | Includes Non-Deliverable Bond Forward Contracts assets of $15,829. |
| (1) | | Gross amounts available for offset but not netted in the Statement of Assets and Liabilities. |
| (2) | | Net amount represents the net amount due (to) from counterparty in the event of a default based on the contractual set-off rights under the agreement. Net amount excludes any over-collateralized amounts. |
66
GOLDMAN SACHS FIXED INCOME ALTERNATIVES FUNDS
|
| 5. AGREEMENTS AND AFFILIATED TRANSACTIONS |
A. Management Agreement — Under the Agreement, GSAM manages the Funds, subject to the general supervision of the Trustees.
As compensation for the services rendered pursuant to the Agreement, the assumption of the expenses related thereto and administration of the Funds’ business affairs, including providing facilities, GSAM is entitled to a management fee, accrued daily and paid monthly, equal to an annual percentage rate of each Fund’s average daily net assets.
For the six months ended September 30, 2015, contractual and effective net management fees with GSAM were at the following rates:
| | | | | | | | | | | | | | | | | | | | | | | | | | | | | | |
| | | | | Contractual Management Rate | | | Effective Net
Management
Rate^ | |
| Fund | | | | First $1 billion | | | Next $1 billion | | | Next $3 billion | | | Next $3 billion | | | Over $8 billion | | | Effective Rate | | |
Fixed Income Macro Strategies | | | | | 1.50 | % | | | 1.50 | % | | | 1.35 | % | | | 1.28 | % | | | 1.26 | % | | | 1.50 | % | | | 1.35 | %(a)* |
Long Short Credit Strategies | | | | | 1.00 | | | | 0.90 | | | | 0.86 | | | | 0.84 | | | | 0.82 | | | | 1.00 | | | | 1.00 | |
| ^ | | Effective Net Management Rate includes the impact of management fee waivers of affiliated underlying funds, if any, and any additional voluntary management fee waivers, if applicable. |
| * | | GSAM has agreed to waive a portion of it management fee in order to achieve the effective net management rate of 1.35% as an annual percentage rate of the average daily net assets of the Fund through at least July 29, 2016. Prior to such date GSAM may not terminate the arrangement without the approval of the Trustees. |
| (a) | | Reflects combined management fees paid to GSAM under the Agreement and the Subsidiary Agreement as defined below after waivers. |
The Fixed Income Macro Strategies and Long Short Credit Strategies Funds invest in the FST Shares of the Goldman Financial Square Government Fund, which is an affiliated Underlying Fund. GSAM has agreed to waive a portion of its management fee payable by the Funds in an amount equal to the management fee it earns as an investment adviser to any of the affiliated Underlying Funds in which the Funds invests. For the six months ended September 30, 2015, GSAM waived $1,508 and $18,135 of this Underlying Fund’s management fee for Fixed Income Macro Strategies Fund and Long Short Credit Strategies Fund, respectively.
GSAM also provides management services to the Subsidiary pursuant to a Subsidiary Management Agreement (the “Subsidiary Agreement”) and is entitled to a management fee accrued daily and paid monthly, equal to an annual percentage rate of 0.42% of the Subsidiary’s average daily net assets. In consideration of the Subsidiary’s management fee, and for as long as the Subsidiary Agreement remains in effect, GSAM has contractually agreed to waive irrevocably a portion of the Fixed Income Macro Strategies Fund’s management fee in an amount equal to the management fee paid to GSAM by the Subsidiary under the Subsidiary Agreement. For the six months ended September 30, 2015, GSAM waived $64,621 of the Fund’s management fee.
B. Distribution and Service Plans — The Trust, on behalf of each Fund, has adopted Distribution and Service Plans (the “Plans”). Under the Plans, Goldman Sachs, which serves as distributor (the “Distributor”), is entitled to a fee accrued daily and paid monthly, for distribution services and personal and account maintenance services, which may then be paid by Goldman Sachs to authorized dealers, at the following annual rates calculated on a Fund’s average daily net assets of each respective share class:
| | | | | | | | | | | | |
| | | Distribution and Service Plan Rates | |
| | | Class A* | | | Class C | | | Class R* | |
Distribution Plan | | | 0.25 | % | | | 0.75 | % | | | 0.50 | % |
Service Plan | | | — | | | | 0.25 | | | | — | |
| * | | With respect to Class A and Class R Shares, the Distributor at its discretion may use compensation for distribution services paid under the Distribution Plan to compensate service organizations for personal and account maintenance services and expenses as long as such total compensation does not exceed the maximum cap on “service fees” imposed by the Financial Industry Regulatory Authority. |
For the six months ended September 30, 2015, Goldman Sachs waived a portion of the distribution and service fees equal to 0.017% of the average daily net assets attributable to Class A Shares, 0.051% of the average daily net assets attributable to Class C Shares and 0.016% of the average daily net assets attributable to Class R Shares of the Fixed Income Macro Strategies Fund.
67
GOLDMAN SACHS FIXED INCOME ALTERNATIVES FUNDS
Notes to Financial Statements (continued)
September 30, 2015 (Unaudited)
|
| 5. AGREEMENTS AND AFFILIATED TRANSACTIONS (continued) |
C. Distribution Agreement — Goldman Sachs, as Distributor of the shares of the Funds pursuant to a Distribution Agreement, may retain a portion of the Class A front end sales charge and Class C Shares’ CDSC. During the six months ended September 30, 2015, Goldman Sachs advised that it retained $578 and $1,599 in front end sales charges for the Fixed Income Macro Strategies and the Long Short Credit Strategies Funds, respectively, and it did not retain any contingent deferred sales charges for either fund.
D. Transfer Agency Agreement — Goldman Sachs also serves as the transfer agent of the Funds for a fee pursuant to the Transfer Agency Agreement. The fees charged for such transfer agency services are accrued daily and paid monthly at annual rates as follows: 0.13% of the average daily net assets of Class A, Class C, Class IR and Class R Shares and 0.04% of the average daily net assets of Institutional Shares.
For the six months ended September 30, 2015, Goldman Sachs waived a portion of the transfer agency fees equal to 0.03% of the average daily net assets attributable to Class IR shares and equal to 0.02% of the average daily net assets of Institutional Shares of the Fixed Income Macro Strategies Fund.
E. Other Expense Agreements and Affiliated Transactions — GSAM has agreed to limit certain “Other Expenses” of the Funds (excluding acquired fund fees and expenses, transfer agency fees and expenses, taxes, interest, brokerage fees, shareholder meetings, litigation, indemnification and extraordinary expenses), to the extent such expenses exceed, on an annual basis of the average daily net assets of each fund. Such Other Expense reimbursements, if any, are accrued daily and paid monthly. In addition, the Funds are not obligated to reimburse GSAM for prior fiscal year expense reimbursements, if any. The Other Expense limitations as an annual percentage rate of average daily net assets for the Fixed Income Macro Strategies and Long Short Credit Strategies Funds are 0.064% and 0.094%, respectively. Prior to July 29, 2015, the Other Expense limitation for Long Short Credit Strategies was 0.204%. These Other Expense limitations will remain in place through at least July 29, 2016, and prior to such date GSAM may not terminate the arrangements without the approval of the Trustees. In addition, the Funds have entered into certain offset arrangements with the transfer agent, which may result in a reduction of the Funds’ expenses and are received irrespective of the application of the “Other Expense” limitations described above.
For the six months ended September 30, 2015, these expense reductions, including any fee waivers and Other Expense reimbursements, were as follows:
| | | | | | | | | | | | | | | | | | | | | | |
| | | | | Management
Fees Waivers | | | Distribution
and Service
Fees | | | Transfer Agency Fees | | | Other Expense
Reimbursements | | | Total Expense Reductions | |
Fixed Income Macro Strategies | | | | $ | 53,982 | | | $ | 929 | | | $ | 6,870 | | | $ | 406,310 | | | $ | 468,091 | |
Long Short Credit Strategies | | | | | 18,135 | | | | — | | | | — | | | | — | | | | 18,135 | |
F. Line of Credit Facility — As of September 30, 2015, the Funds participated in a $1,205,000,000 committed, unsecured revolving line of credit facility (the “facility”) together with other funds of the Trust and registered investment companies having management agreements with GSAM or its affiliates (“Other Borrowers”). Pursuant to the terms of the facility, the Funds and Other Borrowers could increase the credit amount by up to an additional $115,000,000, for a total of up to $1,320,000,000. This facility is to be used for temporary emergency purposes, or to allow for an orderly liquidation of securities to meet redemption requests. The interest rate on borrowings is based on the federal funds rate. The facility also requires a fee to be paid by the Funds based on the amount of the commitment that has not been utilized. For the six months ended September 30, 2015, the Funds did not have any borrowings under the facility.
68
GOLDMAN SACHS FIXED INCOME ALTERNATIVES FUNDS
|
| 5. AGREEMENTS AND AFFILIATED TRANSACTIONS (continued) |
G. Other Transactions with Affiliates — At September 30, 2015, the Goldman Sachs Group, Inc. (“GSG”) was the beneficial owner of approximately 5% or more of the following outstanding shares of the Funds:
| | | | | | | | | | | | | | |
| Fund | | | | Class C | | | Institutional | | | Class R | |
Fixed Income Macro Strategies | | | | | 5 | % | | | 32 | % | | | 100 | % |
Long Short Credit Strategies | | | | | — | | | | — | | | | 73 | |
The following table provides information about the investment in the shares of an issuer deemed to be an affiliate of the Long Short Credit Strategies Fund for the six months ended September 30, 2015:
| | | | | | | | | | | | | | |
| Name of Affiliated Issuer | | | | Market Value
3/31/2015 | | | Net Change
in Unrealized
Gain (loss) | | | Market Value 9/30/15 | |
Lone Pine Resources CDA, Ltd. — Common Stocks | | | | $ | 59,152 | | | $ | (59,150 | ) | | $ | 2 | |
Lone Pine Resources CDA, Ltd. — Preferred Stocks | | | | | 1,587,835 | | | | (257,490 | ) | | | 1,330,345 | |
The Fixed Income Macro Strategies Fund and Long Short Credit Strategies Fund invest in the FST Shares of the Goldman Sachs Financial Square Government Fund. This Underlying Fund is considered to be affiliated with the Funds. The table below shows the transactions in and earnings from investments in this affiliated Fund for September 30, 2015:
| | | | | | | | | | | | | | | | | | | | | | |
| Fund | | Underlying Fund | | Market Value 3/31/15 | | | Purchases at Cost | | | Proceeds from Sales | | | Market Value 9/30/15 | | | Dividend Income | |
Fixed Income Macro Strategies | | Goldman Sachs Financial Square Government Fund | | $ | — | | | $ | 12,959,515 | | | $ | (963,165 | ) | | $ | 11,996,350 | | | $ | 299 | |
Long Short Credit Strategies | | Goldman Sachs Financial Square Government Fund | | $ | 11,250,687 | | | $ | 94,062,932 | | | $ | (78,744,030 | ) | | $ | 26,569,589 | | | $ | 1,417 | |
| | |
| 6. PORTFOLIO SECURITIES TRANSACTIONS | | |
The cost of purchases and proceeds from sales and maturities of long-term securities for the six months ended September 30, 2015 were as follows:
| | | | | | | | | | | | | | | | | | |
| Fund | | | | Purchases of
U.S. Government and
Agency Obligations | | | Purchased (Excluding
U.S. Government and
Agency Obligations) | | | Sales and Maturities of
U.S. Government and
Agency Obligations | | | Sales and
Maturities (Excluding
U.S. Government and
Agency Obligations) | |
Fixed Income Macro Strategies | | | | $ | 69,120,438 | | | $ | 23,318,592 | | | $ | 71,295,584 | | | $ | 25,474,370 | |
Long Short Credit Strategies | | | | | — | | | | 165,914,540 | | | | — | | | | 167,760,226 | |
69
GOLDMAN SACHS FIXED INCOME ALTERNATIVES FUNDS
Notes to Financial Statements (continued)
September 30, 2015 (Unaudited)
As of the Funds’ most recent fiscal year ended March 31, 2015, the Funds’ capital loss carryforwards and timing differences, on tax basis were as follows:
| | | | | | | | |
| | | Fixed Income Macro Strategies | | | Long Short Credit Strategies | |
Capital loss carryforwards: | | | | | | | | |
Perpetual Short-Term | | $ | (2,097,898 | ) | | $ | (1,252,964 | ) |
Perpetual Long-Term | | | (1,335,024 | ) | | | (123,149 | ) |
Total capital loss carryforwards | | $ | (3,432,922 | ) | | $ | (1,376,113 | ) |
Timing differences (Post October Loss Deferral, Dividend Payable and Straddle Loss Deferral) | | $ | (3,706,932 | ) | | $ | (10,721,283 | ) |
As of September 30, 2015, the Funds’ aggregate security unrealized gains and losses based on cost for U.S. federal income tax purposes were as follows:
| | | | | | | | |
| | | Fixed Income
MacroStrategies | | | Long Short Credit Strategies | |
Tax Cost | | $ | 70,072,665 | | | $ | 201,635,926 | |
Gross unrealized gain | | | 683,265 | | | | 750,056 | |
Gross unrealized loss | | | (1,627,939 | ) | | | (9,199,768 | ) |
Net unrealized gains (losses) | | $ | (944,674 | ) | | $ | (8,449,712 | ) |
The difference between GAAP-basis and tax-basis unrealized gains (losses) is attributable primarily to wash sales, net mark to market gains/(losses) on regulated futures, foreign currency contracts and options contracts, and differences in the tax treatment of underlying fund investments and swap transactions.
GSAM has reviewed the Funds’ tax positions for all open tax years (the current year, as applicable) and has concluded that no provision for income tax is required in the Funds’ financial statements. Such open tax years remain subject to examination and adjustment by tax authorities.
The Funds’ risks include, but are not limited to, the following:
Foreign Custody Risk — A Fund that invests in foreign securities may hold such securities and cash with foreign banks, agents, and securities depositories appointed by the Fund’s custodian (each a “Foreign Custodian”). Some foreign custodians may be recently organized or new to the foreign custody business. In some countries, Foreign Custodians may be subject to little or no regulatory oversight over, or independent evaluation of, their operations. Further, the laws of certain countries may place limitations on a Fund’s ability to recover its assets if a Foreign Custodian enters bankruptcy.
Investments in Other Investment Companies — As a shareholder of another investment company, a Fund will directly bear its proportionate share of any net management fees and other expenses paid by such other investment companies, in addition to the fees and expenses regularly borne by the Fund.
Interest Rate Risk — When interest rates increase, fixed income securities or instruments held by the Fund will generally decline in value. Long-term fixed income securities or instruments will normally have more price volatility because of this risk than short-term fixed income securities or instruments.
70
GOLDMAN SACHS FIXED INCOME ALTERNATIVES FUNDS
|
| 8. OTHER RISKS (continued) |
Large Shareholder Transactions Risk — A Fund may experience adverse effects when certain large shareholders, such as other funds, institutional investors (including those trading by use of non-discretionary mathematical formulas), financial intermediaries (who may make investment decisions on behalf of underlying clients and/or include a Fund in their investment model), individuals, accounts and Goldman Sachs affiliates, purchase or redeem large amounts of shares of a Fund. Such large shareholder redemptions may cause the Fund to sell portfolio securities at times when it would not otherwise do so, which may negatively impact a Fund’s NAV and liquidity. These transactions may also accelerate the realization of taxable income to shareholders if such sales of investments resulted in gains, and may also increase transaction costs. In addition, a large redemption could result in a Fund’s current expenses being allocated over a smaller asset base, leading to an increase in the Fund’s expense ratio. Similarly, large Fund share purchases may adversely affect a Fund’s performance to the extent that a Fund is delayed in investing new cash and, as a result, maintains a larger cash position than it ordinarily would.
Leverage Risk — Leverage creates exposure to potential gains and losses in excess of the initial amount invested. Borrowings and the use of derivatives may result in leverage and may make the Funds more volatile. When the Funds use leverage, the sum of each Fund’s investment exposure may significantly exceed the amount of assets invested in each Fund, although these exposures may vary over time. Relatively small market movements may result in large changes in the value of a leveraged investment. Each Fund will identify liquid assets on its books or otherwise cover transactions that may give rise to such risk, to the extent required by applicable law. The use of leverage may cause the Funds to liquidate portfolio positions to satisfy their obligations or to meet segregation requirements when it may not be advantageous to do so. The use of leverage by each Fund can substantially increase the adverse impact to which each Fund’s investment portfolio may be subject.
Liquidity Risk — The Funds may make investments that are illiquid or that may become less liquid in response to market developments or adverse investor perceptions. Illiquid investments may be more difficult to value. Liquidity risk may also refer to the risk that a Fund will not be able to pay redemption proceeds within the allowable time period because of unusual market conditions, an unusually high volume of redemption requests, or other reasons. To meet redemption requests, a Fund may be forced to sell investments at an unfavorable time and/or under unfavorable conditions. Liquidity risk may be the result of, among other things, the reduced number and capacity of traditional market participants to make a market in fixed income securities or the lack of an active market. The potential for liquidity risk may be magnified by a rising interest rate environment or other circumstances where investor redemptions from fixed income mutual funds may be higher than normal, potentially causing increased supply in the market due to selling activity.
Market and Credit Risks — In the normal course of business, the Funds trade financial instruments and enter into financial transactions where risk of potential loss exists due to changes in the market (market risk). Additionally, the Funds may also be exposed to credit risk in the event that an issuer or guarantor fails to perform or that an institution or entity with which the Funds have unsettled or open transactions defaults.
Investing in foreign markets may involve special risks and considerations not typically associated with investing in the U.S. Foreign securities may be subject to risk of loss because of more or less foreign government regulation, less public information and less economic, political and social stability in the countries in which the Funds invest. Loss may also result from the imposition of exchange controls, confiscations and other government restrictions by the United States or other governments, or from problems in registration, settlement or custody. Foreign risk also involves the risk of negative foreign currency rate fluctuations, which may cause the value of securities denominated in such foreign currency (or other instruments through which the Funds have exposure to foreign currencies) to decline in value. Currency exchange rates may fluctuate significantly over short periods of time. To the extent that the Funds also invest in securities of issuers located in emerging markets, these risks may be more pronounced.
Non-Diversification Risk — The Funds are non-diversified, meaning that they are permitted to invest a larger percentage of their assets in fewer issuers than diversified mutual funds. Thus, a Fund may be more susceptible to adverse developments affecting any single issuer held in its portfolio, and may be more susceptible to greater losses because of these developments.
Tax Risk — The Fixed Income Macro Strategies Fund will seek to gain exposure to the commodity markets primarily through investments in the Subsidiary and/or commodity index-linked structured notes. Historically, the Internal Revenue Service (“IRS”)
71
GOLDMAN SACHS FIXED INCOME ALTERNATIVES FUNDS
Notes to Financial Statements (continued)
September 30, 2015 (Unaudited)
|
| 8. OTHER RISKS (continued) |
issued private letter rulings (“PLRs”) in which the IRS specifically concluded that income and gains from investments in commodity index-linked structured notes or a wholly-owned foreign subsidiary that invests in commodity-linked instruments are “qualifying income” for purposes of compliance with Subchapter M of the Code. However, the Fund has not received a PLR, and is not able to rely on PLRs issues to other taxpayers. Additionally, the IRS has suspended the granting of such PLRs, pending review of its position on this matter. In light of this, the Fixed Income Macro Strategies Fund has obtained an opinion of counsel that the Fund’s income from such investments should constitute “qualifying income.” However, no assurances can be provided that the IRS would not be able to successfully assert that the Fund’s income from such investments was not “qualifying income”, in which case the Fund would fail to qualify as regulated investment company (“RIC”) under Subchapter M of the Code if over 10% of its gross income was derived from these investments. If the Fund failed to qualify as a RIC, it would be subject to federal and state income tax on all of its taxable income at regular corporate tax rates. This would significantly adversely affect the returns to, and could cause substantial losses for, Fund shareholders.
Under the Trust’s organizational documents, its Trustees, officers, employees and agents are indemnified, to the extent permitted by the Act and state law, against certain liabilities that may arise out of performance of their duties to the Funds. Additionally, in the course of business, the Funds enter into contracts that contain a variety of indemnification clauses. The Funds’ maximum exposure under these arrangements is unknown, as this would involve future claims that may be made against the Funds that have not yet occurred. However, GSAM believes the risk of loss under these arrangements to be remote.
Supplement Regarding the Goldman Sachs Fixed Income Macro Strategies Fund — At a meeting held on October 14-15, 2015, the Trustees approved certain enhancements to the Fixed Income Macro Strategies Fund’s (the “Fund”) investment strategies, consistent with its investment objective to seek to generate long-term absolute return, through the implementation of relative value, macro and other strategies that aim to exploit disparities or inefficiencies in the global fixed income, currency and commodities markets. As part of these enhancements, the Fund uses a long/short approach to invest in certain fixed income securities. The changes took effect on November 20, 2015.
Subsequent events after the Statements of Assets and Liabilities date have been evaluated through the date the financial statements were issued. Other than items previously discussed, GSAM has concluded that there is no impact requiring adjustment or disclosure in the financial statements.
72
GOLDMAN SACHS FIXED INCOME ALTERNATIVES FUNDS
|
| 11. SUMMARY OF SHARE TRANSACTIONS |
Share activity is as follows:
| | | | | | | | | | | | | | | | |
| | | Fixed Income Macro Strategies Fund | |
| | | | |
| | | For the Six Months Ended September 30, 2015 (Unaudited) | | | For the Fiscal Year Ended March 31, 2015
| |
| | | | |
| | | Shares | | | Dollars | | | Shares | | | Dollars | |
| | | | |
| Class A Shares | | | | | | | | | | | | | | | | |
Shares sold | | | 12,980 | | | $ | 121,167 | | | | 336,237 | | | $ | 3,087,797 | |
Reinvestment of distributions | | | 25 | | | | 230 | | | | 208 | | | | 1,883 | |
Shares redeemed | | | (274,392 | ) | | | (2,477,071 | ) | | | (54,613 | ) | | | (494,518 | ) |
| | | | (261,387 | ) | | | (2,355,674 | ) | | | 281,832 | | | | 2,595,162 | |
| Class C Shares | | | | | | | | | | | | | | | | |
Shares sold | | | 11,519 | | | | 105,398 | | | | 39,295 | | | | 356,698 | |
Reinvestment of distributions | | | 11 | | | | 104 | | | | 14 | | | | 129 | |
Shares redeemed | | | (31,152 | ) | | | (285,952 | ) | | | (1,902 | ) | | | (17,269 | ) |
| | | | (19,622 | ) | | | (180,450 | ) | | | 37,407 | | | | 339,558 | |
| Institutional Shares | | | | | | | | | | | | | | | | |
Shares sold | | | 662,786 | | | | 6,101,161 | | | | 3,814,149 | | | | 37,384,501 | |
Reinvestment of distributions | | | 15,254 | | | | 140,963 | | | | 25,207 | | | | 235,132 | |
Shares redeemed | | | (1,536,725 | ) | | | (13,949,206 | ) | | | (5,991,769 | ) | | | (56,745,429 | ) |
| | | | (858,685 | ) | | | (7,707,082 | ) | | | (2,152,413 | ) | | | (19,125,796 | ) |
| Class IR Shares | | | | | | | | | | | | | | | | |
Shares sold | | | 99,430 | | | | 913,252 | | | | 543,071 | | | | 5,209,448 | |
Reinvestment of distributions | | | 872 | | | | 8,056 | | | | 817 | | | | 7,529 | |
Shares redeemed | | | (110,740 | ) | | | (1,019,862 | ) | | | (114,985 | ) | | | (1,075,798 | ) |
| | | | (10,438 | ) | | | (98,554 | ) | | | 428,903 | | | | 4,141,179 | |
| Class R Shares | | | | | | | | | | | | | | | | |
Reinvestment of distributions | | | 2 | | | | 20 | | | | 3 | | | | 27 | |
| | | | 2 | | | | 20 | | | | 3 | | | | 27 | |
NET DECREASE | | | (1,150,130 | ) | | $ | (10,341,740 | ) | | | (1,404,268 | ) | | $ | (12,049,870 | ) |
73
GOLDMAN SACHS FIXED INCOME ALTERNATIVES FUNDS
Notes to Financial Statements (continued)
September 30, 2015 (Unaudited)
|
| 11. SUMMARY OF SHARE TRANSACTIONS (continued) |
Share activity is as follows:
| | | | | | | | | | | | | | | | |
| | | Long Short Credit Strategies Fund | |
| | | | |
| | | For the Six Months Ended September 30, 2015 (Unaudited) | | | For the Fiscal Year Ended March 31, 2015 | |
| | | | |
| | | Shares | | | Dollars | | | Shares | | | Dollars | |
| | | | |
| Class A Shares(a) | | | | | | | | | | | | | | | | |
Shares sold | | | 377,816 | | | $ | 3,710,280 | | | | 1,384,039 | | | $ | 14,242,762 | |
Reinvestment of distributions | | | 9,031 | | | | 88,018 | | | | 23,611 | | | | 231,696 | |
Shares redeemed | | | (146,556 | ) | | | (1,432,352 | ) | | | (698,285 | ) | | | (7,048,423 | ) |
| | | | 240,291 | | | | 2,365,946 | | | | 709,365 | | | | 7,426,035 | |
| Class C Shares(a) | | | | | | | | | | | | | | | | |
Shares sold | | | 45,554 | | | | 445,552 | | | | 106,163 | | | | 1,096,805 | |
Reinvestment of distributions | | | 801 | | | | 7,796 | | | | 2,789 | | | | 27,283 | |
Shares redeemed | | | (10,354 | ) | | | (101,320 | ) | | | (5,118 | ) | | | (50,095 | ) |
| | | | 36,001 | | | | 352,028 | | | | 103,834 | | | | 1,073,993 | |
| Institutional Shares | | | | | | | | | | | | | | | | |
Shares sold | | | 3,697,154 | | | | 36,142,959 | | | | 10,597,097 | | | | 109,192,487 | |
Reinvestment of distributions | | | 199,506 | | | | 1,946,237 | | | | 985,024 | | | | 9,865,895 | |
Shares redeemed | | | (4,195,062 | ) | | | (41,036,158 | ) | | | (24,047,921 | ) | | | (244,786,078 | ) |
| | | | (298,402 | ) | | | (2,946,962 | ) | | | (12,465,800 | ) | | | (125,727,696 | ) |
| Class IR Shares(a) | | | | | | | | | | | | | | | | |
Shares sold | | | 209,325 | | | | 2,041,975 | | | | 271,680 | | | | 2,772,337 | |
Reinvestment of distributions | | | 3,356 | | | | 32,719 | | | | 7,346 | | | | 71,932 | |
Shares redeemed | | | (63,852 | ) | | | (625,360 | ) | | | (26,124 | ) | | | (266,143 | ) |
| | | | 148,829 | | | | 1,449,334 | | | | 252,902 | | | | 2,578,126 | |
| Class R Shares(a) | | | | | | | | | | | | | | | | |
Shares sold | | | 103 | | | | 1,010 | | | | 3,224 | | | | 33,292 | |
Reinvestment of distributions | | | 31 | | | | 299 | | | | 102 | | | | 1,010 | |
Shares redeemed | | | — | | | | — | | | | (38 | ) | | | (377 | ) |
| | | | 134 | | | | 1,309 | | | | 3,288 | | | | 33,925 | |
NET INCREASE (DECREASE) | | | 126,853 | | | $ | 1,221,655 | | | | (11,396,411 | ) | | $ | (114,615,617 | ) |
| (a) | | Commenced operations on April 30, 2014. |
74
GOLDMAN SACHS FIXED INCOME ALTERNATIVES FUNDS
| | |
Fund Expenses — Six Month Period Ended September 30, 2015 (Unaudited) | | |
As a shareholder of Class A, Class C, Institutional, Service, Class IR or Class R Shares of a Fund, you incur two types of costs: (1) transaction costs, including sales charges on purchase payments (with respect to Class A Shares), contingent deferred sales charges on redemptions (with respect to Class C Shares), and (2) ongoing costs, including management fees; distribution and service (12b-1) fees (with respect to Class A and Class R Shares); and other Fund expenses. This Example is intended to help you understand your ongoing costs (in dollars) of investing in Class A, Class C, Institutional, Service, Class IR or Class R Shares of the Funds and to compare these costs with the ongoing costs of investing in other mutual funds.
The Example is based on an investment of $1,000 invested at the beginning of the period and held for the entire period from April 1, 2015 through September 30, 2015, which represents a period of 183 days in a 366-day year.
Actual Expenses — The first line under each share class in the table below provides information about actual account values and actual expenses. You may use the information in this line, together with the amount you invested, to estimate the expenses that you paid over the period. Simply divide your account value by $1,000 (for example, an $8,600 account value divided by $1,000=8.6), then multiply the result by the number in the first line under the heading entitled “Expenses Paid” to estimate the expenses you paid on your account during this period.
Hypothetical Example for Comparison Purposes — The second line under each share class in the table below provides information about hypothetical account values and hypothetical expenses based on the Funds’ actual net expense ratios and an assumed rate of return of 5% per year before expenses, which is not the Funds’ actual return. The hypothetical account values and expenses may not be used to estimate the actual ending account balance or expenses you paid for the period. You may use this information to compare the ongoing costs of investing in the Funds and other funds. To do so, compare this 5% hypothetical example with the 5% hypothetical examples that appear in the shareholder reports of the other funds.
Please note that the expenses shown in the table are meant to highlight your ongoing costs only and do not reflect any transactional costs, such as sales charges, redemption fees, or exchange fees. Therefore, the second line of the table is useful in comparing ongoing costs only, and will not help you determine the relative total costs of owning different funds. In addition, if these transactional costs were included, your costs would have been higher.
| | | | | | | | | | | | | | | | | | | | | | | | |
| | | Fixed Income Macro Strategies Fund | | | Long Short Credit Strategies Fund | |
| Share Class | | Beginning
Account Value
4/1/15 | | | Ending
Account Value
9/30/15 | | | Expenses
Paid for the
6 months
ended
9/30/15* | | | Beginning
Account Value
4/1/15 | | | Ending
Account Value
9/30/15 | | | Expenses
Paid for the
6 months
ended
9/30/15* | |
| Class A | | | | | | | | | | | | | | | | | | | | | | | | |
Actual | | $ | 1,000.00 | | | $ | 1,033.60 | | | $ | 9.81 | | | $ | 1,000.00 | | | $ | 984.70 | | | $ | 7.39 | |
Hypothetical 5% return | | | 1,000.00 | | | | 1,015.35 | + | | | 9.72 | | | | 1,000.00 | | | | 1,017.55 | + | | | 7.52 | |
| Class C | | | | | | | | | | | | | | | | | | | | | | | | |
Actual | | | 1,000.00 | | | | 1,030.30 | | | | 10.35 | | | | 1,000.00 | | | | 981.00 | | | | 11.04 | |
Hypothetical 5% return | | | 1,000.00 | | | | 1,014.80 | + | | | 10.28 | | | | 1,000.00 | | | | 1,013.85 | + | | | 11.23 | |
| Institutional | | | | | | | | | | | | | | | | | | | | | | | | |
Actual | | | 1,000.00 | | | | 1,034.30 | | | | 7.37 | | | | 1,000.00 | | | | 987.40 | | | | 5.71 | |
Hypothetical 5% return | | | 1,000.00 | | | | 1,017.75 | + | | | 7.31 | | | | 1,000.00 | | | | 1,019.25 | + | | | 5.81 | |
| Class IR | | | | | | | | | | | | | | | | | | | | | | | | |
Actual | | | 1,000.00 | | | | 1,033.00 | | | | 7.73 | | | | 1,000.00 | | | | 985.90 | | | | 6.06 | |
Hypothetical 5% return | | | 1,000.00 | | | | 1,017.40 | + | | | 7.67 | | | | 1,000.00 | | | | 1,018.90 | + | | | 6.16 | |
| Class R | | | | | | | | | | | | | | | | | | | | | | | | |
Actual | | | 1,000.00 | | | | 1,030.80 | | | | 9.60 | | | | 1,000.00 | | | | 984.40 | | | | 8.68 | |
Hypothetical 5% return | | | 1,000.00 | | | | 1,015.55 | + | | | 9.52 | | | | 1,000.00 | | | | 1,016.25 | + | | | 8.82 | |
| | * | | Expenses for each share class are calculated using each Fund’s annualized net expense ratio for each class, which represents the ongoing expenses as a percentage of net assets for the six months ended September 30, 2015. Expenses are calculated by multiplying the annualized net expense ratio by the average account value for the period; then multiplying the result by the number of days in the most recent fiscal half year; and then dividing that result by the number of days in the fiscal year. The annualized net expense ratios for the period were as follows: | |
| | | | | | | | | | | | | | | | | | | | |
| Fund | | Class A | | | Class C | | | Institutional | | | Class IR | | | Class R | |
Fixed Income Macro Strategies | | | 1.93 | % | | | 2.04 | % | | | 1.45 | % | | | 1.52 | % | | | 1.89 | % |
Long Short Credit Strategies | | | 1.49 | | | | 2.23 | | | | 1.15 | | | | 1.22 | | | | 1.75 | |
| | + | | Hypothetical expenses are based on each Fund’s actual annualized net expense ratios and an assumed rate of return of 5% per year before expenses. | |
75
GOLDMAN SACHS FIXED INCOME ALTERNATIVES FUNDS
Statement Regarding Basis for Approval of Management Agreement (Unaudited)
Background
The Goldman Sachs Fixed Income Macro Strategies Fund and Goldman Sachs Long Short Credit Strategies Fund (the “Funds”) are investment portfolios of Goldman Sachs Trust (the “Trust”). The Board of Trustees oversees the management of the Trust and reviews the investment performance and expenses of the Funds at regularly scheduled meetings held throughout the year. In addition, the Board of Trustees determines annually whether to approve the continuance of the Trust’s investment management agreement (the “Management Agreement”) with Goldman Sachs Asset Management, L.P. (the “Investment Adviser”) on behalf of the Funds.
The Management Agreement was most recently approved for continuation until June 30, 2016 by the Board of Trustees, including those Trustees who are not parties to the Management Agreement or “interested persons” (as defined in the Investment Company Act of 1940, as amended) of any party thereto (the “Independent Trustees”), at a meeting held on June 10-11, 2015 (the “Annual Meeting”).
The review process undertaken by the Trustees spans the course of the year and culminates with the Annual Meeting. To assist the Trustees in their deliberations, the Trustees have established a Contract Review Committee (the “Committee”), comprised of the Independent Trustees. The Committee held three meetings over the course of the year since the Management Agreement was last approved. At those Committee meetings, regularly scheduled Board or other committee meetings, and/or the Annual Meeting, matters relevant to the renewal of the Management Agreement were considered by the Board, or the Independent Trustees, as applicable. Such matters included:
| | (a) | | the nature and quality of the advisory, administrative, and other services provided to the Funds by the Investment Adviser and its affiliates, including information about: |
| | (i) | | the structure, staff, and capabilities of the Investment Adviser and its portfolio management teams; |
| | (ii) | | the groups within the Investment Adviser and its affiliates that support the portfolio management teams or provide other types of necessary services, including fund services groups (e.g., accounting and financial reporting, tax, shareholder services and operations); controls and risk management groups (e.g., legal, compliance, valuation oversight, credit risk management, internal audit, compliance testing, market risk analysis, finance and strategy and central funding); sales and distribution support groups and others (e.g., information technology and training); |
| | (iii) | | trends in employee headcount; |
| | (iv) | | the Investment Adviser’s financial resources and ability to hire and retain talented personnel and strengthen its operations; and |
| | (v) | | the parent company’s support of the Investment Adviser and its mutual fund business, as expressed by the firm’s senior management; |
| | (b) | | information on the investment performance of each Fund, including comparisons to the performance of similar mutual funds, as provided by a third-party mutual fund data provider engaged as part of the contract review process (the “Outside Data Provider”), and benchmark performance indices, and general investment outlooks in the markets in which the Funds invest; |
| | (c) | | information provided by the Investment Adviser indicating the Investment Adviser’s views on whether a Fund’s peer group and/or benchmark index had high, medium, or low relevance given the Fund’s particular investment strategy; |
| | (d) | | the terms of the Management Agreement and other agreements with affiliated service providers entered into by the Trust on behalf of the Funds; |
| | (e) | | fee and expense information for the Funds, including: |
| | (i) | | the relative management fee and expense levels of each Fund as compared to those of comparable funds managed by other advisers, as provided by the Outside Data Provider; and |
| | (ii) | | the expense trends of each Fund; |
| | (f) | | with respect to the investment performance and expense comparison data provided by the Outside Data Provider, its processes in producing that data for the Funds; |
| | (g) | | the undertakings of the Investment Adviser to waive a portion of its management fees (with respect to the Fixed Income Macro Strategies Fund) and to limit certain expenses of each Fund that exceed specified levels; |
| | (h) | | information relating to the profitability of the Management Agreement and the transfer agency and distribution and service arrangements of each Fund and the Trust as a whole to the Investment Adviser and its affiliates; |
| | (i) | | whether each Fund’s existing management fee schedule adequately addressed any economies of scale; |
| | (j) | | a summary of the “fall-out” benefits derived by the Investment Adviser and its affiliates from their relationships with the Funds, including the fees received by the Investment Adviser’s affiliates from the Funds for transfer agency, portfolio trading, distribution and other services; |
76
GOLDMAN SACHS FIXED INCOME ALTERNATIVES FUNDS
Statement Regarding Basis for Approval of Management Agreement (Unaudited) (continued)
| | (k) | | a summary of potential benefits derived by the Funds as a result of their relationship with the Investment Adviser; |
| | (l) | | information regarding portfolio trading and how the Investment Adviser carries out its duty to seek best execution; |
| | (m) | | portfolio manager ownership of Fund shares; the manner in which portfolio manager compensation is determined; and the number and types of accounts managed by the portfolio managers; |
| | (n) | | the nature and quality of the services provided to the Funds by their unaffiliated service providers, and the Investment Adviser’s general oversight and evaluation (including reports on due diligence) of those service providers as part of the administration services provided under the Management Agreement; and |
| | (o) | | the Investment Adviser’s processes and policies addressing various types of potential conflicts of interest; its approach to risk management; the annual review of the effectiveness of the Funds’ compliance program; and periodic compliance reports. |
The Trustees also received an overview of the Funds’ distribution arrangements. They received information regarding the Funds’ assets, share purchase and redemption activity and the payment of Rule 12b-1 distribution and service fees and non-Rule 12b-1 shareholder service and/or administration fees with respect to the Funds. Information was also provided to the Trustees relating to revenue sharing payments made by and services provided by the Investment Adviser and its affiliates to intermediaries that promote the sale, distribution, and/or servicing of Fund shares.
The presentations made at the Board and Committee meetings and at the Annual Meeting encompassed the Funds and other mutual fund portfolios for which the Board of Trustees has responsibility. In evaluating the Management Agreement at the Annual Meeting, the Trustees relied upon their knowledge, resulting from their meetings and other interactions throughout the year, of the Investment Adviser and its affiliates, their services, and the Funds. In conjunction with these meetings, the Trustees received written materials and oral presentations on the topics covered, and were advised by their independent legal counsel regarding their responsibilities and other regulatory requirements related to the approval and continuation of mutual fund investment management agreements under applicable law. In addition, the Investment Adviser and its affiliates provided the Independent Trustees with a written response to a formal request for information sent on behalf of the Independent Trustees by their independent legal counsel. During the course of their deliberations, the Independent Trustees met in executive sessions with their independent legal counsel, without representatives of the Investment Adviser or its affiliates present. The Independent Trustees also discussed the broad range of other investment choices that are available to Fund investors, including the availability of comparable funds managed by other advisers.
Nature, Extent, and Quality of the Services Provided Under the Management Agreement
As part of their review, the Trustees considered the nature, extent, and quality of the services provided to the Funds by the Investment Adviser. In this regard, the Trustees considered both the investment advisory services and non-advisory services that are provided by the Investment Adviser and its affiliates. The Trustees noted the transition in the leadership and changes in personnel of various of the Investment Adviser’s portfolio management teams that had occurred in recent periods, and the ongoing recruitment efforts aimed at bringing high quality investment talent to the Investment Adviser. They also noted the Investment Adviser’s commitment to maintaining high quality systems. The Trustees concluded that the Investment Adviser continued to commit substantial financial and operational resources to the Funds and expressed confidence that the Investment Adviser would continue to do so in the future. The Trustees also recognized that the Investment Adviser had made significant commitments to address regulatory compliance requirements applicable to the Funds and the Investment Adviser.
Investment Performance
The Trustees also considered the investment performance of the Funds. In this regard, they compared the investment performance of each Fund to its peers using rankings and ratings (rankings only with respect to the Fixed Income Macro Strategies Fund) compiled by the Outside Data Provider as of December 31, 2014, and updated performance information prepared by the Investment Adviser using the peer groups identified by the Outside Data Provider as of March 31, 2015. The information on each Fund’s investment performance was provided for the one-, three-, and five-year periods ending on the applicable dates, to the extent that each Fund had been in existence for those periods. The Trustees also reviewed each Fund’s investment performance relative to its performance benchmark. As part of this review, they considered the investment performance of each Fund in light of its investment objective and policies and market conditions.
In addition, the Trustees considered materials prepared and presentations made by the Investment Adviser’s senior management and portfolio management personnel, in which Fund performance was assessed. The Trustees also considered the Investment Adviser’s periodic reports with respect to the Funds’ risk profiles, and how the Investment Adviser’s approach to risk monitoring and management influences portfolio management.
77
GOLDMAN SACHS FIXED INCOME ALTERNATIVES FUNDS
Statement Regarding Basis for Approval of Management Agreement (Unaudited) (continued)
The Trustees observed that the Fixed Income Macro Strategies Fund’s Institutional Shares had placed in the fourth quartile of the Fund’s peer group, had underperformed the Fund’s LIBOR-based benchmark index by 8.14%, and had underperformed the average performance of a group of competitor funds, as determined by the Investment Adviser (the “Competitor Fund Average”), for the one-year period ended March 31, 2015. They considered that the Long Short Credit Strategies Fund launched in April 2014 in connection with the reorganization of the Goldman Sachs Credit Strategies Fund (the “Predecessor Fund”), a closed-end interval fund, with and into the Fund. The Trustees noted that the Investment Adviser had been managing the Predecessor Fund, and that the Long Short Credit Strategies Fund, like the Predecessor Fund, invested primary in credit-related investments. They also considered that the performance of the Long Short Credit Strategies Fund included the performance of the Predecessor Fund, although they noted that the Fund implements a long/short credit strategy, while the Predecessor Fund implemented a long-only credit strategy. The Trustees noted that the Long Short Credit Strategies Fund’s Institutional Shares had placed in the top half of the Fund’s peer group for the three- and five-year periods and the fourth quartile for the one-year period; had outperformed the Fund’s LIBOR-based benchmark index by 3.17% and 4.69%, respectively, for the three- and five-year periods and underperformed by 3.02% for the one-year period; and had outperformed the Fund’s Competitor Fund Average for the three- and five-year periods and underperformed for the one-year period ended March 31, 2015.
Costs of Services Provided and Competitive Information
The Trustees considered the contractual terms of the Management Agreement and the fee rates payable by each Fund thereunder. In this regard, the Trustees considered information on the services rendered by the Investment Adviser to the Funds, which included both advisory and administrative services that were directed to the needs and operations of the Funds as registered mutual funds.
In particular, the Trustees reviewed analyses prepared by the Outside Data Provider regarding the expense rankings of the Funds. The analyses provided a comparison of the Funds’ management fees and breakpoints to those of relevant peer groups and category universes; an expense analysis which compared each Fund’s overall net and gross expenses to a peer group and a category universe; and a five-year history (or, in the case of Funds that commenced investment operations within a shorter period, since the year in which it commenced operations) comparing each Fund’s net expenses to the peer and category medians. The analyses also compared each Fund’s transfer agency, custody, and distribution fees, other expenses and fee waivers/reimbursements to those of the peer group and category medians. The Trustees concluded that the comparisons provided by the Outside Data Provider were useful in evaluating the reasonableness of the management fees and total expenses paid by the Funds.
In addition, the Trustees considered the Investment Adviser’s undertakings to waive a portion of its management fees (with respect to the Fixed Income Macro Strategies Fund) and to limit certain expenses of each Fund that exceed specified levels. With respect to the Fixed Income Macro Strategies Fund, the Trustees noted that the Investment Adviser had agreed to waive a portion of its management fee in an amount equal to the entire management fee paid to the Investment Adviser as the investment adviser to the Fund’s wholly-owned subsidiary. The Trustees also noted that certain changes were being made to existing fee waiver or expense limitation arrangements of the Long Short Credit Strategies Fund that would have the effect of lowering total Fund expenses, with such changes taking effect in connection with the Fund’s next annual registration statement update. They also noted that the Investment Adviser did not manage other types of accounts having investment objectives and policies similar to those of the Funds, and therefore this type of fee comparison was not possible.
In addition, the Trustees noted that shareholders are able to redeem their Fund shares at any time if shareholders believe that the Fund fees and expenses are too high or if they are dissatisfied with the performance of the Fund.
Profitability
The Trustees reviewed the Investment Adviser’s revenues and pre-tax profit margins with respect to the Trust and each of the Funds. In this regard the Trustees noted that they had received, among other things, profitability analyses and summaries, revenue and expense schedules by Fund and by function (i.e., investment management, transfer agency and distribution and service), and information on the Investment Adviser’s expense allocation methodology. They observed that the profitability and expense figures are substantially similar to those used by the Investment Adviser for many internal purposes, including compensation decisions among various business groups, and are thus subject to a vigorous internal debate about how certain revenue and expenses should be allocated. The Trustees also noted that the internal audit group within the Goldman Sachs organization had audited the expense allocation methodology and was satisfied with the reasonableness, consistency, and accuracy of the Investment Adviser’s expense allocation methodology and profitability analysis calculations. Profitability data for the Trust and each Fund were provided for 2014 and 2013 (with respect to the Long Short Credit Strategies Fund, the 2013 profitability information was for the Predecessor Fund), and the Trustees considered this information in relation to the Investment Adviser’s overall profitability. The Trustees
78
GOLDMAN SACHS FIXED INCOME ALTERNATIVES FUNDS
Statement Regarding Basis for Approval of Management Agreement (Unaudited) (continued)
considered the Investment Adviser’s revenues and pre-tax profit margins both in absolute terms and in comparison to information on the reported pre-tax profit margins earned by certain other asset management firms.
Economies of Scale
The Trustees considered the information that had been provided regarding the Investment Adviser’s profitability. The Trustees also considered the breakpoints in the fee rate payable under the Management Agreement for each of the Funds at the following annual percentage rates of the average daily net assets of the Funds:
| | | | | | | | |
Average Daily
Net Assets | | Fixed Income Macro
Strategies Fund | | | Long Short Credit
Strategies Fund | |
| First $1 billion | | | 1.50 | % | | | 1.00 | % |
| Next $1 billion | | | 1.50 | % | | | 0.90 | % |
| Next $3 billion | | | 1.35 | % | | | 0.86 | % |
| Next $3 billion | | | 1.28 | % | | | 0.84 | % |
| Over $8 billion | | | 1.26 | % | | | 0.82 | % |
The Trustees noted that the breakpoints were designed to share potential economies of scale, if any, with the Funds and their shareholders as assets under management reach those asset levels. The Trustees considered the amounts of assets in the Funds; the Funds’ recent share purchase and redemption activity; the information provided by the Investment Adviser relating to the costs of the services provided by the Investment Adviser and its affiliates and their realized profits; information comparing fee rates charged by the Investment Adviser with fee rates charged to other funds in the peer groups; and the Investment Adviser’s undertakings to waive a portion of its management fees (with respect to the Fixed Income Macro Strategies Fund) and to limit certain expenses of each Fund that exceed specified levels. Upon reviewing these matters at the Annual Meeting, the Trustees concluded that the fee breakpoints represented a means of assuring that benefits of scalability, if any, would be passed along to shareholders at the specified asset levels.
Other Benefits to the Investment Adviser and Its Affiliates
The Trustees also considered the other benefits derived by the Investment Adviser and its affiliates from their relationships with the Funds as stated above, including: (a) transfer agency fees received by Goldman, Sachs & Co. (“Goldman Sachs”); (b) futures commissions earned by Goldman Sachs for executing futures transactions on behalf of the Funds; (c) trading efficiencies resulting from aggregation of orders of the Funds with those for other funds or accounts managed by the Investment Adviser; (d) the Investment Adviser’s ability to leverage the infrastructure designed to service the Funds on behalf of its other clients; (e) the Investment Adviser’s ability to cross-market other products and services to Fund shareholders; (f) Goldman Sachs’ retention of certain fees as Fund Distributor; (g) the Investment Adviser’s ability to negotiate better pricing with custodians on behalf of its other clients, as a result of the relationship with the Funds; and (h) the possibility that the working relationship between the Investment Adviser and the Funds’ third-party service providers may cause those service providers to be more likely to do business with other areas of Goldman Sachs. In the course of considering the foregoing, the Independent Trustees requested and received further information quantifying certain of these fall-out benefits.
Other Benefits to the Funds and Their Shareholders
The Trustees also noted that the Funds receive certain potential benefits as a result of their relationship with the Investment Adviser, including: (a) trading efficiencies resulting from aggregation of orders of the Funds with those of other funds or accounts managed by the Investment Adviser; (b) enhanced servicing from vendors because of the volume of business generated by the Investment Adviser and its affiliates; (c) enhanced servicing from broker-dealers because of the volume of business generated by the Investment Adviser and its affiliates; (d) the Investment Adviser’s ability to negotiate favorable terms with derivatives counterparties on behalf of the Funds as a result of the size and reputation of the Goldman Sachs organization; (e) the Investment Adviser’s knowledge and experience gained from managing other accounts and products; (f) the Investment Adviser’s ability to hire and retain qualified personnel to provide services to the Funds because of the reputation of the Goldman Sachs organization; (g) the Funds’ access, through the Investment Adviser, to certain firmwide resources (e.g., proprietary risk management systems and databases), subject to certain restrictions; and (h) the Funds’ access to certain affiliated distribution channels. In addition, the
79
GOLDMAN SACHS FIXED INCOME ALTERNATIVES FUNDS
Statement Regarding Basis for Approval of Management Agreement (Unaudited) (continued)
Trustees noted the competitive nature of the mutual fund marketplace, and considered that many of the Funds’ shareholders invested in the Funds in part because of the Funds’ relationship with the Investment Adviser and that those shareholders have a general expectation that the relationship will continue.
Conclusion
In connection with their consideration of the Management Agreement, the Trustees gave weight to each of the factors described above, but did not identify any particular factor as controlling their decision. After deliberation and consideration of all of the information provided, including the factors described above, the Trustees concluded, in the exercise of their business judgment, that the management fees paid by each of the Funds were reasonable in light of the services provided to it by the Investment Adviser, the Investment Adviser’s costs and each Fund’s current and reasonably foreseeable asset levels. The Trustees unanimously concluded that the Investment Adviser’s continued management likely would benefit each Fund and its shareholders and that the Management Agreement should be approved and continued with respect to each Fund until June 30, 2016.
80
FUNDS PROFILE
Goldman Sachs Funds

Goldman Sachs is a premier financial services firm, known since 1869 for creating thoughtful and customized investment solutions in complex global markets.
Today, the Investment Management Division of Goldman Sachs serves a diverse set of clients worldwide, including private institutions, public entities and individuals. With approximately $1.02 trillion in assets under supervision as of September 30, 2015, Goldman Sachs Asset Management (“GSAM”) has portfolio management teams located around the world and our investment professionals bring firsthand knowledge of local markets to every investment decision. Assets under supervision includes assets under management and other client assets for which Goldman Sachs does not have full discretion. GSAM leverages the resources of Goldman, Sachs & Co. subject to legal, internal and regulatory restrictions.

Money Market1
Financial Square FundsSM
| n | | Financial Square Tax-Exempt Funds |
| n | | Financial Square Treasury Solutions Fund2 |
| n | | Financial Square Government Fund |
| n | | Financial Square Money Market Fund |
| n | | Financial Square Prime Obligations Fund |
| n | | Financial Square Treasury Instruments Fund |
| n | | Financial Square Treasury Obligations Fund |
| n | | Financial Square Federal Instruments Fund |
Fixed Income
Short Duration and Government
| n | | High Quality Floating Rate Fund |
| n | | Limited Maturity Obligations Fund |
| n | | Short Duration Government Fund |
| n | | Short Duration Income Fund |
| n | | Inflation Protected Securities Fund |
Multi-Sector
Municipal and Tax-Free
| n | | High Yield Municipal Fund |
| n | | Dynamic Municipal Income Fund3 |
| n | | Short Duration Tax-Free Fund |
Single Sector
| n | | Investment Grade Credit Fund |
| n | | High Yield Floating Rate Fund |
| n | | Emerging Markets Debt Fund |
| n | | Local Emerging Markets Debt Fund |
| n | | Dynamic Emerging Markets Debt Fund |
Fixed Income Alternatives
| n | | Long Short Credit Strategies Fund |
| n | | Fixed Income Macro Strategies Fund |
Fundamental Equity
| n | | Small/Mid Cap Value Fund |
| n | | Small/Mid Cap Growth Fund |
| n | | Flexible Cap Growth Fund |
| n | | Concentrated Growth Fund |
| n | | Technology Opportunities Fund4 |
| n | | Growth Opportunities Fund |
| n | | Rising Dividend Growth Fund |
| n | | Dynamic U.S. Equity Fund5 |
Tax-Advantaged Equity
| n | | U.S. Tax-Managed Equity Fund |
| n | | International Tax-Managed Equity Fund |
| n | | U.S. Equity Dividend and Premium Fund |
| n | | International Equity Dividend and Premium Fund |
Equity Insights
| n | | Small Cap Equity Insights Fund |
| n | | U.S. Equity Insights Fund |
| n | | Small Cap Growth Insights Fund |
| n | | Large Cap Growth Insights Fund |
| n | | Large Cap Value Insights Fund |
| n | | Small Cap Value Insights Fund |
| n | | International Small Cap Insights Fund |
| n | | International Equity Insights Fund |
| n | | Emerging Markets Equity Insights Fund |
Fundamental Equity International
| n | | Strategic International Equity Fund |
| n | | Focused International Equity Fund |
| n | | International Small Cap Fund |
| n | | Emerging Markets Equity Fund6 |
Select Satellite7
| n | | Real Estate Securities Fund |
| n | | International Real Estate Securities Fund |
| n | | Global Real Estate Securities Fund |
| n | | Commodity Strategy Fund |
| n | | Dynamic Commodity Strategy Fund |
| n | | Dynamic Allocation Fund |
| n | | Absolute Return Tracker Fund |
| n | | Managed Futures Strategy Fund |
| n | | MLP Energy Infrastructure Fund |
| n | | Multi-Manager Alternatives Fund |
| n | | Multi-Asset Real Return Fund |
| n | | Retirement Portfolio Completion Fund |
| n | | Absolute Return Multi-Asset Fund |
Total Portfolio Solutions7
| n | | Global Managed Beta Fund |
| n | | Multi-Manager Non-Core Fixed Income Fund |
| n | | Multi-Manager U.S. Dynamic Equity Fund |
| n | | Multi-Manager Global Equity Fund |
| n | | Multi-Manager International Equity Fund |
| n | | Tactical Tilt Implementation Fund |
| n | | Balanced Strategy Portfolio |
| n | | Multi-Manager Real Assets Strategy Fund |
| n | | Growth and Income Strategy Portfolio |
| n | | Growth Strategy Portfolio |
| n | | Equity Growth Strategy Portfolio |
| n | | Satellite Strategies Portfolio |
| n | | Enhanced Dividend Global Equity Portfolio |
| n | | Tax Advantaged Global Equity Portfolio |
| 1 | | An investment in a money market fund is neither insured nor guaranteed by the Federal Deposit Insurance Corporation (“FDIC”) or any other government agency. Although the Funds seek to preserve the value of your investment at $1.00 per share, it is possible to lose money by investing in the Funds. |
| 2 | | Effective on September 30, 2015, the Goldman Sachs Financial Square Federal Fund was renamed the Goldman Sachs Financial Square Treasury Solutions Fund. |
| 3 | | Effective on December 18, 2014, the Goldman Sachs Municipal Income Fund was renamed the Goldman Sachs Dynamic Municipal Income Fund. |
| 4 | | Effective on July 31, 2015, the Goldman Sachs Technology Tollkeeper Fund was renamed the Goldman Sachs Technology Opportunities Fund. |
| 5 | | Effective on April 30, 2015, the Goldman Sachs U.S. Equity Fund was renamed the Goldman Sachs Dynamic U.S. Equity Fund. |
| 6 | | Effective at the close of business on October 23, 2015, the Goldman Sachs BRIC Fund (Brazil, Russia, India, China) was reorganized with and into the Goldman Sachs Emerging Markets Equity Fund. |
| 7 | | Individual Funds within the Total Portfolio Solutions and Select Satellite categories will have various placement on the risk/return spectrum and may have greater or lesser risk than that indicated by the placement of the general Total Portfolio Solutions or Select Satellite category. |
Financial Square FundsSM is a registered service mark of Goldman, Sachs & Co.
| *This | | list covers open-end funds only. Please visit our website at www.GSAMFUNDS.com to learn about our closed-end funds and exchange-traded funds. |
| | |
TRUSTEES Ashok N. Bakhru, Chairman Kathryn A. Cassidy John P. Coblentz, Jr. Diana M. Daniels Joseph P. LoRusso Herbert J. Markley James A. McNamara Jessica Palmer Alan A. Shuch Richard P. Strubel Roy W. Templin Gregory G. Weaver | | OFFICERS James A. McNamara, President Scott M. McHugh, Principal Financial Officer and Treasurer Caroline Kraus, Secretary |
| |
GOLDMAN, SACHS & CO. Distributor and Transfer Agent | | GOLDMAN SACHS ASSET MANAGEMENT, L.P. Investment Adviser |
Visit our web site at www.GSAMFUNDS.com to obtain the most recent month-end returns.
Goldman Sachs Asset Management, L.P., 200 West Street, New York, New York 10282
The reports concerning the Funds included in this shareholder report may contain certain forward-looking statements about the factors that may affect the performance of the Funds in the future. These statements are based on Fund management’s predictions and expectations concerning certain future events and their expected impact on the Funds, such as performance of the economy as a whole and of specific industry sectors, changes in the levels of interest rates, the impact of developing world events, and other factors that may influence the future performance of the Funds. Management believes these forward-looking statements to be reasonable, although they are inherently uncertain and difficult to predict. Actual events may cause adjustments in portfolio management strategies from those currently expected to be employed.
A description of the policies and procedures that the Funds use to determine how to vote proxies relating to portfolio securities and information regarding how the Funds voted proxies relating to portfolio securities for the most recent 12-month period ended June 30 are available (I) without charge, upon request by calling 1-800-526-7384 (for Retail Shareholders) or 1-800-621-2550 (for Institutional Shareholders); and (II) on the Securities and Exchange Commission (‘‘SEC’’) web site at http://www.sec.gov.
The Funds file their complete schedule of portfolio holdings with the SEC for the first and third quarters of each fiscal year on Form N-Q. The Funds’ Forms N-Q are available on the SEC’s web site at http://www.sec.gov within 60 days after the Funds’ first and third fiscal quarters. The Funds’ Forms N-Q may be reviewed and copied at the SEC’s Public Reference Room in Washington, D.C., and information on the operation of the Public Reference Room may also be obtained by calling 1-800-SEC-0330. Forms N-Q may be obtained upon request and without charge by calling 1-800-526-7384 (for Retail Shareholders) or 1-800-621-2550 (for Institutional Shareholders).
Economic and market forecasts presented herein reflect our judgment as of the date of this presentation and are subject to change without notice. These forecasts do not take into account the specific investment objectives, restrictions, tax and financial situation or other needs of any specific client. Actual data will vary and may not be reflected here. These forecasts are subject to high levels of uncertainty that may affect actual performance. Accordingly, these forecasts should be viewed as merely representative of a broad range of possible outcomes. These forecasts are estimated, based on assumptions, and are subject to significant revision and may change materially as economic and market conditions change. Goldman Sachs has no obligation to provide updates or changes to these forecasts. Case studies and examples are for illustrative purposes only.
Fund holdings and allocations shown are as of September 30, 2015 and may not be representative of future investments. Fund holdings should not be relied on in making investment decisions and should not be construed as research or investment advice regarding particular securities.
The portfolio risk management process includes an effort to monitor and manage risk, but does not imply low risk.
This material is not authorized for distribution to prospective investors unless preceded or accompanied by a current Prospectus or summary prospectus, if applicable. Investors should consider a Fund’s objective, risks, and charges and expenses, and read the summary prospectus, if available, and/or the Prospectus carefully before investing or sending money. The summary prospectus, if available, and the Prospectus contain this and other information about a Fund and may be obtained from your authorized dealer or from Goldman, Sachs & Co. by calling (retail – 1-800-526-7384) (institutional – 1-800-621-2550).
© 2015 Goldman Sachs. All rights reserved. 172509.MF.MED.TMPL/11/2015 FIALTSAR-15/1.6K
(a) As of the end of the period covered by this report, the registrant has adopted a code of ethics that applies to the registrant’s principal executive officer, principal financial officer, principal accounting officer or controller, or persons performing similar functions, regardless of whether these individuals are employed by the registrant or a third party (the “Code of Ethics”).
(b) During the period covered by this report, no amendments were made to the provisions of the Code of Ethics.
(c) During the period covered by this report, the registrant did not grant any waivers, including an implicit waiver, from any provision of the Code of Ethics.
(d) A copy of the Code of Ethics is available as provided in Item 12(a)(1) of this report.
| ITEM 3. | AUDIT COMMITTEE FINANCIAL EXPERT. |
The registrant’s board of trustees has determined that the registrant has at least one “audit committee financial expert” (as defined in Item 3 of Form N-CSR) serving on its audit committee. John P. Coblentz, Jr. is the “audit committee financial expert” and is “independent” (as each term is defined in Item 3 of Form N-CSR).
| ITEM 4. | PRINCIPAL ACCOUNTANT FEES AND SERVICES. |
Table 1 — Items 4(a) - 4(d). The accountant fees below reflect the aggregate fees billed by all of the Funds of the Goldman Sachs Trust and includes the Goldman Sachs Funds to which this certified shareholder report relates.
| | | | | | | | | | | | |
| | | 2015 | | 2014 | | Description of Services Rendered |
| | | |
| | | | | | | | | | | | |
| | | |
Audit Fees: | | | | | | | | | | | | |
| | | |
• PricewaterhouseCoopers LLP
(“PwC”) | | | $ | 3,570,472 | | | | $ | 2,208,710 | | | Financial Statement audits. |
| | | |
Audit-Related Fees: | | | | | | | | | | | | |
| | | |
• PwC | | | $ | 0 | | | | $ | 0 | | | Other attest services. |
| | | |
Tax Fees: | | | | | | | | | | | | |
| | | |
• PwC | | | $ | 659,410 | | | | $ | 723,485 | | | Tax compliance services provided in connection with the preparation and review of registrant’s tax returns. |
Table 2 — Items 4(b)(c) & (d). Non-Audit Services to the Goldman Sachs Trust’s service affiliates * that were pre-approved by the Audit Committee of the Goldman Sachs Trust pursuant to Rule 2-01(c)(7)(ii) of Regulation S-X.
| | | | | | | | | | | | |
| | | 2015 | | 2014 | | Description of Services Rendered |
| | | |
| | | | | | | | | | | | |
| | | |
Audit-Related Fees: | | | | | | | | | | | | |
| | | |
• PwC | | | $ | 1,568,616 | | | | $ | 1,486,420 | | | Internal control review performed in accordance with Statement on Standards for Attestation Engagements No. 16. These fees are borne by the Funds’ Adviser. |
| * | These include the advisor (excluding sub-advisors) and any entity controlling, controlled by or under common control with the advisor that provides ongoing services to the registrant (hereinafter referred to as “service affiliates”). |
Item 4(e)(1) — Audit Committee Pre-Approval Policies and Procedures
Pre-Approval of Audit and Non-Audit Services Provided to the Funds of the Goldman Sachs Trust. The Audit and Non-Audit Services Pre-Approval Policy (the “Policy”) adopted by the Audit Committee of Goldman Sachs Trust (“GST”) sets forth the procedures and the conditions pursuant to which services performed by an independent auditor for GST may be pre-approved. Services may be pre-approved specifically by the Audit Committee as a whole or, in certain circumstances, by the Audit Committee Chairman or the person designated as the Audit Committee Financial Expert. In addition, subject to specified cost limitations, certain services may be pre-approved under the provisions of the Policy. The Policy provides that the Audit Committee will consider whether the services provided by an independent auditor are consistent with the Securities and Exchange Commission’s rules on auditor independence. The Policy provides for periodic review and pre-approval by the Audit Committee of the services that may be provided by the independent auditor.
De Minimis Waiver. The pre-approval requirements of the Policy may be waived with respect to the provision of non-audit services that are permissible for an independent auditor to perform, provided (1) the aggregate amount of all such services provided constitutes no more than five percent of the total amount of revenues subject to pre-approval that was paid to the independent auditors during the fiscal year in which the services are provided; (2) such services were not recognized by GST at the time of the engagement to be non-audit services; and (3) such services are promptly brought to the attention of the Audit Committee and approved prior to the completion of the audit by the Audit Committee or by one or more members of the Audit Committee to whom authority to grant such approvals has been delegated by the Audit Committee, pursuant to the pre-approval provisions of the Policy.
Pre-Approval of Non-Audit Services Provided to GST’s Investment Advisers. The Policy provides that, in addition to requiring pre-approval of audit and non-audit services provided to GST, the Audit Committee will pre-approve those non-audit services provided to GST’s investment advisers (and entities controlling, controlled by or under common control with the investment advisers that provide ongoing services to GST) where the engagement relates directly to the operations or financial reporting of GST.
Item 4(e)(2) – 0% of the audit-related fees, tax fees and other fees listed in Table 1 were approved by GST’s Audit Committee pursuant to the “de minimis” exception of Rule 2-01(c)(7)(i)(C) of Regulation S-X. In addition, 0% of the non-audit services to the GST’s service affiliates listed in Table 2 were approved by GST’s Audit Committee pursuant to the “de minimis” exception of Rule 2-01(c)(7)(i)(C) of Regulation S-X.
Item 4(f) – Not applicable.
Item 4(g) Aggregate Non-Audit Fees Disclosure
The aggregate non-audit fees billed to GST by PwC for the twelve months ended March 31, 2015 and March 31, 2014 were approximately $659,410 and $723,485 respectively. The aggregate non-audit fees billed to GST’s adviser and service affiliates by PwC for non-audit services for the twelve months ended December 31, 2014 and December 31, 2013 were approximately $10.2 million and $9.8 million respectively. With regard to the aggregate non-audit fees billed to GST’s adviser and service affiliates, the 2014 and 2013 amounts include fees for non-audit services required to be pre-approved [see Table 2] and fees for non-audit services that did not require pre-approval since they did not directly relate to GST’s operations or financial reporting.
Item 4(h) — GST’s Audit Committee has considered whether the provision of non-audit services to GST’s investment adviser and service affiliates that did not require pre-approval pursuant to paragraph (c)(7)(ii) of Rule 2-01 of Regulation S-X is compatible with maintaining the auditors’ independence.
| ITEM 5. | AUDIT COMMITTEE OF LISTED REGISTRANTS. |
| ITEM 6. | SCHEDULE OF INVESTMENTS. |
| | Schedule of Investments is included as part of the Report to Stockholders filed under Item 1. |
| ITEM 7. | DISCLOSURE OF PROXY VOTING POLICIES AND PROCEDURES FOR CLOSED-END MANAGEMENT INVESTMENT COMPANIES. |
| ITEM 8. | PORTFOLIO MANAGERS OF CLOSED-END MANAGEMENT INVESTMENT COMPANIES. |
| ITEM 9. | PURCHASES OF EQUITY SECURITIES BY CLOSED-END MANAGEMENT INVESTMENT COMPANY AND AFFILIATED PURCHASERS. |
| ITEM 10. | SUBMISSION OF MATTERS TO A VOTE OF SECURITY HOLDERS. |
| | There have been no material changes to the procedures by which shareholders may recommend nominees to the registrant’s board of trustees. |
| ITEM 11. | CONTROLS AND PROCEDURES. |
| | (a) | The registrant’s principal executive and principal financial officers, or persons performing similar functions have concluded that the registrant’s disclosure controls and procedures (as defined in Rule 30a-3(c) under the Investment Company Act of 1940, as amended (the “1940 Act”)) are effective as of a date within 90 days of the filing of this report that includes the disclosure required by this paragraph, based on the evaluation of these controls and procedures required by Rule 30a-3(b) under the 1940 Act and 15d-15(b) under the Securities Exchange Act of 1934, as amended. |
| | (b) | There were no changes in the registrant’s internal control over financial reporting (as defined in Rule 30a-3(d) under the 1940 Act) that occurred during the registrant’s second fiscal quarter of the period covered by this report that have materially affected, or are reasonably likely to materially affect, the registrant’s internal control over financial reporting. |
| | | | |
| (a)(1) | | Goldman Sachs Trust’s Code of Ethics for Principal Executive and Senior Financial Officers is incorporated by reference to Exhibit 12(a)(1) of the registrant’s Form N-CSR filed on July 8, 2015 for its International Equity Insights Funds. |
| | |
| (a)(2) | | Exhibit 99.CERT | | Certifications pursuant to Section 302 of the Sarbanes-Oxley Act of 2002 filed herewith. |
| | |
| (b) | | Exhibit 99.906CERT | | Certifications pursuant to Section 906 of the Sarbanes-Oxley Act of 2002 filed herewith. |
SIGNATURES
Pursuant to the requirements of the Securities Exchange Act of 1934 and the Investment Company Act of 1940, the registrant has duly caused this report to be signed on its behalf by the undersigned, thereunto duly authorized.
| | |
| | | Goldman Sachs Trust |
| |
| By: | | /s/ James A. McNamara |
| |
| | |
| | James A. McNamara |
| | President/Chief Executive Officer |
| | Goldman Sachs Trust |
| |
| Date: | | December 7, 2015 |
Pursuant to the requirements of the Securities Exchange Act of 1934 and the Investment Company Act of 1940, this report has been signed below by the following persons on behalf of the registrant and in the capacities and on the dates indicated.
| | |
| By: | | /s/ James A. McNamara |
| |
| | |
| | James A. McNamara |
| | President/Chief Executive Officer |
| | Goldman Sachs Trust |
| |
| Date: | | December 7, 2015 |
| |
| By: | | /s/ Scott McHugh |
| |
| | |
| | Scott McHugh |
| | Principal Financial Officer |
| | Goldman Sachs Trust |
| |
| Date: | | December 7, 2015 |