UNITED STATES
SECURITIES AND EXCHANGE COMMISSION
Washington, D.C. 20549
FORM N-CSR
CERTIFIED SHAREHOLDER REPORT OF REGISTERED
MANAGEMENT INVESTMENT COMPANIES
Investment Company Act file number 811-05349
Goldman Sachs Trust
(Exact name of registrant as specified in charter)
71 South Wacker Drive, Chicago, Illinois 60606
(Address of principal executive offices) (Zip code)
| | |
| Caroline Kraus, Esq. | | Copies to: |
| Goldman, Sachs & Co. | | Geoffrey R.T. Kenyon, Esq. |
| 200 West Street | | Dechert LLP |
| New York, New York 10282 | | 100 Oliver Street |
| | 40th Floor |
| | Boston, MA 02110-2605 |
(Name and address of agents for service)
Registrant’s telephone number, including area code: (312) 655-4400
Date of fiscal year end: October 31
Date of reporting period: April 30, 2015
| ITEM 1. | REPORTS TO STOCKHOLDERS. |
| | The Semi-Annual Report to Stockholders is filed herewith. |
Goldman Sachs Funds

| | | | |
| | |
| Semi-Annual Report | | | | April 30, 2015 |
| | |
| | | | Domestic Equity Insights Funds |
| | | | Large Cap Growth Insights |
| | | | Large Cap Value Insights |
| | | | Small Cap Equity Insights |
| | | | Small Cap Growth Insights |
| | | | Small Cap Value Insights |
| | | | U.S. Equity Insights |

Goldman Sachs Domestic Equity Insights Funds
| n | | LARGE CAP GROWTH INSIGHTS |
| n | | LARGE CAP VALUE INSIGHTS |
| n | | SMALL CAP EQUITY INSIGHTS |
| n | | SMALL CAP GROWTH INSIGHTS |
| n | | SMALL CAP VALUE INSIGHTS |
| | | | |
TABLE OF CONTENTS | | | | |
| |
Principal Investment Strategies and Risks | | | 1 | |
| |
Market Review | | | 3 | |
| |
Investment Process | | | 4 | |
| |
Portfolio Management Discussion and Performance Summaries | | | 6 | |
| |
Schedules of Investments | | | 36 | |
| |
Financial Statements | | | 58 | |
| |
Financial Highlights | | | 66 | |
| |
Notes to Financial Statements | | | 78 | |
| |
Other Information | | | 99 | |
| | | | |
| | | |
| NOT FDIC-INSURED | | May Lose Value | | No Bank Guarantee |
GOLDMAN SACHS DOMESTIC EQUITY INSIGHTS FUNDS
Principal Investment Strategies and Risks
This is not a complete list of risks that may affect the Funds. For additional information concerning the risks applicable to the Funds, please see the Funds’ Prospectus.
The Goldman Sachs Large Cap Growth Insights Fund invests primarily in a broadly diversified portfolio of equity investments in large-capitalization U.S. issuers, including foreign issuers traded in the United States. The Fund’s equity investments will be subject to market risk, which means that the value of the securities in which it invests may go up or down in response to the prospects of individual companies, particular sectors and/or general economic conditions. The Investment Adviser’s use of quantitative models to execute the Fund’s investment strategy may fail to produce the intended result. Different investment styles (e.g., “quantitative” and “growth”) tend to shift in and out of favor, and at times the Fund may underperform other funds that invest in similar asset classes. The Fund may have a high rate of portfolio turnover, which involves correspondingly greater expenses which must be borne by the Fund, and is also likely to result in short-term capital gains taxable to shareholders.
The Goldman Sachs Large Cap Value Insights Fund invests primarily in a diversified portfolio of equity investments in large-capitalization U.S. issuers, including foreign issuers traded in the United States. The Fund’s equity investments will be subject to market risk, which means that the value of the securities in which it invests may go up or down in response to the prospects of individual companies, particular sectors and/or general economic conditions. The Investment Adviser’s use of quantitative models to execute the Fund’s investment strategy may fail to produce the intended result. Different investment styles (e.g., “quantitative” and “value”) tend to shift in and out of favor, and at times the Fund may underperform other funds that invest in similar asset classes. The Fund may have a high rate of portfolio turnover, which involves correspondingly greater expenses which must be borne by the Fund, and is also likely to result in short-term capital gains taxable to shareholders.
The Goldman Sachs Small Cap Equity Insights Fund invests primarily in a broadly diversified portfolio of equity investments in small-capitalization U.S. issuers, including foreign issuers traded in the United States. The Fund’s equity investments will be subject to market risk, which means that the value of the securities in which it invests may go up or down in response to the prospects of individual companies, particular sectors and/or general economic conditions. The securities of mid- and small-capitalization companies involve greater risks than those associated with larger, more established companies and may be subject to more abrupt or erratic price movements. The Investment Adviser’s use of quantitative models to execute the Fund’s investment strategy may fail to produce the intended result. Different investment styles (e.g., “quantitative”) tend to shift in and out of favor, and at times the Fund may underperform other funds that invest in similar asset classes. The Fund may have a high rate of portfolio turnover, which involves correspondingly greater expenses which must be borne by the Fund, and is also likely to result in short-term capital gains taxable to shareholders.
The Goldman Sachs Small Cap Growth Insights Fund invests primarily in a broadly diversified portfolio of equity investments in small-capitalization U.S. issuers, including foreign issuers that are traded in the U.S. The Fund’s equity investments are subject to market risk, which means that the value of the securities in which it invests may go up or down in response to the prospects of individual companies, particular sectors and/or general economic conditions. The securities of mid- and small-capitalization companies involve greater risks than those associated with larger, more established companies and may be subject to more abrupt or erratic price movements. The Investment Adviser’s use of quantitative models to execute the Fund’s investment strategy may fail to produce the intended result. Different investment styles (e.g., “quantitative” and “growth”) tend to shift in and out of favor, and at times the Fund may underperform other funds that invest in similar asset classes. The Fund may have a high rate of portfolio turnover, which involves correspondingly greater expenses which must be borne by the Fund, and is also likely to result in short-term capital gains taxable to shareholders.
1
GOLDMAN SACHS DOMESTIC EQUITY INSIGHTS FUNDS
The Goldman Sachs Small Cap Value Insights Fund invests primarily in a broadly diversified portfolio of equity investments in small-capitalization U.S. issuers, including foreign issuers that are traded in the U.S. The Fund’s equity investments are subject to market risk, which means that the value of the securities in which it invests may go up or down in response to the prospects of individual companies, particular sectors and/or general economic conditions. The securities of mid- and small-capitalization companies involve greater risks than those associated with larger, more established companies and may be subject to more abrupt or erratic price movements. The Investment Adviser’s use of quantitative models to execute the Fund’s investment strategy may fail to produce the intended result. Different investment styles (e.g., “quantitative” and “value”) tend to shift in and out of favor, and at times the Fund may underperform other funds that invest in similar asset classes. The Fund may have a high rate of portfolio turnover, which involves correspondingly greater expenses which must be borne by the Fund, and is also likely to result in short-term capital gains taxable to shareholders.
The Goldman Sachs U.S. Equity Insights Fund invests primarily in a diversified portfolio of equity investments in U.S. issuers, including foreign issuers traded in the United States. The Fund’s equity investments will be subject to market risk, which means that the value of the securities in which it invests may go up or down in response to the prospects of individual companies, particular sectors and/ or general economic conditions. The Investment Adviser’s use of quantitative models to execute the Fund’s investment strategy may fail to produce the intended result. Different investment styles (e.g., “quantitative”) tend to shift in and out of favor, and at times the Fund may underperform other funds that invest in similar asset classes. The Fund may have a high rate of portfolio turnover, which involves correspondingly greater expenses which must be borne by the Fund, and is also likely to result in short-term capital gains taxable to shareholders.
2
MARKET REVIEW
Goldman Sachs Domestic Equity Insights Funds
Market Review
U.S. equities generated positive returns during the six months ended April 30, 2015 (the “Reporting Period”).
Economic data generally improved during the Reporting Period, with a notable drop in U.S. unemployment to 5.5%. As a result, U.S. equity markets began to focus on the potential timing of the first interest rate increase by the Federal Reserve (the “Fed”) since 2006. Meanwhile, oil prices dropped sharply. The price of West Texas Intermediate (“WTI”) crude oil declined, falling from a high of $107 per barrel during June 2014 to a low of $43 per barrel in March 2015, before rebounding to almost $60 per barrel by the end of the Reporting Period. Low oil prices forced U.S. producers to cut supply, which, in turn, drove down the earnings of many energy and energy-related companies. That said, market participants appeared to view the combination of lower energy prices, higher employment numbers and an improving housing market as beneficial for consumers. Consumer confidence and spending slowly improved during the Reporting Period, and the stocks of many consumer-oriented companies rose in anticipation of a further increase in consumption.
For the Reporting Period overall, the S&P 500® Index returned 4.40%, with eight of 10 sectors generating positive returns. The consumer discretionary (+11.50%) and health care (+7.17%) sectors performed best. The consumer discretionary sector was the largest positive contributor (measured by weight times total return) to S&P 500® Index returns. In terms of market capitalization, small-cap stocks outperformed large-cap stocks, especially in the health care sector. The Russell 2000® Index, which measures the small-cap universe, returned 4.65% during the Reporting Period. In the style arena, growth stocks outperformed value stocks overall. The Russell 1000® Growth Index, representing large-cap growth stocks, rose 6.54%, while the Russell 1000® Value Index, representing large-cap value stocks, was up 2.89% during the Reporting Period.
Looking Ahead
At the end of the Reporting Period, we continued to believe that less expensive stocks should outpace more expensive stocks. In addition, we expected stocks with good momentum to outperform those with poor momentum. We plan to focus on seeking companies about which fundamental research analysts are becoming more positive as well as profitable companies with sustainable earnings and a track record of using their capital to enhance shareholder value. As such, we anticipate remaining fully invested, with long-term performance likely to be the result of stock selection rather than sector or capitalization allocations.
We stand behind our investment philosophy that sound economic investment principles, coupled with a disciplined quantitative approach, can provide strong, uncorrelated returns over the long term. Our research agenda is robust, and we continue to enhance our existing models, add new proprietary forecasting signals and improve our trading execution as we seek to provide the most value to our shareholders.
3
GOLDMAN SACHS DOMESTIC EQUITY INSIGHTS FUNDS
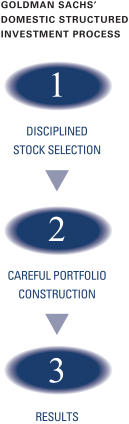
What Differentiates Goldman Sachs’
Domestic Equity Insights Funds Investment Process?
At Goldman Sachs Asset Management, L.P. (“GSAM”), Equity Insights combines traditional fundamental analysis with sophisticated quantitative modeling. Our approach is not unlike that of a more traditional active manager: we look at fundamental investment themes that have been effective historically in forecasting excess returns of stocks. However, where we differ from traditional managers is that we seek to rigorously test every potential research theme or signal to verify whether they have shown consistent predictive ability across a wide variety of stocks in different time periods and under different market conditions.

| n | | Comprehensive — We calculate expected excess returns for more than 10,000 stocks on a daily basis. |
| n | | Rigorous — We evaluate stocks based on fundamental investment criteria that have outperformed historically. |
| n | | Objective — Our stock selection process is free from the emotion that may lead to biased investment decisions. |

| n | | Our computer optimization process allocates risk to our high conviction investment ideas and constructs funds that strive to neutralize systematic risks and deliver better returns. |
| n | | We use a unique, proprietary risk model that is designed to be more precise, more focused and faster to respond because it seeks to identify, track and manage risk specific to our process, using daily data. |

Fully invested, well-diversified portfolio that seeks to:
| n | | Maintain style, sector, risk and capitalization characteristics similar to the benchmark. |
| n | | Offer broad access to a clearly defined equity universe. |
| n | | Generate excess returns that are positive, consistent and repeatable. |
4
GOLDMAN SACHS DOMESTIC EQUITY INSIGHTS FUNDS
Enhancements Made to Proprietary Quantitative Model during the Six-Month Period Ended April 30, 2015
We continuously look for ways to improve our investment process. Accordingly, we introduced a number of enhancements to our proprietary quantitative model during the six-month period ended April 30, 2015.
We implemented an enhancement to our Valuation theme to evaluate energy companies’ reserves. Energy reserves are not capitalized on the balance sheet, so we believe reserve-based valuation metrics provide a more accurate picture of the intrinsic value of an energy company. In addition, we implemented an enhancement to our Sentiment theme through which we analyze short selling of stocks in order to gain a more comprehensive understanding of investor views about potential future price declines. We analyze more than 9,000 stocks on a daily basis to identify companies with large, “fresh” short positions that may indicate negative return expectations. We also implemented an enhancement to our Momentum theme, evaluating price pressures created through consistent trade imbalances between buyers and sellers. In certain instances, traders may push prices as they engage in end-of-day hedging, inventory management and index trading. Such activities, when persistent, can create buying and selling opportunities as stock prices revert to long-term views.
5
PORTFOLIO RESULTS
Goldman Sachs Large Cap Growth Insights Fund
Investment Objective
The Fund seeks long-term growth of capital, with dividend income as a secondary consideration.
Portfolio Management Discussion and Analysis
Below, the Goldman Sachs Quantitative Investment Strategies Team discusses the Goldman Sachs Large Cap Growth Insights Fund’s (the “Fund”) performance and positioning for the six-month period ended April 30, 2015 (the “Reporting Period”).
| Q | | How did the Fund perform during the Reporting Period? |
| A | | During the Reporting Period, the Fund’s Class A, C, Institutional, Service, IR and R Shares generated cumulative total returns, without sales charges, of 5.63%, 5.24%, 5.86%, 5.62%, 5.75% and 5.54%, respectively. These returns compare to the 6.54% cumulative total return of the Fund’s benchmark, the Russell 1000® Growth Index (with dividends reinvested) (the “Index”), during the same period. |
| Q | | What key factors were most responsible for the Fund’s performance during the Reporting Period? |
| A | | The Fund underperformed the Index during the Reporting Period primarily because of stock selection based on one of our quantitative model’s investment themes. On the positive side, stock selection based on four of our other five investment themes added to relative performance. |
| Q | | What impact did the Fund’s investment themes have on performance during the Reporting Period? |
| A | | In keeping with our investment approach, we use our quantitative model and six investment themes to take a long-term view of market patterns and look for inefficiencies, selecting stocks for the Fund and overweighting or underweighting the ones chosen by the model. Over time and by design, the performance of any one of the model’s investment themes tends to have a low correlation with the model’s other themes, demonstrating the diversification benefit of the Fund’s theme-driven quantitative model. The variance in performance supports our research indicating that the diversification provided by our different investment themes is a significant investment advantage over the long term, even though the Fund may experience underperformance in the short term. Of course, diversification does not protect an investor from market risk nor does it ensure a profit. |
| | During the Reporting Period, four of our six investment themes contributed positively to the Fund’s relative returns — Sentiment, Momentum, Profitability and Management. The Sentiment theme reflects selected investment views and decisions of individuals and financial intermediaries. The Momentum theme seeks to predict drifts in stock prices caused by delayed investor reaction to company-specific information and information about related companies. The Profitability theme assesses whether a company is earning more than its cost of capital, while the Management theme assesses the characteristics, policies and strategic decisions of company management. |
| | Valuation detracted from relative performance. The Valuation theme attempts to capture potential mispricings of securities, typically by comparing a measure of the company’s intrinsic value to its market value. |
| | The Quality theme, which seeks to assess both firm and management quality, had a rather neutral impact on relative returns during the Reporting Period. |
| Q | | How did the Fund’s sector and industry allocations affect relative performance? |
| A | | In constructing the Fund’s portfolio, we focus on picking stocks rather than on making sector or industry bets. Consequently, the Fund is similar to the Index in terms of its sector and industry allocations and its style. Changes in its sector or industry weights generally do not have a meaningful impact on relative performance. |
6
PORTFOLIO RESULTS
| Q | | Did stock selection help or hurt Fund performance during the Reporting Period? |
| A | | We seek to outpace the Index by overweighting stocks we expect to outperform and underweighting those we think may lag. At the same time, we strive to maintain a risk profile similar to the Index. The Fund’s investments are selected using fundamental research and a variety of quantitative techniques based on our investment themes. For example, the Fund aims to hold a basket of stocks with better Momentum characteristics than the benchmark. |
| | During the Reporting Period, security selection overall hurt the Fund’s relative performance. Our stock choices in the health care, information technology and materials sectors detracted from relative results. Investments in the energy, industrials and financials sectors contributed positively. |
| Q | | Which individual stock positions detracted most from the Fund’s results during the Reporting Period? |
| A | | The Fund was hampered by its underweight positions in Amazon and Boeing as well as by an overweight in GameStop. We adopted the underweight in online retailer Amazon because of our negative views on Valuation and Quality, while the underweight in aircraft manufacturer Boeing was the result of our negative views on Quality and Profitability. The Fund was overweight video game retailer GameStop due to our positive views on Momentum and Valuation. |
| Q | | Which individual stock positions contributed most to the Fund’s relative returns during the Reporting Period? |
| A | | The Fund benefited from overweight positions in petroleum refiner Tesoro; biotechnology company Biogen; and home improvement retailer Lowe’s Companies. Our positive views on Sentiment and Valuation resulted in the Fund’s overweight in Tesoro. The overweight in Biogen was due to our positive views on Sentiment and Profitability. Our positive views on Sentiment and Quality led us to overweight Lowe’s Companies. |
| Q | | How did the Fund use derivatives and similar instruments during the Reporting Period? |
| A | | During the Reporting Period, we used financial futures contracts to equitize the Fund’s cash holdings. In other words, we put the Fund’s cash holdings to work by using them as collateral for the purchase of financial futures contracts. |
| Q | | What was the Fund’s sector positioning relative to the Index at the end of the Reporting Period? |
| A | | At the end of the Reporting Period, the Fund was overweight the energy, health care and telecommunication services sectors relative to the Index. Compared to the Index, the Fund was underweight the industrials, consumer discretionary, materials, financials, information technology and consumer staples sectors. The Fund was relatively neutral compared to the Index in the utilities sector at the end of the Reporting Period. |
7
FUND BASICS
Large Cap Growth Insights Fund
as of April 30, 2015
| | | | | | | | | | |
| | PERFORMANCE REVIEW | |
| | | November 1, 2014–April 30, 2015 | | Fund Total Return
(based on NAV)1 | | | Russell 1000®
Growth Index2 | |
| | Class A | | | 5.63 | % | | | 6.54 | % |
| | Class C | | | 5.24 | | | | 6.54 | |
| | Institutional | | | 5.86 | | | | 6.54 | |
| | Service | | | 5.62 | | | | 6.54 | |
| | Class IR | | | 5.75 | | | | 6.54 | |
| | | Class R | | | 5.54 | | | | 6.54 | |
| | 1 | | The net asset value (“NAV”) represents the net assets of the class of the Fund (ex-dividend) divided by the total number of shares of the class outstanding. The Fund’s performance assumes the reinvestment of dividends and other distributions. The Fund’s performance does not reflect the deduction of any applicable sales charges. |
| | 2 | | The Russell 1000® Growth Index (with dividends reinvested) is an unmanaged market capitalization weighted index of the 1000 largest U.S. companies with higher price-to-book ratios and higher forecasted growth values. The figures for the Index do not include any deduction for fees, expenses or taxes. It is not possible to invest directly in an index. |
| | | | | | | | | | | | | | | | | | | | | | |
| | STANDARDIZED TOTAL RETURNS3 | |
| | | For the period ended 3/31/15 | | One Year | | | Five Years | | | Ten Years | | | Since Inception | | | Inception Date | |
| | Class A | | | 11.41 | % | | | 14.74 | % | | | 7.06 | % | | | 8.53 | % | | | 5/1/97 | |
| | Class C | | | 15.98 | | | | 15.20 | | | | 6.84 | | | | 4.07 | | | | 8/15/97 | |
| | Institutional | | | 18.34 | | | | 16.52 | | | | 8.10 | | | | 9.13 | | | | 5/1/97 | |
| | Service | | | 17.74 | | | | 15.94 | | | | 7.58 | | | | 8.72 | | | | 5/1/97 | |
| | Class IR | | | 18.11 | | | | 16.35 | | | | N/A | | | | 7.67 | | | | 11/30/07 | |
| | | Class R | | | 17.57 | | | | 15.77 | | | | N/A | | | | 7.15 | | | | 11/30/07 | |
| | 3 | | The Standardized Total Returns are average annual total returns as of the most recent calendar quarter-end. They assume reinvestment of all distributions at NAV. These returns reflect a maximum initial sales charge of 5.5% for Class A Shares and the assumed contingent deferred sales charge for Class C Shares (1% if redeemed within 12 months of purchase). Because Institutional, Service, Class IR and Class R Shares do not involve a sales charge, such a charge is not applied to their Standardized Total Returns. |
The returns set forth in the tables above represent past performance. Past performance does not guarantee future results. The Fund’s investment return and principal value will fluctuate so that an investor’s shares, when redeemed, may be worth more or less than their original cost. Current performance may be lower or higher than the performance quoted above. Please visit our web site at www.GSAMFUNDS.com to obtain the most recent month-end returns. Performance reflects applicable fee waivers and/or expense limitations in effect during the periods shown. In their absence, performance would be reduced. Returns do not reflect the deduction of taxes that a shareholder would pay on Fund distributions or the redemption of Fund shares.
8
FUND BASICS
| | | | | | | | | | |
| | EXPENSE RATIOS4 | |
| | | | | Net Expense Ratio (Current) | | | Gross Expense Ratio (Before Waivers) | |
| | Class A | | | 0.96 | % | | | 1.20 | % |
| | Class C | | | 1.71 | | | | 1.95 | |
| | Institutional | | | 0.56 | | | | 0.80 | |
| | Service | | | 1.06 | | | | 1.30 | |
| | Class IR | | | 0.71 | | | | 0.97 | |
| | | Class R | | | 1.21 | | | | 1.45 | |
| | 4 | | The expense ratios of the Fund, both current (net of applicable fee waivers and/or expense limitations) and before waivers (gross of applicable fee waivers and/or expense limitations) are as set forth above according to the most recent publicly available Prospectus for the Fund and may differ from the expense ratios disclosed in the Financial Highlights in this report. Pursuant to a contractual arrangement, the Fund’s waivers and/or expense limitations will remain in place through at least February 29, 2016, and prior to such date the Investment Adviser may not terminate the arrangements without the approval of the Fund’s Board of Trustees. If these arrangements are discontinued in the future, the expense ratios may change without shareholder approval. |
| | | | | | | | |
| | TOP TEN HOLDINGS AS OF 4/30/155 |
| | | Holding | | % of Net Assets | | | Line of Business |
| | Apple, Inc. | | | 7.5 | % | | Computers & Peripherals |
| | Verizon Communications, Inc. | | | 2.9 | | | Diversified Telecommunication
Services |
| | Gilead Sciences, Inc. | | | 2.2 | | | Biotechnology |
| | PepsiCo., Inc. | | | 2.2 | | | Beverages |
| | Microsoft Corp. | | | 2.2 | | | Software |
| | Google, Inc. Class C | | | 2.2 | | | Internet Software & Services |
| | Comcast Corp. Class A | | | 2.2 | | | Media |
| | Oracle Corp. | | | 1.9 | | | Software |
| | Amgen, Inc. | | | 1.8 | | | Biotechnology |
| | | 3M Co. | | | 1.8 | | | Industrial Conglomerates |
| | 5 | | The top 10 holdings may not be representative of the Fund’s future investments. |
9
FUND BASICS
|
| FUND VS. BENCHMARK SECTOR ALLOCATIONS6 |
| As of April 30, 2015 |
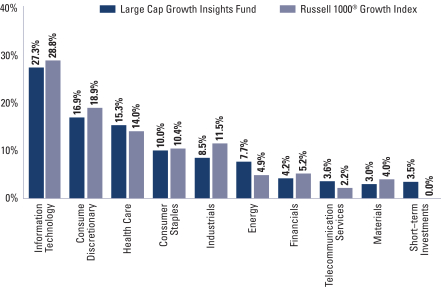
| | 6 | | The Fund is actively managed and, as such, its composition may differ over time. Consequently, the Fund’s overall sector allocations may differ from the percentages contained in the graph above. The graph categorizes investments using the Global Industry Classification Standard (“GICS”), however, the sector classifications used by the portfolio management team may differ from GICS. The percentage shown for each investment category reflects the value of investments in that category as a percentage of market value (excluding investments in the securities lending reinvestment vehicle, if any). Investments in the securities lending reinvestment vehicle represented 0.5% of the Fund’s net assets as of April 30, 2015. Short-term investments represent repurchase agreements. The graph depicts the Fund’s investments but may not represent the Fund’s market exposure due to the exclusion of certain derivatives, if any, as listed in the Additional Investment Information section of the Schedule of Investments. |
10
PORTFOLIO RESULTS
Goldman Sachs Large Cap Value Insights Fund
Investment Objective
The Fund seeks long-term growth of capital and dividend income.
Portfolio Management Discussion and Analysis
Below, the Goldman Sachs Quantitative Investment Strategies Team discusses the Goldman Sachs Large Cap Value Insights Fund’s (the “Fund”) performance and positioning for the six-month period ended April 30, 2015 (the “Reporting Period”).
| Q | | How did the Fund perform during the Reporting Period? |
| A | | During the Reporting Period, the Fund’s Class A, C, Institutional, Service, IR and R Shares generated cumulative total returns, without sales charges, of 2.20%, 1.90%, 2.40%, 2.20%, 2.40% and 2.10%, respectively. These returns compare to the 2.89% cumulative total return of the Fund’s benchmark, the Russell 1000® Value Index (with dividends reinvested) (the “Index”), during the same period. |
| Q | | What key factors were most responsible for the Fund’s performance during the Reporting Period? |
| A | | The Fund underperformed the Index during the Reporting Period primarily because of stock selection based on one of our quantitative model’s investment themes. On the positive side, stock selection based on three of our other five investment themes added to relative performance. |
| Q | | What impact did the Fund’s investment themes have on performance during the Reporting Period? |
| A | | In keeping with our investment approach, we use our quantitative model and six investment themes to take a long-term view of market patterns and look for inefficiencies, selecting stocks for the Fund and overweighting or underweighting the ones chosen by the model. Over time and by design, the performance of any one of the model’s investment themes tends to have a low correlation with the model’s other themes, demonstrating the diversification benefit of the Fund’s theme-driven quantitative model. The variance in performance supports our research indicating that the diversification provided by our different investment themes is a significant investment advantage over the long term, even though the Fund may experience underperformance in the short term. Of course, diversification does not protect an investor from market risk nor does it ensure a profit. |
| | During the Reporting Period, three of our six investment themes contributed positively to relative performance. Sentiment and Momentum were the strongest performing themes. The Sentiment theme reflects selected investment views and decisions of individuals and financial intermediaries. The Momentum theme seeks to predict drifts in stock prices caused by delayed investor reaction to company-specific information and information about related companies. Profitability also added to relative returns, albeit to a lesser extent. The Profitability theme assesses whether a company is earning more than its cost of capital. |
| | Valuation detracted from relative results. The Valuation theme attempts to capture potential mispricings of securities, typically by comparing a measure of the company’s intrinsic value to its market value. |
| | The impact of our Management and Quality themes on relative performance was rather neutral during the Reporting Period. The Management theme assesses the characteristics, policies and strategic decisions of company management. The Quality theme seeks to assess both firm and management quality. |
| Q | | How did the Fund’s sector and industry allocations affect relative performance? |
| A | | In constructing the Fund’s portfolio, we focus on picking stocks rather than on making sector or industry bets. |
11
PORTFOLIO RESULTS
| | Consequently, the Fund is similar to the Index in terms of its sector and industry allocations and its style. Changes in its sector or industry weights generally do not have a meaningful impact on relative performance. |
| Q | | Did stock selection help or hurt Fund performance during the Reporting Period? |
| A | | We seek to outpace the Index by overweighting stocks we expect to outperform and underweighting those we think may lag. At the same time, we strive to maintain a risk profile similar to the Index. The Fund’s investments are selected using fundamental research and a variety of quantitative techniques based on our investment themes. For example, the Fund aims to hold a basket of stocks with better Momentum characteristics than the benchmark. |
| | During the Reporting Period, security selection overall dampened the Fund’s relative performance. Stock choices in the consumer discretionary, health care and telecommunication services sectors detracted from results. Investments in two sectors — energy and financials — contributed positively. |
| Q | | Which individual stock positions detracted most from the Fund’s results during the Reporting Period? |
| A | | The Fund was hurt during the Reporting Period by overweight positions in Wal-Mart Stores, which operates discount department and warehouse stores; Xerox, a document management company; and GameStop, a video game retailer. We chose to overweight Wal-Mart Stores because of our positive views on Sentiment and Valuation. The Fund was overweight Xerox and GameStop because of our positive views on Sentiment, Valuation and Quality. |
| Q | | Which individual stock positions contributed most to the Fund’s relative returns during the Reporting Period? |
| A | | The Fund benefited from overweight positions in Biogen, a biotechnology company; Lowe’s Companies, a home improvement retailer; and Cameron International, a provider of flow equipment products, systems and services to the oil, gas and process industries. Our positive views on Valuation, Quality and Momentum led us to overweight Biogen. We adopted the overweights in Lowe’s Companies and Cameron International because of our positive views on Sentiment and Quality. |
| Q | | How did the Fund use derivatives and similar instruments during the Reporting Period? |
| A | | During the Reporting Period, we used financial futures contracts to equitize the Fund’s cash holdings. In other words, we put the Fund’s cash holdings to work by using them as collateral for the purchase of financial futures contracts. |
| Q | | What was the Fund’s sector positioning relative to the Index at the end of the Reporting Period? |
| A | | At the end of the Reporting Period, the Fund was overweight the information technology, health care, consumer staples, energy, telecommunication services and consumer discretionary sectors relative to the Index. Compared to the Index, the Fund was underweight the utilities, industrials, financials and materials sectors at the end of the Reporting Period. |
12
FUND BASICS
Large Cap Value Insights Fund
as of April 30, 2015
| | | | | | | | | | |
| | PERFORMANCE REVIEW | |
| | | November 1, 2014–April 30, 2015 | | Fund Total Return
(based on NAV)1 | | | Russell 1000®
Value Index2 | |
| | Class A | | | 2.20 | % | | | 2.89 | % |
| | Class C | | | 1.90 | | | | 2.89 | |
| | Institutional | | | 2.40 | | | | 2.89 | |
| | Service | | | 2.20 | | | | 2.89 | |
| | Class IR | | | 2.40 | | | | 2.89 | |
| | | Class R | | | 2.10 | | | | 2.89 | |
| | 1 | | The net asset value (“NAV”) represents the net assets of the class of the Fund (ex-dividend) divided by the total number of shares of the class outstanding. The Fund’s performance assumes the reinvestment of dividends and other distributions. The Fund’s performance does not reflect the deduction of any applicable sales charges. |
| | 2 | | The Russell 1000® Value Index (with dividends reinvested) is an unmanaged market capitalization weighted index of the 1000 largest U.S. companies with lower price-to-book ratios and lower forecasted growth values. The figures for the Index do not include any deduction for fees, expenses or taxes. It is not possible to invest directly in an index. |
| | | | | | | | | | | | | | | | | | | | |
| | STANDARDIZED TOTAL RETURNS3 |
| | | For the period ended 3/31/15 | | One Year | | | Five Years | | | Ten Years | | | Since Inception | | | Inception Date |
| | Class A | | | 3.52 | % | | | 12.71 | % | | | 5.51 | % | | | 5.14 | % | | 12/31/98 |
| | Class C | | | 7.78 | | | | 13.16 | | | | 5.32 | | | | 4.72 | | | 12/31/98 |
| | Institutional | | | 10.02 | | | | 14.48 | | | | 6.54 | | | | 5.92 | | | 12/31/98 |
| | Service | | | 9.43 | | | | 13.89 | | | | 6.00 | | | | 5.40 | | | 12/31/98 |
| | Class IR | | | 9.77 | | | | 14.30 | | | | N/A | | | | 5.37 | | | 11/30/07 |
| | | Class R | | | 9.23 | | | | 13.73 | | | | N/A | | | | 4.86 | | | 11/30/07 |
| | 3 | | The Standardized Total Returns are average annual total returns as of the most recent calendar quarter-end. They assume reinvestment of all distributions at NAV. These returns reflect a maximum initial sales charge of 5.5% for Class A Shares and the assumed contingent deferred sales charge for Class C Shares (1% if redeemed within 12 months of purchase). Because Institutional, Service, Class IR and Class R Shares do not involve a sales charge, such a charge is not applied to their Standardized Total Returns. |
The returns set forth in the tables above represent past performance. Past performance does not guarantee future results. The Fund’s investment return and principal value will fluctuate so that an investor’s shares, when redeemed, may be worth more or less than their original cost. Current performance may be lower or higher than the performance quoted above. Please visit our web site at www.GSAMFUNDS.com to obtain the most recent month-end returns. Performance reflects applicable fee waivers and/or expense limitations in effect during the periods shown. In their absence, performance would be reduced. Returns do not reflect the deduction of taxes that a shareholder would pay on Fund distributions or the redemption of Fund shares.
13
FUND BASICS
| | | | | | | | | | |
| | EXPENSE RATIOS4 | |
| | | | | Net Expense Ratio (Current) | | | Gross Expense Ratio (Before Waivers) | |
| | Class A | | | 0.96 | % | | | 1.14 | % |
| | Class C | | | 1.71 | | | | 1.89 | |
| | Institutional | | | 0.56 | | | | 0.74 | |
| | Service | | | 1.06 | | | | 1.24 | |
| | Class IR | | | 0.71 | | | | 0.88 | |
| | | Class R | | | 1.21 | | | | 1.39 | |
| | 4 | | The expense ratios of the Fund, both current (net of applicable fee waivers and/or expense limitations) and before waivers (gross of applicable fee waivers and/or expense limitations) are as set forth above according to the most recent publicly available Prospectus for the Fund and may differ from the expense ratios disclosed in the Financial Highlights in this report. Pursuant to a contractual arrangement, the Fund’s waivers and/or expense limitations will remain in place through at least February 29, 2016, and prior to such date the Investment Adviser may not terminate the arrangements without the approval of the Fund’s Board of Trustees. If these arrangements are discontinued in the future, the expense ratios may change without shareholder approval. |
| | | | | | | | |
| | TOP TEN HOLDINGS AS OF 4/30/155 |
| | | Holding | | % of Net Assets | | | Line of Business |
| | Exxon Mobil Corp. | | | 4.0 | % | | Oil, Gas & Consumable Fuels |
| | JPMorgan Chase & Co. | | | 3.4 | | | Commercial Banks |
| | Johnson & Johnson | | | 3.2 | | | Pharmaceuticals |
| | Pfizer, Inc. | | | 3.1 | | | Pharmaceuticals |
| | Bank of America Corp. | | | 2.7 | | | Commercial Banks |
| | Berkshire Hathaway, Inc. Class B | | | 2.4 | | | Diversified Financial Services |
| | General Electric Co. | | | 2.2 | | | Industrial Conglomerates |
| | Wal-Mart Stores, Inc. | | | 2.1 | | | Food & Staples Retailing |
| | CVS Health Corp. | | | 2.0 | | | Food & Staples Retailing |
| | | Bristol-Myers Squibb Co. | | | 1.7 | | | Pharmaceuticals |
| | 5 | | The top 10 holdings may not be representative of the Fund’s future investments. |
14
FUND BASICS
|
| FUND VS. BENCHMARK SECTOR ALLOCATIONS6 |
| As of April 30, 2015 |
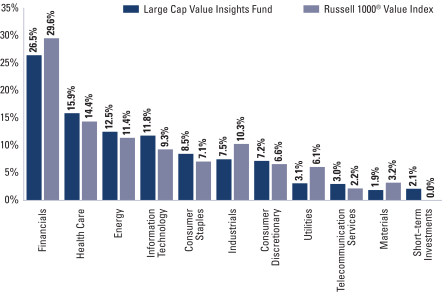
| | 6 | | The Fund is actively managed and, as such, its composition may differ over time. Consequently, the Fund’s overall sector allocations may differ from the percentages contained in the graph above. The graph categorizes investments using the Global Industry Classification Standard (“GICS”), however, the sector classifications used by the portfolio management team may differ from GICS. The percentage shown for each investment category reflects the value of investments in that category as a percentage of market value (excluding investments in the securities lending reinvestment vehicle, if any). Investments in the securities lending reinvestment vehicle represented 0.7% of the Fund’s net assets as of April 30, 2015. Short-term investments represent repurchase agreements. The graph depicts the Fund’s investments but may not represent the Fund’s market exposure due to the exclusion of certain derivatives, if any, as listed in the Additional Investment Information section of the Schedule of Investments. |
15
PORTFOLIO RESULTS
Goldman Sachs Small Cap Equity Insights Fund
Investment Objective
The Fund seeks long-term growth of capital.
Portfolio Management Discussion and Analysis
Below, the Goldman Sachs Quantitative Investment Strategies Team discusses the Goldman Sachs Small Cap Equity Insights Fund’s (the “Fund”) performance and positioning for the six-month period ended April 30, 2015 (the “Reporting Period”).
| Q | | How did the Fund perform during the Reporting Period? |
| A | | During the Reporting Period, the Fund’s Class A, C, Institutional, Service, IR and R Shares generated cumulative total returns, without sales charges, of 6.74%, 6.37%, 6.98%, 6.67%, 6.93% and 6.67%, respectively. These returns compare to the 4.65% cumulative total return of the Fund’s benchmark, the Russell 2000® Index (with dividends reinvested) (the “Index”), during the same period. |
| Q | | What key factors were most responsible for the Fund’s performance during the Reporting Period? |
| A | | The Fund outperformed the Index during the Reporting Period because of stock selection based on our quantitative model and four of its six investment themes. |
| Q | | What impact did the Fund’s investment themes have on performance during the Reporting Period? |
| A | | In keeping with our investment approach, we use our quantitative model and six investment themes to take a long-term view of market patterns and look for inefficiencies, selecting stocks for the Fund and overweighting or underweighting the ones chosen by the model. Over time and by design, the performance of any one of the model’s investment themes tends to have a low correlation with the model’s other themes, demonstrating the diversification benefit of the Fund’s theme-driven quantitative model. The variance in performance supports our research indicating that the diversification provided by our different investment themes is a significant investment advantage over the long term, even though the Fund may experience underperformance in the short term. Of course, diversification does not protect an investor from market risk nor does it ensure a profit. |
| | During the Reporting Period, four of our six investment themes added to the Fund’s relative returns — Sentiment, Profitability, Momentum and Quality. The Sentiment theme reflects selected investment views and decisions of individuals and financial intermediaries. The Profitability theme assesses whether a company is earning more than its cost of capital. The Momentum theme seeks to predict drifts in stock prices caused by delayed investor reaction to company-specific information and information about related companies. The Quality theme seeks to assess both firm and management quality. |
| | Valuation and Management detracted from relative performance. The Valuation theme attempts to capture potential mispricings of securities, typically by comparing a measure of the company’s intrinsic value to its market value. The Management theme assesses the characteristics, policies and strategic decisions of company management. |
| Q | | How did the Fund’s sector and industry allocations affect relative performance? |
| A | | In constructing the Fund’s portfolio, we focus on picking stocks rather than on making sector or industry bets. Consequently, the Fund is similar to the Index in terms of its sector and industry allocations and its style. Changes in its sector or industry weights generally do not have a meaningful impact on relative performance. |
| Q | | Did stock selection help or hurt Fund performance during the Reporting Period? |
| A | | We seek to outpace the Index by overweighting stocks we expect to outperform and underweighting those we think may |
16
PORTFOLIO RESULTS
| | lag. At the same time, we strive to maintain a risk profile similar to the Index. The Fund’s investments are selected using fundamental research and a variety of quantitative techniques based on our investment themes. For example, the Fund aims to hold a basket of stocks with better Momentum characteristics than the benchmark. |
| | During the Reporting Period, security selection overall added to the Fund’s relative performance. Stock selection in the information technology, industrials and financials sectors contributed most positively. Stock picks in the consumer discretionary, consumer staples and utilities sectors dampened relative returns the most. |
| Q | | Which individual stock positions contributed most to the Fund’s relative returns during the Reporting Period? |
| A | | The Fund benefited from overweight positions in Dyax, NPS Pharmaceuticals and JetBlue Airways. We assumed the overweight in biopharmaceutical company Dyax because of our positive views on Sentiment and Profitability. The overweight in drug maker NPS Pharmaceuticals was the result of our positive views on Momentum and Valuation. The Fund was overweight JetBlue Airways based on our positive views on Quality and Sentiment. |
| Q | | Which individual stock positions detracted most from the Fund’s results during the Reporting Period? |
| A | | The Fund was hurt by overweight positions in Genomic Health, a molecular diagnostics company; Infinity Pharmaceuticals, a biopharmaceutical maker; and Schnitzer Steel Industries, a metals recycling company. We chose to overweight Genomic Health and Schnitzer Steel Industries due to our positive views on Quality and Valuation. The overweight in Infinity Pharmaceuticals was the result of our positive views on Sentiment and Momentum. |
| Q | | How did the Fund use derivatives and similar instruments during the Reporting Period? |
| A | | During the Reporting Period, we used financial futures contracts to equitize the Fund’s cash holdings. In other words, we put the Fund’s cash holdings to work by using them as collateral for the purchase of financial futures contracts. |
| Q | | What was the Fund’s sector positioning relative to the Index at the end of the Reporting Period? |
| A | | At the end of the Reporting Period, the Fund was overweight the consumer discretionary, health care and energy sectors relative to the Index. Compared to the Index, the Fund was underweight the utilities, consumer staples and industrials sectors. The Fund was relatively neutral compared to the Index in financials, information technology, materials and telecommunication services at the end of the Reporting Period. |
17
FUND BASICS
Small Cap Equity Insights Fund
as of April 30, 2015
| | | | | | | | | | |
| | PERFORMANCE REVIEW | |
| | | November 1, 2014–April 30, 2015 | | Fund Total Return
(based on NAV)1 | | | Russell 2000® Index2 | |
| | Class A | | | 6.74 | % | | | 4.65 | % |
| | Class C | | | 6.37 | | | | 4.65 | |
| | Institutional | | | 6.98 | | | | 4.65 | |
| | Service | | | 6.67 | | | | 4.65 | |
| | Class IR | | | 6.93 | | | | 4.65 | |
| | | Class R | | | 6.67 | | | | 4.65 | |
| | 1 | | The net asset value (“NAV”) represents the net assets of the class of the Fund (ex-dividend) divided by the total number of shares of the class outstanding. The Fund’s performance assumes the reinvestment of dividends and other distributions. The Fund’s performance does not reflect the deduction of any applicable sales charges. |
| | 2 | | The Russell 2000® Index (with dividends reinvested) is an unmanaged index of common stock prices that measures the performance of the 2000 smallest companies in the Russell 3000® Index. The figures for the Index do not include any deduction for fees, expenses or taxes. It is not possible to invest directly in an index. |
| | | | | | | | | | | | | | | | | | | | |
| | STANDARDIZED TOTAL RETURNS3 |
| | | For the period ended 3/31/15 | | One Year | | | Five Years | | | Ten Years | | | Since Inception | | | Inception Date |
| | Class A | | | 6.83 | % | | | 13.58 | % | | | 6.15 | % | | | 6.66 | % | | 8/15/97 |
| | Class C | | | 11.21 | | | | 14.02 | | | | 5.96 | | | | 6.22 | | | 8/15/97 |
| | Institutional | | | 13.50 | | | | 15.33 | | | | 7.17 | | | | 7.42 | | | 8/15/97 |
| | Service | | | 12.95 | | | | 14.74 | | | | 6.63 | | | | 6.90 | | | 8/15/97 |
| | Class IR | | | 13.30 | | | | 15.14 | | | | N/A | | | | 8.81 | | | 11/30/07 |
| | | Class R | | | 12.78 | | | | 14.58 | | | | N/A | | | | 8.30 | | | 11/30/07 |
| | 3 | | The Standardized Total Returns are average annual total returns as of the most recent calendar quarter-end. They assume reinvestment of all distributions at NAV. These returns reflect a maximum initial sales charge of 5.5% for Class A Shares and the assumed contingent deferred sales charge for Class C Shares (1% if redeemed within 12 months of purchase). Because Institutional, Service, Class IR and Class R Shares do not involve a sales charge, such a charge is not applied to their Standardized Total Returns. |
The returns set forth in the tables above represent past performance. Past performance does not guarantee future results. The Fund’s investment return and principal value will fluctuate so that an investor’s shares, when redeemed, may be worth more or less than their original cost. Current performance may be lower or higher than the performance quoted above. Please visit our web site at www.GSAMFUNDS.com to obtain the most recent month-end returns. Performance reflects applicable fee waivers and/or expense limitations in effect during the periods shown. In their absence, performance would be reduced. Returns do not reflect the deduction of taxes that a shareholder would pay on Fund distributions or the redemption of Fund shares.
18
FUND BASICS
| | | | | | | | | | |
| | EXPENSE RATIOS4 | |
| | | | | Net Expense Ratio (Current) | | | Gross Expense Ratio (Before Waivers) | |
| | Class A | | | 1.27 | % | | | 1.51 | % |
| | Class C | | | 2.02 | | | | 2.26 | |
| | Institutional | | | 0.87 | | | | 1.11 | |
| | Service | | | 1.37 | | | | 1.60 | |
| | Class IR | | | 1.02 | | | | 1.24 | |
| | | Class R | | | 1.52 | | | | 1.76 | |
| | 4 | | The expense ratios of the Fund, both current (net of applicable fee waivers and/or expense limitations) and before waivers (gross of applicable fee waivers and/or expense limitations) are as set forth above according to the most recent publicly available Prospectus for the Fund and may differ from the expense ratios disclosed in the Financial Highlights in this report. Pursuant to a contractual arrangement, the Fund’s waivers and/or expense limitations will remain in place through at least February 29, 2016, and prior to such date the Investment Adviser may not terminate the arrangements without the approval of the Fund’s Board of Trustees. If these arrangements are discontinued in the future, the expense ratios may change without shareholder approval. |
| | | | | | | | |
| | TOP TEN HOLDINGS AS OF 4/30/155 |
| | | Holding | | % of Net Assets | | | Line of Business |
| | Isis Pharmaceuticals, Inc. | | | 0.9 | % | | Biotechnology |
| | SS&C Technologies Holdings, Inc. | | | 0.9 | | | Software |
| | LogMeIn, Inc. | | | 0.9 | | | Internet Software & Services |
| | Aruba Networks, Inc. | | | 0.8 | | | Communications Equipment |
| | Jack in the Box, Inc. | | | 0.8 | | | Hotels, Restaurants & Leisure |
| | Marriott Vacations Worldwide Corp. | | | 0.8 | | | Hotels, Restaurants & Leisure |
| | AVG Technologies NV | | | 0.8 | | | Software |
| | Green Plains, Inc. | | | 0.8 | | | Oil, Gas & Consumable Fuels |
| | Cooper Tire & Rubber Co. | | | 0.8 | | | Auto Components |
| | | Dyax Corp. | | | 0.8 | | | Biotechnology |
| | 5 | | The top 10 holdings may not be representative of the Fund’s future investments. |
19
FUND BASICS
|
| FUND VS. BENCHMARK SECTOR ALLOCATIONS6 |
| As of April 30, 2015 |
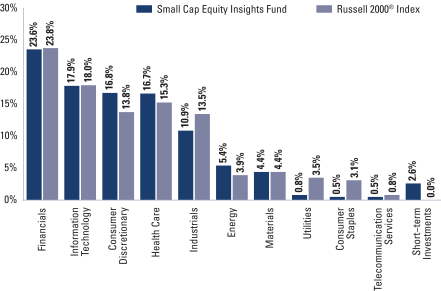
| | 6 | | The Fund is actively managed and, as such, its composition may differ over time. Consequently, the Fund’s overall sector allocations may differ from the percentages contained in the graph above. The graph categorizes investments using the Global Industry Classification Standard (“GICS”), however, the sector classifications used by the portfolio management team may differ from GICS. The percentage shown for each investment category reflects the value of investments in that category as a percentage of market value (excluding investments in the securities lending reinvestment vehicle, if any). Investments in the securities lending reinvestment vehicle represented 3.9% of the Fund’s net assets as of April 30, 2015. Short-term investments represent repurchase agreements. The graph depicts the Fund’s investments but may not represent the Fund’s market exposure due to the exclusion of certain derivatives, if any, as listed in the Additional Investment Information section of the Schedule of Investments. |
20
PORTFOLIO RESULTS
Goldman Sachs Small Cap Growth Insights Fund
Investment Objective
The Fund seeks long-term growth of capital.
Portfolio Management Discussion and Analysis
Below, the Goldman Sachs Quantitative Investment Strategies Team discusses the Goldman Sachs Small Cap Growth Insights Fund’s (the “Fund”) performance and positioning for the six-month period ended April 30, 2015 (the “Reporting Period”).
| Q | | How did the Fund perform during the Reporting Period? |
| A | | During the Reporting Period, the Fund’s Class A, C, Institutional, IR and R Shares generated cumulative total returns, without sales charges, of 7.85%, 7.47%, 8.09%, 7.97% and 7.72%, respectively. These returns compare to the 7.25% cumulative total return of the Fund’s benchmark, the Russell 2000® Growth Index (with dividends reinvested) (the “Index”), during the same period. |
| Q | | What key factors were most responsible for the Fund’s performance during the Reporting Period? |
| A | | The Fund outperformed the Index during the Reporting Period because of stock selection based on our quantitative model and two of its six investment themes. |
| Q | | What impact did the Fund’s investment themes have on performance during the Reporting Period? |
| A | | In keeping with our investment approach, we use our quantitative model and six investment themes to take a long-term view of market patterns and look for inefficiencies, selecting stocks for the Fund and overweighting or underweighting the ones chosen by the model. Over time and by design, the performance of any one of the model’s investment themes tends to have a low correlation with the model’s other themes, demonstrating the diversification benefit of the Fund’s theme-driven quantitative model. The variance in performance supports our research indicating that the diversification provided by our different investment themes is a significant investment advantage over the long term, even though the Fund may experience underperformance in the short term. Of course, diversification does not protect an investor from market risk nor does it ensure a profit. |
| | During the Reporting Period, two of our six investment themes added to relative returns. Our strongest performing theme was Sentiment. The Sentiment theme reflects selected investment views and decisions of individuals and financial intermediaries. Our Profitability theme also contributed positively. The Profitability theme assesses whether a company is earning more than its cost of capital. |
| | Detracting from the Fund’s relative performance were Valuation, Management and Quality. The Valuation theme attempts to capture potential mispricings of securities, typically by comparing a measure of the company’s intrinsic value to its market value. The Management theme assesses the characteristics, policies and strategic decisions of company management. The Quality theme seeks to assess both firm and management quality. |
| | Our Momentum theme had a rather neutral impact on relative performance during the Reporting Period. The Momentum theme seeks to predict drifts in stock prices caused by delayed investor reaction to company-specific information and information about related companies. |
| Q | | How did the Fund’s sector and industry allocations affect relative performance? |
| A | | In constructing the Fund’s portfolio, we focus on picking stocks rather than on making sector or industry bets. Consequently, the Fund is similar to the Index in terms of its sector and industry allocations and style. Changes in its sector or industry weights generally do not have a meaningful impact on relative performance. |
| Q | | Did stock selection help or hurt Fund performance during the Reporting Period? |
| A | | We seek to outpace the Index by overweighting stocks we expect to outperform and underweighting those we think may lag. At the same time, we strive to maintain a risk profile |
21
PORTFOLIO RESULTS
| | similar to the Index. The Fund’s investments are selected using fundamental research and a variety of quantitative techniques based on our investment themes. For example, the Fund aims to hold a basket of stocks with better Momentum characteristics than the benchmark. |
| | During the Reporting Period, stock selection overall enhanced the Fund’s relative results, with investments in the industrials, health care and information technology sectors adding to returns. Stock picks in the consumer discretionary, energy and consumer staples sectors detracted from relative performance. |
| Q | | Which individual stock positions contributed most to the Fund’s relative returns during the Reporting Period? |
| A | | The Fund benefited from overweight positions in Dyax, JetBlue Airways and Impax Laboratories. We adopted the overweight in biopharmaceutical company Dyax because of our positive views on Sentiment and Profitability. The Fund was overweight JetBlue Airways based on our positive views on Quality and Sentiment. Our positive views on Valuation and Sentiment led us to overweight pharmaceutical company Impax Laboratories. |
| Q | | Which individual stock positions detracted most from the Fund’s results during the Reporting Period? |
| A | | The Fund was hurt by an underweight position in Bluebird Bio, a clinical stage biotechnology company. Overweight positions in restaurant chain El Pollo Loco and U.K.-based grocery and general merchandise retailer Tesco also hampered relative results. We assumed the underweight in Bluebird Bio because of our negative views on Momentum and Quality. The Fund was overweight El Pollo Loco based on our positive views on Momentum and Profitability, while the overweight in Tesco was the result of our positive views on Quality. |
| Q | | How did the Fund use derivatives and similar instruments during the Reporting Period? |
| A | | During the Reporting Period, we used financial futures contracts to equitize the Fund’s cash holdings. In other words, we put the Fund’s cash holdings to work by using them as collateral for the purchase of financial futures contracts. |
| Q | | What was the Fund’s sector positioning relative to the Index at the end of the Reporting Period? |
| A | | At the end of the Reporting Period, the Fund was overweight the financials and energy sectors relative to the Index. Compared to the Index, the Fund was underweight the consumer staples, information technology, utilities and industrials sectors. The Fund was relatively neutral relative to the Index in the health care, consumer discretionary, materials and telecommunication services sectors at the end of the Reporting Period. |
22
FUND BASICS
Small Cap Growth Insights Fund
as of April 30, 2015
| | | | | | | | | | |
| | PERFORMANCE REVIEW | |
| | | November 1, 2014–April 30, 2015 | | Fund Total Return
(based on NAV)1 | | | Russell 2000®
Growth Index2 | |
| | Class A | | | 7.85 | % | | | 7.25 | % |
| | Class C | | | 7.47 | | | | 7.25 | |
| | Institutional | | | 8.09 | | | | 7.25 | |
| | Class IR | | | 7.97 | | | | 7.25 | |
| | | Class R | | | 7.72 | | | | 7.25 | |
| | 1 | | The net asset value (“NAV”) represents the net assets of the class of the Fund (ex-dividend) divided by the total number of shares of the class outstanding. The Fund’s performance assumes the reinvestment of dividends and other distributions. The Fund’s performance does not reflect the deduction of any applicable sales charges. |
| | 2 | | The Russell 2000® Growth Index measures the performance of the small-cap growth stocks of the U.S. equity universe. The Index figures do not reflect any deduction for fees, expenses or taxes. It is not possible to invest directly in an index. It includes those Russell 2000 companies with higher price-to-value ratios and higher forecasted growth values. |
| | | | | | | | | | | | | | | | |
| | STANDARDIZED TOTAL RETURNS3 |
| | | For the period ended 3/31/15 | | One Year | | | Five Years | | | Since Inception | | | Inception Date |
| | Class A | | | 7.75 | % | | | 15.82 | % | | | 7.10 | % | | 6/25/07 |
| | Class C | | | 12.08 | | | | 16.24 | | | | 7.08 | | | 6/25/07 |
| | Institutional | | | 14.45 | | | | 17.58 | | | | 8.32 | | | 6/25/07 |
| | Class IR | | | 14.29 | | | | 17.42 | | | | 10.05 | | | 11/30/07 |
| | | Class R | | | 13.71 | | | | 16.82 | | | | 9.49 | | | 11/30/07 |
| | 3 | | The Standardized Total Returns are average annual total returns as of the most recent calendar quarter-end. They assume reinvestment of all distributions at NAV. These returns reflect a maximum initial sales charge of 5.5% for Class A Shares and the assumed contingent deferred sales charge for Class C Shares (1% if redeemed within 12 months of purchase). Because Institutional, Class IR and Class R Shares do not involve a sales charge, such a charge is not applied to their Standardized Total Returns. |
The returns set forth in the tables above represent past performance. Past performance does not guarantee future results. The Fund’s investment return and principal value will fluctuate so that an investor’s shares, when redeemed, may be worth more or less than their original cost. Current performance may be lower or higher than the performance quoted above. Please visit our web site at www.GSAMFUNDS.com to obtain the most recent month-end returns. Performance reflects applicable fee waivers and/or expense limitations in effect during the periods shown. In their absence, performance would be reduced. Returns do not reflect the deduction of taxes that a shareholder would pay on Fund distributions or the redemption of Fund shares.
23
FUND BASICS
| | | | | | | | | | |
| | EXPENSE RATIOS4 | |
| | | | | Net Expense Ratio (Current) | | | Gross Expense Ratio (Before Waivers) | |
| | Class A | | | 1.28 | % | | | 1.87 | % |
| | Class C | | | 2.03 | | | | 2.62 | |
| | Institutional | | | 0.88 | | | | 1.48 | |
| | Class IR | | | 1.03 | | | | 1.63 | |
| | | Class R | | | 1.52 | | | | 2.10 | |
| | 4 | | The expense ratios of the Fund, both current (net of applicable fee waivers and/or expense limitations) and before waivers (gross of applicable fee waivers and/or expense limitations) are as set forth above according to the most recent publicly available Prospectus for the Fund and may differ from the expense ratios disclosed in the Financial Highlights in this report. Pursuant to a contractual arrangement, the Fund’s waivers and/or expense limitations will remain in place through at least February 29, 2016, and prior to such date the Investment Adviser may not terminate the arrangements without the approval of the Fund’s Board of Trustees. If these arrangements are discontinued in the future, the expense ratios may change without shareholder approval. |
| | | | | | | | |
| | TOP TEN HOLDINGS AS OF 4/30/155 |
| | | Holding | | % of Net Assets | | | Line of Business |
| | Isis Pharmaceuticals, Inc. | | | 1.2 | % | | Biotechnology |
| | SS&C Technologies Holdings, Inc. | | | 0.9 | | | Software |
| | Vail Resorts, Inc. | | | 0.9 | | | Hotels, Restaurants & Leisure |
| | Manhattan Associates, Inc. | | | 0.9 | | | Software |
| | Graphic Packaging Holding Co. | | | 0.9 | | | Containers & Packaging |
| | Dyax Corp. | | | 0.8 | | | Biotechnology |
| | Jack in the Box, Inc. | | | 0.8 | | | Hotels, Restaurants & Leisure |
| | Aruba Networks, Inc. | | | 0.8 | | | Communications Equipment |
| | PAREXEL International Corp. | | | 0.8 | | | Life Sciences Tools & Services |
| | | PolyOne Corp. | | | 0.8 | | | Chemicals |
| | 5 | | The top 10 holdings may not be representative of the Fund’s future investments. |
24
FUND BASICS
|
| FUND VS. BENCHMARK SECTOR ALLOCATIONS6 |
| As of April 30, 2015 |
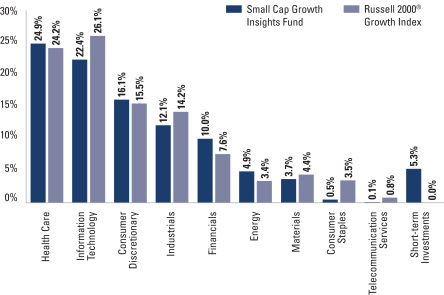
| | 6 | | The Fund is actively managed and, as such, its composition may differ over time. Consequently, the Fund’s overall sector allocations may differ from the percentages contained in the graph above. The graph categorizes investments using the Global Industry Classification Standard (“GICS”), however, the sector classifications used by the portfolio management team may differ from GICS. The percentage shown for each investment category reflects the value of investments in that category as a percentage of market value (excluding investments in the securities lending reinvestment vehicle, if any). Investments in the securities lending reinvestment vehicle represented 4.7% of the Fund’s net assets as of April 30, 2015. Short-term investments represent repurchase agreements. The graph depicts the Fund’s investments but may not represent the Fund’s market exposure due to the exclusion of certain derivatives, if any, as listed in the Additional Investment Information section of the Schedule of Investments. |
25
PORTFOLIO RESULTS
Goldman Sachs Small Cap Value Insights Fund
Investment Objective
The Fund seeks long-term growth of capital.
Portfolio Management Discussion and Analysis
Below, the Goldman Sachs Quantitative Investment Strategies Team discusses the Goldman Sachs Small Cap Value Insights Fund’s (the “Fund”) performance and positioning for the six-month period ended April 30, 2015 (the “Reporting Period”).
| Q | | How did the Fund perform during the Reporting Period? |
| A | | During the Reporting Period, the Fund’s Class A, C, Institutional, IR and R Shares generated cumulative total returns, without sales charges, of 3.68%, 3.31%, 3.89%, 3.79% and 3.54%, respectively. These returns compare to the 2.05% cumulative total return of the Fund’s benchmark, the Russell 2000® Value Index (with dividends reinvested) (the “Index”), during the same period. |
| Q | | What key factors were most responsible for the Fund’s performance during the Reporting Period? |
| A | | The Fund outperformed the Index during the Reporting Period because of stock selection based on our quantitative model and two of its six investment themes. |
| Q | | What impact did the Fund’s investment themes have on performance during the Reporting Period? |
| A | | In keeping with our investment approach, we use our quantitative model and six investment themes to take a long-term view of market patterns and look for inefficiencies, selecting stocks for the Fund and overweighting or underweighting the ones chosen by the model. Over time and by design, the performance of any one of the model’s investment themes tends to have a low correlation with the model’s other themes, demonstrating the diversification benefit of the Fund’s theme-driven quantitative model. The variance in performance supports our research indicating that the diversification provided by our different investment themes is a significant investment advantage over the long term, even though the Fund may experience underperformance in the short term. Of course, diversification does not protect an investor from market risk nor does it ensure a profit. |
| | During the Reporting Period, two of our six investment themes contributed positively to relative returns — Sentiment and Profitability. The Sentiment theme reflects selected investment views and decisions of individuals and financial intermediaries. The Profitability theme assesses whether a company is earning more than its cost of capital. |
| | The Fund’s performance was hampered by our Valuation and Management themes. The Valuation theme attempts to capture potential mispricings of securities, typically by comparing a measure of the company’s intrinsic value to its market value. The Management theme assesses the characteristics, policies and strategic decisions of company management. |
| | Our Quality and Momentum themes had a rather neutral impact on relative performance during the Reporting Period. The Quality theme seeks to assess both firm and management quality. The Momentum theme seeks to predict drifts in stock prices caused by delayed investor reaction to company-specific information and information about related companies. |
| Q | | How did the Fund’s sector and industry allocations affect relative performance? |
| A | | In constructing the Fund’s portfolio, we focus on picking stocks rather than on making sector or industry bets. Consequently, the Fund is similar to the Index in terms of its sector and industry allocations and style. Changes in its sector or industry weights generally do not have a meaningful impact on relative performance. |
| Q | | Did stock selection help or hurt Fund performance during the Reporting Period? |
| A | | We seek to outpace the Index by overweighting stocks we expect to outperform and underweighting those we think may lag. At the same time, we strive to maintain a risk profile |
26
PORTFOLIO RESULTS
| | similar to the Index. The Fund’s investments are selected using fundamental research and a variety of quantitative techniques based on our investment themes. For example, the Fund aims to hold a basket of stocks with better Momentum characteristics than the benchmark. |
| | During the Reporting Period, our security selection overall added to relative performance. Stock choices in the industrials, information technology and energy sectors enhanced relative returns. Holdings in the financials, utilities and consumer discretionary sectors detracted from relative results. |
| Q | | Which individual stock positions contributed most to the Fund’s relative returns during the Reporting Period? |
| A | | The Fund benefited from overweight positions in JetBlue Airways, Aruba Networks and Helen of Troy. We chose to overweight JetBlue Airways because of our positive views on Quality and Sentiment. The overweight in Aruba Networks, which sells enterprise networking equipment, was based on our positive views on Quality and Momentum. The Fund’s overweight in haircare appliance maker Helen of Troy was the result of our positive views on Sentiment and Valuation. |
| Q | | Which individual stock positions detracted most from the Fund’s results during the Reporting Period? |
| A | | The Fund was hurt during the Reporting Period by its underweight in Office Depot, an office supplies retailer. Overweight positions in Tesco and Infinity Pharmaceuticals also detracted from relative performance. We adopted the underweight in Office Depot because of our negative views on Sentiment and Momentum. The Fund’s overweight in Tesco, a U.K.-based grocery and general merchandise retailer, was the result of our positive views on Quality. We assumed the overweight in biopharmaceutical maker Infinity Pharmaceuticals due to our positive views on Sentiment and Momentum. |
| Q | | How did the Fund use derivatives and similar instruments during the Reporting Period? |
| A | | During the Reporting Period, we used financial futures contracts to equitize the Fund’s cash holdings. In other words, we put the Fund’s cash holdings to work by using them as collateral for the purchase of financial futures contracts. |
| Q | | What was the Fund’s sector positioning relative to the Index at the end of the Reporting Period? |
| A | | At the end of the Reporting Period, the Fund was overweight the information technology, consumer discretionary and health care sectors relative to the Index. Compared to the Index, the Fund was underweight the utilities, industrials, financials and consumer staples sectors. The Fund was relatively neutral compared to the Index in the materials, telecommunication services and energy sectors at the end of the Reporting Period. |
27
FUND BASICS
Small Cap Value Insights Fund
as of April 30, 2015

| | | | | | | | | | |
| | PERFORMANCE REVIEW | |
| | | November 1, 2014–April 30, 2015 | | Fund Total Return
(based on NAV)1 | | | Russell 2000®
Value Index2 | |
| | Class A | | | 3.68 | % | | | 2.05 | % |
| | Class C | | | 3.31 | | | | 2.05 | |
| | Institutional | | | 3.89 | | | | 2.05 | |
| | Class IR | | | 3.79 | | | | 2.05 | |
| | | Class R | | | 3.54 | | | | 2.05 | |
| | 1 | | The net asset value (“NAV”) represents the net assets of the class of the Fund (ex-dividend) divided by the total number of shares of the class outstanding. The Fund’s performance assumes the reinvestment of dividends and other distributions. The Fund’s performance does not reflect the deduction of any applicable sales charges. |
| | 2 | | The Russell 2000® Value Index is an unmanaged index of common stock prices that measures the performance of those Russell 2000 companies with lower price-to-book ratios and lower forecasted growth values. The Index figures do not reflect any deduction for fees, expenses or taxes. It is not possible to invest directly in an index. |
| | | | | | | | | | | | | | | | |
| | STANDARDIZED TOTAL RETURNS3 |
| | | For the period ended 3/31/15 | | One Year | | | Five Years | | | Since Inception | | | Inception Date |
| | Class A | | | 3.16 | % | | | 11.78 | % | | | 4.22 | % | | 6/25/07 |
| | Class C | | | 7.30 | | | | 12.20 | | | | 4.18 | | | 6/25/07 |
| | Institutional | | | 9.60 | | | | 13.51 | | | | 5.43 | | | 6/25/07 |
| | Class IR | | | 9.44 | | | | 13.33 | | | | 7.90 | | | 11/30/07 |
| | | Class R | | | 8.87 | | | | 12.77 | | | | 7.41 | | | 11/30/07 |
| | 3 | | The Standardized Total Returns are average annual total returns as of the most recent calendar quarter-end. They assume reinvestment of all distributions at NAV. These returns reflect a maximum initial sales charge of 5.5% for Class A Shares, and the assumed contingent deferred sales charge for Class C Shares (1% if redeemed within 12 months of purchase). Because Institutional, Class R and Class IR Shares do not involve a sales charge, such a charge is not applied to their Standardized Total Returns. |
The returns set forth in the tables above represent past performance. Past performance does not guarantee future results. The Fund’s investment return and principal value will fluctuate so that an investor’s shares, when redeemed, may be worth more or less than their original cost. Current performance may be lower or higher than the performance quoted above. Please visit our web site at www.GSAMFUNDS.com to obtain the most recent month-end returns. Performance reflects applicable fee waivers and/or expense limitations in effect during the periods shown. In their absence, performance would be reduced. Returns do not reflect the deduction of taxes that a shareholder would pay on Fund distributions or the redemption of Fund shares.
28
FUND BASICS
| | | | | | | | | | |
| | EXPENSE RATIOS4 | |
| | | | | Net Expense Ratio (Current) | | | Gross Expense Ratio (Before Waivers) | |
| | Class A | | | 1.28 | % | | | 1.60 | % |
| | Class C | | | 2.02 | | | | 2.35 | |
| | Institutional | | | 0.88 | | | | 1.21 | |
| | Class IR | | | 1.03 | | | | 1.36 | |
| | | Class R | | | 1.53 | | | | 1.85 | |
| | 4 | | The expense ratios of the Fund, both current (net of applicable fee waivers and/or expense limitations) and before waivers (gross of applicable fee waivers and/or expense limitations) are as set forth above according to the most recent publicly available Prospectus for the Fund and may differ from the expense ratios disclosed in the Financial Highlights in this report. Pursuant to a contractual arrangement, the Fund’s waivers and/or expense limitations will remain in place through at least February 29, 2016, and prior to such date the Investment Adviser may not terminate the arrangements without the approval of the Fund’s Board of Trustees. If these arrangements are discontinued in the future, the expense ratios may change without shareholder approval. |
| | | | | | | | |
| | TOP TEN HOLDINGS AS OF 4/30/155 |
| | | Holding | | % of Net Assets | | | Line of Business |
| | Sunstone Hotel Investors, Inc. | | | 0.9 | % | | Real Estate Investment Trusts |
| | Prosperity Bancshares, Inc. | | | 0.9 | | | Commercial Banks |
| | Marriott Vacations Worldwide Corp. | | | 0.9 | | | Hotels, Restaurants & Leisure |
| | Cleco Corp. | | | 0.9 | | | Electric Utilities |
| | Cooper Tire & Rubber Co. | | | 0.8 | | | Auto Components |
| | Symetra Financial Corp. | | | 0.8 | | | Insurance |
| | First Industrial Realty Trust, Inc. | | | 0.8 | | | Real Estate Investment Trusts |
| | EMCOR Group, Inc. | | | 0.8 | | | Construction & Engineering |
| | DiamondRock Hospitality Co. | | | 0.8 | | | Real Estate Investment Trusts |
| | | New Jersey Resources Corp. | | | 0.8 | | | Gas Utilities |
| | 5 | | The top 10 holdings may not be representative of the Fund’s future investments. |
29
FUND BASICS
|
| FUND VS. BENCHMARK SECTOR ALLOCATIONS6 |
| As of April 30, 2015 |
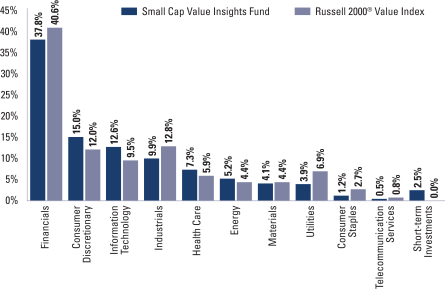
| | 6 | | The Fund is actively managed and, as such, its composition may differ over time. Consequently, the Fund’s overall sector allocations may differ from the percentages contained in the graph above. The graph categorizes investments using the Global Industry Classification Standard (“GICS”), however, the sector classifications used by the portfolio management team may differ from GICS. The percentage shown for each investment category reflects the value of investments in that category as a percentage of market value (excluding investments in the securities lending reinvestment vehicle, if any). Investments in the securities lending reinvestment vehicle represented 3.7% of the Fund’s net assets as of April 30, 2015. Short-term investments represent repurchase agreements. The graph depicts the Fund’s investments but may not represent the Fund’s market exposure due to the exclusion of certain derivatives, if any, as listed in the Additional Investment Information section of the Schedule of Investments. |
30
PORTFOLIO RESULTS
Goldman Sachs U.S. Equity Insights Fund
Investment Objective
The Fund seeks long-term growth of capital and dividend income.
Portfolio Management Discussion and Analysis
Below, the Goldman Sachs Quantitative Investment Strategies Team discusses the Goldman Sachs U.S. Equity Insights Fund’s (the “Fund”) performance and positioning for the six-month period ended April 30, 2015 (the “Reporting Period”).
| Q | | How did the Fund perform during the Reporting Period? |
| A | | During the Reporting Period, the Fund’s Class A, C, Institutional, Service, IR and R Shares generated cumulative total returns, without sales charges, of 4.16%, 3.77%, 4.37%, 4.10%, 4.27% and 4.01%, respectively. These returns compare to the 4.40% cumulative total return of the Fund’s benchmark, the S&P 500® Index (with dividends reinvested) (the “Index”), during the same period. |
| Q | | What key factors were most responsible for the Fund’s performance during the Reporting Period? |
| A | | During the Reporting Period, stock selection drove our quantitative model and two of its six investment themes contributed positively to relative returns, but the Fund underperformed the Index after fees and expenses. |
| Q | | What impact did the Fund’s investment themes have on performance during the Reporting Period? |
| A | | In keeping with our investment approach, we use our quantitative model and six investment themes to take a long-term view of market patterns and look for inefficiencies, selecting stocks for the Fund and overweighting or underweighting the ones chosen by the model. Over time and by design, the performance of any one of the model’s investment themes tends to have a low correlation with the model’s other themes, demonstrating the diversification benefit of the Fund’s theme-driven quantitative model. The variance in performance supports our research indicating that the diversification provided by our different investment themes is a significant investment advantage over the long term, even though the Fund may experience underperformance in the short term. Of course, diversification does not protect an investor from market risk nor does it ensure a profit. |
| | During the Reporting Period, two of our six investment themes added to relative returns — Sentiment and Momentum. The Sentiment theme reflects selected investment views and decisions of individuals and financial intermediaries. The Momentum theme seeks to predict drifts in stock prices caused by delayed investor reaction to company-specific information and information about related companies. |
| | Valuation detracted from relative results. The Valuation theme attempts to capture potential mispricings of securities, typically by comparing a measure of the company’s intrinsic value to its market value. |
| | Our Quality, Management and Profitability themes had a rather neutral impact on relative performance during the Reporting Period. The Quality theme seeks to assess both firm and management quality. The Management theme assesses the characteristics, policies and strategic decisions of company management. The Profitability theme assesses whether a company is earning more than its cost of capital, while |
| Q | | How did the Fund’s sector and industry allocations affect relative performance? |
| A | | In constructing the Fund’s portfolio, we focus on picking stocks rather than on making sector or industry bets. Consequently, the Fund is similar to the Index in terms of its sector and industry allocations and style. Changes in its sector or industry weights generally do not have a meaningful impact on relative performance. |
31
PORTFOLIO RESULTS
| Q | | Did stock selection help or hurt Fund performance during the Reporting Period? |
| A | | We seek to outpace the Index by overweighting stocks we expect to outperform and underweighting those we think may lag. At the same time, we strive to maintain a risk profile similar to the Index. The Fund’s investments are selected using fundamental research and a variety of quantitative techniques based on our investment themes. For example, the Fund aims to hold a basket of stocks with better Momentum characteristics than the benchmark. |
| | During the Reporting Period, our stock selection overall added to relative performance. Holdings in the energy, consumer discretionary and industrial sectors contributed positively. Investments in the health care, materials and consumer staples sectors detracted from relative returns. |
| Q | | Which individual stock positions contributed most to the Fund’s relative returns during the Reporting Period? |
| A | | The Fund benefited from overweight positions in Lowe’s Companies, a home improvement retailer; Cameron International, a provider of flow equipment products, systems and services to the oil, gas and process industries; and Aetna, a managed health care company. All three overweights were the result of our positive views on Sentiment. |
| Q | | Which individual stock positions detracted most from the Fund’s results during the Reporting Period? |
| A | | The Fund was hampered by its underweight position in online retailer Amazon. Overweight positions in document management company Xerox and biopharmaceutical company AbbVie also dampened relative returns. We chose to underweight Amazon because of our negative views on Valuation. The Fund was overweight Xerox and AbbVie as a result of our positive views on Sentiment and Quality. |
| Q | | How did the Fund use derivatives and similar instruments during the Reporting Period? |
| A | | During the Reporting Period, we used financial futures contracts to equitize the Fund’s cash holdings. In other words, we put the Fund’s cash holdings to work by using them as collateral for the purchase of financial futures contracts. |
| Q | | What was the Fund’s sector positioning relative to the Index at the end of the Reporting Period? |
| A | | At the end of the Reporting Period, the Fund was overweight the energy, health care, information technology and telecommunication services sectors relative to the Index. Compared to the Index, the Fund was underweight the utilities, materials, financials, consumer discretionary and industrials sectors. The Fund was relatively neutral compared to the Index in consumer staples at the end of the Reporting Period. |
32
FUND BASICS
U.S. Equity Insights Fund
as of April 30, 2015
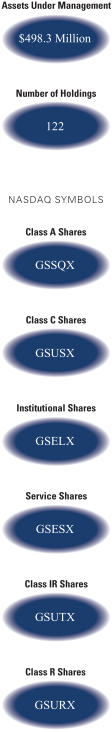
| | | | | | | | | | |
| | PERFORMANCE REVIEW | |
| | | November 1, 2014–April 30, 2015 | | Fund Total Return
(based on NAV)1 | | | S&P 500® Index2 | |
| | Class A | | | 4.16 | % | | | 4.40 | % |
| | Class C | | | 3.77 | | | | 4.40 | |
| | Institutional | | | 4.37 | | | | 4.40 | |
| | Service | | | 4.10 | | | | 4.40 | |
| | Class IR | | | 4.27 | | | | 4.40 | |
| | | Class R | | | 4.01 | | | | 4.40 | |
| | 1 | | The net asset value (“NAV”) represents the net assets of the class of the Fund (ex-dividend) divided by the total number of shares of the class outstanding. The Fund’s performance assumes the reinvestment of dividends and other distributions. The Fund’s performance does not reflect the deduction of any applicable sales charges. |
| | 2 | | The S&P 500® Index (with dividends reinvested) is the Standard & Poor’s 500 Composite Index of 500 stocks, an unmanaged index of common stock prices. The figures for the Index do not include any deduction for fees, expenses or taxes. It is not possible to invest directly in an index. |
| | | | | | | | | | | | | | | | | | | | |
| | STANDARDIZED TOTAL RETURNS3 |
| | | For the period ended 3/31/15 | | One Year | | | Five Years | | | Ten Years | | | Since Inception | | | Inception Date |
| | Class A | | | 7.40 | % | | | 13.69 | % | | | 6.52 | % | | | 8.35 | % | | 5/24/91 |
| | Class C | | | 11.76 | | | | 14.13 | | | | 6.33 | | | | 5.17 | | | 8/15/97 |
| | Institutional | | | 14.08 | | | | 15.44 | | | | 7.55 | | | | 8.80 | | | 6/15/95 |
| | Service | | | 13.51 | | | | 14.87 | | | | 7.02 | | | | 7.29 | | | 6/07/96 |
| | Class IR | | | 13.92 | | | | 15.27 | | | | N/A | | | | 6.69 | | | 11/30/07 |
| | | Class R | | | 13.34 | | | | 14.70 | | | | N/A | | | | 6.17 | | | 11/30/07 |
| | 3 | | The Standardized Total Returns are average annual total returns as of the most recent calendar quarter-end. They assume reinvestment of all distributions at NAV. These returns reflect a maximum initial sales charge of 5.5% for Class A Shares and the assumed contingent deferred sales charge for Class C Shares (1% if redeemed within 12 months of purchase). Because Institutional, Service, Class IR and Class R Shares do not involve a sales charge, such a charge is not applied to their Standardized Total Returns. |
The returns set forth in the tables above represent past performance. Past performance does not guarantee future results. The Fund’s investment return and principal value will fluctuate so that an investor’s shares, when redeemed, may be worth more or less than their original cost. Current performance may be lower or higher than the performance quoted above. Please visit our web site at www.GSAMFUNDS.com to obtain the most recent month-end returns. Performance reflects applicable fee waivers and/or expense limitations in effect during the periods shown. In their absence, performance would be reduced. Returns do not reflect the deduction of taxes that a shareholder would pay on Fund distributions or the redemption of Fund shares.
33
FUND BASICS
| | | | | | | | | | |
| | EXPENSE RATIOS4 | |
| | | | | Net Expense Ratio (Current) | | | Gross Expense Ratio (Before Waivers) | |
| | Class A | | | 0.97 | % | | | 1.21 | % |
| | Class C | | | 1.72 | | | | 1.96 | |
| | Institutional | | | 0.57 | | | | 0.81 | |
| | Service | | | 1.07 | | | | 1.31 | |
| | Class IR | | | 0.72 | | | | 0.96 | |
| | | Class R | | | 1.22 | | | | 1.46 | |
| | 4 | | The expense ratios of the Fund, both current (net of applicable fee waivers and/or expense limitations) and before waivers (gross of applicable fee waivers and/or expense limitations) are as set forth above according to the most recent publicly available Prospectus for the Fund and may differ from the expense ratios disclosed in the Financial Highlights in this report. Pursuant to a contractual arrangement, the Fund’s waivers and/or expense limitations will remain in place through at least February 29, 2016, and prior to such date the Investment Adviser may not terminate the arrangements without the approval of the Fund’s Board of Trustees. If these arrangements are discontinued in the future, the expense ratios may change without shareholder approval. |
| | | | | | | | |
| | TOP TEN HOLDINGS AS OF 4/30/155 |
| | | Holding | | % of Net Assets | | | Line of Business |
| | Apple, Inc. | | | 4.9 | % | | Computers & Peripherals |
| | Microsoft Corp. | | | 3.3 | | | Software |
| | Exxon Mobil Corp. | | | 2.7 | | | Oil, Gas & Consumable Fuels |
| | Johnson & Johnson | | | 2.5 | | | Pharmaceuticals |
| | JPMorgan Chase & Co. | | | 2.3 | | | Commercial Banks |
| | Verizon Communications, Inc. | | | 2.2 | | | Diversified Telecommunication
Services |
| | Pfizer, Inc. | | | 1.9 | | | Pharmaceuticals |
| | PepsiCo., Inc. | | | 1.8 | | | Beverages |
| | General Electric Co. | | | 1.7 | | | Industrial Conglomerates |
| �� | | Wal-Mart Stores, Inc. | | | 1.7 | | | Food & Staples Retailing |
| | 5 | | The top 10 holdings may not be representative of the Fund’s future investments. |
34
FUND BASICS
|
| FUND VS. BENCHMARK SECTOR ALLOCATIONS6 |
| As of April 30, 2015 |
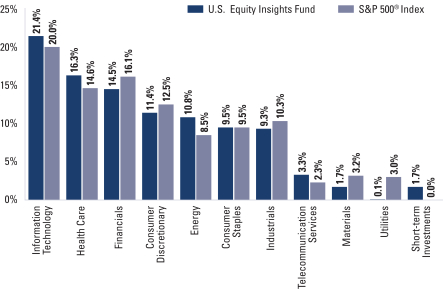
| | 6 | | The Fund is actively managed and, as such, its composition may differ over time. Consequently, the Fund’s overall sector allocations may differ from the percentages contained in the graph above. The graph categorizes investments using the Global Industry Classification Standard (“GICS”), however, the sector classifications used by the portfolio management team may differ from GICS. The percentage shown for each investment category reflects the value of investments in that category as a percentage of market value. Short-term investments represent repurchase agreements. The graph depicts the Fund’s investments but may not represent the Fund’s market exposure due to the exclusion of certain derivatives, if any, as listed in the Additional Investment Information section of the Schedule of Investments. |
35
GOLDMAN SACHS LARGE CAP GROWTH INSIGHTS FUND
Schedule of Investments
April 30, 2015 (Unaudited)
| | | | | | | | |
| Shares | | | Description | |
Value | |
| | | | | | | | |
| | Common Stocks – 96.0% | |
| | Aerospace & Defense – 2.8% | |
| | 20,260 | | | General Dynamics Corp. | | $ | 2,782,103 | |
| | 41,567 | | | Northrop Grumman Corp. | | | 6,402,981 | |
| | 73,380 | | | The Boeing Co. | | | 10,518,289 | |
| | | | | | | | |
| | | | | | | 19,703,373 | |
| | |
| | Airlines – 2.2% | |
| | 71,855 | | | Alaska Air Group, Inc. | | | 4,603,031 | |
| | 16,818 | | | Delta Air Lines, Inc. | | | 750,756 | |
| | 178,920 | | | Southwest Airlines Co. | | | 7,256,995 | |
| | 52,435 | | | United Continental Holdings, Inc.* | | | 3,132,467 | |
| | | | | | | | |
| | | | | | | 15,743,249 | |
| | |
| | Auto Components – 1.8% | |
| | 14,980 | | | Delphi Automotive PLC | | | 1,243,340 | |
| | 110,603 | | | Johnson Controls, Inc. | | | 5,572,179 | |
| | 56,298 | | | Lear Corp. | | | 6,250,767 | |
| | | | | | | | |
| | | | | | | 13,066,286 | |
| | |
| | Automobiles – 0.8% | |
| | 345,434 | | | Ford Motor Co. | | | 5,457,857 | |
| | |
| | Beverages – 2.6% | |
| | 164,359 | | | PepsiCo., Inc. | | | 15,633,828 | |
| | 77,872 | | | The Coca-Cola Co. | | | 3,158,488 | |
| | | | | | | | |
| | | | | | | 18,792,316 | |
| | |
| | Biotechnology – 7.5% | |
| | 50,615 | | | Alkermes PLC* | | | 2,802,553 | |
| | 82,533 | | | Amgen, Inc. | | | 13,032,786 | |
| | 19,081 | | | Biogen, Inc.* | | | 7,134,958 | |
| | 113,085 | | | Celgene Corp.* | | | 12,219,965 | |
| | 155,704 | | | Gilead Sciences, Inc.* | | | 15,649,809 | |
| | 32,503 | | | Isis Pharmaceuticals, Inc.* | | | 1,843,570 | |
| | 23,315 | | | Seattle Genetics, Inc.* | | | 800,637 | |
| | | | | | | | |
| | | | | | | 53,484,278 | |
| | |
| | Building Products – 0.3% | |
| | 6,122 | | | Armstrong World Industries, Inc.* | | | 335,118 | |
| | 39,043 | | | Owens Corning, Inc. | | | 1,509,403 | |
| | | | | | | | |
| | | | | | | 1,844,521 | |
| | |
| | Capital Markets – 0.3% | |
| | 63,317 | | | The Charles Schwab Corp. | | | 1,931,169 | |
| | |
| | Chemicals – 1.0% | |
| | 100,550 | | | E.I. du Pont de Nemours and Co. | | | 7,360,260 | |
| | |
| | Commercial Banks – 0.6% | |
| | 229,822 | | | Bank of America Corp. | | | 3,661,065 | |
| | 29,762 | | | Zions Bancorp | | | 843,306 | |
| | | | | | | | |
| | | | | | | 4,504,371 | |
| | |
| | Commercial Services & Supplies – 0.3% | |
| | 27,539 | | | Cintas Corp. | | | 2,201,743 | |
| | |
| | Communications Equipment – 0.7% | |
| | 62,393 | | | Cisco Systems, Inc. | | | 1,798,790 | |
| | 24,863 | | | F5 Networks, Inc.* | | | 3,033,783 | |
| | |
| | | | | | | | |
| | Common Stocks – (continued) | |
| | Communications Equipment – (continued) | |
| | 3,646 | | | QUALCOMM, Inc. | | | 247,928 | |
| | | | | | | | |
| | | | | | | 5,080,501 | |
| | |
| | Computers & Peripherals – 10.3% | |
| | 427,203 | | | Apple, Inc. | | | 53,464,455 | |
| | 276,091 | | | EMC Corp. | | | 7,429,609 | |
| | 216,819 | | | Hewlett-Packard Co. | | | 7,148,522 | |
| | 113,264 | | | NetApp, Inc. | | | 4,105,820 | |
| | 8,328 | | | Western Digital Corp. | | | 813,979 | |
| | | | | | | | |
| | | | | | | 72,962,385 | |
| | |
| | Consumer Finance – 1.8% | |
| | 47,995 | | | Ally Financial, Inc.* | | | 1,050,611 | |
| | 61,013 | | | American Express Co. | | | 4,725,457 | |
| | 85,125 | | | Capital One Financial Corp. | | | 6,882,356 | |
| | | | | | | | |
| | | | | | | 12,658,424 | |
| | |
| | Diversified Telecommunication Services – 3.6% | |
| | 136,933 | | | CenturyLink, Inc. | | | 4,924,111 | |
| | 407,091 | | | Verizon Communications, Inc.(a) | | | 20,533,670 | |
| | | | | | | | |
| | | | | | | 25,457,781 | |
| | |
| | Electronic Equipment, Instruments & Components – 1.1% | |
| | 338,946 | | | Corning, Inc. | | | 7,094,140 | |
| | 54,032 | | | Flextronics International Ltd.* | | | 622,719 | |
| | | | | | | | |
| | | | | | | 7,716,859 | |
| | |
| | Energy Equipment & Services – 3.0% | |
| | 140,174 | | | Cameron International Corp.* | | | 7,684,339 | |
| | 139,693 | | | FMC Technologies, Inc.* | | | 6,160,461 | |
| | 49,817 | | | Oceaneering International, Inc. | | | 2,745,415 | |
| | 21,311 | | | Oil States International, Inc.* | | | 1,014,190 | |
| | 28,080 | | | Schlumberger Ltd. | | | 2,656,649 | |
| | 44,336 | | | Superior Energy Services, Inc. | | | 1,130,568 | |
| | | | | | | | |
| | | | | | | 21,391,622 | |
| | |
| | Food & Staples Retailing – 3.7% | |
| | 80,596 | | | CVS Health Corp. | | | 8,002,377 | |
| | 133,894 | | | The Kroger Co. | | | 9,226,636 | |
| | 100,600 | | | Wal-Mart Stores, Inc. | | | 7,851,830 | |
| | 11,680 | | | Walgreens Boots Alliance, Inc. | | | 968,622 | |
| | | | | | | | |
| | | | | | | 26,049,465 | |
| | |
| | Food Products – 1.4% | |
| | 100,870 | | | ConAgra Foods, Inc. | | | 3,646,451 | |
| | 101,315 | | | Kellogg Co. | | | 6,416,279 | |
| | | | | | | | |
| | | | | | | 10,062,730 | |
| | |
| | Health Care Equipment & Supplies – 0.8% | |
| | 77,738 | | | Baxter International, Inc. | | | 5,343,710 | |
| | |
| | Health Care Providers & Services – 3.0% | |
| | 20,971 | | | Aetna, Inc. | | | 2,241,171 | |
| | 74,178 | | | AmerisourceBergen Corp. | | | 8,478,545 | |
| | 77,797 | | | Cardinal Health, Inc. | | | 6,561,399 | |
| | 38,014 | | | UnitedHealth Group, Inc. | | | 4,234,760 | |
| | | | | | | | |
| | | | | | | 21,515,875 | |
| | |
| | |
| 36 | | The accompanying notes are an integral part of these financial statements. |
GOLDMAN SACHS LARGE CAP GROWTH INSIGHTS FUND
| | | | | | | | |
| Shares | | | Description | |
Value | |
| | | | | | | | |
| | Common Stocks – (continued) | |
| | Hotels, Restaurants & Leisure – 1.0% | | | | |
| | 5,096 | | | Brinker International, Inc. | | $ | 282,166 | |
| | 149,461 | | | Carnival Corp. | | | 6,571,800 | |
| | 2,398 | | | Wyndham Worldwide Corp. | | | 204,789 | |
| | | | | | | | |
| | | | | | | 7,058,755 | |
| | |
| | Household Durables – 2.0% | | | | |
| | 154,040 | | | Garmin Ltd.(b) | | | 6,961,067 | |
| | 39,674 | | | Mohawk Industries, Inc.* | | | 6,883,439 | |
| | 11,533 | | | Toll Brothers, Inc.* | | | 409,883 | |
| | | | | | | | |
| | | | | | | 14,254,389 | |
| | |
| | Household Products – 0.6% | | | | |
| | 57,564 | | | Colgate-Palmolive Co. | | | 3,872,906 | |
| | 2,650 | | | Kimberly-Clark Corp. | | | 290,678 | |
| | | | | | | | |
| | | | | | | 4,163,584 | |
| | |
| | Industrial Conglomerates – 2.9% | | | | |
| | 81,305 | | | 3M Co. | | | 12,715,289 | |
| | 95,188 | | | Danaher Corp. | | | 7,793,993 | |
| | | | | | | | |
| | | | | | | 20,509,282 | |
| | |
| | Insurance – 0.3% | | | | |
| | 11,826 | | | Lincoln National Corp. | | | 668,051 | |
| | 16,084 | | | Reinsurance Group of America, Inc. | | | 1,473,616 | |
| | | | | | | | |
| | | | | | | 2,141,667 | |
| | |
| | Internet & Catalog Retail* – 1.0% | | | | |
| | 7,684 | | | Amazon.com, Inc. | | | 3,240,957 | |
| | 125,392 | | | Liberty Interactive Corp. Class A | | | 3,606,274 | |
| | | | | | | | |
| | | | | | | 6,847,231 | |
| | |
| | Internet Software & Services* – 4.4% | | | | |
| | 53,684 | | | Facebook, Inc. Class A | | | 4,228,689 | |
| | 19,705 | | | Google, Inc. Class A | | | 10,813,513 | |
| | 28,759 | | | Google, Inc. Class C | | | 15,453,214 | |
| | 13,018 | | | Rackspace Hosting, Inc. | | | 701,670 | |
| | 6,448 | | | VeriSign, Inc. | | | 409,513 | |
| | | | | | | | |
| | | | | | | 31,606,599 | |
| | |
| | IT Services – 2.0% | | | | |
| | 8,534 | | | Accenture PLC Class A | | | 790,675 | |
| | 8,258 | | | Automatic Data Processing, Inc. | | | 698,131 | |
| | 17,354 | | | Fidelity National Information Services, Inc. | | | 1,084,451 | |
| | 9,396 | | | Fiserv, Inc.* | | | 729,130 | |
| | 18,478 | | | International Business Machines Corp. | | | 3,165,097 | |
| | 20,496 | | | Visa, Inc. Class A | | | 1,353,761 | |
| | 545,088 | | | Xerox Corp. | | | 6,268,512 | |
| | | | | | | | |
| | | | | | | 14,089,757 | |
| | |
| | Media – 4.6% | | | | |
| | 16,631 | | | Cinemark Holdings, Inc. | | | 708,980 | |
| | 266,315 | | | Comcast Corp. Class A | | | 15,382,354 | |
| | 27,640 | | | DIRECTV* | | | 2,507,086 | |
| | 82,808 | | | The Walt Disney Co. | | | 9,002,886 | |
| | 17,157 | | | Time Warner Cable, Inc. | | | 2,668,257 | |
| | |
| | | | | | | | |
| | Common Stocks – (continued) | |
| | Media – (continued) | | | | |
| | 33,416 | | | Viacom, Inc. Class B | | | 2,320,741 | |
| | | | | | | | |
| | | | | | | 32,590,304 | |
| | |
| | Metals & Mining – 1.3% | | | | |
| | 132,706 | | | Alcoa, Inc. | | | 1,780,915 | |
| | 147,162 | | | Nucor Corp. | | | 7,190,335 | |
| | 12,679 | | | Steel Dynamics, Inc. | | | 280,586 | |
| | | | | | | | |
| | | | | | | 9,251,836 | |
| | |
| | Multiline Retail – 0.5% | | | | |
| | 1,679 | | | Dillard’s, Inc. Class A | | | 220,940 | |
| | 4,436 | | | Kohl’s Corp. | | | 317,839 | |
| | 22,654 | | | Macy’s, Inc. | | | 1,464,128 | |
| | 17,046 | | | Target Corp. | | | 1,343,736 | |
| | | | | | | | |
| | | | | | | 3,346,643 | |
| | |
| | Oil, Gas & Consumable Fuels – 4.6% | | | | |
| | 178,572 | | | HollyFrontier Corp. | | | 6,925,022 | |
| | 65,332 | | | Marathon Petroleum Corp. | | | 6,439,775 | |
| | 67,101 | | | PBF Energy, Inc. Class A | | | 1,904,326 | |
| | 88,198 | | | Phillips 66 | | | 6,994,983 | |
| | 28,102 | | | QEP Resources, Inc. | | | 632,295 | |
| | 33,479 | | | Tesoro Corp. | | | 2,873,503 | |
| | 128,544 | | | Valero Energy Corp. | | | 7,314,154 | |
| | | | | | | | |
| | | | | | | 33,084,058 | |
| | |
| | Paper & Forest Products – 0.6% | | | | |
| | 81,966 | | | International Paper Co. | | | 4,403,214 | |
| | |
| | Pharmaceuticals – 3.9% | | | | |
| | 147,517 | | | Bristol-Myers Squibb Co. | | | 9,401,258 | |
| | 98,935 | | | Johnson & Johnson | | | 9,814,352 | |
| | 37,380 | | | Merck & Co., Inc. | | | 2,226,353 | |
| | 188,162 | | | Pfizer, Inc. | | | 6,384,337 | |
| | | | | | | | |
| | | | | | | 27,826,300 | |
| | |
| | Real Estate Investment Trusts – 1.2% | | | | |
| | 33,575 | | | American Capital Agency Corp. | | | 692,820 | |
| | 18,721 | | | American Tower Corp. | | | 1,769,696 | |
| | 52,605 | | | Crown Castle International Corp. | | | 4,394,096 | |
| | 28,343 | | | Lamar Advertising Co. Class A | | | 1,642,760 | |
| | | | | | | | |
| | | | | | | 8,499,372 | |
| | |
| | Semiconductors & Semiconductor Equipment – 1.6% | | | | |
| | 138,352 | | | Intel Corp. | | | 4,503,358 | |
| | 36,169 | | | NXP Semiconductors NV* | | | 3,476,564 | |
| | 68,407 | | | Texas Instruments, Inc. | | | 3,708,343 | |
| | | | | | | | |
| | | | | | | 11,688,265 | |
| | |
| | Software – 7.1% | | | | |
| | 102,081 | | | Adobe Systems, Inc.*(a) | | | 7,764,281 | |
| | 56,693 | | | Citrix Systems, Inc.* | | | 3,807,502 | |
| | 30,340 | | | Electronic Arts, Inc.* | | | 1,762,451 | |
| | 320,968 | | | Microsoft Corp. | | | 15,611,883 | |
| | 95,004 | | | Nuance Communications, Inc.* | | | 1,456,411 | |
| | 315,042 | | | Oracle Corp. | | | 13,742,132 | |
| | |
| | |
| The accompanying notes are an integral part of these financial statements. | | 37 |
GOLDMAN SACHS LARGE CAP GROWTH INSIGHTS FUND
Schedule of Investments (continued)
April 30, 2015 (Unaudited)
| | | | | | | | |
| Shares | | | Description | |
Value | |
| | | | | | | | |
| | Common Stocks – (continued) | |
| | Software – (continued) | | | | |
| | 88,334 | | | salesforce.com, Inc.* | | $ | 6,432,482 | |
| | | | | | | | |
| | | | | | | 50,577,142 | |
| | |
| | Specialty Retail – 3.6% | | | | |
| | 28,761 | | | L Brands, Inc. | | | 2,570,083 | |
| | 108,861 | | | Lowe’s Cos., Inc. | | | 7,496,168 | |
| | 114,757 | | | The Gap, Inc. | | | 4,548,968 | |
| | 23,757 | | | The Home Depot, Inc. | | | 2,541,524 | |
| | 134,196 | | | The TJX Cos., Inc. | | | 8,661,010 | |
| | | | | | | | |
| | | | | | | 25,817,753 | |
| | |
| | Textiles, Apparel & Luxury Goods – 1.6% | | | | |
| | 35,114 | | | NIKE, Inc. Class B | | | 3,470,668 | |
| | 112,127 | | | VF Corp. | | | 8,121,358 | |
| | | | | | | | |
| | | | | | | 11,592,026 | |
| | |
| | Tobacco – 1.6% | | | | |
| | 231,263 | | | Altria Group, Inc. | | | 11,574,713 | |
| | |
| | TOTAL COMMON STOCKS | | | | |
| | (Cost $663,191,043) | | $ | 683,251,665 | |
| | |
| | | | | | | | | | | | |
Principal
Amount | | | Interest
Rate | | Maturity
Date | | | Value | |
| | Short-term Investment(c) – 3.5% | |
| | Repurchase Agreement – 3.5% | |
| Joint Repurchase Agreement Account II | |
| $ | 25,200,000 | | | 0.127% | | | 05/01/15 | | | | | |
| | (Cost $25,200,000) | | | | | | $ | 25,200,000 | |
| | |
| TOTAL INVESTMENTS BEFORE SECURITIES LENDING
REINVESTMENT VEHICLE |
|
| | (Cost $688,391,043) | | | $ | 708,451,665 | |
| | |
| | | | | | | | |
| Shares | | Rate | | |
Value | |
| Securities Lending Reinvestment Vehicle(d)(e) – 0.5% | |
Goldman Sachs Financial Square Money Market Fund – FST Shares | |
| 3,175,950 | | | 0.111 | % | | | | |
| (Cost $3,175,950) | | | $ | 3,175,950 | |
| |
| TOTAL INVESTMENTS – 100.0% | |
| (Cost $691,566,993) | | | $ | 711,627,615 | |
| |
LIABILITIES IN EXCESS OF
OTHER ASSETS – (0.0)% | | | | (249,566 | ) |
| |
| NET ASSETS – 100.0% | | | $ | 711,378,049 | |
| |
| | |
| The percentage shown for each investment category reflects the value of investments in that category as a percentage of net assets. |
* | | Non-income producing security. |
(a) | | All or a portion of security is segregated as collateral for initial margin requirements on futures transactions. |
(b) | | All or a portion of security is on loan. |
(c) | | Joint repurchase agreement was entered into on April 30, 2015. Additional information appears on page 57. |
(d) | | Variable rate security. Interest rate or distribution rate disclosed is that which is in effect on April 30, 2015. |
(e) | | Represents an Affiliated Issuer. |
| | | | | | | | |
| ADDITIONAL INVESTMENT INFORMATION |
FUTURES CONTRACTS — At April 30, 2015, the Fund had the following futures contracts:
| | | | | | | | | | | | |
| Type | | Number of
Contracts
Long (Short) | | Expiration
Date | | Current
Value | | | Unrealized
Gain (Loss) | |
S&P 500 E-Mini Index | | 113 | | June 2015 | | $ | 11,745,785 | | | $ | (30,426 | ) |
| | |
| 38 | | The accompanying notes are an integral part of these financial statements. |
GOLDMAN SACHS LARGE CAP VALUE INSIGHTS FUND
Schedule of Investments
April 30, 2015 (Unaudited)
| | | | | | | | |
Shares | | | Description | | Value | |
| | | | | | | | |
| | Common Stocks – 97.8% | | | | |
| | Aerospace & Defense – 2.6% | | | | |
| | 28,279 | | | General Dynamics Corp. | | $ | 3,883,272 | |
| | 38,279 | | | Northrop Grumman Corp. | | | 5,896,497 | |
| | 16,031 | | | The Boeing Co. | | | 2,297,884 | |
| | | | | | | | |
| | | | | | | 12,077,653 | |
| | |
| | Airlines – 0.2% | | | | |
| | 10,684 | | | Alaska Air Group, Inc. | | | 684,417 | |
| | |
| | Auto Components – 0.2% | | | | |
| | 14,255 | | | Johnson Controls, Inc. | | | 718,167 | |
| | 1,853 | | | Lear Corp. | | | 205,738 | |
| | | | | | | | |
| | | | | | | 923,905 | |
| | |
| | Automobiles – 0.6% | | | | |
| | 183,603 | | | Ford Motor Co. | | | 2,900,927 | |
| | |
| | Beverages – 1.0% | | | | |
| | 48,868 | | | PepsiCo., Inc. | | | 4,648,324 | |
| | |
| | Biotechnology – 2.0% | | | | |
| | 18,236 | | | Amgen, Inc. | | | 2,879,647 | |
| | 40,638 | | | Celgene Corp.* | | | 4,391,342 | |
| | 15,743 | | | Gilead Sciences, Inc.* | | | 1,582,329 | |
| | 8,023 | | | Isis Pharmaceuticals, Inc.* | | | 455,065 | |
| | | | | | | | |
| | | | | | | 9,308,383 | |
| | |
| | Capital Markets – 2.0% | | | | |
| | 4,864 | | | Affiliated Managers Group, Inc.* | | | 1,099,896 | |
| | 33,394 | | | Ameriprise Financial, Inc. | | | 4,183,601 | |
| | 130,532 | | | The Charles Schwab Corp. | | | 3,981,226 | |
| | | | | | | | |
| | | | | | | 9,264,723 | |
| | |
| | Commercial Banks – 9.7% | | | | |
| | 778,583 | | | Bank of America Corp. | | | 12,402,827 | |
| | 48,918 | | | Citigroup, Inc. | | | 2,608,308 | |
| | 247,166 | | | JPMorgan Chase & Co. | | | 15,635,721 | |
| | 55,346 | | | PacWest Bancorp | | | 2,496,105 | |
| | 23,538 | | | Regions Financial Corp. | | | 231,378 | |
| | 131,872 | | | Wells Fargo & Co. | | | 7,266,147 | |
| | 155,984 | | | Zions Bancorp | | | 4,419,807 | |
| | | | | | | | |
| | | | | | | 45,060,293 | |
| | |
| | Commercial Services & Supplies – 0.3% | | | | |
| | 13,928 | | | Cintas Corp. | | | 1,113,544 | |
| | |
| | Communications Equipment – 1.5% | | | | |
| | 234,085 | | | Cisco Systems, Inc. | | | 6,748,671 | |
| | |
| | Computers & Peripherals – 3.6% | | | | |
| | 260,105 | | | EMC Corp. | | | 6,999,426 | |
| | 230,388 | | | Hewlett-Packard Co. | | | 7,595,892 | |
| | 31,580 | | | NetApp, Inc. | | | 1,144,775 | |
| | 9,095 | | | Western Digital Corp. | | | 888,945 | |
| | | | | | | | |
| | | | | | | 16,629,038 | |
| | |
| | Consumer Finance – 3.0% | | | | |
| | 120,600 | | | Ally Financial, Inc.* | | | 2,639,934 | |
| | 60,433 | | | American Express Co. | | | 4,680,536 | |
| | |
| | | | | | | | |
| | Common Stocks – (continued) | | | | |
| | Consumer Finance – (continued) | | | | |
| | 83,174 | | | Capital One Financial Corp. | | | 6,724,618 | |
| | | | | | | | |
| | | | | | | 14,045,088 | |
| | |
| | Diversified Financial Services – 2.9% | | | | |
| | 78,314 | | | Berkshire Hathaway, Inc. Class B* | | | 11,058,720 | |
| | 43,009 | | | The NASDAQ OMX Group, Inc. | | | 2,091,528 | |
| | | | | | | | |
| | | | | | | 13,150,248 | |
| | |
| | Diversified Telecommunication Services – 3.0% | | | | |
| | 102,402 | | | AT&T, Inc.(a) | | | 3,547,205 | |
| | 156,980 | | | CenturyLink, Inc. | | | 5,645,001 | |
| | 93,532 | | | Verizon Communications, Inc. | | | 4,717,754 | |
| | | | | | | | |
| | | | | | | 13,909,960 | |
| | |
| | Electric Utilities – 2.5% | | | | |
| | 103,331 | | | American Electric Power Co., Inc. | | | 5,876,434 | |
| | 39,724 | | | Edison International | | | 2,420,781 | |
| | 22,144 | | | Entergy Corp. | | | 1,709,074 | |
| | 27,786 | | | Pinnacle West Capital Corp. | | | 1,700,503 | |
| | | | | | | | |
| | | | | | | 11,706,792 | |
| | |
| | Electronic Equipment, Instruments & Components – 1.1% | |
| | 249,148 | | | Corning, Inc. | | | 5,214,668 | |
| | |
| | Energy Equipment & Services – 2.2% | | | | |
| | 87,602 | | | Cameron International Corp.* | | | 4,802,341 | |
| | 68,490 | | | FMC Technologies, Inc.* | | | 3,020,409 | |
| | 26,873 | | | Oceaneering International, Inc. | | | 1,480,971 | |
| | 10,230 | | | Oil States International, Inc.* | | | 486,846 | |
| | 19,404 | | | Superior Energy Services, Inc. | | | 494,802 | |
| | | | | | | | |
| | | | | | | 10,285,369 | |
| | |
| | Food & Staples Retailing – 5.1% | | | | |
| | 91,537 | | | CVS Health Corp. | | | 9,088,709 | |
| | 65,175 | | | The Kroger Co. | | | 4,491,209 | |
| | 125,388 | | | Wal-Mart Stores, Inc. | | | 9,786,533 | |
| | | | | | | | |
| | | | | | | 23,366,451 | |
| | |
| | Food Products – 1.1% | | | | |
| | 5,101 | | | Archer-Daniels-Midland Co. | | | 249,337 | |
| | 73,746 | | | Kellogg Co. | | | 4,670,334 | |
| | | | | | | | |
| | | | | | | 4,919,671 | |
| | |
| | Health Care Equipment & Supplies – 0.5% | | | | |
| | 27,557 | | | Abbott Laboratories | | | 1,279,196 | |
| | 9,711 | | | Baxter International, Inc. | | | 667,534 | |
| | 5,423 | | | Medtronic PLC | | | 403,742 | |
| | | | | | | | |
| | | | | | | 2,350,472 | |
| | |
| | Health Care Providers & Services – 3.7% | | | | |
| | 11,958 | | | Aetna, Inc.(a) | | | 1,277,952 | |
| | 38,100 | | | AmerisourceBergen Corp. | | | 4,354,830 | |
| | 5,399 | | | Anthem, Inc. | | | 814,871 | |
| | 66,317 | | | Cardinal Health, Inc. | | | 5,593,176 | |
| | 47,283 | | | UnitedHealth Group, Inc. | | | 5,267,326 | |
| | | | | | | | |
| | | | | | | 17,308,155 | |
| | |
| | |
| The accompanying notes are an integral part of these financial statements. | | 39 |
GOLDMAN SACHS LARGE CAP VALUE INSIGHTS FUND
Schedule of Investments (continued)
April 30, 2015 (Unaudited)
| | | | | | | | |
Shares | | | Description | | Value | |
| | | | | | | | |
| | Common Stocks – (continued) | | | | |
| | Hotels, Restaurants & Leisure – 1.1% | | | | |
| | 116,267 | | | Carnival Corp. | | $ | 5,112,260 | |
| | |
| | Household Durables – 2.4% | | | | |
| | 8,287 | | | D.R. Horton, Inc. | | | 210,490 | |
| | 106,430 | | | Garmin Ltd.(b) | | | 4,809,572 | |
| | 29,239 | | | Mohawk Industries, Inc.* | | | 5,072,966 | |
| | 31,310 | | | Toll Brothers, Inc.* | | | 1,112,757 | |
| | | | | | | | |
| | | | | | | 11,205,785 | |
| | |
| | Household Products – 1.3% | | | | |
| | 14,205 | | | Kimberly-Clark Corp. | | | 1,558,147 | |
| | 57,767 | | | The Procter & Gamble Co. | | | 4,593,054 | |
| | | | | | | | |
| | | | | | | 6,151,201 | |
| | |
| | Independent Power Producers & Energy Traders – 0.4% | | | | |
| | 113,617 | | | AES Corp. | | | 1,505,425 | |
| | 12,879 | | | Calpine Corp.* | | | 280,891 | |
| | | | | | | | |
| | | | | | | 1,786,316 | |
| | |
| | Industrial Conglomerates – 4.5% | | | | |
| | 28,406 | | | 3M Co. | | | 4,442,414 | |
| | 76,466 | | | Danaher Corp. | | | 6,261,036 | |
| | 377,475 | | | General Electric Co. | | | 10,222,023 | |
| | | | | | | | |
| | | | | | | 20,925,473 | |
| | |
| | Insurance – 3.2% | | | | |
| | 73,065 | | | Allied World Assurance Co. Holdings AG | | | 3,005,894 | |
| | 63,890 | | | Aspen Insurance Holdings Ltd. | | | 2,985,580 | |
| | 30,505 | | | Assured Guaranty Ltd. | | | 792,825 | |
| | 5,866 | | | Lincoln National Corp. | | | 331,370 | |
| | 21,167 | | | Reinsurance Group of America, Inc. | | | 1,939,321 | |
| | 57,791 | | | The Travelers Cos., Inc. | | | 5,843,248 | |
| | | | | | | | |
| | | | | | | 14,898,238 | |
| | |
| | IT Services – 1.1% | | | | |
| | 421,003 | | | Xerox Corp. | | | 4,841,535 | |
| | |
| | Media – 0.6% | | | | |
| | 37,659 | | | Comcast Corp. Class A | | | 2,175,184 | |
| | 8,018 | | | Viacom, Inc. Class B | | | 556,850 | |
| | | | | | | | |
| | | | | | | 2,732,034 | |
| | |
| | Metals & Mining – 1.3% | | | | |
| | 102,522 | | | Alcoa, Inc. | | | 1,375,845 | |
| | 11,100 | | | Newmont Mining Corp. | | | 294,039 | |
| | 90,592 | | | Nucor Corp. | | | 4,426,325 | |
| | | | | | | | |
| | | | | | | 6,096,209 | |
| | |
| | Multi-Utilities – 0.2% | | | | |
| | 47,920 | | | CenterPoint Energy, Inc. | | | 1,004,882 | |
| | |
| | Multiline Retail – 0.5% | | | | |
| | 16,365 | | | Kohl’s Corp. | | | 1,172,552 | |
| | 14,668 | | | Target Corp. | | | 1,156,279 | |
| | | | | | | | |
| | | | | | | 2,328,831 | |
| | |
| | | | | | | | |
| | Common Stocks – (continued) | | | | |
| | Oil, Gas & Consumable Fuels – 10.3% | | | | |
| | 65,743 | | | Chevron Corp. | | | 7,301,418 | |
| | 20,460 | | | ConocoPhillips | | | 1,389,643 | |
| | 214,479 | | | Exxon Mobil Corp. | | | 18,739,030 | |
| | 103,289 | | | HollyFrontier Corp. | | | 4,005,547 | |
| | 48,785 | | | Marathon Petroleum Corp. | | | 4,808,737 | |
| | 8,691 | | | PBF Energy, Inc. Class A | | | 246,651 | |
| | 67,560 | | | Phillips 66 | | | 5,358,184 | |
| | 98,301 | | | Valero Energy Corp. | | | 5,593,327 | |
| | | | | | | | |
| | | | | | | 47,442,537 | |
| | |
| | Paper & Forest Products – 0.6% | | | | |
| | 51,575 | | | International Paper Co. | | | 2,770,609 | |
| | |
| | Pharmaceuticals – 9.6% | | | | |
| | 121,183 | | | Bristol-Myers Squibb Co. | | | 7,722,993 | |
| | 150,327 | | | Johnson & Johnson | | | 14,912,438 | |
| | 126,884 | | | Merck & Co., Inc. | | | 7,557,211 | |
| | 425,095 | | | Pfizer, Inc. | | | 14,423,473 | |
| | | | | | | | |
| | | | | | | 44,616,115 | |
| | |
| | Real Estate Investment Trusts – 5.7% | | | | |
| | 43,318 | | | American Capital Agency Corp. | | | 893,867 | |
| | 1,713 | | | American Tower Corp. | | | 161,930 | |
| | 19,120 | | | CBL & Associates Properties, Inc. | | | 344,351 | |
| | 28,449 | | | Crown Castle International Corp. | | | 2,376,345 | |
| | 70,715 | | | Equity Lifestyle Properties, Inc. | | | 3,735,166 | |
| | 19,466 | | | Equity Residential | | | 1,437,759 | |
| | 6,476 | | | Gaming and Leisure Properties, Inc. | | | 231,193 | |
| | 145,167 | | | Hospitality Properties Trust | | | 4,366,623 | |
| | 7,563 | | | Iron Mountain, Inc. | | | 260,848 | |
| | 46,301 | | | Lamar Advertising Co. Class A | | | 2,683,606 | |
| | 85,765 | | | Outfront Media, Inc. | | | 2,463,171 | |
| | 8,628 | | | Post Properties, Inc. | | | 493,263 | |
| | 135,913 | | | Weingarten Realty Investors | | | 4,452,510 | |
| | 173,938 | | | WP GLIMCHER, Inc. | | | 2,609,070 | |
| | | | | | | | |
| | | | | | | 26,509,702 | |
| | |
| | Semiconductors & Semiconductor Equipment – 1.1% | | | | |
| | 157,584 | | | Intel Corp. | | | 5,129,359 | |
| | |
| | Software – 3.4% | | | | |
| | 61,534 | | | Adobe Systems, Inc.* | | | 4,680,276 | |
| | 15,980 | | | Citrix Systems, Inc.* | | | 1,073,217 | |
| | 111,488 | | | Microsoft Corp. | | | 5,422,776 | |
| | 108,473 | | | Oracle Corp. | | | 4,731,592 | |
| | | | | | | | |
| | | | | | | 15,907,861 | |
| | |
| | Specialty Retail – 1.2% | | | | |
| | 70,419 | | | The Gap, Inc. | | | 2,791,409 | |
| | 45,406 | | | The TJX Cos., Inc. | | | 2,930,503 | |
| | | | | | | | |
| | | | | | | 5,721,912 | |
| | |
| | Textiles, Apparel & Luxury Goods – 0.5% | |
| | 32,613 | | | VF Corp. | | | 2,362,160 | |
| | |
| | |
| 40 | | The accompanying notes are an integral part of these financial statements. |
GOLDMAN SACHS LARGE CAP VALUE INSIGHTS FUND
| | | | | | | | |
Shares | | | Description | | Value | |
| | | | | | | | |
| | Common Stocks – (continued) | | | | |
| | Tobacco – 0.0% | |
| | 2,983 | | | Altria Group, Inc. | | $ | 149,299 | |
| | |
| | TOTAL COMMON STOCKS | | | | |
| | (Cost $456,288,790) | | $ | 453,309,070 | |
| | |
| | | | | | | | | | | | |
Principal
Amount | | Interest
Rate | | | Maturity
Date | | | Value | |
| Short-term Investment(c) – 2.1% | |
| Repurchase Agreement – 2.1% | |
Joint Repurchase Agreement Account II | |
| $9,800,000 | | | 0.127 | % | | | 05/01/15 | | | | | |
| (Cost $9,800,000) | | | $ | 9,800,000 | |
| |
| TOTAL INVESTMENTS BEFORE SECURITIES LENDING REINVESTMENT VEHICLE | |
| (Cost $466,088,790) | | | $ | 463,109,070 | |
| |
| | | | | | |
Shares | | Rate | | Value | |
| | | | | | |
| Securities Lending Reinvestment Vehicle(d)(e) – 0.7% | |
Goldman Sachs Financial Square Money Market Fund – FST Shares | |
| 2,957,400 | | 0.111% | | | | |
| (Cost $2,957,400) | | $ | 2,957,400 | |
| |
| TOTAL INVESTMENTS – 100.6% | |
| (Cost $469,046,190) | | $ | 466,066,470 | |
| |
LIABILITIES IN EXCESS OF OTHER ASSETS – (0.6)% | | | (2,563,640 | ) |
| |
| NET ASSETS – 100.0% | | $ | 463,502,830 | |
| |
| | |
| The percentage shown for each investment category reflects the value of investments in that category as a percentage of net assets. |
* | | Non-income producing security. |
(a) | | All or a portion of security is segregated as collateral for initial margin requirements on futures transactions. |
(b) | | All or a portion of security is on loan. |
(c) | | Joint repurchase agreement was entered into on April 30, 2015. Additional information appears on page 57. |
(d) | | Variable rate security. Interest rate disclosed is that which is in effect on April 30, 2015. |
(e) | | Represents an Affiliated Issuer. |
|
| ADDITIONAL INVESTMENT INFORMATION |
FUTURES CONTRACTS — At April 30, 2015, the Fund had the following futures contracts:
| | | | | | | | | | | | |
| Type | | Number of
Contracts
Long (Short) | | Expiration
Date | | Current
Value | | | Unrealized
Gain (Loss) | |
S&P 500 E-Mini Index | | 32 | | June 2015 | | $ | 3,326,240 | | | $ | 20,046 | |
| | |
| The accompanying notes are an integral part of these financial statements. | | 41 |
GOLDMAN SACHS SMALL CAP EQUITY INSIGHTS FUND
Schedule of Investments
April 30, 2015 (Unaudited)
| | | | | | | | |
Shares | | | Description | | Value | |
| | | | | | | | |
| | Common Stocks – 97.8% | |
| | Aerospace & Defense – 1.5% | | | | |
| | 1,092 | | | Cubic Corp. | | $ | 54,142 | |
| | 16,322 | | | Curtiss-Wright Corp. | | | 1,192,485 | |
| | 4,345 | | | Engility Holdings, Inc. | | | 121,095 | |
| | 2,468 | | | Esterline Technologies Corp.* | | | 274,664 | |
| | 12,857 | | | Moog, Inc. Class A* | | | 898,447 | |
| | | | | | | | |
| | | | | | | 2,540,833 | |
| | |
| | Airlines – 0.5% | | | | |
| | 5,580 | | | Allegiant Travel Co. | | | 857,981 | |
| | |
| | Auto Components – 1.6% | | | | |
| | 30,372 | | | Cooper Tire & Rubber Co. | | | 1,290,506 | |
| | 40,267 | | | Modine Manufacturing Co.* | | | 494,882 | |
| | 22,285 | | | Stoneridge, Inc.* | | | 268,311 | |
| | 28,492 | | | Tower International, Inc.* | | | 736,803 | |
| | | | | | | | |
| | | | | | | 2,790,502 | |
| | |
| | Biotechnology – 7.8% | | | | |
| | 29,245 | | | Acorda Therapeutics, Inc.* | | | 879,397 | |
| | 21,980 | | | Aegerion Pharmaceuticals, Inc.*(a) | | | 511,255 | |
| | 83,922 | | | Array BioPharma, Inc.*(a) | | | 524,512 | |
| | 53,738 | | | Dyax Corp.* | | | 1,284,875 | |
| | 40,201 | | | Emergent Biosolutions, Inc.* | | | 1,193,568 | |
| | 1,832 | | | Enanta Pharmaceuticals, Inc.*(a) | | | 62,728 | |
| | 33,894 | | | Genomic Health, Inc.*(a) | | | 917,510 | |
| | 19,477 | | | Halozyme Therapeutics, Inc.* | | | 289,623 | |
| | 20,705 | | | Hyperion Therapeutics, Inc.* | | | 951,602 | |
| | 69,611 | | | Infinity Pharmaceuticals, Inc.* | | | 881,971 | |
| | 69,907 | | | Ironwood Pharmaceuticals, Inc.* | | | 954,930 | |
| | 26,794 | | | Isis Pharmaceuticals, Inc.*(a) | | | 1,519,756 | |
| | 10,904 | | | Ligand Pharmaceuticals, Inc. Class B*(a) | | | 846,586 | |
| | 1,093 | | | NewLink Genetics Corp.* | | | 48,748 | |
| | 12,820 | | | Ophthotech Corp.* | | | 580,490 | |
| | 34,694 | | | PDL BioPharma, Inc.(a) | | | 231,409 | |
| | 7,108 | | | Prothena Corp. PLC* | | | 230,370 | |
| | 3,361 | | | PTC Therapeutics, Inc.* | | | 197,459 | |
| | 38,431 | | | Repligen Corp.* | | | 1,134,099 | |
| | | | | | | | |
| | | | | | | 13,240,888 | |
| | |
| | Building Products – 1.1% | | | | |
| | 14,875 | | | American Woodmark Corp.* | | | 754,162 | |
| | 1,276 | | | Apogee Enterprises, Inc. | | | 67,143 | |
| | 2,472 | | | Simpson Manufacturing Co., Inc. | | | 81,032 | |
| | 18,586 | | | Universal Forest Products, Inc. | | | 1,028,178 | |
| | | | | | | | |
| | | | | | | 1,930,515 | |
| | |
| | Capital Markets – 1.9% | | | | |
| | 20,764 | | | Arlington Asset Investment Corp. Class A(a) | | | 450,164 | |
| | 14,323 | | | Evercore Partners, Inc. Class A | | | 690,942 | |
| | 11,701 | | | GAMCO Investors, Inc. Class A | | | 904,604 | |
| | 22,990 | | | Investment Technology Group, Inc.* | | | 654,985 | |
| | 10,865 | | | Piper Jaffray Cos., Inc.* | | | 548,139 | |
| | | | | | | | |
| | | | | | | 3,248,834 | |
| | |
| | Chemicals – 2.4% | | | | |
| | 27,686 | | | A. Schulman, Inc. | | | 1,175,271 | |
| | |
| | | | | | | | |
| | Common Stocks – (continued) | |
| | Chemicals – (continued) | | | | |
| | 23,273 | | | FutureFuel Corp. | | | 252,977 | |
| | 19,658 | | | Innophos Holdings, Inc. | | | 1,038,729 | |
| | 27,229 | | | Intrepid Potash, Inc.* | | | 341,179 | |
| | 20,840 | | | OM Group, Inc. | | | 626,034 | |
| | 11,190 | | | PolyOne Corp. | | | 436,969 | |
| | 2,152 | | | Sensient Technologies Corp. | | | 140,655 | |
| | | | | | | | |
| | | | | | | 4,011,814 | |
| | |
| | Commercial Banks – 4.1% | | | | |
| | 21,572 | | | 1st Source Corp. | | | 671,321 | |
| | 33,494 | | | Central Pacific Financial Corp. | | | 767,013 | |
| | 79,112 | | | CVB Financial Corp. | | | 1,238,103 | |
| | 14,083 | | | First Bancorp, Inc. | | | 234,904 | |
| | 40,848 | | | First Interstate BancSystem, Inc. | | | 1,105,347 | |
| | 6,334 | | | Great Southern Bancorp, Inc. | | | 249,686 | |
| | 69,283 | | | OFG Bancorp | | | 976,197 | |
| | 37,965 | | | Old National Bancorp | | | 518,602 | |
| | 8,265 | | | PrivateBancorp, Inc. | | | 306,384 | |
| | 14,157 | | | Prosperity Bancshares, Inc. | | | 755,134 | |
| | 5,928 | | | Wilshire Bancorp, Inc. | | | 62,540 | |
| | | | | | | | |
| | | | | | | 6,885,231 | |
| | |
| | Commercial Services & Supplies – 1.4% | | | | |
| | 8,788 | | | G&K Services, Inc. Class A | | | 620,433 | |
| | 62,756 | | | Kimball International, Inc. Class B | | | 635,090 | |
| | 2,555 | | | Multi-Color Corp. | | | 160,403 | |
| | 41,196 | | | Quad Graphics, Inc. | | | 887,362 | |
| | | | | | | | |
| | | | | | | 2,303,288 | |
| | |
| | Communications Equipment* – 2.3% | | | | |
| | 57,666 | | | Aruba Networks, Inc. | | | 1,419,160 | |
| | 21,970 | | | Calix, Inc. | | | 162,358 | |
| | 107,160 | | | Harmonic, Inc. | | | 751,192 | |
| | 9,896 | | | NETGEAR, Inc. | | | 299,552 | |
| | 95,092 | | | Polycom, Inc. | | | 1,240,951 | |
| | | | | | | | |
| | | | | | | 3,873,213 | |
| | |
| | Computers & Peripherals* – 0.1% | | | | |
| | 3,492 | | | Electronics for Imaging, Inc. | | | 145,721 | |
| | |
| | Construction & Engineering – 1.0% | | | | |
| | 30,835 | | | Aegion Corp.* | | | 567,981 | |
| | 25,367 | | | EMCOR Group, Inc. | | | 1,132,129 | |
| | | | | | | | |
| | | | | | | 1,700,110 | |
| | |
| | Consumer Finance – 1.8% | | | | |
| | 45,771 | | | Cash America International, Inc. | | | 1,186,384 | |
| | 3,124 | | | Enova International, Inc.* | | | 57,825 | |
| | 81,038 | | | EZCORP, Inc. Class A* | | | 745,550 | |
| | 12,636 | | | World Acceptance Corp.*(a) | | | 1,069,258 | |
| | | | | | | | |
| | | | | | | 3,059,017 | |
| | |
| | Containers & Packaging – 0.7% | |
| | 84,724 | | | Graphic Packaging Holding Co. | | | 1,194,608 | |
| | |
| | Diversified Consumer Services* – 1.3% | |
| | 23,209 | | | Bridgepoint Education, Inc. | | | 203,543 | |
| | |
| | |
| 42 | | The accompanying notes are an integral part of these financial statements. |
GOLDMAN SACHS SMALL CAP EQUITY INSIGHTS FUND
| | | | | | | | |
Shares | | | Description | | Value | |
| | | | | | | | |
| | Common Stocks – (continued) | |
| | Diversified Consumer Services* – (continued) | |
| | 56,127 | | | K12, Inc. | | $ | 907,574 | |
| | 59,737 | | | Regis Corp. | | | 986,855 | |
| | 3,677 | | | Strayer Education, Inc. | | | 186,497 | |
| | | | | | | | |
| | | | | | | 2,284,469 | |
| | |
| | Diversified Telecommunication Services* – 0.2% | |
| | 70,252 | | | Vonage Holdings Corp. | | | 325,267 | |
| | |
| | Electric Utilities – 0.3% | |
| | 8,587 | | | Cleco Corp. | | | 466,703 | |
| | |
| | Electrical Equipment – 0.5% | |
| | 18,359 | | | GrafTech International Ltd.* | | | 88,857 | |
| | 34,160 | | | LSI Industries, Inc. | | | 306,074 | |
| | 6,877 | | | Polypore International, Inc.* | | | 402,717 | |
| | | | | | | | |
| | | | | | | 797,648 | |
| | |
| | Electronic Equipment, Instruments & Components – 3.2% | |
| | 48,688 | | | Benchmark Electronics, Inc.* | | | 1,145,629 | |
| | 10,176 | | | II-VI, Inc.* | | | 181,031 | |
| | 16,659 | | | Insight Enterprises, Inc.* | | | 476,780 | |
| | 47,067 | | | Kimball Electronics, Inc.* | | | 601,987 | |
| | 26,591 | | | Methode Electronics, Inc. | | | 1,129,054 | |
| | 13,918 | | | OSI Systems, Inc.* | | | 935,429 | |
| | 42,262 | | | Sanmina Corp.* | | | 859,186 | |
| | 7,557 | | | TTM Technologies, Inc.* | | | 70,658 | |
| | | | | | | | |
| | | | | | | 5,399,754 | |
| | |
| | Energy Equipment & Services – 1.4% | |
| | 46,543 | | | Forum Energy Technologies, Inc.* | | | 1,082,590 | |
| | 37,982 | | | ION Geophysical Corp.* | | | 86,599 | |
| | 131,846 | | | Key Energy Services, Inc.* | | | 321,704 | |
| | 85,965 | | | Pioneer Energy Services Corp.* | | | 640,439 | |
| | 19,904 | | | Tesco Corp. | | | 255,966 | |
| | | | | | | | |
| | | | | | | 2,387,298 | |
| | |
| | Food Products – 0.5% | |
| | 8,947 | | | Lancaster Colony Corp. | | | 802,188 | |
| | |
| | Gas Utilities – 0.5% | |
| | 27,101 | | | New Jersey Resources Corp. | | | 826,852 | |
| | |
| | Health Care Equipment & Supplies – 4.8% | |
| | 1,277 | | | ABIOMED, Inc.* | | | 80,732 | |
| | 6,660 | | | Anika Therapeutics, Inc.* | | | 227,239 | |
| | 2,697 | | | Atrion Corp. | | | 876,121 | |
| | 22,787 | | | Cantel Medical Corp. | | | 1,020,630 | |
| | 2,297 | | | Cyberonics, Inc.* | | | 139,910 | |
| | 23,625 | | | Greatbatch, Inc.* | | | 1,273,860 | |
| | 13,786 | | | ICU Medical, Inc.* | | | 1,163,125 | |
| | 12,635 | | | Invacare Corp. | | | 253,584 | |
| | 6,199 | | | Masimo Corp.* | | | 209,278 | |
| | 11,975 | | | Meridian Bioscience, Inc. | | | 212,197 | |
| | 29,590 | | | Natus Medical, Inc.* | | | 1,115,839 | |
| | 26,186 | | | NuVasive, Inc.* | | | 1,171,300 | |
| | 9,804 | | | Orthofix International NV* | | | 316,767 | |
| | 1,969 | | | Thoratec Corp.* | | | 78,977 | |
| | | | | | | | |
| | | | | | | 8,139,559 | |
| | |
| | | | | | | | |
| | Common Stocks – (continued) | |
| | Health Care Providers & Services* – 1.9% | |
| | 30,523 | | | Genesis Healthcare, Inc. | | | 210,914 | |
| | 16,591 | | | Magellan Health, Inc. | | | 1,050,210 | |
| | 16,073 | | | Molina Healthcare, Inc. | | | 952,004 | |
| | 10,365 | | | Triple-S Management Corp. Class B | | | 194,033 | |
| | 10,493 | | | WellCare Health Plans, Inc. | | | 812,473 | |
| | | | | | | | |
| | | | | | | 3,219,634 | |
| | |
| | Hotels, Restaurants & Leisure – 6.8% | |
| | 21,917 | | | BJ’s Restaurants, Inc.* | | | 1,025,716 | |
| | 22,923 | | | Bloomin’ Brands, Inc. | | | 519,435 | |
| | 4,471 | | | Bob Evans Farms, Inc. | | | 192,342 | |
| | 18,936 | | | Boyd Gaming Corp.* | | | 249,955 | |
| | 8,678 | | | Cracker Barrel Old Country Store, Inc. | | | 1,149,661 | |
| | 34,288 | | | Denny’s Corp.* | | | 356,938 | |
| | 6,702 | | | DineEquity, Inc. | | | 646,274 | |
| | 15,722 | | | Jack in the Box, Inc. | | | 1,364,198 | |
| | 16,314 | | | Marriott Vacations Worldwide Corp. | | | 1,341,174 | |
| | 20,768 | | | Papa John’s International, Inc. | | | 1,274,532 | |
| | 2,040 | | | Red Robin Gourmet Burgers, Inc.* | | | 153,184 | |
| | 39,141 | | | Sonic Corp. | | | 1,121,390 | |
| | 29,731 | | | Texas Roadhouse, Inc. | | | 998,962 | |
| | 11,921 | | | Vail Resorts, Inc. | | | 1,182,682 | |
| | | | | | | | |
| | | | | | | 11,576,443 | |
| | |
| | Household Durables – 2.4% | |
| | 15,004 | | | Cavco Industries, Inc.* | | | 983,812 | |
| | 36,104 | | | Ethan Allen Interiors, Inc. | | | 874,439 | |
| | 10,436 | | | Helen of Troy Ltd.* | | | 914,298 | |
| | 2,464 | | | Installed Building Products, Inc.* | | | 51,276 | |
| | 4,454 | | | La-Z-Boy, Inc. | | | 116,739 | |
| | 6,881 | | | MDC Holdings, Inc. | | | 184,686 | |
| | 17,437 | | | Universal Electronics, Inc.* | | | 940,552 | |
| | | | | | | | |
| | | | | | | 4,065,802 | |
| | |
| | Insurance – 3.0% | |
| | 33,911 | | | American Equity Investment Life Holding Co. | | | 913,901 | |
| | 21,065 | | | AmTrust Financial Services, Inc.(a) | | | 1,252,736 | |
| | 24,086 | | | Argo Group International Holdings Ltd. | | | 1,179,973 | |
| | 8,989 | | | Maiden Holdings Ltd. | | | 130,610 | |
| | 11,206 | | | Selective Insurance Group, Inc. | | | 301,890 | |
| | 51,429 | | | Symetra Financial Corp. | | | 1,221,439 | |
| | | | | | | | |
| | | | | | | 5,000,549 | |
| | |
| | Internet Software & Services – 2.3% | |
| | 30,439 | | | Constant Contact, Inc.* | | | 1,060,799 | |
| | 22,348 | | | LogMeIn, Inc.* | | | 1,434,295 | |
| | 33,034 | | | Marchex, Inc. Class B | | | 140,394 | |
| | 47,879 | | | Web.com Group, Inc.* | | | 879,537 | |
| | 7,805 | | | WebMD Health Corp.* | | | 344,591 | |
| | | | | | | | |
| | | | | | | 3,859,616 | |
| | |
| | IT Services – 1.2% | | | | |
| | 4,866 | | | CSG Systems International, Inc. | | | 141,698 | |
| | 33,470 | | | ManTech International Corp. Class A | | | 978,328 | |
| | 37,450 | | | Sykes Enterprises, Inc.* | | | 937,374 | |
| | | | | | | | |
| | | | | | | 2,057,400 | |
| | |
| | |
| The accompanying notes are an integral part of these financial statements. | | 43 |
GOLDMAN SACHS SMALL CAP EQUITY INSIGHTS FUND
Schedule of Investments (continued)
April 30, 2015 (Unaudited)
| | | | | | | | |
Shares | | | Description | | Value | |
| | | | | | | | |
| | Common Stocks – (continued) | |
| | Leisure Equipment & Products – 0.3% | | | | |
| | 8,726 | | | Brunswick Corp. | | $ | 436,649 | |
| | 13,919 | | | Callaway Golf Co. | | | 134,736 | |
| | | | | | | | |
| | | | | | | 571,385 | |
| | |
| | Life Sciences Tools & Services* – 0.7% | | | | |
| | 20,039 | | | PAREXEL International Corp. | | | 1,273,979 | |
| | |
| | Machinery – 2.1% | | | | |
| | 4,636 | | | Altra Industrial Motion Corp. | | | 122,251 | |
| | 26,978 | | | Barnes Group, Inc. | | | 1,081,818 | |
| | 9,051 | | | Blount International, Inc.* | | | 120,016 | |
| | 12,161 | | | Hillenbrand, Inc. | | | 357,412 | |
| | 9,223 | | | Hyster-Yale Materials Handling, Inc. | | | 676,415 | |
| | 8,671 | | | Kadant, Inc. | | | 441,874 | |
| | 17,149 | | | Miller Industries, Inc. | | | 383,795 | |
| | 1,606 | | | Mueller Industries, Inc. | | | 56,274 | |
| | 2,821 | | | TriMas Corp.* | | | 79,468 | |
| | 11,452 | | | Wabash National Corp.* | | | 160,557 | |
| | | | | | | | |
| | | | | | | 3,479,880 | |
| | |
| | Media – 0.3% | | | | |
| | 13,855 | | | Entercom Communications Corp. Class A* | | | 164,597 | |
| | 44,613 | | | Harte-Hanks, Inc. | | | 302,922 | |
| | 1,848 | | | Scholastic Corp. | | | 75,103 | |
| | | | | | | | |
| | | | | | | 542,622 | |
| | |
| | Metals & Mining – 1.2% | | | | |
| | 6,137 | | | Century Aluminum Co.* | | | 79,106 | |
| | 31,167 | | | Materion Corp. | | | 1,246,368 | |
| | 40,802 | | | Schnitzer Steel Industries, Inc. Class A | | | 710,771 | |
| | | | | | | | |
| | | | | | | 2,036,245 | |
| | |
| | Oil, Gas & Consumable Fuels – 4.0% | | | | |
| | 73,374 | | | Alon USA Energy, Inc. | | | 1,180,588 | |
| | 8,757 | | | Bill Barrett Corp.* | | | 101,581 | |
| | 35,307 | | | Comstock Resources, Inc.(a) | | | 189,599 | |
| | 7,578 | | | Contango Oil & Gas Co.* | | | 189,980 | |
| | 34,733 | | | Delek US Holdings, Inc. | | | 1,282,342 | |
| | 39,892 | | | Dorian LPG Ltd.* | | | 528,968 | |
| | 41,562 | | | Green Plains, Inc. | | | 1,294,241 | |
| | 11,724 | | | REX American Resources Corp.* | | | 741,191 | |
| | 28,085 | | | Western Refining, Inc. | | | 1,237,144 | |
| | | | | | | | |
| | | | | | | 6,745,634 | |
| | |
| | Paper & Forest Products – 0.2% | | | | |
| | 11,811 | | | PH Glatfelter Co. | | | 292,913 | |
| | |
| | Pharmaceuticals – 1.5% | | | | |
| | 14,415 | | | Catalent, Inc.* | | | 414,720 | |
| | 18,441 | | | Impax Laboratories, Inc.* | | | 834,640 | |
| | 3,627 | | | Pacira Pharmaceuticals, Inc.* | | | 248,377 | |
| | 2,007 | | | Phibro Animal Health Corp. Class A | | | 63,742 | |
| | 1,729 | | | Prestige Brands Holdings, Inc.* | | | 67,863 | |
| | 36,480 | | | Sagent Pharmaceuticals, Inc.* | | | 850,349 | |
| | | | | | | | |
| | | | | | | 2,479,691 | |
| | |
| | | | | | | | |
| | Common Stocks – (continued) | |
| | Professional Services – 2.1% | | | | |
| | 4,414 | | | Barrett Business Services, Inc. | | | 196,291 | |
| | 19,021 | | | CDI Corp. | | | 259,446 | |
| | 19,550 | | | Insperity, Inc. | | | 941,528 | |
| | 39,620 | | | Korn/Ferry International | | | 1,249,219 | |
| | 5,817 | | | Navigant Consulting, Inc.* | | | 84,114 | |
| | 54,733 | | | RPX Corp.* | | | 851,645 | |
| | | | | | | | |
| | | | | | | 3,582,243 | |
| | |
| | Real Estate Investment Trusts – 12.2% | | | | |
| | 28,480 | | | American Assets Trust, Inc. | | | 1,133,504 | |
| | 207,926 | | | Anworth Mortgage Asset Corp.(b) | | | 1,056,264 | |
| | 25,732 | | | Coresite Realty Corp. | | | 1,237,195 | |
| | 73,060 | | | Cousins Properties, Inc. | | | 711,604 | |
| | 42,807 | | | CubeSmart | | | 987,558 | |
| | 38,440 | | | CyrusOne, Inc. | | | 1,248,531 | |
| | 84,160 | | | DiamondRock Hospitality Co. | | | 1,141,210 | |
| | 29,173 | | | DuPont Fabros Technology, Inc. | | | 908,739 | |
| | 58,459 | | | Empire State Realty Trust, Inc. Class A | | | 1,052,262 | |
| | 23,830 | | | FelCor Lodging Trust, Inc. | | | 264,751 | |
| | 59,437 | | | First Industrial Realty Trust, Inc. | | | 1,172,692 | |
| | 34,534 | | | Hudson Pacific Properties, Inc. | | | 1,041,545 | |
| | 46,900 | | | Invesco Mortgage Capital, Inc. | | | 722,260 | |
| | 30,373 | | | Parkway Properties, Inc. | | | 494,169 | |
| | 41,071 | | | Pennsylvania Real Estate Investment Trust | | | 928,615 | |
| | 14,655 | | | PS Business Parks, Inc. | | | 1,118,909 | |
| | 3,744 | | | Ramco-Gershenson Properties Trust | | | 65,445 | |
| | 9,681 | | | RLJ Lodging Trust | | | 287,235 | |
| | 25,880 | | | Rouse Properties, Inc. | | | 452,124 | |
| | 12,047 | | | Sovran Self Storage, Inc. | | | 1,052,185 | |
| | 95,104 | | | Strategic Hotels & Resorts, Inc.* | | | 1,112,717 | |
| | 81,086 | | | Sunstone Hotel Investors, Inc. | | | 1,263,320 | |
| | 27,999 | | | The Geo Group, Inc. | | | 1,091,961 | |
| | | | | | | | |
| | | | | | | 20,544,795 | |
| | |
| | Real Estate Management & Development* – 0.1% | | | | |
| | 2,426 | | | Marcus & Millichap, Inc. | | | 85,832 | |
| | |
| | Road & Rail – 0.5% | | | | |
| | 24,269 | | | ArcBest Corp. | | | 866,403 | |
| | |
| | Semiconductors & Semiconductor Equipment* – 3.9% | | | | |
| | 20,952 | | | Cabot Microelectronics Corp. | | | 991,030 | |
| | 42,999 | | | Diodes, Inc. | | | 1,148,933 | |
| | 61,420 | | | Integrated Device Technology, Inc. | | | 1,117,230 | |
| | 24,213 | | | Microsemi Corp. | | | 807,746 | |
| | 44,806 | | | OmniVision Technologies, Inc. | | | 1,249,863 | |
| | 23,233 | | | Silicon Laboratories, Inc. | | | 1,200,449 | |
| | | | | | | | |
| | | | | | | 6,515,251 | |
| | |
| | Software – 5.0% | | | | |
| | 25,335 | | | Advent Software, Inc. | | | 1,099,792 | |
| | 55,048 | | | AVG Technologies NV* | | | 1,316,748 | |
| | 2,127 | | | BroadSoft, Inc.* | | | 67,298 | |
| | 2,229 | | | Manhattan Associates, Inc.* | | | 117,156 | |
| | 29,241 | | | Monotype Imaging Holdings, Inc. | | | 947,701 | |
| | 29,552 | | | NetScout Systems, Inc.*(a) | | | 1,214,587 | |
| | |
| | |
| 44 | | The accompanying notes are an integral part of these financial statements. |
GOLDMAN SACHS SMALL CAP EQUITY INSIGHTS FUND
| | | | | | | | |
Shares | | | Description | | Value | |
| | | | | | | | |
| | Common Stocks – (continued) | |
| | Software – (continued) | | | | |
| | 49,046 | | | Pegasystems, Inc. | | $ | 1,056,451 | |
| | 39,614 | | | Progress Software Corp.* | | | 1,045,810 | |
| | 3,392 | | | Qlik Technologies, Inc.* | | | 118,008 | |
| | 24,908 | | | SS&C Technologies Holdings, Inc. | | | 1,498,715 | |
| | | | | | | | |
| | | | | | | 8,482,266 | |
| | |
| | Specialty Retail – 3.9% | | | | |
| | 42,032 | | | American Eagle Outfitters, Inc. | | | 668,729 | |
| | 10,497 | | | ANN, Inc.* | | | 397,416 | |
| | 24,150 | | | Brown Shoe Co., Inc. | | | 717,255 | |
| | 6,003 | | | Genesco, Inc.* | | | 405,743 | |
| | 40,873 | | | Haverty Furniture Cos., Inc. | | | 877,135 | |
| | 20,632 | | | hhgregg, Inc.*(a) | | | 118,015 | |
| | 40,261 | | | Select Comfort Corp.* | | | 1,240,844 | |
| | 9,981 | | | Stage Stores, Inc. | | | 192,733 | |
| | 25,936 | | | The Cato Corp. Class A | | | 1,020,322 | |
| | 2,595 | | | Vitamin Shoppe, Inc.* | | | 108,679 | |
| | 27,038 | | | Zumiez, Inc.* | | | 857,375 | |
| | | | | | | | |
| | | | | | | 6,604,246 | |
| | |
| | Textiles, Apparel & Luxury Goods* – 0.1% | | | | |
| | 2,496 | | | Unifi, Inc. | | | 88,084 | |
| | |
| | Thrifts & Mortgage Finance – 0.7% | | | | |
| | 91,729 | | | Brookline Bancorp, Inc. | | | 987,921 | |
| | 14,113 | | | Oritani Financial Corp. | | | 210,284 | |
| | | | | | | | |
| | | | | | | 1,198,205 | |
| | |
| | Trading Companies & Distributors – 0.2% | | | | |
| | 2,859 | | | Watsco, Inc. | | | 343,909 | |
| | |
| | Water Utilities – 0.1% | | | | |
| | 4,157 | | | California Water Service Group | | | 99,228 | |
| | |
| | Wireless Telecommunication Services – 0.2% | | | | |
| | 22,931 | | | Spok Holdings, Inc. | | | 431,676 | |
| | |
| | TOTAL COMMON STOCKS | |
| | (Cost $155,864,864) | | $ | 165,256,224 | |
| | |
| | | | | | | | | | | | | | |
Principal
Amount | | | Interest
Rate | | | Maturity
Date | | | Value | |
| | | | | | | | | | | | | | |
| | Short-term Investment(c) – 2.6% | |
| | Repurchase Agreement – 2.6% | |
| Joint Repurchase Agreement Account II | |
| $ | 4,300,000 | | | | 0.127 | % | | | 05/01/15 | | | | | |
| | (Cost $4,300,000) | | | $ | 4,300,000 | |
| | |
| TOTAL INVESTMENTS BEFORE SECURITIES LENDING
REINVESTMENT VEHICLE |
|
| | (Cost $160,164,864) | | | | | | | $ | 169,556,224 | |
| | |
| | | | | | |
| Shares | | Rate | | Value | |
| Securities Lending Reinvestment Vehicle(d)(e) – 3.9% | |
Goldman Sachs Financial Square Money Market Fund – FST Shares | |
| 6,628,723 | | 0.111% | | | | |
| (Cost $6,628,723) | | $ | 6,628,723 | |
| |
| TOTAL INVESTMENTS – 104.3% | |
| (Cost $166,793,587) | | $ | 176,184,947 | |
| |
| LIABILITIES IN EXCESS OF OTHER ASSETS – (4.3)% | | | (7,227,859 | ) |
| |
| NET ASSETS – 100.0% | | $ | 168,957,088 | |
| |
| | |
| The percentage shown for each investment category reflects the value of investments in that category as a percentage of net assets. |
* | | Non-income producing security. |
(a) | | All or a portion of security is on loan. |
(b) | | A portion of this security is segregated as collateral for initial margin requirement on futures transactions. |
(c) | | Joint repurchase agreement was entered into on April 30, 2015. Additional information appears on page 57. |
(d) | | Variable rate security. Interest rate disclosed is that which is in effect on April 30, 2015. |
(e) | | Represents an affiliated issuer. |
|
| ADDITIONAL INVESTMENT INFORMATION |
FUTURES CONTRACTS — At April 30, 2015, the Fund had the following futures contracts:
| | | | | | | | | | | | |
| Type | | Number of
Contracts
Long (Short) | | Expiration
Date | | Current
Value | | | Unrealized
Gain (Loss) | |
Russell 2000 Mini Index | | 22 | | June 2015 | | $ | 2,676,080 | | | $ | (88,824 | ) |
| | |
| The accompanying notes are an integral part of these financial statements. | | 45 |
GOLDMAN SACHS SMALL CAP GROWTH INSIGHTS FUND
Schedule of Investments
April 30, 2015 (Unaudited)
| | | | | | | | |
| Shares | | | Description | |
Value | |
| | | | | | | | |
| | Common Stocks – 95.2% | |
| | Aerospace & Defense – 1.0% | |
| | 7,836 | | | Curtiss-Wright Corp. | | $ | 572,498 | |
| | 5,291 | | | Moog, Inc. Class A* | | | 369,735 | |
| | | | | | | | |
| | | | | | | 942,233 | |
| | |
| | Airlines – 0.6% | |
| | 4,056 | | | Allegiant Travel Co. | | | 623,651 | |
| | |
| | Auto Components – 0.6% | |
| | 12,046 | | | Cooper Tire & Rubber Co. | | | 511,835 | |
| | 5,284 | | | Stoneridge, Inc.* | | | 63,619 | |
| | | | | | | | |
| | | | | | | 575,454 | |
| | |
| | Biotechnology – 12.5% | |
| | 10,358 | | | Achillion Pharmaceuticals, Inc.* | | | 90,633 | |
| | 19,120 | | | Acorda Therapeutics, Inc.*(a) | | | 574,938 | |
| | 3,416 | | | Aegerion Pharmaceuticals, Inc.* | | | 79,456 | |
| | 1,513 | | | Alder Biopharmaceuticals, Inc.* | | | 38,582 | |
| | 15,807 | | | Arena Pharmaceuticals, Inc.* | | | 68,919 | |
| | 79,914 | | | Array BioPharma, Inc.*(b) | | | 499,463 | |
| | 33,740 | | | Dyax Corp.* | | | 806,723 | |
| | 16,814 | | | Emergent Biosolutions, Inc.* | | | 499,208 | |
| | 5,584 | | | Enanta Pharmaceuticals, Inc.*(b) | | | 191,196 | |
| | 1,524 | | | Five Prime Therapeutics, Inc.* | | | 30,572 | |
| | 1,959 | | | Foundation Medicine, Inc.*(b) | | | 89,154 | |
| | 18,273 | | | Genomic Health, Inc.* | | | 494,650 | |
| | 40,552 | | | Halozyme Therapeutics, Inc.*(b) | | | 603,008 | |
| | 11,520 | | | Hyperion Therapeutics, Inc.* | | | 529,459 | |
| | 39,453 | | | Infinity Pharmaceuticals, Inc.* | | | 499,870 | |
| | 13,574 | | | Intrexon Corp.* | | | 527,078 | |
| | 45,273 | | | Ironwood Pharmaceuticals, Inc.* | | | 618,429 | |
| | 20,179 | | | Isis Pharmaceuticals, Inc.*(a) | | | 1,144,553 | |
| | 9,535 | | | Ligand Pharmaceuticals, Inc. Class B*(b) | | | 740,297 | |
| | 10,723 | | | MiMedx Group, Inc.*(b) | | | 100,796 | |
| | 11,372 | | | NewLink Genetics Corp.* | | | 507,191 | |
| | 11,156 | | | Ophthotech Corp.* | | | 505,144 | |
| | 14,291 | | | Orexigen Therapeutics, Inc.*(b) | | | 93,892 | |
| | 85,878 | | | PDL BioPharma, Inc.(b) | | | 572,806 | |
| | 14,102 | | | Prothena Corp. PLC* | | | 457,046 | |
| | 7,991 | | | PTC Therapeutics, Inc.* | | | 469,471 | |
| | 1,583 | | | Puma Biotechnology, Inc.* | | | 285,858 | |
| | 16,453 | | | Raptor Pharmaceutical Corp.* | | | 166,504 | |
| | 20,255 | | | Repligen Corp.* | | | 597,725 | |
| | 12,178 | | | Sangamo Biosciences, Inc.* | | | 150,642 | |
| | 7,998 | | | ZIOPHARM Oncology, Inc.*(b) | | | 70,462 | |
| | | | | | | | |
| | | | | | | 12,103,725 | |
| | |
| | Building Products – 1.4% | |
| | 7,048 | | | American Woodmark Corp.* | | | 357,334 | |
| | 1,173 | | | Apogee Enterprises, Inc. | | | 61,723 | |
| | 13,980 | | | Continental Building Products, Inc.* | | | 307,700 | |
| | 4,516 | | | Quanex Building Products Corp. | | | 87,159 | |
| | 2,930 | | | Simpson Manufacturing Co., Inc. | | | 96,045 | |
| | 7,609 | | | Universal Forest Products, Inc. | | | 420,930 | |
| | | | | | | | |
| | | | | | | 1,330,891 | |
| | |
| | Capital Markets – 1.0% | |
| | 11,878 | | | Evercore Partners, Inc. Class A | | | 572,995 | |
| | |
| | | | | | | | |
| | Common Stocks – (continued) | |
| | Capital Markets – (continued) | |
| | 2,947 | | | GAMCO Investors, Inc. Class A | | $ | 227,832 | |
| | 6,993 | | | Investment Technology Group, Inc.* | | | 199,231 | |
| | | | | | | | |
| | | | | | | 1,000,058 | |
| | |
| | Chemicals – 1.7% | |
| | 11,638 | | | A. Schulman, Inc. | | | 494,033 | |
| | 7,909 | | | Innophos Holdings, Inc. | | | 417,912 | |
| | 19,558 | | | PolyOne Corp. | | | 763,740 | |
| | | | | | | | |
| | | | | | | 1,675,685 | |
| | |
| | Commercial Banks – 0.8% | |
| | 11,035 | | | First Interstate BancSystem, Inc. | | | 298,607 | |
| | 26,796 | | | OFG Bancorp | | | 377,556 | |
| | 1,810 | | | Prosperity Bancshares, Inc. | | | 96,545 | |
| | | | | | | | |
| | | | | | | 772,708 | |
| | |
| | Commercial Services & Supplies – 0.7% | |
| | 4,319 | | | Deluxe Corp. | | | 279,655 | |
| | 4,026 | | | Kimball International, Inc. Class B | | | 40,743 | |
| | 778 | | | Multi-Color Corp. | | | 48,843 | |
| | 13,113 | | | Quad Graphics, Inc. | | | 282,454 | |
| | | | | | | | |
| | | | | | | 651,695 | |
| | |
| | Communications Equipment* – 2.6% | |
| | 32,549 | | | Aruba Networks, Inc. | | | 801,031 | |
| | 3,803 | | | Calix, Inc. | | | 28,104 | |
| | 25,089 | | | Ciena Corp. | | | 534,396 | |
| | 65,839 | | | Harmonic, Inc. | | | 461,532 | |
| | 2,894 | | | NETGEAR, Inc. | | | 87,601 | |
| | 45,147 | | | Polycom, Inc. | | | 589,168 | |
| | | | | | | | |
| | | | | | | 2,501,832 | |
| | |
| | Computers & Peripherals* – 0.1% | |
| | 2,114 | | | Electronics for Imaging, Inc. | | | 88,217 | |
| | |
| | Construction & Engineering – 1.4% | |
| | 26,810 | | | Aegion Corp.* | | | 493,840 | |
| | 10,680 | | | EMCOR Group, Inc. | | | 476,648 | |
| | 19,254 | | | MasTec, Inc.* | | | 345,417 | |
| | | | | | | | |
| | | | | | | 1,315,905 | |
| | |
| | Consumer Finance – 1.2% | |
| | 19,587 | | | Cash America International, Inc. | | | 507,695 | |
| | 7,385 | | | World Acceptance Corp.*(b) | | | 624,919 | |
| | | | | | | | |
| | | | | | | 1,132,614 | |
| | |
| | Containers & Packaging – 0.8% | |
| | 58,265 | | | Graphic Packaging Holding Co. | | | 821,537 | |
| | |
| | Diversified Consumer Services – 1.1% | |
| | 2,532 | | | Capella Education Co. | | | 136,804 | |
| | 3,718 | | | K12, Inc.* | | | 60,120 | |
| | 26,273 | | | Regis Corp.* | | | 434,030 | |
| | 7,988 | | | Strayer Education, Inc.* | | | 405,151 | |
| | | | | | | | |
| | | | | | | 1,036,105 | |
| | |
| | |
| 46 | | The accompanying notes are an integral part of these financial statements. |
GOLDMAN SACHS SMALL CAP GROWTH INSIGHTS FUND
| | | | | | | | |
Shares | | | Description | | Value | |
| | Common Stocks – (continued) | |
| | Diversified Telecommunication Services* – 0.1% | |
| | 2,312 | | | General Communication, Inc. Class A | | $ | 36,668 | |
| | 6,827 | | | Vonage Holdings Corp. | | | 31,609 | |
| | | | | | | | |
| | | | | | | 68,277 | |
| | |
| | Electrical Equipment – 1.2% | |
| | 1,282 | | | AZZ, Inc. | | | 59,472 | |
| | 14,723 | | | General Cable Corp. | | | 240,132 | |
| | 74,427 | | | GrafTech International Ltd.* | | | 360,227 | |
| | 7,866 | | | Polypore International, Inc.* | | | 460,633 | |
| | | | | | | | |
| | | | | | | 1,120,464 | |
| | |
| | Electronic Equipment, Instruments & Components – 2.9% | |
| | 19,580 | | | Benchmark Electronics, Inc.* | | | 460,718 | |
| | 746 | | | Coherent, Inc.* | | | 44,760 | |
| | 11,526 | | | DTS, Inc.* | | | 413,207 | |
| | 5,229 | | | II-VI, Inc.* | | | 93,024 | |
| | 3,019 | | | Kimball Electronics, Inc.* | | | 38,613 | |
| | 764 | | | Littelfuse, Inc. | | | 74,864 | |
| | 15,028 | | | Methode Electronics, Inc. | | | 638,089 | |
| | 3,204 | | | Newport Corp.* | | | 61,100 | |
| | 7,475 | | | OSI Systems, Inc.* | | | 502,395 | |
| | 925 | | | Plexus Corp.* | | | 39,821 | |
| | 8,834 | | | Sanmina Corp.* | | | 179,595 | |
| | 25,737 | | | TTM Technologies, Inc.* | | | 240,641 | |
| | | | | | | | |
| | | | | | | 2,786,827 | |
| | |
| | Energy Equipment & Services – 1.4% | |
| | 24,430 | | | Forum Energy Technologies, Inc.* | | | 568,242 | |
| | 70,024 | | | Key Energy Services, Inc.* | | | 170,859 | |
| | 4,491 | | | Matrix Service Co.* | | | 98,667 | |
| | 31,729 | | | Pioneer Energy Services Corp.* | | | 236,381 | |
| | 20,023 | | | Tesco Corp. | | | 257,496 | |
| | | | | | | | |
| | | | | | | 1,331,645 | |
| | |
| | Food Products – 0.2% | |
| | 2,598 | | | Lancaster Colony Corp. | | | 232,937 | |
| | |
| | Health Care Equipment & Supplies – 5.4% | |
| | 6,511 | | | ABIOMED, Inc.* | | | 411,625 | |
| | 12,702 | | | Cantel Medical Corp. | | | 568,923 | |
| | 3,424 | | | Cyberonics, Inc.* | | | 208,556 | |
| | 8,019 | | | DexCom, Inc.* | | | 541,844 | |
| | 7,122 | | | Greatbatch, Inc.* | | | 384,018 | |
| | 3,805 | | | ICU Medical, Inc.* | | | 321,028 | |
| | 1,964 | | | Invacare Corp. | | | 39,417 | |
| | 16,697 | | | Masimo Corp.* | | | 563,691 | |
| | 28,655 | | | Meridian Bioscience, Inc. | | | 507,767 | |
| | 15,382 | | | Natus Medical, Inc.* | | | 580,055 | |
| | 15,618 | | | NuVasive, Inc.* | | | 698,593 | |
| | 7,307 | | | Thoratec Corp.* | | | 293,084 | |
| | 2,853 | | | Zeltiq Aesthetics, Inc.* | | | 87,587 | |
| | | | | | | | |
| | | | | | | 5,206,188 | |
| | |
| | Health Care Providers & Services – 2.1% | |
| | 5,450 | | | Genesis Healthcare, Inc.* | | | 37,660 | |
| | 6,833 | | | Magellan Health, Inc.* | | | 432,529 | |
| | 9,766 | | | Molina Healthcare, Inc.* | | | 578,440 | |
| | |
| | | | | | | | |
| | Common Stocks – (continued) | |
| | Health Care Providers & Services – (continued) | |
| | 11,884 | | | The Ensign Group, Inc. | | | 500,435 | |
| | 6,182 | | | WellCare Health Plans, Inc.* | | | 478,672 | |
| | | | | | | | |
| | | | | | | 2,027,736 | |
| | |
| | Health Care Technology(b) – 0.5% | |
| | 8,886 | | | Computer Programs and Systems, Inc. | | | 465,004 | |
| | |
| | Hotels, Restaurants & Leisure – 8.2% | |
| | 10,630 | | | BJ’s Restaurants, Inc.* | | | 497,484 | |
| | 23,203 | | | Bloomin’ Brands, Inc. | | | 525,780 | |
| | 44,006 | | | Boyd Gaming Corp.* | | | 580,879 | |
| | 2,774 | | | Buffalo Wild Wings, Inc.* | | | 441,898 | |
| | 4,832 | | | Cracker Barrel Old Country Store, Inc. | | | 640,143 | |
| | 29,963 | | | Denny’s Corp.* | | | 311,915 | |
| | 4,302 | | | DineEquity, Inc. | | | 414,842 | |
| | 9,290 | | | Jack in the Box, Inc. | | | 806,093 | |
| | 6,215 | | | Marriott Vacations Worldwide Corp. | | | 510,935 | |
| | 11,029 | | | Papa John’s International, Inc. | | | 676,850 | |
| | 3,511 | | | Pinnacle Entertainment, Inc.* | | | 129,064 | |
| | 3,662 | | | Red Robin Gourmet Burgers, Inc.* | | | 274,980 | |
| | 20,379 | | | Sonic Corp. | | | 583,858 | |
| | 18,401 | | | Texas Roadhouse, Inc. | | | 618,274 | |
| | 8,578 | | | Vail Resorts, Inc. | | | 851,024 | |
| | | | | | | | |
| | | | | | | 7,864,019 | |
| | |
| | Household Durables – 2.0% | |
| | 5,615 | | | Cavco Industries, Inc.* | | | 368,176 | |
| | 17,047 | | | Ethan Allen Interiors, Inc. | | | 412,878 | |
| | 1,998 | | | Helen of Troy Ltd.* | | | 175,045 | |
| | 15,330 | | | La-Z-Boy, Inc. | | | 401,799 | |
| | 10,226 | | | Universal Electronics, Inc.* | | | 551,590 | |
| | | | | | | | |
| | | | | | | 1,909,488 | |
| | |
| | Industrial Conglomerates – 0.1% | |
| | 4,463 | | | Raven Industries, Inc. | | | 88,992 | |
| | |
| | Insurance – 1.1% | |
| | 10,392 | | | AmTrust Financial Services, Inc.(b) | | | 618,013 | |
| | 1,679 | | | Argo Group International Holdings Ltd. | | | 82,254 | |
| | 15,920 | | | Symetra Financial Corp. | | | 378,100 | |
| | | | | | | | |
| | | | | | | 1,078,367 | |
| | |
| | Internet Software & Services – 3.3% | |
| | 1,244 | | | Cimpress NV* | | | 104,421 | |
| | 15,731 | | | Constant Contact, Inc.* | | | 548,225 | |
| | 10,478 | | | Envestnet, Inc.* | | | 537,102 | |
| | 10,567 | | | LogMeIn, Inc.* | | | 678,190 | |
| | 6,450 | | | NIC, Inc. | | | 109,650 | |
| | 2,477 | | | SPS Commerce, Inc.* | | | 161,649 | |
| | 31,180 | | | Web.com Group, Inc.* | | | 572,777 | |
| | 9,957 | | | WebMD Health Corp.* | | | 439,602 | |
| | | | | | | | |
| | | | | | | 3,151,616 | |
| | |
| | IT Services – 1.2% | |
| | 7,483 | | | CSG Systems International, Inc. | | | 217,905 | |
| | 3,631 | | | Forrester Research, Inc. | | | 126,323 | |
| | 12,978 | | | ManTech International Corp. Class A | | | 379,347 | |
| | |
| | |
| The accompanying notes are an integral part of these financial statements. | | 47 |
GOLDMAN SACHS SMALL CAP GROWTH INSIGHTS FUND
Schedule of Investments (continued)
April 30, 2015 (Unaudited)
| | | | | | | | |
Shares | | | Description | | Value | |
| | Common Stocks – (continued) | |
| | IT Services – (continued) | |
| | 8,633 | | | Sykes Enterprises, Inc.* | | $ | 216,084 | |
| | 6,730 | | | TeleTech Holdings, Inc. | | | 174,576 | |
| | | | | | | | |
| | | | | | | 1,114,235 | |
| | |
| | Leisure Equipment & Products – 0.3% | |
| | 6,636 | | | Brunswick Corp. | | | 332,065 | |
| | |
| | Life Sciences Tools & Services* – 1.1% | |
| | 5,255 | | | Cambrex Corp. | | | 202,265 | |
| | 5,151 | | | Luminex Corp. | | | 79,943 | |
| | 12,104 | | | PAREXEL International Corp. | | | 769,512 | |
| | | | | | | | |
| | | | | | | 1,051,720 | |
| | |
| | Machinery – 2.9% | |
| | 3,865 | | | Albany International Corp. Class A | | | 151,508 | |
| | 10,261 | | | Altra Industrial Motion Corp. | | | 270,583 | |
| | 11,908 | | | Barnes Group, Inc. | | | 477,511 | |
| | 19,802 | | | Blount International, Inc.* | | | 262,574 | |
| | 11,338 | | | Hillenbrand, Inc. | | | 333,224 | |
| | 2,229 | | | Hyster-Yale Materials Handling, Inc. | | | 163,475 | |
| | 4,756 | | | John Bean Technologies Corp. | | | 183,534 | |
| | 2,343 | | | Mueller Industries, Inc. | | | 82,099 | |
| | 4,021 | | | Tennant Co. | | | 258,510 | |
| | 2,754 | | | TriMas Corp.* | | | 77,580 | |
| | 41,370 | | | Wabash National Corp.* | | | 580,007 | |
| | | | | | | | |
| | | | | | | 2,840,605 | |
| | |
| | Media* – 0.1% | |
| | 5,985 | | | Entercom Communications Corp. Class A | | | 71,102 | |
| | 1,871 | | | Eros International PLC | | | 33,098 | |
| | | | | | | | |
| | | | | | | 104,200 | |
| | |
| | Metals & Mining – 0.8% | |
| | 4,441 | | | Century Aluminum Co.* | | | 57,245 | |
| | 7,322 | | | Globe Specialty Metals, Inc. | | | 145,854 | |
| | 12,406 | | | Materion Corp. | | | 496,116 | |
| | 3,229 | | | Schnitzer Steel Industries, Inc. Class A | | | 56,249 | |
| | | | | | | | |
| | | | | | | 755,464 | |
| | |
| | Oil, Gas & Consumable Fuels – 3.6% | |
| | 36,391 | | | Alon USA Energy, Inc. | | | 585,531 | |
| | 22,801 | | | Bill Barrett Corp.* | | | 264,492 | |
| | 3,885 | | | Contango Oil & Gas Co.* | | | 97,397 | |
| | 17,604 | | | Delek US Holdings, Inc. | | | 649,940 | |
| | 20,937 | | | Green Plains, Inc. | | | 651,978 | |
| | 3,496 | | | REX American Resources Corp.* | | | 221,017 | |
| | 39,395 | | | W&T Offshore, Inc.(b) | | | 253,310 | |
| | 16,326 | | | Western Refining, Inc. | | | 719,160 | |
| | | | | | | | |
| | | | | | | 3,442,825 | |
| | |
| | Paper & Forest Products – 0.3% | |
| | 2,093 | | | Neenah Paper, Inc. | | | 126,564 | |
| | 6,687 | | | PH Glatfelter Co. | | | 165,837 | |
| | | | | | | | |
| | | | | | | 292,401 | |
| | |
| | Personal Products* – 0.2% | |
| | 2,094 | | | USANA Health Sciences, Inc. | | | 238,172 | |
| | |
| | | | | | | | |
| | Common Stocks – (continued) | |
| | Pharmaceuticals – 3.4% | |
| | 12,606 | | | Catalent, Inc.* | | | 362,675 | |
| | 13,735 | | | Impax Laboratories, Inc.* | | | 621,646 | |
| | 893 | | | Lannett Co., Inc.* | | | 51,347 | |
| | 6,232 | | | Pacira Pharmaceuticals, Inc.* | | | 426,767 | |
| | 4,378 | | | Phibro Animal Health Corp. Class A | | | 139,045 | |
| | 17,081 | | | Prestige Brands Holdings, Inc.* | | | 670,429 | |
| | 20,999 | | | Sagent Pharmaceuticals, Inc.* | | | 489,487 | |
| | 12,815 | | | SciClone Pharmaceuticals, Inc.* | | | 104,699 | |
| | 22,033 | | | Sucampo Pharmaceuticals, Inc. Class A* | | | 391,306 | |
| | | | | | | | |
| | | | | | | 3,257,401 | |
| | |
| | Professional Services – 1.8% | |
| | 4,327 | | | CDI Corp. | | | 59,020 | |
| | 2,914 | | | Heidrick & Struggles International, Inc. | | | 70,111 | |
| | 12,013 | | | Insperity, Inc. | | | 578,546 | |
| | 17,917 | | | Korn/Ferry International | | | 564,923 | |
| | 24,237 | | | RPX Corp.* | | | 377,128 | |
| | 4,653 | | | TrueBlue, Inc.* | | | 133,913 | |
| | | | | | | | |
| | | | | | | 1,783,641 | |
| | |
| | Real Estate Investment Trusts – 5.8% | |
| | 11,352 | | | American Assets Trust, Inc. | | | 451,809 | |
| | 62,513 | | | Anworth Mortgage Asset Corp. | | | 317,566 | |
| | 11,758 | | | Coresite Realty Corp. | | | 565,325 | |
| | 5,246 | | | CyrusOne, Inc. | | | 170,390 | |
| | 34,552 | | | DiamondRock Hospitality Co. | | | 468,525 | |
| | 10,403 | | | DuPont Fabros Technology, Inc. | | | 324,053 | |
| | 36,585 | | | Empire State Realty Trust, Inc. Class A | | | 658,530 | |
| | 19,743 | | | First Industrial Realty Trust, Inc. | | | 389,529 | |
| | 4,179 | | | Hudson Pacific Properties, Inc. | | | 126,039 | |
| | 5,794 | | | PS Business Parks, Inc. | | | 442,372 | |
| | 3,950 | | | Sovran Self Storage, Inc. | | | 344,993 | |
| | 46,944 | | | Strategic Hotels & Resorts, Inc.* | | | 549,245 | |
| | 23,677 | | | Sunstone Hotel Investors, Inc. | | | 368,888 | |
| | 11,138 | | | The Geo Group, Inc. | | | 434,382 | |
| | | | | | | | |
| | | | | | | 5,611,646 | |
| | |
| | Real Estate Management & Development* – 0.1% | | | | |
| | 2,953 | | | Marcus & Millichap, Inc. | | | 104,477 | |
| | |
| | Road & Rail – 0.4% | | | | |
| | 11,717 | | | ArcBest Corp. | | | 418,297 | |
| | |
| | Semiconductors & Semiconductor Equipment – 5.6% | | | | |
| | 50,564 | | | Amkor Technology, Inc.* | | | 355,465 | |
| | 11,736 | | | Cabot Microelectronics Corp.* | | | 555,113 | |
| | 10,376 | | | Cavium, Inc.* | | | 672,261 | |
| | 20,179 | | | Diodes, Inc.* | | | 539,183 | |
| | 36,615 | | | Integrated Device Technology, Inc.* | | | 666,027 | |
| | 50,587 | | | Lattice Semiconductor Corp.* | | | 299,981 | |
| | 20,439 | | | Microsemi Corp.* | | | 681,845 | |
| | 6,843 | | | Monolithic Power Systems, Inc. | | | 354,673 | |
| | 17,938 | | | OmniVision Technologies, Inc.* | | | 500,380 | |
| | 2,553 | | | Qorvo, Inc.* | | | 168,268 | |
| | 12,442 | | | Silicon Laboratories, Inc.* | | | 642,878 | |
| | | | | | | | |
| | | | | | | 5,436,074 | |
| | |
| | |
| 48 | | The accompanying notes are an integral part of these financial statements. |
GOLDMAN SACHS SMALL CAP GROWTH INSIGHTS FUND
| | | | | | | | |
Shares | | | Description | | Value | |
| | Common Stocks – (continued) | |
| | Software – 6.9% | | | | |
| | 16,693 | | | Advent Software, Inc. | | $ | 724,643 | |
| | 26,479 | | | AVG Technologies NV* | | | 633,378 | |
| | 2,521 | | | Bottomline Technologies de, Inc.* | | | 67,462 | |
| | 2,735 | | | BroadSoft, Inc.* | | | 86,535 | |
| | 14,198 | | | EPIQ Systems, Inc. | | | 254,286 | |
| | 3,552 | | | Fleetmatics Group PLC* | | | 161,900 | |
| | 9,658 | | | Infoblox, Inc.* | | | 227,543 | |
| | 16,122 | | | Manhattan Associates, Inc.* | | | 847,372 | |
| | 932 | | | MicroStrategy, Inc. Class A* | | | 169,736 | |
| | 15,171 | | | Monotype Imaging Holdings, Inc. | | | 491,692 | |
| | 14,999 | | | NetScout Systems, Inc.*(b) | | | 616,459 | |
| | 26,418 | | | Pegasystems, Inc. | | | 569,044 | |
| | 18,963 | | | Progress Software Corp.* | | | 500,623 | |
| | 3,309 | | | QAD, Inc. Class A | | | 80,673 | |
| | 14,899 | | | SS&C Technologies Holdings, Inc. | | | 896,473 | |
| | 2,889 | | | Tyler Technologies, Inc.* | | | 352,314 | |
| | | | | | | | |
| | | | | | | 6,680,133 | |
| | |
| | Specialty Retail – 3.7% | | | | |
| | 13,244 | | | ANN, Inc.* | | | 501,418 | |
| | 7,927 | | | Brown Shoe Co., Inc. | | | 235,432 | |
| | 6,524 | | | Genesco, Inc.* | | | 440,957 | |
| | 1,932 | | | Group 1 Automotive, Inc. | | | 152,589 | |
| | 3,787 | | | Lithia Motors, Inc. Class A | | | 377,678 | |
| | 22,317 | | | Select Comfort Corp.* | | | 687,810 | |
| | 12,694 | | | The Cato Corp. Class A | | | 499,382 | |
| | 2,914 | | | Vitamin Shoppe, Inc.* | | | 122,038 | |
| | 16,410 | | | Zumiez, Inc.* | | | 520,361 | |
| | | | | | | | |
| | | | | | | 3,537,665 | |
| | |
| | Textiles, Apparel & Luxury Goods* – 0.3% | | | | |
| | 2,822 | | | Skechers U.S.A., Inc. Class A | | | 253,754 | |
| | |
| | Trading Companies & Distributors – 0.7% | | | | |
| | 5,433 | | | Watsco, Inc. | | | 653,536 | |
| | |
| | Wireless Telecommunication Services – 0.0% | | | | |
| | 1,961 | | | Spok Holdings, Inc. | | | 36,916 | |
| | |
| | TOTAL COMMON STOCKS | | | | |
| | (Cost $83,651,631) | | $ | 91,849,097 | |
| | |
| | | | | | | | | | | | | | |
Principal
Amount | | | Interest
Rate | | | Maturity
Date | | | Value | |
| | | | | | | | | | | | | | |
| | Short-term Investment(c) – 5.3% | |
| | Repurchase Agreement – 5.3% | |
| Joint Repurchase Agreement Account II | |
| $ | 5,100,000 | | | | 0.127 | % | | | 05/01/15 | | | | | |
| | (Cost $5,100,000) | | | | | | | $ | 5,100,000 | |
| | |
| TOTAL INVESTMENTS BEFORE SECURITIES LENDING
REINVESTMENT VEHICLE |
|
| | (Cost $88,751,631) | | | | | | | $ | 96,949,097 | |
| | |
| | | | | | |
| Shares | | Rate | | Value | |
| Securities Lending Reinvestment Vehicle(d)(e) – 4.7% | |
Goldman Sachs Financial Square Money Market Fund – FST Shares | |
| 4,509,825 | | 0.111% | | | | |
| (Cost $4,509,825) | | $ | 4,509,825 | |
| |
| TOTAL INVESTMENTS – 105.2% | |
| (Cost $93,261,456) | | $ | 101,458,922 | |
| |
| LIABILITIES IN EXCESS OF OTHER ASSETS – (5.2)% | | | (5,047,979 | ) |
| |
| NET ASSETS – 100.0% | | $ | 96,410,943 | |
| |
| | |
| The percentage shown for each investment category reflects the value of investments in that category as a percentage of net assets. |
* | | Non-income producing security. |
(a) | | All or a portion of security is segregated as collateral for initial margin requirement on futures transactions. |
(b) | | All or a portion of security is on loan. |
(c) | | Joint repurchase agreement was entered into on April 30, 2015. Additional information appears on page 57. |
(d) | | Variable rate security. Interest rate disclosed is that which is in effect on April 30, 2015. |
(e) | | Represents an Affiliated Issuer. |
|
| ADDITIONAL INVESTMENT INFORMATION |
FUTURES CONTRACTS — At April 30, 2015, the Fund had the following futures contracts:
| | | | | | | | | | | | |
| Type | | Number of
Contracts
Long (Short) | | Expiration
Date | | Current
Value | | | Unrealized
Gain (Loss) | |
Russell 2000 Mini Index | | 29 | | June 2015 | | $ | 3,527,560 | | | $ | (107,851 | ) |
| | |
| The accompanying notes are an integral part of these financial statements. | | 49 |
GOLDMAN SACHS SMALL CAP VALUE INSIGHTS FUND
Schedule of Investments
April 30, 2015 (Unaudited)
| | | | | | | | |
Shares | | | Description | | Value | |
| | Common Stocks – 97.4% | |
| | Aerospace & Defense – 1.8% | | | | |
| | 2,118 | | | Cubic Corp. | | $ | 105,010 | |
| | 15,363 | | | Curtiss-Wright Corp. | | | 1,122,421 | |
| | 8,277 | | | Ducommun, Inc.* | | | 251,621 | |
| | 1,772 | | | Esterline Technologies Corp.* | | | 197,206 | |
| | 11,555 | | | Moog, Inc. Class A* | | | 807,463 | |
| | | | | | | | |
| | | | | | | 2,483,721 | |
| | |
| | Auto Components – 1.3% | | | | |
| | 27,974 | | | Cooper Tire & Rubber Co. | | | 1,188,615 | |
| | 32,950 | | | Modine Manufacturing Co.* | | | 404,956 | |
| | 10,765 | | | Tower International, Inc.* | | | 278,383 | |
| | | | | | | | |
| | | | | | | 1,871,954 | |
| | |
| | Biotechnology* – 3.0% | | | | |
| | 8,472 | | | Acorda Therapeutics, Inc.(a) | | | 254,753 | |
| | 29,431 | | | Array BioPharma, Inc. | | | 183,944 | |
| | 11,067 | | | Dyax Corp. | | | 264,612 | |
| | 33,163 | | | Emergent Biosolutions, Inc. | | | 984,609 | |
| | 3,171 | | | Genomic Health, Inc. | | | 85,839 | |
| | 16,222 | | | Hyperion Therapeutics, Inc. | | | 745,563 | |
| | 48,412 | | | Infinity Pharmaceuticals, Inc. | | | 613,380 | |
| | 11,922 | | | Isis Pharmaceuticals, Inc. | | | 676,216 | |
| | 13,284 | | | Repligen Corp. | | | 392,011 | |
| | | | | | | | |
| | | | | | | 4,200,927 | |
| | |
| | Building Products – 0.9% | | | | |
| | 2,805 | | | American Woodmark Corp.* | | | 142,213 | |
| | 11,413 | | | Quanex Building Products Corp. | | | 220,271 | |
| | 15,490 | | | Universal Forest Products, Inc. | | | 856,907 | |
| | | | | | | | |
| | | | | | | 1,219,391 | |
| | |
| | Capital Markets – 1.6% | | | | |
| | 28,956 | | | Arlington Asset Investment Corp. Class A(b) | | | 627,766 | |
| | 3,252 | | | Evercore Partners, Inc. Class A | | | 156,877 | |
| | 5,672 | | | GAMCO Investors, Inc. Class A | | | 438,502 | |
| | 24,718 | | | Investment Technology Group, Inc.* | | | 704,216 | |
| | 7,258 | | | Manning & Napier, Inc. | | | 77,153 | |
| | 5,401 | | | Piper Jaffray Cos., Inc.* | | | 272,480 | |
| | | | | | | | |
| | | | | | | 2,276,994 | |
| | |
| | Chemicals – 2.4% | | | | |
| | 23,330 | | | A. Schulman, Inc. | | | 990,359 | |
| | 30,291 | | | FutureFuel Corp. | | | 329,263 | |
| | 13,931 | | | Innophos Holdings, Inc. | | | 736,114 | |
| | 27,570 | | | Intrepid Potash, Inc.* | | | 345,452 | |
| | 27,541 | | | OM Group, Inc. | | | 827,332 | |
| | 1,665 | | | Sensient Technologies Corp. | | | 108,824 | |
| | | | | | | | |
| | | | | | | 3,337,344 | |
| | |
| | Commercial Banks – 11.0% | | | | |
| | 11,854 | | | 1st Source Corp. | | | 368,896 | |
| | 8,523 | | | Bancfirst Corp. | | | 491,948 | |
| | 10,092 | | | Banner Corp. | | | 456,360 | |
| | 6,170 | | | Berkshire Hills Bancorp, Inc. | | | 172,822 | |
| | 3,333 | | | Cardinal Financial Corp. | | | 68,760 | |
| | 33,017 | | | Central Pacific Financial Corp. | | | 756,089 | |
| | |
| | | | | | | | |
| | Common Stocks – (continued) | |
| | Commercial Banks – (continued) | | | | |
| | 11,221 | | | City Holding Co. | | $ | 515,829 | |
| | 14,127 | | | Columbia Banking System, Inc. | | | 419,572 | |
| | 71,047 | | | CVB Financial Corp. | | | 1,111,886 | |
| | 2,424 | | | First Citizens BancShares, Inc. Class A | | | 582,584 | |
| | 5,792 | | | First Financial Bancorp | | | 99,970 | |
| | 34,108 | | | First Interstate BancSystem, Inc. | | | 922,962 | |
| | 36,675 | | | First Merchants Corp. | | | 827,755 | |
| | 25,428 | | | First Midwest Bancorp, Inc. | | | 434,819 | |
| | 2,706 | | | FirstMerit Corp. | | | 52,415 | |
| | 11,593 | | | Flushing Financial Corp. | | | 222,122 | |
| | 9,256 | | | Great Southern Bancorp, Inc. | | | 364,871 | |
| | 32,286 | | | International Bancshares Corp. | | | 838,790 | |
| | 70,914 | | | National Penn Bancshares, Inc. | | | 737,506 | |
| | 57,321 | | | OFG Bancorp | | | 807,653 | |
| | 68,630 | | | Old National Bancorp | | | 937,486 | |
| | 25,840 | | | PrivateBancorp, Inc. | | | 957,889 | |
| | 24,666 | | | Prosperity Bancshares, Inc. | | | 1,315,684 | |
| | 5,511 | | | S&T Bancorp, Inc. | | | 148,246 | |
| | 3,912 | | | TriCo Bancshares | | | 91,228 | |
| | 5,615 | | | UMB Financial Corp. | | | 279,571 | |
| | 30,702 | | | United Community Banks, Inc. | | | 571,364 | |
| | 80,781 | | | Wilshire Bancorp, Inc. | | | 852,240 | |
| | | | | | | | |
| | | | | | | 15,407,317 | |
| | |
| | Commercial Services & Supplies – 1.5% | | | | |
| | 7,453 | | | ABM Industries, Inc. | | | 238,869 | |
| | 1,144 | | | Deluxe Corp. | | | 74,074 | |
| | 4,510 | | | G&K Services, Inc. Class A | | | 318,406 | |
| | 47,710 | | | Kimball International, Inc. Class B | | | 482,825 | |
| | 2,304 | | | Multi-Color Corp. | | | 144,645 | |
| | 36,143 | | | Quad Graphics, Inc. | | | 778,520 | |
| | | | | | | | |
| | | | | | | 2,037,339 | |
| | |
| | Communications Equipment – 1.9% | | | | |
| | 34,615 | | | Aruba Networks, Inc.* | | | 851,875 | |
| | 19,659 | | | Calix, Inc.* | | | 145,280 | |
| | 4,846 | | | Comtech Telecommunications Corp. | | | 140,049 | |
| | 70,601 | | | Harmonic, Inc.* | | | 494,913 | |
| | 3,529 | | | NETGEAR, Inc.* | | | 106,823 | |
| | 70,641 | | | Polycom, Inc.* | | | 921,865 | |
| | | | | | | | |
| | | | | | | 2,660,805 | |
| | |
| | Computers & Peripherals* – 0.1% | | | | |
| | 45,568 | | | Quantum Corp. | | | 91,592 | |
| | |
| | Construction & Engineering – 1.4% | | | | |
| | 43,876 | | | Aegion Corp.* | | | 808,196 | |
| | 25,913 | | | EMCOR Group, Inc. | | | 1,156,497 | |
| | 1,694 | | | Granite Construction, Inc. | | | 58,799 | |
| | | | | | | | |
| | | | | | | 2,023,492 | |
| | |
| | Consumer Finance – 1.9% | | | | |
| | 36,903 | | | Cash America International, Inc. | | | 956,526 | |
| | 13,657 | | | Enova International, Inc.* | | | 252,791 | |
| | 68,482 | | | EZCORP, Inc. Class A* | | | 630,034 | |
| | 9,663 | | | World Acceptance Corp.*(b) | | | 817,683 | |
| | | | | | | | |
| | | | | | | 2,657,034 | |
| | |
| | |
| 50 | | The accompanying notes are an integral part of these financial statements. |
GOLDMAN SACHS SMALL CAP VALUE INSIGHTS FUND
| | | | | | | | |
Shares | | | Description | | Value | |
| | Common Stocks – (continued) | |
| | Diversified Consumer Services* – 1.3% | | | | |
| | 29,421 | | | Bridgepoint Education, Inc. | | $ | 258,022 | |
| | 37,415 | | | K12, Inc. | | | 605,001 | |
| | 52,491 | | | Regis Corp. | | | 867,151 | |
| | 2,000 | | | Steiner Leisure Ltd. | | | 96,480 | |
| | | | | | | | |
| | | | | | | 1,826,654 | |
| | |
| | Diversified Telecommunication Services* – 0.3% | | | | |
| | 8,579 | | | magicJack VocalTec Ltd.(b) | | | 55,764 | |
| | 84,481 | | | Vonage Holdings Corp. | | | 391,147 | |
| | | | | | | | |
| | | | | | | 446,911 | |
| | |
| | Electric Utilities – 1.2% | | | | |
| | 23,380 | | | Cleco Corp. | | | 1,270,703 | |
| | 11,434 | | | MGE Energy, Inc. | | | 474,282 | |
| | | | | | | | |
| | | | | | | 1,744,985 | |
| | |
| | Electrical Equipment – 0.3% | | | | |
| | 3,216 | | | General Cable Corp. | | | 52,453 | |
| | 25,915 | | | GrafTech International Ltd.* | | | 125,429 | |
| | 26,942 | | | LSI Industries, Inc. | | | 241,400 | |
| | | | | | | | |
| | | | | | | 419,282 | |
| | |
| | Electronic Equipment, Instruments & Components – 2.9% | |
| | 41,284 | | | Benchmark Electronics, Inc.* | | | 971,412 | |
| | 6,870 | | | Fabrinet* | | | 124,416 | |
| | 3,427 | | | II-VI, Inc.* | | | 60,966 | |
| | 1,879 | | | Insight Enterprises, Inc.* | | | 53,777 | |
| | 32,245 | | | Kimball Electronics, Inc.* | | | 412,414 | |
| | 16,383 | | | Methode Electronics, Inc. | | | 695,622 | |
| | 12,529 | | | OSI Systems, Inc.* | | | 842,074 | |
| | 42,772 | | | Sanmina Corp.* | | | 869,555 | |
| | | | | | | | |
| | | | | | | 4,030,236 | |
| | |
| | Energy Equipment & Services – 1.5% | | | | |
| | 39,626 | | | Forum Energy Technologies, Inc.* | | | 921,701 | |
| | 119,158 | | | ION Geophysical Corp.* | | | 271,680 | |
| | 67,741 | | | Key Energy Services, Inc.* | | | 165,288 | |
| | 63,563 | | | Pioneer Energy Services Corp.* | | | 473,544 | |
| | 20,117 | | | Tesco Corp. | | | 258,705 | |
| | | | | | | | |
| | | | | | | 2,090,918 | |
| | |
| | Food & Staples Retailing – 0.6% | | | | |
| | 11,294 | | | Ingles Markets, Inc. Class A | | | 472,767 | |
| | 6,800 | | | SpartanNash Co. | | | 205,156 | |
| | 3,502 | | | Weis Markets, Inc. | | | 155,314 | |
| | | | | | | | |
| | | | | | | 833,237 | |
| | |
| | Food Products – 0.6% | | | | |
| | 8,795 | | | Lancaster Colony Corp. | | | 788,560 | |
| | |
| | Gas Utilities – 1.9% | | | | |
| | 36,952 | | | New Jersey Resources Corp. | | | 1,127,406 | |
| | 19,111 | | | Northwest Natural Gas Co.(b) | | | 892,484 | |
| | 6,964 | | | Piedmont Natural Gas Co., Inc.(b) | | | 260,732 | |
| | 1,807 | | | Southwest Gas Corp. | | | 99,385 | |
| | 4,230 | | | WGL Holdings, Inc. | | | 232,692 | |
| | | | | | | | |
| | | | | | | 2,612,699 | |
| | |
| | | | | | | | |
| | Common Stocks – (continued) | |
| | Health Care Equipment & Supplies – 2.3% | | | | |
| | 4,833 | | | Cantel Medical Corp. | | | 216,470 | |
| | 18,145 | | | Greatbatch, Inc.* | | | 978,378 | |
| | 3,432 | | | ICU Medical, Inc.* | | | 289,558 | |
| | 20,717 | | | Natus Medical, Inc.* | | | 781,238 | |
| | 19,653 | | | NuVasive, Inc.* | | | 879,079 | |
| | 1,624 | | | Orthofix International NV* | | | 52,472 | |
| | 2,632 | | | SurModics, Inc.* | | | 66,379 | |
| | | | | | | | |
| | | | | | | 3,263,574 | |
| | |
| | Health Care Providers & Services – 1.4% | | | | |
| | 18,678 | | | Genesis Healthcare, Inc.* | | | 129,065 | |
| | 15,719 | | | Magellan Health, Inc.* | | | 995,013 | |
| | 3,314 | | | The Ensign Group, Inc. | | | 139,552 | |
| | 17,017 | | | Triple-S Management Corp. Class B* | | | 318,558 | |
| | 5,704 | | | WellCare Health Plans, Inc.* | | | 441,661 | |
| | | | | | | | |
| | | | | | | 2,023,849 | |
| | |
| | Hotels, Restaurants & Leisure – 5.5% | | | | |
| | 18,871 | | | BJ’s Restaurants, Inc.* | | | 883,163 | |
| | 4,113 | | | Bob Evans Farms, Inc. | | | 176,941 | |
| | 24,217 | | | Boyd Gaming Corp.* | | | 319,664 | |
| | 5,751 | | | Cracker Barrel Old Country Store, Inc. | | | 761,893 | |
| | 57,766 | | | Denny’s Corp.* | | | 601,344 | |
| | 7,442 | | | DineEquity, Inc. | | | 717,632 | |
| | 9,460 | | | Jack in the Box, Inc. | | | 820,844 | |
| | 15,697 | | | Marriott Vacations Worldwide Corp. | | | 1,290,450 | |
| | 12,864 | | | Papa John’s International, Inc. | | | 789,464 | |
| | 788 | | | Red Robin Gourmet Burgers, Inc.* | | | 59,171 | |
| | 30,398 | | | Sonic Corp. | | | 870,903 | |
| | 2,114 | | | Speedway Motorsports, Inc. | | | 48,411 | |
| | 3,087 | | | Vail Resorts, Inc. | | | 306,261 | |
| | | | | | | | |
| | | | | | | 7,646,141 | |
| | |
| | Household Durables – 3.0% | | | | |
| | 10,798 | | | Cavco Industries, Inc.* | | | 708,025 | |
| | 6,605 | | | CSS Industries, Inc. | | | 187,186 | |
| | 30,573 | | | Ethan Allen Interiors, Inc. | | | 740,478 | |
| | 10,488 | | | Helen of Troy Ltd.* | | | 918,854 | |
| | 7,517 | | | MDC Holdings, Inc. | | | 201,756 | |
| | 18,248 | | | The Ryland Group, Inc. | | | 752,182 | |
| | 12,335 | | | Universal Electronics, Inc.* | | | 665,350 | |
| | | | | | | | |
| | | | | | | 4,173,831 | |
| | |
| | Insurance – 4.9% | | | | |
| | 40,107 | | | American Equity Investment Life Holding Co. | | | 1,080,883 | |
| | 16,936 | | | AmTrust Financial Services, Inc.(b) | | | 1,007,184 | |
| | 20,403 | | | Argo Group International Holdings Ltd. | | | 999,543 | |
| | 14,697 | | | Employers Holdings, Inc. | | | 358,754 | |
| | 48,649 | | | Maiden Holdings Ltd. | | | 706,870 | |
| | 9,966 | | | Safety Insurance Group, Inc. | | | 579,523 | |
| | 20,034 | | | Selective Insurance Group, Inc. | | | 539,716 | |
| | 49,756 | | | Symetra Financial Corp. | | | 1,181,705 | |
| | 12,483 | | | United Fire Group, Inc. | | | 372,867 | |
| | | | | | | | |
| | | | | | | 6,827,045 | |
| | |
| | |
| The accompanying notes are an integral part of these financial statements. | | 51 |
GOLDMAN SACHS SMALL CAP VALUE INSIGHTS FUND
Schedule of Investments (continued)
April 30, 2015 (Unaudited)
| | | | | | | | |
Shares | | | Description | | Value | |
| | Common Stocks – (continued) | |
| | Internet & Catalog Retail* – 0.1% | | | | |
| | 3,822 | | | Shutterfly, Inc. | | $ | 171,073 | |
| | |
| | Internet Software & Services – 1.1% | | | | |
| | 4,141 | | | Blucora, Inc.* | | | 56,608 | |
| | 22,059 | | | Constant Contact, Inc.* | | | 768,756 | |
| | 8,679 | | | LogMeIn, Inc.* | | | 557,018 | |
| | 25,877 | | | Marchex, Inc. Class B | | | 109,977 | |
| | | | | | | | |
| | | | | | | 1,492,359 | |
| | |
| | IT Services – 0.8% | | | | |
| | 20,357 | | | ManTech International Corp. Class A | | | 595,035 | |
| | 20,907 | | | Sykes Enterprises, Inc.* | | | 523,302 | |
| | 2,037 | | | TeleTech Holdings, Inc. | | | 52,840 | |
| | | | | | | | |
| | | | | | | 1,171,177 | |
| | |
| | Leisure Equipment & Products – 0.2% | | | | |
| | 1,330 | | | Brunswick Corp. | | | 66,553 | |
| | 20,087 | | | Callaway Golf Co. | | | 194,442 | |
| | | | | | | | |
| | | | | | | 260,995 | |
| | |
| | Machinery – 1.5% | | | | |
| | 3,491 | | | Albany International Corp. Class A | | | 136,847 | |
| | 26,911 | | | Barnes Group, Inc. | | | 1,079,131 | |
| | 5,957 | | | Federal Signal Corp. | | | 93,644 | |
| | 7,378 | | | Kadant, Inc. | | | 375,983 | |
| | 13,414 | | | Miller Industries, Inc. | | | 300,205 | |
| | 3,262 | | | TriMas Corp.* | | | 91,891 | |
| | | | | | | | |
| | | | | | | 2,077,701 | |
| | |
| | Media – 0.2% | | | | |
| | 13,330 | | | Entercom Communications Corp. Class A* | | | 158,360 | |
| | 1,972 | | | Scholastic Corp. | | | 80,142 | |
| | | | | | | | |
| | | | | | | 238,502 | |
| | |
| | Metals & Mining – 1.1% | | | | |
| | 24,831 | | | Materion Corp. | | | 992,991 | |
| | 34,209 | | | Schnitzer Steel Industries, Inc. Class A | | | 595,921 | |
| | | | | | | | |
| | | | | | | 1,588,912 | |
| | |
| | Oil, Gas & Consumable Fuels – 3.7% | | | | |
| | 61,778 | | | Alon USA Energy, Inc.(a) | | | 994,008 | |
| | 12,481 | | | Bill Barrett Corp.* | | | 144,780 | |
| | 27,048 | | | Comstock Resources, Inc.(b) | | | 145,248 | |
| | 17,296 | | | Contango Oil & Gas Co.* | | | 433,611 | |
| | 28,441 | | | Delek US Holdings, Inc. | | | 1,050,042 | |
| | 17,962 | | | Dorian LPG Ltd.* | | | 238,176 | |
| | 31,398 | | | Green Plains, Inc. | | | 977,734 | |
| | 8,302 | | | REX American Resources Corp.* | | | 524,852 | |
| | 16,248 | | | Western Refining, Inc. | | | 715,724 | |
| | | | | | | | |
| | | | | | | 5,224,175 | |
| | |
| | Paper & Forest Products – 0.5% | | | | |
| | 1,113 | | | Neenah Paper, Inc. | | | 67,303 | |
| | 28,069 | | | PH Glatfelter Co. | | | 696,111 | |
| | | | | | | | |
| | | | | | | 763,414 | |
| | |
| | | | | | | | |
| | Common Stocks – (continued) | |
| | Pharmaceuticals* – 0.5% | | | | |
| | 1,682 | | | Impax Laboratories, Inc. | | | 76,127 | |
| | 27,777 | | | Sagent Pharmaceuticals, Inc. | | | 647,482 | |
| | | | | | | | |
| | | | | | | 723,609 | |
| | |
| | Professional Services – 2.2% | | | | |
| | 14,377 | | | CDI Corp. | | | 196,102 | |
| | 8,101 | | | Heidrick & Struggles International, Inc. | | | 194,910 | |
| | 13,479 | | | Insperity, Inc. | | | 649,149 | |
| | 32,770 | | | Korn/Ferry International | | | 1,033,238 | |
| | 3,854 | | | Navigant Consulting, Inc.* | | | 55,729 | |
| | 57,115 | | | RPX Corp.* | | | 888,709 | |
| | | | | | | | |
| | | | | | | 3,017,837 | |
| | |
| | Real Estate Investment Trusts – 16.4% | | | | |
| | 25,188 | | | American Assets Trust, Inc. | | | 1,002,482 | |
| | 158,457 | | | Anworth Mortgage Asset Corp. | | | 804,962 | |
| | 18,483 | | | Coresite Realty Corp. | | | 888,663 | |
| | 107,947 | | | Cousins Properties, Inc. | | | 1,051,404 | |
| | 42,889 | | | CubeSmart | | | 989,449 | |
| | 33,568 | | | CyrusOne, Inc. | | | 1,090,289 | |
| | 84,327 | | | DiamondRock Hospitality Co.(a) | | | 1,143,474 | |
| | 30,069 | | | DuPont Fabros Technology, Inc. | | | 936,649 | |
| | 38,383 | | | Empire State Realty Trust, Inc. Class A | | | 690,894 | |
| | 40,542 | | | FelCor Lodging Trust, Inc. | | | 450,422 | |
| | 59,107 | | | First Industrial Realty Trust, Inc. | | | 1,166,181 | |
| | 27,438 | | | Franklin Street Properties Corp. | | | 324,043 | |
| | 25,553 | | | Getty Realty Corp. | | | 443,856 | |
| | 4,605 | | | Hatteras Financial Corp. | | | 83,166 | |
| | 33,402 | | | Hudson Pacific Properties, Inc. | | | 1,007,404 | |
| | 65,831 | | | Invesco Mortgage Capital, Inc. | | | 1,013,797 | |
| | 75,829 | | | Investors Real Estate Trust(b) | | | 543,694 | |
| | 41,645 | | | Parkway Properties, Inc. | | | 677,564 | |
| | 43,717 | | | Pennsylvania Real Estate Investment Trust | | | 988,441 | |
| | 10,487 | | | PS Business Parks, Inc. | | | 800,682 | |
| | 18,743 | | | Ramco-Gershenson Properties Trust | | | 327,628 | |
| | 16,058 | | | RLJ Lodging Trust | | | 476,441 | |
| | 43,390 | | | Rouse Properties, Inc. | | | 758,023 | |
| | 7,993 | | | Saul Centers, Inc. | | | 402,208 | |
| | 7,837 | | | Sovran Self Storage, Inc. | | | 684,484 | |
| | 66,447 | | | Strategic Hotels & Resorts, Inc.* | | | 777,430 | |
| | 85,042 | | | Sunstone Hotel Investors, Inc. | | | 1,324,954 | |
| | 9,421 | | | Terreno Realty Corp. | | | 200,479 | |
| | 28,876 | | | The Geo Group, Inc. | | | 1,126,164 | |
| | 57,330 | | | Western Asset Mortgage Capital Corp.(b) | | | 837,591 | |
| | | | | | | | |
| | | | | | | 23,012,918 | |
| | |
| | Road & Rail – 0.4% | |
| | 16,959 | | | ArcBest Corp. | | | 605,436 | |
| | |
| | Semiconductors & Semiconductor Equipment* – 3.1% | |
| | 15,678 | | | Cabot Microelectronics Corp. | | | 741,569 | |
| | 29,315 | | | Diodes, Inc. | | | 783,297 | |
| | 43,414 | | | Integrated Device Technology, Inc. | | | 789,701 | |
| | 3,409 | | | Microsemi Corp. | | | 113,724 | |
| | 36,068 | | | OmniVision Technologies, Inc. | | | 1,006,117 | |
| | 17,273 | | | Silicon Laboratories, Inc. | | | 892,496 | |
| | | | | | | | |
| | | | | | | 4,326,904 | |
| | |
| | |
| 52 | | The accompanying notes are an integral part of these financial statements. |
GOLDMAN SACHS SMALL CAP VALUE INSIGHTS FUND
| | | | | | | | |
Shares | | | Description | | Value | |
| | Common Stocks – (continued) | |
| | Software – 2.8% | |
| | 16,653 | | | Advent Software, Inc. | | $ | 722,907 | |
| | 14,070 | | | AVG Technologies NV* | | | 336,554 | |
| | 17,867 | | | NetScout Systems, Inc.*(b) | | | 734,334 | |
| | 35,748 | | | Progress Software Corp.* | | | 943,747 | |
| | 10,255 | | | QAD, Inc. Class A | | | 250,017 | |
| | 15,223 | | | SS&C Technologies Holdings, Inc. | | | 915,968 | |
| | | | | | | | |
| | | | | | | 3,903,527 | |
| | |
| | Specialty Retail – 3.4% | |
| | 18,238 | | | American Eagle Outfitters, Inc. | | | 290,167 | |
| | 11,010 | | | Brown Shoe Co., Inc. | | | 326,997 | |
| | 4,027 | | | Genesco, Inc.* | | | 272,185 | |
| | 4,010 | | | Group 1 Automotive, Inc. | | | 316,710 | |
| | 28,394 | | | Haverty Furniture Cos., Inc. | | | 609,335 | |
| | 15,478 | | | hhgregg, Inc.*(b) | | | 88,534 | |
| | 25,942 | | | Select Comfort Corp.* | | | 799,532 | |
| | 23,142 | | | Stage Stores, Inc. | | | 446,872 | |
| | 22,634 | | | The Cato Corp. Class A | | | 890,422 | |
| | 21,131 | | | Zumiez, Inc.* | | | 670,064 | |
| | | | | | | | |
| | | | | | | 4,710,818 | |
| | |
| | Thrifts & Mortgage Finance – 1.9% | |
| | 4,159 | | | Beneficial Bancorp, Inc.* | | | 48,244 | |
| | 87,328 | | | Brookline Bancorp, Inc. | | | 940,523 | |
| | 5,582 | | | Dime Community Bancshares | | | 88,866 | |
| | 40,968 | | | Northfield Bancorp, Inc. | | | 591,168 | |
| | 56,126 | | | Oritani Financial Corp. | | | 836,277 | |
| | 2,232 | | | WSFS Financial Corp. | | | 158,852 | |
| | | | | | | | |
| | | | | | | 2,663,930 | |
| | |
| | Water Utilities – 0.8% | |
| | 5,251 | | | American States Water Co. | | | 201,586 | |
| | 37,095 | | | California Water Service Group | | | 885,458 | |
| | | | | | | | |
| | | | | | | 1,087,044 | |
| | |
| | Wireless Telecommunication Services – 0.2% | |
| | 16,569 | | | Spok Holdings, Inc. | | | 311,911 | |
| | |
| | TOTAL COMMON STOCKS | | | | |
| | (Cost $126,235,082) | | $ | 136,348,074 | |
| | |
| | | | | | | | | | | | |
Principal
Amount | | Interest
Rate | | | Maturity
Date | | | Value | |
| Short-term Investment(c) – 2.5% | |
| Repurchase Agreement – 2.5% | |
Joint Repurchase Agreement Account II | |
| $3,500,000 | | | 0.127 | % | | | 05/01/15 | | | | | |
| (Cost $3,500,000) | | | $ | 3,500,000 | |
| |
| TOTAL INVESTMENTS BEFORE SECURITIES LENDING REINVESTMENT VEHICLE | |
| (Cost $129,735,082) | | | $ | 139,848,074 | |
| |
| | | | | | |
| Shares | | Rate | | Value | |
| Securities Lending Reinvestment Vehicle(d)(e) – 3.7% | |
Goldman Sachs Financial Square Money Market Fund – FST Shares | |
| 5,159,825 | | 0.111% | | | | |
| (Cost $5,159,825) | | $ | 5,159,825 | |
| |
| TOTAL INVESTMENTS – 103.6% | |
| (Cost $134,894,907) | | $ | 145,007,899 | |
| |
LIABILITIES IN EXCESS OF OTHER ASSETS – (3.6)% | | | (4,982,799 | ) |
| |
| NET ASSETS – 100.0% | | $ | 140,025,100 | |
| |
| | |
| The percentage shown for each investment category reflects the value of investments in that category as a percentage of net assets. |
* | | Non-income producing security. |
(a) | | All or a portion of security is segregated as collateral for initial margin requirement on futures transactions. |
(b) | | All or a portion of security is on loan. |
(c) | | Joint repurchase agreement was entered into on April 30, 2015. Additional information appears on page 57. |
(d) | | Variable rate security. Interest rate or distribution rate disclosed is that which is in effect on April 30, 2015. |
(e) | | Represents an Affiliated Issuer. |
|
| ADDITIONAL INVESTMENT INFORMATION |
FUTURES CONTRACTS — At April 30, 2015, the Fund had the following futures contracts:
| | | | | | | | | | | | |
| Type | | Number of
Contracts
Long (Short) | | Expiration
Date | | Current
Value | | | Unrealized
Gain (Loss) | |
Russell 2000 Mini Index | | 15 | | June 2015 | | $ | 1,824,600 | | | $ | (31,053 | ) |
| | |
| The accompanying notes are an integral part of these financial statements. | | 53 |
GOLDMAN SACHS U.S. EQUITY INSIGHTS FUND
Schedule of Investments
April 30, 2015 (Unaudited)
| | | | | | | | |
Shares | | | Description | | Value | |
| | Common Stocks – 98.4% | |
| | Aerospace & Defense – 3.2% | |
| | 22,836 | | | General Dynamics Corp. | | $ | 3,135,839 | |
| | 36,373 | | | Northrop Grumman Corp. | | | 5,602,897 | |
| | 51,288 | | | The Boeing Co. | | | 7,351,622 | |
| | | | | | | | |
| | | | | | | 16,090,358 | |
| | |
| | Airlines – 1.6% | | | | |
| | 34,876 | | | Alaska Air Group, Inc. | | | 2,234,157 | |
| | 44,669 | | | Delta Air Lines, Inc. | | | 1,994,024 | |
| | 89,132 | | | Southwest Airlines Co. | | | 3,615,194 | |
| | | | | | | | |
| | | | | | | 7,843,375 | |
| | |
| | Auto Components – 1.0% | |
| | 100,198 | | | Johnson Controls, Inc. | | | 5,047,975 | |
| | |
| | Automobiles – 0.6% | |
| | 197,162 | | | Ford Motor Co. | | | 3,115,160 | |
| | |
| | Beverages – 1.8% | |
| | 92,747 | | | PepsiCo., Inc. | | | 8,822,095 | |
| | |
| | Biotechnology – 4.9% | |
| | 4,814 | | | Alkermes PLC* | | | 266,551 | |
| | 36,150 | | | Amgen, Inc. | | | 5,708,447 | |
| | 8,249 | | | Biogen, Inc.* | | | 3,084,549 | |
| | 66,089 | | | Celgene Corp.* | | | 7,141,577 | |
| | 78,796 | | | Gilead Sciences, Inc.* | | | 7,919,786 | |
| | 5,431 | | | Isis Pharmaceuticals, Inc.* | | | 308,046 | |
| | | | | | | | |
| | | | | | | 24,428,956 | |
| | |
| | Building Products – 0.0% | |
| | 5,119 | | | Owens Corning, Inc. | | | 197,901 | |
| | |
| | Capital Markets – 1.4% | |
| | 10,397 | | | Ameriprise Financial, Inc. | | | 1,302,536 | |
| | 183,328 | | | The Charles Schwab Corp. | | | 5,591,504 | |
| | | | | | | | |
| | | | | | | 6,894,040 | |
| | |
| | Chemicals – 0.3% | |
| | 21,608 | | | E.I. du Pont de Nemours and Co. | | | 1,581,706 | |
| | |
| | Commercial Banks – 4.6% | |
| | 319,096 | | | Bank of America Corp. | | | 5,083,199 | |
| | 182,143 | | | JPMorgan Chase & Co. | | | 11,522,366 | |
| | 36,268 | | | KeyCorp | | | 524,073 | |
| | 37,300 | | | PacWest Bancorp | | | 1,682,230 | |
| | 34,503 | | | Wells Fargo & Co. | | | 1,901,115 | |
| | 75,401 | | | Zions Bancorp | | | 2,136,488 | |
| | | | | | | | |
| | | | | | | 22,849,471 | |
| | |
| | Communications Equipment – 1.2% | |
| | 199,528 | | | Cisco Systems, Inc. | | | 5,752,392 | |
| | |
| | Computers & Peripherals – 8.5% | |
| | 195,686 | | | Apple, Inc. | | | 24,490,103 | |
| | 247,061 | | | EMC Corp. | | | 6,648,412 | |
| | 201,922 | | | Hewlett-Packard Co. | | | 6,657,368 | |
| | 67,381 | | | NetApp, Inc. | | | 2,442,561 | |
| | 18,701 | | | Western Digital Corp. | | | 1,827,836 | |
| | | | | | | | |
| | | | | | | 42,066,280 | |
| | |
| | Common Stocks – (continued) | |
| | Consumer Finance – 2.7% | |
| | 88,634 | | | American Express Co. | | | 6,864,703 | |
| | 77,796 | | | Capital One Financial Corp. | | | 6,289,807 | |
| | | | | | | | |
| | | | | | | 13,154,510 | |
| | |
| | Diversified Financial Services* – 0.4% | |
| | 15,465 | | | Berkshire Hathaway, Inc. Class B | | | 2,183,813 | |
| | |
| | Diversified Telecommunication Services – 3.2% | |
| | 144,857 | | | CenturyLink, Inc. | | | 5,209,057 | |
| | 216,495 | | | Verizon Communications, Inc. | | | 10,920,008 | |
| | | | | | | | |
| | | | | | | 16,129,065 | |
| | |
| | Electric Utilities – 0.1% | |
| | 6,281 | | | American Electric Power Co., Inc. | | | 357,200 | |
| | |
| | Electronic Equipment, Instruments & Components – 1.4% | |
| | 260,340 | | | Corning, Inc. | | | 5,448,916 | |
| | 140,943 | | | Flextronics International Ltd.* | | | 1,624,368 | |
| | | | | | | | |
| | | | | | | 7,073,284 | |
| | |
| | Energy Equipment & Services – 2.7% | |
| | 33,430 | | | Baker Hughes, Inc. | | | 2,288,618 | |
| | 108,934 | | | Cameron International Corp.* | | | 5,971,762 | |
| | 67,437 | | | FMC Technologies, Inc.* | | | 2,973,972 | |
| | 18,325 | | | Oceaneering International, Inc. | | | 1,009,891 | |
| | 3,672 | | | Oil States International, Inc.* | | | 174,750 | |
| | 8,680 | | | Schlumberger Ltd. | | | 821,215 | |
| | 7,543 | | | Superior Energy Services, Inc. | | | 192,346 | |
| | | | | | | | |
| | | | | | | 13,432,554 | |
| | |
| | Food & Staples Retailing – 4.4% | |
| | 81,153 | | | CVS Health Corp. | | | 8,057,681 | |
| | 80,713 | | | The Kroger Co. | | | 5,561,933 | |
| | 107,052 | | | Wal-Mart Stores, Inc. | | | 8,355,409 | |
| | | | | | | | |
| | | | | | | 21,975,023 | |
| | |
| | Food Products – 0.9% | |
| | 4,977 | | | Archer-Daniels-Midland Co. | | | 243,276 | |
| | 68,751 | | | Kellogg Co. | | | 4,354,001 | |
| | | | | | | | |
| | | | | | | 4,597,277 | |
| | |
| | Health Care Equipment & Supplies(a) – 0.4% | |
| | 46,978 | | | Abbott Laboratories | | | 2,180,719 | |
| | |
| | Health Care Providers & Services – 3.4% | |
| | 24,438 | | | Aetna, Inc. | | | 2,611,689 | |
| | 50,462 | | | AmerisourceBergen Corp. | | | 5,767,806 | |
| | 64,779 | | | Cardinal Health, Inc. | | | 5,463,461 | |
| | 29,522 | | | UnitedHealth Group, Inc. | | | 3,288,751 | |
| | | | | | | | |
| | | | | | | 17,131,707 | |
| | |
| | Hotels, Restaurants & Leisure – 1.1% | |
| | 120,128 | | | Carnival Corp. | | | 5,282,028 | |
| | 2,934 | | | Yum! Brands, Inc. | | | 252,207 | |
| | | | | | | | |
| | | | | | | 5,534,235 | |
| | |
| | |
| 54 | | The accompanying notes are an integral part of these financial statements. |
GOLDMAN SACHS U.S. EQUITY INSIGHTS FUND
| | | | | | | | |
Shares | | | Description | | Value | |
| | Common Stocks – (continued) | |
| | Household Durables – 1.6% | |
| | 23,907 | | | D.R. Horton, Inc. | | $ | 607,238 | |
| | 53,431 | | | Garmin Ltd. | | | 2,414,547 | |
| | 29,160 | | | Mohawk Industries, Inc.* | | | 5,059,260 | |
| | | | | | | | |
| | | | | | | 8,081,045 | |
| | |
| | Household Products – 1.2% | |
| | 52,127 | | | Colgate-Palmolive Co. | | | 3,507,105 | |
| | 12,566 | | | Kimberly-Clark Corp. | | | 1,378,364 | |
| | 13,120 | | | The Procter & Gamble Co. | | | 1,043,171 | |
| | | | | | | | |
| | | | | | | 5,928,640 | |
| | |
| | Industrial Conglomerates – 4.5% | |
| | 47,797 | | | 3M Co. | | | 7,474,973 | |
| | 77,762 | | | Danaher Corp. | | | 6,367,153 | |
| | 317,278 | | | General Electric Co. | | | 8,591,888 | |
| | | | | | | | |
| | | | | | | 22,434,014 | |
| | |
| | Insurance – 2.1% | | | | |
| | 24,884 | | | Aspen Insurance Holdings Ltd. | | | 1,162,829 | |
| | 14,043 | | | Assured Guaranty Ltd. | | | 364,977 | |
| | 38,759 | | | Reinsurance Group of America, Inc. | | | 3,551,100 | |
| | 53,437 | | | The Travelers Cos., Inc. | | | 5,403,015 | |
| | | | | | | | |
| | | | | | | 10,481,921 | |
| | |
| | Internet Software & Services* – 0.8% | |
| | 4,221 | | | Google, Inc. Class A | | | 2,316,358 | |
| | 2,710 | | | Google, Inc. Class C | | | 1,456,417 | |
| | | | | | | | |
| | | | | | | 3,772,775 | |
| | |
| | IT Services – 2.6% | |
| | 47,532 | | | Accenture PLC Class A | | | 4,403,840 | |
| | 20,988 | | | International Business Machines Corp. | | | 3,595,035 | |
| | 417,543 | | | Xerox Corp. | | | 4,801,744 | |
| | | | | | | | |
| | | | | | | 12,800,619 | |
| | |
| | Media – 4.3% | | | | |
| | 144,581 | | | Comcast Corp. Class A | | | 8,350,998 | |
| | 13,751 | | | DIRECTV* | | | 1,247,284 | |
| | 50,136 | | | The Walt Disney Co. | | | 5,450,786 | |
| | 7,328 | | | Time Warner Cable, Inc. | | | 1,139,651 | |
| | 75,184 | | | Viacom, Inc. Class B | | | 5,221,529 | |
| | | | | | | | |
| | | | | | | 21,410,248 | |
| | |
| | Metals & Mining – 0.5% | |
| | 125,429 | | | Alcoa, Inc. | | | 1,683,257 | |
| | 14,756 | | | Nucor Corp. | | | 720,978 | |
| | | | | | | | |
| | | | | | | 2,404,235 | |
| | |
| | Multiline Retail – 0.5% | |
| | 33,010 | | | Target Corp. | | | 2,602,178 | |
| | |
| | Oil, Gas & Consumable Fuels – 8.1% | |
| | 4,779 | | | Chevron Corp. | | | 530,756 | |
| | 155,170 | | | Exxon Mobil Corp. | | | 13,557,203 | |
| | 126,977 | | | HollyFrontier Corp. | | | 4,924,168 | |
| | 58,583 | | | Marathon Petroleum Corp. | | | 5,774,526 | |
| | 7,560 | | | PBF Energy, Inc. Class A | | | 214,553 | |
| | |
| | Common Stocks – (continued) | |
| | Oil, Gas & Consumable Fuels – (continued) | |
| | 78,460 | | | Phillips 66 | | | 6,222,662 | |
| | 39,455 | | | Tesoro Corp. | | | 3,386,423 | |
| | 100,033 | | | Valero Energy Corp. | | | 5,691,878 | |
| | | | | | | | |
| | | | | | | 40,302,169 | |
| | |
| | Paper & Forest Products – 0.9% | | | | |
| | 84,801 | | | International Paper Co. | | | 4,555,510 | |
| | |
| | Pharmaceuticals – 7.5% | | | | |
| | 122,031 | | | Bristol-Myers Squibb Co. | | | 7,777,036 | |
| | 126,837 | | | Johnson & Johnson | | | 12,582,230 | |
| | 129,237 | | | Merck & Co., Inc. | | | 7,697,356 | |
| | 274,307 | | | Pfizer, Inc. | | | 9,307,236 | |
| | | | | | | | |
| | | | | | | 37,363,858 | |
| | |
| | Real Estate Investment Trusts – 3.4% | |
| | 63,053 | | | American Tower Corp. | | | 5,960,400 | |
| | 38,710 | | | Crown Castle International Corp. | | | 3,233,446 | |
| | 9,350 | | | Equity Lifestyle Properties, Inc. | | | 493,867 | |
| | 29,598 | | | Equity Residential | | | 2,186,108 | |
| | 27,633 | | | Hospitality Properties Trust | | | 831,201 | |
| | 7,594 | | | Lamar Advertising Co. Class A | | | 440,148 | |
| | 22,600 | | | Outfront Media, Inc. | | | 649,072 | |
| | 3,796 | | | Post Properties, Inc. | | | 217,017 | |
| | 50,256 | | | Weingarten Realty Investors | | | 1,646,387 | |
| | 72,688 | | | WP GLIMCHER, Inc. | | | 1,090,320 | |
| | | | | | | | |
| | | | | | | 16,747,966 | |
| | |
| | Semiconductors & Semiconductor Equipment – 2.0% | |
| | 147,431 | | | Intel Corp. | | | 4,798,879 | |
| | 2,464 | | | NXP Semiconductors NV* | | | 236,840 | |
| | 92,106 | | | Texas Instruments, Inc. | | | 4,993,066 | |
| | | | | | | | |
| | | | | | | 10,028,785 | |
| | |
| | Software – 5.1% | | | | |
| | 33,092 | | | Adobe Systems, Inc.* | | | 2,516,978 | |
| | 34,587 | | | Citrix Systems, Inc.* | | | 2,322,863 | |
| | 336,236 | | | Microsoft Corp. | | | 16,354,519 | |
| | 75,625 | | | Oracle Corp. | | | 3,298,762 | |
| | 9,703 | | | salesforce.com, Inc.* | | | 706,572 | |
| | | | | | | | |
| | | | | | | 25,199,694 | |
| | |
| | Specialty Retail – 1.6% | |
| | 1,845 | | | L Brands, Inc. | | | 164,869 | |
| | 49,860 | | | The Gap, Inc. | | | 1,976,451 | |
| | 91,354 | | | The TJX Cos., Inc. | | | 5,895,987 | |
| | | | | | | | |
| | | | | | | 8,037,307 | |
| | |
| | Textiles, Apparel & Luxury Goods – 0.7% | | | | |
| | 44,446 | | | VF Corp. | | | 3,219,224 | |
| | |
| | Tobacco – 1.2% | | | | |
| | 121,321 | | | Altria Group, Inc. | | | 6,072,116 | |
| | |
| | Wireless Telecommunication Services* – 0.0% | | | | |
| | 5,352 | | | T-Mobile US, Inc. | | | 182,182 | |
| | |
| | TOTAL COMMON STOCKS | | | | |
| | (Cost $476,470,877) | | $ | 490,063,582 | |
| | |
| | |
| The accompanying notes are an integral part of these financial statements. | | 55 |
GOLDMAN SACHS U.S. EQUITY INSIGHTS FUND
Schedule of Investments (continued)
April 30, 2015 (Unaudited)
| | | | | | | | | | | | | | |
Principal
Amount | | | Interest
Rate | | | Maturity
Date | | | Value | |
| | Short-term Investment(b) – 1.7% | |
| | Repurchase Agreement – 1.7% | |
| Joint Repurchase Agreement Account II | |
| $ | 8,700,000 | | | | 0.127 | % | | | 05/01/15 | | | | | |
| | (Cost $8,700,000) | | | $ | 8,700,000 | |
| | |
| | TOTAL INVESTMENTS – 100.1% | |
| | (Cost $485,170,877) | | | $ | 498,763,582 | |
| | |
| LIABILITIES IN EXCESS OF
OTHER ASSETS – (0.1)% |
| | | (478,677 | ) |
| | |
| | NET ASSETS – 100.0% | | | $ | 498,284,905 | |
| | |
| | |
| The percentage shown for each investment category reflects the value of investments in that category as a percentage of net assets. |
* | | Non-income producing security. |
(a) | | All or a portion of security is segregated as collateral for initial margin requirements on futures transactions. |
(b) | | Joint repurchase agreement was entered into on April 30, 2015. Additional information appears on page 57. |
|
| ADDITIONAL INVESTMENT INFORMATION |
FUTURES CONTRACTS — At April 30, 2015, the Fund had the following futures contracts:
| | | | | | | | | | | | |
| Type | | Number of
Contracts
Long (Short) | | Expiration
Date | | Current
Value | | | Unrealized
Gain (Loss) | |
S&P 500 E-Mini Index | | 77 | | June 2015 | | $ | 8,003,765 | | | $ | 1,442 | |
| | |
| 56 | | The accompanying notes are an integral part of these financial statements. |
GOLDMAN SACHS DOMESTIC EQUITY INSIGHTS FUNDS
Schedule of Investments
April 30, 2015 (Unaudited)
|
| ADDITIONAL INVESTMENT INFORMATION |
JOINT REPURCHASE AGREEMENT ACCOUNT II — At April 30, 2015, the Funds had undivided interests in the Joint Repurchase Agreement Account II, with a maturity date of May 1, 2015, as follows:
| | | | | | | | | | | | |
| Fund | | Principal
Amount | | | Maturity
Value | | | Collateral
Allocation
Value | |
Large Cap Growth Insights | | $ | 25,200,000 | | | $ | 25,200,089 | | | $ | 25,704,040 | |
Large Cap Value Insights | | | 9,800,000 | | | | 9,800,035 | | | | 9,996,015 | |
Small Cap Equity Insights | | | 4,300,000 | | | | 4,300,015 | | | | 4,386,007 | |
Small Cap Growth Insights | | | 5,100,000 | | | | 5,100,018 | | | | 5,202,008 | |
Small Cap Value Insights | | | 3,500,000 | | | | 3,500,012 | | | | 3,570,006 | |
U.S. Equity Insights | | | 8,700,000 | | | | 8,700,031 | | | | 8,874,014 | |
REPURCHASE AGREEMENTS — At April 30, 2015, the Principal Amount of the Funds’ interest in the Joint Repurchase Agreement Account II was as follows:
| | | | | | | | | | | | | | | | | | | | | | | | | | | | |
| Counterparty | | Interest
Rate | | | Large Cap
Growth
Insights | | | Large Cap
Value
Insights | | | Small Cap
Equity
Insights | | | Small Cap
Growth
Insights | | | Small Cap
Value
Insights | | | U.S. Equity
Insights | |
Citigroup Global Markets, Inc. | | | 0.130 | % | | $ | 8,113,329 | | | $ | 3,155,184 | | | $ | 1,384,417 | | | $ | 1,641,983 | | | $ | 1,126,851 | | | $ | 2,801,030 | |
Merrill Lynch & Co., Inc. | | | 0.130 | | | | 9,460,142 | | | | 3,678,943 | | | | 1,614,231 | | | | 1,914,553 | | | | 1,313,909 | | | | 3,266,002 | |
BNP Paribas Securities Co. | | | 0.120 | | | | 7,626,529 | | | | 2,965,873 | | | | 1,301,352 | | | | 1,543,464 | | | | 1,059,240 | | | | 2,632,968 | |
| TOTAL | | | | | | $ | 25,200,000 | | | $ | 9,800,000 | | | $ | 4,300,000 | | | $ | 5,100,000 | | | $ | 3,500,000 | | | $ | 8,700,000 | |
At April 30, 2015, the Joint Repurchase Agreement Account II was fully collateralized by:
| | | | | | | | |
| Issuer | | Interest Rates | | | Maturity Dates | |
Federal Home Loan Bank Discount Notes | | | 0.000 | % | | | 07/29/15 | |
Federal Home Loan Mortgage Corp. | | | 3.000 to 6.000 | | | | 07/01/34 to 03/01/45 | |
Federal National Mortgage Association | | | 3.000 to 7.000 | | | | 10/01/15 to 04/01/45 | |
Government National Mortgage Association | | | 2.500 to 7.500 | | | | 05/20/42 to 10/20/44 | |
United States Treasury Inflation Protected Securities | | | 2.000 | | | | 01/15/21 | |
U.S. Treasury Notes | | | 2.250 to 2.630 | | | | 03/31/21 to 11/15/20 | |
| | |
| The accompanying notes are an integral part of these financial statements. | | 57 |
GOLDMAN SACHS DOMESTIC EQUITY INSIGHTS FUNDS
Statements of Assets and Liabilities
April 30, 2015 (Unaudited)
| | | | | | |
| | | | | Large Cap Growth
Insights Fund | |
| | Assets: | | | | |
| | Investments of unaffiliated issuers, at value (cost $688,391,043, $466,088,790, $160,164,864, $88,751,631, $129,735,082 and $485,170,877)(a) | | $ | 708,451,665 | |
| | Investments in securities lending reinvestment vehicle — affiliated issuer, at value which equals cost | | | 3,175,950 | |
| | Cash | | | 35,525 | |
| | Receivables: | | | | |
| | Investments sold | | | 35,701,611 | |
| | Fund shares sold | | | 4,694,351 | |
| | Dividends and interest | | | 439,732 | |
| | Reimbursement from investment adviser | | | 85,920 | |
| | Securities lending income | | | — | |
| | Other assets | | | 1,689 | |
| | Total assets | | | 752,586,443 | |
| | | | | | |
| | Liabilities: | | | | |
| | Variation margin on certain derivative contracts | | | 113,553 | |
| | Payables: | | | | |
| | Investments purchased | | | 36,721,923 | |
| | Payable upon return of securities loaned | | | 3,175,950 | |
| | Fund shares redeemed | | | 653,202 | |
| | Management fees | | | 294,364 | |
| | Distribution and Service fees and Transfer Agent fee | | | 113,781 | |
| | Accrued expenses and other liabilities | | | 135,621 | |
| | Total liabilities | | | 41,208,394 | |
| | | | | | |
| | Net Assets: | | | | |
| | Paid-in capital | | | 945,869,518 | |
| | Undistributed (distributions in excess of) net investment income | | | 2,459,250 | |
| | Accumulated net realized gain (loss) | | | (256,980,915 | ) |
| | Net unrealized gain (loss) | | | 20,030,196 | |
| | | NET ASSETS | | $ | 711,378,049 | |
| | | Net Assets: | | | | |
| | | Class A | | $ | 185,706,136 | |
| | | Class C | | | 35,342,707 | |
| | | Institutional | | | 462,033,578 | |
| | | Service | | | 1,546,039 | |
| | | Class IR | | | 23,654,979 | |
| | | Class R | | | 3,094,610 | |
| | | Total Net Assets | | $ | 711,378,049 | |
| | | Shares Outstanding $0.001 par value (unlimited shares authorized): | | | | |
| | | Class A | | | 8,205,140 | |
| | | Class C | | | 1,711,274 | |
| | | Institutional | | | 19,825,718 | |
| | | Service | | | 68,978 | |
| | | Class IR | | | 1,057,893 | |
| | | Class R | | | 139,074 | |
| | | Net asset value, offering and redemption price per share:(b) | | | | |
| | | Class A | | | $22.63 | |
| | | Class C | | | 20.65 | |
| | | Institutional | | | 23.30 | |
| | | Service | | | 22.41 | |
| | | Class IR | | | 22.36 | |
| | | Class R | | | 22.25 | |
| | (a) | | Includes loaned securities having a market value of $3,086,477, $2,874,084, $6,351,165, $4,327,676 and $4,984,492 for the Large Cap Growth Insights, Large Cap Value Insights, Small Cap Equity Insights, Small Cap Growth Insights and Small Cap Value Insights Funds, respectively. |
| | (b) | | Maximum public offering price per share for Class A Shares of the Large Cap Growth Insights, Large Cap Value Insights, Small Cap Equity Insights, Small Cap Growth Insights, Small Cap Value Insights and U.S. Equity Insights Funds is $23.95, $18.11, $20.61, $33.56, $41.87 and $44.00, respectively. At redemption, Class C Shares may be subject to a contingent deferred sales charge assessed on the amount equal to the lesser of the current Net Asset Value (“NAV”) or the original purchase price of the shares. |
| | |
| 58 | | The accompanying notes are an integral part of these financial statements. |
GOLDMAN SACHS DOMESTIC EQUITY INSIGHTS FUNDS
| | | | | | | | | | | | | | | | | | | | | | | | | | | | |
| | | Large Cap Value
Insights Fund | | | | | Small Cap Equity Insights Fund | | | | | Small Cap Growth
Insights Fund | | | | | Small Cap Value Insights Fund | | | | | U.S. Equity
Insights Fund | |
| | | | | | | | | | | | | | | | | | | | | | | | | | | | |
| | $ | 463,109,070 | | | | | $ | 169,556,224 | | | | | $ | 96,949,097 | | | | | $ | 139,848,074 | | | | | $ | 498,763,582 | |
| | | 2,957,400 | | | | | | 6,628,723 | | | | | | 4,509,825 | | | | | | 5,159,825 | | | | | | — | |
| | | 81,646 | | | | | | 32,341 | | | | | | 51,398 | | | | | | 53,751 | | | | | | 48,192 | |
| | | | | | | | | | | | | | | | | | | | | | | | | | | | |
| | | 24,463,275 | | | | | | 2,152,070 | | | | | | 1,465,913 | | | | | | 1,922,513 | | | | | | — | |
| | | 166,145 | | | | | | 146,269 | | | | | | 59,653 | | | | | | 319,005 | | | | | | 614,532 | |
| | | 395,114 | | | | | | 30,573 | | | | | | 17,771 | | | | | | 63,369 | | | | | | 314,750 | |
| | | 38,104 | | | | | | 36,152 | | | | | | 30,710 | | | | | | 28,553 | | | | | | 63,133 | |
| | | — | | | | | | 2,319 | | | | | | 2,531 | | | | | | 2,563 | | | | | | — | |
| | | 3,265 | | | | | | 793 | | | | | | 930 | | | | | | 593 | | | | | | 1,437 | |
| | | 491,214,019 | | | | | | 178,585,464 | | | | | | 103,087,828 | | | | | | 147,398,246 | | | | | | 499,805,626 | |
| | | | | | | | | | | | | | | | | | | | | | | | | | | | |
| | | | | | | | | | | | | | | | | | | | | | | | | | | | |
| | | 32,160 | | | | | | 52,920 | | | | | | 70,144 | | | | | | 36,300 | | | | | | 77,370 | |
| | | | | | | | | | | | | | | | | | | | | | | | | | | | |
| | | 23,401,507 | | | | | | 2,021,504 | | | | | | 1,735,326 | | | | | | 1,748,518 | | | | | | — | |
| | | 2,957,400 | | | | | | 6,628,723 | | | | | | 4,509,825 | | | | | | 5,159,825 | | | | | | — | |
| | | 938,103 | | | | | | 628,624 | | | | | | 183,960 | | | | | | 172,761 | | | | | | 654,814 | |
| | | 200,943 | | | | | | 119,259 | | | | | | 63,861 | | | | | | 96,599 | | | | | | 216,074 | |
| | | 54,697 | | | | | | 39,534 | | | | | | 25,434 | | | | | | 57,955 | | | | | | 163,715 | |
| | | 126,379 | | | | | | 137,812 | | | | | | 88,335 | | | | | | 101,188 | | | | | | 408,748 | |
| | | 27,711,189 | | | | | | 9,628,376 | | | | | | 6,676,885 | | | | | | 7,373,146 | | | | | | 1,520,721 | |
| | | | | | | | | | | | | | | | | | | | | | | | | | | | |
| | | | | | | | | | | | | | | | | | | | | | | | | | | | |
| | | 761,143,110 | | | | | | 242,158,254 | | | | | | 82,235,041 | | | | | | 124,173,853 | | | | | | 452,209,881 | |
| | | 303,767 | | | | | | 341,865 | | | | | | (283,858 | ) | | | | | 257,180 | | | | | | 1,366,337 | |
| | | (294,984,373 | ) | | | | | (82,845,567 | ) | | | | | 6,370,145 | | | | | | 5,512,128 | | | | | | 31,114,540 | |
| | | (2,959,674 | ) | | | | | 9,302,536 | | | | | | 8,089,615 | | | | | | 10,081,939 | | | | | | 13,594,147 | |
| | | $ | 463,502,830 | | | | | $ | 168,957,088 | | | | | $ | 96,410,943 | | | | | $ | 140,025,100 | | | | | $ | 498,284,905 | |
| | | | | | | | | | | | | | | | | | | | | | | | | | | | | |
| | | $ | 65,999,825 | | | | | $ | 39,421,267 | | | | | $ | 39,678,210 | | | | | $ | 100,652,614 | | | | | $ | 283,550,635 | |
| | | | 16,337,076 | | | | | | 15,200,790 | | | | | | 7,493,818 | | | | | | 18,354,337 | | | | | | 39,135,642 | |
| | | | 365,248,763 | | | | | | 103,871,864 | | | | | | 41,351,293 | | | | | | 18,267,418 | | | | | | 143,190,851 | |
| | | | 7,305,719 | | | | | | 1,126,538 | | | | | | — | | | | | | — | | | | | | 2,950,296 | |
| | | | 7,736,134 | | | | | | 486,352 | | | | | | 6,506,902 | | | | | | 1,749,109 | | | | | | 2,808,560 | |
| | | | 875,313 | | | | | | 8,850,277 | | | | | | 1,380,720 | | | | | | 1,001,622 | | | | | | 26,648,921 | |
| | | $ | 463,502,830 | | | | | $ | 168,957,088 | | | | | $ | 96,410,943 | | | | | $ | 140,025,100 | | | | | $ | 498,284,905 | |
| | | | | | | | | | | | | | | | | | | | | | | | | | | | | |
| | | | 3,856,636 | | | | | | 2,023,293 | | | | | | 1,251,222 | | | | | | 2,543,568 | | | | | | 6,819,376 | |
| | | | 962,836 | | | | | | 883,455 | | | | | | 286,392 | | | | | | 596,010 | | | | | | 1,026,423 | |
| | | | 21,356,614 | | | | | | 5,144,249 | | | | | | 1,147,738 | | | | | | 369,298 | | | | | | 3,358,228 | |
| | | | 425,222 | | | | | | 58,666 | | | | | | — | | | | | | — | | | | | | 71,070 | |
| | | | 453,326 | | | | | | 25,110 | | | | | | 202,059 | | | | | | 44,323 | | | | | | 68,179 | |
| | | | 51,373 | | | | | | 461,552 | | | | | | 44,600 | | | | | | 25,532 | | | | | | 648,744 | |
| | | | | | | | | | | | | | | | | | | | | | | | | | | | | |
| | | | $17.11 | | | | | | $19.48 | | | | | | $31.71 | | | | | | $39.57 | | | | | | $41.58 | |
| | | | 16.97 | | | | | | 17.21 | | | | | | 26.17 | | | | | | 30.80 | | | | | | 38.13 | |
| | | | 17.10 | | | | | | 20.19 | | | | | | 36.03 | | | | | | 49.47 | | | | | | 42.64 | |
| | | | 17.18 | | | | | | 19.20 | | | | | | — | | | | | | — | | | | | | 41.51 | |
| | | | 17.07 | | | | | | 19.37 | | | | | | 32.20 | | | | | | 39.46 | | | | | | 41.19 | |
| | | | 17.04 | | | | | | 19.18 | | | | | | 30.96 | | | | | | 39.23 | | | | | | 41.08 | |
| | |
| The accompanying notes are an integral part of these financial statements. | | 59 |
GOLDMAN SACHS DOMESTIC EQUITY INSIGHTS FUNDS
Statements of Operations
For the Six Months Ended April 30, 2015 (Unaudited)
| | | | | | |
| | | | | Large Cap Growth
Insights Fund | |
| | Investment income: | | | | |
| | Dividends (net of foreign withholding taxes of $410, $0, $1,821, $808, $1,615 and $0) | | $ | 4,410,342 | |
| | Interest | | | 11,564 | |
| | Securities lending income — affiliated issuer | | | 19,237 | |
| | Total investment income | | | 4,441,143 | |
| | | | | | |
| | Expenses: | | | | |
| | Management fees | | | 1,739,178 | |
| | Distribution and Service fees(a) | | | 291,304 | |
| | Transfer Agent fees(a) | | | 235,952 | |
| | Registration fees | | | 79,469 | |
| | Professional fees | | | 52,555 | |
| | Custody, accounting and administrative services | | | 50,981 | |
| | Printing and mailing costs | | | 27,544 | |
| | Trustee fees | | | 17,201 | |
| | Service Share fees — Shareholder Administration Plan | | | 1,124 | |
| | Service Share fees — Service Plan | | | 1,124 | |
| | Other | | | 13,400 | |
| | Total expenses | | | 2,509,832 | |
| | Less — expense reductions | | | (578,282 | ) |
| | Net expenses | | | 1,931,550 | |
| | NET INVESTMENT INCOME (LOSS) | | | 2,509,593 | |
| | | | | | |
| | Realized and unrealized gain (loss): | | | | |
| | Net realized gain from: | | | | |
| | Investments | | | 31,720,985 | |
| | Futures contracts | | | 511,184 | |
| | Net change in unrealized loss on: | | | | |
| | Investments | | | (6,978,605 | ) |
| | Futures contracts | | | (425,253 | ) |
| | Net realized and unrealized gain | | | 24,828,311 | |
| | NET INCREASE IN NET ASSETS RESULTING FROM OPERATIONS | | $ | 27,337,904 | |
| | (a) | | Class specific Distribution and Service and Transfer Agent fees were as follows: |
| | | | | | | | | | | | | | | | | | | | | | | | | | | | | | | | | | | | | | | | | | | | |
| | | Distribution and Service Fees | | | Transfer Agent Fees | |
Fund | | Class A | | | Class B(b) | | | Class C | | | Class R | | | Class A | | | Class B(b) | | | Class C | | | Institutional | | | Service | | | Class IR | | | Class R | |
Large Cap Growth Insights | | $ | 151,396 | | | $ | 1,021 | | | $ | 133,619 | | | $ | 5,268 | | | $ | 115,061 | | | $ | 194 | | | $ | 25,387 | | | $ | 72,466 | | | $ | 180 | | | $ | 20,662 | | | $ | 2,002 | |
Large Cap Value Insights | | | 81,224 | | | | 267 | | | | 83,819 | | | | 1,499 | | | | 61,730 | | | | 51 | | | | 15,926 | | | | 81,821 | | | | 1,345 | | | | 6,213 | | | | 569 | |
Small Cap Equity Insights | | | 51,575 | | | | 96 | | | | 76,824 | | | | 21,167 | | | | 39,197 | | | | 18 | | | | 14,597 | | | | 21,575 | | | | 280 | | | | 443 | | | | 8,043 | |
Small Cap Growth Insights | | | 45,481 | | | | 900 | | | | 36,099 | | | | 2,923 | | | | 34,565 | | | | 171 | | | | 6,859 | | | | 7,001 | | | | — | | | | 2,051 | | | | 1,111 | |
Small Cap Value Insights | | | 127,249 | | | | 3,050 | | | | 93,977 | | | | 2,589 | | | | 96,709 | | | | 579 | | | | 17,856 | | | | 3,377 | | | | — | | | | 1,590 | | | | 984 | |
U.S. Equity Insights | | | 353,809 | | | | 2,356 | | | | 191,631 | | | | 17,374 | | | | 268,895 | | | | 448 | | | | 36,410 | | | | 27,692 | | | | 325 | | | | 3,622 | | | | 6,602 | |
| | (b) | | Class B Shares were converted into Class A Shares at the close of business on November 14, 2014. |
| | |
| 60 | | The accompanying notes are an integral part of these financial statements. |
GOLDMAN SACHS DOMESTIC EQUITY INSIGHTS FUNDS
| | | | | | | | | | | | | | | | | | | | | | | | | | | | |
| | | Large Cap Value
Insights Fund | | | | | Small Cap Equity
Insights Fund | | | | | Small Cap Growth
Insights Fund | | | | | Small Cap Value
Insights Fund | | | | | U.S. Equity
Insights Fund | |
| | | | | | | | | | | | | | | | | | | | | | | | | | | | |
| | $ | 5,980,984 | | | | | $ | 1,320,631 | | | | | $ | 355,001 | | | | | $ | 1,563,475 | | | | | $ | 4,579,755 | |
| | | 6,002 | | | | | | 1,959 | | | | | | 1,523 | | | | | | 1,684 | | | | | | 6,732 | |
| | | 14,896 | | | | | | 84,425 | | | | | | 68,355 | | | | | | 61,203 | | | | | | 9,260 | |
| | | 6,001,882 | | | | | | 1,407,015 | | | | | | 424,879 | | | | | | 1,626,362 | | | | | | 4,595,747 | |
| | | | | | | | | | | | | | | | | | | | | | | | | | | | |
| | | | | | | | | | | | | | | | | | | | | | | | | | | | |
| | | 1,514,287 | | | | | | 743,108 | | | | | | 348,998 | | | | | | 598,396 | | | | | | 1,536,258 | |
| | | 166,809 | | | | | | 149,662 | | | | | | 85,403 | | | | | | 226,865 | | | | | | 565,170 | |
| | | 167,655 | | | | | | 84,153 | | | | | | 51,758 | | | | | | 121,095 | | | | | | 343,994 | |
| | | 37,375 | | | | | | 24,255 | | | | | | 33,440 | | | | | | 30,122 | | | | | | 63,382 | |
| | | 59,105 | | | | | | 38,085 | | | | | | 36,407 | | | | | | 38,895 | | | | | | 43,913 | |
| | | 56,244 | | | | | | 44,790 | | | | | | 33,572 | | | | | | 37,480 | | | | | | 45,002 | |
| | | 20,128 | | | | | | 26,913 | | | | | | 28,303 | | | | | | 34,831 | | | | | | 56,639 | |
| | | 13,057 | | | | | | 9,246 | | | | | | 7,792 | | | | | | 9,895 | | | | | | 16,717 | |
| | | 8,404 | | | | | | 1,747 | | | | | | — | | | | | | — | | | | | | 2,034 | |
| | | 8,404 | | | | | | 1,747 | | | | | | — | | | | | | — | | | | | | 2,034 | |
| | | 12,692 | | | | | | 8,989 | | | | | | 7,812 | | | | | | 5,512 | | | | | | 18,122 | |
| | | 2,064,160 | | | | | | 1,132,695 | | | | | | 633,485 | | | | | | 1,103,091 | | | | | | 2,693,265 | |
| | | (390,412 | ) | | | | | (175,008 | ) | | | | | (154,517 | ) | | | | | (182,077 | ) | | | | | (541,574 | ) |
| | | 1,673,748 | | | | | | 957,687 | | | | | | 478,968 | | | | | | 921,014 | | | | | | 2,151,691 | |
| | | 4,328,134 | | | | | | 449,328 | | | | | | (54,089 | ) | | | | | 705,348 | | | | | | 2,444,056 | |
| | | | | | | | | | | | | | | | | | | | | | | | | | | | |
| | | | | | | | | | | | | | | | | | | | | | | | | | | | |
| | | | | | | | | | | | | | | | | | | | | | | | | | | | |
| | | 35,645,125 | | | | | | 13,602,271 | | | | | | 6,637,548 | | | | | | 5,463,352 | | | | | | 34,427,684 | |
| | | 491,345 | | | | | | 253,289 | | | | | | 111,105 | | | | | | 158,665 | | | | | | 530,038 | |
| | | | | | | | | | | | | | | | | | | | | | | | | | | | |
| | | (26,981,806 | ) | | | | | (3,023,909 | ) | | | | | (977,822 | ) | | | | | (1,180,854 | ) | | | | | (19,312,935 | ) |
| | | (175,942 | ) | | | | | (322,727 | ) | | | | | (146,766 | ) | | | | | (75,955 | ) | | | | | (109,170 | ) |
| | | 8,978,722 | | | | | | 10,508,924 | | | | | | 5,624,065 | | | | | | 4,365,208 | | | | | | 15,535,617 | |
| | $ | 13,306,856 | | | | | $ | 10,958,252 | | | | | $ | 5,569,976 | | | | | $ | 5,070,556 | | | | | $ | 17,979,673 | |
| | |
| The accompanying notes are an integral part of these financial statements. | | 61 |
GOLDMAN SACHS DOMESTIC EQUITY INSIGHTS FUNDS
Statements of Changes in Net Assets
| | | | | | | | | | |
| | | | | Large Cap Growth Insights Fund | |
| | | | | For the
Six Months Ended
April 30, 2015
(Unaudited) | | | For the Fiscal
Year Ended
October 31, 2014 | |
| | From operations: | |
| | Net investment income | | $ | 2,509,593 | | | $ | 3,674,352 | |
| | Net realized gain | | | 32,232,169 | | | | 75,234,625 | |
| | Net change in unrealized gain (loss) | | | (7,403,858 | ) | | | (2,562,245 | ) |
| | Net increase in net assets resulting from operations | | | 27,337,904 | | | | 76,346,732 | |
| | | | | | | | | | |
| | Distributions to shareholders: | | | | | | | | |
| | From net investment income | | | | | | | | |
| | Class A Shares | | | (704,224 | ) | | | (576,748 | ) |
| | Class B Shares(a) | | | — | | | | (6,640 | ) |
| | Class C Shares | | | (52,165 | ) | | | (44,591 | ) |
| | Institutional Shares | | | (2,655,012 | ) | | | (3,138,318 | ) |
| | Service Shares | | | (4,970 | ) | | | — | |
| | Class IR Shares | | | (245,804 | ) | | | (8,140 | ) |
| | Class R Shares | | | (9,043 | ) | | | (3,030 | ) |
| | Total distributions to shareholders | | | (3,671,218 | ) | | | (3,777,467 | ) |
| | | | | | | | | | |
| | From share transactions: | | | | | | | | |
| | Proceeds from sales of shares | | | 371,813,744 | | | | 120,365,605 | |
| | Reinvestment of distributions | | | 3,567,272 | | | | 3,715,052 | |
| | Cost of shares redeemed | | | (94,848,361 | ) | | | (173,324,529 | ) |
| | Net increase (decrease) in net assets resulting from share transactions | | | 280,532,655 | | | | (49,243,872 | ) |
| | TOTAL INCREASE (DECREASE) | | | 304,199,341 | | | | 23,325,393 | |
| | | | | | | | | | |
| | Net assets: | | | | | | | | |
| | Beginning of period | | | 407,178,708 | | | | 383,853,315 | |
| | End of period | | $ | 711,378,049 | | | $ | 407,178,708 | |
| | Undistributed net investment income | | $ | 2,459,250 | | | $ | 3,620,875 | |
| | (a) | | Class B Shares were converted into Class A Shares at the close of business on November 14, 2014. |
| | |
| 62 | | The accompanying notes are an integral part of these financial statements. |
GOLDMAN SACHS DOMESTIC EQUITY INSIGHTS FUNDS
| | | | | | | | | | | | | | | | | | | | | | |
| | | Large Cap Value Insights Fund | | | | | Small Cap Equity Insights Fund | |
| | | For the
Six Months Ended
April 30, 2015
(Unaudited) | | | | | For the Fiscal
Year Ended
October 31, 2014 | | | | | For the
Six Months Ended
April 30, 2015
(Unaudited) | | | | | For the Fiscal
Year Ended
October 31, 2014 | |
| | | | | | | | | | | | | | | | | | | | | | |
| | $ | 4,328,134 | | | | | $ | 5,017,711 | | | | | $ | 449,328 | | | | | $ | 541,332 | |
| | | 36,136,470 | | | | | | 47,068,748 | | | | | | 13,855,560 | | | | | | 29,090,512 | |
| | | (27,157,748 | ) | | | | | 3,656,494 | | | | | | (3,346,636 | ) | | | | | (12,094,458 | ) |
| | | 13,306,856 | | | | | | 55,742,953 | | | | | | 10,958,252 | | | | | | 17,537,386 | |
| | | | | | | | | | | | | | | | | | | | | | |
| | | | | | | | | | | | | | | | | | | | | | |
| | | | | | | | | | | | | | | | | | | | | | |
| | | (470,039 | ) | | | | | (541,183 | ) | | | | | — | | | | | | (361,132 | ) |
| | | — | | | | | | (1,184 | ) | | | | | — | | | | | | — | |
| | | (57,914 | ) | | | | | (37,601 | ) | | | | | — | | | | | | (81,345 | ) |
| | | (3,574,778 | ) | | | | | (4,201,621 | ) | | | | | (426,236 | ) | | | | | (1,564,589 | ) |
| | | (43,699 | ) | | | | | (46,491 | ) | | | | | — | | | | | | (19,024 | ) |
| | | (55,695 | ) | | | | | (33,636 | ) | | | | | (629 | ) | | | | | (12,581 | ) |
| | | (5,148 | ) | | | | | (420 | ) | | | | | — | | | | | | (69,265 | ) |
| | | (4,207,273 | ) | | | | | (4,862,136 | ) | | | | | (426,865 | ) | | | | | (2,107,936 | ) |
| | | | | | | | | | | | | | | | | | | | | | |
| | | | | | | | | | | | | | | | | | | | | | |
| | | 82,924,423 | | | | | | 177,642,244 | | | | | | 24,892,024 | | | | | | 59,157,234 | |
| | | 4,108,717 | | | | | | 4,772,162 | | | | | | 412,488 | | | | | | 2,004,495 | |
| | | (113,672,526 | ) | | | | | (71,304,606 | ) | | | | | (52,260,196 | ) | | | | | (96,479,200 | ) |
| | | (26,639,386 | ) | | | | | 111,109,800 | | | | | | (26,955,684 | ) | | | | | (35,317,471 | ) |
| | | (17,539,803 | ) | | | | | 161,990,617 | | | | | | (16,424,297 | ) | | | | | (19,888,021 | ) |
| | | | | | | | | | | | | | | | | | | | | | |
| | | | | | | | | | | | | | | | | | | | | | |
| | | 481,042,633 | | | | | | 319,052,016 | | | | | | 185,381,385 | | | | | | 205,269,406 | |
| | $ | 463,502,830 | | | | | $ | 481,042,633 | | | | | $ | 168,957,088 | | | | | $ | 185,381,385 | |
| | $ | 303,767 | | | | | $ | 182,906 | | | | | $ | 341,865 | | | | | $ | 319,402 | |
| | |
| The accompanying notes are an integral part of these financial statements. | | 63 |
GOLDMAN SACHS DOMESTIC EQUITY INSIGHTS FUNDS
Statements of Changes in Net Assets (continued)
| | | | | | | | | | |
| | | | | Small Cap Growth Insights Fund | |
| | | | | For the
Six Months Ended
April 30, 2015
(Unaudited) | | | For the Fiscal
Year Ended
October 31, 2014 | |
| | From operations: | |
| | Net investment income (loss) | | $ | (54,089 | ) | | $ | (209,687 | ) |
| | Net realized gain | | | 6,748,653 | | | | 3,830,076 | |
| | Net change in unrealized gain (loss) | | | (1,124,588 | ) | | | 1,617,785 | |
| | Net increase in net assets resulting from operations | | | 5,569,976 | | | | 5,238,174 | |
| | | | | | | | | | |
| | Distributions to shareholders: | | | | | | | | |
| | From net investment income | | | | | | | | |
| | Class A Shares | | | — | | | | — | |
| | Class B Shares(a) | | | — | | | | — | |
| | Class C Shares | | | — | | | | — | |
| | Institutional Shares | | | — | | | | — | |
| | Service Shares | | | — | | | | — | |
| | Class IR Shares | | | — | | | | — | |
| | Class R Shares | | | — | | | | — | |
| | From net realized gains | | | | | | | | |
| | Class A Shares | | | (1,951,391 | ) | | | (2,475,216 | ) |
| | Class B Shares(a) | | | — | | | | (281,204 | ) |
| | Class C Shares | | | (476,371 | ) | | | (699,423 | ) |
| | Institutional Shares | | | (1,546,468 | ) | | | (1,025,674 | ) |
| | Class IR Shares | | | (73,355 | ) | | | (50,902 | ) |
| | Class R Shares | | | (64,182 | ) | | | (17,942 | ) |
| | Total distributions to shareholders | | | (4,111,767 | ) | | | (4,550,361 | ) |
| | | | | | | | | | |
| | From share transactions: | | | | | | | | |
| | Proceeds from sales of shares | | | 23,797,528 | | | | 24,230,860 | |
| | Reinvestment of distributions | | | 4,017,559 | | | | 4,428,595 | |
| | Cost of shares redeemed | | | (6,708,503 | ) | | | (11,726,599 | ) |
| | Net increase (decrease) in net assets resulting from share transactions | | | 21,106,584 | | | | 16,932,856 | |
| | TOTAL INCREASE (DECREASE) | | | 22,564,793 | | | | 17,620,669 | |
| | | | | | | | | | |
| | Net assets: | | | | | | | | |
| | Beginning of period | | | 73,846,150 | | | | 56,225,481 | |
| | End of period | | $ | 96,410,943 | | | $ | 73,846,150 | |
| | Undistributed (distributions in excess of) net investment income (loss) | | $ | (283,858 | ) | | $ | (229,769 | ) |
| | (a) | | Class B Shares were converted into Class A Shares at the close of business on November 14, 2014. |
| | |
| 64 | | The accompanying notes are an integral part of these financial statements. |
GOLDMAN SACHS DOMESTIC EQUITY INSIGHTS FUNDS
| | | | | | | | | | | | | | | | | | | | | | |
| | | Small Cap Value Insights Fund | | | | | U.S. Equity Insights Fund | |
| | | For the
Six Months Ended
April 30, 2015
(Unaudited) | | | | | For the Fiscal
Year Ended
October 31, 2014 | | | | | For the
Six Months Ended
April 30, 2015
(Unaudited) | | | | | For the Fiscal
Year Ended
October 31, 2014 | |
| | | | | | | | | | | | | | | | | | | | | | |
| | $ | 705,348 | | | | | $ | 437,831 | | | | | $ | 2,444,056 | | | | | $ | 3,497,625 | |
| | | 5,622,017 | | | | | | 16,843,268 | | | | | | 34,957,722 | | | | | | 58,872,523 | |
| | | (1,256,809 | ) | | | | | (5,626,732 | ) | | | | | (19,422,105 | ) | | | | | 1,780,224 | |
| | | 5,070,556 | | | | | | 11,654,367 | | | | | | 17,979,673 | | | | | | 64,150,372 | |
| | | | | | | | | | | | | | | | | | | | | | |
| | | | | | | | | | | | | | | | | | | | | | |
| | | | | | | | | | | | | | | | | | | | | | |
| | | (362,473 | ) | | | | | (504,552 | ) | | | | | (2,013,475 | ) | | | | | (2,673,114 | ) |
| | | — | | | | | | (7,418 | ) | | | | | — | | | | | | (19,454 | ) |
| | | — | | | | | | (7,047 | ) | | | | | (35,665 | ) | | | | | (149,928 | ) |
| | | (94,110 | ) | | | | | (87,527 | ) | | | | | (1,488,787 | ) | | | | | (918,339 | ) |
| | | — | | | | | | — | | | | | | (7,403 | ) | | | | | (9,393 | ) |
| | | (10,792 | ) | | | | | (10,225 | ) | | | | | (10,626 | ) | | | | | (7,281 | ) |
| | | (666 | ) | | | | | (3,164 | ) | | | | | (6,367 | ) | | | | | (2,635 | ) |
| | | | | | | | | | | | | | | | | | | | | | |
| | | (1,537,176 | ) | | | | | — | | | | | | — | | | | | | — | |
| | | — | | | | | | — | | | | | | — | | | | | | — | |
| | | (364,017 | ) | | | | | — | | | | | | — | | | | | | — | |
| | | (192,609 | ) | | | | | — | | | | | | — | | | | | | — | |
| | | (26,978 | ) | | | | | — | | | | | | — | | | | | | — | |
| | | (15,861 | ) | | | | | — | | | | | | — | | | | | | — | |
| | | (2,604,682 | ) | | | | | (619,933 | ) | | | | | (3,562,323 | ) | | | | | (3,780,144 | ) |
| | | | | | | | | | | | | | | | | | | | | | |
| | | | | | | | | | | | | | | | | | | | | | |
| | | 7,534,557 | | | | | | 12,712,890 | | | | | | 105,443,263 | | | | | | 65,394,739 | |
| | | 2,536,170 | | | | | | 606,920 | | | | | | 3,432,072 | | | | | | 3,612,810 | |
| | | (13,480,262 | ) | | | | | (25,718,179 | ) | | | | | (50,317,529 | ) | | | | | (68,720,892 | ) |
| | | (3,409,535 | ) | | | | | (12,398,369 | ) | | | | | 58,557,806 | | | | | | 286,657 | |
| | | (943,661 | ) | | | | | (1,363,935 | ) | | | | | 72,975,156 | | | | | | 60,656,885 | |
| | | | | | | | | | | | | | | | | | | | | | |
| | | | | | | | | | | | | | | | | | | | | | |
| | | 140,968,761 | | | | | | 142,332,696 | | | | | | 425,309,749 | | | | | | 364,652,864 | |
| | $ | 140,025,100 | | | | | $ | 140,968,761 | | | | | $ | 498,284,905 | | | | | $ | 425,309,749 | |
| | $ | 257,180 | | | | | $ | 19,873 | | | | | $ | 1,366,337 | | | | | $ | 2,484,604 | |
| | |
| The accompanying notes are an integral part of these financial statements. | | 65 |
GOLDMAN SACHS LARGE CAP GROWTH INSIGHTS FUND
Financial Highlights
Selected Data for a Share Outstanding Throughout Each Period
| | | | | | | | | | | | | | | | | | | | | | |
| | | | | | | | From
investment operations | | | | |
| | | Year - Share Class | |
Net asset
value,
beginning
of period | | | Net
investment
income (loss)(a) | | | Net realized
and unrealized
gain (loss) | | | Total from
investment
operations | | | Distributions
to shareholders
from net
investment
income | |
| | FOR THE SIX MONTHS ENDED APRIL 30, (UNAUDITED) | |
| | 2015 - A | | $ | 21.57 | | | $ | 0.07 | | | $ | 1.14 | | | $ | 1.21 | | | $ | (0.15 | ) |
| | 2015 - C | | | 19.67 | | | | (0.01 | ) | | | 1.04 | | | | 1.03 | | | | (0.05 | ) |
| | 2015 - Institutional | | | 22.22 | | | | 0.13 | | | | 1.17 | | | | 1.30 | | | | (0.22 | ) |
| | 2015 - Service | | | 21.41 | | | | 0.06 | | | | 1.14 | | | | 1.20 | | | | (0.20 | ) |
| | 2015 - IR | | | 21.36 | | | | 0.11 | | | | 1.11 | | | | 1.22 | | | | (0.22 | ) |
| | 2015 - R | | | 21.25 | | | | 0.05 | | | | 1.13 | | | | 1.18 | | | | (0.18 | ) |
| | | | | | | | | | | | | | | | | | | | | | |
| | FOR THE FISCAL YEARS ENDED OCTOBER 31, | |
| | 2014 - A | | | 18.05 | | | | 0.12 | | | | 3.54 | | | | 3.66 | | | | (0.14 | ) |
| | 2014 - C | | | 16.51 | | | | (0.02 | ) | | | 3.23 | | | | 3.21 | | | | (0.05 | ) |
| | 2014 - Institutional | | | 18.59 | | | | 0.21 | | | | 3.62 | | | | 3.83 | | | | (0.20 | ) |
| | 2014 - Service | | | 17.81 | | | | 0.18 | | | | 3.42 | | | | 3.60 | | | | — | |
| | 2014 - IR | | | 17.88 | | | | 0.14 | | | | 3.52 | | | | 3.66 | | | | (0.18 | ) |
| | 2014 - R | | | 17.85 | | | | 0.07 | | | | 3.48 | | | | 3.55 | | | | (0.15 | ) |
| | 2013 - A | | | 14.05 | | | | 0.21 | (e) | | | 3.95 | | | | 4.16 | | | | (0.16 | ) |
| | 2013 - C | | | 12.88 | | | | 0.06 | (e) | | | 3.65 | | | | 3.71 | | | | (0.08 | ) |
| | 2013 - Institutional | | | 14.48 | | | | 0.27 | (e) | | | 4.07 | | | | 4.34 | | | | (0.23 | ) |
| | 2013 - Service | | | 13.88 | | | | 0.16 | (e) | | | 3.93 | | | | 4.09 | | | | (0.16 | ) |
| | 2013 - IR | | | 13.95 | | | | 0.22 | (e) | | | 3.93 | | | | 4.15 | | | | (0.22 | ) |
| | 2013 - R | | | 13.97 | | | | 0.11 | (e) | | | 3.97 | | | | 4.08 | | | | (0.20 | ) |
| | 2012 - A | | | 12.60 | | | | 0.12 | (f) | | | 1.47 | | | | 1.59 | | | | (0.14 | ) |
| | 2012 - C | | | 11.57 | | | | 0.01 | (f) | | | 1.35 | | | | 1.36 | | | | (0.05 | ) |
| | 2012 - Institutional | | | 12.98 | | | | 0.17 | (f) | | | 1.52 | | | | 1.69 | | | | (0.19 | ) |
| | 2012 - Service | | | 12.47 | | | | 0.10 | (f) | | | 1.47 | | | | 1.57 | | | | (0.16 | ) |
| | 2012 - IR | | | 12.53 | | | | 0.13 | (f) | | | 1.48 | | | | 1.61 | | | | (0.19 | ) |
| | 2012 - R | | | 12.46 | | | | 0.06 | (f) | | | 1.50 | | | | 1.56 | | | | (0.05 | ) |
| | 2011 - A | | | 11.54 | | | | 0.10 | (g) | | | 1.09 | | | | 1.19 | | | | (0.13 | ) |
| | 2011 - C | | | 10.62 | | | | 0.01 | (g) | | | 1.01 | | | | 1.02 | | | | (0.07 | ) |
| | 2011 - Institutional | | | 11.88 | | | | 0.16 | (g) | | | 1.12 | | | | 1.28 | | | | (0.18 | ) |
| | 2011 - Service | | | 11.43 | | | | 0.06 | (g) | | | 1.10 | | | | 1.16 | | | | (0.12 | ) |
| | 2011 - IR | | | 11.48 | | | | 0.13 | (g) | | | 1.08 | | | | 1.21 | | | | (0.16 | ) |
| | 2011 - R | | | 11.42 | | | | 0.08 | (g) | | | 1.06 | | | | 1.14 | | | | (0.10 | ) |
| | 2010 - A | | | 10.04 | | | | 0.09 | | | | 1.52 | | | | 1.61 | | | | (0.11 | ) |
| | 2010 - C | | | 9.26 | | | | — | (h) | | | 1.41 | | | | 1.41 | | | | (0.05 | ) |
| | 2010 - Institutional | | | 10.33 | | | | 0.13 | | | | 1.58 | | | | 1.71 | | | | (0.16 | ) |
| | 2010 - Service | | | 9.95 | | | | 0.08 | | | | 1.51 | | | | 1.59 | | | | (0.11 | ) |
| | 2010 - IR | | | 9.99 | | | | 0.11 | | | | 1.52 | | | | 1.63 | | | | (0.14 | ) |
| | 2010 - R | | | 9.99 | | | | 0.05 | | | | 1.52 | | | | 1.57 | | | | (0.14 | ) |
| | (a) | | Calculated based on the average shares outstanding methodology. |
| | (b) | | Assumes investment at the net asset value at the beginning of the period, reinvestment of all dividends and distributions, a complete redemption of the investment at the net asset value at the end of the period and no sales or redemption charges. Total returns would be reduced if a sales or redemption charge was taken into account. Returns do not reflect the deduction of taxes that a shareholder would pay on Fund distributions or the redemption of Fund shares. Total returns for periods less than one full year are not annualized. |
| | (c) | | The Fund’s portfolio turnover rate is calculated in accordance with regulatory requirements, without regard to transactions involving short term investments and certain derivatives. If such transactions were included, the Fund’s portfolio turnover rate may be higher. |
| | (e) | | Reflects income recognized from special dividends which amounted to $0.05 per share and 0.31% of average net assets. |
| | (f) | | Reflects income recognized from special dividends which amounted to $0.03 per share and 0.22% of average net assets. |
| | (g) | | Reflects income recognized from special dividends which amounted to $0.02 per share and 0.16% of average net assets. |
| | (h) | | Amount is less than $0.005 per share. |
| | |
| 66 | | The accompanying notes are an integral part of these financial statements. |
GOLDMAN SACHS LARGE CAP GROWTH INSIGHTS FUND
| | | | | | | | | | | | | | | | | | | | | | | | | | | | | | | | | | | | | | | | |
| | | | | | | | | | | | | | | | | | | | | | | | | | | | | | | | | | |
| | | Net asset
value, end
of period | | | | | Total
return(b) | | | | | Net assets,
end of
period
(in 000s) | | | | | Ratio of
net expenses
to average
net assets | | | | | Ratio of
total expenses
to average
net assets | | | | | Ratio of
net investment
income (loss)
to average
net assets | | | | | Portfolio
turnover
rate(c) | |
| | | | | | | | | | | | | | | | | | | | | | | | | | | | | | | | | | | | | | | | |
| | $ | 22.63 | | | | | | 5.63 | % | | | | $ | 185,706 | | | | | | 0.96 | %(d) | | | | | 1.18 | %(d) | | | | | 0.67 | %(d) | | | | | 104 | % |
| | | 20.65 | | | | | | 5.24 | | | | | | 35,343 | | | | | | 1.71 | (d) | | | | | 1.93 | (d) | | | | | (0.05 | )(d) | | | | | 104 | |
| | | 23.30 | | | | | | 5.86 | | | | | | 462,034 | | | | | | 0.56 | (d) | | | | | 0.78 | (d) | | | | | 1.10 | (d) | | | | | 104 | |
| | | 22.41 | | | | | | 5.62 | | | | | | 1,546 | | | | | | 1.06 | (d) | | | | | 1.28 | (d) | | | | | 0.56 | (d) | | | | | 104 | |
| | | 22.36 | | | | | | 5.75 | | | | | | 23,655 | | | | | | 0.71 | (d) | | | | | 0.93 | (d) | | | | | 0.97 | (d) | | | | | 104 | |
| | | 22.25 | | | | | | 5.54 | | | | | | 3,095 | | | | | | 1.21 | (d) | | | | | 1.43 | (d) | | | | | 0.46 | (d) | | | | | 104 | |
| | | | | | | | | | | | | | | | | | | | | | | | | | | | | | | | | | | | | | | | |
| | | | | | | | | | | | | | | | | | | | | | | | | | | | | | | | | | | | | | | | |
| | | 21.57 | | | | | | 20.41 | | | | | | 94,053 | | | | | | 0.96 | | | | | | 1.20 | | | | | | 0.63 | | | | | | 234 | |
| | | 19.67 | | | | | | 19.51 | | | | | | 19,448 | | | | | | 1.71 | | | | | | 1.95 | | | | | | (0.12 | ) | | | | | 234 | |
| | | 22.22 | | | | | | 20.88 | | | | | | 269,611 | | | | | | 0.56 | | | | | | 0.80 | | | | | | 1.05 | | | | | | 234 | |
| | | 21.41 | | | | | | 20.21 | | | | | | 408 | | | | | | 1.06 | | | | | | 1.30 | | | | | | 0.96 | | | | | | 234 | |
| | | 21.36 | | | | | | 20.69 | | | | | | 20,793 | | | | | | 0.71 | | | | | | 0.97 | | | | | | 0.68 | | | | | | 234 | |
| | | 21.25 | | | | | | 20.10 | | | | | | 535 | | | | | | 1.21 | | | | | | 1.45 | | | | | | 0.37 | | | | | | 234 | |
| | | 18.05 | | | | | | 29.90 | | | | | | 74,524 | | | | | | 0.95 | | | | | | 1.20 | | | | | | 1.34 | (e) | | | | | 232 | |
| | | 16.51 | | | | | | 28.96 | | | | | | 14,133 | | | | | | 1.70 | | | | | | 1.95 | | | | | | 0.42 | (e) | | | | | 232 | |
| | | 18.59 | | | | | | 30.40 | | | | | | 289,326 | | | | | | 0.55 | | | | | | 0.80 | | | | | | 1.65 | (e) | | | | | 232 | |
| | | 17.81 | | | | | | 29.77 | | | | | | 1,155 | | | | | | 1.05 | | | | | | 1.30 | | | | | | 1.05 | (e) | | | | | 232 | |
| | | 17.88 | | | | | | 30.26 | | | | | | 784 | | | | | | 0.70 | | | | | | 0.95 | | | | | | 1.40 | (e) | | | | | 232 | |
| | | 17.85 | | | | | | 29.53 | | | | | | 359 | | | | | | 1.20 | | | | | | 1.46 | | | | | | 0.70 | (e) | | | | | 232 | |
| | | 14.05 | | | | | | 12.69 | | | | | | 118,956 | | | | | | 0.95 | | | | | | 1.16 | | | | | | 0.83 | (f) | | | | | 146 | |
| | | 12.88 | | | | | | 11.81 | | | | | | 12,555 | | | | | | 1.70 | | | | | | 1.91 | | | | | | 0.08 | (f) | | | | | 146 | |
| | | 14.48 | | | | | | 13.18 | | | | | | 311,286 | | | | | | 0.55 | | | | | | 0.76 | | | | | | 1.23 | (f) | | | | | 146 | |
| | | 13.88 | | | | | | 12.67 | | | | | | 963 | | | | | | 1.05 | | | | | | 1.26 | | | | | | 0.73 | (f) | | | | | 146 | |
| | | 13.95 | | | | | | 12.96 | | | | | | 667 | | | | | | 0.70 | | | | | | 0.90 | | | | | | 0.95 | (f) | | | | | 146 | |
| | | 13.97 | | | | | | 12.50 | | | | | | 127 | | | | | | 1.20 | | | | | | 1.39 | | | | | | 0.39 | (f) | | | | | 146 | |
| | | 12.60 | | | | | | 10.38 | | | | | | 150,750 | | | | | | 0.95 | | | | | | 1.16 | | | | | | 0.84 | (g) | | | | | 76 | |
| | | 11.57 | | | | | | 9.63 | | | | | | 12,999 | | | | | | 1.70 | | | | | | 1.91 | | | | | | 0.10 | (g) | | | | | 76 | |
| | | 12.98 | | | | | | 10.83 | | | | | | 392,373 | | | | | | 0.55 | | | | | | 0.76 | | | | | | 1.22 | (g) | | | | | 76 | |
| | | 12.47 | | | | | | 10.23 | | | | | | 1,004 | | | | | | 1.05 | | | | | | 1.26 | | | | | | 0.49 | (g) | | | | | 76 | |
| | | 12.53 | | | | | | 10.66 | | | | | | 45 | | | | | | 0.70 | | | | | | 0.91 | | | | | | 1.07 | (g) | | | | | 76 | |
| | | 12.46 | | | | | | 10.06 | | | | | | 26 | | | | | | 1.20 | | | | | | 1.41 | | | | | | 0.63 | (g) | | | | | 76 | |
| | | 11.54 | | | | | | 16.17 | | | | | | 145,079 | | | | | | 0.95 | | | | | | 1.16 | | | | | | 0.79 | | | | | | 64 | |
| | | 10.62 | | | | | | 15.30 | | | | | | 13,528 | | | | | | 1.70 | | | | | | 1.91 | | | | | | 0.03 | | | | | | 64 | |
| | | 11.88 | | | | | | 16.68 | | | | | | 362,907 | | | | | | 0.55 | | | | | | 0.76 | | | | | | 1.21 | | | | | | 64 | |
| | | 11.43 | | | | | | 16.07 | | | | | | 93 | | | | | | 1.05 | | | | | | 1.26 | | | | | | 0.71 | | | | | | 64 | |
| | | 11.48 | | | | | | 16.50 | | | | | | 8 | | | | | | 0.70 | | | | | | 0.91 | | | | | | 1.02 | | | | | | 64 | |
| | | 11.42 | | | | | | 15.81 | | | | | | 59 | | | | | | 1.20 | | | | | | 1.41 | | | | | | 0.47 | | | | | | 64 | |
| | |
| The accompanying notes are an integral part of these financial statements. | | 67 |
GOLDMAN SACHS LARGE CAP VALUE INSIGHTS FUND
Financial Highlights
Selected Data for a Share Outstanding Throughout Each Period
| | | | | | | | | | | | | | | | | | | | | | |
| | | | | | | | From
investment operations | | | | |
| | | Year - Share Class | | Net asset
value,
beginning
of period | | | Net
investment
income(a) | | | Net realized
and unrealized
gain (loss) | | | Total from
investment
operations | | | Distributions
to shareholders
from net
investment
income | |
| | FOR THE SIX MONTHS ENDED APRIL 30, (UNAUDITED) | |
| | 2015 - A | | $ | 16.86 | | | $ | 0.12 | | | $ | 0.25 | | | $ | 0.37 | | | $ | (0.12 | ) |
| | 2015 - C | | | 16.71 | | | | 0.06 | | | | 0.26 | | | | 0.32 | | | | (0.06 | ) |
| | 2015 - Institutional | | | 16.85 | | | | 0.16 | | | | 0.25 | | | | 0.41 | | | | (0.16 | ) |
| | 2015 - Service | | | 16.92 | | | | 0.11 | | | | 0.26 | | | | 0.37 | | | | (0.11 | ) |
| | 2015 - IR | | | 16.81 | | | | 0.14 | | | | 0.26 | | | | 0.40 | | | | (0.14 | ) |
| | 2015 - R | | | 16.81 | | | | 0.08 | | | | 0.27 | | | | 0.35 | | | | (0.12 | ) |
| | | | | | | | | | | | | | | | | | | | | | |
| | FOR THE FISCAL YEARS ENDED OCTOBER 31, | |
| | 2014 - A | | | 14.75 | | | | 0.16 | | | | 2.10 | | | | 2.26 | | | | (0.15 | ) |
| | 2014 - C | | | 14.63 | | | | 0.04 | | | | 2.08 | | | | 2.12 | | | | (0.04 | ) |
| | 2014 - Institutional | | | 14.74 | | | | 0.22 | | | | 2.11 | | | | 2.33 | | | | (0.22 | ) |
| | 2014 - Service | | | 14.81 | | | | 0.14 | | | | 2.11 | | | | 2.25 | | | | (0.14 | ) |
| | 2014 - IR | | | 14.72 | | | | 0.21 | | | | 2.08 | | | | 2.29 | | | | (0.20 | ) |
| | 2014 - R | | | 14.71 | | | | 0.08 | | | | 2.13 | | | | 2.21 | | | | (0.11 | ) |
| | 2013 - A | | | 11.49 | | | | 0.25 | (e) | | | 3.22 | | | | 3.47 | | | | (0.21 | ) |
| | 2013 - C | | | 11.40 | | | | 0.12 | (e) | | | 3.23 | | | | 3.35 | | | | (0.12 | ) |
| | 2013 - Institutional | | | 11.48 | | | | 0.28 | (e) | | | 3.25 | | | | 3.53 | | | | (0.27 | ) |
| | 2013 - Service | | | 11.54 | | | | 0.21 | (e) | | | 3.26 | | | | 3.47 | | | | (0.20 | ) |
| | 2013 - IR | | | 11.47 | | | | 0.23 | (e) | | | 3.27 | | | | 3.50 | | | | (0.25 | ) |
| | 2013 - R | | | 11.46 | | | | 0.16 | (e) | | | 3.28 | | | | 3.44 | | | | (0.19 | ) |
| | 2012 - A | | | 10.19 | | | | 0.17 | | | | 1.29 | (f) | | | 1.46 | | | | (0.16 | ) |
| | 2012 - C | | | 10.11 | | | | 0.09 | | | | 1.29 | (f) | | | 1.38 | | | | (0.09 | ) |
| | 2012 - Institutional | | | 10.18 | | | | 0.21 | | | | 1.30 | (f) | | | 1.51 | | | | (0.21 | ) |
| | 2012 - Service | | | 10.23 | | | | 0.17 | | | | 1.29 | (f) | | | 1.46 | | | | (0.15 | ) |
| | 2012 - IR | | | 10.17 | | | | 0.19 | | | | 1.30 | (f) | | | 1.49 | | | | (0.19 | ) |
| | 2012 - R | | | 10.17 | | | | 0.13 | | | | 1.30 | (f) | | | 1.43 | | | | (0.14 | ) |
| | 2011 - A | | | 9.47 | | | | 0.13 | | | | 0.74 | | | | 0.87 | | | | (0.15 | ) |
| | 2011 - C | | | 9.40 | | | | 0.06 | | | | 0.72 | | | | 0.78 | | | | (0.07 | ) |
| | 2011 - Institutional | | | 9.46 | | | | 0.17 | | | | 0.74 | | | | 0.91 | | | | (0.19 | ) |
| | 2011 - Service | | | 9.51 | | | | 0.12 | | | | 0.74 | | | | 0.86 | | | | (0.14 | ) |
| | 2011 - IR | | | 9.45 | | | | 0.15 | | | | 0.74 | | | | 0.89 | | | | (0.17 | ) |
| | 2011 - R | | | 9.45 | | | | 0.12 | | | | 0.72 | | | | 0.84 | | | | (0.12 | ) |
| | 2010 - A | | | 8.42 | | | | 0.13 | | | | 1.05 | | | | 1.18 | | | | (0.13 | ) |
| | 2010 - C | | | 8.36 | | | | 0.06 | | | | 1.04 | | | | 1.10 | | | | (0.06 | ) |
| | 2010 - Institutional | | | 8.41 | | | | 0.17 | | | | 1.05 | | | | 1.22 | | | | (0.17 | ) |
| | 2010 - Service | | | 8.45 | | | | 0.12 | | | | 1.06 | | | | 1.18 | | | | (0.12 | ) |
| | 2010 - IR | | | 8.41 | | | | 0.15 | | | | 1.04 | | | | 1.19 | | | | (0.15 | ) |
| | 2010 - R | | | 8.41 | | | | 0.11 | | | | 1.04 | | | | 1.15 | | | | (0.11 | ) |
| | (a) | | Calculated based on the average shares outstanding methodology. |
| | (b) | | Assumes investment at the net asset value at the beginning of the period, reinvestment of all dividends and distributions, a complete redemption of the investment at the net asset value at the end of the period and no sales or redemption charges. Total returns would be reduced if a sales or redemption charge was taken into account. Returns do not reflect the deduction of taxes that a shareholder would pay on Fund distributions or the redemption of Fund shares. Total returns for periods less than one full year are not annualized. |
| | (c) | | The Fund’s portfolio turnover rate is calculated in accordance with regulatory requirements, without regard to transactions involving short term investments and certain derivatives. If such transactions were included, the Fund’s portfolio turnover rate may be higher. |
| | (e) | | Reflects income recognized from a special dividend which amounted to $0.04 per share and 0.32% of average net assets. |
| | (f) | | Reflects payment from affiliate relating to certain investment transactions which amounted to $0.01 per share. Excluding such payment, the total return would have been 14.34%, 13.51%, 13.55%, 14.81%, 14.28%, 14.67% and 13.98%, respectively. |
| | |
| 68 | | The accompanying notes are an integral part of these financial statements. |
GOLDMAN SACHS LARGE CAP VALUE INSIGHTS FUND
| | | | | | | | | | | | | | | | | | | | | | | | | | | | | | | | | | | | | | | | |
| | | | | | | | | | | | | | | | | | | | | | | | | | | | | | | | | | |
| | | Net asset
value, end
of period | | | | | Total
return(b) | | | | | Net assets,
end of
period
(in 000s) | | | | | Ratio of
net expenses
to average
net assets | | | | | Ratio of
total expenses
to average
net assets | | | | | Ratio of
net investment
income
to average
net assets | | | | | Portfolio
turnover
rate(c) | |
| | | | | | | | | | | | | | | | | | | | | | | | | | | | | | | | | | | | | | | | |
| | $ | 17.11 | | | | | | 2.20 | % | | | | $ | 66,000 | | | | | | 0.96 | %(d) | | | | | 1.12 | %(d) | | | | | 1.40 | %(d) | | | | | 112 | % |
| | | 16.97 | | | | | | 1.90 | | | | | | 16,337 | | | | | | 1.71 | (d) | | | | | 1.87 | (d) | | | | | 0.65 | (d) | | | | | 112 | |
| | | 17.10 | | | | | | 2.40 | | | | | | 365,249 | | | | | | 0.56 | (d) | | | | | 0.72 | (d) | | | | | 1.82 | (d) | | | | | 112 | |
| | | 17.18 | | | | | | 2.20 | | | | | | 7,306 | | | | | | 1.06 | (d) | | | | | 1.22 | (d) | | | | | 1.30 | (d) | | | | | 112 | |
| | | 17.07 | | | | | | 2.40 | | | | | | 7,736 | | | | | | 0.71 | (d) | | | | | 0.87 | (d) | | | | | 1.59 | (d) | | | | | 112 | |
| | | 17.04 | | | | | | 2.10 | | | | | | 875 | | | | | | 1.21 | (d) | | | | | 1.37 | (d) | | | | | 0.99 | (d) | | | | | 112 | |
| | | | | | | | | | | | | | | | | | | | | | | | | | | | | | | | | | | | | | | | |
| | | | | | | | | | | | | | | | | | | | | | | | | | | | | | | | | | | | | | | | |
| | | 16.86 | | | | | | 15.42 | | | | | | 62,704 | | | | | | 0.96 | | | | | | 1.14 | | | | | | 1.00 | | | | | | 222 | |
| | | 16.71 | | | | | | 14.50 | | | | | | 16,567 | | | | | | 1.71 | | | | | | 1.89 | | | | | | 0.25 | | | | | | 222 | |
| | | 16.85 | | | | | | 15.89 | | | | | | 389,534 | | | | | | 0.56 | | | | | | 0.74 | | | | | | 1.39 | | | | | | 222 | |
| | | 16.92 | | | | | | 15.24 | | | | | | 6,062 | | | | | | 1.06 | | | | | | 1.24 | | | | | | 0.91 | | | | | | 222 | |
| | | 16.81 | | | | | | 15.62 | | | | | | 5,238 | | | | | | 0.71 | | | | | | 0.88 | | | | | | 1.27 | | | | | | 222 | |
| | | 16.81 | | | | | | 15.13 | | | | | | 332 | | | | | | 1.21 | | | | | | 1.39 | | | | | | 0.49 | | | | | | 222 | |
| | | 14.75 | | | | | | 30.54 | | | | | | 52,993 | | | | | | 0.95 | | | | | | 1.14 | | | | | | 1.95 | (e) | | | | | 221 | |
| | | 14.63 | | | | | | 29.61 | | | | | | 13,723 | | | | | | 1.70 | | | | | | 1.90 | | | | | | 0.91 | (e) | | | | | 221 | |
| | | 14.74 | | | | | | 31.13 | | | | | | 245,662 | | | | | | 0.55 | | | | | | 0.75 | | | | | | 2.21 | (e) | | | | | 221 | |
| | | 14.81 | | | | | | 30.40 | | | | | | 5,061 | | | | | | 1.05 | | | | | | 1.25 | | | | | | 1.64 | (e) | | | | | 221 | |
| | | 14.72 | | | | | | 30.88 | | | | | | 293 | | | | | | 0.71 | | | | | | 0.91 | | | | | | 1.72 | (e) | | | | | 221 | |
| | | 14.71 | | | | | | 30.25 | | | | | | 79 | | | | | | 1.20 | | | | | | 1.40 | | | | | | 1.23 | (e) | | | | | 221 | |
| | | 11.49 | | | | | | 14.44 | (f) | | | | | 107,535 | | | | | | 0.95 | | | | | | 1.11 | | | | | | 1.53 | | | | | | 135 | |
| | | 11.40 | | | | | | 13.65 | (f) | | | | | 11,018 | | | | | | 1.70 | | | | | | 1.86 | | | | | | 0.77 | | | | | | 135 | |
| | | 11.48 | | | | | | 14.91 | (f) | | | | | 337,650 | | | | | | 0.55 | | | | | | 0.71 | | | | | | 1.91 | | | | | | 135 | |
| | | 11.54 | | | | | | 14.38 | (f) | | | | | 5,117 | | | | | | 1.05 | | | | | | 1.21 | | | | | | 1.48 | | | | | | 135 | |
| | | 11.47 | | | | | | 14.77 | (f) | | | | | 128 | | | | | | 0.70 | | | | | | 0.86 | | | | | | 1.74 | | | | | | 135 | |
| | | 11.46 | | | | | | 14.08 | (f) | | | | | 33 | | | | | | 1.20 | | | | | | 1.36 | | | | | | 1.18 | | | | | | 135 | |
| | | 10.19 | | | | | | 9.15 | | | | | | 133,611 | | | | | | 0.95 | | | | | | 1.13 | | | | | | 1.31 | | | | | | 56 | |
| | | 10.11 | | | | | | 8.30 | | | | | | 11,928 | | | | | | 1.70 | | | | | | 1.88 | | | | | | 0.55 | | | | | | 56 | |
| | | 10.18 | | | | | | 9.61 | | | | | | 365,385 | | | | | | 0.55 | | | | | | 0.73 | | | | | | 1.69 | | | | | | 56 | |
| | | 10.23 | | | | | | 9.02 | | | | | | 7,699 | | | | | | 1.05 | | | | | | 1.23 | | | | | | 1.19 | | | | | | 56 | |
| | | 10.17 | | | | | | 9.48 | | | | | | 67 | | | | | | 0.70 | | | | | | 0.88 | | | | | | 1.48 | | | | | | 56 | |
| | | 10.17 | | | | | | 8.96 | | | | | | 10 | | | | | | 1.20 | | | | | | 1.38 | | | | | | 1.13 | | | | | | 56 | |
| | | 9.47 | | | | | | 14.09 | | | | | | 140,737 | | | | | | 0.94 | | | | | | 1.10 | | | | | | 1.45 | | | | | | 41 | |
| | | 9.40 | | | | | | 13.22 | | | | | | 11,940 | | | | | | 1.69 | | | | | | 1.85 | | | | | | 0.68 | | | | | | 41 | |
| | | 9.46 | | | | | | 14.59 | | | | | | 362,324 | | | | | | 0.54 | | | | | | 0.70 | | | | | | 1.86 | | | | | | 41 | |
| | | 9.51 | | | | | | 14.05 | | | | | | 6,601 | | | | | | 1.04 | | | | | | 1.20 | | | | | | 1.33 | | | | | | 41 | |
| | | 9.45 | | | | | | 14.31 | | | | | | 16 | | | | | | 0.69 | | | | | | 0.85 | | | | | | 1.64 | | | | | | 41 | |
| | | 9.45 | | | | | | 13.74 | | | | | | 47 | | | | | | 1.19 | | | | | | 1.35 | | | | | | 1.15 | | | | | | 41 | |
| | |
| The accompanying notes are an integral part of these financial statements. | | 69 |
GOLDMAN SACHS SMALL CAP EQUITY INSIGHTS FUND
Financial Highlights
Selected Data for a Share Outstanding Throughout Each Period
| | | | | | | | | | | | | | | | | | | | | | |
| | | | | | | | Income (loss) from
investment operations | | | | |
| | | Year - Share Class | | Net asset
value,
beginning
of period | | | Net
investment
income (loss)(a) | | | Net realized
and unrealized
gain (loss) | | | Total from
investment
operations | | | Distributions
to shareholders
from net
investment
income | |
| FOR THE SIX MONTHS ENDED APRIL 30, (UNAUDITED) | | | | | |
| | 2015 - A | | $ | 18.25 | | | $ | 0.03 | (d) | | $ | 1.20 | | | $ | 1.23 | | | $ | — | |
| | 2015 - C | | | 16.18 | | | | (0.04 | )(d) | | | 1.07 | | | | 1.03 | | | | — | |
| | 2015 - Institutional | | | 18.94 | | | | 0.07 | (d) | | | 1.25 | | | | 1.32 | | | | (0.07 | ) |
| | 2015 - Service | | | 18.00 | | | | 0.03 | (d) | | | 1.17 | | | | 1.20 | | | | — | |
| | 2015 - IR | | | 18.14 | | | | 0.05 | (d) | | | 1.20 | | | | 1.25 | | | | (0.02 | ) |
| | 2015 - R | | | 17.98 | | | | 0.01 | (d) | | | 1.19 | | | | 1.20 | | | | — | |
| | | | | | | | | | | | | | | | | | | | | | |
| | FOR THE FISCAL YEARS ENDED OCTOBER 31, | | | | | | | | | | | | | | | | | | | | |
| | 2014 - A | | | 16.86 | | | | 0.01 | | | | 1.52 | | | | 1.53 | | | | (0.14 | ) |
| | 2014 - C | | | 15.01 | | | | (0.11 | ) | | | 1.36 | | | | 1.25 | | | | (0.08 | ) |
| | 2014 - Institutional | | | 17.48 | | | | 0.09 | | | | 1.57 | | | | 1.66 | | | | (0.20 | ) |
| | 2014 - Service | | | 16.64 | | | | (0.01 | ) | | | 1.50 | | | | 1.49 | | | | (0.13 | ) |
| | 2014 - IR | | | 16.70 | | | | 0.08 | | | | 1.48 | | | | 1.56 | | | | (0.12 | ) |
| | 2014 - R | | | 16.67 | | | | (0.03 | ) | | | 1.49 | | | | 1.46 | | | | (0.15 | ) |
| | 2013 - A | | | 12.93 | | | | 0.20 | (f) | | | 3.75 | | | | 3.95 | | | | (0.02 | ) |
| | 2013 - C | | | 11.57 | | | | 0.06 | (f) | | | 3.38 | | | | 3.44 | | | | — | |
| | 2013 - Institutional | | | 13.42 | | | | 0.25 | (f) | | | 3.91 | | | | 4.16 | | | | (0.10 | ) |
| | 2013 - Service | | | 12.78 | | | | 0.17 | (f) | | | 3.72 | | | | 3.89 | | | | (0.03 | ) |
| | 2013 - IR | | | 12.83 | | | | 0.23 | (f) | | | 3.72 | | | | 3.95 | | | | (0.08 | ) |
| | 2013 - R | | | 12.81 | | | | 0.03 | (f) | | | 3.86 | | | | 3.89 | | | | (0.03 | ) |
| | 2012 - A | | | 12.06 | | | | 0.01 | (g) | | | 0.96 | (h) | | | 0.97 | | | | (0.10 | ) |
| | 2012 - C | | | 10.81 | | | | (0.07 | )(g) | | | 0.86 | (h) | | | 0.79 | | | | (0.03 | ) |
| | 2012 - Institutional | | | 12.53 | | | | 0.07 | (g) | | | 0.98 | (h) | | | 1.05 | | | | (0.16 | ) |
| | 2012 - Service | | | 11.94 | | | | 0.01 | (g) | | | 0.94 | (h) | | | 0.95 | | | | (0.11 | ) |
| | 2012 - IR | | | 12.00 | | | | 0.05 | (g) | | | 0.94 | (h) | | | 0.99 | | | | (0.16 | ) |
| | 2012 - R | | | 11.97 | | | | (0.01 | )(g) | | | 0.94 | (h) | | | 0.93 | | | | (0.09 | ) |
| | 2011 - A | | | 10.92 | | | | 0.06 | (i) | | | 1.15 | | | | 1.21 | | | | (0.07 | ) |
| | 2011 - C | | | 9.82 | | | | (0.04 | )(i) | | | 1.04 | | | | 1.00 | | | | (0.01 | ) |
| | 2011 - Institutional | | | 11.34 | | | | 0.11 | (i) | | | 1.19 | | | | 1.30 | | | | (0.11 | ) |
| | 2011 - Service | | | 10.82 | | | | 0.04 | (i) | | | 1.13 | | | | 1.17 | | | | (0.05 | ) |
| | 2011 - IR | | | 10.87 | | | | 0.08 | (i) | | | 1.15 | | | | 1.23 | | | | (0.10 | ) |
| | 2011 - R | | | 10.86 | | | | 0.02 | (i) | | | 1.15 | | | | 1.17 | | | | (0.06 | ) |
| | 2010 - A | | | 8.45 | | | | 0.04 | (j) | | | 2.50 | | | | 2.54 | | | | (0.07 | ) |
| | 2010 - C | | | 7.62 | | | | (0.03 | )(j) | | | 2.26 | | | | 2.23 | | | | (0.03 | ) |
| | 2010 - Institutional | | | 8.78 | | | | 0.09 | (j) | | | 2.57 | | | | 2.66 | | | | (0.10 | ) |
| | 2010 - Service | | | 8.37 | | | | 0.03 | (j) | | | 2.48 | | | | 2.51 | | | | (0.06 | ) |
| | 2010 - IR | | | 8.42 | | | | 0.06 | (j) | | | 2.49 | | | | 2.55 | | | | (0.10 | ) |
| | 2010 - R | | | 8.41 | | | | (0.01 | )(j) | | | 2.51 | | | | 2.50 | | | | (0.05 | ) |
| | (a) | | Calculated based on the average shares outstanding methodology. |
| | (b) | | Assumes investment at the net asset value at the beginning of the period, reinvestment of all dividends and distributions, a complete redemption of the investment at the net asset value at the end of the period and no sales or redemption charges. Total returns would be reduced if a sales or redemption charge was taken into account. Returns do not reflect the deduction of taxes that a shareholder would pay on Fund distributions or the redemption of Fund shares. Total returns for periods less than one full year are not annualized. |
| | (c) | | The Fund’s portfolio turnover rate is calculated in accordance with regulatory requirements, without regard to transactions involving short term investments and certain derivatives. If such transactions were included, the Fund’s portfolio turnover rate may be higher. |
| | (d) | | Reflects income recognized from special dividends which amounted to $0.02 per share and 0.22% of average net assets. |
| | (f) | | Reflects income recognized from special dividends which amounted to $0.13 per share and 0.85% of average net assets. |
| | (g) | | Reflects income recognized from special dividends which amounted to $0.02 per share and 0.17% of average net assets. |
| | (h) | | Reflects payment from affiliate relating to certain investment transactions which amounted to $0.04 per share. Excluding such payment, the total return would have been 7.71%, 6.95%, 6.89%, 8.17%, 7.63%, 8.02%, and 7.44%, respectively. |
| | (i) | | Reflects income recognized from special dividends which amounted to $0.07 per share and 0.55% of average net assets. |
| | (j) | | Reflects income recognized from special dividends which amounted to $0.06 per share and 0.56% of average net assets. |
| | |
| 70 | | The accompanying notes are an integral part of these financial statements. |
GOLDMAN SACHS SMALL CAP EQUITY INSIGHTS FUND
| | | | | | | | | | | | | | | | | | | | | | | | | | | | | | | | | | | | | | | | |
| | | | | | | | | | | | | | | | | | | | | | | | | | | | | | | | | | |
| | | Net asset
value, end
of period | | | | | Total
return(b) | | | | | Net assets,
end of
period
(in 000s) | | | | | Ratio of
net expenses
to average
net assets | | | | | Ratio of
total expenses
to average
net assets | | | | | Ratio of
net investment
income (loss)
to average
net assets | | | | | Portfolio
turnover
rate(c) | |
| | | | | | | | | | | | | | | | | | | | | | | | | | | | | | | | | | | | | | | | |
| | $ | 19.48 | | | | | | 6.74 | % | | | | $ | 39,421 | | | | | | 1.26 | %(e) | | | | | 1.46 | %(e) | | | | | 0.33 | %(d)(e) | | | | | 56 | % |
| | | 17.21 | | | | | | 6.37 | | | | | | 15,201 | | | | | | 2.01 | (e) | | | | | 2.21 | (e) | | | | | (0.42 | )(d)(e) | | | | | 56 | |
| | | 20.19 | | | | | | 6.98 | | | | | | 103,872 | | | | | | 0.86 | (e) | | | | | 1.07 | (e) | | | | | 0.75 | (d)(e) | | | | | 56 | |
| | | 19.20 | | | | | | 6.67 | | | | | | 1,127 | | | | | | 1.36 | (e) | | | | | 1.57 | (e) | | | | | 0.36 | (d)(e) | | | | | 56 | |
| | | 19.37 | | | | | | 6.93 | | | | | | 486 | | | | | | 1.01 | (e) | | | | | 1.21 | (e) | | | | | 0.58 | (d)(e) | | | | | 56 | |
| | | 19.18 | | | | | | 6.67 | | | | | | 8,850 | | | | | | 1.51 | (e) | | | | | 1.71 | (e) | | | | | 0.07 | (d)(e) | | | | | 56 | |
| | | | | | | | | | | | | | | | | | | | | | | | | | | | | | | | | | | | | | | | |
| | | | | | | | | | | | | | | | | | | | | | | | | | | | | | | | | | | | | | | | |
| | | 18.25 | | | | | | 9.16 | | | | | | 40,458 | | | | | | 1.27 | | | | | | 1.51 | | | | | | 0.07 | | | | | | 130 | |
| | | 16.18 | | | | | | 8.33 | | | | | | 15,348 | | | | | | 2.02 | | | | | | 2.26 | | | | | | (0.68 | ) | | | | | 130 | |
| | | 18.94 | | | | | | 9.58 | | | | | | 119,013 | | | | | | 0.87 | | | | | | 1.11 | | | | | | 0.47 | | | | | | 130 | |
| | | 18.00 | | | | | | 9.02 | | | | | | 1,769 | | | | | | 1.37 | | | | | | 1.60 | | | | | | (0.04 | ) | | | | | 130 | |
| | | 18.14 | | | | | | 9.39 | | | | | | 448 | | | | | | 1.02 | | | | | | 1.24 | | | | | | 0.47 | | | | | | 130 | |
| | | 17.98 | | | | | | 8.83 | | | | | | 8,126 | | | | | | 1.52 | | | | | | 1.76 | | | | | | (0.18 | ) | | | | | 130 | |
| | | 16.86 | | | | | | 30.64 | | | | | | 42,607 | | | | | | 1.26 | | | | | | 1.46 | | | | | | 1.39 | (f) | | | | | 151 | |
| | | 15.01 | | | | | | 29.73 | | | | | | 16,202 | | | | | | 2.01 | | | | | | 2.21 | | | | | | 0.45 | (f) | | | | | 151 | |
| | | 17.48 | | | | | | 31.18 | | | | | | 134,276 | | | | | | 0.86 | | | | | | 1.06 | | | | | | 1.61 | (f) | | | | | 151 | |
| | | 16.64 | | | | | | 30.55 | | | | | | 2,514 | | | | | | 1.36 | | | | | | 1.56 | | | | | | 1.13 | (f) | | | | | 151 | |
| | | 16.70 | | | | | | 30.94 | | | | | | 1,767 | | | | | | 1.01 | | | | | | 1.21 | | | | | | 1.62 | (f) | | | | | 151 | |
| | | 16.67 | | | | | | 30.39 | | | | | | 7,450 | | | | | | 1.51 | | | | | | 1.73 | | | | | | 0.18 | (f) | | | | | 151 | |
| | | 12.93 | | | | | | 8.04 | (h) | | | | | 49,863 | | | | | | 1.25 | | | | | | 1.46 | | | | | | 0.15 | (g) | | | | | 125 | |
| | | 11.57 | | | | | | 7.26 | (h) | | | | | 12,487 | | | | | | 2.00 | | | | | | 2.21 | | | | | | (0.57 | )(g) | | | | | 125 | |
| | | 13.42 | | | | | | 8.49 | (h) | | | | | 123,556 | | | | | | 0.85 | | | | | | 1.06 | | | | | | 0.55 | (g) | | | | | 125 | |
| | | 12.78 | | | | | | 7.97 | (h) | | | | | 2,133 | | | | | | 1.35 | | | | | | 1.56 | | | | | | 0.10 | (g) | | | | | 125 | |
| | | 12.83 | | | | | | 8.36 | (h) | | | | | 5,389 | | | | | | 1.00 | | | | | | 1.21 | | | | | | 0.43 | (g) | | | | | 125 | |
| | | 12.81 | | | | | | 7.78 | (h) | | | | | 357 | | | | | | 1.50 | | | | | | 1.71 | | | | | | (0.05 | )(g) | | | | | 125 | |
| | | 12.06 | | | | | | 11.05 | | | | | | 65,299 | | | | | | 1.25 | | | | | | 1.42 | | | | | | 0.45 | (i) | | | | | 34 | |
| | | 10.81 | | | | | | 10.14 | | | | | | 13,338 | | | | | | 2.00 | | | | | | 2.17 | | | | | | (0.32 | )(i) | | | | | 34 | |
| | | 12.53 | | | | | | 11.49 | | | | | | 86,058 | | | | | | 0.85 | | | | | | 1.02 | | | | | | 0.87 | (i) | | | | | 34 | |
| | | 11.94 | | | | | | 10.84 | | | | | | 1,548 | | | | | | 1.35 | | | | | | 1.52 | | | | | | 0.32 | (i) | | | | | 34 | |
| | | 12.00 | | | | | | 11.32 | | | | | | 4,959 | | | | | | 1.00 | | | | | | 1.17 | | | | | | 0.70 | (i) | | | | | 34 | |
| | | 11.97 | | | | | | 10.78 | | | | | | 207 | | | | | | 1.50 | | | | | | 1.67 | | | | | | 0.14 | (i) | | | | | 34 | |
| | | 10.92 | | | | | | 30.23 | | | | | | 104,435 | | | | | | 1.25 | | | | | | 1.39 | | | | | | 0.43 | (j) | | | | | 70 | |
| | | 9.82 | | | | | | 29.29 | | | | | | 13,788 | | | | | | 2.00 | | | | | | 2.14 | | | | | | (0.37 | )(j) | | | | | 70 | |
| | | 11.34 | | | | | | 30.76 | | | | | | 240,597 | | | | | | 0.85 | | | | | | 0.99 | | | | | | 0.88 | (j) | | | | | 70 | |
| | | 10.82 | | | | | | 30.16 | | | | | | 1,431 | | | | | | 1.35 | | | | | | 1.49 | | | | | | 0.33 | (j) | | | | | 70 | |
| | | 10.87 | | | | | | 30.55 | | | | | | 35 | | | | | | 1.00 | | | | | | 1.14 | | | | | | 0.63 | (j) | | | | | 70 | |
| | | 10.86 | | | | | | 29.90 | | | | | | 184 | | | | | | 1.50 | | | | | | 1.64 | | | | | | (0.11 | )(j) | | | | | 70 | |
| | |
| The accompanying notes are an integral part of these financial statements. | | 71 |
GOLDMAN SACHS SMALL CAP GROWTH INSIGHTS FUND
Financial Highlights
Selected Data for a Share Outstanding Throughout Each Period
| | | | | | | | | | | | | | | | | | | | | | | | | | | | | | |
| | | | | | | | From
investment operations | | | Distributions
to shareholders | |
| | | Year - Share Class | | Net asset
value,
beginning
of period | | | Net
investment
income (loss)(a) | | | Net realized
and unrealized
gain (loss) | | | Total from
investment
operations | | | From net
investment
income | | | From net
realized
gains | | | Total
distributions | |
| | FOR THE SIX MONTHS ENDED APRIL 30, (UNAUDITED) | |
| | 2015 - A | | $ | 31.17 | | | $ | (0.04 | )(d) | | $ | 2.37 | | | $ | 2.33 | | | $ | — | | | $ | (1.79 | ) | | $ | (1.79 | ) |
| | 2015 - C | | | 26.12 | | | | (0.13 | )(d) | | | 1.97 | | | | 1.84 | | | | — | | | | (1.79 | ) | | | (1.79 | ) |
| | 2015 - Institutional | | | 35.10 | | | | 0.03 | (d) | | | 2.69 | | | | 2.72 | | | | — | | | | (1.79 | ) | | | (1.79 | ) |
| | 2015 - IR | | | 31.59 | | | | (0.02 | )(d) | | | 2.42 | | | | 2.40 | | | | — | | | | (1.79 | ) | | | (1.79 | ) |
| | 2015 - R | | | 30.51 | | | | (0.08 | )(d) | | | 2.32 | | | | 2.24 | | | | — | | | | (1.79 | ) | | | (1.79 | ) |
| | | | | | | | | | | | | | | | | | | | | | | | | | | | | | |
| | FOR THE FISCAL YEARS ENDED OCTOBER 31, | |
| | 2014 - A | | | 31.10 | | | | (0.10 | ) | | | 2.67 | | | | 2.57 | | | | — | | | | (2.50 | ) | | | (2.50 | ) |
| | 2014 - C | | | 26.64 | | | | (0.27 | ) | | | 2.25 | | | | 1.98 | | | | — | | | | (2.50 | ) | | | (2.50 | ) |
| | 2014 - Institutional | | | 34.59 | | | | 0.01 | | | | 3.00 | | | | 3.01 | | | | — | | | | (2.50 | ) | | | (2.50 | ) |
| | 2014 - IR | | | 31.41 | | | | (0.04 | ) | | | 2.72 | | | | 2.68 | | | | — | | | | (2.50 | ) | | | (2.50 | ) |
| | 2014 - R | | | 30.56 | | | | (0.19 | ) | | | 2.64 | | | | 2.45 | | | | — | | | | (2.50 | ) | | | (2.50 | ) |
| | 2013 - A | | | 23.40 | | | | 0.18 | (f) | | | 7.70 | | | | 7.88 | | | | (0.18 | ) | | | — | | | | (0.18 | ) |
| | 2013 - C | | | 20.09 | | | | (0.03 | )(f) | | | 6.63 | | | | 6.60 | | | | (0.05 | ) | | | — | | | | (0.05 | ) |
| | 2013 - Institutional | | | 26.01 | | | | 0.29 | (f) | | | 8.57 | | | | 8.86 | | | | (0.28 | ) | | | — | | | | (0.28 | ) |
| | 2013 - IR | | | 23.64 | | | | 0.18 | (f) | | | 7.83 | | | | 8.01 | | | | (0.24 | ) | | | — | | | | (0.24 | ) |
| | 2013 - R | | | 23.08 | | | | — | (f)(g) | | | 7.68 | | | | 7.68 | | | | (0.20 | ) | | | — | | | | (0.20 | ) |
| | 2012 - A | | | 21.22 | | | | 0.04 | (h) | | | 2.14 | (i) | | | 2.18 | | | | — | | | | — | | | | — | |
| | 2012 - C | | | 18.35 | | | | (0.11 | )(h) | | | 1.85 | (i) | | | 1.74 | | | | — | | | | — | | | | — | |
| | 2012 - Institutional | | | 23.49 | | | | 0.15 | (h) | | | 2.37 | (i) | | | 2.52 | | | | — | | | | — | | | | — | |
| | 2012 - IR | | | 21.39 | | | | 0.03 | (h) | | | 2.22 | (i) | | | 2.25 | | | | — | | | | — | | | | — | |
| | 2012 - R | | | 20.98 | | | | (0.01 | )(h) | | | 2.11 | (i) | | | 2.10 | | | | — | | | | — | | | | — | |
| | 2011 - A | | | 18.49 | | | | (0.05 | )(j) | | | 2.78 | | | | 2.73 | | | | — | | | | — | | | | — | |
| | 2011 - C | | | 16.11 | | | | (0.18 | )(j) | | | 2.42 | | | | 2.24 | | | | — | | | | — | | | | — | |
| | 2011 - Institutional | | | 20.38 | | | | 0.03 | (j) | | | 3.08 | | | | 3.11 | | | | — | | | | — | | | | — | |
| | 2011 - IR | | | 18.58 | | | | (0.08 | )(j) | | | 2.89 | | | | 2.81 | | | | — | | | | — | | | | — | |
| | 2011 - R | | | 18.33 | | | | (0.11 | )(j) | | | 2.76 | | | | 2.65 | | | | — | | | | — | | | | — | |
| | 2010 - A | | | 14.23 | | | | 0.01 | (k) | | | 4.30 | | | | 4.31 | | | | (0.05 | ) | | | — | | | | (0.05 | ) |
| | 2010 - C | | | 12.45 | | | | (0.10 | )(k) | | | 3.76 | | | | 3.66 | | | | — | | | | — | | | | — | |
| | 2010 - Institutional | | | 15.67 | | | | 0.07 | (k) | | | 4.74 | | | | 4.81 | | | | (0.10 | ) | | | — | | | | (0.10 | ) |
| | 2010 - IR | | | 14.30 | | | | 0.04 | (k) | | | 4.33 | | | | 4.37 | | | | (0.09 | ) | | | — | | | | (0.09 | ) |
| | 2010 - R | | | 14.15 | | | | (0.03 | )(k) | | | 4.27 | | | | 4.24 | | | | (0.06 | ) | | | — | | | | (0.06 | ) |
| | (a) | | Calculated based on the average shares outstanding methodology. |
| | (b) | | Assumes investment at the net asset value at the beginning of the period, reinvestment of all dividends and distributions, a complete redemption of the investment at the net asset value at the end of the period and no sales or redemption charges. Total returns would be reduced if a sales or redemption charge was taken into account. Returns do not reflect the deduction of taxes that a shareholder would pay on Fund distributions or the redemption of Fund shares. Total returns for periods less than one full year are not annualized. |
| | (c) | | The Fund’s portfolio turnover rate is calculated in accordance with regulatory requirements, without regard to transactions involving short term investments and certain derivatives. If such transactions were included, the Fund’s portfolio turnover rate may be higher. |
| | (d) | | Reflects income recognized from special dividends which amounted to $0.02 per share and 0.14% of average net assets. |
| | (f) | | Reflects income recognized from special dividends which amounted to $0.17 per share and 0.65% of average net assets. |
| | (g) | | Amount is less than $0.005 per share. |
| | (h) | | Reflects income recognized from special dividends which amounted to $0.11 per share and 0.51% of average net assets. |
| | (i) | | Reflects payment from affiliate relating to certain investment transactions which amounted to $0.11 per share. Excluding such payment, the total return would have been 9.73%, 8.82%, 8.86%, 10.23%, 9.98% and 9.46%, respectively. |
| | (j) | | Reflects income recognized from special dividends which amounted to $0.07 per share and 0.34% of average net assets. |
| | (k) | | Reflects income recognized from special dividends which amounted to $0.10 per share and 0.63% of average net assets. |
| | |
| 72 | | The accompanying notes are an integral part of these financial statements. |
GOLDMAN SACHS SMALL CAP GROWTH INSIGHTS FUND
| | | | | | | | | | | | | | | | | | | | | | | | | | | | | | | | | | | | | | | | |
| | | | | | | | | | | | | | | | | | | | | | | | | | | | | | | | | | |
| | | Net asset
value, end
of period | | | | | Total
return(b) | | | | | Net assets,
end of
period
(in 000s) | | | | | Ratio of
net expenses
to average
net assets | | | | | Ratio of
total expenses
to average
net assets | | | | | Ratio of
net investment
income (loss)
to average
net assets | | | | | Portfolio
turnover
rate(c) | |
| | | | | | | | | | | | | | | | | | | | | | | | | | | | | | | | | | | | | | | | |
| | $ | 31.71 | | | | | | 7.85 | % | | | | $ | 39,678 | | | | | | 1.27 | %(e) | | | | | 1.65 | %(e) | | | | | (0.23 | )%(e)(d) | | | | | 56 | % |
| | | 26.17 | | | | | | 7.47 | | | | | | 7,494 | | | | | | 2.02 | (e) | | | | | 2.40 | (e) | | | | | (0.97 | )(e)(d) | | | | | 56 | |
| | | 36.03 | | | | | | 8.09 | | | | | | 41,351 | | | | | | 0.87 | (e) | | | | | 1.25 | (e) | | | | | 0.16 | (e)(d) | | | | | 56 | |
| | | 32.20 | | | | | | 7.97 | | | | | | 6,507 | | | | | | 1.02 | (e) | | | | | 1.41 | (e) | | | | | (0.15 | )(e)(d) | | | | | 56 | |
| | | 30.96 | | | | | | 7.72 | | | | | | 1,381 | | | | | | 1.52 | (e) | | | | | 1.90 | (e) | | | | | (0.51 | )(e)(d) | | | | | 56 | |
| | | | | | | | | | | | | | | | | | | | | | | | | | | | | | | | | | | | | | | | |
| | | | | | | | | | | | | | | | | | | | | | | | | | | | | | | | | | | | | | | | |
| | | 31.17 | | | | | | 8.74 | | | | | | 32,390 | | | | | | 1.30 | | | | | | 1.86 | | | | | | (0.33 | ) | | | | | 162 | |
| | | 26.12 | | | | | | 7.96 | | | | | | 7,124 | | | | | | 2.05 | | | | | | 2.61 | | | | | | (1.08 | ) | | | | | 162 | |
| | | 35.10 | | | | | | 9.15 | | | | | | 30,166 | | | | | | 0.90 | | | | | | 1.47 | | | | | | 0.02 | | | | | | 162 | |
| | | 31.59 | | | | | | 9.02 | | | | | | 1,269 | | | | | | 1.05 | | | | | | 1.62 | | | | | | (0.12 | ) | | | | | 162 | |
| | | 30.51 | | | | | | 8.48 | | | | | | 847 | | | | | | 1.54 | | | | | | 2.09 | | | | | | (0.63 | ) | | | | | 162 | |
| | | 31.10 | | | | | | 33.98 | | | | | | 30,803 | | | | | | 1.30 | | | | | | 1.93 | | | | | | 0.67 | (f) | | | | | 163 | |
| | | 26.64 | | | | | | 32.92 | | | | | | 7,402 | | | | | | 2.05 | | | | | | 2.68 | | | | | | (0.12 | )(f) | | | | | 163 | |
| | | 34.59 | | | | | | 34.48 | | | | | | 14,171 | | | | | | 0.90 | | | | | | 1.53 | | | | | | 0.96 | (f) | | | | | 163 | |
| | | 31.41 | | | | | | 34.25 | | | | | | 639 | | | | | | 1.05 | | | | | | 1.71 | | | | | | 0.62 | (f) | | | | | 163 | |
| | | 30.56 | | | | | | 33.60 | | | | | | 209 | | | | | | 1.55 | | | | | | 2.18 | | | | | | (0.01 | )(f) | | | | | 163 | |
| | | 23.40 | | | | | | 10.24 | (i) | | | | | 25,662 | | | | | | 1.25 | | | | | | 1.96 | | | | | | 0.16 | (h) | | | | | 116 | |
| | | 20.09 | | | | | | 9.46 | (i) | | | | | 5,247 | | | | | | 2.00 | | | | | | 2.71 | | | | | | (0.59 | )(h) | | | | | 116 | |
| | | 26.01 | | | | | | 10.70 | (i) | | | | | 7,733 | | | | | | 0.85 | | | | | | 1.55 | | | | | | 0.57 | (h) | | | | | 116 | |
| | | 23.64 | | | | | | 10.49 | (i) | | | | | 176 | | | | | | 1.00 | | | | | | 1.70 | | | | | | 0.12 | (h) | | | | | 116 | |
| | | 23.08 | | | | | | 9.98 | (i) | | | | | 30 | | | | | | 1.50 | | | | | | 2.20 | | | | | | (0.08 | )(h) | | | | | 116 | |
| | | 21.22 | | | | | | 14.76 | | | | | | 24,979 | | | | | | 1.25 | | | | | | 1.96 | | | | | | (0.26 | )(j) | | | | | 52 | |
| | | 18.35 | | | | | | 13.90 | | | | | | 5,180 | | | | | | 2.00 | | | | | | 2.71 | | | | | | (1.00 | )(j) | | | | | 52 | |
| | | 23.49 | | | | | | 15.26 | | | | | | 6,959 | | | | | | 0.85 | | | | | | 1.56 | | | | | | 0.14 | (j) | | | | | 52 | |
| | | 21.39 | | | | | | 15.12 | | | | | | 38 | | | | | | 1.00 | | | | | | 1.71 | | | | | | (0.38 | )(j) | | | | | 52 | |
| | | 20.98 | | | | | | 14.46 | | | | | | 19 | | | | | | 1.50 | | | | | | 2.21 | | | | | | (0.51 | )(j) | | | | | 52 | |
| | | 18.49 | | | | | | 30.38 | | | | | | 22,598 | | | | | | 1.25 | | | | | | 2.09 | | | | | | 0.03 | (k) | | | | | 100 | |
| | | 16.11 | | | | | | 29.40 | | | | | | 5,263 | | | | | | 2.00 | | | | | | 2.84 | | | | | | (0.70 | )(k) | | | | | 100 | |
| | | 20.38 | | | | | | 30.87 | | | | | | 5,649 | | | | | | 0.85 | | | | | | 1.69 | | | | | | 0.39 | (k) | | | | | 100 | |
| | | 18.58 | | | | | | 30.66 | | | | | | 10 | | | | | | 1.00 | | | | | | 1.84 | | | | | | 0.26 | (k) | | | | | 100 | |
| | | 18.33 | | | | | | 30.07 | | | | | | 47 | | | | | | 1.50 | | | | | | 2.34 | | | | | | (0.21 | )(k) | | | | | 100 | |
| | |
| The accompanying notes are an integral part of these financial statements. | | 73 |
GOLDMAN SACHS SMALL CAP VALUE INSIGHTS FUND
Financial Highlights
Selected Data for a Share Outstanding Throughout Each Period
| | | | | | | | | | | | | | | | | | | | | | | | | | | | | | | | | | |
| | | | | | From
Investment Operations | | | Distributions
to shareholders | |
| | | Year - Share Class | | Net asset
value,
beginning
of period | | | Net
investment
income (loss)(a) | | | Net realized
and unrealized
gain (loss) | | | Total from
investment
operations | | | From net
investment
income | | | From net
realized
gains | | | Total
distributions | |
| | FOR THE SIX MONTHS ENDED APRIL 30, (UNAUDITED) | | | | | | | | | | | | | |
| | 2015 - A | | $ | 38.89 | | | $ | 0.21 | | | $ | 1.20 | | | $ | 1.41 | | | $ | (0.14 | ) | | $ | (0.59 | ) | | $ | (0.73 | ) |
| | 2015 - C | | | 30.40 | | | | 0.05 | | | | 0.94 | | | | 0.99 | | | | — | | | | (0.59 | ) | | | (0.59 | ) |
| | 2015 - Institutional | | | 48.49 | | | | 0.35 | | | | 1.51 | | | | 1.86 | | | | (0.29 | ) | | | (0.59 | ) | | | (0.88 | ) |
| | 2015 - IR | | | 38.84 | | | | 0.26 | | | | 1.18 | | | | 1.44 | | | | (0.23 | ) | | | (0.59 | ) | | | (0.82 | ) |
| | 2015 - R | | | 38.50 | | | | 0.14 | | | | 1.20 | | | | 1.34 | | | | (0.02 | ) | | | (0.59 | ) | | | (0.61 | ) |
| | | | | | | | | | | | | | | | | | | | | | | | | | | | | | | | | | |
| | FOR THE FISCAL YEARS ENDED OCTOBER 31, | | | | | | | | | | | | | |
| | 2014 - A | | | 35.97 | | | | 0.15 | | | | 2.95 | | | | 3.10 | | | | (0.18 | ) | | | — | | | | (0.18 | ) |
| | 2014 - C | | | 28.20 | | | | (0.10 | ) | | | 2.31 | | | | 2.21 | | | | (0.01 | ) | | | — | | | | (0.01 | ) |
| | 2014 - Institutional | | | 44.76 | | | | 0.38 | | | | 3.67 | | | | 4.05 | | | | (0.32 | ) | | | — | | | | (0.32 | ) |
| | 2014 - IR | | | 35.92 | | | | 0.25 | | | | 2.94 | | | | 3.19 | | | | (0.27 | ) | | | — | | | | (0.27 | ) |
| | 2014 - R | | | 35.62 | | | | 0.07 | | | | 2.92 | | | | 2.99 | | | | (0.11 | ) | | | — | | | | (0.11 | ) |
| | 2013 - A | | | 28.75 | | | | 0.42 | (e) | | | 7.12 | | | | 7.54 | | | | (0.32 | ) | | | — | | | | (0.32 | ) |
| | 2013 - C | | | 22.62 | | | | 0.15 | (e) | | | 5.60 | | | | 5.75 | | | | (0.17 | ) | | | — | | | | (0.17 | ) |
| | 2013 - Institutional | | | 35.67 | | | | 0.69 | (e) | | | 8.84 | | | | 9.53 | | | | (0.44 | ) | | | — | | | | (0.44 | ) |
| | 2013 - IR | | | 28.75 | | | | 0.49 | (e) | | | 7.11 | | | | 7.60 | | | | (0.43 | ) | | | — | | | | (0.43 | ) |
| | 2013 - R | | | 28.54 | | | | 0.31 | (e) | | | 7.09 | | | | 7.40 | | | | (0.32 | ) | | | — | | | | (0.32 | ) |
| | 2012 - A | | | 26.36 | | | | 0.22 | (f) | | | 2.31 | (h) | | | 2.53 | | | | (0.14 | ) | | | — | | | | (0.14 | ) |
| | 2012 - C | | | 20.79 | | | | — | (f)(g) | | | 1.83 | (h) | | | 1.83 | | | | — | | | | — | | | | — | |
| | 2012 - Institutional | | | 32.66 | | | | 0.47 | (f) | | | 2.79 | (h) | | | 3.26 | | | | (0.25 | ) | | | — | | | | (0.25 | ) |
| | 2012 - IR | | | 26.40 | | | | 0.31 | (f) | | | 2.28 | (h) | | | 2.59 | | | | (0.24 | ) | | | — | | | | (0.24 | ) |
| | 2012 - R | | | 26.21 | | | | 0.15 | (f) | | | 2.30 | (h) | | | 2.45 | | | | (0.12 | ) | | | — | | | | (0.12 | ) |
| | 2011 - A | | | 24.10 | | | | 0.15 | (i) | | | 2.27 | | | | 2.42 | | | | (0.16 | ) | | | — | | | | (0.16 | ) |
| | 2011 - C | | | 19.06 | | | | (0.04 | )(i) | | | 1.80 | | | | 1.76 | | | | (0.03 | ) | | | — | | | | (0.03 | ) |
| | 2011 - Institutional | | | 29.80 | | | | 0.32 | (i) | | | 2.79 | | | | 3.11 | | | | (0.25 | ) | | | — | | | | (0.25 | ) |
| | 2011 - IR | | | 24.15 | | | | 0.24 | (i) | | | 2.24 | | | | 2.48 | | | | (0.23 | ) | | | — | | | | (0.23 | ) |
| | 2011 - R | | | 23.99 | | | | 0.07 | (i) | | | 2.26 | | | | 2.33 | | | | (0.11 | ) | | | — | | | | (0.11 | ) |
| | 2010 - A | | | 18.78 | | | | 0.16 | (j) | | | 5.34 | | | | 5.50 | | | | (0.18 | ) | | | — | | | | (0.18 | ) |
| | 2010 - C | | | 14.94 | | | | — | (g)(j) | | | 4.24 | | | | 4.24 | | | | (0.12 | ) | | | — | | | | (0.12 | ) |
| | 2010 - Institutional | | | 23.11 | | | | 0.30 | (j) | | | 6.59 | | | | 6.89 | | | | (0.20 | ) | | | — | | | | (0.20 | ) |
| | 2010 - IR | | | 18.78 | | | | 0.22 | (j) | | | 5.34 | | | | 5.56 | | | | (0.19 | ) | | | — | | | | (0.19 | ) |
| | 2010 - R | | | 18.74 | | | | 0.10 | (j) | | | 5.33 | | | | 5.43 | | | | (0.18 | ) | | | — | | | | (0.18 | ) |
| | (a) | | Calculated based on the average shares outstanding methodology. |
| | (b) | | Assumes investment at the net asset value at the beginning of the period, reinvestment of all dividends and distributions, a complete redemption of the investment at the net asset value at the end of the period and no sales or redemption charges. Total returns would be reduced if a sales or redemption charge was taken into account. Returns do not reflect the deduction of taxes that a shareholder would pay on Fund distributions or the redemption of Fund shares. Total returns for periods less than one full year are not annualized. |
| | (c) | | The Fund’s portfolio turnover rate is calculated in accordance with regulatory requirements, without regard to transactions involving short term investments and certain derivatives. If such transactions were included, the Fund’s portfolio turnover rate may be higher. |
| | (e) | | Reflects income recognized from special dividends which amounted to $0.20 per share and 0.65% of average net assets. |
| | (f) | | Reflects income recognized from special dividends which amounted to $0.09 per share and 0.33% of average net assets. |
| | (g) | | Amount is less than $0.005 per share. |
| | (h) | | Reflects payment from affiliate relating to certain investment transactions which amounted to $0.07 per share. Excluding such payment, the total return would have been 9.34%, 8.35%, 8.44%, 9.81%, 9.55% and 9.09%, respectively. |
| | (i) | | Reflects income recognized from special dividends which amounted to $0.07 per share and 0.27% of average net assets. |
| | (j) | | Reflects income recognized from special dividends which amounted to $0.06 per share and 0.33% of average net assets. |
| | |
| 74 | | The accompanying notes are an integral part of these financial statements. |
GOLDMAN SACHS SMALL CAP VALUE INSIGHTS FUND
| | | | | | | | | | | | | | | | | | | | | | | | | | | | | | | | | | | | | | | | |
| | | | | | | | | | | | | | | | | | | | | | | | | | | | | | | | | | |
| | | Net asset
value, end
of period | | | | | Total
return(b) | | | | | Net assets,
end of
period
(in 000s) | | | | | Ratio of
net expenses
to average
net assets | | | | | Ratio of
total expenses
to average
net assets | | | | | Ratio of
net investment
income (loss)
to average
net assets | | | | | Portfolio
turnover
rate(c) | |
| | | | | | | | | | | | | | | | | | | | | | | | | | | | | | | | | | | | | | | | |
| | $ | 39.57 | | | | | | 3.68 | % | | | | $ | 100,653 | | | | | | 1.25 | %(d) | | | | | 1.51 | %(d) | | | | | 1.06 | %(d) | | | | | 57 | % |
| | | 30.80 | | | | | | 3.31 | | | | | | 18,354 | | | | | | 2.00 | (d) | | | | | 2.26 | (d) | | | | | 0.31 | (d) | | | | | 57 | |
| | | 49.47 | | | | | | 3.89 | | | | | | 18,267 | | | | | | 0.85 | (d) | | | | | 1.11 | (d) | | | | | 1.44 | (d) | | | | | 57 | |
| | | 39.46 | | | | | | 3.79 | | | | | | 1,749 | | | | | | 1.00 | (d) | | | | | 1.26 | (d) | | | | | 1.32 | (d) | | | | | 57 | |
| | | 39.23 | | | | | | 3.54 | | | | | | 1,002 | | | | | | 1.50 | (d) | | | | | 1.76 | (d) | | | | | 0.74 | (d) | | | | | 57 | |
| | | | | | | | | | | | | | | | | | | | | | | | | | | | | | | | | | | | | | | | |
| | | | | | | | | | | | | | | | | | | | | | | | | | | | | | | | | | | | | | | | |
| | | 38.89 | | | | | | 8.66 | | | | | | 96,094 | | | | | | 1.27 | | | | | | 1.59 | | | | | | 0.41 | | | | | | 114 | |
| | | 30.40 | | | | | | 7.84 | | | | | | 18,994 | | | | | | 2.02 | | | | | | 2.34 | | | | | | (0.34 | ) | | | | | 114 | |
| | | 48.49 | | | | | | 9.12 | | | | | | 15,973 | | | | | | 0.87 | | | | | | 1.20 | | | | | | 0.81 | | | | | | 114 | |
| | | 38.84 | | | | | | 8.94 | | | | | | 1,788 | | | | | | 1.02 | | | | | | 1.35 | | | | | | 0.66 | | | | | | 114 | |
| | | 38.50 | | | | | | 8.40 | | | | | | 1,176 | | | | | | 1.52 | | | | | | 1.84 | | | | | | 0.18 | | | | | | 114 | |
| | | 35.97 | | | | | | 26.54 | | | | | | 99,381 | | | | | | 1.26 | | | | | | 1.54 | | | | | | 1.32 | (e) | | | | | 141 | |
| | | 28.20 | | | | | | 25.63 | | | | | | 19,416 | | | | | | 2.00 | | | | | | 2.29 | | | | | | 0.58 | (e) | | | | | 141 | |
| | | 44.76 | | | | | | 27.05 | | | | | | 12,204 | | | | | | 0.86 | | | | | | 1.13 | | | | | | 1.74 | (e) | | | | | 141 | |
| | | 35.92 | | | | | | 26.91 | | | | | | 1,310 | | | | | | 1.01 | | | | | | 1.29 | | | | | | 1.53 | (e) | | | | | 141 | |
| | | 35.62 | | | | | | 26.21 | | | | | | 1,154 | | | | | | 1.51 | | | | | | 1.79 | | | | | | 0.96 | (e) | | | | | 141 | |
| | | 28.75 | | | | | | 9.60 | (h) | | | | | 87,084 | | | | | | 1.25 | | | | | | 1.52 | | | | | | 0.79 | (f) | | | | | 85 | |
| | | 22.62 | | | | | | 8.78 | (h) | | | | | 17,808 | | | | | | 2.00 | | | | | | 2.27 | | | | | | 0.04 | (f) | | | | | 85 | |
| | | 35.67 | | | | | | 10.02 | (h) | | | | | 12,310 | | | | | | 0.85 | | | | | | 1.11 | | | | | | 1.30 | (f) | | | | | 85 | |
| | | 28.75 | | | | | | 9.82 | (h) | | | | | 455 | | | | | | 1.00 | | | | | | 1.26 | | | | | | 1.11 | (f) | | | | | 85 | |
| | | 28.54 | | | | | | 9.35 | (h) | | | | | 699 | | | | | | 1.50 | | | | | | 1.75 | | | | | | 0.52 | (f) | | | | | 85 | |
| | | 26.36 | | | | | | 10.03 | | | | | | 91,426 | | | | | | 1.25 | | | | | | 1.54 | | | | | | 0.58 | (i) | | | | | 33 | |
| | | 20.79 | | | | | | 9.21 | | | | | | 19,248 | | | | | | 2.00 | | | | | | 2.29 | | | | | | (0.17 | )(i) | | | | | 33 | |
| | | 32.66 | | | | | | 10.46 | | | | | | 3,479 | | | | | | 0.85 | | | | | | 1.14 | | | | | | 0.97 | (i) | | | | | 33 | |
| | | 26.40 | | | | | | 10.29 | | | | | | 223 | | | | | | 1.00 | | | | | | 1.29 | | | | | | 0.96 | (i) | | | | | 33 | |
| | | 26.21 | | | | | | 9.71 | | | | | | 214 | | | | | | 1.50 | | | | | | 1.79 | | | | | | 0.26 | (i) | | | | | 33 | |
| | | 24.10 | | | | | | 29.47 | | | | | | 95,864 | | | | | | 1.25 | | | | | | 1.55 | | | | | | 0.72 | (j) | | | | | 85 | |
| | | 19.06 | | | | | | 28.54 | | | | | | 21,671 | | | | | | 2.00 | | | | | | 2.30 | | | | | | (0.02 | )(j) | | | | | 85 | |
| | | 29.80 | | | | | | 30.03 | | | | | | 2,462 | | | | | | 0.85 | | | | | | 1.15 | | | | | | 1.10 | (j) | | | | | 85 | |
| | | 24.15 | | | | | | 29.83 | | | | | | 28 | | | | | | 1.00 | | | | | | 1.30 | | | | | | 0.99 | (j) | | | | | 85 | |
| | | 23.99 | | | | | | 29.17 | | | | | | 120 | | | | | | 1.50 | | | | | | 1.80 | | | | | | 0.45 | (j) | | | | | 85 | |
| | |
| The accompanying notes are an integral part of these financial statements. | | 75 |
GOLDMAN SACHS U.S. EQUITY INSIGHTS FUND
Financial Highlights
Selected Data for a Share Outstanding Throughout Each Period
| | | | | | | | | | | | | | | | | | | | | | |
| | | | | | | | Income (loss) from
investment operations | | | | |
| | | Year - Share Class | | Net asset
value,
beginning
of period | | | Net
investment
income (loss)(a) | | | Net realized
and unrealized
gain (loss) | | | Total from
investment
operations | | | Distributions
to shareholders
from net
investment
income | |
| | FOR THE SIX MONTHS ENDED APRIL 30, (UNAUDITED) | |
| | 2015 - A | | $ | 40.20 | | | $ | 0.21 | | | $ | 1.46 | | | $ | 1.67 | | | $ | (0.29 | ) |
| | 2015 - C | | | 36.78 | | | | 0.05 | | | | 1.34 | | | | 1.39 | | | | (0.04 | ) |
| | 2015 - Institutional | | | 41.29 | | | | 0.29 | | | | 1.51 | | | | 1.80 | | | | (0.45 | ) |
| | 2015 - Service | | | 40.12 | | | | 0.14 | | | | 1.51 | | | | 1.65 | | | | (0.26 | ) |
| | 2015 - IR | | | 39.89 | | | | 0.24 | | | | 1.46 | | | | 1.70 | | | | (0.40 | ) |
| | 2015 - R | | | 39.80 | | | | (0.02 | ) | | | 1.63 | | | | 1.61 | | | | (0.33 | ) |
| | | | | | | | | | | | | | | | | | | | | | |
| | FOR THE FISCAL YEARS ENDED OCTOBER 31, | |
| | 2014 - A | | | 34.52 | | | | 0.33 | | | | 5.71 | | | | 6.04 | | | | (0.36 | ) |
| | 2014 - C | | | 31.63 | | | | 0.05 | | | | 5.24 | | | | 5.29 | | | | (0.14 | ) |
| | 2014 - Institutional | | | 35.44 | | | | 0.49 | | | | 5.86 | | | | 6.35 | | | | (0.50 | ) |
| | 2014 - Service | | | 34.44 | | | | 0.29 | | | | 5.71 | | | | 6.00 | | | | (0.32 | ) |
| | 2014 - IR | | | 34.26 | | | | 0.42 | | | | 5.67 | | | | 6.09 | | | | (0.46 | ) |
| | 2014 - R | | | 34.16 | | | | 0.23 | | | | 5.67 | | | | 5.90 | | | | (0.26 | ) |
| | 2013 - A | | | 26.80 | | | | 0.44 | | | | 7.68 | | | | 8.12 | | | | (0.40 | ) |
| | 2013 - C | | | 24.59 | | | | 0.19 | | | | 7.07 | | | | 7.26 | | | | (0.22 | ) |
| | 2013 - Institutional | | | 27.51 | | | | 0.53 | | | | 7.91 | | | | 8.44 | | | | (0.51 | ) |
| | 2013 - Service | | | 26.76 | | | | 0.41 | | | | 7.65 | | | | 8.06 | | | | (0.38 | ) |
| | 2013 - IR | | | 26.62 | | | | 0.45 | | | | 7.67 | | | | 8.12 | | | | (0.48 | ) |
| | 2013 - R | | | 26.58 | | | | 0.36 | | | | 7.61 | | | | 7.97 | | | | (0.39 | ) |
| | 2012 - A | | | 24.21 | | | | 0.33 | (e) | | | 2.70 | (f) | | | 3.03 | | | | (0.44 | ) |
| | 2012 - C | | | 22.25 | | | | 0.13 | (e) | | | 2.48 | (f) | | | 2.61 | | | | (0.27 | ) |
| | 2012 - Institutional | | | 24.82 | | | | 0.44 | (e) | | | 2.77 | (f) | | | 3.21 | | | | (0.52 | ) |
| | 2012 - Service | | | 24.14 | | | | 0.30 | (e) | | | 2.70 | (f) | | | 3.00 | | | | (0.38 | ) |
| | 2012 - IR | | | 24.08 | | | | 0.37 | (e) | | | 2.69 | (f) | | | 3.06 | | | | (0.52 | ) |
| | 2012 - R | | | 23.98 | | | | 0.22 | (e) | | | 2.73 | (f) | | | 2.95 | | | | (0.35 | ) |
| | 2011 - A | | | 22.32 | | | | 0.31 | (g) | | | 1.87 | | | | 2.18 | | | | (0.29 | ) |
| | 2011 - C | | | 20.54 | | | | 0.12 | (g) | | | 1.72 | | | | 1.84 | | | | (0.13 | ) |
| | 2011 - Institutional | | | 22.89 | | | | 0.44 | (g) | | | 1.87 | | | | 2.31 | | | | (0.38 | ) |
| | 2011 - Service | | | 22.25 | | | | 0.28 | (g) | | | 1.87 | | | | 2.15 | | | | (0.26 | ) |
| | 2011 - IR | | | 22.21 | | | | 0.36 | (g) | | | 1.86 | | | | 2.22 | | | | (0.35 | ) |
| | 2011 - R | | | 22.11 | | | | 0.24 | (g) | | | 1.85 | | | | 2.09 | | | | (0.22 | ) |
| | 2010 - A | | | 19.75 | | | | 0.24 | | | | 2.63 | | | | 2.87 | | | | (0.30 | ) |
| | 2010 - C | | | 18.21 | | | | 0.07 | | | | 2.44 | | | | 2.51 | | | | (0.18 | ) |
| | 2010 - Institutional | | | 20.25 | | | | 0.33 | | | | 2.69 | | | | 3.02 | | | | (0.38 | ) |
| | 2010 - Service | | | 19.66 | | | | 0.23 | | | | 2.60 | | | | 2.83 | | | | (0.24 | ) |
| | 2010 - IR | | | 19.65 | | | | 0.29 | | | | 2.63 | | | | 2.92 | | | | (0.36 | ) |
| | 2010 - R | | | 19.63 | | | | 0.18 | | | | 2.61 | | | | 2.79 | | | | (0.31 | ) |
| | (a) | | Calculated based on the average shares outstanding methodology. |
| | (b) | | Assumes investment at the net asset value at the beginning of the period, reinvestment of all dividends and distributions, a complete redemption of the investment at the net asset value at the end of the period and no sales or redemption charges. Total returns would be reduced if a sales or redemption charge was taken into account. Returns do not reflect the deduction of taxes that a shareholder would pay on Fund distributions or the redemption of Fund shares. Total returns for periods less than one full year are not annualized. |
| | (c) | | The Fund’s portfolio turnover rate is calculated in accordance with regulatory requirements, without regard to transactions involving short term investments and certain derivatives. If such transactions were included, the Fund’s portfolio turnover rate may be higher. |
| | (e) | | Reflects income recognized from non-recurring special dividends which amounted to $0.06 per share and 0.23% of average net assets. |
| | (f) | | Reflects payment from affiliate relating to certain investment transactions which amounted to $0.02 per share. Excluding such payment, the total return would have been 12.61%, 11.75%, 11.75%, 13.08%, 12.50%, 12.87%, and 12.33%, respectively. |
| | (g) | | Reflects income recognized from a non-recurring special dividend which amounted to $0.03 per share and 0.13% of average net assets. |
| | |
| 76 | | The accompanying notes are an integral part of these financial statements. |
GOLDMAN SACHS U.S. EQUITY INSIGHTS FUND
| | | | | | | | | | | | | | | | | | | | | | | | | | | | | | | | | | | | | | | | |
| | | | | | | | | | | | | | | | | | | | | | | | | | | | | | | | | | |
| | | Net asset
value, end
of period | | | | | Total
return(b) | | | | | Net assets,
end of
period
(in 000s) | | | | | Ratio of
net expenses
to average
net assets | | | | | Ratio of
total expenses
to average
net assets | | | | | Ratio of
net investment
income (loss)
to average
net assets | | | | | Portfolio
turnover
rate(c) | |
| | | | | | | | | | | | | | | | | | | | | | | | | | | | | | | | | | | | | | | | |
| | $ | 41.58 | | | | | | 4.16 | % | | | | $ | 283,551 | | | | | | 0.96 | %(d) | | | | | 1.19 | %(d) | | | | | 1.00 | %(d) | | | | | 99 | % |
| | | 38.13 | | | | | | 3.77 | | | | | | 39,136 | | | | | | 1.71 | (d) | | | | | 1.94 | (d) | | | | | 0.25 | (d) | | | | | 99 | |
| | | 42.64 | | | | | | 4.37 | | | | | | 143,191 | | | | | | 0.56 | (d) | | | | | 0.79 | (d) | | | | | 1.37 | (d) | | | | | 99 | |
| | | 41.51 | | | | | | 4.10 | | | | | | 2,950 | | | | | | 1.06 | (d) | | | | | 1.30 | (d) | | | | | 0.69 | (d) | | | | | 99 | |
| | | 41.19 | | | | | | 4.27 | | | | | | 2,809 | | | | | | 0.71 | (d) | | | | | 0.94 | (d) | | | | | 1.17 | (d) | | | | | 99 | |
| | | 41.08 | | | | | | 4.01 | | | | | | 26,649 | | | | | | 1.21 | (d) | | | | | 1.47 | (d) | | | | | (0.09 | )(d) | | | | | 99 | |
| | | | | | | | | | | | | | | | | | | | | | | | | | | | | | | | | | | | | | | | |
| | | | | | | | | | | | | | | | | | | | | | | | | | | | | | | | | | | | | | | | |
| | | 40.20 | | | | | | 17.67 | | | | | | 275,574 | | | | | | 0.97 | | | | | | 1.21 | | | | | | 0.88 | | | | | | 222 | |
| | | 36.78 | | | | | | 16.80 | | | | | | 36,503 | | | | | | 1.72 | | | | | | 1.96 | | | | | | 0.13 | | | | | | 222 | |
| | | 41.29 | | | | | | 18.14 | | | | | | 105,300 | | | | | | 0.57 | | | | | | 0.81 | | | | | | 1.27 | | | | | | 222 | |
| | | 40.12 | | | | | | 17.57 | | | | | | 1,132 | | | | | | 1.07 | | | | | | 1.31 | | | | | | 0.78 | | | | | | 222 | |
| | | 39.89 | | | | | | 17.98 | | | | | | 1,003 | | | | | | 0.72 | | | | | | 0.96 | | | | | | 1.13 | | | | | | 222 | |
| | | 39.80 | | | | | | 17.42 | | | | | | 457 | | | | | | 1.22 | | | | | | 1.46 | | | | | | 0.63 | | | | | | 222 | |
| | | 34.52 | | | | | | 30.75 | | | | | | 256,626 | | | | | | 0.95 | | | | | | 1.21 | | | | | | 1.46 | | | | | | 203 | |
| | | 31.63 | | | | | | 29.78 | | | | | | 34,143 | | | | | | 1.70 | | | | | | 1.96 | | | | | | 0.70 | | | | | | 203 | |
| | | 35.44 | | | | | | 31.27 | | | | | | 64,809 | | | | | | 0.56 | | | | | | 0.82 | | | | | | 1.70 | | | | | | 203 | |
| | | 34.44 | | | | | | 30.57 | | | | | | 1,020 | | | | | | 1.05 | | | | | | 1.31 | | | | | | 1.37 | | | | | | 203 | |
| | | 34.26 | | | | | | 31.06 | | | | | | 546 | | | | | | 0.71 | | | | | | 0.97 | | | | | | 1.48 | | | | | | 203 | |
| | | 34.16 | | | | | | 30.42 | | | | | | 343 | | | | | | 1.20 | | | | | | 1.46 | | | | | | 1.19 | | | | | | 203 | |
| | | 26.80 | | | | | | 12.69 | (f) | | | | | 239,796 | | | | | | 0.95 | | | | | | 1.20 | | | | | | 1.31 | (e) | | | | | 121 | |
| | | 24.59 | | | | | | 11.84 | (f) | | | | | 30,979 | | | | | | 1.70 | | | | | | 1.95 | | | | | | 0.55 | (e) | | | | | 121 | |
| | | 27.51 | | | | | | 13.16 | (f) | | | | | 33,613 | | | | | | 0.55 | | | | | | 0.80 | | | | | | 1.69 | (e) | | | | | 121 | |
| | | 26.76 | | | | | | 12.58 | (f) | | | | | 1,036 | | | | | | 1.05 | | | | | | 1.30 | | | | | | 1.18 | (e) | | | | | 121 | |
| | | 26.62 | | | | | | 12.96 | (f) | | | | | 198 | | | | | | 0.70 | | | | | | 0.95 | | | | | | 1.45 | (e) | | | | | 121 | |
| | | 26.58 | | | | | | 12.42 | (f) | | | | | 336 | | | | | | 1.20 | | | | | | 1.44 | | | | | | 0.85 | (e) | | | | | 121 | |
| | | 24.21 | | | | | | 9.83 | | | | | | 278,353 | | | | | | 0.95 | | | | | | 1.19 | | | | | | 1.28 | (g) | | | | | 46 | |
| | | 22.25 | | | | | | 9.00 | | | | | | 32,665 | | | | | | 1.70 | | | | | | 1.94 | | | | | | 0.52 | (g) | | | | | 46 | |
| | | 24.82 | | | | | | 10.20 | | | | | | 33,581 | | | | | | 0.55 | | | | | | 0.79 | | | | | | 1.76 | (g) | | | | | 46 | |
| | | 24.14 | | | | | | 9.74 | | | | | | 962 | | | | | | 1.05 | | | | | | 1.29 | | | | | | 1.19 | (g) | | | | | 46 | |
| | | 24.08 | | | | | | 10.09 | | | | | | 105 | | | | | | 0.70 | | | | | | 0.94 | | | | | | 1.57 | (g) | | | | | 46 | |
| | | 23.98 | | | | | | 9.53 | | | | | | 29 | | | | | | 1.20 | | | | | | 1.44 | | | | | | 1.03 | (g) | | | | | 46 | |
| | | 22.32 | | | | | | 14.67 | | | | | | 301,843 | | | | | | 0.95 | | | | | | 1.18 | | | | | | 1.12 | | | | | | 47 | |
| | | 20.54 | | | | | | 13.84 | | | | | | 34,942 | | | | | | 1.70 | | | | | | 1.93 | | | | | | 0.37 | | | | | | 47 | |
| | | 22.89 | | | | | | 15.10 | | | | | | 115,177 | | | | | | 0.55 | | | | | | 0.78 | | | | | | 1.54 | | | | | | 47 | |
| | | 22.25 | | | | | | 14.50 | | | | | | 1,273 | | | | | | 1.05 | | | | | | 1.28 | | | | | | 1.10 | | | | | | 47 | |
| | | 22.21 | | | | | | 15.00 | | | | | | 8 | | | | | | 0.70 | | | | | | 0.93 | | | | | | 1.37 | | | | | | 47 | |
| | | 22.11 | | | | | | 14.35 | | | | | | 48 | | | | | | 1.20 | | | | | | 1.43 | | | | | | 0.88 | | | | | | 47 | |
| | |
| The accompanying notes are an integral part of these financial statements. | | 77 |
GOLDMAN SACHS DOMESTIC EQUITY INSIGHTS FUNDS
Notes to Financial Statements
April 30, 2015 (Unaudited)
Goldman Sachs Trust (the “Trust”) is a Delaware statutory trust registered under the Investment Company Act of 1940, as amended (the “Act”), as an open-end management investment company. The following table lists those series of the Trust that are included in this report (collectively, the “Funds” or individually a “Fund”), along with their corresponding share classes and respective diversification status under the Act:
| | | | |
| Fund | | Share Classes Offered | | Diversified/ Non-diversified |
Large Cap Growth Insights, Large Cap Value Insights, Small Cap Equity Insights and U.S. Equity Insights | | A, C, Institutional, Service, IR and R | | Diversified |
Small Cap Growth Insights and Small Cap Value Insights | | A, C, Institutional, IR and R | | Diversified |
Class A Shares are sold with a front-end sales charge of up to 5.50%. Class C Shares are sold with a contingent deferred sales charge (“CDSC”) of 1.00%, which is imposed on redemptions made within 12 months of purchase. Institutional, Service, Class IR and Class R Shares are not subject to a sales charge.
Goldman Sachs Asset Management, L.P. (“GSAM”), an affiliate of Goldman, Sachs & Co. (“Goldman Sachs”), serves as investment adviser to the Funds pursuant to a management agreement (the “Agreement”) with the Trust.
At the close of business on November 14, 2014, Class B Shares of each Fund were converted to Class A Shares of the Fund.
|
| 2. SIGNIFICANT ACCOUNTING POLICIES |
The financial statements have been prepared in accordance with accounting principles generally accepted in the United States of America (“GAAP”) and require management to make estimates and assumptions that may affect the reported amounts and disclosures. Actual results may differ from those estimates and assumptions.
A. Investment Valuation — The Funds’ valuation policy is to value investments at fair value.
Investment Income and Investments — Investment income includes interest income and dividend income, net of any foreign withholding taxes, less any amounts reclaimable. Interest income is accrued daily and adjusted for amortization of premiums and accretion of discounts. Dividend income is recognized on ex-dividend date or, for certain foreign securities, as soon as such information is obtained subsequent to the ex-dividend date. Investment transactions are reflected on trade date. Realized gains and losses are calculated using identified cost. Investment transactions are recorded on the following business day for daily net asset value (“NAV”) calculations. Any foreign capital gains tax is accrued daily based upon net unrealized gains, and is payable upon sale of such investments. Distributions received from the Funds’ investments in U.S. real estate investment trusts (“REITs”) may be characterized as ordinary income, net capital gain or a return of capital. A return of capital is recorded by the Funds as a reduction to the cost basis of the REIT.
For derivative contracts, realized gains and losses are recorded upon settlement of the contract.
78
GOLDMAN SACHS DOMESTIC EQUITY INSIGHTS FUNDS
|
| 2. SIGNIFICANT ACCOUNTING POLICIES (continued) |
B. Class Allocations and Expenses — Investment income, realized and unrealized gain (loss), and non-class specific expenses of each Fund are allocated daily based upon the proportion of net assets of each class. Class specific expenses, where applicable, are borne by the respective share classes and include Distribution and Service, Transfer Agent and Service and Shareholder Administration fees. Non-class specific expenses directly incurred by a Fund are charged to that Fund, while such expenses incurred by the Trust are allocated across the respective Funds on a straight-line and/or pro-rata basis depending upon the nature of the expenses.
C. Federal Taxes and Distributions to Shareholders — It is each Fund’s policy to comply with the requirements of the Internal Revenue Code of 1986, as amended (the “Code”), applicable to regulated investment companies (mutual funds) and to distribute each year substantially all of its investment company taxable income and capital gains to its shareholders. Accordingly, the Funds are not required to make any provisions for the payment of federal income tax. Distributions to shareholders are recorded on the ex-dividend date.
Income and capital gains distributions, if any, are declared and paid according to the following schedule:
| | | | | | |
| Fund | | | | Income Distributions Declared/Paid | | Capital Gains Distributions Declared/Paid |
Large Cap Value Insights | | | | Quarterly | | Annually |
Large Cap Growth Insights, Small Cap Equity Insights, Small Cap Growth Insights, Small Cap Value Insights and U.S. Equity Insights | | | | Annually | | Annually |
Net capital losses are carried forward to future fiscal years and may be used to the extent allowed by the Code to offset any future capital gains. Utilization of capital loss carryforwards will reduce the requirement of future capital gains distributions.
Under the Regulated Investment Company Modernization Act of 2010, the Funds are permitted to carry forward capital losses incurred in taxable years beginning after December 22, 2010 for an unlimited period. However, any losses incurred during those future taxable years will be required to be utilized prior to the losses incurred in pre-enactment taxable years. As a result of this ordering rule, pre-enactment capital loss carry forwards may be more likely to expire unused. Additionally, post enactment capital losses that are carried forward will retain their character as either short term or long term capital losses rather than being considered all short-term as under previous law.
The characterization of distributions to shareholders for financial reporting purposes is determined in accordance with federal income tax rules, which may differ from GAAP. The source of each Fund’s distributions may be shown in the accompanying financial statements as either from net investment income, net realized gain or capital. Certain components of the Funds’ net assets on the Statements of Assets and Liabilities reflect permanent GAAP/tax differences based on the appropriate tax character.
|
| 3. INVESTMENTS AND FAIR VALUE MEASUREMENTS |
The fair value of a financial instrument is the amount that would be received to sell an asset or paid to transfer a liability in an orderly transaction between market participants at the measurement date (i.e., the exit price). GAAP establishes a fair value hierarchy that prioritizes the inputs to valuation techniques used to measure fair value. The hierarchy gives the highest priority to
79
GOLDMAN SACHS DOMESTIC EQUITY INSIGHTS FUNDS
Notes to Financial Statements (continued)
April 30, 2015 (Unaudited)
|
| 3. INVESTMENTS AND FAIR VALUE MEASUREMENTS (continued) |
unadjusted quoted prices in active markets for identical assets or liabilities (Level 1 measurements) and the lowest priority to unobservable inputs (Level 3 measurements). The levels used for classifying investments are not necessarily an indication of the risk associated with investing in these investments. The three levels of the fair value hierarchy are described below:
Level 1 — Unadjusted quoted prices in active markets that are accessible at the measurement date for identical, unrestricted assets or liabilities;
Level 2 — Quoted prices in markets that are not active or financial instruments for which significant inputs are observable (including, but not limited to, quoted prices for similar investments, interest rates, foreign exchange rates, volatility and credit spreads), either directly or indirectly;
Level 3 — Prices or valuations that require significant unobservable inputs (including GSAM’s assumptions in determining fair value measurement).
The Trustees have adopted Valuation Procedures that govern the valuation of the portfolio investments held by the Funds, including investments for which market quotations are not readily available. The Trustees have delegated to GSAM day-to-day responsibility for implementing and maintaining internal controls and procedures related to the valuation of the Funds’ portfolio investments. To assess the continuing appropriateness of pricing sources and methodologies, GSAM regularly performs price verification procedures and issues challenges as necessary to third party pricing vendors or brokers, and any differences are reviewed in accordance with the Valuation Procedures.
A. Level 1 and Level 2 Fair Value Investments — The valuation techniques and significant inputs used in determining the fair values for investments classified as Level 1 and Level 2 are as follows:
Equity Securities — Equity securities and investment companies traded on a United States (“U.S.”) securities exchange or the NASDAQ system, or those located on certain foreign exchanges, including but not limited to the Americas, are valued daily at their last sale price or official closing price on the principal exchange or system on which they are traded. If there is no sale or official closing price or it is believed by the investment adviser to not represent fair value, equity securities and exchange traded investment companies are valued at the last bid price for long positions and at the last ask price for short positions. Investments in investment companies (other than those that are exchange traded) are valued at the NAV on the valuation date. To the extent these investments are actively traded, they are classified as Level 1 of the fair value hierarchy, otherwise they are generally classified as Level 2.
Unlisted equity securities for which market quotations are available are valued at the last sale price on the valuation date, or if no sale occurs, at the last bid price. Securities traded on certain foreign securities exchanges are valued daily at fair value determined by an independent fair value service (if available) under Valuation Procedures approved by the Trustees and consistent with applicable regulatory guidance. The independent fair value service takes into account multiple factors including, but not limited to, movements in the securities markets, certain depositary receipts, futures contracts and foreign currency exchange rates that have occurred subsequent to the close of the foreign securities exchange. These investments are generally classified as Level 2 of the fair value hierarchy.
Money Market Funds — Investments in the Goldman Sachs Financial Square Money Market Fund are valued at the NAV of the FST Share class on the day of valuation. These investments are generally classified as Level 1 of the fair value hierarchy.
The Goldman Sachs Financial Square Money Market Fund may invest in debt securities which are valued daily on the basis of quotations supplied by dealers, if market quotations are readily available, or an independent pricing service approved by the
80
GOLDMAN SACHS DOMESTIC EQUITY INSIGHTS FUNDS
|
| 3. INVESTMENTS AND FAIR VALUE MEASUREMENTS (continued) |
Trustees. The pricing services may use valuation models or matrix pricing, which consider: (i) yield or price with respect to bonds that are considered comparable in characteristics such as rating, interest rate and maturity date or (ii) quotations from securities dealers to determine current value.
Derivative Contracts — A derivative is an instrument whose value is derived from underlying assets, indices, reference rates or a combination of these factors. The Funds enter into derivative transactions to hedge against changes in interest rates, securities prices, and/or currency exchange rates, to increase total return, or to gain access to certain markets or attain exposure to other underliers.
Exchange-traded derivatives, including futures contracts, are valued at the last sale or settlement price and typically fall within Level 1 of the fair value hierarchy. Over-the-counter (“OTC”) and centrally cleared derivatives are valued using market transactions and other market evidence, including market-based inputs to models, calibration to market-clearing transactions, broker or dealer quotations, or other alternative pricing sources. Where models are used, the selection of a particular model to value OTC and centrally cleared derivatives depends upon the contractual terms of, and specific risks inherent in, the instrument, as well as the availability of pricing information in the market. Valuation models require a variety of inputs, including contractual terms, market prices, yield curves, credit curves, measures of volatility, voluntary and involuntary prepayment rates, loss severity rates and correlations of such inputs. For OTC and centrally cleared derivatives that trade in liquid markets, model inputs can generally be verified and model selection does not involve significant management judgment. OTC and centrally cleared derivatives are classified within Level 2 of the fair value hierarchy when significant inputs are corroborated by market evidence.
i. Futures Contracts — Futures contracts are contracts to buy or sell a standardized quantity of a specified commodity or security and are valued based on exchanged settlement prices or independent market quotes. Futures contracts are valued at the last settlement price, or in the absence of a sale, the last bid price for long positions and at the last ask price for short positions, at the end of each day on the board of trade or exchange upon which they are traded. Upon entering into a futures contract, a Fund deposits cash or securities in an account on behalf of the broker in an amount sufficient to meet the initial margin requirement. Subsequent payments are made or received by a Fund equal to the daily change in the contract value and are recorded as variation margin receivable or payable with a corresponding offset to unrealized gains or losses.
Short Term Investments — Short-term investments having a maturity of 60 days or less are generally valued at amortized cost which approximates fair market value. These investments are classified as Level 2 of the fair value hierarchy.
i. Repurchase Agreements — Repurchase agreements involve the purchase of securities subject to the seller’s agreement to repurchase the securities at a mutually agreed upon date and price, under the terms of a Master Repurchase Agreement (“MRA”). During the term of a repurchase agreement, the value of the underlying securities held as collateral on behalf of a Fund, including accrued interest, is required to exceed the value of the repurchase agreement, including accrued interest. The gross value of repurchase agreements is included in the Statements of Assets and Liabilities for financial reporting purposes. The underlying securities for all repurchase agreements are held at the Funds’ custodian or designated sub-custodians under tri-party repurchase agreements.
An MRA governs transactions between a Fund and select counterparties. An MRA contains provisions for, among other things, initiation, income payments, events of default and maintenance of securities for repurchase agreements. An MRA also permits offsetting with collateral to create one single net payment in the event of default or similar events, including the bankruptcy or insolvency of a counterparty.
81
GOLDMAN SACHS DOMESTIC EQUITY INSIGHTS FUNDS
Notes to Financial Statements (continued)
April 30, 2015 (Unaudited)
|
| 3. INVESTMENTS AND FAIR VALUE MEASUREMENTS (continued) |
If the seller defaults, a Fund could suffer a loss to the extent that the proceeds from the sale of the underlying securities and other collateral held by the Fund are less than the repurchase price and the Fund’s costs associated with delay and enforcement of the repurchase agreement. In addition, in the event of default or insolvency of the seller, a court could determine that a Fund’s interest in the collateral is not enforceable, resulting in additional losses to the Fund.
Pursuant to exemptive relief granted by the Securities and Exchange Commission (“SEC”) and terms and conditions contained therein, the Funds, together with other funds of the Trust and registered investment companies having management agreements with GSAM or its affiliates, may transfer uninvested cash into joint accounts, the daily aggregate balance of which is invested in one or more repurchase agreements. Under these joint accounts, the Funds maintain pro-rata credit exposure to the underlying repurchase agreements’ counterparties. With the exception of certain transaction fees, the Funds are not subject to any expenses in relation to these investments.
B. Level 3 Fair Value Investments — To the extent that significant inputs to valuation models and other alternative pricing sources are unobservable, or if quotations are not readily available, or if GSAM believes that such quotations do not accurately reflect fair value, the fair value of the Funds’ investments may be determined under Valuation Procedures approved by the Trustees. GSAM, consistent with its procedures and applicable regulatory guidance, may make an adjustment to the most recent valuation prices of either domestic or foreign securities in light of significant events to reflect what it believes to be the fair value of the securities at the time of determining a Fund’s NAV. Significant events which could affect a large number of securities in a particular market may include, but are not limited to: significant fluctuations in U.S. or foreign markets; market dislocations; market disruptions; or unscheduled market closings. Significant events which could also affect a single issuer may include, but are not limited to: corporate actions such as reorganizations, mergers and buy-outs; ratings downgrades; and bankruptcies.
C. Fair Value Hierarchy — The following is a summary of the Funds’ investments and derivatives classified in the fair value hierarchy as of April 30, 2015:
| | | | | | | | | | | | |
|
| LARGE CAP GROWTH INSIGHTS | |
| | | |
| Investment Type | | Level 1 | | | Level 2 | | | Level 3 | |
| Assets | | | | | | | | | | | | |
Common Stock and/or Other Equity Investments(a) | | | | | | | | | | | | |
Europe | | $ | 15,274,199 | | | $ | — | | | $ | — | |
North America | | | 667,977,466 | | | | — | | | | — | |
Short-term Investments | | | — | | | | 25,200,000 | | | | — | |
Securities Lending Reinvestment Vehicle | | | 3,175,950 | | | | — | | | | — | |
| Total | | $ | 686,427,615 | | | $ | 25,200,000 | | | $ | — | |
| | | |
| Derivative Type | | | | | | | | | |
| Liabilities(b) | | | | | | | | | | | | |
Futures Contracts | | $ | (30,426 | ) | | $ | — | | | $ | — | |
82
GOLDMAN SACHS DOMESTIC EQUITY INSIGHTS FUNDS
|
| 3. INVESTMENTS AND FAIR VALUE MEASUREMENTS (continued) |
| | | | | | | | | | | | |
|
| LARGE CAP VALUE INSIGHTS | |
| | | |
| Investment Type | | Level 1 | | | Level 2 | | | Level 3 | |
| Assets | | | | | | | | | | | | |
Common Stock and/or Other Equity Investments(a) | | | | | | | | | | | | |
Europe | | $ | 8,219,208 | | | $ | — | | | $ | — | |
North America | | | 445,089,862 | | | | — | | | | — | |
Short-term Investments | | | — | | | | 9,800,000 | | | | — | |
Securities Lending Reinvestment Vehicle | | | 2,957,400 | | | | — | | | | — | |
| Total | | $ | 456,266,470 | | | $ | 9,800,000 | | | $ | — | |
| | | |
| Derivative Type | | | | | | | | | |
| Assets(b) | | | | | | | | | | | | |
Futures Contracts | | $ | 20,046 | | | $ | — | | | $ | — | |
|
| SMALL CAP EQUITY INSIGHTS | |
| | | |
| Investment Type | | Level 1 | | | Level 2 | | | Level 3 | |
| Assets | | | | | | | | | | | | |
Common Stock and/or Other Equity Investments(a) | | | | | | | | | | | | |
Europe | | $ | 1,547,118 | | | $ | — | | | $ | — | |
North America | | | 163,392,339 | | | | — | | | | — | |
South America | | | 316,767 | | | | — | | | | — | |
Short-term Investments | | | — | | | | 4,300,000 | | | | — | |
Securities Lending Reinvestment Vehicle | | | 6,628,723 | | | | — | | | | — | |
| Total | | $ | 171,884,947 | | | $ | 4,300,000 | | | $ | — | |
| | | |
| Derivative Type | | | | | | | | | |
| Liabilities(b) | | | | | | | | | | | | |
Futures Contracts | | $ | (88,824 | ) | | $ | — | | | $ | — | |
83
GOLDMAN SACHS DOMESTIC EQUITY INSIGHTS FUNDS
Notes to Financial Statements (continued)
April 30, 2015 (Unaudited)
|
| 3. INVESTMENTS AND FAIR VALUE MEASUREMENTS (continued) |
| | | | | | | | | | | | |
|
| SMALL CAP GROWTH INSIGHTS | |
| | | |
| Investment Type | | Level 1 | | | Level 2 | | | Level 3 | |
| Assets | | | | | | | | | | | | |
Common Stock and/or Other Equity Investments(a) | | | | | | | | | | | | |
Europe | | $ | 1,356,745 | | | $ | — | | | $ | — | |
North America | | | 90,492,352 | | | | — | | | | — | |
Short-term Investments | | | — | | | | 5,100,000 | | | | — | |
Securities Lending Reinvestment Vehicle | | | 4,509,825 | | | | — | | | | — | |
| Total | | $ | 96,358,922 | | | $ | 5,100,000 | | | $ | — | |
| | | |
| Derivative Type | | Level 1 | | | Level 2 | | | Level 3 | |
| Liabilities(b) | | | | | | | | | | | | |
Futures Contracts | | $ | (107,851 | ) | | $ | — | | | $ | — | |
|
| SMALL CAP VALUE INSIGHTS | |
| | | |
| Investment Type | | Level 1 | | | Level 2 | | | Level 3 | |
| Assets | | | | | | | | | | | | |
Common Stock and/or Other Equity Investments(a) | | | | | | | | | | | | |
Asia | | $ | 180,180 | | | $ | — | | | $ | — | |
Europe | | | 336,554 | | | | — | | | | — | |
North America | | | 135,778,868 | | | | — | | | | — | |
South America | | | 52,472 | | | | — | | | | — | |
Short-term Investments | | | — | | | | 3,500,000 | | | | — | |
Securities Lending Reinvestment Vehicle | | | 5,159,825 | | | | — | | | | — | |
| Total | | $ | 141,507,899 | | | $ | 3,500,000 | | | $ | — | |
| | | |
| Derivative Type | | | | | | | | | |
| Liabilities(b) | | | | | | | | | | | | |
Futures Contracts | | $ | (31,053 | ) | | $ | — | | | $ | — | |
84
GOLDMAN SACHS DOMESTIC EQUITY INSIGHTS FUNDS
|
| 3. INVESTMENTS AND FAIR VALUE MEASUREMENTS (continued) |
| | | | | | | | | | | | |
|
| U.S. EQUITY INSIGHTS | |
| | | |
| Investment Type | | Level 1 | | | Level 2 | | | Level 3 | |
| Assets | | | | | | | | | | | | |
Common Stock and/or Other Equity Investments(a) | | | | | | | | | | | | |
Europe | | $ | 7,321,778 | | | $ | — | | | $ | — | |
North America | | | 482,741,804 | | | | — | | | | — | |
Short-term Investments | | | — | | | | 8,700,000 | | | | — | |
| Total | | $ | 490,063,582 | | | $ | 8,700,000 | | | $ | — | |
| | | |
| Derivative Type | | | | | | | | | |
| Assets(b) | | | | | | | | | | | | |
Futures Contracts | | $ | 1,442 | | | $ | — | | | $ | — | |
| (a) | | Amounts are disclosed by continent to highlight the impact of time zone differences between local market close and the calculation of NAV. Security valuations are based on the principal exchange or system on which they are traded, which may differ from country of domicile. |
| (b) | | Amount shown represents unrealized gain (loss) at period end. |
For further information regarding security characteristics, see the Schedules of Investments.
|
| 4. INVESTMENTS IN DERIVATIVES |
The following table sets forth, by certain risk types, the gross value of derivative contracts as of April 30, 2015. These instruments were used to meet the Funds’ investment objectives and to obtain and/or manage exposure related to the risks below. The values in the tables below exclude the effects of cash collateral received or posted pursuant to these derivative contracts, and therefore are not representative of the Funds’ net exposure.
| | | | | | | | | | | | |
| Risk | | Fund | | Statements of Assets
and Liabilities | | Assets(a) | | | Liabilities(a) | |
Equity | | Large Cap Growth Insights | | Variation margin on certain derivative contracts | | | $— | | | $ | (30,426) | |
Equity | | Large Cap Value Insights | | Variation margin on certain derivative contracts | | | 20,046 | | | | — | |
Equity | | Small Cap Equity Insights | | Variation margin on certain derivative contracts | | | — | | | | (88,824) | |
Equity | | Small Cap Growth Insights | | Variation margin on certain derivative contracts | | | — | | | | (107,851) | |
Equity | | Small Cap Value Insights | | Variation margin on certain derivative contracts | | | — | | | | (31,053) | |
Equity | | U.S. Equity Insights | | Variation margin on certain derivative contracts | | | 1,442 | | | | — | |
| (a) | | Includes unrealized gain (loss) on futures contracts described in the Additional Investment Information sections of the Schedules of Investments. Only current day’s variation margin is reported within the Statements of Assets and Liabilities. |
85
GOLDMAN SACHS DOMESTIC EQUITY INSIGHTS FUNDS
Notes to Financial Statements (continued)
April 30, 2015 (Unaudited)
|
| 4. INVESTMENTS IN DERIVATIVES (continued) |
The following tables set forth, by certain risk types, the Funds’ gains (losses) related to these derivatives and their indicative volumes for the six months ended April 30, 2015. These gains (losses) should be considered in the context that these derivative contracts may have been executed to create investment opportunities and/or economically hedge certain investments, and accordingly, certain gains (losses) on such derivative contracts may offset certain (losses) gains attributable to investments. These gains (losses) are included in “Net realized gain (loss)” or “Net change in unrealized gain (loss)” on the Statements of Operations:
| | | | | | | | | | | | | | | | | | | | |
| Risk | | | | Fund | | | | Net
Realized
Gain (Loss) | | | | | Net Change in
Unrealized
Gain (Loss) | | | Average
Number of
Contracts(a) | |
Equity | | | | Large Cap Growth Insights | | | | $ | 511,184 | | | | | $ | (425,253 | ) | | | 127 | |
Equity | | | | Large Cap Value Insights | | | | | 491,345 | | | | | | (175,942 | ) | | | 59 | |
Equity | | | | Small Cap Equity Insights | | | | | 253,289 | | | | | | (322,727 | ) | | | 23 | |
Equity | | | | Small Cap Growth Insights | | | | | 111,105 | | | | | | (146,766 | ) | | | 17 | |
Equity | | | | Small Cap Value Insights | | | | | 158,665 | | | | | | (75,955 | ) | | | 15 | |
Equity | | | | U.S. Equity Insights | | | | | 530,038 | | | | | | (109,170 | ) | | | 68 | |
| (a) | | Average number of contracts is based on the average of month end balances for the six months ended April 30, 2015. |
| | |
| 5. AGREEMENTS AND AFFILIATED TRANSACTIONS | | |
A. Management Agreement — Under the Agreement, GSAM manages the Funds, subject to the general supervision of the Trustees.
As compensation for the services rendered pursuant to the Agreement, the assumption of the expenses related thereto and administration of the Funds’ business affairs, including providing facilities, GSAM is entitled to a management fee, accrued daily and paid monthly, equal to an annual percentage rate of each Fund’s average daily net assets.
For the six months ended April 30, 2015, contractual and effective net management fees with GSAM were at the following rates:
| | | | | | | | | | | | | | | | | | | | | | | | | | | | | | |
| | | | | Contractual Management Rate | | | Effective Net
Management
Rate*^ | |
| Fund | | | | First
$1 Billion | | | Next
$1 Billion | | | Next
$3 Billion | | | Next
$3 Billion | | | Over
$8 Billion | | | Effective
Rate | | |
Large Cap Growth Insights | | | | | 0.65 | % | | | 0.59 | % | | | 0.56 | % | | | 0.55 | % | | | 0.54 | % | | | 0.65 | % | | | 0.52 | % |
Large Cap Value Insights | | | | | 0.60 | | | | 0.54 | | | | 0.51 | | | | 0.50 | | | | 0.49 | | | | 0.60 | | | | 0.52 | |
Small Cap Equity Insights | | | | | 0.85 | | | | 0.85 | | | | 0.77 | | | | 0.73 | | | | 0.72 | | | | 0.85 | | | | 0.82 | |
Small Cap Growth Insights | | | | | 0.85 | | | | 0.85 | | | | 0.77 | | | | 0.73 | | | | 0.72 | | | | 0.85 | | | | 0.83 | # |
Small Cap Value Insights | | | | | 0.85 | | | | 0.85 | | | | 0.77 | | | | 0.73 | | | | 0.72 | | | | 0.85 | | | | 0.81 | |
U.S. Equity Insights | | | | | 0.65 | | | | 0.59 | | | | 0.56 | | | | 0.55 | | | | 0.54 | | | | 0.65 | | | | 0.52 | |
| * | | GSAM has agreed to waive a portion of its management fee in order to achieve net management rates, as defined in the Funds’ most recent prospectuses. These waivers will be effective through at least February 29, 2016, and prior to such date GSAM may not terminate the arrangements without the approval of the Trustees. The Effective Net Management Rates above are calculated based on management rates before and after waivers had been adjusted, if applicable. |
| ^ | | Effective Net Management Rate includes the impact of management fee waivers of affiliated underlying funds, if any. |
| # | | Effective February 27, 2015, GSAM agreed to waive a portion of its management fee in order to achieve an effective net management rate of 0.81% for the Small Cap Growth Insights Fund. Prior to February 27, 2015, the effective net management rate for the Small Cap Growth Insights Fund was 0.84%. |
86
GOLDMAN SACHS DOMESTIC EQUITY INSIGHTS FUNDS
|
| 5. AGREEMENTS AND AFFILIATED TRANSACTIONS (continued) |
B. Distribution and Service Plans — The Trust, on behalf of each Fund, has adopted Distribution and Service Plans (the “Plans”). Under the Plans, Goldman Sachs, which serves as distributor (the “Distributor”), is entitled to a fee accrued daily and paid monthly, for distribution services and personal and account maintenance services, which may then be paid by Goldman Sachs to authorized dealers, at the following annual rates calculated on a Fund’s average daily net assets of each respective share class:
| | | | | | | | | | | | |
| | | Distribution and Service Plan Rates | |
| | | Class A* | | | Class C | | | Class R* | |
Distribution Plan | | | 0.25 | % | | | 0.75 | % | | | 0.50 | % |
Service Plan | | | — | | | | 0.25 | | | | — | |
| * | | With respect to Class A and Class R Shares, the Distributor at its discretion may use compensation for distribution services paid under the Distribution Plan to compensate service organizations for personal and account maintenance services and expenses as long as such total compensation does not exceed the maximum cap on “service fees” imposed by the Financial Industry Regulatory Authority. |
C. Distribution Agreement — Goldman Sachs, as Distributor of the shares of the Funds pursuant to a Distribution Agreement, may retain a portion of the Class A front end sales charge and Class C Shares’ CDSC. During the six months ended April 30, 2015, Goldman Sachs advised that it retained the following amounts:
| | | | | | | | | | |
| | | | | Front End
Sales Charge | | | Contingent Deferred
Sales Charge | |
| Fund | | | | Class A | | | Class C | |
Large Cap Growth Insights | | | | $ | 21,335 | | | $ | 1 | |
Large Cap Value Insights | | | | | 3,521 | | | | 339 | |
Small Cap Equity Insights | | | | | 1,288 | | | | 268 | |
Small Cap Growth Insights | | | | | 2,808 | | | | — | |
Small Cap Value Insights | | | | | 1,314 | | | | — | * |
U.S. Equity Insights | | | | | 6,032 | | | | 349 | |
| * | | Amount is less than $0.50. |
D. Service Plan and Shareholder Administration Plan — The Trust, on behalf of each Fund that offers Service Shares, has adopted a Service Plan and a Shareholder Administration Plan. These plans allow for service organizations to provide varying levels of personal and account maintenance and shareholder administration services to their customers who are beneficial owners of such shares. The Service Plan and Shareholder Administration Plan each provide for compensation to the service organizations which is accrued daily and paid monthly at an annual rate of 0.25% (0.50% in aggregate) of the average daily net assets of the Service Shares.
E. Transfer Agency Agreement — Goldman Sachs also serves as the transfer agent of the Funds for a fee pursuant to the Transfer Agency Agreement. The fees charged for such transfer agency services are accrued daily and paid monthly at annual rates as follows: 0.19% of the average daily net assets of Class A, Class C, Class IR and Class R Shares; and 0.04% of the average daily net assets of Institutional and Service Shares.
87
GOLDMAN SACHS DOMESTIC EQUITY INSIGHTS FUNDS
Notes to Financial Statements (continued)
April 30, 2015 (Unaudited)
|
| 5. AGREEMENTS AND AFFILIATED TRANSACTIONS (continued) |
F. Other Expense Agreements and Affiliated Transactions — GSAM has agreed to limit certain “Other Expenses” of the Funds (excluding acquired fund fees and expenses, transfer agency fees and expenses, service fees and shareholder administration fees (as applicable), taxes, interest, brokerage fees, shareholder meetings, litigation, indemnification and extraordinary expenses) to the extent such expenses exceed, on an annual basis, a percentage rate of the average daily net assets of each Fund. Such Other Expense reimbursements, if any, are accrued daily and paid monthly. In addition, the Funds are not obligated to reimburse GSAM for prior fiscal year expense reimbursements, if any. The Other Expense limitations as an annual percentage rate of average daily net assets are 0.004%. These Other Expense limitations will remain in place through at least February 29, 2016, and prior to such date GSAM may not terminate the arrangements without the approval of the Trustees. The Funds bear their respective share of costs related to proxy and shareholder meetings, and GSAM has agreed to reimburse each Fund to the extent such expenses exceed a specified percentage of the Fund’s net assets. In addition, the Funds have entered into certain offset arrangements with the transfer agent, which may result in a reduction of the Funds’ expenses and are received irrespective of the application of the “Other Expense” limitations described above.
For the six months ended April 30, 2015, these expense reductions, including any fee waivers and Other Expense reimbursements, were as follows:
| | | | | | | | | | | | | | |
| | | | | Management
Fee Waiver | | | Other Expense
Reimbursements | | | Total Expense
Reimbursements | |
Large Cap Growth Insights | | | | $ | 347,836 | | | $ | 230,446 | | | $ | 578,282 | |
Large Cap Value Insights | | | | | 201,905 | | | | 188,507 | | | | 390,412 | |
Small Cap Equity Insights | | | | | 26,227 | | | | 148,781 | | | | 175,008 | |
Small Cap Growth Insights | | | | | 8,833 | | | | 145,684 | | | | 154,517 | |
Small Cap Value Insights | | | | | 28,160 | | | | 153,917 | | | | 182,077 | |
U.S. Equity Insights | | | | | 307,252 | | | | 234,322 | | | | 541,574 | |
G. Line of Credit Facility — As of April 30, 2015, the Funds participated in a $1,080,000,000 committed, unsecured revolving line of credit facility (the “facility”) together with other funds of the Trust and registered investment companies having management agreements with GSAM or its affiliates (“Other Borrowers”). Pursuant to the terms of the facility, the Funds and Other Borrowers could increase the credit amount by an additional $120,000,000, for a total of up to $1,200,000,000. This facility is to be used for temporary emergency purposes, or to allow for an orderly liquidation of securities to meet redemption requests. The interest rate on borrowings is based on the federal funds rate. The facility also requires a fee to be paid by the Funds based on the amount of the commitment that has not been utilized. For the six months ended April 30, 2015, the Funds did not have any borrowings under the facility. The facility was increased to $1,205,000,000 effective May 5, 2015.
H. Other Transactions with Affiliates — For the six months ended April 30, 2015, Goldman Sachs earned $5,850, $505, $1,020, $400, $93 and $2,626 in brokerage commissions from portfolio transactions, on behalf of the Large Cap Growth Insights, Large Cap Value Insights, Small Cap Equity Insights, Small Cap Growth Insights, Small Cap Value Insights and U.S. Equity Insights Funds, respectively.
88
GOLDMAN SACHS DOMESTIC EQUITY INSIGHTS FUNDS
|
| 5. AGREEMENTS AND AFFILIATED TRANSACTIONS (continued) |
As of April 30, 2015, the following Fund of Funds Portfolios were the beneficial owners of 5% or more of total outstanding shares of the following Funds:
| | | | | | | | | | | | | | | | | | | | | | |
| Fund | | | | Goldman Sachs Balanced Strategy Portfolio | | | Goldman Sachs Enhanced Dividend Global Equity Portfolio | | | Goldman Sachs Equity Growth Strategy Portfolio | | | Goldman Sachs Growth and Income Strategy Portfolio | | | Goldman Sachs Growth Strategy Portfolio | |
Large Cap Growth Insights | | | | | 5 | % | | | — | % | | | 9 | % | | | 14 | % | | | 17 | % |
Large Cap Value Insights | | | | | 8 | | | | — | | | | 15 | | | | 23 | | | | 27 | |
Small Cap Equity Insights | | | | | 1 | | | | 19 | | | | 5 | | | | 5 | | | | 7 | |
| | |
| 6. PORTFOLIO SECURITIES TRANSACTIONS | | |
The cost of purchases and proceeds from sales and maturities of long-term securities for the six months ended April 30, 2015, were as follows:
| | | | | | | | | | |
| Fund | | | | Purchases | | | Sales and Maturities | |
Large Cap Growth Insights | | | | $ | 813,228,764 | | | $ | 541,605,742 | |
Large Cap Value Insights | | | | | 543,813,970 | | | | 568,900,944 | |
Small Cap Equity Insights | | | | | 96,749,968 | | | | 122,323,945 | |
Small Cap Growth Insights | | | | | 60,309,435 | | | | 44,353,208 | |
Small Cap Value Insights | | | | | 77,858,148 | | | | 83,183,096 | |
U.S. Equity Insights | | | | | 518,815,365 | | | | 459,130,951 | |
Pursuant to exemptive relief granted by the SEC and the terms and conditions contained therein, the Funds may lend their securities through a securities lending agent, Goldman Sachs Agency Lending (“GSAL”), a wholly-owned subsidiary of Goldman Sachs, to certain qualified borrowers including Goldman Sachs and affiliates. In accordance with the Funds’ securities lending procedures, the Funds receive cash collateral at least equal to the market value of the securities on loan. The market value of the loaned securities is determined at the close of business of the Funds, at their last sale price or official closing price on the principal exchange or system on which they are traded, and any additional required collateral is delivered to the Funds on the next business day. As with other extensions of credit, the Funds may experience delay in the recovery of their securities or incur a loss should the borrower of the securities breach its agreement with the Funds or become insolvent at a time when the collateral is insufficient to cover the cost of repurchasing securities on loan. Dividend income received from securities on loan may not be subject to withholding taxes and therefore withholding taxes paid may differ from the amounts listed in the Statement of Operations.
The Funds invest the cash collateral received in connection with securities lending transactions in the Goldman Sachs Financial Square Money Market Fund (“Money Market Fund”), an affiliated series of the Trust. The Money Market Fund is registered under the Act as an open end investment company, is subject to Rule 2a-7 under the Act, and is managed by GSAM, for which GSAM may receive an investment advisory fee of up to 0.205% on an annualized basis of the average daily net assets of the Money Market Fund.
89
GOLDMAN SACHS DOMESTIC EQUITY INSIGHTS FUNDS
Notes to Financial Statements (continued)
April 30, 2015 (Unaudited)
|
| 7. SECURITIES LENDING (continued) |
In the event of a default by a borrower with respect to any loan, GSAL will exercise any and all remedies provided under the applicable borrower agreement to make the Funds whole. These remedies include purchasing replacement securities by applying the collateral held from the defaulting broker against the purchase cost of the replacement securities. If, despite such efforts by GSAL to exercise these remedies, the Funds sustain losses as a result of a borrower’s default, GSAL indemnifies the Funds by purchasing replacement securities at its expense, or paying the Funds an amount equal to the market value of the replacement securities, subject to an exclusion for any shortfalls resulting from a loss of value in the cash collateral pool due to reinvestment risk and a requirement that the Funds agree to assign rights to the collateral to GSAL for purpose of using the collateral to cover purchase of replacement securities as more fully described in the Securities Lending Agency Agreement. The Fund’s loaned securities were all subject to enforceable Securities Lending Agreements and the value of the collateral is at least equal to the value of the cash received. The value of loaned securities and cash collateral at period end are disclosed in the Funds’ Statements of Assets and Liabilities.
Both the Funds and GSAL received compensation relating to the lending of the Funds’ securities. The amounts earned by the Funds for the six months ended April 30, 2015, are reported under Investment Income on the Statements of Operations.
The table below details securities lending activity with affiliates of Goldman Sachs:
| | | | | | | | | | | | | | |
| | | | | For the Six Months Ended April 30, 2015 | | | Amounts Payable to
Goldman Sachs
Upon Return of
Securities Loaned as of
April 30, 2015 | |
| Fund | | | | Earnings of GSAL
Relating to
Securities
Loaned | | | Amounts Received
by the Funds
from Lending to
Goldman Sachs | | |
Large Cap Growth Insights | | | | $ | 2,140 | | | $ | 13,182 | | | $ | — | |
Large Cap Value Insights | | | | | 1,660 | | | | 11,300 | | | | 2,957,400 | |
Small Cap Equity Insights | | | | | 9,418 | | | | 15,668 | | | | 1,789,723 | |
Small Cap Growth Insights | | | | | 7,627 | | | | 21,492 | | | | 321,975 | |
Small Cap Value Insights | | | | | 6,826 | | | | 5,672 | | | | 1,491,750 | |
U.S. Equity Insights | | | | | 1,030 | | | | 4,157 | | | | — | |
The following table provides information about the Funds’ investment in the Money Market Fund as of and for the six months ended April 30,2015:
| | | | | | | | | | | | | | | | | | | | | | |
| Fund | | | | Number of
Shares Held
Beginning
of Year | | | Shares
Bought | | | Shares
Sold | | | Number of
Shares Held
End of Year | | | Value at
End of Year | |
Large Cap Growth Insights | | | | | 9,972,213 | | | | 27,838,418 | | | | (34,634,681 | ) | | | 3,175,950 | | | $ | 3,175,950 | |
Large Cap Value Insights | | | | | 5,490,200 | | | | 28,123,923 | | | | (30,656,723 | ) | | | 2,957,400 | | | | 2,957,400 | |
Small Cap Equity Insights | | | | | 16,225,232 | | | | 40,714,681 | | | | (50,311,191 | ) | | | 6,628,722 | | | | 6,628,722 | |
Small Cap Growth Insights | | | | | 5,813,078 | | | | 21,495,102 | | | | (22,798,355 | ) | | | 4,509,825 | | | | 4,509,825 | |
Small Cap Value Insights | | | | | 6,709,250 | | | | 27,854,575 | | | | (29,404,000 | ) | | | 5,159,825 | | | | 5,159,825 | |
U.S. Equity Insights | | | | | 7,637,400 | | | | 19,529,794 | | | | (27,167,194 | ) | | | — | | | | — | |
90
GOLDMAN SACHS DOMESTIC EQUITY INSIGHTS FUNDS
As of the Funds’ most recent fiscal year end, October 31, 2014, the Funds’ capital loss carryforwards and certain timing differences on a tax basis were as follows:
| | | | | | | | | | | | | | | | | | | | | | | | |
| | | Large Cap Growth Insights | | | Large Cap Value Insights | | | Small Cap
Equity Insights | | | Small Cap
Growth Insights | | | Small Cap
Value Insights | | | U.S. Equity Insights | |
Capital loss carryforwards:(1) | | | | | | | | | | | | | | | | | | | | | | | | |
Expiring 2017 | | $ | (287,917,747 | ) | | $ | (330,284,652 | ) | | $ | (96,353,932 | ) | | $ | — | | | $ | — | | | $ | (2,918,116 | ) |
Timing differences (Qualified Late Year Loss Deferrals) | | $ | — | | | $ | — | | | $ | — | | | $ | (229,769 | ) | | $ | — | | | $ | — | |
| (1) | | Expiration occurs on October 31 of the year indicated |
As of April 30, 2015, the Funds’ aggregate security unrealized gains and losses based on cost for U.S. federal income tax purposes were as follows:
| | | | | | | | | | | | | | | | | | | | | | | | |
| | | Large Cap
Growth
Insights | | | Large Cap
Value
Insights | | | Small Cap
Equity
Insights | | | Small Cap
Growth
Insights | | | Small Cap
Value
Insights | | | U.S.
Equity
Insights | |
Tax Cost | | $ | 692,467,504 | | | $ | 469,686,393 | | | $ | 166,906,875 | | | $ | 93,599,938 | | | $ | 134,960,009 | | | $ | 485,985,331 | |
Gross unrealized gain | | | 32,401,253 | | | | 10,499,320 | | | | 20,491,192 | | | | 11,469,284 | | | | 17,230,117 | | | | 24,716,303 | |
Gross unrealized loss | | | (13,241,142 | ) | | | (14,119,243 | ) | | | (11,213,120 | ) | | | (3,610,300 | ) | | | (7,182,227 | ) | | | (11,938,052 | ) |
Net unrealized gains (losses) on securities | | $ | 19,160,111 | | | $ | (3,619,923 | ) | | $ | 9,278,072 | | | $ | 7,858,984 | | | $ | 10,047,890 | | | $ | 12,778,251 | |
The difference between GAAP-basis and tax basis unrealized gains (losses) is attributable primarily to wash sales and net mark to market gains (losses) on regulated futures contracts.
GSAM has reviewed the Funds’ tax positions for all open tax years (the current and prior three years, as applicable) and has concluded that no provision for income tax is required in the Funds’ financial statements. Such open tax years remain subject to examination and adjustment by tax authorities.
The Funds’ risks include, but are not limited to, the following:
Investments in Other Investment Companies — As a shareholder of another investment company, including an exchange traded fund (“ETF”), a Fund will directly bear its proportionate share of any net management fees and other expenses paid by such other investment companies, in addition to the fees and expenses regularly borne by the Fund. ETFs are subject to risks that do not apply to conventional mutual funds, including but not limited to the following: (i) the market price of the ETF’s shares may trade at a premium or a discount to their NAV; and (ii) an active trading market for an ETF’s shares may not develop or be maintained.
Large Shareholder Transactions Risk — A Fund may experience adverse effects when certain large shareholders, such as other funds, institutional investors (including those trading by use of non-discretionary mathematical formulas), financial intermediaries (who may make investment decisions on behalf of underlying clients and/or include a Fund in their investment model), individuals, accounts and Goldman Sachs affiliates, purchase or redeem large amounts of shares of a Fund. Such large shareholder redemptions may cause the Fund to sell portfolio securities at times when it would not otherwise do so, which may negatively impact a Fund’s NAV and liquidity. Similarly, large Fund share purchases may adversely affect a Fund’s performance to the extent that a Fund is delayed in investing new cash and is required to maintain a larger cash position than it ordinarily would.
91
GOLDMAN SACHS DOMESTIC EQUITY INSIGHTS FUNDS
Notes to Financial Statements (continued)
April 31, 2015 (Unaudited)
|
| 9. OTHER RISKS (continued) |
These transactions may also accelerate the realization of taxable income to shareholders if such sales of investments resulted in gains, and may also increase transaction costs. In addition, a large redemption could result in a Fund’s current expenses being allocated over a smaller asset base, leading to an increase in the Fund’s expense ratio.
Liquidity Risk — The Funds may make investments that are illiquid or that may become less liquid in response to market developments or adverse investor perceptions. Illiquid investments may be more difficult to value. Liquidity risk may also refer to the risk that a Fund will not be able to pay redemption proceeds within the allowable time period because of unusual market conditions, an unusually high volume of redemption requests, or other reasons. To meet redemption requests, a Fund may be forced to sell investments at an unfavorable time and/or under unfavorable conditions.
Market and Credit Risks — In the normal course of business, the Funds trade financial instruments and enter into financial transactions where risk of potential loss exists due to changes in the market (market risk). Additionally, the Funds may also be exposed to credit risk in the event that an issuer or guarantor fails to perform or that an institution or entity with which the Funds have unsettled or open transactions defaults.
Investing in foreign markets may involve special risks and considerations not typically associated with investing in the U.S. Foreign securities may be subject to risk of loss because of more or less foreign government regulation, less public information and less economic, political and social stability in the countries in which the Funds invest. Loss may also result from the imposition of exchange controls, confiscations and other government restrictions by the United States or other governments, or from problems in registration, settlement or custody. Foreign risk also involves the risk of negative foreign currency rate fluctuations, which may cause the value of securities denominated in such foreign currency (or other instruments through which the Funds has exposure to foreign currencies) to decline in value. Currency exchange rates may fluctuate significantly over short periods of time. To the extent that the Funds also invests in securities of issuers located in emerging markets, these risks may be more pronounced.
Under the Trust’s organizational documents, its Trustees, officers, employees and agents are indemnified, to the extent permitted by the Act and state law, against certain liabilities that may arise out of performance of their duties to the Funds. Additionally, in the course of business, the Funds enter into contracts that contain a variety of indemnification clauses. The Funds’ maximum exposure under these arrangements is unknown, as this would involve future claims that may be made against the Funds that have not yet occurred. However, GSAM believes the risk of loss under these arrangements to be remote.
Subsequent events after the Statement of Assets and Liabilities date have been evaluated through the date the financial statements were issued. GSAM has concluded that there is no impact requiring adjustment or disclosure in the financial statements.
92
GOLDMAN SACHS DOMESTIC EQUITY INSIGHTS FUNDS
|
| 12. SUMMARY OF SHARE TRANSACTIONS |
Share activity is as follows:
| | | | | | | | | | | | | | | | |
| | | Large Cap Growth Insights Fund | |
| | | | |
| | | For the Six Months Ended
April 30, 2015
(Unaudited) | | | For the Fiscal Year Ended
October 31, 2014 | |
| | | | |
| | | Shares | | | Dollars | | | Shares | | | Dollars | |
| | | | |
| Class A Shares | | | | | | | | | | | | | | | | |
Shares sold | | | 4,628,728 | | | $ | 104,749,642 | | | | 1,140,971 | | | $ | 23,041,804 | |
Reinvestment of distributions | | | 29,769 | | | | 663,856 | | | | 29,429 | | | | 536,186 | |
Shares converted from Class B | | | 84,680 | | | | 1,853,649 | | | | 34,771 | | | | 682,123 | |
Shares redeemed | | | (899,043 | ) | | | (19,981,903 | ) | | | (972,493 | ) | | | (19,422,128 | ) |
| | | | 3,844,134 | | | | 87,285,244 | | | | 232,678 | | | | 4,837,985 | |
| Class B Shares(a) | | | | | | | | | | | | | | | | |
Shares sold | | | 1,430 | | | | 28,727 | | | | 4,202 | | | | 79,218 | |
Reinvestment of distributions | | | — | | | | — | | | | 335 | | | | 5,643 | |
Shares converted to Class A | | | (92,267 | ) | | | (1,853,649 | ) | | | (37,723 | ) | | | (682,123 | ) |
Shares redeemed | | | (26,872 | ) | | | (539,632 | ) | | | (64,301 | ) | | | (1,155,549 | ) |
| | | | (117,709 | ) | | | (2,364,554 | ) | | | (97,487 | ) | | | (1,752,811 | ) |
| Class C Shares | | | | | | | | | | | | | | | | |
Shares sold | | | 794,726 | | | | 16,362,990 | | | | 206,466 | | | | 3,840,197 | |
Reinvestment of distributions | | | 2,142 | | | | 43,723 | | | | 2,208 | | | | 36,935 | |
Shares redeemed | | | (74,393 | ) | | | (1,539,214 | ) | | | (75,781 | ) | | | (1,365,814 | ) |
| | | | 722,475 | | | | 14,867,499 | | | | 132,893 | | | | 2,511,318 | |
| Institutional Shares | | | | | | | | | | | | | | | | |
Shares sold | | | 9,926,099 | | | | 227,186,565 | | | | 3,689,139 | | | | 73,143,280 | |
Reinvestment of distributions | | | 113,490 | | | | 2,601,195 | | | | 167,029 | | | | 3,125,118 | |
Shares redeemed | | | (2,345,864 | ) | | | (54,456,828 | ) | | | (7,291,686 | ) | | | (149,714,093 | ) |
| | | | 7,693,725 | | | | 175,330,932 | | | | (3,435,518 | ) | | | (73,445,695 | ) |
| Service Shares | | | | | | | | | | | | | | | | |
Shares sold | | | 56,880 | | | | 1,271,223 | | | | 26,507 | | | | 541,116 | |
Reinvestment of distributions | | | 224 | | | | 4,945 | | | | — | | | | — | |
Shares redeemed | | | (7,195 | ) | | | (157,939 | ) | | | (72,284 | ) | | | (1,311,426 | ) |
| | | | 49,909 | | | | 1,118,229 | | | | (45,777 | ) | | | (770,310 | ) |
| Class IR Shares | | | | | | | | | | | | | | | | |
Shares sold | | | 869,746 | | | | 19,247,503 | | | | 939,114 | | | | 19,456,980 | |
Reinvestment of distributions | | | 11,163 | | | | 245,693 | | | | 452 | | | | 8,140 | |
Shares redeemed | | | (796,590 | ) | | | (17,670,029 | ) | | | (9,849 | ) | | | (195,622 | ) |
| | | | 84,319 | | | | 1,823,167 | | | | 929,717 | | | | 19,269,498 | |
| Class R Shares | | | | | | | | | | | | | | | | |
Shares sold | | | 136,493 | | | | 2,967,094 | | | | 12,928 | | | | 263,010 | |
Reinvestment of distributions | | | 358 | | | | 7,860 | | | | 169 | | | | 3,030 | |
Shares redeemed | | | (22,964 | ) | | | (502,816 | ) | | | (8,006 | ) | | | (159,897 | ) |
| | | | 113,887 | | | | 2,472,138 | | | | 5,091 | | | | 106,143 | |
NET INCREASE (DECREASE) | | | 12,390,740 | | | $ | 280,532,655 | | | | (2,278,403 | ) | | $ | (49,243,872 | ) |
| (a) | | Class B Shares were converted into Class A Shares at the close of business on November 14, 2014. |
93
GOLDMAN SACHS DOMESTIC EQUITY INSIGHTS FUNDS
Notes to Financial Statements (continued)
April 30, 2015 (Unaudited)
|
| 12. SUMMARY OF SHARE TRANSACTIONS (continued) |
Share activity is as follows:
| | | | | | | | | | | | | | | | |
| | | Large Cap Value Insights Fund | |
| | | | |
| | | For the Six Months Ended
April 30, 2015 (Unaudited) | | | For the Fiscal Year Ended
October 31, 2014 | |
| | | | |
| | | Shares | | | Dollars | | | Shares | | | Dollars | |
| | | | |
| Class A Shares | | | | | | | | | | | | | | | | |
Shares sold | | | 577,539 | | | $ | 9,932,004 | | | | 1,244,957 | | | $ | 20,053,474 | |
Reinvestment of distributions | | | 24,223 | | | | 419,569 | | | | 32,033 | | | | 509,338 | |
Shares converted from Class B | | | 6,658 | | | | 113,458 | | | | 1,748 | | | | 28,286 | |
Shares redeemed | | | (471,726 | ) | | | (8,123,458 | ) | | | (1,150,727 | ) | | | (18,291,690 | ) |
| | | | 136,694 | | | | 2,341,573 | | | | 128,011 | | | | 2,299,408 | |
| Class B Shares(a) | | | | | | | | | | | | | | | | |
Shares sold | | | — | | | | — | | | | 1,211 | | | | 19,707 | |
Reinvestment of distributions | | | — | | | | — | | | | 73 | | | | 1,120 | |
Shares converted to Class A | | | (6,694 | ) | | | (113,458 | ) | | | (1,759 | ) | | | (28,286 | ) |
Shares redeemed | | | (29,394 | ) | | | (498,274 | ) | | | (48,028 | ) | | | (743,920 | ) |
| | | | (36,088 | ) | | | (611,732 | ) | | | (48,503 | ) | | | (751,379 | ) |
| Class C Shares | | | | | | | | | | | | | | | | |
Shares sold | | | 150,783 | | | | 2,574,158 | | | | 260,358 | | | | 4,120,167 | |
Reinvestment of distributions | | | 3,207 | | | | 55,119 | | | | 2,277 | | | | 35,992 | |
Shares redeemed | | | (182,366 | ) | | | (3,101,565 | ) | | | (209,275 | ) | | | (3,277,855 | ) |
| | | | (28,376 | ) | | | (472,288 | ) | | | 53,360 | | | | 878,304 | |
| Institutional Shares | | | | | | | | | | | | | | | | |
Shares sold | | | 3,860,147 | | | | 64,636,949 | | | | 9,200,717 | | | | 146,961,493 | |
Reinvestment of distributions | | | 204,092 | | | | 3,532,411 | | | | 260,091 | | | | 4,145,244 | |
Shares redeemed | | | (5,831,889 | ) | | | (100,216,699 | ) | | | (2,999,668 | ) | | | (47,610,683 | ) |
| | | | (1,767,650 | ) | | | (32,047,339 | ) | | | 6,461,140 | | | | 103,496,054 | |
| Service Shares | | | | | | | | | | | | | | | | |
Shares sold | | | 136,541 | | | | 2,363,088 | | | | 83,939 | | | | 1,351,563 | |
Reinvestment of distributions | | | 2,507 | | | | 43,604 | | | | 2,905 | | | | 46,412 | |
Shares redeemed | | | (72,089 | ) | | | (1,235,585 | ) | | | (70,290 | ) | | | (1,097,018 | ) |
| | | | 66,959 | | | | 1,171,107 | | | | 16,554 | | | | 300,957 | |
| Class IR Shares | | | | | | | | | | | | | | | | |
Shares sold | | | 165,774 | | | | 2,847,329 | | | | 301,660 | | | | 4,816,810 | |
Reinvestment of distributions | | | 3,225 | | | | 55,695 | | | | 2,052 | | | | 33,636 | |
Shares redeemed | | | (27,288 | ) | | | (471,132 | ) | | | (12,031 | ) | | | (194,521 | ) |
| | | | 141,711 | | | | 2,431,892 | | | | 291,681 | | | | 4,655,925 | |
| Class R Shares | | | | | | | | | | | | | | | | |
Shares sold | | | 33,025 | | | | 570,895 | | | | 19,968 | | | | 319,030 | |
Reinvestment of distributions | | | 134 | | | | 2,319 | | | | 27 | | | | 420 | |
Shares redeemed | | | (1,518 | ) | | | (25,813 | ) | | | (5,619 | ) | | | (88,919 | ) |
| | | | 31,641 | | | | 547,401 | | | | 14,376 | | | | 230,531 | |
NET INCREASE (DECREASE) | | | (1,455,109 | ) | | $ | (26,639,386 | ) | | | 6,916,619 | | | $ | 111,109,800 | |
| (a) | | Class B Shares were converted into Class A Shares at the close of business on November 14, 2014. |
94
GOLDMAN SACHS DOMESTIC EQUITY INSIGHTS FUNDS
|
| 12. SUMMARY OF SHARE TRANSACTIONS (continued) |
Share activity is as follows:
| | | | | | | | | | | | | | | | |
| | | Small Cap Equity Insights Fund | |
| | | | |
| | | For the Six Months Ended
April 30, 2015 (Unaudited) | | | For the Fiscal Year Ended
October 31, 2014 | |
| | | | |
| | | Shares | | | Dollars | | | Shares | | | Dollars | |
| | | | |
| Class A Shares | | | | | | | | | | | | | | | | |
Shares sold | | | 381,936 | | | $ | 7,336,858 | | | | 641,097 | | | $ | 11,340,505 | |
Reinvestment of distributions | | | — | | | | — | | | | 19,655 | | | | 335,904 | |
Shares converted from Class B | | | 1,362 | | | | 25,015 | | | | 1,048 | | | | 18,626 | |
Shares redeemed | | | (576,999 | ) | | | (11,153,806 | ) | | | (971,627 | ) | | | (16,959,478 | ) |
| | | | (193,701 | ) | | | (3,791,933 | ) | | | (309,827 | ) | | | (5,264,443 | ) |
| Class B Shares(a) | | | | | | | | | | | | | | | | |
Shares sold | | | — | | | | — | | | | — | | | | — | |
Reinvestment of distributions | | | — | | | | — | | | | — | | | | — | |
Shares converted to Class A | | | (1,528 | ) | | | (25,015 | ) | | | (1,171 | ) | | | (18,626 | ) |
Shares redeemed | | | (11,958 | ) | | | (195,796 | ) | | | (15,554 | ) | | | (244,030 | ) |
| | | | (13,486 | ) | | | (220,811 | ) | | | (16,725 | ) | | | (262,656 | ) |
| Class C Shares | | | | | | | | | | | | | | | | |
Shares sold | | | 71,532 | | | | 1,213,133 | | | | 164,552 | | | | 2,568,567 | |
Reinvestment of distributions | | | — | | | | — | | | | 4,716 | | | | 71,917 | |
Shares redeemed | | | (136,894 | ) | | | (2,304,550 | ) | | | (300,056 | ) | | | (4,687,663 | ) |
| | | | (65,362 | ) | | | (1,091,417 | ) | | | (130,788 | ) | | | (2,047,179 | ) |
| Institutional Shares | | | | | | | | | | | | | | | | |
Shares sold | | | 698,872 | | | | 13,890,737 | | | | 2,281,008 | | | | 41,635,800 | |
Reinvestment of distributions | | | 21,563 | | | | 411,859 | | | | 85,135 | | | | 1,504,345 | |
Shares redeemed | | | (1,859,118 | ) | | | (35,615,836 | ) | | | (3,763,367 | ) | | | (68,685,300 | ) |
| | | | (1,138,683 | ) | | | (21,313,240 | ) | | | (1,397,224 | ) | | | (25,545,155 | ) |
| Service Shares | | | | | | | | | | | | | | | | |
Shares sold | | | 28,126 | | | | 531,437 | | | | 19,056 | | | | 329,321 | |
Reinvestment of distributions | | | — | | | | — | | | | 635 | | | | 10,704 | |
Shares redeemed | | | (67,761 | ) | | | (1,277,078 | ) | | | (72,479 | ) | | | (1,252,817 | ) |
| | | | (39,635 | ) | | | (745,641 | ) | | | (52,788 | ) | | | (912,792 | ) |
| Class IR Shares | | | | | | | | | | | | | | | | |
Shares sold | | | 1,458 | | | | 28,185 | | | | 5,380 | | | | 93,695 | |
Reinvestment of distributions | | | 34 | | | | 629 | | | | 742 | | | | 12,580 | |
Shares redeemed | | | (1,067 | ) | | | (19,913 | ) | | | (87,244 | ) | | | (1,467,122 | ) |
| | | | 425 | | | | 8,901 | | | | (81,122 | ) | | | (1,360,847 | ) |
| Class R Shares | | | | | | | | | | | | | | | | |
Shares sold | | | 99,074 | | | | 1,891,674 | | | | 184,584 | | | | 3,189,346 | |
Reinvestment of distributions | | | — | | | | — | | | | 4,093 | | | | 69,045 | |
Shares redeemed | | | (89,427 | ) | | | (1,693,217 | ) | | | (183,729 | ) | | | (3,182,790 | ) |
| | | | 9,647 | | | | 198,457 | | | | 4,948 | | | | 75,601 | |
NET INCREASE (DECREASE) | | | (1,440,795 | ) | | $ | (26,955,684 | ) | | | (1,983,526 | ) | | $ | (35,317,471 | ) |
| (a) | | Class B Shares were converted into Class A Shares at the close of business on November 14, 2014. |
95
GOLDMAN SACHS DOMESTIC EQUITY INSIGHTS FUNDS
Notes to Financial Statements (continued)
April 30, 2015 (Unaudited)
|
| 12. SUMMARY OF SHARE TRANSACTIONS (continued) |
Share activity is as follows:
| | | | | | | | | | | | | | | | |
| | | Small Cap Growth Insights Fund | |
| | | | |
| | | For the Six Months Ended
April 30, 2015
(Unaudited) | | | For the Fiscal Year Ended
October 31, 2014 | |
| | | | |
| | | Shares | | | Dollars | | | Shares | | | Dollars | |
| | | | |
| Class A Shares | | | | | | | | | | | | | | | | |
Shares sold | | | 182,312 | | | $ | 5,818,211 | | | | 131,364 | | | $ | 3,958,503 | |
Reinvestment of distributions | | | 64,673 | | | | 1,922,740 | | | | 82,953 | | | | 2,433,841 | |
Shares converted from Class B | | | 58,348 | | | | 1,833,293 | | | | 18,168 | | | | 550,991 | |
Shares redeemed | | | (93,307 | ) | | | (2,936,322 | ) | | | (183,697 | ) | | | (5,542,646 | ) |
| | | | 212,026 | | | | 6,637,922 | | | | 48,788 | | | | 1,400,689 | |
| Class B Shares(a) | | | | | | | | | | | | | | | | |
Shares sold | | | — | | | | — | | | | 1,244 | | | | 31,476 | |
Reinvestment of distributions | | | — | | | | — | | | | 11,441 | | | | 280,650 | |
Shares converted to Class A | | | (70,295 | ) | | | (1,833,293 | ) | | | (21,791 | ) | | | (550,991 | ) |
Shares redeemed | | | (8,938 | ) | | | (233,385 | ) | | | (25,306 | ) | | | (638,773 | ) |
| | | | (79,233 | ) | | | (2,066,678 | ) | | | (34,412 | ) | | | (877,638 | ) |
| Class C Shares | | | | | | | | | | | | | | | | |
Shares sold | | | 31,207 | | | | 827,204 | | | | 40,961 | | | | 1,044,852 | |
Reinvestment of distributions | | | 18,075 | | | | 444,639 | | | | 25,501 | | | | 631,416 | |
Shares redeemed | | | (35,614 | ) | | | (927,893 | ) | | | (71,573 | ) | | | (1,809,961 | ) |
| | | | 13,668 | | | | 343,950 | | | | (5,111 | ) | | | (133,693 | ) |
| Institutional Shares | | | | | | | | | | | | | | | | |
Shares sold | | | 311,257 | | | | 11,153,072 | | | | 525,893 | | | | 17,910,042 | |
Reinvestment of distributions | | | 45,623 | | | | 1,538,410 | | | | 30,824 | | | | 1,015,038 | |
Shares redeemed | | | (68,445 | ) | | | (2,411,187 | ) | | | (107,067 | ) | | | (3,604,391 | ) |
| | | | 288,435 | | | | 10,280,295 | | | | 449,650 | | | | 15,320,689 | |
| Service Shares | | | | | | | | | | | | | | | | |
Shares sold | | | — | | | | — | | | | — | | | | — | |
Reinvestment of distributions | | | — | | | | — | | | | — | | | | — | |
Shares redeemed | | | — | | | | — | | | | — | | | | — | |
| | | | — | | | | — | | | | — | | | | — | |
| Class IR Shares | | | | | | | | | | | | | | | | |
Shares sold | | | 161,077 | | | | 5,364,009 | | | | 18,886 | | | | 576,775 | |
Reinvestment of distributions | | | 2,432 | | | | 73,355 | | | | 1,716 | | | | 50,902 | |
Shares redeemed | | | (1,633 | ) | | | (52,138 | ) | | | (748 | ) | | | (22,608 | ) |
| | | | 161,876 | | | | 5,385,226 | | | | 19,854 | | | | 605,069 | |
| Class R Shares | | | | | | | | | | | | | | | | |
Shares sold | | | 20,216 | | | | 635,032 | | | | 23,971 | | | | 709,212 | |
Reinvestment of distributions | | | 1,322 | | | | 38,415 | | | | 582 | | | | 16,748 | |
Shares redeemed | | | (4,691 | ) | | | (147,578 | ) | | | (3,626 | ) | | | (108,220 | ) |
| | | | 16,847 | | | | 525,869 | | | | 20,927 | | | | 617,740 | |
NET INCREASE (DECREASE) | | | 613,619 | | | $ | 21,106,584 | | | | 499,696 | | | $ | 16,932,856 | |
| (a) | | Class B Shares were converted into Class A Shares at the close of business on November 14, 2014. |
96
GOLDMAN SACHS DOMESTIC EQUITY INSIGHTS FUNDS
|
| 12. SUMMARY OF SHARE TRANSACTIONS (continued) |
Share activity is as follows:
| | | | | | | | | | | | | | | | |
| | | Small Cap Value Insights Fund | |
| | | | |
| | | For the Six Months Ended
April 30, 2015
(Unaudited) | | | For the Fiscal Year Ended
October 31, 2014 | |
| | | | |
| | | Shares | | | Dollars | | | Shares | | | Dollars | |
| | | | |
| Class A Shares | | | | | | | | | | | | | | | | |
Shares sold | | | 75,851 | | | $ | 2,998,161 | | | | 118,394 | | | $ | 4,428,576 | |
Reinvestment of distributions | | | 48,801 | | | | 1,870,547 | | | | 13,561 | | | | 495,786 | |
Shares converted from Class B | | | 154,046 | | | | 6,012,436 | | | | 30,786 | | | | 1,161,766 | |
Shares redeemed | | | (205,919 | ) | | | (8,154,376 | ) | | | (454,680 | ) | | | (17,026,064 | ) |
| | | | 72,779 | | | | 2,726,768 | | | | (291,939 | ) | | | (10,939,936 | ) |
| Class B Shares(a) | | | | | | | | | | | | | | | | |
Shares sold | | | — | | | | — | | | | 2,688 | | | | 70,930 | |
Reinvestment of distributions | | | — | | | | — | | | | 286 | | | | 7,273 | |
Shares converted to Class A | | | (223,262 | ) | | | (6,012,436 | ) | | | (44,413 | ) | | | (1,161,766 | ) |
Shares redeemed | | | (35,384 | ) | | | (953,437 | ) | | | (55,810 | ) | | | (1,450,108 | ) |
| | | | (258,646 | ) | | | (6,965,873 | ) | | | (97,249 | ) | | | (2,533,671 | ) |
| Class C Shares | | | | | | | | | | | | | | | | |
Shares sold | | | 12,288 | | | | 375,999 | | | | 30,558 | | | | 896,826 | |
Reinvestment of distributions | | | 11,198 | | | | 335,036 | | | | 225 | | | | 6,477 | |
Shares redeemed | | | (52,255 | ) | | | (1,608,990 | ) | | | (94,576 | ) | | | (2,784,381 | ) |
| | | | (28,769 | ) | | | (897,955 | ) | | | (63,793 | ) | | | (1,881,078 | ) |
| Institutional Shares | | | | | | | | | | | | | | | | |
Shares sold | | | 64,729 | | | | 3,204,200 | | | | 131,158 | | | | 6,116,030 | |
Reinvestment of distributions | | | 5,823 | | | | 278,565 | | | | 1,849 | | | | 84,000 | |
Shares redeemed | | | (30,678 | ) | | | (1,503,926 | ) | | | (76,260 | ) | | | (3,543,942 | ) |
| | | | 39,874 | | | | 1,978,839 | | | | 56,747 | | | | 2,656,088 | |
| Service Shares | | | | | | | | | | | | | | | | |
Shares sold | | | — | | | | — | | | | — | | | | — | |
Reinvestment of distributions | | | — | | | | — | | | | — | | | | — | |
Shares redeemed | | | — | | | | — | | | | — | | | | — | |
| | | | — | | | | — | | | | — | | | | — | |
| Class IR Shares | | | | | | | | | | | | | | | | |
Shares sold | | | 15,922 | | | | 634,873 | | | | 21,139 | | | | 792,684 | |
Reinvestment of distributions | | | 989 | | | | 37,770 | | | | 281 | | | | 10,225 | |
Shares redeemed | | | (18,625 | ) | | | (729,353 | ) | | | (11,856 | ) | | | (444,755 | ) |
| | | | (1,714 | ) | | | (56,710 | ) | | | 9,564 | | | | 358,154 | |
| Class R Shares | | | | | | | | | | | | | | | | |
Shares sold | | | 8,007 | | | | 321,324 | | | | 10,745 | | | | 407,844 | |
Reinvestment of distributions | | | 374 | | | | 14,252 | | | | 88 | | | | 3,159 | |
Shares redeemed | | | (13,398 | ) | | | (530,180 | ) | | | (12,678 | ) | | | (468,929 | ) |
| | | | (5,017 | ) | | | (194,604 | ) | | | (1,845 | ) | | | (57,926 | ) |
NET INCREASE (DECREASE) | | | (181,493 | ) | | $ | (3,409,535 | ) | | | (388,515 | ) | | $ | (12,398,369 | ) |
| (a) | | Class B Shares were converted into Class A Shares at the close of business on November 14, 2014. |
97
GOLDMAN SACHS DOMESTIC EQUITY INSIGHTS FUNDS
Notes to Financial Statements (continued)
April 31, 2015 (Unaudited)
|
| 12. SUMMARY OF SHARE TRANSACTIONS (continued) |
Share activity is as follows:
| | | | | | | | | | | | | | | | |
| | | U.S. Equity Insights Fund | |
| | | | |
| | | For the Six Months Ended
April 30, 2015
(Unaudited) | | | For the Fiscal Year Ended
October 31, 2014 | |
| | | | |
| | | Shares | | | Dollars | | | Shares | | | Dollars | |
| | | | |
| Class A Shares | | | | | | | | | | | | | | | | |
Shares sold | | | 310,225 | | | $ | 12,802,086 | | | | 369,977 | | | $ | 13,778,014 | |
Reinvestment of distributions | | | 45,885 | | | | 1,901,942 | | | | 73,150 | | | | 2,538,314 | |
Shares converted from Class B | | | 75,598 | | | | 3,085,169 | | | | 29,712 | | | | 1,100,583 | |
Shares redeemed | | | (467,088 | ) | | | (19,338,621 | ) | | | (1,052,986 | ) | | | (39,313,513 | ) |
| | | | (35,380 | ) | | | (1,549,424 | ) | | | (580,147 | ) | | | (21,896,602 | ) |
| Class B Shares(a) | | | | | | | | | | | | | | | | |
Shares sold | | | — | | | | 18 | | | | 10,205 | | | | 359,336 | |
Reinvestment of distributions | | | — | | | | — | | | | 484 | | | | 15,783 | |
Shares converted to Class A | | | (80,912 | ) | | | (3,085,169 | ) | | | (31,659 | ) | | | (1,100,583 | ) |
Shares redeemed | | | (61,227 | ) | | | (2,334,674 | ) | | | (59,056 | ) | | | (2,052,126 | ) |
| | | | (142,139 | ) | | | (5,419,825 | ) | | | (80,026 | ) | | | (2,777,590 | ) |
| Class C Shares | | | | | | | | | | | | | | | | |
Shares sold | | | 133,166 | | | | 5,058,558 | | | | 98,598 | | | | 3,376,844 | |
Reinvestment of distributions | | | 834 | | | | 31,814 | | | | 4,233 | | | | 135,286 | |
Shares redeemed | | | (100,044 | ) | | | (3,791,949 | ) | | | (189,899 | ) | | | (6,450,588 | ) |
| | | | 33,956 | | | | 1,298,423 | | | | (87,068 | ) | | | (2,938,458 | ) |
| Institutional Shares | | | | | | | | | | | | | | | | |
Shares sold | | | 1,212,250 | | | | 51,431,894 | | | | 1,234,543 | | | | 47,132,166 | |
Reinvestment of distributions | | | 34,827 | | | | 1,478,040 | | | | 25,607 | | | | 909,325 | |
Shares redeemed | | | (438,875 | ) | | | (18,676,460 | ) | | | (538,939 | ) | | | (20,498,630 | ) |
| | | | 808,202 | | | | 34,233,474 | | | | 721,211 | | | | 27,542,861 | |
| Service Shares | | | | | | | | | | | | | | | | |
Shares sold | | | 46,747 | | | | 1,926,530 | | | | 2,316 | | | | 85,612 | |
Reinvestment of distributions | | | 85 | | | | 3,524 | | | | 121 | | | | 4,185 | |
Shares redeemed | | | (3,981 | ) | | | (162,956 | ) | | | (3,842 | ) | | | (143,333 | ) |
| | | | 42,851 | | | | 1,767,098 | | | | (1,405 | ) | | | (53,536 | ) |
| Class IR Shares | | | | | | | | | | | | | | | | |
Shares sold | | | 129,461 | | | | 5,292,371 | | | | 10,392 | | | | 389,426 | |
Reinvestment of distributions | | | 259 | | | | 10,626 | | | | 212 | | | | 7,281 | |
Shares redeemed | | | (86,686 | ) | | | (3,625,067 | ) | | | (1,392 | ) | | | (50,514 | ) |
| | | | 43,034 | | | | 1,677,930 | | | | 9,212 | | | | 346,193 | |
| Class R Shares | | | | | | | | | | | | | | | | |
Shares sold | | | 694,625 | | | | 28,931,806 | | | | 7,152 | | | | 273,341 | |
Reinvestment of distributions | | | 149 | | | | 6,126 | | | | 77 | | | | 2,636 | |
Shares redeemed | | | (57,503 | ) | | | (2,387,802 | ) | | | (5,809 | ) | | | (212,188 | ) |
| | | | 637,271 | | | | 26,550,130 | | | | 1,420 | | | | 63,789 | |
NET INCREASE (DECREASE) | | | 1,387,795 | | | $ | 58,557,806 | | | | (16,803 | ) | | $ | 286,657 | |
| (a) | | Class B Shares were converted into Class A Shares at the close of business on November 14, 2014. |
98
GOLDMAN SACHS DOMESTIC EQUITY INSIGHTS FUNDS
Fund Expenses — Six Month Period Ended April 30, 2015 (Unaudited)
As a shareholder of Class A, Class C, Institutional, Service, Class IR or Class R Shares of a Fund, you incur two types of costs: (1) transaction costs, including sales charges on purchase payments (with respect to Class A Shares), contingent deferred sales charges on redemptions (with respect to Class C Shares), and (2) ongoing costs, including management fees; distribution and service (12b-1) fees (with respect to Class A, Class C and Class R Shares); and other Fund expenses. This Example is intended to help you understand your ongoing costs (in dollars) of investing in Class A, Class C, Institutional, Service, Class IR or Class R Shares of the Funds and to compare these costs with the ongoing costs of investing in other mutual funds.
The Example is based on an investment of $1,000 invested at the beginning of the period and held for the entire period from November 1, 2014 through April 30, 2015.
Actual Expenses — The first line under each share class in the table below provides information about actual account values and actual expenses. You may use the information in this line, together with the amount you invested, to estimate the expenses that you paid over the period. Simply divide your account value by $1,000 (for example, an $8,600 account value divided by $1,000=8.6), then multiply the result by the number in the first line under the heading entitled “Expenses Paid” to estimate the expenses you paid on your account during this period.
Hypothetical Example for Comparison Purposes — The second line under each share class in the table below provides information about hypothetical account values and hypothetical expenses based on the Funds’ actual net expense ratios and an assumed rate of return of 5% per year before expenses, which is not the Funds’ actual return. The hypothetical account values and expenses may not be used to estimate the actual ending account balance or expenses you paid for the period. You may use this information to compare the ongoing costs of investing in the Funds and other funds. To do so, compare this 5% hypothetical example with the 5% hypothetical examples that appear in the shareholder reports of the other funds.
Please note that the expenses shown in the table are meant to highlight your ongoing costs only and do not reflect any transactional costs, such as sales charges, redemption fees, or exchange fees. Therefore, the second line of the table is useful in comparing ongoing costs only, and will not help you determine the relative total costs of owning different funds. In addition, if these transactional costs were included, your costs would have been higher.
| | | | | | | | | | | | | | | | | | | | | | | | | | | | | | | | | | | | |
| | | Large Cap Growth Insights Fund | | | Large Cap Value Insights Fund | | | Small Cap Equity Insights Fund | |
| Share Class | | Beginning
Account
Value
11/1/14 | | | Ending
Account
Value
4/30/15 | | | Expenses
Paid for the
6 months ended
4/30/15* | | | Beginning
Account
Value
11/1/14 | | | Ending
Account
Value
4/30/15 | | | Expenses
Paid for the
6 months ended
4/30/15* | | | Beginning
Account
Value
11/1/14 | | | Ending
Account
Value
4/30/15 | | | Expenses
Paid for the
6 months ended
4/30/15* | |
| Class A | | | | | | | | | | | | | | | | | | | | | | | | | | | | | | | | | | | | |
Actual | | $ | 1,000.00 | | | $ | 1,056.30 | | | $ | 4.89 | | | $ | 1,000.00 | | | $ | 1,022.00 | | | $ | 4.81 | | | $ | 1,000.00 | | | $ | 1,067.40 | | | $ | 6.46 | |
Hypothetical 5% return | | | 1,000.00 | | | | 1,020.03 | + | | | 4.81 | | | | 1,000.00 | | | | 1,020.03 | + | | | 4.81 | | | | 1,000.00 | | | | 1,018.55 | + | | | 6.31 | |
| Class C | | | | | | | | | | | | | | | | | | | | | | | | | | | | | | | | | | | | |
Actual | | | 1,000.00 | | | | 1,052.40 | | | | 8.70 | | | | 1,000.00 | | | | 1,019.00 | | | | 8.56 | | | | 1,000.00 | | | | 1,063.70 | | | | 10.28 | |
Hypothetical 5% return | | | 1,000.00 | | | | 1,016.32 | + | | | 8.55 | | | | 1,000.00 | | | | 1,016.32 | + | | | 8.55 | | | | 1,000.00 | | | | 1,014.83 | + | | | 10.04 | |
| Institutional | | | | | | | | | | | | | | | | | | | | | | | | | | | | | | | | | | | | |
Actual | | | 1,000.00 | | | | 1,058.60 | | | | 2.86 | | | | 1,000.00 | | | | 1,024.00 | | | | 2.81 | | | | 1,000.00 | | | | 1,069.80 | | | | 4.41 | |
Hypothetical 5% return | | | 1,000.00 | | | | 1,022.02 | + | | | 2.81 | | | | 1,000.00 | | | | 1,022.02 | + | | | 2.81 | | | | 1,000.00 | | | | 1,020.53 | + | | | 4.31 | |
| Service | | | | | | | | | | | | | | | | | | | | | | | | | | | | | | | | | | | | |
Actual | | | 1,000.00 | | | | 1,056.20 | | | | 5.40 | | | | 1,000.00 | | | | 1,022.00 | | | | 5.31 | | | | 1,000.00 | | | | 1,066.70 | | | | 6.97 | |
Hypothetical 5% return | | | 1,000.00 | | | | 1,019.54 | + | | | 5.31 | | | | 1,000.00 | | | | 1,019.54 | + | | | 5.31 | | | | 1,000.00 | | | | 1,018.05 | + | | | 6.80 | |
| Class IR | | | | | | | | | | | | | | | | | | | | | | | | | | | | | | | | | | | | |
Actual | | | 1,000.00 | | | | 1,057.50 | | | | 3.62 | | | | 1,000.00 | | | | 1,024.00 | | | | 3.56 | | | | 1,000.00 | | | | 1,069.30 | | | | 5.18 | |
Hypothetical 5% return | | | 1,000.00 | | | | 1,021.27 | + | | | 3.56 | | | | 1,000.00 | | | | 1,021.27 | + | | | 3.56 | | | | 1,000.00 | | | | 1,019.79 | + | | | 5.06 | |
| Class R | | | | | | | | | | | | | | | | | | | | | | | | | | | | | | | | | | | | |
Actual | | | 1,000.00 | | | | 1,055.40 | | | | 6.17 | | | | 1,000.00 | | | | 1,021.00 | | | | 6.06 | | | | 1,000.00 | | | | 1,066.70 | | | | 7.74 | |
Hypothetical 5% return | | | 1,000.00 | | | | 1,018.79 | + | | | 6.06 | | | | 1,000.00 | | | | 1,018.79 | + | | | 6.06 | | | | 1,000.00 | | | | 1,017.31 | + | | | 7.55 | |
99
GOLDMAN SACHS DOMESTIC EQUITY INSIGHTS FUNDS
Fund Expenses — Six Month Period Ended April 30, 2015 (Unaudited) (continued)
| | | | | | | | | | | | | | | | | | | | | | | | | | | | | | | | | | | | |
| | | Small Cap Growth Insights Fund | | | Small Cap Value Insights Fund | | | U.S. Equity Insights Fund | |
| Share Class | | Beginning
Account
Value
11/1/14 | | | Ending
Account
Value
4/30/15 | | | Expenses
Paid for the
6 months ended
4/30/15* | | | Beginning
Account
Value
11/1/14 | | | Ending
Account
Value
4/30/15 | | | Expenses
Paid for the
6 months ended
4/30/15* | | | Beginning
Account
Value
11/1/14 | | | Ending
Account
Value
4/30/15 | | | Expenses
Paid for the
6 months ended
4/30/15* | |
| Class A | | | | | | | | | | | | | | | | | | | | | | | | | | | | | | | | | | | | |
Actual | | $ | 1,000.00 | | | $ | 1,078.50 | | | $ | 6.54 | | | $ | 1,000.00 | | | $ | 1,036.80 | | | $ | 6.31 | | | $ | 1,000.00 | | | $ | 1,041.60 | | | $ | 4.86 | |
Hypothetical 5% return | | | 1,000.00 | | | | 1,018.50 | + | | | 6.36 | | | | 1,000.00 | | | | 1,018.60 | + | | | 6.26 | | | | 1,000.00 | | | | 1,020.03 | + | | | 4.81 | |
| Class C | | | | | | | | | | | | | | | | | | | | | | | | | | | | | | | | | | | | |
Actual | | | 1,000.00 | | | | 1,074.70 | | | | 10.39 | | | | 1,000.00 | | | | 1,033.10 | | | | 10.08 | | | | 1,000.00 | | | | 1,037.70 | | | | 8.64 | |
Hypothetical 5% return | | | 1,000.00 | | | | 1,014.78 | + | | | 10.09 | | | | 1,000.00 | | | | 1,014.88 | + | | | 9.99 | | | | 1,000.00 | | | | 1,016.32 | + | | | 8.55 | |
| Institutional | | | | | | | | | | | | | | | | | | | | | | | | | | | | | | | | | | | | |
Actual | | | 1,000.00 | | | | 1,080.90 | | | | 4.49 | | | | 1,000.00 | | | | 1,038.90 | | | | 4.30 | | | | 1,000.00 | | | | 1,043.70 | | | | 2.84 | |
Hypothetical 5% return | | | 1,000.00 | | | | 1,020.48 | + | | | 4.36 | | | | 1,000.00 | | | | 1,020.58 | + | | | 4.26 | | | | 1,000.00 | | | | 1,022.02 | + | | | 2.81 | |
| Service | | | | | | | | | | | | | | | | | | | | | | | | | | | | | | | | | | | | |
Actual | | | N/A | | | | N/A | | | | N/A | | | | N/A | | | | N/A | | | | N/A | | | | 1,000.00 | | | | 1,041.00 | | | | 5.36 | |
Hypothetical 5% return | | | N/A | | | | N/A | | | | N/A | | | | N/A | | | | N/A | | | | N/A | | | | 1,000.00 | | | | 1,019.54 | + | | | 5.31 | |
| Class IR | | | | | | | | | | | | | | | | | | | | | | | | | | | | | | | | | | | | |
Actual | | | 1,000.00 | | | | 1,079.70 | | | | 5.26 | | | | 1,000.00 | | | | 1,037.90 | | | | 5.05 | | | | 1,000.00 | | | | 1,042.70 | | | | 3.60 | |
Hypothetical 5% return | | | 1,000.00 | | | | 1,019.74 | + | | | 5.11 | | | | 1,000.00 | | | | 1,019.84 | + | | | 5.01 | | | | 1,000.00 | | | | 1,021.27 | + | | | 3.56 | |
| Class R | | | | | | | | | | | | | | | | | | | | | | | | | | | | | | | | | | | | |
Actual | | | 1,000.00 | | | | 1,077.20 | | | | 7.83 | | | | 1,000.00 | | | | 1,035.40 | | | | 7.57 | | | | 1,000.00 | | | | 1,040.10 | | | | 6.12 | |
Hypothetical 5% return | | | 1,000.00 | | | | 1,017.26 | + | | | 7.60 | | | | 1,000.00 | | | | 1,017.36 | + | | | 7.50 | | | | 1,000.00 | | | | 1,018.79 | + | | | 6.06 | |
| * | | Expenses for each share class are calculated using each Fund’s annualized net expense ratio for each class, which represents the ongoing expenses as a percentage of net assets for the six months ended April 30, 2015. Expenses are calculated by multiplying the annualized net expense ratio by the average account value for the period; then multiplying the result by the number of days in the most recent fiscal half year; and then dividing that result by the number of days in the fiscal year. The annualized net expense ratios for the period were as follows: |
| | | | | | | | | | | | | | | | | | | | | | | | |
| Fund | | Class A | | | Class C | | | Institutional | | | Service | | | Class IR | | | Class R | |
Large Cap Growth Insights | | | 0.96 | % | | | 1.71 | % | | | 0.56 | % | | | 1.06 | % | | | 0.71 | % | | | 1.21 | % |
Large Cap Value Insights | | | 0.96 | | | | 1.71 | | | | 0.56 | | | | 1.06 | | | | 0.71 | | | | 1.21 | |
Small Cap Equity Insights | | | 1.26 | | | | 2.01 | | | | 0.86 | | | | 1.36 | | | | 1.01 | | | | 1.51 | |
Small Cap Growth Insights | | | 1.27 | | | | 2.02 | | | | 0.87 | | | | N/A | | | | 1.02 | | | | 1.52 | |
Small Cap Value Insights | | | 1.25 | | | | 2.00 | | | | 0.85 | | | | N/A | | | | 1.00 | | | | 1.50 | |
U.S. Equity Insights | | | 0.96 | | | | 1.71 | | | | 0.56 | | | | 1.06 | | | | 0.71 | | | | 1.21 | |
| + | | Hypothetical expenses are based on each Fund’s actual annualized net expense ratios and an assumed rate of return of 5% per year before expenses. |
100
FUNDS PROFILE
Goldman Sachs Funds

Goldman Sachs is a premier financial services firm, known since 1869 for creating thoughtful and customized investment solutions in complex global markets.
Today, the Investment Management Division of Goldman Sachs serves a diverse set of clients worldwide, including private institutions, public entities and individuals. With approximately $1.02 trillion in assets under supervision as of March 31, 2015, Goldman Sachs Asset Management (“GSAM”) has portfolio management teams located around the world and our investment professionals bring firsthand knowledge of local markets to every investment decision. Assets under supervision includes assets under management and other client assets for which Goldman Sachs does not have full discretion. GSAM leverages the resources of Goldman, Sachs & Co. subject to legal, internal and regulatory restrictions.

Money Market1
Financial Square FundsSM
| n | | Financial Square Tax-Exempt Funds |
| n | | Financial Square Federal Fund |
| n | | Financial Square Government Fund |
| n | | Financial Square Money Market Fund |
| n | | Financial Square Prime Obligations Fund |
| n | | Financial Square Treasury Instruments Fund |
| n | | Financial Square Treasury Obligations Fund |
Fixed Income
Short Duration and Government
| n | | High Quality Floating Rate Fund |
| n | | Limited Maturity Obligations Fund |
| n | | Short Duration Government Fund |
| n | | Short Duration Income Fund |
| n | | Inflation Protected Securities Fund |
Multi-Sector
Municipal and Tax-Free
| n | | High Yield Municipal Fund |
| n | | Dynamic Municipal Income Fund3 |
| n | | Short Duration Tax-Free Fund |
Single Sector
| n | | Investment Grade Credit Fund |
| n | | High Yield Floating Rate Fund |
| n | | Emerging Markets Debt Fund |
| n | | Local Emerging Markets Debt Fund |
| n | | Dynamic Emerging Markets Debt Fund |
Fixed Income Alternatives
| n | | Long Short Credit Strategies Fund |
| n | | Fixed Income Macro Strategies Fund |
Fundamental Equity
| n | | Small/Mid Cap Value Fund |
| n | | Small/Mid Cap Growth Fund |
| n | | Flexible Cap Growth Fund |
| n | | Concentrated Growth Fund |
| n | | Technology Tollkeeper Fund |
| n | | Growth Opportunities Fund |
| n | | Rising Dividend Growth Fund |
| n | | Dynamic U.S. Equity Fund4 |
Tax-Advantaged Equity
| n | | U.S. Tax-Managed Equity Fund |
| n | | International Tax-Managed Equity Fund |
| n | | U.S. Equity Dividend and Premium Fund |
| n | | International Equity Dividend and Premium Fund |
Equity Insights
| n | | Small Cap Equity Insights Fund |
| n | | U.S. Equity Insights Fund |
| n | | Small Cap Growth Insights Fund |
| n | | Large Cap Growth Insights Fund |
| n | | Large Cap Value Insights Fund |
| n | | Small Cap Value Insights Fund |
| n | | International Small Cap Insights Fund |
| n | | International Equity Insights Fund |
| n | | Emerging Markets Equity Insights Fund |
Fundamental Equity International
| n | | Strategic International Equity Fund |
| n | | Focused International Equity Fund |
| n | | International Small Cap Fund |
| n | | Emerging Markets Equity Fund |
| n | | BRIC Fund (Brazil, Russia, India, China) |
Select Satellite5
| n | | Global Managed Beta Fund |
| n | | Multi-Manager Non-Core Fixed Income Fund |
| n | | Real Estate Securities Fund |
| n | | International Real Estate Securities Fund |
| n | | Commodity Strategy Fund |
| n | | Dynamic Commodity Strategy Fund |
| n | | Dynamic Allocation Fund |
| n | | Absolute Return Tracker Fund |
| n | | Managed Futures Strategy Fund |
| n | | MLP Energy Infrastructure Fund |
| n | | Multi-Manager Alternatives Fund |
| n | | Multi-Asset Real Return Fund |
| n | | Retirement Portfolio Completion Fund |
| n | | Tactical Tilt Implementation Fund |
Total Portfolio Solutions5
| n | | Balanced Strategy Portfolio |
| n | | Growth and Income Strategy Portfolio |
| n | | Growth Strategy Portfolio |
| n | | Equity Growth Strategy Portfolio |
| n | | Satellite Strategies Portfolio |
| n | | Enhanced Dividend Global Equity Portfolio |
| n | | Tax Advantaged Global Equity Portfolio |
| 1 | | An investment in a money market fund is neither insured nor guaranteed by the Federal Deposit Insurance Corporation (“FDIC”) or any other government agency. Although the Funds seek to preserve the value of your investment at $1.00 per share, it is possible to lose money by investing in the Funds. |
| 2 | | Effective on October 1, 2014, the Goldman Sachs Core Plus Fixed Income Fund was renamed the Goldman Sachs Bond Fund. |
| 3 | | Effective on December 18, 2014, the Goldman Sachs Municipal Income Fund was renamed the Goldman Sachs Dynamic Municipal Income Fund. |
| 4 | | Effective on April 30, 2015, the Goldman Sachs U.S. Equity Fund was renamed the Goldman Sachs Dynamic U.S. Equity Fund. |
| 5 | | Individual Funds within the Total Portfolio Solutions and Select Satellite categories will have various placement on the risk/return spectrum and may have greater or lesser risk than that indicated by the placement of the general Total Portfolio Solutions or Select Satellite category. |
Financial Square FundsSM is a registered service mark of Goldman, Sachs & Co.
| * | | This list covers open-end funds only. Please visit our website at www.GSAMFUNDS.com to learn about our closed-end funds. |
| | |
TRUSTEES Ashok N. Bakhru, Chairman Kathryn A. Cassidy John P. Coblentz, Jr. Diana M. Daniels Joseph P. LoRusso Herbert J. Markley James A. McNamara Jessica Palmer Alan A. Shuch Richard P. Strubel Roy W. Templin Gregory G. Weaver | | OFFICERS James A. McNamara, President Scott M. McHugh, Principal Financial Officer and Treasurer Caroline L. Kraus, Secretary |
| |
GOLDMAN, SACHS & CO. Distributor and Transfer Agent | | GOLDMAN SACHS ASSET MANAGEMENT, L.P. Investment Adviser |
Visit our Web site at www.GSAMFUNDS.com to obtain the most recent month-end returns.
Goldman Sachs Asset Management, L.P., 200 West Street, New York, New York 10282
The reports concerning the Funds included in this shareholder report may contain certain forward-looking statements about the factors that may affect the performance of the Funds in the future. These statements are based on Fund management’s predictions and expectations concerning certain future events and their expected impact on the Funds, such as performance of the economy as a whole and of specific industry sectors, changes in the levels of interest rates, the impact of developing world events, and other factors that may influence the future performance of the Funds. Management believes these forward-looking statements to be reasonable, although they are inherently uncertain and difficult to predict. Actual events may cause adjustments in portfolio management strategies from those currently expected to be employed.
A description of the policies and procedures that the Funds use to determine how to vote proxies relating to portfolio securities and information regarding how a Fund voted proxies relating to portfolio securities during the most recent 12-month period ended June 30 is available (I) without charge, upon request by calling 1-800-526-7384 (for Retail Shareholders) or 1-800-621-2550 (for Institutional Shareholders); and (II) on the Securities and Exchange Commission Web site at http://www.sec.gov.
The Funds file their complete schedule of portfolio holdings with the SEC for the first and third quarters of each fiscal year on Form N-Q. The Funds’ Form N-Qs are available on the SEC’s web site at http://www.sec.gov within 60 days after the Funds’ first and third fiscal quarters. The Funds’ Form N-Qs may be reviewed and copied at the SEC’s Public Reference Room in Washington, D.C. and information on the operation of the Public Reference Room may also be obtained by calling 1-800-SEC-0330. Form N-Qs may be obtained upon request and without charge by calling 1-800-526-7384 (for Retail Shareholders) or 1-800-621-2550 (for Institutional Shareholders).
The website links provided are for your convenience only and are not an endorsement or recommendation by GSAM of any of these websites or the products or services offered. GSAM is not responsible for the accuracy and validity of the content of these websites.
Fund holdings and allocations shown are as of April 30, 2015 and may not be representative of future investments. Fund holdings should not be relied on in making investment decisions and should not be construed as research or investment advice regarding particular securities. Current and future holdings are subject to risk.
The Global Industry Classification Standard (GICS) was developed by and is the exclusive property and a service mark of Morgan Stanley Capital International Inc. (MSCI) and Standard & Poor’s, a division of The McGraw-Hill Companies, Inc. (S&P) and is licensed for use by Goldman Sachs. Neither MSCI, S&P nor any other party involved in making or compiling the GICS or any GICS classifications makes any express or implied warranties or representations with respect to such standard or classification (or the results to be obtained by the use thereof), and all such parties hereby expressly disclaim all warranties of originality, accuracy, completeness, merchantability or fitness for a particular purpose with respect to any of such standard or classification. Without limiting any of the foregoing, in no event shall MSCI, S&P, any of their affiliates or any third party involved in making or compiling the GICS or any GICS classifications have any liability for any direct, indirect, special, punitive, consequential or any other damages (including lost profits) even if notified of the possibility of such damages.
The portfolio risk management process includes an effort to monitor and manage risk, but does not imply low risk.
Economic and market forecasts presented herein reflect a series of assumptions and judgments as of the date of this presentation and are subject to change without notice. These forecasts do not take into account the specific investment objectives, restrictions, tax and financial situation or other needs of any specific client. Actual data will vary and may not be reflected here. These forecasts are subject to high levels of uncertainty that may affect actual performance. Accordingly, these forecasts should be viewed as merely representative of a broad range of possible outcomes. These forecasts are estimated, based on assumptions, and are subject to significant revision and may change materially as economic and market conditions change. Goldman Sachs has no obligation to provide updates or changes to these forecasts. Case studies and examples are for illustrative purposes only.
Diversification does not protect an investor from market risk and does not ensure a profit.
This material is not authorized for distribution to prospective investors unless preceded or accompanied by a current Prospectus or summary prospectus, if applicable. Investors should consider a Fund’s objective, risks, and charges and expenses, and read the summary prospectus, if available, and/or the Prospectus carefully before investing or sending money. The summary prospectus, if available, and the Prospectus contain this and other information about a Fund and may be obtained from your authorized dealer or from Goldman, Sachs & Co. by calling (retail – 1-800-526-7384) (institutional – 1-800-621-2550).
© 2015 Goldman Sachs. All rights reserved.164861.MF.MED.TMPL /6/2015 DOMINSSAR-15 / 43.7K
| | (a) | As of the end of the period covered by this report, the registrant has adopted a code of ethics that applies to the registrant’s principal executive officer, principal financial officer, principal accounting officer or controller, or persons performing similar functions, regardless of whether these individuals are employed by the registrant or a third party (the “Code of Ethics”). |
| | (b) | During the period covered by this report, no amendments were made to the provisions of the Code of Ethics. |
| | (c) | During the period covered by this report, the registrant did not grant any waivers, including an implicit waiver, from any provision of the Code of Ethics. |
| | (d) | A copy of the Code of Ethics is available as provided in Item 12(a)(1) of this report. |
| ITEM 3. | AUDIT COMMITTEE FINANCIAL EXPERT. |
| | The registrant’s board of trustees has determined that the registrant has at least one “audit committee financial expert” (as defined in Item 3 of Form N-CSR) serving on its audit committee. John P. Coblentz, Jr. is the “audit committee financial expert” and is “independent” (as each term is defined in Item 3 of Form N-CSR). |
| ITEM 4. | PRINCIPAL ACCOUNTANT FEES AND SERVICES. |
Table 1 — Items 4(a) - 4(d). The accountant fees below reflect the aggregate fees billed by all of the Funds of the Goldman Sachs Trust and includes the Goldman Sachs Funds to which this certified shareholder report relates.
| | | | | | | | | | | | |
| | | 2014 | | 2013 | | Description of Services Rendered |
| | | |
| | | | | | | | | | | | |
| | | |
Audit Fees: | | | | | | | | | | | | |
| | | |
• PricewaterhouseCoopers LLP
(“PwC”) | | | $ | 4,291,739 | | | | $ | 2,304,956 | | | Financial Statement audits. |
| | | |
Audit-Related Fees: | | | | | | | | | | | | |
| | | |
• PwC | | | $ | 0 | | | | $ | 2,340 | | | Other attest services. |
| | | |
Tax Fees: | | | | | | | | | | | | |
| | | |
• PwC | | | $ | 794,850 | | | | $ | 864,950 | | | Tax compliance services provided in connection with the preparation and review of registrant’s tax returns. |
Table 2 — Items 4(b)(c) & (d). Non-Audit Services to the Goldman Sachs Trust’s service affiliates * that were pre-approved by the Audit Committee of the Goldman Sachs Trust pursuant to Rule 2-01(c)(7)(ii) of Regulation S-X.
| | | | | | | | | | | | |
| | | 2014 | | 2013 | | Description of Services Rendered |
| | | |
| | | | | | | | | | | | |
| | | |
Audit-Related Fees: | | | | | | | | | | | | |
| | | |
• PwC | | | $ | 1,486,420 | | | | $ | 1,516,680 | | | Internal control review performed in accordance with Statement on Standards for Attestation Engagements No. 16. These fees are borne by the Funds’ Adviser. |
| * | These include the advisor (excluding sub-advisors) and any entity controlling, controlled by or under common control with the advisor that provides ongoing services to the registrant (hereinafter referred to as “service affiliates”). |
Item 4(e)(1) — Audit Committee Pre-Approval Policies and Procedures
Pre-Approval of Audit and Non-Audit Services Provided to the Funds of the Goldman Sachs Trust. The Audit and Non-Audit Services Pre-Approval Policy (the “Policy”) adopted by the Audit Committee of Goldman Sachs Trust (“GST”) sets forth the procedures and the conditions pursuant to which services performed by an independent auditor for GST may be pre-approved. Services may be pre-approved specifically by the Audit Committee as a whole or, in certain circumstances, by the Audit Committee Chairman or the person designated as the Audit Committee Financial Expert. In addition, subject to specified cost limitations, certain services may be pre-approved under the provisions of the Policy. The Policy provides that the Audit Committee will consider whether the services provided by an independent auditor are consistent with the Securities and Exchange Commission’s rules on auditor independence. The Policy provides for periodic review and pre-approval by the Audit Committee of the services that may be provided by the independent auditor.
De Minimis Waiver. The pre-approval requirements of the Policy may be waived with respect to the provision of non-audit services that are permissible for an independent auditor to perform, provided (1) the aggregate amount of all such services provided constitutes no more than five percent of the total amount of revenues subject to pre-approval that was paid to the independent auditors during the fiscal year in which the services are provided; (2) such services were not recognized by GST at the time of the engagement to be non-audit services; and (3) such services are promptly brought to the attention of the Audit Committee and approved prior to the completion of the audit by the Audit Committee or by one or more members of the Audit Committee to whom authority to grant such approvals has been delegated by the Audit Committee, pursuant to the pre-approval provisions of the Policy.
Pre-Approval of Non-Audit Services Provided to GST’s Investment Advisers. The Policy provides that, in addition to requiring pre-approval of audit and non-audit services provided to GST, the Audit Committee will pre-approve those non-audit services provided to GST’s investment advisers (and entities controlling, controlled by or under common control with the investment advisers that provide ongoing services to GST) where the engagement relates directly to the operations or financial reporting of GST.
Item 4(e)(2) – 0% of the audit-related fees, tax fees and other fees listed in Table 1 were approved by GST’s Audit Committee pursuant to the “de minimis” exception of Rule 2-01(c)(7)(i)(C) of Regulation S-X. In addition, 0% of the non-audit services to the GST’s service affiliates listed in Table 2 were approved by GST’s Audit Committee pursuant to the “de minimis” exception of Rule 2-01(c)(7)(i)(C) of Regulation S-X.
Item 4(f) – Not applicable.
Item 4(g) Aggregate Non-Audit Fees Disclosure
The aggregate non-audit fees billed to GST by PwC for the twelve months ended October 31, 2014 and October 31, 2013 were approximately $794,850 and $867,290 respectively. The aggregate non-audit fees billed to GST’s adviser and service affiliates by PwC for non-audit services for the twelve months ended December 31, 2013 and December 31, 2012 were approximately $9.8 million and $10.0 million respectively. With regard to the aggregate non-audit fees billed to GST’s adviser and service affiliates, the 2014 and 2013 amounts include fees for non-audit services required to be pre-approved [see Table 2] and fees for non-audit services that did not require pre-approval since they did not directly relate to GST’s operations or financial reporting.
Item 4(h) — GST’s Audit Committee has considered whether the provision of non-audit services to GST’s investment adviser and service affiliates that did not require pre-approval pursuant to paragraph (c)(7)(ii) of Rule 2-01 of Regulation S-X is compatible with maintaining the auditors’ independence.
| ITEM 5. | AUDIT COMMITTEE OF LISTED REGISTRANTS. |
| ITEM 6. | SCHEDULE OF INVESTMENTS. |
| | Schedule of Investments is included as part of the Report to Stockholders filed under Item 1. |
| ITEM 7. | DISCLOSURE OF PROXY VOTING POLICIES AND PROCEDURES FOR CLOSED-END MANAGEMENT INVESTMENT COMPANIES. |
| ITEM 8. | PORTFOLIO MANAGERS OF CLOSED-END MANAGEMENT INVESTMENT COMPANIES. |
| ITEM 9. | PURCHASES OF EQUITY SECURITIES BY CLOSED-END MANAGEMENT INVESTMENT COMPANY AND AFFILIATED PURCHASERS. |
| ITEM 10. | SUBMISSION OF MATTERS TO A VOTE OF SECURITY HOLDERS. |
| | There have been no material changes to the procedures by which shareholders may recommend nominees to the registrant’s board of trustees. |
| ITEM 11. | CONTROLS AND PROCEDURES. |
| | (a) | The registrant’s principal executive and principal financial officers, or persons performing similar functions have concluded that the registrant’s disclosure controls and procedures (as defined in Rule 30a-3(c) under the Investment Company Act of 1940, as amended (the “1940 Act”)) are effective as of a date within 90 days of the filing of this report that includes the disclosure required by this paragraph, based on the evaluation of these controls and procedures required by Rule 30a-3(b) under the 1940 Act and 15d-15(b) under the Securities Exchange Act of 1934, as amended. |
| | (b) | There were no changes in the registrant’s internal control over financial reporting (as defined in Rule 30a-3(d) under the 1940 Act) that occurred during the registrant’s fiscal quarter of the period covered by this report that have materially affected, or are reasonably likely to materially affect, the registrant’s internal control over financial reporting. |
| | | | |
| (a)(1) | | Goldman Sachs Trust’s Code of Ethics for Principal Executive and Senior Financial Officers is incorporated by reference to Exhibit 12(a)(1) of the registrant’s Form N-CSR filed on July 8, 2015 for its International Equity Insights Funds. |
| | |
| (a)(2) | | Exhibit 99.CERT | | Certifications pursuant to Section 302 of the Sarbanes-Oxley Act of 2002 filed herewith. |
| | |
| (b) | | Exhibit 99.906CERT | | Certifications pursuant to Section 906 of the Sarbanes-Oxley Act of 2002 filed herewith. |
SIGNATURES
Pursuant to the requirements of the Securities Exchange Act of 1934 and the Investment Company Act of 1940, the registrant has duly caused this report to be signed on its behalf by the undersigned, thereunto duly authorized.
| | |
| | | Goldman Sachs Trust |
| |
| By: | | /s/ James A. McNamara |
| |
| | |
| | James A. McNamara |
| | President/Principal Executive Officer |
| | Goldman Sachs Trust |
| |
| Date: | | July 8, 2015 |
Pursuant to the requirements of the Securities Exchange Act of 1934 and the Investment Company Act of 1940, this report has been signed below by the following persons on behalf of the registrant and in the capacities and on the dates indicated.
| | |
| By: | | /s/ James A. McNamara |
| |
| | |
| | James A. McNamara |
| | President/Principal Executive Officer |
| | Goldman Sachs Trust |
| |
| Date: | | July 8, 2015 |
| |
| By: | | /s/ Scott McHugh |
| |
| | |
| | Scott McHugh |
| | Principal Financial Officer |
| | Goldman Sachs Trust |
| |
| Date: | | July 8, 2015 |