UNITED STATES
SECURITIES AND EXCHANGE COMMISSION
Washington, D.C. 20549
FORM N-CSR
CERTIFIED SHAREHOLDER REPORT OF REGISTERED
MANAGEMENT INVESTMENT COMPANIES
Investment Company Act file number 811-05349
Goldman Sachs Trust
(Exact name of registrant as specified in charter)
71 South Wacker Drive, Chicago, Illinois 60606
(Address of principal executive offices) (Zip code)
| | |
| Caroline Kraus, Esq. | | Copies to: |
| Goldman, Sachs & Co. | | Geoffrey R.T. Kenyon, Esq. |
| 200 West Street | | Dechert LLP |
| New York, New York 10282 | | 100 Oliver Street |
| | 40th Floor |
| | Boston, MA 02110-2605 |
(Name and address of agents for service)
Registrant’s telephone number, including area code: (312) 655-4400
Date of fiscal year end: October 31
Date of reporting period: April 30, 2015
| ITEM 1. | REPORTS TO STOCKHOLDERS. |
| | The Semi-Annual Report to Stockholders is filed herewith. |
Goldman Sachs Funds

| | | | |
| | |
| Semi-Annual Report | | | | April 30, 2015 |
| | |
| | | | Fundamental International Equity Funds |
| | | | Focused International Equity |
| | | | International Small Cap |
| | | | Strategic International Equity |

Goldman Sachs Fundamental International
Equity Funds
| n | | FOCUSED INTERNATIONAL EQUITY |
| n | | INTERNATIONAL SMALL CAP |
| n | | STRATEGIC INTERNATIONAL EQUITY |
| | | | |
TABLE OF CONTENTS | | | | |
| |
Principal Investment Strategies and Risks | | | 1 | |
| |
Investment Process | | | 2 | |
| |
Market Review | | | 3 | |
| |
Portfolio Management Discussions and Performance Summaries | | | 5 | |
| |
Schedules of Investments | | | 23 | |
| |
Financial Statements | | | 32 | |
| |
Financial Highlights | | | 36 | |
| |
Notes to the Financial Statements | | | 42 | |
| |
Other Information | | | 56 | |
| | | | |
| | | |
| NOT FDIC-INSURED | | May Lose Value | | No Bank Guarantee |
GOLDMAN SACHS FUNDAMENTAL INTERNATIONAL EQUITY FUNDS
Principal Investment Strategies and Risks
This is not a complete list of risks that may affect the Funds. For additional information concerning the risks applicable to the Funds, please see the Funds’ Prospectus.
The Goldman Sachs Focused International Equity Fund invests primarily in a diversified portfolio of equity investments in companies that are organized outside the United States or whose securities are principally traded outside the United States. The Fund is subject to market risk, which means that the value of the securities in which it invests may go up or down in response to the prospects of individual companies, particular sectors and/or general economic conditions. Foreign and emerging markets investments may be more volatile and less liquid than investments in U.S. securities and are subject to the risks of currency fluctuations and adverse economic or political developments. Because the Fund may invest in a relatively small number of issuers, the Fund is subject to greater risk of loss.
The Goldman Sachs International Small Cap Fund invests primarily in a diversified portfolio of equity investments in non-U.S. small-capitalization companies. The Fund is subject to market risk, which means that the value of the securities in which it invests may go up or down in response to the prospects of individual companies, particular sectors and/or general economic conditions. Foreign and emerging markets investments may be more volatile and less liquid than investments in U.S. securities and are subject to the risks of currency fluctuations and adverse economic or political developments. The securities of mid- and small-capitalization companies involve greater risks than those associated with larger, more established companies and may be subject to more abrupt or erratic price movements.
The Goldman Sachs Strategic International Equity Fund invests primarily in a diversified portfolio of equity investments in companies that are organized outside the United States or whose securities are principally traded outside the United States. The Fund’s equity investments are subject to market risk, which means that the value of the securities in which it invests may go up or down in response to the prospects of individual companies, particular sectors and/or general economic conditions. Foreign and emerging markets investments may be more volatile and less liquid than investments in U.S. securities and are subject to the risks of currency fluctuations and adverse economic or political developments.
1
GOLDMAN SACHS FUNDAMENTAL INTERNATIONAL EQUITY FUNDS
What Differentiates Goldman Sachs’ Fundamental International Equity Investment Process?
Goldman Sachs’ Fundamental International Equity investment process is based on the belief that strong, consistent results are best achieved through expert stock selection, performed by research teams working together on a global scale. Our deep, diverse and experienced team of research analysts and portfolio managers combines local insights with global, industry-specific expertise to identify its high conviction investment ideas.
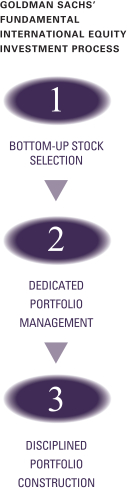

| n | | Fundamental research teams based in the United States, United Kingdom, Japan, China, Korea, Singapore, Brazil and India and focusing on long-term business and management quality |
| n | | Analysts collaborate regularly to leverage regional and industry-specific research and insights |
| n | | Global perspective is informed by local market expertise |
| n | | A common valuation framework, focusing on long-term earnings power, ensures consistency when valuing and comparing a company to its peers globally |

| n | | Team of experienced Research Analysts is regionally aligned and has sector expertise |
| n | | Team leverages the research of the approximately 80+ regional investment professionals |
| n | | Decision-making process is informed by active participation in the global research process |

| n | | Security selections are aligned with level of investment conviction |
| n | | Risk monitoring considers whether investment and other risks to the Funds are intended and justified |
| n | | Dedicated portfolio construction team assists in ongoing monitoring and adjustment of the Funds |

International equity portfolios that strive to offer:
| | n | | Access to markets across the world | |
| | n | | Disciplined approach to stock selection | |
| | n | | Optimal risk/return profiles | |
2
MARKET REVIEW
Goldman Sachs Fundamental Equity International Funds
Market Review
International equities gained solid ground during the six-month period ended April 30, 2015 (the “Reporting Period”). The MSCI® Europe, Australasia, Far East (EAFE) Index (net, unhedged) (the “MSCI® EAFE Index”) posted a return of 6.81%.* Central bank policy, currency movements and the sharp decline in oil prices were some of the biggest themes dominating the international equities markets during the Reporting Period.
Both the European Central Bank (“ECB”) and the Bank of Japan (“BoJ”) employed easy monetary policy in an effort to stimulate economic growth. With interest rates near zero in both regions, both the euro and the yen fell against the U.S. dollar, which helped increase exports, an important source of revenue to companies in Europe and Japan. The euro sank to a 12-year low against the U.S. dollar in March 2015 before rebounding slightly in April 2015, and the impact of depreciation was already noticeable in many European corporate earnings reports, many of which were better than expected. Japanese companies also began to benefit from the weak yen. Strong equity markets in both regions reflected optimism that the monetary stimulus would stave off deflation and promote economic growth. While progress was slow, a number of economic indicators in both regions appeared to be improving toward the end of the Reporting Period.
As for oil prices, the international Brent crude oil benchmark price fell rather steadily from a high of $115 per barrel in June 2014 to a low of $47 per barrel in January 2015 before rebounding to almost $70 per barrel by the end of April 2015. The low price of crude oil forced many energy companies to lower their earnings projections. As a result, the energy sector, and those countries’ equity markets most closely tied to the commodities markets, declined most during the Reporting Period. The utilities sector also posted a negative return during the Reporting Period.
However, market participants perceived the combination of lower energy prices, aggressive monetary stimulus and improving economies as beneficial for consumers in Europe and Japan. As consumer confidence and consumer spending slowly improved during the Reporting Period, the stocks of many consumer-oriented companies rose in anticipation of increased consumption. The consumer discretionary sector was the best performing sector in the MSCI® EAFE Index during the Reporting Period. The information technology, health care and industrials sectors also outperformed the MSCI® EAFE Index amidst robust global merger and acquisition activity.
From a country and region perspective, Denmark, Ireland, Hong Kong and Japan were the best performing individual country constituents of the MSCI® EAFE Index for the Reporting Period overall, while China, Norway, Australia and Spain were weakest.
Looking Ahead
As the equity bull market enters its seventh year, we believe the global economy may be nearing several inflection points and new equity market leaders may well emerge. For example, the U.S. economy has strengthened to the point where the Federal Reserve (the “Fed”) is preparing to raise interest rates for the first time since June 2006. The euro has depreciated to match the ECB’s near zero interest rate Policy, and European banks are lending again after years of deleveraging. In Japan, inflation is taking hold, wages are rising and
| *All | | index returns are expressed in U.S. dollar terms. |
3
MARKET REVIEW
consumption may be about to pick up. It is widely anticipated that India’s re-accelerating Gross Domestic Product (“GDP”) growth will likely eclipse China’s slowing economic growth rate this year. In our view, the macroeconomic themes behind many of these changes — diverging monetary policies, currency movements, low oil prices and structural reforms — affect nearly every company’s earnings and stock price in a different way.
Naturally, we believe new equity market leaders are likely to emerge from the changing economic landscape. But the best performing stocks and stock markets may not necessarily be in the countries or industries with the highest economic growth, and yesterday’s laggards are not always ready to be tomorrow’s leaders. Furthermore, earnings multiples have crept up, leaving few bargains, in our opinion. Indeed, because earnings multiples have already expanded, we believe earnings growth will become an increasingly important driver of stock performance in the months ahead. The sometimes offsetting or contradicting effects of macroeconomic conditions are likely to make top-down calls more difficult, but we believe the true impact may be revealed in corporate earnings. In our view, more expensive equities, lower return expectations and offsetting macroeconomic influences create a stock-picker’s market and one in which portfolios that outperform may look different from the broader market. Even when sector and country weightings are similar, a closer look may reveal differentiation through concentration, market capitalization, quality or other characteristics. The past year or so was challenging for most active managers, but we think that is about to change.
In all, we think global equity returns for calendar year 2015 may be slightly below their long-term average, but still are likely to compare favorably with other asset classes. As always, we maintain our focus on seeking companies that we believe will generate long-term growth in today’s ever-changing market conditions.
4
PORTFOLIO RESULTS
Goldman Sachs Focused International Equity Fund
Investment Objective
The Fund seeks long-term capital appreciation.
Portfolio Management Discussion and Analysis
Below, the Goldman Sachs Global Equity Team discusses the Goldman Sachs Focused International Equity Fund’s (the “Fund”) performance and positioning for the six-month period ended April 30, 2015 (the “Reporting Period”).
| Q | | How did the Fund perform during Reporting Period? |
| A | | During the Reporting Period, the Fund’s Class A, C, Institutional, Service and IR Shares generated cumulative total returns, without sales charges, of 5.64%, 5.26%, 5.85%, 5.58% and 5.74%, respectively. These returns compare to the 6.81% cumulative total return of the Fund’s benchmark, the MSCI® Europe, Australasia, Far East (EAFE) Index (Net, USD, Unhedged) (the “MSCI® Index”), during the same period. |
| Q | | What key factors were responsible for the Fund’s performance during the Reporting Period? |
| A | | The Fund generated solid absolute gains, but its underperformance to the MSCI® Index during the Reporting Period can be primarily attributed to individual stock selection. Sector and country allocation also detracted. |
| Q | | Which stocks detracted significantly from the Fund’s performance during the Reporting Period? |
| A | | The biggest detractors from Fund performance relative to the MSCI® Index during the Reporting Period were Aurizon Holdings, Hana Financial Group and Mediatek. |
| | Aurizon Holdings, an Australian railroad operator to the mining industry, performed poorly, as the slowing Chinese economy raised concerns that commodities freight volumes may come under pressure despite the long-term nature of the company’s contracts with its mining customers. We sold the Fund’s position in Aurizon Holdings by the end of the Reporting Period. |
| | Hana Financial Group detracted from the Fund’s relative returns during the Reporting Period. The South Korean banking group performed poorly due to earnings downgrades driven by the slowdown in the South Korean economy. The economic slowdown led to rate cuts by the nation’s central bank, which, in turn, pressured banks’ margins and also increased their competition. |
| | Mediatek is a Taiwanese semiconductor company focusing on low-end handsets for emerging markets. Its shares came under pressure as the growth in mobile phone sales in Mediatek’s key Asian markets slowed due to sluggish economies as well as due to a move to fourth generation devices, a market that Mediatek is expected to only start supplying later in 2015. |
| Q | | What were some of the Fund’s best-performing individual stocks? |
| A | | The greatest contributors to Fund performance relative to the MSCI® Index during the Reporting Period were Mitsubishi UFJ Financial Group, Novo-Nordisk and BG Group. |
| | Japanese banking group Mitsubishi UFJ Financial Group was the top positive contributor to the Fund’s relative results during the Reporting Period. It performed well on the back of strong results, driven by a gradual recovery in its Japanese business and robust growth in its international businesses, especially in Asia and the U.S. Additionally, Mitsubishi UFJ Financial Group announced increased shareholder distributions via a higher dividend and share buy-backs. |
5
PORTFOLIO RESULTS
| | Danish multinational pharmaceuticals company Novo-Nordisk was a strong positive contributor during the Reporting Period. In January 2015, Novo-Nordisk announced that its sales volumes were up 8% in local currency in the fourth quarter of 2014, with the majority of growth coming from North America. Its stock also responded well to positive Phase II results for its oral diabetes drug GLP-1 in February 2015 and its currently ongoing talks with regulators about potentially initiating Phase III. If realized, many believe Phase III trials would be a major opportunity for Novo-Nordisk, as the oral administration of the drug should appeal to more patients than the use of injections, allowing the company to take market share. (Phase II is when a drug or treatment is given to a larger group of people to see if it is effective and to further evaluate its safety. Phase III is when a drug or treatment is given to large groups of people to confirm its effectiveness, monitor side effects, compare it to commonly used treatments and collect information that will allow the drug or treatment to be used safely.) At the end of March 2015, the company also announced its decision to resubmit new applications for its drugs Tresiba and Ryzodeg for U.S. Food and Drug Administration (“FDA”) approval. The market saw this as positive, as approval would remove the overhang on the company’s stock stemming from the growth uncertainty of the company’s insulin drug portfolio. |
| | Shares of BG Group, a U.K.-listed oil and gas exploration company, rose upon its acceptance of a takeover offer from its larger rival Royal Dutch Shell at a 55% premium. Royal Dutch Shell is particularly interested in BG Group’s oil assets in the promising pre-salt basin off the coast of Brazil as well as its leading franchise in global liquid natural gas production and trading. |
| Q | | Which equity market sectors most significantly affected Fund performance during the Reporting Period? |
| A | | The sectors that detracted most from the Fund’s relative results during the Reporting Period were consumer discretionary, information technology and consumer staples, where stock selection in each weighed most negatively on performance. Having a slightly underweighted allocation to the strongly performing consumer discretionary sector also dampened relative results. |
| | The sectors that contributed most positively to the Fund’s performance relative to the MSCI® Index during the Reporting Period were financials, health care and energy, each due primarily to effective stock selection. |
| Q | | Which countries most affected the Fund’s performance during the Reporting Period? |
| A | | Typically, the Fund’s individual stock holdings will significantly influence the Fund’s performance within a particular country or region relative to the MSCI® Index. This effect may be even more pronounced in a concentrated portfolio or in countries that represent only a modest proportion of the MSCI® Index. |
| | That said, the countries that detracted most from the Fund’s performance during the Reporting Period were Japan, South Korea and Germany, where stock selection and country allocation overall hurt. Effective stock selection in France, Switzerland and the U.K. boosted the Fund’s relative returns most. Having a modestly overweighted allocation to Switzerland also helped, as its equity market outpaced the MSCI® Index during the Reporting Period. |
| Q | | How did the Fund use derivatives and similar instruments during the Reporting Period? |
| A | | During the Reporting Period, we did not use derivatives to hedge positions or as part of an active management strategy. |
| Q | | Did the Fund make any significant purchases or sales during the Reporting Period? |
| A | | We established new Fund positions during the Reporting Period in French global advertising company Publicis Groupe, French banking group Societe Generale and Japanese diversified financing services company ORIX. |
| | We initiated a Fund position in Publicis Groupe during the fourth quarter of 2014. Its stock had been weak earlier in 2014 given concerns around the European economy and the company’s acquisition of U.S. technology company Sapient, which was initially poorly received by the market. We saw it as an opportunity to buy into what we perceived as a steadily growing company with strong cash generation. |
| | We established a Fund position in Societe Generale in the first quarter of 2015. Its stock had been a significant laggard compared to other European banks for more than a year, and its relative valuation appeared attractive to us at 0.8x price/ tangible book value vs. 1.1x for the sector. We believed that concerns around weakness in the bank’s Russian business and continued re-regulation of banks were well priced in already. At the time of purchase, we believed the gradual recovery of the European economy should lead to upgrades to the growth outlook for the bank. |
6
PORTFOLIO RESULTS
| | We purchased a Fund position in ORIX, which provides and operates corporate financing, leasing, real estate related business, principal investment and retail business. We expect return on equity to improve as ORIX rebalances its business portfolio and focuses more on return on net assets. Also, we believe capital gain is likely to be maintained at current levels for the next several years. In addition, we believed at the time of purchase that ORIX had an attractive valuation, which looked undervalued considering anticipated net income growth going forward. |
| | In addition to the sale of Aurizon, already mentioned, we sold the Fund’s positions in Intesa Sanpaolo and Credit Suisse during the Reporting Period. |
| | We exited the Fund’s position in Intesa Sanpaolo, one of the leading banks in Italy, taking profits. While we still like the trends in peripheral European nation banks, such as rising net interest margins on the back of lower funding costs and loss provisions, we thought valuations were getting stretched. Performance of Intesa Sanpaolo was strong in the first quarter of 2015, and we considered it appropriate to sell out and redeploy capital into what we considered to be more attractive investment opportunities elsewhere. |
| | We eliminated the Fund’s position in Swiss bank Credit Suisse toward the end of 2014, as we saw what we believed to be better opportunities elsewhere. We had turned more cautious around new money inflows into Credit Suisse’s private bank, as we believed weakness in emerging markets economies could slow wealth creation. |
| Q | | Were there any notable changes in the Fund’s weightings during the Reporting Period? |
| A | | In this Fund, both sector weightings and country allocations are largely the result of our bottom-up stock selection process rather than any top-down macroeconomic views or regional, country, sector or industry bets. We seek to outpace the MSCI® Index by overweighting stocks that we expect to outperform and underweighting those we think may lag. Consequently, changes in its sector or country weightings are generally the direct result of individual stock selection or of stock appreciation or depreciation. That said, during the Reporting Period, the Fund’s exposure to information technology, health care, consumer staples, materials and consumer discretionary increased relative to the MSCI® |
| | Index during the Reporting Period, while its relative exposure to financials, industrials, energy and telecommunication services decreased. From a country perspective, several changes were made. Among them, the Fund’s exposure to Japan, France and Spain increased relative to the MSCI® Index during the Reporting Period, while its relative exposure to the U.K., Switzerland, Italy and Sweden decreased. |
| Q | | Were there any changes to the Fund’s portfolio management team during the Reporting Period? |
| A | | There were no material changes to the Fund’s portfolio management team during the Reporting Period. |
| Q | | How was the Fund positioned relative to the MSCI® Index at the end of the Reporting Period? |
| A | | At the end of the Reporting Period, the Fund had more exposure to South Korea, France, Spain, Taiwan, Japan and Ireland and less exposure to the U.K., Germany, Australia, Switzerland and Sweden relative to the MSCI® Index. At the end of the Reporting Period, the Fund held neutral positions relative to the MSCI® Index in several countries and had no position at all in several other countries and regions, most notably China, Hong Kong, Italy, the Netherlands and Singapore. |
| | From a sector allocation perspective, the Fund had overweight positions relative to the MSCI® Index in information technology and industrials at the end of the Reporting Period. On the same date, the Fund had underweighted positions compared to the MSCI® Index in financials, telecommunication services and consumer staples and was rather neutrally weighted compared to the MSCI® Index in materials, energy, utilities, consumer discretionary and health care. |
| | As always, we remained focused on individual stock selection, with sector and country positioning being a secondary, closely-monitored effect. |
7
FUND BASICS
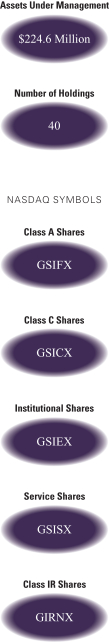
Focused International Equity Fund
as of April 30, 2015
| | | | | | | | | | |
| | PERFORMANCE REVIEW | |
| | | November 1, 2014–April 30, 2015 | | Fund Total Return
(based on NAV)1 | | | MSCI® EAFE Index
(Net, USD, Unhedged)2 | |
| | Class A | | | 5.64 | % | | | 6.81 | % |
| | Class C | | | 5.26 | | | | 6.81 | |
| | Institutional | | | 5.85 | | | | 6.81 | |
| | Service | | | 5.58 | | | | 6.81 | |
| | | Class IR | | | 5.74 | | | | 6.81 | |
| | 1 | | The net asset value (“NAV”) represents the net assets of the class of the Fund (ex-dividend) divided by the total number of shares of the class outstanding. The Fund’s performance assumes the reinvestment of dividends and other distributions. The Fund’s performance does not reflect the deduction of any applicable sales charges. |
| | 2 | | The MSCI® EAFE Index (Net, USD, Unhedged) is a market capitalization-weighted composite of securities in 22 developed markets. The Index approximates the minimum possible dividend reinvestment. The dividend is reinvested after deduction for withholding tax, applying the rate to non- resident individuals who do not benefit from double taxation treaties. MSCI® Barra uses withholding tax rates applicable to Luxembourg holding companies, as Luxembourg applies the highest rates. The Index is unmanaged and the figures for the Index do not include any deduction for fees or expenses. It is not possible to invest directly in an index. |
| | | | | | | | | | | | | | | | | | | | |
| | STANDARDIZED TOTAL RETURNS3 |
| | | For the period ended 3/31/15 | | One Year | | | Five Years | | | Ten Years | | | Since Inception | | | Inception Date |
| | Class A | | | -11.97 | % | | | 3.53 | % | | | 2.27 | % | | | 4.42 | % | | 12/01/92 |
| | Class C | | | -8.49 | | | | 3.92 | | | | 2.09 | | | | 1.73 | | | 8/15/97 |
| | Institutional | | | -6.50 | | | | 5.13 | | | | 3.26 | | | | 4.21 | | | 2/07/96 |
| | Service | | | -6.95 | | | | 4.60 | | | | 2.74 | | | | 4.68 | | | 3/06/96 |
| | | Class IR | | | -6.61 | | | | N/A | | | | N/A | | | | 7.28 | | | 8/31/10 |
| | 3 | | The Standardized Total Returns are average annual total returns as of the most recent calendar quarter-end. They assume reinvestment of all distributions at NAV. These returns reflect a maximum initial sales charge of 5.5% for Class A Shares and the assumed contingent deferred sales charge for Class C Shares (1% if redeemed within 12 months of purchase). Because Institutional, Service and Class IR Shares do not involve a sales charge, such a charge is not applied to their Standardized Total Returns. |
The returns set forth in the tables above represent past performance. Past performance does not guarantee future results. The Fund’s investment return and principal value will fluctuate so that an investor’s shares, when redeemed, may be worth more or less than their original cost. Current performance may be lower or higher than the performance quoted above. Please visit our web site at www.GSAMFUNDS.com to obtain the most recent month-end returns. Performance reflects applicable fee waivers and/or expense limitations in effect during the periods shown. In their absence, performance would be reduced. Returns do not reflect the deduction of taxes that a shareholder would pay on Fund distributions or the redemption of Fund shares.
8
FUND BASICS
| | | | | | | | | | |
| | EXPENSE RATIOS4 | |
| | | | | Net Expense Ratio (Current) | | | Gross Expense Ratio (Before Waivers) | |
| | Class A | | | 1.32 | % | | | 1.63 | % |
| | Class C | | | 2.07 | | | | 2.38 | |
| | Institutional | | | 0.92 | | | | 1.23 | |
| | Service | | | 1.42 | | | | 1.73 | |
| | | Class IR | | | 1.07 | | | | 1.38 | |
| | 4 | | The expense ratios of the Fund, both current (net of applicable fee waivers and/or expense limitations) and before waivers (gross of applicable fee waivers and/or expense limitations) are as set forth above according to the most recent publicly available Prospectus for the Fund and may differ from the expense ratios disclosed in the Financial Highlights in this report. Pursuant to a contractual arrangement, the Fund’s waivers and/or expense limitations will remain in place through at least February 29, 2016, and prior to such date the investment adviser may not terminate the arrangements without the approval of the Fund’s Board of Trustees. If these arrangements are discontinued in the future, the expense ratios may change without shareholder approval. |
| | | | | | | | | | |
| | TOP TEN HOLDINGS AS OF 4/30/155 |
| | | Holding | | % of Net Assets | | | Line of Business | | Country |
| | Computershare Ltd. | | | 4.0 | % | | Software & Services | | Australia |
| | Bayer AG (Registered) | | | 4.0 | | | Pharmaceuticals,
Biotechnology & Life Sciences | | Germany |
| | Banco Popular Espanol SA | | | 3.6 | | | Banks | | Spain |
| | Sanofi | | | 3.2 | | | Pharmaceuticals,
Biotechnology & Life Sciences | | France |
| | Publicis Groupe SA | | | 3.2 | | | Media | | France |
| | Reckitt Benckiser Group PLC | | | 3.2 | | | Household & Personal
Products | | United Kingdom |
| | Societe Generale SA | | | 3.1 | | | Banks | | France |
| | ORIX Corp. | | | 3.1 | | | Diversified Financials | | Japan |
| | Iberdrola SA | | | 3.1 | | | Utilities | | Spain |
| | | BG Group PLC | | | 3.0 | | | Energy | | United Kingdom |
| | 5 | | The top 10 holdings may not be representative of the Fund’s future investments. |
9
FUND BASICS
|
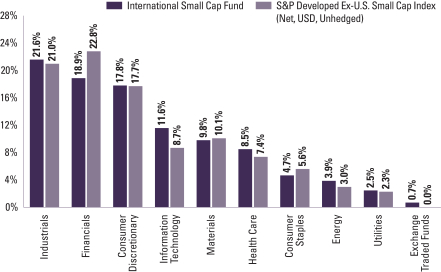
| FUND VS. BENCHMARK SECTOR ALLOCATIONS6 |
| As of April 30, 2015 |
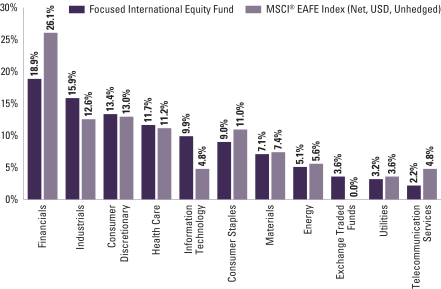
| | 6 | | The Fund is actively managed and, as such, its composition may differ over time. Consequently, the Fund’s overall sector allocations may differ from percentages contained in the graph above. The graph categorizes investments using Global Industry Classification Standard (“GICS”), however, the sector classifications used by the portfolio management team may differ from GICS. Underlying sector allocations of exchange traded funds held by the Fund are not reflected in the graph above. The percentage shown for each investment category reflects the value of investments in that category as a percentage of market value. The graph depicts the Fund’s investments but may not represent the Fund’s market exposure due to the exclusion of certain derivatives, if any, as listed in the Additional Investment Information section of the Schedule of Investments. |
10
PORTFOLIO RESULTS
Goldman Sachs International Small Cap Fund
Investment Objective
The Fund seeks long-term capital appreciation.
Portfolio Management Discussion and Analysis
Below, the Goldman Sachs Global Equity Team discusses the Goldman Sachs International Small Cap Fund’s (the “Fund”) performance and positioning for the six-month period ended April 30, 2015 (the “Reporting Period”).
| Q | | How did the Fund perform during the Reporting Period? |
| A | | During the Reporting Period, the Fund’s Class A, C, Institutional, Service and IR Shares generated cumulative total returns, without sales charges, of 7.96%, 7.59%, 8.19%, 7.95% and 8.13%, respectively. These returns compare to the 9.60% cumulative total return of the Fund’s benchmark, the Standard and Poor’s (S&P) Developed Ex-U.S. Small Cap Index (Net, USD, Unhedged) (the “S&P Index”), during the same period. |
| Q | | What key factors were responsible for the Fund’s performance during the Reporting Period? |
| A | | The Fund generated solid absolute gains, but its underperformance to the S&P Index during the Reporting Period can be primarily attributed to individual stock selection. Sector and country allocation also detracted. |
| Q | | Which stocks detracted significantly from the Fund’s performance during the Reporting Period? |
| A | | The biggest detractors from Fund performance relative to the S&P Index during the Reporting Period were Brocolli, Aryzta and En-Japan. |
| | Brocolli, a Japanese manufacturer of character-themed goods, such as trading card games, books, CDs and stationery items, detracted most from the Fund’s relative results during the Reporting Period. Its stock underperformed the S&P Index due mainly to a connection issue on a new network game that was launched in December 2014. Investors had expected the launch of the new smartphone game to be a catalyst for rapid earnings growth in the next fiscal year. However, given the technical glitch, the number of downloads was not increasing. We decided to sell the Fund’s position in Brocolli by the end of the Reporting Period. |
| | Aryzta, a Swiss-based global specialty bakery supplier, also detracted from the Fund’s relative performance during the Reporting Period. The company reported a disappointing set of fourth quarter 2014 results, highlighting an unexpected drop in performance in the U.S. Furthermore, the stock suffered when the company announced a poorly-received acquisition at the end of March 2015. |
| | En-Japan is a Japan-based Internet-based recruiting solutions provider. Its underperformance to the S&P Index during the Reporting Period can be attributed back to the first quarter of 2014 when the company formally announced a downward revision of its earnings forecast for its fiscal year 2014 due to a 360 million Japanese yen charge for the planned closure of its existing new graduate recruitment website and planned migration into a new service. The company saw a period of better performance between May and September 2014, but its stock underperformed again in the last quarter of 2014 due to profit taking sell offs after its outperformance since May 2014. We sold the Fund’s position in En-Japan by the end of the Reporting Period. |
| Q | | What were some of the Fund’s best-performing individual stocks? |
| A | | The greatest contributors to Fund performance relative to the S&P Index during the Reporting Period were Gategroup Holding, OCI Materials and Disco. |
| | Gategroup Holding, a Swiss-based global airline catering company, was the greatest positive contributor to the Fund’s relative performance during the Reporting Period. The company benefited from lower oil prices, which, in turn, stimulated airline volumes. Additionally, activist shareholders began to try to increase the company’s focus on cost control and the emerging market growth opportunity, which may provide an added catalyst in the future. At the end of the Reporting Period, we continued to like the stock and believe the company has room for improved top-line, or |
11
PORTFOLIO RESULTS
| | revenue, growth as airlines become less focused on reducing food content as part of their service. |
| | South Korean-based materials manufacturer OCI Materials was also a strong contributor to the Fund’s relative results. OCI Materials’ products are used in the manufacturing process of semiconductors, thin film transistor liquid crystal displays (“TFT-LCD”) and solar cells and film deposition. With approximately 50% exposure each to the semiconductor and LCD industries, as measured by client mix, both businesses have been showing strong order flows — increasingly so from the semiconductor industry. In our view, incremental volume increases may come from potential capacity expansion within OCI Materials, which we believe likely, as talks with major clients indicate there may be an industry-wide supply shortage in the next six to 12 months without any immediate capital expenditure decisions. |
| | Disco is a Japanese manufacturer of abrasive and precision industrial machinery for cutting and grinding. Its stock price rose, as analysts revised their forecasts up incorporating potential margin improvement with a favorable currency effect. In addition, new orders for dicing machines were expected to bottom out from the first calendar quarter, led by strong high-end smartphone demand. |
| Q | | Which equity market sectors most significantly affected Fund performance during the Reporting Period? |
| A | | The biggest detractors from the Fund’s relative results during the Reporting Period were financials, consumer discretionary and utilities, where stock selection overall hurt relative performance. The sectors that contributed most to the Fund’s performance relative to the S&P Index were industrials, information technology and energy, due primarily to effective stock selection in each. |
| Q | | Which countries most affected the Fund’s performance during the Reporting Period? |
| A | | Typically, the Fund’s individual stock holdings will significantly influence the Fund’s performance within a particular country or region relative to the S&P Index. This effect may be even more pronounced in countries that represent only a modest proportion of the S&P Index. |
| | That said, the Fund’s stock selection in South Korea and China detracted most from the Fund’s performance during the Reporting Period. Both stock selection and having an underweighted allocation to the strongly performing Hong Kong equity market also hurt performance. Conversely, the countries that contributed most positively to the Fund’s performance during the Reporting Period were Japan, Australia and Switzerland, where stock selection proved particularly effective. |
| Q | | How did the Fund use derivatives and similar instruments during the Reporting Period? |
| A | | During the Reporting Period, we did not use derivatives to hedge positions or as part of an active management strategy, but we used index futures on an opportunistic basis to ensure the portfolio remained almost fully exposed to equities following cash inflows or stock sales. |
| Q | | Did the Fund make any significant purchases or sales during the Reporting Period? |
| A | | We established Fund positions in Otsuka, GMO Internet and PSP Swiss Property during the Reporting Period. |
| | We initiated a Fund position in Otsuka, a Japan-based large information technology service company that sells software and hardware to mid- and small-sized companies. We believe Otsuka should continue to be stable in the system integration business segment because the industry has a high barrier to entry. Without selling larger numbers of software packages, the system integration business has faced challenges. First, its pricing has been declining due to severe deflation in Japan. Second, its results are related to capital expenditure of its customers, so there is still a cyclicality, though less than that for large companies. Also, we expect Otsuka’s core businesses, such as hardware supply and service, to continue to grow going forward. |
| | We established a Fund position in GMO Internet, a Japanese company that provides whole Internet-related services to customers. The company offers domain, server, Internet security and settlement services through its web infrastructure and e-commerce business segments. We expect to see earnings recover in its fiscal year 2015 based on an increase of commercial transactions via the Internet. GMO Internet’s share price had underperformed in 2014, and in our view, its valuation was attractive at the time of purchase. |
| | We bought shares of PSP Swiss Property, a real estate company that owns commercial buildings in Switzerland, primarily in Zurich and Geneva, and generates revenue by collecting rent on these buildings. Its stock, in our view, has an attractive dividend yield of almost 4%, especially compared to the Swiss 10-year bond at a yield of less than 0.2%. With European quantitative easing getting underway |
12
PORTFOLIO RESULTS
| | and the very low interest rate environment that persists, we believe PSP Swiss Property is well positioned to benefit from investor demand for yield. We also believe it offers attractive upside potential. |
| | In addition to those sales mentioned earlier, we eliminated the Fund’s positions in M3, Unite Group and Seiko Holdings during the Reporting Period. |
| | We eliminated the Fund’s position in M3, a Japanese supplier of medical information services for doctors through the Internet. In addition to top-line growth, growth expectations for both new business in Japan and overseas sales pushed its share price higher. Indeed, its share price doubled since December 2013 and thus we decided to sell out of the position, taking profits. |
| | We sold the Fund’s position in Unite Group, the largest student housing operator in the U.K. We had bought its stock, as the student housing sector was undersupplied, which was leading to high rental growth. The thesis subsequently played out, and the stock performed well. At the time of sale, we felt the supply in the student housing sector had picked up, and while we believed Unite Group is still a good business, we felt such sentiment was being reflected in its then-current stock price and thus the upside potential in its stock price may be limited. |
| | Seiko Holdings designs, manufactures and sells electronic devices, watches and clocks in Japan and overseas. Its stock price rose on investors’ expectations for the company to benefit from increasing consumption of inbound tourism as well as on its attractive valuation. In addition, the company has grown sales of watches in both domestic and overseas markets as a result of its efforts to reinforce its brand power, which led to improving profitability. We sold the Fund’s position in Seiko Holdings, taking profits. |
| Q | | Were there any notable changes in the Fund’s weightings during the Reporting Period? |
| A | | In this Fund, both sector weightings and country allocations are largely the result of our bottom-up stock selection process rather than any top-down macroeconomic views or industry bets. We seek to outpace the S&P Index by overweighting stocks that we expect to outperform and underweighting those we think may lag. Consequently, changes in its sector or country weightings are generally the direct result of individual stock selection or of stock appreciation or depreciation. That said, during the Reporting Period, the Fund’s exposure to industrials, consumer discretionary and information technology increased relative to the S&P Index during the Reporting Period, while its relative exposure to financials, materials, health care and telecommunication services decreased. From a country perspective, among the changes made during the Reporting Period were the Fund’s increased exposure to France relative to the S&P Index during the Reporting Period and its decreased relative exposure to the U.K. and Sweden. |
| Q | | Were there any changes to the Fund’s portfolio management team during the Reporting Period? |
| A | | During the Reporting Period, Aidan Farrell, managing director and lead portfolio manager of the Fund left the firm. Gaurav Rege, former co-lead portfolio manager, was named lead portfolio manager of the Fund. |
| Q | | How was the Fund positioned relative to the S&P Index at the end of the Reporting Period? |
| A | | At the end of the Reporting Period, the Fund had more exposure to the U.K., China, Taiwan, Portugal and Italy and less exposure to Sweden, Germany, Spain and France relative to the S&P Index. At the end of the Reporting Period, the Fund held neutral positions relative to the S&P Index in several countries, most notably Japan and Canada, and had no position at all in several other countries and regions, most notably Hong Kong. |
| | From a sector allocation perspective, the Fund had an overweighted position relative to the S&P Index in information technology at the end of the Reporting Period. On the same date, the Fund had underweighted positions compared to the S&P Index in financials and consumer staples and was rather neutrally weighted relative to the S&P Index in health care, energy, utilities, materials, industrials and consumer discretionary. The Fund had no exposure to the telecommunication services sector at the end of the Reporting Period. |
| | As always, we remained focused on individual stock selection, with sector and country positioning being a secondary, closely-monitored effect. |
13
FUND BASICS
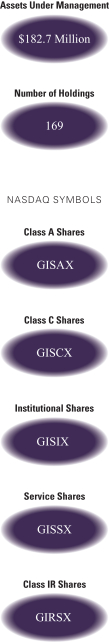
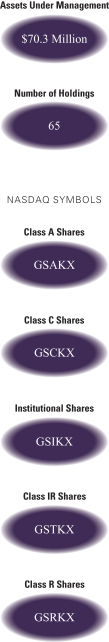
International Small Cap Fund
as of April 30, 2015
| | | | | | | | | | |
| | PERFORMANCE REVIEW | |
| | | November 1, 2014–April 30, 2015 | | Fund Total Return
(based on NAV)1 | | | S&P Developed
Ex-U.S. Small Cap
Index (Net, USD, Unhedged)2 | |
| | Class A | | | 7.96 | % | | | 9.60 | % |
| | Class C | | | 7.59 | | | | 9.60 | |
| | Institutional | | | 8.19 | | | | 9.60 | |
| | Service | | | 7.95 | | | | 9.60 | |
| | | Class IR | | | 8.13 | | | | 9.60 | |
| | 1 | | The net asset value (“NAV”) represents the net assets of the class of the Fund (ex-dividend) divided by the total number of shares of the class outstanding. The Fund’s performance assumes the reinvestment of dividends and other distributions. The Fund’s performance does not reflect the deduction of any applicable sales charges. |
| | 2 | | The S&P Developed Ex-U.S. Small Cap Index (Net, USD, Unhedged) is the small capitalization stock component of the S&P Developed Broad Market Index (BMI). The BMI is a float-weighted index that spans 22 countries (inclusive of the US) and includes the listed shares of all companies with an available market capitalization (float) of at least $100 million at the annual rebalance. At rebalance, companies are deleted from the index if their float falls below $75 million. The Small Cap Ex-U.S. is defined as those stocks falling in the bottom 15% of the cumulative available capital in each country. The Index reflects returns net of withholding taxes applied to foreign investors, calculated daily based on tax rates that would be applied to a Luxembourg-based investor. The Index is unmanaged and the figures for the Index do not include any deduction for fees or expenses. It is not possible to invest directly in an index. |
| | | | | | | | | | | | | | | | | | | | | | |
| | STANDARDIZED TOTAL RETURNS3 | |
| | | For the period ended 3/31/15 | | One Year | | | Five Years | | | Ten Years | | | Since Inception | | | Inception Date | |
| | Class A | | | -7.77 | % | | | 8.31 | % | | | 4.13 | % | | | 5.64 | % | | | 5/01/98 | |
| | Class C | | | -4.11 | | | | 8.72 | | | | 3.95 | | | | 5.31 | | | | 5/01/98 | |
| | Institutional | | | -2.03 | | | | 10.01 | | | | 5.17 | | | | 6.52 | | | | 5/01/98 | |
| | Service | | | -2.50 | | | | 9.44 | | | | 4.62 | | | | 5.97 | | | | 5/01/98 | |
| | | Class IR | | | -2.20 | | | | N/A | | | | N/A | | | | 11.88 | | | | 8/31/10 | |
| | 3 | | The Standardized Total Returns are average annual total returns as of the most recent calendar quarter-end. They assume reinvestment of all distributions at NAV. These returns reflect a maximum initial sales charge of 5.5% for Class A Shares and the assumed contingent deferred sales charge for Class C Shares (1% if redeemed within 12 months of purchase). Because Institutional, Service and Class IR Shares do not involve a sales charge, such a charge is not applied to their Standardized Total Returns. |
The returns set forth in the tables above represent past performance. Past performance does not guarantee future results. The Fund’s investment return and principal value will fluctuate so that an investor’s shares, when redeemed, may be worth more or less than their original cost. Current performance may be lower or higher than the performance quoted above. Please visit our web site at www.GSAMFUNDS.com to obtain the most recent month-end returns. Performance reflects applicable fee waivers and/or expense limitations in effect during the periods shown. In their absence, performance would be reduced. Returns do not reflect the deduction of taxes that a shareholder would pay on Fund distributions or the redemption of Fund shares.
14
FUND BASICS
| | | | | | | | | | |
| | EXPENSE RATIOS4 | |
| | | | | Net Expense Ratio (Current) | | | Gross Expense Ratio (Before Waivers) | |
| | Class A | | | 1.38 | % | | | 1.77 | % |
| | Class C | | | 2.12 | | | | 2.52 | |
| | Institutional | | | 0.97 | | | | 1.37 | |
| | Service | | | 1.47 | | | | 1.86 | |
| | | Class IR | | | 1.09 | | | | 1.52 | |
| | 4 | | The expense ratios of the Fund, both current (net of applicable fee waivers and/or expense limitations) and before waivers (gross of applicable fee waivers and/or expense limitations) are as set forth above according to the most recent publicly available Prospectus for the Fund and may differ from the expense ratios disclosed in the Financial Highlights in this report. Pursuant to a contractual arrangement, the Fund’s waivers and/or expense limitations will remain in place through at least February 29, 2016, and prior to such date the investment adviser may not terminate the arrangements without the approval of the Fund’s Board of Trustees. If these arrangements are discontinued in the future, the expense ratios may change without shareholder approval. |
| | | | | | | | | | |
| | TOP TEN HOLDINGS AS OF 4/30/155 |
| | | Holding | | % of Net Assets | | | Line of Business | | Country |
| | Inchcape PLC | | | 1.4 | % | | Retailing | | United Kingdom |
| | Actelion Ltd. (Registered) | | | 1.3 | | | Pharmaceuticals,
Biotechnology & Life Sciences | | Switzerland |
| | Julius Baer Group Ltd. | | | 1.3 | | | Diversified Financials | | Switzerland |
| | Brenntag AG | | | 1.2 | | | Capital Goods | | Germany |
| | Regus PLC | | | 1.2 | | | Commercial &
Professional Services | | Luxembourg |
| | Persimmon PLC | | | 1.2 | | | Consumer Durables &
Apparel | | United Kingdom |
| | Gategroup Holding AG | | | 1.1 | | | Commercial &
Professional Services | | Switzerland |
| | Big Yellow Group PLC | | | 1.1 | | | Real Estate Investment
Trust | | United Kingdom |
| | GEA Group AG | | | 1.1 | | | Capital Goods | | Germany |
| | | CTT-Correios de Portugal SA | | | 1.1 | | | Transportation | | Portugal |
| | 5 | | The top 10 holdings may not be representative of the Fund’s future investments. |
15
FUND BASICS
|
| FUND VS. BENCHMARK SECTOR ALLOCATIONS6 |
| As of April 30, 2015 |
| | 6 | | The Fund is actively managed and, as such, its composition may differ over time. Consequently, the Fund’s overall sector allocations may differ from percentages contained in the graph above. The graph categorizes investments using Global Industry Classification Standard (“GICS”), however, the sector classifications used by the portfolio management team may differ from GICS. Underlying sector allocations of exchange traded funds held by the Fund are not reflected in the graph above. The percentage shown for each investment category reflects the value of investments in that category as a percentage of market value. The graph depicts the Fund’s investments but may not represent the Fund’s market exposure due to the exclusion of certain derivatives, if any, as listed in the Additional Investment Information section of the Schedule of Investments. |
16
PORTFOLIO RESULTS
Goldman Sachs Strategic International Equity Fund
Investment Objective
The Fund seeks long-term growth of capital.
Portfolio Management Discussion and Analysis
Below, the Goldman Sachs Global Equity Team discusses the Goldman Sachs Strategic International Equity Fund’s (the “Fund”) performance and positioning for the six-month period ended April 30, 2015 (the “Reporting Period”).
| Q | | How did the Fund perform during the Reporting Period? |
| A | | During the Reporting Period, the Fund’s Class A, C, Institutional, IR and R Shares generated cumulative total returns, without sales charges, of 5.26%, 4.87%, 5.52%, 5.44% and 5.11%, respectively. These returns compare to the 6.81% cumulative total return of the Fund’s benchmark, the MSCI® Europe, Australasia, Far East (EAFE) Index (Net, USD, Unhedged) (the “MSCI® Index”), during the same period. |
| Q | | What key factors were responsible for the Fund’s performance during the Reporting Period? |
| A | | The Fund generated solid absolute gains, but its underperformance to the MSCI® Index during the Reporting Period can be primarily attributed to individual stock selection. Sector and country allocation also detracted. |
| Q | | Which stocks detracted significantly from the Fund’s performance during the Reporting Period? |
| A | | Among the biggest detractors from Fund performance relative to the MSCI® Index during the Reporting Period were Drax Group, Magnit and Total. |
| | Drax Group, a British utilities company, detracted most from the Fund’s relative returns during the Reporting Period. The company’s poor performance can be attributed largely to the negative impact of falling oil prices on the U.K. power price. We sold the Fund’s position in the stock by the end of the Reporting Period. |
| | Magnit, the largest food retailer in Russia, detracted from the Fund’s relative returns during the Reporting Period. The European and U.S. sanctions on Russia — as well as the drop in oil prices — pushed the Russian economy into recession. |
| | The company reported solid results for the fourth quarter of 2014 but was dragged lower by these geopolitical factors and by the sharp fall in the ruble. Still, as the dominant player within the food retail industry in Russia, we believe Magnit can benefit from current weakness by gaining market share using its scale to source cheaper products and by continuing to grow its store footprint. |
| | French integrated oil company Total detracted from the Fund’s relative performance. Total’s share price decline can be tied to oil prices, which fell dramatically during the Reporting Period. At the end of the Reporting Period, Total remained our top pick amongst large global integrated oil companies given what we consider to be its attractive valuation, near-years production growth, falling capital expenditure profile and cost cutting measures — along with low expectations for the company seemingly embedded in consensus estimates. |
| Q | | What were some of the Fund’s best-performing individual stocks? |
| A | | The greatest contributors to Fund performance relative to the MSCI® Index during the Reporting Period were Mitsubishi UFJ Financial Group, Pola Orbis Holding and Just Eat. |
| | Japanese banking group Mitsubishi UFJ Financial Group was the top positive contributor to the Fund’s relative results during the Reporting Period. It performed strongly on the back of strong results, driven by a gradual recovery in its Japanese business and strong growth in its international businesses, especially in Asia and the U.S. Additionally, Mitsubishi UFJ Financial Group announced increased |
17
PORTFOLIO RESULTS
| | shareholder distributions via a higher dividend and share buy-backs. |
| | Japanese consumer goods company Pola Orbis Holding was another top contributor to the Fund’s relative results during the Reporting Period. Pola Orbis Holding reported strong fourth quarter 2014 domestic sales and showed resilient sales in China, its other key market. The market also seemed to like the company’s focus on shareholder returns with a high dividend pay-out ratio and a return on equity target that is gradually rising towards 8%. |
| | Just Eat, a U.K.-based online marketplace for restaurant delivery and a new purchase for the Fund during the Reporting Period, was a strong positive contributor during the Reporting Period. The company continued to take market share in its biggest market, i.e. the U.K., and also grew in smaller markets, such as Canada, France, Spain and Italy. Additionally, the company announced good fourth quarter 2014 results with growth ahead of consensus expectations. At the end of the Reporting Period, we continued to like the growth potential and strong positioning of Just Eat. We took advantage of a recent placing by private equity to increase the Fund’s position in the stock. |
| Q | | Which equity market sectors most significantly affected Fund performance during the Reporting Period? |
| A | | The biggest detractors from the Fund’s results during the Reporting Period were consumer discretionary, information technology and utilities, where weak stock selection hurt most. Having an underweighted allocation to consumer discretionary, which outpaced the MSCI® Index during the Reporting Period, also dampened results. |
| | The sectors that contributed most to the Fund’s performance relative to the MSCI® Index were financials, health care and consumer staples. Stock selection in all three sectors proved effective during the Reporting Period. |
| Q | | Which countries most affected the Fund’s performance during the Reporting Period? |
| A | | Typically, the Fund’s individual stock holdings will significantly influence the Fund’s performance within a particular country or region relative to the MSCI® Index. This effect may be even more pronounced in countries that represent only a modest proportion of the MSCI® Index. |
| | That said, the countries that detracted most from the Fund’s relative performance were Spain, Russia and South Korea. Stock selection overall in Spain proved disappointing. Having exposure to Russia and South Korea, each of which are not components of the MSCI® Index and each of which underperformed the MSCI® Index, also hurt. Conversely, effective individual stock selection in Switzerland and Italy contributed most positively to the Fund’s results relative to the MSCI® Index. Having an underweighted allocation to Australia, which underperformed the MSCI® Index, also boosted the Fund’s relative results. |
| Q | | How did the Fund use derivatives and similar instruments during the Reporting Period? |
| A | | During the Reporting Period, we did not use derivatives to hedge positions or as part of an active management strategy. |
| Q | | Did the Fund make any significant purchases or sales during the Reporting Period? |
| A | | During the Reporting Period, we purchased Fund positions in French banking group Societe Generale, U.K. insurer Aviva and Irish specialty pharmaceuticals company Shire. |
| | We established a Fund position in Societe Generale in the first quarter of 2015. Its stock had been a significant laggard compared to other European banks for more than a year, and its relative valuation appeared attractive to us at 0.8x price/ tangible book value vs. 1.1x for the sector. We believed that concerns around weakness in the bank’s Russian business and around continued re-regulation of banks were well priced in already. At the time of purchase, we believed the gradual recovery of the European economy would lead to upgrades to the growth outlook for the bank. |
| | We initiated a Fund position in Aviva, as its share price weakened at the end of 2014 when the company announced its acquisition of Friends Life, one of its competitors. We think the market misjudged the deal. We believe the deal should allow Aviva to generate cost synergies and improve its cash flow going forward. |
| | We purchased a Fund position in Shire during the Reporting Period, and the company proved to be a strong performer during the Reporting Period, as the stock recovered from a sharp decline in share price in October 2014 when pharmaceuticals company Abbvie decided to pull its offer to buy the company. We had taken advantage of the sell-off to re-initiate a position, as we believed the company had once again become undervalued. (We had sold the Fund’s position |
18
PORTFOLIO RESULTS
| | in Shire in July 2014 after the agreed takeover offer by Abbvie.) Shire performed well during the Reporting Period, as it reported strong fourth quarter 2014 earnings, confirming the resilience of its existing business. Additionally, the company announced in January 2015 its acquisition of NPS Pharmaceutical, which added two assets that complemented Shire’s orphan drug business. (An orphan drug is a pharmaceutical agent that has been developed specifically to treat a rare medical condition, the condition itself being referred to as an orphan disease. The assignment of orphan status to a disease and to any drugs developed to treat it is a matter of public policy in many countries. |
| | In addition to the sales already mentioned, we sold out of the Fund’s positions in Aurizon Holdings, LM Ericsson Telefon and Credit Saison during the Reporting Period. |
| | Aurizon Holdings, an Australian railroad operator to the mining industry, performed poorly, as the slowing Chinese economy raised concerns that commodities freight volumes may come under pressure despite the long-term nature of the company’s contracts with its mining customers. We sold the Fund’s position in Aurizon Holdings by the end of the Reporting Period. |
| | We sold the Fund’s position in LM Ericsson Telefon, a Swedish communication networks manufacturer, because we are concerned that the end of the mobile network fourth generation upgrade cycle in the U.S. may not be offset by the continuation of this upgrade cycle in Europe and emerging market nations, which are lower margin geographies than the U.S. |
| | We eliminated the Fund’s position in Credit Saison, a Japanese consumer finance company, because we believe an increase in repayment of excessive interest charged in previous years and an increase in costs to upgrade its information technology systems will likely hurt its earnings in the next few quarters despite an acceleration of its top line, or revenue, growth. |
| Q | | Were there any notable changes in the Fund’s weightings during the Reporting Period? |
| A | | In this Fund, both sector weightings and country allocations are largely the result of our bottom-up stock selection process rather than any top-down macroeconomic views or regional, country, sector or industry bets. We seek to outpace the MSCI® Index by overweighting stocks that we expect to outperform and underweighting those we think may lag. Consequently, changes in its sector or country weightings are generally the direct result of individual stock selection or of stock appreciation or depreciation. That said, during the Reporting Period, the Fund’s exposure to consumer discretionary increased relative to the MSCI® Index during the Reporting Period, while its relative exposure to financials and materials decreased. From a country perspective, the Fund’s exposure to the U.K. increased relative to the MSCI® Index during the Reporting Period, while its relative exposure to Italy decreased. |
| Q | | Were there any changes to the Fund’s portfolio management team during the Reporting Period? |
| A | | There were no material changes to the Fund’s portfolio management team during the Reporting Period. |
| Q | | How was the Fund positioned relative to the MSCI® Index at the end of the Reporting Period? |
| A | | At the end of the Reporting Period, the Fund had more exposure to Belgium, South Korea, Ireland, Switzerland, Taiwan and Sweden relative to the MSCI® Index and less exposure to the U.K., Australia, Italy and the Netherlands relative to the MSCI® Index. At the end of the Reporting Period, the Fund held neutral positions relative to the MSCI® Index in several countries, most notably Japan and France, and had no position at all in several other countries and regions, most notably Hong Kong. |
| | From a sector allocation perspective, the Fund had overweight positions relative to the MSCI® Index in consumer staples and information technology at the end of the Reporting Period. On the same date, the Fund had underweighted positions compared to the MSCI® Index in consumer discretionary, financials, materials, industrials, utilities and health care and rather neutral positions relative to the MSCI® Index in energy and telecommunication services. |
| | As always, we remained focused on individual stock selection, with sector and country positioning being a secondary, closely-monitored effect. |
19
FUND BASICS
Strategic International Equity Fund
as of April 30, 2015
| | | | | | | | | | |
| | PERFORMANCE REVIEW | |
| | | November 1, 2014–April 30, 2015 | | Fund Total Return (based on NAV)1 | | | MSCI® EAFE Index (Net, USD, Unhedged)2 | |
| | Class A | | | 5.26 | % | | | 6.81 | % |
| | Class C | | | 4.87 | | | | 6.81 | |
| | Institutional | | | 5.52 | | | | 6.81 | |
| | Class IR | | | 5.44 | | | | 6.81 | |
| | | Class R | | | 5.11 | | | | 6.81 | |
| | 1 | | The net asset value (“NAV”) represents the net assets of the class of the Fund (ex-dividend) divided by the total number of shares of the class outstanding. The Fund’s performance assumes the reinvestment of dividends and other distributions. The Fund’s performance does not reflect the deduction of any applicable sales charges. |
| | 2 | | The MSCI® EAFE Index (Net, USD, Unhedged) is a market capitalization-weighted composite of securities in 22 developed markets. The Index approximates the minimum possible dividend reinvestment. The dividend is reinvested after deduction for withholding tax, applying the rate to non- resident individuals who do not benefit from double taxation treaties. MSCI® Barra uses withholding tax rates applicable to Luxembourg holding companies, as Luxembourg applies the highest rates. The Index is unmanaged and the figures for the Index do not include any deduction for fees or expenses. It is not possible to invest directly in an index. |
| | | | | | | | | | | | | | | | |
| | STANDARDIZED TOTAL RETURNS3 |
| | | For the period ended 3/31/15 | | One Year | | | Five Years | | | Since Inception | | | Inception Date |
| | Class A | | | -7.46 | % | | | 4.52 | % | | | -1.05 | % | | 6/25/07 |
| | Class C | | | -3.75 | | | | 4.92 | | | | -1.07 | | | 6/25/07 |
| | Institutional | | | -1.71 | | | | 6.11 | | | | 0.05 | | | 6/25/07 |
| | Class IR | | | -1.87 | | | | 6.06 | | | | -1.04 | | | 11/30/07 |
| | | Class R | | | -2.37 | | | | 5.44 | | | | -1.60 | | | 11/30/07 |
| | 3 | | The Standardized Total Returns are average annual total returns as of the most recent calendar quarter-end. They assume reinvestment of all distributions at NAV. These returns reflect a maximum initial sales charge of 5.5% for Class A Shares and the assumed contingent deferred sales charge for Class C Shares (1% if redeemed within 12 months of purchase). Because Institutional, Class IR and Class R Shares do not involve a sales charge, such a charge is not applied to their Standardized Total Returns. |
The returns set forth in the tables above represent past performance. Past performance does not guarantee future results. The Fund’s investment return and principal value will fluctuate so that an investor’s shares, when redeemed, may be worth more or less than their original cost. Current performance may be lower or higher than the performance quoted above. Please visit our web site at www.GSAMFUNDS.com to obtain the most recent month-end returns. Performance reflects applicable fee waivers and/or expense limitations in effect during the periods shown. In their absence, performance would be reduced. Returns do not reflect the deduction of taxes that a shareholder would pay on Fund distributions or the redemption of Fund shares.
20
FUND BASICS
| | | | | | | | |
| | EXPENSE RATIOS4 | |
| | | | | Net Expense Ratio (Current) | | Gross Expense Ratio (Before Waivers) | |
| | Class A | | 1.35% | | | 1.79 | % |
| | Class C | | 2.10 | | | 2.54 | |
| | Institutional | | 0.95 | | | 1.39 | |
| | Class IR | | 1.09 | | | 1.54 | |
| | | Class R | | 1.60 | | | 2.04 | |
| | 4 | | The expense ratios of the Fund, both current (net of applicable fee waivers and/or expense limitations) and before waivers (gross of applicable fee waivers and/or expense limitations) are as set forth above according to the most recent publicly available Prospectus for the Fund and may differ from the expense ratios disclosed in the Financial Highlights in this report. Pursuant to a contractual arrangement, the Fund’s waivers and/or expense limitations will remain in place through at least February 29, 2016, and prior to such date the investment adviser may not terminate the arrangements without the approval of the Fund’s Board of Trustees. If these arrangements are discontinued in the future, the expense ratios may change without shareholder approval. |
| | | | | | | | | | |
| | TOP TEN HOLDINGS AS OF 4/30/155 |
| | | Holding | | % of Net Assets | | | Line of Business | | Country |
| | iShares MSCI Japan Fund | | | 4.8 | % | | Exchange Traded Fund | | United States |
| | Novartis AG (Registered) | | | 3.1 | | | Pharmaceuticals, Biotechnology & Life Sciences | | Switzerland |
| | Anheuser-Busch InBev NV | | | 2.8 | | | Food, Beverage & Tobacco | | Belgium |
| | Vodafone Group PLC | | | 2.8 | | | Telecommunication Services | | United Kingdom |
| | Nidec Corp. | | | 2.2 | | | Capital Goods | | Japan |
| | Mitsubishi UFJ Financial Group, Inc. | | | 2.2 | | | Banks | | Japan |
| | Beiersdorf AG | | | 2.2 | | | Household & Personal Products | | Germany |
| | UBS Group AG | | | 2.2 | | | Diversified Financials | | Switzerland |
| | BG Group PLC | | | 2.0 | | | Energy | | United Kingdom |
| | | Bayer AG (Registered) | | | 2.0 | | | Pharmaceuticals, Biotechnology & Life Sciences | | Germany |
| | 5 | | The top 10 holdings may not be representative of the Fund’s future investments. |
21
FUND BASICS
|
| FUND VS. BENCHMARK SECTOR ALLOCATIONS6 |
| As of April 30, 2015 |
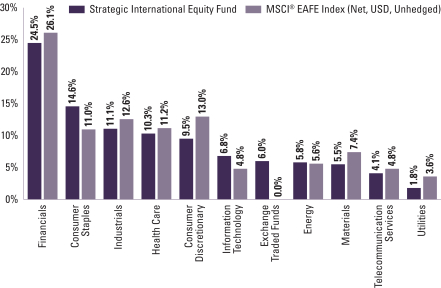
| | 6 | | The Fund is actively managed and, as such, its composition may differ over time. Consequently, the Fund’s overall sector allocations may differ from percentages contained in the graph above. The graph categorizes investments using Global Industry Classification Standard (“GICS”), however, the sector classifications used by the portfolio management team may differ from GICS. Underlying sector allocations of exchange traded funds held by the Fund are not reflected in the graph above. The percentage shown for each investment category reflects the value of investments in that category as a percentage of market value. The graph depicts the Fund’s investments but may not represent the Fund’s market exposure due to the exclusion of certain derivatives, if any, as listed in the Additional Investment Information section of the Schedule of Investments. |
22
GOLDMAN SACHS FOCUSED INTERNATIONAL EQUITY FUND
Schedule of Investments
April 30, 2015 (Unaudited)
| | | | | | | | |
Shares | | | Description | | Value | |
| | Common Stocks – 91.3% | |
| | Australia – 4.0% | |
| | 935,489 | | | Computershare Ltd. (Software & Services) | | $ | 9,074,616 | |
| | |
| | Belgium – 2.1% | |
| | 31,294 | | | Solvay SA (Materials) | | | 4,607,886 | |
| | |
| | Denmark – 2.0% | |
| | 79,772 | | | Novo Nordisk A/S Class B (Pharmaceuticals, Biotechnology & Life Sciences) | | | 4,478,454 | |
| | |
| | France – 13.4% | |
| | 84,501 | | | Publicis Groupe SA (Media) | | | 7,087,147 | |
| | 227,169 | | | Rexel SA (Capital Goods) | | | 4,281,375 | |
| | 62,412 | | | Safran SA (Capital Goods) | | | 4,560,280 | |
| | 70,048 | | | Sanofi (Pharmaceuticals, Biotechnology & Life Sciences) | | | 7,130,221 | |
| | 140,571 | | | Societe Generale SA (Banks) | | | 7,027,805 | |
| | | | | | | | |
| | | | | | | 30,086,828 | |
| | |
| | Germany – 5.9% | |
| | 62,015 | | | Bayer AG (Registered) (Pharmaceuticals, Biotechnology & Life Sciences)* | | | 8,925,980 | |
| | 50,821 | | | Beiersdorf AG (Household & Personal Products) | | | 4,420,701 | |
| | | | | | | | |
| | | | | | | 13,346,681 | |
| | |
| | Ireland – 3.4% | |
| | 821,772 | | | C&C Group PLC (Food, Beverage & Tobacco) | | | 3,329,884 | |
| | 52,957 | | | Shire PLC (Pharmaceuticals, Biotechnology & Life Sciences) | | | 4,303,478 | |
| | | | | | | | |
| | | | | | | 7,633,362 | |
| | |
| | Japan – 22.9% | |
| | 94,900 | | | Dentsu, Inc. (Media) | | | 4,423,735 | |
| | 172,000 | | | Hoya Corp. (Technology Hardware & Equipment) | | | 6,629,034 | |
| | 475,400 | | | Isuzu Motors Ltd. (Automobiles & Components) | | | 6,300,864 | |
| | 294,000 | | | Kubota Corp. (Capital Goods) | | | 4,601,399 | |
| | 676,400 | | | Mitsubishi UFJ Financial Group, Inc. (Banks) | | | 4,805,382 | |
| | 64,000 | | | Nidec Corp. (Capital Goods) | | | 4,787,508 | |
| | 448,700 | | | ORIX Corp. (Diversified Financials) | | | 6,900,289 | |
| | 85,700 | | | Pola Orbis Holdings, Inc. (Household & Personal Products) | | | 4,446,657 | |
| | 1,193,000 | | | Sumitomo Osaka Cement Co. Ltd. (Materials) | | | 3,885,543 | |
| | 634,200 | | | Tokyu Fudosan Holdings Corp. (Real Estate) | | | 4,712,705 | |
| | | | | | | | |
| | | | | | | 51,493,116 | |
| | |
| | Common Stocks – (continued) | |
| | Netherlands – 1.8% | |
| | 127,779 | | | Royal Dutch Shell PLC Class A (Energy) | | $ | 4,028,906 | |
| | |
| | South Korea – 4.7% | |
| | 145,128 | | | Hana Financial Group, Inc. (Banks) | | | 4,271,971 | |
| | 135,136 | | | Kia Motors Corp. (Automobiles & Components) | | | 6,227,312 | |
| | | | | | | | |
| | | | | | | 10,499,283 | |
| | |
| | Spain – 6.6% | |
| | 1,539,600 | | | Banco Popular Espanol SA (Banks) | | | 8,010,626 | |
| | 1,030,847 | | | Iberdrola SA (Utilities) | | | 6,899,758 | |
| | | | | | | | |
| | | | | | | 14,910,384 | |
| | |
| | Sweden – 2.0% | |
| | 326,312 | | | Volvo AB Class B (Capital Goods) | | | 4,508,067 | |
| | |
| | Switzerland – 9.8% | |
| | 19,551 | | | Syngenta AG (Registered) (Materials) | | | 6,542,347 | |
| | 9,831 | | | The Swatch Group AG (Consumer Durables & Apparel) | | | 4,395,001 | |
| | 223,163 | | | UBS Group AG (Diversified Financials)* | | | 4,458,202 | |
| | 110,641 | | | Wolseley PLC (Capital Goods) | | | 6,543,797 | |
| | | | | | | | |
| | | | | | | 21,939,347 | |
| | |
| | Taiwan – 2.4% | |
| | 414,000 | | | MediaTek, Inc. (Semiconductors & Semiconductor Equipment) | | | 5,321,634 | |
| | |
| | United Kingdom – 10.3% | |
| | 373,590 | | | BG Group PLC (Energy) | | | 6,767,042 | |
| | 1,122,838 | | | Melrose Industries PLC (Capital Goods) | | | 4,556,466 | |
| | 79,498 | | | Reckitt Benckiser Group PLC (Household & Personal Products) | | | 7,075,675 | |
| | 1,330,281 | | | Vodafone Group PLC (Telecommunication Services) | | | 4,686,858 | |
| | | | | | | | |
| | | | | | | 23,086,041 | |
| | |
| | TOTAL COMMON STOCKS | |
| | (Cost $212,037,271) | | $ | 205,014,605 | |
| | |
| | | | | | | | |
| | |
| The accompanying notes are an integral part of these financial statements. | | 23 |
GOLDMAN SACHS FOCUSED INTERNATIONAL EQUITY FUND
Schedule of Investments (continued)
April 30, 2015 (Unaudited)
| | | | | | | | |
Shares | | | Description | | Value | |
| | Exchange Traded Funds – 3.4% | |
| | United States – 3.4% | |
| | 67,383 | | | iShares MSCI EAFE Fund | | $ | 4,481,644 | |
| | 247,236 | | | iShares MSCI Japan Fund | | | 3,179,455 | |
| | |
| | TOTAL EXCHANGE TRADED FUNDS | |
| | (Cost $7,532,113) | | $ | 7,661,099 | |
| | |
| | TOTAL INVESTMENTS – 94.7% | | | | |
| | (Cost $219,569,384) | | $ | 212,675,704 | |
| | |
| OTHER ASSETS IN EXCESS OF
LIABILITIES – 5.3% | | | 11,900,702 | |
| | |
| | NET ASSETS – 100.0% | | $ | 224,576,406 | |
| | |
| | |
| The percentage shown for each investment category reflects the value of investments in that category as a percentage of net assets. |
* | | Non-income producing security. |
| | |
| 24 | | The accompanying notes are an integral part of these financial statements. |
GOLDMAN SACHS INTERNATIONAL SMALL CAP FUND
Schedule of Investments
April 30, 2015 (Unaudited)
| | | | | | | | |
Shares | | | Description | | Value | |
| | Common Stocks – 94.9% | |
| | Australia – 5.0% | |
| | 379,124 | | | Aveo Group (Real Estate) | | $ | 826,932 | |
| | 25,876 | | | Caltex Australia Ltd. (Energy) | | | 721,678 | |
| | 156,296 | | | Computershare Ltd. (Software & Services) | | | 1,516,133 | |
| | 378,543 | | | Echo Entertainment Group Ltd. (Consumer Services) | | | 1,351,610 | |
| | 86,728 | | | GrainCorp Ltd. Class A (Food, Beverage & Tobacco) | | | 676,086 | |
| | 342,194 | | | Macquarie Atlas Roads Group (Transportation) | | | 877,291 | |
| | 141,185 | | | Navitas Ltd. (Consumer Services) | | | 513,836 | |
| | 57,298 | | | Seek Ltd. (Commercial & Professional Services) | | | 732,880 | |
| | 120,732 | | | Super Retail Group Ltd. (Retailing) | | | 939,830 | |
| | 165,941 | | | Treasury Wine Estates Ltd. (Food, Beverage & Tobacco) | | | 727,778 | |
| | 173,472 | | | Veda Group Ltd. (Commercial & Professional Services) | | | 313,046 | |
| | | | | | | | |
| | | | | | | 9,197,100 | |
| | |
| | Belgium – 0.6% | |
| | 31,563 | | | bpost SA (Transportation) | | | 905,180 | |
| | 929 | | | Cie d’Entreprises CFE (Capital Goods) | | | 100,517 | |
| | 40,230 | | | Rezidor Hotel Group AB (Consumer Services) | | | 171,379 | |
| | | | | | | | |
| | | | | | | 1,177,076 | |
| | |
| | Canada – 7.7% | |
| | 36,376 | | | Aimia, Inc. (Media) | | | 404,010 | |
| | 109,587 | | | Alamos Gold, Inc. (Materials) | | | 757,526 | |
| | 18,374 | | | Algonquin Power & Utilities Corp. (Utilities) | | | 149,703 | |
| | 11,838 | | | Amaya, Inc. (Consumer Services)* | | | 276,989 | |
| | 255,454 | | | B2Gold Corp. (Materials)* | | | 400,172 | |
| | 3,031 | | | Boardwalk Real Estate Investment Trust (REIT) | | | 152,643 | |
| | 17,730 | | | Bonterra Energy Corp. (Energy) | | | 566,802 | |
| | 16,964 | | | Canadian Solar, Inc. (Semiconductors & Semiconductor Equipment)* | | | 600,526 | |
| | 22,137 | | | Canadian Western Bank (Banks) | | | 575,580 | |
| | 5,510 | | | CCL Industries, Inc. Class B (Materials) | | | 633,479 | |
| | 70,271 | | | Celestica, Inc. (Technology Hardware & Equipment)* | | | 857,929 | |
| | 7,900 | | | Cogeco Cable, Inc. (Media) | | | 452,523 | |
| | 48,041 | | | Element Financial Corp. (Diversified Financials)* | | | 688,860 | |
| | 58,055 | | | Enerflex Ltd. (Energy) | | | 778,558 | |
| | 9,462 | | | FirstService Corp. (Real Estate) | | | 619,402 | |
| | 12,952 | | | Home Capital Group, Inc. (Banks) | | | 511,209 | |
| | 10,103 | | | Laurentian Bank of Canada (Banks) | | | 404,371 | |
| | 3,665 | | | MacDonald Dettwiler & Associates Ltd. (Capital Goods) | | | 290,952 | |
| | 10,655 | | | Maple Leaf Foods, Inc. (Food, Beverage & Tobacco) | | | 204,445 | |
| | 10,564 | | | Methanex Corp. (Materials) | | | 635,766 | |
| | 38,673 | | | Mullen Group Ltd. (Energy) | | | 670,567 | |
| | |
| | Common Stocks – (continued) | |
| | Canada – (continued) | | | | |
| | 27,281 | | | Northland Power, Inc. (Utilities) | | $ | 390,052 | |
| | 11,575 | | | Parkland Fuel Corp. (Energy) | | | 252,702 | |
| | 13,503 | | | Progressive Waste Solutions Ltd. (Commercial & Professional Services) | | | 390,261 | |
| | 9,921 | | | ShawCor Ltd. (Energy) | | | 335,908 | |
| | 24,434 | | | Stantec, Inc. (Commercial & Professional Services) | | | 660,012 | |
| | 98,749 | | | Surge Energy, Inc. (Energy) | | | 359,310 | |
| | 37,203 | | | Veresen, Inc. (Energy) | | | 559,356 | |
| | 16,992 | | | WestJet Airlines Ltd. (Transportation) | | | 384,063 | |
| | | | | | | | |
| | | | | | | 13,963,676 | |
| | |
| | China – 2.4% | |
| | 17,298 | | | Ctrip.com International Ltd. ADR (Retailing)* | | | 1,101,537 | |
| | 21,669 | | | Hollysys Automation Technologies Ltd. (Technology Hardware & Equipment) | | | 476,068 | |
| | 124,400 | | | Livzon Pharmaceutical Group, Inc. Class H (Pharmaceuticals, Biotechnology & Life Sciences) | | | 898,827 | |
| | 236,500 | | | Shanghai Fosun Pharmaceutical Group Co. Ltd. Class H (Pharmaceuticals, Biotechnology & Life Sciences) | | | 900,092 | |
| | 25,326 | | | TAL Education Group ADR (Consumer Services)* | | | 930,730 | |
| | | | | | | | |
| | | | | | | 4,307,254 | |
| | |
| | Denmark – 0.9% | |
| | 73,451 | | | GN Store Nord A/S (Health Care Equipment & Services) | | | 1,585,771 | |
| | |
| | Finland – 0.8% | |
| | 60,541 | | | Amer Sports OYJ (Consumer Durables & Apparel) | | | 1,515,100 | |
| | |
| | France – 6.8% | |
| | 18,496 | | | Cap Gemini SA (Software & Services) | | | 1,647,911 | |
| | 100,040 | | | Coface SA (Diversified Financials)* | | | 1,246,933 | |
| | 13,272 | | | Eramet (Materials)* | | | 1,091,765 | |
| | 15,432 | | | Ingenico (Technology Hardware & Equipment) | | | 1,936,294 | |
| | 20,088 | | | Ipsen SA (Pharmaceuticals, Biotechnology & Life Sciences) | | | 1,153,615 | |
| | 27,462 | | | JCDecaux SA (Media) | | | 1,084,860 | |
| | 31,397 | | | Klepierre (REIT) | | | 1,522,932 | |
| | 41,732 | | | Nexity SA (Real Estate) | | | 1,832,720 | |
| | 52,623 | | | UBISOFT Entertainment (Software & Services)* | | | 970,356 | |
| | | | | | | | |
| | | | | | | 12,487,386 | |
| | |
| | Germany – 5.5% | |
| | 37,393 | | | Brenntag AG (Capital Goods) | | | 2,243,605 | |
| | 41,307 | | | GEA Group AG (Capital Goods) | | | 1,983,807 | |
| | 32,186 | | | Gerry Weber International AG (Consumer Durables & Apparel) | | | 1,052,021 | |
| | 30,332 | | | GfK SE (Media) | | | 1,160,650 | |
| | |
| | |
| The accompanying notes are an integral part of these financial statements. | | 25 |
GOLDMAN SACHS INTERNATIONAL SMALL CAP FUND
Schedule of Investments (continued)
April 30, 2015 (Unaudited)
| | | | | | | | |
Shares | | | Description | | Value | |
| | Common Stocks – (continued) | |
| | Germany – (continued) | | | | |
| | 44,655 | | | Infineon Technologies AG (Semiconductors & Semiconductor Equipment) | | $ | 524,997 | |
| | 18,925 | | | Leoni AG (Automobiles & Components) | | | 1,211,971 | |
| | 34,260 | | | Salzgitter AG (Materials) | | | 1,168,635 | |
| | 11,059 | | | Symrise AG (Materials) | | | 670,545 | |
| | | | | | | | |
| | | | | | | 10,016,231 | |
| | |
| | Hong Kong – 0.5% | |
| | 1,194,000 | | | China Traditional Chinese Medicine Co. Ltd. (Pharmaceuticals, Biotechnology & Life Sciences)* | | | 929,738 | |
| | |
| | Ireland – 1.0% | |
| | 441,521 | | | Beazley PLC (Insurance) | | | 1,898,799 | |
| | |
| | Italy – 3.2% | |
| | 63,943 | | | Buzzi Unicem SpA (Materials) | | | 1,029,170 | |
| | 14,782 | | | Ei Towers SpA (Technology Hardware & Equipment)* | | | 897,950 | |
| | 73,377 | | | MARR SpA (Food & Staples Retailing) | | | 1,473,920 | |
| | 36,815 | | | Moncler SpA (Consumer Durables & Apparel) | | | 655,603 | |
| | 228,470 | | | Unione di Banche Italiane SCpA (Banks) | | | 1,813,453 | |
| | | | | | | | |
| | | | | | | 5,870,096 | |
| | |
| | Japan – 20.3% | |
| | 17,700 | | | ABC-Mart, Inc. (Retailing) | | | 1,007,112 | |
| | 26,400 | | | Alps Electric Co. Ltd. (Technology Hardware & Equipment) | | | 655,787 | |
| | 21,800 | | | Asahi Intecc Co. Ltd. (Health Care Equipment & Services) | | | 1,342,514 | |
| | 34,600 | | | Asics Corp. (Consumer Durables & Apparel) | | | 887,846 | |
| | 37,200 | | | Azbil Corp. (Technology Hardware & Equipment) | | | 979,926 | |
| | 34,400 | | | Century Tokyo Leasing Corp. (Diversified Financials) | | | 1,086,174 | |
| | 106,500 | | | Daibiru Corp. (Real Estate) | | | 1,045,739 | |
| | 102,500 | | | Daifuku Co. Ltd. (Capital Goods) | | | 1,365,512 | |
| | 341,000 | | | Denki Kagaku Kogyo KK (Materials) | | | 1,392,369 | |
| | 62,300 | | | Eiken Chemical Co. Ltd. (Health Care Equipment & Services) | | | 1,234,166 | |
| | 36,700 | | | FP Corp. (Materials) | | | 1,316,687 | |
| | 36,800 | | | Fuji Seal International, Inc. (Materials) | | | 1,104,039 | |
| | 135,400 | | | GMO Internet, Inc. (Software & Services) | | | 1,702,136 | |
| | 40,100 | | | HIS Co. Ltd. (Consumer Services) | | | 1,336,636 | |
| | 86,000 | | | Iwatani Corp. (Capital Goods) | | | 581,658 | |
| | 57,400 | | | J. Front Retailing Co. Ltd. (Retailing) | | | 956,497 | |
| | 102,000 | | | Makino Milling Machine Co. Ltd. (Capital Goods) | | | 931,630 | |
| | |
| | Common Stocks – (continued) | |
| | Japan – (continued) | | | | |
| | 14,700 | | | Matsumotokiyoshi Holdings Co. Ltd. (Food & Staples Retailing) | | $ | 535,242 | |
| | 28,700 | | | MISUMI Group, Inc. (Capital Goods) | | | 1,077,057 | |
| | 197,000 | | | Nankai Electric Railway Co. Ltd. (Transportation) | | | 941,753 | |
| | 15,000 | | | Obic Co. Ltd. (Software & Services) | | | 627,459 | |
| | 37,600 | | | Otsuka Corp. (Software & Services) | | | 1,731,818 | |
| | 91,400 | | | Sac’s Bar Holdings, Inc. (Retailing) | | | 1,632,545 | |
| | 40,500 | | | Sakata Seed Corp. (Food, Beverage & Tobacco) | | | 702,256 | |
| | 50,000 | | | Shinmaywa Industries Ltd. (Capital Goods) | | | 519,792 | |
| | 53,800 | | | Ship Healthcare Holdings, Inc. (Health Care Equipment & Services) | | | 1,314,881 | |
| | 63,100 | | | Start Today Co. Ltd. (Retailing) | | | 1,545,801 | |
| | 51,900 | | | Sumco Corp. (Semiconductors & Semiconductor Equipment) | | | 783,077 | |
| | 215,000 | | | Takuma Co. Ltd. (Capital Goods) | | | 1,651,765 | |
| | 127,000 | | | The 77 Bank Ltd. (Banks) | | | 732,941 | |
| | 274,000 | | | The Hokkoku Bank Ltd. (Banks) | | | 992,500 | |
| | 137,000 | | | The Nishi-Nippon City Bank Ltd. (Banks) | | | 436,543 | |
| | 22,900 | | | Tokyo Ohka Kogyo Co. Ltd. (Materials) | | | 712,767 | |
| | 171,700 | | | Tosei Corp. (Real Estate) | | | 1,240,680 | |
| | 37,000 | | | Tv Tokyo Holdings Corp. (Media) | | | 686,380 | |
| | 18,400 | | | Yonex Co. Ltd. (Consumer Durables & Apparel) | | | 274,463 | |
| | | | | | | | |
| | | | | | | 37,066,148 | |
| | |
| | Luxembourg – 1.2% | |
| | 558,230 | | | Regus PLC (Commercial & Professional Services) | | | 2,132,059 | |
| | |
| | Netherlands – 1.5% | |
| | 64,557 | | | Delta Lloyd NV (Insurance) | | | 1,220,846 | |
| | 110,466 | | | USG People NV (Commercial & Professional Services) | | | 1,500,132 | |
| | | | | | | | |
| | | | | | | 2,720,978 | |
| | |
| | New Zealand – 0.4% | |
| | 129,040 | | | Fletcher Building Ltd. (Materials) | | | 806,340 | |
| | |
| | Portugal – 1.5% | |
| | 173,439 | | | CTT-Correios de Portugal SA (Transportation) | | | 1,956,214 | |
| | 256,559 | | | REN – Redes Energeticas Nacionais SGPS SA (Utilities)* | | | 803,161 | |
| | | | | | | | |
| | | | | | | 2,759,375 | |
| | |
| | Singapore – 0.4% | |
| | 3,773,400 | | | SIIC Environment Holdings Ltd. (Utilities)* | | | 640,240 | |
| | |
| | South Africa – 0.6% | |
| | 57,803 | | | Mondi PLC (Materials) | | | 1,170,405 | |
| | |
| | |
| 26 | | The accompanying notes are an integral part of these financial statements. |
GOLDMAN SACHS INTERNATIONAL SMALL CAP FUND
| | | | | | | | |
Shares | | | Description | | Value | |
| | Common Stocks – (continued) | |
| | South Korea – 4.1% | |
| | 4,936 | | | BGF Retail Co. Ltd. (Food & Staples Retailing) | | $ | 540,266 | |
| | 135,035 | | | Byucksan Corp. (Capital Goods) | | | 788,830 | |
| | 2,258 | | | CJ CheilJedang Corp. (Food, Beverage & Tobacco) | | | 878,130 | |
| | 73,989 | | | Doosan Infracore Co. Ltd. (Capital Goods)* | | | 817,718 | |
| | 13,433 | | | Grand Korea Leisure Co. Ltd. (Consumer Services) | | | 480,734 | |
| | 39,074 | | | GS Engineering & Construction Corp. (Capital Goods)* | | | 1,167,197 | |
| | 15,957 | | | Korean Air Lines Co. Ltd. (Transportation)* | | | 680,998 | |
| | 16,974 | | | OCI Materials Co. Ltd. (Materials) | | | 1,603,147 | |
| | 3,718 | | | Spigen Korea Co. Ltd. (Technology Hardware & Equipment) | | | 512,353 | |
| | | | | | | | |
| | | | | | | 7,469,373 | |
| | |
| | Spain – 1.5% | |
| | 37,665 | | | Enagas SA (Utilities) | | | 1,159,996 | |
| | 34,653 | | | Tecnicas Reunidas SA (Energy) | | | 1,611,835 | |
| | | | | | | | |
| | | | | | | 2,771,831 | |
| | |
| | Sweden – 0.9% | |
| | 32,736 | | | Indutrade AB (Capital Goods) | | | 1,599,216 | |
| | |
| | Switzerland – 7.8% | |
| | 17,702 | | | Actelion Ltd. (Registered) (Pharmaceuticals, Biotechnology & Life Sciences)* | | | 2,329,245 | |
| | 20,459 | | | Aryzta AG (Food, Beverage & Tobacco)* | | | 1,380,515 | |
| | 927 | | | Barry Callebaut AG (Registered) (Food, Beverage & Tobacco)* | | | 1,124,562 | |
| | 59,676 | | | Gategroup Holding AG (Commercial & Professional Services)* | | | 2,091,650 | |
| | 4,668 | | | Geberit AG (Registered) (Capital Goods) | | | 1,653,282 | |
| | 24,256 | | | Implenia AG (Registered) (Capital Goods) | | | 1,660,837 | |
| | 44,006 | | | Julius Baer Group Ltd. (Diversified Financials)* | | | 2,303,308 | |
| | 18,289 | | | PSP Swiss Property AG (Registered) (Real Estate)* | | | 1,705,862 | |
| | | | | | | | |
| | | | | | | 14,249,261 | |
| | |
| | Taiwan – 1.6% | |
| | 507,000 | | | Chipbond Technology Corp. (Semiconductors & Semiconductor Equipment) | | | 1,095,623 | |
| | 53,120 | | | Eclat Textile Co. Ltd. (Consumer Durables & Apparel) | | | 711,188 | |
| | 120,000 | | | momo.com, Inc. (Retailing) | | | 1,174,388 | |
| | | | | | | | |
| | | | | | | 2,981,199 | |
| | |
| | Common Stocks – (continued) | |
| | United Kingdom – 18.4% | |
| | 171,686 | | | Alent PLC (Materials) | | $ | 953,446 | |
| | 268,923 | | | Ashmore Group PLC (Diversified Financials) | | | 1,271,279 | |
| | 78,217 | | | Ashtead Group PLC (Capital Goods) | | | 1,341,233 | |
| | 38,513 | | | Bellway PLC (Consumer Durables & Apparel) | | | 1,170,881 | |
| | 194,288 | | | Big Yellow Group PLC (REIT) | | | 1,986,514 | |
| | 142,686 | | | Bodycote PLC (Capital Goods) | | | 1,502,717 | |
| | 141,899 | | | BTG PLC (Pharmaceuticals, Biotechnology & Life Sciences)* | | | 1,565,724 | |
| | 334,456 | | | Cairn Energy PLC (Energy)* | | | 911,211 | |
| | 38,773 | | | Close Brothers Group PLC (Diversified Financials) | | | 906,336 | |
| | 83,766 | | | Drax Group PLC (Utilities) | | | 511,794 | |
| | 311,656 | | | Foxtons Group PLC (Real Estate) | | | 1,050,281 | |
| | 142,120 | | | Greene King PLC (Consumer Services) | | | 1,806,897 | |
| | 157,292 | | | Halma PLC (Technology Hardware & Equipment) | | | 1,713,048 | |
| | 363,617 | | | Hays PLC (Commercial & Professional Services) | | | 854,629 | |
| | 149,301 | | | Henderson Group PLC CDI (Diversified Financials) | | | 628,962 | |
| | 195,535 | | | Inchcape PLC (Retailing) | | | 2,487,218 | |
| | 171,682 | | | Jupiter Fund Management PLC (Diversified Financials) | | | 1,130,395 | |
| | 740,006 | | | Londonmetric Property PLC (REIT) | | | 1,874,250 | |
| | 35,479 | | | Melrose Industries PLC (Capital Goods) | | | 143,974 | |
| | 81,035 | | | Persimmon PLC (Consumer Durables & Apparel)* | | | 2,104,021 | |
| | 623,451 | | | SIG PLC (Capital Goods) | | | 1,852,776 | |
| | 208,538 | | | Smart Metering Systems PLC (Technology Hardware & Equipment) | | | 1,137,576 | |
| | 324,250 | | | Spire Healthcare Group PLC (Health Care Equipment & Services)*(a) | | | 1,588,011 | |
| | 98,261 | | | St. James’s Place PLC (Insurance) | | | 1,340,350 | |
| | 56,525 | | | Telecom Plus PLC (Utilities) | | | 663,921 | |
| | 33,983 | | | Victrex PLC (Materials) | | | 1,028,551 | |
| | | | | | | | |
| | | | | | | 33,525,995 | |
| | |
| | United States – 0.3% | |
| | 41,154 | | | Tahoe Resources, Inc. (Materials) | | | 581,579 | |
| | |
| | TOTAL COMMON STOCKS | |
| | (Cost $167,655,904) | | $ | 173,422,226 | |
| | |
| | |
| The accompanying notes are an integral part of these financial statements. | | 27 |
GOLDMAN SACHS INTERNATIONAL SMALL CAP FUND
Schedule of Investments (continued)
April 30, 2015 (Unaudited)
| | | | | | | | |
Shares | | | Description | | Value | |
| | Exchange Traded Fund – 0.7% | |
| | United States – 0.7% | |
| | 23,261 | | | iShares MSCI Israel Capped Fund | | $ | 1,201,663 | |
| | (Cost $1,084,603) | | | | |
| | |
| | TOTAL INVESTMENTS – 95.6% | |
| | (Cost $168,740,507) | | $ | 174,623,889 | |
| | |
| OTHER ASSETS IN EXCESS OF
LIABILITIES – 4.4% | | | 8,032,105 | |
| | |
| | NET ASSETS – 100.0% | | $ | 182,655,994 | |
| | |
| | |
| The percentage shown for each investment category reflects the value of investments in that category as a percentage of net assets. |
* | | Non-income producing security. |
(a) | | Exempt from registration under Rule 144A of the Securities Act of 1933. Under procedures approved by the Board of Trustees, such securities have been determined to be liquid by the Investment Adviser and may be resold, normally to qualified institutional buyers in transactions exempt from registration. Total market value of Rule 144A securities amounts to $1,588,011, which represents approximately 0.9% of net assets as of April 30, 2015. |
| | |
|
Investment Abbreviations: |
ADR | | —American Depositary Receipt |
CDI | | —CHESS Depositary Interest |
REIT | | —Real Estate Investment Trust |
|
| | |
| 28 | | The accompanying notes are an integral part of these financial statements. |
GOLDMAN SACHS INTERNATIONAL SMALL CAP FUND
|
| ADDITIONAL INVESTMENT INFORMATION |
FUTURES CONTRACTS — At April 30, 2015, the Fund had the following futures contracts:
| | | | | | | | | | | | |
| Type | | Number of
Contracts
Long (Short) | | Expiration
Date | | Current
Value | | | Unrealized
Gain (Loss) | |
MSCI Singapore Index | | 31 | | May 2015 | | $ | 1,846,131 | | | $ | (10,040 | ) |
| | |
| The accompanying notes are an integral part of these financial statements. | | 29 |
GOLDMAN SACHS STRATEGIC INTERNATIONAL EQUITY FUND
Schedule of Investments
April 30, 2015 (Unaudited)
| | | | | | | | |
Shares | | | Description | | Value | |
| | Common Stocks – 87.9% | |
| | Australia – 3.4% | |
| | 40,969 | | | Australia & New Zealand Banking Group Ltd. (Banks) | | $ | 1,096,243 | |
| | 133,478 | | | Computershare Ltd. (Software & Services) | | | 1,294,790 | |
| | | | | | | | |
| | | | | | | 2,391,033 | |
| | |
| | Belgium – 4.1% | |
| | 16,062 | | | Anheuser-Busch InBev NV (Food, Beverage & Tobacco) | | | 1,955,522 | |
| | 6,202 | | | Solvay SA (Materials) | | | 913,214 | |
| | | | | | | | |
| | | | | | | 2,868,736 | |
| | |
| | China – 0.6% | |
| | 89,000 | | | China Mengniu Dairy Co. Ltd. (Food, Beverage & Tobacco) | | | 450,710 | |
| | |
| | Denmark – 1.5% | |
| | 18,994 | | | Novo Nordisk A/S Class B (Pharmaceuticals, Biotechnology & Life Sciences) | | | 1,066,336 | |
| | |
| | France – 9.4% | |
| | 5,447 | | | Air Liquide SA (Materials) | | | 712,361 | |
| | 10,760 | | | Klepierre (REIT) | | | 521,921 | |
| | 26,157 | | | Rexel SA (Capital Goods) | | | 492,972 | |
| | 14,445 | | | Safran SA (Capital Goods) | | | 1,055,458 | |
| | 11,302 | | | Sanofi (Pharmaceuticals, Biotechnology & Life Sciences) | | | 1,150,436 | |
| | 26,712 | | | Societe Generale SA (Banks) | | | 1,335,459 | |
| | 24,723 | | | Total SA (Energy) | | | 1,338,749 | |
| | | | | | | | |
| | | | | | | 6,607,356 | |
| | |
| | Germany – 6.8% | |
| | 8,994 | | | Adidas AG (Consumer Durables & Apparel) | | | 736,932 | |
| | 9,720 | | | Bayer AG (Registered) (Pharmaceuticals, Biotechnology & Life Sciences)* | | | 1,399,025 | |
| | 17,755 | | | Beiersdorf AG (Household & Personal Products) | | | 1,544,431 | |
| | 14,729 | | | GEA Group AG (Capital Goods) | | | 707,374 | |
| | 7,823 | | | Rocket Internet SE (Software & Services)*(a) | | | 388,826 | |
| | | | | | | | |
| | | | | | | 4,776,588 | |
| | |
| | India – 1.0% | |
| | 44,408 | | | Thermax Ltd. (Capital Goods) | | | 685,644 | |
| | |
| | Ireland – 3.8% | |
| | 1,317,504 | | | Bank of Ireland (Banks)* | | | 504,129 | |
| | 15,067 | | | Kerry Group PLC Class A (Food, Beverage & Tobacco) | | | 1,108,214 | |
| | 13,544 | | | Shire PLC (Pharmaceuticals, Biotechnology & Life Sciences) | | | 1,100,634 | |
| | | | | | | | |
| | | | | | | 2,712,977 | |
| | |
| | Common Stocks – (continued) | |
| | Italy – 1.0% | |
| | 213,378 | | | Intesa Sanpaolo SpA (Banks) | | $ | 716,844 | |
| | |
| | Japan – 17.3% | |
| | 5,500 | | | Disco Corp. (Semiconductors & Semiconductor Equipment) | | | 500,869 | |
| | 20,100 | | | Hoya Corp. (Technology Hardware & Equipment) | | | 774,672 | |
| | 37,900 | | | Japan Tobacco, Inc. (Food, Beverage & Tobacco) | | | 1,323,501 | |
| | 34,700 | | | KDDI Corp. (Telecommunication Services) | | | 821,083 | |
| | 62,000 | | | Kubota Corp. (Capital Goods) | | | 970,363 | |
| | 217,900 | | | Mitsubishi UFJ Financial Group, Inc. (Banks) | | | 1,548,038 | |
| | 20,900 | | | Nidec Corp. (Capital Goods) | | | 1,563,420 | |
| | 68,900 | | | ORIX Corp. (Diversified Financials) | | | 1,059,572 | |
| | 22,000 | | | Pola Orbis Holdings, Inc. (Household & Personal Products) | | | 1,141,499 | |
| | 21,300 | | | Start Today Co. Ltd. (Retailing) | | | 521,800 | |
| | 131,800 | | | Tokyu Fudosan Holdings Corp. (Real Estate) | | | 979,398 | |
| | 37,500 | | | Unicharm Corp. (Household & Personal Products) | | | 943,881 | |
| | | | | | | | |
| | | | | | | 12,148,096 | |
| | |
| | Netherlands – 3.2% | |
| | 138,699 | | | Aegon NV (Insurance) | | | 1,094,322 | |
| | 36,273 | | | Royal Dutch Shell PLC Class A (Energy) | | | 1,143,697 | |
| | | | | | | | |
| | | | | | | 2,238,019 | |
| | |
| | Russia – 0.8% | |
| | 2,468 | | | OJSC Magnit (Food & Staples Retailing) | | | 539,849 | |
| | |
| | Singapore – 0.9% | |
| | 39,005 | | | DBS Group Holdings Ltd. (Banks) | | | 619,804 | |
| | |
| | South Korea – 2.4% | |
| | 19,644 | | | Hana Financial Group, Inc. (Banks) | | | 578,238 | |
| | 24,415 | | | Kia Motors Corp. (Automobiles & Components) | | | 1,125,088 | |
| | | | | | | | |
| | | | | | | 1,703,326 | |
| | |
| | Spain – 4.3% | |
| | 102,483 | | | Banco Bilbao Vizcaya Argentaria SA (Banks) | | | 1,029,758 | |
| | 157,141 | | | Banco Popular Espanol SA (Banks) | | | 817,614 | |
| | 180,138 | | | Iberdrola SA (Utilities) | | | 1,205,716 | |
| | | | | | | | |
| | | | | | | 3,053,088 | |
| | |
| | Sweden – 4.0% | |
| | 32,512 | | | Hennes & Mauritz AB Class B (Retailing) | | | 1,292,572 | |
| | 29,833 | | | Svenska Cellulosa AB SCA Class B (Household & Personal Products) | | | 754,625 | |
| | 56,285 | | | Volvo AB Class B (Capital Goods) | | | 777,589 | |
| | | | | | | | |
| | | | | | | 2,824,786 | |
| | |
| | |
| 30 | | The accompanying notes are an integral part of these financial statements. |
GOLDMAN SACHS STRATEGIC INTERNATIONAL EQUITY FUND
| | | | | | | | |
Shares | | | Description | | Value | |
| | Common Stocks – (continued) | |
| | Switzerland – 12.5% | |
| | 48,460 | | | Credit Suisse Group AG (Registered) (Diversified Financials)* | | $ | 1,282,594 | |
| | 10,276 | | | Julius Baer Group Ltd. (Diversified Financials)* | | | 537,854 | |
| | 21,094 | | | Novartis AG (Registered) (Pharmaceuticals, Biotechnology & Life Sciences) | | | 2,153,111 | |
| | 3,280 | | | Syngenta AG (Registered) (Materials) | | | 1,097,586 | |
| | 2,411 | | | The Swatch Group AG (Consumer Durables & Apparel) | | | 1,077,850 | |
| | 76,354 | | | UBS Group AG (Diversified Financials)* | | | 1,525,349 | |
| | 19,228 | | | Wolseley PLC (Capital Goods) | | | 1,137,229 | |
| | | | | | | | |
| | | | | | | 8,811,573 | |
| | |
| | Taiwan – 1.1% | |
| | 59,000 | | | MediaTek, Inc. (Semiconductors & Semiconductor Equipment) | | | 758,397 | |
| | |
| | United Kingdom – 9.8% | |
| | 138,173 | | | Aviva PLC (Insurance) | | | 1,111,666 | |
| | 78,126 | | | BG Group PLC (Energy) | | | 1,415,139 | |
| | 165,891 | | | ITV PLC (Media) | | | 644,075 | |
| | 118,625 | | | Just Eat PLC (Software & Services)* | | | 831,854 | |
| | 20,507 | | | Rio Tinto PLC (Materials) | | | 917,711 | |
| | 552,668 | | | Vodafone Group PLC (Telecommunication Services) | | | 1,947,165 | |
| | | | | | | | |
| | | | | | | 6,867,610 | |
| | |
| | TOTAL COMMON STOCKS | |
| | (Cost $58,861,216) | | $ | 61,840,772 | |
| | |
| | | | | | | | |
| | Preferred Stock – 1.3% | |
| | Germany – 1.3% | |
| | 3,599 | | | Volkswagen AG (Automobiles & Components) | | | | |
| | (Cost $846,001) | | $ | 926,547 | |
| | |
| | | | | | | | |
Shares | | | Description | | Value | |
| | Exchange Traded Funds – 5.8% | |
| | United States – 5.8% | |
| | 10,214 | | | iShares MSCI EAFE Fund | | $ | 679,333 | |
| | 261,137 | | | iShares MSCI Japan Fund | | | 3,358,222 | |
| | |
| | TOTAL EXCHANGE TRADED FUNDS | |
| | (Cost $3,881,912) | | $ | 4,037,555 | |
| | |
| | TOTAL INVESTMENTS – 95.0% | |
| | (Cost $63,589,129) | | $ | 66,804,874 | |
| | |
| OTHER ASSETS IN EXCESS OF
LIABILITIES – 5.0% | | | 3,526,612 | |
| | |
| | NET ASSETS – 100.0% | | $ | 70,331,486 | |
| | |
| | |
| The percentage shown for each investment category reflects the value of investments in that category as a percentage of net assets. |
* (a) | | Non-income producing security. Exempt from registration under Rule 144A of the Securities Act of 1933. Under procedures approved by the Board of Trustees, such securities have been determined to be liquid by the Investment Adviser and may be resold, normally to qualified institutional buyers in transactions exempt from registration. Total market value of Rule 144A securities amounts to $388,826, which represents approximately 0.6% of net assets as of April 30, 2015. |
| | |
|
Investment Abbreviation: |
REIT | | —Real Estate Investment Trust |
|
| | |
| The accompanying notes are an integral part of these financial statements. | | 31 |
GOLDMAN SACHS FUNDAMENTAL INTERNATIONAL EQUITY FUNDS
Statements of Assets and Liabilities
April 30, 2015 (Unaudited)
| | | | | | | | | | | | | | |
| | | | | Focused
International
Equity Fund | | | International
Small Cap Fund | | | Strategic
International
Equity Fund | |
| Assets: | | | |
| | Investments, at value (cost $219,569,384, $168,740,507 and $63,589,129) | | $ | 212,675,704 | | | $ | 174,623,889 | | | $ | 66,804,874 | |
| | Cash | | | 12,909,706 | | | | 6,211,599 | | | | 3,123,749 | |
| | Foreign currencies, at value (cost $92,474, $823,839 and $121,283) | | | 92,148 | | | | 824,612 | | | | 117,040 | |
| | Due from custodian | | | — | | | | 1,207,551 | | | | — | |
| | Receivables: | | | | | | | | | | | | |
| | Dividends | | | 711,296 | | | | 501,177 | | | | 198,975 | |
| | Fund shares sold | | | 534,641 | | | | 201,274 | | | | 167,081 | |
| | Foreign tax reclaims | | | 391,894 | | | | 193,480 | | | | 187,134 | |
| | Reimbursement from investment adviser | | | 43,731 | | | | 56,904 | | | | 71,007 | |
| | Investments sold | | | — | | | | 2,011,100 | | | | 325,469 | |
| | Collateral on certain derivative contracts(a) | | | — | | | | 46,339 | | | | — | |
| | Variation margin on certain derivative contracts | | | — | | | | 2,626 | | | | — | |
| | Other assets | | | 70,917 | | | | 4,486 | | | | 321 | |
| | Total assets | | | 227,430,037 | | | | 185,885,037 | | | | 70,995,650 | |
| | | | | | | | | | | | | | |
| | Liabilities: | |
| | Payables: | | | | | | | | | | | | |
| | Investments purchased | | | 2,241,203 | | | | 1,489,175 | | | | 500,660 | |
| | Fund shares redeemed | | | 342,672 | | | | 1,494,666 | | | | 22,466 | |
| | Management fees | | | 155,605 | | | | 135,372 | | | | 48,274 | |
| | Distribution and Service fees and Transfer Agent fees | | | 43,326 | | | | 15,784 | | | | 14,895 | |
| | Foreign capital gains taxes | | | — | | | | — | | | | 20,657 | |
| | Accrued expenses | | | 70,825 | | | | 94,046 | | | | 57,212 | |
| | Total liabilities | | | 2,853,631 | | | | 3,229,043 | | | | 664,164 | |
| | | | | | | | | | | | | | |
| | Net Assets: | |
| | Paid-in capital | | | 441,928,140 | | | | 177,770,774 | | | | 110,159,975 | |
| | Undistributed net investment income | | | 1,425,344 | | | | 709,067 | | | | 198,242 | |
| | Accumulated net realized loss | | | (211,869,056 | ) | | | (1,672,183 | ) | | | (43,217,798 | ) |
| | Net unrealized gain (loss) | | | (6,908,022 | ) | | | 5,848,336 | | | | 3,191,067 | |
| | | NET ASSETS | | $ | 224,576,406 | | | $ | 182,655,994 | | | $ | 70,331,486 | |
| | | Net Assets: | | | | | | | | | | | | |
| | | Class A | | $ | 54,604,298 | | | $ | 15,534,545 | | | $ | 24,396,837 | |
| | | Class C | | | 18,901,740 | | | | 3,804,393 | | | | 4,946,961 | |
| | | Institutional | | | 149,071,418 | | | | 156,524,448 | | | | 40,845,404 | |
| | | Service | | | 38,781 | | | | 1,297,454 | | | | — | |
| | | Class IR | | | 1,960,169 | | | | 5,495,154 | | | | 124,767 | |
| | | Class R | | | — | | | | — | | | | 17,517 | |
| | | Total Net Assets | | $ | 224,576,406 | | | $ | 182,655,994 | | | $ | 70,331,486 | |
| | | Shares outstanding $0.001 par value (unlimited shares authorized): | | | | | | | | | | | | |
| | | Class A | | | 2,884,306 | | | | 774,649 | | | | 1,779,635 | |
| | | Class C | | | 1,072,999 | | | | 197,300 | | | | 400,508 | |
| | | Institutional | | | 7,735,766 | | | | 7,587,871 | | | | 2,850,494 | |
| | | Service | | | 2,039 | | | | 65,574 | | | | — | |
| | | Class IR | | | 102,140 | | | | 267,191 | | | | 9,097 | |
| | | Class R | | | — | | | | — | | | | 1,271 | |
| | | Net asset value, offering and redemption price per share:(b) | | | | | | | | | | | | |
| | | Class A | | | $18.93 | | | | $20.05 | | | | $13.71 | |
| | | Class C | | | 17.62 | | | | 19.28 | | | | 12.35 | |
| | | Institutional | | | 19.27 | | | | 20.63 | | | | 14.33 | |
| | | Service | | | 19.02 | | | | 19.79 | | | | — | |
| | | Class IR | | | 19.19 | | | | 20.57 | | | | 13.72 | |
| | | Class R | | | — | | | | — | | | | 13.78 | |
| | (a) | | Includes amount segregated for initial margin and/or collateral on futures of $46,339 for the International Small Cap Fund. |
| | (b) | | Maximum public offering price per share for Class A shares of the Focused International Equity, International Small Cap and Strategic International Equity Funds is $20.03, $21.22 and $14.51, respectively. At redemption, Class C Shares may be subject to a contingent deferred sales charge assessed on the amount equal to the lesser of the current net asset value (“NAV”) or the original purchase price of the shares. |
| | |
| 32 | | The accompanying notes are an integral part of these financial statements. |
GOLDMAN SACHS FUNDAMENTAL INTERNATIONAL EQUITY FUNDS
Statements of Operations
For the Six Months Ended April 30, 2015 (Unaudited)
| | | | | | | | | | | | | | |
| | | | | Focused
International
Equity Fund | | | International Small Cap
Fund | | | Strategic
International
Equity Fund | |
| | Investment income: | |
| | Dividends (net of foreign taxes withheld of $245,424, $131,339 and $75,200) | | $ | 2,638,486 | | | $ | 2,136,038 | | | $ | 804,534 | |
| | | | | | | | | | | | | | |
| | Expenses: | | | | | | | | | | | | |
| | Management fees | | | 1,108,327 | | | | 1,046,141 | | | | 279,540 | |
| | Distribution and Service fees(a) | | | 157,137 | | | | 34,758 | | | | 52,674 | |
| | Transfer Agent fees(a) | | | 99,560 | | | | 55,053 | | | | 34,024 | |
| | Custody, accounting and administrative services | | | 90,963 | | | | 123,424 | | | | 61,518 | |
| | Professional fees | | | 44,350 | | | | 43,168 | | | | 43,402 | |
| | Registration fees | | | 36,334 | | | | 40,842 | | | | 39,149 | |
| | Printing and mailing costs | | | 31,425 | | | | 30,822 | | | | 25,923 | |
| | Trustee fees | | | 10,939 | | | | 10,368 | | | | 10,581 | |
| | Service share fees — Service Plan | | | 170 | | | | 1,424 | | | | — | |
| | Service share fees — Shareholder Administration Plan | | | 170 | | | | 1,424 | | | | — | |
| | Other | | | 6,151 | | | | 4,381 | | | | 6,485 | |
| | Total expenses | | | 1,585,526 | | | | 1,391,805 | | | | 553,296 | |
| | Less — expense reductions | | | (372,931 | ) | | | (412,641 | ) | | | (183,202 | ) |
| | Net expenses | | | 1,212,595 | | | | 979,164 | | | | 370,094 | |
| | NET INVESTMENT INCOME | | | 1,425,891 | | | | 1,156,874 | | | | 434,440 | |
| | | | | | | | | | | | | | |
| | Realized and unrealized gain (loss): | | | | | | | | | | | | |
| | Net realized gain (loss) from: | | | | | | | | | | | | |
| | Investments | | | (6,762,557 | ) | | | 7,159,882 | | | | 534,168 | |
| | Futures contracts | | | — | | | | 119,613 | | | | — | |
| | Forward foreign currency exchange contracts | | | — | | | | (107,513 | ) | | | — | |
| | Foreign currency transactions | | | (242,710 | ) | | | (3,000 | ) | | | (44,671 | ) |
| | Net change in unrealized gain (loss) on: | | | | | | | | | | | | |
| | Investments (including the effects of the net change in the foreign capital gains tax liability of $6,862 for the Strategic International Equity Fund) | | | 17,227,759 | | | | 6,789,020 | | | | 2,526,040 | |
| | Futures contracts | | | — | | | | (18,715 | ) | | | — | |
| | Forward foreign currency exchange contracts | | | — | | | | 100,593 | | | | — | |
| | Foreign currency translation | | | 13,583 | | | | (4,054 | ) | | | (9,172 | ) |
| | Net realized and unrealized gain | | | 10,236,075 | | | | 14,035,826 | | | | 3,006,365 | |
| | NET INCREASE IN NET ASSETS RESULTING FROM OPERATIONS | | $ | 11,661,966 | | | $ | 15,192,700 | | | $ | 3,440,805 | |
| | (a) | | Class specific Distribution and Service, and Transfer Agent fees were as follows: |
| | | | | | | | | | | | | | | | | | | | | | | | | | | | | | | | | | | | | | | | | | | | |
| | | Distribution and Service Fees | | | Transfer Agent Fees | |
Fund | | Class A | | | Class B(b) | | | Class C | | | Class R | | | Class A | | | Class B(b) | | | Class C | | | Institutional | | | Service | | | Class IR | | | Class R | |
Focused International Equity | | $ | 66,978 | | | $ | 115 | | | $ | 90,044 | | | $ | — | | | $ | 50,904 | | | $ | 22 | | | $ | 17,108 | | | $ | 29,579 | | | $ | 27 | | | $ | 1,920 | | | $ | — | |
International Small Cap | | | 18,063 | | | | 100 | | | | 16,595 | | | | — | | | | 13,728 | | | | 19 | | | | 3,153 | | | | 33,278 | | | | 228 | | | | 4,647 | | | | — | |
Strategic International Equity | | | 28,597 | | | | 583 | | | | 23,453 | | | | 41 | | | | 21,734 | | | | 111 | | | | 4,456 | | | | 7,590 | | | | — | | | | 117 | | | | 16 | |
| | (b) | | Class B Shares were converted into Class A Shares at the close of business on November 14, 2014. |
| | |
| The accompanying notes are an integral part of these financial statements. | | 33 |
GOLDMAN SACHS FUNDAMENTAL INTERNATIONAL EQUITY FUNDS
Statements of Changes in Net Assets
| | | | | | | | | | |
| | | | | Focused International Equity Fund | |
| | | | | For the
Six Months Ended
April 30, 2015
(Unaudited) | | | For the Fiscal Year Ended
October 31, 2014 | |
| | From operations: | |
| | Net investment income | | $ | 1,425,891 | | | $ | 7,711,148 | |
| | Net realized gain (loss) | | | (7,005,267 | ) | | | 9,955,040 | |
| | Net change in unrealized gain (loss) | | | 17,241,342 | | | | (37,422,124 | ) |
| | Net increase (decrease) in net assets resulting from operations | | | 11,661,966 | | | | (19,755,936 | )�� |
| | | | | | | | | | |
| | Distributions to shareholders: | | | | | | | | |
| | From net investment income | | | | | | | | |
| | Class A Shares | | | (1,737,059 | ) | | | (228,497 | ) |
| | Class B Shares(a) | | | — | | | | — | |
| | Class C Shares | | | (456,968 | ) | | | — | |
| | Institutional Shares | | | (5,428,826 | ) | | | (930,005 | ) |
| | Service Shares | | | (9,843 | ) | | | (940 | ) |
| | Class IR Shares | | | (70,733 | ) | | | (14,137 | ) |
| | Class R Shares | | | — | | | | — | |
| | Total distributions to shareholders | | | (7,703,429 | ) | | | (1,173,579 | ) |
| | | | | | | | | | |
| | From share transactions: | | | | | | | | |
| | Proceeds from sales of shares | | | 16,373,774 | | | | 132,262,656 | |
| | Reinvestment of distributions | | | 7,537,145 | | | | 1,140,136 | |
| | Cost of shares redeemed | | | (53,713,567 | ) | | | (56,445,399 | ) |
| | Net increase (decrease) in net assets resulting from share transactions | | | (29,802,648 | ) | | | 76,957,393 | |
| | TOTAL INCREASE (DECREASE) | | | (25,844,111 | ) | | | 56,027,878 | |
| | | | | | | | | | |
| | Net assets: | | | | | | | | |
| | Beginning of period | | | 250,420,517 | | | | 194,392,639 | |
| | End of period | | $ | 224,576,406 | | | $ | 250,420,517 | |
| | Undistributed net investment income | | $ | 1,425,344 | | | $ | 7,702,882 | |
| | (a) | | Class B shares were converted into Class A Shares at the close of business on November 14, 2014. |
| | |
| 34 | | The accompanying notes are an integral part of these financial statements. |
GOLDMAN SACHS FUNDAMENTAL INTERNATIONAL EQUITY FUNDS
| | | | | | | | | | | | | | | | | | | | | | |
| | | International Small Cap Fund | | | | | Strategic International Equity Fund | |
| | | For the
Six Months Ended
April 30, 2015
(Unaudited) | | | | | For the Fiscal Year Ended
October 31, 2014 | | | | | For the
Six Months Ended
April 30, 2015
(Unaudited) | | | | | For the Fiscal Year Ended
October 31, 2014 | |
| | | | | | | | | | | | | | | | | | | | | | |
| | $ | 1,156,874 | | | | | $ | 2,631,047 | | | | | $ | 434,440 | | | | | $ | 2,551,063 | |
| | | 7,168,982 | | | | | | 18,506,583 | | | | | | 489,497 | | | | | | 6,105,483 | |
| | | 6,866,844 | | | | | | (21,277,002 | ) | | | | | 2,516,868 | | | | | | (9,639,888 | ) |
| | | 15,192,700 | | | | | | (139,372 | ) | | | | | 3,440,805 | | | | | | (983,342 | ) |
| | | | | | | | | | | | | | | | | | | | | | |
| | | | | | | | | | | | | | | | | | | | | | |
| | | | | | | | | | | | | | | | | | | | | | |
| | | (202,348 | ) | | | | | (252,522 | ) | | | | | (849,696 | ) | | | | | (181,701 | ) |
| | | — | | | | | | (3,621 | ) | | | | | — | | | | | | (1,078 | ) |
| | | (28,965 | ) | | | | | (29,832 | ) | | | | | (152,361 | ) | | | | | (8,305 | ) |
| | | (2,965,911 | ) | | | | | (3,353,326 | ) | | | | | (1,528,500 | ) | | | | | (464,488 | ) |
| | | (14,470 | ) | | | | | (16,362 | ) | | | | | — | | | | | | — | |
| | | (81,045 | ) | | | | | (18,633 | ) | | | | | (5,027 | ) | | | | | (623 | ) |
| | | — | | | | | | — | | | | | | (557 | ) | | | | | (111 | ) |
| | | (3,292,739 | ) | | | | | (3,674,296 | ) | | | | | (2,536,141 | ) | | | | | (656,306 | ) |
| | | | | | | | | | | | | | | | | | | | | | |
| | | | | | | | | | | | | | | | | | | | | | |
| | | 29,766,337 | | | | | | 63,131,042 | | | | | | 13,312,291 | | | | | | 14,098,789 | |
| | | 3,164,213 | | | | | | 3,530,834 | | | | | | 2,501,121 | | | | | | 650,708 | |
| | | (58,730,405 | ) | | | | | (56,636,871 | ) | | | | | (20,253,590 | ) | | | | | (12,450,865 | ) |
| | | (25,799,855 | ) | | | | | 10,025,005 | | | | | | (4,440,178 | ) | | | | | 2,298,632 | |
| | | (13,899,894 | ) | | | | | 6,211,337 | | | | | | (3,535,514 | ) | | | | | 658,984 | |
| | | | | | | | | | | | | | | | | | | | | | |
| | | | | | | | | | | | | | | | | | | | | | |
| | | 196,555,888 | | | | | | 190,344,551 | | | | | | 73,867,000 | | | | | | 73,208,016 | |
| | $ | 182,655,994 | | | | | $ | 196,555,888 | | | | | $ | 70,331,486 | | | | | $ | 73,867,000 | |
| | $ | 709,067 | | | | | $ | 2,844,932 | | | | | $ | 198,242 | | | | | $ | 2,299,943 | |
| | |
| The accompanying notes are an integral part of these financial statements. | | 35 |
GOLDMAN SACHS FOCUSED INTERNATIONAL EQUITY FUND
Financial Highlights
Selected Data for a Share Outstanding Throughout Each Period
| | | | | | | | | | | | | | | | | | | | | | | | | | |
| | | | | | | | Income (loss) from
investment operations | | | | | | | |
| | | Year - Share Class | | Net asset
value,
beginning
of period | | | Net
investment
income (loss)(a) | | | Net realized
and unrealized
gain (loss) | | | Total from
investment
operations | | | Distributions
to shareholders
from net
investment
income | | | Increase from
regulatory
settlements | |
| | FOR THE SIX MONTHS ENDED APRIL 30, (UNAUDITED) | | | | | |
| | 2015 - A | | $ | 18.49 | | | $ | 0.10 | | | $ | 0.90 | | | $ | 1.00 | | | $ | (0.56 | ) | | $ | — | |
| | 2015 - C | | | 17.18 | | | | 0.03 | | | | 0.84 | | | | 0.87 | | | | (0.43 | ) | | | — | |
| | 2015 - Institutional | | | 18.86 | | | | 0.13 | | | | 0.93 | | | | 1.06 | | | | (0.65 | ) | | | — | |
| | 2015 - Service | | | 18.57 | | | | 0.07 | | | | 0.93 | | | | 1.00 | | | | (0.55 | ) | | | — | |
| | 2015 - IR | | | 18.76 | | | | 0.12 | | | | 0.91 | | | | 1.03 | | | | (0.60 | ) | | | — | |
| | | | | | | | | | | | | | | | | | | | | | | | | | |
| | FOR THE FISCAL YEARS ENDED OCTOBER 31, | | | | | |
| | 2014 - A | | | 20.00 | | | | 0.55 | (e) | | | (1.99 | ) | | | (1.44 | ) | | | (0.07 | ) | | | — | |
| | 2014 - C | | | 18.65 | | | | 0.36 | (e) | | | (1.83 | ) | | | (1.47 | ) | | | — | | | | — | |
| | 2014 - Institutional | | | 20.39 | | | | 0.64 | (e) | | | (2.02 | ) | | | (1.38 | ) | | | (0.15 | ) | | | — | |
| | 2014 - Service | | | 20.08 | | | | 0.52 | (e) | | | (1.98 | ) | | | (1.46 | ) | | | (0.05 | ) | | | — | |
| | 2014 - IR | | | 20.29 | | | | 0.75 | (e) | | | (2.14 | ) | | | (1.39 | ) | | | (0.14 | ) | | | — | |
| | 2013 - A | | | 15.58 | | | | 0.15 | | | | 4.71 | | | | 4.86 | | | | (0.44 | ) | | | — | |
| | 2013 - C | | | 14.60 | | | | 0.02 | | | | 4.41 | | | | 4.43 | | | | (0.38 | ) | | | — | |
| | 2013 - Institutional | | | 15.92 | | | | 0.23 | | | | 4.79 | | | | 5.02 | | | | (0.55 | ) | | | — | |
| | 2013 - Service | | | 15.69 | | | | 0.14 | | | | 4.72 | | | | 4.86 | | | | (0.47 | ) | | | — | |
| | 2013 - IR | | | 15.87 | | | | 0.16 | | | | 4.82 | | | | 4.98 | | | | (0.56 | ) | | | — | |
| | 2012 - A | | | 14.74 | | | | 0.28 | | | | 0.93 | | | | 1.21 | | | | (0.47 | ) | | | 0.10 | |
| | 2012 - C | | | 13.82 | | | | 0.16 | | | | 0.87 | | | | 1.03 | | | | (0.35 | ) | | | 0.10 | |
| | 2012 - Institutional | | | 15.07 | | | | 0.32 | | | | 0.97 | | | | 1.29 | | | | (0.54 | ) | | | 0.10 | |
| | 2012 - Service | | | 14.85 | | | | 0.26 | | | | 0.94 | | | | 1.20 | | | | (0.46 | ) | | | 0.10 | |
| | 2012 - IR | | | 15.06 | | | | 0.28 | | | | 0.98 | | | | 1.26 | | | | (0.55 | ) | | | 0.10 | |
| | 2011 - A | | | 16.81 | | | | 0.42 | (g) | | | (2.22 | ) | | | (1.80 | ) | | | (0.27 | ) | | | — | |
| | 2011 - C | | | 15.79 | | | | 0.29 | (g) | | | (2.09 | ) | | | (1.80 | ) | | | (0.17 | ) | | | — | |
| | 2011 - Institutional | | | 17.18 | | | | 0.50 | (g) | | | (2.27 | ) | | | (1.77 | ) | | | (0.34 | ) | | | — | |
| | 2011 - Service | | | 16.92 | | | | 0.42 | (g) | | | (2.24 | ) | | | (1.82 | ) | | | (0.25 | ) | | | — | |
| | 2011 - IR | | | 17.22 | | | | 0.63 | (g) | | | (2.45 | ) | | | (1.82 | ) | | | (0.34 | ) | | | — | |
| | 2010 - A | | | 15.22 | | | | 0.10 | | | | 1.79 | | | | 1.89 | | | | (0.30 | ) | | | — | |
| | 2010 - C | | | 14.35 | | | | (0.02 | ) | | | 1.69 | | | | 1.67 | | | | (0.23 | ) | | | — | |
| | 2010 - Institutional | | | 15.55 | | | | 0.16 | | | | 1.82 | | | | 1.98 | | | | (0.35 | ) | | | — | |
| | 2010 - Service | | | 15.32 | | | | 0.08 | | | | 1.80 | | | | 1.88 | | | | (0.28 | ) | | | — | |
| | 2010 - IR (Commenced August 31, 2010) | | | 15.13 | | | | 0.02 | | | | 2.07 | | | | 2.09 | | | | — | | | | — | |
| | (a) | | Calculated based on the average shares outstanding methodology. |
| | (b) | | Assumes investment at the net asset value at the beginning of the period, reinvestment of all distributions, a complete redemption of the investment at the net asset value at the end of the period and no sales or redemption charges. Total returns would be reduced if a sales or redemption charge was taken into account. Returns do not reflect the deduction of taxes that a shareholder would pay on Fund distributions or the redemption of Fund shares. Total returns for periods less than one full year are not annualized. |
| | (c) | | The Fund's portfolio turnover rate is calculated in accordance with regulatory requirements, without regard to transactions involving short term investments and certain derivatives. If such transactions were included, the Fund's portfolio turnover rate may be higher. |
| | (e) | | Reflects income recognized from a corporate action which amounted to $0.35 per share and 1.76% of average net assets. |
| | (f) | | Total returns reflects the impact of payments for regulatory settlements entitled to be received during the year and recorded as an increase to capital by the Fund. Excluding such payments, the total return would have been: |
| | | | | | | | | | | | | | | | | | | | |
| | | Class A | | | Class C | | | Institutional | | | Service | | | Class IR | |
For the Fiscal Year Ended October 31, 2012 | | | 8.66 | % | | | 7.81 | % | | | 9.15 | % | | | 8.57 | % | | | 8.92 | % |
| | (g) | | Reflects income recognized from a corporate action which amounted to $0.26 per share and 1.55% of average net assets. |
| | |
| 36 | | The accompanying notes are an integral part of these financial statements. |
GOLDMAN SACHS FOCUSED INTERNATIONAL EQUITY FUND
| | | | | | | | | | | | | | | | | | | | | | | | | | | | | | | | | | | | | | | | |
| | | | | | | | | | | | | | | | | | | | | | | | | | | | | | | | | | |
| | | Net asset
value, end
of period | | | | | Total
return(b) | | | | | Net assets,
end of
period
(in 000s) | | | | | Ratio of
net expenses
to average
net assets | | | | | Ratio of
total expenses
to average
net assets | | | | | Ratio of
net investment
income (loss)
to average
net assets | | | | | Portfolio
turnover
rate(c) | |
| | | | | | | | | | | | | | | | | | | | | | | | | | | | | | | | | | | | | | | | |
| | $ | 18.93 | | | | | | 5.64 | % | | | | $ | 54,604 | | | | | | 1.30 | %(d) | | | | | 1.64 | %(d) | | | | | 1.08 | %(d) | | | | | 48 | % |
| | | 17.62 | | | | | | 5.26 | | | | | | 18,902 | | | | | | 2.05 | (d) | | | | | 2.39 | (d) | | | | | 0.37 | (d) | | | | | 48 | |
| | | 19.27 | | | | | | 5.85 | | | | | | 149,071 | | | | | | 0.90 | (d) | | | | | 1.24 | (d) | | | | | 1.47 | (d) | | | | | 48 | |
| | | 19.02 | | | | | | 5.58 | | | | | | 39 | | | | | | 1.40 | (d) | | | | | 1.73 | (d) | | | | | 0.74 | (d) | | | | | 48 | |
| | | 19.19 | | | | | | 5.74 | | | | | | 1,960 | | | | | | 1.05 | (d) | | | | | 1.39 | (d) | | | | | 1.31 | (d) | | | | | 48 | |
| | | | | | | | | | | | | | | | | | | | | | | | | | | | | | | | | | | | | | | | |
| | | | | | | | | | | | | | | | | | | | | | | | | | | | | | | | | | | | | | | | |
| | | 18.49 | | | | | | (7.16 | ) | | | | | 58,368 | | | | | | 1.33 | | | | | | 1.63 | | | | | | 2.78 | (e) | | | | | 121 | |
| | | 17.18 | | | | | | (7.83 | ) | | | | | 18,247 | | | | | | 2.08 | | | | | | 2.38 | | | | | | 1.97 | (e) | | | | | 121 | |
| | | 18.86 | | | | | | (6.79 | ) | | | | | 170,954 | | | | | | 0.93 | | | | | | 1.23 | | | | | | 3.17 | (e) | | | | | 121 | |
| | | 18.57 | | | | | | (7.28 | ) | | | | | 332 | | | | | | 1.43 | | | | | | 1.73 | | | | | | 2.62 | (e) | | | | | 121 | |
| | | 18.76 | | | | | | (6.90 | ) | | | | | 2,253 | | | | | | 1.07 | | | | | | 1.38 | | | | | | 3.73 | (e) | | | | | 121 | |
| | | 20.00 | | | | | | 31.94 | | | | | | 61,224 | | | | | | 1.46 | | | | | | 1.69 | | | | | | 0.89 | | | | | | 189 | |
| | | 18.65 | | | | | | 30.97 | | | | | | 17,910 | | | | | | 2.20 | | | | | | 2.44 | | | | | | 0.15 | | | | | | 189 | |
| | | 20.39 | | | | | | 32.50 | | | | | | 112,707 | | | | | | 1.06 | | | | | | 1.29 | | | | | | 1.29 | | | | | | 189 | |
| | | 20.08 | | | | | | 31.86 | | | | | | 364 | | | | | | 1.56 | | | | | | 1.79 | | | | | | 0.80 | | | | | | 189 | |
| | | 20.29 | | | | | | 32.36 | | | | | | 1,609 | | | | | | 1.20 | | | | | | 1.44 | | | | | | 0.89 | | | | | | 189 | |
| | | 15.58 | | | | | | 9.36 | (f) | | | | | 52,564 | | | | | | 1.48 | | | | | | 1.72 | | | | | | 1.95 | | | | | | 144 | |
| | | 14.60 | | | | | | 8.55 | (f) | | | | | 14,039 | | | | | | 2.23 | | | | | | 2.47 | | | | | | 1.14 | | | | | | 144 | |
| | | 15.92 | | | | | | 9.84 | (f) | | | | | 61,874 | | | | | | 1.08 | | | | | | 1.31 | | | | | | 2.11 | | | | | | 144 | |
| | | 15.69 | | | | | | 9.26 | (f) | | | | | 299 | | | | | | 1.58 | | | | | | 1.82 | | | | | | 1.77 | | | | | | 144 | |
| | | 15.87 | | | | | | 9.61 | (f) | | | | | 30 | | | | | | 1.23 | | | | | | 1.46 | | | | | | 1.87 | | | | | | 144 | |
| | | 14.74 | | | | | | (10.89 | ) | | | | | 118,977 | | | | | | 1.53 | | | | | | 1.67 | | | | | | 2.55 | (g) | | | | | 135 | |
| | | 13.82 | | | | | | (11.55 | ) | | | | | 15,883 | | | | | | 2.28 | | | | | | 2.42 | | | | | | 1.86 | (g) | | | | | 135 | |
| | | 15.07 | | | | | | (10.53 | ) | | | | | 28,105 | | | | | | 1.13 | | | | | | 1.27 | | | | | | 2.94 | (g) | | | | | 135 | |
| | | 14.85 | | | | | | (10.96 | ) | | | | | 300 | | | | | | 1.63 | | | | | | 1.77 | | | | | | 2.51 | (g) | | | | | 135 | |
| | | 15.06 | | | | | | (10.80 | ) | | | | | 3 | | | | | | 1.28 | | | | | | 1.42 | | | | | | 3.87 | (g) | | | | | 135 | |
| | | 16.81 | | | | | | 12.48 | | | | | | 162,231 | | | | | | 1.54 | | | | | | 1.61 | | | | | | 0.66 | | | | | | 182 | |
| | | 15.79 | | | | | | 11.72 | | | | | | 20,031 | | | | | | 2.29 | | | | | | 2.36 | | | | | | (0.11 | ) | | | | | 182 | |
| | | 17.18 | | | | | | 12.95 | | | | | | 36,693 | | | | | | 1.14 | | | | | | 1.21 | | | | | | 1.05 | | | | | | 182 | |
| | | 16.92 | | | | | | 12.37 | | | | | | 354 | | | | | | 1.64 | | | | | | 1.71 | | | | | | 0.54 | | | | | | 182 | |
| | | 17.22 | | | | | | 13.81 | | | | | | 1 | | | | | | 1.29 | (d) | | | | | 1.36 | (d) | | | | | 0.08 | (d) | | | | | 182 | |
| | |
| The accompanying notes are an integral part of these financial statements. | | 37 |
GOLDMAN SACHS INTERNATIONAL SMALL CAP FUND
Financial Highlights
Selected Data for a Share Outstanding Throughout Each Period
| | | | | | | | | | | | | | | | | | | | | | |
| | | | | | | | Income (loss) from
investment operations | | | | |
| | | Year - Share Class | | Net asset
value,
beginning
of period | | | Net
investment
income (loss)(a) | | | Net realized
and unrealized
gain (loss) | | | Total from
investment
operations | | | Distributions
to shareholders
from net
investment
income | |
| | FOR THE SIX MONTHS ENDED APRIL 30, (UNAUDITED) | |
| | 2015 - A | | $ | 18.84 | | | $ | 0.09 | | | $ | 1.39 | | | $ | 1.48 | | | $ | (0.27 | ) |
| | 2015 - C | | | 18.08 | | | | 0.02 | | | | 1.34 | | | | 1.36 | | | | (0.16 | ) |
| | 2015 - Institutional | | | 19.42 | | | | 0.12 | | | | 1.44 | | | | 1.56 | | | | (0.35 | ) |
| | 2015 - Service | | | 18.59 | | | | 0.08 | | | | 1.38 | | | | 1.46 | | | | (0.26 | ) |
| | 2015 - IR | | | 19.36 | | | | 0.12 | | | | 1.42 | | | | 1.54 | | | | (0.33 | ) |
| | | | | | | | | | | | | | | | | | | | | | |
| | FOR THE FISCAL YEARS ENDED OCTOBER 31, | |
| | 2014 - A | | | 19.26 | | | | 0.19 | | | | (0.28 | ) | | | (0.09 | ) | | | (0.33 | ) |
| | 2014 - C | | | 18.52 | | | | 0.03 | | | | (0.25 | ) | | | (0.22 | ) | | | (0.22 | ) |
| | 2014 - Institutional | | | 19.82 | | | | 0.27 | | | | (0.29 | ) | | | (0.02 | ) | | | (0.38 | ) |
| | 2014 - Service | | | 19.00 | | | | 0.16 | | | | (0.27 | ) | | | (0.11 | ) | | | (0.30 | ) |
| | 2014 - IR | | | 19.77 | | | | 0.23 | | | | (0.28 | ) | | | (0.05 | ) | | | (0.36 | ) |
| | 2013 - A | | | 15.18 | | | | 0.16 | (e) | | | 4.04 | | | | 4.20 | | | | (0.12 | ) |
| | 2013 - C | | | 14.65 | | | | 0.04 | (e) | | | 3.88 | | | | 3.92 | | | | (0.05 | ) |
| | 2013 - Institutional | | | 15.67 | | | | 0.25 | (e) | | | 4.14 | | | | 4.39 | | | | (0.24 | ) |
| | 2013 - Service | | | 15.04 | | | | 0.14 | (e) | | | 3.99 | | | | 4.13 | | | | (0.17 | ) |
| | 2013 - IR | | | 15.65 | | | | 0.25 | (e) | | | 4.10 | | | | 4.35 | | | | (0.23 | ) |
| | 2012 - A | | | 14.06 | | | | 0.11 | | | | 1.26 | | | | 1.37 | | | | (0.25 | ) |
| | 2012 - C | | | 13.54 | | | | — | (f) | | | 1.24 | | | | 1.24 | | | | (0.13 | ) |
| | 2012 - Institutional | | | 14.53 | | | | 0.17 | | | | 1.29 | | | | 1.46 | | | | (0.32 | ) |
| | 2012 - Service | | | 13.98 | | | | 0.09 | | | | 1.25 | | | | 1.34 | | | | (0.28 | ) |
| | 2012 - IR | | | 14.50 | | | | 0.14 | | | | 1.30 | | | | 1.44 | | | | (0.29 | ) |
| | 2011 - A | | | 14.62 | | | | 0.08 | (g) | | | (0.39 | ) | | | (0.31 | ) | | | (0.25 | ) |
| | 2011 - C | | | 14.10 | | | | (0.03 | )(g) | | | (0.38 | ) | | | (0.41 | ) | | | (0.15 | ) |
| | 2011 - Institutional | | | 15.06 | | | | 0.15 | (g) | | | (0.38 | ) | | | (0.23 | ) | | | (0.30 | ) |
| | 2011 - Service | | | 14.53 | | | | 0.06 | (g) | | | (0.38 | ) | | | (0.32 | ) | | | (0.23 | ) |
| | 2011 - IR | | | 15.09 | | | | 0.18 | (g) | | | (0.47 | ) | | | (0.29 | ) | | | (0.30 | ) |
| | 2010 - A | | | 12.27 | | | | 0.04 | (h) | | | 2.74 | | | | 2.78 | | | | (0.43 | ) |
| | 2010 - C | | | 11.85 | | | | (0.05 | )(h) | | | 2.64 | | | | 2.59 | | | | (0.34 | ) |
| | 2010 - Institutional | | | 12.62 | | | | 0.10 | (h) | | | 2.81 | | | | 2.91 | | | | (0.47 | ) |
| | 2010 - Service | | | 12.20 | | | | 0.03 | (h) | | | 2.72 | | | | 2.75 | | | | (0.42 | ) |
| | 2010 - IR (Commenced August 31, 2010) | | | 12.90 | | | | 0.02 | (h) | | | 2.17 | | | | 2.19 | | | | — | |
| | (a) | | Calculated based on the average shares outstanding methodology. |
| | (b) | | Assumes investment at the net asset value at the beginning of the period, reinvestment of all distributions, a complete redemption of the investment at the net asset value at the end of the period and no sales or redemption charges. Total returns would be reduced if a sales or redemption charge was taken into account. Returns do not reflect the deduction of taxes that a shareholder would pay on Fund distributions or the redemption of Fund shares. Total returns for periods less than one full year are not annualized. |
| | (c) | | The Fund’s portfolio turnover rate is calculated in accordance with regulatory requirements, without regard to transactions involving short term investments and certain derivatives. If such transactions were included, the Fund’s portfolio turnover rate may be higher. |
| | (e) | | Reflects income recognized from non-recurring special dividends which amounted to $0.06 per share and 0.31% of average net assets. |
| | (f) | | Amount is less than $0.005 per share. |
| | (g) | | Reflects income recognized from special dividends which amounted to $0.03 per share and 0.16% of average net assets. |
| | (h) | | Reflects income recognized from special dividends which amounted to $0.01 per share and 0.10% of average net assets. |
| | |
| 38 | | The accompanying notes are an integral part of these financial statements. |
GOLDMAN SACHS INTERNATIONAL SMALL CAP FUND
| | | | | | | | | | | | | | | | | | | | | | | | | | | | | | | | | | | | | | | | |
| | | | | | | | | | | | | | | | | | | | | | | | | | | | | | | | | | |
| | | Net asset
value, end
of period | | | | | Total return(b) | | | | | Net assets,
end of period (in 000s) | | | | | Ratio of net expenses to average net assets | | | | | Ratio of
total expenses
to average
net assets | | | | | Ratio of
net investment
income (loss)
to average net assets | | | | | Portfolio
turnover
rate(c) | |
| | | | |
| | $ | 20.05 | | | | | | 7.96 | % | | | | $ | 15,535 | | | | | | 1.37 | %(d) | | | | | 1.81 | %(d) | | | | | 0.93 | %(d) | | | | | 42 | % |
| | | 19.28 | | | | | | 7.59 | | | | | | 3,804 | | | | | | 2.12 | (d) | | | | | 2.56 | (d) | | | | | 0.21 | (d) | | | | | 42 | |
| | | 20.63 | | | | | | 8.19 | | | | | | 156,524 | | | | | | 0.97 | (d) | | | | | 1.40 | (d) | | | | | 1.26 | (d) | | | | | 42 | |
| | | 19.79 | | | | | | 7.95 | | | | | | 1,297 | | | | | | 1.47 | (d) | | | | | 1.91 | (d) | | | | | 0.89 | (d) | | | | | 42 | |
| | | 20.57 | | | | | | 8.13 | | | | | | 5,495 | | | | | | 1.12 | (d) | | | | | 1.56 | (d) | | | | | 1.21 | (d) | | | | | 42 | |
| | | | | | | | | | | | | | | | | | | | | | | | | | | | | | | | | | | | | | | | |
| | | | |
| | | 18.84 | | | | | | (0.48 | ) | | | | | 14,189 | | | | | | 1.50 | | | | | | 1.77 | | | | | | 0.97 | | | | | | 100 | |
| | | 18.08 | | | | | | (1.19 | ) | | | | | 3,183 | | | | | | 2.24 | | | | | | 2.52 | | | | | | 0.17 | | | | | | 100 | |
| | | 19.42 | | | | | | (0.06 | ) | | | | | 173,215 | | | | | | 1.09 | | | | | | 1.37 | | | | | | 1.34 | | | | | | 100 | |
| | | 18.59 | | | | | | (0.57 | ) | | | | | 1,052 | | | | | | 1.59 | | | | | | 1.86 | | | | | | 0.82 | | | | | | 100 | |
| | | 19.36 | | | | | | (0.23 | ) | | | | | 4,686 | | | | | | 1.21 | | | | | | 1.52 | | | | | | 1.16 | | | | | | 100 | |
| | | 19.26 | | | | | | 27.90 | | | | | | 14,029 | | | | | | 1.56 | | | | | | 1.88 | | | | | | 0.94 | (e) | | | | | 89 | |
| | | 18.52 | | | | | | 26.81 | | | | | | 2,389 | | | | | | 2.31 | | | | | | 2.63 | | | | | | 0.22 | (e) | | | | | 89 | |
| | | 19.82 | | | | | | 28.43 | | | | | | 171,473 | | | | | | 1.16 | | | | | | 1.46 | | | | | | 1.39 | (e) | | | | | 89 | |
| | | 19.00 | | | | | | 27.75 | | | | | | 1,035 | | | | | | 1.66 | | | | | | 1.98 | | | | | | 0.87 | (e) | | | | | 89 | |
| | | 19.77 | | | | | | 28.20 | | | | | | 968 | | | | | | 1.31 | | | | | | 1.62 | | | | | | 1.44 | (e) | | | | | 89 | |
| | | 15.18 | | | | | | 9.84 | | | | | | 10,551 | | | | | | 1.58 | | | | | | 2.18 | | | | | | 0.80 | | | | | | 85 | |
| | | 14.65 | | | | | | 9.14 | | | | | | 1,796 | | | | | | 2.33 | | | | | | 2.92 | | | | | | (0.01 | ) | | | | | 85 | |
| | | 15.67 | | | | | | 10.49 | | | | | | 67,614 | | | | | | 1.18 | | | | | | 1.73 | | | | | | 1.14 | | | | | | 85 | |
| | | 15.04 | | | | | | 9.77 | | | | | | 805 | | | | | | 1.68 | | | | | | 2.25 | | | | | | 0.65 | | | | | | 85 | |
| | | 15.65 | | | | | | 10.13 | | | | | | 362 | | | | | | 1.33 | | | | | | 1.84 | | | | | | 0.93 | | | | | | 85 | |
| | | 14.06 | | | | | | (1.97 | ) | | | | | 22,537 | | | | | | 1.60 | | | | | | 1.94 | | | | | | 0.54 | (g) | | | | | 117 | |
| | | 13.54 | | | | | | (2.68 | ) | | | | | 2,177 | | | | | | 2.35 | | | | | | 2.69 | | | | | | (0.23 | )(g) | | | | | 117 | |
| | | 14.53 | | | | | | (1.59 | ) | | | | | 36,067 | | | | | | 1.20 | | | | | | 1.54 | | | | | | 0.95 | (g) | | | | | 117 | |
| | | 13.98 | | | | | | (2.05 | ) | | | | | 730 | | | | | | 1.70 | | | | | | 2.04 | | | | | | 0.41 | (g) | | | | | 117 | |
| | | 14.50 | | | | | | (1.72 | ) | | | | | 24 | | | | | | 1.35 | | | | | | 1.69 | | | | | | 1.12 | (g) | | | | | 117 | |
| | | 14.62 | | | | | | 23.11 | | | | | | 23,503 | | | | | | 1.60 | | | | | | 1.86 | | | | | | 0.31 | (h) | | | | | 155 | |
| | | 14.10 | | | | | | 22.18 | | | | | | 2,120 | | | | | | 2.35 | | | | | | 2.61 | | | | | | (0.43 | )(h) | | | | | 155 | |
| | | 15.06 | | | | | | 23.61 | | | | | | 89,035 | | | | | | 1.20 | | | | | | 1.46 | | | | | | 0.78 | (h) | | | | | 155 | |
| | | 14.53 | | | | | | 22.91 | | | | | | 490 | | | | | | 1.70 | | | | | | 1.96 | | | | | | 0.23 | (h) | | | | | 155 | |
| | | 15.09 | | | | | | 16.74 | | | | | | 1 | | | | | | 1.35 | (d) | | | | | 1.61 | (d) | | | | | 0.73 | (d)(h) | | | | | 155 | |
| | |
| The accompanying notes are an integral part of these financial statements. | | 39 |
GOLDMAN SACHS STRATEGIC INTERNATIONAL EQUITY FUND
Financial Highlights
Selected Data for a Share Outstanding Throughout Each Period
| | | | | | | | | | | | | | | | | | | | | | |
| | | | | | | | Income (loss) from
investment operations | | | | |
| | | Year - Share Class | | Net asset
value, beginning of period | | | Net investment income(a) | | | Net realized and unrealized gain (loss) | | | Total from investment operations | | | Distributions to shareholders from net investment income | |
| | FOR THE SIX MONTHS ENDED APRIL 30, (UNAUDITED) | |
| | 2015 - A | | $ | 13.52 | | | $ | 0.07 | | | $ | 0.61 | | | $ | 0.68 | | | $ | (0.49 | ) |
| | 2015 - C | | | 12.17 | | | | 0.02 | | | | 0.55 | | | | 0.57 | | | | (0.39 | ) |
| | 2015 - Institutional | | | 14.13 | | | | 0.11 | | | | 0.63 | | | | 0.74 | | | | (0.54 | ) |
| | 2015 - IR | | | 13.55 | | | | 0.09 | | | | 0.61 | | | | 0.70 | | | | (0.53 | ) |
| | 2015 - R | | | 13.57 | | | | 0.06 | | | | 0.60 | | | | 0.66 | | | | (0.45 | ) |
| | | | | | | | | | | | | | | | | | | | | | |
| | FOR THE FISCAL YEARS ENDED OCTOBER 31, | |
| | 2014 - A | | | 13.81 | | | | 0.45 | (e) | | | (0.63 | ) | | | (0.18 | ) | | | (0.11 | ) |
| | 2014 - C | | | 12.45 | | | | 0.31 | (e) | | | (0.57 | ) | | | (0.26 | ) | | | (0.02 | ) |
| | 2014 - Institutional | | | 14.44 | | | | 0.52 | (e) | | | (0.67 | ) | | | (0.15 | ) | | | (0.16 | ) |
| | 2014 - IR | | | 13.84 | | | | 0.40 | (e) | | | (0.56 | ) | | | (0.16 | ) | | | (0.13 | ) |
| | 2014 - R | | | 13.88 | | | | 0.41 | (e) | | | (0.63 | ) | | | (0.22 | ) | | | (0.09 | ) |
| | 2013 - A | | | 11.06 | | | | 0.14 | | | | 2.80 | | | | 2.94 | | | | (0.19 | ) |
| | 2013 - C | | | 10.01 | | | | 0.04 | | | | 2.54 | | | | 2.58 | | | | (0.14 | ) |
| | 2013 - Institutional | | | 11.58 | | | | 0.19 | | | | 2.93 | | | | 3.12 | | | | (0.26 | ) |
| | 2013 - IR | | | 11.11 | | | | 0.18 | | | | 2.80 | | | | 2.98 | | | | (0.25 | ) |
| | 2013 - R | | | 11.14 | | | | 0.08 | | | | 2.85 | | | | 2.93 | | | | (0.19 | ) |
| | 2012 - A | | | 10.62 | | | | 0.20 | | | | 0.61 | | | | 0.81 | | | | (0.37 | ) |
| | 2012 - C | | | 9.64 | | | | 0.10 | | | | 0.57 | | | | 0.67 | | | | (0.30 | ) |
| | 2012 - Institutional | | | 11.11 | | | | 0.19 | | | | 0.71 | | | | 0.90 | | | | (0.43 | ) |
| | 2012 - IR | | | 10.70 | | | | 0.21 | | | | 0.63 | | | | 0.84 | | | | (0.43 | ) |
| | 2012 - R | | | 10.57 | | | | 0.16 | | | | 0.64 | | | | 0.80 | | | | (0.23 | ) |
| | 2011 - A | | | 11.71 | | | | 0.28 | (f) | | | (1.25 | ) | | | (0.97 | ) | | | (0.12 | ) |
| | 2011 - C | | | 10.63 | | | | 0.17 | (f) | | | (1.12 | ) | | | (0.95 | ) | | | (0.04 | ) |
| | 2011 - Institutional | | | 12.24 | | | | 0.25 | (f) | | | (1.22 | ) | | | (0.97 | ) | | | (0.16 | ) |
| | 2011 - IR | | | 11.70 | | | | 0.17 | (f) | | | (1.06 | ) | | | (0.89 | ) | | | (0.11 | ) |
| | 2011 - R | | | 11.64 | | | | 0.27 | (f) | | | (1.26 | ) | | | (0.99 | ) | | | (0.08 | ) |
| | 2010 - A | | | 10.55 | | | | 0.10 | | | | 1.19 | | | | 1.29 | | | | (0.13 | ) |
| | 2010 - C | | | 9.59 | | | | 0.01 | | | | 1.09 | | | | 1.10 | | | | (0.06 | ) |
| | 2010 - Institutional | | | 11.02 | | | | 0.10 | | | | 1.28 | | | | 1.38 | | | | (0.16 | ) |
| | 2010 - IR | | | 10.54 | | | | 0.12 | | | | 1.19 | | | | 1.31 | | | | (0.15 | ) |
| | 2010 - R | | | 10.52 | | | | 0.07 | | | | 1.19 | | | | 1.26 | | | | (0.14 | ) |
| | (a) | | Calculated based on the average shares outstanding methodology. |
| | (b) | | Assumes investment at the net asset value at the beginning of the period, reinvestment of all distributions, a complete redemption of the investment at the net asset value at the end of the period and no sales or redemption charges. Total returns would be reduced if a sales or redemption charge was taken into account. Returns do not reflect the deduction of taxes that a shareholder would pay on Fund distributions or the redemption of Fund shares. Total returns for periods less than one full year are not annualized. |
| | (c) | | The Fund’s portfolio turnover rate is calculated in accordance with regulatory requirements, without regard to transactions involving short term investments and certain derivatives. If such transactions were included, the Fund’s portfolio turnover rate may be higher. |
| | (e) | | Reflects income recognized from a corporate action which amounted to $0.33 per share and 2.32% of average net assets. |
| | (f) | | Reflects income recognized from a corporate action which amounted to $0.14 per share and 1.22% of average net assets. |
| | |
| 40 | | The accompanying notes are an integral part of these financial statements. |
GOLDMAN SACHS STRATEGIC INTERNATIONAL EQUITY FUND
| | | | | | | | | | | | | | | | | | | | | | | | | | | | | | | | | | | | | | | | |
| | | | | | | | | | | | | |
| | | Net asset value, end of period | | | | | Total return(b) | | | | | Net assets, end of period (in 000s) | | | | | Ratio of net expenses to average net assets | | | | | Ratio of total expenses to average net assets | | | | | Ratio of net investment income to average net assets | | | | | Portfolio turnover rate(c) | |
| | | | |
| | $ | 13.71 | | | | | | 5.26 | % | | | | $ | 24,397 | | | | | | 1.30 | %(d) | | | | | 1.86 | %(d) | | | | | 1.14 | %(d) | | | | | 42 | % |
| | | 12.35 | | | | | | 4.87 | | | | | | 4,947 | | | | | | 2.05 | (d) | | | | | 2.61 | (d) | | | | | 0.39 | (d) | | | | | 42 | |
| | | 14.33 | | | | | | 5.52 | | | | | | 40,845 | | | | | | 0.90 | (d) | | | | | 1.46 | (d) | | | | | 1.55 | (d) | | | | | 42 | |
| | | 13.72 | | | | | | 5.44 | | | | | | 125 | | | | | | 1.05 | (d) | | | | | 1.60 | (d) | | | | | 1.35 | (d) | | | | | 42 | |
| | | 13.78 | | | | | | 5.11 | | | | | | 18 | | | | | | 1.55 | (d) | | | | | 2.11 | (d) | | | | | 0.89 | (d) | | | | | 42 | |
| | | | | | | | | | | | | | | | | | | | | | | | | | | | | | | | | | | | | | | | |
| | | | |
| | | 13.52 | | | | | | (1.41 | ) | | | | | 22,384 | | | | | | 1.33 | | | | | | 1.77 | | | | | | 3.21 | (e) | | | | | 89 | |
| | | 12.17 | | | | | | (2.10 | ) | | | | | 4,873 | | | | | | 2.08 | | | | | | 2.52 | | | | | | 2.44 | (e) | | | | | 89 | |
| | | 14.13 | | | | | | (1.05 | ) | | | | | 45,118 | | | | | | 0.93 | | | | | | 1.37 | | | | | | 3.55 | (e) | | | | | 89 | |
| | | 13.55 | | | | | | (1.14 | ) | | | | | 128 | | | | | | 1.07 | | | | | | 1.52 | | | | | | 2.86 | (e) | | | | | 89 | |
| | | 13.57 | | | | | | (1.58 | ) | | | | | 17 | | | | | | 1.58 | | | | | | 2.02 | | | | | | 2.92 | (e) | | | | | 89 | |
| | | 13.81 | | | | | | 27.11 | | | | | | 23,850 | | | | | | 1.47 | | | | | | 1.87 | | | | | | 1.16 | | | | | | 102 | |
| | | 12.45 | | | | | | 26.06 | | | | | | 5,700 | | | | | | 2.22 | | | | | | 2.62 | | | | | | 0.37 | | | | | | 102 | |
| | | 14.44 | | | | | | 27.63 | | | | | | 41,058 | | | | | | 1.07 | | | | | | 1.47 | | | | | | 1.51 | | | | | | 102 | |
| | | 13.84 | | | | | | 27.37 | | | | | | 65 | | | | | | 1.22 | | | | | | 1.62 | | | | | | 1.49 | | | | | | 102 | |
| | | 13.88 | | | | | | 26.72 | | | | | | 17 | | | | | | 1.72 | | | | | | 2.11 | | | | | | 0.61 | | | | | | 102 | |
| | | 11.06 | | | | | | 8.17 | | | | | | 21,854 | | | | | | 1.45 | | | | | | 1.95 | | | | | | 1.91 | | | | | | 119 | |
| | | 10.01 | | | | | | 7.35 | | | | | | 5,147 | | | | | | 2.20 | | | | | | 2.70 | | | | | | 1.01 | | | | | | 119 | |
| | | 11.58 | | | | | | 8.58 | | | | | | 23,684 | | | | | | 1.05 | | | | | | 1.51 | | | | | | 1.68 | | | | | | 119 | |
| | | 11.11 | | | | | | 8.42 | | | | | | 79 | | | | | | 1.20 | | | | | | 1.68 | | | | | | 2.01 | | | | | | 119 | |
| | | 11.14 | | | | | | 7.87 | | | | | | 7 | | | | | | 1.70 | | | | | | 2.19 | | | | | | 1.49 | | | | | | 119 | |
| | | 10.62 | | | | | | (8.40 | ) | | | | | 41,862 | | | | | | 1.45 | | | | | | 1.78 | | | | | | 2.36 | (f) | | | | | 139 | |
| | | 9.64 | | | | | | (9.00 | ) | | | | | 6,643 | | | | | | 2.20 | | | | | | 2.53 | | | | | | 1.63 | (f) | | | | | 139 | |
| | | 11.11 | | | | | | (8.04 | ) | | | | | 6,416 | | | | | | 1.05 | | | | | | 1.38 | | | | | | 2.02 | (f) | | | | | 139 | |
| | | 10.70 | | | | | | (7.69 | ) | | | | | 56 | | | | | | 1.20 | | | | | | 1.53 | | | | | | 1.56 | (f) | | | | | 139 | |
| | | 10.57 | | | | | | (8.61 | ) | | | | | 7 | | | | | | 1.70 | | | | | | 2.03 | | | | | | 2.30 | (f) | | | | | 139 | |
| | | 11.71 | | | | | | 12.34 | | | | | | 60,561 | | | | | | 1.45 | | | | | | 1.71 | | | | | | 0.89 | | | | | | 121 | |
| | | 10.63 | | | | | | 11.48 | | | | | | 8,845 | | | | | | 2.20 | | | | | | 2.46 | | | | | | 0.13 | | | | | | 121 | |
| | | 12.24 | | | | | | 12.69 | | | | | | 21,434 | | | | | | 1.05 | | | | | | 1.31 | | | | | | 0.90 | | | | | | 121 | |
| | | 11.70 | | | | | | 12.55 | | | | | | 7 | | | | | | 1.20 | | | | | | 1.46 | | | | | | 1.13 | | | | | | 121 | |
| | | 11.64 | | | | | | 12.06 | | | | | | 28 | | | | | | 1.70 | | | | | | 1.96 | | | | | | 0.67 | | | | | | 121 | |
| | |
| The accompanying notes are an integral part of these financial statements. | | 41 |
GOLDMAN SACHS FUNDAMENTAL INTERNATIONAL EQUITY FUNDS
Notes to Financial Statements
April 30, 2015 (Unaudited)
Goldman Sachs Trust (the “Trust”) is a Delaware statutory trust registered under the Investment Company Act of 1940, as amended (the “Act”), as an open-end management investment company. The following table lists those series of the Trust that are included in this report (collectively, the “Funds” or individually a “Fund”), along with their corresponding share classes and respective diversification status under the Act:
| | | | |
| Fund | | Share Classes Offered | | Diversified/ Non-diversified |
Focused International Equity and International Small Cap | | A, C, Institutional, Service and IR | | Diversified |
Strategic International Equity | | A, C, Institutional, IR and R | | Diversified |
Class A Shares are sold with a front-end sales charge of up to 5.50%. Class C Shares are sold with a contingent deferred sales charge (“CDSC”) of 1.00%, which is imposed on redemptions made within 12 months of purchase. Institutional, Service, Class IR and Class R Shares are not subject to a sales charge.
At the close of business on November 14, 2014, Class B Shares of each Fund were converted to Class A Shares of the Fund.
Goldman Sachs Asset Management International (“GSAMI”), an affiliate of Goldman, Sachs & Co. (“Goldman Sachs”), serves as investment adviser to the Funds pursuant to a management agreement (the “Agreement”) with the Trust.
|
| 2. SIGNIFICANT ACCOUNTING POLICIES |
The financial statements have been prepared in accordance with accounting principles generally accepted in the United States of America (“GAAP”) and require management to make estimates and assumptions that may affect the reported amounts and disclosures. Actual results may differ from those estimates and assumptions.
A. Investment Valuation — The Funds’ valuation policy is to value investments at fair value.
B. Investment Income and Investments — Investment income includes interest income and dividend income, net of any foreign withholding taxes, less any amounts reclaimable. Interest income is accrued daily and adjusted for amortization of premiums and accretion of discounts. Dividend income is recognized on ex-dividend date or, for certain foreign securities, as soon as such information is obtained subsequent to the ex-dividend date. Investment transactions are reflected on trade date. Realized gains and losses are calculated using identified cost. Investment transactions are recorded on the following business day for daily net asset value (“NAV”) calculations. Any foreign capital gains tax is accrued daily based upon net unrealized gains, and is payable upon sale of such investments. Distributions received from the Funds’ investments in United States (“U.S.”) real estate investment trusts (“REITs”) may be characterized as ordinary income, net capital gain or a return of capital. A return of capital is recorded by the Funds as a reduction to the cost basis of the REIT.
For derivative contracts, realized gains and losses are recorded upon settlement of the contract.
42
GOLDMAN SACHS FUNDAMENTAL INTERNATIONAL EQUITY FUNDS
|
| 2. SIGNIFICANT ACCOUNTING POLICIES (continued) |
C. Class Allocations and Expenses — Investment income, realized and unrealized gain (loss), and non-class specific expenses of each Fund are allocated daily based upon the proportion of net assets of each class. Class specific expenses, where applicable, are borne by the respective share classes and include Distribution and Service, Transfer Agent and Service and Shareholder Administration fees. Non-class specific expenses directly incurred by a Fund are charged to that Fund, while such expenses incurred by the Trust are allocated across the respective Funds on a straight-line and/or pro-rata basis depending upon the nature of the expenses.
D. Federal Taxes and Distributions to Shareholders — It is each Fund’s policy to comply with the requirements of the Internal Revenue Code of 1986, as amended (the “Code”), applicable to regulated investment companies (mutual funds) and to distribute each year substantially all of its investment company taxable income and capital gains to its shareholders. Accordingly, the Funds are not required to make any provisions for the payment of federal income tax. Distributions to shareholders are recorded on the ex-dividend date. Income and capital gains distributions, if any, are declared and paid annually.
Net capital losses are carried forward to future fiscal years and may be used to the extent allowed by the Code to offset any future capital gains. Utilization of capital loss carryforwards will reduce the requirement of future capital gains distributions.
Under the Regulated Investment Company Modernization Act of 2010, the Funds are permitted to carry forward capital losses incurred in taxable years beginning after December 22, 2010 for an unlimited period. However, any losses incurred during those future taxable years will be required to be utilized prior to the losses incurred in pre-enactment taxable years. As a result of this ordering rule, pre-enactment capital loss carryforwards may be more likely to expire unused. Additionally, post-enactment capital losses that are carried forward will retain their character as either short-term or long-term capital losses rather than being considered all short-term as under previous law.
The characterization of distributions to shareholders for financial reporting purposes is determined in accordance with federal income tax rules, which may differ from GAAP. The source of each Fund’s distributions may be shown in the accompanying financial statements as either from net investment income, net realized gain or capital. Certain components of the Funds’ net assets on the Statements of Assets and Liabilities reflect permanent GAAP/tax differences based on the appropriate tax character.
E. Foreign Currency Translation — The accounting records and reporting currency of the Funds are maintained in U.S. dollars. Assets and liabilities denominated in foreign currencies are translated into U.S. dollars using the current exchange rates at the close of each business day. The effect of changes in foreign currency exchange rates on investments is included within net realized and unrealized gain (loss) on investments. Changes in the value of other assets and liabilities as a result of fluctuations in foreign exchange rates are included in the Statements of Operations within net change in unrealized gain (loss) on foreign currency transactions. Transactions denominated in foreign currencies are translated into U.S. dollars on the date the transaction occurred, the effects of which are included within net realized gain (loss) on foreign currency transactions.
|
| 3. INVESTMENTS AND FAIR VALUE MEASUREMENTS |
The fair value of a financial instrument is the amount that would be received to sell an asset or paid to transfer a liability in an orderly transaction between market participants at the measurement date (i.e., the exit price). GAAP establishes a fair value
43
GOLDMAN SACHS FUNDAMENTAL INTERNATIONAL EQUITY FUNDS
Notes to Financial Statements (continued)
April 30, 2015 (Unaudited)
|
| 3. INVESTMENTS AND FAIR VALUE MEASUREMENTS (continued) |
hierarchy that prioritizes the inputs to valuation techniques used to measure fair value. The hierarchy gives the highest priority to unadjusted quoted prices in active markets for identical assets or liabilities (Level 1 measurements) and the lowest priority to unobservable inputs (Level 3 measurements). The levels used for classifying investments are not necessarily an indication of the risk associated with investing in these investments. The three levels of the fair value hierarchy are described below:
Level 1 — Unadjusted quoted prices in active markets that are accessible at the measurement date for identical, unrestricted assets or liabilities;
Level 2 — Quoted prices in markets that are not active or financial instruments for which significant inputs are observable (including, but not limited to, quoted prices for similar investments, interest rates, foreign exchange rates, volatility and credit spreads), either directly or indirectly;
Level 3 — Prices or valuations that require significant unobservable inputs (including GSAMI’s assumptions in determining fair value measurement).
The Trustees have adopted Valuation Procedures that govern the valuation of the portfolio investments held by the Funds, including investments for which market quotations are not readily available. The Trustees have delegated to GSAMI day-to-day responsibility for implementing and maintaining internal controls and procedures related to the valuation of the Funds’ portfolio investments. To assess the continuing appropriateness of pricing sources and methodologies, GSAMI regularly performs price verification procedures and issues challenges as necessary to third party pricing vendors or brokers, and any differences are reviewed in accordance with the Valuation Procedures.
A. Level 1 and Level 2 Fair Value Investments — The valuation techniques and significant inputs used in determining the fair values for investments classified as Level 1 and Level 2 are as follows:
Equity Securities — Equity securities and investment companies traded on a U.S. securities exchange or the NASDAQ system, or those located on certain foreign exchanges, including but not limited to the Americas, are valued daily at their last sale price or official closing price on the principal exchange or system on which they are traded. If there is no sale or official closing price or it is believed by the investment adviser to not represent fair value, equity securities and exchange traded investment companies are valued at the last bid price for long positions and at the last ask price for short positions. Investments in investment companies (other than those that are exchange traded) are valued at the NAV on the valuation date. To the extent these investments are actively traded, they are classified as Level 1 of the fair value hierarchy, otherwise they are generally classified as Level 2.
Unlisted equity securities for which market quotations are available are valued at the last sale price on the valuation date, or if no sale occurs, at the last bid price. Securities traded on certain foreign securities exchanges are valued daily at fair value determined by an independent fair value service (if available) under Valuation Procedures approved by the Trustees and consistent with applicable regulatory guidance. The independent fair value service takes into account multiple factors including, but not limited to, movements in the securities markets, certain depositary receipts, futures contracts and foreign currency exchange rates that have occurred subsequent to the close of the foreign securities exchange. These investments are generally classified as Level 2 of the fair value hierarchy.
44
GOLDMAN SACHS FUNDAMENTAL INTERNATIONAL EQUITY FUNDS
|
| 3. INVESTMENTS AND FAIR VALUE MEASUREMENTS (continued) |
Derivative Contracts — A derivative is an instrument whose value is derived from underlying assets, indices, reference rates or a combination of these factors. The Funds enter into derivative transactions to hedge against changes in interest rates, securities prices, and/or currency exchange rates, to increase total return, or to gain access to certain markets or attain exposure to other underliers.
Exchange-traded derivatives, including futures contracts, are valued at the last sale or settlement price and typically fall within Level 1 of the fair value hierarchy. Over-the-counter (“OTC”) and centrally cleared derivatives are valued using market transactions and other market evidence, including market-based inputs to models, calibration to market-clearing transactions, broker or dealer quotations, or other alternative pricing sources. Where models are used, the selection of a particular model to value OTC and centrally cleared derivatives depends upon the contractual terms of, and specific risks inherent in, the instrument, as well as the availability of pricing information in the market. Valuation models require a variety of inputs, including contractual terms, market prices, yield curves, credit curves, measures of volatility, voluntary and involuntary prepayment rates, loss severity rates and correlations of such inputs. For OTC and centrally cleared derivatives that trade in liquid markets, model inputs can generally be verified and model selection does not involve significant management judgment. OTC and centrally cleared derivatives are classified within Level 2 of the fair value hierarchy when significant inputs are corroborated by market evidence.
i. Forward Contracts — A forward contract is a contract between two parties to buy or sell an asset at a specified price on a future date. A forward contract settlement can occur on a cash or delivery basis. Forward contracts are marked-to-market daily using independent vendor prices, and the change in value, if any, is recorded as an unrealized gain or loss.
A forward foreign currency contract is a forward contract in which a Fund agrees to receive or deliver a fixed quantity of one currency for another, at a pre-determined price at a future date. All forward foreign currency exchange contracts are settled with the counterparty in cash without the delivery of foreign currency.
ii. Futures Contracts — Futures contracts are contracts to buy or sell a standardized quantity of a specified commodity or security and are valued based on exchanged settlement prices or independent market quotes. Futures contracts are valued at the last settlement price, or in the absence of a sale, the last bid price for long positions and at the last ask price for short positions, at the end of each day on the board of trade or exchange upon which they are traded. Upon entering into a futures contract, a Fund deposits cash or securities in an account on behalf of the broker in an amount sufficient to meet the initial margin requirement. Subsequent payments are made or received by a Fund equal to the daily change in the contract value and are recorded as variation margin receivable or payable with a corresponding offset to unrealized gains or losses.
B. Level 3 Fair Value Investments — To the extent that significant inputs to valuation models and other alternative pricing sources are unobservable, or if quotations are not readily available, or if GSAMI believes that such quotations do not accurately reflect fair value, the fair value of the Funds’ investments may be determined under Valuation Procedures approved by the Trustees. GSAMI, consistent with its procedures and applicable regulatory guidance, may make an adjustment to the most recent valuation prices of either domestic or foreign securities in light of significant events to reflect what it believes to be the fair value of the securities at the time of determining a Fund’s NAV. Significant events which could affect a large number of securities in a particular market may include, but are not limited to: significant fluctuations in U.S. or foreign markets; market dislocations; market disruptions; or unscheduled market closings. Significant events which could also affect a single issuer may include, but are not limited to: corporate actions such as reorganizations, mergers and buy-outs; ratings downgrades; and bankruptcies.
45
GOLDMAN SACHS FUNDAMENTAL INTERNATIONAL EQUITY FUNDS
Notes to Financial Statements (continued)
April 30, 2015 (Unaudited)
|
| 3. INVESTMENTS AND FAIR VALUE MEASUREMENTS (continued) |
C. Fair Value Hierarchy — The following is a summary of the Funds’ investments and derivatives classified in the fair value hierarchy as of April 30, 2015:
| | | | | | | | | | | | |
| | | |
| FOCUSED INTERNATIONAL EQUITY | | | | | | | | | | | | |
| | | |
| Investment Type | | Level 1 | | | Level 2 | | | Level 3 | |
| Assets | | | | | | | | | | | | |
Common Stock and/or Other Equity Investments(a) | | | | | | | | | | | | |
Asia | | $ | — | | | $ | 67,314,033 | | | $ | — | |
Australia and Oceania | | | — | | | | 9,074,616 | | | | — | |
Europe | | | — | | | | 128,625,956 | | | | — | |
North America | | | 7,661,099 | | | | — | | | | — | |
| Total | | $ | 7,661,099 | | | $ | 205,014,605 | | | $ | — | |
| | | |
| INTERNATIONAL SMALL CAP | | | | | | | | | | | | |
| | | |
| Investment Type | | Level 1 | | | Level 2 | | | Level 3 | |
| Assets | | | | | | | | | | | | |
Common Stock and/or Other Equity Investments(a) | | | | | | | | | | | | |
Africa | | $ | — | | | $ | 1,170,405 | | | $ | — | |
Asia | | | 2,508,335 | | | | 50,885,617 | | | | — | |
Australia and Oceania | | | — | | | | 10,003,440 | | | | — | |
Europe | | | — | | | | 94,309,174 | | | | — | |
North America | | | 15,746,918 | | | | — | | | | — | |
| Total | | $ | 18,255,253 | | | $ | 156,368,636 | | | $ | — | |
| | | |
| Derivative Type | | | | | | | | | |
| Liabilities(b) | | | | | | | | | | | | |
Futures Contracts | | $ | (10,040 | ) | | $ | — | | | $ | — | |
| | | |
| STRATEGIC INTERNATIONAL EQUITY | | | | | | | | | | | | |
| | | |
| Investment Type | | Level 1 | | | Level 2 | | | Level 3 | |
| Assets | | | | | | | | | | | | |
Common Stock and/or Other Equity Investments(a) | | | | | | | | | | | | |
Asia | | $ | — | | | $ | 16,905,826 | | | $ | — | |
Australia and Oceania | | | — | | | | 2,391,033 | | | | — | |
Europe | | | — | | | | 43,470,460 | | | | — | |
North America | | | 4,037,555 | | | | — | | | | — | |
| Total | | $ | 4,037,555 | | | $ | 62,767,319 | | | $ | — | |
| (a) | | Amounts are disclosed by continent to highlight the impact of time zone differences between local market close and the calculation of NAV. Security valuations are based on the principal exchange or system on which they are traded, which may differ from country of domicile. The Funds utilize fair value model prices provided by an independent fair value service for international equities, resulting in a Level 2 classification. |
| (b) | | Amount shown represents unrealized loss at period end. |
For further information regarding security characteristics, see the Schedules of Investments.
46
GOLDMAN SACHS FUNDAMENTAL INTERNATIONAL EQUITY FUNDS
|
| 4. INVESTMENTS IN DERIVATIVES |
The following table sets forth, by certain risk types, the gross value of derivative contracts as of April 30, 2015. These instruments were used to meet the Fund’s investment objectives and to obtain and/or manage exposure related to the risks below. The values in the table below exclude the effects of cash collateral received or posted pursuant to these derivative contracts, and therefore are not representative of the Fund’s net exposure:
| | | | | | | | | | |
| Fund | | | | Risk | | Statements of Assets and Liabilities | | Liabilities | |
International Small Cap | | | | Equity | | Variation margin on certain derivative contracts | | $ | (10,040) | (a) |
| (a) | | Includes unrealized gain (loss) on futures contracts described in the Additional Investment Information sections of the Schedules of Investments. Only current day’s variation margin is reported within the Statement of Assets and Liabilities. |
The following table sets forth, by certain risk types, the Fund’s gains (losses) related to these derivatives and their indicative volumes for the six months ended April 30, 2015. These gains (losses) should be considered in the context that these derivative contracts may have been executed to create investment opportunities and/or economically hedge certain investments, and accordingly, certain gains (losses) on such derivative contracts may offset certain (losses) gains attributable to investments. These gains (losses) are included in “Net realized gain (loss)” or “Net change in unrealized gain (loss)” on the Statements of Operations:
| | | | | | | | | | | | | | |
| | | |
| INTERNATIONAL SMALL CAP | | | | | | | | | | | | |
| Risk | | Statements of Operations | | Net Realized
Gain (Loss) | | | Net Change in
Unrealized
Gain (Loss) | | | Average
Number of
Contracts(a) | |
| Currency | | Net realized gain (loss) from forward foreign currency exchange contracts/Net change in unrealized gain (loss) on forward foreign currency exchange contracts | | $ | (107,513 | ) | | $ | 100,593 | | | | 1 | |
| Equity | | Net realized gain (loss) from futures contracts/Net change in unrealized gain (loss) on futures contracts | | | 119,613 | | | | (18,715 | ) | | | 22 | |
| Total | | | | $ | 12,100 | | | $ | 81,878 | | | | 23 | |
| (a) | | Average number of contracts is based on the average of month end balances for the period ended April 30, 2015. |
|
| 5. AGREEMENTS AND AFFILIATED TRANSACTIONS |
A. Management Agreement — Under the Agreement, GSAMI manages the Funds, subject to the general supervision of the Trustees.
As compensation for the services rendered pursuant to the Agreement, the assumption of the expenses related thereto and administration of the Funds’ business affairs, including providing facilities, GSAMI is entitled to a management fee, accrued daily and paid monthly, equal to an annual percentage rate of each Fund’s average daily net assets.
47
GOLDMAN SACHS FUNDAMENTAL INTERNATIONAL EQUITY FUNDS
Notes to Financial Statements (continued)
April 30, 2015 (Unaudited)
|
| 5. AGREEMENTS AND AFFILIATED TRANSACTIONS (continued) |
For the six months ended April 30, 2015, contractual and effective net management fees with GSAMI were at the following rates:
| | | | | | | | | | | | | | | | | | | | | | | | | | | | | | |
| | | | | Contractual Management Rate | | | Effective Net
Management
Rate^ | |
| Fund | | | | First $1 billion | | | Next $1 billion | | | Next $3 billion | | | Next $3 billion | | | Over $8 billion | | | Effective
Rate | | |
Focused International Equity | | | | | 1.00 | % | | | 0.90 | % | | | 0.86 | % | | | 0.84 | % | | | 0.82 | % | | | 1.00 | % | | | 0.85 | %* |
International Small Cap | | | | | 1.10 | | | | 1.10 | | | | 0.99 | | | | 0.94 | | | | 0.92 | | | | 1.10 | | | | 0.90 | * |
Strategic International Equity | | | | | 0.85 | | | | 0.77 | | | | 0.73 | | | | 0.72 | | | | 0.71 | | | | 0.85 | | | | 0.85 | |
| ^ | | Effective Net Management Rate includes the impact of management fee waivers of affiliated underlying funds, if any. |
| * | | GSAMI agreed to waive a portion of its management fee in order to achieve effective net management fee rates of 0.85% and 0.90% for the Focused International Equity and International Small Cap Funds, respectively, through at least February 29, 2016. Prior to such date GSAMI may not terminate the arrangement without the approval of the Trustees. |
B. Distribution and Service Plans — The Trust, on behalf of each Fund, has adopted Distribution and Service Plans (the “Plans”). Under the Plans, Goldman Sachs, which serves as distributor (the “Distributor”), is entitled to a fee accrued daily and paid monthly, for distribution services and personal and account maintenance services, which may then be paid by Goldman Sachs to authorized dealers, at the following annual rates calculated on a Fund’s average daily net assets of each respective share class:
| | | | | | | | | | | | |
| | | Distribution and Service Plan Rates | |
| | | Class A* | | | Class C | | | Class R* | |
Distribution Plan | | | 0.25 | % | | | 0.75 | % | | | 0.50 | % |
Service Plan | | | — | | | | 0.25 | | | | — | |
| * | | With respect to Class A and Class R Shares, the Distributor at its discretion may use compensation for distribution services paid under the Distribution Plan to compensate service organizations for personal and account maintenance services and expenses as long as such total compensation does not exceed the maximum cap on “service fees” imposed by the Financial Industry Regulatory Authority. |
C. Distribution Agreement — Goldman Sachs, as Distributor of the shares of the Funds pursuant to a Distribution Agreement, may retain a portion of the Class A front end sales charge and Class C Shares’ CDSC. During the six months ended April 30, 2015, Goldman Sachs advised that it retained the following amounts:
| | | | | | | | | | |
| | | | | Front End
Sales Charge | | | Contingent Deferred
Sales Charge | |
| Fund | | | | Class A | | | Class C | |
Focused International Equity | | | | $ | 2,619 | | | $ | 239 | |
International Small Cap | | | | | 755 | | | | — | |
Strategic International Equity | | | | | 1,668 | | | | — | |
D. Service Plan and Shareholder Administration Plan — The Trust, on behalf of each Fund that offers Service Shares, has adopted a Service Plan and a Shareholder Administration Plan. These plans allow for service organizations to provide varying levels of personal and account maintenance and shareholder administration services to their customers who are beneficial owners of such shares. The Service Plan and Shareholder Administration Plan each provide for compensation to the service organizations which is accrued daily and paid monthly at an annual rate of 0.25% (0.50% in aggregate) of the average daily net assets of the Service Shares.
48
GOLDMAN SACHS FUNDAMENTAL INTERNATIONAL EQUITY FUNDS
|
| 5. AGREEMENTS AND AFFILIATED TRANSACTIONS (continued) |
E. Transfer Agency Agreement — Goldman Sachs also serves as the transfer agent of the Funds for a fee pursuant to the Transfer Agency Agreement. The fees charged for such transfer agency services are accrued daily and paid monthly at annual rates as follows: 0.19% of the average daily net assets of Class A, Class C, Class IR and Class R Shares; and 0.04% of the average daily net assets of Institutional and Service Shares.
F. Other Expense Agreements and Affiliated Transactions — GSAMI has agreed to limit certain “Other Expenses” of the Funds (excluding acquired fund fees and expenses, transfer agency fees and expenses, service fees and shareholder administration fees (as applicable), taxes, interest, brokerage fees, shareholder meetings, litigation, indemnification and extraordinary expenses) to the extent such expenses exceed, on an annual basis, a percentage rate of the average daily net assets of each Fund. Such Other Expense reimbursements, if any, are accrued daily and paid monthly. In addition, the Funds are not obligated to reimburse GSAMI for prior fiscal year expense reimbursements, if any. The Other Expense limitations as an annual percentage rate of average daily net assets for the Focused International Equity, International Small Cap and Strategic International Equity Funds are 0.014%, 0.034% and 0.014%, respectively. These Other Expense limitations will remain in place through at least February 29, 2016, and prior to such date GSAMI may not terminate the arrangements without the approval of the Trustees. The Funds bear their respective share of costs related to proxy and shareholder meetings and GSAMI has agreed to reimburse each Fund to the extent such expenses exceed a specified percentage of the Fund’s net assets. In addition, the Funds have entered into certain offset arrangements with the custodian and the transfer agent, which may result in a reduction of the Funds’ expenses and are received irrespective of the application of the “Other Expense” limitations described above.
For the six months ended April 30, 2015, these expense reductions, including any fee waivers and Other Expense reimbursements, were as follows:
| | | | | | | | | | | | | | | | | | |
| Fund | | | | Management
Fee Waiver | | | Custody Fee
Credits | | | Other Expense
Reimbursement | | | Total Expense
Reductions | |
Focused International Equity | | | | $ | 166,249 | | | $ | 2,037 | | | $ | 204,645 | | | $ | 372,931 | |
International Small Cap | | | | | 190,209 | | | | 1,773 | | | | 220,659 | | | | 412,641 | |
Strategic International Equity | | | | | — | | | | 748 | | | | 182,454 | | | | 183,202 | |
G. Line of Credit Facility — As of April 30, 2015, the Funds participated in a $1,080,000,000 committed, unsecured revolving line of credit facility (the “facility”) together with other funds of the Trust and registered investment companies having management agreements with GSAMI or its affiliates (“Other Borrowers”). Pursuant to the terms of the facility, the Funds and Other Borrowers could increase the credit amount by an additional $120,000,000, for a total of up to $1,200,000,000. This facility is to be used for temporary emergency purposes, or to allow for an orderly liquidation of securities to meet redemption requests. The interest rate on borrowings is based on the federal funds rate. The facility also requires a fee to be paid by the Funds based on the amount of the commitment that has not been utilized. For the six months ended April 30, 2015, the Funds did not have any borrowings under the facility. The facility was increased to $1,205,000,000 effective May 5, 2015.
H. Other Transactions with Affiliates — For the six months ended April 30, 2015, Goldman Sachs earned $902 in brokerage commissions from portfolio transactions, including futures transactions executed with Goldman Sachs as the Futures Commission Merchant, on behalf of the International Small Cap Fund.
As of April 30, 2015, the Goldman Sachs Satellite Strategies Portfolio was the beneficial owner of approximately 39% of total outstanding shares of the International Small Cap Fund.
As of April 30, 2015, the Goldman Sachs Group, Inc. was the beneficial owner of approximately 8% and 53% of the Class IR and Class R Shares of the Strategic International Equity Fund, respectively.
49
GOLDMAN SACHS FUNDAMENTAL INTERNATIONAL EQUITY FUNDS
Notes to Financial Statements (continued)
April 30, 2015 (Unaudited)
|
| 6. PORTFOLIO SECURITIES TRANSACTIONS |
The cost of purchases and proceeds from sales and maturities of long-term securities for the six months ended April 30, 2015, were as follows:
| | | | | | | | | | |
| Fund | | | | Purchases | | | Sales and Maturities | |
Focused International Equity | | | | $ | 106,001,013 | | | $ | 151,857,051 | |
International Small Cap | | | | | 77,122,166 | | | | 105,859,512 | |
Strategic International Equity | | | | | 26,920,516 | | | | 35,011,295 | |
As of the Funds’ most recent fiscal year end, October 31, 2014, the Funds’ capital loss carryforwards on a tax-basis were as follows:
| | | | | | | | | | | | | | |
| | | | | Focused International
Equity | | | International Small
Cap | | | Strategic International
Equity | |
Capital loss carryforwards(1): | | | | | | | | | | | | | | |
Expiring 2016 | | | | $ | (89,358,426 | ) | | $ | — | | | $ | (15,319,008 | ) |
Expiring 2017 | | | | | (106,107,378 | ) | | | (8,401,592 | ) | | | (28,233,535 | ) |
Expiring 2019 | | | | | (9,250,431 | ) | | | — | | | | — | |
Total capital loss carryforwards | | | | $ | (204,716,235 | ) | | $ | (8,401,592 | ) | | $ | (43,552,543 | ) |
| (1) | | Expiration occurs on October 31 of the year indicated. |
As of April 30, 2015, the Funds’ aggregate security unrealized gains and losses based on cost for U.S. federal income tax purposes were as follows:
| | | | | | | | | | | | | | |
| | | | | Focused International
Equity | | | International Small
Cap | | | Strategic International
Equity | |
Tax cost | | | | $ | 219,716,938 | | | $ | 169,727,411 | | | $ | 63,743,881 | |
Gross unrealized gain | | | | | 9,616,353 | | | | 15,340,417 | | | | 6,337,511 | |
Gross unrealized loss | | | | | (16,657,587 | ) | | | (10,443,939 | ) | | | (3,276,518 | ) |
Net unrealized security gain (loss) | | | | $ | (7,041,234 | ) | | $ | 4,896,478 | | | $ | 3,060,993 | |
The difference between GAAP-basis and tax-basis unrealized gains (losses) is attributable primarily to wash sales and differences related to the tax treatment of passive foreign investment company investments.
GSAMI has reviewed the Funds’ tax positions for all open tax years (the current and prior three years, as applicable) and has concluded that no provision for income tax is required in the Funds’ financial statements. Such open tax years remain subject to examination and adjustment by tax authorities.
The Funds’ risks include, but are not limited to, the following:
Foreign Custody Risk — A Fund that invests in foreign securities may hold such securities and foreign currency with foreign banks, agents, and securities depositories appointed by the Fund’s custodian (each a “Foreign Custodian”). Some foreign
50
GOLDMAN SACHS FUNDAMENTAL INTERNATIONAL EQUITY FUNDS
|
| 8. OTHER RISKS (continued) |
custodians may be recently organized or new to the foreign custody business. In some countries, Foreign Custodians may be subject to little or no regulatory oversight or independent evaluation of their operations. Further, the laws of certain countries may place limitations on a Fund’s ability to recover its assets if a Foreign Custodian enters bankruptcy. Investments in emerging markets may be subject to greater custody risks than investments in more developed markets. Custody services in emerging market countries are very often undeveloped and may be considerably less well regulated than in more developed countries, and thus may not afford the same level of investor protection as would apply in developed countries.
Investments in Other Investment Companies — As a shareholder of another investment company, including an exchange traded fund (“ETF”), a Fund will directly bear its proportionate share of any net management fees and other expenses paid by such other investment companies, in addition to the fees and expenses regularly borne by the Fund. ETFs are subject to risks that do not apply to conventional mutual funds, including but not limited to the following: (i) the market price of the ETF’s shares may trade at a premium or a discount to their NAV; and (ii) an active trading market for an ETF’s shares may not develop or be maintained.
Issuer Concentration Risk — The Focused International Equity Fund intends to invest in a relatively small number of issuers. As a result, it may be subject to greater risks than a fund that invests in a greater number of issuers. A change in the value of any single investment held by the Fund may affect the overall value of the Fund more than it would affect a mutual fund that holds more investments. In particular, the Fund may be more susceptible to adverse developments affecting any single issuer in the Fund and may be susceptible to greater losses because of these developments.
Large Shareholder Transactions Risk — A Fund may experience adverse effects when certain large shareholders, such as other funds, institutional investors (including those trading by use of non-discretionary mathematical formulas), financial intermediaries (who may make investment decisions on behalf of underlying clients and/or include a Fund in their investment model), individuals, accounts and Goldman Sachs affiliates, purchase or redeem large amounts of shares of a Fund. Such large shareholder redemptions may cause the Fund to sell portfolio securities at times when it would not otherwise do so, which may negatively impact a Fund’s NAV and liquidity. Similarly, large Fund share purchases may adversely affect a Fund’s performance to the extent that a Fund is delayed in investing new cash and is required to maintain a larger cash position than it ordinarily would. These transactions may also accelerate the realization of taxable income to shareholders if such sales of investments resulted in gains, and may also increase transaction costs. In addition, a large redemption could result in a Fund’s current expenses being allocated over a smaller asset base, leading to an increase in the Fund’s expense ratio.
Liquidity Risk — The Funds may make investments that are illiquid or that may become less liquid in response to market developments or adverse investor perceptions. Illiquid investments may be more difficult to value. Liquidity risk may also refer to the risk that a Fund will not be able to pay redemption proceeds within the allowable time period because of unusual market conditions, an unusually high volume of redemption requests, or other reasons. To meet redemption requests, a Fund may be forced to sell investments at an unfavorable time and/or under unfavorable conditions.
Market and Credit Risks — In the normal course of business, the Funds trade financial instruments and enter into financial transactions where risk of potential loss exists due to changes in the market (market risk). Additionally, the Funds may also be exposed to credit risk in the event that an issuer or guarantor fails to perform or that an institution or entity with which the Funds have unsettled or open transactions defaults.
Investing in foreign markets may involve special risks and considerations not typically associated with investing in the U.S. Foreign securities may be subject to risk of loss because of more or less foreign government regulation, less public information and less economic, political and social stability in the countries in which the Fund invests. Loss may also result from the imposition of exchange controls, confiscations and other government restrictions by the U.S. or other governments, or from problems in registration, settlement or custody. Foreign risk also involves the risk of negative foreign currency rate fluctuations, which may cause the value of securities denominated in such foreign currency (or other instruments through which the Fund has exposure to foreign currencies) to decline in value. Currency exchange rates may fluctuate significantly over short periods of time. To the extent that the Fund also invests in securities of issuers located in emerging markets, these risks may be more pronounced.
51
GOLDMAN SACHS FUNDAMENTAL INTERNATIONAL EQUITY FUNDS
Notes to Financial Statements (continued)
April 30, 2015 (Unaudited)
Under the Trust’s organizational documents, its Trustees, officers, employees and agents are indemnified, to the extent permitted by the Act and state law, against certain liabilities that may arise out of performance of their duties to the Funds. Additionally, in the course of business, the Funds enter into contracts that contain a variety of indemnification clauses. The Funds’ maximum exposure under these arrangements is unknown, as this would involve future claims that may be made against the Funds that have not yet occurred. However, GSAMI believes the risk of loss under these arrangements to be remote.
Subsequent events after the Statement of Assets and Liabilities date have been evaluated through the date the financial statements were issued. GSAMI has concluded that there is no impact requiring adjustment or disclosure in the financial statements.
52
GOLDMAN SACHS FUNDAMENTAL INTERNATIONAL EQUITY FUNDS
Notes to Financial Statements (continued)
April 30, 2015 (Unaudited)
|
| 11. SUMMARY OF SHARE TRANSACTIONS |
Share activity is as follows:
| | | | | | | | | | | | | | | | |
| | | Focused International Equity Fund | |
| | | | |
| | | For the Six Months Ended
April 30, 2015
(Unaudited) | | | For the Fiscal Year Ended
October 31, 2014 | |
| | | | |
| | | Shares | | | Dollars | | | Shares | | | Dollars | |
| | | | |
| Class A Shares | | | | | | | | | | | | | | | | |
Shares sold | | | 151,424 | | | $ | 2,734,304 | | | | 810,545 | | | $ | 16,129,234 | |
Shares converted from Class B | | | 4,363 | | | | 79,894 | | | | 1,752 | | | | 34,678 | |
Reinvestment of distributions | | | 94,946 | | | | 1,684,348 | | | | 11,140 | | | | 220,455 | |
Shares redeemed | | | (522,592 | ) | | | (9,266,071 | ) | | | (729,100 | ) | | | (14,367,121 | ) |
| | | | (271,859 | ) | | | (4,767,525 | ) | | | 94,337 | | | | 2,017,246 | |
| Class B Shares(a) | | | | | | | | | | | | | | | | |
Shares sold | | | — | | | | — | | | | 1,969 | | | | 37,951 | |
Shares converted to Class A | | | (4,448 | ) | | | (79,894 | ) | | | (1,778 | ) | | | (34,678 | ) |
Shares redeemed | | | (10,228 | ) | | | (183,739 | ) | | | (14,882 | ) | | | (290,077 | ) |
| | | | (14,676 | ) | | | (263,633 | ) | | | (14,691 | ) | | | (286,804 | ) |
| Class C Shares | | | | | | | | | | | | | | | | |
Shares sold | | | 125,269 | | | | 2,080,654 | | | | 302,550 | | | | 5,604,612 | |
Reinvestment of distributions | | | 26,339 | | | | 435,904 | | | | — | | | | — | |
Shares redeemed | | | (140,726 | ) | | | (2,367,104 | ) | | | (200,946 | ) | | | (3,633,294 | ) |
| | | | 10,882 | | | | 149,454 | | | | 101,604 | | | | 1,971,318 | |
| Institutional Shares | | | | | | | | | | | | | | | | |
Shares sold | | | 627,844 | | | | 11,298,805 | | | | 5,268,434 | | | | 106,829,174 | |
Reinvestment of distributions | | | 296,452 | | | | 5,345,040 | | | | 45,024 | | | | 905,437 | |
Shares redeemed | | | (2,251,474 | ) | | | (40,966,915 | ) | | | (1,779,054 | ) | | | (35,339,890 | ) |
| | | | (1,327,178 | ) | | | (24,323,070 | ) | | | 3,534,404 | | | | 72,394,721 | |
| Service Shares | | | | | | | | | | | | | | | | |
Shares sold | | | 516 | | | | 9,234 | | | | 1,479 | | | | 29,637 | |
Reinvestment of distributions | | | 63 | | | | 1,120 | | | | 6 | | | | 107 | |
Shares redeemed | | | (16,435 | ) | | | (284,841 | ) | | | (1,715 | ) | | | (33,946 | ) |
| | | | (15,856 | ) | | | (274,487 | ) | | | (230 | ) | | | (4,202 | ) |
| Class IR Shares | | | | | | | | | | | | | | | | |
Shares sold | | | 13,584 | | | | 250,777 | | | | 179,185 | | | | 3,632,048 | |
Reinvestment of distributions | | | 3,938 | | | | 70,733 | | | | 706 | | | | 14,137 | |
Shares redeemed | | | (35,518 | ) | | | (644,897 | ) | | | (139,046 | ) | | | (2,781,071 | ) |
| | | | (17,996 | ) | | | (323,387 | ) | | | 40,845 | | | | 865,114 | |
NET INCREASE (DECREASE) | | | (1,636,683 | ) | | $ | (29,802,648 | ) | | | 3,756,269 | | | $ | 76,957,393 | |
| (a) | | Class B Shares converted into Class A Shares at the close of business on November 14, 2014. |
53
GOLDMAN SACHS FUNDAMENTAL INTERNATIONAL EQUITY FUNDS
Notes to Financial Statements (continued)
April 30, 2015 (Unaudited)
|
| 11. SUMMARY OF SHARE TRANSACTIONS (continued) |
Share activity is as follows:
| | | | | | | | | | | | | | | | |
| | | International Small Cap Fund | |
| | | | |
| | | For the Six Months Ended
April 30, 2015
(Unaudited) | | | For the Fiscal Year Ended
October 31, 2014 | |
| | | | |
| | | Shares | | | Dollars | | | Shares | | | Dollars | |
| | | | |
| Class A Shares | | | | | | | | | | | | | | | | |
Shares sold | | | 119,307 | | | $ | 2,262,388 | | | | 323,285 | | | $ | 6,313,379 | |
Shares converted from Class B | | | 2,533 | | | | 47,348 | | | | 788 | | | | 15,330 | |
Reinvestment of distributions | | | 9,774 | | | | 179,944 | | | | 11,580 | | | | 217,128 | |
Shares redeemed | | | (110,011 | ) | | | (2,087,840 | ) | | | (311,187 | ) | | | (6,123,835 | ) |
| | | | 21,603 | | | | 401,840 | | | | 24,466 | | | | 422,002 | |
| Class B Shares(a) | | | | | | | | | | | | | | | | |
Shares sold | | | — | | | | — | | | | 447 | | | | 8,625 | |
Shares converted to Class A | | | (2,585 | ) | | | (47,348 | ) | | | (801 | ) | | | (15,330 | ) |
Reinvestment of distributions | | | — | | | | — | | | | 164 | | | | 3,040 | |
Shares redeemed | | | (9,887 | ) | | | (181,106 | ) | | | (11,188 | ) | | | (215,433 | ) |
| | | | (12,472 | ) | | | (228,454 | ) | | | (11,378 | ) | | | (219,098 | ) |
| Class C Shares | | | | | | | | | | | | | | | | |
Shares sold | | | 59,440 | | | | 1,059,778 | | | | 90,302 | | | | 1,723,658 | |
Reinvestment of distributions | | | 1,390 | | | | 24,687 | | | | 1,298 | | | | 23,503 | |
Shares redeemed | | | (39,543 | ) | | | (706,940 | ) | | | (44,567 | ) | | | (832,733 | ) |
| | | | 21,287 | | | | 377,525 | | | | 47,033 | | | | 914,428 | |
| Institutional Shares | | | | | | | | | | | | | | | | |
Shares sold | | | 1,341,944 | | | | 25,442,805 | | | | 2,553,932 | | | | 50,907,382 | |
Reinvestment of distributions | | | 151,458 | | | | 2,864,067 | | | | 168,944 | | | | 3,252,168 | |
Shares redeemed | | | (2,825,860 | ) | | | (55,303,381 | ) | | | (2,456,065 | ) | | | (49,189,267 | ) |
| | | | (1,332,458 | ) | | | (26,996,509 | ) | | | 266,811 | | | | 4,970,283 | |
| Service Shares | | | | | | | | | | | | | | | | |
Shares sold | | | 14,921 | | | | 273,459 | | | | 1,583 | | | | 28,818 | |
Reinvestment of distributions | | | 796 | | | | 14,470 | | | | 884 | | | | 16,362 | |
Shares redeemed | | | (6,733 | ) | | | (122,734 | ) | | | (382 | ) | | | (7,173 | ) |
| | | | 8,984 | | | | 165,195 | | | | 2,085 | | | | 38,007 | |
| Class IR Shares | | | | | | | | | | | | | | | | |
Shares sold | | | 37,749 | | | | 727,875 | | | | 205,667 | | | | 4,149,180 | |
Reinvestment of distributions | | | 4,295 | | | | 81,045 | | | | 969 | | | | 18,633 | |
Shares redeemed | | | (16,904 | ) | | | (328,372 | ) | | | (13,552 | ) | | | (268,430 | ) |
| | | | 25,140 | | | | 480,548 | | | | 193,084 | | | | 3,899,383 | |
NET INCREASE (DECREASE) | | | (1,267,916 | ) | | $ | (25,799,855 | ) | | | 522,101 | | | $ | 10,025,005 | |
| | | | |
| (a) | | Class B Shares converted into Class A Shares at the close of business on November 14, 2014. |
54
GOLDMAN SACHS FUNDAMENTAL INTERNATIONAL EQUITY FUNDS
|
| 11. SUMMARY OF SHARE TRANSACTIONS (continued) |
Share activity is as follows:
| | | | | | | | | | | | | | | | |
| | | Strategic International Equity Fund | |
| | | | |
| | | For the Six Months Ended
April 30, 2015
(Unaudited) | | | For the Fiscal Year Ended
October 31, 2014 | |
| | | | |
| | | Shares | | | Dollars | | | Shares | | | Dollars | |
| | | | |
| Class A Shares | | | | | | | | | | | | | | | | |
Shares sold | | | 126,402 | | | $ | 1,672,641 | | | | 198,704 | | | $ | 2,763,446 | |
Shares converted from Class B | | | 82,119 | | | | 1,098,759 | | | | 32,994 | | | | 459,442 | |
Reinvestment of distributions | | | 64,638 | | | | 831,893 | | | | 13,124 | | | | 178,224 | |
Shares redeemed | | | (149,390 | ) | | | (1,944,568 | ) | | | (315,548 | ) | | | (4,390,132 | ) |
| | | | 123,769 | | | | 1,658,725 | | | | (70,726 | ) | | | (989,020 | ) |
| Class B Shares(a) | | | | | | | | | | | | | | | | |
Shares sold | | | — | | | | — | | | | 2,579 | | | | 32,762 | |
Shares converted to Class A | | | (92,333 | ) | | | (1,098,759 | ) | | | (36,933 | ) | | | (459,442 | ) |
Reinvestment of distributions | | | — | | | | — | | | | 87 | | | | 1,060 | |
Shares redeemed | | | (19,706 | ) | | | (234,677 | ) | | | (58,436 | ) | | | (727,361 | ) |
| | | | (112,039 | ) | | | (1,333,436 | ) | | | (92,703 | ) | | | (1,152,981 | ) |
| Class C Shares | | | | | | | | | | | | | | | | |
Shares sold | | | 27,052 | | | | 318,238 | | | | 82,020 | | | | 1,031,878 | |
Reinvestment of distributions | | | 11,938 | | | | 138,834 | | | | 605 | | | | 7,442 | |
Shares redeemed | | | (38,894 | ) | | | (460,756 | ) | | | (139,914 | ) | | | (1,749,533 | ) |
| | | | 96 | | | | (3,684 | ) | | | (57,289 | ) | | | (710,213 | ) |
| Institutional Shares | | | | | | | | | | | | | | | | |
Shares sold | | | 820,966 | | | | 11,316,920 | | | | 701,638 | | | | 10,194,170 | |
Reinvestment of distributions | | | 113,557 | | | | 1,525,074 | | | | 32,742 | | | | 463,301 | |
Shares redeemed | | | (1,276,058 | ) | | | (17,599,414 | ) | | | (386,526 | ) | | | (5,573,406 | ) |
| | | | (341,535 | ) | | | (4,757,420 | ) | | | 347,854 | | | | 5,084,065 | |
| Class IR Shares | | | | | | | | | | | | | | | | |
Shares sold | | | 334 | | | | 4,227 | | | | 5,492 | | | | 76,480 | |
Reinvestment of distributions | | | 391 | | | | 5,027 | | | | 46 | | | | 623 | |
Shares redeemed | | | (1,085 | ) | | | (14,175 | ) | | | (773 | ) | | | (10,433 | ) |
| | | | (360 | ) | | | (4,921 | ) | | | 4,765 | | | | 66,670 | |
| Class R Shares | | | | | | | | | | | | | | | | |
Shares sold | | | 20 | | | | 265 | | | | 4 | | | | 53 | |
Reinvestment of distributions | | | 23 | | | | 293 | | | | 4 | | | | 58 | |
| | | | 43 | | | | 558 | | | | 8 | | | | 111 | |
NET INCREASE (DECREASE) | | | (330,026 | ) | | $ | (4,440,178 | ) | | | 131,909 | | | $ | 2,298,632 | |
| (a) | | Class B Shares converted into Class A Shares at the close of business on November 14, 2014. |
55
GOLDMAN SACHS FUNDAMENTAL INTERNATIONAL EQUITY FUNDS
Fund Expenses — Six Month Period Ended April 30, 2015 (Unaudited)
As a shareholder of Class A, Class C, Institutional, Service, Class IR or Class R Shares of a Fund you incur two types of costs: (1) transaction costs, including sales charges on purchase payments (with respect to Class A Shares) and contingent deferred sales charges on redemptions (with respect to and Class C Shares); and (2) ongoing costs, including management fees; distribution and service (12b-1) fees (with respect to Class A, Class C and Class R Shares); and other Fund expenses. This example is intended to help you understand your ongoing costs (in dollars) of investing in Class A, Class C, Institutional, Service, Class IR and Class R Shares of the Funds and to compare these costs with the ongoing costs of investing in other mutual funds.
The example is based on an investment of $1,000 invested at the beginning of the period and held for the entire period from November 1, 2014 through April 30, 2015.
Actual Expenses — The first line under each share class in the table below provides information about actual account values and actual expenses. You may use the information in this line, together with the amount you invested, to estimate the expenses that you paid over the period. Simply divide your account value by $1,000 (for example, an $8,600 account value divided by $1,000=8.6), then multiply the result by the number in the first line under the heading entitled “Expenses Paid” to estimate the expenses you paid on your account during this period.
Hypothetical Example for Comparison Purposes — The second line under each share class in the table below provides information about hypothetical account values and hypothetical expenses based on the Funds’ actual net expense ratio and an assumed rate of return of 5% per year before expenses, which is not the Funds’ actual return. The hypothetical account values and expenses may not be used to estimate the actual ending account balance or expenses you paid for the period. You may use this information to compare the ongoing costs of investing in the Funds and other funds. To do so, compare this 5% hypothetical example with the 5% hypothetical examples that appear in the shareholder reports of the other funds.
Please note that the expenses shown in the table are meant to highlight your ongoing costs only and do not reflect any transactional costs, such as sales charges, redemption fee or exchange fees. Therefore, the second line of the table is useful in comparing ongoing costs only, and will not help you determine the relative total costs of owning different funds. In addition, if these transactional costs were included, your costs would have been higher.
| | | | | | | | | | | | | | | | | | | | | | | | | | | | | | | | | | | | |
| | | Focused International Equity Fund | | | International Small Cap Fund | | | Strategic International Equity Fund | |
| Share Class | | Beginning Account
Value 11/01/14 | | | Ending Account Value 04/30/15 | | | Expenses Paid for the 6 Months Ended 04/30/15* | | | Beginning Account Value 11/01/14 | | | Ending Account Value 04/30/15 | | | Expenses Paid for the 6 Months Ended 04/30/15* | | | Beginning Account Value 11/01/14 | | | Ending Account Value 04/30/15 | | | Expenses Paid for the 6 Months Ended 04/30/15* | |
| Class A | | | | | | | | | | | | | | | | | | | | | | | | | | | | | | | | | | | | |
Actual | | $ | 1,000 | | | $ | 1,056.40 | | | $ | 6.63 | | | $ | 1,000 | | | $ | 1,079.60 | | | $ | 7.06 | | | $ | 1,000 | | | $ | 1,052.60 | | | $ | 6.62 | |
Hypothetical 5% return | | | 1,000 | | | | 1,018.35 | + | | | 6.51 | | | | 1,000 | | | | 1,018.00 | + | | | 6.85 | | | | 1,000 | | | | 1,018.35 | + | | | 6.51 | |
| Class C | | | | | | | | | | | | | | | | | | | | | | | | | | | | | | | | | | | | |
Actual | | | 1,000 | | | | 1,052.60 | | | | 10.43 | | | | 1,000 | | | | 1,075.90 | | | | 10.91 | | | | 1,000 | | | | 1,048.70 | | | | 10.41 | |
Hypothetical 5% return | | | 1,000 | | | | 1,014.63 | + | | | 10.24 | | | | 1,000 | | | | 1,014.28 | + | | | 10.59 | | | | 1,000 | | | | 1,014.63 | + | | | 10.24 | |
| Institutional | | | | | | | | | | | | | | | | | | | | | | | | | | | | | | | | | | | | |
Actual | | | 1,000 | | | | 1,058.50 | | | | 4.59 | | | | 1,000 | | | | 1,081.90 | | | | 5.01 | | | | 1,000 | | | | 1,055.20 | | | | 4.59 | |
Hypothetical 5% return | | | 1,000 | | | | 1,020.33 | + | | | 4.51 | | | | 1,000 | | | | 1,019.98 | + | | | 4.86 | | | | 1,000 | | | | 1,020.33 | + | | | 4.51 | |
| Service | | | | | | | | | | | | | | | | | | | | | | | | | | | | | | | | | | | | |
Actual | | | 1,000 | | | | 1,055.80 | | | | 7.14 | | | | 1,000 | | | | 1,079.50 | | | | 7.58 | | | | N/A | | | | N/A | | | | N/A | |
Hypothetical 5% return | | | 1,000 | | | | 1,017.85 | + | | | 7.00 | | | | 1,000 | | | | 1,017.50 | + | | | 7.35 | | | | N/A | | | | N/A | | | | N/A | |
| Class IR | | | | | | | | | | | | | | | | | | | | | | | | | | | | | | | | | | | | |
Actual | | | 1,000 | | | | 1,057.40 | | | | 5.36 | | | | 1,000 | | | | 1,081.30 | | | | 5.78 | | | | 1,000 | | | | 1,054.40 | | | | 5.35 | |
Hypothetical 5% return | | | 1,000 | | | | 1,019.59 | + | | | 5.26 | | | | 1,000 | | | | 1,019.24 | + | | | 5.61 | | | | 1,000 | | | | 1,019.59 | + | | | 5.26 | |
| Class R | | | | | | | | | | | | | | | | | | | | | | | | | | | | | | | | | | | | |
Actual | | | N/A | | | | N/A | | | | N/A | | | | N/A | | | | N/A | | | | N/A | | | | 1,000 | | | | 1,051.10 | | | | 7.88 | |
Hypothetical 5% return | | | N/A | | | | N/A | | | | N/A | | | | N/A | | | | N/A | | | | N/A | | | | 1,000 | | | | 1,017.11 | | | | 7.75 | |
| * | | Expenses are calculated using each Fund’s annualized net expense ratio for each class, which represents the ongoing expenses as a percentage of net assets for the six months ended April 30, 2015. Expenses are calculated by multiplying the annualized net expense ratio by the average account value for the period; then multiplying the result by the number of days in the most recent fiscal half year; and then dividing that result by the number of days in the fiscal year. The annualized net expense ratios for the period were as follows: |
| | | | | | | | | | | | | | | | | | | | | | | | |
| Fund | | Class A | | | Class C | | | Institutional | | | Service | | | Class IR | | | Class R | |
Focused International Equity | | | 1.30 | % | | | 2.05 | % | | | 0.90 | % | | | 1.40 | % | | | 1.05 | % | | | N/A | |
International Small Cap | | | 1.37 | | | | 2.12 | | | | 0.97 | | | | 1.47 | | | | 1.12 | | | | N/A | |
Strategic International Equity | | | 1.30 | | | | 2.05 | | | | 0.90 | | | | N/A | | | | 1.05 | | | | 1.55 | % |
| + | | Hypothetical expenses are based on each Fund’s actual annualized net expense ratios and an assumed rate of return of 5% per year before expenses. |
56
FUNDS PROFILE
Goldman Sachs Funds

Goldman Sachs is a premier financial services firm, known since 1869 for creating thoughtful and customized investment solutions in complex global markets.
Today, the Investment Management Division of Goldman Sachs serves a diverse set of clients worldwide, including private institutions, public entities and individuals. With approximately $1.02 trillion in assets under supervision as of March 31, 2015, Goldman Sachs Asset Management (“GSAM”) has portfolio management teams located around the world and our investment professionals bring firsthand knowledge of local markets to every investment decision. Assets under supervision includes assets under management and other client assets for which Goldman Sachs does not have full discretion. GSAM leverages the resources of Goldman, Sachs & Co. subject to legal, internal and regulatory restrictions.

Money Market1
Financial Square FundsSM
| n | | Financial Square Tax-Exempt Funds |
| n | | Financial Square Federal Fund |
| n | | Financial Square Government Fund |
| n | | Financial Square Money Market Fund |
| n | | Financial Square Prime Obligations Fund |
| n | | Financial Square Treasury Instruments Fund |
| n | | Financial Square Treasury Obligations Fund |
Fixed Income
Short Duration and Government
| n | | High Quality Floating Rate Fund |
| n | | Limited Maturity Obligations Fund |
| n | | Short Duration Government Fund |
| n | | Short Duration Income Fund |
| n | | Inflation Protected Securities Fund |
Multi-Sector
Municipal and Tax-Free
| n | | High Yield Municipal Fund |
| n | | Dynamic Municipal Income Fund3 |
| n | | Short Duration Tax-Free Fund |
Single Sector
| n | | Investment Grade Credit Fund |
| n | | High Yield Floating Rate Fund |
| n | | Emerging Markets Debt Fund |
| n | | Local Emerging Markets Debt Fund |
| n | | Dynamic Emerging Markets Debt Fund |
Fixed Income Alternatives
| n | | Long Short Credit Strategies Fund |
| n | | Fixed Income Macro Strategies Fund |
Fundamental Equity
| n | | Small/Mid Cap Value Fund |
| n | | Small/Mid Cap Growth Fund |
| n | | Flexible Cap Growth Fund |
| n | | Concentrated Growth Fund |
| n | | Technology Tollkeeper Fund |
| n | | Growth Opportunities Fund |
| n | | Rising Dividend Growth Fund |
| n | | Dynamic U.S. Equity Fund4 |
Tax-Advantaged Equity
| n | | U.S. Tax-Managed Equity Fund |
| n | | International Tax-Managed Equity Fund |
| n | | U.S. Equity Dividend and Premium Fund |
| n | | International Equity Dividend and Premium Fund |
Equity Insights
| n | | Small Cap Equity Insights Fund |
| n | | U.S. Equity Insights Fund |
| n | | Small Cap Growth Insights Fund |
| n | | Large Cap Growth Insights Fund |
| n | | Large Cap Value Insights Fund |
| n | | Small Cap Value Insights Fund |
| n | | International Small Cap Insights Fund |
| n | | International Equity Insights Fund |
| n | | Emerging Markets Equity Insights Fund |
Fundamental Equity
International
| n | | Strategic International Equity Fund |
| n | | Focused International Equity Fund |
| n | | International Small Cap Fund |
| n | | Emerging Markets Equity Fund |
| n | | BRIC Fund (Brazil, Russia, India, China) |
Select Satellite5
| n | | Global Managed Beta Fund |
| n | | Multi-Manager Non-Core Fixed Income Fund |
| n | | Real Estate Securities Fund |
| n | | International Real Estate Securities Fund |
| n | | Commodity Strategy Fund |
| n | | Dynamic Commodity Strategy Fund |
| n | | Dynamic Allocation Fund |
| n | | Absolute Return Tracker Fund |
| n | | Managed Futures Strategy Fund |
| n | | MLP Energy Infrastructure Fund |
| n | | Multi-Manager Alternatives Fund |
| n | | Multi-Asset Real Return Fund |
| n | | Retirement Portfolio Completion Fund |
| n | | Tactical Tilt Implementation Fund |
Total Portfolio Solutions5
| n | | Balanced Strategy Portfolio |
| n | | Growth and Income Strategy Portfolio |
| n | | Growth Strategy Portfolio |
| n | | Equity Growth Strategy Portfolio |
| n | | Satellite Strategies Portfolio |
| n | | Enhanced Dividend Global Equity Portfolio |
| n | | Tax Advantaged Global Equity Portfolio |
| 1 | | An investment in a money market fund is neither insured nor guaranteed by the Federal Deposit Insurance Corporation (“FDIC”) or any other government agency. Although the Funds seek to preserve the value of your investment at $1.00 per share, it is possible to lose money by investing in the Funds. |
| 2 | | Effective on October 1, 2014, the Goldman Sachs Core Plus Fixed Income Fund was renamed the Goldman Sachs Bond Fund. |
| 3 | | Effective on December 18, 2014, the Goldman Sachs Municipal Income Fund was renamed the Goldman Sachs Dynamic Municipal Income Fund. |
| 4 | | Effective on April 30, 2015, the Goldman Sachs U.S. Equity Fund was renamed the Goldman Sachs Dynamic U.S. Equity Fund. |
| 5 | | Individual Funds within the Total Portfolio Solutions and Select Satellite categories will have various placement on the risk/return spectrum and may have greater or lesser risk than that indicated by the placement of the general Total Portfolio Solutions or Select Satellite category. |
Financial Square FundsSM is a registered service mark of Goldman, Sachs & Co.
| *This | | list covers open-end funds only. Please visit our website at www.GSAMFUNDS.com to learn about our closed-end funds. |
| | |
TRUSTEES Ashok N. Bakhru, Chairman Kathryn A. Cassidy John P. Coblentz, Jr. Diana M. Daniels Joseph P. LoRusso Herbert J. Markley James A. McNamara Jessica Palmer Alan A. Shuch Richard P. Strubel Roy W. Templin Gregory G. Weaver | | OFFICERS James A. McNamara, President Scott M. McHugh, Principal Financial Officer and Treasurer Caroline L. Kraus, Secretary |
| |
GOLDMAN, SACHS & CO. Distributor and Transfer Agent | | GOLDMAN SACHS ASSET MANAGEMENT INTERNATIONAL Investment Adviser |
Visit our web site at www.GSAMFUNDS.com to obtain the most recent month-end returns.
Goldman Sachs Asset Management, L.P., 200 West Street, New York, New York 10282
The reports concerning the Funds included in this shareholder report may contain certain forward-looking statements about the factors that may affect the performance of the Funds in the future. These statements are based on Fund management’s predictions and expectations concerning certain future events and their expected impact on the Funds, such as performance of the economy as a whole and of specific industry sectors, changes in the levels of interest rates, the impact of developing world events, and other factors that may influence the future performance of the Funds. Management believes these forward-looking statements to be reasonable, although they are inherently uncertain and difficult to predict. Actual events may cause adjustments in portfolio management strategies from those currently expected to be employed.
A description of the policies and procedures that the Funds use to determine how to vote proxies relating to portfolio securities and information regarding how a Fund voted proxies relating to portfolio securities during the most recent 12-month period ended June 30 is available (I) without charge, upon request by calling 1-800-526-7384 (for Retail Shareholders) or 1-800-621-2550 (for Institutional Shareholders); and (II) on the Securities and Exchange Commission Web site at http://www.sec.gov.
The Funds file their complete schedule of portfolio holdings with the SEC for the first and third quarters of each fiscal year on Form N-Q. The Funds’ Forms N-Q are available on the SEC’s web site at http://www.sec.gov within 60 days after the Funds’ first and third fiscal quarters. The Funds’ Forms N-Q may be reviewed and copied at the SEC’s Public Reference Room in Washington, D.C. and information on the operation of the Public Reference Room may also be obtained by calling 1-800-SEC-0330. Forms N-Q may be obtained upon request and without charge by calling 1-800-526-7384 (for Retail Shareholders) or 1-800-621-2550 (for Institutional Shareholders).
The website links provided are for your convenience only and are not an endorsement or recommendation by GSAM of any of these websites or the products or services offered. GSAM is not responsible for the accuracy and validity of the content of these websites.
Fund holdings and allocations shown are as of April 30, 2015 and may not be representative of future investments. Fund holdings should not be relied on in making investment decisions and should not be construed as research or investment advice regarding particular securities. Current and future holdings are subject to risk.
The Global Industry Classification Standard (GICS) was developed by and is the exclusive property and a service mark of Morgan Stanley Capital International Inc. (MSCI) and Standard & Poor’s, a division of The McGraw-Hill Companies, Inc. (S&P) and is licensed for use by Goldman Sachs. Neither MSCI, S&P nor any other party involved in making or compiling the GICS or any GICS classifications makes any express or implied warranties or representations with respect to such standard or classification (or the results to be obtained by the use thereof), and all such parties hereby expressly disclaim all warranties of originality, accuracy, completeness, merchantability or fitness for a particular purpose with respect to any of such standard or classification. Without limiting any of the foregoing, in no event shall MSCI, S&P, any of their affiliates or any third party involved in making or compiling the GICS or any GICS classifications have any liability for any direct, indirect, special, punitive, consequential or any other damages (including lost profits) even if notified of the possibility of such damages.
The portfolio risk management process includes an effort to monitor and manage risk, but does not imply low risk.
This material is not authorized for distribution to prospective investors unless preceded or accompanied by a current Prospectus or summary prospectus, if applicable. Investors should consider a Fund’s objective, risks, and charges and expenses, and read the summary prospectus, if available, and/or the Prospectus carefully before investing or sending money. The summary prospectus, if available, and the Prospectus contain this and other information about a Fund and may be obtained from your authorized dealer or from Goldman, Sachs & Co. by calling (retail – 1-800-526-7384) (institutional – 1-800-621-2550).
© 2015 Goldman Sachs. All rights reserved. 164842.MF.MED.TMPL/6/2015 EQINTSAR-15/10.6K
| | (a) | As of the end of the period covered by this report, the registrant has adopted a code of ethics that applies to the registrant’s principal executive officer, principal financial officer, principal accounting officer or controller, or persons performing similar functions, regardless of whether these individuals are employed by the registrant or a third party (the “Code of Ethics”). |
| | (b) | During the period covered by this report, no amendments were made to the provisions of the Code of Ethics. |
| | (c) | During the period covered by this report, the registrant did not grant any waivers, including an implicit waiver, from any provision of the Code of Ethics. |
| | (d) | A copy of the Code of Ethics is available as provided in Item 12(a)(1) of this report. |
| ITEM 3. | AUDIT COMMITTEE FINANCIAL EXPERT. |
| | The registrant’s board of trustees has determined that the registrant has at least one “audit committee financial expert” (as defined in Item 3 of Form N-CSR) serving on its audit committee. John P. Coblentz, Jr. is the “audit committee financial expert” and is “independent” (as each term is defined in Item 3 of Form N-CSR). |
| ITEM 4. | PRINCIPAL ACCOUNTANT FEES AND SERVICES. |
Table 1 — Items 4(a) - 4(d). The accountant fees below reflect the aggregate fees billed by all of the Funds of the Goldman Sachs Trust and includes the Goldman Sachs Funds to which this certified shareholder report relates.
| | | | | | | | | | | | |
| | | 2014 | | 2013 | | Description of Services Rendered |
| | | |
| | | | | | | | | | | | |
| | | |
Audit Fees: | | | | | | | | | | | | |
| | | |
• PricewaterhouseCoopers LLP
(“PwC”) | | | $ | 4,291,739 | | | | $ | 2,304,956 | | | Financial Statement audits. |
| | | |
Audit-Related Fees: | | | | | | | | | | | | |
| | | |
• PwC | | | $ | 0 | | | | $ | 2,340 | | | Other attest services. |
| | | |
Tax Fees: | | | | | | | | | | | | |
| | | |
• PwC | | | $ | 794,850 | | | | $ | 864,950 | | | Tax compliance services provided in connection with the preparation and review of registrant’s tax returns. |
Table 2 — Items 4(b)(c) & (d). Non-Audit Services to the Goldman Sachs Trust’s service affiliates * that were pre-approved by the Audit Committee of the Goldman Sachs Trust pursuant to Rule 2-01(c)(7)(ii) of Regulation S-X.
| | | | | | | | | | | | |
| | | 2014 | | 2013 | | Description of Services Rendered |
| | | |
| | | | | | | | | | | | |
| | | |
Audit-Related Fees: | | | | | | | | | | | | |
| | | |
• PwC | | | $ | 1,486,420 | | | | $ | 1,516,680 | | | Internal control review performed in accordance with Statement on Standards for Attestation Engagements No. 16. These fees are borne by the Funds’ Adviser. |
| * | These include the advisor (excluding sub-advisors) and any entity controlling, controlled by or under common control with the advisor that provides ongoing services to the registrant (hereinafter referred to as “service affiliates”). |
Item 4(e)(1) — Audit Committee Pre-Approval Policies and Procedures
Pre-Approval of Audit and Non-Audit Services Provided to the Funds of the Goldman Sachs Trust. The Audit and Non-Audit Services Pre-Approval Policy (the “Policy”) adopted by the Audit Committee of Goldman Sachs Trust (“GST”) sets forth the procedures and the conditions pursuant to which services performed by an independent auditor for GST may be pre-approved. Services may be pre-approved specifically by the Audit Committee as a whole or, in certain circumstances, by the Audit Committee Chairman or the person designated as the Audit Committee Financial Expert. In addition, subject to specified cost limitations, certain services may be pre-approved under the provisions of the Policy. The Policy provides that the Audit Committee will consider whether the services provided by an independent auditor are consistent with the Securities and Exchange Commission’s rules on auditor independence. The Policy provides for periodic review and pre-approval by the Audit Committee of the services that may be provided by the independent auditor.
De Minimis Waiver. The pre-approval requirements of the Policy may be waived with respect to the provision of non-audit services that are permissible for an independent auditor to perform, provided (1) the aggregate amount of all such services provided constitutes no more than five percent of the total amount of revenues subject to pre-approval that was paid to the independent auditors during the fiscal year in which the services are provided; (2) such services were not recognized by GST at the time of the engagement to be non-audit services; and (3) such services are promptly brought to the attention of the Audit Committee and approved prior to the completion of the audit by the Audit Committee or by one or more members of the Audit Committee to whom authority to grant such approvals has been delegated by the Audit Committee, pursuant to the pre-approval provisions of the Policy.
Pre-Approval of Non-Audit Services Provided to GST’s Investment Advisers. The Policy provides that, in addition to requiring pre-approval of audit and non-audit services provided to GST, the Audit Committee will pre-approve those non-audit services provided to GST’s investment advisers (and entities controlling, controlled by or under common control with the investment advisers that provide ongoing services to GST) where the engagement relates directly to the operations or financial reporting of GST.
Item 4(e)(2) – 0% of the audit-related fees, tax fees and other fees listed in Table 1 were approved by GST’s Audit Committee pursuant to the “de minimis” exception of Rule 2-01(c)(7)(i)(C) of Regulation S-X. In addition, 0% of the non-audit services to the GST’s service affiliates listed in Table 2 were approved by GST’s Audit Committee pursuant to the “de minimis” exception of Rule 2-01(c)(7)(i)(C) of Regulation S-X.
Item 4(f) – Not applicable.
Item 4(g) Aggregate Non-Audit Fees Disclosure
The aggregate non-audit fees billed to GST by PwC for the twelve months ended October 31, 2014 and October 31, 2013 were approximately $794,850 and $867,290 respectively. The aggregate non-audit fees billed to GST’s adviser and service affiliates by PwC for non-audit services for the twelve months ended December 31, 2013 and December 31, 2012 were approximately $9.8 million and $10.0 million respectively. With regard to the aggregate non-audit fees billed to GST’s adviser and service affiliates, the 2014 and 2013 amounts include fees for non-audit services required to be pre-approved [see Table 2] and fees for non-audit services that did not require pre-approval since they did not directly relate to GST’s operations or financial reporting.
Item 4(h) — GST’s Audit Committee has considered whether the provision of non-audit services to GST’s investment adviser and service affiliates that did not require pre-approval pursuant to paragraph (c)(7)(ii) of Rule 2-01 of Regulation S-X is compatible with maintaining the auditors’ independence.
| ITEM 5. | AUDIT COMMITTEE OF LISTED REGISTRANTS. |
| ITEM 6. | SCHEDULE OF INVESTMENTS. |
| | Schedule of Investments is included as part of the Report to Stockholders filed under Item 1. |
| ITEM 7. | DISCLOSURE OF PROXY VOTING POLICIES AND PROCEDURES FOR CLOSED-END MANAGEMENT INVESTMENT COMPANIES. |
| ITEM 8. | PORTFOLIO MANAGERS OF CLOSED-END MANAGEMENT INVESTMENT COMPANIES. |
| ITEM 9. | PURCHASES OF EQUITY SECURITIES BY CLOSED-END MANAGEMENT INVESTMENT COMPANY AND AFFILIATED PURCHASERS. |
| ITEM 10. | SUBMISSION OF MATTERS TO A VOTE OF SECURITY HOLDERS. |
| | There have been no material changes to the procedures by which shareholders may recommend nominees to the registrant’s board of trustees. |
| ITEM 11. | CONTROLS AND PROCEDURES. |
| | (a) | The registrant’s principal executive and principal financial officers, or persons performing similar functions have concluded that the registrant’s disclosure controls and procedures (as defined in Rule 30a-3(c) under the Investment Company Act of 1940, as amended (the “1940 Act”)) are effective as of a date within 90 days of the filing of this report that includes the disclosure required by this paragraph, based on the evaluation of these controls and procedures required by Rule 30a-3(b) under the 1940 Act and 15d-15(b) under the Securities Exchange Act of 1934, as amended. |
| | (b) | There were no changes in the registrant’s internal control over financial reporting (as defined in Rule 30a-3(d) under the 1940 Act) that occurred during the registrant’s fiscal quarter of the period covered by this report that have materially affected, or are reasonably likely to materially affect, the registrant’s internal control over financial reporting. |
| | | | |
| (a)(1) | | Goldman Sachs Trust’s Code of Ethics for Principal Executive and Senior Financial Officers is incorporated by reference to Exhibit 12(a)(1) of the registrant’s Form N-CSR filed on July 8, 2015 for its International Equity Insights Funds. |
| | |
| (a)(2) | | Exhibit 99.CERT | | Certifications pursuant to Section 302 of the Sarbanes-Oxley Act of 2002 filed herewith. |
| | |
| (b) | | Exhibit 99.906CERT | | Certifications pursuant to Section 906 of the Sarbanes-Oxley Act of 2002 filed herewith. |
SIGNATURES
Pursuant to the requirements of the Securities Exchange Act of 1934 and the Investment Company Act of 1940, the registrant has duly caused this report to be signed on its behalf by the undersigned, thereunto duly authorized.
| | |
| | | Goldman Sachs Trust |
| |
| By: | | /s/ James A. McNamara |
| |
| | |
| | James A. McNamara |
| | President/Principal Executive Officer |
| | Goldman Sachs Trust |
| |
| Date: | | July 8, 2015 |
Pursuant to the requirements of the Securities Exchange Act of 1934 and the Investment Company Act of 1940, this report has been signed below by the following persons on behalf of the registrant and in the capacities and on the dates indicated.
| | |
| By: | | /s/ James A. McNamara |
| |
| | |
| | James A. McNamara |
| | President/Principal Executive Officer |
| | Goldman Sachs Trust |
| |
| Date: | | July 8, 2015 |
| |
| By: | | /s/ Scott McHugh |
| |
| | |
| | Scott McHugh |
| | Principal Financial Officer |
| | Goldman Sachs Trust |
| |
| Date: | | July 8, 2015 |