UNITED STATES
SECURITIES AND EXCHANGE COMMISSION
Washington, D.C. 20549
FORM N-CSR
CERTIFIED SHAREHOLDER REPORT OF REGISTERED
MANAGEMENT INVESTMENT COMPANIES
Investment Company Act file number 811-05349
Goldman Sachs Trust
(Exact name of registrant as specified in charter)
71 South Wacker Drive, Chicago, Illinois 60606
(Address of principal executive offices) (Zip code)
| | |
| Caroline Kraus, Esq. | | Copies to: |
| Goldman, Sachs & Co. | | Geoffrey R.T. Kenyon, Esq. |
| 200 West Street | | Dechert LLP |
| New York, New York 10282 | | 100 Oliver Street |
| | 40th Floor |
| | Boston, MA 02110-2605 |
(Name and address of agents for service)
Registrant’s telephone number, including area code: (312) 655-4400
Date of fiscal year end: August 31
Date of reporting period: February 28, 2015
| ITEM 1. | REPORTS TO STOCKHOLDERS. |
| | The Semi-Annual Report to Stockholders is filed herewith. |
Goldman Sachs Funds

| | | | |
| | |
| Semi-Annual Report | | | | February 28, 2015 |
| | |
| | | | Global Tax-Aware Equity Portfolios |
| | | | Enhanced Dividend Global Equity Portfolio |
| | | | Tax-Advantaged Global Equity Portfolio |

Goldman Sachs Global Tax-Aware Equity Portfolios
| n | | ENHANCED DIVIDEND GLOBAL EQUITY PORTFOLIO |
| n | | TAX-ADVANTAGED GLOBAL EQUITY PORTFOLIO |
| | | | |
TABLE OF CONTENTS | | | | |
| |
Principal Investment Strategies and Risks | | | 1 | |
| |
Market Review | | | 2 | |
| |
Portfolio Management Discussion and Performance Summaries | | | 5 | |
| |
Schedules of Investments | | | 19 | |
| |
Financial Statements | | | 23 | |
| |
Financial Highlights | | | 26 | |
| |
Notes to Financial Statements | | | 30 | |
| |
Other Information | | | 44 | |
| | | | |
| | | |
| NOT FDIC-INSURED | | May Lose Value | | No Bank Guarantee |
GOLDMAN SACHS GLOBAL TAX-AWARE EQUITY PORTFOLIOS
Principal Investment Strategies and Risks
This is not a complete list of risks that may affect the Portfolios. For additional information concerning the risks applicable to the Portfolios, please see the Portfolios’ Prospectus.
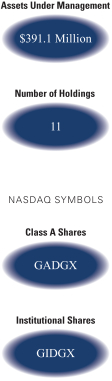
The Goldman Sachs Enhanced Dividend Global Equity Portfolio invests primarily in affiliated domestic and international equity and fixed income funds (“underlying funds”). The Portfolio will also invest directly in other securities, including exchange-traded funds, which may be denominated in currencies other than the U.S. dollar. The Portfolio is intended for investors who want current income. The Portfolio expects to invest primarily in underlying equity funds and equity securities with a blend of domestic large cap, small cap and international exposure, and expects to invest a relatively significant percentage of this equity allocation in the Goldman Sachs U.S. Equity Dividend and Premium and Goldman Sachs International Equity Dividend and Premium Funds, which have an emphasis on dividend paying stocks. In addition, the Portfolio will have a small strategic allocation in U.S. investment grade bonds, which may consist of an investment in the Goldman Sachs Core Fixed Income Fund or other fixed income securities. The Portfolio may also engage in short selling. A short sale transaction involves the sale of a borrowed security to a third party, with the understanding that the security must later be returned to the lender. Short sales involve the risk of an unlimited increase in the market value of the security sold short, which could result in a theoretically unlimited loss.
The Portfolio is subject to the risk factors of each underlying fund and the securities that it holds directly, which include prepayment, credit, liquidity and interest rate risk; the price fluctuations of U.S. government securities in response to changes in interest rates and inflation; the volatility of investments in the markets; and political, economic and currency risks of non-U.S. investments. Derivative instruments may involve a high degree of financial risk. These risks include the risk that a small movement in the price of the underlying security or benchmark may result in a disproportionately large movement, unfavorable or favorable, in the price of the derivative instrument; the risk of default by a counterparty; and liquidity risk. From time to time, the underlying funds in which the Portfolio invests may change. Because the Portfolio is subject to the underlying fund expenses as well as its own expenses, the cost of investing in the Portfolio may be higher than investing in a mutual fund that only invests in stocks and bonds.
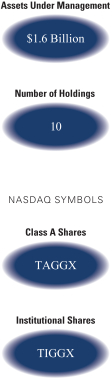
The Goldman Sachs Tax-Advantaged Global Equity Portfolio invests primarily in affiliated domestic and international equity and fixed income funds (“underlying funds”). The Portfolio will also invest directly in other securities, including exchange-traded funds, which may be denominated in currencies other than the U.S. dollar. The Portfolio is intended for investors who wish to minimize short-term gains and defer long-term gains. The Portfolio expects to invest primarily in underlying equity funds and equity securities with a blend of domestic large cap, small cap and international exposure, and expects to invest a relatively significant percentage of this equity allocation in the Goldman Sachs U.S. Tax-Managed Equity and Goldman Sachs International Tax-Managed Equity Funds. In addition, the Portfolio will have a small strategic allocation in U.S. investment grade bonds, which may consist of an investment in the Goldman Sachs Core Fixed Income Fund or other fixed income securities. The Portfolio may also engage in short selling. A short sale transaction involves the sale of a borrowed security to a third party, with the understanding that the security must later be returned to the lender. Short sales involve the risk of an unlimited increase in the market value of the security sold short, which could result in a theoretically unlimited loss. The Portfolio strives to achieve returns primarily in the form of price appreciation and may use different strategies in seeking tax efficiency. No assurance can be offered that the Portfolio’s tax-managed strategies will reduce the amount of taxable income and capital gains distributed by the Portfolio to shareholders.
The Portfolio is subject to the risk factors of each underlying fund and the securities that it holds directly, which include prepayment, credit, liquidity and interest rate risk; the price fluctuations of U.S. government securities in response to changes in interest rates and inflation; the volatility of investments in the markets; and political, economic and currency risks of non-U.S. investments. Derivative instruments may involve a high degree of financial risk. These risks include the risk that a small movement in the price of the underlying security or benchmark may result in a disproportionately large movement, unfavorable or favorable, in the price of the derivative instrument; the risk of default by a counterparty; and liquidity risk. From time to time, the underlying funds in which the Portfolio invests may change. Because the Portfolio is subject to the underlying fund expenses as well as its own expenses, the cost of investing in the Portfolio may be higher than investing in a mutual fund that only invests directly in stocks and bonds.
1
MARKET REVIEW
Goldman Sachs Global Tax-Aware Equity Portfolios
|
| |
| Investment Strategy |
| |
| The Portfolios invest in a strategic mix of Underlying Funds and other securities with the goal of achieving long-term growth of capital (both Portfolios) and current income (Goldman Sachs Enhanced Dividend Global Equity Portfolio only). Under normal conditions, at least 80% of the Portfolios’ total assets measured at the time of purchase will be allocated among the Underlying Funds that currently exist or that may become available for investment in the future for which Goldman Sachs Asset Management (“GSAM”) or an affiliate, now or in the future, acts as investment adviser or principal underwriter. Some of the Underlying Funds invest primarily in fixed income or money market instruments and other Underlying Funds invest primarily in equity securities. The Portfolios may also invest directly in other securities or instruments, including unaffiliated exchange-traded funds and derivatives, and can use these investments for implementing tactical tilts. Under normal circumstances, each of the Portfolios also has a small strategic allocation to U.S. investment grade corporate bonds, which is used to help fund the tactical tilts. Effective March 31, 2015 (after the close of the Reporting Period), tactical tilts may be implemented by each of the Portfolios through an investment in the Goldman Sachs Tactical Tilt Implementation Fund. |
Market Review
During the six months ended February 28, 2015 (the “Reporting Period”), the performance of global equity and fixed income markets was driven by economic conditions, monetary policies of central banks and falling oil prices.
U.S. Equity Markets
Overall, U.S. equities advanced during the Reporting Period with broad sector participation. The Standard & Poor’s 500® Index (the “S&P 500 Index”) ended the Reporting Period with a gain of 6.12%. The Russell 3000® Index generated a return of 5.98%. By the end of the Reporting Period, the S&P 500 Index and Dow Jones Industrial Average each rose to new record highs, and the NASDAQ Composite neared its dot-com era high seen in 2000.
Several macroeconomic themes influenced U.S. equity market performance during the Reporting Period, including the improving U.S. economy, the expectation the Federal Reserve (the “Fed”) would increase interest rates soon and sharply falling oil prices. More specifically, the U.S. reported Gross Domestic Product (“GDP”) growth well ahead of that of Europe and Japan during the Reporting Period. In addition, the U.S. labor market continued to improve, with unemployment falling to 5.6%, its lowest level since June 2008. In turn, financial markets increasingly focused on the potential that the Fed would increase interest rates, which led to an appreciation of the U.S. dollar against many currencies. At the same time, the price of West Texas Intermediate (“WTI”) crude oil fell from more than $90 per barrel at the beginning of the Reporting Period to less than $50 per barrel in January 2015, before recovering modestly in February 2015.
Given this backdrop, the energy sector declined significantly, the only sector in the S&P 500 Index to post a negative return during the Reporting Period. In contrast, both the consumer discretionary and consumer staples sectors significantly outperformed the S&P 500 Index during the Reporting Period, as the U.S. equity markets reflected investor sentiment that the combination of an improving economy, healthier job market, strong U.S. dollar and low oil
2
MARKET REVIEW
prices would be positive for U.S. consumers. Health care was the best performing sector in the S&P 500 Index during the Reporting Period, as robust merger and acquisition activity pushed stock prices higher.
For the Reporting Period overall, mid-cap companies performed best, but only modestly ahead of both large-cap and small-cap companies. Growth stocks outpaced value stocks across the capitalization spectrum of the U.S. equity market. (All as measured by Russell Investments indices.)
International Equity Markets
The MSCI EAFE (Europe, Australasia, Far East) Index (“MSCI EAFE Index”) returned -1.26% during the Reporting Period. Among the macroeconomic themes influencing international equity market performance were disappointing global economic growth, increased monetary stimulus by central banks, a strong U.S. dollar and a steep drop in oil prices. Overall, economic growth remained tepid in Europe and Japan, which led to expectations of additional easing by these countries’ central banks. Indeed, at the end of October 2014, the Bank of Japan announced more easing measures, and Prime Minister Abe delayed another increase in the consumption tax. During January 2015, the European Central Bank (“ECB”) announced a large quantitative easing program through which it planned to buy €60 billion in bonds every month until at least September 2016. Also during the Reporting Period, the euro and the Japanese yen depreciated against the U.S. dollar on anticipation that improving U.S. economic conditions would lead the Fed to raise interest rates while the ECB and Bank of Japan would continue to hold rates near zero. In contrast, the Bank of England was upbeat on the U.K.’s economic prospects and hinted it might raise rates later in 2015, leading the FTSE 100 Index to break a record high set in 1999 toward the end of the Reporting Period.
The price of a barrel of Brent crude oil slid from more than $90 at the start of the Reporting Period to below $50 in January 2015, before recovering slightly in February. In an effort to counteract the negative impact of low oil prices on their resource-oriented economies, Canada cut interest rates for the first time since 2009 and Australia did so for the first time since August 2013.
Within the MSCI EAFE Index, the energy sector declined significantly during the Reporting Period, largely due to the sharp drop in oil prices. Consumer discretionary stocks performed best as investors appeared to expect consumer sentiment and spending to improve as a result of low oil prices.
Fixed Income Markets
In September 2014, when the Reporting Period began, spread, or non-U.S. Treasury, sectors generated mixed results amid increased market volatility. Intermediate-term U.S. Treasury yields edged up as U.S. economic data remained positive. Meanwhile, Eurozone economic growth data generally disappointed as manufacturing and core inflation readings moved lower. Early in the month, the ECB cut rates to record lows and announced plans to start purchasing asset-backed securities (“ABS”) and covered bonds. The U.S. dollar appreciated relative to other world currencies, raising market concerns about the potential negative impact on corporate credit given that U.S. dollar strength might place downward pressure on foreign demand.
Spread sector weakness persisted into the fourth quarter of 2014, as falling oil prices heightened market volatility and sparked a flight to quality. At the same time, the theme of
3
MARKET REVIEW
economic divergence dominated. In the U.S., economic conditions improved, leading the Fed to end its quantitative easing asset purchase program, as planned, in October 2014. Meanwhile, soft economic data in the Eurozone and Japan resulted in further monetary easing by their central banks.
In January 2015, spread sectors rallied amid signs of improving manufacturing activity in the Eurozone, U.K., U.S. and Japan. China, however, continued to experience broad stagnation. While the Fed hinted it might raise short-term rates some time during 2015, global monetary policy easing intensified around the ECB’s announcement of quantitative easing, with central banks in Switzerland, Denmark, India, Canada and Australia all cutting interest rates. The anti-austerity Syriza party was victorious in Greece’s elections at the end of January 2015, falling just short of an outright majority and raising fears of a renewed debt crisis.
The spread sector rally continued in February 2015, as several global central banks cut interest rates, the global economy showed signs of improvement, oil prices appeared to stabilize, geopolitical risks in Europe decreased and investment inflows grew significantly. In the U.S., economic data was strong enough to suggest the Fed would likely maintain flexibility to hike rates at either its June or September 2015 policy meetings. In the Eurozone, finance ministers agreed to a four-month extension of the current Greek bailout package, buying time but leaving unresolved the question of how Greece will fund debt repayments during July and August 2015.
For the Reporting Period overall, commercial mortgage-backed securities and asset-backed securities outperformed U.S. Treasuries. Mortgage-backed securities generally performed in line with U.S. Treasuries, while agencies, high yield corporate bonds, investment grade corporate bonds and emerging markets debt lagged. The U.S. Treasury yield curve, or spectrum of maturities, continued to flatten during the Reporting Period, as intermediate-term and longer-term yields declined and shorter-term maturities edged up. The yield on the bellwether 10-year U.S. Treasury fell approximately 35 basis points during the Reporting Period to 2.59%. (A basis point is 1/100th of a percentage point.)
Looking Ahead
We believe global economic growth will improve during the course of 2015. The U.S. economy appears to be expanding at a solid pace and Eurozone growth is improving, in our view. More specifically, we believe Germany’s economy is benefiting from the weakness of the euro. Although Greek debt remains a source of risk, the four-month bailout extension allows time for further negotiation. In Japan, it appears that economic growth is improving as consumption recovers from the April 2014 tax hike, and the weak yen is continuing to support exports. Falling oil prices, however, have reversed Japan’s inflation gains. As a result, we believe the Bank of Japan may consider additional easing to support the credibility of its inflation target. Overall, we believe lower oil prices will be positive for the U.S. and other major economies.
In our opinion, the Fed is on track to tighten monetary policy during 2015, although U.S. employment and inflation continue to send mixed signals. Any decision by the Fed, we believe, will be made with an eye on wage growth, which can be used as a measure of economic slack and inflation potential.
The economic and market forecasts presented herein are for informational purposes as of the date of this report. There can be no assurance that the forecasts will be achieved. Please see additional disclosures at the end of this report.
4
PORTFOLIO RESULTS
Goldman Sachs Enhanced Dividend Global Equity Portfolio
Investment Objective
The Fund seeks long-term growth of capital and current income.
Portfolio Management Discussion and Analysis
Below, the Goldman Sachs Quantitative Investment Strategies Team discusses the Goldman Sachs Enhanced Dividend Global Equity Portfolio’s (the “Portfolio”) performance and positioning for the six-month period ended February 28, 2015 (the “Reporting Period”).
| Q | | How did the Portfolio perform during the Reporting Period? |
| A | | During the Reporting Period, the Portfolio’s Class A and Institutional Shares generated cumulative total returns, without sales charges, of 1.13% and 1.42%, respectively. These returns compare to the 1.01% cumulative total return of the Portfolio’s blended benchmark, the Enhanced Dividend Global Equity Composite Index (“EDGE Composite Index”), over the same time period. The components of the EDGE Composite Index generated cumulative total returns of 2.25% and 0.86% for the Barclays U.S. Aggregate Bond Index and the MSCI All Country World Index (ACWI) Investable Market Index® (“MSCI ACWI IMI”), respectively, during the Reporting Period. |
| Q | | What key factors affected the Portfolio’s performance during the Reporting Period? |
| A | | The Portfolio benefited from its tactical asset allocation decisions (“tactical tilts”) as well as from its strategic weightings during the Reporting Period. Overall, the performance of the Underlying Funds detracted slightly from results versus the EDGE Composite Index. |
| Q | | How were the Portfolio’s tactical tilts managed during the Reporting Period? |
| A | | In keeping with our investment process, we develop views regarding near-term expected market returns and seek to temporarily change the Portfolio’s allocations in an attempt to enhance performance. These tactical tilts added to the Fund’s returns during the Reporting Period overall. |
| | During September 2014, we reduced the size of the Portfolio’s tactical tilt to Spanish equities (expressed through investments in equity index futures) because of the risk of slowing Eurozone economic growth and the rapid appreciation of Spanish equities. We adopted a short position in the Japanese yen versus the U.S. dollar due to divergence in global monetary policies and what we considered Japan’s unsupportive current account surpluses. (In a short position, a security or currency is borrowed and then sold in the financial markets with the expectation that the asset will drop in value.) We also eliminated the Portfolio’s long position in the British pound versus the U.S. dollar on worries about possible depreciation resulting from the Scottish independence referendum. (In a long position, a security or currency is bought with the expectation the asset will increase in value.) In addition, we assumed a short position in the euro versus the U.S. dollar because of diverging global monetary policies and deteriorating cross-border Eurozone capital flows. Later in the month, as a result of stronger economic data in the U.S. relative to Japan and the Eurozone, we increased the size of the Portfolio’s short positions in the Japanese yen and the euro versus the U.S. dollar. To implement all these tactical currency tilts, we employed forward foreign currency exchange contracts. We reduced the Portfolio’s allocation to investment grade fixed income to fund Portfolio positions adopted during September 2014. |
| | In October 2014, we increased the size of the Portfolio’s tactical tilt to U.S. high yield corporate bonds (accomplished through an investment in the Goldman Sachs High Yield Fund). We also increased the size of the Portfolio’s tactical tilt to Spanish equities because of stronger market technicals (or supply/demand factors) and ongoing improvement in fundamentals. We funded both positions by reducing the Portfolio’s allocation to investment grade fixed income. Additionally, during October 2014, we eliminated the Portfolio’s overweight in U.S. technology stocks (which had been accomplished through an exchange-traded fund (“ETF”)) because recent strong performance had reduced the number of attractive investment opportunities, in our view. We also believed technology stocks were vulnerable to disappointing third calendar quarter earnings. In addition, the technology sector’s robust performance appeared to be |
5
PORTFOLIO RESULTS
| | driven by a concentrated group of stocks, which may not have been representative of the overall sector and therefore might not continue going forward. Later in October 2014, because we believed Spain’s economy was growing faster than France’s economy, we changed the funding source for the Portfolio’s tactical tilt to Spanish equities from investment grade fixed income to a short position in French equities. At the same time, in response to increased global risks such as the Ebola outbreak, we hedged our exposure to U.S. equities through the purchase of equity index put options. This position was funded out of investment grade fixed income. We increased the size of the Portfolio’s tactical tilt to U.S. high yield corporate bonds. Additionally, we reduced the size of the Portfolio’s tactical tilt to U.S. high yield bank loans (accomplished through an investment in the Goldman Sachs High Yield Floating Rate Fund). We added an overweight in Japanese stocks, accomplished by purchasing equity index futures, and funded the position by reducing the Portfolio’s overall allocation to non-U.S. developed markets stocks. We further increased the size of the Portfolio’s short position in the Japanese yen versus the U.S. dollar as the Bank of Japan enlarged its quantitative easing program and the Japanese Government Investment Pension Fund announced it would double the size of its public equity allocation. We allowed the Portfolio’s position in October 2014 S&P 500® Index put options to expire. |
| | During November 2014, we increased the Portfolio’s overweight in Japanese stocks in response to monetary policy developments and the potential for large investment inflows. We funded this position by reducing the Portfolio’s overall allocation to developed markets equities. In addition, we sold Australian dollar put options as the Australian dollar fell 7% versus the U.S. dollar. |
| | During December 2014, we shifted the Fund to a long position in the Indian rupee versus the U.S. dollar (accomplished through forward foreign currency exchange contracts) as India’s economic growth accelerated and in response to Prime Minister Narendra Modi’s agenda to implement incremental structural and fiscal reforms. The drop in oil prices also seemed likely to help India, which is a net importer of oil. In addition, we moved the Portfolio to a short position in the Australian dollar versus the U.S. dollar (accomplished through Australian dollar put options) given that the Australian economy faces multiple headwinds, including slowing economic growth in China, a significant drop in Australia’s commodity export prices (especially iron ore), a deceleration in mining investment and tighter fiscal policy. Both positions were funded by reducing the Portfolio’s allocation to investment grade fixed income. Additionally, we sold index put options on an energy ETF as energy stocks fell dramatically. We also increased the Portfolio’s short positions in the Japanese yen and the euro versus the U.S. dollar. The U.S. dollar had recently weakened, but we expected it to rebound and strengthen against both currencies, which is what occurred later in the Reporting Period. |
| | In January 2015, we replaced a portion of the Portfolio’s investment in a U.S. bank ETF with an increased allocation to U.S. equities. In addition, as large-cap U.S. bank stocks underperformed during the month, we sold index put options on a U.S. bank ETF as a way of monetizing the higher volatility. We also replaced the Portfolio’s tactical tilt to Spanish stocks versus French stocks with a tactical tilt to European stocks (accomplished through equity index futures) versus U.S. fixed income. Although the merits of a tactical tilt to Spanish stocks versus French stocks remained, we saw a strong risk/reward opportunity in European equities as Eurozone growth prospects appeared to be broadly improving. |
| | During February 2015, we implemented a hedge (accomplished through forward foreign currency exchange contracts) on the Portfolio’s exposure to developed markets currencies to mitigate risks of foreign exchange fluctuations associated with the Portfolio’s holdings of non-U.S. stocks. We also eliminated the Portfolio’s tactical tilt to European stocks because of unfavorable market technicals and stagnant European corporate earnings. |
| Q | | How did the Portfolio’s Underlying Funds perform relative to their respective benchmark indices during the Reporting Period? |
| A | | We use seven Underlying Funds to implement our strategic asset allocation. Because of our tactical trading, the Portfolio was invested in six of these Underlying Funds during the Reporting Period. Two of the six Underlying Funds in which the Portfolio was invested underperformed in relative terms — the Goldman Sachs U.S. Equity Dividend and Premium Fund and the Goldman Sachs International Equity Dividend and Premium Fund. These same two were also the Underlying Funds in which the Portfolio invested a significant percentage of its equity allocation. |
| | Four of the six Underlying Funds in which the Portfolio was invested — the Goldman Sachs MLP Energy Infrastructure Fund, the Goldman Sachs Small Cap Equity Insights Fund, the Goldman Sachs Emerging Markets Equity Insights Fund |
6
PORTFOLIO RESULTS
| | and the Goldman Sachs International Small Cap Insights Fund — outperformed their respective benchmark indices during the Reporting Period. (The Portfolio did not have an allocation to the Goldman Sachs Core Fixed Income Fund during the Reporting Period.) |
| Q | | How did call writing affect performance? |
| A | | As mentioned above, the Portfolio’s two largest allocations were to the Goldman Sachs U.S. Equity Dividend and Premium Fund and the Goldman Sachs International Equity Dividend and Premium Fund, which earn premiums through an equity index call writing strategy. When equity markets are down, flat or only modestly positive, these Underlying Funds tend to outperform their respective benchmark indices because of the premiums they earn from call writing. When equity markets rally strongly, these two Underlying Funds are likely to trail their respective benchmark indices. Although the Underlying Funds keep the premiums they earn from call writing, they can underperform when the call options are exercised. |
| | The U.S. equity market appreciated significantly during the Reporting Period, and the call writing strategy of the Goldman Sachs U.S. Equity Dividend and Premium Fund hurt performance as call options were exercised. Although the international equity market declined during the Reporting Period, the call writing strategy of the Goldman Sachs International Equity Dividend and Premium Fund also dampened performance. |
| Q | | How did the Portfolio use derivatives and similar instruments during the Reporting Period? |
| A | | The Portfolio used equity index futures and equity index options during the Reporting Period to implement our views on the U.S., Spanish, Italian, French, European, Japanese and emerging markets equity markets. The Portfolio employed put options to implement our views on the Australian dollar and forward foreign currency exchange contracts to obtain exposure to the British pound, Indian rupee, Australian dollar, euro and Japanese yen. In addition, some of the Portfolio’s Underlying Funds used derivatives during the Reporting Period to apply their active investment views with greater versatility and to afford greater risk management precision. As market conditions warranted during the Reporting Period, some of these Underlying Funds engaged in forward foreign currency exchange contracts, financial futures contracts, options and swap contracts to enhance portfolio return and for hedging purposes. |
| Q | | What changes did you make during the Reporting Period within the Portfolio? |
| A | | As mentioned previously, we made changes within the Portfolio during the Reporting Period based on our views about near-term expected market returns and as we sought to enhance performance. |
| Q | | What was the Portfolio’s tactical view and strategy at the end of the Reporting Period? |
| A | | In terms of our fixed income views at the end of the Reporting Period, the Portfolio had a tactical tilt to U.S high yield corporate bonds, accomplished through an investment in the Goldman Sachs High Yield Fund. We consider U.S. high yield corporate bonds attractive relative to investment grade fixed income, where rising rates may, in our view, lead to negative returns. In addition, at the end of the Reporting Period, the Portfolio had a tactical tilt to U.S. high yield bank loans, accomplished through an investment in the Goldman Sachs High Yield Floating Rate Fund, because we believe these securities are well suited for a rising rate environment. |
| | In terms of our equity views, the Portfolio had a tactical tilt to large-cap U.S. bank stocks (accomplished through an investment in an ETF), as our bullish case for U.S. banks remained intact at the end of the Reporting Period. Our positive view was based on the easing of bank lending standards and accelerating loan growth, among other things. In addition, at the end of the Reporting Period, the Portfolio had a tactical tilt to U.S. energy stocks (through equity index put options) due to their attractive valuations. The Portfolio also continued to have a tactical tilt to Spanish equities (through equity index futures). We believe Spain has made much needed progress in reforming its economy. Because the Spanish government is committed to reform and holds a stable majority in its parliament, we expect progress to continue. We maintained the Portfolio’s position in U.S. equity index put options as a hedge against the threat of geopolitical risks. Additionally, the Portfolio held a short position in Italian equities (through equity index put options), allowing it to earn a premium in exchange for the possibility of buying Italian stocks during the course of the next 12 months if prices decline. At the end of the Reporting Period, the Portfolio had a long position in Japanese stocks through an investment in equity index futures. In our view, Japan’s aggressive monetary policy and reform stand in contrast to |
7
PORTFOLIO RESULTS
| | the incremental monetary policy and structural reform in the Eurozone. In addition, Japanese equities have historically tended to rise substantially after major policy changes. |
| | In terms of our currency views, the Portfolio held a long position in the U.S. dollar versus the Japanese yen. We believe the Bank of Japan will maintain low interest rates and potentially introduce additional stimulus to achieve its 2% inflation target. Meanwhile, we expect U.S. interest rates to increase about mid-year 2015, providing a policy advantage for the U.S. relative to Japan. Additionally, at the end of the Reporting Period, the Portfolio had a short position in the euro versus the U.S. dollar, in line with our belief that U.S. and Eurozone monetary policy will further diverge, cross-border Eurozone capital flows will deteriorate and the ECB will continue to pursue its easy monetary policies. The Portfolio also had a long position in the Indian rupee versus the Australian dollar at the end of the Reporting Period. We believe the Indian rupee benefits from lower external vulnerabilities, positive capital inflows because of incremental implementation of structural and fiscal reforms, and oil price weakness. In contrast, we believe the Australian dollar faces headwinds from weak commodity prices, the deterioration of China’s economic growth, a shrinking trade balance and a central bank that favors looser monetary policy and a weaker currency. All these currency views were implemented though forward foreign currency exchange contracts. |
| | At the end of the Reporting Period, the Portfolio was hedged (accomplished through forward foreign currency exchange contracts) on its exposure to international developed markets currencies to mitigate risks of foreign exchange fluctuations associated with the Portfolio’s holdings of non-U.S. stocks. |
8
FUND BASICS
Enhanced Dividend Global Equity Portfolio
| | | | | | | | | | | | | | | | | | |
| | PERFORMANCE REVIEW | |
| | | September 1, 2014–
February 28, 2015 | | Portfolio
Total Return
(based on NAV)1 | | | EDGE
Composite
Index2 | | | Barclays U.S.
Aggregate Bond
Index3 | | | MSCI ACWI
IMI Index4 | |
| | Class A | | | 1.13 | % | | | 1.01 | % | | | 2.25 | % | | | 0.86 | % |
| | | Institutional | | | 1.42 | | | | 1.01 | | | | 2.25 | | | | 0.86 | |
| | 1 | | The net asset value (“NAV”) represents the net assets of the class of the Portfolio (ex-dividend) divided by the total number of shares of the class outstanding. The Portfolio’s performance reflects the reinvestment of dividends and other distributions. The Portfolio’s performance does not reflect the deduction of any applicable sales charges. |
| | 2 | | The EDGE Composite Index (“EDGE Composite”) is a composite representation prepared by the investment adviser of the performance of the Portfolio’s asset classes weighted according to their respective weightings in the Portfolio’s target range. |
| | | | The EDGE Composite Index is comprised of the Morgan Stanley Capital International All Country World Index IM I (Investable Market Index) (“MSCI ACWI IMI”) (90%) and the Barclays U.S. Aggregate Bond Index (10%). The EDGE Composite figures do not reflect any deduction for fees, expenses or taxes. |
| | 3 | | The Barclays U.S. Aggregate Bond Index represents an unmanaged diversified portfolio of fixed income securities, including U.S. Treasuries, investment grade corporate bonds and mortgage-backed and asset-backed securities. |
| | 4 | | The MSCI ACWI IMI captures large, mid and small cap representation across 23 developed markets and 23 emerging markets. With 8,575 constituents, the MSCI ACWI IMI is comprehensive, covering approximately 99% of the global equity investment opportunity set. As of February 28, 2015, the 23 developed markets in the MSCI ACWI IMI include Australia, Austria, Belgium, Canada, Denmark, Finland, France, Germany, Hong Kong, Ireland, Israel, Italy, Japan, Netherlands, New Zealand, Norway, Portugal, Singapore, Spain, Sweden, Switzerland, the U.K. and the U.S. The 23 emerging markets include Brazil, Chile, China, Colombia, Czech Republic, Egypt, Greece, Hungary, India, Indonesia, South Korea, Malaysia, Mexico, Peru, Philippines, Poland, Russia, Qatar, South Africa, Taiwan, Thailand, Turkey and United Arab Emirates. |
| | | | | | | | | | | | | | | | | | |
| | STANDARDIZED TOTAL RETURNS5 | |
| | | For the period ended 12/31/14 | | One Year | | | Five Years | | | Since Inception | | | Inception Date | |
| | Class A | | | -1.77 | % | | | 8.42 | % | | | 4.51 | % | | | 4/30/08 | |
| | | Institutional | | | 4.32 | | | | 10.09 | | | | 5.82 | | | | 4/30/08 | |
| | 5 | | The Standardized Total Returns are average annual total returns as of the most recent calendar quarter-end. They assume reinvestment of all distributions at NAV. These returns reflect a maximum initial sales charge of 5.5% for Class A Shares. Because Institutional Shares do not involve a sales charge, such a charge is not applied to their Standardized Total Returns. |
The returns represent past performance. Past performance does not guarantee future results. The Portfolio’s investment return and principal value will fluctuate so that an investor’s shares, when redeemed, may be worth more or less than their original cost. Current performance may be lower or higher than the performance quoted above. Please visit our web site at www.GSAMFUNDS.com to obtain the most recent month-end returns. Performance reflects applicable fee waivers and/or expense limitations in effect during the periods shown. In their absence, performance would be reduced. Returns do not reflect the deduction of taxes that a shareholder would pay on Portfolio distributions or the redemption of Portfolio shares.
9
FUND BASICS
| | | | | | | | | | |
| | EXPENSE RATIOS6 | |
| | | | | Net Expense Ratio (Current) | | | Gross Expense Ratio (Before Waivers) | |
| | Class A | | | 1.44 | % | | | 1.50 | % |
| | | Institutional | | | 1.04 | | | | 1.10 | |
| | 6 | | The expense ratios of the Portfolio, both current (net of applicable fee waivers and/or expense limitations) and before waivers (gross of applicable fee waivers and/or expense limitations), are as set forth above according to the most recent publicly available Prospectus for the Portfolio and may differ from the expense ratios disclosed in the Financial Highlights in this report. Pursuant to a contractual arrangement, the Portfolio’s waivers and/or expense limitations will remain in place through at least December 29, 2015, and prior to such date the Investment Adviser may not terminate the arrangements without the approval of the Portfolio’s Board of Trustees. If these arrangements are discontinued in the future, the expense ratios may change without shareholder approval. |
| | | | | | | | | | | | | | |
| | STANDARDIZED AFTER-TAX PERFORMANCE AS OF 12/31/147 | |
| | | Class A Shares | | One Year | | | Five Years | | | Since Inception
(4/30/08) | |
| | Return before taxes* | | | -1.77 | % | | | 8.42 | % | | | 4.51 | % |
| | Return after taxes on distributions** | | | -2.99 | | | | 7.52 | | | | 3.75 | |
| | | Return after taxes on distributions and sale
of Portfolio shares*** | | | 0.05 | | | | 6.68 | | | | 3.56 | |
| | 7 | | The after-tax returns are calculated using the historically highest individual federal marginal income tax rates at the time of distributions (currently 23.8% for qualifying ordinary income dividends and long-term capital gain distributions and 43.4% for non-qualifying ordinary income dividends) and do not reflect state and local taxes. Actual after-tax returns will be calculated at calendar year-end and depend on an investor’s tax situation and may differ from those shown. In addition, the after-tax returns shown are not relevant to investors who hold Portfolio shares through tax-deferred arrangements such as 401(k) plans or individual retirement accounts. Under certain circumstances, the addition of the tax benefits from capital losses resulting from redemptions may cause the Returns After Taxes on Distributions and Sale of Portfolio Shares to be greater than the Returns After Taxes on Distributions or even Returns Before Taxes. Standardized after-tax returns assume reinvestment of all distributions at NAV and reflect a maximum initial sales charge of 5.5% for Class A Shares. |
*Returns Before Taxes do not reflect taxes on distributions on the Portfolio’s Class A Shares nor do they show how performance can be impacted by taxes when shares are redeemed.
**Returns After Taxes on Distributions assume that taxes are paid on distributions on the Portfolio’s Class A Shares (i.e., dividends and capital gains) but do not reflect taxes that may be incurred upon redemption of the Class A Shares at the end of the performance period.
***Returns After Taxes on Distributions and Sale of Portfolio Shares reflect taxes paid on distributions on the Portfolio’s Class A Shares and taxes applicable when the shares are redeemed.
10
FUND BASICS
|
| OVERALL UNDERLYING FUND WEIGHTINGS8 |
| Percentage of Net Assets |
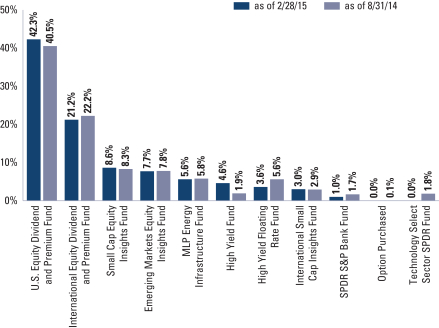
| | 8 | | The Portfolio is actively managed and, as such, its composition may differ over time. The percentage shown for each Underlying Fund reflects the value of that Underlying Fund as a percentage of net assets of the Portfolio. Figures in the graph above may not sum to 100% due to rounding and/or the exclusion of other assets and liabilities. Underlying sector allocations of ETFs held by the Portfolio are not reflected in the graph above. The above graph depicts the Portfolio’s investments but may not represent the Portfolio’s market exposure due to the exclusion of certain derivatives, if any, as listed in the Additional Investment Information section of the Schedule of Investments. |
11
PORTFOLIO RESULTS
Goldman Sachs Tax-Advantaged
Global Equity Portfolio
Investment Objective
The Fund seeks long-term growth of capital.
Portfolio Management Discussion and Analysis
Below, the Goldman Sachs Quantitative Investment Strategies Team discusses the Goldman Sachs Tax-Advantaged Global Equity Portfolio’s (the “Portfolio”) performance and positioning for the six-month period ended February 28, 2015 (the “Reporting Period”).
| Q | | How did the Portfolio perform during the Reporting Period? |
| A | | During the Reporting Period, the Portfolio’s Class A and Institutional Shares generated cumulative total returns, without sales charges, of 2.07% and 2.25%, respectively. These returns compare to the 1.01% cumulative total return of the Portfolio’s blended benchmark, the Tax-Advantaged Global Equity Composite Index (“TAG Composite Index”), over the same time period. The components of the TAG Composite Index generated cumulative total returns of 2.25% and 0.86% for the Barclays U.S. Aggregate Bond Index and the MSCI All Country World Index (ACWI) Investable Market Index® (“MSCI ACWI IMI”), respectively, during the Reporting Period. |
| Q | | What key factors affected the Portfolio’s performance during the Reporting Period? |
| A | | The Portfolio benefited from its tactical asset allocation decisions (“tactical tilts”) as well as from its strategic weightings during the Reporting Period. Overall, the performance of the Underlying Funds contributed positively to results versus the TAG Composite Index. |
| Q | | How were the Portfolio’s tactical tilts managed during the Reporting Period? |
| A | | In keeping with our investment process, we develop views regarding near-term expected market returns and seek to temporarily change the Portfolio’s allocations in an attempt to enhance performance. These tactical tilts added to the Fund’s returns during the Reporting Period overall. |
| | During September 2014, we reduced the size of the Portfolio’s tactical tilt to Spanish equities (expressed through investments in equity index futures) because of the risk of slowing Eurozone economic growth and the rapid appreciation of Spanish equities. We adopted a short position in the Japanese yen versus the U.S. dollar due to divergence in global monetary policies and what we considered Japan’s unsupportive current account surpluses. (In a short position, a security or currency is borrowed and then sold in the financial markets with the expectation that the asset will drop in value.) We also eliminated the Portfolio’s long position in the British pound versus the U.S. dollar on worries about possible depreciation resulting from the Scottish independence referendum. (In a long position, a security or currency is bought with the expectation the asset will increase in value.) In addition, we assumed a short position in the euro versus the U.S. dollar because of diverging global monetary policies and deteriorating cross-border Eurozone capital flows. Later in the month, as a result of stronger economic data in the U.S. relative to Japan and the Eurozone, we increased the size of the Portfolio’s short positions in the Japanese yen and the euro versus the U.S. dollar. To implement all these tactical currency tilts, we employed forward foreign currency exchange contracts. We reduced the Portfolio’s allocation to investment grade fixed income to fund Portfolio positions adopted during September 2014. |
| | In October 2014, we increased the size of the Portfolio’s tactical tilt to U.S. high yield corporate bonds (accomplished through an investment in the Goldman Sachs High Yield Fund). We also increased the size of the Portfolio’s tactical tilt to Spanish equities because of stronger market technicals (or supply/demand factors) and ongoing improvement in fundamentals. We funded both positions by reducing the Portfolio’s allocation to investment grade fixed income. Additionally, during October 2014, we eliminated the Portfolio’s overweight in U.S. technology stocks (which had been accomplished through an exchange-traded fund (“ETF”)) because recent strong performance had reduced the number of attractive investment opportunities, in our view. We also believed technology stocks were vulnerable to disappointing third calendar quarter earnings. In addition, the technology sector’s robust performance appeared to be driven by a concentrated group of stocks, which may not have been representative of the overall sector and therefore |
12
PORTFOLIO RESULTS
| | might not continue going forward. Later in October 2014, because we believed Spain’s economy was growing faster than France’s economy, we changed the funding source for the Portfolio’s tactical tilt to Spanish equities from investment grade fixed income to a short position in French equities. At the same time, in response to increased global risks such as the Ebola outbreak, we hedged our exposure to U.S. equities through the purchase of equity index put options. This position was funded out of investment grade fixed income. We increased the size of the Portfolio’s tactical tilt to U.S. high yield corporate bonds. Additionally, we reduced the size of the Portfolio’s tactical tilt to U.S. high yield bank loans (accomplished through an investment in the Goldman Sachs High Yield Floating Rate Fund). We added an overweight in Japanese stocks, accomplished by purchasing equity index futures, and funded the position by reducing the Portfolio’s overall allocation to non-U.S. developed markets stocks. We further increased the size of the Portfolio’s short position in the Japanese yen versus the U.S. dollar as the Bank of Japan enlarged its quantitative easing program and the Japanese Government Investment Pension Fund announced it would double the size of its public equity allocation. We allowed the Portfolio’s position in October 2014 S&P 500® Index put options to expire. |
| | During November 2014, we increased the Portfolio’s overweight in Japanese stocks in response to monetary policy developments and the potential for large investment inflows. We funded this position by reducing the Portfolio’s overall allocation to developed markets equities. In addition, we sold Australian dollar put options as the Australian dollar fell 7% versus the U.S. dollar. |
| | During December 2014, we shifted the Fund to a long position in the Indian rupee versus the U.S. dollar (accomplished through forward foreign currency exchange contracts) as India’s economic growth accelerated and in response to Prime Minister Narendra Modi’s agenda to implement incremental structural and fiscal reforms. The drop in oil prices also seemed likely to help India, which is a net importer of oil. In addition, we moved the Portfolio to a short position in the Australian dollar versus the U.S. dollar (accomplished through Australian dollar put options) given that the Australian economy faces multiple headwinds, including slowing economic growth in China, a significant drop in Australia’s commodity export prices (especially iron ore), a deceleration in mining investment and tighter fiscal policy. Both positions were funded by reducing the Portfolio’s allocation to investment grade fixed income. Additionally, we sold index put options on an energy ETF as energy stocks fell dramatically. We also increased the Portfolio’s short positions in the Japanese yen and the euro versus the U.S. dollar. The U.S. dollar had recently weakened, but we expected it to rebound and strengthen against both currencies, which is what occurred later in the Reporting Period. |
| | In January 2015, we replaced a portion of the Portfolio’s investment in a U.S. bank ETF with an increased allocation to U.S. equities. In addition, as large-cap U.S. bank stocks underperformed during the month, we sold index put options on a U.S. bank ETF as a way of monetizing the higher volatility. We also replaced the Portfolio’s tactical tilt to Spanish stocks versus French stocks with a tactical tilt to European stocks (accomplished through equity index futures) versus U.S. fixed income. Although the merits of a tactical tilt to Spanish stocks versus French stocks remained, we saw a strong risk/reward opportunity in European equities as Eurozone growth prospects appeared to be broadly improving. |
| | During February 2015, we implemented a hedge (accomplished through forward foreign currency exchange contracts) on the Portfolio’s exposure to developed markets currencies to mitigate risks of foreign exchange fluctuations associated with the Portfolio’s holdings of non-U.S. stocks. We also eliminated the Portfolio’s tactical tilt to European stocks because of unfavorable market technicals and stagnant European corporate earnings. |
| Q | | How did the Portfolio’s Underlying Funds perform relative to their respective benchmark indices during the Reporting Period? |
| A | | We use six Underlying Funds to implement our strategic allocation decisions within the Portfolio. Because of our tactical trading, the Portfolio was invested in five of these Underlying Funds during the Reporting Period. Four of these Underlying Funds outperformed their respective benchmark indices during the Reporting Period. (The Portfolio did not have an allocation to the Goldman Sachs Core Fixed Income Fund during the Reporting Period.) |
| | One of the Underlying Funds that outperformed in relative terms — the Goldman Sachs U.S. Tax-Managed Equity Fund — was one in which the Portfolio held its largest weightings. The Goldman Sachs MLP Energy Infrastructure Fund, the Goldman Sachs Emerging Markets Equity Insights Fund and the Goldman Sachs International Small Cap Insights Fund also outperformed their respective benchmark indices. |
| | The Goldman Sachs International Tax-Managed Equity Fund — in which the Portfolio also holds its largest |
13
PORTFOLIO RESULTS
| | weightings — underperformed its benchmark index during the Reporting Period. |
| Q | | How did the Portfolio use derivatives and similar instruments during the Reporting Period? |
| A | | The Portfolio used equity index futures and equity index options during the Reporting Period to implement our views on the U.S., Spanish, Italian, French, European, Japanese and emerging markets equity markets. The Portfolio employed put options to implement our views on the Australian dollar and forward foreign currency exchange contracts to obtain exposure to the British pound, Indian rupee, Australian dollar, euro and Japanese yen. In addition, some of the Portfolio’s Underlying Funds used derivatives during the Reporting Period to apply their active investment views with greater versatility and to afford greater risk management precision. As market conditions warranted during the Reporting Period, some of these Underlying Funds engaged in forward foreign currency exchange contracts, financial futures contracts, options and swap contracts to enhance portfolio return and for hedging purposes. |
| Q | | What changes did you make during the Reporting Period within the Portfolio? |
| A | | As mentioned previously, we made changes within the Portfolio during the Reporting Period based on our views about near-term expected market returns and as we sought to enhance performance. |
| Q | | What was the Portfolio’s tactical view and strategy at the end of the Reporting Period? |
| A | | In terms of our fixed income views at the end of the Reporting Period, the Portfolio had a tactical tilt to U.S. high yield corporate bonds, accomplished through an investment in the Goldman Sachs High Yield Fund. We consider U.S. high yield corporate bonds attractive relative to investment grade fixed income, where rising rates are likely, in our view, to lead to negative returns. In addition, at the end of the Reporting Period, the Portfolio had a tactical tilt to U.S. high yield bank loans, accomplished through an investment in the Goldman Sachs High Yield Floating Rate Fund, because we believe these securities are well suited for a rising rate environment. |
| | In terms of our equity views, the Portfolio had a tactical tilt to large-cap U.S. bank stocks (accomplished through an investment in an ETF) as our bullish case for U.S. banks remained intact at the end of the Reporting Period. Our positive view was based on the easing of bank lending standards and accelerating loan growth, among other things. In addition, at the end of the Reporting Period, the Portfolio had a tactical tilt to U.S. energy stocks (through equity index put options) due to their attractive valuations. The Portfolio also continued to have a tactical tilt to Spanish equities (through equity index futures). We believe Spain has made much needed progress in reforming its economy. Because the Spanish government is committed to reform and holds a stable majority in its parliament, we expect progress to continue. We maintained the Portfolio’s position in U.S. equity index put options as a hedge against the threat of geopolitical risks. Additionally, the Portfolio held a short position in Italian equities (through equity index put options), allowing it to earn a premium in exchange for the possibility of buying Italian stocks during the course of the next 12 months if prices decline. At the end of the Reporting Period, the Portfolio had a long position in Japanese stocks through an investment in equity index futures. In our view, Japan’s aggressive monetary policy and reform stand in contrast to the incremental monetary policy and structural reform in the Eurozone. In addition, Japanese equities have historically tended to rise substantially after major policy changes. |
| | In terms of our currency views, the Portfolio held a long position in the U.S. dollar versus the Japanese yen. We believe the Bank of Japan will maintain low interest rates and potentially introduce additional stimulus to achieve its 2% inflation target. Meanwhile, we expect U.S. interest rates to increase about mid-year 2015, providing a policy advantage for the U.S. relative to Japan. Additionally, at the end of the Reporting Period, the Portfolio had a short position in the euro versus the U.S. dollar, in line with our belief that U.S. and Eurozone monetary policy will further diverge, cross-border Eurozone capital flows will deteriorate and the ECB will continue to pursue its easy monetary policies. The Portfolio also had a long position in the Indian rupee versus the Australian dollar at the end of the Reporting Period. We believe the Indian rupee benefits from lower external vulnerabilities, positive capital inflows because of incremental implementation of structural and fiscal reforms, and oil price weakness. In contrast, we believe the Australian dollar faces headwinds from weak commodity prices, the deterioration of China’s economic growth, a shrinking trade balance and a central bank that favors looser monetary policy and a weaker currency. All these currency views were implemented though forward foreign currency exchange contracts. |
| | At the end of the Reporting Period, the Portfolio was hedged (accomplished through forward foreign currency exchange contracts) on its exposure to international developed markets currencies to mitigate risks of foreign exchange fluctuations associated with the Portfolio’s holdings of non-U.S. stocks. |
14
FUND BASICS
Tax-Advantaged Global Equity Portfolio
as of February 28, 2015
| | | | | | | | | | | | | | | | | | |
| | PERFORMANCE REVIEW | |
| | | September 1, 2014–
February 28, 2015 | | Portfolio
Total Return
(based on NAV)1 | | | TAG
Composite
Index2 | | | Barclays U.S.
Aggregate Bond
Index3 | | | MSCI ACWI
IMI Index4 | |
| | Class A | | | 2.07 | % | | | 1.01 | % | | | 2.25 | % | | | 0.86 | % |
| | | Institutional | | | 2.25 | | | | 1.01 | | | | 2.25 | | | | 0.86 | |
| | 1 | | The net asset value (“NAV”) represents the net assets of the class of the Portfolio (ex-dividend) divided by the total number of shares of the class outstanding. The Portfolio’s performance reflects the reinvestment of dividends and other distributions. The Portfolio’s performance does not reflect the deduction of any applicable sales charges. |
| | 2 | | The TAG Composite Index (“TAG Composite”) is a composite representation prepared by the investment adviser of the performance of the Portfolio’s asset classes weighted according to their respective weightings in the Portfolio’s target range. |
| | | | The TAG Composite Index is comprised of the Morgan Stanley Capital International All Country World Index IM I (Investable Market Index) (“MSCI ACWI IMI”) (90%) and the Barclays U.S. Aggregate Bond Index (10%). |
| | 3 | | The Barclays U.S. Aggregate Bond Index represents an unmanaged diversified portfolio of fixed income securities, including U.S. Treasuries, investment grade corporate bonds and mortgage-backed and asset-backed securities. |
| | 4 | | The MSCI ACWI IMI captures large, mid and small cap representation across 23 developed markets and 23 emerging markets. With 8,575 constituents, the MSCI ACWI IMI is comprehensive, covering approximately 99% of the global equity investment opportunity set. As of February 28, 2015, the 23 developed markets in the MSCI ACWI IMI include Australia, Austria, Belgium, Canada, Denmark, Finland, France, Germany, Hong Kong, Ireland, Israel, Italy, Japan, Netherlands, New Zealand, Norway, Portugal, Singapore, Spain, Sweden, Switzerland, the U.K. and the U.S. The 23 emerging markets include Brazil, Chile, China, Colombia, Czech Republic, Egypt, Greece, Hungary, India, Indonesia, South Korea, Malaysia, Mexico, Peru, Philippines, Poland, Russia, Qatar, South Africa, Taiwan, Thailand, Turkey and United Arab Emirates. |
| | | | | | | | | | | | | | | | |
| | STANDARDIZED TOTAL RETURNS5 |
| | | For the period ended 12/31/14 | | One Year | | | Five Years | | | Since Inception | | | Inception Date |
| | Class A | | | -0.41 | % | | | 10.23 | % | | | 5.16 | % | | 4/30/08 |
| | | Institutional | | | 5.80 | | | | 11.91 | | | | 6.48 | | | 4/30/08 |
| | 5 | | The Standardized Total Returns are average annual total returns as of the most recent calendar quarter-end. They assume reinvestment of all distributions at NAV. These returns reflect a maximum initial sales charge of 5.5% for Class A Shares. Because Institutional Shares do not involve a sales charge, such a charge is not applied to their Standardized Total Returns. |
The returns represent past performance. Past performance does not guarantee future results. The Portfolio’s investment return and principal value will fluctuate so that an investor’s shares, when redeemed, may be worth more or less than their original cost. Current performance may be lower or higher than the performance quoted above. Please visit our web site at www.GSAMFUNDS.com to obtain the most recent month-end returns. Performance reflects applicable fee waivers and/or expense limitations in effect during the periods shown. In their absence, performance would be reduced. Returns do not reflect the deduction of taxes that a shareholder would pay on Portfolio distributions or the redemption of Portfolio shares.
15
FUND BASICS
| | | | | | | | | | |
| | EXPENSE RATIOS6 | |
| | | | | Net Expense Ratio (Current) | | | Gross Expense Ratio (Before Waivers) | |
| | Class A | | | 1.43 | % | | | 1.45 | % |
| | | Institutional | | | 1.03 | | | | 1.05 | |
| | 6 | | The expense ratios of the Portfolio, both current (net of applicable fee waivers and/or expense limitations) and before waivers (gross of applicable fee waivers and/or expense limitations) are as set forth above according to the most recent publicly available Prospectus for the Portfolio and may differ from the expense ratios disclosed in the Financial Highlights in this report. Pursuant to a contractual arrangement, the Portfolio’s waivers and/or expense limitations will remain in place through at least December 29, 2015, and prior to such date the Investment Adviser may not terminate the arrangements without the approval of the Portfolio’s Board of Trustees. If these arrangements are discontinued in the future, the expense ratios may change without shareholder approval. |
| | | | | | | | | | | | | | |
| | STANDARDIZED AFTER-TAX PERFORMANCE AS OF 12/31/147 | |
| | | Class A Shares | | One Year | | | Five Years | | | Since Inception
(4/30/08) | |
| | Return before taxes* | | | -0.41 | % | | | 10.23 | % | | | 5.16 | % |
| | Return after taxes on distributions** | | | -1.03 | | | | 9.75 | | | | 4.72 | |
| | | Return after taxes on distributions and
sale of Portfolio shares*** | | | 0.27 | | | | 8.10 | | | | 4.02 | |
| | 7 | | The after-tax returns are calculated using the historically highest individual federal marginal income tax rates at the time of distributions (currently 23.8% for qualifying ordinary income dividends and long-term capital gain distributions and 43.4% for non-qualifying ordinary income dividends) and do not reflect state and local taxes. Actual after-tax returns will be calculated at calendar year-end and depend on an investor’s tax situation and may differ from those shown. In addition, the after-tax returns shown are not relevant to investors who hold Portfolio shares through tax-deferred arrangements such as 401(k) plans or individual retirement accounts. Under certain circumstances, the addition of the tax benefits from capital losses resulting from redemptions may cause the Returns After Taxes on Distributions and Sale of Portfolio Shares to be greater than the Returns After Taxes on Distributions or even Returns Before Taxes. Standardized after-tax returns assume reinvestment of all distributions at NAV and reflect a maximum initial sales charge of 5.5% for Class A Shares. |
*Returns Before Taxes do not reflect taxes on distributions on the Portfolio’s Class A Shares nor do they show how performance can be impacted by taxes when shares are redeemed.
**Returns After Taxes on Distributions assume that taxes are paid on distributions on the Portfolio’s Class A Shares (i.e., dividends and capital gains) but do not reflect taxes that may be incurred upon redemption of the Class A Shares at the end of the performance period.
***Returns After Taxes on Distributions and Sale of Portfolio Shares reflect taxes paid on distributions on the Portfolio’s Class A Shares and taxes applicable when the shares are redeemed.
16
FUND BASICS
|
| OVERALL UNDERLYING FUND WEIGHTINGS8 |
| Percentage of Net Assets |
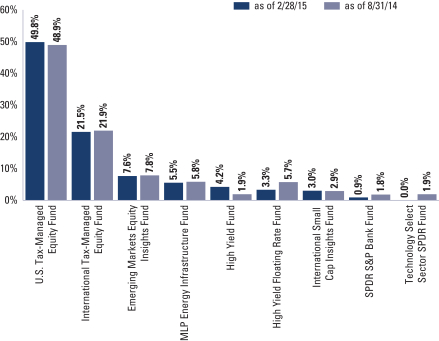
| | 8 | | The Portfolio is actively managed and, as such, its composition may differ over time. The percentage shown for each Underlying Fund reflects the value of that Underlying Fund as a percentage of net assets of the Portfolio. Figures in the graph above may not sum to 100% due to rounding and/or the exclusion of other assets and liabilities. Underlying sector allocations of ETFs held by the Portfolio are not reflected in the graph above. The above graph depicts the Portfolio’s investments but may not represent the Portfolio’s market exposure due to the exclusion of certain derivatives, if any, as listed in the Additional Investment Information section of the Schedule of Investments. |
17
GOLDMAN SACHS GLOBAL TAX-AWARE EQUITY PORTFOLIOS
Index Definitions:
The S&P 500® Index is the Standard & Poor’s 500 Composite Index of 500 stocks, an unmanaged index of common stock prices.
The MSCI® EAFE® Index (Europe, Australasia, Far East) is a free float-adjusted market capitalization index that is designed to measure the equity market performance of developed markets, excluding the US & Canada. The MSCI® EAFE® Index consists of the following 21 developed market country indexes: Australia, Austria, Belgium, Denmark, Finland, France, Germany, Hong Kong, Ireland, Israel, Italy, Japan, the Netherlands, New Zealand, Norway, Portugal, Singapore, Spain, Sweden, Switzerland, and the United Kingdom.
The Russell 3000® Index is an unmanaged index that measures the performance of the 3,000 largest U.S. companies based on total market capitalization which represents approximately 98% of the investable U.S. equity market.
The FTSE 100 Index (Financial Times Stock Exchange) covers 100 of the largest companies traded on the London Stock Exchange.
18
GOLDMAN SACHS ENHANCED DIVIDEND GLOBAL EQUITY PORTFOLIO
Schedule of Investments
February 28, 2015 (Unaudited)
| | | | | | | | |
| Shares | | | Description | | Value | |
| | | | | | | | |
| | Underlying Funds (Institutional Shares)(a) – 96.6% | |
| | Equity – 88.4% | | | | |
| | 13,714,303 | | | Goldman Sachs U.S. Equity Dividend and Premium Fund | | $ | 165,394,491 | |
| | 11,400,503 | | | Goldman Sachs International Equity Dividend and Premium Fund | | | 83,109,665 | |
| | 1,647,429 | | | Goldman Sachs Small Cap Equity Insights Fund | | | 33,624,021 | |
| | 3,491,746 | | | Goldman Sachs Emerging Markets Equity Insights Fund | | | 30,203,604 | |
| | 1,881,029 | | | Goldman Sachs MLP Energy Infrastructure Fund | | | 21,801,131 | |
| | 1,122,880 | | | Goldman Sachs International Small Cap Insights Fund | | | 11,565,663 | |
| | | | | | | | |
| | | | | | | 345,698,575 | |
| | |
| | Fixed Income – 8.2% | | | | |
| | 2,615,463 | | | Goldman Sachs High Yield Fund | | | 17,968,234 | |
| | 1,430,524 | | | Goldman Sachs High Yield Floating Rate Fund | | | 14,205,103 | |
| | 566 | | | Goldman Sachs Core Fixed Income Fund | | | 6,037 | |
| | | | | | | | |
| | | | | | | 32,179,374 | |
| | |
| TOTAL UNDERLYING FUNDS
(INSTITUTIONAL SHARES) – 96.6% |
|
| | (Cost $319,978,886) | | $ | 377,877,949 | |
| | |
| | | | | | | | |
| | Exchange Traded Fund – 1.0% | |
| | 119,614 | | | SPDR S&P Bank Fund | | $ | 3,958,027 | |
| | (Cost $3,829,393) | | | | |
| | |
| | | | | | | | | | | | | | |
| Contracts | | | Strike
Price | | | Expiration
Date | | | Value | |
| | | | | | | | | | | | | | |
| | Option Purchased – 0.0% | | | | | |
| S&P 500 Index Put Option | | | | | |
| | 179 | | | $ | 1,675 | | | | 03/20/15 | | | $ | 4,475 | |
| | (Cost $818,567) | | | | | | | | | |
| | |
| | TOTAL INVESTMENTS – 97.6% | | | | | |
| | (Cost $324,626,846) | | | $ | 381,840,451 | |
| | |
| OTHER ASSETS IN EXCESS OF
LIABILITIES – 2.4% |
| | | 9,285,774 | |
| | |
| | NET ASSETS – 100.0% | | | $ | 391,126,225 | |
| | |
| | |
| The percentage shown for each investment and investment category reflects the value of the respective investment or category as a percentage of net assets. |
(a) | | Represents Affiliated Funds. |
| | |
|
Investment Abbreviations: |
AUD | | — Australian Dollar |
CHF | | — Swiss Franc |
EUR | | — Euro |
GBP | | — British Pound |
INR | | — Indian Rupee |
JPY | | — Japanese Yen |
SPDR | | — Standard and Poor’s Depositary Receipts |
USD | | — United States Dollar |
|
| | |
| The accompanying notes are an integral part of these financial statements. | | 19 |
GOLDMAN SACHS ENHANCED DIVIDEND GLOBAL EQUITY PORTFOLIO
Schedule of Investments (continued)
February 28, 2015 (Unaudited)
|
| ADDITIONAL INVESTMENT INFORMATION |
FORWARD FOREIGN CURRENCY EXCHANGE CONTRACTS — At February 28, 2015, the Portfolio had the following forward foreign currency exchange contracts:
FORWARD FOREIGN CURRENCY EXCHANGE CONTRACTS WITH UNREALIZED GAIN
| | | | | | | | | | | | | | |
| Counterparty | | Contracts to
Buy/Sell | | Settlement
Date | | | Current Value | | | Unrealized Gain | |
Morgan Stanley Co., Inc. | | INR/USD | | | 03/18/15 | | | $ | 3,660,497 | | | $ | 60,497 | |
| | USD/AUD | | | 03/18/15 | | | | 3,349,021 | | | | 250,979 | |
| | USD/CHF | | | 03/18/15 | | | | 4,349,146 | | | | 150,854 | |
| | USD/EUR | | | 03/18/15 | | | | 21,506,732 | | | | 1,133,830 | |
| | | USD/JPY | | | 03/18/15 | | | | 10,804,396 | | | | 195,604 | |
| TOTAL | | | | | | | | | | | | $ | 1,791,764 | |
FORWARD FOREIGN CURRENCY EXCHANGE CONTRACTS WITH UNREALIZED LOSS
| | | | | | | | | | | | | | |
| Counterparty | | Contracts to
Buy/Sell | | Settlement
Date | | | Current Value | | | Unrealized
Loss | |
Morgan Stanley Co., Inc. | | USD/AUD | | | 03/18/15 | | | $ | 3,620,424 | | | $ | (20,424 | ) |
| | USD/GBP | | | 03/18/15 | | | | 10,079,018 | | | | (179,018 | ) |
| | | USD/JPY | | | 03/18/15 | | | | 10,731,347 | | | | (147,274 | ) |
| TOTAL | | | | | | | | | | | | $ | (346,716 | ) |
FUTURES CONTRACTS — At February 28, 2015, the Portfolio had the following futures contracts:
| | | | | | | | | | | | | | |
| Type | | Number of
Contracts
Long (Short) | | | Expiration
Date | | Current Value | | | Unrealized
Gain (Loss) | |
IBEX 35 Index | | | 60 | | | March 2015 | | $ | 7,489,802 | | | $ | 316,113 | |
TSE TOPIX Index | | | 58 | | | March 2015 | | | 7,396,364 | | | | 577,917 | |
| TOTAL | | | | | | | | | | | | $ | 894,030 | |
WRITTEN OPTIONS CONTRACTS — At February 28, 2015, the Fund had the following written options:
| | | | | | | | | | | | |
| Put Options | | Number of
Contracts | | | Exercise
Rate | | Expiration Month | | Value | |
FTSE MIB Index Put Option | | | 48 | | | EUR 19,000 | | June 2015 | | $ | (32,900 | ) |
SPDR S&P Bank ETF | | | 3,543,868 | | | $31 | | September 2015 | | | (142,287 | ) |
Energy Select Sector SPDR Fund | | | 3,132,887 | | | 67 | | January 2016 | | | (125,958 | ) |
| Total (Premiums Received $641,769) | | | 6,676,803 | | | | | | | $ | (301,145 | ) |
For the six months ended February 28, 2015, the Fund had the following written options activity:
| | | | | | | | |
| | | Number of Contracts | | | Premiums Received | |
Contracts Outstanding August 31, 2014 | | | 48 | | | $ | 137,656 | |
Contracts written | | | 6,676,755 | | | | 504,113 | |
Contracts Outstanding February 28, 2015 | | | 6,676,803 | | | $ | 641,769 | |
| | |
| 20 | | The accompanying notes are an integral part of these financial statements. |
GOLDMAN SACHS TAX-ADVANTAGED GLOBAL EQUITY PORTFOLIO
Schedule of Investments
February 28, 2015 (Unaudited)
| | | | | | | | |
| Shares | | | Description | | Value | |
| | | | | | | | |
| | Underlying Funds (Institutional Shares)(a) – 94.8% | |
| | Equity – 87.3% | | | | |
| | 42,497,307 | | | Goldman Sachs U.S. Tax-Managed Equity Fund | | $ | 773,450,979 | |
| | 37,290,770 | | | Goldman Sachs International Tax-Managed Equity Fund | | | 333,752,391 | |
| | 13,631,496 | | | Goldman Sachs Emerging Markets Equity Insights Fund | | | 117,912,440 | |
| | 7,361,614 | | | Goldman Sachs MLP Energy Infrastructure Fund | | | 85,321,107 | |
| | 4,457,071 | | | Goldman Sachs International Small Cap Insights Fund | | | 45,907,827 | |
| | | | | | | | |
| | | | | | | 1,356,344,744 | |
| | |
| | Fixed Income – 7.5% | | | | |
| | 9,524,488 | | | Goldman Sachs High Yield Fund | | | 65,433,234 | |
| | 5,201,537 | | | Goldman Sachs High Yield Floating Rate Fund | | | 51,651,267 | |
| | 2,273 | | | Goldman Sachs Core Fixed Income Fund | | | 24,226 | |
| | | | | | | | |
| | | | | | | 117,108,727 | |
| | |
| TOTAL UNDERLYING FUNDS
(INSTITUTIONAL SHARES) – 94.8% | | | | |
| | (Cost $1,166,191,126) | | $ | 1,473,453,471 | |
| | |
| | | | | | | | |
| | Exchange Traded Fund – 0.9% | |
| | 430,137 | | | SPDR S&P Bank Fund | | $ | 14,233,233 | |
| | (Cost $11,754,299) | | | | |
| | |
| | | | | | | | | | | | | | |
| Contracts | | | Strike
Price | | | Expiration
Date | | | Value | |
| | | | | | | | | | | | | | |
| | Option Purchased – 0.0% | |
| S&P 500 Index Put Option | |
| | 598 | | | $ | 1,675 | | | | 03/20/15 | | | $ | 14,950 | |
| | (Cost $2,734,654) | | | | | | | | | |
| | |
| | TOTAL INVESTMENTS – 95.7% | | | | | |
| | (Cost $1,180,680,079) | | | $ | 1,487,701,654 | |
| | |
| OTHER ASSETS IN EXCESS OF
LIABILITIES – 4.3% |
| | | 66,294,380 | |
| | |
| | NET ASSETS – 100.0% | | | $ | 1,553,996,034 | |
| | |
| | |
The percentage shown for each investment and investment category reflects the value of the respective investment or category as a percentage of net assets. |
(a) | | Represents Affiliated Funds. |
| | |
|
Investment Abbreviations: |
AUD | | — Australian Dollar |
CHF | | — Swiss Franc |
EUR | | — Euro |
GBP | | — British Pound |
INR | | — Indian Rupee |
JPY | | — Japanese Yen |
SPDR | | — Standard and Poor’s Depositary Receipts |
USD | | — United States Dollar |
|
| | |
| The accompanying notes are an integral part of these financial statements. | | 21 |
GOLDMAN SACHS TAX-ADVANTAGED GLOBAL EQUITY PORTFOLIO
Schedule of Investments (continued)
February 28, 2015 (Unaudited)
|
| ADDITIONAL INVESTMENT INFORMATION |
FORWARD FOREIGN CURRENCY EXCHANGE CONTRACTS — At February 28, 2015, the Portfolio had the following forward foreign currency exchange contracts:
FORWARD FOREIGN CURRENCY EXCHANGE CONTRACTS WITH UNREALIZED GAIN
| | | | | | | | | | | | | | |
| Counterparty | | Contracts to
Buy/Sell | | Settlement
Date | | | Current Value | | | Unrealized Gain | |
Morgan Stanley Co., Inc. | | INR/USD | | | 03/18/15 | | | $ | 12,811,741 | | | $ | 211,740 | |
| | USD/AUD | | | 03/18/15 | | | | 11,721,575 | | | | 878,425 | |
| | USD/CHF | | | 03/18/15 | | | | 15,946,868 | | | | 553,132 | |
| | USD/EUR | | | 03/18/15 | | | | 78,123,633 | | | | 4,106,504 | |
| | | USD/JPY | | | 03/18/15 | | | | 40,369,394 | | | | 730,606 | |
| TOTAL | | | | | | | | | | | | $ | 6,480,407 | |
FORWARD FOREIGN CURRENCY EXCHANGE CONTRACTS WITH UNREALIZED LOSS
| | | | | | | | | | | | | | |
| Counterparty | | Contracts to
Buy/Sell | | Settlement
Date | | | Current Value | | | Unrealized
Loss | |
Morgan Stanley Co., Inc. | | USD/AUD | | | 03/18/15 | | | $ | 13,274,887 | | | $ | (74,887 | ) |
| | USD/GBP | | | 03/18/15 | | | | 36,752,783 | | | | (652,783 | ) |
| | | USD/JPY | | | 03/18/15 | | | | 37,794,784 | | | | (519,534 | ) |
| TOTAL | | | | | | | | | | | | $ | (1,247,204 | ) |
FUTURES CONTRACTS — At February 28, 2015, the Portfolio had the following futures contracts:
| | | | | | | | | | | | | | |
| Type | | Number of
Contracts
Long (Short) | | | Expiration Date | | Current Value | | | Unrealized Gain (Loss) | |
IBEX 35 Index | | | 218 | | | March 2015 | | $ | 27,212,946 | | | $ | 1,148,025 | |
TSE TOPIX Index | | | 197 | | | March 2015 | | | 25,122,132 | | | | 1,962,926 | |
| TOTAL | | | | | | | | | | | | $ | 3,110,951 | |
WRITTEN OPTIONS CONTRACTS — At February 28, 2015, the Fund had the following written options:
| | | | | | | | | | | | |
| Put Options | | Number of
Contracts | | | Exercise
Rate | | Expiration
Month | | Value | |
FTSE MIB Index Put Option | | | 152 | | | EUR 19,000 | | June 2015 | �� | $ | (104,184 | ) |
SPDR S&P Bank ETF | | | 12,903,330 | | | $31 | | September 2015 | | | (518,073 | ) |
Energy Select Sector SPDR Fund | | | 11,123,929 | | | 67 | | January 2016 | | | (447,237 | ) |
| TOTAL (Premiums Received $2,249,235) | | | 24,027,411 | | | | | | | $ | (1,069,494 | ) |
For the six months ended February 28, 2015, the Fund had the following written options activity:
| | | | | | | | |
| | | Number of Contracts | | | Premiums Received | |
Contracts Outstanding August 31, 2014 | | | 152 | | | $ | 435,914 | |
Contracts written | | | 24,027,259 | | | | 1,813,321 | |
Contracts Outstanding February 28, 2015 | | | 24,027,411 | | | $ | 2,249,235 | |
| | |
| 22 | | The accompanying notes are an integral part of these financial statements. |
GOLDMAN SACHS GLOBAL TAX-AWARE EQUITY PORTFOLIOS
Statements of Assets and Liabilities
February 28, 2015 (Unaudited)
| | | | | | | | | | |
| | | | | Enhanced Dividend
Global Equity
Portfolio | | | Tax-Advantaged
Global Equity
Portfolio | |
| | Assets: | | | | | | | | |
| | Investments in Affiliated Underlying Funds, at value (cost $319,978,886 and $1,166,191,126) | | $ | 377,877,949 | | | $ | 1,473,453,471 | |
| | Investments, at value (cost $4,647,960 and $14,488,953) | | | 3,962,502 | | | | 14,248,183 | |
| | Cash | | | 8,342,376 | | | | 76,868,539 | |
| | Foreign currencies, at value (cost $339,216 and $1,077,554) | | | 336,579 | | | | 1,069,176 | |
| | Receivables: | | | | | | | | |
| | Collateral on certain derivative contracts(a) | | | 1,894,226 | | | | 3,225,000 | |
| | Portfolio shares sold | | | 712,629 | | | | 13,304,346 | |
| | Reimbursement from investment adviser | | | 8,182 | | | | 14,203 | |
| | Unrealized gain on forward foreign currency exchange contracts | | | 1,791,764 | | | | 6,480,407 | |
| | Variation margin on certain derivative contracts | | | 20,900 | | | | 65,350 | |
| | Other assets | | | 1,572 | | | | 4,396 | |
| | Total assets | | | 394,948,679 | | | | 1,588,733,071 | |
| | | | | | | | | | |
| | Liabilities: | | | | | | | | |
| | Payables: | | | | | | | | |
| | Portfolio shares redeemed | | | 3,055,472 | | | | 3,773,585 | |
| | Collateral on certain derivative contracts(a) | | | — | | | | 622,325 | |
| | Management fees | | | 44,412 | | | | 166,470 | |
| | Distribution and Service fees and Transfer Agent fees | | | 12,130 | | | | 44,512 | |
| | Investments purchased | | | — | | | | 27,725,915 | |
| | Unrealized loss on forward foreign currency exchange contracts | | | 346,716 | | | | 1,247,204 | |
| | Written options, at value (premiums received $641,769 and $2,249,235) | | | 301,145 | | | | 1,069,494 | |
| | Accrued expenses | | | 62,579 | | | | 87,532 | |
| | Total liabilities | | | 3,822,454 | | | | 34,737,037 | |
| | | | | | | | | | |
| | Net Assets: | | | | | | | | |
| | Paid-in capital | | | 331,312,810 | | | | 1,246,069,477 | |
| | Undistributed (distributions in excess of) net investment income | | | (235,318 | ) | | | 3,645,553 | |
| | Accumulated net realized gain (loss) | | | 179,718 | | | | (11,989,147 | ) |
| | Net unrealized gain | | | 59,869,015 | | | | 316,270,151 | |
| | | | | | | | | | |
| | | NET ASSETS | | $ | 391,126,225 | | | $ | 1,553,996,034 | |
| | | Net Assets: | | | | | | | | |
| | | Class A | | $ | 951,852 | | | $ | 402,794 | |
| | | Institutional | | | 390,174,373 | | | | 1,553,593,240 | |
| | | Total Net Assets | | $ | 391,126,225 | | | $ | 1,553,996,034 | |
| | | Shares outstanding $0.001 par value (unlimited shares authorized): | | | | | | | | |
| | | Class A | | | 83,422 | | | | 29,995 | |
| | | Institutional | | | 34,024,447 | | | | 116,415,838 | |
| | | Net asset value, offering and redemption price per share:(b) | | | | | | | | |
| | | Class A | | $ | 11.41 | | | $ | 13.43 | |
| | | Institutional | | | 11.47 | | | | 13.35 | |
| | (a) | | Segregated for initial margin and collateral on transactions as follows: |
| | | | | | | | | | | | |
Portfolio | | Forwards | | | Futures | | | Options | |
Enhanced Dividend Global Equity | | $ | (1,350,000 | ) | | $ | 1,080,000 | | | $ | 2,164,226 | |
Tax-Advantaged Global Equity | | | (4,890,000 | ) | | | 3,225,000 | | | | 4,267,675 | |
| | (b) | | Maximum public offering price per share for Class A shares of the Enhanced Dividend Global Equity and Tax-Advantaged Global Equity Portfolios is $12.07 and $14.21, respectively. |
| | |
| The accompanying notes are an integral part of these financial statements. | | 23 |
GOLDMAN SACHS GLOBAL TAX-AWARE EQUITY PORTFOLIOS
Statements of Operations
For the Six Months Ended February 28, 2015 (Unaudited)
| | | | | | | | | | |
| | | | | Enhanced Dividend
Global Equity
Portfolio | | | Tax-Advantaged
Global Equity
Portfolio | |
| | Investment income: | | | | | | | | |
| | Dividends from Affiliated Underlying Funds | | $ | 4,106,173 | | | $ | 19,308,819 | |
| | Dividends from Underlying Funds | | | 91,839 | | | | 310,858 | |
| | Total investment income | | | 4,198,012 | | | | 19,619,677 | |
| | | | | | | | | | |
| | Expenses: | | | | | | | | |
| | Management fees | | | 277,317 | | | | 974,992 | |
| | Transfer Agent fees(a) | | | 74,213 | | | | 260,196 | |
| | Professional fees | | | 44,559 | | | | 48,131 | |
| | Custody, accounting and administrative services | | | 22,417 | | | | 45,050 | |
| | Printing and mailing costs | | | 18,594 | | | | 31,405 | |
| | Trustee fees | | | 9,920 | | | | 10,792 | |
| | Registration fees | | | 7,950 | | | | 22,166 | |
| | Distribution and Service fees — Class A Shares | | | 436 | | | | 327 | |
| | Other | | | 9,306 | | | | 14,568 | |
| | Total expenses | | | 464,712 | | | | 1,407,627 | |
| | Less — expense reductions | | | (89,271 | ) | | | (91,790 | ) |
| | Net expenses | | | 375,441 | | | | 1,315,837 | |
| | NET INVESTMENT INCOME | | | 3,822,571 | | | | 18,303,840 | |
| | | | | | | | | | |
| | Realized and unrealized gain (loss): | | | | | | | | |
| | Net realized gain (loss) from: | | | | | | | | |
| | Investments in Affiliated Underlying Funds | | | 544,594 | | | | (4,963,819 | ) |
| | Investments | | | 2,160,284 | | | | 3,783,443 | |
| | Futures contracts | | | 324,681 | | | | 1,180,208 | |
| | Forward foreign currency exchange contracts | | | 1,181,088 | | | | 4,002,788 | |
| | Foreign currency transactions | | | (166,831 | ) | | | (391,502 | ) |
| | Capital gain distributions from Affiliated Underlying Funds | | | 9,146,146 | | | | 2,246,905 | |
| | Net change in unrealized gain (loss) on: | | | | | | | | |
| | Investments in Affiliated Underlying Funds | | | (10,791,287 | ) | | | 11,921,580 | |
| | Investments | | | (3,012,736 | ) | | | (6,701,186 | ) |
| | Futures contracts | | | 502,445 | | | | 1,831,810 | |
| | Forward foreign currency exchange contracts | | | 1,501,287 | | | | 5,408,168 | |
| | Foreign currency translation | | | (11,492 | ) | | | (236,850 | ) |
| | Written options | | | 333,648 | | | | 1,157,648 | |
| | Net realized and unrealized gain | | | 1,711,827 | | | | 19,239,193 | |
| | NET INCREASE IN NET ASSETS RESULTING FROM OPERATIONS | | $ | 5,534,398 | | | $ | 37,543,033 | |
| | (a) | | Class specific Transfer Agent fees were as follows: |
| | | | | | | | |
| | | Transfer Agent Fees | |
Portfolio | | Class A | | | Institutional | |
| Enhanced Dividend Global Equity | | $ | 331 | | | $ | 73,882 | |
| Tax-Advantaged Global Equity | | | 249 | | | | 259,947 | |
| | |
| 24 | | The accompanying notes are an integral part of these financial statements. |
GOLDMAN SACHS GLOBAL TAX-AWARE EQUITY PORTFOLIOS
Statements of Changes in Net Assets
| | | | | | | | | | | | | | | | | | |
| | | | | Enhanced Dividend Global Equity Portfolio | | | Tax-Advantaged Global Equity Portfolio | |
| | | | | For the
Six Months Ended
February 28, 2015
(Unaudited) | | | For the Fiscal
Year Ended
August 31, 2014 | | | For the
Six Months Ended
February 28, 2015
(Unaudited) | | | For the Fiscal
Year Ended
August 31, 2014 | |
| | From operations: | | | | | | | | | | | | | | | | |
| | Net investment income | | $ | 3,822,571 | | | $ | 8,178,797 | | | $ | 18,303,840 | | | $ | 14,190,369 | |
| | Net realized gain | | | 13,189,962 | | | | 14,399,259 | | | | 5,858,023 | | | | 29,671,336 | |
| | Net change in unrealized gain (loss) | | | (11,478,135 | ) | | | 32,337,636 | | | | 13,381,170 | | | | 147,385,149 | |
| | Net increase in net assets resulting from operations | | | 5,534,398 | | | | 54,915,692 | | | | 37,543,033 | | | | 191,246,854 | |
| | | | | | | | | | | | | | | | | | |
| | Distributions to shareholders: | | | | | | | | | | | | | | | | |
| | From net investment income | | | | | | | | | | | | | | | | |
| | Class A Shares | | | (3,217 | ) | | | (3,755 | ) | | | (1,961 | ) | | | — | |
| | Institutional Shares | | | (6,097,343 | ) | | | (8,228,288 | ) | | | (19,000,269 | ) | | | (11,583,396 | ) |
| | From net realized gains | | | | | | | | | | | | | | | | |
| | Class A Shares | | | (6,895 | ) | | | (5,994 | ) | | | (4,378 | ) | | | (17,701 | ) |
| | Institutional Shares | | | (11,596,540 | ) | | | (11,673,301 | ) | | | (23,367,537 | ) | | | (21,947,805 | ) |
| | Total distributions to shareholders | | | (17,703,995 | ) | | | (19,911,338 | ) | | | (42,374,145 | ) | | | (33,548,902 | ) |
| | | | | | | | | | | | | | | | | | |
| | From share transactions: | | | | | | | | | | | | | | | | |
| | Proceeds from sales of shares | | | 31,979,909 | | | | 75,496,200 | | | | 360,063,478 | | | | 386,507,016 | |
| | Reinvestment of distributions | | | 17,332,080 | | | | 19,329,204 | | | | 41,144,277 | | | | 32,487,429 | |
| | Cost of shares redeemed | | | (19,900,321 | ) | | | (40,617,222 | ) | | | (76,181,768 | ) | | | (83,386,177 | ) |
| | Net increase in net assets resulting from share transactions | | | 29,411,668 | | | | 54,208,182 | | | | 325,025,987 | | | | 335,608,268 | |
| | TOTAL INCREASE | | | 17,242,071 | | | | 89,212,536 | | | | 320,194,875 | | | | 493,306,220 | |
| | | | | | | | | | | | | | | | | | |
| | Net assets: | | | | | | | | | | | | | | | | |
| | Beginning of period | | | 373,884,154 | | | | 284,671,618 | | | | 1,233,801,159 | | | | 740,494,939 | |
| | End of period | | $ | 391,126,225 | | | $ | 373,884,154 | | | $ | 1,553,996,034 | | | $ | 1,233,801,159 | |
| | Undistributed (distributions in excess of) net investment income | | $ | (235,318 | ) | | $ | 2,042,671 | | | $ | 3,645,553 | | | $ | 4,343,943 | |
| | |
| The accompanying notes are an integral part of these financial statements. | | 25 |
GOLDMAN SACHS ENHANCED DIVIDEND GLOBAL EQUITY PORTFOLIO
Financial Highlights
Selected Data for a Share Outstanding Throughout Each Period
| | | | | | | | | | | | | | | | | | | | | | | | | | | | | | |
| | | | | | | | Income from
investment operations | | | Distributions
to shareholders | |
| | | Year - Share Class | |
Net asset
value,
beginning
of period | | | Net
investment
income(a)(b) | | | Net realized
and unrealized
gain | | | Total from
investment
operations | | | From net
investment
income | | | From net
realized
gains | | | Total
distributions | |
| | FOR THE SIX MONTHS ENDED FEBRUARY 28, (UNAUDITED) | |
| | 2015 - A | | $ | 11.83 | | | $ | 0.07 | | | $ | 0.03 | | | $ | 0.10 | | | $ | (0.16 | ) | | $ | (0.36 | ) | | $ | (0.52 | ) |
| | 2015 - Institutional | | | 11.89 | | | | 0.12 | | | | 0.01 | | | | 0.13 | | | | (0.19 | ) | | | (0.36 | ) | | | (0.55 | ) |
| | | | | | | | | | | | | | | | | | | | | | | | | | | | | | |
| | FOR THE FISCAL YEARS ENDED AUGUST 31, | |
| | 2014 - A | | | 10.64 | | | | 0.23 | | | | 1.62 | | | | 1.85 | | | | (0.24 | ) | | | (0.42 | ) | | | (0.66 | ) |
| | 2014 - Institutional | | | 10.69 | | | | 0.28 | | | | 1.62 | | | | 1.90 | | | | (0.28 | ) | | | (0.42 | ) | | | (0.70 | ) |
| | 2013 - A | | | 9.73 | | | | 0.21 | | | | 1.08 | | | | 1.29 | | | | (0.27 | ) | | | (0.11 | ) | | | (0.38 | ) |
| | 2013 - Institutional | | | 9.76 | | | | 0.26 | | | | 1.09 | | | | 1.35 | | | | (0.31 | ) | | | (0.11 | ) | | | (0.42 | ) |
| | 2012 - A | | | 9.23 | | | | 0.19 | | | | 0.58 | | | | 0.77 | | | | (0.26 | ) | | | (0.01 | ) | | | (0.27 | ) |
| | 2012 - Institutional | | | 9.27 | | | | 0.23 | | | | 0.57 | | | | 0.80 | | | | (0.30 | ) | | | (0.01 | ) | | | (0.31 | ) |
| | 2011 - A | | | 8.27 | | | | 0.18 | | | | 1.03 | | | | 1.21 | | | | (0.20 | ) | | | (0.05 | ) | | | (0.25 | ) |
| | 2011 - Institutional | | | 8.30 | | | | 0.22 | | | | 1.04 | | | | 1.26 | | | | (0.24 | ) | | | (0.05 | ) | | | (0.29 | ) |
| | 2010 - A | | | 7.98 | | | | 0.15 | | | | 0.32 | | | | 0.47 | | | | (0.16 | ) | | | (0.02 | ) | | | (0.18 | ) |
| | 2010 - Institutional | | | 8.00 | | | | 0.19 | | | | 0.32 | | | | 0.51 | | | | (0.19 | ) | | | (0.02 | ) | | | (0.21 | ) |
| | (a) | | Calculated based on the average shares outstanding methodology. |
| | (b) | | Recognition of net investment income by the Portfolio is affected by the timing of declaration of dividends by the Underlying Funds in which the Portfolio invests. |
| | (c) | | Assumes investment at the net asset value at the beginning of the period, reinvestment of all distributions, a complete redemption of the investment at the net asset value at the end of the period and no sales or redemption charges. Total returns would be reduced if a sales or redemption charge was taken into account. Returns do not reflect the deduction of taxes that a shareholder would pay on Portfolio distributions or the redemption of Portfolio shares. Total returns for periods less than one full year are not annualized. |
| | (d) | | Expense ratios exclude the expenses of the Underlying Funds in which the Portfolio invests. |
| | (e) | | The portfolio turnover rate is calculated in accordance with regulatory requirements, without regard to transactions involving short term investments and certain derivatives. If such transactions were included, the portfolio turnover rate may be higher. |
| | |
| 26 | | The accompanying notes are an integral part of these financial statements. |
GOLDMAN SACHS ENHANCED DIVIDEND GLOBAL EQUITY PORTFOLIO
| | | | | | | | | | | | | | | | | | | | | | | | | | | | | | | | | | | | | | | | |
| | | | | | | | | | | | | | | | | | | | | | | | | | | | | | | | | | |
| | | Net asset
value, end
of period | | | | | Total
return(c) | | | | | Net assets,
end of
period
(in 000s) | | | | | Ratio of
net expenses
to average
net assets(d) | | | | | Ratio of
total expenses
to average
net assets(d) | | | | | Ratio of
net investment
income
to average
net assets(b) | | | | | Portfolio
turnover
rate(e) | |
| | | | | | | | | | | | | | | | | | | | | | | | | | | | | | | | | | | | | | | | |
| | $ | 11.41 | | | | | | 1.13 | % | | | | $ | 952 | | | | | | 0.60 | %(f) | | | | | 0.64 | %(f) | | | | | 1.30 | %(f) | | | | | 12 | % |
| | | 11.47 | | | | | | 1.42 | | | | | | 390,174 | | | | | | 0.20 | (f) | | | | | 0.25 | (f) | | | | | 2.07 | (f) | | | | | 12 | |
| | | | | | | | | | | | | | | | | | | | | | | | | | | | | | | | | | | | | | | | |
| | | | | | | | | | | | | | | | | | | | | | | | | | | | | | | | | | | | | | | | |
| | | 11.83 | | | | | | 17.92 | | | | | | 220 | | | | | | 0.60 | | | | | | 0.66 | | | | | | 2.02 | | | | | | 14 | |
| | | 11.89 | | | | | | 18.29 | | | | | | 373,665 | | | | | | 0.20 | | | | | | 0.26 | | | | | | 2.43 | | | | | | 14 | |
| | | 10.64 | | | | | | 13.61 | | | | | | 133 | | | | | | 0.60 | | | | | | 0.68 | | | | | | 2.13 | | | | | | 40 | |
| | | 10.69 | | | | | | 14.21 | | | | | | 284,539 | | | | | | 0.20 | | | | | | 0.29 | | | | | | 2.49 | | | | | | 40 | |
| | | 9.73 | | | | | | 8.51 | | | | | | 127,290 | | | | | | 0.60 | | | | | | 0.70 | | | | | | 2.02 | | | | | | 32 | |
| | | 9.76 | | | | | | 8.79 | | | | | | 75,735 | | | | | | 0.20 | | | | | | 0.30 | | | | | | 2.42 | | | | | | 32 | |
| | | 9.23 | | | | | | 14.52 | | | | | | 102,498 | | | | | | 0.60 | | | | | | 0.73 | | | | | | 1.91 | | | | | | 25 | |
| | | 9.27 | | | | | | 15.01 | | | | | | 65,856 | | | | | | 0.20 | | | | | | 0.33 | | | | | | 2.28 | | | | | | 25 | |
| | | 8.27 | | | | | | 5.80 | | | | | | 54,481 | | | | | | 0.60 | | | | | | 0.78 | | | | | | 1.74 | | | | | | 42 | |
| | | 8.30 | | | | | | 6.31 | | | | | | 30,802 | | | | | | 0.20 | | | | | | 0.38 | | | | | | 2.18 | | | | | | 42 | |
| | |
| The accompanying notes are an integral part of these financial statements. | | 27 |
GOLDMAN SACHS TAX-ADVANTAGED GLOBAL EQUITY PORTFOLIO
Financial Highlights
Selected Data for a Share Outstanding Throughout Each Period
| | | | | | | | | | | | | | | | | | | | | | | | | | | | | | |
| | | | | | | | Income from
investment operations | | | Distributions
to shareholders | |
| | | Year - Share Class | |
Net asset
value,
beginning
of period | | | Net
investment
income(a)(b) | | | Net realized
and unrealized
gain | | | Total from
investment
operations | | | From net
investment
income | | | From net
realized
gains | | | Total
distributions | |
| | FOR THE SIX MONTHS ENDED FEBRUARY 28, (UNAUDITED) | |
| | 2015 - A | | $ | 13.51 | | | $ | 0.15 | | | $ | 0.10 | | | $ | 0.25 | | | $ | (0.10 | ) | | $ | (0.23 | ) | | $ | (0.33 | ) |
| | 2015 - Institutional | | | 13.48 | | | | 0.18 | | | | 0.10 | | | | 0.28 | | | | (0.18 | ) | | | (0.23 | ) | | | (0.41 | ) |
| | | | | | | | | | | | | | | | | | | | | | | | | | | | | | |
| | FOR THE FISCAL YEARS ENDED AUGUST 31, | |
| | 2014 - A | | | 11.31 | | | | 0.20 | | | | 2.31 | | | | 2.51 | | | | — | | | | (0.31 | ) | | | (0.31 | ) |
| | 2014 - Institutional | | | 11.38 | | | | 0.18 | | | | 2.39 | | | | 2.57 | | | | (0.16 | ) | | | (0.31 | ) | | | (0.47 | ) |
| | 2013 - A | | | 9.78 | | | | 0.32 | | | | 1.41 | | | | 1.73 | | | | (0.17 | ) | | | (0.03 | ) | | | (0.20 | ) |
| | 2013 - Institutional | | | 9.84 | | | | 0.15 | | | | 1.63 | | | | 1.78 | | | | (0.21 | ) | | | (0.03 | ) | | | (0.24 | ) |
| | 2012 - A | | | 8.98 | | | | 0.15 | | | | 0.79 | | | | 0.94 | | | | (0.13 | ) | | | (0.01 | ) | | | (0.14 | ) |
| | 2012 - Institutional | | | 9.04 | | | | 0.17 | | | | 0.81 | | | | 0.98 | | | | (0.17 | ) | | | (0.01 | ) | | | (0.18 | ) |
| | 2011 - A | | | 7.84 | | | | 0.10 | | | | 1.19 | | | | 1.29 | | | | (0.12 | ) | | | (0.03 | ) | | | (0.15 | ) |
| | 2011 - Institutional | | | 7.89 | | | | 0.14 | | | | 1.19 | | | | 1.33 | | | | (0.15 | ) | | | (0.03 | ) | | | (0.18 | ) |
| | 2010 - A | | | 7.78 | | | | 0.11 | | | | 0.10 | | | | 0.21 | | | | (0.13 | ) | | | (0.02 | ) | | | (0.15 | ) |
| | 2010 - Institutional | | | 7.82 | | | | 0.14 | | | | 0.10 | | | | 0.24 | | | | (0.15 | ) | | | (0.02 | ) | | | (0.17 | ) |
| | (a) | | Calculated based on the average shares outstanding methodology. |
| | (b) | | Recognition of net investment income by the Portfolio is affected by the timing of declaration of dividends by the Underlying Funds in which the Portfolio invests. |
| | (c) | | Assumes investment at the net asset value at the beginning of the period, reinvestment of all distributions, a complete redemption of the investment at the net asset value at the end of the period and no sales or redemption charges. Total returns would be reduced if a sales or redemption charge was taken into account. Returns do not reflect the deduction of taxes that a shareholder would pay on Portfolio distributions or the redemption of Portfolio shares. Total returns for periods less than one full year are not annualized. |
| | (d) | | Expense ratios exclude the expenses of the Underlying Funds in which the Portfolio invests. |
| | (e) | | The portfolio turnover rate is calculated in accordance with regulatory requirements, without regard to transactions involving short term investments and certain derivatives. If such transactions were included, the portfolio turnover rate may be higher. |
| | |
| 28 | | The accompanying notes are an integral part of these financial statements. |
GOLDMAN SACHS TAX-ADVANTAGED GLOBAL EQUITY PORTFOLIO
| | | | | | | | | | | | | | | | | | | | | | | | | | | | | | | | | | | | | | | | |
| | | | | | | | | | | | | | | | | | | | | | | | | | | | | | | | | | |
| | | Net asset
value, end
of period | | | | | Total
return(c) | | | | | Net assets,
end of
period
(in 000s) | | | | | Ratio of
net expenses
to average
net assets(d) | | | | | Ratio of
total expenses
to average
net assets(d) | | | | | Ratio of
net investment
income
to average
net assets(b) | | | | | Portfolio
turnover
rate(e) | |
| | | | | | | | | | | | | | | | | | | | | | | | | | | | | | | | | | | | | | | | |
| | $ | 13.43 | | | | | | 2.07 | % | | | | $ | 403 | | | | | | 0.60 | %(f) | | | | | 0.62 | %(f) | | | | | 2.27 | %(f) | | | | | 12 | % |
| | | 13.35 | | | | | | 2.25 | | | | | | 1,553,593 | | | | | | 0.20 | (f) | | | | | 0.22 | (f) | | | | | 2.82 | (f) | | | | | 12 | |
| | | | | | | | | | | | | | | | | | | | | | | | | | | | | | | | | | | | | | | | |
| | | | | | | | | | | | | | | | | | | | | | | | | | | | | | | | | | | | | | | | |
| | | 13.51 | | | | | | 22.55 | | | | | | 235 | | | | | | 0.60 | | | | | | 0.62 | | | | | | 1.56 | | | | | | 9 | |
| | | 13.48 | | | | | | 23.05 | | | | | | 1,233,566 | | | | | | 0.20 | | | | | | 0.22 | | | | | | 1.43 | | | | | | 9 | |
| | | 11.31 | | | | | | 18.12 | | | | | | 636 | | | | | | 0.60 | | | | | | 0.64 | | | | | | 3.16 | | | | | | 36 | |
| | | 11.38 | | | | | | 18.45 | | | | | | 739,859 | | | | | | 0.20 | | | | | | 0.24 | | | | | | 1.34 | | | | | | 36 | |
| | | 9.78 | | | | | | 10.52 | | | | | | 243,892 | | | | | | 0.60 | | | | | | 0.65 | | | | | | 1.62 | | | | | | 24 | |
| | | 9.84 | | | | | | 11.02 | | | | | | 207,103 | | | | | | 0.20 | | | | | | 0.25 | | | | | | 1.88 | | | | | | 24 | |
| | | 8.98 | | | | | | 16.41 | | | | | | 222,002 | | | | | | 0.60 | | | | | | 0.66 | | | | | | 1.05 | | | | | | 23 | |
| | | 9.04 | | | | | | 16.89 | | | | | | 147,848 | | | | | | 0.20 | | | | | | 0.26 | | | | | | 1.46 | | | | | | 23 | |
| | | 7.84 | | | | | | 2.56 | | | | | | 191,008 | | | | | | 0.60 | | | | | | 0.69 | | | | | | 1.30 | | | | | | 23 | |
| | | 7.89 | | | | | | 2.94 | | | | | | 57,539 | | | | | | 0.20 | | | | | | 0.29 | | | | | | 1.73 | | | | | | 23 | |
| | |
| The accompanying notes are an integral part of these financial statements. | | 29 |
GOLDMAN SACHS GLOBAL TAX-AWARE EQUITY PORTFOLIOS
Notes to Financial Statements
February 28, 2015 (Unaudited)
Goldman Sachs Trust (the “Trust”) is a Delaware statutory trust registered under the Investment Company Act of 1940, as amended (the “Act”), as an open-end management investment company. The following table lists those series of the Trust that are included in this report (collectively, the “Portfolios” or individually a “Portfolio”), along with their corresponding share classes and respective diversification status under the Act:
| | | | |
| Portfolio | | Share Classes Offered | | Diversified/ Non-diversified |
Enhanced Dividend Global Equity and Tax-Advantaged Global Equity | | A and Institutional | | Diversified |
Class A Shares are sold with a front-end sales charge of up to 5.50%. Institutional Shares are not subject to a sales charge.
Goldman Sachs Asset Management, L.P. (“GSAM”), an affiliate of Goldman, Sachs & Co. (“Goldman Sachs”), serves as investment adviser to the Portfolios pursuant to a management agreement (the “Agreement”) with the Trust.
The Portfolios are expected to invest primarily in a combination of domestic and international equity and fixed income underlying funds (“Underlying Funds”) which are registered under the Act, for which GSAM or Goldman Sachs Asset Management International (“GSAMI”), also an affiliate of Goldman Sachs, act as investment advisers. Additionally, these Portfolios may invest a portion of their assets directly in other securities and instruments, including unaffiliated exchange traded funds (“Unaffiliated Funds”).
|
| 2. SIGNIFICANT ACCOUNTING POLICIES |
The financial statements have been prepared in accordance with accounting principles generally accepted in the United States of America (“GAAP”) and require management to make estimates and assumptions that may affect the reported amounts and disclosures. Actual results may differ from those estimates and assumptions.
A. Investment Valuation — The Portfolios’ valuation policy, as well as the Underlying Funds’ is to value investments at fair value.
B. Investment Income and Investments — Investment income includes interest income and dividend income, net of any foreign withholding taxes, less any amounts reclaimable. Interest income is accrued daily and adjusted for amortization of premiums and accretion of discounts. Dividend income is recognized on ex-dividend date or, for certain foreign securities, as soon as such information is obtained subsequent to the ex-dividend date. Capital gain distributions received from Underlying Funds are recognized on ex-dividend date. Investment transactions are reflected on trade date. Realized gains and losses are calculated using identified cost. Investment transactions are recorded on the following business day for daily net asset value (“NAV”) calculations. Any foreign capital gains tax is accrued daily based upon net unrealized gains, and is payable upon sale of such investments. Income distributions are recognized in accordance with the character that is distributed. Capital gain distributions are recorded as capital gains in the financial statements. Income distributions are recorded in income.
For derivative contracts, realized gains and losses are recorded upon settlement of the contract.
30
GOLDMAN SACHS GLOBAL TAX-AWARE EQUITY PORTFOLIOS
|
| 2. SIGNIFICANT ACCOUNTING POLICIES (continued) |
C. Class Allocations and Expenses — Investment income, realized and unrealized gain (loss), and non-class specific expenses of each Portfolio are allocated daily based upon the proportion of net assets of each class. Class specific expenses, where applicable, are borne by the respective share classes and include Distribution and Service, Transfer Agent and Service and Shareholder Administration fees. Non-class specific expenses directly incurred by a Portfolio are charged to that Portfolio, while such expenses incurred by the Trust are allocated across the respective Portfolios on a straight-line and/or pro-rata basis depending upon the nature of the expenses.
Expenses included in the accompanying financial statements reflect the expenses of each Portfolio and do not include any expenses associated with the Underlying Funds. Because the Underlying Funds have varied expense and fee levels and the Portfolios may own different proportions of the Underlying Funds at different times, the amount of fees and expenses incurred indirectly by each Portfolio will vary.
D. Federal Taxes and Distributions to Shareholders — It is each Portfolio’s policy to comply with the requirements of the Internal Revenue Code of 1986, as amended (the “Code”), applicable to regulated investment companies (mutual funds) and to distribute each year substantially all of its investment company taxable income and capital gains to its shareholders. Accordingly, the Portfolios are not required to make any provisions for the payment of federal income tax. Distributions to shareholders are recorded on the ex-dividend date. Income and capital gains distributions, if any, are declared and paid according to the following schedule:
| | | | | | |
| Portfolio | | | | Income Distributions Declared/Paid | | Capital Gains Distributions Declared/Paid |
Enhanced Dividend Global Equity | | | | Quarterly | | Annually |
Tax-Advantaged Global Equity | | | | Annually | | Annually |
Net capital losses are carried forward to future fiscal years and may be used to the extent allowed by the Code to offset any future capital gains. Losses that are carried forward will retain their character as either short-term or long-term capital losses. Utilization of capital loss carryforwards will reduce the requirement of future capital gains distributions.
The characterization of distributions to shareholders for financial reporting purposes is determined in accordance with federal income tax rules, which may differ from GAAP. The source of each Portfolio’s distributions may be shown in the accompanying financial statements as either from net investment income, net realized gain or capital. Certain components of the Portfolios’ net assets on the Statements of Assets and Liabilities reflect permanent GAAP/tax differences based on the appropriate tax character.
E. Foreign Currency Translation — The accounting records and reporting currency of the Portfolios are maintained in United States (“U.S.”) dollars. Assets and liabilities denominated in foreign currencies are translated into U.S. dollars using the current exchange rates at the close of each business day. The effect of changes in foreign currency exchange rates on investments is included within net realized and unrealized gain (loss) on investments. Changes in the value of other assets and liabilities as a result of fluctuations in foreign exchange rates are included in the Statements of Operations within net change in unrealized gain (loss) on foreign currency transactions. Transactions denominated in foreign currencies are translated into U.S. dollars on the date the transaction occurred, the effects of which are included within net realized gain (loss) on foreign currency transactions.
31
GOLDMAN SACHS GLOBAL TAX-AWARE EQUITY PORTFOLIOS
Notes to Financial Statements (continued)
February 28, 2015 (Unaudited)
|
| 3. INVESTMENTS AND FAIR VALUE MEASUREMENTS |
The fair value of a financial instrument is the amount that would be received to sell an asset or paid to transfer a liability in an orderly transaction between market participants at the measurement date (i.e., the exit price). GAAP establishes a fair value hierarchy that prioritizes the inputs to valuation techniques used to measure fair value. The hierarchy gives the highest priority to unadjusted quoted prices in active markets for identical assets or liabilities (Level 1 measurements) and the lowest priority to unobservable inputs (Level 3 measurements). The levels used for classifying investments are not necessarily an indication of the risk associated with investing in these investments. The three levels of the fair value hierarchy are described below:
Level 1 — Unadjusted quoted prices in active markets that are accessible at the measurement date for identical, unrestricted assets or liabilities;
Level 2 — Quoted prices in markets that are not active or financial instruments for which significant inputs are observable (including, but not limited to, quoted prices for similar investments, interest rates, foreign exchange rates, volatility and credit spreads), either directly or indirectly;
Level 3 — Prices or valuations that require significant unobservable inputs (including GSAM’s assumptions in determining fair value measurement).
The Trustees have adopted Valuation Procedures that govern the valuation of the portfolio investments held by the Portfolios including investments for which market quotations are not readily available. The Trustees have delegated to GSAM day-to-day responsibility for implementing and maintaining internal controls and procedures related to the valuation of the Portfolio’s portfolio investments. To assess the continuing appropriateness of pricing sources and methodologies, GSAM regularly performs price verification procedures and issues challenges as necessary to third party pricing vendors or brokers, and any differences are reviewed in accordance with the Valuation Procedures.
A. Level 1 and Level 2 Fair Value Investments — The valuation techniques and significant inputs used in determining the fair values for investments classified as Level 1 and Level 2 are as follows:
Underlying Funds — Investments in the Underlying Funds are valued at the NAV per share of the Institutional Share class of each Underlying Fund on the day of valuation. Because each Portfolio invests primarily in other mutual funds that fluctuate in value, the Portfolios’ shares will correspondingly fluctuate in value. These investments are generally classified as Level 1 of the fair value hierarchy.
The Underlying Funds may invest in debt securities which, if market quotations are readily available are valued daily on the basis of quotations supplied by dealers or an independent pricing service approved by the Trustees. The pricing services may use valuation models or matrix pricing, which consider: (i) yield or price with respect to bonds that are considered comparable in characteristics such as rating, interest rate and maturity date or (ii) quotations from securities dealers to determine current value. Short-term debt obligations that mature in sixty days or less and that do not exhibit signs of credit deterioration are valued at amortized cost, which approximates fair value. With the exception of treasury securities of G8 countries (not held in money market funds), which are generally classified as Level 1, these investments are generally classified as Level 2 of the fair value hierarchy.
The Underlying Funds may invest in equity securities and investment companies. Investments in equity securities and investment companies traded on a U.S. securities exchange or the NASDAQ system, or those located on certain foreign exchanges, including but not limited to the Americas, are valued daily at their last sale price or official closing price on the principal exchange or system on which they are traded. If there is no sale or official closing price or it is believed by the investment adviser to not represent fair value, equity securities and exchange traded investment companies are valued at the last bid price for long positions and at the last ask price for short positions. Investments in investment companies (other than those that are exchange traded) are valued at the NAV on the valuation date. To the extent these investments are actively traded, they are classified as Level 1 of the fair value hierarchy, otherwise they are generally classified as Level 2.
32
GOLDMAN SACHS GLOBAL TAX-AWARE EQUITY PORTFOLIOS
|
| 3. INVESTMENTS AND FAIR VALUE MEASUREMENTS (continued) |
Unlisted equity securities for which market quotations are available are valued at the last sale price on the valuation date, or if no sale occurs, at the last bid price. Securities traded on certain foreign securities exchanges are valued daily at fair value determined by an independent fair value service (if available) under Valuation Procedures approved by the Trustees and consistent with applicable regulatory guidance. The independent fair value service takes into account multiple factors including, but not limited to, movements in the securities markets, certain depositary receipts, futures contracts and foreign currency exchange rates that have occurred subsequent to the close of the foreign securities exchange. These investments are generally classified as Level 2 of the fair value hierarchy.
Derivative Contracts — A derivative is an instrument whose value is derived from underlying assets, indices, reference rates or a combination of these factors. The Portfolios enter into derivative transactions to hedge against changes in interest rates, securities prices, and/or currency exchange rates, to increase total return, or to gain access to certain markets or attain exposure to other underliers.
Exchange-traded derivatives, including futures contracts, are valued at the last sale or settlement price and typically fall within Level 1 of the fair value hierarchy. Over-the-counter (“OTC”) and centrally cleared derivatives are valued using market transactions and other market evidence, including market-based inputs to models, calibration to market-clearing transactions, broker or dealer quotations, or other alternative pricing sources. Where models are used, the selection of a particular model to value OTC and centrally cleared derivatives depends upon the contractual terms of, and specific risks inherent in, the instrument, as well as the availability of pricing information in the market. Valuation models require a variety of inputs, including contractual terms, market prices, yield curves, credit curves, measures of volatility, voluntary and involuntary prepayment rates, loss severity rates and correlations of such inputs. For OTC and centrally cleared derivatives that trade in liquid markets, model inputs can generally be verified and model selection does not involve significant management judgment. OTC and centrally cleared derivatives are classified within Level 2 of the fair value hierarchy when significant inputs are corroborated by market evidence.
i. Forward Contracts — A forward contract is a contract between two parties to buy or sell an asset at a specified price on a future date. A forward contract settlement can occur on a cash or delivery basis. Forward contracts are marked-to-market daily using independent vendor prices, and the change in value, if any, is recorded as an unrealized gain or loss.
A forward foreign currency contract is a forward contract in which a Portfolio agrees to receive or deliver a fixed quantity of one currency for another, at a pre-determined price at a future date. All forward foreign currency exchange contracts are marked-to-market daily at the applicable forward rate. Non-deliverable forward foreign currency exchange contracts are settled with the counterparty in cash without the delivery of foreign currency.
ii. Futures Contracts — Futures contracts are contracts to buy or sell a standardized quantity of a specified commodity or security and are valued based on exchanged settlement prices or independent market quotes. Futures contracts are valued at the last settlement price, or in the absence of a sale, the last bid price for long positions and at the last ask price for short positions, at the end of each day on the board of trade or exchange upon which they are traded. Upon entering into a futures contract, a Portfolio deposits cash or securities in an account on behalf of the broker in an amount sufficient to meet the initial margin requirement. Subsequent payments are made or received by a Portfolio equal to the daily change in the contract value and are recorded as variation margin receivable or payable with a corresponding offset to unrealized gains or losses.
33
GOLDMAN SACHS GLOBAL TAX-AWARE EQUITY PORTFOLIOS
Notes to Financial Statements (continued)
February 28, 2015 (Unaudited)
|
| 3. INVESTMENTS AND FAIR VALUE MEASUREMENTS (continued) |
iii. Options — When a Portfolio writes call or put options, an amount equal to the premium received is recorded as a liability and is subsequently marked-to-market to reflect the current value of the option written. Swaptions are options on interest rate swap contracts.
Upon the purchase of a call option or a put option by a Portfolio, the premium paid is recorded as an investment and subsequently marked-to-market to reflect the current value of the option. Certain options may be purchased with premiums to be determined on a future date. The premiums for these options are based upon implied volatility parameters at specified terms.
B. Level 3 Fair Value Investments — To the extent that the aforementioned significant inputs are unobservable, or if quotations are not readily available, or if GSAM believes that such quotations do not accurately reflect fair value, the fair value of the Portfolios’ investments may be determined under Valuation Procedures approved by the Trustees. GSAM, consistent with its procedures and applicable regulatory guidance, may make an adjustment to the most recent valuation prices of either domestic or foreign securities in light of significant events to reflect what it believes to be the fair value of the securities at the time of determining a Portfolio’s NAV. Significant events which could affect a large number of securities in a particular market may include, but are not limited to: significant fluctuations in U.S. or foreign markets; market dislocations; market disruptions; or unscheduled market closings. Significant events which could also affect a single issuer may include, but are not limited to: corporate actions such as reorganizations, mergers and buy-outs; ratings downgrades; and bankruptcies.
C. Fair Value Hierarchy — The following is a summary of the Portfolios’ investments and derivatives classified in the fair value hierarchy as of February 28, 2015:
| | | | | | | | | | | | |
| | | |
| ENHANCED DIVIDEND GLOBAL EQUITY | | | | | | | | | | | | |
| | | |
| Investment Type | | Level 1 | | | Level 2 | | | Level 3 | |
| Assets | | | | | | | | | | | | |
Equity Underlying Funds | | $ | 345,698,575 | | | $ | — | | | $ | — | |
Fixed Income Underlying Funds | | | 32,179,374 | | | | — | | | | — | |
Exchange Traded Fund | | | 3,958,027 | | | | — | | | | — | |
| Total | | $ | 381,835,976 | | | $ | — | | | $ | — | |
| | | |
| Derivative Type | | Level 1 | | | Level 2 | | | Level 3 | |
| Assets | | | | | | | | | | | | |
Forward Foreign Currency Exchange Contracts(a) | | $ | — | | | $ | 1,791,764 | | | $ | — | |
Futures Contracts(a) | | | 894,030 | | | | — | | | | — | |
Option Purchased | | | 4,475 | | | | — | | | | — | |
| Total | | $ | 898,505 | | | $ | 1,791,764 | | | $ | — | |
| Liabilities | | | | | | | | | | | | |
Forward Foreign Currency Exchange Contracts(a) | | $ | — | | | $ | (346,716 | ) | | $ | — | |
Written Options Contracts | | | (32,900 | ) | | | (268,245 | ) | | | — | |
| Total | | $ | (32,900 | ) | | $ | (614,961 | ) | | $ | — | |
34
GOLDMAN SACHS GLOBAL TAX-AWARE EQUITY PORTFOLIOS
|
| 3. INVESTMENTS AND FAIR VALUE MEASUREMENTS (continued) |
| | | | | | | | | | | | |
| | | |
| TAX-ADVANTAGED GLOBAL EQUITY | | | | | | | | | | | | |
| | | |
| Investment Type | | Level 1 | | | Level 2 | | | Level 3 | |
| Assets | | | | | | | | | | | | |
Equity Underlying Funds | | $ | 1,356,344,744 | | | $ | — | | | $ | — | |
Fixed Income Underlying Funds | | | 117,108,727 | | | | — | | | | — | |
Exchange Traded Fund | | | 14,233,233 | | | | — | | | | — | |
| Total | | $ | 1,487,686,704 | | | $ | — | | | $ | — | |
| | | |
| Derivative Type | | | | | | | | | |
| Assets | | | | | | | | | | | | |
Forward Foreign Currency Exchange Contracts(a) | | $ | — | | | $ | 6,480,407 | | | $ | — | |
Futures Contracts(a) | | | 3,110,951 | | | | — | | | | — | |
Option Purchased | | | 14,950 | | | | — | | | | — | |
| Total | | $ | 3,125,901 | | | $ | 6,480,407 | | | $ | — | |
| Liabilities | | | | | | | | | | | | |
Forward Foreign Currency Exchange Contracts(a) | | $ | — | | | $ | (1,247,204 | ) | | $ | — | |
Written Options Contracts | | | (104,184 | ) | | | (965,310 | ) | | | — | |
| Total | | $ | (104,184 | ) | | $ | (2,212,514 | ) | | $ | — | |
| (a) | | Amount shown represents unrealized gain (loss) at period end. |
For further information regarding security characteristics, see the Schedules of Investments.
|
| 4. INVESTMENTS IN DERIVATIVES |
The following tables set forth, by certain risk types, the gross value of derivative contracts as of February 28, 2015. These instruments were used to meet the Portfolios’ investment objectives and to obtain and/or manage exposure related to the risks below. The values in the tables below exclude the effects of cash collateral received or posted pursuant to these derivative contracts, and therefore are not representative of the Portfolios’ net exposure:
| | | | | | | | | | | | |
| | |
| Enhanced Dividend Global Equity | | | | | | | |
| Risk | | Statements of Assets
and Liabilities | | Assets | | | Statements of Assets
and Liabilities | | Liabilities | |
Currency | | Receivable for unrealized gain on forward foreign currency exchange contracts | | $ | 1,791,764 | | | Payable for unrealized loss on forward foreign currency exchange contracts | | $ | (346,716) | |
Equity | | Variation margin on certain derivative contracts; Investments, at value | | | 898,505 | (a) | | Written options, at value | | | (301,145) | |
| Total | | | | $ | 2,690,269 | | | | | $ | (647,861) | |
35
GOLDMAN SACHS GLOBAL TAX-AWARE EQUITY PORTFOLIOS
Notes to Financial Statements (continued)
February 28, 2015 (Unaudited)
|
| 4. INVESTMENTS IN DERIVATIVES (continued) |
| | | | | | | | | | | | |
| | |
| Tax-Advantaged Global Equity | | | | | | | |
| Risk | | Statements of Assets
and Liabilities | | Assets | | | Statements of Assets
and Liabilities | | Liabilities | |
Currency | | Receivable for unrealized gain on forward foreign currency exchange contracts | | $ | 6,480,407 | | | Payable for unrealized loss on forward foreign currency exchange contracts | | $ | (1,247,204) | |
Equity | | Variation margin on certain derivative contracts; Investments, at value | | | 3,125,901 | (a) | | Written options, at value | | | (1,069,494) | |
| Total | | | | $ | 9,606,308 | | | | | $ | (2,316,698) | |
| (a) | | Includes unrealized gain (loss) on futures contracts described in the Additional Investment Information sections of the Schedules of Investments. Only current day’s variation margin is reported within the Statements of Assets and Liabilities. |
The following tables set forth, by certain risk types, the Portfolios’ gains (losses) related to these derivatives and their indicative volumes for the six months ended February 28, 2015. These gains (losses) should be considered in the context that these derivative contracts may have been executed to create investment opportunities and/or economically hedge certain investments, and accordingly, certain gains (losses) on such derivative contracts may offset certain (losses) gains attributable to investments. These gains (losses) are included in “Net realized gain (loss)” or “Net change in unrealized gain (loss)” on the Statements of Operations:
| | | | | | | | | | | | | | |
| | |
| Enhanced Dividend Global Equity | | | | | | | | | |
| Risk | | Statements of Operations | | Net Realized
Gain (Loss) | | | Net Change in
Unrealized
Gain (Loss) | | | Average
Number of
Contracts(a) | |
Currency | | Net realized gain (loss) from investments and forward foreign currency exchange contracts/Net change in unrealized gain (loss) from investments and forward foreign currency exchange contracts | | $ | 1,288,548 | | | $ | 1,550,708 | | | | 6 | |
Equity | | Net realized gain (loss) from investments and futures contracts/Net change in unrealized gain (loss) on investments, futures contracts and written options | | | 324,681 | | | | 117,056 | | | | 387 | |
| Total | | | | $ | 1,613,229 | | | $ | 1,667,764 | | | | 393 | |
| | |
| Tax-Advantaged Global Equity | | | | | | | | | |
| Risk | | Statements of Operations | | Net Realized
Gain (Loss) | | | Net Change in
Unrealized
Gain (Loss) | | | Average
Number of
Contracts(a) | |
Currency | | Net realized gain (loss) from investments and forward foreign currency exchange contracts/Net change in unrealized gain (loss) from investments and forward foreign currency exchange contracts | | $ | 4,331,138 | | | $ | 5,559,177 | | | | 8 | |
Equity | | Net realized gain (loss) from investments and futures contracts/Net change in unrealized gain (loss) on investments, futures contracts and written options | | | 1,620,252 | | | | 558,721 | | | | 1,236 | |
| Total | | | | $ | 5,951,390 | | | $ | 6,117,898 | | | | 1,244 | |
| (a) | | Average number of contracts is based on the average of month end balances for the period ended February 28, 2015. |
36
GOLDMAN SACHS GLOBAL TAX-AWARE EQUITY PORTFOLIOS
|
| 5. AGREEMENTS AND AFFILIATED TRANSACTIONS |
A. Management Agreement — Under the Agreement, GSAM manages the Portfolios, subject to the general supervision of the Trustees.
As compensation for the services rendered pursuant to the Agreement, the assumption of the expenses related thereto and administration of the Portfolios’ business affairs, including providing facilities, GSAM is entitled to a management fee, accrued daily and paid monthly, equal to an annual percentage rate of 0.15% of each Portfolio’s average daily net assets.
B. Distribution and Service Plans — The Trust, on behalf of each Portfolio’s Class A Shares, has adopted Distribution and Service Plans (the “Plans”). Under the Plans, Goldman Sachs, which serves as distributor (the “Distributor”), is entitled to a fee accrued daily and paid monthly, for distribution services and personal and account maintenance services, which may then be paid by Goldman Sachs to authorized dealers, equal to, on an annual basis, 0.25% of each Portfolio’s average daily net assets attributable to Class A Shares.
C. Distribution Agreement — Goldman Sachs, as Distributor of the shares of the Portfolios pursuant to a Distribution Agreement, may retain a portion of the Class A front end sales charge. During the six months ended February 28, 2015, Goldman Sachs advised that it did not retain any Class A front-end sales charges.
D. Transfer Agency Agreement — Goldman Sachs also serves as the transfer agent of the Portfolios for a fee pursuant to the Transfer Agency Agreement. The fees charged for such transfer agency services are accrued daily and paid monthly at annual rates as follows: 0.19% of the average daily net assets of Class A and 0.04% of the average daily net assets of Institutional Shares.
E. Other Expense Agreements and Affiliated Transactions — GSAM has agreed to limit certain “Other Expenses” of the Portfolios (excluding acquired fund fees and expenses, transfer agency fees and expenses, service fees and shareholder administration fees (as applicable), taxes, interest, brokerage fees, shareholder meetings, litigation, indemnification, and extraordinary expenses) to the extent such expenses exceed, on an annual basis, a percentage rate of the average daily net assets of each Portfolio. Such Other Expense reimbursements, if any, are accrued daily and paid monthly. In addition, the Portfolios are not obligated to reimburse GSAM for prior fiscal year expense reimbursements, if any. The Other Expense limitation as an annual percentage rate of average daily net assets for the Portfolios is 0.014%. These Other Expense limitations will remain in place through at least December 29, 2015, and prior to such date GSAM may not terminate the arrangements without the approval of the Trustees. The Portfolios bear their respective share of costs related to proxy and shareholder meetings, and GSAM has agreed to reimburse each Portfolio to the extent such expenses exceed a specified percentage of the Portfolio’s net assets. In addition, the Portfolios have entered into certain offset arrangements with the custodian and the transfer agent, which may result in a reduction of the Portfolios’ expenses and are received irrespective of the application of the “Other Expense” limitations described above.
For the six months ended February 28, 2015, these expense reductions, including any fee waivers and Other Expense reimbursements, were $89,271 and $91,790 for the Enhanced Dividend Global Equity and Tax-Advantaged Global Equity Portfolios, respectively.
F. Line of Credit Facility — As of February 28, 2015, the Portfolios participated in a $1,080,000,000 committed, unsecured revolving line of credit facility (the “facility”) together with other funds of the Trust and registered investment companies having management agreements with GSAM or its affiliates (“Other Borrowers”). Pursuant to the terms of the facility, the Portfolios and Other Borrowers could increase the credit amount by an additional $120,000,000, for a total of up to $1,200,000,000. This facility is to be used solely for temporary or emergency purposes, which may include the funding of redemptions. The interest rate on
37
GOLDMAN SACHS GLOBAL TAX-AWARE EQUITY PORTFOLIOS
Notes to Financial Statements (continued)
February 28, 2015 (Unaudited)
|
| 5. AGREEMENTS AND AFFILIATED TRANSACTIONS (continued) |
borrowings is based on the federal funds rate. The facility also requires a fee to be paid by the Portfolios based on the amount of the commitment that has not been utilized. For the six months ended February 28, 2015, the Portfolios did not have any borrowings under the facility.
G. Other Transactions with Affiliates — For the six months ended February 28, 2015, Goldman Sachs earned $5,093 and $17,382 in brokerage commissions from portfolio transactions, including futures transactions executed with Goldman Sachs as the Futures Commission Merchant, on behalf of the Enhanced Dividend Global Equity and Tax-Advantaged Global Equity Portfolios, respectively.
The Portfolios invest primarily in the Institutional Shares of the Underlying Funds. These Underlying Funds are considered to be affiliated with the Portfolios. The tables below show the transactions in and earnings from investments in these Underlying Funds for the six months ended February 28, 2015:
| | | | | | | | | | | | | | | | | | | | | | | | | | | | | | | | |
|
| Enhanced Dividend Global Equity | |
| Underlying Funds | | Market
Value
08/31/2014 | | | Purchases
at Cost* | | | Proceeds
from Sales | | | Net
Realized
Gain (Loss) | | | Change in
Unrealized
Appreciation
(Depreciation) | | | Market
Value
02/28/2015 | | | Dividend
Income | | | Capital Gain
Distributions | |
Goldman Sachs Core Fixed Income Fund | | $ | 5,932 | | | $ | 77 | | | $ | — | | | $ | — | | | $ | 28 | | | $ | 6,037 | | | $ | 77 | | | $ | — | |
Goldman Sachs Emerging Markets Equity Insights Fund | | | 29,186,433 | | | | 4,463,581 | | | | (956,309 | ) | | | (55,063 | ) | | | (2,435,038 | ) | | | 30,203,604 | | | | 495,757 | | | | 220,823 | |
Goldman Sachs High Yield Floating Rate Fund | | | 21,018,068 | | | | 1,676,116 | | | | (8,198,457 | ) | | | (238,514 | ) | | | (52,110 | ) | | | 14,205,103 | | | | 304,962 | | | | 1,623 | |
Goldman Sachs High Yield Fund | | | 7,008,355 | | | | 12,003,908 | | | | (568,736 | ) | | | (57,931 | ) | | | (417,362 | ) | | | 17,968,234 | | | | 422,736 | | | | 328,634 | |
Goldman Sachs International Equity Dividend and Premium Fund | | | 83,055,355 | | | | 14,162,599 | | | | (6,572,350 | ) | | | (353,417 | ) | | | (7,182,522 | ) | | | 83,109,665 | | | | 380,715 | | | | 2,440,589 | |
Goldman Sachs International Small Cap Insights Fund | | | 10,798,254 | | | | 2,125,997 | | | | (961,263 | ) | | | (18,046 | ) | | | (379,279 | ) | | | 11,565,663 | | | | 213,200 | | | | 104,177 | |
Goldman Sachs MLP Energy Infrastructure Fund | | | 21,613,706 | | | | 3,663,813 | | | | (716,600 | ) | | | 36,911 | | | | (2,796,699 | ) | | | 21,801,131 | | | | 479,781 | | | | — | |
Goldman Sachs Small Cap Equity Insights Fund | | | 31,136,768 | | | | 3,398,947 | | | | (3,776,162 | ) | | | 417,669 | | | | 2,446,799 | | | | 33,624,021 | | | | 120,462 | | | | — | |
Goldman Sachs U.S. Equity Dividend and Premium Fund | | | 151,443,105 | | | | 27,410,223 | | | | (14,296,718 | ) | | | 812,985 | | | | 24,896 | | | | 165,394,491 | | | | 1,688,483 | | | | 6,050,300 | |
Total | | $ | 355,265,976 | | | $ | 68,905,261 | | | $ | (36,046,595 | ) | | $ | 544,594 | | | $ | (10,791,287 | ) | | $ | 377,877,949 | | | $ | 4,106,173 | | | $ | 9,146,146 | |
38
GOLDMAN SACHS GLOBAL TAX-AWARE EQUITY PORTFOLIOS
|
| 5. AGREEMENTS AND AFFILIATED TRANSACTIONS (continued) |
| | | | | | | | | | | | | | | | | | | | | | | | | | | | | | | | |
|
| Tax-Advantaged Global Equity | |
| Underlying Funds | | Market
Value
08/31/2014 | | | Purchases
at Cost* | | | Proceeds
from Sales | | | Net
Realized
Gain (Loss) | | | Change in
Unrealized
Appreciation
(Depreciation) | | | Market
Value
02/28/2015 | | | Dividend
Income | | | Capital Gain
Distributions | |
Goldman Sachs Core Fixed Income Fund | | $ | 23,805 | | | $ | 307 | | | $ | — | | | $ | — | | | $ | 114 | | | $ | 24,226 | | | $ | 307 | | | $ | — | |
Goldman Sachs Emerging Markets Equity Insights Fund | | | 96,836,815 | | | | 32,332,305 | | | | (2,940,634 | ) | | | (383,958 | ) | | | (7,932,088 | ) | | | 117,912,440 | | | | 1,754,483 | | | | 781,492 | |
Goldman Sachs High Yield Floating Rate Fund | | | 69,805,996 | | | | 11,281,653 | | | | (28,478,183 | ) | | | (839,599 | ) | | | (118,600 | ) | | | 51,651,267 | | | | 1,044,406 | | | | 5,412 | |
Goldman Sachs High Yield Fund | | | 22,905,833 | | | | 45,857,248 | | | | (1,828,357 | ) | | | (205,038 | ) | | | (1,296,452 | ) | | | 65,433,234 | | | | 1,453,041 | | | | 1,095,154 | |
Goldman Sachs International Small Cap Insights Fund | | | 35,248,358 | | | | 14,736,001 | | | | (3,002,418 | ) | | | (337,353 | ) | | | (736,761 | ) | | | 45,907,827 | | | | 746,665 | | | | 364,847 | |
Goldman Sachs International Tax-Managed Equity Fund | | | 270,039,648 | | | | 95,873,379 | | | | (22,056,083 | ) | | | (2,151,413 | ) | | | (7,953,140 | ) | | | 333,752,391 | | | | 7,648,251 | | | | — | |
Goldman Sachs MLP Energy Infrastructure Fund | | | 71,770,741 | | | | 25,158,585 | | | | (2,203,536 | ) | | | (374,579 | ) | | | (9,030,104 | ) | | | 85,321,107 | | | | 1,701,704 | | | | — | |
Goldman Sachs U.S. Tax-Managed Equity Fund | | | 602,864,754 | | | | 191,314,877 | | | | (59,045,384 | ) | | | (671,879 | ) | | | 38,988,611 | | | | 773,450,979 | | | | 4,959,962 | | | | — | |
Total | | $ | 1,169,495,950 | | | $ | 416,554,355 | | | $ | (119,554,595 | ) | | $ | (4,963,819 | ) | | $ | 11,921,580 | | | $ | 1,473,453,471 | | | $ | 19,308,819 | | | $ | 2,246,905 | |
| * | | Includes reinvestment of distributions. |
39
GOLDMAN SACHS GLOBAL TAX-AWARE EQUITY PORTFOLIOS
Notes to Financial Statements (continued)
February 28, 2015 (Unaudited)
|
| 5. AGREEMENTS AND AFFILIATED TRANSACTIONS (continued) |
As of February 28, 2015, the following Goldman Sachs Fund of Funds Portfolios were the beneficial owners of 5% or more of total outstanding shares of the following Funds:
| | | | | | | | | | |
| Underlying Funds | | | | Enhanced Dividend
Global Equity | | | Tax Advantaged
Global Equity | |
Goldman Sachs Emerging Markets Equity Insights | | | | | 5 | % | | | 17 | % |
Goldman Sachs International Equity Dividend and Premium | | | | | 20 | | | | — | |
Goldman Sachs International Tax-Managed Equity | | | | | — | | | | 92 | |
Goldman Sachs International Small Cap Equity Insights | | | | | — | | | | 5 | |
Goldman Sachs Small Cap Equity Insights | | | | | 18 | | | | — | |
Goldman Sachs U.S. Tax-Managed Equity | | | | | — | | | | 83 | |
Goldman Sachs U.S. Equity Dividend and Premium | | | | | 11 | | | | — | |
|
| 6. PORTFOLIO SECURITIES TRANSACTIONS |
The cost of purchases and proceeds from sales and maturities of long-term securities for the six months ended February 28, 2015 were as follows:
| | | | | | | | | | |
| Portfolio | | | | Purchases | | | Sales | |
Enhanced Dividend Global Equity | | | | $ | 69,256,009 | | | $ | 45,511,069 | |
Tax-Advantaged Global Equity | | | | | 417,570,772 | | | | 150,954,073 | |
As of the Portfolios’ most recent fiscal year end, August 31, 2014, the Portfolios’ timing differences, on a tax basis were as follows:
| | | | | | | | | | |
| | | | | Enhanced Dividend
Global Equity | | | Tax-Advantaged
Global Equity | |
Timing differences (Qualified Late Year Loss Deferral) | | | | $ | (114,692 | ) | | $ | (610,854 | ) |
As of February 28, 2015, the Portfolios’ aggregate security unrealized gains and losses based on cost for U.S. federal income tax purposes were as follows:
| | | | | | | | |
| | | Enhanced Dividend
Global Equity | | | Tax-Advantaged
Global Equity | |
Tax cost | | $ | 336,155,616 | | | $ | 1,196,171,613 | |
Gross unrealized gain | | | 58,220,021 | | | | 311,247,248 | |
Gross unrealized loss | | | (12,535,186 | ) | | | (19,717,207 | ) |
Net unrealized security gain | | $ | 45,684,835 | | | $ | 291,530,041 | |
40
GOLDMAN SACHS GLOBAL TAX-AWARE EQUITY PORTFOLIOS
|
| 7. TAX INFORMATION (continued) |
The difference between GAAP-basis and tax-basis unrealized gains (losses) is attributable primarily to wash sales, net mark to market gains (losses) on regulated futures and options contracts, net mark to market gains/(losses) on foreign currency contracts, and differences in the tax treatment of underlying fund investments.
GSAM has reviewed the Portfolios’ tax positions for all open tax years (the current and prior three years, as applicable) and has concluded that no provision for income tax is required in the Portfolios’ financial statements. Such open tax years remain subject to examination and adjustment by tax authorities.
The Portfolios’ risks include, but are not limited to, the following:
Investments in the Underlying Funds — The Portfolios invest primarily in a combination of Underlying Funds, and are subject to the risk factors associated with the investments of those Underlying Funds in direct proportion to the amount of assets allocated to each. As of February 28, 2015, the Enhanced Dividend Global Equity Portfolio invested 42.3% and 21.2% of its net assets in the Goldman Sachs U.S. Equity Dividend and Premium Fund (the “U.S. Equity Dividend and Premium Fund”) and the Goldman Sachs International Equity Dividend and Premium Fund (the “International Equity Dividend and Premium Fund”), respectively. Because of the high concentration of its assets in these Underlying Funds, the Enhanced Dividend Global Equity Portfolio has greater exposure to the risks associated with these Underlying Funds than it does to the risks associated with the other Underlying Funds in which it invests. The U.S. Equity Dividend and Premium Fund invests primarily in dividend paying equity investments in large-capitalization U.S. equity issuers, with public stock market capitalizations within the range of the market capitalization of the S&P 500 at the time of investment. This Underlying Fund expects that, under normal circumstances, it will write call options on the S&P 500 Index or related exchange-traded funds in an amount that is between 25% and 75% of the value of its portfolio. The International Equity Dividend and Premium Fund invests primarily in dividend-paying equity investments in companies that are organized outside the United States or whose securities are principally traded outside the United States with public stock market capitalizations within the range of capitalization of the Morgan Stanley Capital International (MSCI) Europe, Australia, Far East (EAFE) Index (“MSCI EAFE Index”) at the time of investment. This Underlying Fund expects that, under normal circumstances, it will write call options on the MSCI EAFE Index, other national or regional stock market indices or related exchange-traded funds in an amount that is between 25% and 75% of the value of its portfolio.
As of February 28, 2015, the Tax-Advantaged Global Equity Portfolio invested 49.8% and 21.5% of its net assets in the Goldman Sachs U.S. Tax-Managed Equity Fund (the “U.S. Tax-Managed Equity Fund”) and the Goldman Sachs International Tax-Managed Equity Fund (the “International Tax-Managed Equity Fund”), respectively. Because of the high concentration of its assets in these Underlying Funds, the Tax-Advantaged Global Equity Portfolio has greater exposure to the risks associated with these Underlying Funds than it does to the risks associated with the other Underlying Funds in which it invests. The U.S. Tax-Managed Equity Fund invests in a broadly diversified portfolio of equity investments in U.S. issuers, including foreign issuers that are traded in the United States. This Underlying Fund will seek to maintain risk, style, capitalization and industry characteristics similar to the Russell 3000 Index. The International Tax-Managed Equity Fund invests primarily in international equity securities. This Underlying Fund will seek to maintain risk, style, capitalization and industry characteristics similar to the MSCI EAFE Index. The investment adviser may seek tax-efficiency by offsetting gains and losses, limiting portfolio turnover or selling high tax basis securities for both Underlying Funds.
The Portfolios do not invest in the Underlying Funds for the purpose of exercising management or control; however, investments by the Portfolios within their principal investment strategies may represent a significant portion of an Underlying Fund’s net assets.
Large Shareholder Transactions Risk — A Portfolio or an Underlying Fund may experience adverse effects when certain large shareholders, such as other funds, institutional investors (including those trading by use of non-discretionary mathematical formulas), financial intermediaries (who may make investment decisions on behalf of underlying clients and/or include a Portfolio
41
GOLDMAN SACHS GLOBAL TAX-AWARE EQUITY PORTFOLIOS
Notes to Financial Statements (continued)
February 28, 2015 (Unaudited)
|
| 8. OTHER RISKS (continued) |
or an Underlying Fund in their investment model), individuals, accounts and Goldman Sachs affiliates, purchase or redeem large amounts of shares of a Portfolio or an Underlying Fund. Such large shareholder redemptions may cause the Portfolio or the Underlying Fund to sell portfolio securities at times when it would not otherwise do so, which may negatively impact a Portfolio’s or an Underlying Fund’s NAV and liquidity. Similarly, large Portfolio or Underlying Fund share purchases may adversely affect a Portfolio’s or an Underlying Fund’s performance to the extent that a Portfolio or an Underlying Fund is delayed in investing new cash and is required to maintain a larger cash position than it ordinarily would. These transactions may also accelerate the realization of taxable income to shareholders if such sales of investments resulted in gains, and may also increase transaction costs. In addition, a large redemption could result in a Portfolio’s or an Underlying Fund’s current expenses being allocated over a smaller asset base, leading to an increase in the Portfolio’s or the Underlying Fund’s expense ratio.
Liquidity Risk — The Underlying Funds may make investments that are illiquid or that may become less liquid in response to market developments or adverse investor perceptions. Illiquid investments may be more difficult to value. Liquidity risk may also refer to the risk that a Portfolio will not be able to pay redemption proceeds within the allowable time period because of unusual market conditions, an unusually high volume of redemption requests, or other reasons. To meet redemption requests, a Portfolio may be forced to sell investments at an unfavorable time and/or under unfavorable conditions.
Market and Credit Risks — In the normal course of business, the Portfolios and the Underlying Funds trade financial instruments and enter into financial transactions where risk of potential loss exists due to changes in the market (market risk). Additionally, the Portfolios and the Underlying Funds may also be exposed to credit risk in the event that an issuer or guarantor fails to perform or that an institution or entity with which the Portfolios and the Underlying Funds have unsettled or open transactions defaults.
Investing in foreign markets may involve special risks and considerations not typically associated with investing in the U.S. Foreign securities may be subject to risk of loss because of more or less foreign government regulation, less public information and less economic, political and social stability in the countries in which the Portfolios and the Underlying Funds invest. Loss may also result from the imposition of exchange controls, confiscations and other government restrictions by the United States or other governments, or from problems in registration, settlement or custody. Foreign risk also involves the risk of negative foreign currency rate fluctuations, which may cause the value of securities denominated in such foreign currency (or other instruments through which the Fund has exposure to foreign currencies) to decline in value. Currency exchange rates may fluctuate significantly over short periods of time. To the extent that the Portfolios and the Underlying Funds also invest in securities of issuers located in emerging markets, these risks may be more pronounced.
Under the Trust’s organizational documents, its Trustees, officers, employees and agents are indemnified, to the extent permitted by the Act and state law, against certain liabilities that may arise out of performance of their duties to the Portfolios. Additionally, in the course of business, the Portfolios enter into contracts that contain a variety of indemnification clauses. The Portfolios’ maximum exposure under these arrangements is unknown, as this would involve future claims that may be made against the Portfolios that have not yet occurred. However, GSAM believes the risk of loss under these arrangements to be remote.
Subsequent events after the Statement of Assets and Liabilities date have been evaluated through the date the financial statements were issued. GSAM has concluded that there is no impact requiring adjustment or disclosure in the financial statements.
42
GOLDMAN SACHS GLOBAL TAX-AWARE EQUITY PORTFOLIOS
|
| 11. SUMMARY OF SHARE TRANSACTIONS |
Share activity is as follows:
| | | | | | | | | | | | | | | | |
| | | Enhanced Dividend Global Equity Portfolio | |
| | | | |
| | | For the Six Months Ended
February 28, 2015
(Unaudited) | | | For the Fiscal Year Ended
August 31, 2014 | |
| | | | |
| | | Shares | | | Dollars | | | Shares | | | Dollars | |
| | | | |
| Class A Shares | | | | | | | | | | | | | | | | |
Shares sold | | | 65,613 | | | $ | 717,981 | | | | 6,351 | | | $ | 70,389 | |
Reinvestment of distributions | | | 929 | | | | 10,112 | | | | 878 | | | | 9,749 | |
Shares redeemed | | | (1,690 | ) | | | (19,164 | ) | | | (1,158 | ) | | | (13,306 | ) |
| | | | 64,852 | | | | 708,929 | | | | 6,071 | | | | 66,832 | |
| Institutional Shares | | | | | | | | | | | | | | | | |
Shares sold | | | 2,754,190 | | | | 31,261,928 | | | | 6,670,280 | | | | 75,425,811 | |
Reinvestment of distributions | | | 1,582,681 | | | | 17,321,968 | | | | 1,733,576 | | | | 19,319,455 | |
Shares redeemed | | | (1,752,197 | ) | | | (19,881,157 | ) | | | (3,579,364 | ) | | | (40,603,916 | ) |
| | | | 2,584,674 | | | | 28,702,739 | | | | 4,824,492 | | | | 54,141,350 | |
NET INCREASE | | | 2,649,526 | | | $ | 29,411,668 | | | | 4,830,563 | | | $ | 54,208,182 | |
Share activity is as follows:
| | | | | | | | | | | | | | | | |
| | | Tax-Advantaged Global Equity Portfolio | |
| | | | |
| | | For the Six Months Ended
February 28, 2015
(Unaudited) | | | For the Fiscal Year Ended
August 31, 2014 | |
| | | | |
| | | Shares | | | Dollars | | | Shares | | | Dollars | |
| | | | |
| Class A Shares | | | | | | | | | | | | | | | | |
Shares sold | | | 12,117 | | | $ | 158,043 | | | | — | (a) | | $ | 5 | |
Reinvestment of distributions | | | 500 | | | | 6,339 | | | | 1,458 | | | | 17,701 | |
Shares redeemed | | | (1 | ) | | | (10 | ) | | | (40,326 | ) | | | (512,579 | ) |
| | | | 12,616 | | | | 164,372 | | | | (38,868 | ) | | | (494,873 | ) |
| Institutional Shares | | | | | | | | | | | | | | | | |
Shares sold | | | 27,546,985 | | | | 359,905,435 | | | | 30,406,848 | | | | 386,507,011 | |
Reinvestment of distributions | | | 3,238,682 | | | | 41,137,938 | | | | 2,639,043 | | | | 32,469,728 | |
Shares redeemed | | | (5,863,855 | ) | | | (76,181,758 | ) | | | (6,543,993 | ) | | | (82,873,598 | ) |
| | | | 24,921,812 | | | | 324,861,615 | | | | 26,501,898 | | | | 336,103,141 | |
NET INCREASE | | | 24,934,428 | | | $ | 325,025,987 | | | | 26,463,030 | | | $ | 335,608,268 | |
| (a) | | Amount is less than 0.5 shares. |
43
GOLDMAN SACHS GLOBAL TAX-AWARE EQUITY PORTFOLIOS
| | |
Portfolio Expenses — Six Month Period Ended February 28, 2015 (Unaudited) | | |
As a shareholder of Class A or Institutional Shares of a Portfolio, you incur two types of costs: (1) transaction costs, including sales charges on purchase payments (with respect to Class A Shares), and (2) ongoing costs, including management fees; distribution and service (12b-1) fees (with respect to Class A Shares); and other Portfolio expenses. This example is intended to help you understand your ongoing costs (in dollars) of investing in Class A and Institutional Shares of the Portfolios and to compare these costs with the ongoing costs of investing in other mutual funds.
The example is based on an investment of $1,000 invested at the beginning of the period and held for the entire period from September 1, 2014 through February 28, 2015.
Actual Expenses — The first line under each share class in the table below provides information about actual account values and actual expenses. You may use the information in this line, together with the amount you invested, to estimate the expenses that you paid over the period. Simply divide your account value by $1,000 (for example, an $8,600 account value divided by $1,000=8.6), then multiply the result by the number in the first line under the heading entitled “Expenses Paid” to estimate the expenses you paid on your account during this period.
Hypothetical Example for Comparison Purposes — The second line under each share class in the table below provides information about hypothetical account values and hypothetical expenses based on the Portfolios' actual net expense ratios and an assumed rate of return of 5% per year before expenses, which is not the Portfolios' actual return. The hypothetical account values and expenses may not be used to estimate the actual ending account balance or expenses you paid for the period. You may use this information to compare the ongoing costs of investing in the Portfolios and other funds. To do so, compare this 5% hypothetical example with the 5% hypothetical examples that appear in the shareholder reports of the other funds.
Please note that the expenses shown in the table are meant to highlight your ongoing costs only and do not reflect any transactional costs, such as sales charges, redemption fees, or exchange fees and do not include expenses of Underlying Funds in which the Portfolios invest. Therefore, the second line of the table is useful in comparing ongoing costs only, and will not help you determine the relative total costs of owning different funds. In addition, if these transactional costs were included, your costs would have been higher.
| | | | | | | | | | | | | | | | | | | | | | | | |
| | | Enhanced Dividend Global Equity Portfolio | | | Tax-Advantaged Global Equity Portfolio | |
| Share Class | | Beginning
Account Value
9/01/14 | | | Ending
Account Value
2/28/15 | | | Expenses
Paid for the
6 Months
Ended
2/28/15* | | | Beginning
Account Value
9/01/14 | | | Ending
Account Value
2/28/15 | | | Expenses
Paid for the
6 Months
Ended
2/28/15* | |
| Class A | | | | | | | | | | | | | | | | | | | | | | | | |
Actual | | $ | 1,000 | | | $ | 1,011.30 | | | $ | 2.99 | | | $ | 1,000 | | | $ | 1,020.70 | | | $ | 3.01 | |
Hypothetical 5% return | | | 1,000 | | | | 1,021.82 | + | | | 3.01 | | | | 1,000 | | | | 1,021.82 | + | | | 3.01 | |
| Institutional | | | | | | | | | | | | | | | | | | | | | | | | |
Actual | | | 1,000 | | | | 1,014.20 | | | | 1.00 | | | | 1,000 | | | | 1,022.50 | | | | 1.00 | |
Hypothetical 5% return | | | 1,000 | | | | 1,023.80 | + | | | 1.00 | | | | 1,000 | | | | 1,023.80 | + | | | 1.00 | |
| | * | | Expenses are calculated using each Portfolio’s annualized net expense ratio for each class, which represents the ongoing expenses as a percentage of net assets for the six months ended February 28, 2015. Expenses are calculated by multiplying the annualized net expense ratio by the average account value for the period; then multiplying the result by the number of days in the most recent fiscal half year; and then dividing that result by the number of days in the fiscal year. The annualized net expense ratios for the period were as follows: | |
| | | | | | | | |
| Portfolio | | Class A | | | Institutional | |
Enhanced Dividend Global Equity | | | 0.60 | % | | | 0.20 | % |
Tax-Advantaged Global Equity | | | 0.60 | | | | 0.20 | |
| | + | | Hypothetical expenses are based on each Portfolio's actual annualized net expense ratios and an assumed rate of return of 5% per year before expenses. | |
44
FUNDS PROFILE
Goldman Sachs Funds

Goldman Sachs is a premier financial services firm, known since 1869 for creating thoughtful and customized investment solutions in complex global markets.
Today, the Investment Management Division of Goldman Sachs serves a diverse set of clients worldwide, including private institutions, public entities and individuals. With approximately $1.02 trillion in assets under supervision as of December 31, 2014, Goldman Sachs Asset Management (“GSAM”) has portfolio management teams located around the world and our investment professionals bring firsthand knowledge of local markets to every investment decision. Assets under supervision includes assets under management and other client assets for which Goldman Sachs does not have full discretion. GSAM leverages the resources of Goldman, Sachs & Co. subject to legal, internal and regulatory restrictions.

Money Market1
Financial Square FundsSM
| n | | Financial Square Tax-Exempt Funds |
| n | | Financial Square Federal Fund |
| n | | Financial Square Government Fund |
| n | | Financial Square Money Market Fund |
| n | | Financial Square Prime Obligations Fund |
| n | | Financial Square Treasury Instruments Fund |
| n | | Financial Square Treasury Obligations Fund |
Fixed Income
Short Duration and Government
| n | | High Quality Floating Rate Fund |
| n | | Limited Maturity Obligations Fund |
| n | | Short Duration Government Fund |
| n | | Short Duration Income Fund |
| n | | Inflation Protected Securities Fund |
Multi-Sector
Municipal and Tax-Free
| n | | High Yield Municipal Fund |
| n | | Dynamic Municipal Income Fund3 |
| n | | Short Duration Tax-Free Fund |
Single Sector
| n | | Investment Grade Credit Fund |
| n | | High Yield Floating Rate Fund |
| n | | Emerging Markets Debt Fund |
| n | | Local Emerging Markets Debt Fund |
| n | | Dynamic Emerging Markets Debt Fund |
Fixed Income Alternatives
| n | | Long Short Credit Strategies Fund |
| n | | Fixed Income Macro Strategies Fund |
Fundamental Equity
| n | | Small/Mid Cap Value Fund |
| n | | Small/Mid Cap Growth Fund |
| n | | Flexible Cap Growth Fund |
| n | | Concentrated Growth Fund |
| n | | Technology Tollkeeper Fund |
| n | | Growth Opportunities Fund |
| n | | Rising Dividend Growth Fund |
Tax-Advantaged Equity
| n | | U.S. Tax-Managed Equity Fund |
| n | | International Tax-Managed Equity Fund |
| n | | U.S. Equity Dividend and Premium Fund |
| n | | International Equity Dividend and Premium Fund |
Equity Insights
| n | | Small Cap Equity Insights Fund |
| n | | U.S. Equity Insights Fund |
| n | | Small Cap Growth Insights Fund |
| n | | Large Cap Growth Insights Fund |
| n | | Large Cap Value Insights Fund |
| n | | Small Cap Value Insights Fund |
| n | | International Small Cap Insights Fund |
| n | | International Equity Insights Fund |
| n | | Emerging Markets Equity Insights Fund |
Fundamental Equity International
| n | | Strategic International Equity Fund |
| n | | Focused International Equity Fund |
| n | | International Small Cap Fund |
| n | | Emerging Markets Equity Fund |
| n | | BRIC Fund (Brazil, Russia, India, China) |
Select Satellite4
| n | | Real Estate Securities Fund |
| n | | International Real Estate Securities Fund |
| n | | Commodity Strategy Fund |
| n | | Dynamic Commodity Strategy Fund |
| n | | Dynamic Allocation Fund |
| n | | Absolute Return Tracker Fund |
| n | | Managed Futures Strategy Fund |
| n | | MLP Energy Infrastructure Fund |
| n | | Multi-Manager Alternatives Fund |
| n | | Multi-Asset Real Return Fund |
| n | | Retirement Portfolio Completion Fund |
| n | | Tactical Tilt Implementation Fund |
| n | | Global Managed Beta Fund |
Total Portfolio Solutions4
| n | | Balanced Strategy Portfolio |
| n | | Growth and Income Strategy Portfolio |
| n | | Growth Strategy Portfolio |
| n | | Equity Growth Strategy Portfolio |
| n | | Satellite Strategies Portfolio |
| n | | Enhanced Dividend Global Equity Portfolio |
| n | | Tax Advantaged Global Equity Portfolio |
| 1 | | An investment in a money market fund is neither insured nor guaranteed by the Federal Deposit Insurance Corporation (“FDIC”) or any other government agency. Although the Funds seek to preserve the value of your investment at $1.00 per share, it is possible to lose money by investing in the Funds. |
| 2 | | Effective on October 1, 2014, the Goldman Sachs Core Plus Fixed Income Fund was renamed the Goldman Sachs Bond Fund. |
| 3 | | Effective on December 18, 2014, the Goldman Sachs Municipal Income Fund was renamed the Goldman Sachs Dynamic Municipal Income Fund. |
| 4 | | Individual Funds within the Total Portfolio Solutions and Select Satellite categories will have various placement on the risk/return spectrum and may have greater or lesser risk than that indicated by the placement of the general Total Portfolio Solutions or Select Satellite category. |
Financial Square FundsSM is a registered service mark of Goldman, Sachs & Co.
| *This | | list covers open-end funds only. Please visit our website at www.GSAMFUNDS.com to learn about our closed-end funds. |
| | |
TRUSTEES Ashok N. Bakhru, Chairman Kathryn A. Cassidy John P. Coblentz, Jr. Diana M. Daniels Joseph P. LoRusso Herbert J. Markley James A. McNamara Jessica Palmer Alan A. Shuch Richard P. Strubel Roy W. Templin Gregory G. Weaver | | OFFICERS James A. McNamara, President Scott M. McHugh, Principal Financial Officer and Treasurer Caroline L. Kraus, Secretary |
| |
GOLDMAN, SACHS & CO. Distributor and Transfer Agent | | GOLDMAN SACHS ASSET MANAGEMENT, L.P. Investment Adviser |
Visit our web site at www.GSAMFUNDS.com to obtain the most recent month-end returns.
Goldman Sachs Asset Management, L.P., 200 West Street, New York, New York 10282
The reports concerning the Portfolios included in this shareholder report may contain certain forward-looking statements about the factors that may affect the performance of the Portfolios in the future. These statements are based on Portfolio management’s predictions and expectations concerning certain future events and their expected impact on the Portfolios, such as performance of the economy as a whole and of specific industry sectors, changes in the levels of interest rates, the impact of developing world events, and other factors that may influence the future performance of the Portfolios. Management believes these forward-looking statements to be reasonable, although they are inherently uncertain and difficult to predict. Actual events may cause adjustments in portfolio management strategies from those currently expected to be employed.
A description of the policies and procedures that the Portfolios use to determine how to vote proxies relating to portfolio securities and information regarding how a Portfolio voted proxies relating to portfolio securities during the most recent 12-month period ended June 30 is available (i) without charge, upon request by calling 1-800-526-7384 (for Retail Shareholders) or 1-800-621-2550 (for Institutional Shareholders); and (ii) on the Securities and Exchange Commission (“SEC”) web site at http://www.sec.gov.
The Portfolios file their complete schedule of portfolio holdings with the SEC for the first and third quarters of each fiscal year on Form N-Q. The Portfolios’ Form N-Qs are available on the SEC’s web site at http://www.sec.gov within 60 days after the Portfolios’ first and third fiscal quarters. The Portfolios’ Form N-Qs may be reviewed and copied at the SEC’s Public Reference Room in Washington, D.C., and information on the operation of the Public Reference Room may also be obtained by calling 1-800-SEC-0330. Forms N-Q may be obtained upon request and without charge by calling 1-800-526-7384 (for Retail Shareholders) or 1-800-621-2550 (for Institutional Shareholders).
Economic and market forecasts presented herein reflect our judgment as of the date of this report and are subject to change without notice. These forecasts do not take into account the specific investment objectives, restrictions, tax and financial situation or other needs of any specific client. Actual data will vary and may not be reflected here. These forecasts are subject to high levels of uncertainty that may affect actual performance. Accordingly, these forecasts should be viewed as merely representative of a broad range of possible outcomes. These forecasts are estimated, based on assumptions, and are subject to significant revision and may change materially as economic and market conditions change. Goldman Sachs has no obligation to provide updates or changes to these forecasts. Case studies and examples are for illustrative purposes only.
Goldman, Sachs & Co. (“Goldman Sachs”) does not provide legal, tax or accounting advice. Any statement contained in this communication (including any attachments) concerning U.S. tax matters was not intended or written to be used, and cannot be used, for the purpose of avoiding penalties under the Internal Revenue Code, and was written to support the promotion or marketing of the transaction(s) or matter(s) addressed. Clients of Goldman Sachs should obtain their own independent tax advice based on their particular circumstances.
Fund holdings and allocations shown are as of February 28, 2015 and may not be representative of future investments. Portfolio holdings should not be relied on in making investment decisions and should not be construed as research or investment advice regarding particular securities. Current and future holdings are subject to risk.
This material is not authorized for distribution to prospective investors unless preceded or accompanied by a current Prospectus or summary prospectus, if applicable. Investors should consider a Fund’s objective, risks, and charges and expenses, and read the summary prospectus, if available, and/or the Prospectus carefully before investing or sending money. The summary prospectus, if available, and the Prospectus contain this and other information about a Fund and may be obtained from your authorized dealer or from Goldman, Sachs & Co. by calling (retail – 1-800-526-7384) (institutional – 1-800-621-2550).
Goldman, Sachs & Co. is the distributor of the Goldman Sachs Funds.
© 2015 Goldman Sachs. All rights reserved. 159682.MF.MED.TMPL / 4 / 2015 / TAGEDSAR-15 / 2K
(a) As of the end of the period covered by this report, the registrant has adopted a code of ethics that applies to the registrant’s principal executive officer, principal financial officer, principal accounting officer or controller, or persons performing similar functions, regardless of whether these individuals are employed by the registrant or a third party (the “Code of Ethics”).
(b) During the period covered by this report, no amendments were made to the provisions of the Code of Ethics.
(c) During the period covered by this report, the registrant did not grant any waivers, including an implicit waiver, from any provision of the Code of Ethics.
(d) A copy of the Code of Ethics is available as provided in Item 12(a)(1) of this report.
| ITEM 3. | AUDIT COMMITTEE FINANCIAL EXPERT. |
The registrant’s board of trustees has determined that the registrant has at least one “audit committee financial expert” (as defined in Item 3 of Form N-CSR) serving on its audit committee. John P. Coblentz, Jr. is the “audit committee financial expert” and is “independent” (as each term is defined in Item 3 of Form N-CSR).
| ITEM 4. | PRINCIPAL ACCOUNTANT FEES AND SERVICES. |
Table 1 — Items 4(a) - 4(d). The accountant fees below reflect the aggregate fees billed by all of the Funds of the Goldman Sachs Trust and includes the Goldman Sachs Funds to which this certified shareholder report relates.
| | | | | | | | | | | | |
| | | 2014 | | 2013 | | Description of Services Rendered |
| | | |
| | | | | | | | | | | | |
| | | |
Audit Fees: | | | | | | | | | | | | |
| | | |
• PricewaterhouseCoopers LLP
(“PwC”) | | | $ | 4,269,524 | | | | $ | 3,372,161 | | | Financial Statement audits. |
| | | |
Audit-Related Fees: | | | | | | | | | | | | |
| | | |
• PwC | | | $ | 0 | | | | $ | 2,340 | | | Other attest services. |
| | | |
Tax Fees: | | | | | | | | | | | | |
| | | |
• PwC | | | $ | 939,217 | | | | $ | 816,858 | | | Tax compliance services provided in connection with the preparation and review of registrant’s tax returns. |
Table 2 — Items 4(b)(c) & (d). Non-Audit Services to the Goldman Sachs Trust’s service affiliates * that were pre-approved by the Audit Committee of the Goldman Sachs Trust pursuant to Rule 2-01(c)(7)(ii) of Regulation S-X.
| | | | | | | | | | | | |
| | | 2014 | | 2013 | | Description of Services Rendered |
| | | |
| | | | | | | | | | | | |
| | | |
Audit-Related Fees: | | | | | | | | | | | | |
| | | |
• PwC | | | $ | 1,486,420 | | | | $ | 1,516,680 | | | Internal control review performed in accordance with Statement on Standards for Attestation Engagements No. 16. These fees are borne by the Funds’ Adviser. |
| * | These include the advisor (excluding sub-advisors) and any entity controlling, controlled by or under common control with the advisor that provides ongoing services to the registrant (hereinafter referred to as “service affiliates”). |
Item 4(e)(1) — Audit Committee Pre-Approval Policies and Procedures
Pre-Approval of Audit and Non-Audit Services Provided to the Funds of the Goldman Sachs Trust. The Audit and Non-Audit Services Pre-Approval Policy (the “Policy”) adopted by the Audit Committee of Goldman Sachs Trust (“GST”) sets forth the procedures and the conditions pursuant to which services performed by an independent auditor for GST may be pre-approved. Services may be pre-approved specifically by the Audit Committee as a whole or, in certain circumstances, by the Audit Committee Chairman or the person designated as the Audit Committee Financial Expert. In addition, subject to specified cost limitations, certain services may be pre-approved under the provisions of the Policy. The Policy provides that the Audit Committee will consider whether the services provided by an independent auditor are consistent with the Securities and Exchange Commission’s rules on auditor independence. The Policy provides for periodic review and pre-approval by the Audit Committee of the services that may be provided by the independent auditor.
De Minimis Waiver. The pre-approval requirements of the Policy may be waived with respect to the provision of non-audit services that are permissible for an independent auditor to perform, provided (1) the aggregate amount of all such services provided constitutes no more than five percent of the total amount of revenues subject to pre-approval that was paid to the independent auditors during the fiscal year in which the services are provided; (2) such services were not recognized by GST at the time of the engagement to be non-audit services; and (3) such services are promptly brought to the attention of the Audit Committee and approved prior to the completion of the audit by the Audit Committee or by one or more members of the Audit Committee to whom authority to grant such approvals has been delegated by the Audit Committee, pursuant to the pre-approval provisions of the Policy.
Pre-Approval of Non-Audit Services Provided to GST’s Investment Advisers. The Policy provides that, in addition to requiring pre-approval of audit and non-audit services provided to GST, the Audit Committee will pre-approve those non-audit services provided to GST’s investment advisers (and entities controlling, controlled by or under common control with the investment advisers that provide ongoing services to GST) where the engagement relates directly to the operations or financial reporting of GST.
Item 4(e)(2) – 0% of the audit-related fees, tax fees and other fees listed in Table 1 were approved by GST’s Audit Committee pursuant to the “de minimis” exception of Rule 2-01(c)(7)(i)(C) of Regulation S-X. In addition, 0% of the non-audit services to the GST’s service affiliates listed in Table 2 were approved by GST’s Audit Committee pursuant to the “de minimis” exception of Rule 2-01(c)(7)(i)(C) of Regulation S-X.
Item 4(f) – Not applicable.
Item 4(g) Aggregate Non-Audit Fees Disclosure
The aggregate non-audit fees billed to GST by PwC for the twelve months ended August 31, 2014 and August 31, 2013 were approximately $939,217 and $819,198 respectively. The aggregate non-audit fees billed to GST’s adviser and service affiliates by PwC for non-audit services for the twelve months ended December 31, 2013 and December 31, 2012 $9.8 million and $9.8 million respectively. With regard to the aggregate non-audit fees billed to GST’s adviser and service affiliates, the 2012 and 2011 amounts include fees for non-audit services required to be pre-approved [see Table 2] and fees for non-audit services that did not require pre-approval since they did not directly relate to GST’s operations or financial reporting.
Item 4(h) — GST’s Audit Committee has considered whether the provision of non-audit services to GST’s investment adviser and service affiliates that did not require pre-approval pursuant to paragraph (c)(7)(ii) of Rule 2-01 of Regulation S-X is compatible with maintaining the auditors’ independence.
| ITEM 5. | AUDIT COMMITTEE OF LISTED REGISTRANTS. |
| ITEM 6. | SCHEDULE OF INVESTMENTS. |
| | Schedule of Investments is included as part of the Report to Stockholders filed under Item 1. |
| ITEM 7. | DISCLOSURE OF PROXY VOTING POLICIES AND PROCEDURES FOR CLOSED-END MANAGEMENT INVESTMENT COMPANIES. |
| ITEM 8. | PORTFOLIO MANAGERS OF CLOSED-END MANAGEMENT INVESTMENT COMPANIES. |
| ITEM 9. | PURCHASES OF EQUITY SECURITIES BY CLOSED-END MANAGEMENT INVESTMENT COMPANY AND AFFILIATED PURCHASERS. |
| ITEM 10. | SUBMISSION OF MATTERS TO A VOTE OF SECURITY HOLDERS. |
| | There have been no material changes to the procedures by which shareholders may recommend nominees to the registrant’s board of trustees. |
| ITEM 11. | CONTROLS AND PROCEDURES. |
| | (a) | The registrant’s principal executive and principal financial officers, or persons performing similar functions have concluded that the registrant’s disclosure controls and procedures (as defined in Rule 30a-3(c) under the Investment Company Act of 1940, as amended (the “1940 Act”)) are effective as of a date within 90 days of the filing of this report that includes the disclosure required by this paragraph, based on the evaluation of these controls and procedures required by Rule 30a-3(b) under the 1940 Act and 15d-15(b) under the Securities Exchange Act of 1934, as amended. |
| | (b) | There were no changes in the registrant’s internal control over financial reporting (as defined in Rule 30a-3(d) under the 1940 Act) that occurred during the registrant’s second fiscal quarter of the period covered by this report that have materially affected, or are reasonably likely to materially affect, the registrant’s internal control over financial reporting. |
| | | | |
| (a)(1) | | Goldman Sachs Trust’s Code of Ethics for Principal Executive and Senior Financial Officers is incorporated by reference to Exhibit 12(a)(1) of the registrant’s Form N-CSR filed on June 3, 2010 for its Short Duration and Government Fixed Income Funds. |
| | |
| (a)(2) | | Exhibit 99.CERT | | Certifications pursuant to Section 302 of the Sarbanes-Oxley Act of 2002 filed herewith. |
| | |
| (b) | | Exhibit 99.906CERT | | Certifications pursuant to Section 906 of the Sarbanes-Oxley Act of 2002 filed herewith. |
SIGNATURES
Pursuant to the requirements of the Securities Exchange Act of 1934 and the Investment Company Act of 1940, the registrant has duly caused this report to be signed on its behalf by the undersigned, thereunto duly authorized.
| | |
| | | Goldman Sachs Trust |
| |
| By: | | /s/ James A. McNamara |
| |
| | |
| | James A. McNamara |
| | President/Principal Executive Officer |
| | Goldman Sachs Trust |
| |
| Date: | | May 4, 2015 |
Pursuant to the requirements of the Securities Exchange Act of 1934 and the Investment Company Act of 1940, this report has been signed below by the following persons on behalf of the registrant and in the capacities and on the dates indicated.
| | |
| By: | | /s/ James A. McNamara |
| |
| | |
| | James A. McNamara |
| | President/Principal Executive Officer |
| | Goldman Sachs Trust |
| |
| Date: | | May 4, 2015 |
| |
| By: | | /s/ Scott McHugh |
| |
| | |
| | Scott McHugh |
| | Principal Financial Officer |
| | Goldman Sachs Trust |
| |
| Date: | | May 4, 2015 |