UNITED STATES
SECURITIES AND EXCHANGE COMMISSION
Washington, D.C. 20549
FORM N-CSR
CERTIFIED SHAREHOLDER REPORT OF REGISTERED
MANAGEMENT INVESTMENT COMPANIES
Investment Company Act file number 811-05349
Goldman Sachs Trust
(Exact name of registrant as specified in charter)
71 South Wacker Drive, Chicago, Illinois 60606
(Address of principal executive offices) (Zip code)
| | |
| Caroline Kraus, Esq. | | Copies to: |
| Goldman, Sachs & Co. | | Geoffrey R.T. Kenyon, Esq. |
| 200 West Street | | Dechert LLP |
| New York, New York 10282 | | 100 Oliver Street |
| | 40th Floor |
| | Boston, MA 02110-2605 |
(Name and address of agents for service)
Registrant’s telephone number, including area code: (312) 655-4400
Date of fiscal year end: March 31
Date of reporting period: September 30, 2014
| ITEM 1. | REPORTS TO STOCKHOLDERS. |
| | The Semi-Annual Report to Stockholders is filed herewith. |
Goldman Sachs Funds

| | | | |
| | |
| Semi-Annual Report | | | | September 30, 2014 |
| | |
| | | | Single Sector Fixed Income Funds |
| | | | Dynamic Emerging Markets Debt |
| | | | Emerging Markets Debt |
| | | | High Yield |
| | | | High Yield Floating Rate |
| | | | Investment Grade Credit |
| | | | Local Emerging Markets Debt |
| | | | U.S. Mortgages |

Goldman Sachs Single Sector Fixed Income Funds
| n | | DYNAMIC EMERGING MARKETS DEBT |
| n | | HIGH YIELD FLOATING RATE |
| n | | INVESTMENT GRADE CREDIT |
| n | | LOCAL EMERGING MARKETS DEBT |
| | | | |
TABLE OF CONTENTS | | | | |
| |
Principal Investment Strategies and Risks | | | 1 | |
| |
Investment Process | | | 4 | |
| |
Market Review | | | 5 | |
| |
Portfolio Management Discussions and Performance Summaries | | | 7 | |
| |
Schedules of Investments | | | 42 | |
| |
Financial Statements | | | 124 | |
| |
Financial Highlights | | | 132 | |
| |
Notes to the Financial Statements | | | 146 | |
| |
Other Information | | | 181 | |
| | | | |
| | | |
| NOT FDIC-INSURED | | May Lose Value | | No Bank Guarantee |
GOLDMAN SACHS SINGLE SECTOR FIXED INCOME FUNDS
Principal Investment Strategies and Risks
This is not a complete list of risks that affect the Funds. For additional information concerning the risks applicable to the Funds, please see the Funds’ prospectus.
The Goldman Sachs Dynamic Emerging Markets Debt Fund invests primarily in sovereign and corporate debt of issuers located in or tied economically to emerging countries or in currencies of such emerging countries. Investments in fixed income securities are subject to the risks associated with debt securities generally, including credit, liquidity and interest rate risk. Foreign and emerging markets investments may be more volatile and less liquid than investments in U.S. securities and are subject to the risks of currency fluctuations and adverse economic or political developments. The securities markets of emerging countries have less government regulation and are subject to less extensive accounting and financial reporting requirements than the markets of more developed countries. Such securities are also subject to foreign custody risk. The Fund is also subject to the risk that the issuers of sovereign debt or the government authorities that control the payment of debt may be unable or unwilling to repay principal or interest when due. High yield, lower rated investments involve greater price volatility and present greater risks than higher rated fixed income securities. Derivative instruments may involve a high degree of financial risk. These risks include the risk that a small movement in the price of the underlying security or benchmark may result in a disproportionately large movement, unfavorable or favorable, in the price of the derivative instrument; the risk of default by a counterparty; and liquidity risk. At times, the Fund may be unable to sell certain of its illiquid investments without a substantial drop in price, if at all. The Fund is “non-diversified” and may invest more of its assets in fewer issuers than “diversified” funds. Accordingly, the Fund may be more susceptible to adverse developments affecting any single issuer held in its portfolio and to greater losses resulting from these developments.
The Goldman Sachs Emerging Markets Debt Fund invests primarily in sovereign and corporate debt of issuers located in or tied economically to emerging countries. The Fund’s investments in fixed income securities are subject to the risks associated with debt securities generally, including credit, liquidity and interest rate risk. Foreign and emerging markets investments may be more volatile and less liquid than investments in U.S. securities and are subject to the risks of currency fluctuations and adverse economic or political developments. The countries in which the Fund invests may have sovereign ratings that are below investment grade or are unrated. High yield, lower rated investments involve greater price volatility and present greater risks than higher rated fixed income securities. The securities markets of emerging countries have less government regulation and are subject to less extensive accounting and financial reporting requirements than the markets of more developed countries. Such securities are also subject to foreign custody risk. The Fund is also subject to the risk that the issuers of sovereign debt or the government authorities that control the payment of debt may be unable or unwilling to repay principal or interest when due. Derivative instruments may involve a high degree of financial risk. These risks include the risk that a small movement in the price of the underlying security or benchmark may result in a disproportionately large movement, unfavorable or favorable, in the price of the derivative instrument; the risk of default by a counterparty; and liquidity risk. At times, the Fund may be unable to sell certain of its illiquid investments without a substantial drop in price, if at all. The Fund is “non-diversified” and may invest more of its assets in fewer issuers than “diversified” funds. Accordingly, the Fund may be more susceptible to adverse developments affecting any single issuer held in its portfolio and to greater losses resulting from these developments.
1
GOLDMAN SACHS SINGLE SECTOR FIXED INCOME FUNDS
The Goldman Sachs High Yield Fund invests primarily in high yield, fixed income securities that, at the time of purchase, are non-investment grade securities. The Fund’s investments in fixed income securities are subject to the risks associated with debt securities generally, including credit, liquidity and interest rate risk. High yield, lower rated investments involve greater price volatility and present greater risks than higher rated fixed income securities. Foreign and emerging markets investments may be more volatile and less liquid than investments in U.S. securities and are subject to the risks of currency fluctuations and adverse economic or political developments. Derivative instruments may involve a high degree of financial risk. These risks include the risk that a small movement in the price of the underlying security or benchmark may result in a disproportionately large movement, unfavorable or favorable, in the price of the derivative instrument; the risk of default by a counterparty; and liquidity risk. At times, the Fund may be unable to sell certain of its illiquid investments without a substantial drop in price, if at all.
The Goldman Sachs High Yield Floating Rate Fund invests primarily in domestic or foreign floating rate loans and other floating or variable rate obligations rated below investment grade. Indirect loan participations may subject the Fund to greater delays, expenses and risks than direct obligations in the case that a borrower fails to pay scheduled principal and interest. Investments in loans and fixed income instruments are subject to the risks associated with debt instruments generally, including credit, liquidity and interest rate risk. Foreign and emerging markets investments may be more volatile and less liquid than investments in U.S. securities and are subject to the risks of currency fluctuations and adverse economic or political developments. High yield, lower rated investments involve greater price volatility and present greater risks than higher rated investments. At times, the Fund may be unable to sell certain of its illiquid investments without a substantial drop in price, if at all. Derivative instruments may involve a high degree of financial risk. These risks include the risk that a small movement in the price of the underlying security or benchmark may result in a disproportionately large movement, unfavorable or favorable, in the price of the derivative instrument; the risk of default by a counterparty; and liquidity risk.
The Goldman Sachs Investment Grade Credit Fund invests primarily in investment grade fixed income securities. The Fund’s investments in fixed income securities are subject to the risks associated with debt securities generally, including credit, liquidity and interest rate risk. Any guarantee on U.S. government securities applies only to the underlying securities of the Fund if held to maturity and not to the value of the Fund’s shares. Foreign and emerging markets investments may be more volatile and less liquid than its investment in U.S. securities and are subject to the risks of currency fluctuations and adverse economic or political developments. Derivative instruments may involve a high degree of financial risk. These risks include the risk that a small movement in the price of the underlying security or benchmark may result in a disproportionately large movement, unfavorable or favorable, in the price of the derivative instrument; the risk of default by a counterparty; and liquidity risk.
The Goldman Sachs Local Emerging Markets Debt Fund invests primarily in sovereign and corporate debt of issuers located in or tied economically to emerging countries, denominated in the local currency of such emerging countries, or in currencies of such emerging countries. Investments in fixed income securities are subject to the risks associated with debt securities generally, including credit, liquidity and interest rate risk. Foreign and emerging markets investments may be more volatile and less liquid than investments in U.S. securities and are subject to the risks of currency fluctuations and adverse
2
GOLDMAN SACHS SINGLE SECTOR FIXED INCOME FUNDS
economic or political developments. The securities markets of emerging countries have less government regulation and are subject to less extensive accounting and financial reporting requirements than the markets of more developed countries. Such securities are also subject to foreign custody risk. The Fund is also subject to the risk that the issuers of sovereign debt or the government authorities that control the payment of debt may be unable or unwilling to repay principal or interest when due. High yield, lower rated investments involve greater price volatility and present greater risks than higher rated fixed income securities. Derivative instruments may involve a high degree of financial risk. These risks include the risk that a small movement in the price of the underlying security or benchmark may result in a disproportionately large movement, unfavorable or favorable, in the price of the derivative instrument; the risk of default by a counterparty; and liquidity risk. At times, the Fund may be unable to sell certain of its illiquid investments without a substantial drop in price, if at all. The Fund is “non-diversified” and may invest more of its assets in fewer issuers than “diversified” funds. Accordingly, the Fund may be more susceptible to adverse developments affecting any single issuer held in its portfolio and to greater losses resulting from these developments.
The Goldman Sachs U.S. Mortgages Fund invests primarily in mortgage-backed securities of U.S. issuers. The Fund’s investments in fixed income securities are subject to the risks associated with debt securities generally, including credit, liquidity and interest rate risk. Investments in mortgage-backed securities are also subject to prepayment risk, the risk that in a declining interest rate environment the Fund’s underlying mortgages may be prepaid, causing the Fund to have to reinvest at lower interest rates. Any guarantee on U.S. government securities applies only to the underlying securities of the Fund if held to maturity and not to the value of the Fund’s shares. Derivative instruments may involve a high degree of financial risk. These risks include the risk that a small movement in the price of the underlying security or benchmark may result in a disproportionately large movement, unfavorable or favorable, in the price of the derivative instrument; the risk of default by a counterparty; and liquidity risk.
3
GOLDMAN SACHS SINGLE SECTOR FIXED INCOME FUNDS
What Differentiates the Goldman Sachs Asset Management Fixed Income Investment Process?
At Goldman Sachs Asset Management, L.P. (“GSAM”), the goal of our fixed income investment process is to provide consistent, strong performance by actively managing our portfolios within a research-intensive, risk-managed framework.
A key element of our fixed income investment philosophy is to evaluate the broadest global opportunity set to capture relative value across sectors and instruments. Our globally integrated investment process involves managing dynamically along the risk/return spectrum, as we continue to develop value-added strategies through:

| n | | Assess relative value among securities and sectors |
| n | | Leverage the vast resources of GSAM in selecting securities for each portfolio |

| n | | Team approach to decision making |
| n | | Manage risk by avoiding significant sector and interest rate bets |
| n | | Careful management of yield curve strategies — while closely managing portfolio duration |

Fixed Income portfolios that:
| | n | | Include domestic and global investment options, income opportunities, and access to areas of specialization such as high yield | |
| | n | | Capitalize on GSAM’s industry-renowned credit research capabilities | |
| | n | | Use a risk-managed framework to seek total return, recognizing the importance of investors’ capital accumulation goals as well as their need for income | |
4
MARKET REVIEW
Goldman Sachs Single Sector Fixed Income Funds
Market Review
Economic conditions, geopolitical tensions and monetary policies of global central banks drove the performance of the global fixed income markets during the six months ended September 30, 2014 (the “Reporting Period”).
When the Reporting Period began in April 2014, spread, or non-government bond, sectors rallied as global bond yields fell. Markets focused in part on events in Ukraine, as Russia’s intervention led to sanctions by the U.S. and Europe. Emerging markets debt overall appeared to benefit from investment flows diverted from Russia. Economic influences included the U.S. Commerce Department’s announcement that first quarter 2014 Gross Domestic Product (“GDP”) had declined, indicating an economic contraction. However, second calendar quarter economic data releases, such as auto sales, jobless claims and manufacturing activity, suggested a rebound was underway. This supported the view of some market participants that the first quarter 2014 contraction might have been due to inclement winter weather and that economic growth could accelerate in the remainder of the calendar year. From a monetary policy perspective, in June 2014, the European Central Bank (“ECB”) cut interest rates by 10 basis points, moving the deposit rate for the Eurozone into negative territory for the first time in history. (A basis point is 1/100th of a percentage point.) The ECB also announced it would be implementing additional liquidity measures targeted at stimulating lending. Meanwhile, India’s elections delivered a victory to its existing government, which is seeking to revive the country’s economic growth, tame inflation and remove roadblocks to reform.
At the beginning of the third calendar quarter, spread sectors generally continued to rally. In July 2014, core European government bond yields fell, while U.S. Treasury yields rose modestly. U.S. economic data was mixed, with labor and manufacturing indicators continuing to improve and housing data showing signs of weakening. In the U.K., economic growth continued at a brisk pace, broadly in line with market expectations. During August 2014, global spread sectors continued to post gains. Eurozone GDP came in below expectations, with Italy, France and Germany surprising to the downside. In the U.S., Treasury yields fell despite the release of positive durable goods orders and manufacturing data. The decline in U.S. Treasury yields may have reflected market concern about increased geopolitical risk in Ukraine and the Middle East. Meanwhile, Federal Reserve (“Fed”) comments suggested a modest shift in tone towards policy tightening. In the U.K., data continued to indicate strong economic momentum. However, heightened concerns about European economic growth appeared to decrease the likelihood of a rate hike by the Bank of England in the near term.
In September 2014, the spread sector rally ended. Core government bond yields in the U.S., U.K., Eurozone and Japan also rose during the month. In the U.S., economic data remained generally positive, despite a disappointing August 2014 payroll number, with employment, auto sales and manufacturing showing improvement. In the Eurozone, the ECB cut interest rates to record lows and announced plans to start purchasing asset-backed securities as it sought to combat a drop in inflation and weak economic growth. In the U.K., unemployment continued to fall rapidly. Scotland voted to remain part of the United Kingdom, although this had little effect on U.K. government yields.
For the Reporting Period overall, sovereign emerging markets debt generated the strongest positive returns within the broad fixed income market. Mortgage-backed securities also outperformed U.S. Treasuries, followed at some distance by agency securities, asset-backed
5
MARKET REVIEW
securities and commercial mortgage-backed securities. Conversely, high yield corporate bonds underperformed U.S. Treasuries, while investment grade corporate bonds also lagged, albeit more modestly. The U.S. Treasury yield curve, or spectrum of maturities, flattened during the Reporting Period, as intermediate-term and longer-term yields declined and shorter-term maturities edged up. The yield on the bellwether 10-year U.S. Treasury fell approximately 23 basis points during the Reporting Period to 2.49%.
Looking Ahead
At the end of the Reporting Period, we believed global macroeconomic conditions had diverged and that the divergence was continuing to intensify. In our opinion, the U.S. is the growth leader among developed nations, while the Eurozone appears to be falling further behind. We believe the Eurozone’s economic weakness could persist for some time and could also affect other economies. Most notably, we think Eurozone weakness could pose a risk to the U.K.’s economic expansion. Inflation seems to be trending higher in the U.S. and Japan, but Eurozone inflation is significantly below the ECB’s target rate, and we do not expect a change in the near term. Meanwhile, developed central bank activity is also moving in opposite directions. The Fed plans to end its quantitative easing asset purchase program in October 2014, and we believe the first short-term rate hike could occur in mid-2015, unless the recent increase in market volatility leads to slower economic growth. By contrast, the ECB has committed to bolder stimulus, and we think it may resort to full-scale quantitative easing in 2015. The Bank of Japan remains in easing mode, but we do not expect any action in the near term as the impact of its sales tax hike, put into effect in April 2014, works its way through the nation’s economy.
We are also seeing divergence in the emerging markets, with investors seemingly favoring countries that have passed reforms necessary for sustainable growth. These countries include India, Mexico and Indonesia. In China, we believe the balancing act between that nation’s economic reforms and a potential 2014 growth rate of 7.5% has tilted in favor of the growth target. However, in our view, the economy’s longer-term health depends on China switching to more sustainable economic drivers. At the end of the Reporting Period, wage inflation was eroding China’s competitiveness, with credit growth and the slowing real estate sector as our key concerns.
In the near term, we believe the divergence in macroeconomic conditions around the globe could stir volatility. However, we believe economic growth and strong corporate fundamentals should support the corporate credit sector. Meanwhile, geopolitical risks have increased and may also contribute to market volatility, but, in our view, are unlikely to have much impact on global GDP. Energy prices have fallen, suggesting to us that global oversupply was a stronger market driver than geopolitics at the end of the Reporting Period.
6
PORTFOLIO RESULTS
Goldman Sachs Dynamic Emerging Markets
Debt Fund
Investment Objective
The Fund seeks a high level of total return consisting of income and capital appreciation.
Portfolio Management Discussion and Analysis
Below, the Goldman Sachs Global Fixed Income Investment Management Team discusses the Goldman Sachs Dynamic Emerging Markets Debt Fund’s (the “Fund”) performance and positioning for the six-month period ended September 30, 2014 (the “Reporting Period”).
| Q | | How did the Fund perform during the Reporting Period? |
| A | | During the Reporting Period, the Fund’s Class A, C, Institutional, IR and R Shares generated cumulative total returns, without sales charges, of 0.56%, 0.39%, 0.95%, 0.89% and 0.65%, respectively. These returns compare to the 0.92% cumulative total return of the Fund’s benchmark, the Dynamic Emerging Markets Debt Composite Index (the “Index”), which is comprised 50% of the J.P. Morgan Government Bond Index — Emerging Markets (GBI-EMSM) Global Diversified Index (Gross, USD, Unhedged), 25% of the J.P. Morgan Emerging Markets Bond Index (Gross, USD, Unhedged) (EMBISM) Global Diversified Index and 25% of the J.P. Morgan Corporate Emerging Markets Bond Index (Gross, USD, Unhedged) (CEMBISM) Broad Diversified Index during the same time period. The components of the Fund’s blended benchmark, the J.P. Morgan GBI-EMSM Global Diversified Index, J.P. Morgan EMBISM Global Diversified Index and J.P. Morgan CEMBISM Broad Diversified Index, generated cumulative total returns of -1.87%, 4.14% and 3.36%, respectively, during the Reporting Period. |
| Q | | What economic and market factors most influenced emerging markets debt as a whole during the Reporting Period? |
| A | | When the Reporting Period began during the second quarter of 2014, yields on 10-year U.S. Treasury securities declined. As U.S. Treasury yields fell, investors sought higher yields in riskier asset classes, and external emerging markets debt recorded strong gains for the second calendar quarter. Although U.S. Treasury yields continued to fall in the third calendar quarter, external markets debt posted a modest decline, driven by weakness in the Venezuelan, Ukrainian and Russian debt markets. For the Reporting Period overall, external emerging markets debt, as represented by the J.P. Morgan EMBISM Global Diversified Index, generated a positive return. |
| | Local emerging markets debt generated positive returns during the second quarter of 2014, benefiting from currency appreciation and changes in local interest rates. In the third calendar quarter, local emerging markets debt recorded a modest decline, driven primarily by a sell-off in local currency markets. For the Reporting Period overall, the asset class, as represented by the J.P. Morgan GBI-EMSM Global Diversified Index, recorded a negative return, due largely to currency depreciation. Emerging markets currencies, as represented by the J.P. Morgan Emerging Local Markets Plus (ELMI+) Index, also declined. |
| | For the emerging markets corporate bond sector, performance during the Reporting Period overall was negatively affected by U.S. and European Union sanctions, which targeted Russia’s energy, defense and banking industries. In India, the general election delivered a resounding victory to the Bharatiya Janata Party (“BJP”), which is generally viewed as pro-business by the markets. Meanwhile, in Indonesia, Jakarta’s governor Joko Widodo won the presidential election, a result considered by many observers to be positive for the country’s credit markets and the Indonesian rupiah. The emerging markets corporate bond sector saw approximately $288 billion of gross new issuance for the 2014 calendar year through the end of the Reporting Period.1 Meanwhile, J.P. Morgan revised upward its 2014 global emerging markets corporate default forecast from 2.2% to 3.4%, stating the adjustments were based on individual credits rather than on market-wide expectations. J.P. Morgan also said it expected fundamentals to remain stable for the majority of the credits in the emerging markets corporate bonds universe. |
7
PORTFOLIO RESULTS
| Q | | What key factors were responsible for the Fund’s performance during the Reporting Period? |
| A | | During the Reporting Period, the Fund was hampered by country and issue selection of local emerging markets bonds. |
| | Our U.S. duration and yield curve strategy also detracted from returns. Duration is a measure of the Fund’s sensitivity to changes in interest rates. Yield curve indicates a spectrum of maturities. |
| | On the positive side, the Fund benefited from our active currency management through which the Fund takes positions in local currencies (accomplished through the use of forward foreign currency exchange contracts as well as bonds denominated in local currencies). In addition, country and issue selection of external emerging markets bonds added to returns. Issue selection among external emerging markets corporate bonds and emerging markets quasi-sovereign bonds also contributed positively. |
| Q | | Which segments of emerging markets debt most significantly affected Fund performance? |
| A | | The Fund was hampered by an underweight in South Korean local interest rates, which performed well during the Reporting Period. The Fund was underweight because we believed the South Korean central bank was unlikely to cut interest rates in the near term. However, in August 2014, the nation’s central bank lowered rates to help boost South Korea’s economic growth. The Fund was also hurt during the Reporting Period by an underweight position in Polish local interest rates. We expected Poland’s economic growth to pick up, narrowing the country’s output gap and pushing inflation higher. However, Poland’s economic growth weakened on lower trade with Russia and slower Western European growth. Inflation also remained low, prompting the Polish central bank to cut interest rates. A position in the Polish zloty, accomplished through the use of forward foreign currency exchange contracts, dampened relative performance. During the Reporting Period, the Fund was hampered by its position in the Indian rupee, accomplished through the use of forward foreign currency exchange contracts. We had a positive outlook on the Indian rupee because of the BJP’s landslide election victory, which we believed would attract capital inflows and help boost economic growth. Instead, the rupee weakened after India’s central bank intervened in the foreign exchange markets. |
| | The Fund benefited during the Reporting Period from its overweight in Brazilian local interest rates accomplished through investments in a combination of nominal and inflation-linked Brazilian local bonds in both short-term and long-term maturities. We believe Brazil offers one of the highest real interest rates (the rate of interest an investor can expect to receive after allowing for inflation) in the world. An overweight in Mexican local rates, accomplished through investments in local emerging markets bonds, also added to relative results. In our view, Mexico has a conservative fiscal policy, a prudent monetary policy and an independent central bank. Its new government is focused on a list of reforms that could improve competitiveness and increase oil production. The Fund benefited from its overweight in Dominican Republic local interest rates accomplished through investments in local emerging markets bonds. The Dominican Republic has reduced its fiscal and current account deficits, and we believe the country may benefit from stronger, more stable economic growth and stable-to-lower oil prices. In addition, a position in the Malaysian ringgit, accomplished through the use of forward foreign currency exchange contracts, contributed positively to relative performance. We believed the ringgit would benefit from global economic growth and the efforts of the Malaysian central bank to control inflation. An overweight in Chinese company CITIC Pacific corporate bonds enhanced relative results. In August 2014, CITIC Limited completed a reverse merger with CITIC Pacific and the combined company was renamed CITIC Limited. (A reverse merger is used by private companies to become publicly traded without resorting to an initial public offering.) We expected the market to view CITIC Limited as investment grade once the merger was complete. Ultimately, credit rating agency Moody’s Investors Service upgraded CITIC Limited to A3 from Ba2. |
| Q | | Did the Fund’s duration and yield curve positioning strategy help or hurt its results during the Reporting Period? |
| A | | The Fund’s U.S. duration and yield curve positioning detracted from relative returns during the Reporting Period. The Fund held a short duration position relative to the Index, which hurt performance as interest rates fell. |
| Q | | How did the Fund use derivatives and similar instruments during the Reporting Period? |
| A | | The Fund invested in U.S. Treasury futures, Eurodollar futures, forward foreign currency exchange contracts, interest rate swaps, total return swaps, credit default swaps, cross currency swaps, non-deliverable currency forwards, and structured notes. U.S. Treasury futures were used to manage U.S. interest rate duration. Eurodollar futures were used to |
8
PORTFOLIO RESULTS
| | express our views on the direction of interest rates and to facilitate specific duration and yield curve strategies. |
| | Eurodollar futures are contracts that have underlying assets linked to time deposits denominated in U.S. dollars at banks outside the U.S. Forward foreign currency exchange contracts were used for hedging purposes or to express a positive view on a given currency. Interest rate swaps were used to express our views on the direction of a country’s interest rates. Cross-currency swaps were employed to express relative value views on given currencies as well as our views on the direction of a country’s interest rates. Credit default swaps were used to implement specific credit-related investment strategies. Total return swaps and structured notes were used in place of buying a local currency denominated bond when a particular market was otherwise inaccessible or as a more efficient means of gaining access to a local market. Non-deliverable currency forwards were used to gain exposure to a particular country and also to take advantage of relative value opportunities. |
| Q | | Were there any notable changes in the Fund’s weightings during the Reporting Period? |
| A | | During the Reporting Period, we shifted the Fund from a neutral position relative to the Index in Indonesian external debt to an overweight position. We eliminated the Fund’s underweight in South African external bonds and adopted a neutral position. Also during the Reporting Period, we moved the Fund from an underweight in Indonesian local interest rates to an overweight position. We shifted the Fund from overweighted positions in Colombian, Mexican and Polish local interest rates to neutral positions. In addition, we shifted the Fund from a slight underweight in emerging market currencies overall at the beginning of the Reporting Period to a small overweight by end of Reporting Period. We eliminated the Fund’s position in the Malaysian ringgit during September 2014 after our views about the global growth outlook changed. |
| Q | | How was the Fund positioned relative to its benchmark index at the end of the Reporting Period? |
| A | | At the end of the Reporting Period, we continued to see attractive opportunities in Latin American local interest rates and had positioned the Fund with an overweight to Brazil, focused on a mix of Brazilian nominal and inflation linked bonds. The Fund was also overweight Dominican Republic and Indonesian local interest rates. Within external debt, the Fund was overweight the Dominican Republic and Paraguay. The Fund was underweight Philippines and Hungarian external bonds. Relative to currencies, the Fund was overweight in countries where we see an improving growth outlook or attractive valuations. Some of the Fund’s largest currency overweights included the Mexican peso and Indian rupee. Also, at the end of the Reporting Period, the Fund was overweight emerging markets corporate bonds as we see low default probabilities for credits with strong balance sheets. Within emerging markets corporate bonds, the Fund maintained an overweight in the energy sector, where we find the cost structure competitive. Energy emerging markets corporate bonds also serve, in our view, as a foreign exchange hedge because commodities are priced in U.S. dollars. The Fund was underweight the financials sector, as we are concerned about limited disclosure relative to balance sheet asset quality, funding risks when banks rely on wholesale funding markets and macroeconomic risks. Moreover, we believe the performance of emerging markets banks tend to be highly correlated to the performance of emerging markets sovereign debt. |
| Q | | What is the Fund’s tactical view and strategy for the months ahead? |
| A | | At the end of the Reporting Period, we continued to have a long-term positive outlook on emerging markets debt because we believe the asset class is shifting from a niche investment to a core portfolio component. In historical terms, we believe, many portfolios have been under-allocated to emerging markets debt relative to those emerging nations’ portion of world Gross Domestic Product (“GDP”) or bond market capitalization. Emerging markets economies, in our opinion, have become better able to withstand shocks to the global financial system, thanks in part to reserve accumulation and improved external debt positions. We continue to view emerging markets debt as a compelling strategic asset class that has the potential to provide investors with an attractive credit risk premium, given the strong credit profile and low debt levels of most emerging markets economies. |
| | Going forward, we plan to maintain our focus on relative value opportunities, especially those created by the increased dispersion of returns in external emerging markets debt. In our view, the increased dispersion in returns is being driven by idiosyncratic country risk, differences in economic fundamentals and in the policies of emerging markets governments as well as by the overall global environment. In addition, we believe a number of other factors could have varied effects on individual emerging markets countries —including the risk of higher U.S. interest rates, fears about the |
9
PORTFOLIO RESULTS
| | path of China’s economic growth and persistent geopolitical concerns. |
| | Meanwhile, during the Reporting Period, local emerging markets debt and local currencies were buffeted by a surging U.S. dollar and a drop in commodities prices. U.S. dollar strength had exacerbated the decline in commodities prices, which also suffered because of excess supply in various segments of the market including wheat, corn and soy. In turn, lower commodities prices hindered the terms of trade of certain emerging countries and erased some of the recent reduction in their current account deficits. (Terms of trade refers to the relative price of exports in terms of imports and is defined as the ratio of export prices to import prices.) Looking ahead, we do not expect local emerging markets debt to repeat the sell-off that occurred in mid-2013 when many investors questioned the attractiveness of emerging markets debt in view of higher U.S. interest rates. At the time, there was a dramatic re-pricing both in local emerging markets debt and in the currency markets of numerous emerging market countries. Brazil, India, Indonesia, South Africa and emerging countries with current account and capital account deficits took the brunt of the weakness. Some of the same countries, specifically Brazil, Indonesia and South Africa, were among the worst currency performers during September 2014. That said, we believe the depreciation of many emerging markets currencies during the Reporting Period should help buffer their economies. In the short term, currency depreciation can improve a country’s balance of payments; over the longer term, it can make exports more competitive and help drive economic growth. At the end of the Reporting Period, we believe valuations in local emerging markets debt were at reasonable levels. |
| | As for emerging markets corporate bonds, we have a positive outlook, given that emerging markets corporate bonds have wider spreads (or yield differentials) relative to comparable developed markets bonds. In addition, we believe that emerging markets corporate issuers have less leverage and their balance sheets are generally robust with limited near-term need to refinance debt. Nevertheless, the liquidity of emerging markets corporate bonds is less than that of emerging markets sovereign debt. Going forward, we expect strong issuance to continue. J.P. Morgan forecasts $337 billion in emerging markets corporate bond issuance for 2014 as a whole. |
10
FUND BASICS
Dynamic Emerging Markets Debt Fund
as of September 30, 2014
| | | | | | | | | | | | | | | | | | | | | | | | | | | | | | |
| | PERFORMANCE REVIEW | |
| | | April 1, 2014–
September 30,
2014 | | Fund Total Return
(based on NAV)1 | | | Dynamic
Emerging
Markets
Debt
Composite
Index2 | | | J.P.Morgan
Emerging Markets
Bond Index (EMBI)3 | | | JPM
Government
Bond Index
– Emerging
Markets
(GBI-EM)4 | | | J.P. Morgan
Corporate
Emerging
Markets
Bond Index
(CEMBI)5 | | | 30-Day
Standardized
Subsidized
Yield6 | | | 30-Day
Standardized
Unsubsidized
Yield6 | |
| | Class A | | | 0.56 | % | | | 0.92 | % | | | 4.14 | % | | | -1.87 | % | | | 3.36 | % | | | 4.12 | % | | | 1.20 | % |
| | Class C | | | 0.39 | | | | 0.92 | | | | 4.14 | | | | -1.87 | | | | 3.36 | | | | 3.53 | | | | 1.31 | |
| | Institutional | | | 0.95 | | | | 0.92 | | | | 4.14 | | | | -1.87 | | | | 3.36 | | | | 4.65 | | | | 2.42 | |
| | Class IR | | | 0.89 | | | | 0.92 | | | | 4.14 | | | | -1.87 | | | | 3.36 | | | | 4.55 | | | | 2.32 | |
| | | Class R | | | 0.65 | | | | 0.92 | | | | 4.14 | | | | -1.87 | | | | 3.36 | | | | 4.04 | | | | 1.82 | |
| | 1 | | The net asset value (“NAV”) represents the net assets of the class of the Fund (ex-dividend) divided by the total number of shares of the class outstanding. The Fund’s performance assumes the reinvestment of dividends and other distributions. The Fund’s performance does not reflect the deduction of any applicable sales charges. |
| | 2 | | The Dynamic Emerging Markets Debt Composite Index is comprised of the J.P. Morgan GBI-EMSM Global Diversified Index (50%), the J.P. Morgan EMBISM Global Diversified Index (25%), and the J.P. Morgan CEMBISM Broad Diversified Index (25%). The index figures do not reflect any deduction for fees, expenses or taxes. It is not possible to invest directly in an index. |
| | 3 | | The J.P. Morgan EMBISM Global Diversified Index is an unmanaged index of debt instruments of 50 emerging countries. The Index figures do not reflect any deduction for fees, expenses or taxes. It is not possible to invest directly in an index. |
| | 4 | | The J.P. Morgan GBI-EMSM Global Diversified Index is an unmanaged index of debt instruments of 14 Emerging Countries. The Index figures do not reflect any deduction for fees, expenses or taxes. It is not possible to invest directly in an index. |
| | 5 | | The J.P. Morgan CEMBISM Broad Diversified tracks total returns of U.S. dollar-denominated debt instruments issued by corporate entities in emerging markets countries. The Index figures do not reflect any deduction for fees, expenses or taxes. It is not possible to invest directly in an index. |
| | 6 | | The method of calculation of the 30-Day Standardized Subsidized Yield is mandated by the Securities and Exchange Commission and is determined by dividing the net investment income per share earned during the last 30 days of the period by the maximum public offering price (“POP”) per share on the last day of the period. This number is then annualized. The 30-Day Standardized Subsidized Yield reflects fee waivers and/or expense reimbursements recorded by the Fund during the period. Without waivers and/or reimbursements, yields would be reduced. This yield does not necessarily reflect income actually earned and distributed by the Fund and, therefore, may not be correlated with the dividends or other distributions paid to shareholders. The 30-Day Standardized Unsubsidized Yield does not adjust for any fee waivers and/or expense reimbursements in effect. If the Fund does not incur any fee waivers and/or expense reimbursements during the period, the 30-Day Standardized Subsidized Yield and 30-Day Standardized Unsubsidized Yield will be identical. |
11
FUND BASICS
| | | | | | | | | | | | | | |
| | STANDARDIZED TOTAL RETURNS7 | |
| | | For the period ended 9/30/14 | | One Year | | | Since Inception | | | Inception Date | |
| | Class A | | | -1.61 | % | | | -4.45 | % | | | 5/31/13 | |
| | Class C | | | 1.61 | | | | -1.60 | | | | 5/31/13 | |
| | Institutional | | | 3.76 | | | | -0.55 | | | | 5/31/13 | |
| | Class IR | | | 3.42 | | | | -0.83 | | | | 5/31/13 | |
| | | Class R | | | 3.16 | | | | -1.13 | | | | 5/31/13 | |
| | 7 | | The Standardized Total Returns are cumulative total returns as of the most recent calendar quarter-end. They assume reinvestment of all distributions at NAV. These returns reflect a maximum initial sales charge of 4.50% for Class A Shares and the assumed contingent deferred sales charge for Class C Shares (1% if redeemed within 12 months of purchase). Because Institutional, Class IR and Class R Shares do not involve a sales charge, such a charge is not applied to their Standardized Total Returns. The Fund will charge a 2% redemption fee on the redemption of shares (including by exchange) held for 30 calendar days or less. The performance figures do not reflect the deduction of the redemption fee. If reflected, the redemption fee would reduce the performance quoted. |
The returns set forth in the tables above represent past performance. Past performance does not guarantee future results. The Fund’s investment return and principal value will fluctuate so that an investor’s shares, when redeemed, may be worth more or less than their original cost. Current performance may be lower or higher than the performance quoted above. Please visit our web site at www.GSAMFUNDS.com to obtain the most recent month-end returns. Performance reflects applicable fee waivers and/or expense limitations in effect during the periods shown. In their absence, performance would be reduced. Returns do not reflect the deduction of taxes that a shareholder would pay on Fund distributions or the redemption of Fund shares.
12
FUND BASICS
| | | | | | | | | | |
| | EXPENSE RATIOS8 | |
| | | | | Net Expense Ratio (Current) | | | Gross Expense Ratio (Before Waivers) | |
| | Class A | | | 1.23 | % | | | 3.55 | % |
| | Class C | | | 1.98 | | | | 4.30 | |
| | Institutional | | | 0.89 | | | | 3.21 | |
| | Class IR | | | 0.98 | | | | 3.30 | |
| | | Class R | | | 1.48 | | | | 3.80 | |
| | 8 | | The expense ratios of the Fund, both current (net of applicable fee waivers and/or expense limitations) and before waivers (gross of applicable fee waivers and/or expense limitations) are as set forth above according to the most recent publicly available Prospectus for the Fund and may differ from the expense ratios disclosed in the Financial Highlights in this report. Pursuant to a contractual arrangement, the Fund’s waivers and/or expense limitations will remain in place through at least July 29, 2015, and prior to such date the Investment Adviser may not terminate the arrangements without the approval of the Fund’s Board of Trustees. If these arrangements are discontinued in the future, the expense ratios may change without shareholder approval. |
| | | | | | | | | | |
| | TOP TEN COUNTRY ALLOCATION9 | |
| | | | | Percentage of Net Assets | |
| | | | | as of 9/30/14 | | | as of 3/31/14 | |
| | Mexico | | | 8.9 | % | | | 8.0 | % |
| | Indonesia | | | 6.3 | | | | 3.6 | |
| | Turkey | | | 5.1 | | | | 8.1 | |
| | Brazil | | | 4.9 | | | | 5.6 | |
| | South Africa | | | 4.9 | | | | 3.4 | |
| | Russia | | | 4.1 | | | | 4.4 | |
| | Thailand | | | 3.9 | | | | 3.3 | |
| | Chile | | | 3.7 | | | | 2.3 | |
| | Colombia | | | 3.6 | | | | 4.7 | |
| | | Poland | | | 3.3 | | | | 1.5 | |
| | 9 | | The percentage shown for each investment category reflects the value of investments in that country as a percentage of net assets. The table does not include repurchase agreements of 6.3% as of 9/30/14 and 16.8% as of 3/31/14. The table depicts the Fund’s investments but may not represent the Fund’s market exposure due to the exclusion of certain derivatives, if any, as listed in the Additional Investment Information section of the Schedule of Investments. |
13
PORTFOLIO RESULTS
Goldman Sachs Emerging Markets Debt Fund
Investment Objective
The Fund seeks a high level of total return consisting of income and capital appreciation.
Portfolio Management Discussion and Analysis
Below, the Goldman Sachs Global Fixed Income Investment Management Team discusses the Goldman Sachs Emerging Markets Debt Fund’s (the “Fund”) performance and positioning for the six-month period ended September 30, 2014 (the “Reporting Period”).
| Q | | How did the Fund perform during the Reporting Period? |
| A | | During the Reporting Period, the Fund’s Class A, C, Institutional and IR Shares generated cumulative total returns, without sales charges, of 4.19%, 3.88%, 4.44% and 4.40%, respectively. These returns compare to the 4.14% cumulative total return of the Fund’s benchmark, the J.P. Morgan Emerging Markets Bond Index (EMBISM) Global Diversified Index (Gross, USD, Unhedged) (the “Index”), during the same time period. |
| Q | | What economic and market factors most influenced emerging markets debt as a whole during the Reporting Period? |
| A | | When the Reporting Period began during the second quarter of 2014, yields on 10-year U.S. Treasury securities declined. As U.S. Treasury yields fell, investors sought higher yields in riskier asset classes, and external emerging markets debt recorded strong gains for the second calendar quarter. Although U.S. Treasury yields continued to fall in the third calendar quarter, external emerging markets debt posted a modest decline, driven in part by idiosyncratic weakness in the Venezuelan, Ukrainian and Russian debt markets. |
| | For the Reporting Period overall, external emerging markets debt, as represented by the Index, generated a positive return. Sovereign spreads (that is, the difference in yields between external emerging markets debt and U.S. Treasuries) widened by approximately two basis points to close the Reporting Period 299 basis points wider than U.S. Treasury securities. (A basis point is 1/100th of a percentage point.) The top performing emerging external debt markets during the Reporting Period, as represented by the Index, were (in U.S. dollar terms1) Zambia (15.76%), Ghana (12.28%) and Argentina (11.30%). The weakest performing emerging external debt markets were Ukraine (-5.36%), Venezuela (-2.76%) and Angola (1.34%). |
| Q | | What key factors were responsible for the Fund’s performance during the Reporting Period? |
| A | | During the Reporting Period, the Fund benefited from our active currency management through which the Fund takes positions in local currencies (accomplished through the use of forward foreign currency exchange contracts as well as bonds denominated in local currencies). In addition, our country and issue selection of external emerging markets debt added to returns. Individual issue selection in emerging markets corporate bonds and quasi-sovereign bonds also contributed positively. |
| | The Fund’s performance was hampered by country and issue selection of local emerging markets debt. Our U.S. duration and yield curve strategy also detracted from returns. Duration is a measure of the Fund’s sensitivity to changes in interest rates. Yield curve indicates a spectrum of maturities. |
| Q | | Which segments of emerging markets debt most significantly affected Fund performance? |
| A | | The Fund benefited during the Reporting Period by its overweight relative to the Index in Argentinean external debt. Argentina’s external debt market rallied during the Reporting Period, even after the country was forced into technical default at the end of July 2014. The technical default was not due to Argentina’s inability to pay but was because of a U.S. court ruling that prevented disbursement until Argentina settles with investors from a previous restructuring. In addition, an overweight in Paraguayan external bonds added to relative results. The Fund was overweight because Paraguay’s debt-to-Gross Domestic Product (“GDP”) levels were low, and we had a favorable |
| 1 | | All regional and market returns are in U.S. dollar terms (unless otherwise specified), are based on country-specific stock market indices and reflect the reinvestment of any dividends if applicable. |
14
PORTFOLIO RESULTS
| | view of the country’s current account dynamics. Furthermore, President Horacio Cartes has embarked on an ambitious modernization and reform agenda, including tax reform and a fiscal responsibility law that would limit Paraguay’s fiscal deficit to 1.5% in normal market conditions and to 3% in times of crisis. Also, during the Reporting Period, the Fund benefited from a position in the Malaysian ringgit, which was accomplished through the use of forward foreign currency exchange contracts. We believed the ringgit would benefit from global economic growth and from the efforts of the Malaysian central bank to control inflation. An overweight in CITIC Pacific corporate bonds enhanced relative results. In August 2014, CITIC Limited completed a reverse merger with CITIC Pacific, and the combined company was renamed CITIC Limited. (A reverse merger is used by private companies to become publicly traded without resorting to an initial public offering.) We expected the market to view CITIC Limited as investment grade once the merger was complete. Ultimately, credit rating agency Moody’s Investors Service upgraded CITIC Limited to A3 from Ba2. |
| | Detracting from relative performance during the Reporting Period was the Fund’s overweight in Venezuelan external debt. After performing well in the second calendar of 2014, Venezuelan external debt sold off in the third calendar quarter on the ouster of oil minister Rafael Ramirez and on falling oil prices. In addition, the Fund was hampered by an underweight in South Korean local interest rates, which performed well during the Reporting Period. The Fund was underweight because we believed the South Korean central bank was unlikely to cut interest rates in the near term. However, in August 2014, the nation’s central bank lowered rates to help boost South Korea’s economic growth. The Fund was also hurt during the Reporting Period by an underweight position in Polish local interest rates. We expected Poland’s economic growth to pick up, narrowing the country’s output gap and pushing inflation higher. However, Poland’s economic growth weakened on lower trade with Russia and slower Western European growth. Inflation also remained low, prompting the Polish central bank to cut interest rates. A position in the Polish zloty, accomplished through the use of forward foreign currency exchange contracts, dampened relative performance as well. |
| Q | | Did the Fund’s duration and yield curve positioning strategy help or hurt its results during the Reporting Period? |
| A | | During the Reporting Period, the Fund’s U.S. duration and yield curve positioning was a drag on relative performance. The Fund held a short duration position relative to the Index, which detracted from returns as interest rates fell. |
| Q | | How did the Fund use derivatives and similar instruments during the Reporting Period? |
| A | | The Fund invested in U.S. Treasury futures, Eurodollar futures, forward foreign currency exchange contracts, interest rate swaps, total return swaps, credit default swaps, cross currency swaps, non-deliverable currency forwards and structured notes. U.S. Treasury futures were used to manage U.S. interest rate duration. Eurodollar futures were used to express our views on the direction of interest rates and to facilitate specific duration and yield curve strategies. Eurodollar futures are contracts that have underlying assets linked to time deposits denominated in U.S. dollars at banks outside the U.S. Forward foreign currency exchange contracts were used for hedging purposes or to express a positive view on a given currency. Interest rate swaps were used to express our views on the direction of a country’s interest rates. Total return swaps, credit default swaps and structured notes were used in place of buying a local currency denominated bond when a particular market was otherwise inaccessible or as a more efficient means of gaining access to a local market. Non-deliverable currency forwards were used to gain exposure to a particular country and also to take advantage of relative value opportunities. |
| Q | | Were there any notable changes in the Fund’s weightings during the Reporting Period? |
| A | | During the Reporting Period, we shifted the Fund from neutral positions in Bulgarian and Indonesian external debt to overweight positions relative to the Index. We increased the Fund’s overweight in Paraguayan external debt over the course of the Reporting Period. We eliminated the Fund’s underweight in South African external debt, shifting to a neutral position. In addition, we moved the Fund from an overweight in Argentinean external debt to an underweight position overall. We accomplished this by reducing the Fund’s investments in external bonds; the Fund continued to hold an overweight in Argentinean GDP warrants at the end of the Reporting Period. We gradually reduced the Fund’s |
15
PORTFOLIO RESULTS
| | overweight in Costa Rican external debt to a neutral position by the end of the Reporting Period. We eliminated the Fund’s position in the Malaysian ringgit during September 2014 after our views about the global growth outlook changed. |
| Q | | How was the Fund positioned relative to its benchmark index at the end of the Reporting Period? |
| A | | At the end of the Reporting Period, the Fund was overweight relative to the Index in the external debt of countries with what we considered to be strong and improving balance sheets. For example, the Fund was overweight Dominican Republic external debt, as that country has reduced its fiscal and current account deficits. We also believe the Dominican Republic may benefit from stronger, more stable economic growth and stable-to-lower oil prices. In addition, at the end of the Reporting Period, the Fund was overweight relative to the Index in Paraguay external debt. |
| Q | | What is the Fund’s tactical view and strategy for the months ahead? |
| A | | At the end of the Reporting Period, we continued to have a long-term positive outlook on emerging markets debt because we believe the asset class is shifting from a niche investment to a core portfolio component. In historical terms, we believe, many portfolios have been under-allocated to emerging markets debt relative to those emerging nations’ portion of world GDP or bond market capitalization. Emerging markets economies, in our opinion, have become better able to withstand shocks to the global financial system, thanks in part to reserve accumulation and improved external debt positions. We continue to view emerging markets debt as a compelling strategic asset class that has the potential to provide investors with an attractive credit risk premium, given the strong credit profile and low debt levels of most emerging markets economies. |
| | Going forward, we plan to maintain our focus on relative value opportunities, especially those created by the increased dispersion of returns in external emerging markets debt. In our view, the increased dispersion in returns is being driven by idiosyncratic country risk, differences in economic fundamentals and in the policies of emerging markets governments as well as by the overall global environment. In addition, we believe a number of other factors could have varied effects on individual emerging markets countries —including the risk of higher U.S. interest rates, fears about the path of China’s economic growth and persistent geopolitical concerns. |
16
FUND BASICS
Emerging Markets Debt Fund
as of September 30, 2014
| | | | | | | | | | | | | | | | | | |
| | PERFORMANCE REVIEW | |
| | | April 1, 2014– September 30, 2014 | | Fund Total Return
(based on NAV)1 | | | J.P. Morgan
EMBISM Global
Diversified Index2 | | | 30-Day
Standardized
Subsidized Yield3 | | | 30-Day
Standardized
Unsubsidized Yield3 | |
| | Class A | | | 4.19 | % | | | 4.14 | % | | | 3.68 | % | | | 3.67 | % |
| | Class C | | | 3.88 | | | | 4.14 | | | | 3.10 | | | | 3.09 | |
| | Institutional | | | 4.44 | | | | 4.14 | | | | 4.20 | | | | 4.19 | |
| | | Class IR | | | 4.40 | | | | 4.14 | | | | 4.11 | | | | 4.10 | |
| | 1 | | The net asset value (“NAV”) represents the net assets of the class of the Fund (ex-dividend) divided by the total number of shares of the class outstanding. The Fund’s performance assumes the reinvestment of dividends and other distributions. The Fund’s performance does not reflect the deduction of any applicable sales charges. |
| | 2 | | The J.P. Morgan Emerging Markets Bond Index (EMBISM) Global Diversified (Gross, USD, Unhedged) Index is an unmanaged index of debt instruments of 50 emerging countries. The Index figures do not reflect any deduction for fees, expenses or taxes. It is not possible to invest directly in an index. |
| | 3 | | The method of calculation of the 30-Day Standardized Subsidized Yield is mandated by the Securities and Exchange Commission and is determined by dividing the net investment income per share earned during the last 30 days of the period by the maximum public offering price (“POP”) per share on the last day of the period. This number is then annualized. The 30-Day Standardized Subsidized Yield reflects fee waivers and/or expense reimbursements recorded by the Fund during the period. Without waivers and/or reimbursements, yields would be reduced. This yield does not necessarily reflect income actually earned and distributed by the Fund and, therefore, may not be correlated with the dividends or other distributions paid to shareholders. The 30-Day Standardized Unsubsidized Yield does not adjust for any fee waivers and/or expense reimbursements in effect. If the Fund does not incur any fee waivers and/or expense reimbursements during the period, the 30-Day Standardized Subsidized Yield and 30-Day Standardized Unsubsidized Yield will be identical. |
| | | | | | | | | | | | | | | | | | | | | | |
| | STANDARDIZED TOTAL RETURNS4 | |
| | | For the period ended 9/30/14 | | One Year | | | Five Years | | | Ten Years | | | Since Inception | | | Inception Date | |
| | Class A | | | 4.70 | % | | | 7.33 | % | | | 8.45 | % | | | 9.17 | % | | | 8/29/03 | |
| | Class C | | | 7.89 | | | | 7.57 | | | | N/A | | | | 6.94 | | | | 9/29/06 | |
| | Institutional | | | 10.12 | | | | 8.71 | | | | 9.33 | | | | 10.02 | | | | 8/29/03 | |
| | | Class IR | | | 10.02 | | | | N/A | | | | N/A | | | | 7.05 | | | | 7/30/10 | |
| | 4 | | The Standardized Total Returns are average annual total returns as of the most recent calendar quarter-end. They assume reinvestment of all distributions at NAV. These returns reflect a maximum initial sales charge of 4.5% for Class A Shares and the assumed contingent deferred sales charge for Class C Shares (1% if redeemed within 12 months of purchase). Because Institutional and Class IR Shares do not involve a sales charge, such a charge is not applied to their Standardized Total Returns. The Fund will charge a 2% redemption fee on the redemption of shares (including by exchange) held for 30 calendar days or less. The performance figures do not reflect the deduction of the redemption fee. If reflected, the redemption fee would reduce the performance quoted. |
The returns set forth in the tables above represent past performance. Past performance does not guarantee future results. The Fund’s investment return and principal value will fluctuate so that an investor’s shares, when redeemed, may be worth more or less than their original cost. Current performance may be lower or higher than the performance quoted above. Please visit our web site at www.GSAMFUNDS.com to obtain the most recent month-end returns. Performance reflects applicable fee waivers and/or expense limitations in effect during the periods shown. In their absence, performance would be reduced. Returns do not reflect the deduction of taxes that a shareholder would pay on Fund distributions or the redemption of Fund shares.
17
FUND BASICS
| | | | | | | | | | |
| | EXPENSE RATIOS5 | |
| | | | | Net Expense Ratio (Current) | | | Gross Expense Ratio (Before Waivers) | |
| | Class A | | | 1.25 | % | | | 1.26 | % |
| | Class C | | | 2.00 | | | | 2.01 | |
| | Institutional | | | 0.91 | | | | 0.92 | |
| | | Class IR | | | 1.00 | | | | 1.01 | |
| | 5 | | The expense ratios of the Fund, both current (net of applicable fee waivers and/or expense limitations) and before waivers (gross of applicable fee waivers and/or expense limitations) are as set forth above according to the most recent publicly available Prospectus for the Fund and may differ from the expense ratios disclosed in the Financial Highlights in this report. Pursuant to a contractual arrangement, the Fund’s waivers and/or expense limitations will remain in place through at least July 29, 2015, and prior to such date the Investment Adviser may not terminate the arrangements without the approval of the Fund’s Board of Trustees. If these arrangements are discontinued in the future, the expense ratios may change without shareholder approval. |
| | | | | | | | | | |
| | TOP TEN COUNTRY ALLOCATION6 | |
| | | | | Percentage of Net Assets | |
| | | | | as of 9/30/14 | | | as of 3/31/14 | |
| | United States | | | 7.8 | % | | | 1.1 | % |
| | Mexico | | | 6.7 | | | | 4.4 | |
| | Indonesia | | | 4.9 | | | | 3.8 | |
| | Brazil | | | 3.7 | | | | 4.8 | |
| | Turkey | | | 3.5 | | | | 5.7 | |
| | Hong Kong | | | 3.4 | | | | 0.4 | |
| | Croatia | | | 3.4 | | | | 2.2 | |
| | Dominican Republic | | | 3.4 | | | | 3.2 | |
| | Chile | | | 3.3 | | | | 2.9 | |
| | | Luxembourg | | | 3.0 | | | | 2.5 | |
| | 6 | | The percentage shown for each investment category reflects the value of investments in that country as a percentage of net assets. The table does not include repurchase agreements of 3.7% as of 9/30/14 and 6.7% as of 3/31/14. The table depicts the Fund’s investments but may not represent the Fund’s market exposure due to the exclusion of certain derivatives, if any, as listed in the Additional Investment Information section of the Schedule of Investments. |
18
PORTFOLIO RESULTS
Goldman Sachs High Yield Fund
Investment Objective
The Fund seeks a high level of current income and may also consider the potential for capital appreciation.
Portfolio Management Discussion and Analysis
Below, the Goldman Sachs High Yield Fixed Income Investment Management Team discusses the Goldman Sachs High Yield Fund’s (the “Fund”) performance and positioning for the six-month period ended September 30, 2014 (the “Reporting Period”).
| Q | | How did the Fund perform during the Reporting Period? |
| A | | During the Reporting Period, the Fund’s Class A, B, C, Institutional, Service, IR and R Shares generated cumulative total returns, without sales charges, of -0.30%, -0.66%, -0.67%, -0.12%, -0.38%, -0.16% and -0.42%, respectively. These returns compare to the 0.50% cumulative total return of the Fund’s benchmark, the Barclays U.S. High Yield Index, 2% Issuer Capped Bond Index (the “Index”), during the same time period. |
| Q | | What economic and market factors most influenced the high yield bond market as a whole during the Reporting Period? |
| A | | During the Reporting Period, high yield corporate bonds generated a small gain, with higher quality credits performing best. Option adjusted spreads widened approximately 66 basis points to end the Reporting Period at 424 basis points. (The option adjusted spread is a measurement tool for evaluating price differences between similar products with different embedded options. A basis point is 1/100th of a percentage point.) High yield corporate bonds underperformed high yield loans, as represented by the Barclays Bank Loan Index/U.S. High-Yield Loan Index, and underperformed equities, as represented by the S&P 500® Total Return Index. |
| | Issuance was strong during the Reporting Period, with approximately $197.6 billion in new high yield corporate bonds priced. Refinancing remained the primary use of proceeds. Meanwhile, demand was tepid during the Reporting Period overall. During the second quarter of 2014, high yield corporate bond mutual funds received approximately $3.7 billion in investment inflows. However, in the third calendar quarter, investor sentiment shifted, and approximately $18 billion was withdrawn from high yield corporate bond mutual funds. |
| | The default rate for high yield corporate bonds remained low in historical terms, helped by healthier corporate balance sheets. However, the default rate spiked during the Reporting Period as a result of the default of power company Energy Future Holdings. For the Reporting Period overall, there were seven defaults among high yield issuers, affecting approximately $20.9 billion in bonds. The 12-month par-weighted default high yield corporate bond rate through September 30, 2014 was 1.86%.1 |
| Q | | What key factors were responsible for the Fund’s performance during the Reporting Period? |
| A | | The Fund’s duration positioning detracted from its relative performance during the Reporting Period. (Duration is a measure of a portfolio’s sensitivity to changes in interest rates.) In addition, the Fund was hampered by its overall underweight in long spread duration credits (greater than nine years), as spreads (yield differentials between high yield corporate bonds and U.S. Treasury securities of similar maturity) narrowed. (Spread duration represents the price sensitivity of a high yield bond to a change in spreads.) The Fund was also hurt by an overweight in lower credit quality issues and an underweight in higher credit quality issues. |
| | On the positive side, the Fund benefited from its overweight in high yield loans, which outperformed high yield bonds during the Reporting Period. Overweighted exposure to euro-denominated credits contributed positively. The Fund’s overweight in emerging markets high yield corporate bonds and our individual issue selection also added slightly to relative returns. |
19
PORTFOLIO RESULTS
| Q | | Which segments within high yield most significantly affected Fund performance? |
| A | | The Fund’s overweight in lower credit quality credits, in particular its overweight position in CCC-rated bonds, and its underweighted position in higher credit quality credits, particularly BB-rated bonds, detracted from relative results, as higher credit quality bonds outperformed lower credit quality bonds during the Reporting Period. Fund performance benefited from an underweight in CC-rated bonds. |
| | In terms of sector positioning, the Fund was hurt by an underweight in utilities (especially gas and electric utilities). Overweight positions in gaming, technology and cellular telecommunications also dampened returns. Conversely, the Fund benefited from an overweight position in the commercial services sector. An underweight in the energy sector was also advantageous, as oil prices declined during the Reporting Period. |
| | With regard to individual issue selection, the Fund benefited from its lack of exposure to several names, especially Cliffs Natural Resources, an iron ore and coal producer; Quicksilver Resources, an oil and gas exploration and production company; Walter Energy, a producer of metallurgical coal for the global steel industry; and Alpha Natural Resources, which produces metallurgical coal. The Fund was hurt by its lack of exposure to power company Energy Futures Holdings as well as by overweighted positions in Claire’s Stores, a retailer of fashion jewelry and accessories for girls; Post Holdings (formerly Post Cereals), a consumer packaged goods company; and Algeco Scotsman, a provider of modular space and secure storage solutions. |
| Q | | Did the Fund’s duration and yield curve positioning strategy help or hurt its results during the Reporting Period? |
| A | | During the Reporting Period, the Fund’s duration and yield curve positioning hurt its performance relative to the Index. More specifically, the Fund was hampered by its short duration position as interest rates declined. |
| Q | | How did the Fund use derivatives and similar instruments during the Reporting Period? |
| A | | To hedge against currency risk (that is, the risk that certain currencies might fluctuate in value), the Fund employed forward foreign exchange currency contracts during the Reporting Period. Additionally, a specialized index of credit default swaps (CDX) was used to manage the beta of the Fund on an active basis. It was also used as a cost-efficient instrument to help manage the Fund’s cash position. We employ CDX contracts as a way to gain credit exposure by being short credit protection, when the Fund experiences significant cash inflows. In addition, during the Reporting Period, the Fund used U.S. Treasury futures to facilitate specific duration and yield curve strategies. |
| Q | | Were there any notable changes in the Fund’s weightings during the Reporting Period? |
| A | | During the Reporting Period, we reduced the Fund’s overweight in gaming. We also shifted the Fund from an overweight position in retail and apparel to an underweight position by the end of the Reporting Period. We reduced the size of the Fund’s underweight in autos and finance. We increased the Fund’s exposure to more defensive industries, such as packaging and non-cable media, during the Reporting Period. |
| Q | | How was the Fund positioned relative to its benchmark index at the end of the Reporting Period? |
| A | | At the end of the Reporting Period, the Fund was overweight relative to the Index in commercial services, gaming and telecommunications. It was underweight compared to the Index in utilities, energy, aerospace and defense, and metals and mining at the end of the Reporting Period. |
| Q | | What is the Fund’s tactical view and strategy for the months ahead? |
| A | | At the end of the Reporting Period, we had a positive outlook on high yield corporate bonds, largely because of a favorable macroeconomic backdrop and solid company fundamentals. In our view, the weakness of the asset class during the Reporting Period could be a potential buying opportunity, particularly if high yield corporate bond spreads continue to narrow. Indeed, we expect spreads to tighten as the credit cycle continues to mature. That said, we acknowledge risks exist and believe they stem mainly from macroeconomic or geopolitical developments that could create broad-based risk aversion. Among those developments could be the potential escalation of military conflicts in Eastern Europe or the Middle East, deflationary stagnation in Europe or surprise weakness in China’s economy, which could be a negative signal for global economic trends. |
20
FUND BASICS
High Yield Fund
as of September 30, 2014
| | | | | | | | | | | | | | | | | | |
| | PERFORMANCE REVIEW | |
| | | April 1, 2014– September 30, 2014 | | Fund Total Return
(based on NAV)1 | | | Barclays U.S.
Corporate
High-Yield 2%
Issuer Capped
Bond Index | | | 30-Day
Standardized
Subsidized Yield3 | | | 30-Day
Standardized
Unsubsidized Yield3 | |
| | Class A | | | -0.30 | % | | | 0.50 | % | | | 4.35 | % | | | 4.35 | % |
| | Class B | | | -0.66 | | | | 0.50 | | | | 3.79 | | | | 3.79 | |
| | Class C | | | -0.67 | | | | 0.50 | | | | 3.80 | | | | 3.80 | |
| | Institutional | | | -0.12 | | | | 0.50 | | | | 4.91 | | | | 4.91 | |
| | Service | | | -0.38 | | | | 0.50 | | | | 4.39 | | | | 4.39 | |
| | Class IR | | | -0.16 | | | | 0.50 | | | | 4.81 | | | | 4.81 | |
| | | Class R | | | -0.42 | | | | 0.50 | | | | 4.30 | | | | 4.30 | |
| | 1 | | The net asset value (“NAV”) represents the net assets of the class of the Fund (ex-dividend) divided by the total number of shares of the class outstanding. The Fund’s performance assumes the reinvestment of dividends and other distributions. The Fund’s performance does not reflect the deduction of any applicable sales charges. |
| | 2 | | The Barclays U.S. Corporate High-Yield 2% Issuer Capped Bond Index, an unmanaged index, covers the universe of U.S. dollar denominated, non-convertible, fixed rate, non-investment grade debt. Index holdings must have at least one year to final maturity, at least $150 million par amount outstanding, and be publicly issued with a rating of Ba1 or lower. The Index figures do not reflect any deduction for fees, expenses or taxes. It is not possible to invest directly in an index. |
| | 3 | | The method of calculation of the 30-Day Standardized Subsidized Yield is mandated by the Securities and Exchange Commission and is determined by dividing the net investment income per share earned during the last 30 days of the period by the maximum public offering price (“POP”) per share on the last day of the period. This number is then annualized. The 30-Day Standardized Subsidized Yield reflects fee waivers and/or expense reimbursements recorded by the Fund during the period. Without waivers and/or reimbursements, yields would be reduced. This yield does not necessarily reflect income actually earned and distributed by the Fund and, therefore, may not be correlated with the dividends or other distributions paid to shareholders. The 30-Day Standardized Unsubsidized Yield does not adjust for any fee waivers and/or expense reimbursements in effect. If the Fund does not incur any fee waivers and/or expense reimbursements during the period, the 30-Day Standardized Subsidized Yield and 30-Day Standardized Unsubsidized Yield will be identical. |
The returns set forth in the table above represent past performance. Past performance does not guarantee future results. The Fund’s investment return and principal value will fluctuate so that an investor’s shares, when redeemed, may be worth more or less than their original cost. Current performance may be lower or higher than the performance quoted above. Please visit our web site at www.GSAMFUNDS.com to obtain the most recent month-end returns. Performance reflects applicable fee waivers and/or expense limitations in effect during the periods shown. In their absence, performance would be reduced. Returns do not reflect the deduction of taxes that a shareholder would pay on Fund distributions or the redemption of Fund shares.
21
FUND BASICS
| | | | | | | | | | | | | | | | | | | | |
| | STANDARDIZED TOTAL RETURNS4 |
| | | For the period ended 9/30/14 | | One Year | | | Five Years | | | Ten Years | | | Since Inception | | | Inception Date |
| | Class A | | | 1.98 | % | | | 8.22 | % | | | 6.56 | % | | | 6.43 | % | | 8/1/97 |
| | Class B | | | 0.70 | | | | 7.99 | | | | 6.41 | | | | 6.34 | | | 8/1/97 |
| | Class C | | | 4.94 | | | | 8.42 | | | | 6.27 | | | | 5.95 | | | 8/15/97 |
| | Institutional | | | 7.01 | | | | 9.59 | | | | 7.43 | | | | 7.11 | | | 8/1/97 |
| | Service | | | 6.63 | | | | 9.06 | | | | 6.88 | | | | 6.57 | | | 8/1/97 |
| | Class IR | | | 7.07 | | | | 9.53 | | | | N/A | | | | 7.49 | | | 11/30/07 |
| | | Class R | | | 6.53 | | | | 8.96 | | | | N/A | | | | 6.92 | | | 11/30/07 |
| | 4 | | The Standardized Total Returns are average annual total returns as of the most recent calendar quarter-end. They assume reinvestment of all distributions at NAV. These returns reflect a maximum initial sales charge of 4.5% for Class A Shares, the assumed contingent deferred sales charge for Class B Shares (5% maximum declining to 0% after six years) and the assumed contingent deferred sales charge for Class C Shares (1% if redeemed within 12 months of purchase). Class B Shares convert automatically to Class A Shares on or about the fifteenth day of the last month of the calendar quarter that is eight years after purchase. Returns for Class B Shares for the period after conversion reflect the performance of Class A Shares. Because Institutional, Service, Class R and IR Shares do not involve a sales charge, such a charge is not applied to their Standardized Total Returns. The Fund will charge a 2% redemption fee on the redemption of shares (including by exchange) held for 60 calendar days or less. The performance figures do not reflect the deduction of the redemption fee. If reflected, the redemption fee would reduce the performance quoted. The Fund’s Class B Shares are no longer available for purchase by new or existing shareholders (although current Class B shareholders may continue to reinvest income and capital gains distributions into Class B Shares, and Class B shareholders may continue to exchange their shares for Class B Shares of certain other Goldman Sachs Funds). |
The returns set forth in the table above represent past performance. Past performance does not guarantee future results. The Fund’s investment return and principal value will fluctuate so that an investor’s shares, when redeemed, may be worth more or less than their original cost. Current performance may be lower or higher than the performance quoted above. Please visit our web site at www.GSAMFUNDS.com to obtain the most recent month-end returns. Performance reflects applicable fee waivers and/or expense limitations in effect during the periods shown. In their absence, performance would be reduced. Returns do not reflect the deduction of taxes that a shareholder would pay on Fund distributions or the redemption of Fund shares.
| | | | | | | | | | |
| | EXPENSE RATIOS5 | |
| | | | | Net Expense Ratio (Current) | | | Gross Expense Ratio (Before Waivers) | |
| | Class A | | | 1.05 | % | | | 1.05 | % |
| | Class B | | | 1.81 | | | | 1.81 | |
| | Class C | | | 1.81 | | | | 1.81 | |
| | Institutional | | | 0.72 | | | | 0.72 | |
| | Service | | | 1.22 | | | | 1.22 | |
| | Class IR | | | 0.81 | | | | 0.81 | |
| | | Class R | | | 1.31 | | | | 1.31 | |
| | 5 | | The expense ratios of the Fund, both current (net of applicable fee waivers and/or expense limitations) and before waivers (gross of applicable fee waivers and/or expense limitations) are as set forth above according to the most recent publicly available Prospectus for the Fund and may differ from the expense ratios disclosed in the Financial Highlights in this report. |
22
FUND BASICS
| | | | | | | | |
| | TOP TEN ISSUERS AS OF 9/30/14 |
| | | Company | | % of Net Assets | | | Line of Business |
| | Sprint Corp. | | | 2.5 | % | | Telecommunications – Cellular |
| | HCA, Inc. | | | 2.4 | | | Health Care – Services |
| | MGM Resorts International | | | 1.8 | | | Gaming |
| | Frontier Communications Corp. | | | 1.5 | | | Telecommunications |
| | HD Supply, Inc. | | | 1.5 | | | Consumer Products – Industrial |
| | Reynolds Group Issuer, Inc. | | | 1.4 | | | Packaging |
| | First Data Corp. | | | 1.2 | | | Technology – Software/Service |
| | SLM Corp. | | | 1.2 | | | Finance |
| | Ally Financial, Inc. | | | 1.1 | | | Finance |
| | | Wind Acquisition Finance SA | | | 1.1 | | | Telecommunications – Cellular |
| | 6 | | The top 10 issuers may not be representative of the Fund’s future investments. |
| | | | | | | | | | |
| | TOP TEN INDUSTRY ALLOCATION7 | |
| | | | | Percentage of Net Assets | |
| | | | | as of 9/30/14 | | | as of 3/31/14 | |
| | Telecommunications | | | 11.8 | % | | | 10.5 | % |
| | Energy | | | 10.7 | | | | 12.5 | |
| | Media | | | 8.0 | | | | 8.0 | |
| | Health Care | | | 7.6 | | | | 7.1 | |
| | Finance | | | 6.0 | | | | 6.6 | |
| | Gaming | | | 5.3 | | | | 5.9 | |
| | Consumer Products | | | 5.1 | | | | 4.9 | |
| | Technology | | | 4.6 | | | | 4.9 | |
| | Banks | | | 3.4 | | | | 1.8 | |
| | | Home Construction | | | 3.7 | | | | 2.7 | |
| | 7 | | The percentage shown for each investment category reflects the value of investments in that category as a percentage of net assets. The table does not include repurchase agreements of 1.4% as of 9/30/14 and 2.1% as of 3/31/14. The table depicts the Fund’s investments but may not represent the Fund’s market exposure due to the exclusion of certain derivatives, if any, as listed in the Additional Investment Information section of the Schedule of Investments. |
23
PORTFOLIO RESULTS
Goldman Sachs High Yield Floating Rate Fund
Investment Objective
The Fund seeks a high level of current income.
Portfolio Management Discussion and Analysis
Below, the Goldman Sachs High Yield Fixed Income Investment Management Team discusses the Goldman Sachs High Yield Floating Rate Fund’s (the “Fund”) performance and positioning for the six-month period ended September 30, 2014 (the “Reporting Period”).
| Q | | How did the Fund perform during the Reporting Period? |
| A | | During the Reporting Period, the Fund’s Class A, C, Institutional, IR and R Shares generated cumulative total returns, without sales charges, of 0.16%, -0.32%, -0.23%, 0.29% and -0.06%, respectively. These returns compare to the 0.88% cumulative total return of the Fund’s benchmark, the Barclays U.S. High-Yield Loans Index (the “Index”), during the same time period. |
| Q | | What economic and market factors most influenced the high yield floating rate loan market as a whole during the Reporting Period? |
| A | | High yield loans posted a modest gain during the Reporting Period. High yield loan spreads (or yield differentials with duration-equivalent U.S. Treasury securities) widened by approximately 37 basis points, ending the Reporting Period at 510 basis points. (A basis point is 1/100th of a percentage point.) The weighted average price for the loans in the Index decreased from $98.72 to $97.67. |
| | While the technical backdrop for high yield loans was challenging, issuance remained robust, with $232 billion of new high yield loans brought to market during the Reporting Period. An increasing amount of the proceeds were used to finance mergers and acquisitions activity. Covenant-lite issuance also increased, suggesting freer standards from underwriters. (Covenant-lite loans are issued with less restrictive lending terms.) At the same time, high yield loan mutual funds experienced investment outflows as investors grew more concerned about potential credit quality degradation and less concerned about holding low duration, floating rate assets in the falling interest rate environment. By the end of the Reporting Period, the high yield loan market had seen six consecutive months of investment inflows. |
| | During the Reporting Period, the default rate for high yield loans remained low on a historical basis, helped by healthier corporate balance sheets. There were 21 defaults among high yield issuers in the 2014 calendar year through September 30, 2014, affecting $26 billion in high yield loans. The trailing 12-month loan-only default rate through September 30, 2014 was 3.59%. Excluding the default of Energy Future Holdings, widely anticipated by the market, the trailing 12-month default rate through September 30, 2014 was 0.95%. |
| Q | | What key factors were responsible for the Fund’s performance during the Reporting Period? |
| A | | The Fund’s exposure to the high yield corporate bond market was most responsible for its underperformance of the Index during the Reporting Period. Sector positioning within the high yield loan market also dampened results. |
| Q | | Which segments of the high yield floating rate loan market significantly affected Fund performance? |
| A | | Overall during the Reporting Period, the Fund was hurt by its exposure to the high yield corporate bond market, as spreads widened during the third quarter of 2014 on soft economic data in Asia and Europe. An overweight in European (such as U.K.) credits also detracted from relative performance. |
| | Relative to sector positioning within the high yield loan market, an overweight in cellular telecommunications dampened performance. In addition, the Fund was hampered by an underweight in utilities, especially a lack of exposure to Energy Future Holdings, which filed for bankruptcy in April 2014. During the Reporting Period, the power company’s debt rallied on the possibility that a legal resolution to creditors’ claims might come sooner than expected. Conversely, the Fund benefited from its underweighted positions in consumer cyclical, consumer services and leisure and restaurants. An underweight in the energy sector was also advantageous, as oil prices declined during the Reporting Period. |
24
PORTFOLIO RESULTS
| | Relative to individual issue selection, the Fund was hurt during the Reporting Period by an overweight in Sprint, a wireless telecommunications provider, and in Delta Airlines, an airline company. A lack of exposure to Toys “R” Us, a toy and juvenile products retailer, also hindered results. On the positive side, the Fund’s lack of exposure to Education Management added to performance. The operator of private sector post-secondary educational institutions is facing a federal investigation over financial aid lending practices. Furthermore, a lack of exposure to children’s clothing retailer Gymboree also added to returns as did an overweight position in clothing retailer American Apparel. |
| Q | | Did the Fund’s duration and yield curve positioning strategy help or hurt its results during the Reporting Period? |
| A | | The Fund does not use duration and yield curve positioning as active management strategies within its investment process. |
| Q | | How did the Fund use derivatives and similar instruments during the Reporting Period? |
| A | | To hedge against currency risk (that is, the risk that certain currencies might fluctuate in value), the Fund employed forward foreign exchange currency contracts during the Reporting Period. The Fund also employed interest rate swaps as a cost-efficient instrument to provide us with greater precision and versatility in the management of duration. Interest rate swaps are only utilized in the Fund for the purpose of hedging duration, as the Fund does not take active duration and yield curve positions. Additionally, a specialized index of credit default swaps (CDX) was used to manage the beta of the Fund on an active basis. It was also used as a cost-efficient instrument to help manage the Fund’s cash position. We employ CDX contracts as a way to gain credit exposure by being short credit protection, when the Fund experiences significant cash inflows. |
| Q | | Were there any notable changes in the Fund’s weightings during the Reporting Period? |
| A | | During the Reporting Period, we shifted the Fund from an overweight relative to the Index in consumer non-cyclicals to a slightly underweight position. We increased the Fund’s overweight in industrial manufacturing and its underweight in finance. |
| Q | | How was the Fund positioned relative to its benchmark index at the end of the Reporting Period? |
| A | | At the end of the Reporting Period, the Fund was overweight relative to the Index in industrial manufacturing, communications and commercial services. It was underweight compared to the Index in consumer cyclical, energy and finance. |
| Q | | What is the Fund’s tactical view and strategy for the months ahead? |
| A | | At the end of the Reporting Period, we remained positive on high yield loans, largely because we believe macroeconomic conditions remain favorable for non-investment grade credit. Overall, global central banks remain accommodative, as evidenced by increased monetary stimulus by the European Central Bank during the Reporting Period. In our view, U.S. economic growth is also improving, and we believe low yields on global government bonds support a continued search for yield. We expect the default rate for high yield loans to remain below long term averages for some time. Given the modest performance of high yield loans during the Reporting Period, we believe the asset class is likely to generate attractive returns in the near term, especially given the low default rate. Our positive outlook is tempered by risk factors that include increased mergers and acquisitions activity and a larger amount of covenant-lite issuance. We plan to be vigilant in our credit selection, and at the end of the Reporting Period, we were focusing Fund investments on higher quality issues. |
25
FUND BASICS
High Yield Floating Rate Fund
as of September 30, 2014
| | | | | | | | | | | | | | | | | | |
| | PERFORMANCE REVIEW | |
| | | April 1, 2014– September 30, 2014 | | Fund Total Return
(based on NAV)1 | | | Barclays
U.S. High-Yield
Loans Index2 | | | 30-Day
Standardized
Subsidized Yield3 | | | 30-Day
Standardized
Unsubsidized Yield3 | |
| | Class A | | | 0.16 | % | | | 0.88 | % | | | 3.18 | % | | | 3.18 | % |
| | Class C | | | -0.32 | | | | 0.88 | | | | 2.50 | | | | 2.50 | |
| | Institutional | | | 0.23 | | | | 0.88 | | | | 3.60 | | | | 3.60 | |
| | Class IR | | | 0.29 | | | | 0.88 | | | | 3.50 | | | | 3.50 | |
| | | Class R | | | -0.06 | | | | 0.88 | | | | 3.03 | | | | 3.03 | |
| | 1 | | The net asset value (“NAV”) represents the net assets of the class of the Fund (ex-dividend) divided by the total number of shares of the class outstanding. The Fund’s performance assumes the reinvestment of dividends and other distributions. The Fund’s performance does not reflect the deduction of any applicable sales charges. |
| | 2 | | The Barclays U.S. High-Yield Loans Index provides broad and comprehensive total return metrics of the universe of syndicated term loans. To be included in the index, a bank loan must be dollar denominated, have at least $150 million, a minimum term of one year, and a minimum initial spread of LIBOR+125. It is not possible to invest directly in an index. |
| | 3 | | The method of calculation of the 30-Day Standardized Subsidized Yield is mandated by the Securities and Exchange Commission and is determined by dividing the net investment income per share earned during the last 30 days of the period by the maximum public offering price (“POP”) per share on the last day of the period. This number is then annualized. The 30-Day Standardized Subsidized Yield reflects fee waivers and/or expense reimbursements recorded by the Fund during the period. Without waivers and/or reimbursements, yields would be reduced. This yield does not necessarily reflect income actually earned and distributed by the Fund and, therefore, may not be correlated with the dividends or other distributions paid to shareholders. The 30-Day Standardized Unsubsidized Yield does not adjust for any fee waivers and/or expense reimbursements in effect. If the Fund does not incur any fee waivers and/or expense reimbursements during the period, the 30-Day Standardized Subsidized Yield and 30-Day Standardized Unsubsidized Yield will be identical. |
| | | | | | | | | | | | |
| | STANDARDIZED TOTAL RETURNS4 |
| | | For the period ended 9/30/14 | | One Year | | | Since Inception | | | Inception Date |
| | Class A | | | 0.14 | % | | | 2.56 | % | | 3/31/11 |
| | Class C | | | 0.56 | | | | 2.47 | | | 3/31/11 |
| | Institutional | | | 2.69 | | | | 3.61 | | | 3/31/11 |
| | Class IR | | | 2.70 | | | | 3.54 | | | 3/31/11 |
| | | Class R | | | 2.08 | | | | 2.98 | | | 3/31/11 |
| | 4 | | The Standardized Total Returns are average annual total returns as of the most recent calendar quarter-end. They assume reinvestment of all distributions at NAV. These returns reflect a maximum initial sales charge of 2.25% for Class A Shares and the assumed contingent deferred sales charge for Class C Shares (1% if redeemed within 12 months of purchase). Because Institutional, Class IR and Class R Shares do not involve a sales charge, such a charge is not applied to their Standardized Total Returns. |
The returns set forth in the tables above represent past performance. Past performance does not guarantee future results. The Fund’s investment return and principal value will fluctuate so that an investor’s shares, when redeemed, may be worth more or less than their original cost. Current performance may be lower or higher than the performance quoted above. Please visit our web site at www.GSAMFUNDS.com to obtain the most recent month-end returns. Performance reflects applicable fee waivers and/or expense limitations in effect during the periods shown. In their absence, performance would be reduced. Returns do not reflect the deduction of taxes that a shareholder would pay on Fund distributions or the redemption of Fund shares.
26
FUND BASICS
| | | | | | | | | | |
| | EXPENSE RATIOS5 | |
| | | | | Net Expense Ratio (Current) | | | Gross Expense Ratio (Before Waivers) | |
| | Class A | | | 0.96 | % | | | 0.97 | % |
| | Class C | | | 1.72 | | | | 1.73 | |
| | Institutional | | | 0.63 | | | | 0.63 | |
| | Class IR | | | 0.72 | | | | 0.73 | |
| | | Class R | | | 1.21 | | | | 1.22 | |
| | 5 | | The expense ratios of the Fund, both current (net of applicable fee waivers and/or expense limitations) and before waivers (gross of applicable fee waivers and/or expense limitations) are as set forth above according to the most recent publicly available Prospectus for the Fund and may differ from the expense ratios disclosed in the Financial Highlights in this report. Pursuant to a contractual arrangement, the Fund’s waivers and/or expense limitations will remain in place through at least July 29, 2015, and prior to such date the Investment Adviser may not terminate the arrangements without the approval of the Fund’s Board of Trustees. If these arrangements are discontinued in the future, the expense ratios may change without shareholder approval. |
| | | | | | | | | | |
| | TOP TEN INDUSTRY ALLOCATION6 | |
| | | | | Percentage of Net Assets | |
| | | | | as of 9/30/14 | | | as of 3/31/14 | |
| | Food & Beverages | | | 7.1 | % | | | 7.4 | % |
| | Health Care | | | 6.0 | | | | 4.9 | |
| | Retailers | | | 5.2 | | | | 5.1 | |
| | Media – Broadcasting & Radio | | | 4.9 | | | | 6.3 | |
| | Services Cyclical – Business Services | | | 4.6 | | | | 3.2 | |
| | Media – Cable | | | 4.3 | | | | 4.2 | |
| | Airlines | | | 3.8 | | | | 4.3 | |
| | Health Care – Services | | | 3.5 | | | | 4.2 | |
| | Packaging | | | 3.4 | | | | 3.0 | |
| | | Building Materials | | | 3.2 | | | | 3.5 | |
| | 6 | | The percentage shown for each investment category reflects the value of investments in that category as a percentage of net assets. The table does not include repurchase agreements of 5.5% as of 9/30/14 and 11.4% as of 3/31/14. The table depicts the Fund’s investments but may not represent the Fund’s market exposure due to the exclusion of certain derivatives, if any, as listed in the Additional Investment Information section of the Schedule of Investments. |
27
PORTFOLIO RESULTS
Goldman Sachs Investment Grade Credit Fund
Investment Objective
The Fund seeks a high level of total return consisting of capital appreciation and income that exceeds the total return of the Barclays U.S. Credit Index.
Portfolio Management Discussion and Analysis
Below, the Goldman Sachs U.S. Fixed Income Investment Management Team discusses the Goldman Sachs Investment Grade Credit Fund’s (the “Fund”) performance and positioning for the six-month period ended September 30, 2014 (the “Reporting Period”).
| Q | | How did the Fund perform during the Reporting Period? |
| A | | During the Reporting Period, the Fund’s Class A, Institutional, IR and Separate Account Institutional Shares generated cumulative total returns, without sales charges, of 2.54%, 2.83%, 2.78% and 2.83%, respectively. These returns compare to the 2.68% cumulative total return of the Fund’s benchmark, the Barclays U.S. Credit Index (the “Index”), during the same time period. |
| Q | | What economic and market factors most influenced the investment grade credit market as a whole during the Reporting Period? |
| A | | In the second quarter of 2014 when the Reporting Period began, investment grade corporate bonds generated positive returns. Investment grade credit spreads, or the difference in yields between corporate bonds and duration-equivalent U.S. Treasury securities, tightened by approximately eight basis points to end the second calendar quarter at 104 basis points. (A basis point is 1/100th of a percentage point.) European investment grade corporate bonds outperformed U.S. investment grade corporate bonds, driven by the European Central Bank’s accommodative monetary policy as well as by improving financial conditions and modest economic growth in the region. However, in the third quarter of 2014, investment grade corporate bonds lost ground. Investment grade credit spreads widened by approximately five basis points, ending the third calendar quarter at 109 basis points. European investment grade corporate bonds continued to outperform U.S. investment grade corporate bonds. |
| | Issuance was strong overall during the Reporting Period. In the second calendar quarter, U.S. new issuance was approximately $292 billion, while European new issuance was approximately $179 billion. Global mergers and acquisitions activity was robust, as U.S. companies bought European businesses for their cash balances and for tax efficiency reasons. During the third calendar quarter, U.S. new issuance was approximately $234 billion and European new issuance was approximately $117 billion. Mergers and acquisitions activity increased, with a significant portion driven by pharmaceutical and health care companies seeking to unlock overseas cash and manage their tax rates through corporate inversions. (A corporate inversion is the reincorporation of a company overseas in order to reduce the tax burden on income earned abroad.) In September 2014, the U.S. Treasury Department issued new policies discouraging corporate inversions. |
| Q | | What key factors were responsible for the Fund’s performance during the Reporting Period? |
| A | | Individual issue selection amongst investment grade corporate bonds contributed most positively to the Fund’s relative returns during the Reporting Period. Our cross-sector strategy also added modestly to performance. In our cross-sector strategy, we invest Fund assets across a variety of fixed income sectors, including some that may not be included in the Fund’s benchmark. The Fund’s duration and yield curve positioning detracted from relative results. Duration is a measure of the Fund’s sensitivity to changes in interest rates. Yield curve indicates a spectrum of maturities. |
| Q | | Which segments of investment grade credit most significantly affected Fund performance? |
| A | | Overall, individual issue selection of investment grade corporate bonds enhanced the Fund’s relative returns. Slightly offsetting this positive performance was individual issue selection amongst emerging market bonds. In terms of positioning, the Fund benefited from its underweight in longer-term investment grade corporate bonds and in the highest credit quality investment grade corporate bonds. |
28
PORTFOLIO RESULTS
| | Conversely, the Fund’s overweight to investment grade corporate bonds in the banking sector detracted from relative results. |
| Q | | Did the Fund’s duration and yield curve positioning strategy help or hurt its results during the Reporting Period? |
| A | | The Fund’s duration and yield curve positioning hurt its relative performance during the Reporting Period. The Fund was hampered by its short duration bias relative to the Index as interest rates declined. Ten-year U.S. Treasury security yields decreased from 2.72% at the beginning of the Reporting Period to 2.49% at the end of the Reporting Period. Yields on 30-year U.S. Treasury securities started the Reporting Period at 3.56% and ended the Reporting Period at 3.20%. |
| Q | | How did the Fund use derivatives and similar instruments during the Reporting Period? |
| A | | As market conditions warranted during the Reporting Period, the Fund used U.S. Treasury futures and Eurodollar futures to hedge interest rate exposure and facilitate specific duration and yield curve strategies. Eurodollar futures are contracts that have underlying assets linked to time deposits denominated in U.S. dollars at banks outside the U.S. Interest rate swaps were used to express our views on the direction of a country’s interest rates. The Fund employed interest rate swaps and swaptions (options on interest rate swap contracts) to hedge interest rate exposure and express an outright term structure view (term structure, most often depicted as a yield curve, refers to the term structure of interest rates, which is the relationship between the yield to maturity and the time to maturity for pure discount bonds). In addition, it used credit default swaps to implement specific credit-related investment strategies and hedge corporate spread duration (the price sensitivity of a corporate bond to a 100 basis point change in its spread over the London Interbank Offered Rate (“LIBOR”)). It utilized forward foreign currency exchange contracts to hedge currency exposure. |
| Q | | Were there any notable changes in the Fund’s weightings during the Reporting Period? |
| A | | Throughout the Reporting Period, the Fund held an overweight position in investment grade corporate bonds. In late July 2014, we decreased the size of that overweight because we believed the U.S. economy was improving and the Fed might consider raising interest rates. In addition, investment grade corporate bonds have historically experienced weak performance during the late summer. During September 2014, we increased the Fund’s positioning in investment grade corporate bonds because, in our view, valuations had improved and default expectations remained low. At the end of the Reporting Period, the Fund had an overweight position in investment grade corporate bonds. |
| Q | | How was the Fund positioned relative to its benchmark index at the end of the Reporting Period? |
| A | | At the end of the Reporting Period, the Fund was overweight relative to the Index in investment grade bonds issued by real estate investment trusts (“REITs”) and banks. In addition, the Fund was overweight consumer products investment grade corporate bonds based on strengthening consumer demand. It was also overweight investment grade corporate bonds issued by telecommunication companies as that industry continued to consolidate. Compared to the Index at the end of the Reporting Period, the Fund was underweight consumer non-cyclical, energy and capital goods. We generally favored lower credit quality issues and short-term and intermediate-term maturities. |
| Q | | What is the Fund’s tactical view and strategy for the months ahead? |
| A | | At the end of the Reporting Period, we were targeting a slight overweight to neutral position relative to the Index in investment grade bonds, largely because we saw supportive credit fundamentals, valuations being close to fair value and potential upticks in market volatility. We believe modest economic growth in the U.K. and Europe, low to moderate inflation and accommodative central bank monetary policy should continue to support investors’ appetite for investment grade corporate bonds going forward. |
29
FUND BASICS
Investment Grade Credit Fund
as of September 30, 2014
| | | | | | | | | | | | | | | | | | |
| | PERFORMANCE REVIEW | |
| | | April 1, 2014–September 30, 2014 | | Fund Total Return
(based on NAV)1 | | | Barclays U.S.
Credit Index2 | | | 30-Day
Standardized
Subsidized Yield3 | | | 30-Day
Standardized
Unsubsidized Yield3 | |
| | Class A | | | 2.54 | % | | | 2.68 | % | | | 2.29 | % | | | 2.11 | % |
| | Institutional | | | 2.83 | | | | 2.68 | | | | 2.72 | | | | 2.53 | |
| | Class IR | | | 2.78 | | | | 2.68 | | | | 2.63 | | | | 2.44 | |
| | | Separate Account Institutional | | | 2.83 | | | | 2.68 | | | | 2.72 | | | | 2.54 | |
| | 1 | | The net asset value (“NAV”) represents the net assets of the class of the Fund (ex-dividend) divided by the total number of shares of the class outstanding. The Fund’s performance assumes the reinvestment of dividends and other distributions. The Fund’s performance does not reflect the deduction of any applicable sales charges. |
| | 2 | | The Barclays U.S. Credit Index is an unmanaged index which is unbundled into pure corporates (industrial, utility, and finance, including both U.S. and non-U.S. corporations) and non-corporates (sovereign, supranational, foreign agencies, and foreign local governments). The index figures do not reflect any deduction for fees, expenses or taxes. It is not possible to invest directly in an index. |
| | 3 | | The method of calculation of the 30-Day Standardized Subsidized Yield is mandated by the Securities and Exchange Commission and is determined by dividing the net investment income per share earned during the last 30 days of the period by the maximum public offering price (“POP”) per share on the last day of the period. This number is then annualized. The 30-Day Standardized Subsidized Yield reflects fee waivers and/or expense reimbursements recorded by the Fund during the period. Without waivers and/or reimbursements, yields would be reduced. This yield does not necessarily reflect income actually earned and distributed by the Fund and, therefore, may not be correlated with the dividends or other distributions paid to shareholders. The 30-Day Standardized Unsubsidized Yield does not adjust for any fee waivers and/or expense reimbursements in effect. If the Fund does not incur any fee waivers and/or expense reimbursements during the period, the 30-Day Standardized Subsidized Yield and 30-Day Standardized Unsubsidized Yield will be identical. |
| | | | | | | | | | | | | | | | | | | | | | |
| | STANDARDIZED TOTAL RETURNS4 | |
| | | For the period ended 9/30/14 | | One Year | | | Five Years | | | Ten Years | | | Since Inception | | | Inception Date | |
| | Class A | | | 2.82 | % | | | 6.07 | % | | | 4.27 | % | | | 4.46 | % | | | 11/3/03 | |
| | Institutional | | | 7.27 | | | | 7.27 | | | | 5.05 | | | | 5.22 | | | | 11/3/03 | |
| | Class IR | | | 7.17 | | | | N/A | | | | N/A | | | | 5.55 | | | | 7/29/11 | |
| | | Separate Account Institutional | | | 7.27 | | | | 7.28 | | | | 5.09 | | | | 5.25 | | | | 11/3/03 | |
| | 4 | | The Standardized Total Returns are average annual total returns as of the most recent calendar quarter-end. They assume reinvestment of all distributions at NAV. These returns reflect a maximum initial sales charge of 3.75% for Class A Shares. Prior to July 29, 2009, the maximum initial sales charge applicable to Class A Shares was 4.5%, which is not reflected in the average annual total return figures shown. Because Institutional, Separate Account Institutional and Class IR Shares do not involve a sales charge, such a charge is not applied to their Standardized Total Returns. |
The returns set forth in the tables above represent past performance. Past performance does not guarantee future results. The Fund’s investment return and principal value will fluctuate so that an investor’s shares, when redeemed, may be worth more or less than their original cost. Current performance may be lower or higher than the performance quoted above. Please visit our web site at www.GSAMFUNDS.com to obtain the most recent month-end returns. Performance reflects applicable fee waivers and/or expense limitations in effect during the periods shown. In their absence, performance would be reduced. Returns do not reflect the deduction of taxes that a shareholder would pay on Fund distributions or the redemption of Fund shares.
30
FUND BASICS
| | | | | | | | | | |
| | EXPENSE RATIOS5 | |
| | | | | Net Expense Ratio (Current) | | | Gross Expense Ratio (Before Waivers) | |
| | Class A | | | 0.72 | % | | | 0.85 | % |
| | Institutional | | | 0.38 | | | | 0.51 | |
| | Class IR | | | 0.47 | | | | 0.60 | |
| | | Separate Account Institutional | | | 0.38 | | | | 0.51 | |
| | 5 | | The expense ratios of the Fund, both current (net of applicable fee waivers and/or expense limitations) and before waivers (gross of applicable fee waivers and/or expense limitations) are as set forth above according to the most recent publicly available Prospectus for the Fund and may differ from the expense ratios disclosed in the Financial Highlights in this report. Pursuant to a contractual arrangement, the Fund’s waivers and/or expense limitations will remain in place through at least July 29, 2015, and prior to such date the Investment Adviser may not terminate the arrangements without the approval of the Fund’s Board of Trustees. If these arrangements are discontinued in the future, the expense ratios may change without shareholder approval. |
|
| FUND COMPOSITION6 |
| Percentage of Net Assets |
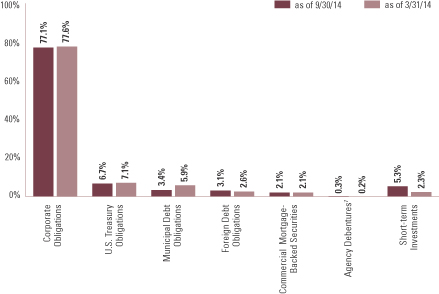
| | 6 | | The percentage shown for each investment category reflects the value of investments in that category as a percentage of net assets. Short-term Investments represents repurchase agreements. Figures in the graph may not sum to 100% due to the exclusion of other assets and liabilities. The graph depicts the Fund’s investments but may not represent the Fund’s market exposure due to the exclusion of certain derivatives, if any, as listed in the Additional Investment Information section of the Schedule of Investments. |
| | 7 | | “Agency Debentures” include agency securities offered by companies such as Federal National Mortgage Association and Federal Home Loan Mortgage Corp., which operate under a government charter. While they are required to report to a government regulator, their assets are not explicitly guaranteed by the government and they otherwise operate similarly to any other publicly traded company. |
31
FUND BASICS
| | | | | | | | | | |
| | TOP TEN INDUSTRY ALLOCATION8 | |
| | | | | Percentage of Net Assets | |
| | | | | as of 9/30/14 | | | as of 3/31/14 | |
| | Banks | | | 17.7 | % | | | 17.5 | % |
| | Real Estate Investment Trusts | | | 7.7 | | | | 7.5 | |
| | Wirelines Telecommunications | | | 5.8 | | | | 6.5 | |
| | Energy | | | 5.5 | | | | 6.4 | |
| | Electric | | | 5.2 | | | | 5.0 | |
| | Pipelines | | | 4.2 | | | | 4.9 | |
| | Media | | | 3.2 | | | | 2.8 | |
| | Brokerage | | | 3.1 | | | | 2.7 | |
| | Insurance | | | 2.8 | | | | 2.9 | |
| | | Food & Beverage | | | 2.8 | | | | 2.5 | |
| | 8 | | The percentage shown for each investment category reflects the value of investments in that category as a percentage of net assets. The table does not include repurchase agreements of 5.3% as of 9/30/14 and 2.3% as of 3/31/14. The table depicts the Fund’s investments but may not represent the Fund’s market exposure due to the exclusion of certain derivatives, if any, as listed in the Additional Investment Information section of the Schedule of Investments. |
32
PORTFOLIO RESULTS
Goldman Sachs Local Emerging
Markets Debt Fund
Investment Objective
The Fund seeks a high level of total return consisting of income and capital appreciation.
Portfolio Management Discussion and Analysis
Below, the Goldman Sachs Global Fixed Income Investment Management Team discusses the Goldman Sachs Local Emerging Markets Debt Fund’s (the “Fund”) performance and positioning for the six-month period ended September 30, 2014 (the “Reporting Period”).
| Q | | How did the Fund perform during the Reporting Period? |
| A | | During the Reporting Period, the Fund’s Class A, C, Institutional and IR Shares generated cumulative total returns, without sales charges, of -1.99%, -2.23%, -1.82% and -1.87%, respectively. These returns compare to the -1.87% cumulative total return of the Fund’s benchmark, the J.P. Morgan Government Bond Index – Emerging Markets (GBI-EMSM) Global Diversified Index (Gross, USD, Unhedged) (the “Index”), during the same time period. |
| Q | | What economic and market factors most influenced local emerging markets debt as a whole during the Reporting Period? |
| A | | When the Reporting Period began during the second quarter of 2014, local emerging markets debt generated positive returns, benefiting from currency appreciation and changes in local interest rates. In the third calendar quarter, local emerging markets debt recorded a modest decline, driven primarily by a sell-off in local currency markets. For the Reporting Period overall, the asset class, as represented by the Index, recorded a negative return, largely due to currency depreciation. Emerging markets currencies, as represented by the J.P. Morgan Emerging Local Markets Plus (ELMI+) Index, declined -1.88%. Among countries, on a total return basis, the weakest performers (in U.S. dollar terms1) during the Reporting Period were Russia (-10.51%), Indonesia (-6.11%) and Hungary (-3.47%). The top performers were Nigeria (+13.19%), Philippines (+6.38%) and Thailand (+2.89%). |
| Q | | What key factors were responsible for the Fund’s performance during the Reporting Period? |
| A | | During the Reporting Period, the Fund was hurt by our issue selection of local emerging markets bonds. The Fund’s U.S. duration and yield curve strategy also detracted. Duration is a measure of the Fund’s sensitivity to changes in interest rates. Yield curve indicates a spectrum of maturities. |
| | On the positive side, the Fund benefited from our active currency management through which the Fund takes positions in local currencies (accomplished through the use of forward foreign currency exchange contracts as well as bonds denominated in local currencies). In addition, our country and issue selection of external emerging markets debt contributed positively. Issue selection of emerging markets corporate bonds and emerging markets quasi-sovereign bonds also added to relative returns. |
| Q | | Which segments of local emerging markets debt most significantly affected Fund performance? |
| A | | During the Reporting Period, the Fund was hindered by an underweight relative to the Index in South Korean local interest rates. The Fund was underweight because we considered valuations rich, but South Korea’s local bonds advanced during the Reporting Period. Also during the Reporting Period, the Fund was hurt by an underweight position in Polish local interest rates. We expected Poland’s economic growth to improve, thereby narrowing the country’s output gap and pushing inflation higher. However, Poland’s economic growth weakened on lower trade with Russia and slower Western European growth. Inflation also remained low, prompting the Polish central bank to cut interest rates. A position in the Polish zloty, accomplished through the use of forward foreign currency exchange contracts, also dampened relative performance. During the Reporting Period, the Fund was hampered by its position in |
| 1 | | All regional and market returns are in U.S. dollar terms (unless otherwise specified), are based on country-specific stock market indices and reflect the reinvestment of any dividends if applicable. |
33
PORTFOLIO RESULTS
| | the Indian rupee, accomplished through the use of forward foreign currency exchange contracts. We had a positive outlook on the Indian rupee because of the Bharatiya Janata Party’s landslide election victory, which we believed would attract capital inflows and help boost economic growth. Instead, the rupee weakened after India’s central bank intervened in the foreign exchange markets. |
| | On the positive side, the Fund benefited from its overweight in Dominican Republic local interest rates accomplished through investments in local emerging markets bonds. The Dominican Republic has reduced its fiscal and current account deficits, and we believe the country will benefit from stronger, more stable economic growth and stable-to-lower oil prices. An overweight in Mexican local interest rates, accomplished through investments in local emerging markets bonds, also added to relative results. In our view, Mexico has a conservative fiscal policy, a prudent monetary policy and an independent central bank. Its new government appears focused on a list of reforms that could improve competitiveness and increase oil production. The Fund also benefited during the Reporting Period from its overweight in Brazilian local interest rates accomplished through investments in a combination of nominal and inflation-linked Brazilian local bonds in both short-term and long-term maturities. We believe Brazil offers some of the highest real interest rates (i.e., the rate of interest an investor can expect to receive after allowing for inflation) in the world. In addition, a position in the Malaysian ringgit, accomplished through the use of forward foreign currency exchange contracts, contributed positively to relative performance. We believed the ringgit would benefit from global economic growth and the efforts of the Malaysian central bank to control inflation. |
| Q | | Did the Fund’s duration and yield curve positioning strategy help or hurt its results during the Reporting Period? |
| A | | During the Reporting Period, the Fund’s U.S. duration and yield curve positioning detracted from relative performance. The Fund held a short duration position relative to the Index, which hurt returns as interest rates fell. |
| Q | | How did the Fund use derivatives and similar instruments during the Reporting Period? |
| A | | The Fund invested in U.S. Treasury futures, Eurodollar futures, forward foreign currency exchange contracts, interest rate swaps, credit default swaps, total return swaps, cross currency swaps, non-deliverable currency forwards and structured notes. U.S. Treasury futures were used to manage U.S. interest rate duration. Eurodollar futures were used to express our views on the direction of interest rates and to facilitate specific duration and yield curve strategies. Eurodollar futures are contracts that have underlying assets linked to time deposits denominated in U.S. dollars at banks outside the U.S. Forward foreign currency exchange contracts were used for hedging purposes or to express a positive view on a given currency. Interest rate swaps were used to express our views on the direction of a country’s interest rates. Cross-currency swaps were employed to express relative value views on given currencies as well as our views on the direction of a country’s interest rates. Credit default swaps were used to implement specific credit-related investment strategies. Total return swaps and structured notes were used in place of buying a local currency denominated bond when a particular market was otherwise inaccessible or as a more efficient means of gaining access to a local market. Non-deliverable currency forwards were used to gain exposure to a particular country and also to take advantage of relative value opportunities. |
| Q | | Were there any notable changes in the Fund’s weightings during the Reporting Period? |
| A | | During the Reporting Period, we shifted the Fund from an underweight relative to the Index in Indonesian local interest rates to an overweight position. We moved the Fund from underweight positions in Hungarian and Polish local interest rates to neutral positions. In addition, we eliminated the Fund’s overweight to Colombia local interest rates, adopting a neutral position compared to the Index. We also reduced the Fund’s overweight in Mexican local interest rates while still maintaining a small overweight position at the end of the Reporting Period. We eliminated the Fund’s position in the Malaysian ringgit during September 2014 after our views about the global growth outlook changed. |
| Q | | How was the Fund positioned relative to its benchmark index at the end of the Reporting Period? |
| A | | At the end of the Reporting Period, the Fund was underweight relative to the Index in select Asian local interest rates, such as South Korea and Malaysia. Although we believe Asia overall is likely to benefit from U.S. economic growth and increased capital expenditures, Asian yield curves were quite flat at the end of the Reporting Period and were not, in our view, pricing in potential growth. We also see relative value opportunities in idiosyncratic mispricings within local emerging markets debt. For example, at the end of the Reporting Period, the Fund was |
34
PORTFOLIO RESULTS
| | overweight Brazilian interest rates because we believe Brazil’s yield curve is steeper than fundamentals would suggest. In addition, at the end of the Reporting Period, we saw opportunities in numerous long/short pairs, with exposure focused on specific currencies rather than on broad sectors. The Fund was long the Indian rupee, Polish zloty and Mexican peso at the end of the Reporting Period; it was short the Hungarian forint and Singapore dollar. |
| Q | | What is the Fund’s tactical view and strategy for the months ahead? |
| A | | During the Reporting Period, local emerging markets debt and local currencies were buffeted by a surging U.S. dollar and a drop in commodities prices. U.S. dollar strength had exacerbated the decline in commodities prices, which also suffered because of excess supply in various segments of the market including wheat, corn and soy. In turn, lower commodities prices hindered the terms of trade of certain emerging countries and erased some of the recent reduction in their current account deficits. (Terms of trade refers to the relative price of exports in terms of imports and is defined as the ratio of export prices to import prices.) Looking ahead, we do not expect local emerging markets debt to repeat the sell-off that occurred in mid-2013 when many investors questioned the attractiveness of emerging markets debt in view of higher U.S. interest rates. At the time, there was a dramatic re-pricing both in local emerging markets debt and in the currency markets of numerous emerging market countries. Brazil, India, Indonesia, South Africa and emerging countries with current account and capital account deficits took the brunt of the weakness. Some of the same countries, specifically Brazil, Indonesia and South Africa, were among the worst currency performers during September 2014. That said, we believe the depreciation of many emerging markets currencies during the Reporting Period should help buffer their economies. In the short term, currency depreciation can improve a country’s balance of payments; over the longer term, it can make exports more competitive and help drive economic growth. At the end of the Reporting Period, we believe valuations in local emerging markets debt were at reasonable levels. |
35
FUND BASICS
Local Emerging Markets Debt Fund
as of September 30, 2014
| | | | | | | | | | | | | | | | | | |
| | PERFORMANCE REVIEW | |
| | | April 1, 2014– September 30, 2014 | | Fund Total Return
(based on NAV)1 | | | J.P. Morgan GBI EMSM Global
Diversified Index2 | | | 30-Day
Standardized
Subsidized Yield3 | | | 30-Day
Standardized
Unsubsidized Yield3 | |
| | Class A | | | -1.99 | % | | | -1.87 | % | | | 4.84 | % | | | 4.68 | % |
| | Class C | | | -2.23 | | | | -1.87 | | | | 4.29 | | | | 4.12 | |
| | Institutional | | | -1.82 | | | | -1.87 | | | | 5.43 | | | | 5.26 | |
| | | Class IR | | | -1.87 | | | | -1.87 | | | | 5.33 | | | | 5.16 | |
| | 1 | | The net asset value (“NAV”) represents the net assets of the class of the Fund (ex-dividend) divided by the total number of shares of the class outstanding. The Fund’s performance assumes the reinvestment of dividends and other distributions. The Fund’s performance does not reflect the deduction of any applicable sales charges. |
| | 2 | | The J.P. Morgan Government Bond Index — Emerging Markets (GBI-EMSM) Global Diversified (Gross, USD, Unhedged) Index is an unmanaged index of debt instruments of 14 emerging countries. The Index figures do not reflect any deduction for fees, expenses or taxes. It is not possible to invest directly in an index. |
| | 3 | | The method of calculation of the 30-Day Standardized Subsidized Yield is mandated by the Securities and Exchange Commission and is determined by dividing the net investment income per share earned during the last 30 days of the period by the maximum public offering price (“POP”) per share on the last day of the period. This number is then annualized. The 30-Day Standardized Subsidized Yield reflects fee waivers and/or expense reimbursements recorded by the Fund during the period. Without waivers and/or reimbursements, yields would be reduced. This yield does not necessarily reflect income actually earned and distributed by the Fund and, therefore, may not be correlated with the dividends or other distributions paid to shareholders. The 30-Day Standardized Unsubsidized Yield does not adjust for any fee waivers and/or expense reimbursements in effect. If the Fund does not incur any fee waivers and/or expense reimbursements during the period, the 30-Day Standardized Subsidized Yield and 30-Day Standardized Unsubsidized Yield will be identical. |
| | | | | | | | | | | | | | | | | | |
| | STANDARDIZED TOTAL RETURNS4 | |
| | | For the period ended 9/30/14 | | One Year | | | Five Year | | | Since Inception | | | Inception Date | |
| | Class A | | | -6.77 | % | | | 2.66 | % | | | 1.54 | % | | | 2/15/08 | |
| | Class C | | | -4.05 | | | | 2.88 | | | | 1.52 | | | | 2/15/08 | |
| | Institutional | | | -2.03 | | | | 3.99 | | | | 2.60 | | | | 2/15/08 | |
| | | Class IR | | | -2.12 | | | | N/A | | | | 2.08 | | | | 7/30/10 | |
| | 4 | | The Standardized Total Returns are average annual total returns as of the most recent calendar quarter-end. They assume reinvestment of all distributions at NAV. These returns reflect a maximum initial sales charge of 4.5% for Class A Shares and the assumed contingent deferred sales charge for Class C Shares (1% if redeemed within 12 months of purchase). Because Institutional and Class IR Shares do not involve a sales charge, such a charge is not applied to their Standardized Total Returns. The Fund will charge a 2% redemption fee on the redemption of shares (including by exchange) held for 30 calendar days or less. The performance figures do not reflect the deduction of the redemption fee. If reflected, the redemption fee would reduce the performance quoted. |
The returns set forth in the tables above represent past performance. Past performance does not guarantee future results. The Fund’s investment return and principal value will fluctuate so that an investor’s shares, when redeemed, may be worth more or less than their original cost. Current performance may be lower or higher than the performance quoted above. Please visit our web site at www.GSAMFUNDS.com to obtain the most recent month-end returns. Performance reflects applicable fee waivers and/or expense limitations in effect during the periods shown. In their absence, performance would be reduced. Returns do not reflect the deduction of taxes that a shareholder would pay on Fund distributions or the redemption of Fund shares.
36
FUND BASICS
| | | | | | | | | | |
| | EXPENSE RATIOS5 | |
| | | | | Net Expense Ratio (Current) | | | Gross Expense Ratio (Before Waivers) | |
| | Class A | | | 1.25 | % | | | 1.36 | % |
| | Class C | | | 2.01 | | | | 2.12 | |
| | Institutional | | | 0.92 | | | | 1.02 | |
| | | Class IR | | | 1.01 | | | | 1.11 | |
| | 5 | | The expense ratios of the Fund, both current (net of applicable fee waivers and/or expense limitations) and before waivers (gross of applicable fee waivers and/or expense limitations) are as set forth above according to the most recent publicly available Prospectus for the Fund and may differ from the expense ratios disclosed in the Financial Highlights in this report. Pursuant to a contractual arrangement, the Fund’s waivers and/or expense limitations will remain in place through at least July 29, 2015, and prior to such date the Investment Adviser may not terminate the arrangements without the approval of the Fund’s Board of Trustees. If these arrangements are discontinued in the future, the expense ratios may change without shareholder approval. |
| | | | | | |
| | TOP TEN COUNTRY ALLOCATION6 | |
| | | | | Percentage of
Net Assets
as of 9/30/14 | |
| | Brazil | | | 11.4 | % |
| | Indonesia | | | 8.7 | |
| | Colombia | | | 7.8 | |
| | Malaysia | | | 6.8 | |
| | Turkey | | | 6.6 | |
| | Poland | | | 6.5 | |
| | United States | | | 6.5 | |
| | Mexico | | | 6.3 | |
| | Russia | | | 6.0 | |
| | | Thailand | | | 4.8 | |
| | 6 | | The percentage shown for each investment category reflects the value of investments in that country as a percentage of net assets. The table does not include repurchase agreements of 7.0% as of 9/30/14. The table depicts the Fund’s investments but may not represent the Fund’s market exposure due to the exclusion of certain derivatives, if any, as listed in the Additional Investment Information section of the Schedule of Investments. |
37
PORTFOLIO RESULTS
Goldman Sachs U.S. Mortgages Fund
Investment Objective
The Fund seeks a high level of total return consisting of income and capital appreciation.
Portfolio Management Discussion and Analysis
Below, the Goldman Sachs U.S. Fixed Income Investment Management Team discusses the Goldman Sachs U.S. Mortgages Fund’s (the “Fund”) performance and positioning for the six-month period ended September 30, 2014 (the “Reporting Period”).
| Q | | How did the Fund perform during the Reporting Period? |
| A | | During the Reporting Period, the Fund’s Class A, Institutional, IR and Separate Account Institutional Shares generated cumulative total returns, without sales charges, of 2.37%, 2.64%, 2.50% and 2.55%, respectively. These returns compare to the 2.48% cumulative total return of the Fund’s benchmark, the Barclays U.S. Securitized Bond Index (with dividends reinvested) (the “Index”), during the same time period. |
| Q | | What economic and market factors most influenced the U.S. mortgage markets as a whole during the Reporting Period? |
| A | | During the second quarter of 2014 when the Reporting Period began, the mortgage-backed securities market rallied as robust demand outstripped supply. Mortgage-backed securities spreads (or yield differentials versus U.S. Treasury securities) tightened on muted housing activity and limited supply. In the third calendar quarter, mortgage-backed securities retraced some of their gains. Mortgage-backed securities spreads versus U.S. Treasury securities widened as continued Federal Reserve (“Fed”) tapering of asset purchases increased supply. In September 2014, mortgage-backed securities performed well, as the Fed reassured the market it would continue reinvesting the principal payments from its agency mortgage-backed securities holdings. |
| Q | | What key factors were responsible for the Fund’s performance during the Reporting Period? |
| A | | During the Reporting Period, the Fund benefited from its position in the securitized sector. Our cross-sector strategy also enhanced relative returns. In our cross-sector strategy, we invest Fund assets across a variety of fixed income sectors, including some that may not be included in the Fund’s benchmark. |
| | | The management of the Fund’s duration and yield curve positioning detracted modestly from relative returns. Duration is a measure of the Fund’s sensitivity to changes in interest rates. Yield curve indicates a spectrum of maturities. |
| Q | | Which segments of the U.S. mortgage-backed securities sector most significantly affected Fund performance? |
| A | | Issue selection in the securitized sector added to the Fund’s relative performance. More specifically, the Fund benefited from issue selection among agency mortgage-backed securities and its positioning in the coupon stack (i.e., across securities with different coupons). Early in the Reporting Period, the Fund was overweight relative to the Index in higher coupon agency mortgage-backed securities (or those with higher interest rates), which added to returns as higher coupon agency mortgage-backed securities benefited from lower prepayment speeds. The Fund also benefited from its overweight relative to the Index in commercial mortgage-backed securities (“CMBS”). In addition, issue selection of CMBS contributed positively. |
| | Additionally, individual issue selection among government securities enhanced returns. |
| Q | | Did the Fund’s duration and yield curve positioning strategy help or hurt its results during the Reporting Period? |
| A | | During the Reporting Period, the Fund’s underweighted position toward the front, or short-term, end of the U.S. Treasury yield curve modestly detracted from performance, especially as interest rates decreased during April, May and August 2014. |
| Q | | How did the Fund use derivatives and similar instruments during the Reporting Period? |
| A | | The Fund used U.S. Treasury futures to hedge interest rate exposure and to facilitate specific duration and yield curve |
38
PORTFOLIO RESULTS
| | strategies. It used Eurodollar futures to express our views on the direction of interest rates and to facilitate specific duration and yield curve strategies. Eurodollar futures are contracts that have underlying assets linked to time deposits denominated in U.S. dollars at banks outside the U.S. Interest rate swaps were used to hedge interest rate exposure and express an outright term structure view. (Term structure, most often depicted as a yield curve, refers to the terms structure of interest rates, which is the relationship between the yield to the maturity and the time to maturity for pure discount bonds.) The Fund used mortgage-backed securities forward agreements (known as “TBAs”) to efficiently manage certain of its mortgage-backed securities positions. It used swaptions to hedge volatility and yield curve risks in the Fund and/or to express tactical views on rate markets. |
| Q | | Were there any notable changes in the Fund’s weightings during the Reporting Period? |
| A | | For most of the Reporting Period, the Fund generally held an underweight relative to the Index in agency mortgage-backed securities — occasionally shifting the size of that underweight position — as we deemed necessary, based on our views of potential market reaction to Fed tapering comments and developments affecting the mortgage-backed securities market, such as news about issuance. In addition, we increased the Fund’s short duration bias during the Reporting Period. |
| Q | | How was the Fund positioned relative to its benchmark index at the end of the Reporting Period? |
| A | | At the end of the Reporting Period, the Fund was overweight relative to the Index in CMBS. It was underweight compared to the Index in pass-through mortgage-backed securities and asset-backed securities. (Pass-through mortgage securities consist of a pool of residential mortgage loans, where homeowners’ monthly payments of principal, interest and prepayments pass from the original bank through a government agency or investment bank to investors.) At the end of the Reporting Period, the Fund also had positions in agency collateralized mortgage obligations and Federal Family Education Loan Program (“FFELP”) student loan asset-backed securities, which are not represented in the Index. |
| Q | | What is the Fund’s tactical view and strategy for the months ahead? |
| A | | At the end of the Reporting Period, we expected to maintain the Fund’s underweight allocation to agency mortgage-backed securities, as we believe an increase in supply through the end of 2014 could push mortgage-backed securities spreads wider. Within the Fund’s underweight position, we favor higher coupon agency mortgage-backed securities because we believe prepayment rates should remain relatively benign and volatility may continue to increase within the mortgage-backed securities market. Elsewhere, we favor senior collateralized loan obligations, based on our view that corporate default rates will likely remain low. We continue to see attractive opportunities within non-agency residential mortgage-backed securities, as borrower performance continues to improve. In addition, we continue to find value in certain legacy CMBS (in general, CMBS that were issued in 2006 or earlier) as well as certain single-asset, single-loan CMBS. (Single-asset, single-loan CMBS have a relatively small number of underlying loans or issuers, often only one.) |
39
FUND BASICS
U.S. Mortgages Fund
as of September 30, 2014
| | | | | | | | | | | | | | | | | | |
| | PERFORMANCE REVIEW | |
| | | April 1, 2014– September 30, 2014 | | Fund Total Return
(based on NAV)1 | | | Barclays U.S.
Securitized
Bond Index2 | | | 30-Day
Standardized
Subsidized Yield3 | | | 30-Day
Standardized
Unsubsidized Yield3 | |
| | Class A | | | 2.37 | % | | | 2.48 | % | | | 1.33 | % | | | 1.08 | % |
| | Institutional | | | 2.64 | | | | 2.48 | | | | 1.74 | | | | 1.49 | |
| | Class IR | | | 2.50 | | | | 2.48 | | | | 1.63 | | | | 1.37 | |
| | | Separate Account Institutional | | | 2.55 | | | | 2.48 | | | | 1.74 | | | | 1.49 | |
| | 1 | | The net asset value (“NAV”) represents the net assets of the class of the Fund (ex-dividend) divided by the total number of shares of the class outstanding. The Fund’s performance assumes the reinvestment of dividends and other distributions. The Fund’s performance does not reflect the deduction of any applicable sales charges. |
| | 2 | | The Barclays U.S. Securitized Bond Index (with dividends reinvested) is an unmanaged composite of asset-backed securities, collateralized mortgage-backed securities and fixed rate mortgage-backed securities. The index figures do not reflect any deduction for fees, expenses or taxes. It is not possible to invest directly in an index. |
| | 3 | | The method of calculation of the 30-Day Standardized Subsidized Yield is mandated by the Securities and Exchange Commission and is determined by dividing the net investment income per share earned during the last 30 days of the period by the maximum public offering price (“POP”) per share on the last day of the period. This number is then annualized. The 30-Day Standardized Subsidized Yield reflects fee waivers and/or expense reimbursements recorded by the Fund during the period. Without waivers and/or reimbursements, yields would be reduced. This yield does not necessarily reflect income actually earned and distributed by the Fund and, therefore, may not be correlated with the dividends or other distributions paid to shareholders. The 30-Day Standardized Unsubsidized Yield does not adjust for any fee waivers and/or expense reimbursements in effect. If the Fund does not incur any fee waivers and/or expense reimbursements during the period, the 30-Day Standardized Subsidized Yield and 30-Day Standardized Unsubsidized Yield will be identical. |
| | | | | | | | | | | | | | | | | | | | | | |
| | STANDARDIZED TOTAL RETURNS4 | |
| | | For the period ended 9/30/14 | | One Year | | | Five Years | | | Ten Years | | | Since Inception | | | Inception Date | |
| | Class A | | | 0.23 | % | | | 3.44 | % | | | 3.66 | % | | | 3.81 | % | | | 11/3/03 | |
| | Institutional | | | 4.53 | | | | 4.63 | | | | 4.45 | | | | 4.57 | | | | 11/3/03 | |
| | Class IR | | | 4.43 | | | | N/A | | | | N/A | | | | 3.52 | | | | 7/29/11 | |
| | | Separate Account Institutional | | | 4.43 | | | | 4.60 | | | | 4.47 | | | | 4.58 | | | | 11/3/03 | |
| | 4 | | The Standardized Total Returns are average annual total returns as of the most recent calendar quarter-end. They assume reinvestment of all distributions at NAV. These returns reflect a maximum initial sales charge of 3.75% for Class A Shares. Prior to July 29, 2009, the maximum initial sales charge applicable to Class A Shares was 4.5%, which is not reflected in the average annual return figures shown. Because Institutional, Separate Account Institutional and Class IR Shares do not involve a sales charge, such a charge is not applied to their Standardized Total Returns. |
The returns set forth in the tables above represent past performance. Past performance does not guarantee future results. The Fund’s investment return and principal value will fluctuate so that an investor’s shares, when redeemed, may be worth more or less than their original cost. Current performance may be lower or higher than the performance quoted above. Please visit our web site at www.GSAMFUNDS.com to obtain the most recent month-end returns. Performance reflects applicable fee waivers and/or expense limitations in effect during the periods shown. In their absence, performance would be reduced. Returns do not reflect the deduction of taxes that a shareholder would pay on Fund distributions or the redemption of Fund shares.
40
FUND BASICS
| | | | | | | | | | |
| | EXPENSE RATIOS5 | |
| | | | | Net Expense Ratio (Current) | | | Gross Expense Ratio (Before Waivers) | |
| | Class A | | | 0.72 | % | | | 0.96 | % |
| | Institutional | | | 0.38 | | | | 0.63 | |
| | Class IR | | | 0.49 | | | | 0.73 | |
| | | Separate Account Institutional | | | 0.38 | | | | 0.62 | |
| | 5 | | The expense ratios of the Fund, both current (net of applicable fee waivers and/or expense limitations) and before waivers (gross of applicable fee waivers and/or expense limitations) are as set forth above according to the most recent publicly available Prospectus for the Fund and may differ from the expense ratios disclosed in the Financial Highlights in this report. Pursuant to a contractual arrangement, the Fund’s waivers and/or expense limitations will remain in place through at least July 29, 2015, and prior to such date the Investment Adviser may not terminate the arrangements without the approval of the Fund’s Board of Trustees. If these arrangements are discontinued in the future, the expense ratios may change without shareholder approval. |
|
| FUND COMPOSITION6 |
| Percentage of Net Assets |
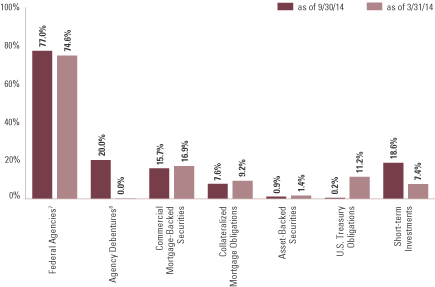
| | 6 | | The percentage shown for each investment category reflects the value of investments in that category as a percentage of net assets. Short-term Investments represents repurchase agreements. Figures in the graph may not sum to 100% due to the exclusion of other assets and liabilities. The graph depicts the Fund’s investments but may not represent the Fund’s market exposure due to the exclusion of certain derivatives, if any, as listed in the Additional Investment Information section of the Schedule of Investments. |
| | 7 | | “Federal Agencies” are mortgage-backed securities guaranteed by the Government National Mortgage Association (“GNMA”), Federal National Mortgage Association (“FNMA”) and Federal Home Loan Mortgage Corp. (“FHLMC”). GNMA instruments are backed by the full faith and credit of the U.S. Government. |
| | 8 | | “Agency Debentures” include agency securities offered by companies such as FNMA and FHLMC, which operate under a government charter. While they are required to report to a government regulator, their assets are not explicitly guaranteed by the government and they otherwise operate like any other publicly traded company. |
41
GOLDMAN SACHS DYNAMIC EMERGING MARKETS DEBT FUND
Schedule of Investments
September 30, 2014 (Unaudited)
| | | | | | | | | | | | | | |
Principal
Amount | | | Interest
Rate | | | Maturity
Date | | | Value | |
| | | | | | | | | | | | | | |
| | Sovereign Debt Obligations – 56.6% | |
| | Argentina(a) – 0.9% | |
| Republic of Argentina (NR/NR) | |
| $ | 3,010,000 | | | | 0.000 | % | | | 12/15/35 | | | $ | 228,760 | |
| EUR | 160,000 | | | | 0.000 | | | | 12/15/35 | | | | 14,955 | |
| | | | | | | | | | | | | | |
| | | | | | | | | | | | | 243,715 | |
| | |
| | Brazil – 3.5% | |
| Brazil Letras do Tesouro Nacional (BBB+/Baa2) | |
| BRL | 2,000 | | | | 0.000 | (b) | | | 01/01/15 | | | | 795 | |
| Brazil Notas do Tesouro Nacional (BBB+/Baa2) | |
| | 155,213 | | | | 6.000 | | | | 08/15/22 | | | | 63,425 | |
| | 1,308,000 | | | | 10.000 | | | | 01/01/23 | | | | 470,573 | |
| | 1,172,720 | | | | 6.000 | | | | 08/15/50 | | | | 462,125 | |
| | | | | | | | | | | | | | |
| | | | | | | | | | | | | 996,918 | |
| | |
| | Bulgaria – 0.4% | |
| Republic of Bulgaria (BBB-/Baa2) | |
| EUR | 100,000 | | | | 2.950 | | | | 09/03/24 | | | | 126,463 | |
| | |
| | Colombia – 2.7% | |
| Republic of Colombia (BBB+/Baa2) | |
| COP | 222,800,000 | | | | 8.000 | | | | 10/28/15 | | | | 113,573 | |
| | 12,300,000 | | | | 11.250 | | | | 10/24/18 | | | | 7,247 | |
| | 992,700,000 | | | | 7.000 | | | | 05/04/22 | | | | 496,190 | |
| | 13,700,000 | | | | 7.500 | | | | 08/26/26 | | | | 6,906 | |
| | 372,900,000 | | | | 6.000 | | | | 04/28/28 | | | | 163,430 | |
| | | | | | | | | | | | | | |
| | | | | | | | | | | | | 787,346 | |
| | |
| | Costa Rica – 0.3% | |
| Republic of Costa Rica (BB/Ba1) | |
| $ | 70,000 | | | | 9.995 | | | | 08/01/20 | | | | 88,550 | |
| | |
| | Croatia – 1.7% | |
| Republic of Croatia (BB/Ba1) | |
| | 470,000 | | | | 6.250 | | | | 04/27/17 | | | | 499,375 | |
| | |
| | Dominican Republic – 0.9% | |
| Dominican Republic (NR/NR) | |
| DOP | 5,700,000 | | | | 14.500 | | | | 02/10/23 | | | | 149,533 | |
| | 300,000 | | | | 18.500 | | | | 02/04/28 | | | | 9,248 | |
| Dominican Republic (B+/B1)(c) | |
| $ | 100,000 | | | | 7.450 | | | | 04/30/44 | | | | 107,000 | |
| | | | | | | | | | | | | | |
| | | | | | | | | | | | | 265,781 | |
| | |
| | El Salvador – 0.1% | |
| El Salvador Government International Bond (BB-/Ba3) | |
| | 20,000 | | | | 6.375 | (c) | | | 01/18/27 | | | | 20,000 | |
| | 10,000 | | | | 7.650 | | | | 06/15/35 | | | | 10,700 | |
| | 10,000 | | | | 7.650 | (c) | | | 06/15/35 | | | | 10,700 | |
| | | | | | | | | | | | | | |
| | | | | | | | | | | | | 41,400 | |
| | |
| | Gabon – 0.4% | |
| Republic of Gabon (BB-/NR) | |
| | 100,000 | | | | 8.200 | | | | 12/12/17 | | | | 113,100 | |
| | |
| | Ghana(c) – 0.7% | |
| Republic of Ghana (B/B2) | |
| | 200,000 | | | | 8.125 | | | | 01/18/26 | | | | 200,500 | |
| | |
| | | | | | | | | | | | | | |
| | Sovereign Debt Obligations – (continued) | |
| | Hungary – 1.1% | |
| Hungary Government Bond (BB/NR) | |
| HUF | 170,000 | | | | 5.500 | % | | | 06/24/25 | | | $ | 737 | |
| Hungary Government Bond (BB/Ba1) | |
| | 9,340,000 | | | | 7.500 | | | | 11/12/20 | | | | 45,041 | |
| $ | 50,000 | | | | 4.000 | | | | 03/25/19 | | | | 51,063 | |
| HUF | 4,380,000 | | | | 6.000 | | | | 11/24/23 | | | | 19,738 | |
| | 29,760,000 | | | | 6.500 | | | | 06/24/19 | | | | 135,495 | |
| | 5,700,000 | | | | 7.000 | | | | 06/24/22 | | | | 27,034 | |
| | 4,980,000 | | | | 5.500 | | | | 12/20/18 | | | | 21,966 | |
| | | | | | | | | | | | | | |
| | | | | | | | | | | | | 301,074 | |
| | |
| | Indonesia – 2.9% | |
| Indonesia Government Bond (NR/Baa3) | |
| IDR | 1,000,000,000 | | | | 5.625 | | | | 05/15/23 | | | | 67,706 | |
| | 2,343,000,000 | | | | 6.125 | | | | 05/15/28 | | | | 150,079 | |
| Republic of Indonesia (BB+/Baa3) | |
| $ | 140,000 | | | | 5.875 | | | | 03/13/20 | | | | 153,825 | |
| | 240,000 | | | | 5.875 | (c) | | | 01/15/24 | | | | 264,000 | |
| | 210,000 | | | | 5.250 | | | | 01/17/42 | | | | 201,600 | |
| | | | | | | | | | | | | | |
| | | | | | | | | | | | | 837,210 | |
| | |
| | Israel(b) – 0.9% | |
| Israel Government Bond (NR/NR) | |
| ILS | 940,000 | | | | 0.000 | | | | 05/06/15 | | | | 254,924 | |
| | |
| | Ivory Coast(c) – 0.7% | |
| Ivory Coast Government International Bond (NR/B1) | |
| $ | 200,000 | | | | 5.375 | | | | 07/23/24 | | | | 190,000 | |
| | |
| | Lithuania – 0.4% | |
| Republic of Lithuania (A-/Baa1) | |
| | 100,000 | | | | 7.375 | | | | 02/11/20 | | | | 120,482 | |
| | |
| | Malaysia – 2.8% | |
| Federation of Malaysia (NR/NR)(b) | |
| MYR | 1,730,000 | | | | 0.000 | | | | 01/20/15 | | | | 522,181 | |
| Malaysia Government Bond (NR/A3) | |
| | 120,000 | | | | 4.160 | | | | 07/15/21 | | | | 37,227 | |
| Malaysia Government Bond (NR/NR) | |
| | 50,000 | | | | 3.418 | | | | 08/15/22 | | | | 14,734 | |
| | 110,000 | | | | 3.480 | | | | 03/15/23 | | | | 32,512 | |
| | 160,000 | | | | 3.889 | | | | 07/31/20 | | | | 48,966 | |
| | 130,000 | | | | 4.181 | | | | 07/15/24 | | | | 40,482 | |
| | 10,000 | | | | 4.048 | | | | 09/30/21 | | | | 3,091 | |
| | 290,000 | | | | 3.654 | | | | 10/31/19 | | | | 88,277 | |
| | | | | | | | | | | | | | |
| | | | | | | | | | | | | 787,470 | |
| | |
| | Mexico – 7.4% | |
| United Mexican States (BBB+/A3) | |
| $ | 220,000 | | | | 3.625 | | | | 03/15/22 | | | | 223,300 | |
| United Mexican States (NR/A3) | |
| MXN | 7,813,900 | | | | 4.750 | | | | 06/14/18 | | | | 578,057 | |
| United Mexican States (A/A3) | |
| | 66,100 | | | | 8.500 | | | | 05/31/29 | | | | 5,816 | |
| | 202,700 | | | | 7.500 | | | | 06/03/27 | | | | 16,527 | |
| | 521,400 | | | | 8.500 | | | | 11/18/38 | | | | 45,972 | |
| | 1,848,300 | | | | 10.000 | | | | 11/20/36 | | | | 186,496 | |
| | 2,964,400 | | | | 8.000 | | | | 12/07/23 | | | | 250,655 | |
| | 625,061 | | | | 5.000 | | | | 06/16/16 | | | | 50,551 | |
| | |
| | |
| 42 | | The accompanying notes are an integral part of these financial statements. |
GOLDMAN SACHS DYNAMIC EMERGING MARKETS DEBT FUND
| | | | | | | | | | | | | | |
Principal
Amount | | | Interest
Rate | | | Maturity
Date | | | Value | |
| | | | | | | | | | | | | | |
| | Sovereign Debt Obligations – (continued) | |
| | Mexico – (continued) | |
| United Mexican States (A/A3) – (continued) | |
| MXN | 168,823 | | | | 3.500 | % | | | 12/14/17 | | | $ | 13,622 | |
| | 1,350,000 | | | | 8.500 | | | | 12/13/18 | | | | 113,691 | |
| | 1,236,600 | | | | 7.750 | | | | 12/14/17 | | | | 100,481 | |
| | 1,044,100 | | | | 10.000 | | | | 12/05/24 | | | | 100,771 | |
| United Mexican States (NR/NR)(b) | |
| | 5,729,630 | | | | 0.000 | | | | 10/16/14 | | | | 425,478 | |
| | 79,350 | | | | 0.000 | | | | 12/24/14 | | | | 5,860 | |
| | | | | | | | | | | | | | |
| | | | | | | | | | | | | 2,117,277 | |
| | |
| | Nigeria – 0.8% | |
| Nigeria Government Bond (NR/NR)(b) | |
| NGN | 11,820,000 | | | | 0.000 | | | | 05/07/15 | | | | 67,684 | |
| Nigeria Government Bond(b) | |
| | 4,850,000 | | | | 0.000 | | | | 06/04/15 | | | | 27,525 | |
| Nigeria Government Bond (NR/NR) | |
| | 14,120,000 | | | | 0.000 | (b) | | | 09/03/15 | | | | 78,005 | |
| | 6,490,000 | | | | 16.000 | | | | 06/29/19 | | | | 45,202 | |
| | | | | | | | | | | | | | |
| | | | | | | | | | | | | 218,416 | |
| | |
| | Panama – 0.8% | |
| Panama Notas del Tesoro (NR/NR) | |
| $ | 30,000 | | | | 4.875 | | | | 02/05/21 | | | | 31,616 | |
| Republic of Panama (BBB/Baa2) | |
| | 100,000 | | | | 7.125 | | | | 01/29/26 | | | | 125,750 | |
| | 50,000 | | | | 8.875 | | | | 09/30/27 | | | | 71,125 | |
| | | | | | | | | | | | | | |
| | | | | | | | | | | | | 228,491 | |
| | |
| | Paraguay – 1.1% | |
| Republic of Paraguay (BB/Ba2) | |
| | 200,000 | | | | 4.625 | | | | 01/25/23 | | | | 203,500 | |
| | 100,000 | | | | 6.100 | (c) | | | 08/11/44 | | | | 105,750 | |
| | | | | | | | | | | | | | |
| | | | | | | | | | | | | 309,250 | |
| | |
| | Peru – 0.7% | |
| Republic of Peru (BBB+/A3) | |
| | 170,000 | | | | 8.375 | | | | 05/03/16 | | | | 188,496 | |
| Republic of Peru (A-/A3) | |
| PEN | 4,000 | | | | 8.200 | | | | 08/12/26 | | | | 1,650 | |
| | 4,000 | | | | 6.900 | | | | 08/12/37 | | | | 1,396 | |
| Republic of Peru (NR/A3) | |
| | 1,000 | | | | 6.950 | | | | 08/12/31 | | | | 359 | |
| | | | | | | | | | | | | | |
| | | | | | | | | | | | | 191,901 | |
| | |
| | Philippines – 0.5% | |
| Republic of Philippines (BBB/Baa3) | |
| $ | 110,000 | | | | 6.375 | | | | 10/23/34 | | | | 138,600 | |
| | |
| | Poland – 3.3% | |
| Poland Government Bond (A/NR) | |
| PLN | 710,000 | | | | 3.250 | | | | 07/25/19 | | | | 222,755 | |
| | 560,000 | | | | 3.250 | | | | 07/25/25 | | | | 172,252 | |
| Poland Government Bond (A/A2) | |
| | 150,000 | | | | 5.250 | | | | 10/25/20 | | | | 52,047 | |
| | 148,000 | | | | 5.750 | | | | 10/25/21 | | | | 53,126 | |
| | 1,030,000 | | | | 5.750 | | | | 09/23/22 | | | | 373,803 | |
| | 210,000 | | | | 4.000 | | | | 10/25/23 | | | | 68,403 | |
| | | | | | | | | | | | | | |
| | | | | | | | | | | | | 942,386 | |
| | |
| | | | | | | | | | | | | | |
| | Sovereign Debt Obligations – (continued) | |
| | Romania – 1.4% | |
| Republic of Romania (NR/NR) | |
| RON | 250,000 | | | | 5.900 | % | | | 07/26/17 | | | $ | 77,014 | |
| | 200,000 | | | | 4.750 | | | | 06/24/19 | | | | 60,505 | |
| | 270,000 | | | | 5.950 | | | | 06/11/21 | | | | 85,942 | |
| | 20,000 | | | | 5.850 | | | | 04/26/23 | | | | 6,424 | |
| Republic of Romania (BBB-/Baa3) | |
| EUR | 60,000 | | | | 4.875 | | | | 11/07/19 | | | | 85,976 | |
| | 30,000 | | | | 3.625 | | | | 04/24/24 | | | | 40,356 | |
| | 40,000 | | | | 4.625 | | | | 09/18/20 | | | | 57,248 | |
| | | | | | | | | | | | | | |
| | | | | | | | | | | | | 413,465 | |
| | |
| | Russia – 4.1% | |
| Russian Federation Bond (BBB/Baa1) | |
| RUB | 4,610,000 | | | | 7.600 | | | | 07/20/22 | | | | 105,285 | |
| | 280,000 | | | | 7.600 | | | | 04/14/21 | | | | 6,498 | |
| | 2,500,000 | | | | 7.000 | | | | 08/16/23 | | | | 54,570 | |
| Russian Federation Bond (NR/Baa1) | |
| | 6,900,000 | | | | 7.050 | | | | 01/19/28 | | | | 145,264 | |
| | 12,550,000 | | | | 7.000 | | | | 01/25/23 | | | | 274,441 | |
| Russian Federation Bond (BBB-/Baa1) | |
| $ | 400,000 | | | | 4.875 | | | | 09/16/23 | | | | 393,000 | |
| | 200,000 | | | | 4.500 | | | | 04/04/22 | | | | 194,250 | |
| | | | | | | | | | | | | | |
| | | | | | | | | | | | | 1,173,308 | |
| | |
| | South Africa – 4.9% | |
| Republic of South Africa (NR/Baa1) | |
| ZAR | 780,000 | | | | 7.000 | | | | 02/28/31 | | | | 58,725 | |
| | 2,140,000 | | | | 6.750 | | | | 03/31/21 | | | | 178,764 | |
| Republic of South Africa (BBB+/Baa1) | |
| | 340,000 | | | | 8.000 | | | | 12/21/18 | | | | 30,627 | |
| | 1,362,000 | | | | 7.250 | | | | 01/15/20 | | | | 118,108 | |
| Republic of South Africa (BBB-/Baa1) | |
| $ | 200,000 | | | | 5.375 | | | | 07/24/44 | | | | 199,750 | |
| | 150,000 | | | | 5.875 | | | | 05/30/22 | | | | 165,375 | |
| Republic of South Africa (NR/NR) | |
| ZAR | 700,000 | | | | 8.750 | | | | 02/28/48 | | | | 60,411 | |
| | 3,130,000 | | | | 8.000 | | | | 01/31/30 | | | | 260,305 | |
| | 3,240,000 | | | | 8.250 | | | | 03/31/32 | | | | 269,796 | |
| | 670,000 | | | | 8.750 | | | | 01/31/44 | | | | 57,246 | |
| | | | | | | | | | | | | | |
| | | | | | | | | | | | | 1,399,107 | |
| | |
| | Sri Lanka(c) – 0.7% | |
| Republic of Sri Lanka (B+/B1) | |
| $ | 200,000 | | | | 6.000 | | | | 01/14/19 | | | | 209,250 | |
| | |
| | Thailand – 3.2% | |
| Thailand Government Bond (NR/Baa1) | |
| THB | 9,010,000 | | | | 3.450 | | | | 03/08/19 | | | | 282,664 | |
| | 722,631 | | | | 1.250 | | | | 03/12/28 | | | | 20,539 | |
| Thailand Government Bond (A-/Baa1) | |
| | 4,980,000 | | | | 3.625 | | | | 06/16/23 | | | | 156,452 | |
| | 3,443,296 | | | | 1.200 | | | | 07/14/21 | | | | 103,141 | |
| | 5,215,000 | | | | 3.650 | | | | 12/17/21 | | | | 165,117 | |
| | 5,730,000 | | | | 3.875 | | | | 06/13/19 | | | | 183,863 | |
| | | | | | | | | | | | | | |
| | | | | | | | | | | | | 911,776 | |
| | |
| | |
| The accompanying notes are an integral part of these financial statements. | | 43 |
GOLDMAN SACHS DYNAMIC EMERGING MARKETS DEBT FUND
Schedule of Investments (continued)
September 30, 2014 (Unaudited)
| | | | | | | | | | | | | | |
Principal
Amount | | | Interest
Rate | | | Maturity
Date | | | Value | |
| | | | | | | | | | | | | | |
| | Sovereign Debt Obligations – (continued) | |
| | Turkey – 5.1% | |
| Republic of Turkey (NR/Baa3) | |
| $ | 100,000 | | | | 5.625 | % | | | 03/30/21 | | | $ | 106,250 | |
| | 200,000 | | | | 5.750 | | | | 03/22/24 | | | | 212,000 | |
| Turkey Government Bond (NR/NR) | |
| TRY | 525,000 | | | | 6.500 | | | | 01/07/15 | | | | 228,825 | |
| | 305,000 | | | | 5.000 | | | | 05/13/15 | | | | 130,176 | |
| | 150,000 | | | | 9.000 | | | | 03/08/17 | | | | 65,214 | |
| | 450,000 | | | | 8.300 | | | | 06/20/18 | | | | 189,810 | |
| | 550,000 | | | | 8.800 | | | | 11/14/18 | | | | 235,252 | |
| | 340,000 | | | | 10.400 | | | | 03/27/19 | | | | 153,643 | |
| | 260,000 | | | | 8.500 | | | | 07/10/19 | | | | 109,154 | |
| | 60,000 | | | | 7.100 | | | | 03/08/23 | | | | 22,369 | |
| | | | | | | | | | | | | | |
| | | | | | | | | | | | | 1,452,693 | |
| | |
| | Ukraine – 0.7% | |
| Ukraine Government Bond (CCC/Caa3) | |
| $ | 150,000 | | | | 6.580 | | | | 11/21/16 | | | | 127,500 | |
| | 100,000 | | | | 6.750 | | | | 11/14/17 | | | | 84,750 | |
| | | | | | | | | | | | | | |
| | | | | | | | | | | | | 212,250 | |
| | |
| | Uruguay – 1.1% | |
| Republic of Uruguay (BBB-/Baa2) | |
| | 270,911 | | | | 4.500 | | | | 08/14/24 | | | | 283,779 | |
| | 40,000 | | | | 5.100 | | | | 06/18/50 | | | | 38,800 | |
| | | | | | | | | | | | | | |
| | | | | | | | | | | | | 322,579 | |
| | |
| | Venezuela – 0.4% | |
| Republic of Venezuela (CCC+/Caa1) | |
| | 110,000 | | | | 7.750 | | | | 10/13/19 | | | | 78,375 | |
| | 39,000 | | | | 9.250 | | | | 09/15/27 | | | | 27,982 | |
| | 10,000 | | | | 9.250 | | | | 05/07/28 | | | | 6,850 | |
| | | | | | | | | | | | | | |
| | | | | | | | | | | | | 113,207 | |
| | |
| | TOTAL SOVEREIGN DEBT OBLIGATIONS | |
| | (Cost $16,752,522) | | | $ | 16,208,264 | |
| | |
| | | | | | | | | | | | | | |
| | Corporate Obligations – 28.4% | |
| | Brazil – 1.4% | |
| Banco do Estado do Rio Grande do Sul SA (NR/Ba1) | |
| $ | 200,000 | | | | 7.375 | % | | | 02/02/22 | | | $ | 208,858 | |
| Brazil Minas SPE via State of Minas Gerais (BBB-/NR) | |
| | 200,000 | | | | 5.333 | | | | 02/15/28 | | | | 198,000 | |
| | | | | | | | | | | | | | |
| | | | | | | | | | | | | 406,858 | |
| | |
| | British Virgin Islands – 0.3% | |
| Arcos Dorados Holdings, Inc. (NR/Ba2) | |
| | 100,000 | | | | 6.625 | | | | 09/27/23 | | | | 97,250 | |
| | |
| | Canada – 1.2% | |
| Pacific Rubiales Energy Corp. (BB+/Ba2)(c)(d) | |
| | 100,000 | | | | 5.375 | | | | 01/26/19 | | | | 100,750 | |
| PTTEP Canada International Finance Ltd. (BBB+/Baa1) | |
| | 200,000 | | | | 6.350 | | | | 06/12/42 | | | | 233,136 | |
| | | | | | | | | | | | | | |
| | | | | | | | | | | | | 333,886 | |
| | |
| | | | | | | | | | | | | | |
| | Corporate Obligations – (continued) | |
| | Chile – 3.7% | |
| AES Gener SA (BBB-/Baa3) | |
| $ | 170,000 | | | | 5.250 | % | | | 08/15/21 | | | $ | 177,599 | |
| Corpbanca SA (NR/Baa3)(c) | |
| | 200,000 | | | | 3.875 | | | | 09/22/19 | | | | 200,700 | |
| ENTEL Chile SA (BBB/Baa2)(c) | |
| | 210,000 | | | | 4.875 | | | | 10/30/24 | | | | 215,712 | |
| GNL Quintero SA (BBB/Baa2)(c) | |
| | 290,000 | | | | 4.634 | | | | 07/31/29 | | | | 288,187 | |
| Sociedad Quimica y Minera de Chile SA (BBB/Baa1) | |
| | 200,000 | | | | 3.625 | | | | 04/03/23 | | | | 192,000 | |
| | | | | | | | | | | | | | |
| | | | | | | | | | | | | 1,074,198 | |
| | |
| | Colombia – 0.9% | |
| Bancolombia SA (NR/Baa2) | |
| | 100,000 | | | | 5.950 | | | | 06/03/21 | | | | 109,500 | |
| Ecopetrol SA (BBB/Baa2) | |
| | 50,000 | | | | 7.375 | | | | 09/18/43 | | | | 60,454 | |
| Empresas Publicas de Medellin ESP (NR/Baa3)(c)(d) | |
| COP | 164,000,000 | | | | 7.625 | | | | 09/10/24 | | | | 81,336 | |
| | | | | | | | | | | | | | |
| | | | | | | | | | | | | 251,290 | |
| | |
| | Costa Rica(c) – 0.7% | |
| Banco Nacional de Costa Rica (NR/Ba1) | |
| $ | 200,000 | | | | 6.250 | | | | 11/01/23 | | | | 200,500 | |
| | |
| | Dominican Republic(d)(e) – 0.7% | |
| Aeropuertos Dominicanos Siglo XXI SA (B+/B1) | |
| | 200,000 | | | | 9.750 | | | | 11/13/19 | | | | 192,000 | |
| | |
| | Hong Kong – 2.8% | |
| China Unicom Ltd. (NR/NR) | |
| CNH | 1,000,000 | | | | 4.000 | | | | 04/16/17 | | | | 161,118 | |
| CITIC Pacific Ltd. (BBB+/A3) | |
| $ | 400,000 | | | | 6.375 | | | | 04/10/20 | | | | 450,684 | |
| Sinopec Group Overseas Development 2013 Ltd. (AA-/Aa3)(c) | |
| | 200,000 | | | | 4.375 | | | | 10/17/23 | | | | 206,608 | |
| | | | | | | | | | | | | | |
| | | | | | | | | | | | | 818,410 | |
| | |
| | Ireland – 0.7% | |
| VIP Finance Ireland Ltd. for OJSC Vimpel Communications
(BB/Ba3) |
|
| | 200,000 | | | | 7.748 | | | | 02/02/21 | | | | 205,250 | |
| | |
| | Israel – 1.5% | |
| Delek & Avner Tamar Bond Ltd. (BBB-/Baa3)(c) | |
| | 100,000 | | | | 2.803 | | | | 12/30/16 | | | | 99,750 | |
| | 100,000 | | | | 3.839 | | | | 12/30/18 | | | | 100,000 | |
| Israel Electric Corp. Ltd. (BBB-/Baa3) | |
| | 200,000 | | | | 7.250 | | | | 01/15/19 | | | | 224,700 | |
| | | | | | | | | | | | | | |
| | | | | | | | | | | | | 424,450 | |
| | |
| | Ivory Coast(c) – 0.4% | |
| Agromercantil Senior Trust (BB/NR) | |
| | 100,000 | | | | 6.250 | | | | 04/10/19 | | | | 103,977 | |
| | |
| | Jamaica(c)(d) – 0.7% | |
| Digicel Group Ltd. (NR/Caa1) | |
| | 200,000 | | | | 8.250 | | | | 09/30/20 | | | | 205,500 | |
| | |
| | |
| 44 | | The accompanying notes are an integral part of these financial statements. |
GOLDMAN SACHS DYNAMIC EMERGING MARKETS DEBT FUND
| | | | | | | | | | | | | | |
Principal
Amount | | | Interest
Rate | | | Maturity
Date | | | Value | |
| | | | | | | | | | | | | | |
| | Corporate Obligations – (continued) | |
| | Kazakhstan – 1.0% | |
| KazMunayGas National Co. (BBB-/Baa3) | |
| $ | 270,000 | | | | 11.750 | % | | | 01/23/15 | | | $ | 277,762 | |
| | |
| | Luxembourg(c)(d) – 1.2% | |
| Tupy Overseas SA (BB-/NR) | |
| | 200,000 | | | | 6.625 | | | | 07/17/24 | | | | 204,000 | |
| Wind Acquisition Finance SA (BB/Ba3) | |
| EUR | 110,000 | | | | 4.000 | | | | 07/15/20 | | | | 136,831 | |
| | | | | | | | | | | | | | |
| | | | | | | | | | | | | 340,831 | |
| | |
| | Mexico �� 1.5% | |
| America Movil SAB de CV (A-/A2) | |
| MXN | 2,000,000 | | | | 6.000 | | | | 06/09/19 | | | | 149,953 | |
| Cemex SAB de CV (B+/NR)(c)(d) | |
| EUR | 100,000 | | | | 4.750 | | | | 01/11/22 | | | | 126,621 | |
| Petroleos Mexicanos (BBB+/A3) | |
| $ | 20,000 | | | | 3.500 | | | | 07/18/18 | | | | 20,730 | |
| | 18,000 | | | | 6.000 | | | | 03/05/20 | | | | 20,385 | |
| | 90,000 | | | | 6.375 | (c) | | | 01/23/45 | | | | 101,772 | |
| | | | | | | | | | | | | | |
| | | | | | | | | | | | | 419,461 | |
| | |
| | Netherlands – 1.5% | |
| Listrindo Capital BV (BB-/Ba2)(d) | |
| | 200,000 | | | | 6.950 | | | | 02/21/19 | | | | 211,500 | |
| Lukoil International Finance BV (BBB-/Baa2) | |
| | 200,000 | | | | 6.125 | | | | 11/09/20 | | | | 200,500 | |
| Petrobras Global Finance BV (BBB-/Baa1) | |
| | 10,000 | | | | 4.875 | | | | 03/17/20 | | | | 10,051 | |
| | | | | | | | | | | | | | |
| | | | | | | | | | | | | 422,051 | |
| | |
| | Paraguay(c) – 0.6% | |
| Banco Regional SAECA (BB-/Ba2) | |
| | 150,000 | | | | 8.125 | | | | 01/24/19 | | | | 164,250 | |
| | |
| | Peru – 2.2% | |
| Abengoa Transmision Sur SA (BBB-/NR)(c) | |
| | 200,000 | | | | 6.875 | | | | 04/30/43 | | | | 221,000 | |
| Corp Lindley S.A. (BB+/NR) | |
| | 310,000 | | | | 6.750 | | | | 11/23/21 | | | | 341,000 | |
| SAN Miguel Industrias Pet SA (NR/Ba2)(c)(d) | |
| | 60,000 | | | | 7.750 | | | | 11/06/20 | | | | 64,800 | |
| | | | | | | | | | | | | | |
| | | | | | | | | | | | | 626,800 | |
| | |
| | Philippines – 0.4% | |
| Energy Development Corp. (NR/NR) | |
| | 100,000 | | | | 6.500 | | | | 01/20/21 | | | | 108,500 | |
| | |
| | Singapore(d) – 0.5% | |
| Berau Capital Resources Pte Ltd. (B/B2) | |
| | 100,000 | | | | 12.500 | | | | 07/08/15 | | | | 77,500 | |
| Olam International Ltd. (NR/NR) | |
| | 70,000 | | | | 6.750 | | | | 01/29/18 | | | | 72,537 | |
| | | | | | | | | | | | | | |
| | | | | | | | | | | | | 150,037 | |
| | |
| | Thailand(a)(c)(d) – 0.7% | |
| PTT Exploration & Production PCL (BBB-/Baa3) | |
| | 200,000 | | | | 4.875 | | | | 06/18/49 | | | | 202,050 | |
| | |
| | | | | | | | | | | | | | |
| | Corporate Obligations – (continued) | |
| | United Arab Emirates – 2.3% | |
| Dolphin Energy Ltd. (NR/A1) | |
| $ | 400,000 | | | | 5.500 | % | | | 12/15/21 | | | $ | 448,040 | |
| Ruwais Power Co. PJSC (A-/A3)(c) | |
| | 200,000 | | | | 6.000 | | | | 08/31/36 | | | | 224,000 | |
| | | | | | | | | | | | | | |
| | | | | | | | | | | | | 672,040 | |
| | |
| | United States(c) – 1.2% | |
| Brazil Loan Trust 1 (BBB-/NR) | |
| | 150,000 | | | | 5.477 | | | | 07/24/23 | | | | 153,750 | |
| Cemex Finance LLC (B+/NR)(d) | |
| EUR | 100,000 | | | | 5.250 | | | | 04/01/21 | | | | 128,989 | |
| YPF SA (NR/Caa1) | |
| $ | 40,000 | | | | 8.875 | | | | 12/19/18 | | | | 41,600 | |
| | 20,000 | | | | 8.750 | | | | 04/04/24 | | | | 20,221 | |
| | | | | | | | | | | | | | |
| | | | | | | | | | | | | 344,560 | |
| | |
| | Venezuela – 0.3% | |
| Petroleos de Venezuela SA (CCC+/NR) | |
| | 80,000 | | | | 6.000 | | | | 05/16/24 | | | | 40,900 | |
| | 50,000 | | | | 6.000 | | | | 11/15/26 | | | | 25,188 | |
| Petroleos de Venezuela SA (NR/Caa1) | |
| | 46,000 | | | | 9.750 | | | | 05/17/35 | | | | 29,693 | |
| | | | | | | | | | | | | | |
| | | | | | | | | | | | | 95,781 | |
| | |
| | TOTAL CORPORATE OBLIGATIONS | |
| | (Cost $8,097,028) | | | $ | 8,137,692 | |
| | |
| | | | | | | | | | | | | | |
| | Structured Notes(c) – 3.4% | |
| | Indonesia – 3.4% | |
| Republic of Indonesia (Issuer Deutsche Bank AG (London)
(NR/NR) |
|
| IDR | 2,200,000,000 | | | | 8.250 | % | | | 06/17/32 | | | $ | 168,363 | |
| Republic of Indonesia (Issuer JPMorgan Chase Bank NA)
(NR/NR) |
|
| | 1,500,000,000 | | | | 9.000 | | | | 03/19/29 | | | | 123,410 | |
| Republic of Indonesia (Issuer Standard Chartered Bank) (NR/NR) | |
| | 1,000,000,000 | | | | 8.375 | | | | 03/19/24 | | | | 81,124 | |
| | 1,043,000,000 | | | | 8.375 | | | | 03/19/24 | | | | 84,613 | |
| | 1,042,000,000 | | | | 8.375 | | | | 03/19/24 | | | | 84,532 | |
| | 1,000,000,000 | | | | 8.375 | | | | 03/19/24 | | | | 81,124 | |
| | 1,005,000,000 | | | | 9.000 | | | | 03/19/29 | | | | 82,685 | |
| | 2,291,000,000 | | | | 9.000 | | | | 03/19/29 | | | | 188,488 | |
| | 1,026,000,000 | | | | 9.000 | | | | 03/19/29 | | | | 84,412 | |
| | |
| | TOTAL STRUCTURED NOTES | |
| | (Cost $1,136,786) | | | $ | 978,751 | |
| | |
| | | | | | | | | | | | | | |
| | Municipal Debt Obligations – 2.5% | |
| | Puerto Rico – 2.5% | |
| Puerto Rico Commonwealth Aqueduct & Sewer Authority RB
(Senior Lien) Series 2008 A (BB-/Caa1) |
|
| $ | 40,000 | | | | 6.000 | % | | | 07/01/44 | | | $ | 29,500 | |
| | |
| | |
| The accompanying notes are an integral part of these financial statements. | | 45 |
GOLDMAN SACHS DYNAMIC EMERGING MARKETS DEBT FUND
Schedule of Investments (continued)
September 30, 2014 (Unaudited)
| | | | | | | | | | | | | | |
Principal
Amount | | | Interest
Rate | | | Maturity
Date | | | Value | |
| | | | | | | | | | | | | | |
| | Municipal Debt Obligations – (continued) | |
| | Puerto Rico – (continued) | |
| Puerto Rico Commonwealth Aqueduct & Sewer Authority RB
(Senior Lien) Series 2012 A (BB-/Caa1) |
|
| $ | 5,000 | | | | 5.125 | % | | | 07/01/37 | | | $ | 3,562 | |
| | 20,000 | | | | 5.250 | | | | 07/01/42 | | | | 14,250 | |
| Puerto Rico Commonwealth Aqueduct & Sewer Authority RB
(Senior Lien) Series 2012 D (BB-/Caa1) |
|
| | 5,000 | | | | 5.000 | | | | 07/01/33 | | | | 3,550 | |
| Puerto Rico Commonwealth GO Bonds for Public Improvement
Series 2012 A (BB/B2) |
|
| | 10,000 | | | | 5.125 | | | | 07/01/37 | | | | 7,475 | |
| Puerto Rico Commonwealth GO Bonds Refunding for Public
Improvement Series 2012 A (BB/B2) |
|
| | 15,000 | | | | 5.500 | | | | 07/01/26 | | | | 11,935 | |
| | 15,000 | | | | 5.500 | | | | 07/01/39 | | | | 11,211 | |
| Puerto Rico Commonwealth GO Bonds Series 2008 A (BB/B2) | |
| | 15,000 | | | | 5.375 | | | | 07/01/33 | | | | 11,293 | |
| Puerto Rico Commonwealth GO Bonds Series 2014 A (BB/B2) | |
| | 385,000 | | | | 8.000 | | | | 07/01/35 | | | | 338,808 | |
| Puerto Rico Sales Tax Financing Corp. Sales Tax RB
SubSeries 2009 A (BBB-/B1) |
|
| | 30,000 | | | | 0.000 | (b) | | | 08/01/32 | | | | 23,605 | |
| | 20,000 | | | | 5.750 | | | | 08/01/37 | | | | 16,331 | |
| | 35,000 | | | | 6.000 | | | | 08/01/42 | | | | 28,078 | |
| Puerto Rico Sales Tax Financing Corp. Sales Tax RB
SubSeries 2010 A (BBB-/B1) |
|
| | 15,000 | | | | 5.500 | | | | 08/01/37 | | | | 11,757 | |
| | 55,000 | | | | 5.375 | | | | 08/01/39 | | | | 41,966 | |
| | 20,000 | | | | 5.500 | | | | 08/01/42 | | | | 15,276 | |
| Puerto Rico Sales Tax Financing Corp. Sales Tax RB
SubSeries 2010 C (BBB-/B1) |
|
| | 5,000 | | | | 5.000 | | | | 08/01/35 | | | | 3,809 | |
| | 5,000 | | | | 5.375 | | | | 08/01/38 | | | | 3,878 | |
| | 10,000 | | | | 6.000 | | | | 08/01/39 | | | | 8,186 | |
| | 30,000 | | | | 5.250 | | | | 08/01/41 | | | | 22,136 | |
| Puerto Rico Sales Tax Financing Corp. Sales Tax RB
SubSeries 2011 A-1 (BBB-/B1) |
|
| | 35,000 | | | | 5.000 | | | | 08/01/43 | | | | 25,074 | |
| Puerto Rico Sales Tax Financing Corp. Sales Tax RB Unrefunded
SubSeries 2009 A (BBB-/B1) |
|
| | 45,000 | | | | 5.500 | | | | 08/01/28 | | | | 38,016 | |
| | 35,000 | | | | 6.125 | | | | 08/01/29 | | | | 29,760 | |
| | |
| | TOTAL MUNICIPAL DEBT OBLIGATIONS | |
| | (Cost $703,466) | | | $ | 699,456 | |
| | |
| | | | | | | | | | | | | | |
| | | | | | | | | | | | | | |
| | U.S. Treasury Obligation – 0.8% | |
| United States Treasury Bond | |
| $ | 200,000 | | | | 3.750 | % | | | 11/15/43 | | | $ | 221,042 | |
| | (Cost $197,900) | | | | | | | | | |
| | |
| TOTAL INVESTMENTS BEFORE SHORT-TERM
INVESTMENT |
|
| | (Cost $26,887,702) | | | $ | 26,245,205 | |
| | |
| | | | | | | | | | | | | | |
| | Short-term Investment(f) – 6.3% | |
| | Repurchase Agreement – 6.3% | |
| Joint Repurchase Agreement Account II | |
| $ | 1,800,000 | | | | 0.012 | % | | | 10/01/14 | | | $ | 1,800,000 | |
| | (Cost $1,800,000) | |
| | |
| | TOTAL INVESTMENTS – 98.0% | |
| | (Cost $28,687,702) | | | $ | 28,045,205 | |
| | |
| | OTHER ASSETS IN EXCESS OF | | | | | |
| | LIABILITIES – 2.0% | | | | 570,254 | |
| | |
| | NET ASSETS – 100.0% | | | $ | 28,615,459 | |
| | |
| | |
| The percentage shown for each investment category reflects the value of investments in that category as a percentage of net assets. |
(a) | | Variable rate security. Interest rate or distribution rate disclosed is that which is in effect at September 30, 2014. |
(b) | | Issued with a zero coupon. Income is recognized through the accretion of discount. |
(c) | | Exempt from registration under Rule 144A of the Securities Act of 1933. Under procedures approved by the Board of Trustees, such securities have been determined to be liquid by the investment adviser and may be resold, normally to qualified institutional buyers in transactions exempt from registration. Total market value of Rule 144A securities amounts to $5,678,855, which represents approximately 19.8% of net assets as of September 30, 2014. |
(d) | | Security with “Call” features with resetting interest rates. Maturity dates disclosed are the final maturity dates. |
(e) | | Coupon changes periodically based upon a predetermined schedule. Interest rate disclosed is that which is in effect at September 30, 2014. |
(f) | | Joint repurchase agreement was entered into on September 30, 2014. Additional information appears on page 123. |
Security ratings disclosed, if any, are obtained from by Standard & Poor’s/Moody’s Investor Service. A brief description of the ratings is available in the Fund’s Statement of Additional Information.
| | |
| 46 | | The accompanying notes are an integral part of these financial statements. |
GOLDMAN SACHS DYNAMIC EMERGING MARKETS DEBT FUND
| | |
|
Currency Abbreviations: |
AUD | | —Australian Dollar |
BRL | | —Brazilian Real |
CLP | | —Chilean Peso |
CNH | | —Chinese Yuan Renminbi Offshore |
COP | | —Colombian Peso |
DOP | | —Dominican Peso |
EUR | | —Euro |
HUF | | —Hungarian Forint |
IDR | | —Indonesian Rupiah |
ILS | | —Israeli Shekel |
INR | | —Indian Rupee |
JPY | | —Japanese Yen |
KRW | | —South Korean Won |
MXN | | —Mexican Peso |
MYR | | —Malaysian Ringgit |
NGN | | —Nigerian Naira |
PEN | | —Peruvian Nuevo Sol |
PHP | | —Philippine Peso |
PLN | | —Polish Zloty |
RON | | —New Romanian Leu |
RUB | | —Russian Ruble |
SGD | | —Singapore Dollar |
THB | | —Thai Baht |
TRY | | —Turkish Lira |
TWD | | —Taiwan Dollar |
USD | | —U.S. Dollar |
ZAR | | —South African Rand |
| | |
Investment Abbreviations: |
CLICP | | —Sinacofi Chile Interbank Rate |
GO | | —General Obligation |
JIBAR | | —Johannesburg Interbank Agreed Rate |
KWCDC | | —South Korean Won Certificate of Deposit |
LIBOR | | —London Interbank Offered Rate |
NR | | —Not Rated |
RB | | —Revenue Bond |
TIIE | | —La Tasa de Interbank Equilibrium Interest Rate |
|
| | |
| The accompanying notes are an integral part of these financial statements. | | 47 |
GOLDMAN SACHS DYNAMIC EMERGING MARKETS DEBT FUND
Schedule of Investments (continued)
September 30, 2014 (Unaudited)
|
| ADDITIONAL INVESTMENT INFORMATION |
FORWARD FOREIGN CURRENCY EXCHANGE CONTRACTS — At September 30, 2014, the Fund had the following forward foreign currency exchange contracts:
FORWARD FOREIGN CURRENCY EXCHANGE CONTRACTS WITH UNREALIZED GAIN
| | | | | | | | | | | | | | |
| Counterparty | | Contracts to
Buy/Sell | | Settlement
Date | | | Current
Value | | | Unrealized
Gain | |
Bank of America Securities LLC | | USD/EUR | | | 12/17/14 | | | $ | 990,788 | | | $ | 32,577 | |
| | USD/JPY | | | 12/17/14 | | | | 49,860 | | | | 1,140 | |
| | USD/MYR | | | 10/03/14 | | | | 68,688 | | | | 912 | |
Barclays Bank PLC | | USD/AUD | | | 12/17/14 | | | | 57,649 | | | | 2,367 | |
| | USD/ILS | | | 12/17/14 | | | | 108,224 | | | | 7,505 | |
| | USD/INR | | | 10/07/14 | | | | 200,827 | | | | 3,173 | |
| | USD/INR | | | 10/27/14 | | | | 99,412 | | | | 1,588 | |
| | USD/KRW | | | 10/27/14 | | | | 150,053 | | | | 1,447 | |
| | USD/MYR | | | 10/03/14 | | | | 270,931 | | | | 1,350 | |
| | ZAR/USD | | | 12/17/14 | | | | 95,125 | | | | 125 | |
BNP Paribas SA | | EUR/PLN | | | 12/17/14 | | | | 99,629 | | | | 208 | |
| | EUR/USD | | | 12/17/14 | | | | 101,101 | | | | 14 | |
| | MXN/USD | | | 12/17/14 | | | | 76,934 | | | | 386 | |
| | USD/AUD | | | 12/17/14 | | | | 195,029 | | | | 5,227 | |
| | USD/BRL | | | 10/22/14 | | | | 98,133 | | | | 2,867 | |
| | USD/COP | | | 10/24/14 | | | | 64,174 | | | | 2,855 | |
| | USD/MXN | | | 12/17/14 | | | | 60,774 | | | | 1,538 | |
| | USD/MYR | | | 10/20/14 | | | | 99,399 | | | | 1,601 | |
| | USD/RUB | | | 10/02/14 | | | | 57,449 | | | | 3,551 | |
| | USD/RUB | | | 10/27/14 | | | | 198,620 | | | | 3,380 | |
| | USD/TRY | | | 12/17/14 | | | | 37,872 | | | | 1,848 | |
Citibank NA (London) | | PHP/USD | | | 10/20/14 | | | | 50,010 | | | | 10 | |
| | USD/ILS | | | 05/06/15 | | | | 124,946 | | | | 5,671 | |
| | USD/INR | | | 10/14/14 | | | | 201,470 | | | | 3,530 | |
| | USD/PHP | | | 10/14/14 | | | | 49,821 | | | | 1,179 | |
| | USD/SGD | | | 12/17/14 | | | | 178,720 | | | | 2,993 | |
| | USD/TRY | | | 12/17/14 | | | | 98,708 | | | | 3,292 | |
| | USD/TWD | | | 10/17/14 | | | | 199,895 | | | | 2,105 | |
| | USD/TWD | | | 10/20/14 | | | | 199,232 | | | | 1,768 | |
Credit Suisse International (London) | | COP/USD | | | 11/04/14 | | | | 110,591 | | | | 96 | |
| | USD/RUB | | | 10/02/14 | | | | 96,904 | | | | 5,096 | |
Deutsche Bank AG (London) | | MXN/USD | | | 12/17/14 | | | | 200,335 | | | | 1,324 | |
| | USD/CNH | | | 12/17/14 | | | | 572,874 | | | | 2,647 | |
| | USD/EUR | | | 12/17/14 | | | | 49,287 | | | | 1,229 | |
| | USD/IDR | | | 10/31/14 | | | | 139,496 | | | | 5,516 | |
| | USD/INR | | | 10/07/14 | | | | 66,922 | | | | 319 | |
| | USD/KRW | | | 10/14/14 | | | | 200,789 | | | | 4,211 | |
| | USD/MXN | | | 12/17/14 | | | | 240,549 | | | | 3,230 | |
| | USD/MYR | | | 10/07/14 | | | | 309,529 | | | | 8,009 | |
| | USD/PHP | | | 10/14/14 | | | | 49,831 | | | | 1,169 | |
| | USD/PHP | | | 10/20/14 | | | | 99,597 | | | | 1,403 | |
| | USD/PLN | | | 12/17/14 | | | | 121,108 | | | | 2,672 | |
| | USD/RUB | | | 10/17/14 | | | | 25,440 | | | | 30 | |
| | USD/RUB | | | 11/17/14 | | | | 95,012 | | | | 6,765 | |
| | USD/ZAR | | | 12/17/14 | | | | 76,622 | | | | 3,676 | |
HSBC Bank PLC | | TRY/USD | | | 12/17/14 | | | | 58,056 | | | | 56 | |
| | TWD/USD | | | 10/20/14 | | | | 102,064 | | | | 64 | |
| | USD/CNH | | | 12/17/14 | | | | 406,569 | | | | 431 | |
| | USD/JPY | | | 12/17/14 | | | | 48,928 | | | | 1,072 | |
| | |
| 48 | | The accompanying notes are an integral part of these financial statements. |
GOLDMAN SACHS DYNAMIC EMERGING MARKETS DEBT FUND
|
| ADDITIONAL INVESTMENT INFORMATION (continued) |
FORWARD FOREIGN CURRENCY EXCHANGE CONTRACTS WITH UNREALIZED GAIN (continued)
| | | | | | | | | | | | | | |
| Counterparty | | Contracts to
Buy/Sell | | Settlement
Date | | | Current
Value | | | Unrealized
Gain | |
HSBC Bank PLC (continued) | | USD/KRW | | | 10/22/14 | | | $ | 30,086 | | | $ | 381 | |
| | USD/KRW | | | 10/23/14 | | | | 70,092 | | | | 908 | |
| | USD/MXN | | | 12/17/14 | | | | 43,154 | | | | 1,155 | |
| | USD/RUB | | | 10/24/14 | | | | 25,341 | | | | 659 | |
| | USD/RUB | | | 11/17/14 | | | | 130,830 | | | | 10,882 | |
| | USD/SGD | | | 12/17/14 | | | | 227,714 | | | | 4,279 | |
| | USD/TRY | | | 12/17/14 | | | | 40,344 | | | | 2,035 | |
| | USD/ZAR | | | 12/17/14 | | | | 122,478 | | | | 6,387 | |
JPMorgan Chase Bank (London) | | MXN/USD | | | 12/17/14 | | | | 102,337 | | | | 337 | |
| | USD/EUR | | | 12/17/14 | | | | 50,550 | | | | 423 | |
| | USD/IDR | | | 10/31/14 | | | | 70,281 | | | | 1,417 | |
| | USD/INR | | | 10/29/14 | | | | 150,183 | | | | 1,817 | |
| | USD/JPY | | | 12/17/14 | | | | 195,058 | | | | 8,790 | |
| | USD/MXN | | | 12/17/14 | | | | 515,216 | | | | 8,984 | |
| | USD/RUB | | | 10/20/14 | | | | 49,632 | | | | 1,368 | |
| | USD/RUB | | | 11/17/14 | | | | 93,034 | | | | 5,947 | |
| | USD/TRY | | | 12/17/14 | | | | 197,043 | | | | 7,957 | |
Merrill Lynch International Bank Ltd. | | COP/USD | | | 10/31/14 | | | | 47,867 | | | | 128 | |
Morgan Stanley & Co. International PLC | | BRL/USD | | | 11/03/14 | | | | 161,094 | | | | 94 | |
| | TWD/USD | | | 10/17/14 | | | | 202,107 | | | | 107 | |
| | USD/AUD | | | 12/17/14 | | | | 18,396 | | | | 633 | |
| | USD/ILS | | | 12/17/14 | | | | 175,753 | | | | 10,782 | |
| | USD/PHP | | | 10/31/14 | | | | 58,326 | | | | 2,214 | |
| | USD/TRY | | | 12/17/14 | | | | 97,153 | | | | 4,847 | |
Royal Bank of Canada | | USD/AUD | | | 12/17/14 | | | | 100,127 | | | | 369 | |
| | USD/JPY | | | 12/17/14 | | | | 25,307 | | | | 193 | |
Royal Bank of Scotland PLC | | USD/EUR | | | 12/17/14 | | | | 49,287 | | | | 1,251 | |
| | USD/JPY | | | 12/17/14 | | | | 24,667 | | | | 108 | |
| | USD/TRY | | | 12/17/14 | | | | 198,468 | | | | 4,532 | |
Standard Chartered Bank | | NGN/USD | | | 12/16/14 | | | | 34,864 | | | | 17 | |
| | USD/AUD | | | 12/17/14 | | | | 49,086 | | | | 1,999 | |
| | USD/CNH | | | 12/17/14 | | | | 402,689 | | | | 1,311 | |
| | USD/COP | | | 10/24/14 | | | | 90,098 | | | | 7,430 | |
| | USD/EUR | | | 12/17/14 | | | | 49,287 | | | | 1,348 | |
| | USD/IDR | | | 10/31/14 | | | | 90,225 | | | | 3,774 | |
| | USD/MXN | | | 12/17/14 | | | | 39,863 | | | | 513 | |
| | USD/TRY | | | 12/17/14 | | | | 36,918 | | | | 1,895 | |
| | USD/ZAR | | | 12/17/14 | | | | 33,705 | | | | 888 | |
State Street Bank and Trust | | AUD/USD | | | 12/17/14 | | | | 50,499 | | | | 241 | |
| | USD/JPY | | | 12/17/14 | | | | 147,547 | | | | 3,453 | |
UBS AG (London) | | USD/BRL | | | 10/14/14 | | | | 200,851 | | | | 2,149 | |
| | USD/ILS | | | 05/06/15 | | | | 130,299 | | | | 7,543 | |
Westpac Banking Corp. | | AUD/USD | | | 12/17/14 | | | | 100,997 | | | | 256 | |
| | USD/AUD | | | 12/17/14 | | | | 66,467 | | | | 2,577 | |
| | USD/EUR | | | 12/17/14 | | | | 2,072,567 | | | | 48,767 | |
| | USD/MYR | | | 10/20/14 | | | | 96,973 | | | | 1,894 | |
| | | USD/SGD | | | 12/17/14 | | | | 198,741 | | | | 3,750 | |
| TOTAL | | | | | | | | | | | | $ | 324,011 | |
| | |
| The accompanying notes are an integral part of these financial statements. | | 49 |
GOLDMAN SACHS DYNAMIC EMERGING MARKETS DEBT FUND
Schedule of Investments (continued)
September 30, 2014 (Unaudited)
|
| ADDITIONAL INVESTMENT INFORMATION (continued) |
FORWARD FOREIGN CURRENCY EXCHANGE CONTRACTS WITH UNREALIZED LOSS
| | | | | | | | | | | | | | |
| Counterparty | | Contracts to
Buy/Sell | | Settlement
Date | | | Current
Value | | | Unrealized
Loss | |
Bank of America Securities LLC | | EUR/USD | | | 12/17/14 | | | $ | 247,697 | | | $ | (4,387 | ) |
| | HUF/USD | | | 12/17/14 | | | | 99,119 | | | | (1,881 | ) |
Barclays Bank PLC | | EUR/PLN | | | 12/17/14 | | | | 202,344 | | | | (1,406 | ) |
| | EUR/USD | | | 12/17/14 | | | | 49,287 | | | | (1,147 | ) |
| | ILS/USD | | | 12/17/14 | | | | 56,072 | | | | (1,699 | ) |
| | INR/USD | | | 10/07/14 | | | | 169,211 | | | | (1,891 | ) |
| | INR/USD | | | 10/27/14 | | | | 137,662 | | | | (2,493 | ) |
| | JPY/USD | | | 12/17/14 | | | | 48,966 | | | | (2,034 | ) |
| | MYR/USD | | | 10/07/14 | | | | 433,965 | | | | (12,483 | ) |
| | MYR/USD | | | 10/20/14 | | | | 80,880 | | | | (120 | ) |
| | MYR/USD | | | 10/29/14 | | | | 305,907 | | | | (1,379 | ) |
| | MYR/USD | | | 10/31/14 | | | | 203,962 | | | | (6,132 | ) |
| | PLN/USD | | | 12/17/14 | | | | 244,394 | | | | (8,031 | ) |
| | TWD/USD | | | 10/27/14 | | | | 100,331 | | | | (669 | ) |
BNP Paribas SA | | AUD/USD | | | 12/17/14 | | | | 49,628 | | | | (831 | ) |
| | BRL/USD | | | 10/24/14 | | | | 94,154 | | | | (7,559 | ) |
| | HUF/USD | | | 12/17/14 | | | | 45,488 | | | | (1,154 | ) |
| | ILS/USD | | | 12/17/14 | | | | 150,058 | | | | (1,942 | ) |
| | INR/USD | | | 10/14/14 | | | | 49,590 | | | | (675 | ) |
| | PLN/USD | | | 12/17/14 | | | | 246,379 | | | | (5,683 | ) |
Citibank NA (London) | | AUD/USD | | | 12/17/14 | | | | 49,628 | | | | (738 | ) |
| | ILS/USD | | | 12/17/14 | | | | 89,740 | | | | (2,260 | ) |
| | MYR/USD | | | 10/03/14 | | | | 269,619 | | | | (6,481 | ) |
| | PHP/USD | | | 10/29/14 | | | | 49,809 | | | | (191 | ) |
Credit Suisse International (London) | | COP/USD | | | 10/03/14 | | | | 110,897 | | | | (5,731 | ) |
| | COP/USD | | | 11/04/14 | | | | 54,837 | | | | (163 | ) |
| | PEN/USD | | | 11/18/14 | | | | 32,060 | | | | (1,067 | ) |
| | RUB/USD | | | 10/02/14 | | | | 95,669 | | | | (6,331 | ) |
| | RUB/USD | | | 10/27/14 | | | | 196,239 | | | | (5,761 | ) |
| | USD/COP | | | 10/03/14 | | | | 110,897 | | | | (81 | ) |
Deutsche Bank AG (London) | | AUD/USD | | | 12/17/14 | | | | 96,644 | | | | (3,774 | ) |
| | BRL/USD | | | 10/24/14 | | | | 145,253 | | | | (12,041 | ) |
| | EUR/USD | | | 12/17/14 | | | | 298,247 | | | | (6,032 | ) |
| | HUF/USD | | | 12/17/14 | | | | 81,056 | | | | (1,356 | ) |
| | IDR/USD | | | 10/31/14 | | | | 140,945 | | | | (4,058 | ) |
| | IDR/USD | | | 11/03/14 | | | | 100,836 | | | | (164 | ) |
| | INR/USD | | | 10/29/14 | | | | 66,504 | | | | (487 | ) |
| | MYR/USD | | | 10/31/14 | | | | 18,658 | | | | (726 | ) |
| | PHP/USD | | | 10/20/14 | | | | 101,932 | | | | (68 | ) |
| | PLN/USD | | | 12/17/14 | | | | 183,303 | | | | (6,577 | ) |
| | RUB/USD | | | 10/02/14 | | | | 58,487 | | | | (3,070 | ) |
| | THB/USD | | | 10/31/14 | | | | 45,883 | | | | (173 | ) |
| | TRY/USD | | | 12/17/14 | | | | 29,469 | | | | (770 | ) |
HSBC Bank PLC | | EUR/USD | | | 12/17/14 | | | | 149,124 | | | | (2,395 | ) |
| | HUF/USD | | | 12/17/14 | | | | 47,399 | | | | (1,475 | ) |
| | INR/USD | | | 10/27/14 | | | | 127,274 | | | | (1,967 | ) |
| | RON/USD | | | 12/17/14 | | | | 85,408 | | | | (1,808 | ) |
| | RUB/USD | | | 10/17/14 | | | | 48,556 | | | | (1,444 | ) |
| | RUB/USD | | | 10/24/14 | | | | 64,157 | | | | (1,843 | ) |
| | SGD/USD | | | 12/17/14 | | | | 200,325 | | | | (1,675 | ) |
JPMorgan Chase Bank (London) | | JPY/USD | | | 12/17/14 | | | | 196,279 | | | | (4,721 | ) |
| | MXN/USD | | | 12/17/14 | | | | 87,222 | | | | (1,394 | ) |
| | |
| 50 | | The accompanying notes are an integral part of these financial statements. |
GOLDMAN SACHS DYNAMIC EMERGING MARKETS DEBT FUND
|
| ADDITIONAL INVESTMENT INFORMATION (continued) |
FORWARD FOREIGN CURRENCY EXCHANGE CONTRACTS WITH UNREALIZED LOSS (continued)
| | | | | | | | | | | | | | |
| Counterparty | | Contracts to
Buy/Sell | | Settlement
Date | | | Current
Value | | | Unrealized
Loss | |
JPMorgan Chase Bank (London) (continued) | | MYR/USD | | | 10/03/14 | | | $ | 70,000 | | | $ | (1,524 | ) |
| | MYR/USD | | | 10/20/14 | | | | 50,820 | | | | (180 | ) |
| | RUB/USD | | | 11/17/14 | | | | 389,978 | | | | (16,007 | ) |
| | TRY/USD | | | 12/17/14 | | | | 113,578 | | | | (2,422 | ) |
| | USD/MXN | | | 12/17/14 | | | | 303,658 | | | | (658 | ) |
Merrill Lynch International Bank Ltd. | | COP/USD | | | 10/02/14 | | | | 47,983 | | | | (2,034 | ) |
| | HUF/USD | | | 12/17/14 | | | | 105,944 | | | | (886 | ) |
| | USD/COP | | | 10/02/14 | | | | 47,983 | | | | (86 | ) |
Morgan Stanley & Co. International PLC | | AUD/USD | | | 12/17/14 | | | | 48,757 | | | | (1,729 | ) |
| | BRL/USD | | | 10/27/14 | | | | 98,849 | | | | (2,151 | ) |
| | EUR/HUF | | | 12/17/14 | | | | 51,522 | | | | (972 | ) |
| | EUR/USD | | | 12/17/14 | | | | 303,303 | | | | (1,589 | ) |
| | INR/USD | | | 10/27/14 | | | | 128,211 | | | | (2,077 | ) |
| | KRW/USD | | | 10/27/14 | | | | 99,057 | | | | (1,943 | ) |
| | PHP/USD | | | 10/31/14 | | | | 117,280 | | | | (1,198 | ) |
Royal Bank of Canada | | EUR/USD | | | 12/17/14 | | | | 101,101 | | | | (1,901 | ) |
| | JPY/USD | | | 12/17/14 | | | | 97,438 | | | | (4,562 | ) |
| | MXN/USD | | | 12/17/14 | | | | 187,146 | | | | (1,141 | ) |
| | PEN/USD | | | 10/24/14 | | | | 32,075 | | | | (1,027 | ) |
| | ZAR/USD | | | 12/17/14 | | | | 493,470 | | | | (26,276 | ) |
Royal Bank of Scotland PLC | | TRY/USD | | | 12/17/14 | | | | 488,769 | | | | (15,536 | ) |
| | USD/TRY | | | 12/17/14 | | | | 102,372 | | | | (372 | ) |
Standard Chartered Bank | | CLP/USD | | | 10/24/14 | | | | 31,937 | | | | (2,244 | ) |
| | CNH/USD | | | 12/17/14 | | | | 406,789 | | | | (2,211 | ) |
| | COP/USD | | | 10/24/14 | | | | 139,071 | | | | (5,817 | ) |
| | INR/USD | | | 10/14/14 | | | | 278,888 | | | | (3,081 | ) |
| | JPY/USD | | | 12/17/14 | | | | 148,686 | | | | (5,314 | ) |
| | KRW/USD | | | 10/14/14 | | | | 100,940 | | | | (60 | ) |
| | MXN/USD | | | 12/17/14 | | | | 100,024 | | | | (976 | ) |
| | PEN/USD | | | 10/31/14 | | | | 143,803 | | | | (477 | ) |
| | PLN/USD | | | 12/17/14 | | | | 231,098 | | | | (7,327 | ) |
| | TRY/USD | | | 12/17/14 | | | | 99,108 | | | | (1,892 | ) |
State Street Bank and Trust | | AUD/USD | | | 12/17/14 | | | | 49,628 | | | | (1,076 | ) |
| | EUR/USD | | | 12/17/14 | | | | 99,837 | | | | (2,184 | ) |
UBS AG (London) | | BRL/USD | | | 10/14/14 | | | | 190,707 | | | | (12,293 | ) |
| | BRL/USD | | | 10/27/14 | | | | 78,645 | | | | (1,256 | ) |
| | EUR/USD | | | 12/17/14 | | | | 77,646 | | | | (1,744 | ) |
| | INR/USD | | | 10/07/14 | | | | 98,537 | | | | (1,617 | ) |
| | PLN/USD | | | 12/17/14 | | | | 272,384 | | | | (5,616 | ) |
| | RUB/USD | | | 11/17/14 | | | | 379,759 | | | | (19,795 | ) |
Westpac Banking Corp. | | AUD/USD | | | 12/17/14 | | | | 86,196 | | | | (915 | ) |
| | INR/USD | | | 10/14/14 | | | | 157,792 | | | | (2,173 | ) |
| | KRW/USD | | | 10/31/14 | | | | 67,876 | | | | (1,567 | ) |
| | | MYR/USD | | | 10/31/14 | | | | 36,740 | | | | (1,260 | ) |
| TOTAL | | | | | | | | | | | | $ | (317,584 | ) |
| | |
| The accompanying notes are an integral part of these financial statements. | | 51 |
GOLDMAN SACHS DYNAMIC EMERGING MARKETS DEBT FUND
Schedule of Investments (continued)
September 30, 2014 (Unaudited)
|
| ADDITIONAL INVESTMENT INFORMATION (continued) |
FUTURES CONTRACTS — At September 30, 2014, the Fund had the following futures contracts:
| | | | | | | | | | | | | | |
| Type | | Number of
Contracts
Long (Short) | | | Expiration
Date | | Current
Value | | | Unrealized
Gain (Loss) | |
Eurodollars | | | (20 | ) | | March 2017 | | $ | (4,878,750 | ) | | $ | 6,397 | |
Eurodollars | | | (17 | ) | | June 2017 | | | (4,138,863 | ) | | | 7,568 | |
Eurodollars | | | (11 | ) | | September 2017 | | | (2,673,962 | ) | | | 5,758 | |
Ultra Long U.S. Treasury Bonds | | | (1 | ) | | December 2014 | | | (152,500 | ) | | | 63 | |
2 Year U.S. Treasury Notes | | | 23 | | | December 2014 | | | 5,033,406 | | | | 1,337 | |
5 Year U.S. Treasury Notes | | | 2 | | | December 2014 | | | 236,516 | | | | 928 | |
10 Year U.S. Treasury Notes | | | (19 | ) | | December 2014 | | | (2,368,172 | ) | | | 635 | |
20 Year U.S. Treasury Bonds | | | (7 | ) | | December 2014 | | | (965,344 | ) | | | 12,561 | |
| TOTAL | | | | | | | | | | | | $ | 35,247 | |
SWAP CONTRACTS — At September 30, 2014, the Fund had the following swap contracts:
OVER THE COUNTER INTEREST RATE SWAP CONTRACTS
| | | | | | | | | | | | | | | | | | | | |
| | | | | | | | | | | | Rates Exchanged | | | |
| Counterparty | | Notional
Amount
(000s) | | | Termination
Date | | | Payments
Received | | Payments
Made | | Unrealized
Gain (Loss)* | |
Bank of America Securities LLC | | | BRL | | | | 460 | | | | 01/02/17 | | | 11.730% | | 1 month Brazilian
Interbank Deposit
Average | | $ | (1,044 | ) |
| | | CLP | | | | 108,890 | | | | 07/03/19 | | | 6 month CLICP | | 4.130% | | | 35 | |
| | | | | | | 180,350 | | | | 08/08/19 | | | 6 month CLICP | | 3.850 | | | 4,372 | |
| | | KRW | | | | 385,000 | | | | 10/29/23 | | | 3 month KWCDC | | 3.260 | | | (18,015 | ) |
| | | | | | | 10,830 | | | | 01/16/24 | | | 3 month KWCDC | | 3.445 | | | (674 | ) |
| | | MXN | | | | 680 | | | | 03/03/26 | | | 6.930 | | Mexico Interbank TIIE
28 Days | | | 1,627 | |
Barclays Bank PLC | | | BRL | | | | 540 | | | | 01/04/16 | | | 11.555 | | 1 month Brazilian
Interbank Deposit
Average | | | 560 | |
| | | | | | | 440 | | | | 01/02/17 | | | 12.190 | | 1 month Brazilian
Interbank Deposit
Average | | | 1,179 | |
| | | KRW | | | | 357,150 | (a) | | | 09/23/24 | | | 3 month KWCDC | | 3.138 | | | (2,309 | ) |
Citibank NA | | | BRL | | | | 120 | | | | 01/04/16 | | | 1 month Brazilian
Interbank Deposit
Average | | 11.945 | | | (224 | ) |
| | | | | | | 250 | | | | 01/04/16 | | | 11.190 | | 1 month Brazilian
Interbank Deposit
Average | | | (727 | ) |
| | | | | | | 980 | | | | 01/02/17 | | | 11.455 | | 1 month Brazilian
Interbank Deposit
Average | | | (4,102 | ) |
| | | CLP | | | | 55,160 | | | | 03/13/19 | | | 6 month CLICP | | 4.650 | | | (2,238 | ) |
| | | | | | | 37,280 | | | | 09/12/19 | | | 6 month CLICP | | 4.050 | | | 428 | |
| | | KRW | | | | 405,460 | | | | 06/05/23 | | | 3 month KWCDC | | 3.040 | | | (11,960 | ) |
| | | | | | | 19,600 | | | | 01/10/24 | | | 3 month KWCDC | | 3.475 | | | (1,270 | ) |
| | | COP | | | | 24,640 | | | | 04/16/24 | | | 3 month COP | | 5.920 | | | 258 | |
| | | KRW | | | | 74,700 | | | | 04/16/24 | | | 3 month KWCDC | | 3.295 | | | (3,782 | ) |
| | |
| 52 | | The accompanying notes are an integral part of these financial statements. |
GOLDMAN SACHS DYNAMIC EMERGING MARKETS DEBT FUND
|
| ADDITIONAL INVESTMENT INFORMATION (continued) |
OVER THE COUNTER INTEREST RATE SWAP CONTRACTS (continued)
| | | | | | | | | | | | | | | | | | | | |
| | | | | | | | | | | | Rates Exchanged | | | |
| Counterparty | | Notional
Amount
(000s) | | | Termination
Date | | | Payments
Received | | Payments
Made | | Unrealized
Gain (Loss)* | |
Credit Suisse International (London) | | | CLP | | | | 36,600 | | | | 03/28/16 | | | 6 month CLICP | | 3.860% | | $ | (543 | ) |
| | | BRL | | | | 260 | | | | 01/02/17 | | | 11.770% | | 1 month Brazilian
Interbank Deposit
Average | | | (517 | ) |
| | | CLP | | | | 42,120 | | | | 04/28/17 | | | 6 month CLICP | | 3.980 | | | (855 | ) |
| | | | | | | 22,170 | | | | 05/12/17 | | | 6 month CLICP | | 3.950 | | | (415 | ) |
| | | BRL | | | | 170 | | | | 01/02/18 | | | 11.120 | | 1 month Brazilian
Interbank Deposit
Average | | | (1,539 | ) |
| | | | | | | 1,180 | | | | 01/02/18 | | | 11.935 | | 1 month Brazilian
Interbank Deposit
Average | | | (2,438 | ) |
| | | CLP | | | | 35,560 | | | | 02/28/19 | | | 6 month CLICP | | 4.573 | | | (1,300 | ) |
| | | | | | | 10,000 | | | | 03/26/19 | | | 6 month CLICP | | 4.540 | | | (318 | ) |
| | | COP | | | | 95,320 | | | | 04/15/19 | | | 3 month COP | | 5.110 | | | 243 | |
| | | | | | | 69,110 | | | | 06/18/19 | | | 3 month COP | | 5.350 | | | (32 | ) |
Deutsche Bank AG | | | BRL | | | | 250 | | | | 01/04/16 | | | 11.230 | | 1 month Brazilian
Interbank Deposit
Average | | | (683 | ) |
| | | | | | | 1,050 | | | | 01/04/16 | | | 11.650 | | 1 month Brazilian
Interbank Deposit
Average | | | (1,105 | ) |
| | | | | | | 1,850 | | | | 01/04/16 | | | 9.280 | | 1 month Brazilian
Interbank Deposit
Average | | | (24,399 | ) |
| | | KRW | | | | 61,770 | | | | 03/03/17 | | | 2.850 | | 3 month KWCDC | | | 800 | |
| | | BRL | | | | 140 | | | | 01/02/18 | | | 11.150 | | 1 month Brazilian
Interbank Deposit
Average | | | (1,228 | ) |
| | | MXN | | | | 990 | | | | 09/25/18 | | | Mexico Interbank TIIE
28 Days | | 5.180 | | | (326 | ) |
| | | CLP | | | | 9,970 | | | | 10/22/18 | | | 6 month CLICP | | 4.860 | | | (654 | ) |
| | | | | | | 16,470 | | | | 02/24/19 | | | 6 month CLICP | | 4.595 | | | (632 | ) |
| | | | | | | 49,000 | | | | 03/26/19 | | | 6 month CLICP | | 4.550 | | | (1,592 | ) |
| | | | | | | 68,830 | | | | 04/10/19 | | | 6 month CLICP | | 4.430 | | | (1,923 | ) |
| | | COP | | | | 14,300 | | | | 06/17/19 | | | 3 month COP | | 5.320 | | | 2 | |
| | | KRW | | | | 19,460 | | | | 01/08/24 | | | 3 month KWCDC | | 3.470 | | | (1,254 | ) |
| | | | | | | 189,410 | | | | 03/13/24 | | | 3 month KWCDC | | 3.330 | | | (9,956 | ) |
| | | | | | | 173,010 | | | | 07/30/24 | | | 3 month KWCDC | | 2.905 | | | (3,125 | ) |
| | | MXN | | | | 3,740 | (a) | | | 02/15/29 | | | 9.625 | | Mexico Interbank TIIE
28 Days | | | 9,192 | |
JPMorgan Securities, Inc. | | | COP | | | | 67,690 | | | | 04/22/19 | | | 3 month COP | | 5.190 | | | 88 | |
| | | KRW | | | | 91,820 | | | | 01/07/24 | | | 3 month KWCDC | | 3.471 | | | (5,925 | ) |
| | | | | | | 8,650 | | | | 01/13/24 | | | 3 month KWCDC | | 3.465 | | | (554 | ) |
| | | | | | | 28,590 | | | | 01/15/24 | | | 3 month KWCDC | | 3.445 | | | (1,781 | ) |
| | | | | | | 243,740 | | | | 07/03/24 | | | 3 month KWCDC | | 2.965 | | | (5,738 | ) |
| | | | | | | 783,210 | | | | 09/19/24 | | | 3 month KWCDC | | 3.126 | | | (4,724 | ) |
Morgan Stanley & Co. International PLC | | | BRL | | | | 1,070 | | | | 01/02/17 | | | 11.565 | | 1 month Brazilian
Interbank Deposit
Average | | | (3,700 | ) |
| | |
| The accompanying notes are an integral part of these financial statements. | | 53 |
GOLDMAN SACHS DYNAMIC EMERGING MARKETS DEBT FUND
Schedule of Investments (continued)
September 30, 2014 (Unaudited)
|
| ADDITIONAL INVESTMENT INFORMATION (continued) |
OVER THE COUNTER INTEREST RATE SWAP CONTRACTS (continued)
| | | | | | | | | | | | | | | | | | | | |
| | | | | | | | | | | | Rates Exchanged | | | |
| Counterparty | | Notional
Amount
(000s) | | | Termination
Date | | | Payments
Received | | Payments
Made | | Unrealized
Gain (Loss)* | |
Morgan Stanley & Co. International PLC (continued) | | | BRL | | | | 150 | | | | 01/04/21 | | | 1 month Brazilian
Interbank Deposit
Average | | 11.410% | | $ | 1,130 | |
| | | | | | | 540 | | | | 01/04/16 | | | 11.670% | | 1 month Brazilian
Interbank Deposit
Average | | | (523 | ) |
| | | CLP | | | | 9,800 | | | | 04/15/19 | | | 6 month CLICP | | 4.350 | | | (210 | ) |
| | | ZAR | | | | 6,350 | | | | 07/23/20 | | | 7.490 | | 3 month JIBAR | | | (6,547 | ) |
| | | KRW | | | | 20,540 | | | | 01/09/24 | | | 3 month KWCDC | | 3.455 | | | (1,298 | ) |
| | | | | | | | 60,475 | | | | 01/20/24 | | | 3 month KWCDC | | 3.440 | | | (3,736 | ) |
| TOTAL | | | | | | | | | | | | | | | | | | $ | (116,001 | ) |
| | * | | There are no upfront payments on the swap contract(s), therefore the unrealized gain (loss) on the swap contracts is equal to their market value. |
| | (a) | | Represents forward starting interest rate swaps whose effective dates of commencement of accruals and cash flows occur subsequent to September 30, 2014. |
CENTRALLY CLEARED INTEREST RATE SWAP CONTRACTS
| | | | | | | | | | | | | | | | | | |
| | | | | | | Rates Exchanged | | Market Value | |
Notional
Amount
(000s) | | | Termination
Date | | | Payments
Received | | Payments
Made | | Upfront
Payments
Made (Received) | | | Unrealized
Gain (Loss) | |
| ZAR | 790 | | | | 01/06/16 | | | 6.212% | | 3 month JIBAR | | $ | — | | | $ | (339 | ) |
| | 2,470 | | | | 01/08/16 | | | 6.164 | | 3 month JIBAR | | | 1 | | | | (1,224 | ) |
| | 260 | | | | 01/09/16 | | | 6.218 | | 3 month JIBAR | | | — | | | | (113 | ) |
| | 1,120 | | | | 06/13/19 | | | 7.640 | | 3 month JIBAR | | | 1 | | | | 148 | |
| | 1,230 | | | | 09/05/19 | | | 7.280 | | 3 month JIBAR | | | (3 | ) | | | (1,147 | ) |
| | 2,400 | | | | 09/08/19 | | | 7.310 | | 3 month JIBAR | | | (6 | ) | | | (2,123 | ) |
| $ | 1,200 | (a) | | | 12/17/19 | | | 3 month LIBOR | | 2.250% | | | (4,972 | ) | | | (5,347 | ) |
| | 1,700 | (a) | | | 12/17/21 | | | 3 month LIBOR | | 2.500 | | | (7,497 | ) | | | (1,932 | ) |
| ZAR | 750 | | | | 03/14/24 | | | 3 month JIBAR | | 8.550 | | | 1 | | | | (1,612 | ) |
| | TOTAL | | | | | | | | | | | $ | (12,475 | ) | | $ | (13,689 | ) |
| | (a) | | Represents forward starting interest rate swaps whose effective dates of commencement of accruals and cash flows occur subsequent to September 30, 2014. |
| | |
| 54 | | The accompanying notes are an integral part of these financial statements. |
GOLDMAN SACHS DYNAMIC EMERGING MARKETS DEBT FUND
|
| ADDITIONAL INVESTMENT INFORMATION (continued) |
OVER THE COUNTER CREDIT DEFAULT SWAP CONTRACTS
| | | | | | | | | | | | | | | | | | | | | | | | | | |
| | | | | | | | | | | | | | | | | Market Value | |
| Counterparty | | Referenced
Obligation | | Notional
Amount
(000s) | | | Rates Received
(Paid) | | | Termination
Date | | | Credit
Spread at
September 30,
2014(b) | | | Upfront
Payments
Made (Received) | | | Unrealized
Gain (Loss) | |
Protection Purchased: | | | | | | | | | | | | | | | | | | | | | | | | |
Bank of America Securities LLC | | People’s Republic of China, 4.250%, 10/28/14 | | $ | 30 | | | | (1.000 | )% | | | 06/20/19 | | | | 0.809 | % | | $ | (169 | ) | | $ | (98 | ) |
Barclays Bank PLC | | | | | 30 | | | | (1.000 | ) | | | 03/20/19 | | | | 0.760 | | | | (117 | ) | | | (200 | ) |
Citibank NA | | | | | 480 | | | | (1.000 | ) | | | 03/20/19 | | | | 0.760 | | | | (1,945 | ) | | | (3,142 | ) |
| | | | | 1,060 | | | | (1.000 | ) | | | 06/20/19 | | | | 0.809 | | | | (7,438 | ) | | | (2,008 | ) |
JPMorgan Securities, Inc. | | | | | 30 | | | | (1.000 | ) | | | 03/20/19 | | | | 0.760 | | | | (98 | ) | | | (220 | ) |
| | | | | | 170 | | | | (1.000 | ) | | | 06/20/19 | | | | 0.809 | | | | (929 | ) | | | (585 | ) |
| TOTAL | | | | | | | | | | | | | | | | | | | | $ | (10,696 | ) | | $ | (6,253 | ) |
| | (b) | | Credit spread on the Referenced Obligation, together with the term of the swap contract, are indicators of payment/performance risk. The likelihood of a credit event occurring which would require a fund to make a payment or otherwise be required to perform under the swap contract is generally greater as the credit spread and the term of the swap contract increase. |
| | |
| The accompanying notes are an integral part of these financial statements. | | 55 |
GOLDMAN SACHS EMERGING MARKETS DEBT FUND
Schedule of Investments
September 30, 2014 (Unaudited)
| | | | | | | | | | | | | | |
Principal
Amount | | | Interest
Rate | | | Maturity
Date | | | Value | |
| | Sovereign Debt Obligations – 55.3% | |
| | Argentina – 1.7% | |
| Republic of Argentina (NR/NR) | |
| $ | 1,360,000 | | | | 8.750 | % | | | 06/02/17 | | | $ | 1,203,600 | |
| EUR | 206,416 | | | | 7.820 | (a) | | | 12/31/33 | | | | 219,651 | |
| $ | 8,776,758 | | | | 8.280 | (a) | | | 12/31/33 | | | | 7,548,012 | |
| | 2,453,567 | | | | 8.280 | (a) | | | 12/31/33 | | | | 2,048,728 | |
| EUR | 130,135,341 | | | | 0.000 | (g) | | | 12/15/35 | | | | 12,163,195 | |
| $ | 80,510,000 | | | | 0.000 | (g) | | | 12/15/35 | | | | 6,118,760 | |
| | 9,930,000 | | | | 4.383 | | | | 12/15/35 | | | | 724,890 | |
| | | | | | | | | | | | | | |
| | | | | | | | | | | | | 30,026,836 | |
| | |
| | Azerbaijan – 0.5% | |
| Republic of Azerbaijan (NR/Baa3) | |
| | 5,490,000 | | | | 4.750 | (b) | | | 03/18/24 | | | | 5,586,075 | |
| | 2,300,000 | | | | 4.750 | | | | 03/18/24 | | | | 2,340,250 | |
| | | | | | | | | | | | | | |
| | | | | | | | | | | | | 7,926,325 | |
| | |
| | Belarus – 0.2% | |
| Republic of Belarus (B-/B3) | |
| | 3,979,000 | | | | 8.750 | | | | 08/03/15 | | | | 4,058,580 | |
| | 310,000 | | | | 8.950 | | | | 01/26/18 | | | | 329,375 | |
| | | | | | | | | | | | | | |
| | | | | | | | | | | | | 4,387,955 | |
| | |
| | Belize(b)(c) – 0.1% | |
| Government of Belize (B-/NR) | |
| | 2,446,500 | | | | 5.000 | | | | 02/20/38 | | | | 1,804,294 | |
| | |
| | Brazil – 1.3% | |
| Brazil Letras do Tesouro Nacional (BBB+/Baa2)(d) | |
| BRL | 7,406,000 | | | | 0.000 | | | | 01/01/15 | | | | 2,942,439 | |
| Brazil Notas do Tesouro Nacional (BBB+/Baa2) | |
| | 9,362,051 | | | | 6.000 | | | | 08/15/40 | | | | 3,722,049 | |
| Federal Republic of Brazil (BBB-/Baa2) | |
| $ | 6,260,000 | | | | 4.250 | | | | 01/07/25 | | | | 6,197,400 | |
| Federal Republic of Brazil (BBB+/Baa2) | |
| BRL | 23,607,150 | | | | 6.000 | | | | 08/15/50 | | | | 9,302,695 | |
| | | | | | | | | | | | | | |
| | | | | | | | | | | | | 22,164,583 | |
| | |
| | Bulgaria – 1.2% | |
| Republic of Bulgaria (BBB-/Baa2) | |
| EUR | 16,040,000 | | | | 2.950 | | | | 09/03/24 | | | | 20,284,654 | |
| | |
| | Colombia – 1.8% | |
| Republic of Colombia (BBB/Baa2) | |
| $ | 3,540,000 | | | | 8.250 | | | | 12/22/14 | | | | 3,596,640 | |
| | 7,684,000 | | | | 7.375 | | | | 03/18/19 | | | | 9,182,380 | |
| | 1,560,000 | | | | 4.375 | | | | 07/12/21 | | | | 1,649,700 | |
| | 9,991,000 | | | | 4.000 | | | | 02/26/24 | | | | 10,115,887 | |
| | 440,000 | | | | 8.125 | | | | 05/21/24 | | | | 579,700 | |
| | 2,222,000 | | | | 6.125 | | | | 01/18/41 | | | | 2,599,740 | |
| | 3,830,000 | | | | 5.625 | | | | 02/26/44 | | | | 4,213,000 | |
| | | | | | | | | | | | | | |
| | | | | | | | | | | | | 31,937,047 | |
| | |
| | Costa Rica – 0.5% | |
| Republic of Costa Rica (BB/Ba1) | |
| | 390,000 | | | | 9.995 | | | | 08/01/20 | | | | 493,350 | |
| | 6,830,000 | | | | 5.625 | (b) | | | 04/30/43 | | | | 5,839,650 | |
| | 2,140,000 | | | | 5.625 | | | | 04/30/43 | | | | 1,829,700 | |
| | 1,430,000 | | | | 7.000 | | | | 04/04/44 | | | | 1,437,150 | |
| | | | | | | | | | | | | | |
| | | | | | | | | | | | | 9,599,850 | |
| | |
Principal
Amount | | | Interest
Rate | | | Maturity
Date | | | Value | |
| | Sovereign Debt Obligations – (continued) | |
| | Croatia – 3.4% | |
| Republic of Croatia (BB/Ba1) | |
| $ | 21,547,000 | | | | 6.250 | % | | | 04/27/17 | | | $ | 22,893,688 | |
| | 5,220,000 | | | | 6.750 | | | | 11/05/19 | | | | 5,748,525 | |
| | 13,740,000 | | | | 6.375 | | | | 03/24/21 | | | | 14,890,725 | |
| EUR | 10,070,000 | | | | 3.875 | | | | 05/30/22 | | | | 12,791,670 | |
| $ | 3,411,000 | | | | 5.500 | | | | 04/04/23 | | | | 3,509,066 | |
| | | | | | | | | | | | | | |
| | | | | | | | | | | | | 59,833,674 | |
| | |
| | Dominican Republic – 3.2% | |
| Dominican Republic (B+/B1) | |
| | 2,371,763 | | | | 9.040 | | | | 01/23/18 | | | | 2,573,363 | |
| | 3,320,000 | | | | 7.500 | (b) | | | 05/06/21 | | | | 3,710,100 | |
| | 14,182,000 | | | | 7.500 | | | | 05/06/21 | | | | 15,848,385 | |
| Dominican Republic (NR/NR)(b) | |
| DOP | 198,100,000 | | | | 18.500 | | | | 02/04/28 | | | | 6,106,852 | |
| Dominican Republic (B+/B1)(b) | |
| $ | 2,247,000 | | | | 5.875 | | | | 04/18/24 | | | | 2,280,705 | |
| Dominican Republic (NR/NR) | |
| DOP | 11,200,000 | | | | 18.500 | | | | 02/04/28 | | | | 345,264 | |
| Dominican Republic (B+/B1) | |
| $ | 1,300,000 | | | | 5.875 | | | | 04/18/24 | | | | 1,319,500 | |
| | 4,780,000 | | | | 6.600 | (b) | | | 01/28/24 | | | | 5,126,550 | |
| | 15,320,000 | | | | 7.450 | (b) | | | 04/30/44 | | | | 16,392,400 | |
| | 200,000 | | | | 6.600 | | | | 01/28/24 | | | | 214,500 | |
| | 1,360,000 | | | | 7.450 | | | | 04/30/44 | | | | 1,455,200 | |
| | | | | | | | | | | | | | |
| | | | | | | | | | | | | 55,372,819 | |
| | |
| | Ecuador – 0.6% | |
| Ecuador Government International Bond (B+/NR) | |
| | 7,750,000 | | | | 7.950 | (b) | | | 06/20/24 | | | | 8,060,000 | |
| | 2,500,000 | | | | 7.950 | | | | 06/20/24 | | | | 2,600,000 | |
| | | | | | | | | | | | | | |
| | | | | | | | | | | | | 10,660,000 | |
| | |
| | Egypt – 0.5% | |
| Republic of Egypt (B-/Caa1) | |
| | 8,530,000 | | | | 5.750 | | | | 04/29/20 | | | | 8,936,028 | |
| | |
| | El Salvador – 0.8% | |
| El Salvador Government International Bond (BB-/Ba3) | |
| | 690,000 | | | | 7.375 | | | | 12/01/19 | | | | 765,900 | |
| | 4,800,000 | | | | 6.375 | (b) | | | 01/18/27 | | | | 4,800,000 | |
| | 1,870,000 | | | | 8.250 | | | | 04/10/32 | | | | 2,158,934 | |
| | 1,870,000 | | | | 7.650 | | | | 06/15/35 | | | | 2,000,900 | |
| | 1,180,000 | | | | 7.650 | (b) | | | 06/15/35 | | | | 1,262,600 | |
| | 2,320,000 | | | | 7.625 | | | | 02/01/41 | | | | 2,447,600 | |
| | | | | | | | | | | | | | |
| | | | | | | | | | | | | 13,435,934 | |
| | |
| | Gabon – 0.9% | |
| Republic of Gabon (BB-/NR) | |
| | 5,721,800 | | | | 6.375 | (b) | | | 12/12/24 | | | | 6,085,134 | |
| | 8,542,000 | | | | 6.375 | | | | 12/12/24 | | | | 9,084,417 | |
| | | | | | | | | | | | | | |
| | | | | | | | | | | | | 15,169,551 | |
| | |
| | Ghana – 0.7% | |
| Republic of Ghana (B/B2) | |
| | 3,609,000 | | | | 8.500 | | | | 10/04/17 | | | | 3,870,653 | |
| | 2,090,000 | | | | 7.875 | | | | 08/07/23 | | | | 2,093,135 | |
| | 6,620,000 | | | | 8.125 | (b) | | | 01/18/26 | | | | 6,636,550 | |
| | | | | | | | | | | | | | |
| | | | | | | | | | | | | 12,600,338 | |
| | |
| | |
| 56 | | The accompanying notes are an integral part of these financial statements. |
GOLDMAN SACHS EMERGING MARKETS DEBT FUND
| | | | | | | | | | | | | | |
Principal
Amount | | | Interest
Rate | | | Maturity
Date | | | Value | |
| | Sovereign Debt Obligations – (continued) | |
| | Guatemala – 0.6% | |
| Republic of Guatemala (BB/Ba1) | |
| $ | 3,300,000 | | | | 5.750 | %(b) | | | 06/06/22 | | | $ | 3,638,250 | |
| | 1,350,000 | | | | 5.750 | | | | 06/06/22 | | | | 1,488,375 | |
| | 1,910,000 | | | | 4.875 | (b) | | | 02/13/28 | | | | 1,938,783 | |
| | 2,325,000 | | | | 4.875 | | | | 02/13/28 | | | | 2,360,038 | |
| | 1,285,000 | | | | 8.125 | (e) | | | 10/06/34 | | | | 1,689,775 | |
| | | | | | | | | | | | | | |
| | | | | | | | | | | | | 11,115,221 | |
| | |
| | Honduras(b) – 1.3% | |
| Republic of Honduras (B/B3) | |
| | 12,410,000 | | | | 8.750 | | | | 12/16/20 | | | | 14,054,325 | |
| | 8,170,000 | | | | 7.500 | | | | 03/15/24 | | | | 8,721,475 | |
| | | | | | | | | | | | | | |
| | | | | | | | | | | | | 22,775,800 | |
| | |
| | Hungary – 0.2% | |
| Hungary Government Bond (BB/Ba1) | |
| | 3,920,000 | | | | 4.000 | | | | 03/25/19 | | | | 4,003,339 | |
| | |
| | Indonesia – 3.7% | |
| Perusahaan Penerbit SBSN (BB+/Baa3) | |
| | 560,000 | | | | 3.300 | | | | 11/21/22 | | | | 513,100 | |
| Perusahaan Penerbit SBSN (NR/Baa3)(b) | |
| | 3,230,000 | | | | 4.350 | | | | 09/10/24 | | | | 3,151,269 | |
| Republic of Indonesia (BB+/Baa3) | |
| | 820,000 | | | | 7.500 | | | | 01/15/16 | | | | 879,967 | |
| | 914,000 | | | | 11.625 | | | | 03/04/19 | | | | 1,215,620 | |
| | 3,250,000 | | | | 5.875 | | | | 03/13/20 | | | | 3,570,937 | |
| | 1,460,000 | | | | 3.750 | | | | 04/25/22 | | | | 1,405,250 | |
| | 6,770,000 | | | | 3.375 | | | | 04/15/23 | | | | 6,279,175 | |
| | 720,000 | | | | 5.375 | | | | 10/17/23 | | | | 765,000 | |
| | 4,050,000 | | | | 5.875 | (b) | | | 01/15/24 | | | | 4,455,000 | |
| | 2,210,000 | | | | 5.875 | | | | 01/15/24 | | | | 2,431,000 | |
| | 1,880,000 | | | | 8.500 | | | | 10/12/35 | | | | 2,538,000 | |
| | 1,550,000 | | | | 6.625 | | | | 02/17/37 | | | | 1,751,500 | |
| | 3,198,000 | | | | 7.750 | (b) | | | 01/17/38 | | | | 4,049,467 | |
| | 14,654,000 | | | | 7.750 | | | | 01/17/38 | | | | 18,555,627 | |
| | 1,240,000 | | | | 5.250 | | | | 01/17/42 | | | | 1,190,400 | |
| | 1,030,000 | | | | 4.625 | | | | 04/15/43 | | | | 905,113 | |
| | 9,480,000 | | | | 6.750 | | | | 01/15/44 | | | | 11,089,704 | |
| | | | | | | | | | | | | | |
| | | | | | | | | | | | | 64,746,129 | |
| | |
| | Iraq – 0.6% | |
| Republic of Iraq (NR/NR) | |
| | 11,540,000 | | | | 5.800 | | | | 01/15/28 | | | | 10,357,150 | |
| | |
| | Ivory Coast(b) – 0.5% | |
| Republic of Ivory Coast (NR/B1) | |
| | 8,910,000 | | | | 5.375 | | | | 07/23/24 | | | | 8,464,500 | |
| | |
| | Jamaica – 0.3% | |
| Government of Jamaica (B-/Caa3) | |
| | 5,540,000 | | | | 7.625 | | | | 07/09/25 | | | | 5,900,100 | |
| | |
| | Lithuania – 1.3% | |
| Republic of Lithuania (A-/Baa1) | |
| | 8,540,000 | | | | 7.375 | | | | 02/11/20 | | | | 10,289,163 | |
| | 9,450,000 | | | | 6.125 | | | | 03/09/21 | | | | 10,946,471 | |
| | 1,800,000 | | | | 6.625 | | | | 02/01/22 | | | | 2,154,834 | |
| | | | | | | | | | | | | | |
| | | | | | | | | | | | | 23,390,468 | |
| | |
| | Sovereign Debt Obligations – (continued) | |
| | Macedonia(b) – 0.4% | |
| Republic of Macedonia (BB-/NR) | |
| EUR | 5,960,000 | | | | 3.975 | % | | | 07/24/21 | | | $ | 7,627,900 | |
| | |
| | Malaysia – 0.9% | |
| Malaysia Government Bond (NR/NR) | |
| MYR | 38,000,000 | | | | 4.181 | | | | 07/15/24 | | | | 11,833,168 | |
| Wakala Global Sukuk Bhd (A-/A3) | |
| $ | 2,990,000 | | | | 4.646 | | | | 07/06/21 | | | | 3,299,148 | |
| | | | | | | | | | | | | | |
| | | | | | | | | | | | | 15,132,316 | |
| | |
| | Mexico – 4.4% | |
| United Mexican States (BBB+/A3) | |
| | 2,364,000 | | | | 6.050 | | | | 01/11/40 | | | | 2,783,610 | |
| United Mexican States (A/A3) | |
| MXN | 250,100 | | | | 8.500 | | | | 11/18/38 | | | | 22,051 | |
| United Mexican States (BBB+/A3) | |
| $ | 5,514,000 | | | | 3.625 | | | | 03/15/22 | | | | 5,596,710 | |
| | 11,730,000 | | | | 4.750 | | | | 03/08/44 | | | | 11,612,700 | |
| United Mexican States (A/A3) | |
| MXN | 4,382,200 | | | | 7.500 | | | | 06/03/27 | | | | 357,301 | |
| | 10,713,200 | | | | 8.500 | | | | 05/31/29 | | | | 942,620 | |
| United Mexican States (BBB+/A3) | |
| $ | 3,380,000 | | | | 4.000 | | | | 10/02/23 | | | | 3,491,540 | |
| United Mexican States (A/A3) | |
| MXN | 40,476,000 | | | | 8.000 | | | | 12/07/23 | | | | 3,422,446 | |
| United Mexican States (NR/NR)(d) | |
| | 241,891,680 | | | | 0.000 | | | | 10/16/14 | | | | 17,962,715 | |
| United Mexican States (A/A3) | |
| | 46,958,272 | | | | 5.000 | | | | 06/16/16 | | | | 3,797,728 | |
| United Mexican States (BBB+/A3) | |
| $ | 4,381,000 | | | | 5.550 | | | | 01/21/45 | | | | 4,862,910 | |
| United Mexican States (NR/A3) | |
| MXN | 218,930,300 | | | | 4.750 | | | | 06/14/18 | | | | 16,196,042 | |
| United Mexican States (NR/NR)(d) | |
| | 58,704,030 | | | | 0.000 | | | | 12/18/14 | | | | 4,343,849 | |
| | 20,981,220 | | | | 0.000 | | | | 03/19/15 | | | | 1,540,492 | |
| | | | | | | | | | | | | | |
| | | | | | | | | | | | | 76,932,714 | |
| | |
| | Netherlands – 0.7% | |
| Republic of Mozambique (NR/B1) | |
| $ | 12,275,000 | | | | 6.305 | | | | 09/11/20 | | | | 12,256,588 | |
| | |
| | Pakistan – 0.7% | |
| Islamic Republic of Pakistan (B-/Caa1) | |
| | 1,070,000 | | | | 6.875 | (b) | | | 06/01/17 | | | | 1,079,363 | |
| | 1,830,000 | | | | 6.875 | | | | 06/01/17 | | | | 1,846,012 | |
| | 3,500,000 | | | | 7.250 | (b) | | | 04/15/19 | | | | 3,504,375 | |
| | 2,550,000 | | | | 8.250 | (b) | | | 04/15/24 | | | | 2,550,000 | |
| | 2,900,000 | | | | 7.875 | | | | 03/31/36 | | | | 2,555,625 | |
| | | | | | | | | | | | | | |
| | | | | | | | | | | | | 11,535,375 | |
| | |
| | Panama – 2.4% | |
| Panama Notas del Tesoro (NR/NR) | |
| | 920,000 | | | | 4.875 | | | | 02/05/21 | | | | 969,546 | |
| Republic of Panama (BBB/Baa2) | |
| | 7,700,000 | | | | 4.000 | | | | 09/22/24 | | | | 7,680,750 | |
| | 4,438,000 | | | | 8.875 | | | | 09/30/27 | | | | 6,313,055 | |
| | 2,748,000 | | | | 9.375 | (e) | | | 04/01/29 | | | | 4,080,780 | |
| | |
| | |
| The accompanying notes are an integral part of these financial statements. | | 57 |
GOLDMAN SACHS EMERGING MARKETS DEBT FUND
Schedule of Investments (continued)
September 30, 2014 (Unaudited)
| | | | | | | | | | | | | | |
Principal
Amount | | | Interest
Rate | | | Maturity
Date | | | Value | |
| | Sovereign Debt Obligations – (continued) | |
| | Panama – (continued) | |
| Republic of Panama (BBB/Baa2) – (continued) | |
| $ | 18,340,000 | | | | 6.700 | % | | | 01/26/36 | | | $ | 22,488,508 | |
| | 680,000 | | | | 4.300 | | | | 04/29/53 | | | | 586,500 | |
| | | | | | | | | | | | | | |
| | | | | | | | | | | | | 42,119,139 | |
| | |
| | Paraguay – 1.8% | |
| Republic of Paraguay (BB/Ba2) | |
| | 9,090,000 | | | | 4.625 | (b) | | | 01/25/23 | | | | 9,249,075 | |
| | 6,760,000 | | | | 4.625 | | | | 01/25/23 | | | | 6,878,300 | |
| | 14,250,000 | | | | 6.100 | (b) | | | 08/11/44 | | | | 15,069,375 | |
| | | | | | | | | | | | | | |
| | | | | | | | | | | | | 31,196,750 | |
| | |
| | Peru – 0.8% | |
| Republic of Peru (BBB+/A3) | |
| | 2,932,000 | | | | 7.350 | | | | 07/21/25 | | | | 3,826,260 | |
| | 6,201,000 | | | | 8.750 | | | | 11/21/33 | | | | 9,456,525 | |
| | 1,120,000 | | | | 6.550 | | | | 03/14/37 | | | | 1,411,200 | |
| | | | | | | | | | | | | | |
| | | | | | | | | | | | | 14,693,985 | |
| | |
| | Philippines – 1.4% | |
| Republic of Philippines (BBB/Baa3) | |
| | 1,750,000 | | | | 9.875 | | | | 01/15/19 | | | | 2,266,250 | |
| | 5,869,000 | | | | 8.375 | | | | 06/17/19 | | | | 7,336,250 | |
| | 4,032,000 | | | | 4.200 | | | | 01/21/24 | | | | 4,253,760 | |
| | 5,550,000 | | | | 7.750 | | | | 01/14/31 | | | | 7,693,688 | |
| | 100,000 | | | | 6.375 | | | | 01/15/32 | | | | 124,375 | |
| | 2,590,000 | | | | 6.375 | | | | 10/23/34 | | | | 3,263,400 | |
| | | | | | | | | | | | | | |
| | | | | | | | | | | | | 24,937,723 | |
| | |
| | Romania – 2.2% | |
| Republic of Romania (BBB-/Baa3) | |
| EUR | 137,000 | | | | 6.500 | | | | 06/18/18 | | | | 203,562 | |
| | 5,920,000 | | | | 4.875 | | | | 11/07/19 | | | | 8,482,950 | |
| | 12,510,000 | | | | 4.625 | | | | 09/18/20 | | | | 17,904,475 | |
| $ | 710,000 | | | | 4.875 | (b) | | | 01/22/24 | | | | 749,937 | |
| EUR | 8,970,000 | | | | 3.625 | | | | 04/24/24 | | | | 12,066,551 | |
| | | | | | | | | | | | | | |
| | | | | | | | | | | | | 39,407,475 | |
| | |
| | Russia – 0.5% | |
| Russian Federation (BBB-/Baa1) | |
| $ | 9,400,000 | | | | 4.875 | | | | 09/16/23 | | | | 9,235,500 | |
| | 7,535 | | | | 7.500 | (c) | | | 03/31/30 | | | | 8,439 | |
| | | | | | | | | | | | | | |
| | | | | | | | | | | | | 9,243,939 | |
| | |
| | Serbia(b) – 0.6% | |
| Republic of Serbia (BB-/B1) | |
| | 9,840,000 | | | | 5.875 | | | | 12/03/18 | | | | 10,258,692 | |
| | |
| | South Africa – 2.6% | |
| Republic of South Africa (BBB-/Baa1) | |
| | 2,516,000 | | | | 6.875 | | | | 05/27/19 | | | | 2,865,095 | |
| | 16,800,000 | | | | 5.875 | | | | 05/30/22 | | | | 18,522,000 | |
| | 6,770,000 | | | | 4.665 | | | | 01/17/24 | | | | 6,854,625 | |
| | 8,046,000 | | | | 5.875 | | | | 09/16/25 | | | | 8,850,600 | |
| | 8,970,000 | | | | 5.375 | | | | 07/24/44 | | | | 8,958,787 | |
| | | | | | | | | | | | | | |
| | | | | | | | | | | | | 46,051,107 | |
| | |
| | Sovereign Debt Obligations – (continued) | |
| | Sri Lanka – 1.0% | |
| Republic of Sri Lanka (B+/NR) | |
| $ | 540,000 | | | | 7.400 | %(b) | | | 01/22/15 | | | $ | 547,765 | |
| | 274,000 | | | | 7.400 | | | | 01/22/15 | | | | 277,940 | |
| Republic of Sri Lanka (B+/B1) | |
| | 1,130,000 | | | | 6.000 | | | | 01/14/19 | | | | 1,182,263 | |
| | 5,310,000 | | | | 6.000 | (b) | | | 01/14/19 | | | | 5,555,587 | |
| | 600,000 | | | | 5.125 | | | | 04/11/19 | | | | 606,750 | |
| | 3,670,000 | | | | 6.250 | | | | 10/04/20 | | | | 3,858,088 | |
| | 3,560,000 | | | | 6.250 | | | | 07/27/21 | | | | 3,724,650 | |
| | 2,110,000 | | | | 5.875 | | | | 07/25/22 | | | | 2,157,475 | |
| | | | | | | | | | | | | | |
| | | | | | | | | | | | | 17,910,518 | |
| | |
| | Turkey – 3.3% | |
| Republic of Turkey (NR/Baa3) | |
| | 1,060,000 | | | | 7.500 | | | | 07/14/17 | | | | 1,187,200 | |
| | 2,970,000 | | | | 7.000 | | | | 03/11/19 | | | | 3,333,825 | |
| | 4,240,000 | | | | 5.625 | | | | 03/30/21 | | | | 4,505,000 | |
| | 3,260,000 | | | | 6.250 | | | | 09/26/22 | | | | 3,586,000 | |
| | 13,590,000 | | | | 5.750 | | | | 03/22/24 | | | | 14,405,400 | |
| | 570,000 | | | | 7.375 | | | | 02/05/25 | | | | 676,163 | |
| | 610,000 | | | | 8.000 | | | | 02/14/34 | | | | 780,037 | |
| | 9,331,000 | | | | 6.875 | | | | 03/17/36 | | | | 10,672,331 | |
| | 1,880,000 | | | | 6.750 | | | | 05/30/40 | | | | 2,124,400 | |
| | 12,500,000 | | | | 6.000 | | | | 01/14/41 | | | | 12,937,500 | |
| | 3,720,000 | | | | 6.625 | | | | 02/17/45 | | | | 4,157,100 | |
| | | | | | | | | | | | | | |
| | | | | | | | | | | | | 58,364,956 | |
| | |
| | Ukraine – 1.7% | |
| Financing of Infrastructural Projects State Enterprise (NR/Caa3) | |
| | 4,990,000 | | | | 8.375 | | | | 11/03/17 | | | | 4,017,449 | |
| Financing of Infrastrucural Projects State Enterprise (NR/Caa3) | |
| | 2,430,000 | | | | 9.000 | (b) | | | 12/07/17 | | | | 1,989,465 | |
| | 2,400,000 | | | | 9.000 | | | | 12/07/17 | | | | 1,964,904 | |
| | 2,030,000 | | | | 7.400 | | | | 04/20/18 | | | | 1,593,956 | |
| Ukraine Government Bond (CCC/Caa3) | |
| | 12,461,000 | | | | 6.250 | | | | 06/17/16 | | | | 10,700,884 | |
| | 3,460,000 | | | | 6.580 | | | | 11/21/16 | | | | 2,941,000 | |
| | 3,590,000 | | | | 9.250 | | | | 07/24/17 | | | | 3,150,225 | |
| | 1,500,000 | | | | 6.750 | | | | 11/14/17 | | | | 1,271,250 | |
| | 2,190,000 | | | | 7.750 | | | | 09/23/20 | | | | 1,856,025 | |
| | | | | | | | | | | | | | |
| | | | | | | | | | | | | 29,485,158 | |
| | |
| | Uruguay – 1.6% | |
| Republic of Uruguay (BBB-/Baa2) | |
| | 4,307,707 | | | | 4.500 | | | | 08/14/24 | | | | 4,512,323 | |
| | 23,522,828 | | | | 5.100 | | | | 06/18/50 | | | | 22,817,143 | |
| | | | | | | | | | | | | | |
| | | | | | | | | | | | | 27,329,466 | |
| | |
| | Venezuela – 1.6% | |
| Republic of Venezuela (CCC+/Caa1) | |
| | 14,570,000 | | | | 9.000 | | | | 05/07/23 | | | | 10,126,150 | |
| | 18,209,600 | | | | 8.250 | | | | 10/13/24 | | | | 12,018,336 | |
| | 4,650,000 | | | | 7.650 | | | | 04/21/25 | | | | 2,976,000 | |
| | 817,000 | | | | 9.250 | | | | 09/15/27 | | | | 586,198 | |
| | 3,090,000 | | | | 9.250 | | | | 05/07/28 | | | | 2,116,650 | |
| | | | | | | | | | | | | | |
| | | | | | | | | | | | | 27,823,334 | |
| | |
| | |
| 58 | | The accompanying notes are an integral part of these financial statements. |
GOLDMAN SACHS EMERGING MARKETS DEBT FUND
| | | | | | | | | | | | | | |
Principal
Amount | | | Interest
Rate | | | Maturity
Date | | | Value | |
| | Sovereign Debt Obligations – (continued) | |
| | Vietnam – 0.3% | |
| Socialist Republic of Vietnam (BB-/B1) | |
| $ | 4,310,000 | | | | 6.875 | % | | | 01/15/16 | | | $ | 4,576,703 | |
| | |
| | Zambia – 0.5% | |
| Republic of Zambia (B+/NR) | |
| | 9,391,000 | | | | 5.375 | | | | 09/20/22 | | | | 8,897,973 | |
| | |
| | TOTAL SOVEREIGN DEBT OBLIGATIONS | |
| | (Cost $972,696,632) | | | | | | | | | | | $ | 970,674,406 | |
| | |
| | | | | | | | | | | | | | |
| | Foreign Debt Obligations – 1.0% | |
| | Supranational – 1.0% | |
| Corporacion Andina de Fomento (AA-/Aa3) | |
| $ | 9,439,000 | | | | 3.750 | % | | | 01/15/16 | | | $ | 9,769,648 | |
| | 7,564,000 | | | | 4.375 | | | | 06/15/22 | | | | 8,081,778 | |
| | |
| | TOTAL FOREIGN DEBT OBLIGATIONS | |
| | (Cost $17,121,776) | | | | | | | | | | | $ | 17,851,426 | |
| | |
| | | | | | | | | | | | | | |
| | Corporate Obligations – 31.4% | |
| | Azerbaijan – 0.5% | |
| State Oil Company of the Azerbaijan Republic (BB+/Ba1) | |
| $ | 4,110,000 | | | | 5.450 | % | | | 02/09/17 | | | $ | 4,285,538 | |
| | 4,120,000 | | | | 4.750 | | | | 03/13/23 | | | | 4,032,450 | |
| | | | | | | | | | | | | | |
| | | | | | | | | | | | | 8,317,988 | |
| | |
| | Brazil – 1.9% | |
| Banco do Estado do Rio Grande do Sul SA (NR/Ba1) | |
| | 7,010,000 | | | | 7.375 | (b) | | | 02/02/22 | | | | 7,320,473 | |
| | 1,300,000 | | | | 7.375 | | | | 02/02/22 | | | | 1,357,577 | |
| Brazil Minas SPE via State of Minas Gerais (BBB-/NR) | |
| | 15,720,000 | | | | 5.333 | (b) | | | 02/15/28 | | | | 15,562,800 | |
| | 8,690,000 | | | | 5.333 | | | | 02/15/28 | | | | 8,603,100 | |
| Independencia International Ltd. (NR/NR)(a)(b) | |
| | 1,277,436 | | | | 12.000 | | | | 12/30/16 | | | | — | |
| Raizen Energy Finance Ltd. (BBB/Baa3) | |
| | 450,000 | | | | 7.000 | | | | 02/01/17 | | | | 495,000 | |
| | | | | | | | | | | | | | |
| | | | | | | | | | | | | 33,338,950 | |
| | |
| | British Virgin Islands – 1.0% | |
| Arcos Dorados Holdings, Inc. (NR/Ba2)(b) | |
| | 4,297,000 | | | | 6.625 | | | | 09/27/23 | | | | 4,299,149 | |
| PCCW Capital No 4 Ltd. (NR/NR) | |
| | 2,580,000 | | | | 5.750 | | | | 04/17/22 | | | | 2,766,998 | |
| Sinopec Group Overseas Development 2013 Ltd. (AA-/Aa3)(b) | |
| | 10,350,000 | | | | 4.375 | | | | 10/17/23 | | | | 10,691,965 | |
| | | | | | | | | | | | | | |
| | | | | | | | | | | | | 17,758,112 | |
| | |
| | Canada – 0.5% | |
| Pacific Rubiales Energy Corp. (BB+/Ba2)(b)(f) | |
| | 930,000 | | | | 5.375 | | | | 01/26/19 | | | | 936,975 | |
| | 2,067,000 | | | | 5.125 | | | | 03/28/23 | | | | 1,963,650 | |
| | 2,221,000 | | | | 5.625 | | | | 01/19/25 | | | | 2,132,049 | |
| PTTEP Canada International Finance Ltd. (BBB+/Baa1) | |
| | 1,150,000 | | | | 6.350 | (b) | | | 06/12/42 | | | | 1,323,430 | |
| | 1,460,000 | | | | 6.350 | | | | 06/12/42 | | | | 1,701,893 | |
| | | | | | | | | | | | | | |
| | | | | | | | | | | | | 8,057,997 | |
| | |
| | Corporate Obligations – (continued) | |
| | Chile – 3.3% | |
| AES Gener SA (BBB-/Baa3) | |
| $ | 1,320,000 | | | | 5.250 | %(b) | | | 08/15/21 | | | $ | 1,379,004 | |
| | 5,279,000 | | | | 5.250 | | | | 08/15/21 | | | | 5,514,971 | |
| AES Gener SA (NR/Ba2)(b)(f)(g) | |
| | 3,150,000 | | | | 8.375 | | | | 12/18/73 | | | | 3,535,875 | |
| Banco del Estado de Chile | |
| | 3,550,000 | | | | 4.125 | (b) | | | 10/07/20 | | | | 3,709,750 | |
| | 2,340,000 | | | | 3.875 | (b) | | | 02/08/22 | | | | 2,363,400 | |
| | 1,510,000 | | | | 3.875 | | | | 02/08/22 | | | | 1,525,100 | |
| CFR International SpA (BB+/NR)(f) | |
| | 2,180,000 | | | | 5.125 | | | | 12/06/22 | | | | 2,357,114 | |
| Corpbanca SA (NR/Baa3)(b) | |
| | 7,311,000 | | | | 3.875 | | | | 09/22/19 | | | | 7,336,589 | |
| E.CL SA (BBB/NR) | |
| | 2,490,000 | | | | 5.625 | (b) | | | 01/15/21 | | | | 2,689,200 | |
| | 430,000 | | | | 5.625 | | | | 01/15/21 | | | | 464,400 | |
| Embotelladora Andina SA (BBB/NR)(b) | |
| | 1,500,000 | | | | 5.000 | | | | 10/01/23 | | | | 1,575,750 | |
| Empresa de Transporte de Pasajeros Metro SA (AA-/NR)(b) | |
| | 1,200,000 | | | | 4.750 | | | | 02/04/24 | | | | 1,245,000 | |
| ENTEL Chile SA (BBB/Baa2) | |
| | 6,720,000 | | | | 4.875 | (b) | | | 10/30/24 | | | | 6,902,784 | |
| | 910,000 | | | | 4.875 | | | | 10/30/24 | | | | 934,752 | |
| GNL Quintero SA (BBB/Baa2) | |
| | 12,930,000 | | | | 4.634 | (b) | | | 07/31/29 | | | | 12,849,187 | |
| | 200,000 | | | | 4.634 | | | | 07/31/29 | | | | 198,750 | |
| Sociedad Quimica y Minera de Chile SA (BBB/Baa1) | |
| | 1,360,000 | | | | 5.500 | | | | 04/21/20 | | | | 1,485,800 | |
| | 2,333,000 | | | | 3.625 | | | | 04/03/23 | | | | 2,239,680 | |
| | | | | | | | | | | | | | |
| | | | | | | | | | | | | 58,307,106 | |
| | |
| | Colombia – 1.1% | |
| Banco de Bogota SA (BBB-/Baa1) | |
| | 1,450,000 | | | | 5.000 | (b) | | | 01/15/17 | | | | 1,529,750 | |
| | 4,324,000 | | | | 5.000 | | | | 01/15/17 | | | | 4,561,820 | |
| Bancolombia SA (NR/Baa2) | |
| | 3,520,000 | | | | 5.950 | | | | 06/03/21 | | | | 3,854,400 | |
| Ecopetrol SA (BBB/Baa2) | |
| | 1,470,000 | | | | 7.375 | | | | 09/18/43 | | | | 1,777,348 | |
| Empresas Publicas de Medellin ESP (NR/Baa3) | |
| | 2,469,000 | | | | 7.625 | | | | 07/29/19 | | | | 2,925,765 | |
| Transportadora de Gas Internacional SA ESP (BBB-/Baa3)(f) | |
| | 2,600,000 | | | | 5.700 | (b) | | | 03/20/22 | | | | 2,756,000 | |
| | 2,240,000 | | | | 5.700 | | | | 03/20/22 | | | | 2,374,400 | |
| | | | | | | | | | | | | | |
| | | | | | | | | | | | | 19,779,483 | |
| | |
| | Costa Rica – 1.2% | |
| Banco de Costa Rica (NR/Ba1) | |
| | 4,870,000 | | | | 5.250 | (b) | | | 08/12/18 | | | | 4,967,400 | |
| | 1,010,000 | | | | 5.250 | | | | 08/12/18 | | | | 1,030,200 | |
| Banco Nacional de Costa Rica (NR/Ba1) | |
| | 4,490,000 | | | | 4.875 | (b) | | | 11/01/18 | | | | 4,523,675 | |
| | 380,000 | | | | 4.875 | | | | 11/01/18 | | | | 382,850 | |
| | 9,180,000 | | | | 6.250 | (b) | | | 11/01/23 | | | | 9,202,950 | |
| | | | | | | | | | | | | | |
| | | | | | | | | | | | | 20,107,075 | |
| | |
| | |
| The accompanying notes are an integral part of these financial statements. | | 59 |
GOLDMAN SACHS EMERGING MARKETS DEBT FUND
Schedule of Investments (continued)
September 30, 2014 (Unaudited)
| | | | | | | | | | | | | | |
Principal
Amount | | | Interest
Rate | | | Maturity
Date | | | Value | |
| | Corporate Obligations – (continued) | |
| | Croatia(b) – 0.0% | |
| Hrvatska Elektroprivreda (BB-/Ba2) | |
| $ | 290,000 | | | | 6.000 | % | | | 11/09/17 | | | $ | 302,325 | |
| | |
| | Dominican Republic(c)(f) – 0.2% | |
| Aeropuertos Dominicanos Siglo XXI SA (B+/B1) | |
| | 2,812,000 | | | | 9.750 | | | | 11/13/19 | | | | 2,699,520 | |
| | |
| | Guatemala(f) – 0.2% | |
| Central American Bottling Corp. (BB/Ba2) | |
| | 2,560,000 | | | | 6.750 | (b) | | | 02/09/22 | | | | 2,756,039 | |
| | 1,274,000 | | | | 6.750 | | | | 02/09/22 | | | | 1,372,950 | |
| | | | | | | | | | | | | | |
| | | | | | | | | | | | | 4,128,989 | |
| | |
| | Hong Kong – 3.4% | |
| Biostime International Holdings Ltd. (NR/NR)(d) | |
| HKD | 16,000,000 | | | | 0.000 | | | | 02/20/19 | | | | 1,901,430 | |
| China Unicom Ltd. (NR/NR) | |
| CNH | 26,830,000 | | | | 4.000 | | | | 04/16/17 | | | | 4,322,786 | |
| CITIC Ltd. (BBB+/A3) | |
| $ | 36,820,000 | | | | 6.800 | | | | 01/17/23 | | | | 42,377,173 | |
| CITIC Pacific Ltd. (BBB+/A3) | |
| | 2,850,000 | | | | 6.875 | | | | 01/21/18 | | | | 3,195,534 | |
| | 1,400,000 | | | | 6.375 | | | | 04/10/20 | | | | 1,577,394 | |
| | 530,000 | | | | 6.625 | | | | 04/15/21 | | | | 605,785 | |
| Metropolitan Light International Ltd. (NR/NR)(f) | |
| | 4,220,000 | | | | 5.250 | | | | 01/17/18 | | | | 4,251,650 | |
| Sun Hung Kai Properties Capital Market Ltd. (A+/A1) | |
| | 2,130,000 | | | | 4.500 | | | | 02/14/22 | | | | 2,242,570 | |
| | | | | | | | | | | | | | |
| | | | | | | | | | | | | 60,474,322 | |
| | |
| | Hungary(b) – 0.2% | |
| MFB Magyar Fejlesztesi Bank Zrt (NR/Ba1) | |
| | 2,510,000 | | | | 6.250 | | | | 10/21/20 | | | | 2,753,470 | |
| | |
| | Indonesia – 1.2% | |
| Pertamina Persero PT (BB+/Baa3) | |
| | 2,820,000 | | | | 5.625 | | | | 05/20/43 | | | | 2,566,200 | |
| | 5,900,000 | | | | 5.625 | (b) | | | 05/20/43 | | | | 5,377,349 | |
| | 1,200,000 | | | | 6.450 | (b) | | | 05/30/44 | | | | 1,216,260 | |
| Perusahaan Gas Negara Persero Tbk PT (BB+/Baa3)(b) | |
| | 12,300,000 | | | | 5.125 | | | | 05/16/24 | | | | 12,346,125 | |
| | | | | | | | | | | | | | |
| | | | | | | | | | | | | 21,505,934 | |
| | |
| | Ireland – 1.5% | |
| AHML Finance Ltd. (BBB-/Baa1)(b) | |
| RUB | 103,900,000 | | | | 7.750 | | | | 02/13/18 | | | | 2,382,568 | |
| EDC Finance Ltd. (BB+/NR) | |
| $ | 2,270,000 | | | | 4.875 | (b) | | | 04/17/20 | | | | 2,031,650 | |
| | 1,800,000 | | | | 4.875 | | | | 04/17/20 | | | | 1,611,000 | |
| Mobile Telesystems OJSC via MTS International Funding Ltd.
(BBB-/Baa3) |
|
| | 5,501,000 | | | | 8.625 | | | | 06/22/20 | | | | 5,831,060 | |
| MTS International Funding Ltd. (BBB-/Baa3) | |
| | 2,283,000 | | | | 5.000 | | | | 05/30/23 | | | | 1,957,672 | |
| Phosagro OAO via Phosagro Bond Funding Ltd. (NR/Baa3) | |
| | 3,830,000 | | | | 4.204 | (b) | | | 02/13/18 | | | | 3,686,375 | |
| | 1,510,000 | | | | 4.204 | | | | 02/13/18 | | | | 1,453,375 | |
| Sibur Securities Ltd. (NR/Ba1) | |
| | 5,020,000 | | | | 3.914 | (b) | | | 01/31/18 | | | | 4,587,025 | |
| | 520,000 | | | | 3.914 | | | | 01/31/18 | | | | 475,150 | |
| | |
| | Corporate Obligations – (continued) | |
| | Ireland – (continued) | |
| Uralkali OJSC via Uralkali Finance Ltd. (NR/Baa3)(b) | |
| $ | 1,630,000 | | | | 3.723 | % | | | 04/30/18 | | | $ | 1,552,575 | |
| VIP Finance Ireland Ltd. for OJSC Vimpel Communications
(BB/Ba3) |
|
| | 270,000 | | | | 9.125 | | | | 04/30/18 | | | | 290,588 | |
| | 1,230,000 | | | | 7.748 | (b) | | | 02/02/21 | | | | 1,262,287 | |
| | | | | | | | | | | | | | |
| | | | | | | | | | | | | 27,121,325 | |
| | |
| | Israel(b) – 0.2% | |
| Delek & Avner Tamar Bond Ltd. (BBB-/Baa3) | |
| | 1,200,000 | | | | 2.803 | | | | 12/30/16 | | | | 1,197,000 | |
| | 1,200,000 | | | | 3.839 | | | | 12/30/18 | | | | 1,200,000 | |
| Israel Electric Corp. Ltd. (BBB-/Baa3) | |
| | 730,000 | | | | 5.625 | | | | 06/21/18 | | | | 775,625 | |
| | | | | | | | | | | | | | |
| | | | | | | | | | | | | 3,172,625 | |
| | |
| | Ivory Coast – 0.3% | |
| Agromercantil Senior Trust (BB/NR)(b) | |
| | 3,320,000 | | | | 6.250 | | | | 04/10/19 | | | | 3,452,038 | |
| Comcel Trust (NR/Ba1)(f) | |
| | 330,000 | | | | 6.875 | | | | 02/06/24 | | | | 349,800 | |
| Comunicaciones Celulares SA (NR/Ba1)(b)(f) | |
| | 810,000 | | | | 6.875 | | | | 02/06/24 | | | | 854,550 | |
| | | | | | | | | | | | | | |
| | | | | | | | | | | | | 4,656,388 | |
| | |
| | Kazakhstan – 1.2% | |
| Kazakhstan Temir Zholy Finance BV (BBB-/Baa3) | |
| | 1,200,000 | | | | 6.950 | (b) | | | 07/10/42 | | | | 1,293,600 | |
| | 200,000 | | | | 6.950 | | | | 07/10/42 | | | | 215,600 | |
| Kazatomprom (NR/Baa3) | |
| | 700,000 | | | | 6.250 | (b) | | | 05/20/15 | | | | 721,875 | |
| | 1,780,000 | | | | 6.250 | | | | 05/20/15 | | | | 1,835,625 | |
| KazMunayGas National Co. (BBB-/Baa3) | |
| | 2,100,000 | | | | 11.750 | (b) | | | 01/23/15 | | | | 2,160,375 | |
| | 4,300,000 | | | | 11.750 | | | | 01/23/15 | | | | 4,423,625 | |
| | 2,220,000 | | | | 9.125 | | | | 07/02/18 | | | | 2,597,400 | |
| | 7,039,000 | | | | 5.750 | (b) | | | 04/30/43 | | | | 6,619,441 | |
| | 2,018,000 | | | | 5.750 | | | | 04/30/43 | | | | 1,884,294 | |
| | | | | | | | | | | | | | |
| | | | | | | | | | | | | 21,751,835 | |
| | |
| | Luxembourg – 3.0% | |
| Gazprom Neft OAO Via GPN Capital SA (BBB-/Baa2) | |
| | 3,878,000 | | | | 4.375 | | | | 09/19/22 | | | | 3,325,385 | |
| | 14,080,000 | | | | 6.000 | (b) | | | 11/27/23 | | | | 13,235,200 | |
| | 8,230,000 | | | | 6.000 | | | | 11/27/23 | | | | 7,736,200 | |
| MHP SA (CCC/NR) | |
| | 2,040,000 | | | | 8.250 | | | | 04/02/20 | | | | 1,726,330 | |
| Millicom International Cellular SA (NR/Ba2)(b)(f) | |
| | 2,450,000 | | | | 4.750 | | | | 05/22/20 | | | | 2,327,500 | |
| Offshore Drilling Holding SA (BB/NR)(b)(f) | |
| | 3,561,000 | | | | 8.625 | | | | 09/20/20 | | | | 3,770,209 | |
| Tupy Overseas SA (BB-/NR)(f) | |
| | 4,880,000 | | | | 6.625 | (b) | | | 07/17/24 | | | | 4,977,600 | |
| | 340,000 | | | | 6.625 | | | | 07/17/24 | | | | 346,800 | |
| Wind Acquisition Finance SA (BB/Ba3)(b)(f) | |
| EUR | 3,000,000 | | | | 4.000 | | | | 07/15/20 | | | | 3,731,746 | |
| Wind Acquisition Finance SA (NR/Ba3)(b)(f) | |
| $ | 2,340,000 | | | | 4.750 | | | | 07/15/20 | | | | 2,246,400 | |
| | |
| | |
| 60 | | The accompanying notes are an integral part of these financial statements. |
GOLDMAN SACHS EMERGING MARKETS DEBT FUND
| | | | | | | | | | | | | | |
Principal
Amount | | | Interest
Rate | | | Maturity
Date | | | Value | |
| | Corporate Obligations – (continued) | |
| | Luxembourg – (continued) | |
| Wind Acquisition Finance SA (B/Caa1)(b)(f) | |
| $ | 9,730,000 | | | | 7.375 | % | | | 04/23/21 | | | $ | 9,766,487 | |
| | | | | | | | | | | | | | |
| | | | | | | | | | | | | 53,189,857 | |
| | |
| | Mexico – 2.3% | |
| America Movil SAB de CV (A-/A2) | |
| MXN | 19,010,000 | | | | 6.000 | | | | 06/09/19 | | | | 1,425,301 | |
| Cemex SAB de CV (B+/NR)(b)(f) | |
| EUR | 1,770,000 | | | | 4.750 | | | | 01/11/22 | | | | 2,241,188 | |
| $ | 3,770,000 | | | | 5.700 | | | | 01/11/25 | | | | 3,641,820 | |
| GEO Maquinaria (CC/NR) | |
| | 371,739 | | | | 9.625 | (b) | | | 05/02/21 | | | | 104,087 | |
| | 483,261 | | | | 9.625 | | | | 05/02/21 | | | | 135,313 | |
| Grupo Cementos de Chihuahua SAB de CV (B/NR)(b)(f) | |
| | 710,000 | | | | 8.125 | | | | 02/08/20 | | | | 766,343 | |
| Metalsa SA de CV (BB+/NR)(b) | |
| | 3,540,000 | | | | 4.900 | | | | 04/24/23 | | | | 3,424,950 | |
| Pemex Project Funding Master Trust (BBB+/A3) | |
| | 4,490,000 | | | | 6.625 | | | | 06/15/35 | | | | 5,191,562 | |
| Petroleos Mexicanos (BBB+/A3) | |
| | 300,000 | | | | 5.500 | | | | 01/21/21 | | | | 328,545 | |
| | 15,730,000 | | | | 6.375 | (b) | | | 01/23/45 | | | | 17,787,484 | |
| | 1,100,000 | | | | 6.375 | | | | 01/23/45 | | | | 1,243,880 | |
| Trust F/1401 (NR/Baa2) | |
| | 2,110,000 | | | | 6.950 | (b) | | | 01/30/44 | | | | 2,310,450 | |
| | 1,010,000 | | | | 6.950 | | | | 01/30/44 | | | | 1,100,900 | |
| | | | | | | | | | | | | | |
| | | | | | | | | | | | | 39,701,823 | |
| | |
| | Netherlands – 0.8% | |
| Greenko Dutch BV (B/NR)(b)(f) | |
| | 4,530,000 | | | | 8.000 | | | | 08/01/19 | | | | 4,432,424 | |
| Listrindo Capital BV (BB-/Ba2)(f) | |
| | 3,560,000 | | | | 6.950 | | | | 02/21/19 | | | | 3,764,700 | |
| Lukoil International Finance BV (BBB-/Baa2) | |
| | 1,270,000 | | | | 7.250 | | | | 11/05/19 | | | | 1,343,025 | |
| | 1,650,000 | | | | 6.125 | | | | 11/09/20 | | | | 1,654,125 | |
| VimpelCom Holdings BV (BB/Ba3) | |
| | 490,000 | | | | 7.504 | (b) | | | 03/01/22 | | | | 495,512 | |
| | 2,580,000 | | | | 7.504 | | | | 03/01/22 | | | | 2,609,025 | |
| | | | | | | | | | | | | | |
| | | | | | | | | | | | | 14,298,811 | |
| | |
| | Paraguay – 0.8% | |
| Banco Continental SAECA (BB/Ba2)(f) | |
| | 1,900,000 | | | | 8.875 | (b) | | | 10/15/17 | | | | 2,052,000 | |
| | 2,090,000 | | | | 8.875 | | | | 10/15/17 | | | | 2,272,163 | |
| Banco Regional SAECA (BB-/Ba2) | |
| | 905,000 | | | | 8.125 | | | | 01/24/19 | | | | 982,196 | |
| | 6,070,000 | | | | 8.125 | (b) | | | 01/24/19 | | | | 6,646,650 | |
| Telefonica Celular del Paraguay SA (NR/Ba3)(f) | |
| | 1,970,000 | | | | 6.750 | | | | 12/13/22 | | | | 2,043,720 | |
| | | | | | | | | | | | | | |
| | | | | | | | | | | | | 13,996,729 | |
| | |
| | Peru – 1.2% | |
| Abengoa Transmision Sur SA (BBB-/NR) | |
| | 200,000 | | | | 6.875 | | | | 04/30/43 | | | | 221,000 | |
| | 6,100,000 | | | | 6.875 | (b) | | | 04/30/43 | | | | 6,740,500 | |
| | |
| | Corporate Obligations – (continued) | |
| | Peru – (continued) | |
| Corp Financiera de Desarrollo SA (BBB+/NR) | |
| $ | 389,000 | | | | 4.750 | %(b) | | | 02/08/22 | | | $ | 404,560 | |
| | 4,208,000 | | | | 4.750 | | | | 02/08/22 | | | | 4,376,320 | |
| Corp Lindley S.A. (BB+/NR) | |
| | 1,630,000 | | | | 6.750 | (b) | | | 11/23/21 | | | | 1,793,000 | |
| | 5,980,000 | | | | 6.750 | | | | 11/23/21 | | | | 6,578,000 | |
| | 120,000 | | | | 4.625 | (b) | | | 04/12/23 | | | | 116,400 | |
| | | | | | | | | | | | | | |
| | | | | | | | | | | | | 20,229,780 | |
| | |
| | Philippines – 0.8% | |
| Alliance Global Group, Inc. (NR/NR) | |
| | 1,500,000 | | | | 6.500 | | | | 08/18/17 | | | | 1,620,000 | |
| Development Bank of Philippines (BBB/NR) | |
| | 1,610,000 | | | | 5.500 | | | | 03/25/21 | | | | 1,754,900 | |
| Energy Development Corp. (NR/NR) | |
| | 6,795,000 | | | | 6.500 | | | | 01/20/21 | | | | 7,372,575 | |
| San Miguel Corp. (NR/NR)(f) | |
| | 4,254,000 | | | | 4.875 | | | | 04/26/23 | | | | 3,913,680 | |
| | | | | | | | | | | | | | |
| | | | | | | | | | | | | 14,661,155 | |
| | |
| | Singapore – 0.4% | |
| Berau Capital Resources Pte Ltd. (B/B2)(f) | |
| | 1,210,000 | | | | 12.500 | | | | 07/08/15 | | | | 937,750 | |
| Bumi Investment Pte Ltd. (CCC-/Ca) | |
| | 1,150,000 | | | | 10.750 | | | | 10/06/17 | | | | 488,750 | |
| Olam International Ltd. (NR/NR) | |
| | 5,190,000 | | | | 6.750 | (f) | | | 01/29/18 | | | | 5,378,138 | |
| | 400,000 | | | | 7.500 | | | | 08/12/20 | | | | 452,000 | |
| | | | | | | | | | | | | | |
| | | | | | | | | | | | | 7,256,638 | |
| | |
| | South Africa(b) – 0.1% | |
| ZAR Sovereign Capital Fund (NR/Baa1) | |
| | 2,320,000 | | | | 3.903 | | | | 06/24/20 | | | | 2,291,000 | |
| | |
| | Thailand(b)(g) – 0.8% | |
| PTT Exploration & Production PCL (BBB-/Baa3) | |
| | 12,980,000 | | | | 4.875 | | | | 12/29/49 | | | | 13,113,045 | |
| | |
| | Turkey – 0.2% | |
| Export Credit Bank of Turkey (BB+/Baa3) | |
| | 270,000 | | | | 5.375 | (b) | | | 11/04/16 | | | | 281,475 | |
| | 2,240,000 | | | | 5.375 | | | | 11/04/16 | | | | 2,335,200 | |
| Hazine Mustesarligi Varlik Kiralama AS (NR/Baa3) | |
| | 208,000 | | | | 2.803 | | | | 03/26/18 | | | | 202,521 | |
| | | | | | | | | | | | | | |
| | | | | | | | | | | | | 2,819,196 | |
| | |
| | United Arab Emirates – 0.7% | |
| Dolphin Energy Ltd. (NR/A1) | |
| | 1,901,900 | | | | 5.888 | | | | 06/15/19 | | | | 2,092,090 | |
| | 2,980,000 | | | | 5.500 | | | | 12/15/21 | | | | 3,337,898 | |
| Ruwais Power Co. PJSC (A-/A3) | |
| | 5,990,000 | | | | 6.000 | (b) | | | 08/31/36 | | | | 6,708,800 | |
| | 830,000 | | | | 6.000 | | | | 08/31/36 | | | | 929,600 | |
| | | | | | | | | | | | | | |
| | | | | | | | | | | | | 13,068,388 | |
| | |
| | United Kingdom – 0.2% | |
| Ukreximbank Via Biz Finance PLC (NR/Caa3) | |
| | 290,000 | | | | 8.375 | | | | 04/27/15 | | | | 240,700 | |
| | 3,910,000 | | | | 8.750 | | | | 01/22/18 | | | | 2,914,768 | |
| | | | | | | | | | | | | | |
| | | | | | | | | | | | | 3,155,468 | |
| | |
| | |
| The accompanying notes are an integral part of these financial statements. | | 61 |
GOLDMAN SACHS EMERGING MARKETS DEBT FUND
Schedule of Investments (continued)
September 30, 2014 (Unaudited)
| | | | | | | | | | | | | | |
Principal
Amount | | | Interest
Rate | | | Maturity
Date | | | Value | |
| | Corporate Obligations – (continued) | |
| | United States – 1.0% | |
| Brazil Loan Trust 1 (BBB-/NR) | |
| $ | 13,430,000 | | | | 5.477 | %(b) | | | 07/24/23 | | | $ | 13,765,750 | |
| | 3,019,000 | | | | 5.477 | | | | 07/24/23 | | | | 3,094,475 | |
| New Cotai LLC/New Cotai Capital Corp. (NR/NR)(b)(f)(h) | |
| | 1,084,601 | | | | 10.625 | | | | 05/01/19 | | | | 1,212,833 | |
| | | | | | | | | | | | | | |
| | | | | | | | | | | | | 18,073,058 | |
| | |
| | Venezuela – 1.2% | |
| Petroleos de Venezuela SA (CCC+/NR) | |
| | 12,880,000 | | | | 9.000 | | | | 11/17/21 | | | | 8,597,400 | |
| | 5,695,000 | | | | 6.000 | | | | 11/15/26 | | | | 2,868,856 | |
| Petroleos de Venezuela SA (NR/Caa1) | |
| | 3,839,000 | | | | 9.750 | | | | 05/17/35 | | | | 2,478,075 | |
| Petroleos de Venezuela SA (CCC+/NR) | |
| | 15,390,000 | | | | 6.000 | | | | 05/16/24 | | | | 7,868,137 | |
| | | | | | | | | | | | | | |
| | | | | | | | | | | | | 21,812,468 | |
| | |
| | Vietnam(f) – 0.0% | |
| Debt and Asset Trading Corp. (NR/NR) | |
| | 660,000 | | | | 1.000 | | | | 10/10/25 | | | | 346,500 | |
| | |
| | TOTAL CORPORATE OBLIGATIONS | |
| | (Cost $556,331,613) | | | | | | | $ | 552,247,360 | |
| | |
| | | | | | | | | | | | | | |
| | Agency Debentures(d) – 4.3% | |
| FHLB | |
| $ | 30,500,000 | | | | 0.000 | % | | | 11/19/14 | | | $ | 30,499,451 | |
| | 44,500,000 | | | | 0.000 | | | | 12/17/14 | | | | 44,498,576 | |
| | |
| | TOTAL AGENCY DEBENTURES | |
| | (Cost $74,993,788) | | | | | | | $ | 74,998,027 | |
| | |
| | | | | | | | | | | | | | |
| | Structured Note – 0.5% | |
| | Brazil – 0.5% | |
| Notas do Tesouro Nacional Series B (Issuer HSBC Corp.)
(NR/NR) |
|
| BRL | 23,897,866 | | | | 6.000 | % | | | 08/15/40 | | | $ | 9,501,020 | |
| | (Cost $13,980,224) | | | | | | | | | |
| | |
| | | | | | | | | | | | | | |
| | Municipal Debt Obligations – 2.5% | |
| | Puerto Rico – 2.5% | |
| Puerto Rico Commonwealth Aqueduct & Sewer Authority RB
(Senior Lien) Series 2008 A (BB-/Caa1) |
|
| $ | 1,525,000 | | | | 6.000 | % | | | 07/01/44 | | | $ | 1,124,703 | |
| Puerto Rico Commonwealth Aqueduct & Sewer Authority RB
(Senior Lien) Series 2012 A (BB-/Caa1) |
|
| | 305,000 | | | | 5.125 | | | | 07/01/37 | | | | 216,565 | |
| | 640,000 | | | | 5.250 | | | | 07/01/42 | | | | 454,349 | |
| Puerto Rico Commonwealth Aqueduct & Sewer Authority RB
(Senior Lien) Series 2012 D (BB-/Caa1) |
|
| | 305,000 | | | | 5.000 | | | | 07/01/33 | | | | 216,620 | |
| Puerto Rico Commonwealth GO Bonds Refunding Public
Improvement Series 2006 A (BB/B2) |
|
| | 80,000 | | | | 5.250 | | | | 07/01/23 | | | | 63,834 | |
| | |
| | Municipal Debt Obligations – (continued) | |
| | Puerto Rico – (continued) | |
| Puerto Rico Commonwealth GO Bonds Refunding Public
Improvement Series 2009 B (BB/B2) |
|
| $ | 1,385,000 | | | | 5.750 | % | | | 07/01/38 | | | $ | 1,064,137 | |
| Puerto Rico Commonwealth GO Bonds Refunding Public
Improvement Series 2012 A (BB/B2) |
|
| | 1,210,000 | | | | 5.500 | | | | 07/01/26 | | | | 962,785 | |
| Puerto Rico Commonwealth GO Bonds Series 2008 A (BB/B2) | |
| | 1,315,000 | | | | 5.375 | | | | 07/01/33 | | | | 989,984 | |
| Puerto Rico Commonwealth GO Bonds Series 2014 A (BB/B2) | |
| | 17,850,000 | | | | 8.000 | | | | 07/01/35 | | | | 15,708,357 | |
| Puerto Rico Highways & Transportation Authority RB Refunding
Series 2007 CC (AA/A2) |
|
| | 125,000 | | | | 5.250 | | | | 07/01/36 | | | | 122,450 | |
| Puerto Rico Sales Tax Financing Corp. Sales Tax RB SubSeries
2009 A (BBB-/B1) |
|
| | 4,600,000 | | | | 5.500 | | | | 08/01/22 | | | | 4,130,064 | |
| Puerto Rico Sales Tax Financing Corp. Sales Tax RB
SubSeries 2009 A (BBB-/B1) |
|
| | 3,725,000 | | | | 5.250 | | | | 08/01/27 | | | | 3,100,988 | |
| | 340,000 | | | | 6.750 | | | | 08/01/32 | | | | 267,526 | |
| | 4,950,000 | | | | 5.750 | | | | 08/01/37 | | | | 4,041,823 | |
| | 1,960,000 | | | | 6.500 | | | | 08/01/44 | | | | 1,658,513 | |
| Puerto Rico Sales Tax Financing Corp. Sales Tax RB
SubSeries 2010 A (BBB-/B1) |
|
| | 8,465,000 | | | | 5.500 | | | | 08/01/37 | | | | 6,634,782 | |
| | 900,000 | | | | 5.375 | | | | 08/01/39 | | | | 686,709 | |
| Puerto Rico Sales Tax Financing Corp. Sales Tax RB
SubSeries 2010 C (BBB-/B1) |
|
| | 660,000 | | | | 6.000 | | | | 08/01/39 | | | | 540,263 | |
| | 1,575,000 | | | | 5.250 | | | | 08/01/41 | | | | 1,162,161 | |
| Puerto Rico Sales Tax Financing Corp. Sales Tax RB
SubSeries 2011 A-1 (BBB-/B1) |
|
| | 15,000 | | | | 5.250 | | | | 08/01/43 | | | | 10,982 | |
| | |
| | TOTAL MUNICIPAL DEBT OBLIGATIONS | |
| | (Cost $42,258,199) | | | | | | | $ | 43,157,595 | |
| | |
| TOTAL INVESTMENTS BEFORE SHORT-TERM
INVESTMENT |
|
| | (Cost $1,677,382,232) | | | | | | | $ | 1,668,429,834 | |
| | |
| | | | | | | | | | | | | | |
| | Short-term Investment(i) – 3.7% | |
| | Repurchase Agreement – 3.7% | |
| Joint Repurchase Agreement Account II | |
| $ | 65,100,000 | | | | 0.012 | % | | | 10/01/14 | | | $ | 65,100,000 | |
| | (Cost $65,100,000) | | | | | | | | | |
| | |
| | TOTAL INVESTMENTS – 98.7% | |
| | (Cost $1,742,482,232) | | | | | | | $ | 1,733,529,834 | |
| | |
| OTHER ASSETS IN EXCESS OF
LIABILITIES – 1.3% |
| | | 22,822,522 | |
| | |
| | NET ASSETS – 100.0% | | | $ | 1,756,352,356 | |
| | |
| | |
| 62 | | The accompanying notes are an integral part of these financial statements. |
GOLDMAN SACHS EMERGING MARKETS DEBT FUND
| | |
| The percentage shown for each investment category reflects the value of investments in that category as a percentage of net assets. |
(a) | | Security is currently in default and/or non-income producing. |
(b) | | Exempt from registration under Rule 144A of the Securities Act of 1933. Under procedures approved by the Board of Trustees, such securities have been determined to be liquid by the investment adviser and may be resold, normally to qualified institutional buyers in transactions exempt from registration. Total market value of Rule 144A securities amounts to $480,056,283, which represents approximately 27.3% of net assets as of September 30, 2014. |
(c) | | Coupon changes periodically based upon a predetermined schedule. Interest rate disclosed is that which is in effect at September 30, 2014. |
(d) | | Issued with a zero coupon. Income is recognized through the accretion of discount. |
(e) | | Security with “Put” features and resetting interest rates. Maturity dates disclosed are the puttable dates. Interest rate disclosed is that which is in effect at September 30, 2014. |
(f) | | Security with “Call” features with resetting interest rates. Maturity dates disclosed are the final maturity dates. |
(g) | | Variable rate security. Interest rate or distribution rate disclosed is that which is in effect at September 30, 2014. |
(h) | | Pay-in-kind securities. |
(i) | | Joint repurchase agreement was entered into on September 30, 2014. Additional information appears on page 123. |
Security ratings disclosed, if any, are obtained from by Standard & Poor’s/Moody’s Investor Service. A brief description of the ratings is available in the Fund’s Statement of Additional Information.
| | |
|
Currency Abbreviations: |
AUD | | —Australian Dollar |
BRL | | —Brazilian Real |
CNH | | —Chinese Yuan Renminbi Offshore |
DOP | | —Dominican Peso |
EUR | | —Euro |
HKD | | —Hong Kong Dollar |
HUF | | —Hungarian Forint |
IDR | | —Indonesian Rupiah |
ILS | | —Israeli Shekel |
INR | | —Indian Rupee |
JPY | | —Japanese Yen |
KRW | | —South Korean Won |
MXN | | —Mexican Peso |
MYR | | —Malaysian Ringgit |
PHP | | —Philippine Peso |
PLN | | —Polish Zloty |
RUB | | —Russian Ruble |
SGD | | —Singapore Dollar |
TRY | | —Turkish Lira |
TWD | | —Taiwan Dollar |
USD | | —U.S. Dollar |
| | |
Investment Abbreviations: |
FHLB | | —Federal Home Loan Bank |
GO | | —General Obligation |
KLIBOR | | —Kuala Lumpur Interbank Offered Rate |
KWCDC | | —South Korean Won Certificate of Deposit |
LIBOR | | —London Interbank Offered Rate |
NR | | —Not Rated |
RB | | —Revenue Bond |
TIIE | | —La Tasa de Interbank Equilibrium Interest Rate |
|
| | |
| The accompanying notes are an integral part of these financial statements. | | 63 |
GOLDMAN SACHS EMERGING MARKETS DEBT FUND
Schedule of Investments (continued)
September 30, 2014 (Unaudited)
|
| ADDITIONAL INVESTMENT INFORMATION |
FORWARD FOREIGN CURRENCY EXCHANGE CONTRACTS — At September 30, 2014, the Fund had the following forward foreign currency exchange contracts:
FORWARD FOREIGN CURRENCY EXCHANGE CONTRACTS WITH UNREALIZED GAIN
| | | | | | | | | | | | | | |
| Counterparty | | Contracts to
Buy/Sell | | Settlement
Date | | | Current
Value | | | Unrealized
Gain | |
Bank of America Securities LLC | | USD/EUR | | | 12/17/14 | | | $ | 48,112,624 | | | $ | 1,581,909 | |
| | USD/JPY | | | 12/17/14 | | | | 2,430,447 | | | | 55,553 | |
| | USD/MYR | | | 10/03/14 | | | | 3,907,303 | | | | 51,897 | |
Barclays Bank PLC | | USD/AUD | | | 12/17/14 | | | | 4,227,951 | | | | 173,659 | |
| | USD/BRL | | | 10/24/14 | | | | 8,495,814 | | | | 680,678 | |
| | USD/ILS | | | 12/17/14 | | | | 5,146,477 | | | | 356,913 | |
| �� | USD/INR | | | 10/07/14 | | | | 9,745,010 | | | | 153,990 | |
| | USD/INR | | | 10/27/14 | | | | 4,873,144 | | | | 77,856 | |
| | USD/KRW | | | 10/27/14 | | | | 7,367,438 | | | | 71,062 | |
| | USD/MYR | | | 10/03/14 | | | | 3,149,964 | | | | 10,232 | |
BNP Paribas SA | | EUR/PLN | | | 12/17/14 | | | | 4,881,828 | | | | 10,189 | |
| | EUR/USD | | | 12/17/14 | | | | 4,940,040 | | | | 675 | |
| | USD/AUD | | | 12/17/14 | | | | 9,580,803 | | | | 256,751 | |
| | USD/BRL | | | 10/22/14 | | | | 4,796,863 | | | | 140,137 | |
| | USD/MYR | | | 10/20/14 | | | | 4,877,434 | | | | 78,566 | |
| | USD/RUB | | | 10/27/14 | | | | 9,752,050 | | | | 165,950 | |
| | USD/TRY | | | 12/17/14 | | | | 4,418,837 | | | | 215,618 | |
Citibank NA (London) | | PHP/USD | | | 10/20/14 | | | | 2,468,503 | | | | 503 | |
| | USD/INR | | | 10/14/14 | | | | 9,784,549 | | | | 171,451 | |
| | USD/PHP | | | 10/14/14 | | | | 2,428,551 | | | | 57,449 | |
| | USD/SGD | | | 12/17/14 | | | | 7,845,375 | | | | 131,399 | |
| | USD/TRY | | | 12/17/14 | | | | 4,821,205 | | | | 160,795 | |
| | USD/TWD | | | 10/17/14 | | | | 9,807,726 | | | | 103,274 | |
| | USD/TWD | | | 10/20/14 | | | | 9,803,022 | | | | 86,978 | |
Credit Suisse International (London) | | USD/RUB | | | 10/02/14 | | | | 4,719,772 | | | | 248,228 | |
Deutsche Bank AG (London) | | RUB/USD | | | 11/17/14 | | | | 985,535 | | | | 1,724 | |
| | USD/CNH | | | 12/17/14 | | | | 24,031,341 | | | | 105,072 | |
| | USD/EUR | | | 12/17/14 | | | | 2,425,156 | | | | 60,486 | |
| | USD/INR | | | 10/07/14 | | | | 332,404 | | | | 1,585 | |
| | USD/KRW | | | 10/14/14 | | | | 9,751,487 | | | | 204,513 | |
| | USD/MXN | | | 12/17/14 | | | | 9,744,422 | | | | 130,578 | |
| | USD/MYR | | | 10/07/14 | | | | 11,066,667 | | | | 317,333 | |
| | USD/PHP | | | 10/14/14 | | | | 2,429,031 | | | | 56,969 | |
| | USD/PHP | | | 10/20/14 | | | | 4,876,314 | | | | 68,686 | |
| | USD/RUB | | | 10/02/14 | | | | 993,985 | | | | 73 | |
| | USD/RUB | | | 11/17/14 | | | | 4,274,900 | | | | 304,364 | |
HSBC Bank PLC | | TWD/USD | | | 10/20/14 | | | | 4,959,096 | | | | 3,096 | |
| | USD/BRL | | | 10/27/14 | | | | 6,878,669 | | | | 108,153 | |
| | USD/CNH | | | 12/17/14 | | | | 19,805,015 | | | | 20,985 | |
| | USD/JPY | | | 12/17/14 | | | | 2,419,007 | | | | 52,993 | |
| | USD/KRW | | | 10/22/14 | | | | 1,456,517 | | | | 18,464 | |
| | USD/KRW | | | 10/23/14 | | | | 3,410,806 | | | | 44,194 | |
| | USD/SGD | | | 12/17/14 | | | | 11,304,203 | | | | 212,415 | |
| | USD/TRY | | | 12/17/14 | | | | 4,707,231 | | | | 237,507 | |
JPMorgan Chase Bank (London) | | MXN/USD | | | 12/17/14 | | | | 4,972,381 | | | | 16,381 | |
| | USD/EUR | | | 10/30/14 | | | | 75,982,547 | | | | 1,959,515 | |
| | USD/EUR | | | 12/17/14 | | | | 2,463,069 | | | | 20,600 | |
| | USD/IDR | | | 10/31/14 | | | | 3,446,268 | | | | 69,503 | |
| | USD/INR | | | 10/29/14 | | | | 7,009,206 | | | | 84,794 | |
| | |
| 64 | | The accompanying notes are an integral part of these financial statements. |
GOLDMAN SACHS EMERGING MARKETS DEBT FUND
|
| ADDITIONAL INVESTMENT INFORMATION (continued) |
FORWARD FOREIGN CURRENCY EXCHANGE CONTRACTS WITH UNREALIZED GAIN (continued)
| | | | | | | | | | | | | | |
| Counterparty | | Contracts to
Buy/Sell | | Settlement
Date | | | Current
Value | | | Unrealized
Gain | |
JPMorgan Chase Bank (London) (continued) | | USD/JPY | | | 12/17/14 | | | $ | 9,114,720 | | | $ | 410,765 | |
| | USD/MXN | | | 12/17/14 | | | | 25,286,295 | | | | 440,905 | |
| | USD/RUB | | | 10/20/14 | | | | 2,402,749 | | | | 66,251 | |
| | USD/RUB | | | 11/17/14 | | | | 4,185,917 | | | | 267,574 | |
| | USD/TRY | | | 12/17/14 | | | | 9,577,232 | | | | 386,768 | |
Merrill Lynch International Bank Ltd. | | MXN/USD | | | 10/31/14 | | | | 3,182,720 | | | | 15,413 | |
Morgan Stanley & Co. International PLC | | TWD/USD | | | 10/17/14 | | | | 9,875,241 | | | | 5,241 | |
| | USD/AUD | | | 12/17/14 | | | | 717,091 | | | | 24,654 | |
| | USD/ILS | | | 12/17/14 | | | | 8,357,734 | | | | 512,696 | |
| | USD/TRY | | | 12/17/14 | | | | 4,477,137 | | | | 223,345 | |
Royal Bank of Canada | | USD/AUD | | | 12/17/14 | | | | 4,919,260 | | | | 18,162 | |
| | USD/JPY | | | 12/17/14 | | | | 1,225,163 | | | | 9,337 | |
Royal Bank of Scotland PLC | | USD/EUR | | | 12/17/14 | | | | 2,421,997 | | | | 61,471 | |
| | USD/HKD | | | 11/13/14 | | | | 1,464,141 | | | | 1,594 | |
| | USD/JPY | | | 12/17/14 | | | | 1,588,864 | | | | 6,922 | |
| | USD/TRY | | | 12/17/14 | | | | 9,654,559 | | | | 220,441 | |
Standard Chartered Bank | | USD/AUD | | | 12/17/14 | | | | 1,913,385 | | | | 77,894 | |
| | USD/CNH | | | 12/17/14 | | | | 19,757,665 | | | | 64,335 | |
| | USD/EUR | | | 12/17/14 | | | | 2,417,574 | | | | 66,150 | |
| | USD/TRY | | | 12/17/14 | | | | 4,307,564 | | | | 221,029 | |
State Street Bank and Trust | | AUD/USD | | | 12/17/14 | | | | 2,465,725 | | | | 11,740 | |
| | USD/JPY | | | 12/17/14 | | | | 7,244,475 | | | | 169,525 | |
UBS AG (London) | | USD/BRL | | | 10/14/14 | | | | 9,825,856 | | | | 105,144 | |
| | USD/BRL | | | 10/24/14 | | | | 15,385,032 | | | | 1,276,813 | |
| | USD/HUF | | | 12/17/14 | | | | 6,879,697 | | | | 171,671 | |
| | USD/MXN | | | 10/31/14 | | | | 61,051,989 | | | | 1,200,135 | |
Westpac Banking Corp. | | AUD/USD | | | 12/17/14 | | | | 4,941,897 | | | | 12,541 | |
| | USD/AUD | | | 12/17/14 | | | | 2,590,905 | | | | 100,446 | |
| | USD/EUR | | | 10/30/14 | | | | 17,003,478 | | | | 424,240 | |
| | USD/EUR | | | 12/17/14 | | | | 71,129,493 | | | | 1,684,667 | |
| | USD/MYR | | | 10/07/14 | | | | 5,230,318 | | | | 151,798 | |
| | USD/MYR | | | 10/20/14 | | | | 4,692,130 | | | | 91,653 | |
| | | USD/SGD | | | 12/17/14 | | | | 9,865,922 | | | | 186,150 | |
| TOTAL | | | | | | | | | | | | $ | 17,829,165 | |
FORWARD FOREIGN CURRENCY EXCHANGE CONTRACTS WITH UNREALIZED LOSS
| | | | | | | | | | | | | | |
| Counterparty | | Contracts to
Buy/Sell | | Settlement
Date | | | Current
Value | | | Unrealized
Loss | |
Bank of America Securities LLC | | EUR/USD | | | 12/17/14 | | | $ | 12,158,639 | | | $ | (215,375 | ) |
| | HUF/USD | | | 12/17/14 | | | | 4,858,797 | | | | (92,203 | ) |
Barclays Bank PLC | | EUR/PLN | | | 12/17/14 | | | | 9,827,064 | | | | (68,306 | ) |
| | EUR/USD | | | 12/17/14 | | | | 2,423,893 | | | | (56,428 | ) |
| | ILS/USD | | | 12/17/14 | | | | 2,374,938 | | | | (71,981 | ) |
| | INR/USD | | | 10/07/14 | | | | 5,275,956 | | | | (58,937 | ) |
| | INR/USD | | | 10/27/14 | | | | 6,252,931 | | | | (113,234 | ) |
| | JPY/USD | | | 12/17/14 | | | | 2,391,639 | | | | (99,361 | ) |
| | MYR/USD | | | 10/20/14 | | | | 3,959,110 | | | | (5,890 | ) |
| | MYR/USD | | | 10/29/14 | | | | 5,606,804 | | | | (29,817 | ) |
| | PLN/USD | | | 12/17/14 | | | | 6,555,370 | | | | (215,416 | ) |
| | TWD/USD | | | 10/27/14 | | | | 4,920,195 | | | | (32,805 | ) |
| | |
| The accompanying notes are an integral part of these financial statements. | | 65 |
GOLDMAN SACHS EMERGING MARKETS DEBT FUND
Schedule of Investments (continued)
September 30, 2014 (Unaudited)
|
| ADDITIONAL INVESTMENT INFORMATION (continued) |
FORWARD FOREIGN CURRENCY EXCHANGE CONTRACTS WITH UNREALIZED LOSS (continued)
| | | | | | | | | | | | | | |
| Counterparty | | Contracts to
Buy/Sell | | Settlement
Date | | | Current
Value | | | Unrealized
Loss | |
BNP Paribas SA | | AUD/USD | | | 12/17/14 | | | $ | 2,417,838 | | | $ | (40,504 | ) |
| | ILS/USD | | | 12/17/14 | | | | 7,336,113 | | | | (94,887 | ) |
| | INR/USD | | | 10/14/14 | | | | 3,156,906 | | | | (42,952 | ) |
| | PLN/USD | | | 12/17/14 | | | | 6,608,608 | | | | (152,444 | ) |
Citibank NA (London) | | AUD/USD | | | 12/17/14 | | | | 2,426,545 | | | | (36,104 | ) |
| | IDR/USD | | | 10/31/14 | | | | 3,147,770 | | | | (123,916 | ) |
| | ILS/USD | | | 12/17/14 | | | | 4,368,076 | | | | (109,924 | ) |
| | MXN/USD | | | 12/17/14 | | | | 11,481,439 | | | | (155,015 | ) |
| | MYR/USD | | | 10/03/14 | | | | 4,389,198 | | | | (105,501 | ) |
| | PHP/USD | | | 10/29/14 | | | | 2,470,514 | | | | (9,486 | ) |
Credit Suisse International (London) | | RUB/USD | | | 10/02/14 | | | | 4,642,742 | | | | (307,258 | ) |
| | RUB/USD | | | 10/27/14 | | | | 9,622,509 | | | | (282,491 | ) |
Deutsche Bank AG (London) | | AUD/USD | | | 12/17/14 | | | | 4,729,455 | | | | (184,712 | ) |
| | EUR/USD | | | 12/17/14 | | | | 14,629,291 | | | | (295,724 | ) |
| | IDR/USD | | | 11/03/14 | | | | 4,926,981 | | | | (8,019 | ) |
| | INR/USD | | | 10/29/14 | | | | 330,329 | | | | (2,417 | ) |
| | KRW/USD | | | 10/31/14 | | | | 2,417,201 | | | | (65,485 | ) |
| | PHP/USD | | | 10/20/14 | | | | 4,952,711 | | | | (3,289 | ) |
| | PLN/USD | | | 12/17/14 | | | | 4,916,719 | | | | (176,411 | ) |
| | RUB/USD | | | 10/02/14 | | | | 1,071,015 | | | | (56,223 | ) |
HSBC Bank PLC | | EUR/USD | | | 12/17/14 | | | | 6,072,369 | | | | (109,845 | ) |
| | INR/USD | | | 10/27/14 | | | | 5,781,088 | | | | (89,324 | ) |
| | MXN/USD | | | 12/17/14 | | | | 11,372,937 | | | | (144,472 | ) |
| | RUB/USD | | | 10/17/14 | | | | 2,400,605 | | | | (71,395 | ) |
| | SGD/USD | | | 12/17/14 | | | | 9,822,856 | | | | (82,144 | ) |
JPMorgan Chase Bank (London) | | JPY/USD | | | 12/17/14 | | | | 9,657,706 | | | | (232,294 | ) |
| | MYR/USD | | | 10/03/14 | | | | 2,668,069 | | | | (58,091 | ) |
| | MYR/USD | | | 10/07/14 | | | | 1,918,788 | | | | (34,201 | ) |
| | MYR/USD | | | 10/20/14 | | | | 2,469,231 | | | | (8,769 | ) |
| | RUB/USD | | | 11/17/14 | | | | 898,578 | | | | (36,884 | ) |
| | TRY/USD | | | 12/17/14 | | | | 3,636,450 | | | | (77,550 | ) |
| | USD/MXN | | | 12/17/14 | | | | 14,910,305 | | | | (32,305 | ) |
Merrill Lynch International Bank Ltd. | | EUR/USD | | | 10/30/14 | | | | 5,891,610 | | | | (118,478 | ) |
Morgan Stanley & Co. International PLC | | AUD/USD | | | 12/17/14 | | | | 2,385,623 | | | | (84,583 | ) |
| | BRL/USD | | | 10/14/14 | | | | 4,198,778 | | | | (183,521 | ) |
| | BRL/USD | | | 10/27/14 | | | | 4,845,539 | | | | (105,461 | ) |
| | EUR/HUF | | | 12/17/14 | | | | 2,492,398 | | | | (47,022 | ) |
| | EUR/USD | | | 12/17/14 | | | | 14,806,849 | | | | (77,617 | ) |
| | INR/USD | | | 10/27/14 | | | | 5,823,629 | | | | (94,326 | ) |
| | KRW/USD | | | 10/27/14 | | | | 4,857,710 | | | | (95,290 | ) |
Royal Bank of Canada | | EUR/USD | | | 12/17/14 | | | | 4,895,808 | | | | (92,083 | ) |
| | JPY/USD | | | 12/17/14 | | | | 4,758,216 | | | | (222,784 | ) |
| | MXN/USD | | | 12/17/14 | | | | 22,269,597 | | | | (443,844 | ) |
Royal Bank of Scotland PLC | | TRY/USD | | | 12/17/14 | | | | 23,853,661 | | | | (755,222 | ) |
| | USD/TRY | | | 12/17/14 | | | | 4,974,061 | | | | (18,061 | ) |
Standard Chartered Bank | | CNH/USD | | | 12/17/14 | | | | 19,757,621 | | | | (107,379 | ) |
| | INR/USD | | | 10/14/14 | | | | 18,660,789 | | | | (206,092 | ) |
| | JPY/USD | | | 12/17/14 | | | | 7,215,116 | | | | (257,884 | ) |
| | KRW/USD | | | 10/14/14 | | | | 4,932,091 | | | | (2,909 | ) |
| | MXN/USD | | | 12/17/14 | | | | 17,215,201 | | | | (380,439 | ) |
| | PLN/USD | �� | | 12/17/14 | | | | 5,681,272 | | | | (180,134 | ) |
| | TRY/USD | | | 12/17/14 | | | | 4,856,297 | | | | (92,703 | ) |
| | |
| 66 | | The accompanying notes are an integral part of these financial statements. |
GOLDMAN SACHS EMERGING MARKETS DEBT FUND
|
| ADDITIONAL INVESTMENT INFORMATION (continued) |
FORWARD FOREIGN CURRENCY EXCHANGE CONTRACTS WITH UNREALIZED LOSS (continued)
| | | | | | | | | | | | | | |
| Counterparty | | Contracts to
Buy/Sell | | Settlement
Date | | | Current
Value | | | Unrealized
Loss | |
State Street Bank and Trust | | AUD/USD | | | 12/17/14 | | | $ | 2,402,166 | | | $ | (52,075 | ) |
| | EUR/USD | | | 12/17/14 | | | | 4,875,588 | | | | (106,672 | ) |
UBS AG (London) | | BRL/USD | | | 10/14/14 | | | | 9,332,379 | | | | (601,621 | ) |
| | INR/USD | | | 10/07/14 | | | | 4,801,459 | | | | (78,756 | ) |
| | PLN/USD | | | 12/17/14 | | | | 6,632,067 | | | | (136,733 | ) |
| | RUB/USD | | | 11/17/14 | | | | 3,695,339 | | | | (282,069 | ) |
Westpac Banking Corp. | | AUD/USD | | | 12/17/14 | | | | 4,867,891 | | | | (51,687 | ) |
| | | INR/USD | | | 10/14/14 | | | | 6,096,320 | | | | (83,957 | ) |
| TOTAL | | | | | | | | | | | | $ | (9,249,191 | ) |
FUTURES CONTRACTS — At September 30, 2014, the Fund had the following futures contracts:
| | | | | | | | | | | | | | |
| Type | | Number of
Contracts
Long (Short) | | | Expiration
Date | | Current
Value | | | Unrealized
Gain (Loss) | |
Eurodollars | | | (1,139 | ) | | March 2017 | | $ | (277,844,813 | ) | | $ | 363,780 | |
Eurodollars | | | (948 | ) | | June 2017 | | | (230,802,450 | ) | | | 415,090 | |
Eurodollars | | | (567 | ) | | September 2017 | | | (137,830,612 | ) | | | 295,328 | |
Ultra Long U.S. Treasury Bonds | | | 139 | | | December 2014 | | | 21,197,500 | | | | (351,394 | ) |
2 Year U.S. Treasury Notes | | | 175 | | | December 2014 | | | 38,297,656 | | | | (8,909 | ) |
5 Year U.S. Treasury Notes | | | 644 | | | December 2014 | | | 76,158,032 | | | | 110,536 | |
10 Year U.S. Treasury Notes | | | (925 | ) | | December 2014 | | | (115,292,578 | ) | | | (379,966 | ) |
20 Year U.S. Treasury Bonds | | | (91 | ) | | December 2014 | | | (12,549,469 | ) | | | (139,279 | ) |
| TOTAL | | | | | | | | | | | | $ | 305,186 | |
SWAP CONTRACTS — At September 30, 2014, the Fund had the following swap contracts:
OVER THE COUNTER INTEREST RATE SWAP CONTRACTS
| | | | | | | | | | | | | | | | | | | | |
| | | | | | | | | | | | Rates Exchanged | | | |
| Counterparty | | | | | Notional
Amount
(000s) | | | Termination
Date | | | Payments
Received | | Payments
Made | | Unrealized
Gain (Loss)* | |
Bank of America Securities LLC | | | KRW | | | | 733,290 | | | | 01/16/24 | | | 3 month KWCDC | | 3.445% | | $ | (45,654 | ) |
| | | MXN | | | | 14,640 | | | | 03/03/26 | | | 6.930% | | Mexico Interbank TIIE 28 Days | | | 35,028 | |
Barclays Bank PLC | | | KRW | | | | 1,000,000 | | | | 08/09/23 | | | 3 month KWCDC | | 3.440 | | | (59,973 | ) |
| | | MYR | | | | 6,800 | | | | 08/14/23 | | | 3 month KLIBOR | | 4.485 | | | (29,576 | ) |
Citibank NA | | | BRL | | | | 15,410 | | | | 01/04/16 | | | 11.190 | | 1 month Brazilian Interbank Deposit
Average | | | (44,784 | ) |
| | | KRW | | | | 4,820,980 | | | | 03/07/17 | | | 2.875 | | 3 month KWCDC | | | 65,043 | |
| | | MYR | | | | 18,970 | | | | 09/17/18 | | | 3 month KLIBOR | | 3.830 | | | 25,459 | |
| | | | | | | 11,920 | | | | 09/24/18 | | | 3 month KLIBOR | | 3.785 | | | 22,125 | |
| | | | | | | 20,280 | | | | 11/19/18 | | | 3 month KLIBOR | | 3.915 | | | 9,735 | |
| | | | | | | 9,040 | | | | 11/21/18 | | | 3 month KLIBOR | | 3.960 | | | (245 | ) |
| | | BRL | | | | 5,910 | | | | 01/04/21 | | | 10.730 | | 1 month Brazilian Interbank Deposit
Average | | | (97,836 | ) |
| | | KRW | | | | 12,731,400 | | | | 08/08/23 | | | 3 month KWCDC | | 3.450 | | | (772,095 | ) |
| | | | | | | 2,069,140 | | | | 08/16/23 | | | 3 month KWCDC | | 3.485 | | | (131,393 | ) |
| | | | | | | 2,648,200 | | | | 08/21/23 | | | 3 month KWCDC | | 3.625 | | | (196,538 | ) |
| | | MYR | | | | 14,950 | | | | 11/15/23 | | | 3 month KLIBOR | | 4.450 | | | (48,494 | ) |
| | |
| The accompanying notes are an integral part of these financial statements. | | 67 |
GOLDMAN SACHS EMERGING MARKETS DEBT FUND
Schedule of Investments (continued)
September 30, 2014 (Unaudited)
|
| ADDITIONAL INVESTMENT INFORMATION (continued) |
OVER THE COUNTER INTEREST RATE SWAP CONTRACTS (continued)
| | | | | | | | | | | | | | | | | | | | |
| | | | | | | | | | | | Rates Exchanged | | | |
| Counterparty | | | | | Notional
Amount
(000s) | | | Termination
Date | | | Payments
Received | | Payments
Made | | Unrealized
Gain (Loss)* | |
Credit Suisse International (London) | | | BRL | | | | 7,820 | | | | 01/04/21 | | | 11.040% | | 1 month Brazilian Interbank
Deposit Average | | $ | (97,149 | ) |
Deutsche Bank Securities, Inc. | | | | | | | 15,170 | | | | 01/04/16 | | | 11.230 | | 1 month Brazilian Interbank
Deposit Average | | | (41,458 | ) |
| | | | | | | 64,600 | | | | 01/04/16 | | | 11.650 | | 1 month Brazilian Interbank
Deposit Average | | | (67,971 | ) |
| | | KRW | | | | 4,252,430 | | | | 03/03/17 | | | 2.850 | | 3 month KWCDC | | | 55,057 | |
| | | BRL | | | | 26,130 | | | | 01/02/18 | | | 11.870 | | 1 month Brazilian Interbank
Deposit Average | | | (68,922 | ) |
| | | MYR | | | | 19,420 | | | | 09/13/18 | | | 3 month KLIBOR | | 3.920% | | | 4,747 | |
| | | MXN | | | | 60,090 | | | | 09/25/18 | | | Mexico Interbank
TIIE 28 Days | | 5.180 | | | (19,781 | ) |
| | | MYR | | | | 16,090 | | | | 11/14/18 | | | 3 month KLIBOR | | 3.880 | | | 14,081 | |
| | | BRL | | | | 8,470 | | | | 01/04/21 | | | 11.015 | | 1 month Brazilian Interbank
Deposit Average | | | (108,018 | ) |
| | | | | | | 25,340 | | | | 01/04/21 | | | 11.230 | | 1 month Brazilian Interbank
Deposit Average | | | (251,818 | ) |
| | | KRW | | | | 21,700,000 | (a) | | | 12/21/22 | | | 3 month KWCDC | | 3.390 | | | (496,716 | ) |
| | | | | | | 1,400,000 | (a) | | | 01/08/23 | | | 3 month KWCDC | | 3.390 | | | (31,749 | ) |
| | | MYR | | | | 5,830 | | | | 08/14/23 | | | 3 month KLIBOR | | 4.490 | | | (26,027 | ) |
JPMorgan Securities, Inc. | | | KRW | | | | 38,314,470 | | | | 03/05/17 | | | 2.889 | | 3 month KWCDC | | | 531,548 | |
| | | MYR | | | | 11,150 | | | | 12/11/18 | | | 3 month KLIBOR | | 3.972 | | | (604 | ) |
| | | BRL | | | | 5,910 | | | | 01/04/21 | | | 11.045 | | 1 month Brazilian Interbank
Deposit Average | | | (72,962 | ) |
| | | KRW | | | | 3,387,950 | | | | 08/13/23 | | | 3 month KWCDC | | 3.415 | | | (196,696 | ) |
| | | MYR | | | | 6,450 | | | | 08/15/23 | | | 3 month KLIBOR | | 4.520 | | | (33,131 | ) |
| | | KRW | | | | 2,607,840 | | | | 08/19/23 | | | 3 month KWCDC | | 3.563 | | | (181,180 | ) |
| | | MYR | | | | 9,260 | | | | 09/26/23 | | | 3 month KLIBOR | | 4.330 | | | (3,845 | ) |
| | | KRW | | | | 770,160 | | | | 12/23/23 | | | 3 month KWCDC | | 3.470 | | | (48,428 | ) |
| | | | | | | 3,270,720 | | | | 01/07/24 | | | 3 month KWCDC | | 3.471 | | | (211,040 | ) |
| | | | | | | 977,430 | | | | 01/13/24 | | | 3 month KWCDC | | 3.465 | | | (62,484 | ) |
| | | | | | | 1,936,610 | | | | 01/15/24 | | | 3 month KWCDC | | 3.445 | | | (120,613 | ) |
| | | | | | | 50 | | | | 01/16/24 | | | 3 month KWCDC | | 3.457 | | | (3 | ) |
| | | | | | | 2,699,030 | | | | 01/27/24 | | | 3 month KWCDC | | 3.383 | | | (153,986 | ) |
Morgan Stanley & Co. International PLC | | | BRL | | | | 32,670 | | | | 01/04/16 | | | 11.670 | | 1 month Brazilian Interbank
Deposit Average | | | (31,671 | ) |
| | | MYR | | | | 23,990 | | | | 11/20/18 | | | 3 month KLIBOR | | 3.934 | | | 6,884 | |
| | | KRW | | | | 6,983,920 | (a) | | | 12/11/22 | | | 3 month KWCDC | | 3.260 | | | (123,452 | ) |
| | | | | | | 18,128,470 | (a) | | | 12/12/22 | | | 3 month KWCDC | | 3.290 | | | (342,698 | ) |
| | | | | | | 18,128,470 | (a) | | | 12/13/22 | | | 3 month KWCDC | | 3.300 | | | (349,645 | ) |
| | | | | | | 33,000,000 | (a) | | | 01/08/23 | | | 3 month KWCDC | | 3.380 | | | (734,878 | ) |
| | | | | | | 2,022,340 | | | | 08/16/23 | | | 3 month KWCDC | | 3.485 | | | (128,465 | ) |
| | | | | | | | 1,611,030 | | | | 01/09/24 | | | 3 month KWCDC | | 3.455 | | | (101,829 | ) |
| TOTAL | | | | | | | | | | | | | | | | | | $ | (4,764,100 | ) |
| | * | | There are no upfront payments on the swap contract(s), therefore the unrealized gain/loss of the swap contract(s) is equal to their market value. |
| | (a) | | Represents forward starting interest rate swaps whose effective dates of commencement of accruals and cash flows occur subsequent to September 30, 2014. |
| | |
| 68 | | The accompanying notes are an integral part of these financial statements. |
GOLDMAN SACHS EMERGING MARKETS DEBT FUND
|
| ADDITIONAL INVESTMENT INFORMATION (continued) |
CENTRALLY CLEARED INTEREST RATE SWAP CONTRACTS
| | | | | | | | | | | | | | | | |
| | | | | | Rates Exchanged | | Market Value | |
Notional
Amount
(000s) | | | Termination
Date | | Payments
Received | | Payments
Made | | Upfront
Payments
Made (Received) | | | Unrealized
Gain (Loss) | |
| MXN | 103,600 | | | 09/25/18 | | Mexico Interbank TIIE 28 Days | | 5.190% | | $ | 31 | | | $ | (38,152 | ) |
| $ | 69,600 | (a) | | 12/17/19 | | 3 month LIBOR | | 2.250 | | | (711,163 | ) | | | 112,665 | |
| | 46,200 | (a) | | 12/17/21 | | 3 month LIBOR | | 2.500 | | | (311,990 | ) | | | 55,765 | |
| | TOTAL | | | | | | | | | $ | (1,023,122 | ) | | $ | 130,278 | |
| | (a) | | Represents forward starting interest rate swaps whose effective dates of commencement of accruals and cash flows occur subsequent to September 30, 2014. |
OVER THE COUNTER CREDIT DEFAULT SWAP CONTRACTS
| | | | | | | | | | | | | | | | | | | | | | | | | | |
| | | | | | | | | | | | | | | | | Market Value | |
| Counterparty | | Referenced
Obligation | | Notional
Amount
(000s) | | | Rates Received
(Paid) | | | Termination
Date | | | Credit
Spread at
September 30,
2014(b) | | | Upfront
Payments
Made (Received) | | | Unrealized
Gain (Loss) | |
Protection Purchased: | | | | | | | | | | | | | | | | | | | | | | | | | | |
Bank of America Securities LLC | | People’s Republic of China 4.250%, 10/28/14 | | $ | 1,100 | | | | (1.000 | )% | | | 03/20/19 | | | | 0.760 | % | | $ | (1,860 | ) | | $ | (9,795 | ) |
| | | | | 2,680 | | | | (1.000 | ) | | | 06/20/19 | | | | 0.809 | | | | (15,551 | ) | | | (8,331 | ) |
Barclays Bank PLC | | | | | 4,140 | | | | (1.000 | ) | | | 03/20/19 | | | | 0.760 | | | | (14,483 | ) | | | (29,381 | ) |
| | | | | 3,350 | | | | (1.000 | ) | | | 09/20/19 | | | | 0.853 | | | | (48,385 | ) | | | 24,090 | |
Citibank NA | | | | | 28,220 | | | | (1.000 | ) | | | 03/20/19 | | | | 0.760 | | | | (86,341 | ) | | | (212,649 | ) |
| | | | | 600 | | | | (1.000 | ) | | | 03/20/19 | | | | 0.760 | | | | (3,578 | ) | | | (2,779 | ) |
| | | | | 6,200 | | | | (1.000 | ) | | | 03/20/19 | | | | 0.760 | | | | (44,980 | ) | | | (20,709 | ) |
| | | | | 12,360 | | | | (1.000 | ) | | | 06/20/19 | | | | 0.809 | | | | (5,426 | ) | | | (104,716 | ) |
| | | | | 25,480 | | | | (1.000 | ) | | | 06/20/19 | | | | 0.809 | | | | (167,605 | ) | | | (59,450 | ) |
JPMorgan Securities, Inc. | | | | | 3,900 | | | | (1.000 | ) | | | 03/20/19 | | | | 0.760 | | | | (12,249 | ) | | | (29,071 | ) |
| | | | | 6,200 | | | | (1.000 | ) | | | 03/20/19 | | | | 0.760 | | | | (43,520 | ) | | | (22,169 | ) |
| | | | | 4,400 | | | | (1.000 | ) | | | 06/20/19 | | | | 0.809 | | | | (25,576 | ) | | | (13,632 | ) |
| | | | | 7,400 | | | | (1.000 | ) | | | 09/20/19 | | | | 0.853 | | | | (106,905 | ) | | | 53,236 | |
Protection Sold: | | | | | | | | | | | | | | | | | | | | | | | | | | |
Citibank NA | | Federative Republic of Brazil 12.250%, 03/06/30 | | | 4,000 | | | | 1.000 | | | | 09/20/24 | | | | 2.339 | | | | (319,341 | ) | | | (110,899 | ) |
JPMorgan Securities, Inc. | | | | | 900 | | | | 1.000 | | | | 06/20/24 | | | | 2.319 | | | | (73,380 | ) | | | (20,336 | ) |
Morgan Stanley & Co. International PLC | | | | | 7,530 | | | | 1.000 | | | | 06/20/24 | | | | 2.319 | | | | (724,987 | ) | | | (59,111 | ) |
| TOTAL | | | | | | | | | | | | | | | | | | | | $ | (1,694,167 | ) | | $ | (625,702 | ) |
| | (b) | | Credit spread on the Referenced Obligation, together with the term of the swap contract, are indicators of payment/performance risk. The likelihood of a credit event occurring which would require a fund to make a payment or otherwise be required to perform under the swap contract is generally greater as the credit spread and the term of the swap contract increase. |
| | |
| The accompanying notes are an integral part of these financial statements. | | 69 |
GOLDMAN SACHS HIGH YIELD FUND
Schedule of Investments
September 30, 2014 (Unaudited)
| | | | | | | | | | | | | | |
Principal
Amount | | | Interest
Rate | | | Maturity
Date | | | Value | |
| | Corporate Obligations – 89.9% | |
| | Airlines – 0.6% | |
| Air Canada (BB-/Ba3)(a) | |
| $ | 10,000,000 | | | | 6.750 | % | | | 10/01/19 | | | $ | 10,600,000 | |
| Air Canada (BB+/Ba2)(a) | |
| | 2,548,206 | | | | 5.375 | | | | 11/15/22 | | | | 2,606,433 | |
| Continental Airlines 2012-3 Class C Pass Thru Certificates
(B+/B1) |
|
| | 8,100,000 | | | | 6.125 | | | | 04/29/18 | | | | 8,484,750 | |
| United Airlines 2014-1 Class B Pass Through Trust (BB+/NR) | |
| | 3,950,000 | | | | 4.750 | | | | 10/11/23 | | | | 3,940,125 | |
| United Continental Holdings, Inc. (B/B2) | |
| | 1,750,000 | | | | 6.375 | | | | 06/01/18 | | | | 1,833,125 | |
| | | | | | | | | | | | | | |
| | | | | | | | | | | | | 27,464,433 | |
| | |
| | Automotive – 0.5% | |
| Chrysler Group LLC (B/B1) | |
| | 11,800,000 | | | | 8.000 | | | | 06/15/19 | | | | 12,508,000 | |
| | 9,850,000 | | | | 8.250 | | | | 06/15/21 | | | | 10,761,125 | |
| General Motors Liquidation Co. (NR/NR)(b) | |
| | 7,125,000 | | | | 7.125 | | | | 07/15/13 | | | | — | |
| | 2,000,000 | | | | 7.700 | | | | 04/15/16 | | | | — | |
| | 1,000,000 | | | | 8.800 | | | | 03/01/49 | | | | — | |
| | 14,500,000 | | | | 8.375 | | | | 07/15/49 | | | | — | |
| | | | | | | | | | | | | | |
| | | | | | | | | | | | | 23,269,125 | |
| | |
| | Automotive Parts – 1.4% | |
| American Axle & Manufacturing, Inc. (B+/B2) | |
| | 3,000,000 | | | | 5.125 | | | | 02/15/19 | | | | 3,000,000 | |
| | 5,000,000 | | | | 6.250 | | | | 03/15/21 | | | | 5,200,000 | |
| | 5,000,000 | | | | 6.625 | | | | 10/15/22 | | | | 5,300,000 | |
| Gates Global LLC (B/Caa2)(a) | |
| | 30,000,000 | | | | 6.000 | | | | 07/15/22 | | | | 28,500,000 | |
| Schaeffler Finance BV (BB-/Ba2)(a) | |
| | 9,800,000 | | | | 4.250 | | | | 05/15/21 | | | | 9,457,000 | |
| Schaeffler Holding Finance BV (B/B1)(a)(c) | |
| | 7,200,000 | | | | 6.875 | | | | 08/15/18 | | | | 7,488,000 | |
| Stackpole International Intermediate Co. (B+/B2)(a) | |
| | 6,000,000 | | | | 7.750 | | | | 10/15/21 | | | | 6,030,000 | |
| | | | | | | | | | | | | | |
| | | | | | | | | | | | | 64,975,000 | |
| | |
| | Banks – 3.4% | |
| Bank of America Corp. (BB/Ba3)(d) | |
| | 4,500,000 | | | | 8.000 | | | | 01/30/49 | | | | 4,826,250 | |
| | 11,700,000 | | | | 6.250 | | | | 09/05/49 | | | | 11,583,000 | |
| | 6,200,000 | | | | 5.125 | | | | 12/29/49 | | | | 6,006,250 | |
| Barclays Bank PLC (B/NR)(d) | |
| | 6,200,000 | | | | 8.250 | | | | 12/15/49 | | | | 6,339,500 | |
| Citigroup, Inc. (BB/Ba3)(d) | |
| | 11,350,000 | | | | 6.300 | | | | 12/29/49 | | | | 11,222,313 | |
| | 14,000,000 | | | | 5.900 | | | | 12/31/49 | | | | 13,790,000 | |
| Credit Suisse Group AG (BB/NR)(a)(d) | |
| | 16,500,000 | | | | 7.500 | | | | 12/11/49 | | | | 17,344,800 | |
| | 23,000,000 | | | | 6.250 | | | | 12/31/49 | | | | 22,252,500 | |
| HSBC Holdings PLC (NR/Baa3)(d) | |
| | 13,500,000 | | | | 6.375 | | | | 09/17/49 | | | | 13,447,643 | |
| JPMorgan Chase & Co. (BBB-/Ba1)(d) | |
| | 4,500,000 | | | | 5.000 | | | | 07/01/49 | | | | 4,386,600 | |
| | |
| | Corporate Obligations – (continued) | |
| | Banks – (continued) | |
| Lloyds Banking Group PLC (B+/NR)(d) | |
| $ | 15,297,000 | | | | 7.500 | % | | | 12/31/49 | | | $ | 15,755,910 | |
| Nordea Bank AB (BBB/NR)(a)(d) | |
| | 12,100,000 | | | | 5.500 | | | | 09/23/49 | | | | 11,888,250 | |
| Royal Bank of Scotland Group PLC (BB/Ba3) | |
| | 2,530,000 | | | | 6.125 | | | | 12/15/22 | | | | 2,677,848 | |
| | 8,470,000 | | | | 6.100 | | | | 06/10/23 | | | | 8,943,424 | |
| Royal Bank of Scotland PLC (BB+/NR)(d) | |
| | 8,850,000 | | | | 9.500 | | | | 03/16/22 | | | | 10,089,000 | |
| | | | | | | | | | | | | | |
| | | | | | | | | | | | | 160,553,288 | |
| | |
| | Building Materials – 1.1% | |
| Atrium Windows & Doors, Inc. (B-/Caa1)(a) | |
| | 11,150,000 | | | | 7.750 | | | | 05/01/19 | | | | 10,815,500 | |
| Builders FirstSource, Inc. (B/Caa1)(a) | |
| | 7,000,000 | | | | 7.625 | | | | 06/01/21 | | | | 7,000,000 | |
| Gibraltar Industries, Inc. (BB-/NR) | |
| | 4,000,000 | | | | 6.250 | | | | 02/01/21 | | | | 4,100,000 | |
| Hardwoods Acquisition, Inc. (B/B3)(a) | |
| | 6,930,000 | | | | 7.500 | | | | 08/01/21 | | | | 6,930,000 | |
| Safway Group Holding LLC/Safway Finance Corp. (B/B3)(a) | |
| | 2,900,000 | | | | 7.000 | | | | 05/15/18 | | | | 2,929,000 | |
| Summit Materials LLC/Summit Materials Finance Corp.
(B-/Caa1) |
|
| | 4,750,000 | | | | 10.500 | | | | 01/31/20 | | | | 5,213,125 | |
| | 1,650,000 | | | | 10.500 | (a) | | | 01/31/20 | | | | 1,810,875 | |
| Transfield Services Ltd. (B+/Ba3)(a) | |
| | 4,350,000 | | | | 8.375 | | | | 05/15/20 | | | | 4,524,000 | |
| Zachry Holdings, Inc. (B+/B2)(a) | |
| | 8,850,000 | | | | 7.500 | | | | 02/01/20 | | | | 9,137,625 | |
| | | | | | | | | | | | | | |
| | | | | | | | | | | | | 52,460,125 | |
| | |
| | Capital Goods – 0.2% | |
| Dynacast International LLC/Dynacast Finance, Inc. (B/B2) | |
| | 8,000,000 | | | | 9.250 | | | | 07/15/19 | | | | 8,620,000 | |
| | |
| | Chemicals – 2.2% | |
| Ashland, Inc. (BB/Ba1) | |
| | 6,450,000 | | | | 3.875 | | | | 04/15/18 | | | | 6,466,125 | |
| | 11,000,000 | | | | 4.750 | | | | 08/15/22 | | | | 10,725,000 | |
| Eagle Spinco, Inc. (BB/Ba3) | |
| | 11,100,000 | | | | 4.625 | | | | 02/15/21 | | | | 10,683,750 | |
| Hexion US Finance Corp./Hexion Nova Scotia Finance ULC
(CCC+/Caa1) |
|
| | 13,000,000 | | | | 8.875 | | | | 02/01/18 | | | | 13,195,000 | |
| Hexion US Finance Corp./Hexion Nova Scotia Finance ULC
(CCC+/Caa2) |
|
| | 5,000,000 | | | | 9.000 | | | | 11/15/20 | | | | 4,762,500 | |
| Huntsman International LLC (B+/B1) | |
| | 5,950,000 | | | | 4.875 | | | | 11/15/20 | | | | 5,845,875 | |
| Momentive Performance Materials, Inc. (NR/WR)(b) | |
| | 13,000,000 | | | | 8.875 | | | | 10/15/20 | | | | 11,667,500 | |
| Rayonier AM Products, Inc. (BB+/Ba3)(a) | |
| | 3,450,000 | | | | 5.500 | | | | 06/01/24 | | | | 3,312,000 | |
| Rockwood Specialties Group, Inc. (BBB-/Ba1) | |
| | 8,825,000 | | | | 4.625 | | | | 10/15/20 | | | | 9,111,813 | |
| | |
| | |
| 70 | | The accompanying notes are an integral part of these financial statements. |
GOLDMAN SACHS HIGH YIELD FUND
| | | | | | | | | | | | | | |
Principal
Amount | | | Interest
Rate | | | Maturity
Date | | | Value | |
| | Corporate Obligations – (continued) | |
| | Chemicals – (continued) | |
| SPCM SA (BB+/Ba3)(a) | |
| $ | 4,900,000 | | | | 6.000 | % | | | 01/15/22 | | | $ | 5,213,279 | |
| US Coatings Acquisition, Inc./Axalta Coating Systems Dutch
Holding B BV (B+/B1) |
|
| EUR | 7,000,000 | | | | 5.750 | | | | 02/01/21 | | | | 9,339,121 | |
| US Coatings Acquisition, Inc./Flash Dutch 2 BV (B-/Caa1)(a) | |
| $ | 7,265,000 | | | | 7.375 | | | | 05/01/21 | | | | 7,750,847 | |
| WR Grace & Co. (BB+/Ba3)(a) | |
| | 3,000,000 | | | | 5.125 | | | | 10/01/21 | | | | 3,037,500 | |
| | 2,150,000 | | | | 5.625 | | | | 10/01/24 | | | | 2,193,000 | |
| | | | | | | | | | | | | | |
| | | | | | | | | | | | | 103,303,310 | |
| | |
| | Conglomerates – 0.3% | |
| Park-Ohio Industries, Inc. (B-/B3) | |
| | 12,500,000 | | | | 8.125 | | | | 04/01/21 | | | | 13,375,000 | |
| | |
| | Construction Machinery – 1.4% | |
| Accudyne Industries Borrower/Accudyne Industries LLC
(CCC+/Caa1)(a) |
|
| | 7,050,000 | | | | 7.750 | | | | 12/15/20 | | | | 7,261,500 | |
| Cleaver-Brooks, Inc. (B/B2)(a) | |
| | 5,150,000 | | | | 8.750 | | | | 12/15/19 | | | | 5,600,625 | |
| Dematic SA/DH Services Luxembourg Sarl (CCC+/Caa1)(a) | |
| | 15,250,000 | | | | 7.750 | | | | 12/15/20 | | | | 16,012,500 | |
| Mcron Finance Sub LLC (B/B1)(a) | |
| | 4,560,000 | | | | 8.375 | | | | 05/15/19 | | | | 4,839,300 | |
| Milacron LLC/Mcron Finance Corp. (B-/Caa1)(a) | |
| | 10,000,000 | | | | 7.750 | | | | 02/15/21 | | | | 10,562,500 | |
| The Manitowoc Co., Inc. (BB-/B2) | |
| | 6,000,000 | | | | 8.500 | | | | 11/01/20 | | | | 6,450,000 | |
| | 5,000,000 | | | | 5.875 | | | | 10/15/22 | | | | 5,150,000 | |
| Vander Intermediate Holding II Corp. (CCC+/Caa2)(a)(c) | |
| | 5,700,000 | | | | 9.750 | | | | 02/01/19 | | | | 5,942,250 | |
| Waterjet Holdings, Inc. (B/B2)(a) | |
| | 4,450,000 | | | | 7.625 | | | | 02/01/20 | | | | 4,605,750 | |
| | | | | | | | | | | | | | |
| | | | | | | | | | | | | 66,424,425 | |
| | |
| | Consumer Products – Household & Leisure – 1.1% | |
| Radio Systems Corp. (B/B3)(a) | |
| | 9,000,000 | | | | 8.375 | | | | 11/01/19 | | | | 9,720,000 | |
| Serta Simmons Holdings LLC (CCC+/Caa1)(a) | |
| | 9,400,000 | | | | 8.125 | | | | 10/01/20 | | | | 9,940,500 | |
| Spectrum Brands, Inc. (B/B3) | |
| | 3,750,000 | | | | 6.375 | | | | 11/15/20 | | | | 3,909,375 | |
| | 4,000,000 | | | | 6.625 | | | | 11/15/22 | | | | 4,190,000 | |
| Springs Industries, Inc. (B/B2) | |
| | 7,150,000 | | | | 6.250 | | | | 06/01/21 | | | | 7,024,875 | |
| The Sun Products Corp. (CCC/Caa2)(a) | |
| | 19,100,000 | | | | 7.750 | | | | 03/15/21 | | | | 14,659,250 | |
| Visant Corp. (CCC+/Caa2) | |
| | 2,641,000 | | | | 10.000 | | | | 10/01/17 | | | | 2,357,093 | |
| | | | | | | | | | | | | | |
| | | | | | | | | | | | | 51,801,093 | |
| | |
| | Consumer Products – Industrial – 1.6% | |
| HD Supply, Inc. (B+/B1) | |
| | 3,500,000 | | | | 8.125 | | | | 04/15/19 | | | | 3,780,000 | |
| | |
| | Corporate Obligations – (continued) | |
| | Consumer Products – Industrial – (continued) | |
| HD Supply, Inc. (CCC+/B3) | |
| $ | 10,200,000 | | | | 11.000 | % | | | 04/15/20 | | | $ | 11,577,000 | |
| HD Supply, Inc. (CCC+/Caa2) | |
| | 30,922,000 | | | | 7.500 | | | | 07/15/20 | | | | 32,081,575 | |
| | 18,000,000 | | | | 11.500 | | | | 07/15/20 | | | | 20,700,000 | |
| WESCO Distribution, Inc. (B+/B1) | |
| | 8,000,000 | | | | 5.375 | | | | 12/15/21 | | | | 7,960,000 | |
| | | | | | | | | | | | | | |
| | | | | | | | | | | | | 76,098,575 | |
| | |
| | Consumer Products – Non Durable – 1.6% | |
| Anna Merger Sub, Inc. (CCC+/Caa1)(a) | |
| | 12,350,000 | | | | 7.750 | | | | 10/01/22 | | | | 12,411,750 | |
| APX Group, Inc. (B/Ba3) | |
| | 12,000,000 | | | | 6.375 | | | | 12/01/19 | | | | 11,655,000 | |
| APX Group, Inc. (CCC+/Caa1) | |
| | 5,000,000 | | | | 8.750 | | | | 12/01/20 | | | | 4,525,000 | |
| Constellation Brands, Inc. (BB+/Ba1) | |
| | 10,000,000 | | | | 3.750 | | | | 05/01/21 | | | | 9,800,000 | |
| | 9,550,000 | | | | 4.250 | | | | 05/01/23 | | | | 9,359,000 | |
| Prestige Brands, Inc. (B-/Caa1) | |
| | 2,700,000 | | | | 8.125 | | | | 02/01/20 | | | | 2,882,250 | |
| | 4,700,000 | | | | 5.375 | (a) | | | 12/15/21 | | | | 4,453,250 | |
| Sally Holdings LLC (BB+/Ba2) | |
| | 18,700,000 | | | | 5.750 | | | | 06/01/22 | | | | 19,074,000 | |
| | 650,000 | | | | 5.500 | | | | 11/01/23 | | | | 653,250 | |
| | | | | | | | | | | | | | |
| | | | | | | | | | | | | 74,813,500 | |
| | |
| | Emerging Markets(a) – 0.5% | |
| Digicel Group Ltd. (NR/Caa1) | |
| | 11,800,000 | | | | 8.250 | | | | 09/30/20 | | | | 12,124,500 | |
| | 5,000,000 | | | | 7.125 | | | | 04/01/22 | | | | 5,000,000 | |
| Digicel Ltd. (NR/B1) | |
| | 8,000,000 | | | | 7.000 | | | | 02/15/20 | | | | 8,120,000 | |
| | | | | | | | | | | | | | |
| | | | | | | | | | | | | 25,244,500 | |
| | |
| | Energy – Coal – 0.5% | |
| Arch Coal, Inc. (CCC+/B3)(a) | |
| | 2,050,000 | | | | 8.000 | | | | 01/15/19 | | | | 1,763,000 | |
| Arch Coal, Inc. (CCC+/Caa1) | |
| | 3,000,000 | | | | 7.000 | | | | 06/15/19 | | | | 1,642,500 | |
| | 7,950,000 | | | | 9.875 | | | | 06/15/19 | | | | 4,611,000 | |
| Peabody Energy Corp. (BB-/Ba3) | |
| | 10,000,000 | | | | 6.000 | | | | 11/15/18 | | | | 9,800,000 | |
| Peabody Energy Corp. (B-/B2) | |
| | 7,250,000 | | | | 4.750 | | | | 12/15/41 | | | | 4,996,214 | |
| | | | | | | | | | | | | | |
| | | | | | | | | | | | | 22,812,714 | |
| | |
| | Energy – Exploration & Production – 9.4% | |
| Antero Resources Corp. (BB/B1)(a) | |
| | 7,900,000 | | | | 5.125 | | | | 12/01/22 | | | | 7,682,750 | |
| Antero Resources Finance Corp. (BB/B1) | |
| | 8,550,000 | | | | 5.375 | | | | 11/01/21 | | | | 8,507,250 | |
| Athlon Holdings LP/Athlon Finance Corp. (CCC+/B3) | |
| | 15,000,000 | | | | 7.375 | | | | 04/15/21 | | | | 16,275,000 | |
| | 6,250,000 | | | | 6.000 | (a) | | | 05/01/22 | | | | 6,703,125 | |
| | |
| | |
| The accompanying notes are an integral part of these financial statements. | | 71 |
GOLDMAN SACHS HIGH YIELD FUND
Schedule of Investments (continued)
September 30, 2014 (Unaudited)
| | | | | | | | | | | | | | |
Principal
Amount | | | Interest
Rate | | | Maturity
Date | | | Value | |
| | Corporate Obligations – (continued) | |
| | Energy – Exploration & Production – (continued) | |
| Berry Petroleum Co. (BB-/B1) | |
| $ | 10,150,000 | | | | 6.375 | % | | | 09/15/22 | | | $ | 9,870,875 | |
| California Resources Corp. (BB/Ba1)(a) | |
| | 15,450,000 | | | | 6.000 | | | | 11/15/24 | | | | 15,836,250 | |
| Chaparral Energy, Inc. (B-/B3) | |
| | 7,000,000 | | | | 9.875 | | | | 10/01/20 | | | | 7,525,000 | |
| | 3,175,000 | | | | 8.250 | | | | 09/01/21 | | | | 3,349,625 | |
| | 10,000,000 | | | | 7.625 | | | | 11/15/22 | | | | 10,350,000 | |
| Concho Resources, Inc. (BB+/Ba3) | |
| | 760,000 | | | | 7.000 | | | | 01/15/21 | | | | 809,400 | |
| | 4,650,000 | | | | 6.500 | | | | 01/15/22 | | | | 4,940,625 | |
| | 6,900,000 | | | | 5.500 | | | | 10/01/22 | | | | 7,107,000 | |
| | 11,800,000 | | | | 5.500 | | | | 04/01/23 | | | | 12,213,000 | |
| CrownRock LP/CrownRock Finance, Inc. (B/Caa1)(a) | |
| | 16,000,000 | | | | 7.125 | | | | 04/15/21 | | | | 16,640,000 | |
| Diamondback Energy, Inc. (B-/B3)(a) | |
| | 6,250,000 | | | | 7.625 | | | | 10/01/21 | | | | 6,734,375 | |
| Gulfmark Offshore, Inc. (BB-/B1) | |
| | 9,250,000 | | | | 6.375 | | | | 03/15/22 | | | | 9,018,750 | |
| Halcon Resources Corp. (CCC+/Caa1) | |
| | 7,800,000 | | | | 9.750 | | | | 07/15/20 | | | | 7,878,000 | |
| | 11,000,000 | | | | 8.875 | | | | 05/15/21 | | | | 10,890,000 | |
| Kodiak Oil & Gas Corp. (B/B3) | |
| | 12,000,000 | | | | 8.125 | | | | 12/01/19 | | | | 12,900,000 | |
| | 5,000,000 | | | | 5.500 | | | | 01/15/21 | | | | 5,062,500 | |
| | 3,300,000 | | | | 5.500 | | | | 02/01/22 | | | | 3,333,000 | |
| Laredo Petroleum, Inc. (B/B2) | |
| | 12,850,000 | | | | 9.500 | | | | 02/15/19 | | | | 13,653,125 | |
| | 3,000,000 | | | | 5.625 | | | | 01/15/22 | | | | 2,947,500 | |
| | 3,389,000 | | | | 7.375 | | | | 05/01/22 | | | | 3,566,923 | |
| Linn Energy LLC/Linn Energy Finance Corp. (B/B1) | |
| | 9,850,000 | | | | 6.250 | | | | 11/01/19 | | | | 9,665,312 | |
| | 2,850,000 | | | | 7.750 | | | | 02/01/21 | | | | 2,885,625 | |
| Magnum Hunter Resources Corp. (CCC/NR) | |
| | 25,000,000 | | | | 9.750 | | | | 05/15/20 | | | | 26,437,500 | |
| MEG Energy Corp. (BB/B1)(a) | |
| | 7,500,000 | | | | 6.500 | | | | 03/15/21 | | | | 7,575,000 | |
| | 22,550,000 | | | | 6.375 | | | | 01/30/23 | | | | 22,690,937 | |
| | 11,000,000 | | | | 7.000 | | | | 03/31/24 | | | | 11,385,000 | |
| Memorial Production Partners LP/Memorial Production Finance
Corp. (B-/Caa1) |
|
| | 17,000,000 | | | | 7.625 | | | | 05/01/21 | | | | 17,085,000 | |
| | 2,200,000 | | | | 6.875 | (a) | | | 08/01/22 | | | | 2,101,000 | |
| Oasis Petroleum, Inc. (B+/B2) | |
| | 9,250,000 | | | | 6.875 | | | | 03/15/22 | | | | 9,805,000 | |
| Parsley Energy LLC/Parsley Finance Corp. (CCC+/Caa2)(a) | |
| | 5,350,000 | | | | 7.500 | | | | 02/15/22 | | | | 5,517,188 | |
| Resolute Energy Corp. (CCC+/B3) | |
| | 12,600,000 | | | | 8.500 | | | | 05/01/20 | | | | 12,663,000 | |
| Rosetta Resources, Inc. (B+/B1) | |
| | 7,300,000 | | | | 5.625 | | | | 05/01/21 | | | | 7,154,000 | |
| | 5,450,000 | | | | 5.875 | | | | 06/01/24 | | | | 5,341,000 | |
| RSP Permian, Inc. (B-/B3)(a) | |
| | 5,650,000 | | | | 6.625 | | | | 10/01/22 | | | | 5,678,250 | |
| Samson Investment Co. (CCC+/B3) | |
| | 18,000,000 | | | | 9.750 | | | | 02/15/20 | | | | 16,560,000 | |
| | |
| | Corporate Obligations – (continued) | |
| | Energy – Exploration & Production – (continued) | |
| SandRidge Energy, Inc. (B-/B2) | |
| $ | 2,900,000 | | | | 8.750 | % | | | 01/15/20 | | | $ | 2,987,000 | |
| | 2,500,000 | | | | 8.125 | | | | 10/15/22 | | | | 2,493,750 | |
| Seven Generations Energy Ltd. (CCC/Caa1)(a) | |
| | 12,500,000 | | | | 8.250 | | | | 05/15/20 | | | | 13,503,750 | |
| SM Energy Co. (BB/Ba2) | |
| | 5,000,000 | | | | 6.500 | | | | 11/15/21 | | | | 5,275,000 | |
| | 20,000,000 | | | | 5.000 | | | | 01/15/24 | | | | 19,200,000 | |
| Vanguard Natural Resourses LLC/VNR Finance Corp. (B/B3) | |
| | 15,000,000 | | | | 7.875 | | | | 04/01/20 | | | | 15,525,000 | |
| Whiting Petroleum Corp. (BB+/Ba2) | |
| | 12,300,000 | | | | 5.750 | | | | 03/15/21 | | | | 13,007,250 | |
| | | | | | | | | | | | | | |
| | | | | | | | | | | | | 438,329,635 | |
| | |
| | Energy – Services – 0.8% | |
| Atwood Oceanics, Inc. (BB/Ba3) | |
| | 9,725,000 | | | | 6.500 | | | | 02/01/20 | | | | 9,943,813 | |
| CVR Refining LLC/Coffeyville Finance, Inc. (B+/B2) | |
| | 7,500,000 | | | | 6.500 | | | | 11/01/22 | | | | 7,650,000 | |
| FTS International, Inc. (B/B2)(a) | |
| | 7,900,000 | | | | 6.250 | | | | 05/01/22 | | | | 7,761,750 | |
| Trinidad Drilling Ltd. (BB/B1)(a) | |
| | 10,000,000 | | | | 7.875 | | | | 01/15/19 | | | | 10,343,700 | |
| | | | | | | | | | | | | | |
| | | | | | | | | | | | | 35,699,263 | |
| | |
| | Entertainment & Leisure – 0.4% | |
| Regal Entertainment Group (B-/B3) | |
| | 3,800,000 | | | | 5.750 | | | | 03/15/22 | | | | 3,809,500 | |
| Viking Cruises Ltd. (B+/B3)(a) | |
| | 11,079,000 | | | | 8.500 | | | | 10/15/22 | | | | 12,103,808 | |
| WMG Acquisition Corp. (B+/B1)(a) | |
| | 300,000 | | | | 5.625 | | | | 04/15/22 | | | | 300,750 | |
| WMG Acquisition Corp. (B/Caa1)(a) | |
| | 5,000,000 | | | | 6.750 | | | | 04/15/22 | | | | 4,812,500 | |
| | | | | | | | | | | | | | |
| | | | | | | | | | | | | 21,026,558 | |
| | |
| | Environmental – 0.7% | |
| ADS Waste Holdings, Inc. (CCC+/Caa2) | |
| | 20,000,000 | | | | 8.250 | | | | 10/01/20 | | | | 20,900,000 | |
| Casella Waste Systems, Inc. (CCC+/Caa1) | |
| | 12,500,000 | | | | 7.750 | | | | 02/15/19 | | | | 12,531,250 | |
| | | | | | | | | | | | | | |
| | | | | | | | | | | | | 33,431,250 | |
| | |
| | Finance – 6.0% | |
| AerCap Ireland Capital Ltd./AerCap Global Aviation Trust
(BB+/Ba2)(a) |
|
| | 5,000,000 | | | | 3.750 | | | | 05/15/19 | | | | 4,862,500 | |
| Aircastle Ltd. (BB+/Ba3) | |
| | 5,600,000 | | | | 4.625 | | | | 12/15/18 | | | | 5,607,000 | |
| | 8,000,000 | | | | 6.250 | | | | 12/01/19 | | | | 8,430,000 | |
| Ally Financial, Inc. (BB/B1) | |
| | 20,000,000 | | | | 6.250 | | | | 12/01/17 | | | | 21,550,000 | |
| | 5,250,000 | | | | 8.000 | | | | 03/15/20 | | | | 6,116,250 | |
| Ally Financial, Inc. (NR/B1) | |
| | 6,000,000 | | | | 5.125 | | | | 09/30/24 | | | | 5,880,000 | |
| Ally Financial, Inc. (BB/B1) | |
| | 16,000,000 | | | | 8.000 | | | | 11/01/31 | | | | 19,960,000 | |
| | |
| | |
| 72 | | The accompanying notes are an integral part of these financial statements. |
GOLDMAN SACHS HIGH YIELD FUND
| | | | | | | | | | | | | | |
Principal
Amount | | | Interest
Rate | | | Maturity
Date | | | Value | |
| | Corporate Obligations – (continued) | |
| | Finance – (continued) | |
| CIT Group, Inc. (BB-/Ba3) | |
| $ | 4,500,000 | | | | 5.000 | % | | | 05/15/17 | | | $ | 4,612,500 | |
| | 9,950,000 | | | | 5.250 | | | | 03/15/18 | | | | 10,248,500 | |
| | 16,000,000 | | | | 5.500 | (a) | | | 02/15/19 | | | | 16,680,000 | |
| | 2,042,000 | | | | 5.375 | | | | 05/15/20 | | | | 2,103,260 | |
| Harbinger Group, Inc. (B+/Ba3) | |
| | 9,000,000 | | | | 7.875 | | | | 07/15/19 | | | | 9,573,750 | |
| International Lease Finance Corp. (BBB-/Ba1)(a) | |
| | 4,900,000 | | | | 7.125 | | | | 09/01/18 | | | | 5,500,250 | |
| International Lease Finance Corp. (BB+/Ba2) | |
| | 15,550,000 | | | | 5.875 | | | | 04/01/19 | | | | 16,405,250 | |
| | 8,450,000 | | | | 6.250 | | | | 05/15/19 | | | | 9,083,750 | |
| | 3,000,000 | | | | 4.625 | | | | 04/15/21 | | | | 2,985,000 | |
| Jefferies Finance LLC/JFIN Co-Issuer Corp. (B/B1)(a) | |
| | 9,150,000 | | | | 7.375 | | | | 04/01/20 | | | | 9,401,625 | |
| | 4,500,000 | | | | 6.875 | | | | 04/15/22 | | | | 4,466,250 | |
| Jefferies LoanCore LLC/JLC Finance Corp. (B/B2)(a) | |
| | 8,000,000 | | | | 6.875 | | | | 06/01/20 | | | | 7,760,000 | |
| Nationstar Mortgage LLC/Nationstar Capital Corp. (B+/B2) | |
| | 7,700,000 | | | | 6.500 | | | | 08/01/18 | | | | 7,584,500 | |
| | 5,200,000 | | | | 7.875 | | | | 10/01/20 | | | | 5,213,000 | |
| | 14,450,000 | | | | 6.500 | | | | 07/01/21 | | | | 13,655,250 | |
| Navient LLC (BB/Ba3) | |
| | 7,000,000 | | | | 8.450 | | | | 06/15/18 | | | | 7,924,491 | |
| | 15,900,000 | | | | 5.500 | | | | 01/15/19 | | | | 16,251,271 | |
| | 10,000,000 | | | | 4.875 | | | | 06/17/19 | | | | 10,018,232 | |
| | 12,000,000 | | | | 8.000 | | | | 03/25/20 | | | | 13,486,755 | |
| | 5,350,000 | | | | 6.125 | | | | 03/25/24 | | | | 5,239,942 | |
| | 1,200,000 | | | | 5.625 | | | | 08/01/33 | | | | 1,016,961 | |
| Rialto Holdings LLC/Rialto Corp. (B/B2)(a) | |
| | 11,300,000 | | | | 7.000 | | | | 12/01/18 | | | | 11,582,500 | |
| Speedy Cash Intermediate Holdings Corp. (B/Caa1)(a) | |
| | 13,500,000 | | | | 10.750 | | | | 05/15/18 | | | | 13,533,750 | |
| Synovus Financial Corp. (BB-/B1) | |
| | 4,250,000 | | | | 7.875 | | | | 02/15/19 | | | | 4,738,750 | |
| | | | | | | | | | | | | | |
| | | | | | | | | | | | | 281,471,287 | |
| | |
| | Food – 1.6% | |
| B&G Foods, Inc. (BB-/B1) | |
| | 12,300,000 | | | | 4.625 | | | | 06/01/21 | | | | 11,715,750 | |
| Cott Beverages, Inc. (B+/B3)(a) | |
| | 10,000,000 | | | | 5.375 | | | | 07/01/22 | | | | 9,650,000 | |
| Post Holdings, Inc. (B/B2) | |
| | 16,550,000 | | | | 6.750 | (a) | | | 12/01/21 | | | | 15,888,000 | |
| | 11,050,000 | | | | 7.375 | | | | 02/15/22 | | | | 10,994,750 | |
| | 6,050,000 | | | | 6.000 | (a) | | | 12/15/22 | | | | 5,535,750 | |
| Shearer’s Foods LLC/Chip Finance Corp. (B/B1)(a) | |
| | 6,957,000 | | | | 9.000 | | | | 11/01/19 | | | | 7,565,737 | |
| The WhiteWave Foods Co. (BB-/B1) | |
| | 3,050,000 | | | | 5.375 | | | | 10/01/22 | | | | 3,095,750 | |
| TreeHouse Foods, Inc. (BB/Ba2) | |
| | 3,500,000 | | | | 4.875 | | | | 03/15/22 | | | | 3,447,500 | |
| Wells Enterprises, Inc. (B+/B3)(a) | |
| | 9,196,000 | | | | 6.750 | | | | 02/01/20 | | | | 9,379,920 | |
| | | | | | | | | | | | | | |
| | | | | | | | | | | | | 77,273,157 | |
| | |
| | Corporate Obligations – (continued) | |
| | Gaming – 5.1% | |
| Caesars Entertainment Operating Co., Inc. (CCC-/Caa2) | |
| $ | 31,050,000 | | | | 9.000 | % | | | 02/15/20 | | | $ | 23,830,875 | |
| Churchill Downs, Inc. (BB/B1)(a) | |
| | 10,000,000 | | | | 5.375 | | | | 12/15/21 | | | | 10,000,000 | |
| Downstream Development Authority of the Quapaw Tribe of
Oklahoma (B/B3)(a) |
|
| | 10,700,000 | | | | 10.500 | | | | 07/01/19 | | | | 11,261,750 | |
| Gala Electric Casinos PLC (CCC+/Caa2) | |
| GBP | 1,000,000 | | | | 11.500 | | | | 06/01/19 | | | | 1,717,187 | |
| Gala Group Finance PLC (B+/B2) | |
| | 3,060,000 | | | | 8.875 | | | | 09/01/18 | | | | 5,169,665 | |
| GLP Capital LP/GLP Financing II, Inc. (BBB-/Ba1) | |
| $ | 18,165,000 | | | | 4.875 | | | | 11/01/20 | | | | 18,437,475 | |
| | 15,000,000 | | | | 5.375 | | | | 11/01/23 | | | | 15,337,500 | |
| Marina District Finance Co., Inc. (B+/B2) | |
| | 5,000,000 | | | | 9.875 | | | | 08/15/18 | | | | 5,237,500 | |
| MGM Resorts International (B+/B3) | |
| | 8,350,000 | | | | 6.875 | | | | 04/01/16 | | | | 8,830,125 | |
| | 10,000,000 | | | | 10.000 | | | | 11/01/16 | | | | 11,275,000 | |
| | 24,750,000 | | | | 6.750 | | | | 10/01/20 | | | | 26,296,875 | |
| | 25,000,000 | | | | 6.625 | | | | 12/15/21 | | | | 26,312,500 | |
| | 11,650,000 | | | | 7.750 | | | | 03/15/22 | | | | 12,960,625 | |
| New Red Finance, Inc. (B-/Caa1)(a) | |
| | 37,350,000 | | | | 6.000 | | | | 04/01/22 | | | | 37,069,875 | |
| River Cree Enterprises LP (B-/NR)(a) | |
| CAD | 7,200,000 | | | | 11.000 | | | | 01/20/21 | | | | 6,985,276 | |
| Seminole Hard Rock Entertainment, Inc. (BB-/B2)(a) | |
| $ | 10,400,000 | | | | 5.875 | | | | 05/15/21 | | | | 10,036,000 | |
| Wynn Macau Ltd. (BB/Ba2)(a) | |
| | 9,000,000 | | | | 5.250 | | | | 10/15/21 | | | | 8,640,000 | |
| | | | | | | | | | | | | | |
| | | | | | | | | | | | | 239,398,228 | |
| | |
| | Health Care – Medical Products – 0.8% | |
| DJO Finance LLC/DJO Finance Corp. (CCC/Caa2) | |
| | 5,000,000 | | | | 9.750 | | | | 10/15/17 | | | | 5,137,500 | |
| DJO Finance LLC/DJO Finance Corp. (CCC+/Caa1) | |
| | 7,000,000 | | | | 9.875 | | | | 04/15/18 | | | | 7,350,000 | |
| Fresenius Medical Care US Finance II, Inc. (BB+/Ba2)(a) | |
| | 8,650,000 | | | | 5.625 | | | | 07/31/19 | | | | 9,104,125 | |
| | 4,505,000 | | | | 5.875 | | | | 01/31/22 | | | | 4,786,563 | |
| Fresenius Medical Care US Finance, Inc. (BB+/Ba2)(a) | |
| | 4,550,000 | | | | 5.750 | | | | 02/15/21 | | | | 4,800,250 | |
| Fresenius US Finance II, Inc. (BB+/Ba1)(a) | |
| | 5,450,000 | | | | 4.250 | | | | 02/01/21 | | | | 5,490,875 | |
| | | | | | | | | | | | | | |
| | | | | | | | | | | | | 36,669,313 | |
| | |
| | Health Care – Pharmaceuticals(a) – 0.8% | |
| Valeant Pharmaceuticals International, Inc. (B/B1) | |
| | 5,147,000 | | | | 6.750 | | | | 08/15/18 | | | | 5,417,218 | |
| | 25,000,000 | | | | 6.375 | | | | 10/15/20 | | | | 25,687,500 | |
| | 6,000,000 | | | | 5.625 | | | | 12/01/21 | | | | 5,977,500 | |
| | 50,000 | | | | 7.250 | | | | 07/15/22 | | | | 52,875 | |
| | | | | | | | | | | | | | |
| | | | | | | | | | | | | 37,135,093 | |
| | |
| | Health Care – Services – 5.6% | |
| 21st Century Oncology, Inc. (B-/Caa2) | |
| | 2,150,000 | | | | 8.875 | | | | 01/15/17 | | | | 2,214,500 | |
| | |
| | |
| The accompanying notes are an integral part of these financial statements. | | 73 |
GOLDMAN SACHS HIGH YIELD FUND
Schedule of Investments (continued)
September 30, 2014 (Unaudited)
| | | | | | | | | | | | | | |
Principal
Amount | | | Interest
Rate | | | Maturity
Date | | | Value | |
| | Corporate Obligations – (continued) | |
| | Health Care – Services – (continued) | |
| 21st Century Oncology, Inc. (CCC/Caa3) | |
| $ | 10,700,000 | | | | 9.875 | % | | | 04/15/17 | | | $ | 10,379,000 | |
| Amsurg Corp. (B-/B3)(a) | |
| | 5,900,000 | | | | 5.625 | | | | 07/15/22 | | | | 5,841,000 | |
| CHS/Community Health Systems, Inc. (BB/Ba2) | |
| | 15,000,000 | | | | 5.125 | | | | 08/15/18 | | | | 15,412,500 | |
| CHS/Community Health Systems, Inc. (B-/B3)(a) | |
| | 29,000,000 | | | | 6.875 | | | | 02/01/22 | | | | 30,232,500 | |
| CHS/Community Health Systems, Inc. (BB/Ba2)(a) | |
| | 5,000,000 | | | | 5.125 | | | | 08/01/21 | | | | 5,012,500 | |
| Crimson Merger Sub, Inc. (CCC+/Caa1)(a) | |
| | 19,000,000 | | | | 6.625 | | | | 05/15/22 | | | | 17,385,000 | |
| Envision Healthcare Corp. (B/B3)(a) | |
| | 4,700,000 | | | | 5.125 | | | | 07/01/22 | | | | 4,629,500 | |
| HCA Holdings, Inc. (B-/B3) | |
| | 4,750,000 | | | | 6.250 | | | | 02/15/21 | | | | 4,963,750 | |
| HCA, Inc. (BB/Ba3) | |
| | 3,000,000 | | | | 3.750 | | | | 03/15/19 | | | | 2,947,500 | |
| | 35,000,000 | | | | 6.500 | | | | 02/15/20 | | | | 38,237,500 | |
| | 12,000,000 | | | | 7.250 | | | | 09/15/20 | | | | 12,600,000 | |
| | 10,000,000 | | | | 5.000 | | | | 03/15/24 | | | | 9,837,500 | |
| HCA, Inc. (B-/B3) | |
| | 38,500,000 | | | | 7.500 | | | | 02/15/22 | | | | 43,408,750 | |
| Lifepoint Hospitals, Inc. (BB-/Ba2) | |
| | 16,000,000 | | | | 5.500 | | | | 12/01/21 | | | | 16,200,000 | |
| MPH Acquisition Holdings LLC (CCC+/Caa1)(a) | |
| | 5,300,000 | | | | 6.625 | | | | 04/01/22 | | | | 5,353,000 | |
| MPT Operating Partnership LP/MPT Finance Corp. (BB/Ba1) | |
| | 19,500,000 | | | | 6.875 | | | | 05/01/21 | | | | 20,865,000 | |
| | 14,200,000 | | | | 6.375 | | | | 02/15/22 | | | | 15,123,000 | |
| | | | | | | | | | | | | | |
| | | | | | | | | | | | | 260,642,500 | |
| | |
| | Home Construction – 2.3% | |
| Beazer Homes USA, Inc. (CCC/Caa2) | |
| | 4,300,000 | | | | 7.500 | | | | 09/15/21 | | | | 4,375,250 | |
| | 3,150,000 | | | | 7.250 | | | | 02/01/23 | | | | 3,134,250 | |
| Brookfield Residential Properties, Inc. (BB-/B2)(a) | |
| | 6,000,000 | | | | 6.500 | | | | 12/15/20 | | | | 6,317,400 | |
| | 2,650,000 | | | | 6.125 | | | | 07/01/22 | | | | 2,711,215 | |
| Century Communities, Inc. (B/B3)(a) | |
| | 3,675,000 | | | | 6.875 | | | | 05/15/22 | | | | 3,702,562 | |
| CPG Merger Sub LLC (CCC+/Caa2)(a) | |
| | 5,700,000 | | | | 8.000 | | | | 10/01/21 | | | | 5,785,500 | |
| D.R. Horton, Inc. (BB/Ba1) | |
| | 5,000,000 | | | | 3.750 | | | | 03/01/19 | | | | 4,862,500 | |
| | 3,000,000 | | | | 4.750 | | | | 02/15/23 | | | | 2,910,000 | |
| Lennar Corp. (BB/Ba3) | |
| | 2,000,000 | | | | 6.950 | | | | 06/01/18 | | | | 2,180,000 | |
| | 7,600,000 | | | | 4.500 | | | | 06/15/19 | | | | 7,486,000 | |
| | 3,000,000 | | | | 4.750 | | | | 11/15/22 | | | | 2,880,000 | |
| Meritage Homes Corp. (BB-/Ba3) | |
| | 3,000,000 | | | | 7.150 | | | | 04/15/20 | | | | 3,225,000 | |
| | 5,000,000 | | | | 7.000 | | | | 04/01/22 | | | | 5,325,000 | |
| Ryland Group Co. (BB-/B1) | |
| | 5,000,000 | | | | 5.375 | | | | 10/01/22 | | | | 4,875,000 | |
| | |
| | Corporate Obligations – (continued) | |
| | Home Construction – (continued) | |
| Standard Pacific Corp. (B+/B1) | |
| $ | 6,000,000 | | | | 6.250 | % | | | 12/15/21 | | | $ | 6,112,500 | |
| The Ryland Group, Inc. (BB-/B1) | |
| | 6,000,000 | | | | 0.250 | | | | 06/01/19 | | | | 5,484,918 | |
| Toll Brothers Finance Corp. (BB+/Ba1) | |
| | 5,000,000 | | | | 5.875 | | | | 02/15/22 | | | | 5,312,500 | |
| | 5,850,000 | | | | 4.375 | | | | 04/15/23 | | | | 5,616,000 | |
| Weyerhaeuser Real Estate Co. (BB-/B1)(a) | |
| | 6,250,000 | | | | 4.375 | | | | 06/15/19 | | | | 6,109,375 | |
| | 5,400,000 | | | | 5.875 | | | | 06/15/24 | | | | 5,386,500 | |
| WLH PNW Finance Corp. (NR/B3)(a) | |
| | 10,250,000 | | | | 7.000 | | | | 08/15/22 | | | | 10,378,125 | |
| Woodside Homes Co. LLC/Woodside Homes Finance, Inc.
(B/B3)(a) |
|
| | 3,625,000 | | | | 6.750 | | | | 12/15/21 | | | | 3,588,750 | |
| | | | | | | | | | | | | | |
| | | | | | | | | | | | | 107,758,345 | |
| | |
| | Life Insurance(a) – 0.1% | |
| Fidelity & Guaranty Life Holdings, Inc. (BB-/Ba3) | |
| | 3,700,000 | | | | 6.375 | | | | 04/01/21 | | | | 3,875,750 | |
| | |
| | Lodging – 0.5% | |
| Felcor Lodging LP (B-/B2) | |
| | 7,300,000 | | | | 5.625 | | | | 03/01/23 | | | | 7,190,500 | |
| Hilton Worldwide Finance LLC/Hilton Worldwide Finance Corp.
(B/B3)(a) |
|
| | 8,050,000 | | | | 5.625 | | | | 10/15/21 | | | | 8,291,500 | |
| New Cotai LLC/New Cotai Capital Corp. (NR/NR)(a)(c) | |
| | 7,452,210 | | | | 10.625 | | | | 05/01/19 | | | | 8,333,279 | |
| | | | | | | | | | | | | | |
| | | | | | | | | | | | | 23,815,279 | |
| | |
| | Machinery – 0.7% | |
| Aecom Technology Corp. (BB-/Ba3)(a) | |
| | 3,850,000 | | | | 5.750 | | | | 10/15/22 | | | | 3,860,268 | |
| | 4,850,000 | | | | 5.875 | | | | 10/15/24 | | | | 4,874,408 | |
| Constellation Enterprises LLC (B-/Caa1)(a) | |
| | 10,370,000 | | | | 10.625 | | | | 02/01/16 | | | | 9,333,000 | |
| Dresser-Rand Group, Inc. (B+/Ba3) | |
| | 8,000,000 | | | | 6.500 | | | | 05/01/21 | | | | 8,640,000 | |
| EnPro Industries, Inc. (BB-/B1)(a) | |
| | 4,450,000 | | | | 5.875 | | | | 09/15/22 | | | | 4,539,000 | |
| | | | | | | | | | | | | | |
| | | | | | | | | | | | | 31,246,676 | |
| | |
| | Media – Broadcasting & Radio – 2.1% | |
| Entercom Radio LLC (B-/Caa1) | |
| | 9,700,000 | | | | 10.500 | | | | 12/01/19 | | | | 10,694,250 | |
| Gannett Co., Inc. (BB+/Ba1) | |
| | 7,000,000 | | | | 5.125 | | | | 07/15/20 | | | | 7,070,000 | |
| iHeartCommunications, Inc. (CCC+/Caa1) | |
| | 15,000,000 | | | | 9.000 | | | | 12/15/19 | | | | 15,093,750 | |
| iHeartCommunications, Inc. (CCC-/NR)(c) | |
| | 2,020,000 | | | | 14.000 | | | | 02/01/21 | | | | 1,853,350 | |
| Nexstar Broadcasting, Inc. (B/Caa1) | |
| | 6,350,000 | | | | 6.875 | | | | 11/15/20 | | | | 6,524,625 | |
| Sirius XM Radio, Inc. (BB/B1)(a) | |
| | 400,000 | | | | 4.250 | | | | 05/15/20 | | | | 382,000 | |
| | 3,900,000 | | | | 5.875 | | | | 10/01/20 | | | | 3,939,000 | |
| | |
| | |
| 74 | | The accompanying notes are an integral part of these financial statements. |
GOLDMAN SACHS HIGH YIELD FUND
| | | | | | | | | | | | | | |
Principal
Amount | | | Interest
Rate | | | Maturity
Date | | | Value | |
| | Corporate Obligations – (continued) | |
| | Media – Broadcasting & Radio – (continued) | |
| Sirius XM Radio, Inc. (BB/B1)(a) – (continued) | |
| $ | 8,850,000 | | | | 5.750 | % | | | 08/01/21 | | | $ | 8,850,000 | |
| | 9,750,000 | | | | 6.000 | | | | 07/15/24 | | | | 9,871,875 | |
| Univision Communications, Inc. (CCC+/Caa2)(a) | |
| | 10,000,000 | | | | 8.500 | | | | 05/15/21 | | | | 10,600,000 | |
| Univision Communications, Inc. (B+/B2)(a) | |
| | 16,506,000 | | | | 6.750 | | | | 09/15/22 | | | | 17,702,685 | |
| | 4,200,000 | | | | 5.125 | | | | 05/15/23 | | | | 4,252,500 | |
| | | | | | | | | | | | | | |
| | | | | | | | | | | | | 96,834,035 | |
| | |
| | Media – Cable – 4.3% | |
| Adelphia Communications Corp. (NR/NR)(b) | |
| | 2,000,000 | | | | 10.250 | | | | 06/15/49 | | | | 17,500 | |
| CCO Holdings LLC/CCO Holdings Capital Corp. (B/B1) | |
| | 5,500,000 | | | | 7.375 | | | | 06/01/20 | | | | 5,816,250 | |
| | 10,000,000 | | | | 6.500 | | | | 04/30/21 | | | | 10,425,000 | |
| | 10,000,000 | | | | 6.625 | | | | 01/31/22 | | | | 10,500,000 | |
| | 11,000,000 | | | | 5.750 | | | | 09/01/23 | | | | 10,972,500 | |
| Cequel Communications Holdings I LLC/Cequel Capital Corp.
(B-/B3)(a) |
|
| | 25,600,000 | | | | 5.125 | | | | 12/15/21 | | | | 24,384,000 | |
| CSC Holdings LLC (BB/Ba2) | |
| | 5,100,000 | | | | 8.625 | | | | 02/15/19 | | | | 5,826,750 | |
| | 7,650,000 | | | | 6.750 | | | | 11/15/21 | | | | 8,147,250 | |
| | 7,000,000 | | | | 5.250 | (a) | | | 06/01/24 | | | | 6,720,000 | |
| DISH DBS Corp. (BB-/Ba3) | |
| | 5,400,000 | | | | 4.250 | | | | 04/01/18 | | | | 5,420,250 | |
| | 800,000 | | | | 7.875 | | | | 09/01/19 | | | | 908,000 | |
| | 22,000,000 | | | | 6.750 | | | | 06/01/21 | | | | 23,595,000 | |
| Harron Communications LP/Harron Finance Corp. (B-/Caa1)(a) | |
| | 6,730,000 | | | | 9.125 | | | | 04/01/20 | | | | 7,403,000 | |
| Lynx II Corp. (B/B2)(a) | |
| | 4,000,000 | | | | 6.375 | | | | 04/15/23 | | | | 4,130,000 | |
| Midcontinent Communications & Midcontinent Finance Corp.
(B-/B3)(a) |
|
| | 7,500,000 | | | | 6.250 | | | | 08/01/21 | | | | 7,575,000 | |
| Numericable Group SA (B+/Ba3)(a) | |
| | 19,400,000 | | | | 6.000 | | | | 05/15/22 | | | | 19,545,500 | |
| UPC Holding BV (B/B2) | |
| EUR | 5,000,000 | | | | 8.375 | | | | 08/15/20 | | | | 6,810,179 | |
| | 2,600,000 | | | | 6.375 | | | | 09/15/22 | | | | 3,529,766 | |
| CHF | 12,350,000 | | | | 6.750 | (a) | | | 03/15/23 | | | | 14,151,209 | |
| Virgin Media Secured Finance PLC (BB-/Ba3)(a) | |
| $ | 16,000,000 | | | | 5.375 | | | | 04/15/21 | | | | 16,120,000 | |
| VTR Finance BV (B+/B1)(a) | |
| | 10,000,000 | | | | 6.875 | | | | 01/15/24 | | | | 10,268,800 | |
| | | | | | | | | | | | | | |
| | | | | | | | | | | | | 202,265,954 | |
| | |
| | Media – Diversified – 0.3% | |
| Videotron Ltd. (BB/Ba2) | |
| | 8,450,000 | | | | 5.000 | | | | 07/15/22 | | | | 8,365,500 | |
| | 8,000,000 | | | | 5.375 | (a) | | | 06/15/24 | | | | 7,920,000 | |
| | | | | | | | | | | | | | |
| | | | | | | | | | | | | 16,285,500 | |
| | |
| | Media – Non Cable(a) – 0.2% | |
| Getty Images, Inc. (CCC+/Caa2) | |
| | 14,000,000 | | | | 7.000 | | | | 10/15/20 | | | | 10,325,000 | |
| | |
| | Corporate Obligations – (continued) | |
| | Metals – 1.6% | |
| AK Steel Corp. (B-/Caa1) | |
| $ | 12,000,000 | | | | 7.625 | % | | | 05/15/20 | | | $ | 11,850,000 | |
| | 4,850,000 | | | | 7.625 | | | | 10/01/21 | | | | 4,680,250 | |
| Alcoa, Inc. (BBB-/Ba1) | |
| | 3,219,000 | | | | 6.150 | | | | 08/15/20 | | | | 3,545,804 | |
| | 9,850,000 | | | | 5.125 | | | | 10/01/24 | | | | 9,824,678 | |
| ArcelorMittal (BB+/Ba1) | |
| | 3,700,000 | | | | 6.000 | | | | 03/01/21 | | | | 3,875,750 | |
| | 10,000,000 | | | | 6.750 | | | | 02/25/22 | | | | 10,697,500 | |
| Commercial Metals Co. (BB+/Ba2) | |
| | 7,792,000 | | | | 4.875 | | | | 05/15/23 | | | | 7,538,760 | |
| Steel Dynamics, Inc. (BB+/Ba2) | |
| | 5,650,000 | | | | 5.125 | (a) | | | 10/01/21 | | | | 5,720,625 | |
| | 8,650,000 | | | | 5.250 | | | | 04/15/23 | | | | 8,693,250 | |
| | 6,150,000 | | | | 5.500 | (a) | | | 10/01/24 | | | | 6,257,625 | |
| | | | | | | | | | | | | | |
| | | | | | | | | | | | | 72,684,242 | |
| | |
| | Mining(a) – 0.4% | |
| Calcipar SA (BB/Ba3) | |
| | 7,005,000 | | | | 6.875 | | | | 05/01/18 | | | | 7,215,150 | |
| Magnetation LLC/Mag Finance Corp. (B-/B3) | |
| | 3,700,000 | | | | 11.000 | | | | 05/15/18 | | | | 3,727,750 | |
| New Gold, Inc. (BB-/B2) | |
| | 1,098,000 | | | | 7.000 | | | | 04/15/20 | | | | 1,161,135 | |
| | 8,000,000 | | | | 6.250 | | | | 11/15/22 | | | | 8,080,000 | |
| | | | | | | | | | | | | | |
| | | | | | | | | | | | | 20,184,035 | |
| | |
| | Packaging – 2.7% | |
| Ardagh Finance Holdings SA (CCC+/Caa2)(a)(c) | |
| | 7,000,000 | | | | 8.625 | | | | 06/15/19 | | | | 6,860,948 | |
| Ardagh Glass Finance PLC (CCC+/Caa1) | |
| EUR | 6,000,000 | | | | 8.750 | | | | 02/01/20 | | | | 7,918,796 | |
| Ardagh Packaging Finance PLC (CCC+/Caa1)(a) | |
| $ | 1,550,000 | | | | 6.250 | | | | 01/31/19 | | | | 1,548,063 | |
| | 7,275,000 | | | | 9.125 | | | | 10/15/20 | | | | 7,884,281 | |
| Ardagh Packaging Finance PLC (NR/Caa1)(a) | |
| | 1,332,353 | | | | 7.000 | | | | 11/15/20 | | | | 1,327,357 | |
| Ardagh Packaging Finance PLC (CCC+/Caa1)(a) | |
| | 2,350,000 | | | | 6.000 | | | | 06/30/21 | | | | 2,253,062 | |
| Ball Corp. (BB+/Ba1) | |
| | 1,500,000 | | | | 5.750 | | | | 05/15/21 | | | | 1,554,375 | |
| | 9,450,000 | | | | 5.000 | | | | 03/15/22 | | | | 9,473,625 | |
| BWAY Holding Co. (CCC/Caa2)(a) | |
| | 13,500,000 | | | | 9.125 | | | | 08/15/21 | | | | 13,601,250 | |
| Reynolds Group Issuer, Inc. (CCC+/Caa2) | |
| | 37,000,000 | | | | 9.000 | | | | 04/15/19 | | | | 38,572,500 | |
| | 12,000,000 | | | | 9.875 | | | | 08/15/19 | | | | 12,915,000 | |
| Reynolds Group Issuer, Inc. (B+/B1) | |
| | 5,000,000 | | | | 7.875 | | | | 08/15/19 | | | | 5,300,000 | |
| | 9,100,000 | | | | 5.750 | | | | 10/15/20 | | | | 9,247,875 | |
| | 1,625,000 | | | | 6.875 | | | | 02/15/21 | | | | 1,692,031 | |
| Sealed Air Corp. (BB/B1)(a) | |
| | 5,450,000 | | | | 8.375 | | | | 09/15/21 | | | | 6,035,875 | |
| | | | | | | | | | | | | | |
| | | | | | | | | | | | | 126,185,038 | |
| | |
| | |
| The accompanying notes are an integral part of these financial statements. | | 75 |
GOLDMAN SACHS HIGH YIELD FUND
Schedule of Investments (continued)
September 30, 2014 (Unaudited)
| | | | | | | | | | | | | | |
Principal
Amount | | | Interest
Rate | | | Maturity
Date | | | Value | |
| | Corporate Obligations – (continued) | |
| | Paper – 0.3% | |
| Clearwater Paper Corp. (BB/Ba2) | |
| $ | 1,100,000 | | | | 4.500 | % | | | 02/01/23 | | | $ | 1,053,250 | |
| | 12,800,000 | | | | 5.375 | (a) | | | 02/01/25 | | | | 12,640,000 | |
| Stone Container Finance Co. of Canada II (NR/WR)(b) | |
| | 2,250,000 | | | | 7.375 | | | | 07/15/14 | | | | — | |
| | | | | | | | | | | | | | |
| | | | | | | | | | | | | 13,693,250 | |
| | |
| | Printing – 0.6% | |
| Logo Merger Sub Corp. (CCC+/Caa1)(a) | |
| | 15,700,000 | | | | 8.375 | | | | 10/15/20 | | | | 16,347,625 | |
| McGraw-Hill Global Education Holdings LLC/McGraw-Hil
Global Education Finance (B+/B1) |
|
| | 5,800,000 | | | | 9.750 | | | | 04/01/21 | | | | 6,409,000 | |
| RR Donnelley & Sons Co. (BB-/Ba3) | |
| | 5,650,000 | | | | 7.875 | | | | 03/15/21 | | | | 6,306,813 | |
| | | | | | | | | | | | | | |
| | | | | | | | | | | | | 29,063,438 | |
| | |
| | Publishing(a) – 1.2% | |
| CBS Outdoor Americas Capital LLC/CBS Outdoor Americas
Capital Corp. (BB-/B1) |
|
| | 2,250,000 | | | | 5.250 | | | | 02/15/22 | | | | 2,247,187 | |
| | 6,650,000 | | | | 5.875 | | | | 03/15/25 | | | | 6,666,625 | |
| Nielsen Finance LLC/Nielsen Finance Co. (BB/B1) | |
| | 3,850,000 | | | | 5.000 | | | | 04/15/22 | | | | 3,763,375 | |
| ProQuest LLC/ProQuest Notes Co. (B/B3) | |
| | 18,800,000 | | | | 9.000 | | | | 10/15/18 | | | | 19,693,000 | |
| The Nielsen Co Luxembourg SARL (BB/B1) | |
| | 6,400,000 | | | | 5.500 | | | | 10/01/21 | | | | 6,416,000 | |
| Time, Inc. (BB/B1) | |
| | 18,000,000 | | | | 5.750 | | | | 04/15/22 | | | | 17,280,000 | |
| | | | | | | | | | | | | | |
| | | | | | | | | | | | | 56,066,187 | |
| | |
| | Real Estate – 0.8% | |
| CB Richard Ellis Services, Inc. (BB/Ba1) | |
| | 5,000,000 | | | | 5.000 | | | | 03/15/23 | | | | 4,950,000 | |
| CBRE Services, Inc. (BB/Ba1) | |
| | 9,150,000 | | | | 5.250 | | | | 03/15/25 | | | | 9,058,500 | |
| DuPont Fabros Technology LP (BB/Ba1) | |
| | 14,000,000 | | | | 5.875 | | | | 09/15/21 | | | | 14,350,000 | |
| istar Financial, Inc. (B+/B3) | |
| | 7,000,000 | | | | 4.000 | | | | 11/01/17 | | | | 6,781,250 | |
| Starwood Property Trust, Inc. (BB-/NR) | |
| | 2,550,000 | | | | 4.550 | | | | 03/01/18 | | | | 2,740,485 | |
| | | | | | | | | | | | | | |
| | | | | | | | | | | | | 37,880,235 | |
| | |
| | Retailers – 1.9% | |
| Claire’s Stores, Inc. (CCC/Caa2) | |
| | 3,000,000 | | | | 8.875 | | | | 03/15/19 | | | | 2,490,000 | |
| Claire’s Stores, Inc. (B-/B2)(a) | |
| | 1,200,000 | | | | 9.000 | | | | 03/15/19 | | | | 1,218,000 | |
| | 4,000,000 | | | | 6.125 | | | | 03/15/20 | | | | 3,680,000 | |
| Claire’s Stores, Inc. (CCC/Caa2)(a) | |
| | 3,000,000 | | | | 7.750 | | | | 06/01/20 | | | | 2,137,500 | |
| Gamestop Corp. (BB+/Ba1)(a) | |
| | 6,800,000 | | | | 5.500 | | | | 10/01/19 | | | | 6,677,955 | |
| Jo-Ann Stores, Inc. (CCC+/Caa1)(a) | |
| | 5,665,000 | | | | 8.125 | | | | 03/15/19 | | | | 5,495,050 | |
| | |
| | Corporate Obligations – (continued) | |
| | Retailers – (continued) | |
| L Brands, Inc. (BB+/Ba1) | |
| $ | 10,337,000 | | | | 6.625 | % | | | 04/01/21 | | | $ | 11,344,857 | |
| | 7,050,000 | | | | 5.625 | | | | 02/15/22 | | | | 7,349,625 | |
| Neiman Marcus Group Ltd., Inc. (CCC+/Caa2)(a) | |
| | 21,000,000 | | | | 8.000 | | | | 10/15/21 | | | | 21,840,000 | |
| | 16,000,000 | | | | 8.750 | (c) | | | 10/15/21 | | | | 16,880,000 | |
| The William Carter Co. (BB+/Ba2) | |
| | 8,000,000 | | | | 5.250 | | | | 08/15/21 | | | | 8,200,000 | |
| | | | | | | | | | | | | | |
| | | | | | | | | | | | | 87,312,987 | |
| | |
| | Retailers – Food & Drug – 0.3% | |
| Rite Aid Corp. (CCC+/Caa1) | |
| | 12,350,000 | | | | 6.750 | | | | 06/15/21 | | | | 12,597,000 | |
| | |
| | Services Cyclical – Business Services – 1.0% | |
| CoreLogic, Inc. (B+/B1) | |
| | 13,000,000 | | | | 7.250 | | | | 06/01/21 | | | | 13,617,500 | |
| Sitel LLC/Sitel Finance Corp. (B-/B2)(a) | |
| | 5,000,000 | | | | 11.000 | | | | 08/01/17 | | | | 5,206,250 | |
| Sitel LLC/Sitel Finance Corp. (CCC+/Caa2) | |
| | 5,000,000 | | | | 11.500 | | | | 04/01/18 | | | | 4,756,250 | |
| SPL Logistics Escrow LLC (B/B2)(a) | |
| | 15,000,000 | | | | 8.875 | | | | 08/01/20 | | | | 16,312,500 | |
| WEX, Inc. (BB-/Ba3)(a) | |
| | 8,900,000 | | | | 4.750 | | | | 02/01/23 | | | | 8,499,500 | |
| | | | | | | | | | | | | | |
| | | | | | | | | | | | | 48,392,000 | |
| | |
| | Services Cyclical – Rental Equipment – 2.0% | |
| Ahern Rentals, Inc. (B/Caa1)(a) | |
| | 7,000,000 | | | | 9.500 | | | | 06/15/18 | | | | 7,490,000 | |
| Algeco Scotsman Global Finance PLC (B/B2)(a) | |
| | 18,500,000 | | | | 8.500 | | | | 10/15/18 | | | | 18,962,500 | |
| Algeco Scotsman Global Finance PLC (CCC+/Caa1)(a) | |
| | 20,000,000 | | | | 10.750 | | | | 10/15/19 | | | | 19,100,000 | |
| Ashtead Capital, Inc. (BB-/Ba3)(a) | |
| | 9,850,000 | | | | 5.625 | | | | 10/01/24 | | | | 9,923,875 | |
| Emeco Pty Ltd. (BB-/Ba3)(a) | |
| | 12,250,000 | | | | 9.875 | | | | 03/15/19 | | | | 12,188,750 | |
| Europcar Groupe SA (B-/Caa1) | |
| EUR | 4,000,000 | | | | 11.500 | (a) | | | 05/15/17 | | | | 5,787,196 | |
| | 1,000,000 | | | | 11.500 | | | | 05/15/17 | | | | 1,446,799 | |
| Jurassic Holdings III, Inc. (B-/Caa1)(a) | |
| $ | 8,650,000 | | | | 6.875 | | | | 02/15/21 | | | | 8,606,750 | |
| United Rentals North America, Inc. (BB-/B1) | |
| | 10,000,000 | | | | 7.375 | | | | 05/15/20 | | | | 10,700,000 | |
| | | | | | | | | | | | | | |
| | | | | | | | | | | | | 94,205,870 | |
| | |
| | Technology – Hardware – 1.8% | |
| Advanced Micro Devices, Inc. (B/B2) | |
| | 6,850,000 | | | | 6.750 | | | | 03/01/19 | | | | 6,901,375 | |
| Alcatel-Lucent USA, Inc. (B/B3)(a) | |
| | 4,000,000 | | | | 8.875 | | | | 01/01/20 | | | | 4,350,000 | |
| | 12,000,000 | | | | 6.750 | | | | 11/15/20 | | | | 12,120,000 | |
| Alcatel-Lucent USA, Inc. (B/WR) | |
| | 7,000,000 | | | | 6.450 | | | | 03/15/29 | | | | 6,615,000 | |
| Ancestry.com, Inc. (CCC+/B3) | |
| | 5,000,000 | | | | 11.000 | | | | 12/15/20 | | | | 5,700,000 | |
| | |
| | |
| 76 | | The accompanying notes are an integral part of these financial statements. |
GOLDMAN SACHS HIGH YIELD FUND
| | | | | | | | | | | | | | |
Principal
Amount | | | Interest
Rate | | | Maturity
Date | | | Value | |
| | Corporate Obligations – (continued) | |
| | Technology – Hardware – (continued) | |
| CommScope Holding Co., Inc. (B/B3)(a)(c) | |
| $ | 6,500,000 | | | | 6.625 | % | | | 06/01/20 | | | $ | 6,760,000 | |
| CommScope, Inc. (B+/B2)(a) | |
| | 5,100,000 | | | | 5.000 | | | | 06/15/21 | | | | 4,985,250 | |
| | 3,400,000 | | | | 5.500 | | | | 06/15/24 | | | | 3,323,500 | |
| EN Germany Holdings BV (CCC+/B3) | |
| EUR | 3,539,000 | | | | 10.750 | | | | 11/15/15 | | | | 4,436,411 | |
| Freescale Semiconductor, Inc. (B/B1)(a) | |
| $ | 9,850,000 | | | | 6.000 | | | | 01/15/22 | | | | 9,997,750 | |
| IAC/InterActiveCorp. (BB+/Ba1) | |
| | 3,000,000 | | | | 4.750 | | | | 12/15/22 | | | | 2,887,500 | |
| NCR Corp. (BB/Ba3) | |
| | 600,000 | | | | 4.625 | | | | 02/15/21 | | | | 591,000 | |
| | 7,011,000 | | | | 5.000 | | | | 07/15/22 | | | | 6,923,363 | |
| | 6,500,000 | | | | 6.375 | | | | 12/15/23 | | | | 6,825,000 | |
| | | | | | | | | | | | | | |
| | | | | | | | | | | | | 82,416,149 | |
| | |
| | Technology – Software/Services – 2.9% | |
| BMC Software Finance, Inc. (CCC+/Caa1)(a) | |
| | 13,250,000 | | | | 8.125 | | | | 07/15/21 | | | | 12,653,750 | |
| Boxer Parent Co., Inc. (CCC+/Caa2)(a)(c) | |
| | 10,950,000 | | | | 9.000 | | | | 10/15/19 | | | | 10,183,500 | |
| CyrusOne LP/CyrusOne Finance Corp. (B+/B2) | |
| | 10,255,000 | | | | 6.375 | | | | 11/15/22 | | | | 10,652,381 | |
| Equinix, Inc. (BB/Ba3) | |
| | 5,750,000 | | | | 4.875 | | | | 04/01/20 | | | | 5,692,500 | |
| | 8,331,000 | | | | 7.000 | | | | 07/15/21 | | | | 8,872,515 | |
| | 9,050,000 | | | | 5.375 | | | | 04/01/23 | | | | 8,914,250 | |
| First Data Corp. (BB-/B1)(a) | |
| | 15,000,000 | | | | 6.750 | | | | 11/01/20 | | | | 15,862,500 | |
| First Data Corp. (B-/Caa1) | |
| | 5,000,000 | | | | 8.250 | (a) | | | 01/15/21 | | | | 5,300,000 | |
| | 6,500,000 | | | | 11.250 | | | | 01/15/21 | | | | 7,410,000 | |
| | 4,000,000 | | | | 12.625 | | | | 01/15/21 | | | | 4,790,000 | |
| | 22,000,000 | | | | 8.750 | (a)(c) | | | 01/15/22 | | | | 23,430,000 | |
| First Data Holdings, Inc. (NR/NR)(a)(c) | |
| | 1,324,959 | | | | 14.500 | | | | 09/24/19 | | | | 1,407,235 | |
| Infor Software Parent LLC/Infor Software Parent, Inc.
(CCC+/Caa1)(a)(c) |
|
| | 7,850,000 | | | | 7.125 | | | | 05/01/21 | | | | 7,771,500 | |
| Nuance Communications, Inc. (BB-/B1)(a) | |
| | 11,900,000 | | | | 5.375 | | | | 08/15/20 | | | | 11,632,250 | |
| | | | | | | | | | | | | | |
| | | | | | | | | | | | | 134,572,381 | |
| | |
| | Telecommunications – 2.9% | |
| CenturyLink, Inc. (BB/Ba2) | |
| | 4,650,000 | | | | 5.625 | | | | 04/01/20 | | | | 4,796,475 | |
| Frontier Communications Corp. (BB-/Ba3) | |
| | 14,000,000 | | | | 8.250 | | | | 04/15/17 | | | | 15,470,000 | |
| | 3,200,000 | | | | 8.125 | | | | 10/01/18 | | | | 3,568,000 | |
| | 27,000,000 | | | | 8.500 | | | | 04/15/20 | | | | 30,037,500 | |
| Level 3 Communications, Inc. (B-/Caa2) | |
| | 5,000,000 | | | | 8.875 | | | | 06/01/19 | | | | 5,337,500 | |
| Level 3 Financing, Inc. (B-/B3) | |
| | 5,700,000 | | | | 8.125 | | | | 07/01/19 | | | | 6,070,500 | |
| | 5,000,000 | | | | 7.000 | | | | 06/01/20 | | | | 5,268,750 | |
| | |
| | Corporate Obligations – (continued) | |
| | Telecommunications – (continued) | |
| Level 3 Financing, Inc. (B-/B3) – (continued) | |
| $ | 7,100,000 | | | | 6.125 | %(a) | | | 01/15/21 | | | $ | 7,313,000 | |
| Telecom Italia Capital SA (BB+/Ba1) | |
| | 2,750,000 | | | | 6.999 | | | | 06/04/18 | | | | 3,090,623 | |
| | 1,950,000 | | | | 7.175 | | | | 06/18/19 | | | | 2,198,625 | |
| | 4,100,000 | | | | 7.721 | | | | 06/04/38 | | | | 4,581,750 | |
| Telecom Italia SpA (BB+/Ba1)(a) | |
| | 19,950,000 | | | | 5.303 | | | | 05/30/24 | | | | 19,563,568 | |
| Windstream Corp. (B/B1) | |
| | 6,325,000 | | | | 7.875 | | | | 11/01/17 | | | | 6,973,312 | |
| | 5,050,000 | | | | 7.750 | | | | 10/15/20 | | | | 5,321,438 | |
| | 6,200,000 | | | | 7.750 | | | | 10/01/21 | | | | 6,626,250 | |
| | 5,250,000 | | | | 7.500 | | | | 06/01/22 | | | | 5,519,062 | |
| | 4,350,000 | | | | 6.375 | | | | 08/01/23 | | | | 4,181,438 | |
| | | | | | | | | | | | | | |
| | | | | | | | | | | | | 135,917,791 | |
| | |
| | Telecommunications – Cellular – 7.2% | |
| Altice Financing SA (BB-/B1)(a) | |
| | 8,100,000 | | | | 6.500 | | | | 01/15/22 | | | | 8,302,500 | |
| Altice Finco SA (B-/B3)(a) | |
| | 3,200,000 | | | | 9.875 | | | | 12/15/20 | | | | 3,592,000 | |
| | 6,000,000 | | | | 8.125 | | | | 01/15/24 | | | | 6,375,000 | |
| Crown Castle International Corp. (BB/B1) | |
| | 5,000,000 | | | | 4.875 | | | | 04/15/22 | | | | 4,850,000 | |
| | 7,850,000 | | | | 5.250 | | | | 01/15/23 | | | | 7,742,063 | |
| Matterhorn Financing & CY SCA (CCC+/NR)(a)(c) | |
| EUR | 6,100,000 | | | | 9.000 | | | | 04/15/19 | | | | 7,788,049 | |
| SBA Communications Corp. (B/B3)(a) | |
| $ | 11,450,000 | | | | 4.875 | | | | 07/15/22 | | | | 10,992,000 | |
| SBA Telecommunications, Inc. (B+/B3) | |
| | 7,400,000 | | | | 5.750 | | | | 07/15/20 | | | | 7,566,500 | |
| Softbank Corp. (BB+/Ba1)(a) | |
| | 35,000,000 | | | | 4.500 | | | | 04/15/20 | | | | 34,737,500 | |
| Sprint Capital Corp. (BB-/B1) | |
| | 14,000,000 | | | | 6.900 | | | | 05/01/19 | | | | 14,700,000 | |
| | 18,000,000 | | | | 8.750 | | | | 03/15/32 | | | | 19,665,000 | |
| Sprint Communications, Inc. (BB-/B1) | |
| | 24,600,000 | | | | 8.375 | | | | 08/15/17 | | | | 27,552,000 | |
| Sprint Communications, Inc. (BB+/Ba2)(a) | |
| | 15,450,000 | | | | 9.000 | | | | 11/15/18 | | | | 17,864,062 | |
| | 8,000,000 | | | | 7.000 | | | | 03/01/20 | | | | 8,760,000 | |
| Sprint Communications, Inc. (BB-/B1) | |
| | 11,350,000 | | | | 7.000 | | | | 08/15/20 | | | | 11,860,750 | |
| | 10,000,000 | | | | 11.500 | | | | 11/15/21 | | | | 12,750,000 | |
| Sprint Corp. (BB-/B1)(a) | |
| | 19,000,000 | | | | 7.250 | | | | 09/15/21 | | | | 19,855,000 | |
| | 18,000,000 | | | | 7.875 | | | | 09/15/23 | | | | 19,125,000 | |
| T-Mobile USA, Inc. (BB/Ba3) | |
| | 9,050,000 | | | | 6.542 | | | | 04/28/20 | | | | 9,253,625 | |
| | 11,000,000 | | | | 6.250 | | | | 04/01/21 | | | | 11,110,000 | |
| | 2,600,000 | | | | 6.633 | | | | 04/28/21 | | | | 2,665,000 | |
| | 9,750,000 | | | | 6.125 | | | | 01/15/22 | | | | 9,774,375 | |
| | 9,000,000 | | | | 6.731 | | | | 04/28/22 | | | | 9,225,000 | |
| Wind Acquisition Finance SA (NR/Ba3)(a) | |
| | 18,400,000 | | | | 4.750 | | | | 07/15/20 | | | | 17,664,000 | |
| Wind Acquisition Finance SA (B/Caa1)(a) | |
| | 33,950,000 | | | | 7.375 | | | | 04/23/21 | | | | 34,077,312 | |
| | | | | | | | | | | | | | |
| | | | | | | | | | | | | 337,846,736 | |
| | |
| | |
| The accompanying notes are an integral part of these financial statements. | | 77 |
GOLDMAN SACHS HIGH YIELD FUND
Schedule of Investments (continued)
September 30, 2014 (Unaudited)
| | | | | | | | | | | | | | |
Principal
Amount | | | Interest
Rate | | | Maturity
Date | | | Value | |
| | Corporate Obligations – (continued) | |
| | Telecommunications – Satellites – 1.7% | |
| Inmarsat Finance PLC (BB+/Ba2)(a) | |
| $ | 8,750,000 | | | | 4.875 | % | | | 05/15/22 | | | $ | 8,509,375 | |
| Intelsat Jackson Holdings SA (B+/B3) | |
| | 10,100,000 | | | | 7.500 | | | | 04/01/21 | | | | 10,756,500 | |
| | 6,000,000 | | | | 5.500 | | | | 08/01/23 | | | | 5,745,000 | |
| Intelsat Jackson Holdings SA (B-/Caa1) | |
| | 10,000,000 | | | | 6.625 | | | | 12/15/22 | | | | 10,075,000 | |
| Intelsat Luxembourg SA (B-/Caa2) | |
| | 4,550,000 | | | | 6.750 | | | | 06/01/18 | | | | 4,675,125 | |
| | 27,000,000 | | | | 7.750 | | | | 06/01/21 | | | | 27,472,500 | |
| | 13,000,000 | | | | 8.125 | | | | 06/01/23 | | | | 13,552,500 | |
| | | | | | | | | | | | | | |
| | | | | | | | | | | | | 80,786,000 | |
| | |
| | Telecommunications – Wireless(a) – 0.7% | |
| Mobile Challenger Intermediate Group SA (B-/NR)(c) | |
| CHF | 9,300,000 | | | | 8.750 | | | | 03/15/19 | | | | 9,847,265 | |
| Sabine Pass Liquefaction LLC (BB+/Ba3) | |
| $ | 11,000,000 | | | | 6.250 | | | | 03/15/22 | | | | 11,577,500 | |
| | 10,950,000 | | | | 5.750 | | | | 05/15/24 | | | | 11,114,250 | |
| | | | | | | | | | | | | | |
| | | | | | | | | | | | | 32,539,015 | |
| | |
| | Textiles & Apparel(a) – 0.1% | |
| Quiksilver, Inc. (CCC+/B2) | |
| | 6,000,000 | | | | 7.875 | | | | 08/01/18 | | | | 5,310,000 | |
| | |
| | Tobacco – 0.2% | |
| Vector Group Ltd. (B+/Ba3) | |
| | 9,100,000 | | | | 7.750 | | | | 02/15/21 | | | | 9,520,875 | |
| | |
| | Transportation(a) – 0.5% | |
| Aguila 3 SA (B/B2) | |
| | 20,000,000 | | | | 7.875 | | | | 01/31/18 | | | | 20,450,000 | |
| Jack Cooper Holdings Corp. (CCC+/B2) | |
| | 4,350,000 | | | | 9.250 | | | | 06/01/20 | | | | 4,687,125 | |
| | | | | | | | | | | | | | |
| | | | | | | | | | | | | 25,137,125 | |
| | |
| | Utilities – Electric – 0.5% | |
| NRG Energy, Inc. (BB-/B1) | |
| | 1,750,000 | | | | 6.625 | | | | 03/15/23 | | | | 1,785,000 | |
| | 10,950,000 | | | | 6.250 | (a) | | | 05/01/24 | | | | 10,977,375 | |
| RJS Power Holdings LLC (BB-/B1)(a) | |
| | 9,000,000 | | | | 5.125 | | | | 07/15/19 | | | | 8,842,500 | |
| | | | | | | | | | | | | | |
| | | | | | | | | | | | | 21,604,875 | |
| | |
| | Utilities – Pipelines – 0.5% | |
| Regency Energy Partners LP/Regency Energy Finance Corp.
(BB/Ba3) |
|
| | 3,000,000 | | | | 5.750 | | | | 09/01/20 | | | | 3,105,000 | |
| | 5,000,000 | | | | 6.500 | | | | 07/15/21 | | | | 5,237,500 | |
| | 3,700,000 | | | | 5.875 | | | | 03/01/22 | | | | 3,857,250 | |
| | 8,450,000 | | | | 5.000 | | | | 10/01/22 | | | | 8,323,250 | |
| | 1,800,000 | | | | 5.500 | | | | 04/15/23 | | | | 1,809,000 | |
| | | | | | | | | | | | | | |
| | | | | | | | | | | | | 22,332,000 | |
| | |
| | TOTAL CORPORATE OBLIGATIONS | | | | | |
| | (Cost $4,160,243,653) | | | $ | 4,210,945,140 | |
| | |
| | | | | | | | | | | | | | |
| | Agency Debentures(e) – 3.2% | |
| FHLB | | | | | | | | | | | | | | |
| $ | 61,000,000 | | | | 0.000 | % | | | 11/19/14 | | | $ | 60,998,902 | |
| | 89,000,000 | | | | 0.000 | | | | 12/17/14 | | | | 88,997,152 | |
| | |
| | TOTAL AGENCY DEBENTURES | |
| | (Cost $149,987,575) | | | $ | 149,996,054 | |
| | |
| | | | | | | | | | | | | | |
| | Senior Term Loans(f) – 5.3% | |
| | Consumer Products – Industrial – 0.8% | |
| Atkore International, Inc. (B/B3) | |
| $ | 11,067,711 | | | | 4.500 | % | | | 04/09/21 | | | $ | 10,957,034 | |
| Atkore International, Inc. (CCC+/Caa2) | |
| | 8,275,000 | | | | 7.750 | | | | 10/09/21 | | | | 8,192,250 | |
| CPM Acquisition Corp. (B+/B1) | |
| | 10,089,875 | | | | 6.250 | | | | 08/29/17 | | | | 10,064,650 | |
| CPM Acquisition Corp. (B/Caa1) | |
| | 7,570,000 | | | | 10.250 | | | | 03/01/18 | | | | 7,645,700 | |
| | | | | | | | | | | | | | |
| | | | | | | | | | | | | 36,859,634 | |
| | |
| | Energy – 0.3% | |
| American Energy – Marcellus LLC (NR/NR) | |
| | 9,950,000 | | | | 5.250 | | | | 08/04/20 | | | | 9,853,585 | |
| | 2,650,000 | | | | 8.500 | | | | 08/04/21 | | | | 2,623,500 | |
| | | | | | | | | | | | | | |
| | | | | | | | | | | | | 12,477,085 | |
| | |
| | Food & Beverages – 1.0% | |
| Burger King Corp. (NR/NR)(g) | |
| | 24,150,000 | | | | 0.000 | | | | 09/04/15 | | | | 24,150,000 | |
| Performance Food Group, Inc. (CCC+/B3) | |
| | 12,439,488 | | | | 6.250 | | | | 11/14/19 | | | | 12,392,840 | |
| Shearer’s Foods, Inc. (CCC+/Caa1) | |
| | 13,000,000 | | | | 7.750 | | | | 06/30/22 | | | | 12,853,750 | |
| | | | | | | | | | | | | | |
| | | | | | | | | | | | | 49,396,590 | |
| | |
| | Gaming – 0.2% | |
| 1011778 B.C. Unlimited (NR/NR)(g) | |
| | 7,450,000 | | | | 0.000 | | | | 09/24/21 | | | | 7,392,039 | |
| Marina District Finance Co., Inc. (B+/B2) | |
| | 72,268 | | | | 6.750 | | | | 08/15/18 | | | | 70,826 | |
| | | | | | | | | | | | | | |
| | | | | | | | | | | | | 7,462,865 | |
| | |
| | Health Care – Services – 0.5% | |
| American Renal Holdings, Inc. (CCC+/Caa1) | |
| | 20,000,000 | | | | 8.500 | | | | 03/20/20 | | | | 19,800,000 | |
| Arysta Lifescience Corp. (CCC+/Caa1) | |
| | 2,750,000 | | | | 8.250 | | | | 11/30/20 | | | | 2,761,467 | |
| | | | | | | | | | | | | | |
| | | | | | | | | | | | | 22,561,467 | |
| | |
| | Home Construction – 0.4% | |
| BRG Bell Sports, Inc. (NR/NR) | |
| | 10,153,884 | | | | 6.500 | | | | 04/15/21 | | | | 10,179,269 | |
| | 7,600,000 | | | | 10.250 | | | | 04/14/22 | | | | 7,600,000 | |
| William Lyon Homes Inc. (NR/NR)(g) | |
| | 2,065,384 | | | | 0.000 | | | | 08/12/22 | | | | 2,065,384 | |
| | | | | | | | | | | | | | |
| | | | | | | | | | | | | 19,844,653 | |
| | |
| | |
| 78 | | The accompanying notes are an integral part of these financial statements. |
GOLDMAN SACHS HIGH YIELD FUND
| | | | | | | | | | | | | | |
Principal
Amount | | | Interest
Rate | | | Maturity
Date | | | Value | |
| | Senior Term Loans(f) – (continued) | |
| | Media – Broadcasting & Radio – 0.1% | |
| iHeart Communications, Inc. (CCC+/Caa1) | |
| $ | 3,795,111 | | | | 3.804 | % | | | 01/29/16 | | | $ | 3,754,807 | |
| | |
| | Media – Non Cable – 0.7% | |
| Affinion Group, Inc. (B/WR) | |
| | 1,439,383 | | | | 6.750 | | | | 04/30/18 | | | | 1,394,403 | |
| Affinion Group, Inc. (CCC/B3) | |
| | 5,100,000 | | | | 8.500 | | | | 10/12/18 | | | | 4,903,956 | |
| Getty Images, Inc. (B/B2) | |
| | 8,909,320 | | | | 4.750 | | | | 10/18/19 | | | | 8,155,770 | |
| Renaissance Learning, Inc. (B-/B1) | |
| | 7,167,532 | | | | 4.500 | | | | 04/09/21 | | | | 7,010,778 | |
| Renaissance Learning, Inc. (CCC/Caa2) | |
| | 12,047,700 | | | | 8.000 | | | | 04/01/22 | | | | 11,761,567 | |
| | | | | | | | | | | | | | |
| | | | | | | | | | | | | 33,226,474 | |
| | |
| | Retail – 0.1% | |
| Doosan Infracore Co., Ltd. (BB-/Ba3) | |
| | 4,688,250 | | | | 4.500 | | | | 05/28/21 | | | | 4,682,390 | |
| | |
| | Retailers – 0.5% | |
| BJ’s Wholesale Club, Inc. (CCC/Caa2) | |
| | 11,950,000 | | | | 8.500 | | | | 03/26/20 | | | | 12,006,045 | |
| True Religion Apparel, Inc. (B-/B3) | |
| | 8,272,125 | | | | 5.875 | | | | 07/30/19 | | | | 7,589,675 | |
| True Religion Apparel, Inc. (CCC/Caa2) | |
| | 6,825,000 | | | | 11.000 | | | | 01/29/20 | | | | 6,415,500 | |
| | | | | | | | | | | | | | |
| | | | | | | | | | | | | 26,011,220 | |
| | |
| | Services Cyclical – Consumer Services – 0.2% | |
| Weight Watchers International, Inc. (B+/B1) | |
| | 10,347,878 | | | | 4.000 | | | | 04/02/20 | | | | 7,864,387 | |
| | |
| | Services Cyclical – Rental Equipment – 0.1% | |
| Maxim Crane Works LP (B/Caa2) | |
| | 6,975,000 | | | | 10.250 | | | | 11/26/18 | | | | 7,108,711 | |
| | |
| | Wireless Telecommunications(g) – 0.4% | |
| Frontier Communications Corp. (NR/NR) | |
| | 19,500,000 | | | | 0.000 | | | | 01/29/15 | | | | 19,500,000 | |
| | |
| | TOTAL SENIOR TERM LOANS | |
| | (Cost $251,121,561) | | | | | | | $ | 250,750,283 | |
| | |
| | | | | | | | |
| Shares | | Rate | | | Value | |
| Preferred Stock(c)(h) – 0.1% | |
| Media – Broadcasting & Radio – 0.1% | |
Spanish Broadcasting System, Inc. | |
| 3,014 | | | 10.750 | % | | $ | 3,405,820 | |
| (Cost $3,042,344) | | | | | |
| |
| | | | | | | | |
Shares | | | Description | | Value | |
| | Common Stocks – 0.5% | |
| | 75,000 | | | Axiall Corp. | | $ | 2,685,750 | |
| | 40 | | | Dawn Holdings, Inc.(b) | | | — | |
| | 125,074 | | | General Motors Co. | | | 3,994,863 | |
| | 558,471 | | | Houghton Mifflin Harcourt Co.(b) | | | 10,856,676 | |
| | 76,163 | | | Intelsat SA(b) | | | 1,305,434 | |
| | 4,578 | | | Lear Corp. | | | 395,585 | |
| | 28,148 | | | Motors Liquidation Co.(b) | | | 688,219 | |
| | 21 | | | New Cotai Class B Shares(b) | | | — | |
| | 40,200 | | | NewPage Holdings, Inc. | | | 3,618,000 | |
| | 228 | | | Nycomed(b) | | | 3 | |
| | 3,874 | | | Panolam Holdings Co.(b) | | | 39 | |
| | 2,500 | | | Port Townsend Holdings Co., Inc.(b) | | | — | |
| | |
| | TOTAL COMMON STOCKS | | | | |
| | (Cost $33,960,089) | | $ | 23,544,569 | |
| | |
| | | | | | | | | | | | |
| Units | | | Description | | Expiration
Date | | | Value | |
| | Warrant(b) – 0.1% | |
| General Motors Co. (NR/NR) | |
| | 107,339 | | | | | | 07/10/16 | | | $ | 2,402,247 | |
| | 107,339 | | | | | | 07/10/19 | | | | 1,551,048 | |
| Lear Corp. (NR/NR) | |
| | 511 | | | | | | 11/09/14 | | | | 89,394 | |
| Lender Process Services, Inc. (NR/NR) | |
| | 14,274 | | | | | | 12/31/20 | | | | — | |
| Masonite International Corp. (NR/NR) | |
| | 22,734 | | | | | | 06/09/16 | | | | 219,838 | |
| | |
| | TOTAL WARRANT | | | | | |
| | (Cost $29,764,284) | | | $ | 4,262,527 | |
| | |
| TOTAL INVESTMENTS BEFORE SHORT-TERM
INVESTMENT |
|
| | (Cost $4,628,119,506) | | | $ | 4,642,904,393 | |
| | |
| | | | | | | | | | | | |
Principal
Amount | | | Interest
Rate | | Maturity
Date | | | Value | |
| | Short-term Investment(i) – 1.4% | |
| | Repurchase Agreement – 1.4% | |
| Joint Repurchase Agreement Account II | |
| $ | 66,000,000 | | | 0.012% | | | 10/01/14 | | | $ | 66,000,000 | |
| | (Cost $66,000,000) | | | | | |
| | |
| | TOTAL INVESTMENTS – 100.5% | | | | | |
| | (Cost $4,694,119,506) | | | $ | 4,708,904,393 | |
| | |
| LIABILITIES IN EXCESS OF OTHER
ASSETS – (0.5)% |
| | | (22,341,319 | ) |
| | |
| | NET ASSETS – 100.0% | | | $ | 4,686,563,074 | |
| | |
| | |
| The accompanying notes are an integral part of these financial statements. | | 79 |
GOLDMAN SACHS HIGH YIELD FUND
Schedule of Investments (continued)
September 30, 2014 (Unaudited)
| | |
| The percentage shown for each investment category reflects the value of investments in that category as a percentage of net assets. |
(a) | | Exempt from registration under Rule 144A of the Securities Act of 1933. Under procedures approved by the Board of Trustees, such securities have been determined to be liquid by the investment adviser and may be resold, normally to qualified institutional buyers in transactions exempt from registration. Total market value of Rule 144A securities amounts to $1,841,838,582, which represents approximately 39.3% of net assets as of September 30, 2014. |
(b) | | Security is currently in default and/or non-income producing. |
(c) | | Pay-in-kind securities. |
(d) | | Variable rate security. Interest rate or distribution rate disclosed is that which is in effect at September 30, 2014. |
(e) | | Issued with a zero coupon. Income is recognized through the accretion of discount. |
(f) | | Senior Term Loans often require prepayments from excess cash flows or permit the borrower to repay at its election. The degree to which borrowers repay, whether as a contractual requirement or at their election, cannot be predicted with accuracy. As a result, the actual remaining maturity may be substantially less than the stated maturities shown. The stated interest rate represents the weighted average interest rate of all contracts within the senior loan facility at September 30, 2014. Senior Term Loans typically have rates of interest which are predetermined either daily, monthly, quarterly or semi-annually by reference to a base lending rate, plus a premium. These base lending rates are primarily the London-Interbank Offered Rate (“LIBOR”), and secondarily the prime rate offered by one or more major United States banks (the “Prime Rate”) and the certificate of deposit (“CD”) rate or other base lending rates used by commercial lenders. |
(g) | | This position represents an unsettled loan commitment at period end. Certain details associated with this purchase are not known prior to the settlement date, including coupon rate. |
(h) | | Security with “Put” features and resetting interest rates. Maturity dates disclosed are the puttable dates. Interest rate disclosed is that which is in effect at September 30, 2014. |
(i) | | Joint repurchase agreement was entered into on September 30, 2014. Additional information appears on page 123. |
Security ratings disclosed, if any, are obtained from Standard & Poor’s/Moody’s Investors Service and are unaudited. A description of the ratings is available in the Fund’s Statement of Additional Information.
| | |
|
Currency Abbreviations: |
CAD | | —Canadian Dollar |
CHF | | —Swiss Franc |
EUR | | —Euro |
GBP | | —British Pound |
USD | | —U.S. Dollar |
|
Investment Abbreviations: |
FHLB | | —Federal Home Loan Bank |
LIBOR | | —London Interbank Offered Rate |
NR | | —Not Rated |
WR | | —Withdrawn Rating |
|
| | |
| 80 | | The accompanying notes are an integral part of these financial statements. |
GOLDMAN SACHS HIGH YIELD FUND
|
| ADDITIONAL INVESTMENT INFORMATION |
FORWARD FOREIGN CURRENCY EXCHANGE CONTRACTS — At September 30, 2014, the Fund had the following forward foreign currency exchange contracts:
FORWARD FOREIGN CURRENCY EXCHANGE CONTRACTS WITH UNREALIZED GAIN
| | | | | | | | | | | | | | |
| Counterparty | | Contracts to
Buy/Sell | | Settlement
Date | | | Current
Value | | | Unrealized
Gain | |
Credit Suisse International (London) | | USD/CHF | | | 10/03/14 | | | $ | 20,814,673 | | | $ | 765,861 | |
| | USD/EUR | | | 10/03/14 | | | | 53,790,434 | | | | 2,092,868 | |
| | USD/GBP | | | 10/03/14 | | | | 12,695,884 | | | | 252,373 | |
UBS AG (London) | | USD/CAD | | | 10/03/14 | | | | 7,492,531 | | | | 189,985 | |
| TOTAL | | | | | | | | | | | | $ | 3,301,087 | |
FUTURES CONTRACTS — At September 30, 2014, the Fund had the following futures contracts:
| | | | | | | | | | | | | | |
| Type | | Number of
Contracts
Long (Short) | | | Expiration
Date | | Current
Value | | | Unrealized
Gain (Loss) | |
Eurodollars | | | (1,267 | ) | | March 2017 | | $ | (309,068,813 | ) | | $ | 403,412 | |
Eurodollars | | | (1,045 | ) | | June 2017 | | | (254,418,313 | ) | | | 456,364 | |
Eurodollars | | | (605 | ) | | September 2017 | | | (147,067,938 | ) | | | 315,119 | |
Ultra Long U.S. Treasury Bonds | | | 101 | | | December 2014 | | | 15,402,500 | | | | 7,073 | |
5 Year German Euro-Bobl | | | (248 | ) | | December 2014 | | | (40,069,215 | ) | | | (113,188 | ) |
10 Year German Euro-Bund | | | (33 | ) | | December 2014 | | | (6,239,596 | ) | | | (22,564 | ) |
10 Year U.K. Long Gilt | | | (36 | ) | | December 2014 | | | (6,603,009 | ) | | | (25,165 | ) |
2 Year U.S. Treasury Notes | | | 950 | | | December 2014 | | | 207,901,563 | | | | (48,378 | ) |
5 Year U.S. Treasury Notes | | | 790 | | | December 2014 | | | 93,423,672 | | | | (4,713 | ) |
10 Year U.S. Treasury Notes | | | (3,349 | ) | | December 2014 | | | (417,421,453 | ) | | | 1,314,064 | |
20 Year U.S. Treasury Bonds | | | 554 | | | December 2014 | | | 76,400,063 | | | | (744,529 | ) |
| TOTAL | | | | | | | | | | | | $ | 1,537,495 | |
SWAP CONTRACTS — At September 30, 2014, the Fund had the following swap contracts:
CENTRALLY CLEARED INTEREST RATE SWAP CONTRACTS
| | | | | | | | | | | | | | | | | | |
| | | | | | Rates Exchanged | | Market Value | |
Notional
Amount
(000s)(a) | | | Termination
Date | | Payments
Received | | | Payments
Made | | Upfront
Payments
Made (Received) | | | Unrealized
Gain (Loss) | |
| $ | 63,800 | | | 12/17/19 | | | 3 month LIBOR | | | 2.250% | | $ | (651,284 | ) | | $ | 102,662 | |
| | 17,000 | | | 12/17/21 | | | 3 month LIBOR | | | 2.500 | | | (224,910 | ) | | | 130,628 | |
| | TOTAL | | | | | | | | | | | $ | (876,194 | ) | | $ | 233,290 | |
| | (a) | | Represents forward starting interest rate swaps whose effective dates of commencement of accruals and cash flows occur subsequent to September 30, 2014. |
| | |
| The accompanying notes are an integral part of these financial statements. | | 81 |
GOLDMAN SACHS HIGH YIELD FUND
Schedule of Investments (continued)
September 30, 2014 (Unaudited)
|
| ADDITIONAL INVESTMENT INFORMATION (continued) |
CENTRALLY CLEARED CREDIT DEFAULT SWAP CONTRACT
| | | | | | | | | | | | | | | | | | | | | | |
| | | | | | | | | | | | | | Market Value | |
| Referenced Obligation | | Notional
Amount
(000s) | | Rates Received
(Paid) | | | Termination
Date | | | Credit
Spread at
September 30,
2014(b) | | | Upfront
Payments
Made (Received) | | | Unrealized
Gain (Loss) | |
Protection Sold: | | | | | | | | | | | | | | | | | | | | | | |
CDX North America High Yield Index 22 | | $79,200 | | | 5.000 | % | | | 06/20/19 | | | | 3.546 | % | | $ | 4,435,469 | | | $ | 430,554 | |
| | (b) | | Credit spread on the Referenced Obligation, together with the term of the swap contract, are indicators of payment/performance risk. The likelihood of a credit event occurring which would require a fund to make a payment or otherwise be required to perform under the swap contract is generally greater as the credit spread and the term of the swap contract increase. |
| | |
| 82 | | The accompanying notes are an integral part of these financial statements. |
GOLDMAN SACHS HIGH YIELD FLOATING RATE FUND
Schedule of Investments
September 30, 2014 (Unaudited)
| | | | | | | | | | | | | | |
Principal
Amount | | | Interest
Rate | | | Maturity
Date | | | Value | |
| | Senior Term Loans(a) – 82.3% | |
| | Aerospace – 1.5% | |
| LM U.S. Corp. Acquisition, Inc. (B-/B2) | |
| $ | 875,412 | | | | 4.750 | % | | | 10/25/19 | | | $ | 868,847 | |
| LM U.S. Corp. Acquisition, Inc. (CCC/Caa2) | |
| | 6,472,375 | | | | 8.500 | | | | 10/15/20 | | | | 6,461,566 | |
| Silver II US Holdings LLC (B+/B1) | |
| | 24,061,934 | | | | 4.000 | | | | 12/13/19 | | | | 23,618,232 | |
| Transdigm, Inc. (B/Ba3) | |
| | 2,309,250 | | | | 3.500 | | | | 02/14/17 | | | | 2,304,054 | |
| | 25,638,755 | | | | 3.750 | | | | 02/28/20 | | | | 25,177,258 | |
| | 11,172,000 | | | | 3.750 | | | | 06/04/21 | | | | 10,962,525 | |
| | | | | | | | | | | | | | |
| | | | | | | | | | | | | 69,392,482 | |
| | |
| | Airlines – 3.0% | |
| Air Canada (BB-/Ba3) | |
| | 4,812,745 | | | | 5.500 | | | | 09/20/19 | | | | 4,854,857 | |
| Atlantic Aviation FBO, Inc. (BB-/Ba3) | |
| | 14,124,639 | | | | 3.250 | | | | 06/01/20 | | | | 13,919,832 | |
| Continental Airlines, Inc. (BB-/Ba2) | |
| | 30,838,967 | | | | 3.500 | | | | 04/01/19 | | | | 30,251,176 | |
| Delta Air Lines, Inc. (BB+/Ba1) | |
| | 24,278,102 | | | | 3.250 | | | | 04/20/17 | | | | 23,962,487 | |
| Delta Air Lines, Inc. (BB/Ba1) | |
| | 65,766,852 | | | | 3.250 | | | | 10/18/18 | | | | 64,106,239 | |
| Flying Fortress, Inc. (BBB-/Ba1) | |
| | 5,041,667 | | | | 3.500 | | | | 06/30/17 | | | | 4,988,124 | |
| | | | | | | | | | | | | | |
| | | | | | | | | | | | | 142,082,715 | |
| | |
| | Automotive – 0.6% | |
| Chrysler Group LLC (BB+/Ba1) | |
| | 28,810,975 | | | | 3.500 | | | | 05/24/17 | | | | 28,558,879 | |
| | |
| | Automotive – Distributors – 0.2% | |
| American Tire Distributors, Inc (CCC+/B2) | |
| | 5,971,069 | | | | 5.750 | | | | 06/01/18 | | | | 5,959,903 | |
| Goodyear Tire & Rubber Co. (BB/Ba1) | |
| | 2,619,083 | | | | 4.750 | | | | 04/30/19 | | | | 2,611,723 | |
| | | | | | | | | | | | | | |
| | | | | | | | | | | | | 8,571,626 | |
| | |
| | Automotive – Parts – 0.9% | |
| Cooper Standard Holdings, Inc. (BB-/B1) | |
| | 11,172,000 | | | | 4.000 | | | | 04/04/21 | | | | 11,025,423 | |
| Gates Global LLC (B+/B2) | |
| | 19,500,000 | | | | 4.250 | | | | 07/05/21 | | | | 19,130,280 | |
| Jason, Inc. (B/B1) | |
| | 9,000,000 | | | | 5.500 | | | | 05/21/21 | | | | 8,988,750 | |
| Remy International, Inc. (BB-/B1) | |
| | 5,599,233 | | | | 4.250 | | | | 03/05/20 | | | | 5,543,241 | |
| | | | | | | | | | | | | | |
| | | | | | | | | | | | | 44,687,694 | |
| | |
| | Building Materials – 3.2% | |
| American Builders & Contractors Supply Co., Inc. (BB+/B1) | |
| | 51,220,401 | | | | 3.500 | | | | 04/16/20 | | | | 50,180,114 | |
| Armstrong World Industries, Inc. (BB/B1) | |
| | 5,964,811 | | | | 3.500 | | | | 03/15/20 | | | | 5,927,531 | |
| CPG International, Inc. (B/B2) | |
| | 12,141,647 | | | | 4.750 | | | | 09/30/20 | | | | 12,070,861 | |
| Gyp Holdings III Corp. (CCC+/Caa2) | |
| | 21,546,000 | | | | 4.750 | | | | 04/01/21 | | | | 21,222,810 | |
| | |
| | Senior Term Loans(a) – (continued) | |
| | Building Materials – (continued) | |
| Jeld-Wen, Inc. (B/NR) | |
| $ | 25,525,000 | | | | 0.000 | % | | | 09/18/21 | | | $ | 25,317,737 | |
| PLY Gem Industries, Inc. (B+/B1) | |
| | 8,706,250 | | | | 4.000 | | | | 02/01/21 | | | | 8,523,941 | |
| Quikrete Cos., Inc. (B+/B1) | |
| | 17,745,971 | | | | 4.000 | | | | 09/28/20 | | | | 17,524,146 | |
| Roofing Supply Group LLC (B/B3) | |
| | 7,131,408 | | | | 5.000 | | | | 05/31/19 | | | | 7,036,347 | |
| Ultima US Holdings LLC (B/B2) | |
| | 5,558,000 | | | | 5.500 | | | | 07/02/20 | | | | 5,516,315 | |
| | | | | | | | | | | | | | |
| | | | | | | | | | | | | 153,319,802 | |
| | |
| | Capital Goods – Others – 0.9% | |
| Alliance Laundry Systems LLC (B/B2) | |
| | 16,966,496 | | | | 4.250 | | | | 12/10/18 | | | | 16,761,541 | |
| Alliance Laundry Systems LLC (CCC+/Caa2) | |
| | 7,410,137 | | | | 9.500 | | | | 12/10/19 | | | | 7,465,712 | |
| USIC Holdings, Inc. (B/B2) | |
| | 17,676,498 | | | | 4.000 | | | | 07/10/20 | | | | 17,278,777 | |
| | | | | | | | | | | | | | |
| | | | | | | | | | | | | 41,506,030 | |
| | |
| | Chemicals – 2.7% | |
| American Pacific Corp. (NR/NR) | |
| | 9,540,707 | | | | 7.000 | | | | 02/27/19 | | | | 9,564,559 | |
| Eagle Spinco, Inc. (BBB-/Ba1) | |
| | 4,877,938 | | | | 3.500 | | | | 01/27/17 | | | | 4,853,548 | |
| Emerald Performance Materials LLC (B/B1) | |
| | 7,525,000 | | | | 4.500 | | | | 08/01/21 | | | | 7,447,869 | |
| Emerald Performance Materials LLC (CCC+/Caa1) | |
| | 6,350,000 | | | | 7.750 | | | | 08/01/22 | | | | 6,299,708 | |
| Houghton International, Inc. (B+/B1) | |
| | 4,421,250 | | | | 4.000 | | | | 12/20/19 | | | | 4,365,984 | |
| Huntsman International LLC (BB+/Ba2) | |
| | 3,500,000 | | | | 3.750 | | | | 08/12/21 | | | | 3,460,625 | |
| PQ Corp. (B+/B2) | |
| | 9,574,972 | | | | 4.000 | | | | 08/07/17 | | | | 9,455,285 | |
| Taminco Global Chemical Corp. (BB-/B1) | |
| | 5,932,432 | | | | 3.250 | | | | 02/15/19 | | | | 5,887,939 | |
| Univar, Inc. (B+/B3) | |
| | 30,658,215 | | | | 5.000 | | | | 06/30/17 | | | | 30,300,433 | |
| US Coatings Acquisition, Inc. (B+/B1) | |
| | 45,450,797 | | | | 3.750 | | | | 02/01/20 | | | | 44,494,512 | |
| | | | | | | | | | | | | | |
| | | | | | | | | | | | | 126,130,462 | |
| | |
| | Consumer Products – Household & Leisure – 2.2% | |
| Bombardier Recreational Products, Inc. (BB-/B1) | |
| | 32,740,492 | | | | 4.000 | | | | 01/30/19 | | | | 32,058,508 | |
| Polymer Group, Inc. (B-/B2) | |
| | 21,852,136 | | | | 5.250 | | | | 12/19/19 | | | | 21,742,876 | |
| Prestige Brands, Inc. (BB/B1) | |
| | 7,275,000 | | | | 4.500 | | | | 09/03/21 | | | | 7,256,812 | |
| Renfro Corp. (B/B2) | |
| | 16,816,392 | | | | 5.750 | | | | 01/30/19 | | | | 16,564,146 | |
| The Sun Products Corp. (B-/B1) | |
| | 26,671,846 | | | | 5.500 | | | | 03/23/20 | | | | 24,988,319 | |
| | | | | | | | | | | | | | |
| | | | | | | | | | | | | 102,610,661 | |
| | |
| | |
| The accompanying notes are an integral part of these financial statements. | | 83 |
GOLDMAN SACHS HIGH YIELD FLOATING RATE FUND
Schedule of Investments (continued)
September 30, 2014 (Unaudited)
| | | | | | | | | | | | | | |
Principal
Amount | | | Interest
Rate | | | Maturity
Date | | | Value | |
| | Senior Term Loans(a) – (continued) | |
| | Consumer Products – Industrial – 2.0% | |
| Atkore International, Inc. (B/B3) | |
| $ | 18,827,763 | | | | 4.500 | % | | | 04/09/21 | | | $ | 18,639,485 | |
| Atkore International, Inc. (CCC+/Caa2) | |
| | 11,250,000 | | | | 7.750 | | | | 10/09/21 | | | | 11,137,500 | |
| CPM Acquisition Corp. (B+/B1) | |
| | 4,054,809 | | | | 6.250 | | | | 08/29/17 | | | | 4,044,672 | |
| CPM Acquisition Corp. (B/Caa1) | |
| | 1,150,000 | | | | 10.250 | | | | 03/01/18 | | | | 1,161,500 | |
| HD Supply, Inc. (B+/B1) | |
| | 45,021,437 | | | | 4.000 | | | | 06/28/18 | | | | 44,481,180 | |
| Minimax GmbH & Co. (NR/NR) | |
| | 5,184,863 | | | | 4.250 | | | | 08/14/20 | | | | 5,171,901 | |
| Southwire Co. (BB+/Ba3) | |
| | 12,524,531 | | | | 3.254 | | | | 02/10/21 | | | | 12,333,532 | |
| | | | | | | | | | | | | | |
| | | | | | | | | | | | | 96,969,770 | |
| | |
| | Diversified Manufacturing – 2.4% | |
| Crosby US Acquisition Corp. (B/B1) | |
| | 28,132,413 | | | | 3.750 | | | | 11/23/20 | | | | 26,866,454 | |
| Gardner Denver, Inc. (B/B1) | |
| | 7,256,675 | | | | 4.250 | | | | 07/30/20 | | | | 7,105,881 | |
| Mannington Mills, Inc. (BB-/B1) | |
| | 6,575,000 | | | | 4.500 | | | | 09/18/21 | | | | 6,533,906 | |
| Milacron LLC (B/B1) | |
| | 9,950,000 | | | | 4.000 | | | | 03/30/20 | | | | 9,751,000 | |
| Mirror Bidco Corp. (B/B1) | |
| | 17,928,554 | | | | 4.250 | | | | 12/28/19 | | | | 17,648,510 | |
| Penn Engineering & Manufacturing Corp. (BB/B1) | |
| | 4,650,000 | | | | 4.500 | | | | 08/29/21 | | | | 4,626,750 | |
| Rexnord LLC (BB-/B2) | |
| | 41,621,004 | | | | 4.000 | | | | 08/21/20 | | | | 40,900,128 | |
| | | | | | | | | | | | | | |
| | | | | | | | | | | | | 113,432,629 | |
| | |
| | Energy – 2.0% | |
| American Energy – Marcellus LLC (B-/Ba3) | |
| | 13,550,000 | | | | 5.250 | | | | 08/04/20 | | | | 13,418,700 | |
| American Energy – Marcellus LLC (CCC/Caa1) | |
| | 25,155,000 | | | | 8.500 | | | | 08/04/21 | | | | 24,903,450 | |
| Jonah Energy LLC (B/B3) | |
| | 11,250,000 | | | | 7.500 | | | | 05/12/21 | | | | 11,109,375 | |
| MEG Energy Corp. (BBB-/Ba1) | |
| | 45,767,626 | | | | 3.750 | | | | 03/31/20 | | | | 45,456,864 | |
| | | | | | | | | | | | | | |
| | | | | | | | | | | | | 94,888,389 | |
| | |
| | Energy – Exploration & Production – 0.1% | |
| Seventy Seven Operating LLC (B+/B1) | |
| | 3,665,813 | | | | 3.750 | | | | 06/25/21 | | | | 3,626,882 | |
| | |
| | Entertainment – 0.6% | |
| Sabre, Inc. (B+/Ba3) | |
| | 488,222 | | | | 3.500 | | | | 02/19/18 | | | | 485,781 | |
| | 25,789,402 | | | | 4.000 | | | | 02/19/19 | | | | 25,426,504 | |
| WMG Acquisition Corp. (B+/B1) | |
| | 3,111,429 | | | | 3.750 | | | | 07/01/20 | | | | 2,999,137 | |
| | | | | | | | | | | | | | |
| | | | | | | | | | | | | 28,911,422 | |
| | |
| | Senior Term Loans(a) – (continued) | |
| | Environmental – 0.4% | |
| EnergySolutions LLC (BB-/B3) | |
| $ | 19,950,000 | | | | 6.750 | % | | | 05/29/20 | | | $ | 20,199,375 | |
| | |
| | Finance – 1.6% | |
| CeramTec Acquisition Corp. (B/Ba3) | |
| | 2,574,263 | | | | 4.250 | | | | 08/28/20 | | | | 2,546,924 | |
| | 6,432,649 | | | | 4.250 | | | | 08/31/20 | | | | 6,364,334 | |
| Guggenheim Partners LLC (NR/NR) | |
| | 13,627,425 | | | | 4.250 | | | | 07/22/20 | | | | 13,496,874 | |
| Houghton Mifflin Harcourt, Inc. (NR/B1) | |
| | 30,724,105 | | | | 4.250 | | | | 05/22/18 | | | | 30,647,295 | |
| ROC Finance LLC (BB-/B2) | |
| | 1,980,000 | | | | 5.000 | | | | 06/20/19 | | | | 1,889,257 | |
| SBA Senior Finance II LLC (BB/Ba3) | |
| | 21,446,250 | | | | 3.250 | | | | 03/24/21 | | | | 20,966,712 | |
| | | | | | | | | | | | | | |
| | | | | | | | | | | | | 75,911,396 | |
| | |
| | Food & Beverages – 6.9% | |
| Albertson’s Holdings LLC (BB-/Ba3) | |
| | 18,150,000 | | | | 4.000 | | | | 08/25/19 | | | | 18,006,252 | |
| Arysta Lifescience Corp. (B/B1) | |
| | 6,283,519 | | | | 4.500 | | | | 05/29/20 | | | | 6,220,684 | |
| Arysta Lifescience Corp. (CCC+/Caa1) | |
| | 7,975,000 | | | | 8.250 | | | | 11/30/20 | | | | 8,008,256 | |
| Atrium Innovations, Inc. (B/B2) | |
| | 13,706,270 | | | | 4.250 | | | | 02/15/21 | | | | 13,432,145 | |
| Atrium Innovations, Inc. (CCC+/Caa2) | |
| | 9,575,000 | | | | 7.750 | | | | 08/13/21 | | | | 9,335,625 | |
| Big Heart Pet Brands (B+/B1) | |
| | 9,211,938 | | | | 3.500 | | | | 03/08/20 | | | | 8,831,945 | |
| Blue Buffalo Co. Ltd. (BB/B1) | |
| | 21,435,505 | | | | 3.750 | | | | 08/08/19 | | | | 21,221,150 | |
| Diamond Foods, Inc. (B-/B2) | |
| | 16,466,802 | | | | 4.250 | | | | 08/20/18 | | | | 16,271,341 | |
| Dole Food Co., Inc. (B-/B2) | |
| | 7,637,500 | | | | 4.500 | | | | 11/01/18 | | | | 7,551,578 | |
| High Liner Foods, Inc. (B+/B2) | |
| | 9,626,625 | | | | 4.250 | | | | 04/24/21 | | | | 9,566,459 | |
| HJ Heinz Co. (BB/Ba2) | |
| | 77,130,389 | | | | 3.500 | | | | 06/05/20 | | | | 76,089,129 | |
| Performance Food Group, Inc. (CCC+/B3) | |
| | 43,102,450 | | | | 6.250 | | | | 11/14/19 | | | | 42,940,816 | |
| Pinnacle Foods Finance LLC (BB/Ba3) | |
| | 23,746,296 | | | | 3.250 | | | | 04/29/20 | | | | 23,229,746 | |
| Shearer’s Foods, Inc. (B/B1) | |
| | 7,725,000 | | | | 4.500 | | | | 06/30/21 | | | | 7,652,617 | |
| | 12,800,000 | | | | 7.750 | | | | 06/30/22 | | | | 12,656,000 | |
| US Foods, Inc. (B-/B2) | |
| | 49,447,303 | | | | 4.500 | | | | 03/31/19 | | | | 49,153,586 | |
| | | | | | | | | | | | | | |
| | | | | | | | | | | | | 330,167,329 | |
| | |
| | Food & Drug Retailers – 0.6% | |
| Rite Aid Corp. (BB-/Ba3) | |
| | 14,811,713 | | | | 3.500 | | | | 02/21/20 | | | | 14,521,699 | |
| Rite Aid Corp. (B/B2) | |
| | 4,490,000 | | | | 5.750 | | | | 08/21/20 | | | | 4,540,513 | |
| | 9,570,000 | | | | 4.875 | | | | 06/21/21 | | | | 9,510,187 | |
| | | | | | | | | | | | | | |
| | | | | | | | | | | | | 28,572,399 | |
| | |
| | |
| 84 | | The accompanying notes are an integral part of these financial statements. |
GOLDMAN SACHS HIGH YIELD FLOATING RATE FUND
| | | | | | | | | | | | | | |
Principal
Amount | | | Interest
Rate | | | Maturity
Date | | | Value | |
| | Senior Term Loans(a) – (continued) | |
| | Gaming – 1.9% | |
| Aristocrat Leisure Ltd. (BB/Ba2) | |
| $ | 20,400,000 | | | | 4.750 | % | | | 09/29/21 | | | $ | 20,170,500 | |
| Boyd Gaming Corp. (BB-/Ba3) | |
| | 4,850,420 | | | | 4.000 | | | | 08/14/20 | | | | 4,771,601 | |
| CCM Merger, Inc. (B+/B2) | |
| | 5,387,755 | | | | 4.500 | | | | 08/08/21 | | | | 5,330,537 | |
| CityCenter Holdings LLC (NR/WR) | |
| | 20,289,724 | | | | 4.250 | | | | 10/16/20 | | | | 20,061,465 | |
| Marina District Finance Co., Inc. (B+/B2) | |
| | 19,061,472 | | | | 6.750 | | | | 08/15/18 | | | | 19,023,350 | |
| MGM Resorts International (BB/Ba2) | |
| | 10,333,530 | | | | 3.500 | | | | 12/20/19 | | | | 10,139,776 | |
| Scientific Games International, Inc. (BB-/Ba3) | |
| | 8,675,000 | | | | 6.000 | | | | 09/17/21 | | | | 8,498,377 | |
| | | | | | | | | | | | | | |
| | | | | | | | | | | | | 87,995,606 | |
| | |
| | Health Care – 1.7% | |
| Community Health Systems, Inc. (BB/Ba2) | |
| | 5,064,712 | | | | 3.485 | | | | 01/25/17 | | | | 5,034,223 | |
| | 25,553,803 | | | | 4.250 | | | | 01/27/21 | | | | 25,460,276 | |
| HCA, Inc. (BB/Ba3) | |
| | 33,114,253 | | | | 2.904 | | | | 03/31/17 | | | | 32,870,532 | |
| | 14,136,781 | | | | 2.983 | | | | 05/01/18 | | | | 13,958,092 | |
| MedAssets, Inc. (BB+/Ba3) | |
| | 73,819 | | | | 4.000 | | | | 12/13/19 | | | | 73,266 | |
| VWR Funding, Inc. (B+/B1) | |
| | 4,911,923 | | | | 3.404 | | | | 04/03/17 | | | | 4,824,442 | |
| | | | | | | | | | | | | | |
| | | | | | | | | | | | | 82,220,831 | |
| | |
| | Health Care – Medical Products – 0.3% | |
| Convatec, Inc. (B+/Ba3) | |
| | 2,794,150 | | | | 4.000 | | | | 12/22/16 | | | | 2,770,875 | |
| Hologic, Inc. (BBB-/Ba2) | |
| | 10,946,307 | | | | 3.250 | | | | 08/01/19 | | | | 10,828,306 | |
| | | | | | | | | | | | | | |
| | | | | | | | | | | | | 13,599,181 | |
| | |
| | Health Care – Pharmaceuticals – 2.2% | |
| Catalent Pharma Solutions, Inc. (BB/Ba3) | |
| | 3,299,307 | | | | 4.500 | | | | 05/20/21 | | | | 3,277,993 | |
| Grifols Worldwide Operations (BB/Ba1) | |
| | 7,960,000 | | | | 3.154 | | | | 02/27/21 | | | | 7,805,815 | |
| Mallinckrodt International Finance SA (BB+/Ba2) | |
| | 19,688,625 | | | | 3.500 | | | | 03/19/21 | | | | 19,376,680 | |
| PharMedium Healthcare Corp. (B/B1) | |
| | 4,433,573 | | | | 4.250 | | | | 01/28/21 | | | | 4,333,818 | |
| PharMedium Healthcare Corp. (CCC+/Caa2) | |
| | 2,000,000 | | | | 7.750 | | | | 01/28/22 | | | | 1,975,000 | |
| Salix Pharmaceuticals Ltd. (BB/Ba1) | |
| | 37,022,618 | | | | 4.250 | | | | 01/02/20 | | | | 36,883,783 | |
| Valeant Pharmaceuticals International, Inc. (BB/Ba1) | |
| | 4,561,323 | | | | 3.750 | | | | 02/13/19 | | | | 4,505,584 | |
| | 25,800,954 | | | | 3.750 | | | | 08/05/20 | | | | 25,465,542 | |
| | | | | | | | | | | | | | |
| | | | | | | | | | | | | 103,624,215 | |
| | |
| | Health Care – Services – 3.5% | |
| American Renal Holdings, Inc. (B/Ba3) | |
| | 14,773,697 | | | | 4.500 | | | | 09/20/19 | | | | 14,515,157 | |
| | |
| | Senior Term Loans(a) – (continued) | |
| | Health Care – Services – (continued) | |
| American Renal Holdings, Inc. (CCC+/Caa1) | |
| 22,390,000 | | | | 8.500 | | | | 03/20/20 | | | | 22,166,100 | |
| Amsurg Corp. (BB-/Ba2) | |
| | 7,331,625 | | | | 3.750 | | | | 07/16/21 | | | | 7,246,871 | |
| Envision Healthcare Corp. (BB-/Ba3) | |
| | 14,200,679 | | | | 4.000 | | | | 05/25/18 | | | | 14,048,022 | |
| MPH Acquisition Holdings LLC (B/B1) | |
| | 63,932,344 | | | | 4.000 | | | | 03/31/21 | | | | 62,374,313 | |
| QOL Meds LLC (B/B2) | |
| | 2,175,000 | | | | 5.500 | | | | 07/15/20 | | | | 2,158,688 | |
| Radnet Management, Inc. (B+/Ba3) | |
| | 5,768,043 | | | | 4.250 | | | | 10/10/18 | | | | 5,721,207 | |
| Sedgwick Claims Management Services, Inc. (CCC+/Caa2) | |
| | 10,400,758 | | | | 6.750 | | | | 02/28/22 | | | | 10,147,291 | |
| Sedgwick Claims Management Services, Inc. (B/NR) | |
| | 7,300,000 | | | | 6.750 | | | | 02/28/22 | | | | 7,122,099 | |
| Surgery Center Holdings, Inc. (B/B1) | |
| | 3,625,000 | | | | 5.250 | | | | 07/09/20 | | | | 3,611,406 | |
| U.S. Renal Care, Inc. (B/Ba3) | |
| | 7,214,274 | | | | 4.250 | | | | 07/03/19 | | | | 7,128,640 | |
| U.S. Renal Care, Inc. (CCC+/Caa1) | |
| | 7,975,000 | | | | 10.250 | | | | 01/03/20 | | | | 8,054,750 | |
| | 4,000,000 | | | | 8.500 | | | | 07/03/20 | | | | 4,040,000 | |
| | | | | | | | | | | | | | |
| | | | | | | | | | | | | 168,334,544 | |
| | |
| | Lodging – 2.5% | |
| Four Seasons Holdings, Inc. (BB-/B1) | |
| | 11,924,513 | | | | 3.500 | | | | 06/27/20 | | | | 11,700,928 | |
| Four Seasons Holdings, Inc. (B-/Caa1) | |
| | 10,392,000 | | | | 6.250 | | | | 12/28/20 | | | | 10,392,000 | |
| Hilton Worldwide Finance LLC (BB+/Ba3) | |
| | 50,623,272 | | | | 3.500 | | | | 10/26/20 | | | | 49,779,382 | |
| La Quinta Intermediate Holding LLC (BB-/B1) | |
| | 44,494,643 | | | | 4.000 | | | | 04/14/21 | | | | 43,957,148 | |
| Peninsula Gaming LLC (B+/B1) | |
| | 4,980,068 | | | | 4.250 | | | | 11/20/17 | | | | 4,925,586 | |
| | | | | | | | | | | | | | |
| | | | | | | | | | | | | 120,755,044 | |
| | |
| | Media – Broadcasting & Radio – 4.3% | |
| Getty Images, Inc. (B/B2) | |
| | 42,495,059 | | | | 4.750 | | | | 10/18/19 | | | | 38,900,827 | |
| Gray Television, Inc. (BB/Ba3) | |
| | 2,992,500 | | | | 3.750 | | | | 06/10/21 | | | | 2,943,872 | |
| Hubbard Radio LLC (B+/B1) | |
| | 28,265,382 | | | | 4.500 | | | | 04/29/19 | | | | 28,018,060 | |
| iHeart Communications, Inc. (CCC+/Caa1) | |
| | 45,112,026 | | | | 3.804 | | | | 01/29/16 | | | | 37,885,804 | |
| | 2,263,014 | | | | 6.904 | | | | 01/30/19 | | | | 2,159,572 | |
| | 20,847,038 | | | | 7.654 | | | | 07/30/19 | | | | 20,385,484 | |
| Salem Communications Corp. (B/B2) | |
| | 14,244,775 | | | | 4.500 | | | | 03/13/20 | | | | 14,108,310 | |
| Telesat Canada (BB/Ba3) | |
| | 5,234,401 | | | | 3.500 | | | | 03/28/19 | | | | 5,138,454 | |
| The E.W. Scripps Co. (BB+/Ba2) | |
| | 8,298,737 | | | | 3.250 | | | | 11/26/20 | | | | 8,236,496 | |
| | |
| | |
| The accompanying notes are an integral part of these financial statements. | | 85 |
GOLDMAN SACHS HIGH YIELD FLOATING RATE FUND
Schedule of Investments (continued)
September 30, 2014 (Unaudited)
| | | | | | | | | | | | | | |
Principal
Amount | | | Interest
Rate | | | Maturity
Date | | | Value | |
| | Senior Term Loans(a) – (continued) | |
| | Media – Broadcasting & Radio – (continued) | |
| Univision Communications, Inc. (B+/B2) | |
| $ | 35,441,173 | | | | 4.000 | % | | | 03/01/20 | | | $ | 34,754,677 | |
| | 11,942,568 | | | | 4.000 | | | | 03/02/20 | | | | 11,703,717 | |
| | | | | | | | | | | | | | |
| | | | | | | | | | | | | 204,235,273 | |
| | |
| | Media – Cable – 3.2% | |
| Altice Financing SA (BB-/B1) | |
| | 4,152,848 | | | | 5.500 | | | | 07/02/19 | | | | 4,183,994 | |
| Charter Communications Operating LLC (BB+/Ba1) | |
| | 31,290,654 | | | | 3.000 | | | | 07/01/20 | | | | 30,340,670 | |
| | 12,194,110 | | | | 3.000 | | | | 01/03/21 | | | | 11,818,165 | |
| | 4,000,000 | | | | 4.250 | | | | 09/12/21 | | | | 3,985,440 | |
| CSC Holdings LLC (BB+/Baa3) | |
| | 11,993,882 | | | | 2.654 | | | | 04/17/20 | | | | 11,630,347 | |
| Harron Communications LLP (BB/Ba3) | |
| | 4,778,458 | | | | 3.500 | | | | 06/19/20 | | | | 4,739,657 | |
| Midcontinent Communications (BB-/Ba3) | |
| | 10,786,328 | | | | 3.500 | | | | 07/30/20 | | | | 10,722,257 | |
| Virgin Media Investment Holdings Ltd. (BB-/Ba3) | |
| | 44,150,000 | | | | 3.500 | | | | 06/07/20 | | | | 42,946,030 | |
| Wave Division Holdings LLC (BB-/Ba3) | |
| | 6,877,500 | | | | 4.000 | | | | 10/15/19 | | | | 6,757,144 | |
| Ziggo N.V. (BB-/Ba3) | |
| | 391,915 | | | | 2.750 | | | | 01/15/22 | | | | 380,208 | |
| | 7,196,596 | | | | 3.210 | | | | 01/15/22 | | | | 6,981,634 | |
| | 10,608,426 | | | | 3.250 | | | | 01/15/22 | | | | 10,291,552 | |
| EUR | 4,610,000 | | | | 3.500 | | | | 01/15/22 | | | | 5,733,692 | |
| | | | | | | | | | | | | | |
| | | | | | | | | | | | | 150,510,790 | |
| | |
| | Media – Non Cable – 3.2% | |
| Advantage Sales & Marketing, Inc. (B/B1) | |
| $ | 20,029,399 | | | | 4.250 | | | | 07/23/21 | | | | 19,664,665 | |
| Advantage Sales & Marketing, Inc. (CCC+/Caa1) | |
| | 4,791,893 | | | | 7.500 | | | | 07/25/22 | | | | 4,714,887 | |
| Affinion Group, Inc. (B/WR) | |
| | 2,432,014 | | | | 6.750 | | | | 04/30/18 | | | | 2,356,014 | |
| Affinion Group, Inc. (CCC/B3) | |
| | 6,086,500 | | | | 8.500 | | | | 10/12/18 | | | | 5,852,535 | |
| Cengage Learning Acquisitions, Inc. (B+/B2) | |
| | 1,641,750 | | | | 7.000 | | | | 03/31/20 | | | | 1,638,237 | |
| Checkout Holding Corp. (B+/B1) | |
| | 19,650,750 | | | | 4.500 | | | | 04/09/21 | | | | 19,095,616 | |
| Checkout Holding Corp. (CCC+/Caa1) | |
| | 15,750,000 | | | | 7.750 | | | | 04/11/22 | | | | 15,021,562 | |
| McGraw-Hill Global Education Holdings LLC (B+/B1) | |
| | 6,321,903 | | | | 5.750 | | | | 03/22/19 | | | | 6,326,645 | |
| Media General, Inc. (BB-/B1) | |
| | 11,480,861 | | | | 4.250 | | | | 07/31/20 | | | | 11,351,702 | |
| NEP Supershooters LP (B-/Caa1) | |
| | 4,271,429 | | | | 9.500 | | | | 07/22/20 | | | | 4,250,071 | |
| NEP/NCP Holdco, Inc. (B/B2) | |
| | 34,665,039 | | | | 4.250 | | | | 01/22/20 | | | | 33,740,523 | |
| Renaissance Learning, Inc. (B-/B1) | |
| | 7,569,114 | | | | 4.500 | | | | 04/09/21 | | | | 7,403,578 | |
| Renaissance Learning, Inc. (CCC/Caa2) | |
| | 9,612,400 | | | | 8.000 | | | | 04/11/22 | | | | 9,384,105 | |
| | |
| | Senior Term Loans(a) – (continued) | |
| | Media – Non Cable – (continued) | |
| SuperMedia, Inc. (CCC+/Caa1) | |
| 2,191,444 | | | | 11.600 | | | | 12/30/16 | | | | 1,781,644 | |
| TWCC Holding Corp. (B+/Ba3) | |
| | 8,317,997 | | | | 3.500 | | | | 02/13/17 | | | | 8,167,274 | |
| | | | | | | | | | | | | | |
| | | | | | | | | | | | | 150,749,058 | |
| | |
| | Metals & Mining – 0.9% | |
| Delachaux SA (NR/NR) | |
| | 3,650,000 | | | | 5.500 | | | | 09/25/21 | | | | 3,652,300 | |
| FMG Resources (August 2006) Pty Ltd. (BBB/Baa3) | |
| | 13,320,841 | | | | 3.750 | | | | 06/30/19 | | | | 13,027,382 | |
| Hi Crush Partners LP (B+/B2) | |
| | 7,931,507 | | | | 4.750 | | | | 04/28/21 | | | | 7,872,020 | |
| Novelis, Inc. (BB-/Ba2) | |
| | 17,157,258 | | | | 3.750 | | | | 03/10/17 | | | | 16,937,474 | |
| | | | | | | | | | | | | | |
| | | | | | | | | | | | | 41,489,176 | |
| | |
| | Packaging – 2.9% | |
| Ardagh Holdings USA, Inc. (B+/Ba3) | |
| | 3,482,500 | | | | 4.000 | | | | 12/17/19 | | | | 3,430,263 | |
| Berlin Packaging LLC (NR/NR) | |
| | 6,675,000 | | | | 4.500 | | | | 09/24/21 | | | | 6,658,312 | |
| Berry Plastics Holding Corp. (BB-/B1) | |
| | 43,213,376 | | | | 3.500 | | | | 02/08/20 | | | | 42,049,208 | |
| Berry Plastics Holding Group, Inc. (BB-/B1) | |
| | 12,504,805 | | | | 3.750 | | | | 01/06/21 | | | | 12,209,441 | |
| BWAY Holding Co., Inc. (B-/B2) | |
| | 28,852,688 | | | | 5.500 | | | | 08/14/20 | | | | 28,798,733 | |
| Consolidated Container Co. LLC (B/B2) | |
| | 5,857,370 | | | | 5.000 | | | | 07/03/19 | | | | 5,747,544 | |
| Kloeckner Acquisition Corp. (B+/Ba3) | |
| | 5,656,606 | | | | 4.750 | | | | 12/21/16 | | | | 5,649,536 | |
| Reynolds Group Holdings, Inc. (B+/B1) | |
| | 32,368,667 | | | | 4.000 | | | | 12/01/18 | | | | 31,996,427 | |
| | | | | | | | | | | | | | |
| | | | | | | | | | | | | 136,539,464 | |
| | |
| | Property/Casualty Insurance – 0.3% | |
| Onex York Acquisition Corp. (B/B1) | |
| | 12,750,000 | | | | 4.750 | | | | 10/01/21 | | | | 12,678,345 | |
| | |
| | Real Estate – 0.8% | |
| ABRA, Inc. (NR/NR) | |
| | 5,475,000 | | | | 4.750 | | | | 09/17/21 | | | | 5,451,074 | |
| Realogy Corp. (BB/WR) | |
| | 20,983,545 | | | | 3.750 | | | | 03/05/20 | | | | 20,590,104 | |
| Starwood Property Trust, Inc. (BB+/Ba3) | |
| | 12,503,065 | | | | 3.500 | | | | 04/17/20 | | | | 12,296,015 | |
| | | | | | | | | | | | | | |
| | | | | | | | | | | | | 38,337,193 | |
| | |
| | Restaurants – 1.8% | |
| Burger King Corp. (B+/B2) | |
| | 12,325,000 | | | | 0.000 | | | | 09/04/15 | | | | 12,325,000 | |
| Burger King Corp. (BB/Ba3) | |
| | 5,585,751 | | | | 3.750 | | | | 09/28/19 | | | | 5,540,953 | |
| Dunkin’ Brands, Inc. (B+/B2) | |
| | 3,425,000 | | | | 3.250 | | | | 02/07/21 | | | | 3,329,203 | |
| New Red Finance, Inc. (NR/NR) | |
| | 54,050,000 | | | | 4.500 | | | | 09/24/21 | | | | 53,629,491 | |
| | |
| | |
| 86 | | The accompanying notes are an integral part of these financial statements. |
GOLDMAN SACHS HIGH YIELD FLOATING RATE FUND
| | | | | | | | | | | | | | |
Principal
Amount | | | Interest
Rate | | | Maturity
Date | | | Value | |
| | Senior Term Loans(a) – (continued) | |
| | Restaurants – (continued) | |
| NPC International, Inc. (B/B1) | |
| $ | 7,934,655 | | | | 4.000 | % | | | 12/28/18 | | | $ | 7,656,942 | |
| Seminole Hard Rock Entertainment, Inc. (BB+/Ba1) | |
| | 4,937,500 | | | | 3.500 | | | | 05/14/20 | | | | 4,836,676 | |
| | | | | | | | | | | | | | |
| | | | | | | | | | | | | 87,318,265 | |
| | |
| | Retailers – 4.9% | |
| Academy Ltd. (B/B1) | |
| | 15,981,346 | | | | 4.500 | | | | 08/03/18 | | | | 15,801,556 | |
| Bass Pro Group LLC (BB-/B1) | |
| | 7,586,916 | | | | 3.750 | | | | 11/20/19 | | | | 7,486,389 | |
| BJ’s Wholesale Club, Inc. (B-/B3) | |
| | 15,214,925 | | | | 4.500 | | | | 09/26/19 | | | | 14,965,248 | |
| BJ’s Wholesale Club, Inc. (CCC/Caa2) | |
| | 17,825,000 | | | | 8.500 | | | | 03/26/20 | | | | 17,908,599 | |
| Burlington Coat Factory Warehouse Corp. (B/B1) | |
| | 13,000,000 | | | | 4.250 | | | | 07/17/21 | | | | 12,851,020 | |
| Container Store, Inc. (B/B2) | |
| | 11,322,625 | | | | 4.250 | | | | 04/06/19 | | | | 11,096,173 | |
| Dell, Inc. (BB+/Ba2) | |
| | 6,475,000 | | | | 3.750 | | | | 10/29/18 | | | | 6,394,062 | |
| | 4,606,563 | | | | 4.500 | | | | 04/29/20 | | | | 4,570,954 | |
| Doosan Infracore Co., Ltd. (BB-/Ba3) | |
| | 10,124,625 | | | | 4.500 | | | | 05/28/21 | | | | 10,111,969 | |
| Fairway Group Acquisition Co. (B-/B2) | |
| | 12,091,281 | | | | 5.000 | | | | 08/17/18 | | | | 11,773,885 | |
| Grocery Outlet, Inc. (NR/NR) | |
| | 3,934,551 | | | | 6.500 | | | | 12/10/18 | | | | 3,922,275 | |
| | 2,251,087 | | | | 11.500 | | | | 05/24/19 | | | | 2,273,598 | |
| Michaels Stores, Inc. (B+/Ba3) | |
| | 30,396,639 | | | | 3.750 | | | | 01/28/20 | | | | 29,782,323 | |
| Neiman Marcus Group Ltd., Inc. (B/B2) | |
| | 31,738,013 | | | | 4.250 | | | | 10/25/20 | | | | 31,151,811 | |
| Party City Holdings, Inc. (B/B2) | |
| | 7,872,882 | | | | 4.000 | | | | 07/27/19 | | | | 7,728,100 | |
| Payless, Inc. (B/B1) | |
| | 10,573,500 | | | | 5.000 | | | | 03/11/21 | | | | 10,150,560 | |
| Payless, Inc. (CCC+/B3) | |
| | 3,750,000 | | | | 8.500 | | | | 03/11/22 | | | | 3,525,000 | |
| Petco Animal Supplies, Inc. (B/Ba3) | |
| | 5,347,222 | | | | 4.000 | | | | 11/24/17 | | | | 5,290,863 | |
| The Hillman Group, Inc. (B/B1) | |
| | 2,643,375 | | | | 4.500 | | | | 06/30/21 | | | | 2,630,158 | |
| The Men’s Wearhouse, Inc. (B+/Ba2) | |
| | 3,750,000 | | | | 4.500 | | | | 06/18/21 | | | | 3,724,988 | |
| True Religion Apparel, Inc. (B-/B3) | |
| | 16,689,375 | | | | 5.875 | | | | 07/30/19 | | | | 15,312,502 | |
| True Religion Apparel, Inc. (CCC/Caa2) | |
| | 5,650,000 | | | | 11.000 | | | | 01/29/20 | | | | 5,311,000 | |
| | | | | | | | | | | | | | |
| | | | | | | | | | | | | 233,763,033 | |
| | |
| | Services Cyclical – Business Services – 4.1% | |
| ADS Waste Holdings, Inc. (B+/B2) | |
| | 52,647,507 | | | | 3.750 | | | | 10/09/19 | | | | 51,173,377 | |
| Crossmark Holdings, Inc. (B/B1) | |
| | 7,090,805 | | | | 4.500 | | | | 12/20/19 | | | | 6,948,989 | |
| | |
| | Senior Term Loans(a) – (continued) | |
| | Services Cyclical – Business Services – (continued) | |
| Crossmark Holdings, Inc. (CCC+/Caa1) | |
| 6,864,000 | | | | 8.750 | | | | 12/21/20 | | | | 6,778,200 | |
| Devix Midco SA (B/B1) | |
| | 3,715,688 | | | | 4.250 | | | | 05/02/21 | | | | 3,683,175 | |
| Devix Midco SA (CCC+/Caa1) | |
| | 3,000,000 | | | | 8.000 | | | | 05/02/22 | | | | 2,981,250 | |
| First Data Corp. (BB-/B1) | |
| | 750,000 | | | | 3.655 | | | | 03/24/17 | | | | 736,125 | |
| | 27,285,076 | | | | 3.655 | | | | 03/23/18 | | | | 26,730,916 | |
| | 10,000,000 | | | | 3.655 | | | | 09/24/18 | | | | 9,781,300 | |
| | 17,977,728 | | | | 4.155 | | | | 03/24/21 | | | | 17,708,063 | |
| Koosharem LLC (B-/B3) | |
| | 10,723,125 | | | | 7.500 | | | | 04/29/20 | | | | 10,669,509 | |
| Ship US Bidco, Inc. (BB/Ba3) | |
| | 4,013,791 | | | | 5.250 | | | | 11/29/19 | | | | 4,029,565 | |
| TCH 2 Holdings LLC (B-/B1) | |
| | 5,586,354 | | | | 5.500 | | | | 05/06/21 | | | | 5,530,491 | |
| Travelport Finance S.A.R.L. (B-/B2) | |
| | 12,625,000 | | | | 6.000 | | | | 09/02/21 | | | | 12,595,710 | |
| Vantiv, LLC (BB+/Ba3) | |
| | 38,104,500 | | | | 3.750 | | | | 06/13/21 | | | | 37,834,720 | |
| | | | | | | | | | | | | | |
| | | | | | | | | | | | | 197,181,390 | |
| | |
| | Services Cyclical – Consumer Services – 1.9% | |
| Bright Horizons Family Solution, Inc. (BB-/B1) | |
| | 53,469,283 | | | | 3.750 | | | | 01/30/20 | | | | 52,734,080 | |
| Spin Holdco, Inc. (B/B2) | |
| | 21,462,912 | | | | 4.250 | | | | 11/14/19 | | | | 21,047,176 | |
| Weight Watchers International, Inc. (B+/B1) | |
| | 985,000 | | | | 3.160 | | | | 04/02/16 | | | | 953,805 | |
| | 18,277,222 | | | | 4.000 | | | | 04/02/20 | | | | 13,890,689 | |
| | | | | | | | | | | | | | |
| | | | | | | | | | | | | 88,625,750 | |
| | |
| | Services Cyclical – Rental Equipment – 0.2% | |
| Maxim Crane Works LP (B/Caa2) | |
| | 8,250,000 | | | | 10.250 | | | | 11/26/18 | | | | 8,408,153 | |
| | |
| | Technology – 1.1% | |
| Ability Network, Inc. (CCC+/Caa2) | |
| | 12,718,125 | | | | 6.000 | | | | 05/14/21 | | | | 12,686,330 | |
| CDW LLC (BB/Ba3) | |
| | 37,811,758 | | | | 3.250 | | | | 04/29/20 | | | | 36,855,877 | |
| Peak Ten, Inc. (B/B2) | |
| | 3,740,625 | | | | 5.000 | | | | 06/17/21 | | | | 3,717,246 | |
| | | | | | | | | | | | | | |
| | | | | | | | | | | | | 53,259,453 | |
| | |
| | Technology – Software/Services – 3.2% | |
| Applied Systems, Inc. (B+/B1) | |
| | 2,779,000 | | | | 4.250 | | | | 01/25/21 | | | | 2,744,262 | |
| Applied Systems, Inc. (CCC+/Caa2) | |
| | 2,865,000 | | | | 7.500 | | | | 01/23/22 | | | | 2,852,824 | |
| Aspect Software, Inc. (B/B1) | |
| | 4,991,351 | | | | 7.250 | | | | 05/06/16 | | | | 4,977,326 | |
| Avago Technologies Cayman Ltd. (BBB-/Ba1) | |
| | 30,872,625 | | | | 3.750 | | | | 05/06/21 | | | | 30,567,912 | |
| Blackboard, Inc. (B+/B1) | |
| | 7,395,328 | | | | 4.750 | | | | 10/04/18 | | | | 7,332,912 | |
| | |
| | |
| The accompanying notes are an integral part of these financial statements. | | 87 |
GOLDMAN SACHS HIGH YIELD FLOATING RATE FUND
Schedule of Investments (continued)
September 30, 2014 (Unaudited)
| | | | | | | | | | | | | | |
Principal
Amount | | | Interest
Rate | | | Maturity
Date | | | Value | |
| | Senior Term Loans(a) – (continued) | |
| | Technology – Software/Services – (continued) | |
| BMC Software, Inc. (B/B1) | |
| $ | 52,644,823 | | | | 5.000 | % | | | 09/10/20 | | | $ | 51,723,539 | |
| Dealertrack Technologies, Inc. (BB-/Ba2) | |
| | 6,660,652 | | | | 3.500 | | | | 02/28/21 | | | | 6,549,619 | |
| Electrical Components International, Inc. (B+/B1) | |
| | 5,236,875 | | | | 5.750 | | | | 05/28/21 | | | | 5,259,812 | |
| Emdeon, Inc. (BB-/Ba3) | |
| | 18,805,758 | | | | 3.750 | | | | 11/02/18 | | | | 18,576,516 | |
| Ion Trading Technologies S.A.R.L. (B/B2) | |
| | 3,241,875 | | | | 4.250 | | | | 06/10/21 | | | | 3,195,938 | |
| Ion Trading Technologies S.A.R.L. (CCC+/Caa2) | |
| | 4,900,000 | | | | 7.250 | | | | 05/15/22 | | | | 4,871,433 | |
| Lawson Software, Inc. (B+/Ba3) | |
| | 4,361,045 | | | | 3.750 | | | | 06/03/20 | | | | 4,258,386 | |
| Sybil Software LLC (B+/B1) | |
| | 7,556,250 | | | | 4.750 | | | | 03/20/20 | | | | 7,537,359 | |
| | | | | | | | | | | | | | |
| | | | | | | | | | | | | 150,447,838 | |
| | |
| | Textiles & Apparel – 0.2% | |
| Hanesbrands, Inc. (BBB-/Baa3) | |
| EUR | 9,052,313 | | | | 0.000 | | | | 07/29/21 | | | | 11,483,606 | |
| | |
| | Transportation – 0.1% | |
| Pilot Travel Centers LLC (BB/Ba2) | |
| $ | 3,300,000 | | | | 0.000 | | | | 09/23/21 | | | | 3,283,500 | |
| | |
| | Utilities – Electric – 1.9% | |
| Calpine Corp. (BB/Ba3) | |
| | 18,494,583 | | | | 4.000 | | | | 04/01/18 | | | | 18,322,214 | |
| | 33,683,549 | | | | 4.000 | | | | 10/09/19 | | | | 33,323,472 | |
| | 14,486,794 | | | | 4.000 | | | | 10/30/20 | | | | 14,323,817 | |
| NRG Energy, Inc. (BB+/Baa3) | |
| | 26,630,684 | | | | 2.750 | | | | 07/02/18 | | | | 26,098,071 | |
| | | | | | | | | | | | | | |
| | | | | | | | | | | | | 92,067,574 | |
| | |
| | Wireless Telecommunications – 3.2% | |
| Asurion LLC (B/Ba3) | |
| | 2,091,426 | | | | 5.000 | | | | 05/24/19 | | | | 2,079,149 | |
| Crown Castle Operating Co. (BBB/Ba2) | |
| | 41,197,329 | | | | 3.000 | | | | 01/31/21 | | | | 30,793,146 | |
| Intelsat Jackson Holdings Ltd. (BB/Ba3) | |
| | 75,184,955 | | | | 3.750 | | | | 06/30/19 | | | | 73,869,219 | |
| Level 3 Financing, Inc. (BB/Ba3) | |
| | 14,095,000 | | | | 4.000 | | | | 08/01/19 | | | | 13,830,719 | |
| | 22,000,000 | | | | 4.000 | | | | 01/15/20 | | | | 21,587,500 | |
| LTS Buyer LLC (B/B1) | |
| | 10,368,750 | | | | 4.000 | | | | 04/13/20 | | | | 10,176,513 | |
| | | | | | | | | | | | | | |
| | | | | | | | | | | | | 152,336,246 | |
| | |
| | Wirelines Telecommunications – 0.2% | |
| Frontier Communications Corp. (BB-/Ba3) | |
| | 10,000,000 | | | | 7.250 | | | | 01/29/15 | | | | 10,000,000 | |
| | |
| | TOTAL SENIOR TERM LOANS | |
| | (Cost $3,969,898,251) | | | $ | 3,908,783,470 | |
| | |
| | | | | | | | | | | | | | |
| | Corporate Obligations – 10.7% | |
| | Airlines – 0.8% | | | | | | | | | | | | | |
| Air Canada (BB-/Ba3)(b)(c) | |
| $ | 9,400,000 | | | | 6.750 | % | | | 10/01/19 | | | $ | 9,964,000 | |
| Air Canada (BB+/Ba2)(b) | |
| | 11,923,683 | | | | 5.375 | | | | 11/15/22 | | | | 12,196,139 | |
| Air Canada 2013-1 Class C Pass Through Trust (B+/B1)(b) | |
| | 6,271,000 | | | | 6.625 | | | | 05/15/18 | | | | 6,535,323 | |
| Continental Airlines 2012-3 Class C Pass Thru Certificates
(B+/B1) |
|
| | 4,500,000 | | | | 6.125 | | | | 04/29/18 | | | | 4,713,750 | |
| United Airlines 2014-1 Class B Pass Through Trust (BB+/NR) | |
| | 3,850,000 | | | | 4.750 | | | | 10/11/23 | | | | 3,840,375 | |
| United Continental Holdings, Inc. (B/B2) | |
| | 1,299,000 | | | | 6.375 | | | | 06/01/18 | | | | 1,360,702 | |
| | | | | | | | | | | | | | |
| | | | | | | | | | | | | 38,610,289 | |
| | |
| | Automotive(c) – 0.1% | |
| Chrysler Group LLC (B/B1) | |
| | 5,000,000 | | | | 8.000 | | | | 06/15/19 | | | | 5,300,000 | |
| | |
| | Automotive – Parts(c) – 0.2% | |
| American Axle & Manufacturing, Inc. (B+/B2) | |
| | 1,000,000 | | | | 5.125 | | | | 02/15/19 | | | | 1,000,000 | |
| Stackpole International Intermediate Co. (B+/B2)(b) | |
| | 6,650,000 | | | | 7.750 | | | | 10/15/21 | | | | 6,683,250 | |
| | | | | | | | | | | | | | |
| | | | | | | | | | | | | 7,683,250 | |
| | |
| | Building Materials(b)(c) – 0.0% | |
| Galapagos SA (B/B1) | |
| EUR | 1,100,000 | | | | 5.375 | | | | 06/15/21 | | | | 1,355,816 | |
| | |
| | Chemicals – 0.4% | | | | | | | | | | | | | |
| Hexion US Finance Corp./Hexion Nova Scotia Finance ULC
(CCC+/Caa1)(c) |
|
| $ | 5,575,000 | | | | 8.875 | | | | 02/01/18 | | | | 5,658,625 | |
| Hexion US Finance Corp./Hexion Nova Scotia Finance ULC
(CCC+/Caa2)(c) |
|
| | 1,550,000 | | | | 9.000 | | | | 11/15/20 | | | | 1,476,375 | |
| Momentive Performance Materials, Inc. (NR/WR)(c)(d) | |
| | 10,000,000 | | | | 8.875 | | | | 10/15/20 | | | | 8,975,000 | |
| US Coatings Acquisition, Inc./Axalta Coating Systems Dutch
Holding B BV (B+/B1)(c) |
|
| EUR | 1,000,000 | | | | 5.750 | | | | 02/01/21 | | | | 1,334,160 | |
| WR Grace & Co. (BB+/Ba3)(b) | |
| $ | 1,500,000 | | | | 5.125 | | | | 10/01/21 | | | | 1,518,750 | |
| | 50,000 | | | | 5.625 | | | | 10/01/24 | | | | 51,000 | |
| | | | | | | | | | | | | | |
| | | | | | | | | | | | | 19,013,910 | |
| | |
| | Consumer Products – Household & Leisure(c) – 0.2% | |
| Springs Industries, Inc. (B/B2) | |
| | 10,000,000 | | | | 6.250 | | | | 06/01/21 | | | | 9,825,000 | |
| | |
| | Consumer Products – Industrial(c) – 0.1% | |
| HD Supply, Inc. (B+/B1) | |
| | 2,000,000 | | | | 8.125 | | | | 04/15/19 | | | | 2,160,000 | |
| | |
| | Energy – Exploration & Production(b)(c) – 0.1% | |
| California Resources Corp. (BB/Ba1) | |
| | 5,200,000 | | | | 5.000 | | | | 01/15/20 | | | | 5,271,500 | |
| | |
| | |
| 88 | | The accompanying notes are an integral part of these financial statements. |
GOLDMAN SACHS HIGH YIELD FLOATING RATE FUND
| | | | | | | | | | | | | | |
Principal
Amount | | | Interest
Rate | | | Maturity
Date | | | Value | |
| | Corporate Obligations – (continued) | |
| | Entertainment(b)(c) – 0.0% | |
| WMG Acquisition Corp. (B+/B1) | |
| $ | 1,750,000 | | | | 5.625 | % | | | 04/15/22 | | | $ | 1,754,375 | |
| | |
| | Finance(b) – 0.1% | |
| CIT Group, Inc. (BB-/Ba3) | |
| | 1,650,000 | | | | 5.500 | | | | 02/15/19 | | | | 1,720,125 | |
| International Lease Finance Corp. (BBB-/Ba1) | |
| | 2,000,000 | | | | 7.125 | | | | 09/01/18 | | | | 2,245,000 | |
| | | | | | | | | | | | | | |
| | | | | | | | | | | | | 3,965,125 | |
| | |
| | Food and Beverage(c) – 0.2% | |
| B&G Foods, Inc. (BB-/B1) | |
| | 5,450,000 | | | | 4.625 | | | | 06/01/21 | | | | 5,191,125 | |
| Premier Foods PLC (B/B2)(b) | |
| GBP | 1,700,000 | | | | 6.500 | | | | 03/15/21 | | | | 2,430,840 | |
| Shearer’s Foods LLC/Chip Finance Corp. (B/B1)(b) | |
| $ | 900,000 | | | | 9.000 | | | | 11/01/19 | | | | 978,750 | |
| | | | | | | | | | | | | | |
| | | | | | | | | | | | | 8,600,715 | |
| | |
| | Gaming(c) – 0.1% | |
| Caesars Entertainment Operating Co., Inc. (CCC-/Caa2) | |
| | 7,800,000 | | | | 9.000 | | | | 02/15/20 | | | | 5,986,500 | |
| | |
| | Health Care – 1.8% | |
| CHS/Community Health Systems, Inc. (BB/Ba2)(c) | |
| | 12,550,000 | | | | 5.125 | | | | 08/15/18 | | | | 12,895,125 | |
| | 10,000,000 | | | | 5.125 | (b) | | | 08/01/21 | | | | 10,025,000 | |
| CHS/Community Health Systems, Inc. (B-/B3)(b)(c) | |
| | 17,600,000 | | | | 6.875 | | | | 02/01/22 | | | | 18,348,000 | |
| Crimson Merger Sub, Inc. (CCC+/Caa1)(b)(c) | |
| | 5,200,000 | | | | 6.625 | | | | 05/15/22 | | | | 4,758,000 | |
| HCA, Inc. (BB/Ba3) | |
| | 10,000,000 | | | | 3.750 | | | | 03/15/19 | | | | 9,825,000 | |
| | 16,300,000 | | | | 6.500 | | | | 02/15/20 | | | | 17,807,750 | |
| | 4,435,000 | | | | 7.250 | (c) | | | 09/15/20 | | | | 4,656,750 | |
| | 8,050,000 | | | | 5.000 | | | | 03/15/24 | | | | 7,919,187 | |
| | | | | | | | | | | | | | |
| | | | | | | | | | | | | 86,234,812 | |
| | |
| | Media – Broadcasting & Radio(c) – 0.6% | |
| iHeartCommunications, Inc. (CCC+/Caa1) | |
| | 3,153,000 | | | | 9.000 | | | | 12/15/19 | | | | 3,172,706 | |
| Univision Communications, Inc. (B+/B2)(b) | |
| | 6,525,000 | | | | 6.875 | | | | 05/15/19 | | | | 6,802,313 | |
| | 10,550,000 | | | | 7.875 | | | | 11/01/20 | | | | 11,301,687 | |
| | 6,421,000 | | | | 6.750 | | | | 09/15/22 | | | | 6,886,523 | |
| | | | | | | | | | | | | | |
| | | | | | | | | | | | | 28,163,229 | |
| | |
| | Media – Cable(c) – 1.1% | |
| Cequel Communications Holdings I LLC/Cequel Capital Corp.
(B-/B3)(b) |
|
| | 2,600,000 | | | | 5.125 | | | | 12/15/21 | | | | 2,476,500 | |
| Numericable Group SA (B+/Ba3)(b) | |
| | 21,000,000 | | | | 4.875 | | | | 05/15/19 | | | | 20,737,500 | |
| | 8,200,000 | | | | 6.250 | | | | 05/15/24 | | | | 8,261,500 | |
| Virgin Media Finance PLC (B/B2) | |
| | 10,000,000 | | | | 8.375 | | | | 10/15/19 | | | | 10,420,000 | |
| Virgin Media Secured Finance PLC (BB-/Ba3)(b) | |
| | 11,000,000 | | | | 5.375 | | | | 04/15/21 | | | | 11,082,500 | |
| | | | | | | | | | | | | | |
| | | | | | | | | | | | | 52,978,000 | |
| | |
| | Corporate Obligations – (continued) | |
| | Media – Non Cable(b)(c) – 0.1% | |
| Nielsen Finance LLC/Nielsen Finance Co. (BB/B1) | |
| 3,450,000 | | | | 5.000 | | | | 04/15/22 | | | | 3,372,375 | |
| | |
| | Packaging(c) – 0.5% | |
| Ardagh Packaging Finance PLC (CCC+/Caa1)(b) | |
| | 4,900,000 | | | | 6.250 | | | | 01/31/19 | | | | 4,893,875 | |
| Ardagh Packaging Finance PLC/Ardagh Holdings USA, Inc.
(B+/Ba3)(b) |
|
| EUR | 5,200,000 | | | | 4.250 | | | | 01/15/22 | | | | 6,403,666 | |
| Reynolds Group Issuer, Inc. (B+/B1) | |
| $ | 1,731,000 | | | | 7.875 | | | | 08/15/19 | | | | 1,834,860 | |
| | 8,550,000 | | | | 5.750 | | | | 10/15/20 | | | | 8,688,937 | |
| | | | | | | | | | | | | | |
| | | | | | | | | | | | | 21,821,338 | |
| | |
| | Restaurants(b)(c) – 0.2% | |
| New Red Finance, Inc. (B-/Caa1) | |
| | 11,350,000 | | | | 6.000 | | | | 04/01/22 | | | | 11,264,875 | |
| | |
| | Retailers(c) – 0.3% | |
| American Apparel, Inc. (CC/Caa2) | |
| | 5,868,513 | | | | 13.000 | | | | 04/15/20 | | | | 6,543,392 | |
| Claire’s Stores, Inc. (B-/B2)(b) | |
| | 3,850,000 | | | | 9.000 | | | | 03/15/19 | | | | 3,907,750 | |
| | 900,000 | | | | 6.125 | | | | 03/15/20 | | | | 828,000 | |
| | | | | | | | | | | | | | |
| | | | | | | | | | | | | 11,279,142 | |
| | |
| | Services Cyclical – Business Services(b)(c) – 0.5% | |
| Altegrity, Inc. (CCC/Caa1) | |
| | 9,600,000 | | | | 9.500 | | | | 07/01/19 | | | | 8,904,000 | |
| First Data Corp. (BB-/B1) | |
| | 8,150,000 | | | | 7.375 | | | | 06/15/19 | | | | 8,557,500 | |
| | 2,925,000 | | | | 6.750 | | | | 11/01/20 | | | | 3,093,188 | |
| Sabre, Inc. (B+/Ba3) | |
| | 4,000,000 | | | | 8.500 | | | | 05/15/19 | | | | 4,310,000 | |
| | | | | | | | | | | | | | |
| | | | | | | | | | | | | 24,864,688 | |
| | |
| | Services Cyclical – Consumer Services(c) – 0.2% | |
| APX Group, Inc. (B/Ba3) | |
| | 10,000,000 | | | | 6.375 | | | | 12/01/19 | | | | 9,712,500 | |
| | |
| | Services Cyclical – Rental Equipment(b)(c) – 0.7% | |
| Ahern Rentals, Inc. (B/Caa1) | |
| | 10,000,000 | | | | 9.500 | | | | 06/15/18 | | | | 10,700,000 | |
| Algeco Scotsman Global Finance PLC (B/B2) | |
| | 10,000,000 | | | | 8.500 | | | | 10/15/18 | | | | 10,250,000 | |
| Jurassic Holdings III, Inc. (B-/Caa1) | |
| | 11,000,000 | | | | 6.875 | | | | 02/15/21 | | | | 10,945,000 | |
| | | | | | | | | | | | | | |
| | | | | | | | | | | | | 31,895,000 | |
| | |
| | Telecommunications – Cellular – 1.6% | |
| Altice Financing SA (BB-/B1)(b)(c) | |
| | 8,000,000 | | | | 6.500 | | | | 01/15/22 | | | | 8,200,000 | |
| SBA Communications Corp. (B/B3)(b)(c) | |
| | 10,600,000 | | | | 4.875 | | | | 07/15/22 | | | | 10,176,000 | |
| Softbank Corp. (BB+/Ba1)(b) | |
| | 17,550,000 | | | | 4.500 | | | | 04/15/20 | | | | 17,418,375 | |
| Sprint Communications, Inc. (BB-/B1) | |
| | 8,000,000 | | | | 8.375 | | | | 08/15/17 | | | | 8,960,000 | |
| | |
| | |
| The accompanying notes are an integral part of these financial statements. | | 89 |
GOLDMAN SACHS HIGH YIELD FLOATING RATE FUND
Schedule of Investments (continued)
September 30, 2014 (Unaudited)
| | | | | | | | | | | | | | |
Principal
Amount | | | Interest
Rate | | | Maturity
Date | | | Value | |
| | Corporate Obligations – (continued) | |
| | Telecommunications – Cellular – (continued) | |
| Sprint Communications, Inc. (BB+/Ba2)(b) | |
| $ | 3,500,000 | | | | 9.000 | % | | | 11/15/18 | | | $ | 4,046,875 | |
| Sprint Communications, Inc. (BB-/B1) | |
| | 3,950,000 | | | | 7.000 | | | | 08/15/20 | | | | 4,127,750 | |
| Sprint Corp. (BB-/B1)(b) | |
| | 5,800,000 | | | | 7.250 | | | | 09/15/21 | | | | 6,061,000 | |
| | 3,000,000 | | | | 7.875 | | | | 09/15/23 | | | | 3,187,500 | |
| Wind Acquisition Finance SA (NR/Ba3)(b)(c) | |
| | 7,800,000 | | | | 4.750 | | | | 07/15/20 | | | | 7,488,000 | |
| Wind Acquisition Finance SA (B/Caa1)(b)(c) | |
| | 7,600,000 | | | | 7.375 | | | | 04/23/21 | | | | 7,628,500 | |
| | | | | | | | | | | | | | |
| | | | | | | | | | | | | 77,294,000 | |
| | |
| | Telecommunications – Internet & Data(b)(c)(e) – 0.2% | |
| Level 3 Financing, Inc. (B-/B3) | |
| | 8,350,000 | | | | 3.823 | | | | 01/15/18 | | | | 8,256,063 | |
| | |
| | Telecommunications – Satellites(c) – 0.2% | |
| Intelsat Jackson Holdings SA (B-/Caa1) | |
| | 8,475,000 | | | | 6.625 | | | | 12/15/22 | | | | 8,538,563 | |
| Intelsat Luxembourg SA (B-/Caa2) | |
| | 700,000 | | | | 8.125 | | | | 06/01/23 | | | | 729,750 | |
| | | | | | | | | | | | | | |
| | | | | | | | | | | | | 9,268,313 | |
| | |
| | Telecommunications – Wirelines – 0.1% | |
| Frontier Communications Corp. (BB-/Ba3) | |
| | 5,000,000 | | | | 8.250 | | | | 04/15/17 | | | | 5,525,000 | |
| | |
| | Transportation(c) – 0.3% | |
| Aguila 3 SA (B/B2) | |
| | 12,950,000 | | | | 7.875 | (b) | | | 01/31/18 | | | | 13,241,375 | |
| CHF | 2,150,000 | | | | 7.875 | | | | 01/31/18 | | | | 2,287,750 | |
| | | | | | | | | | | | | | |
| | | | | | | | | | | | | 15,529,125 | |
| | |
| | TOTAL CORPORATE OBLIGATIONS | |
| | (Cost $511,194,735) | | | $ | 506,984,940 | |
| | |
| | | | | | | | | | | | | | |
| | Agency Debenture(f) – 3.1% | |
| | FHLB | | | | | | | | | | | | | |
| $ | 150,000,000 | | | | 0.000 | % | | | 11/21/14 | | | $ | 149,997,300 | |
| | (Cost $149,993,625) | | | | | |
| | |
| | | | | | | | | | | | | | |
| | Asset-Backed Securities(b)(e) – 1.8% | |
| | Collateralized Loan Obligations – 1.8% | |
| ACIS CLO Ltd. Series 2013-1A, Class ACOM (A/NR) | |
| $ | 9,000,000 | | | | 1.461 | % | | | 04/18/24 | | | $ | 8,674,200 | |
| ACIS CLO Ltd. Series 2014-4A, Class ACOM (AA/NR) | |
| | 9,000,000 | | | | 1.713 | | | | 05/01/26 | | | | 8,821,800 | |
| ACIS CLO Ltd. Series 2014-4A, Class C (A/NR) | |
| | 1,500,000 | | | | 2.777 | | | | 05/01/26 | | | | 1,389,865 | |
| B&M CLO Ltd. Series 2014-1A, Class B (A/NR) | |
| | 8,500,000 | | | | 2.998 | | | | 04/16/26 | | | | 8,073,954 | |
| ICG US CLO Ltd. Series 2014-1A, Class B (A/NR) | |
| | 7,250,000 | | | | 2.966 | | | | 04/20/26 | | | | 6,887,587 | |
| | |
| | Asset-Backed Securities(b)(e) – (continued) | |
| | Collateralized Loan Obligations – (continued) | |
| OCP CLO Ltd. Series 2014-5A, Class B (A/NR) | |
| $ | 9,250,000 | | | | 2.916 | % | | | 04/26/26 | | | $ | 8,807,221 | |
| OFSI Fund V Ltd. Series 2013-5A, Class A3L (A/NR) | |
| | 4,000,000 | | | | 3.433 | | | | 04/17/25 | | | | 3,924,476 | |
| OFSI Fund VI Ltd. Series 2014-6A, Class B (A/NR) | |
| | 12,500,000 | | | | 3.423 | | | | 03/20/25 | | | | 12,080,050 | |
| Palmer Square CLO Ltd. Series 2013-1A, Class B (A/NR) | |
| | 3,300,000 | | | | 3.084 | | | | 05/15/25 | | | | 3,204,290 | |
| Red River CLO Ltd. Series 1A, Class A (AAA/Aaa) | |
| | 1,800,762 | | | | 0.510 | | | | 07/27/18 | | | | 1,791,126 | |
| Regatta IV Funding Ltd. Series 2014-1A, Class C (NR/A2) | |
| | 3,600,000 | | | | 3.215 | | | | 07/25/26 | | | | 3,485,063 | |
| Trinitas CLO II Ltd. Series 2014-2A, Class C (A/NR) | |
| | 1,950,000 | | | | 3.124 | | | | 07/15/26 | | | | 1,862,814 | |
| Trinitas CLO Ltd. Series 2014-1A, Class B1 (A/NR) | |
| | 8,000,000 | | | | 3.103 | | | | 04/15/26 | | | | 7,552,648 | |
| Zais CLO 1 Ltd. Series 2014-1A, Class B (A/NR) | |
| | 8,600,000 | | | | 2.864 | | | | 04/15/26 | | | | 8,143,615 | |
| | |
| | TOTAL ASSET-BACKED SECURITIES | | | | | |
| | (Cost $85,212,663) | | | $ | 84,698,709 | |
| | |
| | | | | | | | |
| Shares | | | Description | | Value | |
| | Investment Company(g) – 0.8% | |
| | 5,757,912 | | | Goldman Sachs High Yield Fund
| | | | |
| | (Cost $41,449,489) | | $ | 40,535,700 | |
| | |
| TOTAL INVESTMENTS BEFORE
SHORT-TERM INVESTMENT |
|
| | (Cost $4,757,748,763) | | $ | 4,691,000,119 | |
| | |
| | | | | | | | | | | | |
Principal
Amount | | | Interest
Rate | | Maturity
Date | | | Value | |
| | Short-term Investment(h) – 5.5% | |
| | Repurchase Agreement – 5.5% | |
| Joint Repurchase Agreement Account II | |
| $ | 259,800,000 | | | 0.012% | | | 10/01/14 | | | $ | 259,800,000 | |
| | (Cost $259,800,000) | | | | | |
| | |
| | TOTAL INVESTMENTS – 104.2% | | | | | |
| | (Cost $5,017,548,763) | | | $ | 4,950,800,119 | |
| | |
| LIABILITIES IN EXCESS OF
OTHER ASSETS – (4.2)% |
| | | (199,760,915 | ) |
| | |
| | NET ASSETS – 100.0% | | | $ | 4,751,039,204 | |
| | |
| | |
| 90 | | The accompanying notes are an integral part of these financial statements. |
GOLDMAN SACHS HIGH YIELD FLOATING RATE FUND
| | |
| The percentage shown for each investment category reflects the value of investments in that category as a percentage of net assets. |
(a) | | Senior Term Loans often require prepayments from excess cash flows or permit the borrower to repay at its election. The degree to which borrowers repay, whether as a contractual requirement or at their election, cannot be predicted with accuracy. As a result, the actual remaining maturity may be substantially less than the stated maturities shown. The stated interest rate represents the weighted average interest rate of all contracts within the senior loan facility at September 30, 2014. Senior Term Loans typically have rates of interest which are predetermined either daily, monthly, quarterly or semi-annually by reference to a base lending rate, plus a premium. These base lending rates are primarily the London-Interbank Offered Rate (“LIBOR”), and secondarily the prime rate offered by one or more major United States banks (the “Prime Rate”) and the certificate of deposit (“CD”) rate or other base lending rates used by commercial lenders. |
(b) | | Exempt from registration under Rule 144A of the Securities Act of 1933. Under procedures approved by the Board of Trustees, such securities have been determined to be liquid by the investment adviser and may be resold, normally to qualified institutional buyers in transactions exempt from registration. Total market value of Rule 144A securities amounts to $411,217,017, which represents approximately 8.7% of net assets as of September 30, 2014. |
(c) | | Security with “Call” features with resetting interest rates. Maturity dates disclosed are the final maturity dates. |
(d) | | Security is currently in default and/or non-income producing. |
(e) | | Variable rate security. Interest rate or distribution rate disclosed is that which is in effect at September 30, 2014. |
(f) | | Issued with a zero coupon. Income is recognized through the accretion of discount. |
(g) | | Represents Affiliated Funds. |
(h) | | Joint repurchase agreement was entered into on September 30, 2014. Additional information appears on page 123. |
Security ratings disclosed, if any, are obtained from Standard & Poor’s/Moody’s Investors Service. A brief description of the ratings is available in the Fund’s Statement of Additional Information.
| | |
|
Currency Abbreviations: |
CHF | | —Swiss Franc |
EUR | | —Euro |
GBP | | —British Pound |
USD | | —U.S. Dollar |
|
Investment Abbreviations: |
CLO | | —Collateralized Loan Obligation |
FHLB | | —Federal Home Loan Bank |
LIBOR | | —London Interbank Offered Rate |
LP | | —Limited Partnership |
WR | | —Withdrawn Rating |
|
| | |
| The accompanying notes are an integral part of these financial statements. | | 91 |
GOLDMAN SACHS HIGH YIELD FLOATING RATE FUND
Schedule of Investments (continued)
September 30, 2014 (Unaudited)
|
| ADDITIONAL INVESTMENT INFORMATION |
UNFUNDED LOAN COMMITMENTS — At September 30, 2014, the Fund had unfunded loan commitments which could be extended at the option of the borrowers, pursuant to the following loan agreements:
| | | | | | | | | | | | |
| Borrower | | Principal
Amount | | | Current
Value | | | Unrealized
Gain (Loss) | |
Advantage Sales & Marketing, Inc. (NR/NR), due 07/23/21 | | $ | 40,323 | | | $ | 39,588 | | | $ | (885 | ) |
Ziggo B.V. (NR/NR), due 01/15/22 | | | 5,240,000 | | | | 6,517,256 | | | | (101,129 | ) |
Ziggo N.V. (NR/NR), due 01/15/22 | | | 12,153,064 | | | | 11,831,095 | | | | (361,427 | ) |
| TOTAL | | | | | | | | | | $ | (463,441 | ) |
FORWARD FOREIGN CURRENCY EXCHANGE CONTRACTS — At September 30, 2014, the Fund had the following forward foreign currency exchange contracts:
FORWARD FOREIGN CURRENCY EXCHANGE CONTRACTS WITH UNREALIZED GAIN
| | | | | | | | | | | | | | |
| Counterparty | | Contracts to
Buy/Sell | | Settlement
Date | | | Current
Value | | | Unrealized
Gain | |
Credit Suisse International (London) | | USD/CHF | | | 10/03/14 | | | $ | 5,059,639 | | | $ | 186,166 | |
| | USD/EUR | | | 10/03/14 | | | | 16,614,295 | | | | 646,426 | |
| | USD/GBP | | | 10/03/14 | | | | 2,755,879 | | | | 54,782 | |
Royal Bank of Scotland PLC | | USD/CHF | | | 10/03/14 | | | | 2,236,911 | | | | 46,143 | |
| TOTAL | | | | | | | | | | | | $ | 933,517 | |
FORWARD FOREIGN CURRENCY EXCHANGE CONTRACTS WITH UNREALIZED LOSS
| | | | | | | | | | | | | | |
| Counterparty | | Contracts to
Buy/Sell | | Settlement
Date | | | Current
Value | | | Unrealized
Loss | |
JPMorgan Securities, Inc. | | CHF/USD | | | 10/03/14 | | | $ | 2,765,704 | | | $ | (52,561 | ) |
Royal Bank of Scotland PLC | | CHF/USD | | | 10/03/14 | | | | 2,237,247 | | | | (46,175 | ) |
| TOTAL | | | | | | | | | | | | $ | (98,736 | ) |
SWAP CONTRACTS — At September 30, 2014, the Fund had the following swap contracts:
CENTRALLY CLEARED INTEREST RATE SWAP CONTRACTS
| | | | | | | | | | | | | | | | | | |
| | | | | | Rates Exchanged | | Market Value | |
Notional
Amount
(000s)(a) | | | Termination
Date | | Payments
Received | | | Payments
Made | | Upfront
Payments
Made (Received) | | | Unrealized
Gain (Loss) | |
| $ | 105,500 | | | 12/17/17 | | | 3 month LIBOR | | | 1.500% | | $ | (334,646 | ) | | $ | 282,023 | |
| | 156,000 | | | 12/17/19 | | | 3 month LIBOR | | | 2.250 | | | (1,632,101 | ) | | | 290,642 | |
| | 96,200 | | | 12/17/21 | | | 3 month LIBOR | | | 2.500 | | | (828,176 | ) | | | 294,651 | |
| | 12,900 | | | 12/17/24 | | | 3 month LIBOR | | | 3.000 | | | (363,963 | ) | | | 49,099 | |
| | TOTAL | | $ | (3,158,886 | ) | | $ | 916,415 | |
| | (a) | | Represents forward starting interest rate swaps whose effective dates of commencement of accruals and cash flows occur subsequent to September 30, 2014. |
| | |
| 92 | | The accompanying notes are an integral part of these financial statements. |
GOLDMAN SACHS HIGH YIELD FLOATING RATE FUND
|
| ADDITIONAL INVESTMENT INFORMATION (continued) |
CENTRALLY CLEARED CREDIT DEFAULT SWAP CONTRACT
| | | | | | | | | | | | | | | | | | | | | | |
| | | | | | | | | | | | | | Market Value | |
| Referenced Obligation | | Notional
Amount
(000s) | | Rates Received
(Paid) | | | Termination
Date | | | Credit
Spread at
September 30,
2014(b) | | | Upfront
Payments
Made (Received) | | | Unrealized
Gain (Loss) | |
Protection Sold: | | | | | | | | | | | | | | | | | | | | | | |
CDX North America High Yield Index 22 | | $45,045 | | | 5.000 | % | | | 06/20/19 | | | | 3.546 | % | | $ | 3,089,016 | | | $ | (333,978 | ) |
| | (b) | | Credit spread on the Referenced Obligation, together with the term of the swap contract, are indicators of payment/performance risk. The likelihood of a credit event occurring which would require a fund to make a payment or otherwise be required to perform under the swap contract is generally greater as the credit spread and the term of the swap contract increase. |
| | |
| The accompanying notes are an integral part of these financial statements. | | 93 |
GOLDMAN SACHS INVESTMENT GRADE CREDIT FUND
Schedule of Investments
September 30, 2014 (Unaudited)
| | | | | | | | | | | | | | |
Principal
Amount | | | Interest
Rate | | | Maturity
Date | | | Value | |
| | Corporate Obligations – 77.1% | |
| | Automotive – 1.7% | |
| Ford Motor Credit Co. LLC | |
| $ | 3,075,000 | | | | 3.984 | % | | | 06/15/16 | | | $ | 3,217,093 | |
| | 4,325,000 | | | | 5.875 | | | | 08/02/21 | | | | 4,970,145 | |
| | | | | | | | | | | | | | |
| | | | | | | | | | | | | 8,187,238 | |
| | |
| | Banks – 17.7% | |
| Abbey National Treasury Services PLC(a) | |
| GBP | 600,000 | | | | 2.161 | | | | 02/16/16 | | | | 978,318 | |
| American Express Co.(a)(b) | |
| $ | 1,950,000 | | | | 6.800 | | | | 09/01/66 | | | | 2,081,625 | |
| Bank of America Corp. | |
| | 3,750,000 | | | | 5.000 | | | | 05/13/21 | | | | 4,100,686 | |
| | 8,300,000 | | | | 4.000 | | | | 04/01/24 | | | | 8,379,380 | |
| Barclays Bank PLC | |
| | 3,575,000 | | | | 2.500 | | | | 02/20/19 | | | | 3,583,757 | |
| Citigroup, Inc. | |
| | 3,750,000 | | | | 3.375 | | | | 03/01/23 | | | | 3,686,800 | |
| Compass Bank | |
| | 775,000 | | | | 1.850 | (b) | | | 09/29/17 | | | | 774,823 | |
| | 1,025,000 | | | | 2.750 | (b) | | | 09/29/19 | | | | 1,023,553 | |
| | 2,950,000 | | | | 5.500 | | | | 04/01/20 | | | | 3,223,844 | |
| Credit Suisse AG(c) | |
| | 2,500,000 | | | | 6.500 | | | | 08/08/23 | | | | 2,719,091 | |
| HSBC Holdings PLC(a)(b) | |
| | 1,675,000 | | | | 6.375 | | | | 09/17/49 | | | | 1,668,504 | |
| ING Bank NV(a)(b) | |
| | 4,150,000 | | | | 4.125 | | | | 11/21/23 | | | | 4,222,335 | |
| Intesa Sanpaolo SPA | |
| | 1,600,000 | | | | 3.125 | | | | 01/15/16 | | | | 1,636,007 | |
| | 4,525,000 | | | | 3.875 | | | | 01/16/18 | | | | 4,708,589 | |
| | 3,400,000 | | | | 5.017 | (c) | | | 06/26/24 | | | | 3,302,710 | |
| JPMorgan Chase & Co. | |
| | 3,700,000 | | | | 3.875 | | | | 09/10/24 | | | | 3,632,901 | |
| Macquarie Bank Ltd.(c) | |
| | 2,650,000 | | | | 2.600 | | | | 06/24/19 | | | | 2,647,851 | |
| MUFG Capital Finance 1 Ltd.(a)(b) | |
| | 2,650,000 | | | | 6.346 | | | | 12/31/49 | | | | 2,822,250 | |
| Nordea Bank AB(a)(b)(c) | |
| | 1,200,000 | | | | 6.125 | | | | 09/23/49 | | | | 1,176,000 | |
| PNC Preferred Funding Trust II(a)(b)(c) | |
| | 3,800,000 | | | | 1.457 | | | | 03/29/49 | | | | 3,652,750 | |
| Regions Financial Corp. | |
| | 3,850,000 | | | | 5.750 | | | | 06/15/15 | | | | 3,972,707 | |
| Royal Bank of Scotland PLC | |
| | 4,250,000 | | | | 2.550 | | | | 09/18/15 | | | | 4,311,514 | |
| | 1,150,000 | | | | 9.500 | (a)(b) | | | 03/16/22 | | | | 1,311,000 | |
| | 1,150,000 | | | | 6.000 | | | | 12/19/23 | | | | 1,207,298 | |
| Santander Holdings USA, Inc. | |
| | 3,000,000 | | | | 3.000 | (b) | | | 09/24/15 | | | | 3,053,830 | |
| | 855,000 | | | | 4.625 | | | | 04/19/16 | | | | 898,793 | |
| | 975,000 | | | | 3.450 | (b) | | | 08/27/18 | | | | 1,011,072 | |
| Santander US Debt SAU(c) | |
| | 1,700,000 | | | | 3.781 | | | | 10/07/15 | | | | 1,746,621 | |
| Sumitomo Mitsui Financial Group, Inc.(c) | |
| | 2,875,000 | | | | 4.436 | | | | 04/02/24 | | | | 2,945,061 | |
| Wells Fargo & Co.(a)(b) | |
| | 3,625,000 | | | | 5.900 | | | | 06/15/49 | | | | 3,692,969 | |
| | | | | | | | | | | | | | |
| | | | | | | | | | | | | 84,172,639 | |
| | |
| | Corporate Obligations – (continued) | |
| | Brokerage – 3.1% | |
| KKR Group Finance Co. LLC(c) | |
| $ | 1,850,000 | | | | 6.375 | % | | | 09/29/20 | | | $ | 2,163,349 | |
| Morgan Stanley, Inc. | |
| | 8,925,000 | | | | 6.250 | | | | 08/28/17 | | | | 10,002,662 | |
| | 2,375,000 | | | | 5.950 | | | | 12/28/17 | | | | 2,659,388 | |
| | | | | | | | | | | | | | |
| | | | | | | | | | | | | 14,825,399 | |
| | |
| | Chemicals – 2.4% | |
| Ecolab, Inc. | |
| | 1,667,000 | | | | 5.500 | | | | 12/08/41 | | | | 1,908,200 | |
| Incitec Pivot Ltd.(c) | |
| | 3,700,000 | | | | 4.000 | | | | 12/07/15 | | | | 3,816,369 | |
| LyondellBasell Industries NV(b) | |
| | 1,120,000 | | | | 5.000 | | | | 04/15/19 | | | | 1,236,363 | |
| Monsanto Co.(b) | |
| | 2,000,000 | | | | 4.200 | | | | 07/15/34 | | | | 2,006,412 | |
| | 2,400,000 | | | | 4.700 | | | | 07/15/64 | | | | 2,383,728 | |
| | | | | | | | | | | | | | |
| | | | | | | | | | | | | 11,351,072 | |
| | |
| | Consumer Products – 1.1% | |
| Avon Products, Inc. | |
| | 3,875,000 | | | | 4.600 | | | | 03/15/20 | | | | 3,957,388 | |
| Whirlpool Corp. | |
| | 1,300,000 | | | | 2.400 | | | | 03/01/19 | | | | 1,290,790 | |
| | | | | | | | | | | | | | |
| | | | | | | | | | | | | 5,248,178 | |
| | |
| | Distributor(c) – 0.2% | |
| Southern Star Central Gas Pipeline, Inc. | |
| | 1,100,000 | | | | 6.000 | | | | 06/01/16 | | | | 1,165,054 | |
| | |
| | Diversified Manufacturing – 0.8% | |
| Valmont Industries, Inc.(b) | |
| | 1,200,000 | | | | 5.250 | | | | 10/01/54 | | | | 1,173,450 | |
| Xylem, Inc. | |
| | 2,350,000 | | | | 3.550 | | | | 09/20/16 | | | | 2,455,440 | |
| | | | | | | | | | | | | | |
| | | | | | | | | | | | | 3,628,890 | |
| | |
| | Electric – 5.2% | |
| Arizona Public Service Co. | |
| | 3,965,000 | | | | 8.750 | | | | 03/01/19 | | | | 5,025,362 | |
| Consumers Energy Co.(b) | |
| | 2,500,000 | | | | 3.950 | | | | 05/15/43 | | | | 2,414,540 | |
| Florida Power & Light Co.(b) | |
| | 2,600,000 | | | | 5.250 | | | | 02/01/41 | | | | 3,039,047 | |
| Kentucky Utilities Co.(b) | |
| | 1,700,000 | | | | 5.125 | | | | 11/01/40 | | | | 1,958,195 | |
| PPL WEM Holdings PLC(b)(c) | |
| | 1,750,000 | | | | 5.375 | | | | 05/01/21 | | | | 1,964,433 | |
| Progress Energy, Inc. | |
| | 1,000,000 | | | | 7.000 | | | | 10/30/31 | | | | 1,313,445 | |
| Public Service Electric & Gas Co.(b) | |
| | 2,525,000 | | | | 3.950 | | | | 05/01/42 | | | | 2,460,636 | |
| Puget Sound Energy, Inc.(a)(b) | |
| | 2,000,000 | | | | 6.974 | | | | 06/01/67 | | | | 2,095,000 | |
| Ruwais Power Co. PJSC(c) | |
| | 670,000 | | | | 6.000 | | | | 08/31/36 | | | | 750,400 | |
| Southern California Edison Co.(b) | |
| | 1,550,000 | | | | 4.050 | | | | 03/15/42 | | | | 1,523,448 | |
| | |
| | |
| 94 | | The accompanying notes are an integral part of these financial statements. |
GOLDMAN SACHS INVESTMENT GRADE CREDIT FUND
| | | | | | | | | | | | | | |
Principal
Amount | | | Interest
Rate | | | Maturity
Date | | | Value | |
| | Corporate Obligations – (continued) | |
| | Electric – (continued) | |
| Virginia Electric and Power Co.(b) | |
| $ | 2,030,000 | | | | 4.000 | % | | | 01/15/43 | | | $ | 1,958,141 | |
| | | | | | | | | | | | | | |
| | | | | | | | | | | | | 24,502,647 | |
| | |
| | Energy – 5.5% | |
| Anadarko Petroleum Corp. | |
| | 3,125,000 | | | | 8.700 | | | | 03/15/19 | | | | 3,929,477 | |
| BG Energy Capital PLC(a)(b) | |
| | 2,550,000 | | | | 6.500 | | | | 11/30/72 | | | | 2,772,339 | |
| Corp Financiera de Desarrollo SA(c) | |
| | 360,000 | | | | 4.750 | | | | 02/08/22 | | | | 374,400 | |
| Dolphin Energy Ltd.(c) | |
| | 339,625 | | | | 5.888 | | | | 06/15/19 | | | | 373,588 | |
| | 600,000 | | | | 5.500 | | | | 12/15/21 | | | | 672,060 | |
| Lukoil International Finance BV | |
| | 200,000 | | | | 6.125 | | | | 11/09/20 | | | | 200,500 | |
| Nexen, Inc. | |
| | 675,000 | | | | 6.400 | | | | 05/15/37 | | | | 819,021 | |
| Pemex Project Funding Master Trust | |
| | 900,000 | | | | 6.625 | | | | 06/15/35 | | | | 1,040,625 | |
| Petrobras Global Finance BV | |
| | 3,100,000 | | | | 4.875 | | | | 03/17/20 | | | | 3,115,841 | |
| | 930,000 | | | | 6.250 | | | | 03/17/24 | | | | 972,129 | |
| Petroleos Mexicanos | |
| | 150,000 | | | | 3.500 | | | | 07/18/18 | | | | 155,475 | |
| | 127,000 | | | | 6.000 | | | | 03/05/20 | | | | 143,828 | |
| | 280,000 | | | | 5.500 | | | | 01/21/21 | | | | 306,642 | |
| | 800,000 | | | | 6.375 | (c) | | | 01/23/45 | | | | 904,640 | |
| PTTEP Canada International Finance Ltd.(c) | |
| | 820,000 | | | | 5.692 | | | | 04/05/21 | | | | 922,336 | |
| Transocean, Inc. | |
| | 4,650,000 | | | | 6.500 | | | | 11/15/20 | | | | 4,905,748 | |
| Transportadora de Gas Internacional SA ESP(b) | |
| | 770,000 | | | | 5.700 | | | | 03/20/22 | | | | 816,200 | |
| Weatherford International Ltd. | |
| | 2,685,000 | | | | 9.625 | | | | 03/01/19 | | | | 3,448,120 | |
| | | | | | | | | | | | | | |
| | | | | | | | | | | | | 25,872,969 | |
| | |
| | Food & Beverage(c) – 2.8% | |
| Pernod-Ricard SA | |
| | 5,700,000 | | | | 4.450 | | | | 01/15/22 | | | | 6,023,515 | |
| SABMiller Holdings, Inc. | |
| | 1,175,000 | | | | 4.950 | | | | 01/15/42 | | | | 1,222,749 | |
| Suntory Holdings Ltd. | |
| | 3,400,000 | | | | 2.550 | | | | 09/29/19 | | | | 3,395,587 | |
| WM Wrigley Jr Co.(b) | |
| | 2,650,000 | | | | 3.375 | | | | 10/21/20 | | | | 2,689,466 | |
| | | | | | | | | | | | | | |
| | | | | | | | | | | | | 13,331,317 | |
| | |
| | Home Construction – 1.0% | |
| MDC Holdings, Inc. | |
| | 2,275,000 | | | | 5.625 | | | | 02/01/20 | | | | 2,369,790 | |
| | 2,375,000 | | | | 6.000 | (b) | | | 01/15/43 | | | | 2,183,078 | |
| | | | | | | | | | | | | | |
| | | | | | | | | | | | | 4,552,868 | |
| | |
| | Corporate Obligations – (continued) | |
| | Life Insurance – 1.5% | |
| AIG Life Holdings, Inc. | |
| 1,325,000 | | | | 8.500 | | | | 07/01/30 | | | | 1,742,375 | |
| Genworth Financial, Inc. | |
| | 1,000,000 | | | | 8.625 | | | | 12/15/16 | | | | 1,148,375 | |
| | 1,550,000 | | | | 7.700 | | | | 06/15/20 | | | | 1,863,458 | |
| Teachers Insurance & Annuity Association of America(c) | |
| | 2,440,000 | | | | 4.900 | | | | 09/15/44 | | | | 2,486,660 | |
| | | | | | | | | | | | | | |
| | | | | | | | | | | | | 7,240,868 | |
| | |
| | Media – Cable – 2.3% | |
| Comcast Corp. | |
| | 1,375,000 | | | | 4.250 | | | | 01/15/33 | | | | 1,386,255 | |
| | 2,775,000 | | | | 6.450 | | | | 03/15/37 | | | | 3,546,255 | |
| DIRECTV Holdings LLC/DIRECTV Financing Co., Inc.(b) | |
| | 1,025,000 | | | | 6.000 | | | | 08/15/40 | | | | 1,147,353 | |
| Time Warner Cable, Inc. | |
| | 2,000,000 | | | | 5.000 | | | | 02/01/20 | | | | 2,218,551 | |
| | 1,675,000 | | | | 7.300 | | | | 07/01/38 | | | | 2,262,934 | |
| | 425,000 | | | | 5.875 | (b) | | | 11/15/40 | | | | 497,144 | |
| | | | | | | | | | | | | | |
| | | | | | | | | | | | | 11,058,492 | |
| | |
| | Media – Non Cable – 0.9% | |
| 21st Century Fox America, Inc. | |
| | 700,000 | | | | 3.700 | (b)(c) | | | 09/15/24 | | | | 701,220 | |
| | 1,700,000 | | | | 6.150 | | | | 02/15/41 | | | | 2,031,056 | |
| | 1,625,000 | | | | 5.400 | | | | 10/01/43 | | | | 1,778,124 | |
| | | | | | | | | | | | | | |
| | | | | | | | | | | | | 4,510,400 | |
| | |
| | Metals & Mining – 1.1% | |
| Freeport-McMoRan, Inc.(b) | |
| | 1,600,000 | | | | 3.550 | | | | 03/01/22 | | | | 1,563,320 | |
| Glencore Funding LLC(c) | |
| | 1,550,000 | | | | 1.700 | | | | 05/27/16 | | | | 1,560,517 | |
| | 1,975,000 | | | | 2.500 | | | | 01/15/19 | | | | 1,933,367 | |
| | | | | | | | | | | | | | |
| | | | | | | | | | | | | 5,057,204 | |
| | |
| | Noncaptive – Financial – 2.4% | |
| Air Lease Corp. | |
| | 800,000 | | | | 4.500 | | | | 01/15/16 | | | | 828,000 | |
| | 1,100,000 | | | | 5.625 | | | | 04/01/17 | | | | 1,186,625 | |
| GE Capital Trust I(a)(b) | |
| | 3,280,000 | | | | 6.375 | | | | 11/15/67 | | | | 3,567,000 | |
| General Electric Capital Corp. | |
| | 1,325,000 | | | | 5.875 | | | | 01/14/38 | | | | 1,593,663 | |
| | 975,000 | | | | 6.375 | (a)(b) | | | 11/15/67 | | | | 1,066,406 | |
| International Lease Finance Corp. | |
| | 3,225,000 | | | | 5.750 | | | | 05/15/16 | | | | 3,354,000 | |
| | | | | | | | | | | | | | |
| | | | | | | | | | | | | 11,595,694 | |
| | |
| | Pharmaceuticals(b) – 1.3% | |
| Gilead Sciences, Inc. | |
| | 1,375,000 | | | | 4.800 | | | | 04/01/44 | | | | 1,440,283 | |
| Roche Holdings, Inc.(c) | |
| | 4,725,000 | | | | 2.875 | | | | 09/29/21 | | | | 4,718,224 | |
| | | | | | | | | | | | | | |
| | | | | | | | | | | | | 6,158,507 | |
| | |
| | |
| The accompanying notes are an integral part of these financial statements. | | 95 |
GOLDMAN SACHS INVESTMENT GRADE CREDIT FUND
Schedule of Investments (continued)
September 30, 2014 (Unaudited)
| | | | | | | | | | | | | | |
Principal
Amount | | | Interest
Rate | | | Maturity
Date | | | Value | |
| | Corporate Obligations – (continued) | |
| | Pipelines – 4.2% | |
| Energy Transfer Partners LP | |
| $ | 3,727,000 | | | | 5.950 | % | | | 02/01/15 | | | $ | 3,788,199 | |
| Enterprise Products Operating LLC(a)(b) | |
| | 3,725,000 | | | | 8.375 | | | | 08/01/66 | | | | 4,088,187 | |
| | 1,765,000 | | | | 7.000 | | | | 06/01/67 | | | | 1,844,425 | |
| Tennessee Gas Pipeline Co. | |
| | 2,125,000 | | | | 8.375 | | | | 06/15/32 | | | | 2,809,135 | |
| TransCanada PipeLines Ltd.(a)(b) | |
| | 3,875,000 | | | | 6.350 | | | | 05/15/67 | | | | 3,952,500 | |
| Western Gas Partners LP(b) | |
| | 2,950,000 | | | | 5.450 | | | | 04/01/44 | | | | 3,208,629 | |
| | | | | | | | | | | | | | |
| | | | | | | | | | | | | 19,691,075 | |
| | |
| | Property/Casualty Insurance – 1.3% | |
| Alleghany Corp.(b) | |
| | 1,175,000 | | | | 4.900 | | | | 09/15/44 | | | | 1,168,537 | |
| American International Group, Inc.(b) | |
| | 3,325,000 | | | | 4.500 | | | | 07/16/44 | | | | 3,295,336 | |
| Arch Capital Group Ltd. | |
| | 1,245,000 | | | | 7.350 | | | | 05/01/34 | | | | 1,669,098 | |
| | | | | | | | | | | | | | |
| | | | | | | | | | | | | 6,132,971 | |
| | |
| | Real Estate Investment Trusts – 7.7% | |
| American Campus Communities Operating Partnership LP(b) | |
| | 3,200,000 | | | | 4.125 | | | | 07/01/24 | | | | 3,209,301 | |
| ARC Properties Operating Partnership LP/Clark Acquisition
LLC(c) |
|
| | 5,075,000 | | | | 2.000 | | | | 02/06/17 | | | | 5,075,663 | |
| Camden Property Trust | |
| | 3,400,000 | | | | 5.700 | | | | 05/15/17 | | | | 3,748,313 | |
| CubeSmart LP(b) | |
| | 1,625,000 | | | | 4.800 | | | | 07/15/22 | | | | 1,747,372 | |
| Developers Diversified Realty Corp. | |
| | 590,000 | | | | 9.625 | | | | 03/15/16 | | | | 662,455 | |
| | 3,750,000 | | | | 7.500 | | | | 04/01/17 | | | | 4,262,815 | |
| ERP Operating LP(b) | |
| | 1,750,000 | | | | 4.500 | | | | 07/01/44 | | | | 1,734,239 | |
| HCP, Inc. | |
| | 2,525,000 | | | | 6.300 | | | | 09/15/16 | | | | 2,771,242 | |
| | 2,475,000 | | | | 2.625 | (b) | | | 02/01/20 | | | | 2,449,941 | |
| Health Care REIT, Inc.(b) | |
| | 775,000 | | | | 4.125 | | | | 04/01/19 | | | | 826,132 | |
| Kilroy Realty LP | |
| | 2,300,000 | | | | 5.000 | | | | 11/03/15 | | | | 2,401,246 | |
| | 1,125,000 | | | | 6.625 | | | | 06/01/20 | | | | 1,323,037 | |
| Retail Opportunity Investments Partnership LP(b) | |
| | 1,825,000 | | | | 5.000 | | | | 12/15/23 | | | | 1,938,532 | |
| Trust F/1401(c) | |
| | 230,000 | | | | 5.250 | | | | 12/15/24 | | | | 240,005 | |
| UDR, Inc. | |
| | 1,900,000 | | | | 4.250 | | | | 06/01/18 | | | | 2,030,867 | |
| WEA Finance LLC/Westfield UK & Europe Finance PLC(b)(c) | |
| | 2,150,000 | | | | 2.700 | | | | 09/17/19 | | | | 2,155,098 | |
| | | | | | | | | | | | | | |
| | | | | | | | | | | | | 36,576,258 | |
| | |
| | Corporate Obligations – (continued) | |
| | Retailers(b) – 1.3% | |
| CVS Health Corp. | |
| 1,075,000 | | | | 5.750 | | | | 05/15/41 | | | | 1,260,837 | |
| NIKE, Inc. | |
| | 2,936,000 | | | | 3.625 | | | | 05/01/43 | | | | 2,746,993 | |
| Sysco Corp. | |
| | 2,175,000 | | | | 3.500 | | | | 10/02/24 | | | | 2,180,653 | |
| | | | | | | | | | | | | | |
| | | | | | | | | | | | | 6,188,483 | |
| | |
| | Technology – Hardware – 1.6% | |
| Hewlett-Packard Co. | |
| | 1,400,000 | | | | 3.000 | | | | 09/15/16 | | | | 1,449,198 | |
| | 4,400,000 | | | | 2.600 | | | | 09/15/17 | | | | 4,519,069 | |
| | 1,396,000 | | | | 4.300 | | | | 06/01/21 | | | | 1,488,460 | |
| | | | | | | | | | | | | | |
| | | | | | | | | | | | | 7,456,727 | |
| | |
| | Technology – Software/Services – 0.6% | |
| Apple, Inc. | |
| | 3,000,000 | | | | 3.850 | | | | 05/04/43 | | | | 2,776,610 | |
| | |
| | Tobacco – 1.2% | |
| Altria Group, Inc. | |
| | 1,650,000 | | | | 2.850 | | | | 08/09/22 | | | | 1,579,190 | |
| Imperial Tobacco Finance PLC(c) | |
| | 4,100,000 | | | | 2.050 | | | | 02/11/18 | | | | 4,083,403 | |
| | | | | | | | | | | | | | |
| | | | | | | | | | | | | 5,662,593 | |
| | |
| | Trucking & Leasing(c) – 1.7% | |
| ERAC USA Finance LLC | |
| | 3,650,000 | | | | 5.625 | | | | 03/15/42 | | | | 4,122,237 | |
| Penske Truck Leasing Co. LP/PTL Finance Corp. | |
| | 3,100,000 | | | | 2.500 | | | | 03/15/16 | | | | 3,163,029 | |
| | 650,000 | | | | 4.875 | | | | 07/11/22 | | | | 698,518 | |
| | | | | | | | | | | | | | |
| | | | | | | | | | | | | 7,983,784 | |
| | |
| | Wireless Telecommunications – 0.7% | |
| American Tower Corp. | |
| | 3,325,000 | | | | 3.400 | | | | 02/15/19 | | | | 3,396,828 | |
| | |
| | Wirelines Telecommunications – 5.8% | |
| AT&T, Inc.(b) | |
| | 3,000,000 | | | | 2.625 | | | | 12/01/22 | | | | 2,839,732 | |
| Telefonica Emisiones SAU | |
| | 625,000 | | | | 6.221 | | | | 07/03/17 | | | | 697,006 | |
| | 1,750,000 | | | | 3.192 | | | | 04/27/18 | | | | 1,806,234 | |
| | 1,925,000 | | | | 5.462 | | | | 02/16/21 | | | | 2,141,529 | |
| Verizon Communications, Inc. | |
| | 5,425,000 | | | | 4.500 | | | | 09/15/20 | | | | 5,856,504 | |
| | 4,775,000 | | | | 4.150 | (b) | | | 03/15/24 | | | | 4,911,868 | |
| | 3,464,000 | | | | 6.400 | | | | 09/15/33 | | | | 4,219,601 | |
| | 588,000 | | | | 6.550 | | | | 09/15/43 | | | | 729,258 | |
| | 3,598,000 | | | | 4.862 | (c) | | | 08/21/46 | | | | 3,607,652 | |
| | 589,000 | | | | 5.012 | (c) | | | 08/21/54 | | | | 589,669 | |
| | | | | | | | | | | | | | |
| | | | | | | | | | | | | 27,399,053 | |
| | |
| | TOTAL CORPORATE OBLIGATIONS | | | | | |
| | (Cost $355,844,874) | | | $ | 365,723,818 | |
| | |
| | | | | | | | | | | | | | |
| | |
| 96 | | The accompanying notes are an integral part of these financial statements. |
GOLDMAN SACHS INVESTMENT GRADE CREDIT FUND
| | | | | | | | | | | | | | |
Principal
Amount | | | Interest
Rate | | | Maturity
Date | | | Value | |
| | Mortgage-Backed Obligations(a) – 2.1% | |
| | Commercial Mortgage-Backed Securities – 2.1% | |
| | Sequential Floating Rate – 2.1% | |
| GS Mortgage Securities Trust Series 2007-GG10, Class A4 | |
| $ | 9,069,695 | | | | 5.991 | % | | | 08/10/45 | | | $ | 9,920,299 | |
| | (Cost $10,099,956) | | | | | |
| | |
| | | | | | | | | | | | | | |
| | Agency Debentures – 0.3% | |
| FHLB | |
| $ | 600,000 | | | | 3.000 | % | | | 09/10/21 | | | $ | 618,698 | |
| Tennessee Valley Authority | |
| | 500,000 | | | | 4.625 | | | | 09/15/60 | | | | 544,206 | |
| | |
| | TOTAL AGENCY DEBENTURES | | | | | |
| | (Cost $1,106,204) | | | $ | 1,162,904 | |
| | |
| | | | | | | | | | | | | | |
| | Foreign Debt Obligations – 3.1% | |
| | Sovereign – 3.1% | |
| Federal Republic of Brazil | |
| $ | 940,000 | | | | 4.250 | % | | | 01/07/25 | | | $ | 930,600 | |
| | 370,000 | | | | 8.250 | | | | 01/20/34 | | | | 497,650 | |
| | 1,485,000 | | | | 7.125 | | | | 01/20/37 | | | | 1,819,125 | |
| Republic of Chile | |
| | 935,000 | | | | 3.625 | | | | 10/30/42 | | | | 820,462 | |
| Republic of Colombia | |
| | 801,000 | | | | 4.000 | | | | 02/26/24 | | | | 811,013 | |
| | 522,000 | | | | 6.125 | | | | 01/18/41 | | | | 610,740 | |
| Republic of Panama(d) | |
| | 120,000 | | | | 9.375 | | | | 04/01/29 | | | | 178,200 | |
| Republic of Turkey | |
| | 2,040,000 | | | | 6.250 | | | | 09/26/22 | | | | 2,244,000 | |
| | 1,550,000 | | | | 5.750 | | | | 03/22/24 | | | | 1,643,000 | |
| | 180,000 | | | | 7.375 | | | | 02/05/25 | | | | 213,525 | |
| Republic of Uruguay | |
| | 551,876 | | | | 5.100 | | | | 06/18/50 | | | | 535,320 | |
| United Mexican States | |
| | 2,854,000 | | | | 6.050 | | | | 01/11/40 | | | | 3,360,585 | |
| | 835,000 | | | | 5.550 | | | | 01/21/45 | | | | 926,850 | |
| | |
| | TOTAL FOREIGN DEBT OBLIGATIONS | |
| | (Cost $13,793,406) | | | $ | 14,591,070 | |
| | |
| | | | | | | | | | | | | | |
| | Municipal Debt Obligations – 3.4% | |
| | California – 2.1% | |
| California State GO Bonds Build America Taxable Series 2009 | |
| $ | 1,450,000 | | | | 7.500 | % | | | 04/01/34 | | | $ | 2,068,686 | |
| | 455,000 | | | | 7.300 | | | | 10/01/39 | | | | 635,931 | |
| California State GO Bonds Build America Taxable Series 2010 | |
| | 2,320,000 | | | | 7.625 | | | | 03/01/40 | | | | 3,382,885 | |
| California State University RB Build America Bonds Series 2010 | |
| | 2,825,000 | | | | 6.484 | | | | 11/01/41 | | | | 3,612,807 | |
| | | | | | | | | | | | | | |
| | | | | | | | | | | | | 9,700,309 | |
| | |
| | Municipal Debt Obligations – (continued) | |
| | Illinois – 1.2% | |
| Chicago Illinois Metropolitan Water Reclamation District GO
Bonds Build America Taxable Direct Payment Series 2009 |
|
| 1,775,000 | | | | 5.720 | | | | 12/01/38 | | | | 2,127,550 | |
| Illinois State GO Bonds Build America Series 2010 | |
| | 3,225,000 | | | | 6.630 | | | | 02/01/35 | | | | 3,527,376 | |
| | | | | | | | | | | | | | |
| | | | | | | | | | | | | 5,654,926 | |
| | |
| | New Jersey – 0.1% | |
| New Jersey State Turnpike Authority RB Build America Bonds
Taxable Series 2009 F |
|
| | 350,000 | | | | 7.414 | | | | 01/01/40 | | | | 501,267 | |
| | |
| | TOTAL MUNICIPAL DEBT OBLIGATIONS | |
| | (Cost $12,546,283) | | | | | | | $ | 15,856,502 | |
| | |
| | | | | | | | | | | | | | |
| | U.S. Treasury Obligations – 6.7% | |
| United States Treasury Bonds | |
| $ | 350,000 | | | | 2.750 | % | | | 11/15/42 | | | $ | 320,187 | |
| | 400,000 | | | | 3.750 | (e) | | | 11/15/43 | | | | 442,084 | |
| | 1,000,000 | | | | 3.375 | | | | 05/15/44 | | | | 1,032,320 | |
| United States Treasury Inflation Protected Securities | |
| | 3,124,566 | | | | 0.625 | | | | 01/15/24 | | | | 3,142,126 | |
| | 1,605,440 | | | | 0.125 | | | | 07/15/24 | | | | 1,542,475 | |
| United States Treasury Notes | |
| | 16,700,000 | | | | 0.375 | (e) | | | 01/31/16 | | | | 16,724,215 | |
| | 3,400,000 | | | | 1.625 | | | | 08/31/19 | | | | 3,376,812 | |
| | 5,300,000 | | | | 1.750 | | | | 09/30/19 | | | | 5,292,315 | |
| | |
| | TOTAL U.S. TREASURY OBLIGATIONS | |
| | (Cost $31,877,341) | | | $ | 31,872,534 | |
| | |
| | | | | | | | | | | | | | |
Notional
Amount | | | Exercise
Rate | | | Expiration
Date | | | Value | |
| | Options Purchased – 0.5% | |
| | Interest Rate Swaptions | |
| Bank of America NA Call - OTC - 10 year Interest Rate Swap
Strike Price 3.590% |
|
| $ | 5,700,000 | | | | 3.590 | % | | | 03/22/16 | | | $ | 112,332 | |
| Bank of America NA Call - OTC - 10 year Interest Rate Swap
Strike Price 4.070% |
|
| | 5,200,000 | | | | 4.070 | | | | 03/29/16 | | | | 53,806 | |
| Bank of America NA Put - OTC - 30 year Interest Rate Swap
Strike Price 3.950% |
|
| | 1,100,000 | | | | 3.950 | | | | 01/29/16 | | | | 147,884 | |
| Bank of America NA Call - OTC - 30 year Interest Rate Swap
Strike Price 3.950% |
|
| | 1,100,000 | | | | 3.950 | | | | 01/29/16 | | | | 29,002 | |
| Citibank NA Call - OTC - 10 year Interest Rate Swap
Strike Price 3.633% |
|
| | 10,400,000 | | | | 3.633 | | | | 02/19/16 | | | | 177,383 | |
| Deutsche Bank AG Call - OTC - 2 year Interest Rate Swap
Strike Price 1.950% |
|
| | 16,100,000 | | | | 1.950 | | | | 10/26/15 | | | | 91,095 | |
| | |
| | |
| The accompanying notes are an integral part of these financial statements. | | 97 |
GOLDMAN SACHS INVESTMENT GRADE CREDIT FUND
Schedule of Investments (continued)
September 30, 2014 (Unaudited)
| | | | | | | | | | | | | | |
Notional
Amount | | | Exercise
Rate | | | Expiration
Date | | | Value | |
| | Options Purchased – (continued) | |
| | Interest Rate Swaptions – (continued) | |
| Deutsche Bank AG Call - OTC - 2 year Interest Rate Swap
Strike Price 2.030% |
|
| $ | 16,000,000 | | | | 2.030 | % | | | 10/26/15 | | | $ | 81,149 | |
| Deutsche Bank AG Put - OTC - 5 year Interest Rate Swap
Strike Price 2.550% |
|
| | 5,400,000 | | | | 2.550 | | | | 09/28/15 | | | | 87,662 | |
| Deutsche Bank AG Call - OTC - 5 year Interest Rate Swap
Strike Price 2.550% |
|
| | 5,400,000 | | | | 2.550 | | | | 09/28/15 | | | | 82,535 | |
| Deutsche Bank AG Put - OTC - 5 year Interest Rate Swap
Strike Price 2.940% |
|
| | 2,800,000 | | | | 2.940 | | | | 09/29/16 | | | | 63,877 | |
| Deutsche Bank AG Call - OTC - 5 year Interest Rate Swap
Strike Price 2.940% |
|
| | 2,800,000 | | | | 2.940 | | | | 09/29/16 | | | | 66,965 | |
| Deutsche Bank AG Call - OTC - 10 year Interest Rate Swap
Strike Price 3.780% |
|
| | 2,200,000 | | | | 3.780 | | | | 09/26/16 | | | | 52,371 | |
| Deutsche Bank AG Put - OTC - 10 year Interest Rate Swap
Strike Price 4.113% |
|
| | 3,300,000 | | | | 4.113 | | | | 04/16/19 | | | | 274,314 | |
| Deutsche Bank AG Call - OTC - 10 year Interest Rate Swap
Strike Price 4.113% |
|
| | 3,300,000 | | | | 4.113 | | | | 04/16/19 | | | | 130,476 | |
| Deutsche Bank AG Put - OTC - 10 year Interest Rate Swap
Strike Price 4.135% |
|
| | 4,100,000 | | | | 4.135 | | | | 04/17/19 | | | | 345,360 | |
| Deutsche Bank AG Call - OTC - 10 year Interest Rate Swap
Strike Price 4.135% |
|
| | 4,100,000 | | | | 4.135 | | | | 04/17/19 | | | | 159,786 | |
| JPMorgan Chase Bank NA Call - OTC - 2 year Interest Rate
Swap Strike Price 1.855% |
|
| | 15,500,000 | | | | 1.855 | | | | 11/02/15 | | | | 103,467 | |
| JPMorgan Chase Bank NA Call - OTC - 5 year Interest Rate
Swap Strike Price 2.783% |
|
| | 5,800,000 | | | | 2.783 | | | | 09/30/15 | | | | 64,525 | |
| JPMorgan Chase Bank NA Put - OTC - 5 year Interest Rate Swap
Strike Price 2.973% |
|
| | 4,300,000 | | | | 2.973 | | | | 09/26/16 | | | | 101,704 | |
| JPMorgan Chase Bank NA Call - OTC - 5 year Interest Rate
Swap Strike Price 2.973% |
|
| | 4,300,000 | | | | 2.973 | | | | 09/26/16 | | | | 99,031 | |
| JPMorgan Chase Bank NA Put - OTC - 10 year Interest Rate
Swap Strike Price 3.413% |
|
| | 2,100,000 | | | | 3.413 | | | | 09/19/16 | | | | 100,257 | |
| JPMorgan Chase Bank NA Call - OTC - 10 year Interest Rate
Swap Strike Price 3.413% |
|
| | 2,100,000 | | | | 3.413 | | | | 09/19/16 | | | | 72,909 | |
| JPMorgan Chase Bank NA Call - OTC - 10 year Interest Rate
Swap Strike Price 3.610% |
|
| | 4,700,000 | | | | 3.610 | | | | 02/16/16 | | | | 81,608 | |
| | |
| | TOTAL OPTIONS PURCHASED | |
| | (Cost $3,047,335) | | | | | | | | | | | $ | 2,579,498 | |
| | |
| TOTAL INVESTMENTS BEFORE SHORT-TERM
INVESTMENT |
|
| | (Cost $428,315,399) | | | $ | 441,706,625 | |
| | |
Principal
Amount | | | Interest
Rate | | | Maturity
Date | | | Value | |
| | | | | | | | | | | | | | |
| | Short-term Investment(f) – 5.3% | |
| | Repurchase Agreement – 5.3% | |
| Joint Repurchase Agreement Account II | |
| $ | 25,300,000 | | | | 0.012 | % | | | 10/01/14 | | | $ | 25,300,000 | |
| | (Cost $25,300,000) | | | | | |
| | |
| | TOTAL INVESTMENTS – 98.5% | | | | | |
| | (Cost $453,615,399) | | | $ | 467,006,625 | |
| | |
| OTHER ASSETS IN EXCESS OF
LIABILITIES – 1.5% |
| | | 7,136,033 | |
| | |
| | NET ASSETS – 100.0% | | | $ | 474,142,658 | |
| | |
| | |
| The percentage shown for each investment category reflects the value of investments in that category as a percentage of net assets. |
(a) | | Variable rate security. Interest rate or distribution rate disclosed is that which is in effect at September 30, 2014. |
(b) | | Security with “Call” features with resetting interest rates. Maturity dates disclosed are the final maturity dates. |
(c) | | Exempt from registration under Rule 144A of the Securities Act of 1933. Under procedures approved by the Board of Trustees, such securities have been determined to be liquid by the investment adviser and may be resold, normally to qualified institutional buyers in transactions exempt from registration. Total market value of Rule 144A securities amounts to $79,763,292, which represents approximately 16.8% of net assets as of September 30, 2014. |
(d) | | Security with “Put” features and resetting interest rates. Maturity dates disclosed are the puttable dates. Interest rate disclosed is that which is in effect at September 30, 2014. |
(e) | | A portion of this security is segregated as collateral for initial margin requirements on futures transactions. |
(f) | | Joint repurchase agreement was entered into on September 30, 2014. Additional information appears on page 123. |
| | |
|
Currency Abbreviations: |
EUR | | —Euro Currency |
GBP | | —British Pound |
USD | | —U.S. Dollar |
|
Investment Abbreviations: |
FHLB | | —Federal Home Loan Bank |
GO | | —General Obligation |
LIBOR | | —London Interbank Offered Rate |
OTC | | —Over the Counter |
RB | | —Revenue Bond |
REIT | | —Real Estate Investment Trust |
SPA | | —Stand-by Purchase Agreement |
|
| | |
| 98 | | The accompanying notes are an integral part of these financial statements. |
GOLDMAN SACHS INVESTMENT GRADE CREDIT FUND
|
| ADDITIONAL INVESTMENT INFORMATION |
FORWARD FOREIGN CURRENCY EXCHANGE CONTRACTS — At September 30, 2014, the Fund had the following forward foreign currency exchange contracts:
FORWARD FOREIGN CURRENCY EXCHANGE CONTRACTS WITH UNREALIZED GAIN
| | | | | | | | | | |
| Counterparty | | Contracts to
Buy/Sell | | Settlement
Date | | Current
Value | | Unrealized
Gain | |
Deutsche Bank AG (London) | | USD/GBP | | 10/22/14 | | $966,337 | | $ | 14,608 | |
FUTURES CONTRACTS — At September 30, 2014, the Fund had the following futures contracts:
| | | | | | | | | | | | | | |
| Type | | Number of
Contracts
Long (Short) | | | Expiration
Date | | Current
Value | | | Unrealized
Gain (Loss) | |
Eurodollars | | | (122 | ) | | March 2017 | | $ | (29,760,375 | ) | | $ | 38,861 | |
Eurodollars | | | (110 | ) | | June 2017 | | | (26,780,875 | ) | | | 50,921 | |
Eurodollars | | | (49 | ) | | September 2017 | | | (11,911,288 | ) | | | 25,549 | |
Ultra Long U.S. Treasury Bonds | | | (8 | ) | | December 2014 | | | (1,220,000 | ) | | | (17,823 | ) |
2 Year U.S. Treasury Notes | | | 8 | | | December 2014 | | | 1,750,750 | | | | 391 | |
5 Year U.S. Treasury Notes | | | 133 | | | December 2014 | | | 15,728,289 | | | | (18,758 | ) |
10 Year U.S. Treasury Notes | | | 302 | | | December 2014 | | | 37,641,469 | | | | 214,239 | |
20 Year U.S. Treasury Bonds | | | 136 | | | December 2014 | | | 18,755,250 | | | | (271,379 | ) |
| TOTAL | | | | | | | | | | | | $ | 22,001 | |
SWAP CONTRACTS — At September 30, 2014, the Fund had the following swap contracts:
CENTRALLY CLEARED INTEREST RATE SWAP CONTRACTS
| | | | | | | | | | | | | | | | |
| | | | | | Rates Exchanged | | Market Value | |
Notional
Amount
(000s)(a) | | | Termination
Date | | Payments
Received | | Payments
Made | | Upfront
Payments
Made (Received) | | | Unrealized
Gain (Loss) | |
| $ | 1,700 | | | 02/01/17 | | 3 month LIBOR | | 1.625% | | $ | (419 | ) | | $ | 919 | |
| | 6,300 | | | 08/04/17 | | 3 month LIBOR | | 2.195 | | | (6,169 | ) | | | 4,104 | |
| | 7,200 | | | 10/28/17 | | 1.450% | | 3 month LIBOR | | | (88,283 | ) | | | 29,921 | |
| | 12,100 | | | 12/17/19 | | 3 month LIBOR | | 2.250 | | | (109,626 | ) | | | 5,576 | |
| | 2,100 | | | 10/02/20 | | 2.532 | | 3 month LIBOR | | | 10 | | | | — | |
| | 9,700 | | | 08/04/21 | | 3.025 | | 3 month LIBOR | | | 40,063 | | | | 12,688 | |
| | 14,900 | | | 12/17/21 | | 3 month LIBOR | | 2.500 | | | (60,447 | ) | | | (22,188 | ) |
| | 5,000 | | | 01/30/24 | | 4.252 | | 3 month LIBOR | | | 5,872 | | | | 178,963 | |
| | 23,500 | | | 12/17/24 | | 3 month LIBOR | | 3.000 | | | (662,695 | ) | | | 89,107 | |
| | 12,600 | | | 03/10/26 | | 3.170 | | 3 month LIBOR | | | (913,393 | ) | | | 953,702 | |
| | 5,200 | | | 08/04/26 | | 3 month LIBOR | | 3.409 | | | (36,274 | ) | | | (42,421 | ) |
| | 700 | | | 09/28/26 | | 3.280 | | 3 month LIBOR | | | 6 | | | | 942 | |
| | 7,100 | | | 12/17/29 | | 3 month LIBOR | | 3.250 | | | (155,030 | ) | | | (56,035 | ) |
| | 1,500 | | | 01/30/39 | | 3 month LIBOR | | 4.370 | | | (57,197 | ) | | | (101,009 | ) |
| | TOTAL | | | | | | | | | $ | (2,043,582 | ) | | $ | 1,054,269 | |
| | (a) | | Represents forward starting interest rate swaps whose effective dates of commencement of accruals and cash flows occur subsequent to September 30, 2014. |
| | |
| The accompanying notes are an integral part of these financial statements. | | 99 |
GOLDMAN SACHS LOCAL EMERGING MARKETS DEBT FUND
Schedule of Investments
September 30, 2014 (Unaudited)
| | | | | | | | | | | | | | |
Principal
Amount | | | Interest
Rate | | | Maturity
Date | | | Value | |
| | Sovereign Debt Obligations – 67.7% | |
| | Argentina(a) – 0.5% | |
| Republic of Argentina (NR/NR) | |
| EUR | 7,287,000 | | | | 0.000 | % | | | 12/15/35 | | | $ | 681,085 | |
| $ | 105,880,000 | | | | 0.000 | | | | 12/15/35 | | | | 8,046,880 | |
| | | | | | | | | | | | | | |
| | | | | | | | | | | | | 8,727,965 | |
| | |
| | Brazil – 10.1% | |
| Brazil Letras do Tesouro Nacional (BBB+/Baa2)(b) | |
| BRL | 146,361,000 | | | | 0.000 | | | | 01/01/15 | | | | 58,149,920 | |
| | 6,877,000 | | | | 0.000 | | | | 04/01/15 | | | | 2,660,117 | |
| | 5,523,000 | | | | 0.000 | | | | 01/01/16 | | | | 1,953,705 | |
| | 57,600,000 | | | | 0.000 | | | | 07/01/17 | | | | 17,009,598 | |
| Brazil Notas do Tesouro Nacional (BBB+/Baa2) | |
| | 5,087,535 | | | | 6.000 | | | | 08/15/16 | | | | 2,108,041 | |
| | 2,074,433 | | | | 6.000 | | | | 05/15/17 | | | | 861,579 | |
| | 22,806,000 | | | | 10.000 | | | | 01/01/18 | | | | 8,735,661 | |
| | 24,246,000 | | | | 10.000 | | | | 01/01/19 | | | | 9,137,297 | |
| | 107,038,000 | | | | 10.000 | | | | 01/01/23 | | | | 38,508,552 | |
| | 5,298,000 | | | | 10.000 | | | | 01/01/25 | | | | 1,873,057 | |
| | 98,331,096 | | | | 6.000 | | | | 08/15/40 | | | | 39,093,267 | |
| | 33,627,008 | | | | 6.000 | | | | 08/15/50 | | | | 13,251,146 | |
| | | | | | | | | | | | | | |
| | | | | | | | | | | | | 193,341,940 | |
| | |
| | Chile – 0.7% | |
| Bonos de la Tesoreria de la Republica (NR/NR) | |
| CLP | 2,090,533,730 | | | | 3.000 | | | | 01/01/15 | | | | 3,509,601 | |
| Bonos del Banco Central de Chile en Pesos (NR/NR) | |
| | 1,245,000,000 | | | | 6.000 | | | | 06/01/17 | | | | 2,225,087 | |
| | 1,546,753,280 | | | | 3.000 | | | | 03/01/22 | | | | 2,863,878 | |
| Republic of Chile (NR/NR) | |
| | 2,905,000,000 | | | | 6.000 | | | | 01/01/18 | | | | 5,147,865 | |
| | | | | | | | | | | | | | |
| | | | | | | | | | | | | 13,746,431 | |
| | |
| | Colombia – 5.7% | |
| Republic of Colombia (NR/Baa2) | |
| COP | 1,000,000,000 | | | | 4.375 | | | | 03/21/23 | | | | 425,512 | |
| Republic of Colombia (BBB/Baa2) | |
| | 2,399,000,000 | | | | 12.000 | | | | 10/22/15 | | | | 1,265,799 | |
| Republic of Colombia (BBB+/Baa2) | |
| | 33,358,000,000 | | | | 8.000 | | | | 10/28/15 | | | | 17,004,385 | |
| | 3,424,300,000 | | | | 11.250 | | | | 10/24/18 | | | | 2,017,636 | |
| | 152,453,300,000 | | | | 7.000 | | | | 05/04/22 | | | | 76,201,994 | |
| | 15,005,000,000 | | | | 7.500 | | | | 08/26/26 | | | | 7,564,317 | |
| | 10,997,500,000 | | | | 6.000 | | | | 04/28/28 | | | | 4,819,850 | |
| | | | | | | | | | | | | | |
| | | | | | | | | | | | | 109,299,493 | |
| | |
| | Costa Rica – 0.3% | |
| Republic of Costa Rica (NR/NR) | |
| CRC | 2,404,800,000 | | | | 11.130 | | | | 03/28/18 | | | | 4,751,504 | |
| | 394,800,000 | | | | 9.200 | | | | 03/27/19 | | | | 727,400 | |
| | | | | | | | | | | | | | |
| | | | | | | | | | | | | 5,478,904 | |
| | |
| | Dominican Republic – 1.3% | |
| Dominican Republic (NR/NR) | |
| DOP | 344,700,000 | | | | 16.950 | | | | 02/04/22 | | | | 10,627,868 | |
| | 113,200,000 | | | | 14.500 | (c) | | | 02/10/23 | | | | 2,969,666 | |
| | 100,000 | | | | 14.500 | | | | 02/10/23 | | | | 2,623 | |
| | 390,500,000 | | | | 18.500 | (c) | | | 02/04/28 | | | | 12,037,990 | |
| | | | | | | | | | | | | | |
| | | | | | | | | | | | | 25,638,147 | |
| | |
| | Sovereign Debt Obligations – (continued) | |
| | Honduras(c) – 0.1% | |
| Republic of Honduras (B/B3) | |
| $ | 1,690,000 | | | | 8.750 | % | | | 12/16/20 | | | $ | 1,913,925 | |
| | |
| | Hungary – 2.5% | |
| Hungary Government Bond (BB/Ba1) | |
| HUF | 674,650,000 | | | | 5.500 | | | | 12/20/18 | | | | 2,975,779 | |
| | 4,542,880,000 | | | | 6.500 | | | | 06/24/19 | | | | 20,683,304 | |
| | 1,342,020,000 | | | | 7.500 | | | | 11/12/20 | | | | 6,471,741 | |
| | 2,780,270,000 | | | | 7.000 | | | | 06/24/22 | | | | 13,186,047 | |
| | 384,370,000 | | | | 6.000 | | | | 11/24/23 | | | | 1,732,159 | |
| Hungary Government Bond (BB/NR) | |
| | 494,180,000 | | | | 5.500 | | | | 06/24/25 | | | | 2,142,653 | |
| | | | | | | | | | | | | | |
| | | | | | | | | | | | | 47,191,683 | |
| | |
| | Indonesia – 0.6% | |
| Perusahaan Penerbit SBSN (NR/Baa3)(c) | |
| $ | 9,641,000 | | | | 4.350 | | | | 09/10/24 | | | | 9,406,001 | |
| Perusahaan Penerbit SBSN (BB+/Baa3) | |
| | 1,660,000 | | | | 3.300 | | | | 11/21/22 | | | | 1,520,975 | |
| Republic of Indonesia (NR/Baa3) | |
| IDR | 9,000,000 | | | | 6.125 | | | | 05/15/28 | | | | 576 | |
| | | | | | | | | | | | | | |
| | | | | | | | | | | | | 10,927,552 | |
| | |
| | Israel(b) – 0.9% | |
| Israel Government Bond (NR/NR) | |
| ILS | 66,870,000 | | | | 0.000 | | | | 05/06/15 | | | | 18,134,853 | |
| | |
| | Malaysia – 6.9% | |
| Federation of Malaysia (NR/NR)(b) | |
| MYR | 43,050,000 | | | | 0.000 | | | | 10/16/14 | | | | 13,105,603 | |
| | 40,150,000 | | | | 0.000 | | | | 10/28/14 | | | | 12,209,725 | |
| | 28,290,000 | | | | 0.000 | | | | 11/06/14 | | | | 8,596,212 | |
| | 16,440,000 | | | | 0.000 | | | | 01/20/15 | | | | 4,962,223 | |
| | 103,680,000 | | | | 0.000 | | | | 08/04/15 | | | | 30,699,299 | |
| Malaysia Government Bond (NR/NR) | |
| | 42,270,000 | | | | 3.654 | | | | 10/31/19 | | | | 12,867,192 | |
| | 16,680,000 | | | | 3.889 | | | | 07/31/20 | | | | 5,104,649 | |
| | 12,570,000 | | | | 4.048 | | | | 09/30/21 | | | | 3,885,933 | |
| | 5,610,000 | | | | 3.418 | | | | 08/15/22 | | | | 1,653,116 | |
| | 15,400,000 | | | | 3.480 | | | | 03/15/23 | | | | 4,551,696 | |
| | 70,300,000 | | | | 4.181 | | | | 07/15/24 | | | | 21,891,362 | |
| Malaysia Government Bond (NR/A3) | |
| | 30,180,000 | | | | 3.741 | | | | 02/27/15 | | | | 9,209,937 | |
| | 11,000,000 | | | | 4.160 | | | | 07/15/21 | | | | 3,412,498 | |
| | | | | | | | | | | | | | |
| | | | | | | | | | | | | 132,149,445 | |
| | |
| | Mexico – 6.2% | |
| United Mexican States (NR/NR)(b) | |
| MXN | 91,000,000 | | | | 0.000 | | | | 12/11/14 | | | | 6,727,001 | |
| United Mexican States (A/A3) | |
| | 304,390,900 | | | | 7.750 | | | | 12/14/17 | | | | 24,733,646 | |
| | 36,212,100 | | | | 6.500 | | | | 06/09/22 | | | | 2,794,539 | |
| | 97,846,000 | | | | 8.000 | | | | 12/07/23 | | | | 8,273,363 | |
| | 52,994,800 | | | | 10.000 | | | | 12/05/24 | | | | 5,114,755 | |
| | 92,321,700 | | | | 8.500 | | | | 05/31/29 | | | | 8,123,085 | |
| | 19,218,000 | | | | 7.750 | | | | 05/29/31 | | | | 1,583,936 | |
| | 256,700 | | | | 8.500 | | | | 11/18/38 | | | | 22,633 | |
| | |
| | |
| 100 | | The accompanying notes are an integral part of these financial statements. |
GOLDMAN SACHS LOCAL EMERGING MARKETS DEBT FUND
| | | | | | | | | | | | | | |
Principal
Amount | | | Interest
Rate | | | Maturity
Date | | | Value | |
| | Sovereign Debt Obligations – (continued) | |
| | Mexico – (continued) | |
| United Mexican States (NR/A3) | |
| MXN | 821,676,000 | | | | 4.750 | % | | | 06/14/18 | | | $ | 60,786,006 | |
| | | | | | | | | | | | | | |
| | | | | | | | | | | | | 118,158,964 | |
| | |
| | Nigeria – 1.0% | |
| Nigeria Government Bond (NR/NR) | |
| NGN | 922,370,000 | | | | 0.000 | (b) | | | 05/07/15 | | | | 5,281,689 | |
| | 658,670,000 | | | | 0.000 | (b) | | | 06/04/15 | | | | 3,738,139 | |
| | 1,574,590,000 | | | | 0.000 | (a) | | | 09/03/15 | | | | 8,698,733 | |
| | 225,570,000 | | | | 16.000 | | | | 06/29/19 | | | | 1,571,074 | |
| | | | | | | | | | | | | | |
| | | | | | | | | | | | | 19,289,635 | |
| | |
| | Paraguay – 0.7% | |
| Republic of Paraguay (BB/Ba2) | |
| $ | 7,770,000 | | | | 4.625 | (c) | | | 01/25/23 | | | | 7,905,975 | |
| | 1,050,000 | | | | 4.625 | | | | 01/25/23 | | | | 1,068,375 | |
| | 5,025,000 | | | | 6.100 | (c) | | | 08/11/44 | | | | 5,313,938 | |
| | | | | | | | | | | | | | |
| | | | | | | | | | | | | 14,288,288 | |
| | |
| | Peru – 0.6% | |
| Republic of Peru (A-/A3) | |
| PEN | 12,428,000 | | | | 7.840 | | | | 08/12/20 | | | | 4,887,213 | |
| | 9,882,000 | | | | 8.200 | | | | 08/12/26 | | | | 4,076,835 | |
| | 422,000 | | | | 6.900 | | | | 08/12/37 | | | | 147,252 | |
| Republic of Peru (NR/NR) | |
| | 4,842,000 | | | | 5.200 | | | | 09/12/23 | | | | 1,621,099 | |
| Republic of Peru (NR/A3) | |
| | 116,000 | | | | 6.950 | | | | 08/12/31 | | | | 41,656 | |
| | 1,969,000 | | | | 6.850 | | | | 02/12/42 | | | | 677,501 | |
| | | | | | | | | | | | | | |
| | | | | | | | | | | | | 11,451,556 | |
| | |
| | Philippines – 0.4% | |
| Republic of Philippines (BBB/Baa3) | |
| PHP | 326,000,000 | | | | 3.900 | | | | 11/26/22 | | | | 7,137,095 | |
| | |
| | Poland – 6.6% | |
| Poland Government Bond (A/NR) | |
| PLN | 99,690,000 | | | | 3.250 | | | | 07/25/19 | | | | 31,276,682 | |
| | 57,600,000 | | | | 3.250 | | | | 07/25/25 | | | | 17,717,322 | |
| Poland Government Bond (A/A2) | |
| | 51,340,000 | | | | 5.250 | | | | 10/25/20 | | | | 17,814,036 | |
| | 139,810,000 | | | | 5.750 | | | | 09/23/22 | | | | 50,739,220 | |
| | 25,370,000 | | | | 4.000 | | | | 10/25/23 | | | | 8,263,805 | |
| | | | | | | | | | | | | | |
| | | | | | | | | | | | | 125,811,065 | |
| | |
| | Romania – 1.9% | |
| Republic of Romania (NR/NR) | |
| RON | 51,060,000 | | | | 5.900 | | | | 07/26/17 | | | | 15,729,281 | |
| | 27,520,000 | | | | 4.750 | | | | 06/24/19 | | | | 8,325,503 | |
| | 33,480,000 | | | | 5.950 | | | | 06/11/21 | | | | 10,656,789 | |
| Republic of Romania (BBB-/Baa3) | |
| EUR | 1,185,000 | | | | 4.625 | | | | 09/18/20 | | | | 1,695,988 | |
| | | | | | | | | | | | | | |
| | | | | | | | | | | | | 36,407,561 | |
| | |
| | Russia – 6.1% | |
| Russian Federation Bond (NR/Baa1) | |
| RUB | 302,240,000 | | | | 7.000 | | | | 01/25/23 | | | | 6,609,326 | |
| | 817,900,000 | | | | 7.050 | | | | 01/19/28 | | | | 17,219,024 | |
| | |
| | Sovereign Debt Obligations – (continued) | |
| | Russia – (continued) | |
| Russian Federation Bond (BBB/Baa1) | |
| RUB | 1,289,130,000 | | | | 6.200 | % | | | 01/31/18 | | | $ | 29,706,241 | |
| | 1,125,000,000 | | | | 7.850 | | | | 03/10/18 | | | | 27,194,793 | |
| | 565,740,000 | | | | 7.500 | | | | 02/27/19 | | | | 13,369,422 | |
| | 115,870,000 | | | | 6.700 | | | | 05/15/19 | | | | 2,645,235 | |
| | 40,950,000 | | | | 7.600 | | | | 04/14/21 | | | | 950,351 | |
| | 533,850,000 | | | | 7.600 | | | | 07/20/22 | | | | 12,192,240 | |
| | 298,630,000 | | | | 7.000 | | | | 08/16/23 | | | | 6,518,574 | |
| | | | | | | | | | | | | | |
| | | | | | | | | | | | | 116,405,206 | |
| | |
| | South Africa – 3.2% | |
| Republic of South Africa (BBB+/Baa1) | |
| ZAR | 18,480,000 | | | | 8.000 | | | | 12/21/18 | | | | 1,664,636 | |
| | 221,209,000 | | | | 7.250 | | | | 01/15/20 | | | | 19,182,490 | |
| Republic of South Africa (NR/NR) | |
| | 6,780,000 | | | | 7.750 | | | | 02/28/23 | | | | 586,847 | |
| | 58,080,000 | | | | 8.000 | | | | 01/31/30 | | | | 4,830,194 | |
| | 294,710,000 | | | | 8.250 | | | | 03/31/32 | | | | 24,540,643 | |
| | 66,770,000 | | | | 8.750 | | | | 01/31/44 | | | | 5,704,958 | |
| | 55,020,000 | | | | 8.750 | | | | 02/28/48 | | | | 4,748,291 | |
| Republic of South Africa (NR/Baa1) | |
| | 6,060,000 | | | | 6.750 | | | | 03/31/21 | | | | 506,219 | |
| | | | | | | | | | | | | | |
| | | | | | | | | | | | | 61,764,278 | |
| | |
| | Thailand – 4.8% | |
| Thailand Government Bond (NR/Baa1) | |
| THB | 369,980,000 | | | | 3.580 | | | | 12/17/27 | | | | 11,328,064 | |
| | 162,901,674 | | | | 1.250 | | | | 03/12/28 | | | | 4,630,168 | |
| | 97,800,000 | | | | 3.775 | | | | 06/25/32 | | | | 2,962,094 | |
| Thailand Government Bond (A-/Baa1) | |
| | 174,547,000 | | | | 3.875 | | | | 06/13/19 | | | | 5,600,834 | |
| | 372,736,792 | | | | 1.200 | | | | 07/14/21 | | | | 11,165,000 | |
| | 1,487,645,000 | | | | 3.650 | | | | 12/17/21 | | | | 47,101,552 | |
| | 321,620,000 | | | | 3.625 | | | | 06/16/23 | | | | 10,104,023 | |
| | | | | | | | | | | | | | |
| | | | | | | | | | | | | 92,891,735 | |
| | |
| | Turkey – 6.6% | |
| Turkey Government Bond (NR/NR) | |
| TRY | 5,110,000 | | | | 8.300 | | | | 10/07/15 | | | | 2,212,884 | |
| | 55,030,000 | | | | 9.000 | | | | 03/08/17 | | | | 23,924,773 | |
| | 64,250,000 | | | | 8.300 | | | | 06/20/18 | | | | 27,100,684 | |
| | 19,120,000 | | | | 8.800 | | | | 11/14/18 | | | | 8,178,208 | |
| | 58,030,000 | | | | 10.400 | | | | 03/27/19 | | | | 26,223,172 | |
| | 59,930,000 | | | | 8.500 | | | | 07/10/19 | | | | 25,160,044 | |
| | 14,295,000 | | | | 9.500 | | | | 01/12/22 | | | | 6,221,156 | |
| | 7,040,000 | | | | 7.100 | | | | 03/08/23 | | | | 2,624,673 | |
| | 12,640,000 | | | | 8.800 | | | | 09/27/23 | | | | 5,231,618 | |
| | | | | | | | | | | | | | |
| | | | | | | | | | | | | 126,877,212 | |
| | |
| | TOTAL SOVEREIGN DEBT OBLIGATIONS | |
| | (Cost $1,395,653,640) | | | $ | 1,297,032,933 | |
| | |
| | | | | | | | | | | | | | |
| | |
| The accompanying notes are an integral part of these financial statements. | | 101 |
GOLDMAN SACHS LOCAL EMERGING MARKETS DEBT FUND
Schedule of Investments (continued)
September 30, 2014 (Unaudited)
| | | | | | | | | | | | | | |
Principal
Amount | | | Interest
Rate | | | Maturity
Date | | | Value | |
| | Structured Notes – 10.8% | |
| | Brazil – 0.2% | |
| Notas do Tesouro Nacional Series B (Issuer HSBC Corp.)
(NR/NR) |
|
| BRL | 845,000 | | | | 0.000 | %(a) | | | 01/05/17 | | | $ | 329,393 | |
| | 7,736,010 | | | | 6.000 | | | | 08/15/40 | | | | 3,075,588 | |
| | | | | | | | | | | | | | |
| | | | | | | | | | | | | 3,404,981 | |
| | |
| | Colombia – 1.8% | |
| Republic of Columbia (Issuer Citigroup Funding, Inc.) (NR/NR) | |
| COP | 24,676,000,000 | | | | 11.250 | (c) | | | 10/25/18 | | | | 14,539,379 | |
| | 15,491,000,000 | | | | 11.250 | (c) | | | 10/25/18 | | | | 9,127,472 | |
| | 12,492,000,000 | | | | 11.000 | | | | 07/27/20 | | | | 7,521,498 | |
| | 4,226,000,000 | | | | 11.000 | | | | 07/25/24 | | | | 2,539,655 | |
| | | | | | | | | | | | | | |
| | | | | | | | | | | | | 33,728,004 | |
| | |
| | Indonesia – 8.2% | |
| Republic of Indonesia (Issuer Barclays Bank PLC) (NR/NR) | |
| IDR | 140,000,000,000 | | | | 10.000 | | | | 07/17/17 | | | | 12,018,055 | |
| Republic of Indonesia (Issuer Deutsche Bank AG (London)
(NR/NR)(c) |
|
| | 105,400,000,000 | | | | 7.000 | | | | 05/17/22 | | | | 7,914,731 | |
| | 35,400,000,000 | | | | 7.000 | | | | 05/17/27 | | | | 2,505,745 | |
| | 29,500,000,000 | | | | 8.250 | | | | 06/17/32 | | | | 2,257,591 | |
| Republic of Indonesia (Issuer JPMorgan Chase Bank NA)
(NR/NR)(c) |
|
| | 46,000,000,000 | | | | 10.000 | | | | 07/18/17 | | | | 3,948,790 | |
| | 66,250,000,000 | | | | 7.000 | | | | 05/17/27 | | | | 4,689,423 | |
| | 161,824,000,000 | | | | 6.125 | | | | 05/17/28 | | | | 10,365,501 | |
| | 27,665,000,000 | | | | 9.000 | | | | 03/19/29 | | | | 2,276,090 | |
| | 42,700,000,000 | | | | 10.500 | | | | 08/19/30 | | | | 3,949,356 | |
| | 363,204,000,000 | | | | 6.625 | | | | 05/17/33 | | | | 23,383,959 | |
| Republic of Indonesia (Issuer JPMorgan Chase Bank NA) (A/NR) | |
| | 50,100,000,000 | | | | 10.000 | | | | 07/17/17 | | | | 4,300,747 | |
| Republic of Indonesia (Issuer Standard Chartered Bank) (NR/NR) | |
| | 307,999,000,000 | | | | 8.375 | (c) | | | 03/19/24 | | | | 24,986,213 | |
| | 20,000,000,000 | | | | 9.000 | | | | 03/19/29 | | | | 1,645,466 | |
| | 64,658,300,000 | | | | 9.000 | (c) | | | 03/19/29 | | | | 53,196,509 | |
| | | | | | | | | | | | | | |
| | | | | | | | | | | | | 157,438,176 | |
| | |
| | Nigeria(c) – 0.3% | |
| Federal Republic of Nigeria (Issuer Citigroup Funding, Inc.)
(NR/NR) |
|
| NGN | 530,000,000 | | | | 16.000 | | | | 07/03/19 | | | | 3,691,401 | |
| Federal Republic of Nigeria (Issuer HSBC Corp.) (NR/NR) | |
| | 301,630,000 | | | | 7.000 | | | | 10/23/19 | | | | 1,484,310 | |
| | | | | | | | | | | | | | |
| | | | | | | | | | | | | 5,175,711 | |
| | |
| | Zambia(c) – 0.3% | |
| Republic of Zambia (Issuer Standard Chartered Bank (London)
(NR/NR) |
|
| ZMW | 10,060,000 | | | | 11.000 | | | | 09/06/17 | | | | 1,375,881 | |
| | 31,230,000 | | | | 11.000 | | | | 02/20/19 | | | | 3,955,220 | |
| | 13,170,000 | | | | 13.000 | | | | 09/03/24 | | | | 1,539,066 | |
| | | | | | | | | | | | | | |
| | | | | | | | | | | | | 6,870,167 | |
| | |
| | TOTAL STRUCTURED NOTES | | | | | |
| | (Cost $257,523,741) | | | $ | 206,617,039 | |
| | |
| | | | | | | | | | | | | | |
| | Corporate Obligations – 3.4% | |
| | Brazil(c) – 0.3% | |
| Banco Santander Brasil SA (BBB-/Baa2) | |
| BRL | 12,900,000 | | | | 8.000 | % | | | 03/18/16 | | | $ | 5,046,218 | |
| | |
| | Colombia(c)(d) – 0.4% | |
| Empresas Publicas de Medellin ESP (NR/Baa3) | |
| COP | 14,028,000,000 | | | | 7.625 | | | | 09/10/24 | | | | 6,957,212 | |
| | |
| | Hong Kong – 0.5% | |
| China Unicom Ltd. (NR/NR) | |
| CNH | 58,670,000 | | | | 4.000 | | | | 04/16/17 | | | | 9,452,771 | |
| | |
| | Ireland – 0.4% | |
| AHML Finance Ltd. (BBB-/Baa1)(c) | |
| RUB | 331,200,000 | | | | 7.750 | | | | 02/13/18 | | | | 7,594,865 | |
| Mobile Telesystems OJSC via MTS International Funding Ltd.
(BBB-/Baa3) |
|
| $ | 192,000 | | | | 8.625 | | | | 06/22/20 | | | | 203,520 | |
| | | | | | | | | | | | | | |
| | | | | | | | | | | | | 7,798,385 | |
| | |
| | Mexico – 0.2% | |
| America Movil SAB de CV (A-/A2) | |
| MXN | 46,460,000 | | | | 6.000 | | | | 06/09/19 | | | | 3,483,401 | |
| | 12,500,000 | | | | 8.460 | | | | 12/18/36 | | | | 901,581 | |
| | | | | | | | | | | | | | |
| | | | | | | | | | | | | 4,384,982 | |
| | |
| | Philippines – 0.1% | |
| Alliance Global Group, Inc. (NR/NR) | |
| $ | 2,710,000 | | | | 6.500 | | | | 08/18/17 | | | | 2,926,800 | |
| | |
| | South Africa – 1.4% | |
| Transnet Ltd. (NR/NR) | |
| ZAR | 18,000,000 | | | | 10.800 | | | | 11/06/23 | | | | 1,713,262 | |
| | 93,000,000 | | | | 9.500 | | | | 08/19/25 | | | | 8,088,050 | |
| | 61,000,000 | | | | 8.900 | | | | 11/14/27 | | | | 5,057,823 | |
| Transnet Ltd. (BBB+/A3) | |
| | 136,000,000 | | | | 10.000 | | | | 03/30/29 | | | | 11,393,854 | |
| | | | | | | | | | | | | | |
| | | | | | | | | | | | | 26,252,989 | |
| | |
| | United States(b) – 0.1% | |
| Citigroup, Inc. (NR/NR) | |
| ZMW | 15,400,000 | | | | 0.000 | | | | 05/20/15 | | | | 2,218,679 | |
| | |
| | TOTAL CORPORATE OBLIGATIONS | | | | | |
| | (Cost $81,019,974) | | | $ | 65,038,036 | |
| | |
| | | | | | | | | | | | | | |
| | Agency Debentures(b) – 4.7% | |
| FHLB | |
| $ | 36,500,000 | | | | 0.000 | % | | | 11/19/14 | | | $ | 36,499,343 | |
| | 53,500,000 | | | | 0.000 | | | | 12/17/14 | | | | 53,498,288 | |
| | |
| | TOTAL AGENCY DEBENTURES | | | | | |
| | (Cost $89,991,002) | | | $ | 89,997,631 | |
| | |
| | | | | | | | | | | | | | |
| | |
| 102 | | The accompanying notes are an integral part of these financial statements. |
GOLDMAN SACHS LOCAL EMERGING MARKETS DEBT FUND
| | | | | | | | | | | | | | |
Principal
Amount | | | Interest
Rate | | | Maturity
Date | | | Value | |
| | Municipal Debt Obligations – 1.3% | |
| | Puerto Rico – 1.3% | |
| Puerto Rico Commonwealth Aqueduct & Sewer Authority RB
(Senior Lien) Series 2008 A (BB-/Caa1) |
|
| $ | 215,000 | | | | 6.000 | % | | | 07/01/38 | | | $ | 161,893 | |
| | 815,000 | | | | 6.000 | | | | 07/01/44 | | | | 601,071 | |
| Puerto Rico Commonwealth Aqueduct & Sewer Authority RB
(Senior Lien) Series 2012 A (BB-/Caa1) |
|
| | 320,000 | | | | 5.750 | | | | 07/01/37 | | | | 236,070 | |
| Puerto Rico Commonwealth Aqueduct & Sewer Authority RB
(Senior Lien) Series 2012 D (BB-/Caa1) |
|
| | 165,000 | | | | 5.000 | | | | 07/01/33 | | | | 117,188 | |
| Puerto Rico Commonwealth GO Bonds for Public Improvement
Series 2011 A (BB/B2) |
|
| | 120,000 | | | | 5.750 | | | | 07/01/41 | | | | 90,060 | |
| Puerto Rico Commonwealth GO Bonds for Public Improvement
Series 2012 A (BB/B2) |
|
| | 15,000 | | | | 5.125 | | | | 07/01/37 | | | | 11,213 | |
| Puerto Rico Commonwealth GO Bonds Refunding for Public
Improvement Series 2008 A (BB/B2) |
|
| | 70,000 | | | | 5.500 | | | | 07/01/32 | | | | 52,585 | |
| Puerto Rico Commonwealth GO Bonds Refunding for Public
Improvement Series 2009 B (BB/B2) |
|
| | 45,000 | | | | 5.875 | | | | 07/01/36 | | | | 34,992 | |
| | 170,000 | | | | 5.750 | | | | 07/01/38 | | | | 130,616 | |
| | 120,000 | | | | 6.000 | | | | 07/01/39 | | | | 92,092 | |
| Puerto Rico Commonwealth GO Bonds Refunding for Public
Improvement Series 2009 C (BB/B2) |
|
| | 10,000 | | | | 6.000 | | | | 07/01/39 | | | | 7,674 | |
| Puerto Rico Commonwealth GO Bonds Refunding for Public
Improvement Series 2011 A (BB/B2) |
|
| | 45,000 | | | | 6.000 | | | | 07/01/34 | | | | 34,883 | |
| Puerto Rico Commonwealth GO Bonds Refunding for Public
Improvement Series 2011 E (BB/B2) |
|
| | 40,000 | | | | 5.625 | | | | 07/01/32 | | | | 30,418 | |
| Puerto Rico Commonwealth GO Bonds Refunding for Public
Improvement Series 2012 A (BB/B2) |
|
| | 20,000 | | | | 5.500 | | | | 07/01/26 | | | | 15,914 | |
| | 820,000 | | | | 5.500 | | | | 07/01/39 | | | | 612,852 | |
| | 300,000 | | | | 5.000 | | | | 07/01/41 | | | | 219,612 | |
| Puerto Rico Commonwealth GO Bonds Series 2007 A (BB/B2) | |
| | 285,000 | | | | 5.250 | | | | 07/01/37 | | | | 214,471 | |
| Puerto Rico Commonwealth GO Bonds Series 2014 A (BB/B2) | |
| | 14,310,000 | | | | 8.000 | | | | 07/01/35 | | | | 12,593,086 | |
| Puerto Rico Commonwealth GO Bonds Unrefunded Balance for
Public Improvement Series 2001 A (BB/B2) |
|
| | 80,000 | | | | 5.125 | | | | 07/01/31 | | | | 59,846 | |
| Puerto Rico Commonwealth GO Bonds Unrefunded Balance for
Public Improvement Series 2004 A (BB/B2) |
|
| | 20,000 | | | | 5.000 | | | | 07/01/34 | | | | 15,054 | |
| Puerto Rico Commonwealth GO Bonds Unrefunded Balance for
Public Improvement Series 2006 A (BB/B2) |
|
| | 30,000 | | | | 5.250 | | | | 07/01/27 | | | | 23,158 | |
| Puerto Rico Sales Tax Financing Corp. Sales Tax RB Capital
Appreciation Series 2010 A (BBB-/B1)(b) |
|
| | 85,000 | | | | 0.000 | | | | 08/01/35 | | | | 14,367 | |
| Puerto Rico Sales Tax Financing Corp. Sales Tax RB Capital
Appreciation SubSeries 2010 C (BBB-/B1)(b) |
|
| | 215,000 | | | | 0.000 | | | | 08/01/37 | | | | 31,798 | |
| | 175,000 | | | | 0.000 | | | | 08/01/38 | | | | 24,467 | |
| | |
| | Municipal Debt Obligations – (continued) | |
| | Puerto Rico – (continued) | |
| Puerto Rico Sales Tax Financing Corp. Sales Tax RB
Series 2011 C (BBB/Ba3) |
|
| $ | 45,000 | | | | 5.250 | % | | | 08/01/40 | | | $ | 38,348 | |
| Puerto Rico Sales Tax Financing Corp. Sales Tax RB
SubSeries 2009 A (BBB-/B1) |
|
| | 90,000 | | | | 5.250 | | | | 08/01/27 | | | | 74,923 | |
| | 1,690,000 | | | | 0.000 | (e) | | | 08/01/32 | | | | 1,329,760 | |
| | 900,000 | | | | 5.750 | | | | 08/01/37 | | | | 734,877 | |
| | 160,000 | | | | 6.375 | | | | 08/01/39 | | | | 134,510 | |
| | 2,070,000 | | | | 6.000 | | | | 08/01/42 | | | | 1,660,616 | |
| | 15,000 | | | | 6.500 | | | | 08/01/44 | | | | 12,693 | |
| Puerto Rico Sales Tax Financing Corp. Sales Tax RB
SubSeries 2010 A (BBB-/B1) |
|
| | 475,000 | | | | 0.000 | (e) | | | 08/01/33 | | | | 277,832 | |
| | 840,000 | | | | 5.500 | | | | 08/01/37 | | | | 658,384 | |
| | 710,000 | | | | 5.375 | | | | 08/01/39 | | | | 541,737 | |
| | 1,830,000 | | | | 5.500 | | | | 08/01/42 | | | | 1,397,791 | |
| Puerto Rico Sales Tax Financing Corp. Sales Tax RB
SubSeries 2010 C (BBB-/B1) |
|
| | 240,000 | | | | 5.375 | | | | 08/01/38 | | | | 186,146 | |
| | 160,000 | | | | 6.000 | | | | 08/01/39 | | | | 130,973 | |
| | 1,760,000 | | | | 5.250 | | | | 08/01/41 | | | | 1,298,669 | |
| Puerto Rico Sales Tax Financing Corp. Sales Tax RB
SubSeries 2011 A-1 (BBB-/B1) |
|
| | 330,000 | | | | 5.000 | | | | 08/01/43 | | | | 236,415 | |
| | 155,000 | | | | 5.250 | | | | 08/01/43 | | | | 113,482 | |
| Puerto Rico Sales Tax Financing Corp. Sales Tax RB Unrefunded
SubSeries 2009 A (BBB-/B1) |
|
| | 1,200,000 | | | | 5.500 | | | | 08/01/28 | | | | 1,013,760 | |
| | 140,000 | | | | 6.125 | | | | 08/01/29 | | | | 119,039 | |
| | |
| | TOTAL MUNICIPAL DEBT OBLIGATIONS | |
| | (Cost $25,419,392) | | | $ | 25,385,335 | |
| | |
| | | | | | | | | | | | | | |
| | U.S. Treasury Obligation(f) – 0.4% | |
| United States Treasury Note | |
| $ | 7,900,000 | | | | 2.375 | % | | | 08/15/24 | | | $ | 7,808,044 | |
| | (Cost $7,889,006) | | | | | | | | | |
| | |
| TOTAL INVESTMENTS BEFORE SHORT-TERM
INVESTMENT |
|
| | (Cost $1,857,496,755) | | | $ | 1,691,879,018 | |
| | |
| | | | | | | | | | | | | | |
| | Short-term Investment(g) – 7.1% | |
| | Repurchase Agreement – 7.1% | |
| Joint Repurchase Agreement Account II | |
| $ | 135,300,000 | | | | 0.012 | % | | | 10/01/14 | | | $ | 135,300,000 | |
| | (Cost $135,300,000) | |
| | |
| | TOTAL INVESTMENTS – 95.4% | |
| | (Cost $1,992,796,755) | | | $ | 1,827,179,018 | |
| | |
| OTHER ASSETS IN EXCESS OF
LIABILITIES – 4.6% |
| | | 87,838,472 | |
| | |
| | NET ASSETS – 100.0% | | | $ | 1,915,017,490 | |
| | |
| | |
| The accompanying notes are an integral part of these financial statements. | | 103 |
GOLDMAN SACHS LOCAL EMERGING MARKETS DEBT FUND
Schedule of Investments (continued)
September 30, 2014 (Unaudited)
| | |
| The percentage shown for each investment category reflects the value of investments in that category as a percentage of net assets. |
(a) | | Variable rate security. Interest rate or distribution rate disclosed is that which is in effect at September 30, 2014. |
(b) | | Issued with a zero coupon. Income is recognized through the accretion of discount. |
(c) | | Exempt from registration under Rule 144A of the Securities Act of 1933. Under procedures approved by the Board of Trustees, such securities have been determined to be liquid by the investment adviser and may be resold, normally to qualified institutional buyers in transactions exempt from registration. Total market value of Rule 144A securities amounts to $234,332,427, which represents approximately 12.1% of net assets as of September 30, 2014. |
(d) | | Security with “Call” features with resetting interest rates. Maturity dates disclosed are the final maturity dates. |
(e) | | Coupon changes periodically based upon a predetermined schedule. Interest rate disclosed is that which is in effect at September 30, 2014. |
(f) | | All or a portion of security is segregated as collateral for initial margin requirements on futures transactions. |
(g) | | Joint repurchase agreement was entered into on September 30, 2014. Additional information appears on page 123. |
Security ratings disclosed, if any, are obtained from Standard & Poor’s/Moody’s Investor Service. A brief description of the ratings is available in the Fund’s Statement of Additional Information.
| | |
|
Currency Abbreviations: |
AUD | | —Australian Dollar |
BRL | | —Brazilian Real |
CLP | | —Chilean Peso |
CNH | | —Chinese Yuan Renminbi Offshore |
COP | | —Colombian Peso |
CRC | | —Costa Rican Colon |
DOP | | —Dominican Peso |
EUR | | —Euro |
HUF | | —Hungarian Forint |
IDR | | —Indonesian Rupiah |
ILS | | —Israeli Shekel |
INR | | —Indian Rupee |
JPY | | —Japanese Yen |
KRW | | —South Korean Won |
MXN | | —Mexican Peso |
MYR | | —Malaysian Ringgit |
NGN | | —Nigerian Naira |
PEN | | —Peruvian Nuevo Sol |
PHP | | —Philippine Peso |
PLN | | —Polish Zloty |
RON | | —New Romanian Leu |
RUB | | —Russian Ruble |
SGD | | —Singapore Dollar |
THB | | —Thai Baht |
TRY | | —Turkish Lira |
TWD | | —Taiwan Dollar |
USD | | —U.S. Dollar |
ZAR | | —South African Rand |
ZMW | | —Zambian Kwacha |
|
Investment Abbreviations: |
CLICP | | —Sinacofi Chile Interbank Rate |
FHLB | | —Federal Home Loan Bank |
GO | | —General Obligation |
JIBAR | | —Johannesburg Interbank Agreed Rate |
KWCDC | | —South Korean Won Certificate of Deposit |
LIBOR | | —London Interbank Offered Rate |
RB | | —Revenue Bond |
TIIE | | —La Tasa de Interbank Equilibrium Interest Rate |
|
| | |
| 104 | | The accompanying notes are an integral part of these financial statements. |
GOLDMAN SACHS LOCAL EMERGING MARKETS DEBT FUND
|
| ADDITIONAL INVESTMENT INFORMATION |
FORWARD FOREIGN CURRENCY EXCHANGE CONTRACTS — At September 30, 2014, the Fund had the following forward foreign currency exchange contracts:
FORWARD FOREIGN CURRENCY EXCHANGE CONTRACTS WITH UNREALIZED GAIN
| | | | | | | | | | | | | | |
| Counterparty | | Contracts to
Buy/Sell | | Settlement
Date | | | Current
Value | | | Unrealized
Gain | |
Bank of America Securities LLC | | USD/EUR | | | 12/17/14 | | | $ | 81,819,643 | | | $ | 2,690,172 | |
| | USD/JPY | | | 12/17/14 | | | | 4,059,218 | | | | 92,782 | |
| | USD/MYR | | | 10/03/14 | | | | 5,860,560 | | | | 77,840 | |
Barclays Bank PLC | | USD/AUD | | | 12/17/14 | | | | 4,623,234 | | | | 189,893 | |
| | USD/ILS | | | 12/17/14 | | | | 8,935,280 | | | | 619,671 | |
| | USD/INR | | | 10/07/14 | | | | 16,484,514 | | | | 260,486 | |
| | USD/INR | | | 10/27/14 | | | | 8,027,744 | | | | 128,256 | |
| | USD/KRW | | | 10/27/14 | | | | 12,069,584 | | | | 116,416 | |
| | USD/MYR | | | 10/03/14 | | | | 26,776,799 | | | | 174,607 | |
| | ZAR/USD | | | 12/17/14 | | | | 5,513,266 | | | | 7,266 | |
BNP Paribas SA | | EUR/PLN | | | 12/17/14 | | | | 8,039,693 | | | | 16,780 | |
| | EUR/USD | | | 12/17/14 | | | | 7,981,911 | | | | 1,089 | |
| | MXN/USD | | | 12/17/14 | | | | 10,823,802 | | | | 54,339 | |
| | USD/AUD | | | 12/17/14 | | | | 15,903,575 | | | | 426,192 | |
| | USD/BRL | | | 10/22/14 | | | | 8,000,277 | | | | 233,723 | |
| | USD/COP | | | 10/24/14 | | | | 4,790,343 | | | | 213,153 | |
| | USD/MYR | | | 10/20/14 | | | | 8,115,278 | | | | 130,722 | |
| | USD/RUB | | | 10/02/14 | | | | 4,895,428 | | | | 302,572 | |
| | USD/RUB | | | 10/27/14 | | | | 15,976,136 | | | | 271,864 | |
| | USD/TRY | | | 12/17/14 | | | | 24,123,382 | | | | 1,177,104 | |
Citibank NA (London) | | PHP/USD | | | 10/20/14 | | | | 3,987,813 | | | | 813 | |
| | USD/ILS | | | 05/06/15 | | | | 8,637,599 | | | | 392,025 | |
| | USD/INR | | | 10/14/14 | | | | 16,584,397 | | | | 290,603 | |
| | USD/PHP | | | 10/14/14 | | | | 4,071,682 | | | | 96,318 | |
| | USD/SGD | | | 12/17/14 | | | | 13,309,606 | | | | 222,918 | |
| | USD/TRY | | | 12/17/14 | | | | 8,180,178 | | | | 272,822 | |
| | USD/TWD | | | 10/17/14 | | | | 16,320,150 | | | | 171,850 | |
| | USD/TWD | | | 10/20/14 | | | | 16,273,611 | | | | 144,389 | |
Credit Suisse International (London) | | COP/USD | | | 11/04/14 | | | | 14,224,752 | | | | 12,420 | |
| | USD/COP | | | 10/24/14 | | | | 4,435,977 | | | | 393,134 | |
| | USD/RUB | | | 10/02/14 | | | | 8,011,642 | | | | 421,358 | |
| | USD/TRY | | | 12/17/14 | | | | 4,520,854 | | | | 107,607 | |
Deutsche Bank AG (London) | | MXN/USD | | | 12/17/14 | | | | 10,089,465 | | | | 66,680 | |
| | RUB/USD | | | 11/17/14 | | | | 6,405,833 | | | | 11,212 | |
| | USD/CNH | | | 12/17/14 | | | | 44,143,861 | | | | 200,654 | |
| | USD/EUR | | | 12/17/14 | | | | 4,051,616 | | | | 101,052 | |
| | USD/IDR | | | 10/31/14 | | | | 11,493,567 | | | | 454,471 | |
| | USD/INR | | | 10/07/14 | | | | 3,024,388 | | | | 14,420 | |
| | USD/KRW | | | 10/14/14 | | | | 16,528,358 | | | | 346,642 | |
| | USD/MXN | | | 12/17/14 | | | | 16,249,255 | | | | 217,745 | |
| | USD/MYR | | | 10/07/14 | | | | 28,926,563 | | | | 721,620 | |
| | USD/PHP | | | 10/14/14 | | | | 4,072,486 | | | | 95,514 | |
| | USD/PHP | | | 10/20/14 | | | | 8,094,978 | | | | 114,022 | |
| | USD/PLN | | | 12/17/14 | | | | 8,667,237 | | | | 191,706 | |
| | USD/RUB | | | 10/02/14 | | | | 6,460,755 | | | | 473 | |
| | USD/RUB | | | 10/17/14 | | | | 1,531,948 | | | | 1,774 | |
| | USD/RUB | | | 11/17/14 | | | | 6,612,060 | | | | 470,765 | |
| | USD/TRY | | | 12/17/14 | | | | 7,951,615 | | | | 128 | |
| | USD/TWD | | | 10/20/14 | | | | 1,028,920 | | | | 7,205 | |
| | USD/ZAR | | | 12/17/14 | | | | 4,675,039 | | | | 224,245 | |
| | |
| The accompanying notes are an integral part of these financial statements. | | 105 |
GOLDMAN SACHS LOCAL EMERGING MARKETS DEBT FUND
Schedule of Investments (continued)
September 30, 2014 (Unaudited)
|
| ADDITIONAL INVESTMENT INFORMATION (continued) |
FORWARD FOREIGN CURRENCY EXCHANGE CONTRACTS WITH UNREALIZED GAIN (continued)
| | | | | | | | | | | | | | |
| Counterparty | | Contracts to
Buy/Sell | | Settlement
Date | | | Current
Value | | | Unrealized
Gain | |
HSBC Bank PLC | | TRY/USD | | | 12/17/14 | | | $ | 4,751,544 | | | $ | 4,544 | |
| | TWD/USD | | | 10/20/14 | | | | 8,074,040 | | | | 5,040 | |
| | USD/BRL | | | 10/27/14 | | | | 34,745,138 | | | | 546,299 | |
| | USD/CNH | | | 12/17/14 | | | | 32,239,839 | | | | 34,161 | |
| | USD/JPY | | | 12/17/14 | | | | 4,016,021 | | | | 87,979 | |
| | USD/KRW | | | 10/22/14 | | | | 2,428,709 | | | | 30,787 | |
| | USD/KRW | | | 10/23/14 | | | | 5,661,641 | | | | 73,359 | |
| | USD/RUB | | | 10/24/14 | | | | 3,329,263 | | | | 86,520 | |
| | USD/RUB | | | 11/17/14 | | | | 12,621,916 | | | | 1,049,889 | |
| | USD/SGD | | | 12/17/14 | | | | 19,177,477 | | | | 360,360 | |
| | USD/TRY | | | 12/17/14 | | | | 25,697,789 | | | | 1,296,600 | |
| | USD/ZAR | | | 12/17/14 | | | | 5,032,264 | | | | 262,438 | |
JPMorgan Chase Bank (London) | | MXN/USD | | | 12/17/14 | | | | 8,095,670 | | | | 26,670 | |
| | USD/EUR | | | 12/17/14 | | | | 4,056,671 | | | | 33,928 | |
| | USD/IDR | | | 10/31/14 | | | | 7,742,519 | | | | 206,099 | |
| | USD/INR | | | 10/29/14 | | | | 12,118,398 | | | | 146,602 | |
| | USD/JPY | | | 12/17/14 | | | | 15,450,540 | | | | 696,295 | |
| | USD/MXN | | | 12/17/14 | | | | 41,997,952 | | | | 732,248 | |
| | USD/RUB | | | 10/20/14 | | | | 4,006,529 | | | | 110,471 | |
| | USD/RUB | | | 11/17/14 | | | | 6,474,429 | | | | 413,861 | |
| | USD/TRY | | | 12/17/14 | | | | 16,250,729 | | | | 656,271 | |
Merrill Lynch International Bank Ltd. | | COP/USD | | | 10/31/14 | | | | 6,657,816 | | | | 17,840 | |
| | USD/RUB | | | 10/24/14 | | | | 2,283,020 | | | | 290,351 | |
Morgan Stanley & Co. International PLC | | BRL/USD | | | 11/03/14 | | | | 14,818,631 | | | | 8,631 | |
| | TWD/USD | | | 10/17/14 | | | | 15,958,469 | | | | 8,469 | |
| | USD/AUD | | | 12/17/14 | | | | 1,456,183 | | | | 50,066 | |
| | USD/ILS | | | 12/17/14 | | | | 14,510,699 | | | | 890,144 | |
| | USD/PHP | | | 10/31/14 | | | | 1,161,669 | | | | 44,082 | |
| | USD/RUB | | | 10/24/14 | | | | 1,086,384 | | | | 114,925 | |
| | USD/TRY | | | 12/17/14 | | | | 23,734,963 | | | | 1,184,037 | |
Royal Bank of Canada | | USD/AUD | | | 12/17/14 | | | | 8,099,801 | | | | 29,905 | |
| | USD/CLP | | | 10/24/14 | | | | 9,476,140 | | | | 671,269 | |
| | USD/JPY | | | 12/17/14 | | | | 2,042,931 | | | | 15,569 | |
Royal Bank of Scotland PLC | | USD/EUR | | | 12/17/14 | | | | 4,050,352 | | | | 102,799 | |
| | USD/JPY | | | 12/17/14 | | | | 2,783,992 | | | | 12,128 | |
| | USD/TRY | | | 12/17/14 | | | | 16,099,405 | | | | 367,595 | |
Standard Chartered Bank | | NGN/USD | | | 12/08/14 | | | | 3,480,301 | | | | 60,038 | |
| | NGN/USD | | | 12/16/14 | | | | 8,198,875 | | | | 4,056 | |
| | USD/AUD | | | 12/17/14 | | | | 3,885,477 | | | | 158,177 | |
| | USD/CNH | | | 12/17/14 | | | | 32,876,946 | | | | 107,054 | |
| | USD/COP | | | 10/24/14 | | | | 43,620,419 | | | | 3,597,300 | |
| | USD/EUR | | | 12/17/14 | | | | 4,022,550 | | | | 110,066 | |
| | USD/IDR | | | 10/31/14 | | | | 8,680,284 | | | | 363,054 | |
| | USD/TRY | | | 12/17/14 | | | | 23,515,920 | | | | 1,206,643 | |
State Street Bank and Trust | | AUD/USD | | | 12/17/14 | | | | 3,984,600 | | | | 18,971 | |
| | USD/JPY | | | 12/17/14 | | | | 12,033,412 | | | | 281,588 | |
UBS AG (London) | | USD/BRL | | | 10/14/14 | | | | 16,180,852 | | | | 173,148 | |
| | USD/ILS | | | 05/06/15 | | | | 9,505,366 | | | | 550,267 | |
Westpac Banking Corp. | | AUD/USD | | | 12/17/14 | | | | 8,044,949 | | | | 20,416 | |
| | USD/AUD | | | 12/17/14 | | | | 5,261,303 | | | | 203,974 | |
| | USD/EUR | | | 12/17/14 | | | | 116,364,678 | | | | 2,756,041 | |
| | USD/MYR | | | 10/20/14 | | | | 8,028,563 | | | | 156,828 | |
| | | USD/SGD | | | 12/17/14 | | | | 16,737,446 | | | | 315,804 | |
| TOTAL | | | | | | | | | | | | $ | 33,703,168 | |
| | |
| 106 | | The accompanying notes are an integral part of these financial statements. |
GOLDMAN SACHS LOCAL EMERGING MARKETS DEBT FUND
|
| ADDITIONAL INVESTMENT INFORMATION (continued) |
FORWARD FOREIGN CURRENCY EXCHANGE CONTRACTS WITH UNREALIZED LOSS
| | | | | | | | | | | | | | |
| Counterparty | | Contracts to
Buy/Sell | | Settlement
Date | | | Current
Value | | | Unrealized
Loss | |
Bank of America Securities LLC | | EUR/USD | | | 12/17/14 | | | $ | 20,120,330 | | | $ | (356,710 | ) |
| | HUF/USD | | | 12/17/14 | | | | 8,004,109 | | | | (151,891 | ) |
Barclays Bank PLC | | EUR/PLN | | | 12/17/14 | | | | 16,655,868 | | | | (115,771 | ) |
| | EUR/USD | | | 12/17/14 | | | | 4,033,923 | | | | (93,911 | ) |
| | ILS/USD | | | 12/17/14 | | | | 3,927,329 | | | | (119,033 | ) |
| | INR/USD | | | 10/07/14 | | | | 11,255,648 | | | | (125,737 | ) |
| | INR/USD | | | 10/27/14 | | | | 10,552,898 | | | | (191,102 | ) |
| | JPY/USD | | | 12/17/14 | | | | 4,050,713 | | | | (168,287 | ) |
| | MYR/USD | | | 10/07/14 | | | | 19,868,452 | | | | (571,514 | ) |
| | MYR/USD | | | 10/20/14 | | | | 6,445,411 | | | | (9,589 | ) |
| | MYR/USD | | | 10/29/14 | | | | 28,069,456 | | | | (125,020 | ) |
| | MYR/USD | | | 10/31/14 | | | | 41,990,596 | | | | (1,262,465 | ) |
| | PLN/USD | | | 12/17/14 | | | | 25,611,797 | | | | (841,630 | ) |
| | TWD/USD | | | 10/27/14 | | | | 8,102,974 | | | | (54,026 | ) |
BNP Paribas SA | | AUD/USD | | | 12/17/14 | | | | 3,982,424 | | | | (66,714 | ) |
| | BRL/USD | | | 10/24/14 | | | | 1,315,394 | | | | (105,606 | ) |
| | EUR/USD | | | 12/17/14 | | | | 2,707,138 | | | | (62,142 | ) |
| | HUF/USD | | | 12/17/14 | | | | 14,072,519 | | | | (356,857 | ) |
| | ILS/USD | | | 12/17/14 | | | | 12,218,768 | | | | (158,232 | ) |
| | INR/USD | | | 10/14/14 | | | | 4,109,036 | | | | (55,906 | ) |
| | PLN/USD | | | 12/17/14 | | | | 25,819,794 | | | | (595,600 | ) |
| | USD/PLN | | | 12/17/14 | | | | 4,748,814 | | | | (1,814 | ) |
Citibank NA (London) | | AUD/USD | | | 12/17/14 | | | | 3,996,354 | | | | (59,462 | ) |
| | ILS/USD | | | 12/17/14 | | | | 7,413,434 | | | | (186,566 | ) |
| | MXN/USD | | | 12/17/14 | | | | 22,777,449 | | | | (307,526 | ) |
| | MYR/USD | | | 10/03/14 | | | | 29,493,105 | | | | (708,911 | ) |
| | PHP/USD | | | 10/29/14 | | | | 4,046,464 | | | | (15,536 | ) |
Credit Suisse International (London) | | COP/USD | | | 10/03/14 | | | | 14,264,115 | | | | (737,053 | ) |
| | COP/USD | | | 11/04/14 | | | | 2,650,115 | | | | (7,885 | ) |
| | PEN/USD | | | 11/18/14 | | | | 4,741,941 | | | | (157,740 | ) |
| | RUB/USD | | | 10/02/14 | | | | 7,853,268 | | | | (519,732 | ) |
| | RUB/USD | | | 10/24/14 | | | | 5,465,111 | | | | (150,550 | ) |
| | RUB/USD | | | 10/27/14 | | | | 15,848,724 | | | | (465,276 | ) |
| | USD/COP | | | 10/03/14 | | | | 14,264,115 | | | | (10,415 | ) |
| | USD/RUB | | | 10/24/14 | | | | 2,473,358 | | | | (5,358 | ) |
Deutsche Bank AG (London) | | AUD/USD | | | 12/17/14 | | | | 7,850,790 | | | | (306,619 | ) |
| | BRL/USD | | | 10/24/14 | | | | 7,988,682 | | | | (662,225 | ) |
| | EUR/USD | | | 12/17/14 | | | | 24,635,746 | | | | (498,553 | ) |
| | HUF/USD | | | 12/17/14 | | | | 6,440,332 | | | | (106,916 | ) |
| | IDR/USD | | | 10/31/14 | | | | 7,545,904 | | | | (355,667 | ) |
| | IDR/USD | | | 11/03/14 | | | | 7,962,041 | | | | (12,959 | ) |
| | INR/USD | | | 10/29/14 | | | | 3,005,511 | | | | (21,991 | ) |
| | KRW/USD | | | 10/31/14 | | | | 3,021,151 | | | | (81,847 | ) |
| | MYR/USD | | | 10/31/14 | | | | 1,915,977 | | | | (74,552 | ) |
| | PHP/USD | | | 10/20/14 | | | | 8,063,645 | | | | (5,355 | ) |
| | PLN/USD | | | 12/17/14 | | | | 25,569,256 | | | | (748,786 | ) |
| | RUB/USD | | | 10/02/14 | | | | 11,514,557 | | | | (604,460 | ) |
| | THB/USD | | | 10/31/14 | | | | 38,828,386 | | | | (180,527 | ) |
| | TRY/USD | | | 12/17/14 | | | | 9,126,409 | | | | (172,869 | ) |
| | USD/THB | | | 11/03/14 | | | | 1,901,967 | | | | (2,967 | ) |
HSBC Bank PLC | | EUR/USD | | | 12/17/14 | | | | 12,094,188 | | | | (194,745 | ) |
| | HUF/USD | | | 12/17/14 | | | | 5,194,761 | | | | (161,600 | ) |
| | INR/USD | | | 10/27/14 | | | | 10,992,979 | | | | (169,854 | ) |
| | |
| The accompanying notes are an integral part of these financial statements. | | 107 |
GOLDMAN SACHS LOCAL EMERGING MARKETS DEBT FUND
Schedule of Investments (continued)
September 30, 2014 (Unaudited)
|
| ADDITIONAL INVESTMENT INFORMATION (continued) |
FORWARD FOREIGN CURRENCY EXCHANGE CONTRACTS WITH UNREALIZED LOSS (continued)
| | | | | | | | | | | | | | |
| Counterparty | | Contracts to
Buy/Sell | | Settlement
Date | | | Current
Value | | | Unrealized
Loss | |
HSBC Bank PLC (continued) | | MXN/USD | | | 12/17/14 | | | $ | 23,309,084 | | | $ | (297,026 | ) |
| | RON/USD | | | 12/17/14 | | | | 8,525,270 | | | | (180,407 | ) |
| | RUB/USD | | | 10/17/14 | | | | 3,985,470 | | | | (118,530 | ) |
| | RUB/USD | | | 10/24/14 | | | | 2,843,452 | | | | (81,679 | ) |
| | SGD/USD | | | 12/17/14 | | | | 16,178,704 | | | | (135,296 | ) |
| | TRY/USD | | | 12/17/14 | | | | 12,721,732 | | | | (361,933 | ) |
JPMorgan Chase Bank (London) | | JPY/USD | | | 12/17/14 | | | | 16,032,377 | | | | (385,623 | ) |
| | MXN/USD | | | 12/17/14 | | | | 6,468,707 | | | | (103,369 | ) |
| | MYR/USD | | | 10/03/14 | | | | 3,144,254 | | | | (68,458 | ) |
| | MYR/USD | | | 10/20/14 | | | | 4,019,724 | | | | (14,276 | ) |
| | PHP/USD | | | 10/31/14 | | | | 2,324,547 | | | | (7,515 | ) |
| | RUB/USD | | | 11/17/14 | | | | 18,067,490 | | | | (741,613 | ) |
| | TRY/USD | | | 12/17/14 | | | | 7,985,699 | | | | (170,301 | ) |
| | USD/MXN | | | 12/17/14 | | | | 24,423,918 | | | | (52,918 | ) |
| | USD/MYR | | | 11/03/14 | | | | 4,747,952 | | | | (952 | ) |
Merrill Lynch International Bank Ltd. | | COP/USD | | | 10/02/14 | | | | 6,673,924 | | | | (282,843 | ) |
| | HUF/USD | | | 12/17/14 | | | | 7,503,899 | | | | (62,759 | ) |
| | USD/COP | | | 10/02/14 | | | | 6,673,924 | | | | (12,022 | ) |
Morgan Stanley & Co. International PLC | | AUD/USD | | | 12/17/14 | | | | 3,985,036 | | | | (141,290 | ) |
| | BRL/USD | | | 10/27/14 | | | | 7,982,269 | | | | (173,731 | ) |
| | EUR/HUF | | | 12/17/14 | | | | 4,229,992 | | | | (79,803 | ) |
| | EUR/USD | | | 12/17/14 | | | | 24,103,071 | | | | (126,347 | ) |
| | INR/USD | | | 10/27/14 | | | | 11,073,872 | | | | (179,366 | ) |
| | KRW/USD | | | 10/27/14 | | | | 8,000,069 | | | | (156,931 | ) |
Royal Bank of Canada | | EUR/USD | | | 12/17/14 | | | | 8,306,697 | | | | (156,238 | ) |
| | JPY/USD | | | 12/17/14 | | | | 8,060,595 | | | | (377,405 | ) |
| | MXN/USD | | | 12/17/14 | | | | 52,228,075 | | | | (1,037,264 | ) |
| | PEN/USD | | | 10/24/14 | | | | 6,113,644 | | | | (195,741 | ) |
Royal Bank of Scotland PLC | | TRY/USD | | | 12/17/14 | | | | 39,872,096 | | | | (1,275,410 | ) |
| | USD/TRY | | | 12/17/14 | | | | 8,098,406 | | | | (29,406 | ) |
Standard Chartered Bank | | CNH/USD | | | 12/17/14 | | | | 34,746,206 | | | | (190,144 | ) |
| | COP/USD | | | 10/24/14 | | | | 17,981,850 | | | | (743,943 | ) |
| | INR/USD | | | 10/14/14 | | | | 23,285,868 | | | | (257,171 | ) |
| | JPY/USD | | | 12/17/14 | | | | 12,242,428 | | | | (437,572 | ) |
| | KRW/USD | | | 10/14/14 | | | | 7,970,298 | | | | (4,702 | ) |
| | MXN/USD | | | 12/17/14 | | | | 32,499,498 | | | | (738,600 | ) |
| | PEN/USD | | | 10/31/14 | | | | 5,870,988 | | | | (19,452 | ) |
| | PLN/USD | | | 12/17/14 | | | | 24,218,348 | | | | (767,883 | ) |
| | TRY/USD | | | 12/17/14 | | | | 6,323,461 | | | | (317,552 | ) |
State Street Bank and Trust | | AUD/USD | | | 12/17/14 | | | | 3,986,777 | | | | (86,427 | ) |
| | EUR/USD | | | 12/17/14 | | | | 8,262,466 | | | | (180,773 | ) |
UBS AG (London) | | BRL/USD | | | 10/14/14 | | | | 15,628,514 | | | | (1,007,486 | ) |
| | EUR/USD | | | 12/17/14 | | | | 3,874,534 | | | | (77,888 | ) |
| | INR/USD | | | 10/07/14 | | | | 8,253,254 | | | | (135,374 | ) |
| | PLN/USD | | | 12/17/14 | | | | 27,558,825 | | | | (568,175 | ) |
| | RUB/USD | | | 11/17/14 | | | | 17,594,065 | | | | (917,086 | ) |
| | ZAR/USD | | | 12/17/14 | | | | 73,986,457 | | | | (3,880,688 | ) |
Westpac Banking Corp. | | AUD/USD | | | 12/17/14 | | | | 7,311,849 | | | | (77,635 | ) |
| | EUR/USD | | | 12/17/14 | | | | 3,460,116 | | | | (56,729 | ) |
| | INR/USD | | | 10/14/14 | | | | 13,872,574 | | | | (191,046 | ) |
| | KRW/USD | | | 10/31/14 | | | | 1,726,290 | | | | (25,710 | ) |
| | | MYR/USD | | | 10/31/14 | | | | 3,395,861 | | | | (116,501 | ) |
| TOTAL | | | | | | | | | | | | $ | (31,089,048 | ) |
| | |
| 108 | | The accompanying notes are an integral part of these financial statements. |
GOLDMAN SACHS LOCAL EMERGING MARKETS DEBT FUND
|
| ADDITIONAL INVESTMENT INFORMATION (continued) |
FUTURES CONTRACTS — At September 30, 2014, the Fund had the following futures contracts:
| | | | | | | | | | | | | | |
| Type | | Number of
Contracts
Long (Short) | | | Expiration
Date | | Current
Value | | | Unrealized
Gain (Loss) | |
Eurodollars | | | (1,464 | ) | | March 2017 | | $ | (357,124,500 | ) | | $ | 466,239 | |
Eurodollars | | | (981 | ) | | June 2017 | | | (238,836,712 | ) | | | 346,907 | |
Eurodollars | | | (754 | ) | | September 2017 | | | (183,287,975 | ) | | | 392,715 | |
Ultra Long U.S. Treasury Bonds | | | (307 | ) | | December 2014 | | | (46,817,500 | ) | | | 657,630 | |
10 Year German Euro-Bund | | | (37 | ) | | December 2014 | | | (6,995,910 | ) | | | (25,299 | ) |
2 Year U.S. Treasury Notes | | | 2,376 | | | December 2014 | | | 519,972,750 | | | | (94,799 | ) |
5 Year U.S. Treasury Notes | | | (1,393 | ) | | December 2014 | | | (164,733,134 | ) | | | 542,507 | |
10 Year U.S. Treasury Notes | | | (1,153 | ) | | December 2014 | | | (143,710,641 | ) | | | 867,446 | |
20 Year U.S. Treasury Bonds | | | 609 | | | December 2014 | | | 83,984,906 | | | | (1,124,768 | ) |
| TOTAL | | | | | | | | | | | | $ | 2,028,578 | |
SWAP CONTRACTS — At September 30, 2014, the Fund had the following swap contracts:
OVER THE COUNTER INTEREST RATE SWAP CONTRACTS
| | | | | | | | | | | | | | | | | | | | | | | | |
| | | | | | | | | | | | Rates Exchanged | | Market Value | |
| Counterparty | | Notional
Amount
(000s) | | | Termination
Date | | | Payments
Received | | Payments
Made | | Upfront
Payments
Made (Received) | | | Unrealized
Gain (Loss) | |
Bank of America Securities LLC | | | BRL | | | | 52,790 | | | | 01/02/17 | | | 11.890% | | 1 month Brazilian
Interbank Deposit
Average | | $ | — | | | $ | (83,122 | ) |
| | | | | | | 80,730 | | | | 01/02/17 | | | 11.730 | | 1 month Brazilian
Interbank Deposit
Average | | | — | | | | (183,298 | ) |
| | | CLP | | | | 4,338,450 | | | | 07/31/19 | | | 6 month CLICP | | 4.030% | | | — | | | | 42,787 | |
| | | KRW | | | | 48,420,000 | (a) | | | 08/10/22 | | | 3 month KWCDC | | 3.120 | | | — | | | | (653,891 | ) |
| | | CLP | | | | 2,809,080 | | | | 06/07/23 | | | 6 month CLICP | | 5.360 | | | — | | | | (208,004 | ) |
| | | KRW | | | | 2,088,990 | | | | 01/16/24 | | | 3 month KWCDC | | 3.445 | | | — | | | | (130,058 | ) |
| | | MXN | | | | 435,070 | (a) | | | 04/22/27 | | | 9.300 | | Mexico Interbank
TIIE 28 Days | | | — | | | | 1,161,833 | |
| | | | | | | 158,630 | (a) | | | 09/03/27 | | | 8.590 | | Mexico Interbank
TIIE 28 Days | | | — | | | | 150,591 | |
Barclays Bank PLC | | | KRW | | | | 26,091,240 | (a) | | | 09/18/22 | | | 3 month KWCDC | | 3.300 | | | — | | | | (531,341 | ) |
| | | | | | | 30,000,000 | (a) | | | 10/09/22 | | | 3 month KWCDC | | 3.120 | | | — | | | | (378,118 | ) |
| | | | | | | 6,345,000 | (a) | | | 11/21/22 | | | 3 month KWCDC | | 3.150 | | | — | | | | (84,892 | ) |
| | | | | | | 19,698,730 | (a) | | | 11/29/22 | | | 3 month KWCDC | | 3.225 | | | — | | | | (326,550 | ) |
| | | | | | | 37,196,850 | (a) | | | 11/29/22 | | | 3 month KWCDC | | 3.230 | | | — | | | | (616,620 | ) |
| | | | | | | 26,791,540 | (a) | | | 12/05/22 | | | 3 month KWCDC | | 3.275 | | | — | | | | (497,245 | ) |
| | | MXN | | | | 55,780 | | | | 05/12/23 | | | 5.615 | | Mexico Interbank
TIIE 28 Days | | | — | | | | (172,427 | ) |
| | | | | | | 703,500 | (a) | | | 06/29/27 | | | 8.010 | | Mexico Interbank
TIIE 28 Days | | | — | | | | (162,653 | ) |
| | | | | | | 301,660 | (a) | | | 07/30/27 | | | 8.650 | | Mexico Interbank
TIIE 28 Days | | | — | | | | 338,035 | |
| | | KRW | | | | 6,115,600 | | | | 01/24/28 | | | 3 month KWCDC | | 3.000 | | | 23 | | | | (132,856 | ) |
Citibank NA | | | BRL | | | | 17,370 | | | | 01/04/16 | | | 11.190 | | 1 month Brazilian
Interbank Deposit
Average | | | — | | | | (50,480 | ) |
| | |
| The accompanying notes are an integral part of these financial statements. | | 109 |
GOLDMAN SACHS LOCAL EMERGING MARKETS DEBT FUND
Schedule of Investments (continued)
September 30, 2014 (Unaudited)
|
| ADDITIONAL INVESTMENT INFORMATION (continued) |
OVER THE COUNTER INTEREST RATE SWAP CONTRACTS (continued)
| | | | | | | | | | | | | | | | | | | | | | | | |
| | | | | | | | | | | | Rates Exchanged | | Market Value | |
| Counterparty | | Notional
Amount
(000s) | | | Termination
Date | | | Payments
Received | | Payments
Made | | Upfront
Payments
Made (Received) | | | Unrealized
Gain (Loss) | |
Citibank NA (continued) | | | BRL | | | | 52,500 | | | | 01/04/16 | | | 8.640 % | | 1 month Brazilian
Interbank Deposit
Average | | $ | — | | | $ | (963,027 | ) |
| | | | | | | 67,890 | | | | 01/04/16 | | | 1 month Brazilian
Interbank Deposit
Average | | 12.640% | | | — | | | | (466,620 | ) |
| | | | | | | 35,190 | | | | 01/02/17 | | | 11.500 | | 1 month Brazilian
Interbank Deposit
Average | | | — | | | | (137,735 | ) |
| | | | | | | 67,610 | | | | 01/02/17 | | | 11.455 | | 1 month Brazilian
Interbank Deposit
Average | | | — | | | | (282,962 | ) |
| | | KRW | | | | 26,353,510 | | | | 03/07/17 | | | 2.875 | | 3 month
KWCDC | | | — | | | | 355,552 | |
| | | ZAR | | | | 166,000 | | | | 05/31/18 | | | 6.500 | | 3 month JIBAR | | | — | | | | (425,738 | ) |
| | | CLP | | | | 1,495,220 | | | | 03/13/19 | | | 6 month CLICP | | 4.650 | | | — | | | | (60,675 | ) |
| | | ZAR | | | | 306,200 | | | | 11/02/19 | | | 6.590 | | 3 month JIBAR | | | — | | | | (1,227,322 | ) |
| | | | | | | 162,000 | | | | 05/30/20 | | | 6.623 | | 3 month JIBAR | | | — | | | | (755,278 | ) |
| | | BRL | | | | 24,560 | | | | 01/04/21 | | | 11.640 | | 1 month Brazilian
Interbank Deposit
Average | | | — | | | | (108,580 | ) |
| | | COP | | | | 4,527,080 | | | | 04/16/24 | | | Columbia 90 days DTF | | 5.920 | | | — | | | | 47,379 | |
| | | KRW | | | | 20,189,970 | | | | 07/11/24 | | | 2.940 | | 3 month
KWCDC | | | — | | | | 430,207 | |
| | | MXN | | | | 94,190 | (a) | | | 09/03/27 | | | 8.520 | | Mexico Interbank
TIIE 28 Days | | | — | | | | 75,265 | |
| | | KRW | | | | 19,730,000 | (a) | | | 03/13/28 | | | 3 month KWCDC | | 3.165 | | | — | | | | (10,070 | ) |
Credit Suisse International (London) | | | CLP | | | | 5,864,500 | | | | 03/28/16 | | | 6 month CLICP | | 3.860 | | | — | | | | (87,046 | ) |
| | | | | | | 4,742,700 | | | | 03/31/16 | | | 6 month CLICP | | 3.850 | | | — | | | | (68,753 | ) |
| | | BRL | | | | 44,320 | | | | 01/02/17 | | | 11.770 | | 1 month Brazilian
Interbank Deposit
Average | | | — | | | | (88,199 | ) |
| | | CLP | | | | 5,280,140 | | | | 04/28/17 | | | 6 month CLICP | | 3.980 | | | — | | | | (107,130 | ) |
| | | | | | | 2,675,440 | | | | 05/12/17 | | | 6 month CLICP | | 3.950 | | | — | | | | (50,022 | ) |
| | | | | | | 5,385,640 | | | | 07/28/17 | | | 6 month CLICP | | 3.640 | | | — | | | | (15,160 | ) |
| | | BRL | | | | 23,240 | | | | 01/02/18 | | | 11.120 | | 1 month Brazilian
Interbank Deposit
Average | | | — | | | | (210,442 | ) |
| | | | | | | 40,360 | | | | 01/02/18 | | | 11.935 | | 1 month Brazilian
Interbank Deposit
Average | | | — | | | | (83,371 | ) |
| | | CLP | | | | 1,346,570 | | | | 02/25/19 | | | 6 month CLICP | | 4.580 | | | — | | | | (50,203 | ) |
| | | | | | | 5,113,230 | | | | 02/28/19 | | | 6 month CLICP | | 4.573 | | | — | | | | (186,959 | ) |
| | | | | | | 2,415,320 | | | | 03/06/19 | | | 6 month CLICP | | 4.610 | | | — | | | | (92,709 | ) |
| | | | | | | 567,780 | | | | 03/13/19 | | | 6 month CLICP | | 4.660 | | | — | | | | (23,436 | ) |
| | | | | | | 442,000 | | | | 03/26/19 | | | 6 month CLICP | | 4.540 | | | — | | | | (16,553 | ) |
| | | COP | | | | 20,678,330 | | | | 04/15/19 | | | Columbia 90 days DTF | | 5.110 | | | — | | | | 52,693 | |
| | | | | | | 9,588,030 | | | | 06/18/19 | | | Colombia IBR
Overnight Interbank | | 5.350 | | | — | | | | (3,883 | ) |
| | | | | | | 3,635,890 | | | | 05/02/24 | | | Colombia IBR
Overnight Interbank | | 6.055 | | | — | | | | 20,043 | |
| | |
| 110 | | The accompanying notes are an integral part of these financial statements. |
GOLDMAN SACHS LOCAL EMERGING MARKETS DEBT FUND
|
| ADDITIONAL INVESTMENT INFORMATION (continued) |
OVER THE COUNTER INTEREST RATE SWAP CONTRACTS (continued)
| | | | | | | | | | | | | | | | | | | | | | | | |
| | | | | | | | | | | | Rates Exchanged | | Market Value | |
| Counterparty | | Notional
Amount
(000s) | | | Termination
Date | | | Payments
Received | | Payments
Made | | Upfront
Payments
Made (Received) | | | Unrealized
Gain (Loss) | |
Deutsche Bank AG | | | BRL | | | | 17,110 | | | | 01/04/16 | | | 11.230 % | | 1 month Brazilian
Interbank Deposit
Average | | $ | — | | | $ | (46,760 | ) |
| | | | | | | 38,650 | | | | 01/04/16 | | | 10.370 | | 1 month Brazilian
Interbank Deposit
Average | | | — | | | | (204,812 | ) |
| | | | | | | 56,320 | | | | 01/04/16 | | | 10.347 | | 1 month Brazilian
Interbank Deposit
Average | | | — | | | | (310,451 | ) |
| | | | | | | 71,300 | | | | 01/04/16 | | | 8.860 | | 1 month Brazilian
Interbank Deposit
Average | | | — | | | | (1,199,109 | ) |
| | | | | | | 71,480 | | | | 01/04/16 | | | 11.650 | | 1 month Brazilian
Interbank Deposit
Average | | | — | | | | (75,210 | ) |
| | | | | | | 58,490 | | | | 01/02/17 | | | 11.820 | | 1 month Brazilian
Interbank Deposit
Average | | | — | | | | (95,920 | ) |
| | | KRW | | | | 11,710,120 | | | | 03/03/17 | | | 2.850 | | 3 month KWCDC | | | — | | | | 151,613 | |
| | | BRL | | | | 23,940 | | | | 01/02/18 | | | 11.150 | | 1 month Brazilian
Interbank Deposit
Average | | | — | | | | (210,058 | ) |
| | | | | | | 31,520 | | | | 01/02/18 | | | 11.450 | | 1 month Brazilian
Interbank Deposit
Average | | | — | | | | (187,756 | ) |
| | | | | | | 127,930 | | | | 01/02/18 | | | 11.500 | | 1 month Brazilian
Interbank Deposit
Average | | | — | | | | (744,262 | ) |
| | | ZAR | | | | 132,550 | | | | 05/30/18 | | | 6.520 | | 3 month JIBAR | | | — | | | | (331,599 | ) |
| | | | | | | 162,430 | | | | 05/31/18 | | | 6.530 | | 3 month JIBAR | | | — | | | | (402,353 | ) |
| | | | | | | 66,000 | | | | 06/07/18 | | | 7.110 | | 3 month JIBAR | | | — | | | | (55,072 | ) |
| | | | | | | 168,500 | | | | 06/07/18 | | | 7.100 | | 3 month JIBAR | | | — | | | | (145,101 | ) |
| | | CLP | | | | 4,106,880 | | | | 10/03/18 | | | 6 month CLICP | | 4.990% | | | — | | | | (312,499 | ) |
| | | | | | | 1,802,040 | | | | 10/22/18 | | | 6 month CLICP | | 4.860 | | | — | | | | (118,257 | ) |
| | | | | | | 1,657,400 | | | | 02/24/19 | | | 6 month CLICP | | 4.595 | | | — | | | | (63,593 | ) |
| | | | | | | 2,098,000 | | | | 03/26/19 | | | 6 month CLICP | | 4.550 | | | — | | | | (80,206 | ) |
| | | | | | | 3,354,300 | | | | 03/27/19 | | | 6 month CLICP | | 4.556 | | | — | | | | (110,259 | ) |
| | | | | | | 6,375,000 | | | | 04/10/19 | | | 6 month CLICP | | 4.430 | | | — | | | | (178,143 | ) |
| | | COP | | | | 17,921,760 | | | | 06/17/19 | | | Colombia IBR
Overnight Interbank | | 5.320 | | | — | | | | 2,663 | |
| | | CLP | | | | 2,048,400 | | | | 07/28/19 | | | 6 month CLICP | | 4.000 | | | — | | | | 24,516 | |
| | | ZAR | | | | 190,000 | | | | 01/02/20 | | | 6.200 | | 3 month JIBAR | | | (1,048 | ) | | | (1,086,654 | ) |
| | | | | | | 7,820 | | | | 05/23/21 | | | 6.550 | | 3 month JIBAR | | | — | | | | (47,316 | ) |
| | | MXN | | | | 85,770 | | | | 09/09/21 | | | 5.830 | | Mexico Interbank
TIIE 28 Days | | | — | | | | (37,680 | ) |
| | | KRW | | | | 22,865,240 | (a) | | | 09/14/22 | | | 3 month KWCDC | | 3.210 | | | — | | | | (382,119 | ) |
| | | | | | | 26,091,240 | (a) | | | 09/18/22 | | | 3 month KWCDC | | 3.320 | | | — | | | | (552,877 | ) |
| | | | | | | 5,000,000 | (a) | | | 01/08/23 | | | 3 month KWCDC | | 3.390 | | | — | | | | (113,391 | ) |
| | | | | | | 17,289,860 | | | | 08/23/23 | | | 3.620 | | 3 month KWCDC | | | — | | | | 1,275,512 | |
| | | MXN | | | | 159,380 | (a) | | | 04/22/27 | | | 9.290 | | Mexico Interbank
TIIE 28 Days | | | — | | | | 422,115 | |
| | |
| The accompanying notes are an integral part of these financial statements. | | 111 |
GOLDMAN SACHS LOCAL EMERGING MARKETS DEBT FUND
Schedule of Investments (continued)
September 30, 2014 (Unaudited)
|
| ADDITIONAL INVESTMENT INFORMATION (continued) |
OVER THE COUNTER INTEREST RATE SWAP CONTRACTS (continued)
| | | | | | | | | | | | | | | | | | | | | | | | |
| | | | | | | | | | | | Rates Exchanged | | Market Value | |
| Counterparty | | Notional
Amount
(000s) | | | Termination
Date | | | Payments
Received | | Payments
Made | | Upfront
Payments
Made (Received) | | | Unrealized
Gain (Loss) | |
Deutsche Bank AG (continued) | | | MXN | | | | 159,100 | (a) | | | 06/11/27 | | | 8.700 % | | Mexico Interbank
TIIE 28 Days | | $ | — | | | $ | 205,121 | |
| | | | | | | 94,990 | (a) | | | 09/22/27 | | | 7.940 | | Mexico Interbank
TIIE 28 Days | | | — | | | | (44,003 | ) |
| | | | | | | 28,000 | (a) | | | 02/24/28 | | | 7.510 | | Mexico Interbank
TIIE 28 Days | | | — | | | | (41,855 | ) |
JPMorgan Securities, Inc. | | | BRL | | | | 82,470 | | | | 01/04/16 | | | 11.826 | | 1 month
Brazilian
Interbank
Deposit Average | | | — | | | | 126,323 | |
| | | | | | | 153,100 | | | | 01/04/16 | | | 9.980 | | 1 month
Brazilian
Interbank
Deposit Average | | | — | | | | (1,127,877 | ) |
| | | | | | | 266,920 | | | | 01/02/17 | | | 1 month Brazilian
Interbank Deposit
Average | | 9.040% | | | — | | | | 6,261,893 | |
| | | CLP | | | | 2,278,820 | | | | 03/04/19 | | | 6 month CLICP | | 4.590 | | | — | | | | (84,895 | ) |
| | | COP | | | | 10,159,090 | | | | 04/22/19 | | | Colombia IBR
Overnight Interbank | | 5.190 | | | — | | | | 13,151 | |
| | | ZAR | | | | 125,000 | | | | 12/20/21 | | | 7.760 | | 3 month JIBAR | | | (1,365 | ) | | | (130,281 | ) |
| | | KRW | | | | 23,074,380 | (a) | | | 11/29/22 | | | 3 month KWCDC | | 3.220 | | | — | | | | (373,043 | ) |
| | | | | | | 5,318,590 | | | | 01/13/24 | | | 3 month KWCDC | | 3.465 | | | — | | | | (340,412 | ) |
| | | | | | | 3,104,250 | | | | 07/03/24 | | | 3 month KWCDC | | 2.965 | | | — | | | | (73,073 | ) |
Morgan Stanley & Co. International PLC | | | BRL | | | | 36,140 | | | | 01/04/16 | | | 11.670 | | 1 month
Brazilian
Interbank
Deposit Average | | | — | | | | (35,035 | ) |
| | | | | | | 46,050 | | | | 01/04/16 | | | 10.190 | | 1 month
Brazilian
Interbank
Deposit Average | | | — | | | | (289,476 | ) |
| | | CLP | | | | 1,333,530 | | | | 03/12/19 | | | 6 month CLICP | | 4.640 | | | — | | | | (53,432 | ) |
| | | | | | | 3,792,910 | | | | 04/09/19 | | | 6 month CLICP | | 4.420 | | | — | | | | (103,262 | ) |
| | | | | | | 1,243,800 | | | | 04/15/19 | | | 6 month CLICP | | 4.350 | | | — | | | | (26,633 | ) |
| | | BRL | | | | 25,280 | | | | 01/04/21 | | | 1 month Brazilian
Interbank Deposit
Average | | 11.410 | | | — | | | | 190,409 | |
| | | MXN | | | | 310,000 | | | | 06/17/21 | | | 5.630 | | Mexico Interbank
TIIE 28 Days | | | — | | | | (342,437 | ) |
| | | KRW | | | | 82,000,000 | (a) | | | 01/08/23 | | | 3 month KWCDC | | 3.380 | | | — | | | | (1,826,061 | ) |
| | | | | | | 14,200,000 | (a) | | | 02/05/23 | | | 3 month KWCDC | | 3.315 | | | — | | | | (273,940 | ) |
| | | | | | | | 28,000,000 | (a) | | | 03/03/28 | | | 3 month KWCDC | | 3.135 | | | — | | | | 14,392 | |
| TOTAL | | | | | | | | | | | | | | | | | | $ | (2,390 | ) | | $ | (10,628,507 | ) |
| | (a) | | Represents forward starting interest rate swaps whose effective dates of commencement of accruals and cash flows occur subsequent to September 30, 2014. |
| | |
| 112 | | The accompanying notes are an integral part of these financial statements. |
GOLDMAN SACHS LOCAL EMERGING MARKETS DEBT FUND
|
| ADDITIONAL INVESTMENT INFORMATION (continued) |
CENTRALLY CLEARED INTEREST RATE SWAP CONTRACTS
| | | | | | | | | | | | | | | | | | | | |
| | | | | | | Rates Exchanged | | Market Value | |
Notional
Amount
(000s) | | | Termination
Date | | | Payments
Received | | | Payments
Made | | Upfront
Payments
Made (Received) | | | Unrealized
Gain (Loss) | |
| ZAR | 176,620 | | | | 01/06/16 | | | | 6.168% | | | 3 month JIBAR | | $ | 24 | | | $ | (85,752 | ) |
| | 162,180 | | | | 01/06/16 | | | | 6.212 | | | 3 month JIBAR | | | 21 | | | | (69,715 | ) |
| | 51,550 | | | | 01/09/16 | | | | 6.218 | | | 3 month JIBAR | | | 7 | | | | (22,333 | ) |
| | 163,160 | | | | 01/14/16 | | | | 6.190 | | | 3 month JIBAR | | | 21 | | | | (78,282 | ) |
| | 112,380 | | | | 03/25/16 | | | | 6.980 | | | 3 month JIBAR | | | (249 | ) | | | 28,312 | |
| | 111,920 | | | | 03/26/16 | | | | 6.990 | | | 3 month JIBAR | | | (252 | ) | | | 29,408 | |
| | 151,610 | | | | 06/13/19 | | | | 7.640 | | | 3 month JIBAR | | | 67 | | | | 19,966 | |
| | 134,360 | | | | 09/05/19 | | | | 7.280 | | | 3 month JIBAR | | | (328 | ) | | | (125,265 | ) |
| | 230,220 | | | | 09/08/19 | | | | 7.310 | | | 3 month JIBAR | | | (574 | ) | | | (203,639 | ) |
| $ | 72,100 | (a) | | | 12/17/19 | | | | 3 month LIBOR | | | 2.250% | | | (736,924 | ) | | | 116,930 | |
| | 21,000 | (a) | | | 12/17/21 | | | | 3 month LIBOR | | | 2.500 | | | (277,781 | ) | | | 161,315 | |
| | 66,900 | (a) | | | 12/17/29 | | | | 3 month LIBOR | | | 3.250 | | | (1,772,519 | ) | | | (216,244 | ) |
| | TOTAL | | | | | | | | | | | | | $ | (2,788,487 | ) | | $ | (445,299 | ) |
| | (a) | | Represents forward starting interest rate swaps whose effective dates of commencement of accruals and cash flows occur subsequent to September 30, 2014. |
OVER THE COUNTER CREDIT DEFAULT SWAP CONTRACTS
| | | | | | | | | | | | | | | | | | | | | | | | | | |
| | | | | | | | | | | | | | | | | Market Value | |
| Counterparty | | Referenced
Obligation | | Notional
Amount
(000s) | | | Rates Received
(Paid) | | | Termination
Date | | | Credit
Spread at
September 30,
2014(b) | | | Upfront
Payments
Made (Received) | | | Unrealized
Gain (Loss) | |
Protection Purchased: | | | | | | | | | | | | | | | | | | | | | | | | |
Bank of America Securities LLC | | People’s Republic of China, 4.250%, 10/28/14 | | $ | 1,160 | | | | (1.000 | )% | | | 06/20/19 | | | | 0.809 | % | | $ | (6,893 | ) | | $ | (3,443 | ) |
Barclays Bank PLC | | | | | 3,170 | | | | (1.000 | ) | | | 03/20/19 | | | | 0.760 | | | | (10,851 | ) | | | (22,735 | ) |
Citibank NA | | | | | 29,550 | | | | (1.000 | ) | | | 03/20/19 | | | | 0.760 | | | | (127,769 | ) | | | (185,312 | ) |
| | | | | 51,890 | | | | (1.000 | ) | | | 06/20/19 | | | | 0.809 | | | | (293,479 | ) | | | (168,920 | ) |
JPMorgan Securities, Inc. | | | | | 3,310 | | | | (1.000 | ) | | | 03/20/19 | | | | 0.760 | | | | (10,530 | ) | | | (24,540 | ) |
| | | | | | 1,630 | | | | (1.000 | ) | | | 06/20/19 | | | | 0.809 | | | | (10,402 | ) | | | (4,123 | ) |
| TOTAL | | | | | | | | | | | | | | | | | | | | $ | (459,924 | ) | | $ | (409,073 | ) |
| | (b) | | Credit spread on the Referenced Obligation, together with the term of the swap contract, are indicators of payment/performance risk. The likelihood of a credit event occurring which would require a fund to make a payment or otherwise be required to perform under the swap contract is generally greater as the credit spread and the term of the swap contract increase. |
| | |
| The accompanying notes are an integral part of these financial statements. | | 113 |
GOLDMAN SACHS LOCAL EMERGING MARKETS DEBT FUND
Schedule of Investments (continued)
September 30, 2014 (Unaudited)
|
| ADDITIONAL INVESTMENT INFORMATION (continued) |
OVER THE COUNTER CROSS CURRENCY SWAP CONTRACTS
| | | | | | | | | | | | | | | | | | | | | | |
| | | | | | | | | | | | | | | Market Value | |
| Counterparty | | Notional Amount
of Currency
Received | | Notional Amount
of Currency
Delivered | | | Termination
Date(c) | | | Receive | | Pay | | Upfront
Payments
Made (Received) | | | Unrealized
Gain (Loss) | |
Citibank NA | | TRY 12,250,000 | | $ | 5,573,248 | | | | 03/10/16 | | | 11.070% | | 3 month LIBOR | | $ | 43,956 | | | $ | (114,917 | ) |
| | 91,670,000 | | | 40,942,385 | | | | 03/26/15 | | | 12.040 | | 3 month LIBOR | | | 43,933 | | | | 2,214,545 | |
| | 66,690,000 | | | 30,417,332 | | | | 03/31/15 | | | 11.575 | | 3 month LIBOR | | | 90,445 | | | | 749,163 | |
| | ZAR 26,400,000 | | | 2,548,263 | | | | 05/13/24 | | | 3 month JIBAR | | 3 month LIBOR | | | 1,169 | | | | (165,218 | ) |
Deutsche Bank AG | | 38,520,000 | | | 3,594,289 | | | | 07/15/24 | | | 3 month JIBAR | | 3 month LIBOR | | | 4,617 | | | | (97,950 | ) |
| | TRY 25,510,000 | | | 11,452,301 | | | | 03/13/16 | | | 11.480 | | 3 month LIBOR | | | (89,778 | ) | | | 141,904 | |
| | ZAR 54,520,000 | | | 5,245,039 | | | | 05/12/24 | | | 3 month JIBAR | | 3 month LIBOR | | | 29,057 | | | | (349,008 | ) |
| | 42,202,250 | | | 4,054,984 | | | | 05/23/19 | | | 3 month JIBAR | | 3 month LIBOR | | | 8,688 | | | | (283,288 | ) |
Morgan Stanley & Co. International PLC | | 55,121,000 | | | 5,153,904 | | | | 08/12/24 | | | 3 month JIBAR | | 3 month LIBOR | | | 16,437 | | | | (181,654 | ) |
| | 54,542,000 | | | 5,262,132 | | | | 05/13/24 | | | 3 month JIBAR | | 3 month LIBOR | | | 4,955 | | | | (341,371 | ) |
| | | 29,540,000 | | | 2,768,510 | | | | 07/17/24 | | | 3 month JIBAR | | 3 month LIBOR | | | (5,244 | ) | | | (85,004 | ) |
| TOTAL | | | | | | | | | | | | | | | | $ | 148,235 | | | $ | 1,487,202 | |
| | (c) | | At the termination date, the notional amount of the currency received will be exchanged back for the notional amount of the currency delivered. |
| | |
| 114 | | The accompanying notes are an integral part of these financial statements. |
GOLDMAN SACHS U.S. MORTGAGES FUND
Schedule of Investments
September 30, 2014 (Unaudited)
| | | | | | | | | | | | | | |
Principal
Amount | | | Interest
Rate | | | Maturity
Date | | | Value | |
| | Mortgage-Backed Obligations – 100.3% | |
| | Collateralized Mortgage Obligations – 7.6% | |
| | Adjustable Rate Non-Agency(a) – 1.2% | |
| Adjustable Rate Mortgage Trust Series 2004-5, Class 2A1 | |
| $ | 180,473 | | | | 2.650 | % | | | 04/25/35 | | | $ | 175,163 | |
| Bear Stearns Alt-A Trust Series 2005-5, Class 21A1 | |
| | 1,061,505 | | | | 2.393 | | | | 07/25/35 | | | | 968,907 | |
| Countrywide Alternative Loan Trust Series 2005-16, Class A1 | |
| | 702,203 | | | | 1.763 | | | | 06/25/35 | | | | 620,326 | |
| Countrywide Alternative Loan Trust Series 2005-38, Class A1 | |
| | 197,971 | | | | 1.618 | | | | 09/25/35 | | | | 180,648 | |
| Harborview Mortgage Loan Trust Series 2005-16, Class 2A1A | |
| | 314,822 | | | | 0.393 | | | | 01/19/36 | | | | 205,359 | |
| Impac CMB Trust Series 2004-08, Class 1A | |
| | 68,450 | | | | 0.875 | | | | 10/25/34 | | | | 59,251 | |
| Morgan Stanley Mortgage Loan Trust Series 2004-8AR,
Class 4A1 |
|
| | 864,664 | | | | 2.429 | | | | 10/25/34 | | | | 861,645 | |
| | | | | | | | | | | | | | |
| | | | | | | | | | | | | 3,071,299 | |
| | |
| | Interest Only(b) – 0.9% | |
| CS First Boston Mortgage Securities Corp. Series 2002-AR31,
Class 5X(a)(c) |
|
| | 57,196 | | | | 0.000 | | | | 11/25/32 | | | | — | |
| CS First Boston Mortgage Securities Corp. Series 2003-19,
Class 1A2 |
|
| | 5,596 | | | | 5.250 | | | | 07/25/33 | | | | 224 | |
| FHLMC REMIC Series 4273, Class PS(a) | |
| | 759,961 | | | | 5.946 | | | | 11/15/43 | | | | 112,096 | |
| FHLMC STRIPS Series 329, Class C1 | |
| | 1,913,302 | | | | 4.000 | | | | 12/15/41 | | | | 421,749 | |
| FNMA REMIC Series 2010-126, Class LS(a) | |
| | 975,523 | | | | 4.846 | | | | 11/25/40 | | | | 178,966 | |
| FNMA REMIC Series 2012-146, Class IO | |
| | 4,137,242 | | | | 3.500 | | | | 01/25/43 | | | | 929,594 | |
| GNMA REMIC Series 2013-113, Class SD(a) | |
| | 508,601 | | | | 6.546 | | | | 08/16/43 | | | | 81,625 | |
| GNMA REMIC Series 2013-182, Class PI | |
| | 176,385 | | | | 4.500 | | | | 12/20/43 | | | | 39,224 | |
| GNMA Series 2011-99, Class DS(a) | |
| | 3,566,300 | | | | 5.946 | | | | 07/16/41 | | | | 622,802 | |
| Master Adjustable Rate Mortgages Trust Series 2003-2,
Class 3AX(a) |
|
| | 19,570 | | | | 0.123 | | | | 08/25/33 | | | | 123 | |
| Master Adjustable Rate Mortgages Trust Series 2003-2,
Class 4AX(a) |
|
| | 3,205 | | | | 0.320 | | | | 07/25/33 | | | | 37 | |
| | | | | | | | | | | | | | |
| | | | | | | | | | | | | 2,386,440 | |
| | |
| | Inverse Floaters(a) – 0.6% | |
| GNMA REMIC Series 2010-1, Class SD | |
| | 47,539 | | | | 5.637 | | | | 01/20/40 | | | | 7,152 | |
| GNMA REMIC Series 2010-35, Class DS | |
| | 182,778 | | | | 5.527 | | | | 03/20/40 | | | | 29,107 | |
| GNMA REMIC Series 2010-85, Class SN | |
| | 111,905 | | | | 5.787 | | | | 07/20/40 | | | | 20,942 | |
| GNMA REMIC Series 2010-9, Class XD | |
| | 2,039,524 | | | | 6.446 | | | | 01/16/40 | | | | 397,157 | |
| GNMA REMIC Series 2010-98, Class QS | |
| | 436,712 | | | | 6.447 | | | | 01/20/40 | | | | 73,004 | |
| | |
| | Mortgage-Backed Obligations – (continued) | |
| | Inverse Floaters(a) – (continued) | |
| GNMA REMIC Series 2011-17, Class SA | |
| 529,311 | | | | 5.947 | | | | 09/20/40 | | | | 85,441 | |
| GNMA REMIC Series 2011-25, Class SA | |
| | 1,020,497 | | | | 5.947 | | | | 10/20/40 | | | | 156,103 | |
| GNMA REMIC Series 2011-61, Class CS | |
| | 407,019 | | | | 6.527 | | | | 12/20/35 | | | | 55,012 | |
| GNMA REMIC Series 2011-79, Class AS | |
| | 287,982 | | | | 5.957 | | | | 07/20/37 | | | | 23,333 | |
| GNMA REMIC Series 2013-113, Class SA | |
| | 316,254 | | | | 6.547 | | | | 08/20/43 | | | | 61,590 | |
| GNMA REMIC Series 2013-134, Class DS | |
| | 2,602,779 | | | | 5.947 | | | | 09/20/43 | | | | 445,470 | |
| GNMA REMIC Series 2013-148, Class SA | |
| | 415,991 | | | | 6.047 | | | | 10/20/43 | | | | 71,939 | |
| GNMA Series 2001-48, Class SA | |
| | 7,075 | | | | 25.988 | | | | 10/16/31 | | | | 10,740 | |
| GNMA Series 2001-51, Class SB | |
| | 6,878 | | | | 25.988 | | | | 10/16/31 | | | | 11,047 | |
| | | | | | | | | | | | | | |
| | | | | | | | | | | | | 1,448,037 | |
| | |
| | Planned Amortization Class – 0.4% | |
| FHLMC REMIC Series 3748 | |
| | 1,000,000 | | | | 4.000 | | | | 11/15/39 | | | | 1,047,505 | |
| | |
| | Sequential Fixed Rate – 2.6% | |
| FHLMC REMIC Series 2042, Class N | |
| | 146,136 | | | | 6.500 | | | | 03/15/28 | | | | 163,718 | |
| FNMA REMIC Series 2000-16, Class ZG | |
| | 300,837 | | | | 8.500 | | | | 06/25/30 | | | | 356,415 | |
| FNMA REMIC Series 2005-62, Class ZL | |
| | 319,176 | | | | 5.500 | | | | 07/25/35 | | | | 347,965 | |
| FNMA REMIC Series 2010-95, Class ZC | |
| | 840,290 | | | | 5.000 | | | | 09/25/40 | | | | 867,971 | |
| FNMA REMIC Series 2011-52, Class GB | |
| | 1,200,000 | | | | 5.000 | | | | 06/25/41 | | | | 1,331,488 | |
| FNMA REMIC Series 2011-99, Class DB | |
| | 1,075,000 | | | | 5.000 | | | | 10/25/41 | | | | 1,197,297 | |
| FNMA REMIC Series 2012-111, Class B | |
| | 301,804 | | | | 7.000 | | | | 10/25/42 | | | | 342,401 | |
| FNMA REMIC Series 2012-153, Class B | |
| | 944,258 | | | | 7.000 | | | | 07/25/42 | | | | 1,070,920 | |
| GNMA Series 2009-61, Class AZ | |
| | 757,373 | | | | 5.500 | | | | 08/20/39 | | | | 840,034 | |
| | | | | | | | | | | | | | |
| | | | | | | | | | | | | 6,518,209 | |
| | |
| | Sequential Floating Rate(a) – 1.1% | |
| FHLMC REMIC Series 4103, Class BF | |
| | 2,332,885 | | | | 0.504 | | | | 12/15/38 | | | | 2,333,104 | |
| FNMA REMIC Series 2011-63, Class FG | |
| | 346,432 | | | | 0.605 | | | | 07/25/41 | | | | 348,237 | |
| | | | | | | | | | | | | | |
| | | | | | | | | | | | | 2,681,341 | |
| | |
| | Support – 0.8% | |
| FNMA REMIC Series 2005-59, Class KZ | |
| | 1,803,435 | | | | 5.500 | | | | 07/25/35 | | | | 1,994,936 | |
| | |
| TOTAL COLLATERALIZED
MORTGAGE OBLIGATIONS |
| | $ | 19,147,767 | |
| | |
| | |
| The accompanying notes are an integral part of these financial statements. | | 115 |
GOLDMAN SACHS U.S. MORTGAGES FUND
Schedule of Investments (continued)
September 30, 2014 (Unaudited)
| | | | | | | | | | | | | | |
Principal
Amount | | | Interest
Rate | | | Maturity
Date | | | Value | |
| | Mortgage-Backed Obligations – (continued) | |
| | Commercial Mortgage-Backed Securities – 15.7% | |
| | Sequential Fixed Rate – 4.7% | |
| Bear Stearns Commercial Mortgage Securities Trust
Series 2007-PW18, Class A1A |
|
| $ | 4,123,074 | | | | 5.602 | % | | | 06/11/50 | | | $ | 4,539,468 | |
| FHLMC Multifamily Structured Pass-Through Certificates
Series K005, Class A2 |
|
| | 2,000,000 | | | | 4.317 | | | | 11/25/19 | | | | 2,201,151 | |
| FHLMC Multifamily Structured Pass-Through Certificates
Series K027, Class A2 |
|
| | 1,400,000 | | | | 2.637 | | | | 01/25/23 | | | | 1,381,672 | |
| FHLMC Multifamily Structured Pass-Through Certificates
Series K028, Class A2 |
|
| | 3,450,000 | | | | 3.111 | | | | 02/25/23 | | | | 3,522,642 | |
| | | | | | | | | | | | | | |
| | | | | | | | | | | | | 11,644,933 | |
| | |
| | Sequential Floating Rate(a) – 11.0% | |
| Banc of America Commercial Mortgage, Inc. Series 2007-2,
Class AM |
|
| | 150,000 | | | | 5.791 | | | | 04/10/49 | | | | 163,449 | |
| Citigroup Commercial Mortgage Trust Series 2008-C7,
Class A1A |
|
| | 2,286,877 | | | | 6.253 | | | | 12/10/49 | | | | 2,547,885 | |
| Commercial Mortgage Trust Series 2007-C9, Class A1A | |
| | 2,613,593 | | | | 5.989 | | | | 12/10/49 | | | | 2,853,935 | |
| Credit Suisse Commercial Mortgage Trust Series 2006-C3,
Class A3 |
|
| | 6,312,037 | | | | 5.999 | | | | 06/15/38 | | | | 6,685,675 | |
| FHLMC Multifamily Structured Pass-Through Certificates
Series K714, Class A2 |
|
| | 700,000 | | | | 3.034 | | | | 10/25/20 | | | | 724,445 | |
| GS Mortgage Securities Trust Series 2007-GG10, Class A4 | |
| | 3,627,878 | | | | 5.991 | | | | 08/10/45 | | | | 3,968,120 | |
| LB-UBS Commercial Mortgage Trust Series 2007-C7, Class A3 | |
| | 752,823 | | | | 5.866 | | | | 09/15/45 | | | | 834,437 | |
| ML-CFC Commercial Mortgage Trust Series 2006-2, Class A4 | |
| | 4,501,962 | | | | 6.066 | | | | 06/12/46 | | | | 4,779,740 | |
| Morgan Stanley Capital I Trust Series 2007-HQ11, Class AM | |
| | 50,000 | | | | 5.478 | | | | 02/12/44 | | | | 53,793 | |
| Morgan Stanley Capital I Trust Series 2007-HQ13, Class AM | |
| | 50,000 | | | | 5.931 | | | | 12/15/44 | | | | 48,415 | |
| Morgan Stanley Capital I Trust Series 2007-T25, Class A1A | |
| | 1,114,121 | | | | 5.509 | | | | 11/12/49 | | | | 1,202,234 | |
| Wachovia Bank Commercial Mortgage Trust Series 2006-C26,
Class A1A |
|
| | 2,175,708 | | | | 6.009 | | | | 06/15/45 | | | | 2,327,386 | |
| WF-RBS Commercial Mortgage Trust Series 2011-C2,
Class A4(d) |
|
| | 1,300,000 | | | | 4.869 | | | | 02/15/44 | | | | 1,442,177 | |
| | | | | | | | | | | | | | |
| | | | | | | | | | | | | 27,631,691 | |
| | |
| TOTAL COMMERCIAL
MORTGAGE-BACKED SECURITIES |
| | $ | 39,276,624 | |
| | |
| | Federal Agencies – 77.0% | |
| | Adjustable Rate FHLMC(a) – 0.2% | |
| $ | 119,223 | | | | 2.375 | % | | | 04/01/33 | | | $ | 126,720 | |
| | |
| | Mortgage-Backed Obligations – (continued) | |
| | Adjustable Rate FHLMC(a) – (continued) | |
| 53,472 | | | | 2.361 | | | | 09/01/33 | | | | 56,833 | |
| | 26,203 | | | | 2.232 | | | | 10/01/34 | | | | 27,736 | |
| | 44,515 | | | | 2.375 | | | | 11/01/34 | | | | 47,406 | |
| | 46,491 | | | | 2.375 | | | | 02/01/35 | | | | 49,526 | |
| | 160,346 | | | | 2.375 | | | | 06/01/35 | | | | 172,490 | |
| | | | | | | | | | | | | | |
| | | | | | | | | | | | | 480,711 | |
| | |
| | Adjustable Rate FNMA(a) – 0.6% | |
| | 5,821 | | | | 1.932 | | | | 07/01/22 | | | | 5,967 | |
| | 18,728 | | | | 1.918 | | | | 07/01/27 | | | | 19,388 | |
| | 22,756 | | | | 1.918 | | | | 11/01/27 | | | | 23,550 | |
| | 6,747 | | | | 1.918 | | | | 01/01/31 | | | | 7,027 | |
| | 8,316 | | | | 1.918 | | | | 06/01/32 | | | | 8,672 | |
| | 10,422 | | | | 1.932 | | | | 08/01/32 | | | | 10,835 | |
| | 42,203 | | | | 1.932 | | | | 05/01/33 | | | | 43,929 | |
| | 17,604 | | | | 1.789 | | | | 06/01/33 | | | | 18,277 | |
| | 225,009 | | | | 2.377 | | | | 06/01/33 | | | | 241,181 | |
| | 14,359 | | | | 2.349 | | | | 07/01/33 | | | | 15,253 | |
| | 215,108 | | | | 1.917 | | | | 08/01/33 | | | | 223,198 | |
| | 1,345 | | | | 2.625 | | | | 09/01/33 | | | | 1,439 | |
| | 1,008 | | | | 2.199 | | | | 12/01/33 | | | | 1,048 | |
| | 110,802 | | | | 2.289 | | | | 12/01/33 | | | | 117,509 | |
| | 4,265 | | | | 2.422 | | | | 04/01/34 | | | | 4,545 | |
| | 266,575 | | | | 2.655 | | | | 08/01/34 | | | | 285,734 | |
| | 53,426 | | | | 2.417 | | | | 11/01/34 | | | | 56,734 | |
| | 71,481 | | | | 2.320 | | | | 02/01/35 | | | | 75,991 | |
| | 92,655 | | | | 2.248 | | | | 03/01/35 | | | | 98,233 | |
| | 56,044 | | | | 2.435 | | | | 04/01/35 | | | | 59,893 | |
| | 126,986 | | | | 2.446 | | | | 05/01/35 | | | | 136,113 | |
| | 16,789 | | | | 1.918 | | | | 11/01/35 | | | | 17,382 | |
| | 61,602 | | | | 1.918 | | | | 12/01/37 | | | | 63,830 | |
| | 39,548 | | | | 1.918 | | | | 01/01/38 | | | | 40,974 | |
| | 19,394 | | | | 1.918 | | | | 11/01/40 | | | | 20,196 | |
| | | | | | | | | | | | | | |
| | | | | | | | | | | | | 1,596,898 | |
| | |
| | Adjustable Rate GNMA(a) – 0.7% | |
| | 34,031 | | | | 1.625 | | | | 06/20/23 | | | | 34,736 | |
| | 15,952 | | | | 1.625 | | | | 07/20/23 | | | | 16,284 | |
| | 15,975 | | | | 1.625 | | | | 08/20/23 | | | | 16,311 | |
| | 43,119 | | | | 1.625 | | | | 09/20/23 | | | | 44,032 | |
| | 12,551 | | | | 1.625 | | | | 03/20/24 | | | | 12,829 | |
| | 109,143 | | | | 1.625 | | | | 04/20/24 | | | | 111,573 | |
| | 13,031 | | | | 1.625 | | | | 05/20/24 | | | | 13,323 | |
| | 92,338 | | | | 1.625 | | | | 06/20/24 | | | | 94,422 | |
| | 19,089 | | | | 2.000 | | | | 06/20/24 | | | | 19,770 | |
| | 30,274 | | | | 1.625 | | | | 07/20/24 | | | | 30,961 | |
| | 32,676 | | | | 2.000 | | | | 07/20/24 | | | | 33,856 | |
| | 56,629 | | | | 1.625 | | | | 08/20/24 | | | | 57,922 | |
| | 28,612 | | | | 2.000 | | | | 08/20/24 | | | | 29,652 | |
| | 27,061 | | | | 1.625 | | | | 09/20/24 | | | | 27,683 | |
| | 33,751 | | | | 2.000 | | | | 11/20/24 | | | | 35,003 | |
| | 12,966 | | | | 2.000 | | | | 12/20/24 | | | | 13,449 | |
| | 19,542 | | | | 2.500 | | | | 12/20/24 | | | | 20,602 | |
| | 22,537 | | | | 2.000 | | | | 01/20/25 | | | | 23,382 | |
| | 11,809 | | | | 2.000 | | | | 02/20/25 | | | | 12,255 | |
| | 41,592 | | | | 2.000 | | | | 05/20/25 | | | | 43,191 | |
| | 35,013 | | | | 2.000 | | | | 07/20/25 | | | | 36,375 | |
| | |
| | |
| 116 | | The accompanying notes are an integral part of these financial statements. |
GOLDMAN SACHS U.S. MORTGAGES FUND
| | | | | | | | | | | | | | |
Principal
Amount | | | Interest
Rate | | | Maturity
Date | | | Value | |
| | Mortgage-Backed Obligations – (continued) | |
| | Adjustable Rate GNMA(a) – (continued) | |
| $ | 16,384 | | | | 1.625 | % | | | 02/20/26 | | | $ | 16,801 | |
| | 843 | | | | 1.625 | | | | 07/20/26 | | | | 865 | |
| | 21,861 | | | | 1.625 | | | | 01/20/27 | | | | 22,449 | |
| | 19,865 | | | | 2.000 | | | | 01/20/27 | | | | 20,653 | |
| | 16,563 | | | | 1.625 | | | | 02/20/27 | | | | 17,011 | |
| | 117,639 | | | | 1.625 | | | | 04/20/27 | | | | 120,845 | |
| | 13,873 | | | | 1.625 | | | | 05/20/27 | | | | 14,253 | |
| | 14,352 | | | | 1.625 | | | | 06/20/27 | | | | 14,747 | |
| | 5,135 | | | | 1.625 | | | | 11/20/27 | | | | 5,280 | |
| | 19,592 | | | | 1.625 | | | | 12/20/27 | | | | 20,146 | |
| | 37,571 | | | | 1.625 | | | | 01/20/28 | | | | 38,636 | |
| | 14,134 | | | | 1.625 | | | | 02/20/28 | | | | 14,536 | |
| | 15,251 | | | | 1.625 | | | | 03/20/28 | | | | 15,686 | |
| | 68,473 | | | | 1.625 | | | | 07/20/29 | | | | 70,552 | |
| | 36,598 | | | | 1.625 | | | | 08/20/29 | | | | 37,713 | |
| | 9,522 | | | | 1.625 | | | | 09/20/29 | | | | 9,814 | |
| | 36,826 | | | | 1.625 | | | | 10/20/29 | | | | 37,955 | |
| | 42,861 | | | | 1.625 | | | | 11/20/29 | | | | 44,148 | |
| | 10,830 | | | | 1.625 | | | | 12/20/29 | | | | 11,160 | |
| | 13,506 | | | | 1.625 | | | | 01/20/30 | | | | 13,925 | |
| | 6,791 | | | | 1.625 | | | | 02/20/30 | | | | 7,002 | |
| | 36,080 | | | | 1.625 | | | | 03/20/30 | | | | 37,204 | |
| | 41,167 | | | | 1.625 | | | | 04/20/30 | | | | 42,458 | |
| | 62,297 | | | | 1.625 | | | | 05/20/30 | | | | 64,251 | |
| | 45,755 | | | | 2.000 | | | | 05/20/30 | | | | 48,039 | |
| | 9,820 | | | | 1.625 | | | | 06/20/30 | | | | 10,129 | |
| | 91,253 | | | | 2.000 | | | | 07/20/30 | | | | 95,838 | |
| | 18,793 | | | | 2.000 | | | | 09/20/30 | | | | 19,743 | |
| | 32,337 | | | | 1.625 | | | | 10/20/30 | | | | 33,370 | |
| | | | | | | | | | | | | | |
| | | | | | | | | | | | | 1,632,820 | |
| | |
| | FHLMC – 12.8% | |
| | 2,839 | | | | 6.000 | | | | 03/01/16 | | | | 2,919 | |
| | 335 | | | | 5.000 | | | | 09/01/16 | | | | 346 | |
| | 2,962 | | | | 5.000 | | | | 11/01/16 | | | | 3,124 | |
| | 10,271 | | | | 5.000 | | | | 01/01/17 | | | | 10,835 | |
| | 15,648 | | | | 5.000 | | | | 02/01/17 | | | | 16,511 | |
| | 14,278 | | | | 5.000 | | | | 03/01/17 | | | | 15,063 | |
| | 27,096 | | | | 5.000 | | | | 04/01/17 | | | | 28,590 | |
| | 793 | | | | 5.000 | | | | 05/01/17 | | | | 837 | |
| | 843 | | | | 5.000 | | | | 08/01/17 | | | | 888 | |
| | 81,861 | | | | 5.000 | | | | 09/01/17 | | | | 86,372 | |
| | 100,902 | | | | 5.000 | | | | 10/01/17 | | | | 106,461 | |
| | 59,150 | | | | 5.000 | | | | 11/01/17 | | | | 62,408 | |
| | 57,857 | | | | 5.000 | | | | 12/01/17 | | | | 61,044 | |
| | 69,467 | | | | 5.000 | | | | 01/01/18 | | | | 73,284 | |
| | 167,301 | | | | 5.000 | | | | 02/01/18 | | | | 176,469 | |
| | 157,612 | | | | 5.000 | | | | 03/01/18 | | | | 166,346 | |
| | 149,888 | | | | 5.000 | | | | 04/01/18 | | | | 158,196 | |
| | 18,047 | | | | 4.500 | | | | 05/01/18 | | | | 19,020 | |
| | 115,215 | | | | 5.000 | | | | 05/01/18 | | | | 121,621 | |
| | 29,397 | | | | 5.000 | | | | 06/01/18 | | | | 31,049 | |
| | 30,020 | | | | 5.000 | | | | 07/01/18 | | | | 31,792 | |
| | 13,880 | | | | 5.000 | | | | 08/01/18 | | | | 14,671 | |
| | 11,125 | | | | 5.000 | | | | 09/01/18 | | | | 11,741 | |
| | 35,243 | | | | 5.000 | | | | 10/01/18 | | | | 37,220 | |
| | 43,444 | | | | 5.000 | | | | 11/01/18 | | | | 45,902 | |
| | |
| | Mortgage-Backed Obligations – (continued) | |
| | FHLMC – (continued) | |
| 19,102 | | | | 5.000 | | | | 12/01/18 | | | | 20,157 | |
| | 4,087 | | | | 5.000 | | | | 01/01/19 | | | | 4,314 | |
| | 593 | | | | 5.000 | | | | 02/01/19 | | | | 629 | |
| | 142,134 | | | | 5.500 | | | | 04/01/20 | | | | 151,888 | |
| | 477,768 | | | | 5.000 | | | | 11/01/22 | | | | 525,769 | |
| | 437,956 | | | | 4.500 | | | | 08/01/23 | | | | 472,562 | |
| | 55,560 | | | | 7.000 | | | | 04/01/31 | | | | 63,972 | |
| | 934,143 | | | | 7.000 | | | | 09/01/31 | | | | 1,074,944 | |
| | 253,697 | | | | 7.000 | | | | 04/01/32 | | | | 286,117 | |
| | 705,659 | | | | 7.000 | | | | 05/01/32 | | | | 804,782 | |
| | 219,519 | | | | 5.000 | | | | 10/01/33 | | | | 242,667 | |
| | 19,651 | | | | 5.500 | | | | 12/01/33 | | | | 22,198 | |
| | 292,318 | | | | 5.500 | | | | 04/01/35 | | | | 326,434 | |
| | 10,357 | | | | 5.000 | | | | 07/01/35 | | | | 11,456 | |
| | 233,556 | | | | 5.000 | | | | 12/01/35 | | | | 258,180 | |
| | 143,230 | | | | 5.500 | | | | 01/01/36 | | | | 160,004 | |
| | 460 | | | | 5.500 | | | | 02/01/36 | | | | 514 | |
| | 2,318 | | | | 5.000 | | | | 02/01/37 | | | | 2,559 | |
| | 8,595 | | | | 5.500 | | | | 01/01/38 | | | | 9,550 | |
| | 924,207 | | | | 7.000 | | | | 02/01/39 | | | | 1,051,647 | |
| | 857,965 | | | | 5.000 | | | | 05/01/39 | | | | 945,359 | |
| | 1,436,475 | | | | 5.000 | | | | 07/01/39 | | | | 1,582,796 | |
| | 68,653 | | | | 5.000 | | | | 08/01/40 | | | | 75,804 | |
| | 67,874 | | | | 5.000 | | | | 10/01/40 | | | | 74,944 | |
| | 146,730 | | | | 4.500 | | | | 02/01/41 | | | | 158,498 | |
| | 8,046 | | | | 5.000 | | | | 06/01/41 | | | | 8,903 | |
| | 81,646 | | | | 3.000 | | | | 05/01/42 | | | | 80,665 | |
| | 342,271 | | | | 3.500 | | | | 06/01/42 | | | | 351,924 | |
| | 293,769 | | | | 3.000 | | | | 08/01/42 | | | | 291,760 | |
| | 80,904 | | | | 3.000 | | | | 10/01/42 | | | | 80,214 | |
| | 541,616 | | | | 3.500 | | | | 10/01/42 | | | | 551,730 | |
| | 962,239 | | | | 4.000 | | | | 10/01/42 | | | | 1,016,327 | |
| | 8,694,068 | | | | 3.000 | | | | 11/01/42 | | | | 8,627,356 | |
| | 439,818 | | | | 3.500 | | | | 11/01/42 | | | | 448,030 | |
| | 2,816,944 | | | | 3.000 | | | | 12/01/42 | | | | 2,801,567 | |
| | 7,019,507 | | | | 3.000 | | | | 01/01/43 | | | | 6,978,336 | |
| | 389,804 | | | | 3.000 | | | | 02/01/43 | | | | 385,628 | |
| | 325,746 | | | | 3.000 | | | | 03/01/43 | | | | 324,130 | |
| | 475,203 | | | | 3.000 | | | | 04/01/43 | | | | 472,846 | |
| | | | | | | | | | | | | | |
| | | | | | | | | | | | | 32,029,869 | |
| | |
| | FNMA – 57.9% | |
| | 351 | | | | 5.500 | | | | 04/01/16 | | | | 371 | |
| | 348 | | | | 5.500 | | | | 08/01/16 | | | | 368 | |
| | 6,265 | | | | 5.500 | | | | 11/01/16 | | | | 6,628 | |
| | 4,596 | | | | 5.500 | | | | 12/01/16 | | | | 4,861 | |
| | 7,212 | | | | 5.500 | | | | 01/01/17 | | | | 7,631 | |
| | 633 | | | | 5.500 | | | | 05/01/17 | | | | 674 | |
| | 2,762 | | | | 5.500 | | | | 07/01/17 | | | | 2,941 | |
| | 292 | | | | 5.500 | | | | 09/01/17 | | | | 311 | |
| | 6,146 | | | | 5.500 | | | | 01/01/18 | | | | 6,544 | |
| | 5,067 | | | | 5.500 | | | | 02/01/18 | | | | 5,396 | |
| | 553 | | | | 6.000 | | | | 02/01/18 | | | | 624 | |
| | 837,407 | | | | 2.800 | | | | 03/01/18 | | | | 866,746 | |
| | 156,998 | | | | 5.000 | | | | 03/01/18 | | | | 165,639 | |
| | 11,990 | | | | 5.500 | | | | 04/01/18 | | | | 12,695 | |
| | 2,530,000 | | | | 3.840 | | | | 05/01/18 | | | | 2,709,840 | |
| | |
| | |
| The accompanying notes are an integral part of these financial statements. | | 117 |
GOLDMAN SACHS U.S. MORTGAGES FUND
Schedule of Investments (continued)
September 30, 2014 (Unaudited)
| | | | | | | | | | | | | | |
Principal
Amount | | | Interest
Rate | | | Maturity
Date | | | Value | |
| | Mortgage-Backed Obligations – (continued) | |
| | FNMA – (continued) | |
| $ | 2,759 | | | | 5.500 | % | | | 05/01/18 | | | $ | 2,931 | |
| | 6,160 | | | | 6.000 | | | | 05/01/18 | | | | 6,955 | |
| | 206,791 | | | | 5.000 | | | | 06/01/18 | | | | 218,780 | |
| | 599,183 | | | | 4.000 | | | | 08/01/18 | | | | 633,198 | |
| | 11,313 | | | | 5.000 | | | | 09/01/18 | | | | 11,976 | |
| | 57,279 | | | | 6.000 | | | | 11/01/18 | | | | 64,670 | |
| | 23,372 | | | | 7.000 | | | | 11/01/18 | | | | 24,310 | |
| | 90,029 | | | | 6.000 | | | | 12/01/18 | | | | 101,644 | |
| | 89,164 | | | | 6.000 | | | | 01/01/19 | | | | 100,669 | |
| | 2,533 | | | | 5.500 | | | | 02/01/19 | | | | 2,708 | |
| | 14,216 | | | | 5.500 | | | | 04/01/19 | | | | 15,182 | |
| | 27,118 | | | | 6.000 | | | | 04/01/19 | | | | 30,617 | |
| | 1,967 | | | | 5.500 | | | | 05/01/19 | | | | 2,083 | |
| | 5,905 | | | | 6.000 | | | | 05/01/19 | | | | 6,667 | |
| | 13,755 | | | | 5.500 | | | | 07/01/19 | | | | 14,704 | |
| | 38,952 | | | | 5.500 | | | | 08/01/19 | | | | 41,575 | |
| | 18,416 | | | | 5.500 | | | | 09/01/19 | | | | 19,875 | |
| | 42,975 | | | | 5.500 | | | | 10/01/19 | | | | 46,009 | |
| | 14,643 | | | | 5.500 | | | | 11/01/19 | | | | 15,841 | |
| | 10,699 | | | | 5.500 | | | | 12/01/19 | | | | 11,506 | |
| | 60,542 | | | | 5.500 | | | | 02/01/20 | | | | 64,711 | |
| | 235,805 | | | | 4.500 | | | | 03/01/20 | | | | 248,815 | |
| | 849,040 | | | | 3.416 | | | | 10/01/20 | | | | 895,546 | |
| | 21,173 | | | | 5.500 | | | | 01/01/21 | | | | 23,019 | |
| | 30,530 | | | | 7.000 | | | | 09/01/21 | | | | 34,000 | |
| | 101,270 | | | | 7.000 | | | | 06/01/22 | | | | 115,081 | |
| | 38,667 | | | | 7.000 | | | | 07/01/22 | | | | 42,825 | |
| | 3,863 | | | | 4.500 | | | | 04/01/23 | | | | 4,126 | |
| | 437,349 | | | | 6.000 | | | | 06/01/26 | | | | 497,444 | |
| | 266,945 | | | | 5.000 | | | | 07/01/27 | | | | 294,531 | |
| | 526 | | | | 7.000 | | | | 01/01/29 | | | | 530 | |
| | 1,861 | | | | 7.000 | | | | 09/01/29 | | | | 1,947 | |
| | 14,689 | | | | 7.000 | | | | 08/01/31 | | | | 16,939 | |
| | 1,499 | | | | 7.000 | | | | 03/01/32 | | | | 1,730 | |
| | 2,151 | | | | 7.000 | | | | 04/01/32 | | | | 2,404 | |
| | 6,963 | | | | 7.000 | | | | 06/01/32 | | | | 7,499 | |
| | 879 | | | | 7.000 | | | | 07/01/32 | | | | 921 | |
| | 70,336 | | | | 6.000 | | | | 01/01/33 | | | | 80,419 | |
| | 2,206 | | | | 6.000 | | | | 02/01/33 | | | | 2,523 | |
| | 7,370 | | | | 5.500 | | | | 04/01/33 | | | | 8,281 | |
| | 536,165 | | | | 5.500 | | | | 05/01/33 | | | | 602,401 | |
| | 336,551 | | | | 5.500 | | | | 06/01/33 | | | | 378,127 | |
| | 213,958 | | | | 5.500 | | | | 07/01/33 | | | | 240,390 | |
| | 38,075 | | | | 5.000 | | | | 08/01/33 | | | | 42,204 | |
| | 2,521 | | | | 5.000 | | | | 09/01/33 | | | | 2,785 | |
| | 37,217 | | | | 5.500 | | | | 09/01/33 | | | | 41,804 | |
| | 24,059 | | | | 5.500 | | | | 12/01/33 | | | | 27,031 | |
| | 118,168 | | | | 5.500 | | | | 02/01/34 | | | | 132,701 | |
| | 9,522 | | | | 5.500 | | | | 03/01/34 | | | | 10,685 | |
| | 26,220 | | | | 5.500 | | | | 04/01/34 | | | | 29,450 | |
| | 3,308 | | | | 5.500 | | | | 06/01/34 | | | | 3,716 | |
| | 86,323 | | | | 5.500 | | | | 07/01/34 | | | | 96,888 | |
| | 13,073 | | | | 5.500 | | | | 08/01/34 | | | | 14,750 | |
| | 44,976 | | | | 5.500 | | | | 10/01/34 | | | | 50,457 | |
| | 58,167 | | | | 5.500 | | | | 11/01/34 | | | | 65,347 | |
| | 453,184 | | | | 5.500 | | | | 12/01/34 | | | | 508,591 | |
| | |
| | Mortgage-Backed Obligations – (continued) | |
| | FNMA – (continued) | |
| 353 | | | | 6.000 | | | | 12/01/34 | | | | 399 | |
| | 4,725 | | | | 5.500 | | | | 01/01/35 | | | | 5,308 | |
| | 372,329 | | | | 5.500 | | | | 02/01/35 | | | | 418,311 | |
| | 28,698 | | | | 5.500 | | | | 03/01/35 | | | | 32,240 | |
| | 260,611 | | | | 6.000 | | | | 04/01/35 | | | | 298,020 | |
| | 67,816 | | | | 5.500 | | | | 05/01/35 | | | | 75,940 | |
| | 7,908 | | | | 5.500 | | | | 06/01/35 | | | | 8,865 | |
| | 14,253 | | | | 5.000 | | | | 07/01/35 | | | | 15,777 | |
| | 15,828 | | | | 5.500 | | | | 07/01/35 | | | | 17,791 | |
| | 145,185 | | | | 5.500 | | | | 08/01/35 | | | | 163,088 | |
| | 16,248 | | | | 5.500 | | | | 09/01/35 | | | | 18,235 | |
| | 12,281 | | | | 5.500 | | | | 10/01/35 | | | | 13,733 | |
| | 145,745 | | | | 6.000 | | | | 10/01/35 | | | | 164,509 | |
| | 60,133 | | | | 5.500 | | | | 12/01/35 | | | | 67,324 | |
| | 3,889 | | | | 6.000 | | | | 12/01/35 | | | | 4,389 | |
| | 7,778 | | | | 5.500 | | | | 01/01/36 | | | | 8,697 | |
| | 224 | | | | 5.500 | | | | 02/01/36 | | | | 250 | |
| | 29,110 | | | | 5.500 | | | | 04/01/36 | | | | 32,465 | |
| | 3,593 | | | | 6.000 | | | | 04/01/36 | | | | 4,055 | |
| | 56,824 | | | | 5.500 | | | | 07/01/36 | | | | 63,230 | |
| | 52,389 | | | | 5.500 | | | | 09/01/36 | | | | 58,856 | |
| | 5,929 | | | | 5.500 | | | | 02/01/37 | | | | 6,626 | |
| | 89,578 | | | | 5.500 | | | | 04/01/37 | | | | 100,560 | |
| | 107,649 | | | | 6.000 | | | | 04/01/37 | | | | 121,493 | |
| | 1,168 | | | | 5.500 | | | | 05/01/37 | | | | 1,305 | |
| | 62,778 | | | | 5.000 | | | | 06/01/37 | | | | 69,372 | |
| | 494 | | | | 5.500 | | | | 06/01/37 | | | | 551 | |
| | 8,343 | | | | 5.500 | | | | 07/01/37 | | | | 9,322 | |
| | 1,315,569 | | | | 5.500 | | | | 08/01/37 | | | | 1,473,111 | |
| | 273,262 | | | | 6.000 | | | | 08/01/37 | | | | 308,405 | |
| | 726,738 | | | | 6.000 | | | | 10/01/37 | | | | 820,202 | |
| | 178,099 | | | | 6.500 | | | | 10/01/37 | | | | 200,814 | |
| | 110,202 | | | | 6.000 | | | | 11/01/37 | | | | 124,374 | |
| | 271 | | | | 5.500 | | | | 12/01/37 | | | | 303 | |
| | 100,910 | | | | 5.500 | | | | 01/01/38 | | | | 113,365 | |
| | 82,469 | | | | 5.500 | | | | 02/01/38 | | | | 92,643 | |
| | 11,343 | | | | 5.500 | | | | 03/01/38 | | | | 12,655 | |
| | 1,000,000 | | | | 6.000 | | | | 03/01/38 | | | | 1,128,607 | |
| | 38,090 | | | | 5.500 | | | | 04/01/38 | | | | 42,645 | |
| | 9,805 | | | | 5.500 | | | | 05/01/38 | | | | 10,979 | |
| | 177,309 | | | | 6.000 | | | | 05/01/38 | | | | 200,112 | |
| | 4,324 | | | | 5.500 | | | | 06/01/38 | | | | 4,820 | |
| | 2,306 | | | | 5.500 | | | | 07/01/38 | | | | 2,576 | |
| | 4,867 | | | | 5.500 | | | | 08/01/38 | | | | 5,426 | |
| | 4,839 | | | | 5.500 | | | | 09/01/38 | | | | 5,394 | |
| | 194,778 | | | | 6.000 | | | | 09/01/38 | | | | 219,843 | |
| | 222,008 | | | | 6.000 | | | | 11/01/38 | | | | 250,560 | |
| | 111,597 | | | | 5.500 | | | | 12/01/38 | | | | 125,368 | |
| | 556,793 | | | | 6.000 | | | | 12/01/38 | | | | 628,445 | |
| | 872,467 | | | | 5.000 | | | | 01/01/39 | | | | 963,622 | |
| | 297,732 | | | | 6.000 | | | | 01/01/39 | | | | 336,046 | |
| | 527,480 | | | | 6.500 | | | | 01/01/39 | | | | 589,841 | |
| | 11,558 | | | | 5.500 | | | | 02/01/39 | | | | 12,940 | |
| | 634,195 | | | | 7.000 | | | | 03/01/39 | | | | 718,905 | |
| | 16,038 | | | | 5.500 | | | | 06/01/39 | | | | 17,846 | |
| | 11,919 | | | | 4.000 | | | | 08/01/39 | | | | 12,570 | |
| | |
| | |
| 118 | | The accompanying notes are an integral part of these financial statements. |
GOLDMAN SACHS U.S. MORTGAGES FUND
| | | | | | | | | | | | | | |
Principal
Amount | | | Interest
Rate | | | Maturity
Date | | | Value | |
| | Mortgage-Backed Obligations – (continued) | |
| | FNMA – (continued) | |
| $ | 509,192 | | | | 6.000 | % | | | 09/01/39 | | | $ | 574,678 | |
| | 169,396 | | | | 6.000 | | | | 10/01/39 | | | | 191,231 | |
| | 14,449 | | | | 5.500 | | | | 11/01/39 | | | | 16,078 | |
| | 126,874 | | | | 6.000 | | | | 10/01/40 | | | | 143,191 | |
| | 349,328 | | | | 4.500 | | | | 02/01/41 | | | | 377,295 | |
| | 4,784,059 | | | | 6.000 | | | | 05/01/41 | | | | 5,399,325 | |
| | 154,608 | | | | 4.500 | | | | 08/01/41 | | | | 167,140 | |
| | 39,972 | | | | 4.500 | | | | 10/01/41 | | | | 43,193 | |
| | 443,950 | | | | 3.000 | | | | 08/01/42 | | | | 441,216 | |
| | 581,318 | | | | 3.000 | | | | 09/01/42 | | | | 576,873 | |
| | 780,880 | | | | 3.000 | | | | 10/01/42 | | | | 775,522 | |
| | 861,566 | | | | 3.000 | | | | 11/01/42 | | | | 855,531 | |
| | 3,490,671 | | | | 3.000 | | | | 12/01/42 | | | | 3,462,983 | |
| | 97,033 | | | | 2.500 | | | | 01/01/43 | | | | 92,078 | |
| | 4,202,223 | | | | 3.000 | | | | 01/01/43 | | | | 4,168,817 | |
| | 2,931,399 | | | | 2.500 | | | | 02/01/43 | | | | 2,781,696 | |
| | 1,335,064 | | | | 3.000 | | | | 02/01/43 | | | | 1,325,918 | |
| | 2,531,177 | | | | 3.000 | | | | 03/01/43 | | | | 2,515,070 | |
| | 2,264,944 | | | | 3.000 | | | | 04/01/43 | | | | 2,250,386 | |
| | 866,514 | | | | 2.500 | | | | 05/01/43 | | | | 822,262 | |
| | 2,670,913 | | | | 3.000 | | | | 05/01/43 | | | | 2,653,948 | |
| | 91,954 | | | | 3.000 | | | | 06/01/43 | | | | 91,334 | |
| | 799,975 | | | | 3.000 | | | | 07/01/43 | | | | 794,319 | |
| | 4,000,000 | | | | 3.500 | | | | TBA-15yr | (e) | | | 4,204,375 | |
| | 17,000,000 | | | | 3.500 | | | | TBA-30yr | (e) | | | 17,373,203 | |
| | 54,000,000 | | | | 4.500 | | | | TBA-30yr | (e) | | | 58,117,500 | |
| | 1,000,000 | | | | 5.000 | | | | TBA-30yr | (e) | | | 1,103,594 | |
| | 1,000,000 | | | | 5.500 | | | | TBA-30yr | (e) | | | 1,113,906 | |
| | 7,000,000 | | | | 6.000 | | | | TBA-30yr | (e) | | | 7,906,797 | |
| | 5,000,000 | | | | 3.000 | | | | TBA-30yr | (e) | | | 4,927,734 | |
| | | | | | | | | | | | | | |
| | | | | | | | | | | | | 145,224,108 | |
| | |
| | GNMA – 4.8% | |
| | 116,147 | | | | 5.500 | | | | 07/15/20 | | | | 123,085 | |
| | 285,689 | | | | 3.950 | | | | 07/15/25 | | | | 297,835 | |
| | 11,693 | | | | 6.000 | | | | 04/15/26 | | | | 13,205 | |
| | 1,037 | | | | 6.500 | | | | 01/15/32 | | | | 1,181 | |
| | 1,984 | | | | 6.500 | | | | 02/15/32 | | | | 2,259 | |
| | 990,481 | | | | 5.500 | | | | 04/15/33 | | | | 1,127,359 | |
| | 8,035 | | | | 5.000 | | | | 11/15/33 | | | | 8,952 | |
| | 2,190 | | | | 6.500 | | | | 08/15/34 | | | | 2,563 | |
| | 201 | | | | 6.500 | | | | 01/15/36 | | | | 228 | |
| | 1,853 | | | | 6.500 | | | | 02/15/36 | | | | 2,100 | |
| | 4,148 | | | | 6.500 | | | | 03/15/36 | | | | 4,712 | |
| | 9,586 | | | | 6.500 | | | | 04/15/36 | | | | 10,886 | |
| | 28,217 | | | | 6.500 | | | | 05/15/36 | | | | 32,234 | |
| | 19,416 | | | | 6.500 | | | | 06/15/36 | | | | 22,100 | |
| | 120,224 | | | | 6.500 | | | | 07/15/36 | | | | 138,152 | |
| | 121,743 | | | | 6.500 | | | | 08/15/36 | | | | 139,393 | |
| | 183,406 | | | | 6.500 | | | | 09/15/36 | | | | 209,689 | |
| | 75,334 | | | | 6.500 | | | | 10/15/36 | | | | 85,700 | |
| | 118,058 | | | | 6.500 | | | | 11/15/36 | | | | 134,394 | |
| | 47,022 | | | | 6.500 | | | | 12/15/36 | | | | 54,108 | |
| | 22,427 | | | | 6.500 | | | | 01/15/37 | | | | 25,640 | |
| | 5,438 | | | | 6.500 | | | | 03/15/37 | | | | 6,264 | |
| | 15,216 | | | | 6.500 | | | | 04/15/37 | | | | 17,370 | |
| | 9,520 | | | | 6.500 | | | | 05/15/37 | | | | 10,870 | |
| | |
| | Mortgage-Backed Obligations – (continued) | |
| | GNMA – (continued) | |
| 5,020 | | | | 6.500 | | | | 08/15/37 | | | | 5,691 | |
| | 35,756 | | | | 6.500 | | | | 09/15/37 | | | | 40,646 | |
| | 35,021 | | | | 6.500 | | | | 10/15/37 | | | | 39,703 | |
| | 24,144 | | | | 6.500 | | | | 11/15/37 | | | | 28,138 | |
| | 8,466 | | | | 6.500 | | | | 05/15/38 | | | | 9,630 | |
| | 9,182 | | | | 6.500 | | | | 11/15/38 | | | | 10,729 | |
| | 7,578 | | | | 6.500 | | | | 02/15/39 | | | | 8,766 | |
| | 714,705 | | | | 5.000 | | | | 07/15/40 | | | | 795,745 | |
| | 37,268 | | | | 2.500 | | | | 12/20/42 | | | | 36,133 | |
| | 5,000,000 | | | | 3.500 | | | | TBA-30yr(e) | | | | 5,168,750 | |
| | 3,000,000 | | | | 5.000 | | | | TBA-30yr(e) | | | | 3,300,937 | |
| | | | | | | | | | | | | | |
| | | | | | | | | | | | | 11,915,147 | |
| | |
| | TOTAL FEDERAL AGENCIES | | | $ | 192,879,553 | |
| | |
| | TOTAL MORTGAGE-BACKED OBLIGATIONS | |
| | (Cost $249,163,205) | | | $ | 251,303,944 | |
| | |
| | | | | | | | | | | | | | |
| | Agency Debentures(f) – 20.0% | |
| FHLB | |
| | $20,000,000 | | | | 0.000 | % | | | 11/19/14 | | | $ | 19,999,640 | |
| | 30,000,000 | | | | 0.000 | | | | 12/17/14 | | | | 29,999,040 | |
| | |
| | TOTAL AGENCY DEBENTURES | |
| | (Cost $49,995,839) | | | $ | 49,998,680 | |
| | |
| | | | | | | | | | | | | | |
| | Asset-Backed Securities(a) – 0.9% | |
| | Home Equity – 0.1% | |
| Countrywide Home Equity Loan Trust Series 2003-D, Class A | |
| $ | 6,541 | | | | 0.414 | % | | | 06/15/29 | | | $ | 6,484 | |
| Countrywide Home Equity Loan Trust Series 2004-G, Class 2A | |
| | 33,615 | | | | 0.374 | | | | 12/15/29 | | | | 30,311 | |
| Countrywide Home Equity Loan Trust Series 2004-O, Class 1A | |
| | 131,475 | | | | 0.434 | | | | 02/15/34 | | | | 111,197 | |
| Residential Asset Mortgage Products, Inc. Series 2004-RZ1,
Class AII |
|
| | 182,163 | | | | 0.635 | | | | 03/25/34 | | | | 175,644 | |
| | | | | | | | | | | | | | |
| | | | | | | | | | | | | 323,636 | |
| | |
| | Student Loan – 0.8% | |
| Brazos Higher Education Authority, Inc. Series 2004-1, Class A-2 | |
| | 142,225 | | | | 0.394 | | | | 06/27/22 | | | | 142,125 | |
| Education Funding Capital Trust I Series 2004-1, Class A2 | |
| | 8,102 | | | | 0.394 | | | | 12/15/22 | | | | 8,098 | |
| Education Loan Asset-Backed Trust I Series 2013-1, Class A1(d) | |
| | 1,778,358 | | | | 0.956 | | | | 06/25/26 | | | | 1,787,977 | |
| Northstar Education Finance, Inc. Series 2005-1, Class A1 | |
| | 18,929 | | | | 0.335 | | | | 10/28/26 | | | | 18,855 | |
| US Education Loan Trust LLC Series 2006-1, Class A2(d) | |
| | 68,488 | | | | 0.364 | | | | 03/01/25 | | | | 68,410 | |
| | | | | | | | | | | | | | |
| | | | | | | | | | | | | 2,025,465 | |
| | |
| | TOTAL ASSET-BACKED SECURITIES | |
| | (Cost $2,376,510) | | | $ | 2,349,101 | |
| | |
| | | | | | | | | | | | | | |
| | |
| The accompanying notes are an integral part of these financial statements. | | 119 |
GOLDMAN SACHS U.S. MORTGAGES FUND
Schedule of Investments (continued)
September 30, 2014 (Unaudited)
| | | | | | | | | | | | | | |
Principal
Amount | | | Interest
Rate | | | Maturity
Date | | | Value | |
| | U.S. Treasury Obligation – 0.2% | |
| United States Treasury Bond | |
| $ | 500,000 | | | | 3.625 | % | | | 02/15/44 | | | $ | 540,375 | |
| | (Cost $509,067) | |
| | |
| | | | | | | | | | | | | | |
Notional
Amount | | | Exercise Rate | | | Expiration Date | | | Value | |
| | Options Purchased – 0.6% | |
| | Interest Rate Swaptions | |
| Deutsche Bank Securities, Inc. Put - OTC - 5 year Interest Rate
Swap Strike Price 2.550% |
|
| $ | 1,400,000 | | | | 2.550 | % | | | 09/28/15 | | | $ | 22,727 | |
| Deutsche Bank AG Call - OTC - 5 year Interest Rate Swap
Strike Price 2.550% |
|
| | 1,400,000 | | | | 2.550 | | | | 09/28/15 | | | | 21,398 | |
| Deutsche Bank AG Put - OTC - 5 year Interest Rate Swap
Strike Price 3.110% |
|
| | 5,200,000 | | | | 3.110 | | | | 09/19/16 | | | | 141,923 | |
| Deutsche Bank AG Call - OTC - 5 year Interest Rate Swap
Strike Price 3.110% |
|
| | 5,200,000 | | | | 3.110 | | | | 09/19/16 | | | | 104,177 | |
| Deutsche Bank AG Put - OTC - 5 year Interest Rate Swap
Strike Price 2.940% |
|
| | 2,200,000 | | | | 2.940 | | | | 09/29/16 | | | | 50,189 | |
| Deutsche Bank AG Call - OTC - 5 year Interest Rate Swap
Strike Price 2.940% |
|
| | 2,200,000 | | | | 2.940 | | | | 09/29/16 | | | | 52,615 | |
| Deutsche Bank AG Put - OTC - 10 year Interest Rate Swap
Strike Price 4.135% |
|
| | 3,300,000 | | | | 4.135 | | | | 04/17/19 | | | | 277,973 | |
| Deutsche Bank AG Call - OTC - 10 year Interest Rate Swap
Strike Price 4.135% |
|
| | 3,300,000 | | | | 4.135 | | | | 04/17/19 | | | | 128,608 | |
| JPMorgan Chase Bank NA Call - OTC - 5 year Interest Rate
Swap Strike Price 2.783% |
|
| | 4,300,000 | | | | 2.783 | | | | 09/30/15 | | | | 47,838 | |
| JPMorgan Chase Bank NA Put - OTC - 5 year Interest Rate Swap
Strike Price 3.080% |
|
| | 2,800,000 | | | | 3.080 | | | | 09/19/16 | | | | 74,148 | |
| JPMorgan Chase Bank NA Call - OTC - 5 year Interest Rate
Swap Strike Price 3.080% |
|
| | 2,800,000 | | | | 3.080 | | | | 09/19/16 | | | | 57,695 | |
| JPMorgan Chase Bank NA Put - OTC - 5 year Interest Rate Swap
Strike Price 2.973% |
|
| | 2,000,000 | | | | 2.973 | | | | 09/26/16 | | | | 47,304 | |
| JPMorgan Chase Bank NA Call - OTC - 5 year Interest Rate
Swap Strike Price 2.973% |
|
| | 2,000,000 | | | | 2.973 | | | | 09/26/16 | | | | 46,061 | |
| JPMorgan Chase Bank NA Put - OTC - 10 year Interest Rate
Swap Strike Price 3.955% |
|
| | 1,000,000 | | | | 3.955 | | | | 05/07/19 | | | | 75,123 | |
| JPMorgan Chase Bank NA Call - OTC - 10 year Interest Rate
Swap Strike Price 3.955% |
|
| | 1,000,000 | | | | 3.955 | | | | 05/07/19 | | | | 44,325 | |
| Morgan Stanley Capital Services, Inc. Put - OTC - 5 year Interest
Rate Swap Strike Price 2.550% |
|
| | 1,100,000 | | | | 2.550 | | | | 09/28/15 | | | | 17,857 | |
| | |
| | Options Purchased – (continued) | |
| | Interest Rate Swaptions – (continued) | |
| Morgan Stanley Capital Services, Inc. Call - OTC - 5 year Interest
Rate Swap Strike Price 2.550% |
|
| 1,100,000 | | | | 2.550 | | | | 09/28/15 | | | | 16,813 | |
| Morgan Stanley Capital Services, Inc. Put - OTC - 5 year Interest
Rate Swap Strike Price 3.115% |
|
| | 2,800,000 | | | | 3.115 | | | | 09/19/16 | | | | 76,802 | |
| Morgan Stanley Capital Services, Inc. Call - OTC - 5 year Interest
Rate Swap Strike Price 3.115% |
|
| | 2,800,000 | | | | 3.115 | | | | 09/19/16 | | | | 55,832 | |
| Morgan Stanley Capital Services, Inc. Put - OTC - 5 year Interest
Rate Swap Strike Price 2.950% |
|
| | 2,900,000 | | | | 2.950 | | | | 09/26/16 | | | | 66,962 | |
| Morgan Stanley Capital Services, Inc. Call - OTC - 5 year Interest
Rate Swap Strike Price 2.950% |
|
| | 2,900,000 | | | | 2.950 | | | | 09/26/16 | | | | 68,165 | |
| Morgan Stanley Capital Services, Inc. Call - OTC - 7 year Interest
Rate Swap Strike Price 3.010% |
|
| | 3,300,000 | | | | 3.010 | | | | 09/29/15 | | | | 49,238 | |
| | |
| | TOTAL OPTIONS PURCHASED | |
| | (Cost $1,505,518) | | | $ | 1,543,773 | |
| | |
| TOTAL INVESTMENTS BEFORE SHORT-TERM
INVESTMENT |
|
| | (Cost $303,550,139) | | | $ | 305,735,873 | |
| | |
| | | | | | | | | | | | | | |
Principal
Amount | | | Interest
Rate | | | Maturity
Date | | | Value | |
| | Short-term Investment(g) – 18.6% | |
| | Repurchase Agreement – 18.6% | |
| Joint Repurchase Agreement Account II | |
| | $46,600,000 | | | | 0.012 | % | | | 10/01/14 | | | $ | 46,600,000 | |
| | (Cost $46,600,000) | |
| | |
| | TOTAL INVESTMENTS – 140.6% | |
| | (Cost $350,150,139) | | | $ | 352,335,873 | |
| | |
| LIABILITIES IN EXCESS OF OTHER
ASSETS – (40.6)% |
| | | (101,688,385 | ) |
| | |
| | NET ASSETS – 100.0% | | | $ | 250,647,488 | |
| | |
| | |
| 120 | | The accompanying notes are an integral part of these financial statements. |
GOLDMAN SACHS U.S. MORTGAGES FUND
| | |
| The percentage shown for each investment category reflects the value of investments in that category as a percentage of net assets. |
(a) | | Variable rate security. Interest rate or distribution rate disclosed is that which is in effect at September 30, 2014. |
(b) | | Security with a notional or nominal principal amount. The actual effective yield of this security is different than the stated interest rate. |
(c) | | Issued with zero coupon and interest rate is contingent upon LIBOR reaching a predetermined level. |
(d) | | Exempt from registration under Rule 144A of the Securities Act of 1933. Under procedures approved by the Board of Trustees, such securities have been determined to be liquid by the investment adviser and may be resold, normally to qualified institutional buyers in transactions exempt from registration. Total market value of Rule 144A securities amounts to $3,298,564, which represents approximately 1.3% of net assets as of September 30, 2014. |
(e) | | TBA (To Be Announced) Securities are purchased on a forward commitment basis with an approximate principal amount and no defined maturity date. The actual principal and maturity date will be determined upon settlement when the specific mortgage pools are assigned. Total market value of TBA securities (excluding forward sales contracts, if any) amounts to $103,216,796 which represents approximately 41.2% of net assets as of September 30, 2014. |
(f) | | Issued with a zero coupon. Income is recognized through the accretion of discount. |
(g) | | Joint repurchase agreement was entered into on September 30, 2014. Additional information appears on page 123. |
| | |
|
Investment Abbreviations: |
FHLB | | —Federal Home Loan Bank |
FHLMC | | —Federal Home Loan Mortgage Corp. |
FNMA | | —Federal National Mortgage Association |
GNMA | | —Government National Mortgage Association |
LIBOR | | —London Interbank Offered Rate |
OTC | | —Over the Counter |
REMIC | | —Real Estate Mortgage Investment Conduit |
STRIPS | | —Separate Trading of Registered Interest and Principal of Securities |
|
| | |
| The accompanying notes are an integral part of these financial statements. | | 121 |
GOLDMAN SACHS U.S. MORTGAGES FUND
Schedule of Investments (continued)
September 30, 2014 (Unaudited)
|
| ADDITIONAL INVESTMENT INFORMATION |
FUTURES CONTRACTS — At September 30, 2014, the Fund had the following futures contracts:
| | | | | | | | | | | | | | |
| Type | | Number of
Contracts
Long (Short) | | | Expiration
Date | | Current
Value | | | Unrealized
Gain (Loss) | |
Eurodollars | | | (47 | ) | | March 2017 | | $ | (11,465,063 | ) | | $ | 12,808 | |
Eurodollars | | | (58 | ) | | June 2016 | | | (14,258,575 | ) | | | 22,375 | |
Eurodollars | | | (27 | ) | | September 2017 | | | (6,563,363 | ) | | | 14,033 | |
Ultra Long U.S. Treasury Bonds | | | (15 | ) | | December 2014 | | | (2,287,500 | ) | | | 37,764 | |
2 Year U.S. Treasury Notes | | | 40 | | | December 2014 | | | 8,753,750 | | | | (3,193 | ) |
5 Year U.S. Treasury Notes | | | (293 | ) | | December 2014 | | | (34,649,539 | ) | | | 94,701 | |
10 Year U.S. Treasury Notes | | | 145 | | | December 2014 | | | 18,072,891 | | | | (102,032 | ) |
20 Year U.S. Treasury Bonds | | | 90 | | | December 2014 | | | 12,411,563 | | | | (145,834 | ) |
| TOTAL | | | | | | | | | | | | $ | (69,378 | ) |
SWAP CONTRACTS — At September 30, 2014, the Fund had the following swap contracts:
CENTRALLY CLEARED INTEREST RATE SWAP CONTRACTS
| | | | | | | | | | | | | | | | |
| | | | | | Rates Exchanged | | Market Value | |
Notional
Amount
(000s) | | | Termination
Date | | Payments
Received | | Payments
Made | | Upfront
Payments
Made (Received) | | | Unrealized
Gain (Loss) | |
| $ | 16,400 | (a) | | 12/17/16 | | 3 month LIBOR | | 1.000% | | $ | (3,696 | ) | | $ | 5,700 | |
| | 700 | (a) | | 02/01/17 | | 3 month LIBOR | | 1.625 | | | (396 | ) | | | 602 | |
| | 3,300 | (a) | | 08/04/17 | | 3 month LIBOR | | 2.195 | | | (3,543 | ) | | | 2,461 | |
| | 19,700 | | | 06/18/19 | | 2.000% | | 3 month LIBOR | | | 167,438 | | | | 54,813 | |
| | 2,200 | (a) | | 12/17/19 | | 3 month LIBOR | | 2.250 | | | (19,723 | ) | | | 805 | |
| | 1,600 | (a) | | 10/02/20 | | 2.532 | | 3 month LIBOR | | | 8 | | | | — | |
| | 5,000 | (a) | | 08/04/21 | | 3.025 | | 3 month LIBOR | | | 22,635 | | | | 4,556 | |
| | 3,000 | (a) | | 12/17/21 | | 3 month LIBOR | | 2.500 | | | (3,773 | ) | | | (12,865 | ) |
| | 1,400 | (a) | | 10/01/22 | | 2.760 | | 3 month LIBOR | | | 11 | | | | (1,279 | ) |
| | 2,000 | (a) | | 01/30/24 | | 4.252 | | 3 month LIBOR | | | 11,577 | | | | 62,357 | |
| | 13,300 | (a) | | 12/17/24 | | 3 month LIBOR | | 3.000 | | | (375,007 | ) | | | 50,380 | |
| | 2,700 | (a) | | 08/04/26 | | 3 month LIBOR | | 3.409 | | | (21,109 | ) | | | (19,751 | ) |
| | 600 | (a) | | 01/30/39 | | 3 month LIBOR | | 4.370 | | | (22,606 | ) | | | (40,676 | ) |
| | TOTAL | | | | | | | | | $ | (248,184 | ) | | $ | 107,103 | |
| | (a) | | Represents forward starting interest rate swaps whose effective dates of commencement of accruals and cash flows occur subsequent to September 30, 2014. |
OVER THE COUNTER TOTAL RETURN SWAP CONTRACTS
| | | | | | | | | | | | | | | | | | |
| | | | | | | | | | | | Market Value | |
| Swap Counterparty | | Notional
Amount
(000s) | | | Reference
Security | | Termination
Date | | Financing
Fee# | | Upfront
Payments
Made (Received) | | | Unrealized
Gain (Loss) | |
JPMorgan Securities, Inc. | | $ | 870 | | | Markit IOS Fannie-Mae Index,
30 yr Fixed Rate, 3.000%, Series 12 | | 01/12/43 | | One month LIBOR | | $ | 1,960 | | | $ | (1,364 | ) |
| | # | | The Fund receives annual coupon payments in accordance with the swap contract(s). On the termination date of the swap contract(s), the Fund will either receive from or pay to the counterparty an amount equal to the net of the accrued financing fees and the value of the reference security subtracted from the original notional cost (notional multiplied by the price change of the reference security, converted to U.S. Dollars). |
| | |
| 122 | | The accompanying notes are an integral part of these financial statements. |
GOLDMAN SACHS SINGLE SECTOR FIXED INCOME FUNDS
Schedule of Investments
September 30, 2014 (Unaudited)
|
| ADDITIONAL INVESTMENT INFORMATION |
JOINT REPURCHASE AGREEMENT ACCOUNT II — At September 30, 2014, the Funds had undivided interests in the Joint Repurchase Agreement Account II, with a maturity date of October 1, 2014, as follows:
| | | | | | | | | | | | |
| Fund | | Principal
Amount | | | Maturity
Value | | | Collateral
Allocation
Value | |
Dynamic Emerging Markets Debt | | $ | 1,800,000 | | | $ | 1,800,001 | | | $ | 1,848,181 | |
Emerging Markets Debt | | | 65,100,000 | | | | 65,100,021 | | | | 66,842,552 | |
High Yield | | | 66,000,000 | | | | 66,000,021 | | | | 67,766,643 | |
High Yield Floating Rate | | | 259,800,000 | | | | 259,800,084 | | | | 266,754,149 | |
Investment Grade Credit | | | 25,300,000 | | | | 25,300,008 | | | | 25,977,213 | |
Local Emerging Markets Debt | | | 135,300,000 | | | | 135,300,044 | | | | 138,921,618 | |
U.S. Mortgages | | | 46,600,000 | | | | 46,600,015 | | | | 47,847,357 | |
REPURCHASE AGREEMENTS — At September 30, 2014, the Principal Amounts of the Funds’ interest in the Joint Repurchase Agreement Account II were as follows:
| | | | | | | | | | | | | | | | | | | | | | | | | | | | | | | | |
| Counterparty | | Interest
Rate | | | Dynamic Emerging
Markets Debt | | | Emerging Markets Debt | | | High Yield | | | High Yield Floating Rate | | | Investment
Grade Credit | | | Local Emerging Markets Debt | | | U.S.
Mortgages | |
BNP Paribas Securities Co. | | | 0.010 | % | | $ | 493,775 | | | $ | 17,858,198 | | | $ | 18,105,086 | | | $ | 71,268,200 | | | $ | 6,940,283 | | | $ | 37,115,425 | | | $ | 12,783,288 | |
Citigroup Global Markets, Inc. | | | 0.000 | | | | 52,796 | | | | 1,909,453 | | | | 1,935,851 | | | | 7,620,215 | | | | 742,076 | | | | 3,968,495 | | | | 1,366,828 | |
TD Securities (USA) LLC | | | 0.005 | | | | 683,689 | | | | 24,726,736 | | | | 25,068,580 | | | | 98,679,046 | | | | 9,609,622 | | | | 51,390,589 | | | | 17,699,937 | |
Wells Fargo Securities LLC | | | 0.030 | | | | 569,740 | | | | 20,605,613 | | | | 20,890,483 | | | | 82,232,539 | | | | 8,008,019 | | | | 42,825,491 | | | | 14,749,947 | |
| TOTAL | | | | | | $ | 1,800,000 | | | $ | 65,100,000 | | | $ | 66,000,000 | | | $ | 259,800,000 | | | $ | 25,300,000 | | | $ | 135,300,000 | | | $ | 46,600,000 | |
At September 30, 2014, the Joint Repurchase Agreement Account II was fully collateralized by:
| | | | | | | | |
| Issuer | | Interest Rates | | | Maturity Dates | |
Federal National Mortgage Association | | | 2.500% to 6.000 | % | | | 05/01/21 to 09/01/44 | |
Government National Mortgage Association | | | 3.500 to 4.500 | | | | 08/15/42 to 06/20/44 | |
U.S. Treasury Bond | | | 5.375 | | | | 02/15/31 | |
U.S. Treasury Inflation Protected Securities | | | 0.125 to 0.500 | | | | 04/15/2015 to 04/15/2016 | |
U.S. Treasury Note | | | 0.875 | | | | 08/15/17 | |
| | |
| The accompanying notes are an integral part of these financial statements. | | 123 |
GOLDMAN SACHS SINGLE SECTOR FIXED INCOME FUNDS
Statements of Assets and Liabilities
September 30, 2014 (Unaudited)
| | | | | | |
| | | | | Dynamic
Emerging Markets
Debt Fund | |
| | Assets: | | | | |
| | Investments of unaffiliated issuers, at value (cost $26,887,702, $1,677,382,232, $4,628,119,506, $4,716,299,274, $428,315,399, $1,857,496,755 and $303,550,139) | | $ | 26,245,205 | |
| | Investments of affiliated issuers, at value (cost $41,449,489 for High Yield Floating Rate Fund) | | | — | |
| | Repurchase agreement, at value which equals cost | | | 1,800,000 | |
| | Cash | | | 97,618 | |
| | Foreign currencies, at value (cost $24,049, $158,235, $0, $7,763,537, $0, $26,841,203 and $0) | | | 22,164 | |
| | Receivables: | | | | |
| | Interest, net of allowances | | | 395,472 | |
| | Unrealized gain on forward foreign currency exchange contracts | | | 324,011 | |
| | Investments sold | | | 285,391 | |
| | Investments sold on an extended settlement basis | | | — | |
| | Collateral on certain derivative contracts(a) | | | 175,141 | |
| | Reimbursement from investment adviser | | | 49,314 | |
| | Unrealized gain on swap contracts | | | 19,914 | |
| | Variation margin on certain derivative contracts | | | 7,032 | |
| | Fund shares sold | | | 299 | |
| | Due from broker | | | — | |
| | Due from broker — upfront payment | | | — | |
| | Foreign tax reclaims, at value | | | — | |
| | Upfront payments made on swap contracts | | | — | |
| | Other assets | | | 2,933 | |
| | Total assets | | | 29,424,494 | |
| | | | | | |
| | Liabilities: | | | | |
| | Due to custodian | | | — | |
| | Foreign currency overdraft, at value (identified cost $0, $0, $1,153, $0, $776, $0 and $0) | | | — | |
| | Payables: | | | | |
| | Unrealized loss on forward foreign currency exchange contracts | | | 317,584 | |
| | Unrealized loss on swap contracts | | | 142,168 | |
| | Investments purchased | | | 103,828 | |
| | Investments purchased on an extended settlement basis | | | — | |
| | Fund shares redeemed | | | 41,107 | |
| | Distributions | | | 40,170 | |
| | Management fees | | | 18,959 | |
| | Upfront payments received on swap contracts | | | 10,696 | |
| | Distribution and service fees and transfer agent fees | | | 1,090 | |
| | Collateral on certain derivative contracts | | | — | |
| | Due to broker — upfront payment | | | — | |
| | Unrealized loss on unfunded loan commitment | | | — | |
| | Variation margin on certain derivative contracts | | | — | |
| | Accrued expenses and other liabilities | | | 133,433 | |
| | Total liabilities | | | 809,035 | |
| | | | | | |
| | Net Assets: | | | | |
| | Paid-in capital | | | 29,491,383 | |
| | Undistributed (distributions in excess of) net investment income | | | (144,576 | ) |
| | Accumulated net realized gain (loss) | | | 17,363 | |
| | Net unrealized gain (loss) | | | (748,711 | ) |
| | | NET ASSETS | | $ | 28,615,459 | |
| | | Net Assets: | | | | |
| | | Class A | | $ | 145,343 | |
| | | Class B | | | — | |
| | | Class C | | | 115,376 | |
| | | Institutional | | | 28,305,406 | |
| | | Service | | | — | |
| | | Separate Account Institutional | | | — | |
| | | Class IR | | | 24,713 | |
| | | Class R | | | 24,621 | |
| | | Total Net Assets | | $ | 28,615,459 | |
| | | Shares Outstanding $0.001 par value (unlimited shares authorized): | | | | |
| | | Class A | | | 15,612 | |
| | | Class B | | | — | |
| | | Class C | | | 12,352 | |
| | | Institutional | | | 3,030,688 | |
| | | Service | | | — | |
| | | Separate Account Institutional | | | — | |
| | | Class IR | | | 2,653 | |
| | | Class R | | | 2,636 | |
| | | Net asset value, offering and redemption price per share:(b) | | | | |
| | | Class A | | | $9.31 | |
| | | Class B | | | — | |
| | | Class C | | | 9.34 | |
| | | Institutional | | | 9.34 | |
| | | Service | | | — | |
| | | Separate Account Institutional | | | — | |
| | | Class IR | | | 9.32 | |
| | | Class R | | | 9.34 | |
| | (a) | | Includes segregated cash of $2,295,000, $595,000, $370,000 and $520,000 for the Emerging Markets Debt, Investment Grade Credit, Local Emerging Markets Debt and U.S. Mortgages Funds, respectively, relating to initial margin requirements and collateral on futures transactions. Also includes amounts segregated for initial margin on swap transactions of $64,722, $1,912,875, $5,460,051, $7,645,268, $1,039,668, $6,635,712 and $361,628 for the Dynamic Emerging Markets Debt, Emerging Markets Debt, High Yield, Yield Floating Rate, Investment Grade Credit, Local Emerging Markets Debt and U.S Mortgages Funds, respectively. |
| | (b) | | Maximum public offering price per share for Class A shares of Dynamic Emerging Markets Debt, Emerging Markets Debt, High Yield, High Yield Floating Rate, Investment Grade Credit, Local Emerging Markets Debt and U.S. Mortgages Funds is $9.75, $13.27, $7.35, $10.15, $9.85, $8.42 and $10.99, respectively. At redemption, Class B and Class C shares may be subject to a contingent deferred sales charge, assessed on the amount equal to the lesser of the current net asset value or the original purchase price of the shares. |
| | |
| 124 | | The accompanying notes are an integral part of these financial statements. |
GOLDMAN SACHS SINGLE SECTOR FIXED INCOME FUNDS
| | | | | | | | | | | | | | | | | | | | | | | | | | | | | | | | | | |
| | | Emerging Markets
Debt Fund | | | | | High Yield Fund | | | | | High Yield
Floating Rate
Fund | | | | | Investment Grade
Credit Fund | | | | | Local Emerging
Markets Debt
Fund | | | | | U.S. Mortgages
Fund | |
| | | | | | | | | | | | | | | | | | | | | | | | | | | | | | | | | | |
| |
|
$1,668,429,834 |
| | | | $ | 4,642,904,393 | | | | | $ | 4,650,464,419 | | | | | $ | 441,706,625 | | | | | $ | 1,691,879,018 | | | | | $ | 305,735,873 | |
| | | — | | | | | | — | | | | | | 40,535,700 | | | | | | — | | | | | | — | | | | | | — | |
| | | 65,100,000 | | | | | | 66,000,000 | | | | | | 259,800,000 | | | | | | 25,300,000 | | | | | | 135,300,000 | | | | | | 46,600,000 | |
| | | 834,971 | | | | | | 4,529,747 | | | | | | 50,107,888 | | | | | | — | | | | | | — | | | | | | 29,136 | |
| | | 156,275 | | | | | | — | | | | | | 7,585,758 | | | | | | — | | | | | | 26,787,665 | | | | | | — | |
| | | | | | | | | | | | | | | | | | | | | | | | | | | | | | | | | | |
| | | 22,946,954 | | | | | | 83,860,874 | | | | | | 51,008,349 | | | | | | 4,232,210 | | | | | | 25,079,572 | | | | | | 548,606 | |
| | | 17,829,165 | | | | | | 3,301,087 | | | | | | 933,517 | | | | | | 14,608 | | | | | | 33,703,168 | | | | | | — | |
| | | 8,225,731 | | | | | | 16,976,344 | | | | | | 7,892,850 | | | | | | 13,270,000 | | | | | | 37,270,581 | | | | | | 5,227 | |
| | | — | | | | | | 20,328,923 | | | | | | 124,291,717 | | | | | | — | | | | | | 1,182,429 | | | | | | 123,636,211 | |
| | | 10,661,473 | | | | | | 10,192,181 | | | | | | 7,645,267 | | | | | | 1,634,668 | | | | | | 18,544,931 | | | | | | 881,629 | |
| | | 15,151 | | | | | | — | | | | | | — | | | | | | 46,780 | | | | | | 99,614 | | | | | | 39,765 | |
| | | 847,033 | | | | | | — | | | | | | — | | | | | | — | | | | | | 14,467,705 | | | | | | — | |
| | | 173,411 | | | | | | 1,615,300 | | | | | | 504,460 | | | | | | 54,224 | | | | | | 649,720 | | | | | | 22,775 | |
| | | 7,320,868 | | | | | | 3,858,312 | | | | | | 15,760,025 | | | | | | 1,899,922 | | | | | | 28,262,435 | | | | | | 1,588,405 | |
| | | — | | | | | | — | | | | | | — | | | | | | — | | | | | | 32,570 | | | | | | — | |
| | | 21 | | | | | | — | | | | | | — | | | | | | — | | | | | | — | | | | | | — | |
| | | — | | | | | | 23,278 | | | | | | — | | | | | | — | | | | | | — | | | | | | — | |
| | | — | | | | | | — | | | | | | — | | | | | | — | | | | | | 243,280 | | | | | | 1,960 | |
| | | 9,676 | | | | | | 42,867 | | | | | | 41,342,340 | | | | | | 3,973 | | | | | | 15,098 | | | | | | 2,357 | |
| | | 1,802,550,563 | | | | | | 4,853,633,306 | | | | | | 5,257,872,290 | | | | | | 488,163,010 | | | | | | 2,013,517,786 | | | | | | 479,091,944 | |
| | | | | | | | | | | | | | | | | | | | | | | | | | | | | | | | | | |
| | | | | | | | | | | | | | | | | | | | | | | | | | | | | | | | | | |
| | | — | | | | | | — | | | | | | — | | | | | | 111,650 | | | | | | 3,957,364 | | | | | | — | |
| | | — | | | | | | 1,128 | | | | | | — | | | | | | 738 | | | | | | — | | | | | | — | |
| | | | | | | | | | | | | | | | | | | | | | | | | | | | | | | | | | |
| | | 9,249,191 | | | | | | — | | | | | | 98,736 | | | | | | — | | | | | | 31,089,048 | | | | | | — | |
| | | 6,236,835 | | | | | | — | | | | | | — | | | | | | — | | | | | | 24,018,083 | | | | | | 1,364 | |
| | | 16,834,481 | | | | | | 5,987,750 | | | | | | 80,090,437 | | | | | | 5,071,160 | | | | | | 21,555,126 | | | | | | 322,647 | |
| | | — | | | | | | 136,474,260 | | | | | | 397,963,765 | | | | | | 5,559,678 | | | | | | — | | | | | | 226,713,594 | |
| | | 9,165,638 | | | | | | 19,919,597 | | | | | | 25,657,404 | | | | | | 676,147 | | | | | | 10,093,589 | | | | | | 421,598 | |
| | | 164,258 | | | | | | 1,387,556 | | | | | | 64,058 | | | | | | 89,627 | | | | | | 347,827 | | | | | | 69,532 | |
| | | 1,162,034 | | | | | | 2,574,076 | | | | | | 2,055,669 | | | | | | 129,729 | | | | | | 1,289,952 | | | | | | 69,258 | |
| | | 1,694,167 | | | | | | — | | | | | | — | | | | | | — | | | | | | 557,359 | | | | | | — | |
| | | 113,695 | | | | | | 363,778 | | | | | | 159,258 | | | | | | 22,299 | | | | | | 100,550 | | | | | | 9,588 | |
| | | — | | | | | | — | | | | | | — | | | | | | 2,160,000 | | | | | | 4,410,000 | | | | | | 640,000 | |
| | | 1,281,639 | | | | | | — | | | | | | — | | | | | | 11 | | | | | | 20,792 | | | | | | 19 | |
| | | — | | | | | | — | | | | | | 463,441 | | | | | | — | | | | | | — | | | | | | — | |
| | | — | | | | | | — | | | | | | — | | | | | | 69,673 | | | | | | — | | | | | | 22,735 | |
| | | 296,269 | | | | | | 362,087 | | | | | | 280,318 | | | | | | 129,640 | | | | | | 1,060,606 | | | | | | 174,121 | |
| | | 46,198,207 | | | | | | 167,070,232 | | | | | | 506,833,086 | | | | | | 14,020,352 | | | | | | 98,500,296 | | | | | | 228,444,456 | |
| | | | | | | | | | | | | | | | | | | | | | | | | | | | | | | | | | |
| | | | | | | | | | | | | | | | | | | | | | | | | | | | | | | | | | |
| | | 1,774,810,938 | | | | | | 4,568,732,505 | | | | | | 4,819,853,568 | | | | | | 452,730,091 | | | | | | 2,333,771,488 | | | | | | 252,469,355 | |
| | | (402,598 | ) | | | | | 84,551 | | | | | | (609,849 | ) | | | | | 358,988 | | | | | | (143,131,965 | ) | | | | | (715,635 | ) |
| | | (12,649,445 | ) | | | | | 97,530,329 | | | | | | (2,930,410 | ) | | | | | 6,571,468 | | | | | | (102,492,918 | ) | | | | | (3,328,327 | ) |
| | | (5,406,539 | ) | | | | | 20,215,689 | | | | | | (65,274,105 | ) | | | | | 14,482,111 | | | | | | (173,129,115 | ) | | | | | 2,222,095 | |
| | | | $1,756,352,356 | | | | | $ | 4,686,563,074 | | | | | $ | 4,751,039,204 | | | | | $ | 474,142,658 | | | | | $ | 1,915,017,490 | | | | | $ | 250,647,488 | |
| | | | | | | | | | | | | | | | | | | | | | | | | | | | | | | | | | | |
| | | | $ 88,172,814 | | | | | $ | 401,415,452 | | | | | $ | 6,217,885 | | | | | $ | 25,114,537 | | | | | $ | 73,681,483 | | | | | $ | 5,725,804 | |
| | | | — | | | | | | 8,574,417 | | | | | | — | | | | | | — | | | | | | — | | | | | | — | |
| | | | 32,401,262 | | | | | | 81,200,828 | | | | | | 2,396,578 | | | | | | — | | | | | | 14,539,619 | | | | | | — | |
| | | | 1,617,897,754 | | | | | | 4,145,926,304 | | | | | | 4,741,529,506 | | | | | | 165,063,966 | | | | | | 1,821,778,000 | | | | | | 42,816,534 | |
| | | | — | | | | | | 16,206,009 | | | | | | — | | | | | | — | | | | | | — | | | | | | — | |
| | | | — | | | | | | — | | | | | | — | | | | | | 283,206,174 | | | | | | — | | | | | | 200,559,009 | |
| | | | 17,880,526 | | | | | | 15,480,367 | | | | | | 884,146 | | | | | | 757,981 | | | | | | 5,018,388 | | | | | | 1,546,141 | |
| | | | — | | | | | | 17,759,697 | | | | | | 11,089 | | | | | | — | | | | | | — | | | | | | — | |
| | | | $1,756,352,356 | | | | | $ | 4,686,563,074 | | | | | $ | 4,751,039,204 | | | | | $ | 474,142,658 | | | | | $ | 1,915,017,490 | | | | | $ | 250,647,488 | |
| | | | | | | | | | | | | | | | | | | | | | | | | | | | | | | | | | | |
| | | | 6,958,380 | | | | | | 57,187,592 | | | | | | 627,066 | | | | | | 2,648,034 | | | | | | 9,168,271 | | | | | | 541,018 | |
| | | | — | | | | | | 1,218,550 | | | | | | — | | | | | | — | | | | | | — | | | | | | — | |
| | | | 2,558,262 | | | | | | 11,551,824 | | | | | | 241,604 | | | | | | — | | | | | | 1,805,948 | | | | | | — | |
| | | | 127,518,376 | | | | | | 588,799,558 | | | | | | 477,611,678 | | | | | | 17,399,610 | | | | | | 226,608,656 | | | | | | 4,037,095 | |
| | | | — | | | | | | 2,309,745 | | | | | | — | | | | | | — | | | | | | — | | | | | | — | |
| | | | — | | | | | | — | | | | | | — | | | | | | 29,843,887 | | | | | | — | | | | | | 18,953,051 | |
| | | | 1,409,432 | | | | | | 2,200,314 | | | | | | 88,988 | | | | | | 79,872 | | | | | | 624,205 | | | | | | 145,735 | |
| | | | — | | | | | | 2,530,054 | | | | | | 1,117 | | | | | | — | | | | | | — | | | | | | — | |
| | | | | | | | | | | | | | | | | | | | | | | | | | | | | | | | | | | |
| | | | $12.67 | | | | | | $7.02 | | | | | | $9.92 | | | | | | $9.48 | | | | | | $8.04 | | | | | | $10.58 | |
| | | | — | | | | | | 7.04 | | | | | | — | | | | | | — | | | | | | — | | | | | | — | |
| | | | 12.67 | | | | | | 7.03 | | | | | | 9.92 | | | | | | — | | | | | | 8.05 | | | | | | — | |
| | | | 12.69 | | | | | | 7.04 | | | | | | 9.93 | | | | | | 9.49 | | | | | | 8.04 | | | | | | 10.61 | |
| | | | — | | | | | | 7.02 | | | | | | — | | | | | | — | | | | | | — | | | | | | — | |
| | | | — | | | | | | — | | | | | | — | | | | | | 9.49 | | | | | | — | | | | | | 10.58 | |
| | | | 12.69 | | | | | | 7.04 | | | | | | 9.94 | | | | | | 9.49 | | | | | | 8.04 | | | | | | 10.61 | |
| | | | — | | | | | | 7.02 | | | | | | 9.92 | | | | | | — | | | | | | — | | | | | | — | |
| | |
| The accompanying notes are an integral part of these financial statements. | | 125 |
GOLDMAN SACHS SINGLE SECTOR FIXED INCOME FUNDS
Statements of Operations
For the Six Months Ended September 30, 2014 (Unaudited)
| | | | | | |
| | | | | Dynamic
Emerging Markets
Debt Fund | |
| | Investment income: | | | | |
| | Interest, net of allowances — (net of foreign withholding taxes of $3,987 for Dynamic Emerging Markets Debt Fund) | | $ | 750,956 | |
| | Dividends — unaffiliated issuers (net of foreign withholding taxes of $724 for High Yield Fund) | | | — | |
| | Dividends — affiliated issuers | | | — | |
| | Total investment income | | | 750,956 | |
| | | | | | |
| | Expenses: | |
| | Management fees | | | 124,931 | |
| | Custody, accounting and administrative services | | | 97,797 | |
| | Professional fees | | | 36,804 | |
| | Registration fees | | | 29,984 | |
| | Amortization of offering costs | | | 28,307 | |
| | Printing and mailing costs | | | 10,225 | |
| | Trustee fees | | | 9,186 | |
| | Transfer Agent fees(a) | | | 5,657 | |
| | Shareholder meeting expense | | | 909 | |
| | Distribution and Service fees(a) | | | 700 | |
| | Service Share fees — Shareholder Administration Plan | | | — | |
| | Service Share fees — Service Plan | | | — | |
| | Other | | | 3,675 | |
| | Total expenses | | | 348,175 | |
| | Less — expense reductions | | | (220,442 | ) |
| | Net expenses | | | 127,733 | |
| | NET INVESTMENT INCOME | | | 623,223 | |
| | | | | | |
| | Realized and unrealized gain (loss): | |
| | Net realized gain (loss) from: | | | | |
| | Investments — unaffiliated issuers | | | 140,259 | |
| | Investments — affiliated issuers | | | — | |
| | Futures contracts | | | (75,636 | ) |
| | Swap contracts | | | (17,294 | ) |
| | Non-deliverable bond forward contracts | | | — | |
| | Forward foreign currency exchange contracts | | | 118,145 | |
| | Foreign currency transactions | | | 18,555 | |
| | Net change in unrealized gain (loss) on: | | | | |
| | Investments — unaffiliated issuers (including the effects of the net change in the foreign capital gains tax liability of $5,960 and $1,024,614 for Dynamic Emerging Markets Debt and Local Emerging Markets Debt Funds) | | | (498,687 | ) |
| | Investments — affiliated issuers | | | — | |
| | Futures contracts | | | 3,729 | |
| | Unfunded loan commitment | | | — | |
| | Non-deliverable bond forward contracts | | | — | |
| | Swap contracts | | | (96,058 | ) |
| | Forward foreign currency exchange contracts | | | (16,994 | ) |
| | Foreign currency translation | | | (15,939 | ) |
| | Net realized and unrealized gain (loss) | | | (439,920 | ) |
| | NET INCREASE (DECREASE) IN NET ASSETS RESULTING FROM OPERATIONS | | $ | 183,303 | |
| | (a) Class specific Distribution and Service and Transfer Agent fees were as follows: | | | | |
| | | | | | | | | | | | | | | | | | | | | | | | | | | | | | | | | | | | | | | | | | | | | | | | |
| | | Distribution and Service Fees | | | Transfer Agent Fees | |
Fund | | Class A | | | Class B | | | Class C | | | Class R | | | Class A | | | Class B | | | Class C | | | Institutional | | | Service | | | Separate Account Institutional | | | Class IR | | | Class R | |
Dynamic Emerging Markets Debt | | $ | 90 | | | $ | — | | | $ | 547 | | | $ | 63 | | | $ | 47 | | | $ | — | | | $ | 71 | | | $ | 5,506 | | | $ | — | | | $ | — | | | $ | 17 | | | $ | 16 | |
Emerging Markets Debt | | �� | 128,180 | | | | — | | | | 164,750 | | | | — | | | | 66,654 | | | | — | | | | 21,418 | | | | 293,714 | | | | — | | | | — | | | | 11,322 | | | | — | |
High Yield | | | 630,998 | | | | 52,392 | | | | 430,816 | | | | 46,086 | | | | 328,119 | | | | 6,811 | | | | 56,006 | | | | 858,170 | | | | 3,349 | | | | — | | | | 10,132 | | | | 11,982 | |
High Yield Floating Rate | | | 22,955 | | | | — | | | | 11,876 | | | | 27 | | | | 11,936 | | | | — | | | | 1,544 | | | | 890,727 | | | | — | | | | — | | | | 723 | | | | 7 | |
Investment Grade Credit | | | 31,305 | | | | — | | | | — | | | | — | | | | 16,279 | | | | — | | | | — | | | | 33,445 | | | | — | | | | 56,518 | | | | 463 | | | | — | |
Local Emerging Markets Debt | | | 108,643 | | | | — | | | | 82,771 | | | | — | | | | 56,494 | | | | — | | | | 10,760 | | | | 372,381 | | | | — | | | | — | | | | 4,299 | | | | — | |
U.S. Mortgages | | | 6,044 | | | | — | | | | — | | | | — | | | | 3,143 | | | | — | | | | — | | | | 6,693 | | | | — | | | | 41,727 | | | | 240 | | | | — | |
| | |
| 126 | | The accompanying notes are an integral part of these financial statements. |
GOLDMAN SACHS SINGLE SECTOR FIXED INCOME FUNDS
| | | | | | | | | | | | | | | | | | | | | | | | | | | | | | | | | | |
| | | Emerging Markets
Debt Fund | | | | | High Yield Fund | | | | | High Yield
Floating Rate
Fund | | | | | Investment Grade
Credit Fund | | | | | Local Emerging
Markets Debt
Fund | | | | | U.S. Mortgages
Fund | |
| | | | | | | | | | | | | | | | | | | | | | | | | | | | | | | | | | |
| | $ | 41,404,139 | | | | | $ | 158,198,420 | | | | | $ | 93,134,472 | | | | | $ | 9,133,416 | | | | | $ | 58,880,998 | | | | | $ | 2,881,970 | |
| | | — | | | | | | 188,357 | | | | | | — | | | | | | — | | | | | | — | | | | | | — | |
| | | — | | | | | | — | | | | | | 1,383,579 | | | | | | — | | | | | | — | | | | | | — | |
| | | 41,404,139 | | | | | | 158,386,777 | | | | | | 94,518,051 | | | | | | 9,133,416 | | | | | | 58,880,998 | | | | | | 2,881,970 | |
| | | | | | | | | | | | | | | | | | | | | | | | | | | | | | | | | | |
| | | | | | | | | | | | | | | | | | | | | | | | | | | | | | | | | | |
| | | 6,485,938 | | | | | | 16,268,547 | | | | | | 12,014,161 | | | | | | 951,145 | | | | | | 8,871,940 | | | | | | 494,613 | |
| | | 245,174 | | | | | | 200,115 | | | | | | 457,046 | | | | | | 70,511 | | | | | | 967,553 | | | | | | 118,015 | |
| | | 46,740 | | | | | | 60,739 | | | | | | 75,921 | | | | | | 42,912 | | | | | | 56,765 | | | | | | 47,750 | |
| | | 49,835 | | | | | | 63,154 | | | | | | 70,580 | | | | | | 39,816 | | | | | | 38,474 | | | | | | 34,726 | |
| | | — | | | | | | — | | | | | | — | | | | | | — | | | | | | — | | | | | | — | |
| | | 162,617 | | | | | | 134,699 | | | | | | 58,084 | | | | | | 20,601 | | | | | | 45,791 | | | | | | 19,484 | |
| | | 12,344 | | | | | | 16,719 | | | | | | 16,836 | | | | | | 9,866 | | | | | | 12,670 | | | | | | 10,493 | |
| | | 393,108 | | | | | | 1,274,569 | | | | | | 904,937 | | | | | | 106,705 | | | | | | 443,934 | | | | | | 51,803 | |
| | | 89,826 | | | | | | 31,954 | | | | | | 7,286 | | | | | | 1,391 | | | | | | 16,932 | | | | | | 936 | |
| | | 292,930 | | | | | | 1,160,292 | | | | | | 34,858 | | | | | | 31,305 | | | | | | 191,414 | | | | | | 6,044 | |
| | | — | | | | | | 20,932 | | | | | | — | | | | | | — | | | | | | — | | | | | | — | |
| | | — | | | | | | 20,932 | | | | | | — | | | | | | — | | | | | | — | | | | | | — | |
| | | 31,154 | | | | | | 60,622 | | | | | | 80,890 | | | | | | 12,532 | | | | | | 42,409 | | | | | | 7,761 | |
| | | 7,809,666 | | | | | | 19,313,274 | | | | | | 13,720,599 | | | | | | 1,286,784 | | | | | | 10,687,882 | | | | | | 791,625 | |
| | | (103,613 | ) | | | | | — | | | | | | (161,911 | ) | | | | | (328,420 | ) | | | | | (1,414,324 | ) | | | | | (307,049 | ) |
| | | 7,706,053 | | | | | | 19,313,274 | | | | | | 13,558,688 | | | | | | 958,364 | | | | | | 9,273,558 | | | | | | 484,576 | |
| | | 33,698,086 | | | | | | 139,073,503 | | | | | | 80,959,363 | | | | | | 8,175,052 | | | | | | 49,607,440 | | | | | | 2,397,394 | |
| | | | | | | | | | | | | | | | | | | | | | | | | | | | | | | | | | |
| | | | | | | | | | | | | | | | | | | | | | | | | | | | | | | | | | |
| | | | | | | | | | | | | | | | | | | | | | | | | | | | | | | | | | |
| | | 23,561,485 | | | | | | 43,296,898 | | | | | | 2,181,357 | | | | | | 4,546,683 | | | | | | (18,097,558 | ) | | | | | 2,645,519 | |
| | | — | | | | | | — | | | | | | (295,073 | ) | | | | | — | | | | | | — | | | | | | — | |
| | | 531,061 | | | | | | (8,209,248 | ) | | | | | — | | | | | | 3,320,819 | | | | | | (5,278,244 | ) | | | | | 810,918 | |
| | | (1,712,379 | ) | | | | | (2,849,896 | ) | | | | | (4,431,922 | ) | | | | | (1,550,516 | ) | | | | | (2,897,578 | ) | | | | | (661,866 | ) |
| | | 736,218 | | | | | | — | | | | | | — | | | | | | — | | | | | | — | | | | | | — | |
| | | 9,094,420 | | | | | | 7,413,343 | | | | | | 2,221,789 | | | | | | 34,621 | | | | | | 1,739,290 | | | | | | — | |
| | | (339,974 | ) | | | | | (3,175,428 | ) | | | | | (1,368,056 | ) | | | | | (13,332 | ) | | | | | (1,285,379 | ) | | | | | — | |
| | | | | | | | | | | | | | | | | | | | | | | | | | | | | | | | | | |
| |
|
(5,904,749 |
) | | | | | (186,212,861 | ) | | | | | (71,264,569 | ) | | | | | (1,327,664 | ) | | | | | (53,954,167 | ) | | | | | 743,167 | |
| | | — | | | | | | — | | | | | | (1,115,796 | ) | | | | | — | | | | | | — | | | | | | — | |
| | | (1,462,618 | ) | | | | | (592,158 | ) | | | | | — | | | | | | (224,275 | ) | | | | | (493,079 | ) | | | | | (319,405 | ) |
| | | — | | | | | | — | | | | | | (737,073 | ) | | | | | — | | | | | | — | | | | | | — | |
| | | (618,563 | ) | | | | | — | | | | | | — | | | | | | — | | | | | | — | | | | | | — | |
| | | (4,460,503 | ) | | | | | 1,952,308 | | | | | | 303,099 | | | | | | 338,974 | | | | | | (3,196,130 | ) | | | | | 339,039 | |
| | | 9,804,619 | | | | | | 3,133,345 | | | | | | 800,181 | | | | | | 13,852 | | | | | | (789,040 | ) | | | | | — | |
| | | (87,153 | ) | | | | | (85,536 | ) | | | | | 569,672 | | | | | | (1,153 | ) | | | | | (2,162,248 | ) | | | | | — | |
| | | 29,141,864 | | | | | | (145,329,233 | ) | | | | | (73,136,391 | ) | | | | | 5,138,009 | | | | | | (86,414,133 | ) | | | | | 3,557,372 | |
| | $ | 62,839,950 | | | | | $ | (6,255,730 | ) | | | | $ | 7,822,972 | | | | | $ | 13,313,061 | | | | | $ | (36,806,693 | ) | | | | $ | 5,954,766 | |
| | |
| The accompanying notes are an integral part of these financial statements. | | 127 |
GOLDMAN SACHS SINGLE SECTOR FIXED INCOME FUNDS
Statements of Changes in Net Assets
| | | | | | | | | | |
| | | | | Dynamic Emerging Markets Debt Fund | |
| | | | | For the
Six Months Ended
September 30, 2014
(Unaudited) | | | For the
Period Ended
March 31, 2014(a) | |
| | From operations: | |
| | Net investment income | | $ | 623,223 | | | $ | 576,502 | |
| | Net realized gain (loss) | | | 184,029 | | | | (418,835 | ) |
| | Net change in unrealized loss | | | (623,949 | ) | | | (124,762 | ) |
| | Net increase (decrease) in net assets resulting from operations | | | 183,303 | | | | 32,905 | |
| | | | | | | | | | |
| | Distributions to shareholders: | | | | | | | | |
| | From net investment income | | | | | | | | |
| | Class A Shares | | | (1,494 | ) | | | (1,365 | ) |
| | Class B Shares | | | — | | | | — | |
| | Class C Shares | | | (1,810 | ) | | | (507 | ) |
| | Institutional Shares | | | (609,227 | ) | | | (478,925 | ) |
| | Service Shares | | | — | | | | — | |
| | Class IR Shares | | | (544 | ) | | | (819 | ) |
| | Class R Shares | | | (482 | ) | | | (580 | ) |
| | From net realized gains | | | | | | | | |
| | Class A Shares | | | — | | | | — | |
| | Class B Shares | | | — | | | | — | |
| | Class C Shares | | | — | | | | — | |
| | Institutional Shares | | | — | | | | — | |
| | Service Shares | | | — | | | | — | |
| | Class IR Shares | | | — | | | | — | |
| | Class R Shares | | | — | | | | — | |
| | Return of capital | | | | | | | | |
| | Class A Shares | | | — | | | | (536 | ) |
| | Class C Shares | | | — | | | | (199 | ) |
| | Institutional Shares | | | — | | | | (188,033 | ) |
| | Class IR Shares | | | — | | | | (322 | ) |
| | Class R Shares | | | — | | | | (227 | ) |
| | Total distributions to shareholders | | | (613,557 | ) | | | (671,513 | ) |
| | | | | | | | | | |
| | From share transactions: | | | | | | | | |
| | Proceeds from sales of shares | | | 5,460,315 | | | | 28,919,836 | |
| | Reinvestment of distributions | | | 370,084 | | | | 388,110 | |
| | Cost of shares redeemed(b) | | | (1,111,572 | ) | | | (4,342,452 | ) |
| | Net increase (decrease) in net assets resulting from share transactions | | | 4,718,827 | | | | 24,965,494 | |
| | TOTAL INCREASE (DECREASE) | | | 4,288,573 | | | | 24,326,886 | |
| | | | | | | | | | |
| | Net assets: | | | | | | | | |
| | Beginning of period | | | 24,326,886 | | | | — | |
| | End of period | | $ | 28,615,459 | | | $ | 24,326,886 | |
| | Undistributed (distributions in excess of) net investment income | | $ | (144,576 | ) | | $ | (154,242 | ) |
| | (a) | | Commenced operations on May 31, 2013. |
| | (b) | | Net of $0 and $3,928, $7,258, and $125,836, and $39,280 and $269,505 of redemption fees for Dynamic Emerging Markets Debt, Emerging Markets Debt and High Yield Funds, respectively, for the period ended September 30, 2014 and for the fiscal year ended March 31, 2014, respectively. |
| | |
| 128 | | The accompanying notes are an integral part of these financial statements. |
GOLDMAN SACHS SINGLE SECTOR FIXED INCOME FUNDS
| | | | | | | | | | | | | | | | | | | | | | |
| | | Emerging Markets Debt Fund | | | | | High Yield Fund | |
| | | For the
Six Months Ended
September 30, 2014
(Unaudited) | | | | | For the Fiscal
Year Ended
March 31, 2014 | | | | | For the
Six Months Ended
September 30, 2014
(Unaudited) | | | | | For the Fiscal
Year Ended
March 31, 2014 | |
| | | | | | | | | | | | | | | | | | | | | | |
| | $ | 33,698,086 | | | | | $ | 69,862,408 | | | | | $ | 139,073,503 | | | | | $ | 337,235,254 | |
| | | 31,870,831 | | | | | | (53,753,476 | ) | | | | | 36,475,669 | | | | | | 142,016,318 | |
| | | (2,728,967 | ) | | | | | (40,546,419 | ) | | | | | (181,804,902 | ) | | | | | (79,542,391 | ) |
| | | 62,839,950 | | | | | | (24,437,487 | ) | | | | | (6,255,730 | ) | | | | | 399,709,181 | |
| | | | | | | | | | | | | | | | | | | | | | |
| | | | | | | | | | | | | | | | | | | | | | |
| | | | | | | | | | | | | | | | | | | | | | |
| | | (2,004,824 | ) | | | | | (5,965,225 | ) | | | | | (13,358,014 | ) | | | | | (32,972,248 | ) |
| | | — | | | | | | — | | | | | | (237,978 | ) | | | | | (836,211 | ) |
| | | (518,287 | ) | | | | | (1,342,149 | ) | | | | | (1,954,450 | ) | | | | | (4,877,298 | ) |
| | | (30,950,938 | ) | | | | | (56,154,613 | ) | | | | | (120,751,873 | ) | | | | | (295,130,180 | ) |
| | | — | | | | | | — | | | | | | (428,885 | ) | | | | | (1,001,173 | ) |
| | | (361,164 | ) | | | | | (837,936 | ) | | | | | (431,716 | ) | | | | | (998,711 | ) |
| | | — | | | | | | — | | | | | | (463,757 | ) | | | | | (1,010,644 | ) |
| | | | | | | | | | | | | | | | | | | | | | |
| | | — | | | | | | (2,020,247 | ) | | | | | — | | | | | | (19,586,059 | ) |
| | | — | | | | | | — | | | | | | — | | | | | | (518,089 | ) |
| | | — | | | | | | (600,152 | ) | | | | | — | | | | | | (3,111,390 | ) |
| | | — | | | | | | (20,739,038 | ) | | | | | — | | | | | | (162,867,891 | ) |
| | | — | | | | | | — | | | | | | — | | | | | | (600,325 | ) |
| | | — | | | | | | (272,490 | ) | | | | | — | | | | | | (526,331 | ) |
| | | — | | | | | | — | | | | | | — | | | | | | (608,391 | ) |
| | | | | | | | | | | | | | | | | | | | | | |
| | | — | | | | | | (305,941 | ) | | | | | — | | | | | | — | |
| | | — | | | | | | (68,835 | ) | | | | | — | | | | | | — | |
| | | — | | | | | | (2,880,021 | ) | | | | | — | | | | | | — | |
| | | — | | | | | | (42,975 | ) | | | | | — | | | | | | — | |
| | | — | | | | | | — | | | | | | — | | | | | | — | |
| | | (33,835,213 | ) | | | | | (91,229,622 | ) | | | | | (137,626,673 | ) | | | | | (524,644,941 | ) |
| | | | | | | | | | | | | | | | | | | | | | |
| | | | | | | | | | | | | | | | | | | | | | |
| | | 436,954,157 | | | | | | 852,069,909 | | | | | | 475,955,990 | | | | | | 1,265,981,357 | |
| | | 32,806,268 | | | | | | 87,742,015 | | | | | | 128,897,498 | | | | | | 498,994,837 | |
| | | (187,859,784 | ) | | | | | (993,217,584 | ) | | | | | (910,790,399 | ) | | | | | (2,429,872,327 | ) |
| | | 281,900,641 | | | | | | (53,405,660 | ) | | | | | (305,936,911 | ) | | | | | (664,896,133 | ) |
| | | 310,905,378 | | | | | | (169,072,769 | ) | | | | | (449,819,314 | ) | | | | | (789,831,893 | ) |
| | | | | | | | | | | | | | | | | | | | | | |
| | | | | | | | | | | | | | | | | | | | | | |
| | | 1,445,446,978 | | | | | | 1,614,519,747 | | | | | | 5,136,382,388 | | | | | | 5,926,214,281 | |
| | $ | 1,756,352,356 | | | | | $ | 1,445,446,978 | | | | | $ | 4,686,563,074 | | | | | $ | 5,136,382,388 | |
| | $ | (402,598 | ) | | | | $ | (265,471 | ) | | | | $ | 84,551 | | | | | $ | (1,362,279 | ) |
| | |
| The accompanying notes are an integral part of these financial statements. | | 129 |
GOLDMAN SACHS SINGLE SECTOR FIXED INCOME FUNDS
Statements of Changes in Net Assets (continued)
| | | | | | | | | | |
| | | | | High Yield Floating Rate Fund | |
| | | | | For the
Six Months Ended
September 30, 2014
(Unaudited) | | | For the Fiscal
Year Ended
March 31, 2014 | |
| | From operations: | |
| | Net investment income | | $ | 80,959,363 | | | $ | 105,590,591 | |
| | Net realized gain (loss) | | | (1,691,905 | ) | | | 3,579,388 | |
| | Net change in unrealized gain (loss) | | | (71,444,486 | ) | | | (10,758,630 | ) |
| | Net increase (decrease) in net assets resulting from operations | | | 7,822,972 | | | | 98,411,349 | |
| | | | | | | | | | |
| | Distributions to shareholders: | | | | | | | | |
| | From net investment income | | | | | | | | |
| | Class A Shares | | | (303,562 | ) | | | (716,181 | ) |
| | Class C Shares | | | (30,339 | ) | | | (60,603 | ) |
| | Institutional Shares | | | (81,111,601 | ) | | | (103,191,743 | ) |
| | Separate Account Institutional Shares | | | — | | | | — | |
| | Class IR Shares | | | (19,979 | ) | | | (161,408 | ) |
| | Class R Shares | | | (171 | ) | | | (331 | ) |
| | From net realized gains | | | | | | | | |
| | Class A Shares | | | — | | | | (40,582 | ) |
| | Class C Shares | | | — | | | | (3,753 | ) |
| | Institutional Shares | | | — | | | | (5,235,933 | ) |
| | Separate Account Institutional Shares | | | — | | | | — | |
| | Class IR Shares | | | — | | | | (8,640 | ) |
| | Class R Shares | | | — | | | | (18 | ) |
| | Return of capital | | | | | | | | |
| | Class A Shares | | | — | | | | — | |
| | Class C Shares | | | — | | | | — | |
| | Institutional Shares | | | — | | | | — | |
| | Separate Account Institutional Shares | | | — | | | | — | |
| | Class IR Shares | | | — | | | | — | |
| | Total distributions to shareholders | | | (81,465,652 | ) | | | (109,419,192 | ) |
| | | | | | | | | | |
| | From share transactions: | | | | | | | | |
| | Proceeds from sales of shares | | | 1,134,613,806 | | | | 3,165,927,522 | |
| | Reinvestment of distributions | | | 81,077,447 | | | | 108,783,941 | |
| | Cost of shares redeemed | | | (591,731,287 | ) | | | (787,533,938 | ) |
| | Net increase (decrease) in net assets resulting from share transactions | | | 623,959,966 | | | | 2,487,177,525 | |
| | TOTAL INCREASE (DECREASE) | | | 550,317,286 | | | | 2,476,169,682 | |
| | | | | | | | | | |
| | Net assets: | | | | | | | | |
| | Beginning of period | | | 4,200,721,918 | | | | 1,724,552,236 | |
| | End of period | | $ | 4,751,039,204 | | | $ | 4,200,721,918 | |
| | Undistributed (distributions in excess of) net investment income | | $ | (609,849 | ) | | $ | (103,560 | ) |
| | (a) | | Net of $34,838 and $251,438 of redemption fees for Local Emerging Markets Debt Fund for the six months ended September 30, 2014 and for the fiscal year ended March 31, 2014, respectively. |
| | |
| 130 | | The accompanying notes are an integral part of these financial statements. |
GOLDMAN SACHS SINGLE SECTOR FIXED INCOME FUNDS
| | | | | | | | | | | | | | | | | | | | | | | | | | | | | | | | | | |
| | | Investment Grade Credit Fund | | | | | Local Emerging Markets Debt Fund | | | | | U.S. Mortgages Fund | |
| | | For the
Six Months Ended
September 30, 2014
(Unaudited) | | | | | For the Fiscal
Year Ended
March 31, 2014 | | | | | For the
Six Months Ended
September 30, 2014
(Unaudited) | | | | | For the Fiscal
Year Ended
March 31, 2014 | | | | | For the
Six Months Ended
September 30, 2014
(Unaudited) | | | | | For the Fiscal
Year Ended
March 31, 2014 | |
| | | | | | | | | | | | | | | | | | | | | | | | | | | | | | | | | | |
| | $ | 8,175,052 | | | | | $ | 18,396,080 | | | | | $ | 49,607,440 | | | | | $ | 135,381,620 | | | | | $ | 2,397,394 | | | | | $ | 4,312,305 | |
| | | 6,338,275 | | | | | | 2,761,565 | | | | | | (25,819,469 | ) | | | | | (370,409,799 | ) | | | | | 2,794,571 | | | | | | (721,112 | ) |
| | | (1,200,266 | ) | | | | | (15,610,609 | ) | | | | | (60,594,664 | ) | | | | | (121,257,010 | ) | | | | | 762,801 | | | | | | (1,843,166 | ) |
| | | 13,313,061 | | | | | | 5,547,036 | | | | | | (36,806,693 | ) | | | | | (356,285,189 | ) | | | | | 5,954,766 | | | | | | 1,748,027 | |
| | | | | | | | | | | | | | | | | | | | | | | | | | | | | | | | | | |
| | | | | | | | | | | | | | | | | | | | | | | | | | | | | | | | | | |
| | | | | | | | | | | | | | | | | | | | | | | | | | | | | | | | | | |
| | | (390,403 | ) | | | | | (847,044 | ) | | | | | (2,362,827 | ) | | | | | (816,980 | ) | | | | | (52,909 | ) | | | | | (77,478 | ) |
| | | — | | | | | | — | | | | | | (387,420 | ) | | | | | (121,084 | ) | | | | | — | | | | | | — | |
| | | (2,891,806 | ) | | | | | (7,750,932 | ) | | | | | (53,504,702 | ) | | | | | (15,455,442 | ) | | | | | (412,962 | ) | | | | | (322,475 | ) |
| | | (4,885,469 | ) | | | | | (9,705,470 | ) | | | | | — | | | | | | — | | | | | | (2,670,776 | ) | | | | | (5,950,896 | ) |
| | | (11,933 | ) | | | | | (4,780 | ) | | | | | (188,851 | ) | | | | | (92,086 | ) | | | | | (4,369 | ) | | | | | (267 | ) |
| | | — | | | | | | — | | | | | | — | | | | | | — | | | | | | — | | | | | | — | |
| | | | | | | | | | | | | | | | | | | | | | | | | | | | | | | | | | |
| | | — | | | | | | (382,159 | ) | | | | | — | | | | | | (2,021,339 | ) | | | | | — | | | | | | — | |
| | | — | | | | | | — | | | | | | — | | | | | | (299,581 | ) | | | | | — | | | | | | — | |
| | | — | | | | | | (2,838,640 | ) | | | | | — | | | | | | (38,239,235 | ) | | | | | — | | | | | | — | |
| | | — | | | | | | (3,862,563 | ) | | | | | — | | | | | | — | | | | | | — | | | | | | — | |
| | | — | | | | | | (1,478 | ) | | | | | — | | | | | | (227,835 | ) | | | | | — | | | | | | — | |
| | | — | | | | | | — | | | | | | — | | | | | | — | | | | | | — | | | | | | — | |
| | | | | | | | | | | | | | | | | | | | | | | | | | | | | | | | | | |
| | | — | | | | | | — | | | | | | — | | | | | | (3,899,217 | ) | | | | | — | | | | | | — | |
| | | — | | | | | | — | | | | | | — | | | | | | (577,900 | ) | | | | | — | | | | | | — | |
| | | — | | | | | | — | | | | | | — | | | | | | (73,764,527 | ) | | | | | — | | | | | | — | |
| | | — | | | | | | — | | | | | | — | | | | | | — | | | | | | — | | | | | | — | |
| | | — | | | | | | — | | | | | | — | | | | | | (439,501 | ) | | | | | — | | | | | | — | |
| | | (8,179,611 | ) | | | | | (25,393,066 | ) | | | | | (56,443,800 | ) | | | | | (135,954,727 | ) | | | | | (3,141,016 | ) | | | | | (6,351,116 | ) |
| | | | | | | | | | | | | | | | | | | | | | | | | | | | | | | | | | |
| | | | | | | | | | | | | | | | | | | | | | | | | | | | | | | | | | |
| | | 42,058,358 | | | | | | 128,608,741 | | | | | | 289,323,529 | | | | | | 1,273,268,383 | | | | | | 50,346,392 | | | | | | 63,747,924 | |
| | | 7,556,545 | | | | | | 23,497,220 | | | | | | 54,054,681 | | | | | | 130,957,369 | | | | | | 2,667,596 | | | | | | 5,388,132 | |
| | | (58,597,349 | ) | | | | | (248,333,803 | ) | | | | | (255,169,934 | )(a) | | | | | (2,487,698,109 | )(a) | | | | | (32,045,167 | ) | | | | | (151,142,569 | ) |
| | | (8,982,446 | ) | | | | | (96,227,842 | ) | | | | | 88,208,276 | | | | | | (1,083,472,357 | ) | | | | | 20,968,821 | | | | | | (82,006,513 | ) |
| | | (3,848,996 | ) | | | | | (116,073,872 | ) | | | | | (5,042,217 | ) | | | | | (1,575,712,273 | ) | | | | | 23,782,571 | | | | | | (86,609,602 | ) |
| | | | | | | | | | | | | | | | | | | | | | | | | | | | | | | | | | |
| | | | | | | | | | | | | | | | | | | | | | | | | | | | | | | | | | |
| | | 477,991,654 | | | | | | 594,065,526 | | | | | | 1,920,059,707 | | | | | | 3,495,771,980 | | | | | | 226,864,917 | | | | | | 313,474,519 | |
| | $ | 474,142,658 | | | | | $ | 477,991,654 | | | | | $ | 1,915,017,490 | | | | | $ | 1,920,059,707 | | | | | $ | 250,647,488 | | | | | $ | 226,864,917 | |
| | $ | 358,988 | | | | | $ | 363,547 | | | | | $ | (143,131,965 | ) | | | | $ | (136,295,605 | ) | | | | $ | (715,635 | ) | | | | $ | 27,987 | |
| | |
| The accompanying notes are an integral part of these financial statements. | | 131 |
GOLDMAN SACHS DYNAMIC EMERGING MARKETS DEBT FUND
Financial Highlights
Selected Data for a Share Outstanding Throughout Each Period
| | | | | | | | | | | | | | | | | | | | | | | | | | | | | | |
| | | | | | | | Income (loss) from
investment operations | | | Distributions
to shareholders | |
| | | Year - Share Class | |
Net asset
value,
beginning
of period | | | Net
investment
income(a) | | | Net realized
and unrealized
gain (loss) | | | Total from
investment
operations | | | From net
investment
income | | | From
capital | | | Total
distributions | |
| | FOR THE SIX MONTHS ENDED SEPTEMBER 30, (UNAUDITED) | |
| | 2014 - A | | $ | 9.45 | | | $ | 0.20 | | | $ | (0.14 | ) | | $ | 0.06 | | | $ | (0.20 | ) | | $ | — | | | $ | (0.20 | ) |
| | 2014 - C | | | 9.46 | | | | 0.16 | | | | (0.12 | ) | | | 0.04 | | | | (0.16 | ) | | | — | | | | (0.16 | ) |
| | 2014 - Institutional | | | 9.46 | | | | 0.22 | | | | (0.13 | ) | | | 0.09 | | | | (0.21 | ) | | | — | | | | (0.21 | ) |
| | 2014 - IR | | | 9.44 | | | | 0.21 | | | | (0.12 | ) | | | 0.09 | | | | (0.21 | ) | | | — | | | | (0.21 | ) |
| | 2014 - R | | | 9.46 | | | | 0.19 | | | | (0.13 | ) | | | 0.06 | | | | (0.18 | ) | | | — | | | | (0.18 | ) |
| | | | | | | | | | | | | | | | | | | | | | | | | | | | | | |
| | FOR THE PERIOD ENDED MARCH 31, | |
| | 2014 - A (Commenced May 31, 2013) | | | 10.00 | | | | 0.31 | | | | (0.52 | ) | | | (0.21 | ) | | | (0.23 | ) | | | (0.11 | ) | | | (0.34 | ) |
| | 2014 - C (Commenced May 31, 2013) | | | 10.00 | | | | 0.25 | | | | (0.51 | ) | | | (0.26 | ) | | | (0.17 | ) | | | (0.11 | ) | | | (0.28 | ) |
| | 2014 - Institutional (Commenced May 31, 2013) | | | 10.00 | | | | 0.32 | | | | (0.50 | ) | | | (0.18 | ) | | | (0.25 | ) | | | (0.11 | ) | | | (0.36 | ) |
| | 2014 - IR (Commenced May 31, 2013) | | | 10.00 | | | | 0.31 | | | | (0.52 | ) | | | (0.21 | ) | | | (0.24 | ) | | | (0.11 | ) | | | (0.35 | ) |
| | 2014 - R (Commenced May 31, 2013) | | | 10.00 | | | | 0.27 | | | | (0.49 | ) | | | (0.22 | ) | | | (0.21 | ) | | | (0.11 | ) | | | (0.32 | ) |
| | (a) | | Calculated based on the average shares outstanding methodology. |
| | (b) | | Assumes investment at the net asset value at the beginning of the period, reinvestment of all dividends and distributions, a complete redemption of the investment at the net asset value at the end of the period and no sales or redemption charges. Total returns would be reduced if a sales or redemption charge was taken into account. Returns do not reflect the deduction of taxes that a shareholder would pay on Fund distributions or the redemption of Fund shares. Total returns for periods less than one full year are not annualized. |
| | (d) | | The Fund’s portfolio turnover rate is calculated in accordance with regulatory requirements, without regard to transactions involving short term investments and certain derivatives. If such transactions were included, the Fund’s portfolio turnover rate may be higher. |
| | |
| 132 | | The accompanying notes are an integral part of these financial statements. |
GOLDMAN SACHS DYNAMIC EMERGING MARKETS DEBT FUND
| | | | | | | | | | | | | | | | | | | | | | | | | | | | | | | | | | | | | | | | |
| | | | | | | | | | | | | | | | | | | | | | | | | | | | | | | | | | |
| | | Net asset
value, end
of period | | | | | Total
return(b) | | | | | Net assets,
end of
period
(in 000s) | | | | | Ratio of
net expenses
to average
net assets(c) | | | | | Ratio of
total expenses
to average
net assets(c) | | | | | Ratio of
net investment
income
to average
net assets(c) | | | | | Portfolio
turnover
rate(d) | |
| | | | | | | | | | | | | | | | | | | | | | | | | | | | | | | | | | | | | | | | |
| | $ | 9.31 | | | | | | 0.56 | % | | | | $ | 145 | | | | | | 1.27 | % | | | | | 2.96 | % | | | | | 4.20 | % | | | | | 63 | % |
| | | 9.34 | | | | | | 0.39 | | | | | | 115 | | | | | | 2.00 | | | | | | 3.46 | | | | | | 3.39 | | | | | | 63 | |
| | | 9.34 | | | | | | 0.95 | | | | | | 28,305 | | | | | | 0.91 | | | | | | 2.40 | | | | | | 4.50 | | | | | | 63 | |
| | | 9.32 | | | | | | 0.89 | | | | | | 25 | | | | | | 1.02 | | | | | | 2.50 | | | | | | 4.39 | | | | | | 63 | |
| | | 9.34 | | | | | | 0.65 | | | | | | 25 | | | | | | 1.50 | | | | | | 3.00 | | | | | | 3.89 | | | | | | 63 | |
| | | | | | | | | | | | | | | | | | | | | | | | | | | | | | | | | | | | | | | | |
| | | | | | | | | | | | | | | | | | | | | | | | | | | | | | | | | | | | | | | | |
| | | 9.45 | | | | | | (2.03 | ) | | | | | 99 | | | | | | 1.27 | | | | | | 3.67 | | | | | | 3.97 | | | | | | 140 | |
| | | 9.46 | | | | | | (2.52 | ) | | | | | 59 | | | | | | 2.01 | | | | | | 5.31 | | | | | | 3.27 | | | | | | 140 | |
| | | 9.46 | | | | | | (1.67 | ) | | | | | 24,119 | | | | | | 0.93 | | | | | | 4.21 | | | | | | 4.17 | | | | | | 140 | |
| | | 9.44 | | | | | | (1.98 | ) | | | | | 24 | | | | | | 1.03 | | | | | | 4.19 | | | | | | 4.00 | | | | | | 140 | |
| | | 9.46 | | | | | | (2.14 | ) | | | | | 24 | | | | | | 1.52 | | | | | | 5.22 | | | | | | 3.50 | | | | | | 140 | |
| | |
| The accompanying notes are an integral part of these financial statements. | | 133 |
GOLDMAN SACHS EMERGING MARKETS DEBT FUND
Financial Highlights
Selected Data for a Share Outstanding Throughout Each Period
| | | | | | | | | | | | | | | | | | | | | | | | | | | | | | | | | | |
| | | | | | | | Income (loss) from
investment operations | | | Distributions
to shareholders | |
| | | Year - Share Class | |
Net asset
value,
beginning
of period | | | Net
investment
income(a) | | | Net realized
and unrealized
gain (loss) | | | Total from
investment
operations | | | From net
investment
income | | | From net
realized
gains | | | From capital | | | Total
distributions | |
| | FOR THE SIX MONTHS ENDED SEPTEMBER 30, (UNAUDITED) | | | | | |
| | 2014 - A | | $ | 12.40 | | | $ | 0.25 | | | $ | 0.27 | | | $ | 0.52 | | | $ | (0.25 | ) | | $ | — | | | $ | — | | | $ | (0.25 | ) |
| | 2014 - C | | | 12.39 | | | | 0.20 | | | | 0.28 | | | | 0.48 | | | | (0.20 | ) | | | — | | | | — | | | | (0.20 | ) |
| | 2014 - Institutional | | | 12.41 | | | | 0.27 | | | | 0.28 | | | | 0.55 | | | | (0.27 | ) | | | — | | | | — | | | | (0.27 | ) |
| | 2014 - IR | | | 12.41 | | | | 0.26 | | | | 0.29 | | | | 0.55 | | | | (0.27 | ) | | | — | | | | — | | | | (0.27 | ) |
| | | | | | | | | | | | | | | | | | | | | | | | | | | | | | | | | | |
| | FOR THE FISCAL YEARS ENDED MARCH 31, | | | | | |
| | 2014 - A | | | 13.28 | | | | 0.55 | | | | (0.70 | ) | | | (0.15 | ) | | | (0.50 | ) | | | (0.20 | ) | | | (0.03 | ) | | | (0.73 | ) |
| | 2014 - C | | | 13.27 | | | | 0.46 | | | | (0.70 | ) | | | (0.24 | ) | | | (0.41 | ) | | | (0.20 | ) | | | (0.03 | ) | | | (0.64 | ) |
| | 2014 - Institutional | | | 13.29 | | | | 0.59 | | | | (0.69 | ) | | | (0.10 | ) | | | (0.55 | ) | | | (0.20 | ) | | | (0.03 | ) | | | (0.78 | ) |
| | 2014 - IR | | | 13.29 | | | | 0.58 | | | | (0.69 | ) | | | (0.11 | ) | | | (0.54 | ) | | | (0.20 | ) | | | (0.03 | ) | | | (0.77 | ) |
| | 2013 - A | | | 12.95 | | | | 0.61 | | | | 0.76 | | | | 1.37 | | | | (0.65 | ) | | | (0.39 | ) | | | — | | | | (1.04 | ) |
| | 2013 - C | | | 12.94 | | | | 0.50 | | | | 0.77 | | | | 1.27 | | | | (0.55 | ) | | | (0.39 | ) | | | — | | | | (0.94 | ) |
| | 2013 - Institutional | | | 12.96 | | | | 0.65 | | | | 0.77 | | | | 1.42 | | | | (0.70 | ) | | | (0.39 | ) | | | — | | | | (1.09 | ) |
| | 2013 - IR | | | 12.96 | | | | 0.64 | | | | 0.77 | | | | 1.41 | | | | (0.69 | ) | | | (0.39 | ) | | | — | | | | (1.08 | ) |
| | 2012 - A | | | 12.28 | | | | 0.61 | | | | 0.81 | | | | 1.42 | | | | (0.61 | ) | | | (0.14 | ) | | | — | | | | (0.75 | ) |
| | 2012 - C | | | 12.27 | | | | 0.52 | | | | 0.80 | | | | 1.32 | | | | (0.51 | ) | | | (0.14 | ) | | | — | | | | (0.65 | ) |
| | 2012 - Institutional | | | 12.29 | | | | 0.65 | | | | 0.81 | | | | 1.46 | | | | (0.65 | ) | | | (0.14 | ) | | | — | | | | (0.79 | ) |
| | 2012 - IR | | | 12.29 | | | | 0.63 | | | | 0.82 | | | | 1.45 | | | | (0.64 | ) | | | (0.14 | ) | | | — | | | | (0.78 | ) |
| | 2011 - A | | | 11.99 | | | | 0.59 | | | | 0.42 | | | | 1.01 | | | | (0.71 | ) | | | (0.01 | ) | | | — | | | | (0.72 | ) |
| | 2011 - C | | | 11.98 | | | | 0.49 | | | | 0.43 | | | | 0.92 | | | | (0.62 | ) | | | (0.01 | ) | | | — | | | | (0.63 | ) |
| | 2011 - Institutional | | | 12.00 | | | | 0.63 | | | | 0.42 | | | | 1.05 | | | | (0.75 | ) | | | (0.01 | ) | | | — | | | | (0.76 | ) |
| | 2011 - IR (Commenced July 30, 2010) | | | 12.44 | | | | 0.41 | | | | (0.04 | ) | | | 0.37 | | | | (0.51 | ) | | | (0.01 | ) | | | — | | | | (0.52 | ) |
| | 2010 - A | | | 9.19 | | | | 0.70 | | | | 2.96 | | | | 3.66 | | | | (0.86 | ) | | | — | | | | — | | | | (0.86 | ) |
| | 2010 - C | | | 9.16 | | | | 0.61 | | | | 2.99 | | | | 3.60 | | | | (0.78 | ) | | | — | | | | — | | | | (0.78 | ) |
| | 2010 - Institutional | | | 9.20 | | | | 0.74 | | | | 2.96 | | | | 3.70 | | | | (0.90 | ) | | | — | | | | — | | | | (0.90 | ) |
| | (a) | | Calculated based on the average shares outstanding methodology. |
| | (b) | | Assumes investment at the net asset value at the beginning of the period, reinvestment of all dividends and distributions, a complete redemption of the investment at the net asset value at the end of the period and no sales or redemption charges. Total returns would be reduced if a sales or redemption charge was taken into account. Returns do not reflect the deduction of taxes that a shareholder would pay on Fund distributions or the redemption of Fund shares. Total returns for periods less than one full year are not annualized. |
| | (c) | | The Fund’s portfolio turnover rate is calculated in accordance with regulatory requirements, without regard to transactions involving short term investments and certain derivatives. If such transactions were included, the Fund’s portfolio turnover rate may be higher. |
| | (e) | | Portfolio turnover rates exclude portfolio securities received as a result of in-kind subscriptions. |
| | |
| 134 | | The accompanying notes are an integral part of these financial statements. |
GOLDMAN SACHS EMERGING MARKETS DEBT FUND
| | | | | | | | | | | | | | | | | | | | | | | | | | | | | | | | | | | | | | | | |
| | | | | | | | | | | | | | | | | | | | | | | | | | | | | | | | | | |
| | | Net asset
value, end
of period | | | | | Total
return(b) | | | | | Net assets,
end of
period
(in 000s) | | | | | Ratio of
net expenses
to average
net assets | | | | | Ratio of
total expenses
to average
net assets | | | | | Ratio of
net investment
income
to average
net assets | | | | | Portfolio
turnover
rate(c) | |
| | | | | | | | | | | | | | | | | | | | | | | | | | | | | | | | | | | | | | | | |
| | $ | 12.67 | | | | | | 4.19 | % | | | | $ | 88,173 | | | | | | 1.25 | %(d) | | | | | 1.26 | %(d) | | | | | 3.89 | %(d) | | | | | 48 | % |
| | | 12.67 | | | | | | 3.88 | | | | | | 32,401 | | | | | | 2.00 | (d) | | | | | 2.01 | (d) | | | | | 3.13 | (d) | | | | | 48 | |
| | | 12.69 | | | | | | 4.44 | | | | | | 1,617,898 | | | | | | 0.91 | (d) | | | | | 0.92 | (d) | | | | | 4.20 | (d) | | | | | 48 | |
| | | 12.69 | | | | | | 4.40 | | | | | | 17,881 | | | | | | 1.00 | (d) | | | | | 1.01 | (d) | | | | | 4.14 | (d) | | | | | 48 | |
| | | | | | | | | | | | | | | | | | | | | | | | | | | | | | | | | | | | | | | | |
| | | | | | | | | | | | | | | | | | | | | | | | | | | | | | | | | | | | | | | | |
| | | 12.40 | | | | | | (0.88 | ) | | | | | 100,723 | | | | | | 1.25 | | | | | | 1.26 | | | | | | 4.38 | | | | | | 121 | |
| | | 12.39 | | | | | | (1.63 | ) | | | | | 32,020 | | | | | | 2.00 | | | | | | 2.01 | | | | | | 3.65 | | | | | | 121 | |
| | | 12.41 | | | | | | (0.54 | ) | | | | | 1,296,153 | | | | | | 0.91 | | | | | | 0.92 | | | | | | 4.76 | | | | | | 121 | |
| | | 12.41 | | | | | | (0.63 | ) | | | | | 16,552 | | | | | | 1.00 | | | | | | 1.01 | | | | | | 4.65 | | | | | | 121 | |
| | | 13.28 | | | | | | 10.64 | | | | | | 211,379 | | | | | | 1.23 | | | | | | 1.26 | | | | | | 4.48 | | | | | | 97 | |
| | | 13.27 | | | | | | 9.82 | | | | | | 49,527 | | | | | | 1.98 | | | | | | 2.01 | | | | | | 3.73 | | | | | | 97 | |
| | | 13.29 | | | | | | 11.04 | | | | | | 1,329,643 | | | | | | 0.89 | | | | | | 0.92 | | | | | | 4.83 | | | | | | 97 | |
| | | 13.29 | | | | | | 10.91 | | | | | | 23,970 | | | | | | 0.97 | | | | | | 1.01 | | | | | | 4.69 | | | | | | 97 | |
| | | 12.95 | | | | | | 11.87 | | | | | | 169,491 | | | | | | 1.22 | | | | | | 1.27 | | | | | | 4.84 | | | | | | 86 | |
| | | 12.94 | | | | | | 11.05 | | | | | | 31,893 | | | | | | 1.97 | | | | | | 2.02 | | | | | | 4.11 | | | | | | 86 | |
| | | 12.96 | | | | | | 12.24 | | | | | | 720,098 | | | | | | 0.88 | | | | | | 0.93 | | | | | | 5.18 | | | | | | 86 | |
| | | 12.96 | | | | | | 12.14 | | | | | | 6,515 | | | | | | 0.97 | | | | | | 1.02 | | | | | | 5.05 | | | | | | 86 | |
| | | 12.28 | | | | | | 8.46 | | | | | | 156,901 | | | | | | 1.22 | | | | | | 1.29 | | | | | | 4.75 | | | | | | 116 | (e) |
| | | 12.27 | | | | | | 7.65 | | | | | | 31,205 | | | | | | 1.97 | | | | | | 2.04 | | | | | | 4.00 | | | | | | 116 | (e) |
| | | 12.29 | | | | | | 8.82 | | | | | | 436,068 | | | | | | 0.88 | | | | | | 0.95 | | | | | | 5.12 | | | | | | 116 | (e) |
| | | 12.29 | | | | | | 2.96 | | | | | | 1,392 | | | | | | 0.97 | (d) | | | | | 1.05 | (d) | | | | | 4.96 | (d) | | | | | 116 | (e) |
| | | 11.99 | | | | | | 40.98 | | | | | | 105,352 | | | | | | 1.22 | | | | | | 1.31 | | | | | | 6.27 | | | | | | 121 | |
| | | 11.98 | | | | | | 40.28 | | | | | | 10,629 | | | | | | 1.97 | | | | | | 2.06 | | | | | | 5.41 | | | | | | 121 | |
| | | 12.00 | | | | | | 41.42 | | | | | | 278,030 | | | | | | 0.88 | | | | | | 0.97 | | | | | | 6.63 | | | | | | 121 | |
| | |
| The accompanying notes are an integral part of these financial statements. | | 135 |
GOLDMAN SACHS HIGH YIELD FUND
Financial Highlights
Selected Data for a Share Outstanding Throughout Each Period
| | | | | | | | | | | | | | | | | | | | | | | | | | | | | | |
| | | | | | | | Income (loss) from
investment operations | | | Distributions
to shareholders | |
| | | Year - Share Class | |
Net asset
value,
beginning
of period | | | Net
investment
income(a) | | | Net realized
and unrealized
gain (loss) | | | Total from
investment
operations | | | From net
investment
income | | | From net
realized
gains | | | Total
distributions | |
| | FOR THE SIX MONTHS ENDED SEPTEMBER 30, (UNAUDITED) | |
| | 2014 - A | | $ | 7.23 | | | $ | 0.19 | | | $ | (0.21 | ) | | $ | (0.02 | ) | | $ | (0.19 | ) | | $ | — | | | $ | (0.19 | ) |
| | 2014 - B | | | 7.25 | | | | 0.17 | | | | (0.22 | ) | | | (0.05 | ) | | | (0.16 | ) | | | — | | | | (0.16 | ) |
| | 2014 - C | | | 7.24 | | | | 0.17 | | | | (0.22 | ) | | | (0.05 | ) | | | (0.16 | ) | | | — | | | | (0.16 | ) |
| | 2014 - Institutional | | | 7.25 | | | | 0.21 | | | | (0.22 | ) | | | (0.01 | ) | | | (0.20 | ) | | | — | | | | (0.20 | ) |
| | 2014 - Service | | | 7.23 | | | | 0.19 | | | | (0.22 | ) | | | (0.03 | ) | | | (0.18 | ) | | | — | | | | (0.18 | ) |
| | 2014 - IR | | | 7.25 | | | | 0.20 | | | | (0.21 | ) | | | (0.01 | ) | | | (0.20 | ) | | | — | | | | (0.20 | ) |
| | 2014 - R | | | 7.23 | | | | 0.18 | | | | (0.21 | ) | | | (0.03 | ) | | | (0.18 | ) | | | — | | | | (0.18 | ) |
| | | | | | | | | | | | | | | | | | | | | | | | | | | | | | |
| | FOR THE FISCAL YEARS ENDED MARCH 31, | |
| | 2014 - A | | | 7.40 | | | | 0.43 | | | | 0.09 | | | | 0.52 | | | | (0.43 | ) | | | (0.26 | ) | | | (0.69 | ) |
| | 2014 - B | | | 7.42 | | | | 0.38 | | | | 0.08 | | | | 0.46 | | | | (0.37 | ) | | | (0.26 | ) | | | (0.63 | ) |
| | 2014 - C | | | 7.41 | | | | 0.38 | | | | 0.08 | | | | 0.46 | | | | (0.37 | ) | | | (0.26 | ) | | | (0.63 | ) |
| | 2014 - Institutional | | | 7.42 | | | | 0.46 | | | | 0.08 | | | | 0.54 | | | | (0.45 | ) | | | (0.26 | ) | | | (0.71 | ) |
| | 2014 - Service | | | 7.40 | | | | 0.42 | | | | 0.09 | | | | 0.51 | | | | (0.42 | ) | | | (0.26 | ) | | | (0.68 | ) |
| | 2014 - IR | | | 7.41 | | | | 0.45 | | | | 0.10 | | | | 0.55 | | | | (0.45 | ) | | | (0.26 | ) | | | (0.71 | ) |
| | 2014 - R | | | 7.40 | | | | 0.41 | | | | 0.09 | | | | 0.50 | | | | (0.41 | ) | | | (0.26 | ) | | | (0.67 | ) |
| | 2013 - A | | | 7.12 | | | | 0.45 | | | | 0.42 | | | | 0.87 | | | | (0.46 | ) | | | (0.13 | ) | | | (0.59 | ) |
| | 2013 - B | | | 7.13 | | | | 0.40 | | | | 0.43 | | | | 0.83 | | | | (0.41 | ) | | | (0.13 | ) | | | (0.54 | ) |
| | 2013 - C | | | 7.13 | | | | 0.40 | | | | 0.42 | | | | 0.82 | | | | (0.41 | ) | | | (0.13 | ) | | | (0.54 | ) |
| | 2013 - Institutional | | | 7.14 | | | | 0.48 | | | | 0.42 | | | | 0.90 | | | | (0.49 | ) | | | (0.13 | ) | | | (0.62 | ) |
| | 2013 - Service | | | 7.11 | | | | 0.44 | | | | 0.43 | | | | 0.87 | | | | (0.45 | ) | | | (0.13 | ) | | | (0.58 | ) |
| | 2013 - IR | | | 7.13 | | | | 0.47 | | | | 0.42 | | | | 0.89 | | | | (0.48 | ) | | | (0.13 | ) | | | (0.61 | ) |
| | 2013 - R | | | 7.12 | | | | 0.44 | | | | 0.41 | | | | 0.85 | | | | (0.44 | ) | | | (0.13 | ) | | | (0.57 | ) |
| | 2012 - A | | | 7.38 | | | | 0.49 | | | | (0.18 | ) | | | 0.31 | | | | (0.50 | ) | | | (0.07 | ) | | | (0.57 | ) |
| | 2012 - B | | | 7.40 | | | | 0.44 | | | | (0.19 | ) | | | 0.25 | | | | (0.45 | ) | | | (0.07 | ) | | | (0.52 | ) |
| | 2012 - C | | | 7.39 | | | | 0.44 | | | | (0.19 | ) | | | 0.25 | | | | (0.44 | ) | | | (0.07 | ) | | | (0.51 | ) |
| | 2012 - Institutional | | | 7.40 | | | | 0.51 | | | | (0.18 | ) | | | 0.33 | | | | (0.52 | ) | | | (0.07 | ) | | | (0.59 | ) |
| | 2012 - Service | | | 7.38 | | | | 0.48 | | | | (0.19 | ) | | | 0.29 | | | | (0.49 | ) | | | (0.07 | ) | | | (0.56 | ) |
| | 2012 - IR | | | 7.39 | | | | 0.50 | | | | (0.17 | ) | | | 0.33 | | | | (0.52 | ) | | | (0.07 | ) | | | (0.59 | ) |
| | 2012 - R | | | 7.38 | | | | 0.47 | | | | (0.18 | ) | | | 0.29 | | | | (0.48 | ) | | | (0.07 | ) | | | (0.55 | ) |
| | 2011 - A | | | 7.07 | | | | 0.55 | | | | 0.30 | | | | 0.85 | | | | (0.54 | ) | | | — | | | | (0.54 | ) |
| | 2011 - B | | | 7.08 | | | | 0.49 | | | | 0.32 | | | | 0.81 | | | | (0.49 | ) | | | — | | | | (0.49 | ) |
| | 2011 - C | | | 7.08 | | | | 0.49 | | | | 0.31 | | | | 0.80 | | | | (0.49 | ) | | | — | | | | (0.49 | ) |
| | 2011 - Institutional | | | 7.09 | | | | 0.57 | | | | 0.31 | | | | 0.88 | | | | (0.57 | ) | | | — | | | | (0.57 | ) |
| | 2011 - Service | | | 7.06 | | | | 0.53 | | | | 0.32 | | | | 0.85 | | | | (0.53 | ) | | | — | | | | (0.53 | ) |
| | 2011 - IR | | | 7.07 | | | | 0.56 | | | | 0.32 | | | | 0.88 | | | | (0.56 | ) | | | — | | | | (0.56 | ) |
| | 2011 - R | | | 7.07 | | | | 0.53 | | | | 0.31 | | | | 0.84 | | | | (0.53 | ) | | | — | | | | (0.53 | ) |
| | 2010 - A | | | 5.18 | | | | 0.53 | | | | 1.90 | | | | 2.43 | | | | (0.54 | ) | | | — | | | | (0.54 | ) |
| | 2010 - B | | | 5.18 | | | | 0.49 | | | | 1.90 | | | | 2.39 | | | | (0.49 | ) | | | — | | | | (0.49 | ) |
| | 2010 - C | | | 5.18 | | | | 0.49 | | | | 1.90 | | | | 2.39 | | | | (0.49 | ) | | | — | | | | (0.49 | ) |
| | 2010 - Institutional | | | 5.19 | | | | 0.56 | | | | 1.91 | | | | 2.47 | | | | (0.57 | ) | | | — | | | | (0.57 | ) |
| | 2010 - Service | | | 5.17 | | | | 0.53 | | | | 1.89 | | | | 2.42 | | | | (0.53 | ) | | | — | | | | (0.53 | ) |
| | 2010 - IR | | | 5.18 | | | | 0.55 | | | | 1.90 | | | | 2.45 | | | | (0.56 | ) | | | — | | | | (0.56 | ) |
| | 2010 - R | | | 5.17 | | | | 0.52 | | | | 1.91 | | | | 2.43 | | | | (0.53 | ) | | | — | | | | (0.53 | ) |
| | (a) | | Calculated based on the average shares outstanding methodology. |
| | (b) | | Assumes investment at the net asset value at the beginning of the period, reinvestment of all dividends and distributions, a complete redemption of the investment at the net asset value at the end of the period and no sales or redemption charges. Total returns would be reduced if a sales or redemption charge was taken into account. Returns do not reflect the deduction of taxes that a shareholder would pay on Fund distributions or the redemption of Fund shares. |
| | (c) | | The Fund’s portfolio turnover rate is calculated in accordance with regulatory requirements, without regard to transactions involving short term investments and certain derivatives. If such transactions were included, the Fund’s portfolio turnover rate may be higher. |
| | |
| 136 | | The accompanying notes are an integral part of these financial statements. |
GOLDMAN SACHS HIGH YIELD FUND
| | | | | | | | | | | | | | | | | | | | | | | | | | | | | | | | | | | | | | | | |
| | | | | | | | | | | | | | | | | | | | | | | | | | | | | | | | | | |
| | | Net asset
value, end
of period | | | | | Total
return(b) | | | | | Net assets,
end of
period
(in 000s) | | | | | Ratio of
net expenses
to average
net assets | | | | | Ratio of
total expenses
to average
net assets | | | | | Ratio of
net investment
income
to average
net assets | | | | | Portfolio
turnover
rate(c) | |
| | | | | | | | | | | | | | | | | | | | | | | | | | | | | | | | | | | | | | | | |
| | $ | 7.02 | | | | | | (0.30 | )% | | | | $ | 401,415 | | | | | | 1.06 | %(d) | | | | | 1.06 | %(d) | | | | | 5.35 | %(d) | | | | | 30 | % |
| | | 7.04 | | | | | | (0.66 | ) | | | | | 8,574 | | | | | | 1.81 | (d) | | | | | 1.81 | (d) | | | | | 4.61 | (d) | | | | | 30 | |
| | | 7.03 | | | | | | (0.67 | ) | | | | | 81,201 | | | | | | 1.81 | (d) | | | | | 1.81 | (d) | | | | | 4.60 | (d) | | | | | 30 | |
| | | 7.04 | | | | | | (0.12 | ) | | | | | 4,145,926 | | | | | | 0.72 | (d) | | | | | 0.72 | (d) | | | | | 5.69 | (d) | | | | | 30 | |
| | | 7.02 | | | | | | (0.38 | ) | | | | | 16,206 | | | | | | 1.22 | (d) | | | | | 1.22 | (d) | | | | | 5.18 | (d) | | | | | 30 | |
| | | 7.04 | | | | | | (0.16 | ) | | | | | 15,480 | | | | | | 0.81 | (d) | | | | | 0.81 | (d) | | | | | 5.60 | (d) | | | | | 30 | |
| | | 7.02 | | | | | | (0.42 | ) | | | | | 17,760 | | | | | | 1.31 | (d) | | | | | 1.31 | (d) | | | | | 5.09 | (d) | | | | | 30 | |
| | | | | | | | | | | | | | | | | | | | | | | | | | | | | | | | | | | | | | | | |
| | | | | | | | | | | | | | | | | | | | | | | | | | | | | | | | | | | | | | | | |
| | | 7.23 | | | | | | 7.41 | | | | | | 549,354 | | | | | | 1.05 | | | | | | 1.05 | | | | | | 5.95 | | | | | | 48 | |
| | | 7.25 | | | | | | 6.61 | | | | | | 11,655 | | | | | | 1.81 | | | | | | 1.81 | | | | | | 5.22 | | | | | | 48 | |
| | | 7.24 | | | | | | 6.61 | | | | | | 88,607 | | | | | | 1.81 | | | | | | 1.81 | | | | | | 5.21 | | | | | | 48 | |
| | | 7.25 | | | | | | 7.77 | | | | | | 4,436,484 | | | | | | 0.72 | | | | | | 0.72 | | | | | | 6.30 | | | | | | 48 | |
| | | 7.23 | | | | | | 7.24 | | | | | | 17,066 | | | | | | 1.22 | | | | | | 1.22 | | | | | | 5.79 | | | | | | 48 | |
| | | 7.25 | | | | | | 7.68 | | | | | | 15,142 | | | | | | 0.81 | | | | | | 0.81 | | | | | | 6.22 | | | | | | 48 | |
| | | 7.23 | | | | | | 7.14 | | | | | | 18,075 | | | | | | 1.31 | | | | | | 1.31 | | | | | | 5.70 | | | | | | 48 | |
| | | 7.40 | | | | | | 12.67 | | | | | | 576,060 | | | | | | 1.05 | | | | | | 1.05 | | | | | | 6.27 | | | | | | 68 | |
| | | 7.42 | | | | | | 11.97 | | | | | | 20,355 | | | | | | 1.80 | | | | | | 1.80 | | | | | | 5.53 | | | | | | 68 | |
| | | 7.41 | | | | | | 11.83 | | | | | | 106,063 | | | | | | 1.80 | | | | | | 1.80 | | | | | | 5.52 | | | | | | 68 | |
| | | 7.42 | | | | | | 13.03 | | | | | | 5,167,948 | | | | | | 0.71 | | | | | | 0.71 | | | | | | 6.61 | | | | | | 68 | |
| | | 7.40 | | | | | | 12.65 | | | | | | 17,512 | | | | | | 1.21 | | | | | | 1.21 | | | | | | 6.11 | | | | | | 68 | |
| | | 7.41 | | | | | | 13.09 | | | | | | 19,711 | | | | | | 0.80 | | | | | | 0.80 | | | | | | 6.55 | | | | | | 68 | |
| | | 7.40 | | | | | | 12.39 | | | | | | 18,565 | | | | | | 1.30 | | | | | | 1.30 | | | | | | 6.01 | | | | | | 68 | |
| | | 7.12 | | | | | | 4.53 | | | | | | 630,049 | | | | | | 1.06 | | | | | | 1.06 | | | | | | 6.97 | | | | | | 71 | |
| | | 7.13 | | | | | | 3.62 | | | | | | 30,572 | | | | | | 1.81 | | | | | | 1.81 | | | | | | 6.24 | | | | | | 71 | |
| | | 7.13 | | | | | | 3.76 | | | | | | 108,682 | | | | | | 1.81 | | | | | | 1.81 | | | | | | 6.21 | | | | | | 71 | |
| | | 7.14 | | | | | | 4.89 | | | | | | 4,988,221 | | | | | | 0.72 | | | | | | 0.72 | | | | | | 7.25 | | | | | | 71 | |
| | | 7.11 | | | | | | 4.22 | | | | | | 21,420 | | | | | | 1.22 | | | | | | 1.22 | | | | | | 6.81 | | | | | | 71 | |
| | | 7.13 | | | | | | 4.79 | | | | | | 37,059 | | | | | | 0.81 | | | | | | 0.81 | | | | | | 7.13 | | | | | | 71 | |
| | | 7.12 | | | | | | 4.28 | | | | | | 17,087 | | | | | | 1.31 | | | | | | 1.31 | | | | | | 6.69 | | | | | | 71 | |
| | | 7.38 | | | | | | 12.56 | | | | | | 862,655 | | | | | | 1.05 | | | | | | 1.06 | | | | | | 7.63 | | | | | | 46 | |
| | | 7.40 | | | | | | 11.87 | | | | | | 45,430 | | | | | | 1.80 | | | | | | 1.81 | | | | | | 6.86 | | | | | | 46 | |
| | | 7.39 | | | | | | 11.72 | | | | | | 114,921 | | | | | | 1.80 | | | | | | 1.81 | | | | | | 6.85 | | | | | | 46 | |
| | | 7.40 | | | | | | 12.93 | | | | | | 4,492,556 | | | | | | 0.71 | | | | | | 0.72 | | | | | | 7.94 | | | | | | 46 | |
| | | 7.38 | | | | | | 12.54 | | | | | | 23,208 | | | | | | 1.21 | | | | | | 1.22 | | | | | | 7.44 | | | | | | 46 | |
| | | 7.39 | | | | | | 12.99 | | | | | | 3,081 | | | | | | 0.80 | | | | | | 0.81 | | | | | | 7.79 | | | | | | 46 | |
| | | 7.38 | | | | | | 12.29 | | | | | | 13,279 | | | | | | 1.30 | | | | | | 1.31 | | | | | | 7.36 | | | | | | 46 | |
| | | 7.07 | | | | | | 48.28 | | | | | | 1,339,958 | | | | | | 1.05 | | | | | | 1.06 | | | | | | 8.38 | | | | | | 35 | |
| | | 7.08 | | | | | | 47.38 | | | | | | 60,649 | | | | | | 1.80 | | | | | | 1.81 | | | | | | 7.61 | | | | | | 35 | |
| | | 7.08 | | | | | | 47.38 | | | | | | 111,997 | | | | | | 1.80 | | | | | | 1.81 | | | | | | 7.56 | | | | | | 35 | |
| | | 7.09 | | | | | | 48.88 | | | | | | 4,655,677 | | | | | | 0.71 | | | | | | 0.72 | | | | | | 8.64 | | | | | | 35 | |
| | | 7.06 | | | | | | 48.13 | | | | | | 22,639 | | | | | | 1.21 | | | | | | 1.22 | | | | | | 8.14 | | | | | | 35 | |
| | | 7.07 | | | | | | 48.63 | | | | | | 786 | | | | | | 0.80 | | | | | | 0.81 | | | | | | 8.01 | | | | | | 35 | |
| | | 7.07 | | | | | | 48.20 | | | | | | 5,404 | | | | | | 1.30 | | | | | | 1.31 | | | | | | 7.78 | | | | | | 35 | |
| | |
| The accompanying notes are an integral part of these financial statements. | | 137 |
GOLDMAN SACHS HIGH YIELD FLOATING RATE FUND
Financial Highlights
Selected Data for a Share Outstanding Throughout Each Period
| | | | | | | | | | | | | | | | | | | | | | | | | | | | | | | | | | |
| | | | | | | | Income (loss) from
investment operations | | | Distributions
to shareholders | | | | |
| | | Year - Share Class | | Net asset
value,
beginning
of period | | | Net
investment
income(a) | | | Net realized
and unrealized
gain (loss) | | | Total from
investment
operations | | | From net
investment
income | | | From net
realized
gains | | | From
capital | | | Total
distributions | |
| | FOR THE SIX MONTHS ENDED SEPTEMBER 30, (UNAUDITED) | |
| | 2014 - A | | $ | 10.07 | | | $ | 0.17 | | | $ | (0.15 | ) | | $ | 0.02 | | | $ | (0.17 | ) | | $ | — | | | $ | — | | | $ | (0.17 | ) |
| | 2014 - C | | | 10.08 | | | | 0.13 | | | | (0.16 | ) | | | (0.03 | ) | | | (0.13 | ) | | | — | | | | — | | | | (0.13 | ) |
| | 2014 - Institutional | | | 10.09 | | | | 0.18 | | | | (0.16 | ) | | | 0.02 | | | | (0.18 | ) | | | — | | | | — | | | | (0.18 | ) |
| | 2014 - IR | | | 10.09 | | | | 0.18 | | | | (0.15 | ) | | | 0.03 | | | | (0.18 | ) | | | — | | | | — | | | | (0.18 | ) |
| | 2014 - R | | | 10.08 | | | | 0.15 | | | | (0.16 | ) | | | (0.01 | ) | | | (0.15 | ) | | | — | | | | — | | | | (0.15 | ) |
| | | | | | | | | | | | | | | | | | | | | | | | | | | | | | | | | | |
| | FOR THE FISCAL YEARS ENDED MARCH 31, | |
| | 2014 - A | | | 10.11 | | | | 0.33 | | | | (0.02 | ) | | | 0.31 | | | | (0.33 | ) | | | (0.02 | ) | | | — | | | | (0.35 | ) |
| | 2014 - C | | | 10.12 | | | | 0.26 | | | | (0.03 | ) | | | 0.23 | | | | (0.25 | ) | | | (0.02 | ) | | | — | | | | (0.27 | ) |
| | 2014 - Institutional | | | 10.13 | | | | 0.37 | | | | (0.03 | ) | | | 0.34 | | | | (0.36 | ) | | | (0.02 | ) | | | — | | | | (0.38 | ) |
| | 2014 - IR | | | 10.13 | | | | 0.36 | | | | (0.03 | ) | | | 0.33 | | | | (0.35 | ) | | | (0.02 | ) | | | — | | | | (0.37 | ) |
| | 2014 - R | | | 10.12 | | | | 0.31 | | | | (0.03 | ) | | | 0.28 | | | | (0.30 | ) | | | (0.02 | ) | | | — | | | | (0.32 | ) |
| | 2013 - A | | | 9.91 | | | | 0.37 | | | | 0.20 | | | | 0.57 | | | | (0.36 | ) | | | — | | | | (0.01 | ) | | | (0.37 | ) |
| | 2013 - C | | | 9.90 | | | | 0.29 | | | | 0.23 | | | | 0.52 | | | | (0.29 | ) | | | — | | | | (0.01 | ) | | | (0.30 | ) |
| | 2013 - Institutional | | | 9.91 | | | | 0.40 | | | | 0.23 | | | | 0.63 | | | | (0.40 | ) | | | — | | | | (0.01 | ) | | | (0.41 | ) |
| | 2013 - IR | | | 9.91 | | | | 0.40 | | | | 0.22 | | | | 0.62 | | | | (0.39 | ) | | | — | | | | (0.01 | ) | | | (0.40 | ) |
| | 2013 - R | | | 9.91 | | | | 0.35 | | | | 0.21 | | | | 0.56 | | | | (0.34 | ) | | | — | | | | (0.01 | ) | | | (0.35 | ) |
| | 2012 - A | | | 10.00 | | | | 0.33 | | | | (0.11 | ) | | | 0.22 | | | | (0.31 | ) | | | — | | | | — | | | | (0.31 | ) |
| | 2012 - C | | | 9.99 | | | | 0.26 | | | | (0.12 | ) | | | 0.14 | | | | (0.23 | ) | | | — | | | | — | | | | (0.23 | ) |
| | 2012 - Institutional | | | 9.99 | | | | 0.35 | | | | (0.09 | ) | | | 0.26 | | | | (0.34 | ) | | | — | | | | — | | | | (0.34 | ) |
| | 2012 - IR | | | 10.00 | | | | 0.34 | | | | (0.10 | ) | | | 0.24 | | | | (0.33 | ) | | | — | | | | — | | | | (0.33 | ) |
| | 2012 - R | | | 10.00 | | | | 0.28 | | | | (0.09 | ) | | | 0.19 | | | | (0.28 | ) | | | — | | | | — | | | | (0.28 | ) |
| | 2011 - A (Commenced March 31, 2011) | | | 10.00 | | | | — | (e) | | | — | (e) | | | — | (e) | | | — | | | | — | | | | — | | | | — | |
| | 2011 - C (Commenced March 31, 2011) | | | 10.00 | | | | — | (e) | | | (0.01 | ) | | | (0.01 | ) | | | — | | | | — | | | | — | | | | — | |
| | 2013 - Institutional (Commenced March 31, 2011) | | | 10.00 | | | | — | (e) | | | (0.01 | ) | | | (0.01 | ) | | | — | | | | — | | | | — | | | | — | |
| | 2011 - IR (Commenced March 31, 2011) | | | 10.00 | | | | — | (e) | | | — | (e) | | | — | (e) | | | — | | | | — | | | | — | | | | — | |
| | 2011 - R (Commenced March 31, 2011) | | | 10.00 | | | | — | (e) | | | — | (e) | | | — | (e) | | | — | | | | — | | | | — | | | | — | |
| | (a) | | Calculated based on the average shares outstanding methodology. |
| | (b) | | Assumes investment at the net asset value at the beginning of the period, reinvestment of all dividends and distributions, a complete redemption of the investment at the net asset value at the end of the period and no sales or redemption charges. Total returns would be reduced if a sales or redemption charge was taken into account. Returns do not reflect the deduction of taxes that a shareholder would pay on Fund distributions or the redemption of Fund shares. Total returns for periods less than one full year are not annualized. |
| | (c) | | The Fund’s portfolio turnover rate is calculated in accordance with regulatory requirements, without regard to transactions involving short term investments and certain derivatives. If such transactions were included, the Fund’s portfolio turnover rate may be higher. |
| | (e) | | Amount is less than $0.005 per share. |
| | |
| 138 | | The accompanying notes are an integral part of these financial statements. |
GOLDMAN SACHS HIGH YIELD FLOATING RATE FUND
| | | | | | | | | | | | | | | | | | | | | | | | | | | | | | | | | | | | | | | | |
| | | | | | | | | | | | | | | | | | | | | | | | | | | | | | | | | | |
| | | Net asset
value, end
of period | | | | | Total
return(b) | | | | | Net assets,
end of
period
(in 000s) | | | | | Ratio of
net expenses
to average
net assets | | | | | Ratio of
total expenses
to average
net assets | | | | | Ratio of
net investment
income (loss)
to average
net assets | | | | | Portfolio
turnover
rate(c) | |
| | | | | | | | | | | | | | | | | | | | | | | | | | | | | | | | | | | | | | | | |
| | $ | 9.92 | | | | | | 0.16 | % | | | | $ | 6,218 | | | | | | 0.94 | %(d) | | | | | 0.95 | %(d) | | | | | 3.29 | %(d) | | | | | 22 | % |
| | | 9.92 | | | | | | (0.32 | ) | | | | | 2,397 | | | | | | 1.69 | (d) | | | | | 1.70 | (d) | | | | | 2.53 | (d) | | | | | 22 | |
| | | 9.93 | | | | | | 0.23 | | | | | | 4,741,530 | | | | | | 0.60 | (d) | | | | | 0.61 | (d) | | | | | 3.62 | (d) | | | | | 22 | |
| | | 9.94 | | | | | | 0.29 | | | | | | 884 | | | | | | 0.70 | (d) | | | | | 0.71 | (d) | | | | | 3.58 | (d) | | | | | 22 | |
| | | 9.92 | | | | | | (0.06 | ) | | | | | 11 | | | | | | 1.16 | (d) | | | | | 1.17 | (d) | | | | | 3.04 | (d) | | | | | 22 | |
| | | | | | | | | | | | | | | | | | | | | | | | | | | | | | | | | | | | | | | | |
| | | | | | | | | | | | | | | | | | | | | | | | | | | | | | | | | | | | | | | | |
| | | 10.07 | | | | | | 3.09 | | | | | | 24,741 | | | | | | 0.96 | | | | | | 0.97 | | | | | | 3.28 | | | | | | 44 | |
| | | 10.08 | | | | | | 2.33 | | | | | | 2,465 | | | | | | 1.72 | | | | | | 1.73 | | | | | | 2.58 | | | | | | 44 | |
| | | 10.09 | | | | | | 3.45 | | | | | | 4,171,873 | | | | | | 0.63 | | | | | | 0.63 | | | | | | 3.65 | | | | | | 44 | |
| | | 10.09 | | | | | | 3.36 | | | | | | 1,631 | | | | | | 0.72 | | | | | | 0.73 | | | | | | 3.59 | | | | | | 44 | |
| | | 10.08 | | | | | | 2.83 | | | | | | 11 | | | | | | 1.21 | | | | | | 1.22 | | | | | | 3.08 | | | | | | 44 | |
| | | 10.11 | | | | | | 5.89 | | | | | | 8,367 | | | | | | 1.04 | | | | | | 1.04 | | | | | | 3.69 | | | | | | 72 | |
| | | 10.12 | | | | | | 5.31 | | | | | | 1,648 | | | | | | 1.79 | | | | | | 1.79 | | | | | | 2.93 | | | | | | 72 | |
| | | 10.13 | | | | | | 6.47 | | | | | | 1,710,411 | | | | | | 0.70 | | | | | | 0.70 | | | | | | 3.99 | | | | | | 72 | |
| | | 10.13 | | | | | | 6.36 | | | | | | 4,116 | | | | | | 0.80 | | | | | | 0.80 | | | | | | 4.00 | | | | | | 72 | |
| | | 10.12 | | | | | | 5.73 | | | | | | 11 | | | | | | 1.28 | | | | | | 1.29 | | | | | | 3.47 | | | | | | 72 | |
| | | 9.91 | | | | | | 2.24 | | | | | | 1,910 | | | | | | 1.08 | | | | | | 1.13 | | | | | | 3.41 | | | | | | 73 | |
| | | 9.90 | | | | | | 1.40 | | | | | | 517 | | | | | | 1.83 | | | | | | 1.88 | | | | | | 2.69 | | | | | | 73 | |
| | | 9.91 | | | | | | 2.58 | | | | | | 644,969 | | | | | | 0.74 | | | | | | 0.79 | | | | | | 3.63 | | | | | | 73 | |
| | | 9.91 | | | | | | 2.48 | | | | | | 116 | | | | | | 0.83 | | | | | | 0.88 | | | | | | 3.51 | | | | | | 73 | |
| | | 9.91 | | | | | | 1.99 | | | | | | 10 | | | | | | 1.33 | | | | | | 1.38 | | | | | | 2.86 | | | | | | 73 | |
| | | 10.00 | | | | | | — | | | | | | 10 | | | | | | 1.08 | (d) | | | | | 1.47 | (d) | | | | | (1.08 | )(d) | | | | | — | |
| | | 9.99 | | | | | | — | | | | | | 10 | | | | | | 1.83 | (d) | | | | | 2.22 | (d) | | | | | (1.83 | )(d) | | | | | — | |
| |
|
9.99 |
| | | | | — | | | | | | 118,817 | | | | | | 0.74 | (d) | | | | | 1.13 | (d) | | | | | (0.74 | )(d) | | | | | — | |
| | | 10.00 | | | | | | — | | | | | | 10 | | | | | | 0.83 | (d) | | | | | 1.22 | (d) | | | | | (0.83 | )(d) | | | | | — | |
| | | 10.00 | | | | | | — | | | | | | 10 | | | | | | 1.33 | (d) | | | | | 1.72 | (d) | | | | | (1.33 | )(d) | | | | | — | |
| | |
| The accompanying notes are an integral part of these financial statements. | | 139 |
GOLDMAN SACHS INVESTMENT GRADE CREDIT FUND
Financial Highlights
Selected Data for a Share Outstanding Throughout Each Period
| | | | | | | | | | | | | | | | | | | | | | | | | | | | | | |
| | | | | | | | Income (loss) from
investment operations | | | Distributions
to shareholders | |
| | | Year - Share Class | | Net asset
value,
beginning
of period | | | Net
investment
income(a) | | | Net realized
and unrealized
gain (loss) | | | Total from
investment
operations | | | From net
investment
income | | | From net
realized
gains | | | Total
distributions | |
| | FOR THE SIX MONTHS ENDED SEPTEMBER 30, (UNAUDITED) | |
| | 2014 - A | | $ | 9.39 | | | $ | 0.15 | | | $ | 0.09 | | | $ | 0.24 | | | $ | (0.15 | ) | | $ | — | | | $ | (0.15 | ) |
| | 2014 - Institutional | | | 9.39 | | | | 0.17 | | | | 0.10 | | | | 0.27 | | | | (0.17 | ) | | | — | | | | (0.17 | ) |
| | 2014 - Separate Account Institutional | | | 9.39 | | | | 0.17 | | | | 0.10 | | | | 0.27 | | | | (0.17 | ) | | | — | | | | (0.17 | ) |
| | 2014 - IR | | | 9.39 | | | | 0.16 | | | | 0.10 | | | | 0.26 | | | | (0.16 | ) | | | — | | | | (0.16 | ) |
| | | | | | | | | | | | | | | | | | | | | | | | | | | | | | |
| | FOR THE FISCAL YEARS ENDED MARCH 31, | |
| | 2014 - A | | | 9.71 | | | | 0.30 | | | | (0.18 | ) | | | 0.12 | | | | (0.30 | ) | | | (0.14 | ) | | | (0.44 | ) |
| | 2014 - Institutional | | | 9.71 | | | | 0.34 | | | | (0.18 | ) | | | 0.16 | | | | (0.34 | ) | | | (0.14 | ) | | | (0.48 | ) |
| | 2014 - Separate Account Institutional | | | 9.71 | | | | 0.33 | | | | (0.17 | ) | | | 0.16 | | | | (0.34 | ) | | | (0.14 | ) | | | (0.48 | ) |
| | 2014 - IR | | | 9.71 | | | | 0.32 | | | | (0.17 | ) | | | 0.15 | | | | (0.33 | ) | | | (0.14 | ) | | | (0.47 | ) |
| | 2013 - A | | | 9.53 | | | | 0.31 | | | | 0.51 | | | | 0.82 | | | | (0.31 | ) | | | (0.33 | ) | | | (0.64 | ) |
| | 2013 - Institutional | | | 9.53 | | | | 0.34 | | | | 0.52 | | | | 0.86 | | | | (0.35 | ) | | | (0.33 | ) | | | (0.68 | ) |
| | 2013 - Separate Account Institutional | | | 9.53 | | | | 0.34 | | | | 0.52 | | | | 0.86 | | | | (0.35 | ) | | | (0.33 | ) | | | (0.68 | ) |
| | 2013 - IR | | | 9.53 | | | | 0.34 | | | | 0.51 | | | | 0.85 | | | | (0.34 | ) | | | (0.33 | ) | | | (0.67 | ) |
| | 2012 - A | | | 9.50 | | | | 0.37 | | | | 0.50 | | | | 0.87 | | | | (0.37 | ) | | | (0.47 | ) | | | (0.84 | ) |
| | 2012 - Institutional | | | 9.51 | | | | 0.40 | | | | 0.50 | | | | 0.90 | | | | (0.41 | ) | | | (0.47 | ) | | | (0.88 | ) |
| | 2012 - Separate Account Institutional | | | 9.51 | | | | 0.40 | | | | 0.50 | | | | 0.90 | | | | (0.41 | ) | | | (0.47 | ) | | | (0.88 | ) |
| | 2012 - IR (Commenced July 29, 2011) | | | 9.86 | | | | 0.25 | | | | 0.15 | | | | 0.40 | | | | (0.26 | ) | | | (0.47 | ) | | | (0.73 | ) |
| | 2011 - A | | | 9.14 | | | | 0.38 | | | | 0.37 | | | | 0.75 | | | | (0.38 | ) | | | (0.01 | ) | | | (0.39 | ) |
| | 2011 - Institutional | | | 9.14 | | | | 0.41 | | | | 0.38 | | | | 0.79 | | | | (0.41 | ) | | | (0.01 | ) | | | (0.42 | ) |
| | 2011 - Separate Account Institutional | | | 9.14 | | | | 0.41 | | | | 0.38 | | | | 0.79 | | | | (0.41 | ) | | | (0.01 | ) | | | (0.42 | ) |
| | 2010 - A | | | 7.75 | | | | 0.43 | | | | 1.40 | | | | 1.83 | | | | (0.44 | ) | | | — | | | | (0.44 | ) |
| | 2010 - Institutional | | | 7.75 | | | | 0.46 | | | | 1.40 | | | | 1.86 | | | | (0.47 | ) | | | — | | | | (0.47 | ) |
| | 2010 - Separate Account Institutional | | | 7.75 | | | | 0.47 | | | | 1.39 | | | | 1.86 | | | | (0.47 | ) | | | — | | | | (0.47 | ) |
| | (a) | | Calculated based on the average shares outstanding methodology. |
| | (b) | | Assumes investment at the net asset value at the beginning of the period, reinvestment of all dividends and distributions, a complete redemption of the investment at the net asset value at the end of the period and no sales or redemption charges. Total returns would be reduced if a sales or redemption charge was taken into account. Returns do not reflect the deduction of taxes that a shareholder would pay on Fund distributions or the redemption of Fund shares. Total returns for periods less than one full year are not annualized. |
| | (c) | | The Fund’s portfolio turnover rate is calculated in accordance with regulatory requirements, without regard to transactions involving short term investments and certain derivatives. If such transactions were included, the Fund’s portfolio turnover rate may be higher. |
| | (e) | | Portfolio turnover rates exclude portfolio securities received as a result of in-kind subscriptions. |
| | |
| 140 | | The accompanying notes are an integral part of these financial statements. |
GOLDMAN SACHS INVESTMENT GRADE CREDIT FUND
| | | | | | | | | | | | | | | | | | | | | | | | | | | | | | | | | | | | | | | | |
| | | | | | | | | | | | | | | | | | | | | | | | | | | | | | | | | | |
| | | Net asset
value, end
of period | | | | | Total
return(b) | | | | | Net assets,
end of
period
(in 000s) | | | | | Ratio of
net expenses
to average
net assets | | | | | Ratio of
total expenses
to average
net assets | | | | | Ratio of
net investment
income
to average
net assets | | | | | Portfolio
turnover
rate(c) | |
| | | | | | | | | | | | | | | | | | | | | | | | | | | | | | | | | | | | | | | | |
| | $ | 9.48 | | | | | | 2.54 | % | | | | $ | 25,115 | | | | | | 0.72 | %(d) | | | | | 0.86 | %(d) | | | | | 3.12 | %(d) | | | | | 35 | % |
| | | 9.49 | | | | | | 2.83 | | | | | | 165,064 | | | | | | 0.39 | (d) | | | | | 0.52 | (d) | | | | | 3.46 | (d) | | | | | 35 | |
| | | 9.49 | | | | | | 2.83 | | | | | | 283,206 | | | | | | 0.38 | (d) | | | | | 0.52 | (d) | | | | | 3.46 | (d) | | | | | 35 | |
| | | 9.49 | | | | | | 2.78 | | | | | | 758 | | | | | | 0.47 | (d) | | | | | 0.61 | (d) | | | | | 3.35 | (d) | | | | | 35 | |
| | | | | | | | | | | | | | | | | | | | | | | | | | | | | | | | | | | | | | | | |
| | | | | | | | | | | | | | | | | | | | | | | | | | | | | | | | | | | | | | | | |
| | | 9.39 | | | | | | 1.41 | | | | | | 24,839 | | | | | | 0.72 | | | | | | 0.85 | | | | | | 3.22 | | | | | | 86 | |
| | | 9.39 | | | | | | 1.76 | | | | | | 165,755 | | | | | | 0.38 | | | | | | 0.51 | | | | | | 3.57 | | | | | | 86 | |
| | | 9.39 | | | | | | 1.76 | | | | | | 286,845 | | | | | | 0.38 | | | | | | 0.51 | | | | | | 3.56 | | | | | | 86 | |
| | | 9.39 | | | | | | 1.66 | | | | | | 552 | | | | | | 0.47 | | | | | | 0.60 | | | | | | 3.37 | | | | | | 86 | |
| | | 9.71 | | | | | | 8.73 | | | | | | 30,216 | | | | | | 0.71 | | | | | | 0.84 | | | | | | 3.17 | | | | | | 162 | |
| | | 9.71 | | | | | | 9.09 | | | | | | 274,095 | | | | | | 0.37 | | | | | | 0.50 | | | | | | 3.51 | | | | | | 162 | |
| | | 9.71 | | | | | | 9.09 | | | | | | 289,032 | | | | | | 0.37 | | | | | | 0.50 | | | | | | 3.51 | | | | | | 162 | |
| | | 9.71 | | | | | | 8.99 | | | | | | 723 | | | | | | 0.47 | | | | | | 0.59 | | | | | | 3.46 | | | | | | 162 | |
| | | 9.53 | | | | | | 9.34 | | | | | | 155,684 | | | | | | 0.71 | | | | | | 0.85 | | | | | | 3.78 | | | | | | 120 | |
| | | 9.53 | | | | | | 9.71 | | | | | | 163,886 | | | | | | 0.37 | | | | | | 0.51 | | | | | | 4.12 | | | | | | 120 | |
| | | 9.53 | | | | | | 9.71 | | | | | | 237,266 | | | | | | 0.37 | | | | | | 0.51 | | | | | | 4.13 | | | | | | 120 | |
| | | 9.53 | | | | | | 4.26 | | | | | | 1,300 | | | | | | 0.46 | (d) | | | | | 0.60 | (d) | | | | | 3.91 | (d) | | | | | 120 | |
| | | 9.50 | | | | | | 8.37 | | | | | | 147,820 | | | | | | 0.74 | | | | | | 0.87 | | | | | | 3.98 | | | | | | 100 | (e) |
| | | 9.51 | | | | | | 8.73 | | | | | | 143,057 | | | | | | 0.40 | | | | | | 0.53 | | | | | | 4.33 | | | | | | 100 | (e) |
| | | 9.51 | | | | | | 8.77 | | | | | | 262,907 | | | | | | 0.37 | | | | | | 0.50 | | | | | | 4.36 | | | | | | 100 | (e) |
| | | 9.14 | | | | | | 23.96 | | | | | | 167,774 | | | | | | 0.76 | | | | | | 0.89 | | | | | | 4.90 | | | | | | 90 | |
| | | 9.14 | | | | | | 24.39 | | | | | | 190,478 | | | | | | 0.41 | | | | | | 0.55 | | | | | | 5.17 | | | | | | 90 | |
| | | 9.14 | | | | | | 24.45 | | | | | | 272,812 | | | | | | 0.36 | | | | | | 0.50 | | | | | | 5.39 | | | | | | 90 | |
| | |
| The accompanying notes are an integral part of these financial statements. | | 141 |
GOLDMAN SACHS LOCAL EMERGING MARKETS DEBT FUND
Financial Highlights
Selected Data for a Share Outstanding Throughout Each Period
| | | | | | | | | | | | | | | | | | | | | | | | | | | | | | | | | | |
| | | | | | | | Income (loss) from
investment operations | | | Distributions
to shareholders | | | | |
| | | Year - Share Class | |
Net asset
value,
beginning
of period | | | Net
investment
income(a) | | | Net realized
and unrealized
gain (loss) | | | Total from
investment
operations | | | From net
investment
income | | | From net
realized
gains | | | From
capital | | | Total
distributions | |
| | FOR THE SIX MONTHS ENDED SEPTEMBER 30, (UNAUDITED) | |
| | 2014 - A | | $ | 8.43 | | | $ | 0.20 | | | $ | (0.36 | ) | | $ | (0.16 | ) | | $ | (0.23 | ) | | $ | — | | | $ | — | | | $ | (0.23 | ) |
| | 2014 - C | | | 8.44 | | | | 0.17 | | | | (0.36 | ) | | | (0.19 | ) | | | (0.20 | ) | | | — | | | | — | | | | (0.20 | ) |
| | 2014 - Institutional | | | 8.43 | | | | 0.22 | | | | (0.36 | ) | | | (0.14 | ) | | | (0.25 | ) | | | — | | | | — | | | | (0.25 | ) |
| | 2014 - IR | | | 8.43 | | | | 0.21 | | | | (0.36 | ) | | | (0.15 | ) | | | (0.24 | ) | | | — | | | | — | | | | (0.24 | ) |
| | | | | | | | | | | | | | | | | | | | | | | | | | | | | | | | | | |
| | FOR THE FISCAL YEARS ENDED MARCH 31, | |
| | 2014 - A | | | 9.71 | | | | 0.40 | | | | (1.27 | ) | | | (0.87 | ) | | | (0.03 | ) | | | (0.13 | ) | | | (0.25 | ) | | | (0.41 | ) |
| | 2014 - C | | | 9.72 | | | | 0.34 | | | | (1.28 | ) | | | (0.94 | ) | | | — | | | | (0.13 | ) | | | (0.21 | ) | | | (0.34 | ) |
| | 2014 - Institutional | | | 9.71 | | | | 0.43 | | | | (1.27 | ) | | | (0.84 | ) | | | (0.06 | ) | | | (0.13 | ) | | | (0.25 | ) | | | (0.44 | ) |
| | 2014 - IR | | | 9.71 | | | | 0.42 | | | | (1.27 | ) | | | (0.85 | ) | | | (0.05 | ) | | | (0.13 | ) | | | (0.25 | ) | | | (0.43 | ) |
| | 2013 - A | | | 9.38 | | | | 0.45 | | | | 0.38 | | | | 0.83 | | | | (0.46 | ) | | | (0.04 | ) | | | — | | | | (0.50 | ) |
| | 2013 - C | | | 9.40 | | | | 0.38 | | | | 0.37 | | | | 0.75 | | | | (0.39 | ) | | | (0.04 | ) | | | — | | | | (0.43 | ) |
| | 2013 - Institutional | | | 9.38 | | | | 0.48 | | | | 0.38 | | | | 0.86 | | | | (0.49 | ) | | | (0.04 | ) | | | — | | | | (0.53 | ) |
| | 2013 - IR | | | 9.38 | | | | 0.47 | | | | 0.38 | | | | 0.85 | | | | (0.48 | ) | | | (0.04 | ) | | | — | | | | (0.52 | ) |
| | 2012 - A | | | 9.59 | | | | 0.42 | | | | (0.16 | ) | | | 0.26 | | | | (0.44 | ) | | | (0.03 | ) | | | — | | | | (0.47 | ) |
| | 2012 - C | | | 9.61 | | | | 0.37 | | | | (0.18 | ) | | | 0.19 | | | | (0.37 | ) | | | (0.03 | ) | | | — | | | | (0.40 | ) |
| | 2012 - Institutional | | | 9.59 | | | | 0.48 | | | | (0.19 | ) | | | 0.29 | | | | (0.47 | ) | | | (0.03 | ) | | | — | | | | (0.50 | ) |
| | 2012 - IR | | | 9.59 | | | | 0.46 | | | | (0.18 | ) | | | 0.28 | | | | (0.46 | ) | | | (0.03 | ) | | | — | | | | (0.49 | ) |
| | 2011 - A | | | 9.31 | | | | 0.41 | | | | 0.60 | | | | 1.01 | | | | (0.64 | ) | | | (0.09 | ) | | | — | | | | (0.73 | ) |
| | 2011 - C | | | 9.33 | | | | 0.32 | | | | 0.61 | | | | 0.93 | | | | (0.56 | ) | | | (0.09 | ) | | | — | | | | (0.65 | ) |
| | 2011 - Institutional | | | 9.31 | | | | 0.44 | | | | 0.60 | | | | 1.04 | | | | (0.67 | ) | | | (0.09 | ) | | | — | | | | (0.76 | ) |
| | 2011 - IR (Commenced July 30, 2010) | | | 9.43 | | | | 0.28 | | | | 0.46 | | | | 0.74 | | | | (0.49 | ) | | | (0.09 | ) | | | — | | | | (0.58 | ) |
| | 2010 - A | | | 7.23 | | | | 0.42 | | | | 2.10 | | | | 2.52 | | | | (0.44 | ) | | | — | | | | — | | | | (0.44 | ) |
| | 2010 - C | | | 7.24 | | | | 0.36 | | | | 2.10 | | | | 2.46 | | | | (0.37 | ) | | | — | | | | — | | | | (0.37 | ) |
| | 2010 - Institutional | | | 7.23 | | | | 0.45 | | | | 2.10 | | | | 2.55 | | | | (0.47 | ) | | | — | | | | — | | | | (0.47 | ) |
| | (a) | | Calculated based on the average shares outstanding methodology. |
| | (b) | | Assumes investment at the net asset value at the beginning of the period, reinvestment of all dividends and distributions, a complete redemption of the investment at the net asset value at the end of the period and no sales or redemption charges. Total returns would be reduced if a sales or redemption charge was taken into account. Returns do not reflect the deduction of taxes that a shareholder would pay on Fund distributions or the redemption of Fund shares. Total returns for periods less than one full year are not annualized. |
| | (c) | | The Fund’s portfolio turnover rate is calculated in accordance with regulatory requirements, without regard to transactions involving short term investments and certain derivatives. If such transactions were included, the Fund’s portfolio turnover rate may be higher. |
| | |
| 142 | | The accompanying notes are an integral part of these financial statements. |
GOLDMAN SACHS LOCAL EMERGING MARKETS DEBT FUND
| | | | | | | | | | | | | | | | | | | | | | | | | | | | | | | | | | | | | | | | |
| | | | | | | | | | | | | | | | | | | | | | | | | | | | | | | | | | |
| | | Net asset
value, end
of period | | | | | Total
return(b) | | | | | Net assets,
end of
period
(in 000s) | | | | | Ratio of
net expenses
to average
net assets | | | | | Ratio of
total expenses
to average
net assets | | | | | Ratio of
net investment
income
to average
net assets | | | | | Portfolio
turnover
rate(c) | |
| | | | | | | | | | | | | | | | | | | | | | | | | | | | | | | | | | | | | | | | |
| | $ | 8.04 | | | | | | (1.99 | )% | | | | $ | 73,681 | | | | | | 1.26 | %(d) | | | | | 1.40 | %(d) | | | | | 4.74 | %(d) | | | | | 79 | % |
| | | 8.05 | | | | | | (2.23 | ) | | | | | 14,540 | | | | | | 2.01 | (d) | | | | | 2.15 | (d) | | | | | 3.98 | (d) | | | | | 79 | |
| | | 8.04 | | | | | | (1.82 | ) | | | | | 1,821,778 | | | | | | 0.92 | (d) | | | | | 1.06 | (d) | | | | | 5.06 | (d) | | | | | 79 | |
| | | 8.04 | | | | | | (1.87 | ) | | | | | 5,018 | | | | | | 1.01 | (d) | | | | | 1.16 | (d) | | | | | 5.01 | (d) | | | | | 79 | |
| | | | | | | | | | | | | | | | | | | | | | | | | | | | | | | | | | | | | | | | |
| | | | | | | | | | | | | | | | | | | | | | | | | | | | | | | | | | | | | | | | |
| | | 8.43 | | | | | | (9.01 | ) | | | | | 96,925 | | | | | | 1.25 | | | | | | 1.36 | | | | | | 4.55 | | | | | | 146 | |
| | | 8.44 | | | | | | (9.68 | ) | | | | | 17,641 | | | | | | 2.01 | | | | | | 2.12 | | | | | | 3.80 | | | | | | 146 | |
| | | 8.43 | | | | | | (8.70 | ) | | | | | 1,797,975 | | | | | | 0.92 | | | | | | 1.02 | | | | | | 4.88 | | | | | | 146 | |
| | | 8.43 | | | | | | (8.78 | ) | | | | | 7,518 | | | | | | 1.01 | | | | | | 1.11 | | | | | | 4.73 | | | | | | 146 | |
| | | 9.71 | | | | | | 9.07 | | | | | | 190,480 | | | | | | 1.26 | | | | | | 1.38 | | | | | | 4.78 | | | | | | 115 | |
| | | 9.72 | | | | | | 8.14 | | | | | | 32,071 | | | | | | 2.00 | | | | | | 2.13 | | | | | | 3.98 | | | | | | 115 | |
| | | 9.71 | | | | | | 9.46 | | | | | | 3,252,343 | | | | | | 0.91 | | | | | | 1.04 | | | | | | 5.05 | | | | | | 115 | |
| | | 9.71 | | | | | | 9.34 | | | | | | 20,878 | | | | | | 1.00 | | | | | | 1.12 | | | | | | 4.91 | | | | | | 115 | |
| | | 9.38 | | | | | | 2.71 | | | | | | 166,407 | | | | | | 1.27 | | | | | | 1.38 | | | | | | 4.31 | | | | | | 183 | |
| | | 9.40 | | | | | | 1.96 | | | | | | 20,704 | | | | | | 2.02 | | | | | | 2.13 | | | | | | 3.98 | | | | | | 183 | |
| | | 9.38 | | | | | | 3.06 | | | | | | 1,586,055 | | | | | | 0.93 | | | | | | 1.04 | | | | | | 5.18 | | | | | | 183 | |
| | | 9.38 | | | | | | 2.97 | | | | | | 7,393 | | | | | | 1.02 | | | | | | 1.13 | | | | | | 4.91 | | | | | | 183 | |
| | | 9.59 | | | | | | 11.30 | | | | | | 1,055,640 | | | | | | 1.35 | | | | | | 1.43 | | | | | | 4.30 | | | | | | 154 | |
| | | 9.61 | | | | | | 10.45 | | | | | | 16,724 | | | | | | 2.10 | | | | | | 2.18 | | | | | | 3.37 | | | | | | 154 | |
| | | 9.59 | | | | | | 11.68 | | | | | | 1,048,186 | | | | | | 1.01 | | | | | | 1.09 | | | | | | 4.63 | | | | | | 154 | |
| | | 9.59 | | | | | | 8.13 | | | | | | 8,247 | | | | | | 1.10 | (d) | | | | | 1.16 | (d) | | | | | 4.40 | (d) | | | | | 154 | |
| | | 9.31 | | | | | | 35.39 | | | | | | 419,456 | | | | | | 1.35 | | | | | | 1.49 | | | | | | 4.74 | | | | | | 134 | |
| | | 9.33 | | | | | | 34.47 | | | | | | 936 | | | | | | 2.10 | | | | | | 2.24 | | | | | | 4.09 | | | | | | 134 | |
| | | 9.31 | | | | | | 35.84 | | | | | | 377,691 | | | | | | 1.01 | | | | | | 1.15 | | | | | | 5.16 | | | | | | 134 | |
| | |
| The accompanying notes are an integral part of these financial statements. | | 143 |
GOLDMAN SACHS U.S. MORTGAGES FUND
Financial Highlights
Selected Data for a Share Outstanding Throughout Each Period
| | | | | | | | | | | | | | | | | | | | | | | | | | | | | | |
| | | | | | | | Income (loss) from
investment operations | | | Distributions
to shareholders | |
| | | Year - Share Class | |
Net asset
value,
beginning
of period | | | Net
investment
income(a) | | | Net realized
and unrealized
gain (loss) | | | Total from
investment
operations | | | From net
investment
income | | | From net
realized
gains | | | Total
distributions | |
| | FOR THE SIX MONTHS ENDED SEPTEMBER 30, (UNAUDITED) | |
| | 2014 - A | | $ | 10.45 | | | $ | 0.08 | | | $ | 0.17 | | | $ | 0.25 | | | $ | (0.12 | ) | | $ | — | | | $ | (0.12 | ) |
| | 2014 - Institutional | | | 10.47 | | | | 0.10 | | | | 0.18 | | | | 0.28 | | | | (0.14 | ) | | | — | | | | (0.14 | ) |
| | 2014 - Separate Account Institutional | | | 10.45 | | | | 0.10 | | | | 0.17 | | | | 0.27 | | | | (0.14 | ) | | | — | | | | (0.14 | ) |
| | 2014 - IR | | | 10.48 | | | | 0.09 | | | | 0.17 | | | | 0.26 | | | | (0.13 | ) | | | — | | | | (0.13 | ) |
| | | | | | | | | | | | | | | | | | | | | | | | | | | | | | |
| | FOR THE FISCAL YEARS ENDED MARCH 31, | |
| | 2014 - A | | | 10.60 | | | | 0.13 | | | | (0.06 | ) | | | 0.07 | | | | (0.22 | ) | | | — | | | | (0.22 | ) |
| | 2014 - Institutional | | | 10.62 | | | | 0.18 | | | | (0.08 | ) | | | 0.10 | | | | (0.25 | ) | | | — | | | | (0.25 | ) |
| | 2014 - Separate Account Institutional | | | 10.60 | | | | 0.16 | | | | (0.06 | ) | | | 0.10 | | | | (0.25 | ) | | | — | | | | (0.25 | ) |
| | 2014 - IR | | | 10.63 | | | | 0.20 | | | | (0.11 | ) | | | 0.09 | | | | (0.24 | ) | | | — | | | | (0.24 | ) |
| | 2013 - A | | | 10.58 | | | | 0.12 | | | | 0.31 | | | | 0.43 | | | | (0.22 | ) | | | (0.19 | ) | | | (0.41 | ) |
| | 2013 - Institutional | | | 10.60 | | | | 0.16 | | | | 0.30 | | | | 0.46 | | | | (0.25 | ) | | | (0.19 | ) | | | (0.44 | ) |
| | 2013 - Separate Account Institutional | | | 10.58 | | | | 0.16 | | | | 0.30 | | | | 0.46 | | | | (0.25 | ) | | | (0.19 | ) | | | (0.44 | ) |
| | 2013 - IR | | | 10.60 | | | | 0.17 | | | | 0.31 | | | | 0.48 | | | | (0.26 | ) | | | (0.19 | ) | | | (0.45 | ) |
| | 2012 - A | | | 10.20 | | | | 0.17 | | | | 0.42 | | | | 0.59 | | | | (0.21 | ) | | | — | | | | (0.21 | ) |
| | 2012 - Institutional | | | 10.21 | | | | 0.20 | | | | 0.44 | | | | 0.64 | | | | (0.25 | ) | | | — | | | | (0.25 | ) |
| | 2012 - Separate Account Institutional | | | 10.20 | | | | 0.21 | | | | 0.42 | | | | 0.63 | | | | (0.25 | ) | | | — | | | | (0.25 | ) |
| | 2012 - IR (Commenced July 29, 2011) | | | 10.45 | | | | 0.14 | | | | 0.19 | | | | 0.33 | | | | (0.18 | ) | | | — | | | | (0.18 | ) |
| | 2011 - A | | | 9.99 | | | | 0.22 | | | | 0.22 | | | | 0.44 | | | | (0.23 | ) | | | — | | | | (0.23 | ) |
| | 2011 - Institutional | | | 10.00 | | | | 0.25 | | | | 0.23 | | | | 0.48 | | | | (0.27 | ) | | | — | | | | (0.27 | ) |
| | 2011 - Separate Account Institutional | | | 9.99 | | | | 0.25 | | | | 0.23 | | | | 0.48 | | | | (0.27 | ) | | | — | | | | (0.27 | ) |
| | 2010 - A | | | 9.27 | | | | 0.32 | | | | 0.76 | | | | 1.08 | | | | (0.36 | ) | | | — | | | | (0.36 | ) |
| | 2010 - Institutional | | | 9.29 | | | | 0.38 | | | | 0.73 | | | | 1.11 | | | | (0.40 | ) | | | — | | | | (0.40 | ) |
| | 2010 - Separate Account Institutional | | | 9.28 | | | | 0.38 | | | | 0.73 | | | | 1.11 | | | | (0.40 | ) | | | — | | | | (0.40 | ) |
| | (a) | | Calculated based on the average shares outstanding methodology. |
| | (b) | | Assumes investment at the net asset value at the beginning of the period, reinvestment of all dividends and distributions, a complete redemption of the investment at the net asset value at the end of the period and no sales or redemption charges. Total returns would be reduced if a sales or redemption charge was taken into account. Returns do not reflect the deduction of taxes that a shareholder would pay on Fund distributions or the redemption of Fund shares. Total returns for periods less than one full year are not annualized. |
| | (c) | | The Fund’s portfolio turnover rate is calculated in accordance with regulatory requirements, without regard to transactions involving short term investments and certain derivatives. If such transactions were included, the Fund’s portfolio turnover rate may be higher. |
| | (e) | | Portfolio turnover rates exclude portfolio securities received as a result of in-kind subscriptions. |
| | |
| 144 | | The accompanying notes are an integral part of these financial statements. |
GOLDMAN SACHS U.S. MORTGAGES FUND
| | | | | | | | | | | | | | | | | | | | | | | | | | | | | | | | | | | | | | | | |
| | | | | | | | | | | | | | | | | | | | | | | | | | | | | | | | | | |
| | | Net asset
value, end
of period | | | | | Total
return(b) | | | | | Net assets,
end of
period
(in 000s) | | | | | Ratio of
net expenses
to average
net assets | | | | | Ratio of
total expenses
to average
net assets | | | | | Ratio of
net investment
income
to average
net assets | | | | | Portfolio
turnover
rate(c) | |
| | | | | | | | | | | | | | | | | | | | | | | | | | | | | | | | | | | | | | | | |
| | $ | 10.58 | | | | | | 2.37 | % | | | | $ | 5,726 | | | | | | 0.72 | %(d) | | | | | 0.97 | %(d) | | | | | 1.58 | %(d) | | | | | 574 | % |
| | | 10.61 | | | | | | 2.64 | | | | | | 42,817 | | | | | | 0.38 | (d) | | | | | 0.63 | (d) | | | | | 1.89 | (d) | | | | | 574 | |
| | | 10.58 | | | | | | 2.55 | | | | | | 200,559 | | | | | | 0.39 | (d) | | | | | 0.63 | (d) | | | | | 1.95 | (d) | | | | | 574 | |
| | | 10.61 | | | | | | 2.50 | | | | | | 1,546 | | | | | | 0.47 | (d) | | | | | 0.73 | (d) | | | | | 1.72 | (d) | | | | | 574 | |
| | | | | | | | | | | | | | | | | | | | | | | | | | | | | | | | | | | | | | | | |
| | | | | | | | | | | | | | | | | | | | | | | | | | | | | | | | | | | | | | | | |
| | | 10.45 | | | | | | 0.64 | | | | | | 3,850 | | | | | | 0.72 | | | | | | 0.96 | | | | | | 1.22 | | | | | | 1,399 | |
| | | 10.47 | | | | | | 0.99 | | | | | | 11,692 | | | | | | 0.38 | | | | | | 0.63 | | | | | | 1.71 | | | | | | 1,399 | |
| | | 10.45 | | | | | | 0.98 | | | | | | 211,306 | | | | | | 0.38 | | | | | | 0.62 | | | | | | 1.58 | | | | | | 1,399 | |
| | | 10.48 | | | | | | 0.88 | | | | | | 16 | | | | | | 0.49 | | | | | | 0.73 | | | | | | 1.91 | | | | | | 1,399 | |
| | | 10.60 | | | | | | 4.07 | | | | | | 4,488 | | | | | | 0.71 | | | | | | 0.91 | | | | | | 1.13 | | | | | | 1,617 | |
| | | 10.62 | | | | | | 4.42 | | | | | | 13,664 | | | | | | 0.37 | | | | | | 0.56 | | | | | | 1.47 | | | | | | 1,617 | |
| | | 10.60 | | | | | | 4.42 | | | | | | 295,322 | | | | | | 0.37 | | | | | | 0.56 | | | | | | 1.49 | | | | | | 1,617 | |
| | | 10.63 | | | | | | 4.61 | | | | | | 1 | | | | | | 0.30 | | | | | | 0.49 | | | | | | 1.57 | | | | | | 1,617 | |
| | | 10.58 | | | | | | 5.82 | | | | | | 5,437 | | | | | | 0.71 | | | | | | 0.91 | | | | | | 1.62 | | | | | | 1,342 | |
| | | 10.60 | | | | | | 6.28 | | | | | | 9,984 | | | | | | 0.37 | | | | | | 0.57 | | | | | | 1.89 | | | | | | 1,342 | |
| | | 10.58 | | | | | | 6.18 | | | | | | 375,451 | | | | | | 0.37 | | | | | | 0.57 | | | | | | 1.97 | | | | | | 1,342 | |
| | | 10.60 | | | | | | 3.20 | | | | | | 1 | | | | | | 0.46 | (d) | | | | | 0.66 | (d) | | | | | 2.06 | (d) | | | | | 1,342 | |
| | | 10.20 | | | | | | 4.46 | | | | | | 5,511 | | | | | | 0.74 | | | | | | 0.92 | | | | | | 2.14 | | | | | | 905 | (e) |
| | | 10.21 | | | | | | 4.81 | | | | | | 54,096 | | | | | | 0.40 | | | | | | 0.58 | | | | | | 2.41 | | | | | | 905 | (e) |
| | | 10.20 | | | | | | 4.84 | | | | | | 348,447 | | | | | | 0.37 | | | | | | 0.55 | | | | | | 2.42 | | | | | | 905 | (e) |
| | | 9.99 | | | | | | 11.84 | | | | | | 12,791 | | | | | | 0.76 | | | | | | 0.94 | | | | | | 3.29 | | | | | | 628 | |
| | | 10.00 | | | | | | 12.11 | | | | | | 62,950 | | | | | | 0.41 | | | | | | 0.60 | | | | | | 3.88 | | | | | | 628 | |
| | | 9.99 | | | | | | 12.17 | | | | | | 369,251 | | | | | | 0.36 | | | | | | 0.55 | | | | | | 3.91 | | | | | | 628 | |
| | |
| The accompanying notes are an integral part of these financial statements. | | 145 |
GOLDMAN SACHS SINGLE SECTOR FIXED INCOME FUNDS
Notes to Financial Statements
September 30, 2014 (Unaudited)
Goldman Sachs Trust (the “Trust”) is a Delaware statutory trust registered under the Investment Company Act of 1940, as amended (the “Act”), as an open-end management investment company. The following table lists those series of the Trust that are included in this report (collectively, the “Funds” or individually a “Fund”), along with their corresponding share classes and respective diversification status under the Act:
| | | | |
| Fund | | Share Classes Offered* | | Diversified/
Non-diversified |
Dynamic Emerging Markets Debt (Commenced operations May 31, 2013) | | A, C, Institutional, IR and R | | Non-diversified |
Emerging Markets Debt, Local Emerging Markets Debt | | A, C, Institutional and IR | | Non-diversified |
High Yield | | A, B, C, Institutional, Service, IR and R | | Diversified |
High Yield Floating Rate | | A, C, Institutional, IR and R | | Diversified |
Investment Grade Credit, U.S. Mortgages | | A, Institutional, IR and Separate Account Institutional | | Diversified |
| * | | The High Yield Fund’s Class B Shares are generally no longer available for purchase by current or prospective investors. |
Class A Shares of the Dynamic Emerging Markets Debt, Emerging Markets Debt, High Yield, High Yield Floating Rate, Investment Grade Credit, Local Emerging Markets Debt and U.S. Mortgages Funds are sold with a front-end sales charge of up to 4.50%, 4.50%, 4.50%, 2.25%, 3.75%, 4.50% and 3.75%, respectively. Class B Shares were sold with a contingent deferred sales charge (“CDSC”) that declines from 5.00% to zero, depending upon the period of time the shares are held. Class C Shares are sold with a CDSC of 1.00%, which is imposed on redemptions made within 12 months of purchase. Institutional, Service, Separate Account Institutional, Class IR and Class R Shares are not subject to a sales charge.
Goldman Sachs Asset Management, L.P. (“GSAM”), an affiliate of Goldman, Sachs & Co. (“Goldman Sachs”), serves as investment adviser to the Funds pursuant to a management agreement (the “Agreement”) with the Trust.
|
| 2. SIGNIFICANT ACCOUNTING POLICIES |
The financial statements have been prepared in accordance with accounting principles generally accepted in the United States of America (“GAAP”) and require management to make estimates and assumptions that may affect the reported amounts and disclosures. Actual results may differ from those estimates and assumptions.
A. Investment Valuation — The Funds’ valuation policy is to value investments at fair value.
B. Investment Income and Investments — Investment income includes interest income and dividend income, net of any foreign withholding taxes, less any amounts reclaimable. Interest income is accrued daily and adjusted for amortization of premiums and accretion of discounts. Dividend income is recognized on ex-dividend date or, for certain foreign securities, as soon as such information is obtained subsequent to the ex-dividend date. Investment transactions are reflected on trade date. Realized gains and losses are calculated using identified cost. Investment transactions are recorded on the following business day for daily net asset value (“NAV”) calculations. Any foreign capital gains tax is accrued daily based upon net unrealized gains, and is payable upon sale of such investments. Distributions received from the Funds’ investments in U.S. real estate investment trusts (“REITs”) may be characterized as ordinary income, net capital gain or a return of capital. A return of capital is recorded by the Funds as a reduction to the cost basis of the REIT.
For derivative contracts, realized gains and losses are recorded upon settlement of the contract. Upfront payments are made or received upon entering into a swap agreement and are reflected in the Statement of Assets and Liabilities. Upfront payments are recognized over the contract’s term/event as realized gains or losses, with the exception of forward starting interest rate swaps
146
GOLDMAN SACHS SINGLE SECTOR FIXED INCOME FUNDS
|
| 2. SIGNIFICANT ACCOUNTING POLICIES (continued) |
whose realized gains or losses are recognized from the effective start date. For securities with paydown provisions, principal payments received are treated as a proportionate reduction to the cost basis of the securities, and excess or shortfall amounts are recorded as income. For treasury inflation protected securities (“TIPS”), adjustments to principal due to inflation/deflation are reflected as increases/decreases to interest income with a corresponding adjustment to cost.
C. Class Allocations and Expenses — Investment income, realized and unrealized gain (loss), and non-class specific expenses of each Fund are allocated daily based upon the proportion of net assets of each class. Class specific expenses, where applicable, are borne by the respective share classes and include Distribution and Service, Transfer Agent and Service and Shareholder Administration fees. Non-class specific expenses directly incurred by a Fund are charged to that Fund, while such expenses incurred by the Trust are allocated across the respective Funds on a straight-line and/or pro-rata basis depending upon the nature of the expenses.
D. Offering and Organization Costs — Offering costs paid in connection with the offering of shares of Dynamic Emerging Markets Debt Fund were being amortized on a straight-line basis over 12 months from the date of commencement of operations.
E. Redemption Fees — A 2% redemption fee will be imposed on the redemption of shares (including by exchange) held for 60 calendar days or less with respect to the High Yield Fund and 30 calendar days or less with respect to the Dynamic Emerging Markets Debt, Emerging Markets Debt and Local Emerging Markets Debt Funds. For this purpose, the Funds use a first-in first-out method so that shares held longest will be treated as being redeemed first and shares held shortest will be treated as being redeemed last. Redemption fees are reimbursed to a Fund and are reflected as a reduction in share redemptions. Redemption fees are credited to Paid-in Capital and are allocated to each share class of a Fund on a pro-rata basis.
F. Federal Taxes and Distributions to Shareholders — It is each Fund’s policy to comply with the requirements of the Internal Revenue Code of 1986, as amended (the “Code”), applicable to regulated investment companies (mutual funds) and to distribute each year substantially all of its investment company taxable income and capital gains to its shareholders. Accordingly, the Funds are not required to make any provisions for the payment of federal income tax. Distributions to shareholders are recorded on the ex-dividend date. Income and capital gains distributions, if any, are declared daily and paid monthly, and capital gains distributions, if any, are declared and paid annually.
Net capital losses are carried forward to future fiscal years and may be used to the extent allowed by the Code to offset any future capital gains. Utilization of capital loss carryforwards will reduce the requirement of future capital gains distributions.
Under the Regulated Investment Company Modernization Act of 2010, the Funds are permitted to carry forward capital losses incurred in taxable years beginning after December 22, 2010 for an unlimited period. However, any losses incurred during those future taxable years will be required to be utilized prior to the losses incurred in pre-enactment taxable years. As a result of this ordering rule, pre-enactment capital loss carryforwards may be more likely to expire unused. Additionally, post-enactment capital losses that are carried forward will retain their character as either short-term or long-term capital losses rather than being considered all short-term as under previous law.
The characterization of distributions to shareholders for financial reporting purposes is determined in accordance with federal income tax rules, which may differ from GAAP. The source of each Fund’s distributions may be shown in the accompanying financial statements as either from net investment income, net realized gain or capital. Certain components of the Funds’ net assets on the Statements of Assets and Liabilities reflect permanent GAAP/tax differences based on the appropriate tax character.
G. Foreign Currency Translation — The accounting records and reporting currency of the Funds are maintained in U.S. dollars. Assets and liabilities denominated in foreign currencies are translated into U.S. dollars using the current exchange rates at the close of each business day. The effect of changes in foreign currency exchange rates on investments is included within net realized and unrealized gain (loss) on investments. Changes in the value of other assets and liabilities as a result of fluctuations in foreign exchange rates are included in the Statements of Operations within net change in unrealized gain (loss) on foreign currency transactions. Transactions denominated in foreign currencies are translated into U.S. dollars on the date the transaction occurred, the effects of which are included within net realized gain (loss) on foreign currency transactions.
147
GOLDMAN SACHS SINGLE SECTOR FIXED INCOME FUNDS
Notes to Financial Statements (continued)
September 30, 2014 (Unaudited)
|
| 3. INVESTMENTS AND FAIR VALUE MEASUREMENTS |
The fair value of a financial instrument is the amount that would be received to sell an asset or paid to transfer a liability in an orderly transaction between market participants at the measurement date (i.e., the exit price). GAAP establishes a fair value hierarchy that prioritizes the inputs to valuation techniques used to measure fair value. The hierarchy gives the highest priority to unadjusted quoted prices in active markets for identical assets or liabilities (Level 1 measurements) and the lowest priority to unobservable inputs (Level 3 measurements). The levels used for classifying investments are not necessarily an indication of the risk associated with investing in these investments. The three levels of the fair value hierarchy are described below:
Level 1 — Unadjusted quoted prices in active markets that are accessible at the measurement date for identical, unrestricted assets or liabilities;
Level 2 — Quoted prices in markets that are not active or financial instruments for which significant inputs are observable (including, but not limited to, quoted prices for similar investments, interest rates, foreign exchange rates, volatility and credit spreads), either directly or indirectly;
Level 3 — Prices or valuations that require significant unobservable inputs (including GSAM’s assumptions in determining fair value measurement).
The Trustees have adopted Valuation Procedures that govern the valuation of the portfolio investments held by the Funds, including investments for which market quotations are not readily available. The Trustees have delegated to GSAM day-to-day responsibility for implementing and maintaining internal controls and procedures related to the valuation of the Funds’ portfolio investments. To assess the continuing appropriateness of pricing sources and methodologies, GSAM regularly performs price verification procedures and issues challenges as necessary to third party pricing vendors or brokers, and any differences are reviewed in accordance with the Valuation Procedures.
A. Level 1 and Level 2 Fair Value Investments — The valuation techniques and significant inputs used in determining the fair values for investments classified as Level 1 and Level 2 are as follows:
Equity Securities — Equity securities and investment companies traded on a United States (“U.S.”) securities exchange or the NASDAQ system, or those located on certain foreign exchanges, including but not limited to the Americas, are valued daily at their last sale price or official closing price on the principal exchange or system on which they are traded. If no sale occurs, equity securities and exchange traded investment companies are valued at the last bid price for long positions and at the last ask price for short positions. Investments in investment companies (other than those that are exchange traded) are valued at the NAV on the valuation date. To the extent these investments are actively traded, they are classified as Level 1 of the fair value hierarchy, otherwise they are generally classified as Level 2.
Unlisted equity securities for which market quotations are available are valued at the last sale price on the valuation date, or if no sale occurs, at the last bid price. Securities traded on certain foreign securities exchanges are valued daily at fair value determined by an independent fair value service (if available) under Valuation Procedures approved by the Trustees and consistent with applicable regulatory guidance. The independent fair value service takes into account multiple factors including, but not limited to, movements in the securities markets, certain depositary receipts, futures contracts and foreign currency exchange rates that have occurred subsequent to the close of the foreign securities exchange. These investments are generally classified as Level 2 of the fair value hierarchy.
Debt Securities — Debt securities for which market quotations are readily available are valued daily on the basis of quotations supplied by dealers or an independent pricing service approved by the Trustees. The pricing services may use valuation models or matrix pricing, which consider: (i) yield or price with respect to bonds that are considered comparable in characteristics such as rating, interest rate and maturity date or (ii) quotations from securities dealers to determine current value. Short-term debt obligations that mature in sixty days or less and that do not exhibit signs of credit deterioration are valued at amortized cost, which approximates fair value. With the exception of treasury securities of G8 countries (not held in money market funds), which are generally classified as Level 1, these investments are generally classified as Level 2 of the fair value hierarchy.
i. Inverse Floaters — The interest rate on inverse floating rate securities (“inverse floaters”) resets in the opposite direction from the market rate of interest to which the inverse floaters are indexed. An inverse floater may be considered to be
148
GOLDMAN SACHS SINGLE SECTOR FIXED INCOME FUNDS
|
| 3. INVESTMENTS AND FAIR VALUE MEASUREMENTS (continued) |
leveraged to the extent that its interest rate varies by a magnitude that exceeds the magnitude of the change in the index rate of interest. The higher the degree of leverage of an inverse floater, the greater the volatility of its market value.
ii. Mortgage-Backed and Asset-Backed Securities — Mortgage-backed securities represent direct or indirect participations in, or are collateralized by and payable from, mortgage loans secured by residential and/or commercial real estate property. Asset-backed securities include securities whose principal and interest payments are collateralized by pools of other assets or receivables. The value of certain mortgage-backed and asset-backed securities (including adjustable rate mortgage loans) may be particularly sensitive to changes in prevailing interest rates. The value of these securities may also fluctuate in response to the market’s perception of the creditworthiness of the issuers.
Asset-backed securities may present credit risks that are not presented by mortgage-backed securities because they generally do not have the benefit of a security interest in collateral that is comparable to mortgage assets. Some asset-backed securities may only have a subordinated claim on collateral.
Stripped mortgage-backed securities are usually structured with two different classes: one that receives substantially all interest payments (interest-only, or “IO” and/or high coupon rate with relatively low principal amount, or “IOette”), and the other that receives substantially all principal payments (principal-only, or “PO”) from a pool of mortgage loans. Little to no principal will be received at the maturity of an IO; as a result, periodic adjustments are recorded to reduce the cost of the security until maturity. These adjustments are included in interest income.
iii. Mortgage Dollar Rolls — Mortgage dollar rolls are transactions whereby a Fund sells mortgage-backed-securities and simultaneously contracts with the same counterparty to repurchase similar securities on a specified future date. During the settlement period, a Fund will not be entitled to accrue interest and receive principal payments on the securities sold.
iv. Senior Term Loans — Senior term loans (“Loans”) are interests in amounts owed by corporate, governmental, or other borrowers to lenders or lending syndicates. Loans are arranged through private negotiations between the borrower and one or more financial institutions (“Lenders”). A Fund’s investments in Loans are in the form of either participations in Loans (“Participations”) or assignments of all or a portion of Loans from third parties (“Assignments”). With respect to Participations, a Fund has the right to receive payments of principal, interest and any fees to which it is entitled from the Lender selling the Participations and only upon receipt by the Lender of the payments from the borrower. A Fund generally has no right to enforce compliance by the borrower with the terms of the loan agreement with respect to Participations. Conversely, Assignments result in a Fund having a direct contractual relationship with the borrower, and the Fund may enforce compliance by the borrower with the terms of the loan agreement.
The High Yield and High Yield Floating Rate Funds may also enter into certain credit arrangements, all or a portion of which may be unfunded. Unfunded loan commitments represent the remaining obligation of a Fund to the borrower. A Fund is obligated to fund these commitments at the borrower’s discretion. A Fund may receive a commitment fee based on the undrawn portion of the underlying line of credit of a Loan. All Loans and unfunded loan commitments involve interest rate risk, liquidity risk and credit risk, including the potential default or insolvency of the borrower. Loans, including unfunded loan commitments, are marked to market daily using pricing vendor quotations and the change in value, if any, is recorded as an unrealized gain or loss.
v. Treasury Inflation Protected Securities — TIPS are treasury securities in which the principal amount is adjusted daily to keep pace with inflation, as measured by the U.S. Consumer Pricing Index for Urban Consumers. The repayment of the original bond principal upon maturity is guaranteed by the full faith and credit of the U.S. Government.
vi. Structured Notes — The values of structured notes are based on the price movements of a reference security or index. Upon termination, a Fund will receive a payment from the issuer based on the value of the referenced instrument (notional amount multiplied by price of the referenced instrument) and record a realized gain or loss.
vii. When-Issued Securities and Forward Commitments — When-issued securities, including TBA (“To Be Announced”) securities, are securities that are authorized but not yet issued in the market and purchased in order to secure what is considered to be an advantageous price or yield to a Fund. A forward commitment involves entering into a contract to
149
GOLDMAN SACHS SINGLE SECTOR FIXED INCOME FUNDS
Notes to Financial Statements (continued)
September 30, 2014 (Unaudited)
|
| 3. INVESTMENTS AND FAIR VALUE MEASUREMENTS (continued) |
purchase or sell securities, typically on an extended settlement basis, for a fixed price at a future date. The purchase of securities on a when-issued or forward commitment basis involves a risk of loss if the value of the security to be purchased declines before the settlement date. Conversely, the sale of securities on a forward commitment basis involves the risk that the value of the securities sold may increase before the settlement date. Although a Fund will generally purchase securities on a when-issued or forward commitment basis with the intention of acquiring the securities for its portfolio, the Fund may dispose of when-issued securities or forward commitments prior to settlement which may result in a realized gain or loss.
Derivative Contracts — A derivative is an instrument whose value is derived from underlying assets, indices, reference rates or a combination of these factors.
Exchange-traded derivatives, including futures contracts, typically fall within Level 1 of the fair value hierarchy. Over-the-counter (“OTC”) and centrally cleared derivatives are valued using market transactions and other market evidence, including market-based inputs to models, calibration to market-clearing transactions, broker or dealer quotations, or other alternative pricing sources. Where models are used, the selection of a particular model to value OTC and centrally cleared derivatives depends upon the contractual terms of, and specific risks inherent in, the instrument, as well as the availability of pricing information in the market. Valuation models require a variety of inputs, including contractual terms, market prices, yield curves, credit curves, measures of volatility, voluntary and involuntary prepayment rates, loss severity rates and correlations of such inputs. For OTC and centrally cleared derivatives that trade in liquid markets, model inputs can generally be verified and model selection does not involve significant management judgment. OTC and centrally cleared derivatives are classified within Level 2 of the fair value hierarchy when significant inputs are corroborated by market evidence.
i. Forward Contracts — A forward contract is a contract between two parties to buy or sell an asset at a specified price on a future date. A forward contract settlement can occur on a cash or delivery basis. Forward contracts are marked-to-market daily using counterparty prices, and the change in value, if any, is recorded as an unrealized gain or loss.
A forward foreign currency contract is a forward contract in which a Fund agrees to receive or deliver a fixed quantity of one currency for another, at a pre-determined price at a future date. All forward foreign currency exchange contracts are marked-to-market daily at the applicable forward rate. Non-deliverable forward foreign currency exchange contracts are settled with the counterparty in cash without the delivery of foreign currency.
A rate lock forward is a type of forward contract between a Fund and a rate lock provider pursuant to which the parties agree to make payments to each other based on a notional amount, contingent upon whether the referenced obligation is above or below a specified yield level on the termination date of the contract.
A non-deliverable bond forward is a short term forward contract between two parties to buy or sell a bond denominated in a non-deliverable foreign currency at a specified future time and price. Non-deliverable bond forwards are marked-to-market daily using market quotations. Unrealized gains or losses on non-deliverable bond forwards are recorded by a Fund on a daily basis, and realized gains or losses are recorded on the termination date or sale of a contract.
ii. Futures Contracts — Futures contracts are contracts to buy or sell a standardized quantity of a specified commodity or security and are valued based on exchanged settlement prices or independent market quotes. Futures contracts are valued at the last settlement price, or in the absence of a sale, the last bid price for long positions and at the last ask price for short positions, at the end of each day on the board of trade or exchange upon which they are traded. Upon entering into a futures contract, a Fund deposits cash or securities in an account on behalf of the broker in an amount sufficient to meet the initial margin requirement. Subsequent payments are made or received by a Fund equal to the daily change in the contract value and are recorded as variation margin receivable or payable with a corresponding offset to unrealized gains or losses.
iii. Options — When a Fund writes call or put options, an amount equal to the premium received is recorded as a liability and is subsequently marked-to-market to reflect the current value of the option written. Swaptions are options on interest rate swap contracts.
Upon the purchase of a call option or a put option by a Fund, the premium paid is recorded as an investment and subsequently marked-to-market to reflect the current value of the option. Certain options may be purchased with premiums to be determined on a future date. The premiums for these options are based upon implied volatility parameters at specified terms.
150
GOLDMAN SACHS SINGLE SECTOR FIXED INCOME FUNDS
|
| 3. INVESTMENTS AND FAIR VALUE MEASUREMENTS (continued) |
iv. Swap Contracts — Bilateral swap contracts are agreements in which a Fund and a counterparty agree to exchange periodic payments on a specified notional amount or make a net payment upon termination. Bilateral swap transactions are privately negotiated in the OTC market and payments are settled through direct payments between a Fund and the counterparty. By contrast, certain swap transactions are subject to mandatory central clearing. These swaps are executed through a derivatives clearing member (“DCM”), acting in an agency capacity, and submitted to a central counterparty (“CCP”)(“centrally cleared swaps”), in which case all payments are settled with the CCP through the DCM. Swaps are marked-to-market daily using pricing vendor quotations, counterparty or clearinghouse prices or model prices, and the change in value, if any, is recorded as an unrealized gain or loss. Upon entering into a swap contract, a Fund is required to satisfy an initial margin requirement by delivering cash or securities to the counterparty (or in some cases, segregated in a triparty account on behalf of the counterparty), which can be adjusted by any mark-to-market gains or losses pursuant to bilateral or centrally cleared arrangements. For centrally cleared swaps the daily change in valuation, if any, is recorded as a receivable or payable for variation margin.
An interest rate swap is an agreement that obligates two parties to exchange a series of cash flows at specified intervals, based upon or calculated by reference to changes in interest rates on a specified notional principal amount. The payment flows are usually netted against each other, with the difference being paid by one party to the other.
A credit default swap is an agreement that involves one party (the buyer of protection) making a stream of payments to another party (the seller of protection) in exchange for the right to receive protection on a reference security or obligation, including a group of assets or exposure to the performance of an index. A Fund’s investment in credit default swaps may involve greater risks than if the Fund had invested in the referenced obligation directly. Credit events are contract specific but may include bankruptcy, failure to pay, restructuring and obligation acceleration. If a Fund buys protection through a credit default swap and no credit event occurs, its payments are limited to the periodic payments previously made to the counterparty. Upon the occurrence of a specified credit event, a Fund, as a buyer of credit protection, is entitled to receive an amount equal to the notional amount of the swap and deliver to the seller the defaulted reference obligation in a physically settled trade. A Fund may also receive a net settlement amount in the form of cash or securities equal to the notional amount of the swap reduced by the recovery value of the reference obligation in cash settled trade.
As a seller of protection, a Fund generally receives a payment stream throughout the term of the swap, provided that there is no credit event. In addition, if a Fund sells protection through a credit default swap, a Fund could suffer a loss because the value of the referenced obligation and the premium payments received may be less than the notional amount of the swap paid to the buyer of protection. Upon the occurrence of a specified credit event, a Fund, as a seller of credit protection, may be required to take possession of the defaulted reference obligation and pay the buyer an amount equal to the notional amount of the swap in a physically settled trade. A Fund may also pay a net settlement amount in the form of cash or securities equal to the notional amount of the swap reduced by the recovery value of the reference obligation in cash settled trade. Recovery values are at times established through the credit event auction process in which market participants are ensured that a transparent price has been set for the defaulted security or obligation. In addition, a Fund is entitled to a return of any assets, which have been pledged as collateral to the counterparty.
The maximum potential amount of future payments (undiscounted) that a Fund as seller of protection could be required to make under a credit default swap would be an amount equal to the notional amount of the agreement. These potential amounts would be partially offset by any recovery values of the respective referenced obligations or net amounts received from a settlement of a credit default swap for the same reference security or obligation where a Fund bought credit protection.
A cross currency swap is an agreement which a Fund may enter into to gain or mitigate exposure to currency risk. A cross currency swap is an agreement to exchange cash flows on a notional amount of two or more currencies based on the relative value differential among them. Such swaps may involve initial and final exchanges that correspond to the agreed upon notional amount. Cross currency swaps usually involve the delivery of the entire principle value of one designated currency in exchange for other designated currency. Therefore, the entire principle value of a cross currency swap is subject to risk that the other party to the swap will default on its contractual delivery obligations. If there is a default by the counterparty, the Fund may have contractual remedies pursuant to the agreements related to the transaction.
151
GOLDMAN SACHS SINGLE SECTOR FIXED INCOME FUNDS
Notes to Financial Statements (continued)
September 30, 2014 (Unaudited)
|
| 3. INVESTMENTS AND FAIR VALUE MEASUREMENTS (continued) |
A total return swap is an agreement that gives a Fund the right to receive the appreciation in the value of a specified security, index or other instrument in return for a fee paid to the counterparty, which will typically be an agreed upon interest rate. If the underlying asset declines in value over the term of the swap, a Fund may also be required to pay the dollar value of that decline to the counterparty.
Short Term Investments — Short-term investments having a maturity of 60 days or less are generally valued at amortized cost which approximates fair market value. These investments are classified as Level 2 of the fair value hierarchy.
i. Repurchase Agreements — Repurchase agreements involve the purchase of securities subject to the seller’s agreement to repurchase the securities at a mutually agreed upon date and price, under the terms of a Master Repurchase Agreement (“MRA”). During the term of a repurchase agreement, the value of the underlying securities held as collateral on behalf of a Fund, including accrued interest, is required to exceed the value of the repurchase agreement, including accrued interest. The gross value of repurchase agreements is included in the Statements of Assets and Liabilities for financial reporting purposes. The underlying securities for all repurchase agreements are held at the Funds’ custodian or designated sub-custodians under tri-party repurchase agreements.
An MRA governs transactions between a Fund and select counterparties. An MRA contains provisions for, among other things, initiation, income payments, events of default and maintenance of securities for repurchase agreements. A MRA also permits offsetting with collateral to create one single net payment in the event of default or similar events, including the bankruptcy or insolvency of a counterparty.
If the seller defaults, a Fund could suffer a loss to the extent that the proceeds from the sale of the underlying securities and other collateral held by the Fund are less than the repurchase price and the Fund’s costs associated with delay and enforcement of the repurchase agreement. In addition, in the event of default or insolvency of the seller, a court could determine that a Fund’s interest in the collateral is not enforceable, resulting in additional losses to the Fund.
Pursuant to exemptive relief granted by the Securities and Exchange Commission (“SEC”) and terms and conditions contained therein, the Funds, together with other funds of the Trust and registered investment companies having management agreements with GSAM or its affiliates, may transfer uninvested cash into joint accounts, the daily aggregate balance of which is invested in one or more repurchase agreements. Under these joint accounts, the Funds maintain pro-rata credit exposure to the underlying repurchase agreements’ counterparties. With the exception of certain transaction fees, the Funds are not subject to any expenses in relation to these investments.
B. Level 3 Fair Value Investments — To the extent that the aforementioned significant inputs are unobservable, or if quotations are not readily available, or if GSAM believes that such quotations do not accurately reflect fair value, the fair value of the Funds’ investments may be determined under Valuation Procedures approved by the Trustees. GSAM, consistent with its procedures and applicable regulatory guidance, may make an adjustment to the most recent valuation prices of either domestic or foreign securities in light of significant events to reflect what it believes to be the fair value of the securities at the time of determining a Fund’s NAV. Significant events which could affect a large number of securities in a particular market may include, but are not limited to: significant fluctuations in U.S. or foreign markets; market dislocations; market disruptions; or unscheduled market closings. Significant events which could also affect a single issuer may include, but are not limited to: corporate actions such as reorganizations, mergers and buy-outs; ratings downgrades; and bankruptcies.
To the extent investments are valued using single source broker quotations obtained directly from the broker or passed through from third party pricing vendors, such as investments are classified as Level 3 investments.
152
GOLDMAN SACHS SINGLE SECTOR FIXED INCOME FUNDS
|
| 3. INVESTMENTS AND FAIR VALUE MEASUREMENTS (continued) |
C. Fair Value Hierarchy — The following is a summary of the Funds’ investments and derivatives classified in the fair value hierarchy as of September 30, 2014:
| | | | | | | | | | | | |
| | | |
| DYNAMIC EMERGING MARKETS DEBT | | | | | | | | | | | | |
| | | |
| Investment Type | | Level 1 | | | Level 2 | | | Level 3 | |
| Assets | | | | | | | | | | | | |
Fixed Income | | | | | | | | | | | | |
Sovereign Debt Obligations | | $ | — | | | $ | 16,208,264 | | | $ | — | |
Corporate Obligations | | | — | | | | 8,137,692 | | | | — | |
Structured Notes | | | — | | | | 978,751 | | | | — | |
Municipal Debt Obligations | | | — | | | | 699,456 | | | | — | |
U.S. Treasury Obligations | | | 221,042 | | | | — | | | | — | |
Short-term Investments | | | — | | | | 1,800,000 | | | | — | |
| Total | | $ | 221,042 | | | $ | 27,824,163 | | | $ | — | |
| | | |
| Derivative Type | | | | | | | | | |
| Assets(a) | | | | | | | | | | | | |
Forward Foreign Currency Exchange Contracts | | $ | — | | | $ | 324,011 | | | $ | — | |
Futures Contracts | | | 35,247 | | | | — | | | | — | |
Interest Rate Swap Contracts | | | — | | | | 20,062 | | | | — | |
| Total | | $ | 35,247 | | | $ | 344,073 | | | $ | — | |
| Liabilities(a) | | | | | | | | | | | | |
Forward Foreign Currency Exchange Contracts | | $ | — | | | $ | (317,584 | ) | | $ | — | |
Interest Rate Swap Contracts | | | — | | | | (149,752 | ) | | | — | |
Credit Default Swap Contracts | | | — | | | | (6,253 | ) | | | — | |
| Total | | $ | — | | | $ | (473,589 | ) | | $ | — | |
| | | |
| EMERGING MARKETS DEBT | | | | | | | | | | | | |
| | | |
| Investment Type | | Level 1 | | | Level 2 | | | Level 3 | |
| Assets | | | | | | | | | | | | |
Fixed Income | | | | | | | | | | | | |
Sovereign Debt Obligations | | $ | — | | | $ | 970,674,406 | | | $ | — | |
Foreign Debt Obligations | | | — | | | | 17,851,426 | | | | — | |
Corporate Obligations | | | — | | | | 552,247,360 | | | | — | |
U.S. Government Agencies | | | — | | | | 74,998,027 | | | | — | |
Structured Note | | | — | | | | 9,501,020 | | | | — | |
Municipal Debt Obligations | | | — | | | | 43,157,595 | | | | — | |
Short-term Investments | | | — | | | | 65,100,000 | | | | — | |
| Total | | $ | — | | | $ | 1,733,529,834 | | | $ | — | |
153
GOLDMAN SACHS SINGLE SECTOR FIXED INCOME FUNDS
Notes to Financial Statements (continued)
September 30, 2014 (Unaudited)
|
| 3. INVESTMENTS AND FAIR VALUE MEASUREMENTS (continued) |
| | | | | | | | | | | | |
| | | |
| EMERGING MARKETS DEBT (continued) | | | | | | | | | | | | |
| | | |
| Derivative Type | | Level 1 | | | Level 2 | | | Level 3 | |
| Assets(a) | | | | | | | | | | | | |
Forward Foreign Currency Exchange Contracts | | $ | — | | | $ | 17,829,165 | | | $ | — | |
Futures Contracts | | | 1,184,734 | | | | — | | | | — | |
Interest Rate Swap Contracts | | | — | | | | 938,137 | | | | — | |
Credit Default Swap Contracts | | | — | | | | 77,326 | | | | — | |
| Total | | $ | 1,184,734 | | | $ | 18,844,628 | | | $ | — | |
| Liabilities(a) | | | | | | | | | | | | |
Forward Foreign Currency Exchange Contracts | | $ | — | | | $ | (9,249,191 | ) | | $ | — | |
Futures Contracts | | | (879,548 | ) | | | — | | | | — | |
Interest Rate Swap Contracts | | | — | | | | (5,571,959 | ) | | | — | |
Credit Default Swap Contracts | | | — | | | | (703,028 | ) | | | — | |
| Total | | $ | (879,548 | ) | | $ | (15,524,178 | ) | | $ | — | |
| | | |
| HIGH YIELD | | | | | | | | | | | | |
| | | |
| Investment Type | | Level 1 | | | Level 2 | | | Level 3 | |
| Assets | | | | | | | | | | | | |
Fixed Income | | | | | | | | | | | | |
Corporate Obligations | | $ | — | | | $ | 4,210,945,140 | | | $ | — | |
U.S. Government Agencies | | | — | | | | 149,996,054 | | | | — | |
Senior Term Loans | | | — | | | | 191,019,399 | | | | 59,730,884 | |
Common Stock and/or Other Equity Investments(b) | | | | | | | | | | | | |
Europe | | | 1,305,434 | | | | — | | | | 3 | |
North America | | | 22,239,093 | | | | 3,405,820 | | | | 39 | |
Warrants | | | — | | | | 4,262,527 | | | | — | |
Short-term Investments | | | — | | | | 66,000,000 | | | | — | |
| Total | | $ | 23,544,527 | | | $ | 4,625,628,940 | | | $ | 59,730,926 | |
| | | |
| Derivative Type | | | | | | | | | |
| Assets(a) | | | | | | | | | | | | |
Forward Foreign Currency Exchange Contracts | | $ | — | | | $ | 3,301,087 | | | $ | — | |
Futures Contracts | | | 2,496,032 | | | | — | | | | — | |
Interest Rate Swap Contracts | | | — | | | | 233,290 | | | | — | |
Credit Default Swap Contracts | | | — | | | | 430,554 | | | | — | |
| Total | | $ | 2,496,032 | | | $ | 3,964,931 | | | $ | — | |
| Liabilities(a) | | | | | | | | | | | | |
Futures Contracts | | $ | (958,537 | ) | | $ | — | | | $ | — | |
154
GOLDMAN SACHS SINGLE SECTOR FIXED INCOME FUNDS
|
| 3. INVESTMENTS AND FAIR VALUE MEASUREMENTS (continued) |
The following is a reconciliation of Level 3 investments for the period ended September 30, 2014:
| | | | | | | | | | |
| | | |
| | | | | Common Stocks | | | Senior Term Loans | |
Beginning Balance as of April 1, 2014 | | | | $ | 39 | | | $ | 19,282,500 | |
Realized gain (loss) | | | | | 48,124 | | | | — | |
Net change in unrealized gain (loss) relating to instruments still held at reporting date | | | | | 3 | | | | 25,084 | |
Purchases | | | | | — | | | | 53,127,280 | |
Sales | | | | | (48,124 | ) | | | (5,100,000 | ) |
Amortization | | | | | — | | | | 60,645 | |
Transfers into Level 3 | | | | | — | | | | — | |
Transfers out of Level 3 | | | | | — | | | | (7,664,625 | ) |
| Ending Balance as of September 30, 2014 | | | | $ | 42 | | | $ | 59,730,884 | |
| | | | | | | | | | | | |
| | | |
| HIGH YIELD FLOATING RATE | | | | | | | | | | | | |
| | | |
| Investment Type | | Level 1 | | | Level 2 | | | Level 3 | |
| Assets | | | | | | | | | | | | |
Fixed Income | | | | | | | | | | | | |
Senior Term Loans | | $ | — | | | $ | 3,732,375,310 | | | $ | 176,408,160 | |
Corporate Obligations | | | — | | | | 506,984,940 | | | | — | |
U.S. Government Agencies | | | — | | | | 149,997,300 | | | | — | |
Asset-Backed Securities | | | — | | | | 84,698,709 | | | | — | |
Unfunded Loan Commitments | | | — | | | | 18,387,939 | | | | — | |
Investment Company | | | 40,535,700 | | | | — | | | | — | |
Short-term Investments | | | — | | | | 259,800,000 | | | | — | |
| Total | | $ | 40,535,700 | | | $ | 4,752,244,198 | | | $ | 176,408,160 | |
| | | |
| Derivative Type | | | | | | | | | |
| Assets(a) | | | | | | | | | | | | |
Forward Foreign Currency Exchange Contracts | | $ | — | | | $ | 933,517 | | | $ | — | |
Interest Rate Swap Contracts | | | — | | | | 916,415 | | | | — | |
| Total | | $ | — | | | $ | 1,849,932 | | | $ | — | |
| Liabilities(a) | | | | | | | | | | | | |
Forward Foreign Currency Exchange Contracts | | $ | — | | | $ | (98,736 | ) | | $ | — | |
Credit Default Swap Contracts | | | — | | | | (333,978 | ) | | | — | |
| Total | | $ | — | | | $ | (432,714 | ) | | $ | — | |
155
GOLDMAN SACHS SINGLE SECTOR FIXED INCOME FUNDS
Notes to Financial Statements (continued)
September 30, 2014 (Unaudited)
|
| 3. INVESTMENTS AND FAIR VALUE MEASUREMENTS (continued) |
| | | | | | | | | | | | |
| | | |
| HIGH YIELD FLOATING RATE (continued) | | | | | | | | | | | | |
|
The following is a reconciliation of Level 3 investments for the period ended September 30, 2014: | |
| | | |
| | | | | | | | | Senior Term Loans | |
Beginning Balance as of April 1, 2014 | | | | | | | | | | $ | 32,856,154 | |
Realized gain (loss) | | | | | | | | | | | (10,398 | ) |
Net change in unrealized gain (loss) relating to instruments still held at reporting date | | | | | | | | | | | (2,147,344 | ) |
Purchases | | | | | | | | | | | 105,155,191 | |
Sales | | | | | | | | | | | (9,411,014 | ) |
Amortization | | | | | | | | | | | 28,365 | |
Transfers into Level 3 | | | | | | | | | | | 51,101,581 | |
Transfers out of Level 3 | | | | | | | | | | | (1,164,375 | ) |
| Ending Balance as of September 30, 2014 | | | | | | | | | | $ | 176,408,160 | |
| | | |
| INVESTMENT GRADE CREDIT | | | | | | | | | | | | |
| | | |
| Investment Type | | Level 1 | | | Level 2 | | | Level 3 | |
| Assets | | | | | | | | | | | | |
Fixed Income | | | | | | | | | | | | |
Corporate Obligations | | $ | — | | | $ | 365,723,818 | | | $ | — | |
Mortgage-Backed Obligations | | | — | | | | 9,920,299 | | | | — | |
U.S. Treasury Obligations and/or Other U.S. Government Agencies | | | 31,872,534 | | | | 1,162,904 | | | | — | |
Foreign Debt Obligations | | | — | | | | 14,591,070 | | | | — | |
Municipal Debt Obligations | | | — | | | | 15,856,502 | | | | — | |
Short-term Investments | | | — | | | | 25,300,000 | | | | — | |
| Total | | $ | 31,872,534 | | | $ | 432,554,593 | | | $ | — | |
| | | |
| Derivative Type | | Level 1 | | | Level 2 | | | Level 3 | |
| Assets | | | | | | | | | | | | |
Options Purchased | | $ | — | | | $ | 2,579,498 | | | $ | — | |
Forward Foreign Currency Exchange Contracts(a) | | | — | | | | 14,608 | | | | — | |
Futures Contracts(a) | | | 329,961 | | | | — | | | | — | |
Interest Rate Swap Contracts(a) | | | — | | | | 1,275,922 | | | | — | |
| Total | | $ | 329,961 | | | $ | 3,870,028 | | | $ | — | |
| Liabilities(a) | | | | | | | | | | | | |
Futures Contracts | | $ | (307,960 | ) | | $ | — | | | $ | — | |
Interest Rate Swap Contracts | | | — | | | | (221,653 | ) | | | — | |
| Total | | $ | (307,960 | ) | | $ | (221,653 | ) | | $ | — | |
156
GOLDMAN SACHS SINGLE SECTOR FIXED INCOME FUNDS
|
| 3. INVESTMENTS AND FAIR VALUE MEASUREMENTS (continued) |
| | | | | | | | | | | | |
| | | |
| LOCAL EMERGING MARKETS DEBT | | | | | | | | | | | | |
| | | |
| Investment Type | | Level 1 | | | Level 2 | | | Level 3 | |
| Assets | | | | | | | | | | | | |
Fixed Income | | | | | | | | | | | | |
Sovereign Debt Obligations | | $ | — | | | $ | 1,297,032,933 | | | $ | — | |
Structured Notes | | | — | | | | 206,617,039 | | | | — | |
Corporate Obligations | | | — | | | | 65,038,036 | | | | — | |
U.S. Treasury Obligations and/or Other U.S. Government Agencies | | | 7,808,044 | | | | 89,997,631 | | | | — | |
Municipal Debt Obligations | | | — | | | | 25,385,335 | | | | — | |
Short-term Investments | | | — | | | | 135,300,000 | | | | — | |
| Total | | $ | 7,808,044 | | | $ | 1,819,370,974 | | | $ | — | |
| | | |
| Derivative Type | | Level 1 | | | Level 2 | | | Level 3 | |
| Assets(a) | | | | | | | | | | | | |
Forward Foreign Currency Exchange Contracts | | $ | — | | | $ | 33,703,168 | | | $ | — | |
Futures Contracts | | | 3,273,444 | | | | — | | | | — | |
Interest Rate Swap Contracts | | | — | | | | 11,718,024 | | | | — | |
Cross Currency Swap Contracts | | | — | | | | 3,105,612 | | | | — | |
| Total | | $ | 3,273,444 | | | $ | 48,526,804 | | | $ | — | |
| Liabilities(a) | | | | | | | | | | | | |
Forward Foreign Currency Exchange Contracts | | $ | — | | | $ | (31,089,048 | ) | | $ | — | |
Futures Contracts | | | (1,244,866 | ) | | | — | | | | — | |
Interest Rate Swap Contracts | | | — | | | | (22,791,830 | ) | | | — | |
Credit Default Swap Contracts | | | — | | | | (409,073 | ) | | | — | |
Cross Currency Swap Contracts | | | — | | | | (1,618,410 | ) | | | — | |
| Total | | $ | (1,244,866 | ) | | $ | (55,908,361 | ) | | $ | — | |
| | | |
| U.S. MORTGAGES | | | | | | | | | | | | |
| | | |
| Investment Type | | Level 1 | | | Level 2 | | | Level 3 | |
| Assets | | | | | | | | | | | | |
Fixed Income | | | | | | | | | | | | |
Mortgage-Backed Obligations | | $ | — | | | $ | 251,303,944 | | | $ | — | |
U.S. Treasury Obligations and/or Other U.S. Government Agencies | | | 540,375 | | | | 49,998,680 | | | | — | |
Asset-Backed Securities | | | — | | | | 2,349,101 | | | | — | |
Short-term Investments | | | — | | | | 46,600,000 | | | | — | |
| Total | | $ | 540,375 | | | $ | 350,251,725 | | | $ | — | |
157
GOLDMAN SACHS SINGLE SECTOR FIXED INCOME FUNDS
Notes to Financial Statements (continued)
September 30, 2014 (Unaudited)
|
| 3. INVESTMENTS AND FAIR VALUE MEASUREMENTS (continued) |
| | | | | | | | | | | | |
| | | |
| U.S. MORTGAGES (continued) | | | | | | | | | | | | |
| | | |
| Derivative Type | | Level 1 | | | Level 2 | | | Level 3 | |
| Assets | | | | | | | | | | | | |
Options Purchased | | $ | — | | | $ | 1,543,773 | | | $ | — | |
Futures Contracts(a) | | | 181,681 | | | | — | | | | — | |
Interest Rate Swap Contracts(a) | | | — | | | | 181,674 | | | | — | |
| Total | | $ | 181,681 | | | $ | 1,725,447 | | | $ | — | |
| Liabilities(a) | | | | | | | | | | | | |
Futures Contracts | | $ | (251,059 | ) | | $ | — | | | $ | — | |
Interest Rate Swap Contracts | | | — | | | | (74,571 | ) | | | — | |
Total Return Swap Contracts | | | — | | | | (1,364 | ) | | | — | |
| Total | | $ | (251,059 | ) | | $ | (75,935 | ) | | $ | — | |
| (a) | | Amount shown represents unrealized gain (loss) at period end. |
| (b) | | Amounts are disclosed by continent to highlight the impact of time zone differences between local market close and the calculation of net asset value. Security valuations are based on the principle exchange or system on which they are traded, which may differ from country of domicile. |
For further information regarding security characteristics, see the Schedules of Investments.
|
| 4. INVESTMENTS IN DERIVATIVES |
The following tables set forth, by certain risk types, the gross value of derivative contracts as of September 30, 2014. These instruments were used to meet the Funds’ investment objectives and to obtain and/or manage exposure related to the risks below. The values in the tables below exclude the effects of cash collateral received or posted pursuant to these derivative contracts, and therefore are not representative of the Funds’ net exposure.
| | | | | | | | | | | | |
| | |
| Dynamic Emerging Markets Debt | | | | | | | |
| Risk | | Statement of Assets
and Liabilities | | Assets | | | Statement of Assets
and Liabilities | | Liabilities | |
Interest rate | | Receivable for unrealized gain on swap contracts; Variation margin on certain derivative contracts | | $ | 55,309 | (a) | | Payable for unrealized loss on swap contracts; Variation margin on certain derivative contracts | | $ | (149,752) | (a)(b) |
Credit | | — | | | — | | | Payable for unrealized loss on swap contracts | | | (6,253) | (b) |
Currency | | Receivable for unrealized gain on forward foreign currency exchange contracts | | | 324,011 | | | Payable for unrealized loss on forward foreign currency exchange contracts | | | (317,584) | |
| Total | | | | $ | 379,320 | | | | | $ | (473,589) | |
158
GOLDMAN SACHS SINGLE SECTOR FIXED INCOME FUNDS
|
| 4. INVESTMENTS IN DERIVATIVES (continued) |
| | | | | | | | | | | | |
| | |
| Emerging Markets Debt | | | | | | | |
| Risk | | Statement of Assets
and Liabilities | | Assets | | | Statement of Assets
and Liabilities | | Liabilities | |
Interest rate | | Receivable for unrealized gain on swap contracts; Variation margin on certain derivative contracts | | $ | 2,122,871 | (a) | | Payable for unrealized loss on swap contracts; Variation margin on certain derivative contracts | | $ | (6,451,507) | (a)(b) |
Credit | | Receivable for unrealized gain on swap contracts | | | 77,326 | | | Payable for unrealized loss on swap contracts | | | (703,028) | (b) |
Currency | | Receivable for unrealized gain on forward foreign currency exchange contracts | | | 17,829,165 | | | Payable for unrealized loss on forward foreign currency exchange contracts | | | (9,249,191) | |
| Total | | | | $ | 20,029,362 | | | | | $ | (16,403,726) | |
| | |
| High Yield | | | | | | | |
| Risk | | Statement of Assets
and Liabilities | | Assets | | | Statement of Assets
and Liabilities | | Liabilities | |
Interest rate | | Variation margin on certain derivative contracts | | $ | 2,729,322 | (a) | | Variation margin on certain derivative contracts | | $ | (958,537) | (a) |
Credit | | Receivable for unrealized gain on swap contracts | | | 430,554 | | | — | | | — | |
Currency | | Receivable for unrealized gain on forward foreign currency exchange contracts | | | 3,301,087 | | | — | | | — | |
| Total | | | | $ | 6,460,963 | | | | | $ | (958,537) | |
| | |
| High Yield Floating Rate | | | | | | | |
| Risk | | Statement of Assets
and Liabilities | | Assets | | | Statement of Assets
and Liabilities | | Liabilities | |
Interest rate | | Variation margin on certain derivative contracts | | $ | 916,415 | (a) | | Variation margin on certain derivative contracts | | $ | — | |
Credit | | — | | | — | | | Payable for unrealized loss on swap contracts | | | (333,978) | |
Currency | | Receivable for unrealized gain on forward foreign currency exchange contracts | | | 933,517 | | | Payable for unrealized loss on forward foreign currency exchange contracts | | | (98,736) | |
| Total | | | | $ | 1,849,932 | | | | | $ | (432,714) | |
159
GOLDMAN SACHS SINGLE SECTOR FIXED INCOME FUNDS
Notes to Financial Statements (continued)
September 30, 2014 (Unaudited)
|
| 4. INVESTMENTS IN DERIVATIVES (continued) |
| | | | | | | | | | | | |
| | |
| Investment Grade Credit | | | | | | | |
| Risk | | Statement of Assets
and Liabilities | | Assets | | | Statement of Assets
and Liabilities | | Liabilities | |
Interest rate | | Variation margin on certain derivative contracts; Investments, at value | | $ | 4,185,381 | (a) | | Variation margin on certain derivative contracts | | $ | (529,613) | (a) |
Currency | | Receivable for unrealized gain on forward foreign currency exchange contracts | | | 14,608 | | | — | | | — | |
| Total | | | | $ | 4,199,989 | | | | | $ | (529,613) | |
| | |
| Local Emerging Markets Debt | | | | | | | |
| Risk | | Statement of Assets
and Liabilities | | Assets | | | Statement of Assets
and Liabilities | | Liabilities | |
Interest rate | | Receivable for unrealized gain on swap contracts; Variation margin on certain derivative contracts | | $ | 14,991,468 | (a) | | Payable for unrealized loss on swap contracts; Variation margin on certain derivative contracts | | $ | (24,036,696) | (a)(b) |
Credit | | — | | | — | | | Payable for unrealized loss on swap contracts | | | (409,073) | (b) |
Currency | | Receivable for unrealized gain on swap contracts; Receivable for unrealized gain on forward foreign currency exchange contracts | | | 36,808,780 | | | Payable for unrealized loss on swap contracts; Payable for unrealized loss on forward foreign currency exchange contracts | | | (32,707,458) | |
| Total | | | | $ | 51,800,248 | | | | | $ | (57,153,227) | |
| | |
| U.S. Mortgages | | | | | | | |
| Risk | | Statement of Assets
and Liabilities | | Assets | | | Statement of Assets
and Liabilities | | Liabilities | |
Interest rate | | Receivable for unrealized gain on swap contracts; Variation margin on certain derivative contracts; Investments, at value | | $ | 1,907,128 | (a) | | Payable for unrealized loss on swap contracts; Variation margin on certain derivative contracts | | $ | (326,994) | (a)(b) |
| (a) | | Includes unrealized gain (loss) on futures contracts and centrally cleared swaps described in the Additional Investment Information sections of the Schedules of Investments. Only current day’s variation margin is reported within the Statements of Assets and Liabilities. |
| (b) | | Aggregate of amounts include $142,168, $6,236,835, $24,018,083 and $1,364 for Dynamic Emerging Markets Debt, Emerging Markets Debt, Local Emerging Markets Debt and U.S. Mortgages Funds, respectively, which represent the payments to be made pursuant to bilateral agreements should counterparties exercise their “right to terminate” provisions based on, among others, the Funds’ performance, their failure to pay on their obligations or failure to pledge collateral. Such amounts do not include incremental charges directly associated with the close-out of the agreements. They also do not reflect the fair value of any assets pledged as collateral which, through the daily margining process, substantially offsets the aforementioned amounts and for which the Funds are entitled to a full return. |
160
GOLDMAN SACHS SINGLE SECTOR FIXED INCOME FUNDS
|
| 4. INVESTMENTS IN DERIVATIVES (continued) |
The following tables set forth, by certain risk types, the Funds’ gains (losses) related to these derivatives and their indicative volumes for the six months ended September 30, 2014. These gains (losses) should be considered in the context that these derivative contracts may have been executed to create investment opportunities and/or economically hedge certain investments, and accordingly, certain gains (losses) on such derivative contracts may offset certain (losses) gains attributable to investments. These gains (losses) are included in “Net realized gain (loss)” or “Net change in unrealized gain (loss)” on the Statements of Operations:
| | | | | | | | | | | | | | |
| | |
| Dynamic Emerging Markets Debt | | | | | | | | | |
| Risk | | Statements of Operations | | Net
Realized
Gain (Loss) | | | Net Change in
Unrealized
Gain (Loss) | | | Average
Number of
Contracts(a) | |
| Interest rate | | Net realized gain (loss) from futures contracts and swap contracts/Net change in unrealized gain (loss) on futures contracts and swap contracts | | $ | (86,169 | ) | | $ | (87,982 | ) | | | 154 | |
| Credit | | Net realized gain (loss) from swap contracts/Net change in unrealized gain (loss) on swap contracts | | | (6,761 | ) | | | (4,347 | ) | | | 37 | |
| Currency | | Net realized gain (loss) from forward foreign currency exchange contracts/Net change in unrealized gain (loss) on forward foreign currency exchange contracts | | | 118,145 | | | | (16,994 | ) | | | 285 | |
| Total | | | | $ | 25,215 | | | $ | (109,323 | ) | | | 476 | |
| | |
| Emerging Markets Debt | | | | | | | | | |
| Risk | | Statements of Operations | | Net
Realized
Gain (Loss) | | | Net Change in
Unrealized
Gain (Loss) | | | Average
Number of
Contracts(a) | |
| Interest rate | | Net realized gain (loss) from futures contracts, non-deliverable bond forward contracts and swap contracts/Net change in unrealized gain (loss) on futures contracts, non-deliverable bond forward contracts and swap contracts | | $ | (468,771 | ) | | $ | (6,106,627 | ) | | | 5,040 | |
| Credit | | Net realized gain (loss) from swap contracts/Net change in unrealized gain (loss) on swap contracts | | | 23,671 | | | | (435,057 | ) | | | 37 | |
| Currency | | Net realized gain (loss) from forward foreign currency exchange contracts/Net change in unrealized gain (loss) on forward foreign currency exchange contracts | | | 9,094,420 | | | | 9,804,619 | | | | 216 | |
| Total | | | | $ | 8,649,320 | | | $ | 3,262,935 | | | | 5,293 | |
| | |
| High Yield | | | | | | | | | |
| Risk | | Statements of Operations | | Net
Realized
Gain (Loss) | | | Net Change in
Unrealized
Gain (Loss) | | | Average
Number of
Contracts(a) | |
| Interest rate | | Net realized gain (loss) from futures contracts and swap contracts/Net change in unrealized gain (loss) on futures contracts and swap contracts | | $ | (7,997,056 | ) | | $ | (358,868 | ) | | | 10,140 | |
| Credit | | Net realized gain (loss) from swap contracts/Net change in unrealized gain (loss) on swap contracts | | | (3,062,088 | ) | | | 1,719,018 | | | | 1 | |
| Currency | | Net realized gain (loss) from forward foreign currency exchange contracts/Net change in unrealized gain (loss) on forward foreign currency exchange contracts | | | 7,413,343 | | | | 3,133,345 | | | | 6 | |
| Total | | | | $ | (3,645,801 | ) | | $ | 4,493,495 | | | | 10,147 | |
161
GOLDMAN SACHS SINGLE SECTOR FIXED INCOME FUNDS
Notes to Financial Statements (continued)
September 30, 2014 (Unaudited)
|
| 4. INVESTMENTS IN DERIVATIVES (continued) |
| | | | | | | | | | | | | | |
| | |
| High Yield Floating Rate | | | | | | | | | |
| Risk | | Statements of Operations | | Net
Realized
Gain (Loss) | | | Net Change in
Unrealized
Gain (Loss) | | | Average
Number of
Contracts(a) | |
| Interest rate | | Net realized gain (loss) from swap contracts/Net change in unrealized gain (loss) on swap contracts | | $ | (2,964,027 | ) | | $ | 637,077 | | | | 4 | |
| Credit | | Net realized gain (loss) from swap contracts/Net change in unrealized gain (loss) on swap contracts | | | (1,467,895 | ) | | | (333,978 | ) | | | 1 | |
| Currency | | Net realized gain (loss) from forward foreign currency exchange contracts/Net change in unrealized gain (loss) on forward foreign currency exchange contracts | | | 2,221,789 | | | | 800,181 | | | | 5 | |
| Total | | | | $ | (2,210,133 | ) | | $ | 1,103,280 | | | | 10 | |
| | |
| Investment Grade Credit | | | | | | | | | |
| Risk | | Statements of Operations | | Net
Realized
Gain (Loss) | | | Net Change in
Unrealized
Gain (Loss) | | | Average
Number of
Contracts(a) | |
| Interest rate | | Net realized gain (loss) from futures contracts and swap contracts/Net change in unrealized gain (loss) on investments, futures contracts and swap contracts | | $ | 1,654,208 | | | $ | (378,874 | ) | | | 1,043 | |
| Credit | | Net realized gain (loss) from swap contracts/Net change in unrealized gain (loss) on swap contracts | | | 116,095 | | | | (145,226 | ) | | | 4 | |
| Currency | | Net realized gain (loss) from forward foreign currency exchange contracts/Net change in unrealized gain (loss) on forward foreign currency exchange contracts | | | 34,621 | | | | 13,852 | | | | 1 | |
| Total | | | | $ | 1,804,924 | | | $ | (510,248 | ) | | | 1,048 | |
| | |
| Local Emerging Markets Debt | | | | | | | | | |
| Risk | | Statements of Operations | | Net
Realized
Gain (Loss) | | | Net Change in
Unrealized
Gain (Loss) | | | Average
Number of
Contracts(a) | |
| Interest rate | | Net realized gain (loss) from futures contracts and swap contracts/Net change in unrealized gain (loss) on futures contracts and swap contracts | | $ | (13,231,985 | ) | | $ | 2,322,730 | | | | 9,592 | |
| Credit | | Net realized gain (loss) from swap contracts/Net change in unrealized gain (loss) on swap contracts | | | (370,088 | ) | | | (264,031 | ) | | | 39 | |
| Currency | | Net realized gain (loss) from swap contracts and forward foreign currency exchange contracts/Net change in unrealized gain (loss) on swap contracts and forward foreign currency exchange contracts | | | 7,165,541 | | | | (6,536,948 | ) | | | 326 | |
| Total | | | | $ | (6,436,532 | ) | | $ | (4,478,249 | ) | | | 9,957 | |
| | |
| U.S. Mortgages | | | | | | | | | |
| Risk | | Statements of Operations | | Net
Realized
Gain (Loss) | | | Net Change in
Unrealized
Gain (Loss) | | | Average
Number of
Contracts(a) | |
| Interest rate | | Net realized gain (loss) from futures contracts and swap contracts/Net change in unrealized gain (loss) on investments, futures contracts and swap contracts | | $ | 149,052 | | | $ | 57,889 | | | | 901 | |
| (a) | | Average number of contracts is based on the average of month end balances for the six months ended September 30, 2014. |
162
GOLDMAN SACHS SINGLE SECTOR FIXED INCOME FUNDS
|
| 4. INVESTMENTS IN DERIVATIVES (continued) |
In order to better define its contractual rights and to secure rights that will help a Fund mitigate its counterparty risk, a Fund may enter into an International Swaps and Derivatives Association, Inc. Master Agreement (“ISDA Master Agreement”) or similar agreement with its derivatives counterparties. An ISDA Master Agreement is a bilateral agreement between a Fund and a counterparty that governs OTC derivatives, including foreign exchange contracts, and typically contains, among other things, collateral posting terms and netting provisions in the event of a default and/or termination event. The provisions of the ISDA Master Agreement typically permit a single net payment in the event of a default (close-out netting) or similar event, including the bankruptcy or insolvency of the counterparty.
Collateral and margin requirements differ between exchange traded derivatives and OTC derivatives. Margin requirements are established by the broker or clearing house for exchange-traded and centrally cleared derivatives (financial futures contracts, options and centrally cleared swaps) pursuant to governing agreements for those instrument types. Brokers can ask for margin in excess of the minimum in certain circumstances. Collateral terms are contract-specific for OTC derivatives (foreign currency exchange contracts, and certain options and swaps). For derivatives traded under an ISDA Master Agreement, the collateral requirements are typically calculated by netting the marked to market amount for each transaction under such agreement and comparing that amount to the value of any collateral currently pledged by a Fund and the counterparty. Additionally, a Fund may be required to post initial margin to the counterparty, the terms of which would be outlined in the confirmation of the OTC transaction.
For financial reporting purposes, cash collateral that has been pledged to cover obligations of a Fund and cash collateral received from the counterparty, if any, is reported separately on the Statements of Assets and Liabilities as receivables/payables for collateral on certain derivative contracts. Non-cash collateral pledged by a Fund, if any, is noted in the Schedules of Investments. Generally, the amount of collateral due from or to a counterparty must exceed a minimum transfer amount threshold before a transfer is required to be made. To the extent amounts due to a Fund from its counterparties are not fully collateralized, contractually or otherwise, the Fund bears the risk of loss from counterparty nonperformance. A Fund attempts to mitigate counterparty risk by only entering into agreements with counterparties that it believes to be of good standing and by monitoring the financial stability of those counterparties.
Additionally, the netting of assets and liabilities and the offsetting of collateral pledged or received are based on contractual netting/set-off provisions in the ISDA Master Agreement or similar agreements. However, in the event of a default or insolvency of a counterparty, a court could determine that such rights are not enforceable due the restrictions or prohibitions against the right of setoff that may be imposed due to a particular jurisdiction’s bankruptcy or insolvency laws.
163
GOLDMAN SACHS SINGLE SECTOR FIXED INCOME FUNDS
Notes to Financial Statements (continued)
September 30, 2014 (Unaudited)
|
| 4. INVESTMENTS IN DERIVATIVES (continued) |
The following tables set forth the Funds’ net exposure for derivative instruments that are subject to enforceable master netting arrangements or similar agreements as of September 30, 2014:
| | | | | | | | | | | | | | | | | | | | | | | | | | | | | | | | | | | | |
| | | | | | |
| Dynamic Emerging Markets Debt Fund | | | | | | | | | | | | | | | | | | | | | | | | | |
| | | Derivative Assets(1) | | | Derivative Liabilities(1) | | | Net
Derivative
Asset
(Liabilities) | | | Collateral
(Received)
Pledged(1) | | | Net
Amount(2) | |
| Counterparty | | Swaps | | | Forward
Currency
Contracts | | | Total | | | Swaps | | | Forward
Currency
Contracts | | | Total | | | | |
Bank of America Securities LLC | | $ | 6,034 | | | $ | 34,629 | | | $ | 40,663 | | | $ | (19,831 | ) | | $ | (6,268 | ) | | $ | (26,099 | ) | | $ | 14,564 | | | $ | — | | | $ | 14,564 | |
Barclays Bank PLC | | | 1,739 | | | | 17,555 | | | | 19,294 | | | | (2,509 | ) | | | (39,484 | ) | | | (41,993 | ) | | | (22,699 | ) | | | — | | | | (22,699 | ) |
BNP Paribas SA | | | — | | | | 23,475 | | | | 23,475 | | | | — | | | | (17,844 | ) | | | (17,844 | ) | | | 5,631 | | | | — | | | | 5,631 | |
Citibank NA | | | 686 | | | | — | | | | 686 | | | | (29,453 | ) | | | — | | | | (29,453 | ) | | | (28,767 | ) | | | — | | | | (28,767 | ) |
Citibank NA (London) | | | — | | | | 20,548 | | | | 20,548 | | | | — | | | | (9,670 | ) | | | (9,670 | ) | | | 10,878 | | | | — | | | | 10,878 | |
Credit Suisse International (London) | | | 243 | | | | 5,192 | | | | 5,435 | | | | (7,957 | ) | | | (19,134 | ) | | | (27,091 | ) | | | (21,656 | ) | | | 21,656 | | | | — | |
Deutsche Bank AG | | | 9,994 | | | | — | | | | 9,994 | | | | (46,877 | ) | | | — | | | | (46,877 | ) | | | (36,883 | ) | | | — | | | | (36,883 | ) |
Deutsche Bank AG (London) | | | — | | | | 42,200 | | | | 42,200 | | | | — | | | | (39,296 | ) | | | (39,296 | ) | | | 2,904 | | | | — | | | | 2,904 | |
HSBC Bank PLC | | | — | | | | 28,309 | | | | 28,309 | | | | — | | | | (12,607 | ) | | | (12,607 | ) | | | 15,702 | | | | — | | | | 15,702 | |
JPMorgan Chase Bank (London) | | | — | | | | 37,040 | | | | 37,040 | | | | — | | | | (26,906 | ) | | | (26,906 | ) | | | 10,134 | | | | — | | | | 10,134 | |
JPMorgan Securities, Inc. | | | 88 | | | | — | | | | 88 | | | | (19,527 | ) | | | — | | | | (19,527 | ) | | | (19,439 | ) | | | — | | | | (19,439 | ) |
Merrill Lynch International Bank Ltd. | | | — | | | | 128 | | | | 128 | | | | — | | | | (3,006 | ) | | | (3,006 | ) | | | (2,878 | ) | | | — | | | | (2,878 | ) |
Morgan Stanley & Co. International PLC | | | 1,130 | | | | 18,677 | | | | 19,807 | | | | (16,014 | ) | | | (11,659 | ) | | | (27,673 | ) | | | (7,866 | ) | | | — | | | | (7,866 | ) |
Royal Bank of Canada | | | — | | | | 562 | | | | 562 | | | | — | | | | (34,907 | ) | | | (34,907 | ) | | | (34,345 | ) | | | — | | | | (34,345 | ) |
Royal Bank of Scotland PLC | | | — | | | | 5,891 | | | | 5,891 | | | | — | | | | (15,908 | ) | | | (15,908 | ) | | | (10,017 | ) | | | — | | | | (10,017 | ) |
Standard Chartered Bank | | | — | | | | 19,175 | | | | 19,175 | | | | — | | | | (29,399 | ) | | | (29,399 | ) | | | (10,224 | ) | | | — | | | | (10,224 | ) |
State Street Bank and Trust | | | — | | | | 3,694 | | | | 3,694 | | | | — | | | | (3,260 | ) | | | (3,260 | ) | | | 434 | | | | — | | | | 434 | |
UBS AG (London) | | | — | | | | 9,692 | | | | 9,692 | | | | — | | | | (42,321 | ) | | | (42,321 | ) | | | (32,629 | ) | | | — | | | | (32,629 | ) |
Westpac Banking Corp. | | | — | | | | 57,244 | | | | 57,244 | | | | — | | | | (5,915 | ) | | | (5,915 | ) | | | 51,329 | | | | — | | | | 51,329 | |
Total | | $ | 19,914 | | | $ | 324,011 | | | $ | 343,925 | | | $ | (142,168 | ) | | $ | (317,584 | ) | | $ | (459,752 | ) | | $ | (115,827 | ) | | $ | 21,656 | | | $ | (94,171 | ) |
164
GOLDMAN SACHS SINGLE SECTOR FIXED INCOME FUNDS
|
| 4. INVESTMENTS IN DERIVATIVES (continued) |
| | | | | | | | | | | | | | | | | | | | | | | | | | | | | | | | | | | | |
| | | | | | |
| Emerging Markets Debt Fund | | | | | | | | | | | | | | | | | | | | | | | | | |
| | | Derivative Assets(1) | | | Derivative Liabilities(1) | | | Net
Derivative
Asset
(Liabilities) | | | Collateral
(Received)
Pledged(1) | | | Net
Amount(2) | |
| Counterparty | | Swaps | | | Forward
Currency
Contracts | | | Total | | | Swaps | | | Forward
Currency
Contracts | | | Total | | | | |
Bank of America Securities LLC | | $ | 35,028 | | | $ | 1,689,359 | | | $ | 1,724,387 | | | $ | (63,780 | ) | | $ | (307,578 | ) | | $ | (371,358 | ) | | $ | 1,353,029 | | | $ | — | | | $ | 1,353,029 | |
Barclays Bank PLC | | | 24,090 | | | | 1,524,390 | | | | 1,548,480 | | | | (118,930 | ) | | | (752,175 | ) | | | (871,105 | ) | | | 677,375 | | | | — | | | | 677,375 | |
BNP Paribas SA | | | — | | | | 867,886 | | | | 867,886 | | | | — | | | | (330,787 | ) | | | (330,787 | ) | | | 537,099 | | | | — | | | | 537,099 | |
Citibank NA | | | 122,362 | | | | — | | | | 122,362 | | | | (1,802,587 | ) | | | — | | | | (1,802,587 | ) | | | (1,680,225 | ) | | | 1,680,225 | | | | — | |
Citibank NA (London) | | | — | | | | 711,849 | | | | 711,849 | | | | — | | | | (539,946 | ) | | | (539,946 | ) | | | 171,903 | | | | — | | | | 171,903 | |
Credit Suisse International (London) | | | — | | | | 248,228 | | | | 248,228 | | | | (97,149 | ) | | | (589,749 | ) | | | (686,898 | ) | | | (438,670 | ) | | | — | | | | (438,670 | ) |
Deutsche Bank AG | | | 73,885 | | | | — | | | | 73,885 | | | | (1,112,460 | ) | | | — | | | | (1,112,460 | ) | | | (1,038,575 | ) | | | 700,000 | | | | (338,575 | ) |
Deutsche Bank AG (London) | | | — | | | | 1,251,383 | | | | 1,251,383 | | | | — | | | | (792,280 | ) | | | (792,280 | ) | | | 459,103 | | | | — | | | | 459,103 | |
HSBC Bank PLC | | | — | | | | 697,807 | | | | 697,807 | | | | — | | | | (497,180 | ) | | | (497,180 | ) | | | 200,627 | | | | — | | | | 200,627 | |
JPMorgan Chase Bank (London) | | | — | | | | 3,723,056 | | | | 3,723,056 | | | | — | | | | (480,094 | ) | | | (480,094 | ) | | | 3,242,962 | | | | — | | | | 3,242,962 | |
JPMorgan Securities, Inc. | | | 584,784 | | | | — | | | | 584,784 | | | | (1,170,180 | ) | | | — | | | | (1,170,180 | ) | | | (585,396 | ) | | | 585,396 | | | | — | |
Merrill Lynch International Bank Ltd. | | | — | | | | 15,413 | | | | 15,413 | | | | — | | | | (118,478 | ) | | | (118,478 | ) | | | (103,065 | ) | | | — | | | | (103,065 | ) |
Morgan Stanley & Co. International PLC | | | 6,884 | | | | 765,936 | | | | 772,820 | | | | (1,871,749 | ) | | | (687,820 | ) | | | (2,559,569 | ) | | | (1,786,749 | ) | | | 1,786,749 | | | | — | |
Royal Bank of Canada | | | — | | | | 27,499 | | | | 27,499 | | | | — | | | | (758,711 | ) | | | (758,711 | ) | | | (731,212 | ) | | | — | | | | (731,212 | ) |
Royal Bank of Scotland PLC | | | — | | | | 290,428 | | | | 290,428 | | | | — | | | | (773,283 | ) | | | (773,283 | ) | | | (482,855 | ) | | | — | | | | (482,855 | ) |
Standard Chartered Bank | | | — | | | | 429,408 | | | | 429,408 | | | | — | | | | (1,227,540 | ) | | | (1,227,540 | ) | | | (798,132 | ) | | | — | | | | (798,132 | ) |
State Street Bank and Trust | | | — | | | | 181,265 | | | | 181,265 | | | | — | | | | (158,747 | ) | | | (158,747 | ) | | | 22,518 | | | | — | | | | 22,518 | |
UBS AG (London) | | | — | | | | 2,753,763 | | | | 2,753,763 | | | | — | | | | (1,099,179 | ) | | | (1,099,179 | ) | | | 1,654,584 | | | | — | | | | 1,654,584 | |
Westpac Banking Corp. | | | — | | | | 2,651,495 | | | | 2,651,495 | | | | — | | | | (135,644 | ) | | | (135,644 | ) | | | 2,515,851 | | | | — | | | | 2,515,851 | |
Total | | $ | 847,033 | | | $ | 17,829,165 | | | $ | 18,676,198 | | | $ | (6,236,835 | ) | | $ | (9,249,191 | ) | | $ | (15,486,026 | ) | | $ | 3,190,172 | | | $ | 4,752,370 | | | $ | 7,942,542 | |
165
GOLDMAN SACHS SINGLE SECTOR FIXED INCOME FUNDS
Notes to Financial Statements (continued)
September 30, 2014 (Unaudited)
|
| 4. INVESTMENTS IN DERIVATIVES (continued) |
| | | | | | | | | | | | | | | | | | | | | | | | | | | | | | | | | | | | |
| | | | | | |
| Local Emerging Markets Debt Fund | | | | | | | | | | | | | | | | | | | | | | | | | |
| | | Derivative Assets(1) | | | Derivative Liabilities(1) | | | Net Derivative
Asset
(Liabilities) | | | Collateral
(Received)
Pledged(1) | | | Net
Amount(2) | |
| Counterparty | | Swaps | | | Forward
Currency
Contracts | | | Total | | | Swaps | | | Forward
Currency
Contracts | | | Total | | | | |
Bank of America Securities LLC | | $ | 1,355,211 | | | $ | 2,860,794 | | | $ | 4,216,005 | | | $ | (1,261,816 | ) | | $ | (508,601 | ) | | $ | (1,770,417 | ) | | $ | 2,445,588 | | | $ | (310,000 | ) | | $ | 2,135,588 | |
Barclays Bank PLC | | | 338,035 | | | | 1,496,595 | | | | 1,834,630 | | | | (2,925,437 | ) | | | (3,678,085 | ) | | | (6,603,522 | ) | | | (4,768,892 | ) | | | 2,750,199 | | | | (2,018,693 | ) |
BNP Paribas SA | | | — | | | | 2,827,538 | | | | 2,827,538 | | | | — | | | | (1,402,871 | ) | | | (1,402,871 | ) | | | 1,424,667 | | | | — | | | | 1,424,667 | |
Citibank NA | | | 3,872,111 | | | | — | | | | 3,872,111 | | | | (5,122,854 | ) | | | — | | | | (5,122,854 | ) | | | (1,250,743 | ) | | | 700,000 | | | | (550,743 | ) |
Citibank NA (London) | | | — | | | | 1,591,738 | | | | 1,591,738 | | | | — | | | | (1,278,001 | ) | | | (1,278,001 | ) | | | 313,737 | | | | — | | | | 313,737 | |
Credit Suisse International (London) | | | 72,736 | | | | 934,519 | | | | 1,007,255 | | | | (1,083,866 | ) | | | (2,054,009 | ) | | | (3,137,875 | ) | | | (2,130,620 | ) | | | 900,000 | | | | (1,230,620 | ) |
Deutsche Bank AG | | | 2,223,444 | | | | — | | | | 2,223,444 | | | | (7,907,561 | ) | | | — | | | | (7,907,561 | ) | | | (5,684,117 | ) | | | 3,640,000 | | | | (2,044,117 | ) |
Deutsche Bank AG (London) | | | — | | | | 3,240,328 | | | | 3,240,328 | | | | — | | | | (3,836,293 | ) | | | (3,836,293 | ) | | | (595,965 | ) | | | — | | | | (595,965 | ) |
HSBC Bank PLC | | | — | | | | 3,837,976 | | | | 3,837,976 | | | | — | | | | (1,701,070 | ) | | | (1,701,070 | ) | | | 2,136,906 | | | | — | | | | 2,136,906 | |
JPMorgan Chase Bank (London) | | | — | | | | 3,022,445 | | | | 3,022,445 | | | | — | | | | (1,545,025 | ) | | | (1,545,025 | ) | | | 1,477,420 | | | | — | | | | 1,477,420 | |
JPMorgan Securities, Inc. | | | 6,401,367 | | | | — | | | | 6,401,367 | | | | (2,158,244 | ) | | | — | | | | (2,158,244 | ) | | | 4,243,123 | | | | (4,100,000 | ) | | | 143,123 | |
Merrill Lynch International Bank Ltd. | | | — | | | | 308,191 | | | | 308,191 | | | | — | | | | (357,624 | ) | | | (357,624 | ) | | | (49,433 | ) | | | — | | | | (49,433 | ) |
Morgan Stanley & Co. International PLC | | | 204,801 | | | | 2,300,354 | | | | 2,505,155 | | | | (3,558,305 | ) | | | (857,468 | ) | | | (4,415,773 | ) | | | (1,910,618 | ) | | | 1,910,618 | | | | — | |
Royal Bank of Canada | | | — | | | | 716,743 | | | | 716,743 | | | | — | | | | (1,766,648 | ) | | | (1,766,648 | ) | | | (1,049,905 | ) | | | — | | | | (1,049,905 | ) |
Royal Bank of Scotland PLC | | | — | | | | 482,522 | | | | 482,522 | | | | — | | | | (1,304,816 | ) | | | (1,304,816 | ) | | | (822,294 | ) | | | — | | | | (822,294 | ) |
Standard Chartered Bank | | | — | | | | 5,606,388 | | | | 5,606,388 | | | | — | | | | (3,477,019 | ) | | | (3,477,019 | ) | | | 2,129,369 | | | | — | | | | 2,129,369 | |
State Street Bank and Trust | | | — | | | | 300,559 | | | | 300,559 | | | | — | | | | (267,200 | ) | | | (267,200 | ) | | | 33,359 | | | | — | | | | 33,359 | |
UBS AG (London) | | | — | | | | 723,415 | | | | 723,415 | | | | — | | | | (6,586,697 | ) | | | (6,586,697 | ) | | | (5,863,282 | ) | | | — | | | | (5,863,282 | ) |
Westpac Banking Corp. | | | — | | | | 3,453,063 | | | | 3,453,063 | | | | — | | | | (467,621 | ) | | | (467,621 | ) | | | 2,985,442 | | | | — | | | | 2,985,442 | |
Total | | $ | 14,467,705 | | | $ | 33,703,168 | | | $ | 48,170,873 | | | $ | (24,018,083 | ) | | $ | (31,089,048 | ) | | $ | (55,107,131 | ) | | $ | (6,936,258 | ) | | $ | 5,490,817 | | | $ | (1,445,441 | ) |
| (1) | | Gross amounts available for offset but not netted in the Statement of Assets and Liabilities. |
| (2) | | Net amount represents the net amount due (to) from counterparty in the event of a default based on the contractual set-off rights under the agreement. Net amount excludes any over-collateralized amounts. |
|
| 5. AGREEMENTS AND AFFILIATED TRANSACTIONS |
A. Management Agreement — Under the Agreement, GSAM manages the Funds, subject to the general supervision of the Trustees.
As compensation for the services rendered pursuant to the Agreement, the assumption of the expenses related thereto and administration of the Funds’ business affairs, including providing facilities, GSAM is entitled to a management fee, accrued daily and paid monthly, equal to an annual percentage rate of each Fund’s average daily net assets.
166
GOLDMAN SACHS SINGLE SECTOR FIXED INCOME FUNDS
|
| 5. AGREEMENTS AND AFFILIATED TRANSACTIONS (continued) |
For the six months ended September 30, 2014, contractual and effective net management fees with GSAM were at the following rates:
| | | | | | | | | | | | | | | | | | | | | | | | | | | | | | |
| | | | | Contractual Management Rate | | | Effective Net
Management
Rate | |
| Fund | | | | First
$1 billion | | | Next
$1 billion | | | Next
$3 billion | | | Next
$3 billion | | | Over
$8 billion | | | Effective
Rate | | |
Dynamic Emerging Markets Debt | | | | | 0.90 | % | | | 0.90 | % | | | 0.81 | % | | | 0.77 | % | | | 0.75 | % | | | 0.90 | % | | | 0.80 | %# |
Emerging Markets Debt | | | | | 0.80 | | | | 0.80 | | | | 0.72 | | | | 0.68 | | | | 0.67 | | | | 0.80 | | | | 0.80 | |
High Yield | | | | | 0.70 | | | | 0.70 | | | | 0.63 | | | | 0.60 | | | | 0.59 | | | | 0.66 | | | | 0.66 | |
High Yield Floating Rate | | | | | 0.60 | | | | 0.54 | | | | 0.51 | | | | 0.50 | | | | 0.49 | | | | 0.54 | | | | 0.54 | |
Investment Grade Credit | | | | | 0.40 | | | | 0.36 | | | | 0.34 | | | | 0.33 | | | | 0.32 | | | | 0.40 | | | | 0.34 | * |
Local Emerging Markets Debt | | | | | 0.90 | | | | 0.90 | | | | 0.81 | | | | 0.77 | | | | 0.75 | | | | 0.90 | | | | 0.80 | # |
U.S. Mortgages | | | | | 0.40 | | | | 0.36 | | | | 0.34 | | | | 0.33 | | | | 0.32 | | | | 0.40 | | | | 0.34 | * |
| # | | GSAM has agreed to waive a portion of its management fee in order to achieve the effective net management fee rates shown above through at least July 25, 2015 for Local Emerging Markets Debt and Dynamic Emerging Markets Debt Funds. Prior to such date GSAM may not terminate the arrangements without the approval of the trustees. Where the application of the above contractual management fee breakpoint schedule of a Fund would result in a lower management fee rate, the breakpoint schedule will be applied to the Fund’s assets. |
| * | | GSAM has agreed to waive a portion of its management fee in order to achieve an effective net management fee rate of 0.34% as an annual percentage rate of the average daily net assets of the Investment Grade Credit and U.S. Mortgages Funds through at least July 29, 2015. |
B. Distribution and Service Plans — The Trust, on behalf of each Fund, has adopted Distribution and Service Plans (the “Plans”). Under the Plans, Goldman Sachs, which serves as distributor (the “Distributor”), is entitled to a fee accrued daily and paid monthly, for distribution services and personal and account maintenance services, which may then be paid by Goldman Sachs to authorized dealers, at the following annual rates calculated on a Fund’s average daily net assets of each respective share class:
| | | | | | | | | | | | | | | | |
| | | Distribution and Service Plan Rates | |
| | | Class A* | | | Class B | | | Class C | | | Class R* | |
Distribution Plan | | | 0.25 | % | | | 0.75 | % | | | 0.75 | % | | | 0.50 | % |
Service Plan | | | — | | | | 0.25 | | | | 0.25 | | | | — | |
| * | | With respect to Class A and Class R Shares, the Distributor at its discretion may use compensation for distribution services paid under the Distribution Plan to compensate service organizations for personal and account maintenance services and expenses as long as such total compensation does not exceed the maximum cap on “service fees” imposed by the Financial Industry Regulatory Authority. |
167
GOLDMAN SACHS SINGLE SECTOR FIXED INCOME FUNDS
Notes to Financial Statements (continued)
September 30, 2014 (Unaudited)
|
| 5. AGREEMENTS AND AFFILIATED TRANSACTIONS (continued) |
C. Distribution Agreement — Goldman Sachs, as Distributor of the shares of the Funds pursuant to a Distribution Agreement, may retain a portion of the Class A front end sales charge and Class B and Class C Shares’ CDSC. During the six months ended September 30, 2014, Goldman Sachs advised that it retained the following amounts:
| | | | | | |
| | | | | Front End
Sales Charge | |
| Fund | | | | Class A | |
Emerging Markets Debt | | | | $ | 8,221 | |
High Yield | | | | | 13,068 | |
High Yield Floating Rate | | | | | 1,023 | |
Investment Grade Credit | | | | | 1,559 | |
Local Emerging Markets Debt | | | | | 1,623 | |
U.S. Mortgages | | | | | 344 | |
Goldman Sachs retained no contingent deferred sales charges.
D. Service Plan and Shareholder Administration Plan — The Trust, on behalf of each Fund that offers Service Shares, has adopted a Service Plan and a Shareholder Administration Plan. These plans allow for service organizations to provide varying levels of personal and account maintenance and shareholder administration services to their customers who are beneficial owners of such shares. The Service Plan and Shareholder Administration Plan each provide for compensation to the service organizations which is accrued daily and paid monthly at an annual rate of 0.25% (0.50% in aggregate) of the average daily net assets of the Service Shares.
E. Transfer Agency Agreement — Goldman Sachs also serves as the transfer agent of the Funds for a fee pursuant to the Transfer Agency Agreement. The fees charged for such transfer agency services are accrued daily and paid monthly at annual rates as follows: 0.13% of the average daily net assets of Class A, Class B, Class C, Class IR and Class R Shares and 0.04% of the average daily net assets of Institutional, Separate Account Institutional and Service Shares.
F. Other Expense Agreements and Affiliated Transactions — GSAM has agreed to limit certain “Other Expenses” of the Funds (excluding transfer agency fees and expenses, service fees and shareholder administration fees (as applicable), taxes, interest, brokerage fees, shareholder meetings, litigation, indemnification and expenses) to the extent such expenses exceed, on an annual basis, a percentage rate of the average daily net assets of each Fund. Such Other Expense reimbursements, if any, are accrued daily and paid monthly. In addition, the Funds are not obligated to reimburse GSAM for prior fiscal year expense reimbursements, if any. The Other Expense limitations as an annual percentage rate of average daily net assets for the Dynamic Emerging Markets Debt, Emerging Markets Debt, High Yield, High Yield Floating Rate, Investment Grade Credit, Local Emerging Markets Debt and U.S. Mortgages Funds, are 0.054%, 0.054%, 0.024%, 0.104%, 0.004%, 0.074% and 0.004%, respectively. These Other Expense limitations will remain in place through at least July 29, 2015, and prior to such date GSAM may not terminate the arrangements without the approval of the Trustees. The Funds bear their respective share of costs related to proxy and shareholder meetings, and GSAM has agreed to reimburse each Fund to the extent such expenses exceed a specified percentage of the Fund’s net assets. In addition, the Funds have entered into certain offset arrangements with the custodian and the transfer agent, which may result in a reduction of the Funds’ expenses and are received irrespective of the application of the “Other Expense” limitations described above.
168
GOLDMAN SACHS SINGLE SECTOR FIXED INCOME FUNDS
|
| 5. AGREEMENTS AND AFFILIATED TRANSACTIONS (continued) |
For the six months ended September 30, 2014, these expense reductions, including any fee waivers and Other Expense reimbursements, were as follows:
| | | | | | | | | | | | | | |
| Fund | | | | Management
Fees Waivers | | | Other
Expense
Reimbursements | | | Total
Expense
Reductions | |
Dynamic Emerging Markets Debt | | | | $ | 13,881 | | | $ | 206,561 | | | $ | 220,442 | |
Emerging Markets Debt | | | | | — | | | | 103,613 | | | | 103,613 | |
High Yield | | | | | — | | | | — | | | | — | |
High Yield Floating Rate | | | | | — | | | | 161,911 | | | | 161,911 | |
Investment Grade Credit | | | | | 142,672 | | | | 185,748 | | | | 328,420 | |
Local Emerging Markets Debt | | | | | 983,997 | | | | 430,327 | | | | 1,414,324 | |
U.S. Mortgages | | | | | 74,192 | | | | 232,857 | | | | 307,049 | |
G. Line of Credit Facility — As of September 30, 2014, the Funds participated in a $1,080,000,000 committed, unsecured revolving line of credit facility (the “facility”) together with other funds of the Trust and registered investment companies having management agreements with GSAM or its affiliates (“Other Borrowers”). Pursuant to the terms of the facility, the Funds and Other Borrowers could increase the credit amount by an additional $120,000,000, for a total of up to $1,200,000,000. This facility is to be used solely for temporary or emergency purposes, which may include the funding of redemptions. The interest rate on borrowings is based on the federal funds rate. The facility also requires a fee to be paid by the Funds based on the amount of the commitment that has not been utilized. For the six months ended September 30, 2014, the Funds did not have any borrowings under the facility.
H. Other Transactions with Affiliates — For the six months ended September 30, 2014, Goldman Sachs earned $1,180, $58,720, $117,617, $13,662, $88,772 and $11,581 in brokerage commissions from portfolio transactions, including futures transactions executed with Goldman Sachs as the Futures Commission Merchant on behalf of the Dynamic Emerging Markets Debt, Emerging Markets Debt, High Yield, Investment Grade Credit, Local Emerging Markets Debt and U.S. Mortgages Funds, respectively.
As of September 30, 2014, the Goldman Sachs Satellite Strategies Portfolio was the beneficial owner of 10% and 7% of total outstanding shares of the Emerging Markets Debt and Local Emerging Markets Debt Funds, respectively.
As of September 30, 2014, the Goldman Sachs Group, Inc. was the beneficial owner of 5% or more of outstanding Class A, Class C, Institutional, Class IR and Class R Shares of the following funds:
| | | | | | | | | | | | | | | | | | | | | | |
| Fund | | | | Class A | | | Class C | | | Institutional | | | Class IR | | | Class R | |
Dynamic Emerging Markets Debt | | | | | 7 | % | | | 8 | % | | | 35 | % | | | 100 | % | | | 100 | % |
High Yield Floating Rate | | | | | — | | | | — | | | | — | | | | — | | | | 100 | |
The High Yield Floating Rate Fund invests in the Institutional Shares of the Goldman Sachs High Yield Fund. This Underlying Fund is considered to be affiliated with the Fund. The table below shows the transactions in and earnings from investments in this affiliated Fund for September 30, 2014:
| | | | | | | | | | | | | | | | | | | | | | | | |
| Underlying Fund | | Market
Value
3/31/14 | | | Purchases
at Cost | | | Proceeds
from Sales | | | Net
Realized
Gain (Loss) | | | Net Change in
Unrealized
Gain (Loss) | | | Market
Value
9/30/14 | |
High Yield Fund — Institutional Shares | | $ | 52,062,990 | | | $ | 1,383,579 | | | $ | (11,500,000 | ) | | $ | (295,073 | ) | | $ | (1,115,796 | ) | | $ | 40,535,700 | |
169
GOLDMAN SACHS SINGLE SECTOR FIXED INCOME FUNDS
Notes to Financial Statements (continued)
September 30, 2014 (Unaudited)
|
| 6. PORTFOLIO SECURITIES TRANSACTIONS |
The cost of purchases and proceeds from sales and maturities of long-term securities for the six months ended September 30, 2014, were as follows:
| | | | | | | | | | | | | | | | | | |
| Fund | | | | Purchases of
U.S. Government and
Agency Obligations | | | Purchases (Excluding
U.S. Government and
Agency Obligations) | | | Sales and
Maturities of
U.S. Government and
Agency Obligations | | | Sales and
Maturities (Excluding
U.S. Government and
Agency Obligations) | |
Dynamic Emerging Markets Debt | | | | $ | — | | | $ | 20,450,485 | | | $ | — | | | $ | 14,777,955 | |
Emerging Markets Debt | | | | | — | | | | 952,002,756 | | | | — | | | | 695,312,618 | |
High Yield | | | | | 304,790,467 | | | | 1,128,886,416 | | | | 306,650,477 | | | | 1,472,654,750 | |
High Yield Floating Rate | | | | | — | | | | 1,577,696,818 | | | | — | | | | 904,788,022 | |
Investment Grade Credit | | | | | 47,057,302 | | | | 112,209,653 | | | | 48,987,264 | | | | 129,177,509 | |
Local Emerging Markets Debt | | | | | 7,888,891 | | | | 1,364,339,726 | | | | 57,960,903 | | | | 1,162,507,897 | |
U.S. Mortgages | | | | | 1,467,204,437 | | | | 5,457,138 | | | | 1,448,498,438 | | | | 992,718 | |
As of the Funds’ most recent fiscal year end, March 31, 2014, the Funds’ timing differences, on a tax basis were as follows:
| | | | | | | | | | | | | | | | | | | | | | | | | | | | |
| | | Dynamic
Emerging
Markets Debt | | | Emerging
Markets Debt | | | High Yield | | | High Yield
Floating Rate | | | Investment
Grade Credit | | | Local Emerging
Markets Debt | | | U.S. Mortgages | |
Capital loss carryforwards | | | | | | | | | | | | | | | | | | | | | | | | | | | | |
Perpetual Short-Term | | $ | (21,452 | ) | | $ | (27,140,420 | ) | | $ | — | | | $ | — | | | $ | — | | | $ | (31,086,348 | ) | | $ | (5,328,747 | ) |
Perpetual Long-Term | | | — | | | | (3,960,660 | ) | | | — | | | | — | | | | — | | | | — | | | | (469,256 | ) |
Total capital loss carryforwards | | $ | (21,452 | ) | | $ | (31,101,080 | ) | | $ | — | | | $ | — | | | $ | — | | | $ | (31,086,348 | ) | | $ | (5,798,003 | ) |
Timing differences (Income Distributions Payable, Qualified Late Year and Straddle Loss Deferrals) | | $ | (236,143 | ) | | $ | (10,996,957 | ) | | $ | (1,535,331 | ) | | $ | (89,623 | ) | | $ | (946,285 | ) | | $ | (170,312,618 | ) | | $ | (111,444 | ) |
As of September 30, 2014, the Funds’ aggregate security unrealized gains and losses based on cost for U.S. federal income tax purposes were as follows:
| | | | | | | | | | | | | | | | | | | | | | | | | | | | |
| | | Dynamic
Emerging
Markets Debt | | | Emerging
Markets Debt | | | High Yield | | | High Yield
Floating Rate | | | Investment
Grade Credit | | | Local Emerging
Markets Debt | | | U.S. Mortgages | |
Tax Cost | | $ | 28,727,580 | | | $ | 1,744,490,319 | | | $ | 4,694,753,582 | | | $ | 5,019,288,026 | | | $ | 453,631,188 | | | $ | 2,003,635,724 | | | $ | 350,206,517 | |
Gross unrealized gain | | | 345,966 | | | | 33,885,541 | | | | 119,071,405 | | | | 8,437,262 | | | | 16,943,158 | | | | 7,540,501 | | | | 3,646,273 | |
Gross unrealized loss | | | (1,028,341 | ) | | | (44,846,026 | ) | | | (104,920,594 | ) | | | (76,925,169 | ) | | | (3,567,721 | ) | | | (183,997,207 | ) | | | (1,516,917 | ) |
Net unrealized gain (loss) | | $ | (682,375 | ) | | $ | (10,960,485 | ) | | $ | 14,150,811 | | | $ | (68,487,907 | ) | | $ | 13,375,437 | | | $ | (176,456,706 | ) | | $ | 2,129,356 | |
170
GOLDMAN SACHS SINGLE SECTOR FIXED INCOME FUNDS
|
| 7. TAX INFORMATION (continued) |
The difference between GAAP-basis and tax-basis unrealized gains (losses) is attributable primarily to wash sales, and differences related to the tax treatment of inflation protected securities, swap transactions, non-deliverable bond forwards, and material modification of debt securities.
GSAM has reviewed the Funds’ tax positions for all open tax years (the current and prior three years, as applicable) and has concluded that no provision for income tax is required in the Funds’ financial statements. Such open tax years remain subject to examination and adjustment by tax authorities.
The Funds’ risks include, but are not limited to, the following:
Foreign Custody Risk — A Fund that invests in foreign securities may hold such securities and foreign currency with foreign banks, agents, and securities depositories appointed by the Fund’s custodian (each a “Foreign Custodian”). Some foreign custodians may be recently organized or new to the foreign custody business. In some countries, Foreign Custodians may be subject to little or no regulatory oversight or independent evaluation of their operations. Further, the laws of certain countries may place limitations on a Fund’s ability to recover its assets if a Foreign Custodian enters bankruptcy. Investments in emerging markets may be subject to greater custody risks than investments in more developed markets. Custody services in emerging market countries are very often undeveloped and may be considerably less well regulated than in more developed countries, and thus may not afford the same level of investor protection as would apply in developed countries.
Large Shareholder Transactions Risk — A Fund may experience adverse effects when certain large shareholders, such as other funds, institutional investors (including those trading by use of non-discretionary mathematical formulas), financial intermediaries (who may make investment decisions on behalf of underlying clients and/or include a Fund in their investment model), individuals, accounts and Goldman Sachs affiliates, purchase or redeem large amounts of shares of a Fund. Such large shareholder redemptions may cause the Fund to sell portfolio securities at times when it would not otherwise do so, which may negatively impact a Fund’s NAV and liquidity. Similarly, large Fund share purchases may adversely affect a Fund’s performance to the extent that a Fund is delayed in investing new cash and is required to maintain a larger cash position than it ordinarily would. These transactions may also accelerate the realization of taxable income to shareholders if such sales of investments resulted in gains, and may also increase transaction costs. In addition, a large redemption could result in a Fund’s current expenses being allocated over a smaller asset base, leading to an increase in the Fund’s expense ratio.
Investments in Other Investment Companies — As a shareholder of another investment company, including an exchange traded fund (“ETF”), a Fund will directly bear its proportionate share of any management fees and other expenses paid by such other investment companies, in addition to the fees and expenses regularly borne by the Fund. ETFs are subject to risks that do not apply to conventional mutual funds, including but not limited to the following: (i) the market price of the ETF’s shares may trade at a premium or a discount to their NAV; and (ii) an active trading market for an ETF’s shares may not develop or be maintained.
Liquidity Risk — The Funds may make investments that are illiquid or that may become less liquid in response to market developments or adverse investor perceptions. Illiquid investments may be more difficult to value. Liquidity risk may also refer to the risk that a Fund will not be able to pay redemption proceeds within the allowable time period because of unusual market conditions, an unusually high volume of redemption requests, or other reasons. To meet redemption requests, a Fund may be forced to sell investments at an unfavorable time and/or under unfavorable conditions. Liquidity risk may be the result of, among other things, the reduced number and capacity of traditional market participants to make a market in fixed income securities or the lack of an active market. The potential for liquidity risk may be magnified by a rising interest rate environment or other circumstances where investor redemptions from fixed income mutual funds may be higher than normal, potentially causing increased supply in the market due to selling activity.
171
GOLDMAN SACHS SINGLE SECTOR FIXED INCOME FUNDS
Notes to Financial Statements (continued)
September 30, 2014 (Unaudited)
|
| 8. OTHER RISKS (continued) |
Market and Credit Risks — In the normal course of business, the Funds trade financial instruments and enter into financial transactions where risk of potential loss exists due to changes in the market (market risk). Additionally, the Funds may also be exposed to credit risk in the event that an issuer or guarantor fails to perform or that an institution or entity with which the Funds have unsettled or open transactions defaults.
Investing in foreign markets may involve special risks and considerations not typically associated with investing in the U.S. Foreign securities may be subject to risk of loss because of more or less foreign government regulation, less public information and less economic, political and social stability in the countries in which the Fund invests. Loss may also result from the imposition of exchange controls, confiscations and other government restrictions by the United States or other governments, or from problems in registration, settlement or custody. Foreign risk also involves the risk of negative foreign currency rate fluctuations, which may cause the value of securities denominated in such foreign currency (or other instruments through which the Fund has exposure to foreign currencies) to decline in value. Currency exchange rates may fluctuate significantly over short periods of time. To the extent that the Fund also invests in securities of issuers located in emerging markets, these risks may be more pronounced.
Non-Diversification Risk — Each of the Dynamic Emerging Markets Debt Fund, Emerging Markets Debt Fund and Local Emerging Markets Debt Fund is non-diversified, meaning that they are permitted to invest a larger percentage of their assets in fewer issuers than diversified mutual funds. Thus, a Fund may be more susceptible to adverse developments affecting any single issuer held in its portfolio, and may be more susceptible to greater losses because of these developments.
Portfolio Concentration Risk — As a result of certain of the Funds’ ability to invest a large percentage of their assets in obligations of issuers within the same country, state, region, currency or economic sector, an adverse economic, business or political development may affect the value of the Funds’ investments more than if their investments were not so concentrated.
Redemption Proceeds Risk — The High Yield Floating Rate Fund may at times purchase securities with settlement periods that are longer than the time period required to pay redemption proceeds. In unusual circumstances, the High Yield Floating Rate Fund may pay redemption proceeds up to seven calendar days following receipt of a properly executed redemption request.
Under the Trust’s organizational documents, its Trustees, officers, employees and agents are indemnified, to the extent permitted by the Act and state law, against certain liabilities that may arise out of performance of their duties to the Funds. Additionally, in the course of business, the Funds enter into contracts that contain a variety of indemnification clauses. The Funds’ maximum exposure under these arrangements is unknown, as this would involve future claims that may be made against the Funds that have not yet occurred. However, GSAM believes the risk of loss under these arrangements to be remote.
172
GOLDMAN SACHS SINGLE SECTOR FIXED INCOME FUNDS
At a meeting held on August 13-14, 2014, the Board of Trustees of the Goldman Sachs Trust approved the early conversion of each Fund’s Class B Shares into Class A Shares.
Accordingly, effective at the close of business on November 14, 2014 (the “Conversion Date”), Class B Shares of each Fund will convert to Class A Shares of the Fund, including Class B Shares that are scheduled to convert on a later date. No CDSCs will be assessed in connection with this early conversion. In addition, effective October 15, 2014, redemptions of a Fund’s Class B Shares before the Conversion Date will not be subject to a CDSC.
Subsequent events after the Statement of Assets and Liabilities date have been evaluated through the date the financial statements were issued. GSAM has concluded that there is no impact requiring adjustment or disclosure in the financial statements.
173
GOLDMAN SACHS SINGLE SECTOR FIXED INCOME FUNDS
Notes to Financial Statements (continued)
September 30, 2014 (Unaudited)
|
| 12. SUMMARY OF SHARE TRANSACTIONS |
Share activity is as follows:
| | | | | | | | | | | | | | | | |
| | | Dynamic Emerging Markets Debt Fund | |
| | | | |
| | | For the Six Months Ended
September 30, 2014
(Unaudited) | | | For the Period Ended
March 31, 2014(a) | |
| | | | |
| | | Shares | | | Dollars | | | Shares | | | Dollars | |
| | | | |
| Class A Shares | | | | | | | | | | | | | | | | |
Shares sold | | | 14,531 | | | $ | 138,169 | | | | 10,314 | | | $ | 98,024 | |
Reinvestment of distributions | | | 153 | | | | 1,460 | | | | 204 | | | | 1,901 | |
Shares redeemed | | | (9,585 | ) | | | (92,534 | ) | | | (5 | ) | | | (33 | ) |
| | | | 5,099 | | | | 47,095 | | | | 10,513 | | | | 99,892 | |
| Class C Shares | | | | | | | | | | | | | | | | |
Shares sold | | | 6,046 | | | | 57,386 | | | | 6,236 | | | | 58,905 | |
Reinvestment of distributions | | | 188 | | | | 1,810 | | | | 76 | | | | 706 | |
Shares redeemed | | | (147 | ) | | | (1,416 | ) | | | (47 | ) | | | (434 | ) |
| | | | 6,087 | | | | 57,780 | | | | 6,265 | | | | 59,177 | |
| Institutional Shares | | | | | | | | | | | | | | | | |
Shares sold | | | 548,597 | | | | 5,264,760 | | | | 2,965,055 | | | | 28,694,887 | |
Reinvestment of distributions | | | 38,128 | | | | 365,788 | | | | 40,941 | | | | 383,555 | |
Shares redeemed | | | (105,692 | ) | | | (1,017,622 | ) | | | (456,341 | ) | | | (4,324,203 | ) |
| | | | 481,033 | | | | 4,612,926 | | | | 2,549,655 | | | | 24,754,239 | |
| Class IR Shares | | | | | | | | | | | | | | | | |
Shares sold | | | — | | | | — | | | | 4,387 | | | | 43,010 | |
Reinvestment of distributions | | | 57 | | | | 544 | | | | 122 | | | | 1,141 | |
Shares redeemed | | | — | | | | — | | | | (1,913 | ) | | | (17,777 | ) |
| | | | 57 | | | | 544 | | | | 2,596 | | | | 26,374 | |
| Class R Shares | | | | | | | | | | | | | | | | |
Shares sold | | | — | | | | — | | | | 2,501 | | | | 25,010 | |
Reinvestment of distributions | | | 50 | | | | 482 | | | | 86 | | | | 807 | |
Shares redeemed | | | — | | | | — | | | | (1 | ) | | | (5 | ) |
| | | | 50 | | | | 482 | | | | 2,586 | | | | 25,812 | |
NET INCREASE | | | 492,326 | | | $ | 4,718,827 | | | | 2,571,615 | | | $ | 24,965,494 | |
| (a) | | Commenced operations on May 31, 2013. |
174
GOLDMAN SACHS SINGLE SECTOR FIXED INCOME FUNDS
|
| 12. SUMMARY OF SHARE TRANSACTIONS (continued) |
Share activity is as follows:
| | | | | | | | | | | | | | | | |
| | | Emerging Markets Debt Fund | |
| | | | |
| | | For the Six Months Ended
September 30, 2014
(Unaudited) | | | For the Fiscal Year Ended
March 31, 2014 | |
| | | | |
| | | Shares | | | Dollars | | | Shares | | | Dollars | |
| | | | |
| Class A Shares | | | | | | | | | | | | | | | | |
Shares sold | | | 2,380,914 | | | $ | 30,321,371 | | | | 5,476,000 | | | $ | 68,635,660 | |
Reinvestment of distributions | | | 151,947 | | | | 1,939,176 | | | | 645,714 | | | | 7,983,559 | |
Shares redeemed | | | (3,700,476 | ) | | | (47,225,933 | ) | | | (13,915,087 | ) | | | (172,716,966 | ) |
| | | | (1,167,615 | ) | | | (14,965,386 | ) | | | (7,793,373 | ) | | | (96,097,747 | ) |
| Class C Shares | | | | | | | | | | | | | | | | |
Shares sold | | | 218,501 | | | | 2,783,555 | | | | 733,439 | | | | 9,162,721 | |
Reinvestment of distributions | | | 33,426 | | | | 426,399 | | | | 122,023 | | | | 1,501,171 | |
Shares redeemed | | | (278,280 | ) | | | (3,542,505 | ) | | | (2,003,027 | ) | | | (24,733,216 | ) |
| | | | (26,353 | ) | | | (332,551 | ) | | | (1,147,565 | ) | | | (14,069,324 | ) |
| Institutional Shares | | | | | | | | | | | | | | | | |
Shares sold | | | 31,154,671 | | | | 399,236,792 | | | | 60,306,035 | | | | 760,543,750 | |
Reinvestment of distributions | | | 2,352,646 | | | | 30,079,361 | | | | 6,253,957 | | | | 77,104,243 | |
Shares redeemed | | | (10,433,563 | ) | | | (133,058,521 | ) | | | (62,140,571 | ) | | | (775,261,888 | ) |
| | | | 23,073,754 | | | | 296,257,632 | | | | 4,419,421 | | | | 62,386,105 | |
| Class IR Shares | | | | | | | | | | | | | | | | |
Shares sold | | | 361,630 | | | | 4,612,439 | | | | 1,101,269 | | | | 13,727,778 | |
Reinvestment of distributions | | | 28,271 | | | | 361,332 | | | | 93,275 | | | | 1,153,042 | |
Shares redeemed | | | (314,400 | ) | | | (4,032,825 | ) | | | (1,663,968 | ) | | | (20,505,514 | ) |
| | | | 75,501 | | | | 940,946 | | | | (469,424 | ) | | | (5,624,694 | ) |
NET INCREASE (DECREASE) | | | 21,955,287 | | | $ | 281,900,641 | | | | (4,990,941 | ) | | $ | (53,405,660 | ) |
175
GOLDMAN SACHS SINGLE SECTOR FIXED INCOME FUNDS
Notes to Financial Statements (continued)
September 30, 2014 (Unaudited)
|
| 12. SUMMARY OF SHARE TRANSACTIONS (continued) |
Share activity is as follows:
| | | | | | | | | | | | | | | | |
| | | High Yield Fund | |
| | | | |
| | | For the Six Months Ended
September 30, 2014
(Unaudited) | | | For the Fiscal Year Ended
March 31, 2014 | |
| | | | |
| | | Shares | | | Dollars | | | Shares | | | Dollars | |
| | | | |
| Class A Shares | | | | | | | | | | | | | | | | |
Shares sold | | | 4,300,117 | | | $ | 31,006,530 | | | | 26,116,314 | | | $ | 190,173,468 | |
Reinvestment of distributions | | | 1,794,716 | | | | 12,890,615 | | | | 7,042,682 | | | | 50,738,541 | |
Shares converted from Class B(a) | | | 38,569 | | | | 278,458 | | | | 116,037 | | | | 838,884 | |
Shares redeemed | | | (24,908,734 | ) | | | (177,981,796 | ) | | | (35,179,533 | ) | | | (255,306,320 | ) |
| | | | (18,775,332 | ) | | | (133,806,193 | ) | | | (1,904,500) | | | | (13,555,427 | ) |
| Class B Shares | | | | | | | | | | | | | | | | |
Shares sold | | | 13,033 | | | | 94,221 | | | | 54,650 | | | | 398,826 | |
Reinvestment of distributions | | | 30,109 | | | | 216,735 | | | | 169,237 | | | | 1,222,855 | |
Shares converted to Class A(a) | | | (38,479 | ) | | | (278,458 | ) | | | (115,762 | ) | | | (838,884 | ) |
Shares redeemed | | | (393,795 | ) | | | (2,839,960 | ) | | | (1,245,436 | ) | | | (9,045,688 | ) |
| | | | (389,132 | ) | | | (2,807,462 | ) | | | (1,137,311 | ) | | | (8,262,891 | ) |
| Class C Shares | | | | | | | | | | | | | | | | |
Shares sold | | | 577,029 | | | | 4,170,049 | | | | 1,169,792 | | | | 8,483,154 | |
Reinvestment of distributions | | | 217,649 | | | | 1,564,781 | | | | 897,865 | | | | 6,477,147 | |
Shares redeemed | | | (1,476,947 | ) | | | (10,649,188 | ) | | | (4,150,018 | ) | | | (30,226,109 | ) |
| | | | (682,269 | ) | | | (4,914,358 | ) | | | (2,082,361 | ) | | | (15,265,808 | ) |
| Institutional Shares | | | | | | | | | | | | | | | | |
Shares sold | | | 60,325,475 | | | | 434,434,152 | | | | 145,286,769 | | | | 1,057,657,995 | |
Reinvestment of distributions | | | 15,685,072 | | | | 112,968,946 | | | | 60,299,396 | | | | 436,017,161 | |
Shares redeemed | | | (98,729,894 | ) | | | (712,481,729 | ) | | | (290,495,097 | ) | | | (2,117,148,978 | ) |
| | | | (22,719,347 | ) | | | (165,078,631 | ) | | | (84,908,932 | ) | | | (623,473,822 | ) |
| Service Shares | | | | | | | | | | | | | | | | |
Shares sold | | | 203,558 | | | | 1,464,476 | | | | 402,167 | | | | 2,926,992 | |
Reinvestment of distributions | | | 51,334 | | | | 368,244 | | | | 194,448 | | | | 1,399,958 | |
Shares redeemed | | | (305,765 | ) | | | (2,199,157 | ) | | | (604,016 | ) | | | (4,380,552 | ) |
| | | | (50,873 | ) | | | (366,437 | ) | | | (7,401 | ) | | | (53,602 | ) |
| Class IR Shares | | | | | | | | | | | | | | | | |
Shares sold | | | 402,807 | | | | 2,902,268 | | | | 352,914 | | | | 2,572,225 | |
Reinvestment of distributions | | | 60,010 | | | | 431,658 | | | | 210,987 | | | | 1,524,943 | |
Shares redeemed | | | (351,444 | ) | | | (2,529,073 | ) | | | (1,133,431 | ) | | | (8,289,374 | ) |
| | | | 111,373 | | | | 804,853 | | | | (569,530 | ) | | | (4,192,206 | ) |
| Class R Shares | | | | | | | | | | | | | | | | |
Shares sold | | | 261,199 | | | | 1,884,294 | | | | 520,094 | | | | 3,768,697 | |
Reinvestment of distributions | | | 63,596 | | | | 456,519 | | | | 224,023 | | | | 1,614,232 | |
Shares redeemed | | | (293,745 | ) | | | (2,109,496 | ) | | | (754,323 | ) | | | (5,475,306 | ) |
| | | | 31,050 | | | | 231,317 | | | | (10,206 | ) | | | (92,377 | ) |
NET DECREASE | | | (42,474,530 | ) | | $ | (305,936,911 | ) | | | (90,620,241 | ) | | $ | (664,896,133 | ) |
| (a) | | Class B Shares convert into Class A Shares on or about the fifteenth day of the last month of the calendar quarter that is eight years after the initial purchase date of either the Fund or another Goldman Sachs Fund. At a meeting held on August 13-14, 2014, the Board of Trustees of the Goldman Sachs Trust approved the early conversion of Class B Shares into Class A Shares. Accordingly, effective at the close of business on November 14, 2014, Class B shares will convert to Class A shares of the Fund, and no Contingent Deferred Sales Charges (“CSDCs”) will be assessed in connection with the redemptions of the Fund’s Class B Shares prior to this date. |
176
GOLDMAN SACHS SINGLE SECTOR FIXED INCOME FUNDS
|
| 12. SUMMARY OF SHARE TRANSACTIONS (continued) |
Share activity is as follows:
| | | | | | | | | | | | | | | | |
| | | High Yield Floating Rate Fund | |
| | | | |
| | | For the Six Months Ended
September 30, 2014
(Unaudited) | | | For the Fiscal Year Ended
March 31, 2014 | |
| | | | |
| | | Shares | | | Dollars | | | Shares | | | Dollars | |
| | | | |
| Class A Shares | | | | | | | | | | | | | | | | |
Shares sold | | | 313,322 | | | $ | 3,146,758 | | | | 4,388,071 | | | $ | 44,286,380 | |
Reinvestment of distributions | | | 30,082 | | | | 302,079 | | | | 74,210 | | | | 747,423 | |
Shares redeemed | | | (2,172,132 | ) | | | (21,754,436 | ) | | | (2,833,756 | ) | | | (28,584,432 | ) |
| | | | (1,828,728 | ) | | | (18,305,599 | ) | | | 1,628,525 | | | | 16,449,371 | |
| Class C Shares | | | | | | | | | | | | | | | | |
Shares sold | | | 29,253 | | | | 294,757 | | | | 186,705 | | | | 1,881,240 | |
Reinvestment of distributions | | | 2,799 | | | | 28,060 | | | | 6,022 | | | | 60,703 | |
Shares redeemed | | | (35,041 | ) | | | (352,182 | ) | | | (110,996 | ) | | | (1,117,793 | ) |
| | | | (2,989 | ) | | | (29,365 | ) | | | 81,731 | | | | 824,150 | |
| Institutional Shares | | | | | | | | | | | | | | | | |
Shares sold | | | 112,623,503 | | | | 1,131,168,290 | | | | 308,612,494 | | | | 3,117,875,785 | |
Reinvestment of distributions | | | 8,044,966 | | | | 80,727,159 | | | | 10,684,489 | | | | 107,805,422 | |
Shares redeemed | | | (56,653,815 | ) | | | (568,869,544 | ) | | | (74,620,425 | ) | | | (753,300,554 | ) |
| | | | 64,014,654 | | | | 643,025,905 | | | | 244,676,558 | | | | 2,472,380,653 | |
| Class IR Shares | | | | | | | | | | | | | | | | |
Shares sold | | | 397 | | | | 4,001 | | | | 186,005 | | | | 1,884,117 | |
Reinvestment of distributions | | | 1,988 | | | | 19,978 | | | | 16,842 | | | | 170,044 | |
Shares redeemed | | | (74,966 | ) | | | (755,125 | ) | | | (447,546 | ) | | | (4,531,159 | ) |
| | | | (72,581 | ) | | | (731,146 | ) | | | (244,699 | ) | | | (2,476,998 | ) |
| Class R Shares | | | | | | | | | | | | | | | | |
Reinvestment of distributions | | | 17 | | | | 171 | | | | 34 | | | | 349 | |
| | | | 17 | | | | 171 | | | | 34 | | | | 349 | |
NET INCREASE | | | 62,110,373 | | | $ | 623,959,966 | | | | 246,142,149 | | | $ | 2,487,177,525 | |
177
GOLDMAN SACHS SINGLE SECTOR FIXED INCOME FUNDS
Notes to Financial Statements (continued)
September 30, 2014 (Unaudited)
|
| 12. SUMMARY OF SHARE TRANSACTIONS (continued) |
Share activity is as follows:
| | | | | | | | | | | | | | | | |
| | | Investment Grade Credit Fund | |
| | | | |
| | | For the Six Months Ended
September 30, 2014
(Unaudited) | | | For the Fiscal Year Ended
March 31, 2014 | |
| | | | |
| | | Shares | | | Dollars | | | Shares | | | Dollars | |
| | | | |
| Class A Shares | | | | | | | | | | | | | | | | |
Shares sold | | | 343,178 | | | $ | 3,270,186 | | | | 1,008,615 | | | $ | 9,419,921 | |
Reinvestment of distributions | | | 39,976 | | | | 381,747 | | | | 129,280 | | | | 1,206,568 | |
Shares redeemed | | | (381,058 | ) | | | (3,624,692 | ) | | | (1,604,127 | ) | | | (15,063,151 | ) |
| | | | 2,096 | | | | 27,241 | | | | (466,232 | ) | | | (4,436,662 | ) |
| Institutional Shares | | | | | | | | | | | | | | | | |
Shares sold | | | 1,501,956 | | | | 14,246,901 | | | | 2,584,816 | | | | 24,449,074 | |
Reinvestment of distributions | | | 299,765 | | | | 2,864,118 | | | | 1,126,629 | | | | 10,533,768 | |
Shares redeemed | | | (2,053,947 | ) | | | (19,569,420 | ) | | | (14,284,235 | ) | | | (133,976,679 | ) |
| | | | (252,226 | ) | | | (2,458,401 | ) | | | (10,572,790 | ) | | | (98,993,837 | ) |
| Separate Account Institutional Shares | | | | | | | | | | | | | | | | |
Shares sold | | | 2,556,098 | | | | 24,290,379 | | | | 10,020,923 | | | | 94,181,701 | |
Reinvestment of distributions | | | 449,860 | | | | 4,298,747 | | | | 1,257,905 | | | | 11,750,626 | |
Shares redeemed | | | (3,700,348 | ) | | | (35,340,404 | ) | | | (10,494,629 | ) | | | (98,549,415 | ) |
| | | | (694,390 | ) | | | (6,751,278 | ) | | | 784,199 | | | | 7,382,912 | |
| Class IR Shares | | | | | | | | | | | | | | | | |
Shares sold | | | 26,417 | | | | 250,892 | | | | 59,675 | | | | 558,045 | |
Reinvestment of distributions | | | 1,248 | | | | 11,933 | | | | 663 | | | | 6,258 | |
Shares redeemed | | | (6,583 | ) | | | (62,833 | ) | | | (75,979 | ) | | | (744,558 | ) |
| | | | 21,082 | | | | 199,992 | | | | (15,641 | ) | | | (180,255 | ) |
NET DECREASE | | | (923,438 | ) | | $ | (8,982,446 | ) | | | (10,270,464 | ) | | $ | (96,227,842 | ) |
178
GOLDMAN SACHS SINGLE SECTOR FIXED INCOME FUNDS
|
| 12. SUMMARY OF SHARE TRANSACTIONS (continued) |
Share activity is as follows:
| | | | | | | | | | | | | | | | |
| | | Local Emerging Markets Debt Fund | |
| | | | |
| | | For the Six Months Ended
September 30, 2014
(Unaudited) | | | For the Fiscal Year Ended
March 31, 2014 | |
| | | | |
| | | Shares | | | Dollars | | | Shares | | | Dollars | |
| | | | |
| Class A Shares | | | | | | | | | | | | | | | | |
Shares sold | | | 1,035,552 | | | $ | 8,811,572 | | | | 6,284,912 | | | $ | 56,480,510 | |
Reinvestment of distributions | | | 271,193 | | | | 2,297,985 | | | | 741,320 | | | | 6,473,731 | |
Shares redeemed | | | (3,640,185 | ) | | | (30,990,990 | ) | | | (15,143,371 | ) | | | (131,373,759 | ) |
| | | | (2,333,440 | ) | | | (19,881,433 | ) | | | (8,117,139 | ) | | | (68,419,518 | ) |
| Class C Shares | | | | | | | | | | | | | | | | |
Shares sold | | | 67,358 | | | | 574,513 | | | | 486,945 | | | | 4,533,038 | |
Reinvestment of distributions | | | 37,629 | | | | 319,364 | | | | 97,061 | | | | 847,962 | |
Shares redeemed | | | (388,638 | ) | | | (3,320,155 | ) | | | (1,792,597 | ) | | | (15,468,125 | ) |
| | | | (283,651 | ) | | | (2,426,278 | ) | | | (1,208,591 | ) | | | (10,087,125 | ) |
| Institutional Shares | | | | | | | | | | | | | | | | |
Shares sold | | | 32,938,701 | | | | 279,599,364 | | | | 132,476,395 | | | | 1,201,006,653 | |
Reinvestment of distributions | | | 6,056,016 | | | | 51,274,101 | | | | 14,058,396 | | | | 122,914,528 | |
Shares redeemed | | | (25,671,350 | ) | | | (218,067,845 | ) | | | (268,161,822 | ) | | | (2,318,984,411 | ) |
| | | | 13,323,367 | | | | 112,805,620 | | | | (121,627,031 | ) | | | (995,063,230 | ) |
| Class IR Shares | | | | | | | | | | | | | | | | |
Shares sold | | | 39,605 | | | | 338,080 | | | | 1,227,400 | | | | 11,248,182 | |
Reinvestment of distributions | | | 19,248 | | | | 163,231 | | | | 82,060 | | | | 721,148 | |
Shares redeemed | | | (327,061 | ) | | | (2,790,944 | ) | | | (2,568,028 | ) | | | (21,871,814 | ) |
| | | | (268,208 | ) | | | (2,289,633 | ) | | | (1,258,568 | ) | | | (9,902,484 | ) |
NET INCREASE (DECREASE) | | | 10,438,068 | | | $ | 88,208,276 | | | | (132,211,329 | ) | | $ | (1,083,472,357 | ) |
179
GOLDMAN SACHS SINGLE SECTOR FIXED INCOME FUNDS
Notes to Financial Statements (continued)
September 30, 2014 (Unaudited)
|
| 12. SUMMARY OF SHARE TRANSACTIONS (continued) |
Share activity is as follows:
| | | | | | | | | | | | | | | | |
| | | U.S. Mortgages Fund | |
| | | | |
| | | For the Six Months Ended
September 30, 2014
(Unaudited) | | | For the Fiscal Year Ended
March 31, 2014 | |
| | | | |
| | | Shares | | | Dollars | | | Shares | | | Dollars | |
| | | | |
| Class A Shares | | | | | | | | | | | | | | | | |
Shares sold | | | 349,045 | | | $ | 3,686,211 | | | | 336,808 | | | $ | 3,503,931 | |
Reinvestment of distributions | | | 4,997 | | | | 52,894 | | | | 7,402 | | | | 77,335 | |
Shares redeemed | | | (181,363 | ) | | | (1,916,856 | ) | | | (399,302 | ) | | | (4,170,849 | ) |
| | | | 172,679 | | | | 1,822,249 | | | | (55,092 | ) | | | (589,583 | ) |
| Institutional Shares | | | | | | | | | | | | | | | | |
Shares sold | | | 3,380,499 | | | | 35,855,346 | | | | 590,131 | | | | 6,168,943 | |
Reinvestment of distributions | | | 37,599 | | | | 399,008 | | | | 29,405 | | | | 307,733 | |
Shares redeemed | | | (497,669 | ) | | | (5,273,970 | ) | | | (789,196 | ) | | | (8,298,066 | ) |
| | | | 2,920,429 | | | | 30,980,384 | | | | (169,660 | ) | | | (1,821,390 | ) |
| Class IR Shares | | | | | | | | | | | | | | | | |
Shares sold | | | 143,929 | | | | 1,527,938 | | | | 1,424 | | | | 14,939 | |
Reinvestment of distributions | | | 412 | | | | 4,369 | | | | 25 | | | | 267 | |
Shares redeemed | | | (153 | ) | | | (1,628 | ) | | | (4 | ) | | | (39 | ) |
| | | | 144,188 | | | | 1,530,679 | | | | 1,445 | | | | 15,167 | |
| Separate Account Institutional Shares | | | | | | | | | | | | | | | | |
Shares sold | | | 878,051 | | | | 9,276,897 | | | | 5,198,994 | | | | 54,060,111 | |
Reinvestment of distributions | | | 209,001 | | | | 2,211,325 | | | | 478,984 | | | | 5,002,797 | |
Shares redeemed | | | (2,351,277 | ) | | | (24,852,713 | ) | | | (13,319,436 | ) | | | (138,673,615 | ) |
| | | | (1,264,225 | ) | | | (13,364,491 | ) | | | (7,641,458 | ) | | | (79,610,707 | ) |
NET INCREASE (DECREASE) | | | 1,973,071 | | | $ | 20,968,821 | | | | (7,864,765 | ) | | $ | (82,006,513 | ) |
180
GOLDMAN SACHS SINGLE SECTOR FIXED INCOME FUNDS
Fund Expenses — Six Month Period Ended September 30, 2014 (Unaudited)
As a shareholder of Class A, Class B, Class C, Institutional, Service, Separate Account Institutional, Class IR or Class R Shares of a Fund, you incur two types of costs: (1) transaction costs, including sales charges on purchase payments (with respect to Class A Shares), contingent deferred sales charges on redemptions (with respect to Class B and Class C Shares), and (2) ongoing costs, including management fees; distribution and service (12b-1) fees (with respect to Class A, Class B, Class C and Class R Shares); and other Fund expenses. This Example is intended to help you understand your ongoing costs (in dollars) of investing in Class A, Class B, Class C, Institutional, Service, Separate Account Institutional, Class IR or Class R Shares of the Funds and to compare these costs with the ongoing costs of investing in other mutual funds.
The Example is based on an investment of $1,000 invested at the beginning of the period and held for the entire period from April 1, 2014 through September 30, 2014.
Actual Expenses — The first line under each share class in the table below provides information about actual account values and actual expenses. You may use the information in this line, together with the amount you invested, to estimate the expenses that you paid over the period. Simply divide your account value by $1,000 (for example, an $8,600 account value divided by $1,000=8.6), then multiply the result by the number in the first line under the heading entitled “Expenses Paid” to estimate the expenses you paid on your account during this period.
Hypothetical Example for Comparison Purposes — The second line under each share class in the table below provides information about hypothetical account values and hypothetical expenses based on the Funds’ actual net expense ratios and an assumed rate of return of 5% per year before expenses, which is not the Funds’ actual return. The hypothetical account values and expenses may not be used to estimate the actual ending account balance or expenses you paid for the period. You may use this information to compare the ongoing costs of investing in the Funds and other funds. To do so, compare this 5% hypothetical example with the 5% hypothetical examples that appear in the shareholder reports of the other funds.
Please note that the expenses shown in the table are meant to highlight your ongoing costs only and do not reflect any transactional costs, such as sales charges, redemption fees, or exchange fees. Therefore, the second line of the table is useful in comparing ongoing costs only, and will not help you determine the relative total costs of owning different funds. In addition, if these transactional costs were included, your costs would have been higher.
| | | | | | | | | | | | | | | | | | | | | | | | | | | | | | | | | | | | | | | | | | | | | | | | |
| | | Dynamic Emerging Markets Debt Fund | | | Emerging Markets Debt Fund | | | High Yield Fund | | | High Yield Floating Rate Fund | |
| Share Class | | Beginning
Account
Value
4/1/14 | | | Ending
Account
Value
9/30/14 | | | Expenses
Paid for
the
6 months
ended
9/30/14* | | | Beginning
Account
Value
4/1/14 | | | Ending
Account
Value
9/30/14 | | | Expenses
Paid for
the
6 months
ended
9/30/14* | | | Beginning
Account
Value
4/1/14 | | | Ending
Account
Value
9/30/14 | | | Expenses
Paid for
the
6 months
ended
9/30/14* | | | Beginning
Account
Value
4/1/14 | | | Ending
Account
Value
9/30/14 | | | Expenses
Paid for
the
6 months
ended
9/30/14* | |
| Class A | | | | | | | | | | | | | | | | | | | | | | | | | | | | | | | | | | | | | | | | | | | | | | | | |
Actual | | $ | 1,000.00 | | | $ | 1,005.60 | | | $ | 6.39 | | | $ | 1,000.00 | | | $ | 1,041.90 | | | $ | 6.40 | | | $ | 1,000.00 | | | $ | 997.00 | | | $ | 5.31 | | | $ | 1,000.00 | | | $ | 1,001.60 | | | $ | 4.72 | |
Hypothetical 5% return | | | 1,000.00 | | | | 1,018.70 | + | | | 6.43 | | | | 1,000.00 | | | | 1,018.80 | + | | | 6.33 | | | | 1,000.00 | | | | 1,019.75 | + | | | 5.37 | | | | 1,000.00 | | | | 1,020.36 | + | | | 4.76 | |
| Class B | | | | | | | | | | | | | | | | | | | | | | | | | | | | | | | | | | | | | | | | | | | | | | | | |
Actual | | | N/A | | | | N/A | | | | N/A | | | | N/A | | | | N/A | | | | N/A | | | | 1,000.00 | | | | 993.40 | | | | 9.04 | | | | N/A | | | | N/A | | | | N/A | |
Hypothetical 5% return | | | N/A | | | | N/A | | | | N/A | | | | N/A | | | | N/A | | | | N/A | | | | 1,000.00 | | | | 1,015.99 | + | | | 9.15 | | | | N/A | | | | N/A | | | | N/A | |
| Class C | | | | | | | | | | | | | | | | | | | | | | | | | | | | | | | | | | | | | | | | | | | | | | | | |
Actual | | | 1,000.00 | | | | 1,003.90 | | | | 10.05 | | | | 1,000.00 | | | | 1,038.80 | | | | 10.22 | | | | 1,000.00 | | | | 993.30 | | | | 9.04 | | | | 1,000.00 | | | | 996.80 | | | | 8.46 | |
Hypothetical 5% return | | | 1,000.00 | | | | 1,015.04 | + | | | 10.10 | | | | 1,000.00 | | | | 1,015.04 | + | | | 10.10 | | | | 1,000.00 | | | | 1,015.99 | + | | | 9.15 | | | | 1,000.00 | | | | 1,016.59 | + | | | 8.54 | |
| Institutional | | | | | | | | | | | | | | | | | | | | | | | | | | | | | | | | | | | | | | | | | | | | | | | | |
Actual | | | 1,000.00 | | | | 1,009.50 | | | | 4.58 | | | | 1,000.00 | | | | 1,044.40 | | | | 4.66 | | | | 1,000.00 | | | | 998.80 | | | | 3.61 | | | | 1,000.00 | | | | 1,002.30 | | | | 3.01 | |
Hypothetical 5% return | | | 1,000.00 | | | | 1,020.51 | + | | | 4.61 | | | | 1,000.00 | | | | 1,020.51 | + | | | 4.61 | | | | 1,000.00 | | | | 1,021.46 | + | | | 3.65 | | | | 1,000.00 | | | | 1,022.06 | + | | | 3.04 | |
| Service | | | | | | | | | | | | | | | | | | | | | | | | | | | | | | | | | | | | | | | | | | | | | | | | |
Actual | | | N/A | | | | N/A | | | | N/A | | | | N/A | | | | N/A | | | | N/A | | | | 1,000.00 | | | | 996.20 | | | | 6.11 | | | | N/A | | | | N/A | | | | N/A | |
Hypothetical 5% return | | | N/A | | | | N/A | | | | N/A | | | | N/A | | | | N/A | | | | N/A | | | | 1,000.00 | | | | 1,018.95 | + | | | 6.17 | | | | N/A | | | | N/A | | | | N/A | |
| Class IR | | | | | | | | | | | | | | | | | | | | | | | | | | | | | | | | | | | | | | | | | | | | | | | | |
Actual | | | 1,000.00 | | | | 1,008.90 | | | | 5.14 | | | | 1,000.00 | | | | 1,044.00 | | | | 5.12 | | | | 1,000.00 | | | | 998.40 | | | | 4.06 | | | | 1,000.00 | | | | 1,002.90 | | | | 3.51 | |
Hypothetical 5% return | | | 1,000.00 | | | | 1,019.95 | + | | | 5.16 | | | | 1,000.00 | | | | 1,020.05 | + | | | 5.06 | | | | 1,000.00 | | | | 1,021.01 | + | | | 4.10 | | | | 1,000.00 | | | | 1,021.56 | + | | | 3.55 | |
| Class R | | | | | | | | | | | | | | | | | | | | | | | | | | | | | | | | | | | | | | | | | | | | | | | | |
Actual | | | 1,000.00 | | | | 1,006.50 | | | | 7.54 | | | | N/A | | | | N/A | | | | N/A | | | | 1,000.00 | | | | 995.80 | | | | 6.55 | | | | 1,000.00 | | | | 999.40 | | | | 5.81 | |
Hypothetical 5% return | | | 1,000.00 | | | | 1,017.55 | + | | | 7.59 | | | | N/A | | | | N/A | | | | N/A | | | | 1,000.00 | | | | 1,018.50 | + | | | 6.63 | | | | 1,000.00 | | | | 1,019.25 | + | | | 5.87 | |
181
GOLDMAN SACHS SINGLE SECTOR FIXED INCOME FUNDS
Fund Expenses — Six Month Period Ended September 30, 2014 (Unaudited) (continued)
| | | | | | | | | | | | | | | | | | | | | | | | | | | | | | | | | | | | |
| | | Investment Grade Credit Fund | | | Local Emerging Markets Debt Fund | | | U.S. Mortgages Fund | |
| Share Class | | Beginning
Account
Value
4/1/14 | | | Ending
Account
Value
9/30/14 | | | Expenses
Paid for the
6 months ended
9/30/14* | | | Beginning
Account
Value
4/1/14 | | | Ending
Account
Value
9/30/14 | | | Expenses
Paid for the
6 months ended
9/30/14* | | | Beginning
Account
Value
4/1/14 | | | Ending
Account
Value
9/30/14 | | | Expenses
Paid for the
6 months ended
9/30/14* | |
| Class A | | | | | | | | | | | | | | | | | | | | | | | | | | | | | | | | | | | | |
Actual | | $ | 1,000.00 | | | $ | 1,025.40 | | | $ | 3.66 | | | $ | 1,000.00 | | | $ | 980.10 | | | $ | 6.25 | | | $ | 1,000.00 | | | $ | 1,023.70 | | | $ | 3.65 | |
Hypothetical 5% return | | | 1,000.00 | | | | 1,021.46 | + | | | 3.65 | | | | 1,000.00 | | | | 1,018.75 | + | | | 6.38 | | | | 1,000.00 | | | | 1,021.46 | + | | | 3.65 | |
| Class C | | | | | | | | | | | | | | | | | | | | | | | | | | | | | | | | | | | | |
Actual | | | N/A | | | | N/A | | | | N/A | | | | 1,000.00 | | | | 977.70 | | | | 9.97 | | | | N/A | | | | N/A | | | | N/A | |
Hypothetical 5% return | | | N/A | | | | N/A | | | | N/A | | | | 1,000.00 | | | | 1,014.99 | + | | | 10.15 | | | | N/A | | | | N/A | | | | N/A | |
| Institutional | | | | | | | | | | | | | | | | | | | | | | | | | | | | | | | | | | | | |
Actual | | | 1,000.00 | | | | 1,028.30 | | | | 1.98 | | | | 1,000.00 | | | | 981.80 | | | | 4.57 | | | | 1,000.00 | | | | 1,026.40 | | | | 1.93 | |
Hypothetical 5% return | | | 1,000.00 | | | | 1,023.11 | + | | | 1.98 | | | | 1,000.00 | | | | 1,020.46 | + | | | 4.66 | | | | 1,000.00 | | | | 1,023.16 | + | | | 1.93 | |
| Class IR | | | | | | | | | | | | | | | | | | | | | | | | | | | | | | | | | | | | |
Actual | | | 1,000.00 | | | | 1,027.80 | | | | 2.39 | | | | 1,000.00 | | | | 981.30 | | | | 5.02 | | | | 1,000.00 | | | | 1,025.00 | | | | 2.39 | |
Hypothetical 5% return | | | 1,000.00 | | | | 1,022.71 | + | | | 2.38 | | | | 1,000.00 | | | | 1,020.00 | + | | | 5.11 | | | | 1,000.00 | | | | 1,022.71 | + | | | 2.38 | |
| Separate Account Institutional | | | | | | | | | | | | | | | | | | | | | | | | | | | | | | | | | | | | |
Actual | | | 1,000.00 | | | | 1,028.30 | | | | 1.93 | | | | N/A | | | | N/A | | | | N/A | | | | 1,000.00 | | | | 1,025.50 | | | | 1.98 | |
Hypothetical 5% return | | | 1,000.00 | | | | 1,023.16 | + | | | 1.93 | | | | N/A | | | | N/A | | | | N/A | | | | 1,000.00 | | | | 1,023.11 | + | | | 1.98 | |
| * | | Expenses for each share class are calculated using each Fund’s annualized net expense ratio for each class, which represents the ongoing expenses as a percentage of net assets for the six months ended September 30, 2014. Expenses are calculated by multiplying the annualized net expense ratio by the average account value for the period; then multiplying the result by the number of days in the most recent fiscal half year; and then dividing that result by the number of days in the fiscal year. The annualized net expense ratios for the period were as follows: |
| | | | | | | | | | | | | | | | | | | | | | | | | | | | | | | | |
| Fund | | Class A | | | Class B | | | Class C | | | Institutional | | | Service | | | Separate Account
Institutional | | | Class IR | | | Class R | |
Dynamic Emerging Markets Debt | | | 1.27 | % | | | N/A | | | | 2.00 | % | | | 0.91 | % | | | N/A | | | | N/A | | | | 1.02 | % | | | 1.50 | % |
Emerging Markets Debt | | | 1.25 | | | | N/A | | | | 2.00 | | | | 0.91 | | | | N/A | | | | N/A | | | | 1.00 | | | | N/A | |
High Yield | | | 1.06 | | | | 1.81 | % | | | 1.81 | | | | 0.72 | | | | 1.22 | % | | | N/A | | | | 0.81 | | | | 1.31 | |
High Yield Floating Rate | | | 0.94 | | | | N/A | | | | 1.69 | | | | 0.60 | | | | N/A | | | | N/A | | | | 0.70 | | | | 1.16 | |
Investment Grade Credit | | | 0.72 | | | | N/A | | | | N/A | | | | 0.39 | | | | N/A | | | | N/A | | | | 0.47 | | | | N/A | |
Local Emerging Markets Debt | | | 1.26 | | | | N/A | | | | 2.01 | | | | 0.92 | | | | N/A | | | | 0.38 | %�� | | | 1.01 | | | | N/A | |
U.S. Mortgages | | | 0.72 | | | | N/A | | | | N/A | | | | 0.38 | | | | N/A | | | | 0.39 | | | | 0.47 | | | | N/A | |
| + | | Hypothetical expenses are based on each Fund’s actual annualized net expense ratios and an assumed rate of return of 5% per year before expenses. |
182
GOLDMAN SACHS SINGLE SECTOR FIXED INCOME FUNDS
Statement Regarding Basis for Approval of Management Agreement (Unaudited)
Background
The Goldman Sachs Dynamic Emerging Markets Debt Fund, Goldman Sachs Emerging Markets Debt Fund, Goldman Sachs High Yield Fund, Goldman Sachs High Yield Floating Rate Fund, Goldman Sachs Investment Grade Credit Fund, Goldman Sachs Local Emerging Markets Debt Fund, and Goldman Sachs U.S. Mortgages Fund (the “Funds”) are investment portfolios of Goldman Sachs Trust (the “Trust”). The Board of Trustees oversees the management of the Trust and reviews the investment performance and expenses of the Funds at regularly scheduled meetings held during the year. In addition, the Board of Trustees determines annually whether to approve the continuance of the Trust’s investment management agreement (the “Management Agreement”) with Goldman Sachs Asset Management, L.P. (the “Investment Adviser”) on behalf of the Funds.
The Management Agreement was most recently approved for continuation until June 30, 2015 by the Board of Trustees, including those Trustees who are not parties to the Management Agreement or “interested persons” (as defined in the Investment Company Act of 1940, as amended) of any party thereto (the “Independent Trustees”), at a meeting held on June 11-12, 2014 (the “Annual Meeting”).
The review process undertaken by the Trustees spans the course of the year and culminates with the Annual Meeting. To assist the Trustees in their deliberations, the Trustees have established a Contract Review Committee (the “Committee”), comprised of the Independent Trustees. The Committee held four meetings over the course of the year since the Management Agreement was last approved. At those Committee meetings, regularly scheduled Board or other committee meetings and/or the Annual Meeting, the Board, or the Independent Trustees, as applicable, considered matters relating to the Management Agreement, including:
| | (a) | | the nature and quality of the advisory, administrative and other services provided to the Funds by the Investment Adviser and its affiliates, including information about: |
| | (i) | | the structure, staff and capabilities of the Investment Adviser and its portfolio management teams; |
| | (ii) | | the groups within the Investment Adviser and its affiliates that support the portfolio management teams or provide other types of necessary services, including fund services groups (e.g., accounting and financial reporting, tax, shareholder services and operations), controls and risk management groups (e.g., legal, compliance, valuation oversight, credit risk management, internal audit, compliance testing, market risk analysis, finance and strategy and central funding), sales and distribution support groups and others (e.g., information technology and training); |
| | (iii) | | trends in headcount; |
| | (iv) | | the Investment Adviser’s financial resources and ability to hire and retain talented personnel and strengthen its operations; and |
| | (v) | | the parent company’s support of the Investment Adviser and its mutual fund business, as expressed by the firm’s senior management; |
| | (b) | | information on the investment performance of each Fund, including comparisons to the performance of similar mutual funds, as provided by a third party mutual fund data provider engaged as part of the contract review process (the “Outside Data Provider”), benchmark performance indices, and comparable institutional composites managed by the Investment Adviser (in the case of the Dynamic Emerging Markets Debt, Emerging Markets Debt, High Yield, Local Emerging Markets Debt, and U.S. Mortgages Funds), and general investment outlooks in the markets in which the Funds invest; |
| | (c) | | the terms of the Management Agreement and agreements with affiliated service providers entered into by the Trust on behalf of the Funds; |
| | (d) | | expense information for the Funds, including: |
| | (i) | | the relative management fee and expense levels of each Fund as compared to those of comparable funds managed by other advisers, as provided by the Outside Data Provider; |
| | (ii) | | each Fund’s expense trends over time; and |
| | (iii) | | to the extent the Investment Adviser manages institutional accounts or collective investment vehicles having investment objectives and policies similar to those of the Funds, comparative information on the advisory fees charged and services provided to those accounts by the Investment Adviser; |
183
GOLDMAN SACHS SINGLE SECTOR FIXED INCOME FUNDS
Statement Regarding Basis for Approval of Management Agreement (Unaudited) (continued)
| | (e) | | with respect to the extensive investment performance and expense comparison data provided by the Outside Data Provider, its processes in producing that data for the Funds; |
| | (f) | | the undertakings of the Investment Adviser to waive certain fees (with respect to the Dynamic Emerging Markets Debt, Investment Grade Credit, Local Emerging Markets Debt, and U.S. Mortgages Funds) and to limit certain expenses of each Fund that exceed specified levels, and a summary of contractual fee reductions made by the Investment Adviser and/or its affiliates over the past several years with respect to the Funds; |
| | (g) | | information relating to the profitability of the Management Agreement and the transfer agency and distribution and service arrangements of each Fund and the Trust as a whole to the Investment Adviser and its affiliates; |
| | (h) | | whether each Fund’s existing management fee schedule adequately addressed any economies of scale; |
| | (i) | | a summary of the “fall-out” benefits derived by the Investment Adviser and its affiliates from their relationships with the Funds, including the fees received by the Investment Adviser’s affiliates from the Funds for transfer agency, portfolio trading, distribution and other services; |
| | (j) | | a summary of potential benefits derived by the Funds as a result of their relationship with the Investment Adviser; |
| | (k) | | information regarding portfolio trading and how the Investment Adviser carries out its duty to seek best execution; |
| | (l) | | portfolio manager ownership of Fund shares; the manner in which portfolio manager compensation is determined; and the number and types of accounts managed by the portfolio managers; |
| | (m) | | the nature and quality of the services provided to the Funds by their unaffiliated service providers, and the Investment Adviser’s general oversight and evaluation (including reports on due diligence) of those service providers as part of the administration services provided under the Management Agreement; and |
| | (n) | | the Investment Adviser’s processes and policies addressing various types of potential conflicts of interest; its approach to risk management; the annual review of the effectiveness of the Funds’ compliance program; and periodic compliance reports. |
The Trustees also received an overview of the Funds’ distribution arrangements. They received information regarding the Funds’ assets, share purchase and redemption activity and the payment of Rule 12b-1 distribution and service fees by the Funds and the payment of non-Rule 12b-1 shareholder service and/or administration fees by the High Yield Fund’s Service Shares. Information was also provided to the Trustees relating to revenue sharing payments made by and services provided by the Investment Adviser and its affiliates to intermediaries that promote the sale, distribution and/or servicing of Fund shares.
The presentations made at the Board and Committee meetings and at the Annual Meeting encompassed the Funds and other mutual fund portfolios for which the Board of Trustees has responsibility. In evaluating the Management Agreement at the Annual Meeting, the Trustees relied upon their knowledge, resulting from their meetings and other interactions throughout the year, of the Investment Adviser, its affiliates, their services and the Funds. In conjunction with these meetings, the Trustees received written materials and oral presentations on the topics covered, and were advised by their independent legal counsel regarding their responsibilities and other regulatory requirements related to the approval and continuation of mutual fund investment management agreements under applicable law. In addition, the Investment Adviser and its affiliates provided the Independent Trustees with a written response to a formal request for information sent on behalf of the Independent Trustees by their independent legal counsel. During the course of their deliberations, the Independent Trustees met in executive sessions with their independent legal counsel, without representatives of the Investment Adviser or its affiliates present. The Independent Trustees also discussed the broad range of other investment choices that are available to Fund investors, including the availability of comparable funds managed by other advisers.
184
GOLDMAN SACHS SINGLE SECTOR FIXED INCOME FUNDS
Statement Regarding Basis for Approval of Management Agreement (Unaudited) (continued)
Nature, Extent and Quality of the Services Provided Under the Management Agreement
As part of their review, the Trustees considered the nature, extent and quality of the services provided by the Investment Adviser. In this regard, the Trustees considered both the investment advisory services and non-advisory services that are provided to the Funds by the Investment Adviser and its affiliates. The Trustees noted the transition in the leadership and changes in personnel of various of the Investment Adviser’s portfolio management teams that had occurred in recent periods, and the ongoing recruitment efforts aimed at bringing high quality investment talent to the Investment Adviser. They also noted the Investment Adviser’s commitment to maintaining high quality systems. The Trustees concluded that the Investment Adviser continued to commit substantial financial and operational resources to the Funds and expressed confidence that the Investment Adviser would continue to do so in the future. The Trustees also recognized that the Investment Adviser had made significant commitments to address regulatory compliance requirements applicable to the Funds and the Investment Adviser.
Investment Performance
The Trustees also considered the investment performance of the Funds. In this regard, they compared the investment performance of each Fund (with the exception of the Dynamic Emerging Markets Debt Fund, which commenced operations in 2013) to its peers using rankings and ratings (rankings only for the High Yield Floating Rate Fund) compiled by the Outside Data Provider as of December 31, 2013, and updated performance information prepared by the Investment Adviser using the peer groups identified by the Outside Data Provider as of March 31, 2014. The information on each Fund’s investment performance was provided for the one-, three-, five- and ten-year periods ending on the applicable dates, to the extent that each Fund had been in existence for those periods. The Trustees also reviewed each Fund’s investment performance over time (including on a year-by-year basis) relative to its performance benchmark. As part of this review, they considered the investment performance trends of the Funds over time, and reviewed the investment performance of each Fund in light of its investment objective and policies and market conditions. The Trustees also received information comparing the Dynamic Emerging Markets Debt, Emerging Markets Debt, High Yield, Local Emerging Markets Debt, and U.S. Mortgages Funds’ performance to that of composites of institutional accounts managed by the Investment Adviser having comparable investment characteristics.
In addition, the Trustees considered materials prepared and presentations made by the Investment Adviser’s senior management and portfolio management personnel, in which Fund performance was assessed. The Trustees also considered the Investment Adviser’s periodic reports with respect to the Funds’ risk profiles, and how the Investment Adviser’s approach to risk monitoring and management influences portfolio management.
The Trustees observed that the Emerging Markets Debt Fund’s Class A Shares had placed in the first quartile of the Fund’s peer group for the one-, three-, five-, and ten-year periods, and had outperformed the Fund’s benchmark index for the five- and ten-year periods and underperformed for the one- and three-year periods ended March 31, 2014. They noted that the High Yield Fund’s Class A Shares had placed in the second quartile of the Fund’s peer group and had underperformed the Fund’s benchmark index for the one-, three-, five-, and ten-year periods ended March 31, 2014. They observed that the High Yield Floating Rate Fund’s Class A Shares had placed in the fourth quartile of the Fund’s peer group and had underperformed the Fund’s benchmark index for the one- and three-year periods ended March 31, 2014. They also noted that changes had been made to the credit quality requirements for investments of the High Yield and High Yield Floating Rate Funds in June 2013. They noted that the Investment Grade Credit Fund’s Class A Shares had placed in the second quartile of the Fund’s peer group for the three-year period, in the third quartile for the one- and five-year periods, and in the fourth quartile for the ten-year period, and had outperformed the Fund’s benchmark index for the one-, three-, and five-year periods and underperformed for the ten-year period ended March 31, 2014. The Trustees noted that the Local Emerging Markets Debt Fund’s Class A Shares had placed in the fourth quartile of the Fund’s peer group and had underperformed the Fund’s benchmark index for the one-, three-, and five-year periods ended March 31, 2014. They considered that the Local Emerging Markets Debt Fund had certain significant differences from its peer group that caused the peer group to be an imperfect basis for performance comparison. The Trustees observed that the U.S. Mortgages Fund’s Class A Shares had placed in the top half of the Fund’s peer group for the one-, three-, five-, and ten-year periods, and had outperformed the Fund’s benchmark index for the one-, three-, and five-year periods and underperformed for the ten-year period ended March 31, 2014. They noted that the Dynamic Emerging Markets Debt Fund had launched on May 29, 2013 and did not yet have a meaningful performance history.
185
GOLDMAN SACHS SINGLE SECTOR FIXED INCOME FUNDS
Statement Regarding Basis for Approval of Management Agreement (Unaudited) (continued)
Costs of Services Provided and Competitive Information
The Trustees considered the contractual terms of the Management Agreement and the fee rates payable by each Fund thereunder. In this regard, the Trustees considered information on the services rendered by the Investment Adviser to the Funds, which included both advisory and administrative services that were directed to the needs and operations of the Funds as registered mutual funds.
In particular, the Trustees reviewed analyses prepared by the Outside Data Provider regarding the expense rankings of the Funds. The analyses provided a comparison of the Funds’ management fees and breakpoints to those of relevant peer groups and category universes; an expense analysis which compared each Fund’s overall net and gross expenses to a peer group and a category universe; and a five-year history (or, in the case of Funds that commenced investment operations within a shorter period, since the year in which it commenced operations) comparing each Fund’s net expenses to the peer and category medians. The analyses also compared each Fund’s transfer agency, custody, and distribution fees, other expenses and fee waivers/reimbursements to those of the peer group and category medians. The Trustees concluded that the comparisons provided by the Outside Data Provider were useful in evaluating the reasonableness of the management fees and total expenses paid by the Funds.
In addition, the Trustees considered the Investment Adviser’s undertakings to waive a portion of its management fees (with respect to the Dynamic Emerging Markets Debt, Investment Grade Credit, Local Emerging Markets Debt, and U.S. Mortgages Funds) and to limit certain expenses of each Fund that exceed specified levels. The Trustees also noted that certain changes were being made to existing fee waiver or expense limitation arrangements of the Dynamic Emerging Markets Debt Fund that would have the effect of lowering total Fund expenses, with such changes taking effect in connection with the Fund’s next annual registration statement update. They also considered, to the extent that the Investment Adviser manages institutional accounts or collective investment vehicles having investment objectives and policies similar to those of the Funds, comparative fee information for services provided by the Investment Adviser to those accounts, and information that indicated that services provided to the Funds differed in various significant respects from the services provided to institutional accounts, which generally operated under less stringent legal and regulatory structures, required fewer services from the Investment Adviser to a smaller number of client contact points, were less time-intensive and paid lower fees.
In addition, the Trustees noted that shareholders are able to redeem their Fund shares at any time if shareholders believe that the Fund fees and expenses are too high or if they are dissatisfied with the performance of the Fund.
Profitability
The Trustees reviewed the Investment Adviser’s revenues and pre-tax profit margins with respect to the Trust and each of the Funds. In this regard the Trustees noted that they had received, among other things, profitability analyses and summaries, revenue and expense schedules by Fund and by function (i.e., investment management, transfer agency and distribution and service) and information on the Investment Adviser’s expense allocation methodology. They observed that the profitability and expense figures are substantially similar to those used by the Investment Adviser for many internal purposes, including compensation decisions among various business groups, and are thus subject to a vigorous internal debate about how certain revenue and expenses should be allocated. The Trustees also noted that the internal audit group within the Goldman Sachs organization had audited the expense allocation methodology and was satisfied with the reasonableness, consistency, and accuracy of the Investment Adviser’s expense allocation methodology and profitability analysis calculations. Profitability data for the Trust and each Fund were provided for 2013 and 2012 (2013 only for the Dynamic Emerging Markets Debt Fund), and the Trustees considered this information in relation to the Investment Adviser’s overall profitability. The Trustees considered the Investment Adviser’s revenues and pre-tax profit margins both in absolute terms and in comparison to information on the reported pre-tax profit margins earned by certain other asset management firms.
186
GOLDMAN SACHS SINGLE SECTOR FIXED INCOME FUNDS
Statement Regarding Basis for Approval of Management Agreement (Unaudited) (continued)
Economies of Scale
The Trustees considered the information that had been provided regarding the Investment Adviser’s profitability. The Trustees also considered the breakpoints in the fee rate payable under the Management Agreement for each of the Funds at the following annual percentage rates of the average daily net assets of the Funds:
| | | | | | | | | | | | | | | | | | | | | | | | | | | | |
Average Daily Net Assets | | Dynamic
Emerging
Markets
Debt Fund | | | Emerging
Markets
Debt Fund | | | High Yield
Fund | | | High Yield
Floating
Rate Fund | | | Investment
Grade
Credit Fund | | | Local
Emerging
Markets
Debt Fund | | | U.S.
Mortgages
Fund | |
| First $1 billion | | | 0.90 | % | | | 0.80 | % | | | 0.70 | % | | | 0.60 | % | | | 0.40 | % | | | 0.90 | % | | | 0.40 | % |
| Next $1 billion | | | 0.90 | | | | 0.80 | | | | 0.70 | | | | 0.54 | | | | 0.36 | | | | 0.90 | | | | 0.36 | |
| Next $3 billion | | | 0.81 | | | | 0.72 | | | | 0.63 | | | | 0.51 | | | | 0.34 | | | | 0.81 | | | | 0.34 | |
| Next $3 billion | | | 0.77 | | | | 0.68 | | | | 0.60 | | | | 0.50 | | | | 0.33 | | | | 0.77 | | | | 0.33 | |
| Over $8 billion | | | 0.75 | | | | 0.67 | | | | 0.59 | | | | 0.49 | | | | 0.32 | | | | 0.75 | | | | 0.32 | |
The Trustees noted that the breakpoints were meant to share potential economies of scale, if any, with the Funds and their shareholders as assets under management reach those asset levels. The Trustees considered the amounts of assets in the Funds; the Funds’ recent share purchase and redemption activity; the information provided by the Investment Adviser relating to the costs of the services provided by the Investment Adviser and its affiliates and their realized profits; information comparing fee rates charged by the Investment Adviser with fee rates charged to other funds in the peer groups; and the Investment Adviser’s undertakings to waive a portion of its management fees (with respect to the Dynamic Emerging Markets Debt, Investment Grade Credit, Local Emerging Markets Debt, and U.S. Mortgages Funds) and to limit certain expenses of each Fund that exceed specified levels. Upon reviewing these matters at the Annual Meeting, the Trustees concluded that the fee breakpoints represented a means of assuring that benefits of scalability, if any, would be passed along to shareholders at the specified asset levels. They also noted that the Investment Adviser had passed along savings to shareholders of the High Yield, High Yield Floating Rate, and Local Emerging Markets Debt Funds, which had asset levels above at least the first breakpoint during the prior fiscal year.
Other Benefits to the Investment Adviser and Its Affiliates
The Trustees also considered the other benefits derived by the Investment Adviser and its affiliates from their relationships with the Funds as stated above, including: (a) transfer agency fees received by Goldman, Sachs & Co. (“Goldman Sachs”); (b) futures commissions earned by Goldman Sachs for executing futures transactions on behalf of the Funds; (c) trading efficiencies resulting from aggregation of orders of the Funds with those for other funds or accounts managed by the Investment Adviser; (d) the Investment Adviser’s ability to leverage the infrastructure designed to service the Funds on behalf of its other clients; (e) the Investment Adviser’s ability to cross-market other products and services to Fund shareholders; (f) Goldman Sachs’ retention of certain fees as Fund Distributor; (g) the Investment Adviser’s ability to negotiate better pricing with custodians on behalf of its other clients, as a result of the relationship with the Funds; and (h) the possibility that the working relationship between the Investment Adviser and the Funds’ third party service providers may cause those service providers to be more likely to do business with other areas of Goldman Sachs. In the course of considering the foregoing, the Independent Trustees requested and received further information quantifying certain of these fall-out benefits.
187
GOLDMAN SACHS SINGLE SECTOR FIXED INCOME FUNDS
Statement Regarding Basis for Approval of Management Agreement (Unaudited) (continued)
Other Benefits to the Funds and Their Shareholders
The Trustees also noted that the Funds receive certain potential benefits as a result of their relationship with the Investment Adviser, including: (a) trading efficiencies resulting from aggregation of orders of the Funds with those of other funds or accounts managed by the Investment Adviser; (b) enhanced servicing from vendors because of the volume of business generated by the Investment Adviser and its affiliates; (c) enhanced servicing from broker-dealers because of the volume of business generated by the Investment Adviser and its affiliates; (d) the Investment Adviser’s ability to negotiate favorable terms with derivatives counterparties on behalf of the Funds as a result of the size and reputation of the Goldman Sachs organization; (e) the Investment Adviser’s knowledge and experience gained from managing other accounts and products; (f) the Investment Adviser’s ability to hire and retain qualified personnel to provide services to the Funds because of the reputation of the Goldman Sachs organization; (g) the Funds’ access, through the Investment Adviser, to certain firmwide resources (e.g., proprietary risk management systems and databases), subject to certain restrictions; and (h) the Funds’ access to certain affiliated distribution channels. In addition, the Trustees noted the competitive nature of the mutual fund marketplace, and considered that many of the Funds’ shareholders invested in the Funds in part because of the Funds’ relationship with the Investment Adviser and that those shareholders have a general expectation that the relationship will continue.
Conclusion
In connection with their consideration of the Management Agreement, the Trustees gave weight to each of the factors described above, but did not identify any particular factor as controlling their decision. After deliberation and consideration of all of the information provided, including the factors described above, the Trustees concluded, in the exercise of their business judgment, that the management fees paid by each of the Funds were reasonable in light of the services provided to it by the Investment Adviser, the Investment Adviser’s costs and each Fund’s current and reasonably foreseeable asset levels. The Trustees unanimously concluded that the Investment Adviser’s continued management likely would benefit each Fund and its shareholders and that the Management Agreement should be approved and continued with respect to each Fund until June 30, 2015.
188
FUNDS PROFILE
Goldman Sachs Funds

Goldman Sachs is a premier financial services firm, known since 1869 for creating thoughtful and customized investment solutions in complex global markets.
Today, the Investment Management Division of Goldman Sachs serves a diverse set of clients worldwide, including private institutions, public entities and individuals. With approximately $999.2 billion in assets under supervision as of September 30, 2014, Goldman Sachs Asset Management (“GSAM”) has portfolio management teams located around the world and our investment professionals bring firsthand knowledge of local markets to every investment decision. Assets under supervision includes assets under management and other client assets for which Goldman Sachs does not have full discretion. GSAM leverages the resources of Goldman, Sachs & Co. subject to legal, internal and regulatory restrictions.

Money Market1
Financial Square FundsSM
| n | | Financial Square Tax-Exempt Funds |
| n | | Financial Square Federal Fund |
| n | | Financial Square Government Fund |
| n | | Financial Square Money Market Fund |
| n | | Financial Square Prime Obligations Fund |
| n | | Financial Square Treasury Instruments Fund |
| n | | Financial Square Treasury Obligations Fund |
Fixed Income
Short Duration and Government
| n | | High Quality Floating Rate Fund |
| n | | Limited Maturity Obligations Fund |
| n | | Short Duration Government Fund |
| n | | Short Duration Income Fund |
| n | | Inflation Protected Securities Fund |
Multi-Sector
Municipal and Tax-Free
| n | | High Yield Municipal Fund |
| n | | Short Duration Tax-Free Fund |
Single Sector
| n | | Investment Grade Credit Fund |
| n | | High Yield Floating Rate Fund |
| n | | Emerging Markets Debt Fund |
| n | | Local Emerging Markets Debt Fund |
| n | | Dynamic Emerging Markets Debt Fund |
Fixed Income Alternatives
| n | | Long Short Credit Strategies Fund3 |
| n | | Fixed Income Macro Strategies Fund |
Fundamental Equity
| n | | Small/Mid Cap Value Fund |
| n | | Small/Mid Cap Growth Fund |
| n | | Flexible Cap Growth Fund |
| n | | Concentrated Growth Fund |
| n | | Technology Tollkeeper Fund |
| n | | Growth Opportunities Fund |
| n | | Rising Dividend Growth Fund |
Tax-Advantaged Equity
| n | | U.S. Tax-Managed Equity Fund4 |
| n | | International Tax-Managed Equity Fund4 |
| n | | U.S. Equity Dividend and Premium Fund |
| n | | International Equity Dividend and Premium Fund |
Equity Insights
| n | | Small Cap Equity Insights Fund |
| n | | U.S. Equity Insights Fund |
| n | | Small Cap Growth Insights Fund |
| n | | Large Cap Growth Insights Fund |
| n | | Large Cap Value Insights Fund |
| n | | Small Cap Value Insights Fund |
| n | | International Small Cap Insights Fund |
| n | | International Equity Insights Fund |
| n | | Emerging Markets Equity Insights Fund |
Fundamental Equity International
| n | | Strategic International Equity Fund |
| n | | Focused International Equity Fund5 |
| n | | International Small Cap Fund |
| n | | Emerging Markets Equity Fund |
| n | | BRIC Fund (Brazil, Russia, India, China) |
Select Satellite6
| n | | Real Estate Securities Fund |
| n | | International Real Estate Securities Fund |
| n | | Commodity Strategy Fund |
| n | | Dynamic Commodity Strategy Fund |
| n | | Dynamic Allocation Fund |
| n | | Absolute Return Tracker Fund |
| n | | Managed Futures Strategy Fund |
| n | | MLP Energy Infrastructure Fund |
| n | | Multi-Manager Alternatives Fund |
| n | | Multi-Asset Real Return Fund |
| n | | Retirement Portfolio Completion Fund |
| n | | Tactical Tilt Implementation Fund |
Total Portfolio Solutions6
| n | | Balanced Strategy Portfolio |
| n | | Growth and Income Strategy Portfolio |
| n | | Growth Strategy Portfolio |
| n | | Equity Growth Strategy Portfolio |
| n | | Satellite Strategies Portfolio |
| n | | Enhanced Dividend Global Equity Portfolio |
| n | | Tax Advantaged Global Equity Portfolio |
| 1 | | An investment in a money market fund is neither insured nor guaranteed by the Federal Deposit Insurance Corporation (“FDIC”) or any other government agency. Although the Funds seek to preserve the value of your investment at $1.00 per share, it is possible to lose money by investing in the Funds. |
| 2 | | Effective on October 1, 2014, the Goldman Sachs Core Plus Fixed Income Fund was renamed the Goldman Sachs Bond Fund. |
| 3 | | Effective at the close of business on March 21, 2014, the Goldman Sachs Credit Strategies Fund was reorganized with and into the Goldman Sachs Long Short Credit Strategies Fund. |
| 4 | | Effective on April 30, 2014, the Goldman Sachs Structured Tax-Managed Equity and Structured International Tax-Managed Equity Funds were renamed the Goldman Sachs U.S. Tax-Managed Equity and International Tax-Managed Equity Funds, respectively. |
| 5 | | Effective at the close of business on February 28, 2014, the Goldman Sachs Concentrated International Equity Fund was renamed the Goldman Sachs Focused International Equity Fund. |
| 6 | | Individual Funds within the Total Portfolio Solutions and Select Satellite categories will have various placement on the risk/return spectrum and may have greater or lesser risk than that indicated by the placement of the general Total Portfolio Solutions or Select Satellite category. |
Financial Square FundsSM is a registered service mark of Goldman, Sachs & Co.
| * | | This list covers open-end funds only. Please visit our website at www.GSAMFUNDS.com to learn about our closed-end funds. |
| | |
TRUSTEES Ashok N. Bakhru, Chairman John P. Coblentz, Jr. Diana M. Daniels Joseph P. LoRusso Herbert J. Markley James A. McNamara Jessica Palmer Alan A. Shuch Richard P. Strubel Roy W. Templin | | OFFICERS James A. McNamara, President Scott M. McHugh, Principal Financial Officer and Treasurer Caroline Kraus, Secretary |
| |
GOLDMAN, SACHS & CO. Distributor and Transfer Agent | | GOLDMAN SACHS ASSET MANAGEMENT, L.P. Investment Adviser |
Visit our web site at www.GSAMFUNDS.com to obtain the most recent month-end returns.
Goldman Sachs Asset Management, L.P., 200 West Street, New York, New York 10282
The reports concerning the Funds included in this shareholder report may contain certain forward-looking statements about the factors that may affect the performance of the Funds in the future. These statements are based on Fund management’s predictions and expectations concerning certain future events and their expected impact on the Funds, such as performance of the economy as a whole and of specific industry sectors, changes in the levels of interest rates, the impact of developing world events, and other factors that may influence the future performance of the Funds. Management believes these forward-looking statements to be reasonable, although they are inherently uncertain and difficult to predict. Actual events may cause adjustments in portfolio management strategies from those currently expected to be employed.
A description of the policies and procedures that the Funds use to determine how to vote proxies relating to portfolio securities and information regarding how the Funds voted proxies relating to portfolio securities for the most recent 12-month period ended June 30 are available (I) without charge, upon request by calling 1-800-526-7384 (for Retail Shareholders) or 1-800-621-2550 (for Institutional Shareholders); and (II) on the Securities and Exchange Commission (‘‘SEC’’) web site at http://www.sec.gov.
The Funds file their complete schedule of portfolio holdings with the SEC for the first and third quarters of each fiscal year on Form N-Q. The Funds’ Forms N-Q are available on the SEC’s web site at http://www.sec.gov within 60 days after the Funds’ first and third fiscal quarters. The Funds’ Forms N-Q may be reviewed and copied at the SEC’s Public Reference Room in Washington, D.C., and information on the operation of the Public Reference Room may also be obtained by calling 1-800-SEC-0330. Forms N-Q may be obtained upon request and without charge by calling 1-800-526-7384 (for Retail Shareholders) or 1-800-621-2550 (for Institutional Shareholders).
Economic and market forecasts presented herein reflect our judgment as of the date of this presentation and are subject to change without notice. These forecasts do not take into account the specific investment objectives, restrictions, tax and financial situation or other needs of any specific client. Actual data will vary and may not be reflected here. These forecasts are subject to high levels of uncertainty that may affect actual performance. Accordingly, these forecasts should be viewed as merely representative of a broad range of possible outcomes. These forecasts are estimated, based on assumptions, and are subject to significant revision and may change materially as economic and market conditions change. Goldman Sachs has no obligation to provide updates or changes to these forecasts. Case studies and examples are for illustrative purposes only.
Fund holdings and allocations shown are as of September 30, 2014 and may not be representative of future investments. Fund holdings should not be relied on in making investment decisions and should not be construed as research or investment advice regarding particular securities.
This material is not authorized for distribution to prospective investors unless preceded or accompanied by a current Prospectus or summary prospectus, if applicable. Investors should consider a Fund’s objective, risks, and charges and expenses, and read the summary prospectus, if available, and/or the Prospectus carefully before investing or sending money. The summary prospectus, if available, and the Prospectus contain this and other information about a Fund and may be obtained from your authorized dealer or from Goldman, Sachs & Co. by calling (retail – 1-800-526-7384) (institutional – 1-800-621-2550).
© 2014 Goldman Sachs. All rights reserved. 145749.MF.MED.TMPL/11/2014 SSFISAR-14/68.3k
The information required by this Item is only required in an annual report on this Form N-CSR.
| ITEM 3. | AUDIT COMMITTEE FINANCIAL EXPERT. |
The information required by this Item is only required in an annual report on this Form N-CSR.
| ITEM 4. | PRINCIPAL ACCOUNTANT FEES AND SERVICES. |
The information required by this Item is only required in an annual report on this Form N-CSR.
| ITEM 5. | AUDIT COMMITTEE OF LISTED REGISTRANTS. |
| ITEM 6. | SCHEDULE OF INVESTMENTS. |
| | Schedule of Investments is included as part of the Report to Stockholders filed under Item 1. |
| ITEM 7. | DISCLOSURE OF PROXY VOTING POLICIES AND PROCEDURES FOR CLOSED-END MANAGEMENT INVESTMENT COMPANIES. |
| ITEM 8. | PORTFOLIO MANAGERS OF CLOSED-END MANAGEMENT INVESTMENT COMPANIES. |
| ITEM 9. | PURCHASES OF EQUITY SECURITIES BY CLOSED-END MANAGEMENT INVESTMENT COMPANY AND AFFILIATED PURCHASERS. |
| ITEM 10. | SUBMISSION OF MATTERS TO A VOTE OF SECURITY HOLDERS. |
| | There have been no material changes to the procedures by which shareholders may recommend nominees to the registrant’s board of trustees. |
| ITEM 11. | CONTROLS AND PROCEDURES. |
| | (a) | The registrant’s principal executive and principal financial officers, or persons performing similar functions have concluded that the registrant’s disclosure controls and procedures (as defined in Rule 30a-3(c) under the Investment Company Act of 1940, as amended (the “1940 Act”)) are effective as of a date within 90 days of the filing of this report that includes the disclosure required by this paragraph, based on the evaluation of these controls and procedures required by Rule 30a-3(b) under the 1940 Act and 15d-15(b) under the Securities Exchange Act of 1934, as amended. |
| | (b) | There were no changes in the registrant’s internal control over financial reporting (as defined in Rule 30a-3(d) under the 1940 Act) that occurred during the registrant’s second fiscal quarter of the period covered by this report that have materially affected, or are reasonably likely to materially affect, the registrant’s internal control over financial reporting. |
| | | | |
| (a)(1) | | The information required by this Item is only required in connection with an annual report on this Form N-CSR. |
| | |
| (a)(2) | | Exhibit 99.CERT | | Certifications pursuant to Section 302 of the Sarbanes-Oxley Act of 2002 filed herewith. |
| | |
| (b) | | Exhibit 99.906CERT | | Certifications pursuant to Section 906 of the Sarbanes-Oxley Act of 2002 filed herewith. |
SIGNATURES
Pursuant to the requirements of the Securities Exchange Act of 1934 and the Investment Company Act of 1940, the registrant has duly caused this report to be signed on its behalf by the undersigned, thereunto duly authorized.
| | |
| | | Goldman Sachs Trust |
| |
| By: | | /s/ James A. McNamara |
| |
| | |
| | James A. McNamara |
| | President/Principal Executive Officer |
| | Goldman Sachs Trust |
| |
| Date: | | December 3, 2014 |
Pursuant to the requirements of the Securities Exchange Act of 1934 and the Investment Company Act of 1940, this report has been signed below by the following persons on behalf of the registrant and in the capacities and on the dates indicated.
| | |
| By: | | /s/ James A. McNamara |
| |
| | |
| | James A. McNamara |
| | President/Principal Executive Officer |
| | Goldman Sachs Trust |
| |
| Date: | | December 3, 2014 |
| |
| By: | | /s/ Scott McHugh |
| |
| | |
| | Scott McHugh |
| | Principal Financial Officer |
| | Goldman Sachs Trust |
| |
| Date: | | December 3, 2014 |