UNITED STATES
SECURITIES AND EXCHANGE COMMISSION
Washington, D.C. 20549
FORM N-CSR
CERTIFIED SHAREHOLDER REPORT OF REGISTERED
MANAGEMENT INVESTMENT COMPANIES
Investment Company Act file number 811-05349
Goldman Sachs Trust
(Exact name of registrant as specified in charter)
71 South Wacker Drive, Chicago, Illinois 60606
(Address of principal executive offices) (Zip code)
| | |
| Caroline Kraus, Esq. | | Copies to: |
| Goldman, Sachs & Co. | | Geoffrey R.T. Kenyon, Esq. |
| 200 West Street | | Dechert LLP |
| New York, New York 10282 | | 100 Oliver Street |
| | 40th Floor |
| | Boston, MA 02110-2605 |
(Name and address of agents for service)
Registrant’s telephone number, including area code: (312) 655-4400
Date of fiscal year end: March 31
Date of reporting period: September 30, 2015
| ITEM 1. | REPORTS TO STOCKHOLDERS. |
| | The Semi-Annual Report to Shareholders is filed herewith. |
Goldman Sachs Funds

| | | | |
| | |
| Semi-Annual Report | | | | September 30, 2015 |
| | |
| | | | Municipal Fixed Income Funds |
| | | | Dynamic Municipal Income* |
| | | | High Yield Municipal |
| | | | Short Duration Tax-Free |
*Effective after the close of business on December 18, 2014, the Goldman Sachs Municipal Income Fund’s name changed to the “Goldman Sachs Dynamic Municipal Income Fund.”

Goldman Sachs Municipal Fixed Income Funds
| n | | DYNAMIC MUNICIPAL INCOME |
| n | | SHORT DURATION TAX-FREE |
| | | | |
TABLE OF CONTENTS | | | | |
| |
Principal Investment Strategies and Risks | | | 1 | |
| |
Investment Process | | | 2 | |
| |
Market Review | | | 3 | |
| |
Portfolio Management Discussions and Performance Summaries | | | 5 | |
| |
Schedules of Investments | | | 20 | |
| |
Financial Statements | | | 72 | |
| |
Financial Highlights | | | 76 | |
| |
Notes to the Financial Statements | | | 82 | |
| |
Other Information | | | 98 | |
| | | | |
| | | |
| NOT FDIC-INSURED | | May Lose Value | | No Bank Guarantee |
GOLDMAN SACHS MUNICIPAL FIXED INCOME FUNDS
Principal Investment Strategies and Risks
This is not a complete list of risks that may affect the Funds. For additional information concerning the risks applicable to the Funds, please see the Funds’ Prospectuses.
Effective after the close of business on December 18, 2014, the Fund’s name changed to the “Goldman Sachs Dynamic Municipal Income Fund.”
The Goldman Sachs Dynamic Municipal Income Fund invests primarily in municipal securities, the interest on which is exempt from regular federal income tax. The Fund may invest up to 100% of its net assets in private activity bonds, whose income may be subject to the federal alternative minimum tax. Investments in fixed income securities are subject to the risks associated with debt securities generally, including credit, liquidity and interest rate risk. At times, the Fund may be unable to sell certain of its illiquid investments without a substantial drop in price, if at all. The Fund may be more sensitive to adverse economic, business or political developments if it invests a substantial portion of its assets in bonds of similar projects or in particular types of municipal securities. Because the Fund may invest heavily in investments in particular states and sectors, the Fund is subject to greater risk of loss as a result of adverse events affecting those states and sectors than if its investments were not so concentrated. The Fund may be adversely impacted by changes in tax law rates and policies, and is not suited for IRAs or other tax-exempt or deferred accounts.
The Goldman Sachs High Yield Municipal Fund invests primarily in high yield municipal securities that, at the time of purchase, are medium quality or non-investment grade, the interest on which is exempt from regular federal income tax. The Fund’s investments in fixed income securities are subject to the risks associated with debt securities generally, including credit, liquidity, interest rate, call and extension risk. High yield, lower rated investments involve greater price volatility and present greater risks, including greater liquidity risk, than higher rated fixed income securities. The Fund is subject to the risk that the liquidity of particular issuers or industries, or of all securities within a particular investment category, will shrink or disappear as a result of adverse economic, market or political events or adverse investor perception. At times, the Fund may be unable to sell certain of its illiquid investments without a substantial drop in price, if at all. The Fund may be more sensitive to adverse economic, business or political developments if it invests a substantial portion of its assets in bonds of similar projects or in particular types of municipal securities. Because the Fund may invest heavily in investments in particular sectors (for example, specific types of municipal securities) or states, the Fund is subject to greater risk of loss as a result of adverse events affecting those sectors or states than if its investments were not so concentrated. The Fund may invest in securities whose income is subject to the federal alternative minimum tax and state income tax. The Fund may be adversely impacted by changes in tax law rates and policies, and is not suited for IRAs or other tax exempt or deferred accounts. Certain shareholders, including clients or affiliates of the investment adviser, may from time to time own or control a significant percentage of the Fund’s shares. Redemptions by these shareholders of their shares of the Fund may impact the Fund’s liquidity and NAV. The Fund is “non-diversified” and may invest more of its assets in fewer issuers than “diversified” funds. Accordingly, the Fund may be more susceptible to adverse developments affecting any single issuer held in its portfolio and to greater losses resulting from these developments.
The Goldman Sachs Short Duration Tax-Free Fund invests primarily in municipal securities, the interest on which is exempt from regular federal income tax and is not a tax preference item under the federal alternative minimum tax. The Fund may invest up to 20% of its portfolio in private activity bonds whose income may be subject to the federal alternative minimum tax and taxable investments. Investments in fixed income securities are subject to the risks associated with debt securities generally, including credit, liquidity and interest rate risk. At times, the Fund may be unable to sell certain of its illiquid investments without a substantial drop in price, if at all. The Fund may be more sensitive to adverse economic, business or political developments if it invests a substantial portion of its assets in bonds of similar projects or in particular types of municipal securities. Because the Fund may invest heavily in investments in particular states and sectors, the Fund is subject to greater risk of loss as a result of adverse events affecting those states and sectors than if its investments were not so concentrated. The Fund may be adversely impacted by changes in tax law rates and policies, and is not suited for IRAs or other tax-exempt or deferred accounts.
1
GOLDMAN SACHS MUNICIPAL FIXED INCOME FUNDS
What Differentiates the Goldman Sachs Asset Management Fixed Income Investment Process?
At Goldman Sachs Asset Management, L.P. (“GSAM”), the goal of our fixed income investment process is to provide consistent, strong performance by actively managing our portfolios within a research-intensive, risk-managed framework.
A key element of our fixed income investment philosophy is to evaluate the broadest global opportunity set to capture relative value across sectors and instruments. Our globally integrated investment process involves managing dynamically along the risk/return spectrum, as we continue to develop value-added strategies through:

| n | | Assess relative value among securities and sectors |
| n | | Leverage the vast resources of GSAM in selecting securities for each portfolio |

| n | | Team approach to decision making |
| n | | Manage risk by avoiding significant sector and interest rate bets |
| n | | Careful management of yield curve strategies — while closely managing portfolio duration |

Fixed Income portfolios that:
| | n | | Include domestic investment options, tax-free income opportunities, and access to areas of specialization such as high yield securities | |
| | n | | Capitalize on GSAM’s industry-renowned credit research capabilities | |
| | n | | Use a risk-managed framework to seek total return, recognizing the importance of investors’ capital accumulation goals as well as their need for income | |
2
MARKET REVIEW
Goldman Sachs Municipal Fixed Income Funds
Market Review
The municipal bond market recorded positive returns during the six months ended September 30, 2015 (the “Reporting Period”) despite rising yields and modestly unfavorable supply and demand dynamics.
When the Reporting Period began in the second quarter of 2015, municipal bond prices retreated as yields rose across the yield curve. (Yield curve indicates a spectrum of maturities.) During the third calendar quarter and through the end of the Reporting Period, uncertainty about the Federal Reserve’s (the “Fed”) interest rate policy helped drive up municipal bond prices.
For the Reporting Period overall, shorter-term municipal yields edged up, while longer-term municipal yields rose more significantly. As a result, the municipal yield curve steepened. The yield on a two-year AAA-rated municipal security rose six basis points to 0.55%; the yield on a 10-year AAA-rated municipal security rose seven basis points to 2.03%; and the yield on a 30-year AAA-rated municipal security increased 24 basis points to 3.04%. (A basis point is 1/100th of a percentage point.) By comparison, the yield on a two-year U.S. Treasury security rose seven basis points to 0.63%; the yield on a 10-year U.S. Treasury rose 11 basis points to 2.04%; and the yield on a 30-year U.S. Treasury security increased 32 basis points to 2.85%. (Source: GSAM, MMD and Bloomberg.)
Market technicals, or supply and demand factors, were modestly unsupportive during the Reporting Period. Primary market issuance was strong, with approximately $200 billion of new supply for the Reporting Period overall. However, demand was weak. Municipal bond mutual funds saw average investment outflows of $200 million per week during the second quarter of 2015. Outflows persisted and even escalated during the third quarter of 2015. (Source: Lipper.)
Overall, credit quality in the municipal bond market remained strong during the Reporting Period. Nevertheless, pockets of weakness generated negative headlines. On June 28, 2015, Puerto Rico Governor Alejandro Garcia Padilla gave an interview to The New York Times in which he said the commonwealth “cannot pay its roughly $72 billion in debts.” These words shifted Puerto Rico’s course from a focused effort on finding liquidity and balancing the budget toward the possibility of a default. Credit ratings agencies responded to Padilla’s comments with multiple notch downgrades. As the Reporting Period progressed, Puerto Rico continued to implement significant measures to address its financial difficulties, including legislation that would allow for the issuance of tax anticipation notes and an increase in petroleum taxes as well as a tax reform proposal that could potentially provide additional revenues. Also during the Reporting Period, credit rating agencies downgraded New Jersey after a revenue shortfall led the state to make a reduced payment to its pension funds. Meanwhile, Illinois grappled with its pension and budgetary issues. In more positive news, state revenues overall expanded during the Reporting Period, with most states working toward solid budget plans that would potentially enhance financial reserves and provide tax breaks. One such example was New York state, which is one of the municipal bond market’s bellwether issuers. California also remained on an upward trajectory, as revenues came in ahead of budget for the state’s 2014-2015 fiscal year.
3
MARKET REVIEW
High Yield Municipals
During the Reporting Period, the high yield municipal bond market underperformed the investment grade municipal bond market. The main drivers of underperformance among high yield municipal bonds were the special tax and transportation sectors. Both sectors fell by more than 10% during the Reporting Period. As mentioned previously, Puerto Rico was the subject of significant negative news, which led to substantial volatility for the credit. Uncertainty around Puerto Rico’s restructuring plan caused it to underperform the Barclays High Yield Municipal Index for the Reporting Period as a whole.
Looking Ahead
At the end of the Reporting Period, municipal bond market technicals appeared to be moving in a more favorable direction, as primary market issuance slowed — though we believe this trend could possibly reverse toward the end of 2015. We also believe the tax environment should continue to be supportive for municipal bonds, even if interest rates remain low. That said, strong U.S. economic data, supported by recent Fed statements, suggest to us that rates may rise during the latter part of 2015. Higher rates, in our view, could make the tax exempt benefits of municipal bonds even more attractive and could boost the relative performance of the asset class. Meanwhile, we anticipate an increase in infrastructure investment by states and municipalities, and we expect their governments to take advantage of continued low interest rates to issue debt. We also expect to see more headlines around pension cost escalation, as this remains a serious challenge for some states and localities.
In the months ahead, we intend to maintain our approach in which we focus on seeking attractive risk/return opportunities across maturities along the municipal bond yield curve and inclusive of all credit qualities. We will continue seeking to keep the Funds invested in the most tax-efficient manner possible.
4
PORTFOLIO RESULTS
Goldman Sachs Dynamic Municipal Income Fund1
Investment Objective
The Fund seeks a high level of current income that is exempt from regular federal income tax.
Portfolio Management Discussion and Analysis
Below, the Goldman Sachs Municipal Fixed Income Investment Management Team discusses the Goldman Sachs Dynamic Municipal Income Fund’s (the “Fund”) performance and positioning for the six-month period ended September 30, 2015 (the “Reporting Period”).
| Q | | How did the Fund perform during the Reporting Period? |
| A | | During the Reporting Period, the Fund’s Class A, C, Institutional, Service and IR Shares generated cumulative total returns, without sales charges, of -0.27%, -0.71%, -0.16%, -0.34% and -0.15%, respectively. These returns compare to the 0.80% cumulative total return of the Fund’s benchmark, the Barclays Municipal Bond 1-10 Year Blend Index (the “Index”), during the same time period. To compare, the Fund’s former benchmark, the Barclays Municipal Bond Index, generated a 0.75% cumulative total return during the same time period. |
| Q | | What key factors were responsible for the Fund’s performance during the Reporting Period? |
| A | | During the Reporting Period, the Fund’s exposure to longer maturity securities detracted from relative performance, as the municipal yield curved steepened, meaning the differential between longer-term and shorter-term yields widened. The Fund’s yield curve strategy detracted from relative returns. (Yield curve is a spectrum of maturities.) |
| On | | the positive side, the Fund’s sector positioning and bottom-up issue selection added to relative results. |
| Q | | Which municipal bond market sectors most significantly affected Fund performance during the Reporting Period? |
| A | | As municipal credit concerns increased in response to negative headlines about Puerto Rico, the Fund was hurt by its overweight position relative to the Index in lower credit quality B-rated municipal bonds. Conversely, the Fund benefited from its overweight position in hospital bonds, as this sector recorded strong gains during the Reporting Period. |
| Q | | How did duration and yield curve positioning decisions affect the Fund’s performance during the Reporting Period? |
| A | | During the Reporting Period, the Fund suffered due to its yield curve positioning relative to the Index. More specifically, the Fund was hurt by its exposure to the longer- maturity segment of the municipal yield curve as the yield curve steepened. |
| Q | | How did the Fund use derivatives and similar instruments during the Reporting Period as a whole? |
| A | | During the Reporting Period overall, the Fund used municipal inverse variable rate securities to take advantage of the steepness of the municipal yield curve, wherein yields on shorter-term maturity municipal bonds were lower than those on longer-term maturity municipal bonds. These securities have an inverse relationship to short-term interest rates — the interest rate they pay generally increases as short-term interest rates fall and vice versa — and they therefore have the potential to increase or decrease the Fund’s income. In addition, the Fund used municipal credit default swaps as we sought to capture the upside potential of select securities that were trading below what we considered their intrinsic value. Also, to manage against potential changes in interest rates, the Fund employed interest rate swap contracts during the Reporting Period. Derivatives did not have a material impact, on a net basis, on the Fund’s performance during the Reporting Period. |
| Q | | What changes did you make in the Fund’s weightings and investments during the Reporting Period? |
| A | | During the Reporting Period, we increased the Fund’s exposure to university and general obligation bonds. We decreased its allocation to hospital credits and lease-backed bonds. In addition, we reduced the Fund’s exposure to higher |
5
PORTFOLIO RESULTS
| | credit quality A-rated issues and lower credit quality B-rated issues. |
| Q | | How was the Fund positioned relative to its benchmark index at the end of the Reporting Period? |
| A | | At the end of the Reporting Period, the Fund held a longer duration position compared to that of the Index. It was underweight relative to the Index in higher credit quality investment grade municipal bonds and overweight in BBB- rated and other lower credit quality issues. Compared to the Index, the Fund was overweight in Puerto Rico, California and Texas municipal bonds and underweight in New York municipal bonds. |
6
FUND BASICS
Dynamic Municipal Income Fund
as of September 30, 2015
| | | | | | | | | | | | | | | | | | | | | | | | | | |
| | PERFORMANCE REVIEW | |
| | | April 1, 2015–
September 30, 2015 | | Fund Total Return (based
on NAV)1 | | | Barclays Municipal
Bond 1-10
Yr Blend Index2 | | | Barclays Municipal
Bond Index3 | | | 30-Day Standardized Subsidized
Yield4 | | | 30-Day Standardized Unsubsidized Yield4 | | | 30-Day Taxable Equivalent Yield5 | |
| | Class A | | | -0.27 | % | | | 0.80 | % | | | 0.75 | % | | | 2.36 | % | | | 2.17 | % | | | 4.17 | % |
| | Class C | | | -0.71 | | | | 0.80 | | | | 0.75 | | | | 1.71 | | | | 1.51 | | | | 3.02 | |
| | Institutional | | | -0.16 | | | | 0.80 | | | | 0.75 | | | | 2.79 | | | | 2.60 | | | | 4.93 | |
| | Service | | | -0.34 | | | | 0.80 | | | | 0.75 | | | | 2.30 | | | | 2.10 | | | | 4.06 | |
| | | Class IR | | | -0.15 | | | | 0.80 | | | | 0.75 | | | | 2.70 | | | | 2.50 | | | | 4.77 | |
| | 1 | | The net asset value (“NAV”) represents the net assets of the class of the Fund (ex-dividend) divided by the total number of shares of the class outstanding. The Fund’s performance assumes the reinvestment of dividends and other distributions. The Fund’s performance does not reflect the deduction of any applicable sales charges. |
| | 2 | | The Fund’s performance benchmark was changed from the Barclays Municipal Bond Index to the Barclays Municipal Bond 1-10 Year Blend Index because Goldman Sachs Asset Management believes it is a more appropriate benchmark against which to measure the Fund’s performance, in light of changes to the Fund’s investment strategies. |
| | 3 | | The Barclays Municipal Bond Index is an unmanaged broad-based total return index composed of approximately 40,000 investment grade, fixed rate, and tax-exempt issues, with a remaining maturity of at least one year. The Barclays Municipal Bond Index figures do not reflect any deduction for fees, expenses or taxes. It is not possible to invest directly in an index. |
| | 4 | | The method of calculation of the 30-Day Standardized Subsidized Yield is mandated by the Securities and Exchange Commission and is determined by dividing the net investment income per share earned during the last 30 days of the period by the maximum public offering price (“POP”) per share on the last day of the period. This number is then annualized. The 30-Day Standardized Subsidized Yield reflects fee waivers and/or expense reimbursements recorded by the Fund during the period. Without waivers and/or reimbursements, yields would be reduced. This yield does not necessarily reflect income actually earned and distributed by the Fund and, therefore, may not be correlated with the dividends or other distributions paid to shareholders. The 30-Day Standardized Unsubsidized Yield does not adjust for any fee waivers and/or expense reimbursements in effect. If the Fund does not incur any fee waivers and/or expense reimbursements during the period, the 30-Day Standardized Subsidized Yield and 30-Day Standardized Unsubsidized Yield will be identical. |
| | 5 | | The 30-Day Taxable Equivalent Yield of the Fund is calculated by dividing the current 30-Day Standardized Subsidized Yield by 1 minus the highest 2013 federal income tax rate of 43.4%. |
The returns set forth in the table above represent past performance. Past performance does not guarantee future results. The Fund’s investment return and principal value will fluctuate so that an investor’s shares, when redeemed, may be worth more or less than their original cost. Current performance may be lower or higher than the performance quoted above. Please visit our web site at www.GSAMFUNDS.com to obtain the most recent month-end returns. Performance reflects applicable fee waivers and/or expense limitations in effect during the periods shown. In their absence, performance would be reduced. Returns do not reflect the deduction of taxes that a shareholder would pay on Fund distributions or the redemption of Fund shares.
7
FUND BASICS
| | | | | | | | | | | | | | | | | | | | |
| | STANDARDIZED TOTAL RETURNS6 |
| | | For the period ended 9/30/15 | | One Year | | | Five Years | | | Ten Years | | | Since Inception | | | Inception Date |
| | Class A | | | -2.77 | % | | | 3.24 | % | | | 3.53 | % | | | 4.61 | % | | 7/20/93 |
| | Class C | | | -0.74 | | | | 3.26 | | | | 3.15 | | | | 3.73 | | | 8/15/97 |
| | Institutional | | | 1.36 | | | | 4.37 | | | | 4.28 | | | | 4.89 | | | 8/15/97 |
| | Service | | | 0.87 | | | | 3.85 | | | | 3.74 | | | | 4.39 | | | 8/15/97 |
| | | Class IR | | | 1.27 | | | | 4.26 | | | | N/A | | | | 4.67 | | | 7/30/10 |
| | 6 | | The Standardized Total Returns are average annual total returns or cumulative total returns (only if the performance period is one year or less) as of the most recent calendar quarter-end. They assume reinvestment of all distributions at NAV. These returns reflect a maximum initial sales charge of 3.75% for Class A Shares and the assumed contingent deferred sales charge for Class C Shares (1% if redeemed within 12 months of purchase). Prior to July 29, 2009, the maximum initial sales charge applicable to Class A Shares of the Fund was 4.5%, which is not reflected in the figures shown. Because Institutional Shares, Service Shares and Class IR Shares do not involve a sales charge, such a charge is not applied to their Standardized Total Returns. |
The returns set forth in the table above represent past performance. Past performance does not guarantee future results. The Fund’s investment return and principal value will fluctuate so that an investor’s shares, when redeemed, may be worth more or less than their original cost. Current performance may be lower or higher than the performance quoted above. Please visit our web site at www.GSAMFUNDS.com to obtain the most recent month-end returns. Performance reflects applicable fee waivers and/or expense limitations in effect during the periods shown. In their absence, performance would be reduced. Returns do not reflect the deduction of taxes that a shareholder would pay on Fund distributions or the redemption of Fund shares.
| | | | | | | | | | |
| | EXPENSE RATIOS7 | |
| | | | | Net Expense Ratio (Current) | | | Gross Expense Ratio (Before Waivers) | |
| | Class A | | | 0.78 | % | | | 1.01 | % |
| | Class C | | | 1.53 | | | | 1.76 | |
| | Institutional | | | 0.44 | | | | 0.67 | |
| | Service | | | 0.94 | | | | 1.16 | |
| | | Class IR | | | 0.53 | | | | 0.76 | |
| | 7 | | The expense ratios of the Fund, both current (net of applicable fee waivers and/or expense limitations) and before waivers (gross of applicable fee waivers and/or expense limitations) are as set forth above according to the most recent publicly available Prospectus for the Fund and may differ from the expense ratios disclosed in the Financial Highlights in this report. Pursuant to a contractual arrangement, the Fund’s waivers and/or expense limitations will remain in place through at least July 29, 2016, and prior to such date the Investment Adviser may not terminate the arrangements without the approval of the Fund’s Board of Trustees. If these arrangements are discontinued in the future, the expense ratios may change without shareholder approval. |
8
FUND BASICS
|
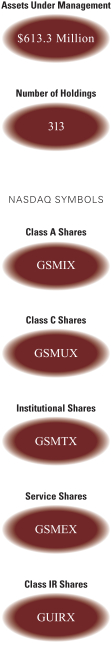
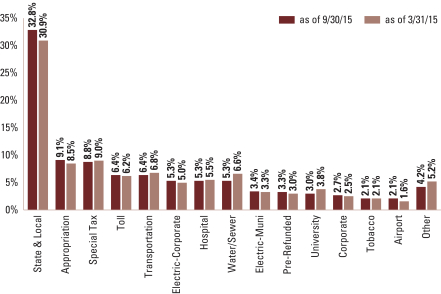
| SECTOR ALLOCATION8 |
| Percentage of Market Value |
| | 8 | | The percentage shown for each investment category reflects the value of investments in that category as a percentage of market value. The above graph depicts the Fund’s investments but may not represent the Fund’s market exposure due to the exclusion of derivatives, if any, as listed in the Additional Investment Information section of the Schedule of Investments. |
9
PORTFOLIO RESULTS
Goldman Sachs High Yield Municipal Fund
Investment Objective
The Fund seeks a high level of current income that is exempt from regular federal income tax and may also consider the potential for capital appreciation.
Portfolio Management Discussion and Analysis
Below, the Goldman Sachs Municipal Fixed Income Investment Management Team discusses the Goldman Sachs High Yield Municipal Fund’s (the “Fund”) performance and positioning for the six-month period ended September 30, 2015 (the “Reporting Period”).
| Q | | How did the Fund perform during the Reporting Period? |
| A | | During the Reporting Period, the Fund’s Class A, C, Institutional and IR Shares generated cumulative total returns, without sales charges, of 0.17%, -0.21%, 0.31% and 0.29%, respectively. These returns compare to the -0.32% cumulative total return of the Fund’s benchmark, the Goldman Sachs High Yield Municipal Fund Composite Index (“High Yield Municipal Composite”), during the same time period. |
| | | The High Yield Municipal Fund Composite is composed 60% of the Barclays Municipal High Yield Bond Index and 40% of the Barclays Municipal Bond Index (with dividends reinvested), which generated cumulative total returns of -1.07% and 0.75%, respectively, during the Reporting Period. |
| Q | | What key factors were responsible for the Fund’s performance during the Reporting Period? |
| A | | The Fund benefited from its underweight position compared to the High Yield Municipal Composite in Puerto Rico municipal bonds. Individual issue selection within the tobacco sector also contributed positively. |
| | | Conversely, the Fund’s holdings of longer maturity securities detracted from relative performance, as the municipal yield curve steepened during the Reporting Period, meaning the differential between longer-term and shorter-term yields widened. (Yield curve is a spectrum of maturities.) In addition, the Fund’s tactical management of its duration positioning detracted from relative results. (Duration is a measure of the Fund’s sensitivity to changes in interest rates.) |
| Q | | Which municipal bond market sectors most significantly affected Fund performance? |
| A | | The Fund’s overweight position relative to the High Yield Municipal Composite in the hospital sector added to relative returns, as hospital bonds recorded strong gains during the Reporting Period. The Fund’s underweight position in Puerto Rico bonds also enhanced results, as the commonwealth’s debt generated a negative absolute return in the High Yield Municipal Composite. |
| Q | | How did duration and yield curve positioning decisions affect the Fund’s performance? |
| A | | During the Reporting Period, the tactical management of the Fund’s duration positioning versus that of the High Yield Municipal Composite detracted from relative performance. Although the Fund benefited from a shorter duration position when municipal yields rose during May and June 2015, the same positioning hurt performance as municipal yields fell in the latter part of the Reporting Period. |
| Q | | How did the Fund use derivatives and similar instruments during the Reporting Period? |
| A | | The Fund used municipal credit default swaps as we sought to capture the upside potential of select securities that were trading below what we considered their intrinsic value. Also during the Reporting Period, the Fund used municipal inverse variable rate securities to take advantage of the steepness of the municipal yield curve, wherein yields on shorter-term maturity municipal bonds were lower than those on longer-term maturity municipal bonds. These securities have an inverse relationship to short-term interest rates — the interest rate they pay generally increases as short-term interest rates fall and vice versa — and they therefore have the potential to increase or decrease the Fund’s income. In addition, the Fund employed interest rate swaps, tied to LIBOR (London interbank offered rates, which are floating interest rates widely used as reference rates in bank, corporate and government lending agreements), to manage the Fund’s duration position. The use of interest rate swaps had a positive impact on the Fund’s performance during the Reporting Period. |
10
PORTFOLIO RESULTS
| Q | | What changes did you make in the Fund’s weightings and investments during the Reporting Period? |
| A | | During the Reporting Period, the Fund’s duration position fluctuated between approximately 8.00 years and 6.50 years and ended the Reporting Period at 7.63 years. We reduced the Fund’s exposure to hospital bonds but maintained an overweight position relative to the High Yield Municipal Composite. We also decreased the Fund’s exposure to toll road bonds. We increased the Fund’s allocation to the municipal debt of Illinois and decreased its exposure to the municipal debt of Florida. |
| Q | | How was the Fund positioned relative to its benchmark index at the end of the Reporting Period? |
| A | | At the end of the Reporting Period, the Fund was overweight relative to the High Yield Municipal Composite in the hospital and special assessment sectors. Compared to the High Yield Municipal Composite, the Fund was underweight higher credit quality AAA-rated and AA-rated issues and overweight lower credit quality BBB-rated issues. |
11
FUND BASICS
High Yield Municipal Fund
as of September 30, 2015
| | | | | | | | | | | | | | | | | | | | | | | | | | | | | | |
| | PERFORMANCE REVIEW | |
| | | April 1, 2015–
September 30, 2015 | | Fund Total
Return
(based
on NAV)1 | | | Goldman
Sachs
High Yield
Municipal
Fund
Composite
Index2 | | | Barclays
Municipal
High Yield
Bond Index3 | | | Barclays
Municipal
Bond Index4 | | | 30-Day
Standardized
Subsidized
Yield5 | | | 30-Day
Standardized
Unsubsidized
Yield5 | | | 30-Day
Taxable
Equivalent
Yield6 | |
| | Class A | | | 0.17 | % | | | -0.32 | % | | | -1.07 | % | | | 0.75 | % | | | 3.18 | % | | | 3.12 | % | | | 5.62 | % |
| | Class C | | | -0.21 | | | | -0.32 | | | | -1.07 | | | | 0.75 | | | | 2.58 | | | | 2.52 | | | | 4.56 | |
| | Institutional | | | 0.31 | | | | -0.32 | | | | -1.07 | | | | 0.75 | | | | 3.62 | | | | 3.61 | | | | 6.40 | |
| | | Class IR | | | 0.29 | | | | -0.32 | | | | -1.07 | | | | 0.75 | | | | 3.57 | | | | 3.51 | | | | 6.31 | |
| | 1 | | The net asset value (“NAV”) represents the net assets of the class of the Fund (ex-dividend) divided by the total number of shares of the class outstanding. The Fund’s performance assumes the reinvestment of dividends and other distributions. The Fund’s performance does not reflect the deduction of any applicable sales charges. |
| | 2 | | The Goldman Sachs High Yield Municipal Fund Composite Index is comprised of the Barclays Municipal High Yield Bond Index (60%) (with dividends reinvested) and the Barclays Municipal Bond Index (40%) (with dividends reinvested). |
| | 3 | | The Barclays Municipal High Yield Bond Index is an unmanaged index made up of bonds that are non-investment grade, unrated, or rated below Ba1 by Moody’s Investors Service with a remaining maturity of at least one year. The Barclays Municipal High Yield Bond Index does not include any deduction for fees, expenses or taxes. It is not possible to invest directly in an index. |
| | 4 | | The Barclays Municipal Bond Index is an unmanaged broad-based total return index composed of approximately 40,000 investment grade, fixed rate, and tax-exempt issues, with a remaining maturity of at least one year. The Barclays Municipal Bond Index does not reflect any deduction for fees, expenses or taxes. It is not possible to invest directly in an index. |
| | 5 | | The method of calculation of the 30-Day Standardized Subsidized Yield is mandated by the Securities and Exchange Commission and is determined by dividing the net investment income per share earned during the last 30 days of the period by the maximum public offering price (“POP”) per share on the last day of the period. This number is then annualized. The 30-Day Standardized Subsidized Yield reflects fee waivers and/or expense reimbursements recorded by the Fund during the period. Without waivers and/or reimbursements, yields would be reduced. This yield does not necessarily reflect income actually earned and distributed by the Fund and, therefore, may not be correlated with the dividends or other distributions paid to shareholders. The 30-Day Standardized Unsubsidized Yield does not adjust for any fee waivers and/or expense reimbursements in effect. If the Fund does not incur any fee waivers and/or expense reimbursements during the period, the 30-Day Standardized Subsidized Yield and 30-Day Standardized Unsubsidized Yield will be identical. |
| | 6 | | The 30-Day Taxable Equivalent Yield of the Fund is calculated by dividing the current 30-Day Standardized Subsidized Yield by 1 minus the highest 2013 federal income tax rate of 43.4%. |
The returns set forth in the table above represent past performance. Past performance does not guarantee future results. The Fund’s investment return and principal value will fluctuate so that an investor’s shares, when redeemed, may be worth more or less than their original cost. Current performance may be lower or higher than the performance quoted above. Please visit our web site at www.GSAMFUNDS.com to obtain the most recent month-end returns. Performance reflects applicable fee waivers and/or expense limitations in effect during the periods shown. In their absence, performance would be reduced. Returns do not reflect the deduction of taxes that a shareholder would pay on Fund distributions or the redemption of Fund shares.
12
FUND BASICS
| | | | | | | | | | | | | | | | | | | | |
| | STANDARDIZED TOTAL RETURNS7 |
| | | For the period ended 9/30/15 | | One Year | | | Five Years | | | Ten Years | | | Since Inception | | | Inception Date |
| | Class A | | | -2.45 | % | | | 4.67 | % | | | 2.54 | % | | | 4.33 | % | | 4/3/00 |
| | Class C | | | 0.36 | | | | 4.86 | | | | 2.25 | | | | 3.86 | | | 4/3/00 |
| | Institutional | | | 2.32 | | | | 5.96 | | | | 3.34 | | | | 5.01 | | | 4/3/00 |
| | | Class IR | | | 2.39 | | | | 5.94 | | | | N/A | | | | 6.51 | | | 7/30/10 |
| | 7The | | Standardized Total Returns are average annual total returns or cumulative total returns (only if the performance period is one year or less) as of the most recent calendar quarter-end. They assume reinvestment of all distributions at NAV. These returns reflect a maximum initial sales charge of 4.5% for Class A Shares and the assumed contingent deferred sales charge for Class C Shares (1% if redeemed within 12 months of purchase). Because Institutional and Class IR Shares do not involve a sales charge, such a charge is not applied to their Standardized Total Returns. The Fund will charge a 2% redemption fee on the redemption of shares (including by exchange) held for 60 calendar days or less. The performance figures do not reflect the deduction of the redemption fee. If reflected, the redemption fee would reduce the performance quoted. |
The returns set forth in the table above represent past performance. Past performance does not guarantee future results. The Fund’s investment return and principal value will fluctuate so that an investor’s shares, when redeemed, may be worth more or less than their original cost. Current performance may be lower or higher than the performance quoted above. Please visit our web site at www.GSAMFUNDS.com to obtain the most recent month-end returns. Performance reflects applicable fee waivers and/or expense limitations in effect during the periods shown. In their absence, performance would be reduced. Returns do not reflect the deduction of taxes that a shareholder would pay on Fund distributions or the redemption of Fund shares.
| | | | | | | | | | |
| | EXPENSE RATIOS8 | |
| | | | | Net Expense Ratio (Current) | | | Gross Expense Ratio (Before Waivers) | |
| | Class A | | | 0.86 | % | | | 0.93 | % |
| | Class C | | | 1.61 | | | | 1.68 | |
| | Institutional | | | 0.57 | | | | 0.59 | |
| | | Class IR | | | 0.61 | | | | 0.68 | |
| | 8The | | expense ratios of the Fund, both current (net of applicable fee waivers and/or expense limitations) and before waivers (gross of applicable fee waivers and/or expense limitations) are as set forth above according to the most recent publicly available Prospectus for the Fund and may differ from the expense ratios disclosed in the Financial Highlights in this report. Pursuant to a contractual arrangement, the Fund’s waivers and/or expense limitations will remain in place through at least July 29, 2016, and prior to such date the Investment Adviser may not terminate the arrangements without the approval of the Fund’s Board of Trustees. If these arrangements are discontinued in the future, the expense ratios may change without shareholder approval. |
13
FUND BASICS
|
| SECTOR ALLOCATION9 |
| Percentage of Market Value |
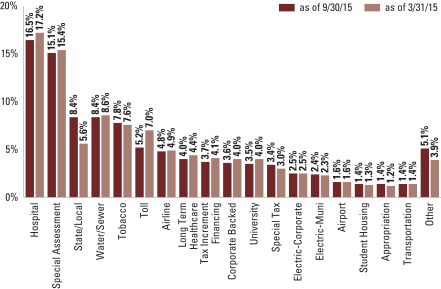
| | 9 | | The percentage shown for each investment category reflects the value of investments in that category as a percentage of market value. The above graph depicts the Fund’s investments but may not represent the Fund’s market exposure due to the exclusion of derivatives, if any, as listed in the Additional Investment Information section of the Schedule of Investments. |
14
PORTFOLIO RESULTS
Goldman Sachs Short Duration Tax-Free Fund
Investment Objective
The Fund seeks a high level of current income, consistent with relatively low volatility of principal, that is exempt from regular federal income tax.
Portfolio Management Discussion and Analysis
Below, the Goldman Sachs Municipal Fixed Income Investment Management Team discusses the Goldman Sachs Short Duration Tax-Free Fund’s (the “Fund”) performance and positioning for the six-month period ended September 30, 2015 (the “Reporting Period”).
| Q | | How did the Fund perform during the Reporting Period? |
| A | | During the Reporting Period, the Fund’s Class A, C, Institutional, Service and IR Shares generated cumulative total returns, without sales charges, of -0.14%, -0.34%, 0.03%, -0.22% and -0.01%, respectively. These returns compare to the 0.66% cumulative total return of the Fund’s benchmark, the Barclays Municipal Bond 1-3 Year Blend Index (the “Index”), during the same time period. |
| Q | | What key factors were responsible for the Fund’s performance during the Reporting Period? |
| A | | The Fund suffered due to its holdings of longer-term securities, as the municipal yield curve steepened during the Reporting Period, meaning the differential between longer-term and shorter-term yields widened. The Fund’s duration and yield curve strategy also detracted from relative results. (Duration is a measure of the Fund’s sensitivity to changes in interest rates. Yield curve is a spectrum of maturities.) |
| On | the positive side, the Fund’s sector positioning and bottom-up issue selection added to relative returns. |
| Q | | Which municipal bond market sectors most significantly affected Fund performance? |
| A | | Although sector positioning added to relative performance overall, the Fund was hurt by its holdings of Puerto Rico bonds. These investments detracted from Fund returns as Puerto Rico’s debt experienced significant volatility amidst persistent headline news. |
| The | Fund benefited from its exposure to local general obligation bonds. Positioning in the toll road sector also added to returns. Additionally, individual issue selection among pre-refunded bonds bolstered results. (Pre-refunding, also known as advance refunding, is a procedure in which a municipality issues a second bond at a lower interest rate, and uses the proceeds from the sale of the second bond to invest in “escrow collateral” for the first bond. The escrow collateral is typically in Treasury securities. Pre-refunded municipal bonds no longer represent the credit risk profile of the original borrower, and given the high credit quality of the escrow collateral, they often increase in value — sometimes significantly.) |
| Q | | How did duration and yield curve positioning decisions affect the Fund’s performance? |
| A | | During the Reporting Period, the Fund’s duration positioning detracted from relative performance. The Fund held a longer duration position relative to the Index at the beginning of the Reporting Period, which hurt performance as shorter-maturity municipal yields — especially those in the two-year portion of the municipal yield curve — rose, particularly during May 2015. |
| Q | | How did the Fund use derivatives and similar instruments during the Reporting Period? |
| A | | During the Reporting Period, the Fund used municipal inverse variable rate securities to seek to take advantage of the steepness of the municipal yield curve, wherein yields on shorter-term maturity municipal bonds were lower than those on longer-term maturity municipal bonds. These securities have an inverse relationship to short-term interest rates — the interest rate they pay generally increases as short-term interest rates fall and vice versa — and they therefore have the potential to increase or decrease the Fund’s income. In addition, the Fund used municipal credit default swaps as we sought to capture the upside potential of select securities that were trading below what we considered their intrinsic value. Derivatives did not have a material impact, on a net basis, on the Fund’s performance during the Reporting Period. |
15
PORTFOLIO RESULTS
| Q | | What changes did you make in the Fund’s weightings and investments during the Reporting Period? |
| A | | During the Reporting Period, we shifted the Fund from a longer duration position relative to that of the Index to a comparatively short duration position. We reduced the Fund’s exposure to water and sewer credits. We increased the Fund’s exposure to general obligation bonds during the Reporting Period. |
| Q | | How was the Fund positioned relative to its benchmark index at the end of the Reporting Period? |
| A | | At the end of the Reporting Period, the Fund had a short duration position compared to that of the Index. It was slightly underweight relative to the Index in higher credit quality AAA-rated issues, and it was overweight BBB-rated issues and other lower credit quality rated municipal bonds. In addition, the Fund was overweight in Illinois, Texas and Puerto Rico municipal bonds at the end of the Reporting Period. |
16
FUND BASICS
Short Duration Tax-Free Fund
as of September 30, 2015
| | | | | | | | | | | | | | | | | | | | | | |
| | PERFORMANCE REVIEW | |
| | | April 1, 2015– September 30, 2015 | | Fund Total Return
(based on NAV)1 | | | Barclays
Municipal 1–3
Year Blend
Index2 | | | 30-Day
Standardized
Subsidized
Yield3 | | | 30-Day
Standardized
Unsubsidized
Yield3 | | | 30-Day Taxable
Equivalent
Yield4 | |
| | Class A | | | -0.14 | % | | | 0.66 | % | | | 0.76 | % | | | 0.73 | % | | | 1.34 | % |
| | Class C | | | -0.34 | | | | 0.66 | | | | 0.38 | | | | 0.00 | | | | 0.67 | |
| | Institutional | | | 0.03 | | | | 0.66 | | | | 1.11 | | | | 1.08 | | | | 1.96 | |
| | Service | | | -0.22 | | | | 0.66 | | | | 0.61 | | | | 0.58 | | | | 1.08 | |
| | | Class IR | | | -0.01 | | | | 0.66 | | | | 1.02 | | | | 0.99 | | | | 1.80 | |
| | 1 | | The net asset value (“NAV”) represents the net assets of the class of the Fund (ex-dividend) divided by the total number of shares of the class outstanding. The Fund’s performance reflects the reinvestment of dividends and other distributions. The Fund’s performance does not reflect the deduction of any applicable sales charges. |
| | 2 | | The Municipal 1-3 Year Blend Index (with dividends reinvested), an unmanaged index, represents investment grade municipal bonds with maturities greater than one year and less than 4 years, and does not reflect any deduction for fees, expenses or taxes. It is not possible to invest directly in an index. |
| | 3 | | The method of calculation of the 30-Day Standardized Subsidized Yield is mandated by the Securities and Exchange Commission and is determined by dividing the net investment income per share earned during the last 30 days of the period by the maximum public offering price (“POP”) per share on the last day of the period. This number is then annualized. The 30-Day Standardized Subsidized Yield reflects fee waivers and/or expense reimbursements recorded by the Fund during the period. Without waivers and/or reimbursements, yields would be reduced. This yield does not necessarily reflect income actually earned and distributed by the Fund and, therefore, may not be correlated with the dividends or other distributions paid to shareholders. The 30-Day Standardized Unsubsidized Yield does not adjust for any fee waivers and/or expense reimbursements in effect. If the Fund does not incur any fee waivers and/or expense reimbursements during the period, the 30-Day Standardized Subsidized Yield and 30-Day Standardized Unsubsidized Yield will be identical. |
| | 4 | | The 30-Day Taxable Equivalent Yield of the Fund is calculated by dividing the current 30-Day Standardized Subsidized Yield by 1 minus the highest 2013 federal income tax rate of 43.4%. |
The returns set forth in the table above represent past performance. Past performance does not guarantee future results. The Fund’s investment return and principal value will fluctuate so that an investor’s shares, when redeemed, may be worth more or less than their original cost. Current performance may be lower or higher than the performance quoted above. Please visit our web site at www.GSAMFUNDS.com to obtain the most recent month-end returns. Performance reflects applicable fee waivers and/or expense limitations in effect during the periods shown. In their absence, performance would be reduced. Returns do not reflect the deduction of taxes that a shareholder would pay on Fund distributions or the redemption of Fund shares.
17
FUND BASICS
| | | | | | | | | | | | | | | | | | | | |
| | STANDARDIZED TOTAL RETURNS5 |
| | | For the period ended 9/30/15 | | One Year | | | Five Years | | | Ten Years | | | Since Inception | | | Inception Date |
| | Class A | | | -1.40 | % | | | 0.80 | % | | | 2.10 | % | | | 2.70 | % | | 5/1/97 |
| | Class C | | | -0.96 | | | | 0.69 | | | | 1.67 | | | | 2.03 | | | 8/15/97 |
| | Institutional | | | 0.43 | | | | 1.43 | | | | 2.62 | | | | 3.35 | | | 10/1/92 |
| | Service | | | -0.07 | | | | 0.95 | | | | 2.11 | | | | 2.82 | | | 9/20/94 |
| | | Class IR | | | 0.34 | | | | 1.34 | | | | N/A | | | | 1.38 | | | 7/30/10 |
| | 5 | | The Standardized Total Returns are average annual total returns or cumulative total returns (only if the performance period is one year or less) as of the most recent calendar quarter-end. They assume reinvestment of all distributions at NAV. These returns reflect a maximum initial sales charge of 1.5% for Class A Shares and the assumed contingent deferred sales charge for Class C Shares (0.65% if redeemed within 12 months of purchase). Prior to July 29, 2009, the maximum initial sales charge applicable to Class A Shares of the Fund was 2.0%, which is not reflected in the figures shown. Because Institutional, Service and Class IR Shares do not involve a sales charge, such a charge is not applied to their Standardized Total Returns. |
The returns set forth in the table above represent past performance. Past performance does not guarantee future results. The Fund’s investment return and principal value will fluctuate so that an investor’s shares, when redeemed, may be worth more or less than their original cost. Current performance may be lower or higher than the performance quoted above. Please visit our web site at www.GSAMFUNDS.com to obtain the most recent month-end returns. Performance reflects applicable fee waivers and/or expense limitations in effect during the periods shown. In their absence, performance would be reduced. Returns do not reflect the deduction of taxes that a shareholder would pay on Fund distributions or the redemption of Fund shares.
| | | | | | | | | | |
| | EXPENSE RATIOS6 | |
| | | | | Net Expense Ratio (Current) | | | Gross Expense Ratio (Before Waivers) | |
| | Class A | | | 0.73 | % | | | 0.76 | % |
| | Class C | | | 1.13 | | | | 1.51 | |
| | Institutional | | | 0.39 | | | | 0.41 | |
| | Service | | | 0.89 | | | | 0.92 | |
| | | Class IR | | | 0.48 | | | | 0.51 | |
| | 6 | | The expense ratios of the Fund, both current (net of applicable fee waivers and/or expense limitations) and before waivers (gross of applicable fee waivers and/or expense limitations) are as set forth above according to the most recent publicly available Prospectus for the Fund and may differ from the expense ratios disclosed in the Financial Highlights in this report. Pursuant to a contractual arrangement, the Fund’s waivers and/or expense limitations will remain in place through at least July 29, 2016, and prior to such date the Investment Adviser may not terminate the arrangements without the approval of the Fund’s Board of Trustees. If these arrangements are discontinued in the future, the expense ratios may change without shareholder approval. |
18
FUND BASICS
|
| SECTOR ALLOCATION7 |
| Percentage of Market Value |
| | 7 | | The percentage shown for each investment category reflects the value of investments in that category as a percentage of market value. The above graph depicts the Fund’s investments but may not represent the Fund’s market exposure due to the exclusion of derivatives, if any, as listed in the Additional Investment Information section of the Schedule of Investments. |
19
GOLDMAN SACHS DYNAMIC MUNICIPAL INCOME FUND
Schedule of Investments
September 30, 2015 (Unaudited)
| | | | | | | | | | | | | | |
Principal
Amount | | | Interest
Rate | | | Maturity
Date | | | Value | |
| | State-Specific Municipal Debt Obligations – 97.5% | |
| | Alabama – 2.4% | |
| Alabama State Port Authority RB for Docks Facilities Series 2010
(A-/NR) |
|
| $ | 2,500,000 | | | | 5.750 | % | | | 10/01/30 | | | $ | 2,930,050 | |
| Alexander City Special Care Facilities Financing Authority
Medical Facilities RB for Russell Hospital Corp. Series 2006 A
(BB-/NR) |
|
| | 1,780,000 | | | | 5.750 | | | | 12/01/36 | | | | 1,800,666 | |
| Auburn University General Fee RB Refunding Series 2015 A
(AA-/Aa2) |
|
| | 1,205,000 | | | | 4.000 | | | | 06/01/19 | | | | 1,329,862 | |
| Health Care Authority RB for Baptist Health Series 2006 D
(BBB+/A3) |
|
| | 575,000 | | | | 5.000 | | | | 11/15/17 | | | | 577,743 | |
| | 100,000 | | | | 5.000 | | | | 11/15/21 | | | | 100,485 | |
| Jefferson County Senior Lien Sewer RB Warrants Series 2013 A
(AGM) (AA/A2) |
|
| | 350,000 | | | | 5.000 | | | | 10/01/44 | | | | 373,240 | |
| Jefferson County Subordinate Lien Sewer RB Warrants
Series 2013 D (BBB-/NR) |
|
| | 1,000,000 | | | | 5.000 | | | | 10/01/21 | | | | 1,094,540 | |
| | 3,000,000 | | | | 6.000 | | | | 10/01/42 | | | | 3,349,950 | |
| | 3,000,000 | | | | 6.500 | | | | 10/01/53 | | | | 3,429,060 | |
| | | | | | | | | | | | | | |
| | | | | | | | | | | | | 14,985,596 | |
| | |
| | Arizona – 1.9% | |
| Arizona Health Facilities Authority Hospital RB for Banner
Health Series 2007 B (AA-/NR)(a) |
|
| | 5,150,000 | | | | 1.000 | | | | 01/01/37 | | | | 4,473,341 | |
| Arizona State University System RB Refunding Series 2015 B
(AA/Aa3) |
|
| | 3,000,000 | | | | 5.000 | | | | 07/01/19 | | | | 3,421,440 | |
| Maricopa County Arizona Pollution Control Corp. PCRB
Refunding for El Paso Electric Co. Project Series 2009 A
(BBB/Baa1) |
|
| | 2,200,000 | | | | 7.250 | | | | 02/01/40 | | | | 2,500,894 | |
| Yavapai County IDA Solid Waste Disposal RB for Waste
Management, Inc. Project Series 2003 A-2 (AMT) (A-/NR)(b) |
|
| | 1,410,000 | | | | 1.600 | | | | 03/01/18 | | | | 1,393,207 | |
| | | | | | | | | | | | | | |
| | | | | | | | | | | | | 11,788,882 | |
| | |
| | Arkansas – 0.7% | |
| Arkansas State Development Finance Authority Hospital RB
Refunding for Washington Regional Medical Center
Series 2015 B (NR/Baa1) |
|
| | 770,000 | | | | 3.000 | | | | 02/01/18 | | | | 791,090 | |
| | 1,845,000 | | | | 3.000 | | | | 02/01/19 | | | | 1,898,579 | |
| Arkansas State Development Finance Authority RB for Single
Family Mortgage-Backed Securities Series 2008 B (AMT)
(GNMA) (FNMA) (AA+/NR) |
|
| | 505,000 | | | | 5.500 | | | | 07/01/23 | | | | 530,321 | |
| City of Little Rock Sewer RB Refunding Series 2015 (NR/Aa3) | |
| | 1,000,000 | | | | 4.000 | | | | 04/01/21 | | | | 1,118,930 | |
| | | | | | | | | | | | | | |
| | | | | | | | | | | | | 4,338,920 | |
| | |
Principal
Amount | | | Interest
Rate | | | Maturity
Date | | | Value | |
| | State-Specific Municipal Debt Obligations – (continued) | |
| | California – 17.8% | |
| Alameda County Oakland Unified School District GO Refunding
Bonds Series 2015 (NR/NR) |
|
| $ | 1,500,000 | | | | 5.000 | % | | | 08/01/19 | | | $ | 1,677,075 | |
| California Educational Facilities Authority RB for California
Institute of Technology Series 2009 (AA-/Aa2) |
|
| | 5,000,000 | | | | 5.000 | | | | 11/01/39 | | | | 5,640,150 | |
| California Health Facilities Financing Authority RB for
Providence Health & Services Series 2008 C (AA-/Aa3)(c) |
|
| | 1,000,000 | | | | 6.500 | | | | 10/01/18 | | | | 1,170,280 | |
| California Municipal Finance Authority Student Housing RB for
Bowles Hall Foundation Series 2015 A (NR/Baa3) |
|
| | 400,000 | | | | 5.000 | | | | 06/01/35 | | | | 433,424 | |
| California State Various Purpose GO Bonds Series 2009
(AA-/Aa3) |
|
| | 5,000,000 | | | | 5.250 | | | | 10/01/25 | | | | 5,784,300 | |
| | 5,000,000 | | | | 6.500 | | | | 04/01/33 | | | | 5,950,050 | |
| | 2,750,000 | | | | 6.000 | | | | 04/01/38 | | | | 3,205,867 | |
| California State Various Purpose GO Bonds Series 2010
(AA-/Aa3) |
|
| | 1,250,000 | | | | 6.000 | | | | 03/01/33 | | | | 1,501,337 | |
| | 1,500,000 | | | | 5.500 | | | | 03/01/40 | | | | 1,735,410 | |
| California Statewide Communities Development Authority
Community Facilities District No. 2007-01 Special Tax
Refunding for Orinda Wilder Project Series 2015 (NR/NR) |
|
| | 345,000 | | | | 5.000 | | | | 09/01/30 | | | | 365,155 | |
| | 375,000 | | | | 5.000 | | | | 09/01/37 | | | | 387,716 | |
| California Statewide Communities Development Authority RB
for Enloe Medical Center Series 2008 (CAL MTG INS)
(AA-/NR) |
|
| | 1,435,000 | | | | 5.750 | | | | 08/15/38 | | | | 1,603,010 | |
| California Statewide Communities Development Authority RB
for Sutter Health Series 2011 A (AA-/Aa3) |
|
| | 2,000,000 | | | | 6.000 | | | | 08/15/42 | | | | 2,336,440 | |
| California Statewide Community Development Authority Water
& Wastewater RB Balance Series 2004 (AGM) (AA/A2) |
|
| | 15,000 | | | | 5.250 | | | | 10/01/19 | | | | 15,049 | |
| Citrus Community College District GO Bonds Capital
Appreciation for Election of 2004 Series 2009 C (AA-/Aa2)(d) |
|
| | 3,500,000 | | | | 0.000 | | | | 06/01/34 | | | | 1,617,700 | |
| Fullerton Community Facilities District No. 1 Special Tax
Refunding Bonds for Amerige Heights Series 2012 (A-/NR) |
|
| | 500,000 | | | | 5.000 | | | | 09/01/32 | | | | 552,090 | |
| Golden State Tobacco Securitization Corp. California Tobacco
Settlement RB Asset-Backed Bonds for Capital Appreciation
Subseries 2007 B (CCC+/NR)(d) |
|
| | 18,000,000 | | | | 0.000 | | | | 06/01/47 | | | | 1,609,200 | |
| Golden State Tobacco Securitization Corp. California Tobacco
Settlement RB Asset-Backed Bonds for Capital Appreciation
Subseries 2007 C (CCC/NR)(d) |
|
| | 19,500,000 | | | | 0.000 | | | | 06/01/47 | | | | 734,955 | |
| Golden State Tobacco Securitization Corp. California Tobacco
Settlement RB Asset-Backed Bonds Series 2007 A-1 (B/B3) |
|
| | 2,500,000 | | | | 4.500 | | | | 06/01/27 | | | | 2,396,850 | |
| Los Angeles Community College District GO Bonds for 2008
Election Series 2010 C (AA+/Aa1) |
|
| | 5,000,000 | | | | 5.250 | | | | 08/01/39 | | | | 5,770,700 | |
| | |
| | |
| 20 | | The accompanying notes are an integral part of these financial statements. |
GOLDMAN SACHS DYNAMIC MUNICIPAL INCOME FUND
| | | | | | | | | | | | | | |
Principal
Amount | | | Interest
Rate | | | Maturity
Date | | | Value | |
| | State-Specific Municipal Debt Obligations – (continued) | |
| | California – (continued) | |
| Los Angeles County Metropolitan Transportation Authority RB
Refunding for Union Station Project Series 2004 D (AMBAC)
(A+/A1)(a) |
|
| $ | 2,100,000 | | | | 0.436 | % | | | 07/01/27 | | | $ | 2,004,338 | |
| Menifee Union School District Riverside County GO Bonds
Capital Appreciation for Election of 2008 Series 2009 C
(ASSURED GTY) (AA/Aa3)(d) |
|
| | 2,000,000 | | | | 0.000 | | | | 08/01/37 | | | | 775,320 | |
| | 4,500,000 | | | | 0.000 | | | | 08/01/38 | | | | 1,655,460 | |
| | 4,500,000 | | | | 0.000 | | | | 08/01/39 | | | | 1,573,470 | |
| Merced City School District GO Bonds Capital Appreciation for
Election of 2003 Series 2005 (NATL-RE) (AA-/NR)(d) |
|
| | 1,205,000 | | | | 0.000 | | | | 08/01/26 | | | | 850,091 | |
| M-S-R Energy Authority Gas RB Series 2009 A (A-/NR) | |
| | 1,750,000 | | | | 6.500 | | | | 11/01/39 | | | | 2,304,750 | |
�� | M-S-R Energy Authority Gas RB Series 2009 C (A-/NR) | |
| | 3,500,000 | | | | 6.125 | | | | 11/01/29 | | | | 4,406,815 | |
| Mt. Diablo Unified School District GO Bonds Capital
Appreciation for Election of 2010 Series 2010 A (AGM)
(AA/Aa3)(e) |
|
| | 5,000,000 | | | | 0.000 | | | | 08/01/35 | | | | 4,064,100 | |
| Ontario Redevelopment Financing Authority Lease RB for
Capital Projects Series 2007 (AMBAC) (AA-/WR) |
|
| | 1,110,000 | | | | 5.250 | | | | 08/01/22 | | | | 1,199,377 | |
| Palomar Pomerado Health COPS Series 2009 (BB+/Ba1) | |
| | 2,500,000 | | | | 6.750 | | | | 11/01/39 | | | | 2,768,275 | |
| Palomar Pomerado Health GO Bonds Capital Appreciation for
Election of 2004 Series 2009 A (ASSURED GTY) (AA/A2)(d) |
|
| | 2,150,000 | | | | 0.000 | | | | 08/01/31 | | | | 1,101,832 | |
| | 4,150,000 | | | | 0.000 | | | | 08/01/32 | | | | 2,018,768 | |
| | 3,500,000 | | | | 0.000 | | | | 08/01/33 | | | | 1,617,000 | |
| Palomar Pomerado Health GO Bonds Capital Appreciation for
Election of 2004 Series 2009 A (ASSURED GTY) (AA/A2)(e) |
|
| | 6,450,000 | | | | 0.000 | | | | 08/01/38 | | | | 6,750,119 | |
| Port of Oakland RB Refunding Senior Lien Series 2012 P
(AMT) (A+/A2) |
|
| | 4,000,000 | | | | 5.000 | | | | 05/01/31 | | | | 4,428,600 | |
| River Islands Public Financing Authority Community Facilities
District No. 2003-1 Special Tax Refunding Bonds
Series 2015 A-1 (NR/NR) |
|
| | 5,000,000 | | | | 5.000 | | | | 09/01/27 | | | | 5,122,450 | |
| Sacramento County Sanitation District Financing Authority RB
Refunding for Sacramento County Regional Series 2007 B
(NATL-RE FGIC) (AA/Aa3)(a) |
|
| | 5,000,000 | | | | 0.747 | | | | 12/01/35 | | | | 4,463,550 | |
| San Diego County Water Authority COPS Series 2008 A (AGM)
(AA/Aa2)(c) |
|
| | 830,000 | | | | 5.000 | | | | 05/01/18 | | | | 921,267 | |
| San Diego County Water Authority COPS Series 2008 A (AGM)
(AA+/Aa2) |
|
| | 4,170,000 | | | | 5.000 | | | | 05/01/33 | | | | 4,529,162 | |
| San Diego Unified School District GO Bonds for Election of 2008
Series 2010 C (AA-/Aa3)(d) |
|
| | 5,000,000 | | | | 0.000 | | | | 07/01/39 | | | | 1,795,950 | |
| | |
| | State-Specific Municipal Debt Obligations – (continued) | |
| | California – (continued) | |
| San Francisco City & County Airport Commission San Francisco
International Airport RB Refunding Second Series 2013 A
(AMT) (A+/A1) |
|
| $ | 2,000,000 | | | | 5.500 | % | | | 05/01/28 | | | $ | 2,351,200 | |
| San Joaquin Hills Transportation Corridor Agency RB Refunding
for Capital Appreciation Series 1997 A (NATL-RE) (AA-/A3)(d) |
|
| | 1,605,000 | | | | 0.000 | | | | 01/15/26 | | | | 1,064,003 | |
| San Joaquin Hills Transportation Corridor Agency RB Refunding
for Toll Road Senior Lien Series 2014 A (BBB-/NR) |
|
| | 1,000,000 | | | | 5.000 | | | | 01/15/29 | | | | 1,101,250 | |
| University of California Regents Medical Center Pooled RB
Refunding Series 2007 C-2 (NATL-RE) (AA-/Aa3)(a) |
|
| | 5,000,000 | | | | 0.955 | | | | 05/15/43 | | | | 4,394,850 | |
| Vernon California Redevelopment Agency Tax Allocation for
Industrial Redevelopment Project Series 2005 (NATL-RE)
(AA-/A3) |
|
| | 725,000 | | | | 5.250 | | | | 09/01/19 | | | | 725,682 | |
| West Contra Costa Unified School District GO Bonds Capital
Appreciation for Election of 2002 Series 2004 C
(NATL-RE FGIC) (AA-/A3)(d) |
|
| | 1,175,000 | | | | 0.000 | | | | 08/01/25 | | | | 834,849 | |
| | | | | | | | | | | | | | |
| | | | | | | | | | | | | 109,309,286 | |
| | |
| | Colorado – 2.2% | |
| Colorado Health Facilities Authority RB Refunding for Covenant
Retirement Communities, Inc. Series 2015 A (BBB+/NR) |
|
| | 550,000 | | | | 2.000 | | | | 12/01/16 | | | | 555,159 | |
| | 625,000 | | | | 4.000 | | | | 12/01/19 | | | | 665,844 | |
| Denver City & County Airport RB Series 2013 A (AMT) (A/A2) | |
| | 5,000,000 | | | | 5.500 | | | | 11/15/29 | | | | 5,769,350 | |
| Denver Colorado Health and Hospital Authority Healthcare RB
Series B (BBB/NR)(a) |
|
| | 5,000,000 | | | | 1.317 | | | | 12/01/33 | | | | 4,632,300 | |
| E-470 Public Highway Authority RB Series 2010 A
(BBB+/Baa1)(d) |
|
| | 6,000,000 | | | | 0.000 | | | | 09/01/40 | | | | 2,034,480 | |
| | | | | | | | | | | | | | |
| | | | | | | | | | | | | 13,657,133 | |
| | |
| | Delaware – 1.4% | |
| New Castle County Delaware GO Bonds Series 2015 (AAA/Aaa) | |
| | 5,000,000 | | | | 5.000 | | | | 10/01/26 | | | | 6,239,150 | |
| University of Delaware RB Series 2015 (AA+/Aa1) | |
| | 1,805,000 | | | | 5.000 | | | | 11/01/33 | | | | 2,100,136 | |
| | | | | | | | | | | | | | |
| | | | | | | | | | | | | 8,339,286 | |
| | |
| | District of Columbia – 1.2% | |
| District of Columbia Tobacco Settlement Financing Corp. RB
Asset-Backed Bonds Series 2001 (A/A1) |
|
| | 95,000 | | | | 6.250 | | | | 05/15/24 | | | | 95,679 | |
| District of Columbia Tobacco Settlement Financing Corp. RB
Asset-Backed Bonds Series 2001 (BBB/Baa1) |
|
| | 1,000,000 | | | | 6.500 | | | | 05/15/33 | | | | 1,220,720 | |
| District of Columbia Water & Sewer Authority RB Public Utility
Senior Lien Series 2009 A (AA+/Aa2)(c) |
|
| | 5,000,000 | | | | 6.000 | | | | 10/01/18 | | | | 5,761,550 | |
| | | | | | | | | | | | | | |
| | | | | | | | | | | | | 7,077,949 | |
| | |
| | |
| The accompanying notes are an integral part of these financial statements. | | 21 |
GOLDMAN SACHS DYNAMIC MUNICIPAL INCOME FUND
Schedule of Investments (continued)
September 30, 2015 (Unaudited)
| | | | | | | | | | | | | | |
Principal
Amount | | | Interest
Rate | | | Maturity
Date | | | Value | |
| | State-Specific Municipal Debt Obligations – (continued) | |
| | Florida – 8.8% | |
| Arbor Greene Community Development District Special
Assessment Refunding Series 2006 (A/NR) |
|
| $ | 895,000 | | | | 5.000 | % | | | 05/01/19 | | | $ | 936,626 | |
| Bartram Park Community Development District Special
Assessment RB Refunding for City of Jacksonville Florida
Senior Lien Series 2015 A-1 (BBB/NR) |
|
| | 500,000 | | | | 4.250 | | | | 05/01/29 | | | | 496,420 | |
| | 500,000 | | | | 4.500 | | | | 05/01/35 | | | | 500,015 | |
| Citizens Property Insurance Corp. Senior Secured RB for High
Risk Account Series 2009 A-1 (A+/A1) |
|
| | 3,650,000 | | | | 5.500 | | | | 06/01/17 | | | | 3,929,006 | |
| City of Cape Coral Water & Sewer RB Refunding Series 2015
(A/A1) |
|
| | 1,000,000 | | | | 4.000 | | | | 10/01/34 | | | | 1,024,020 | |
| Coconut Cay Community Development District Special
Assessment Series 2006 (NR/NR) |
|
| | 840,000 | | | | 5.375 | | | | 05/01/36 | | | | 842,352 | |
| Country Walk Community Development District Special
Assessment RB Refunding Senior Lien Series 2015 A-1
(BBB+/NR) |
|
| | 215,000 | | | | 2.875 | | | | 05/01/21 | | | | 213,955 | |
| | 220,000 | | | | 3.000 | | | | 05/01/22 | | | | 217,662 | |
| | 225,000 | | | | 3.250 | | | | 05/01/23 | | | | 222,464 | |
| | 235,000 | | | | 3.375 | | | | 05/01/24 | | | | 232,321 | |
| | 245,000 | | | | 3.500 | | | | 05/01/25 | | | | 241,854 | |
| Covington Park Florida Community Development District Special
Assessment Refunding for Capital Improvement Series 2005
(BBB/NR) |
|
| | 340,000 | | | | 5.000 | | | | 05/01/21 | | | | 341,187 | |
| Crossings At Fleming Island Community Development District
RB Refunding Series 2007 (NATL-RE) (AA-/A3) |
|
| | 125,000 | | | | 4.750 | | | | 10/01/36 | | | | 128,461 | |
| Florida State Municipal Power Agency RB Series 2009 A
(A+/A2) |
|
| | 1,000,000 | | | | 6.250 | | | | 10/01/31 | | | | 1,184,100 | |
| Greater Orlando Aviation Authority Airport Facilities RB
Refunding for Jetblue Airways Corp. Project Series 2013
(AMT) (NR/NR) |
|
| | 920,000 | | | | 5.000 | | | | 11/15/36 | | | | 938,032 | |
| Greater Orlando Aviation Authority RB Refunding Series 2012 A
(AMT) (AA-/Aa3) |
|
| | 2,000,000 | | | | 5.000 | | | | 10/01/21 | | | | 2,339,520 | |
| Hamal Florida Community Development District Special
Assessment for Refunding and Improvement Series 2006 A
(NATL-RE) (AA-/A3) |
|
| | 2,755,000 | | | | 5.375 | | | | 05/01/22 | | | | 2,823,572 | |
| Heritage Landing Community Development District Special
Assessment Refunding Bonds Series 2015 (BBB/NR) |
|
| | 585,000 | | | | 3.375 | | | | 05/01/23 | | | | 577,401 | |
| | 605,000 | | | | 3.500 | | | | 05/01/24 | | | | 596,566 | |
| | 630,000 | | | | 3.625 | | | | 05/01/25 | | | | 620,260 | |
| | 650,000 | | | | 3.750 | | | | 05/01/26 | | | | 639,178 | |
| High Ridge Quantum Community Development District Special
Assessment for Boyton Beach Series 2005 A (NR/NR) |
|
| | 1,630,000 | | | | 5.750 | | | | 05/01/35 | | | | 1,631,614 | |
| | |
Principal
Amount | | | Interest
Rate | | | Maturity
Date | | | Value | |
| | State-Specific Municipal Debt Obligations – (continued) | |
| | Florida – (continued) | |
| Hollywood Community Redevelopment Agency RB for Beach
CRA Series 2004 (A-/A3) |
|
| $ | 275,000 | | | | 5.625 | % | | | 03/01/24 | | | $ | 275,423 | |
| Lakewood Ranch Stewardship District Special Assessment RB
for Lakewood Centre North Project Series 2015 (NR/NR) |
|
| | 1,000,000 | | | | 4.250 | | | | 05/01/25 | | | | 985,060 | |
| | 1,735,000 | | | | 4.875 | | | | 05/01/35 | | | | 1,752,801 | |
| | 985,000 | | | | 4.875 | | | | 05/01/45 | | | | 987,266 | |
| Longleaf Community Development District Special Assessment
Refunding Series 2006 (NR/NR)(f) |
|
| | 1,185,000 | | | | 5.375 | | | | 05/01/30 | | | | 805,800 | |
| Meadow Pines Community Development District Special
Assessment Refunding Bonds Senior Lien Series 2014 1
(A-/NR) |
|
| | 750,000 | | | | 4.450 | | | | 05/01/30 | | | | 775,920 | |
| Miami Special Obligation Non-Ad Valorem RB Refunding
Series 2011 A (AGM) (AA/A2) |
|
| | 1,200,000 | | | | 6.000 | | | | 02/01/30 | | | | 1,425,144 | |
| | 1,500,000 | | | | 6.000 | | | | 02/01/31 | | | | 1,780,605 | |
| Miami Special Obligation RB Refunding for Port of Miami
Tunnel Project Series 2012 (A/A2)(g) |
|
| | 5,000,000 | | | | 5.000 | | | | 03/01/30 | | | | 5,659,500 | |
| Miami-Dade County Florida Aviation RB Refunding RMKT
03/17/08 Series 2003 E (AMT) (NATL-RE) (AA-/NR) |
|
| | 575,000 | | | | 5.250 | | | | 10/01/16 | | | | 601,381 | |
| Miromar Lakes Community Development District Capital
Impovement RB Refunding Series 2015 (NR/NR) |
|
| | 1,000,000 | | | | 3.500 | | | | 05/01/20 | | | | 984,610 | |
| North Sumter County Utility Dependent District RB Series 2010
(AGM) (AA/A2) |
|
| | 1,250,000 | | | | 5.375 | | | | 10/01/40 | | | | 1,407,575 | |
| Pentathlon Community Development District Special Assessment
Revenue Refunding Series 2012 (A-/NR) |
|
| | 1,330,000 | | | | 4.500 | | | | 11/01/33 | | | | 1,370,392 | |
| Port Everglades Authority RB for Port Facilities Series 1986
(ETM) (AA+/Aaa)(c) |
|
| | 710,000 | | | | 7.125 | | | | 11/01/16 | | | | 736,881 | |
| Randal Park Community Development District Special
Assessment RB Series 2015 (NR/NR) |
|
| | 875,000 | | | | 4.250 | | | | 11/01/25 | | | | 853,265 | |
| St. Petersburg Health Facilities Authority RB Refunding for All
Children’s Hospital Series 2009 A (AA-/Aa3)(c) |
|
| | 2,000,000 | | | | 6.500 | | | | 11/15/19 | | | | 2,441,040 | |
| Tampa Palms Open Space & Transportation Community
Development District Special Assessment Refunding for
Capital Improvement Area 7 Project Series 2004 (NATL-RE)
(AA-/A3) |
|
| | 875,000 | | | | 4.500 | | | | 05/01/18 | | | | 916,265 | |
| Thousand Oaks Community Development District Special
Assessment Series 2005 A-1 (NR/NR) |
|
| | 815,000 | | | | 5.350 | | | | 05/01/35 | | | | 815,562 | |
| TSR Community Development District Special Assessment RB
for Village 1 Project Series 2015 (NR/NR) |
|
| | 435,000 | | | | 3.625 | | | | 11/01/20 | | | | 435,435 | |
| | 530,000 | | | | 4.375 | | | | 11/01/25 | | | | 528,060 | |
| | |
| | |
| 22 | | The accompanying notes are an integral part of these financial statements. |
GOLDMAN SACHS DYNAMIC MUNICIPAL INCOME FUND
| | | | | | | | | | | | | | |
Principal
Amount | | | Interest
Rate | | | Maturity
Date | | | Value | |
| | State-Specific Municipal Debt Obligations – (continued) | |
| | Florida – (continued) | |
| Turnbull Creek Community Development District Senior Special
Assessment Refunding Bonds Series 2015 A-1 (BBB/NR) |
|
| $ | 1,000,000 | | | | 4.250 | % | | | 05/01/31 | | | $ | 987,630 | |
| Verano #1 Community Development District Special Assessment
Bonds for District #1 Project Series 2015 (NR/NR) |
|
| | 750,000 | | | | 4.750 | | | | 11/01/25 | | | | 744,053 | |
| Verona Walk Community Development District Special
Assessment Senior Lien RB Refunding for Capital
Improvement Series 2013 A-1 (A/NR) |
|
| | 500,000 | | | | 4.250 | | | | 05/01/30 | | | | 503,205 | |
| Village Community Development District No. 6 Special
Assessment Series 2007 (NR/NR) |
|
| | 1,680,000 | | | | 5.250 | | | | 05/01/37 | | | | 1,751,551 | |
| Waters Edge Community Development District Capital
Improvement RB Refunding Senior Lien Series 2015 A-1
(BBB+/NR) |
|
| | 2,150,000 | | | | 4.000 | | | | 05/01/31 | | | | 2,101,152 | |
| Wynnfield Lakes Community Development District Special
Assessment Refunding Bonds Series 2014 (A-/NR) |
|
| | 1,470,000 | | | | 4.500 | | | | 05/01/36 | | | | 1,500,370 | |
| | | | | | | | | | | | | | |
| | | | | | | | | | | | | 53,802,532 | |
| | |
| | Georgia – 1.7% | |
| Atlanta Airport RB Refunding Series 2012 C (AMT) (A+/Aa3) | |
| | 1,250,000 | | | | 5.000 | | | | 01/01/27 | | | | 1,418,612 | |
| Metropolitan Atlanta Rapid Transit Authority Sales Tax RB
Series 2009 A (AA+/Aa3) |
|
| | 4,075,000 | | | | 5.250 | | | | 07/01/36 | | | | 4,607,847 | |
| Milledgeville & Baldwin County Development Authority Student
Housing RB Refunding for Georgia College & State University
Foundation Property V, LLC Project Series 2007 (AMBAC)
(A+/WR)(a) |
|
| | 5,000,000 | | | | 0.840 | | | | 10/01/33 | | | | 4,469,650 | |
| | | | | | | | | | | | | | |
| | | | | | | | | | | | | 10,496,109 | |
| | |
| | Guam – 0.4% | |
| Guam Government Limited Obligation GO Bonds Section 30
Series 2009 A (BBB+/NR) |
|
| | 850,000 | | | | 5.625 | | | | 12/01/29 | | | | 954,388 | |
| | 750,000 | | | | 5.750 | | | | 12/01/34 | | | | 839,640 | |
| Guam Power Authority RB 2014 Series A (AGM) (AA/A2) | |
| | 325,000 | | | | 5.000 | | | | 10/01/39 | | | | 367,130 | |
| | 250,000 | | | | 5.000 | | | | 10/01/44 | | | | 280,235 | |
| | | | | | | | | | | | | | |
| | | | | | | | | | | | | 2,441,393 | |
| | |
| | Idaho – 0.2% | |
| Idaho Health Facilities Authority RB for St. Luke’s Health
System Project Series 2008 (A-/A3) |
|
| | 1,000,000 | | | | 6.750 | | | | 11/01/37 | | | | 1,140,510 | |
| | |
| | Illinois – 9.0% | |
| Chicago Illinois Board of Education GO Bonds Capital
Appreciation for School Reform Series 1998 B-1 (NATL-RE
FGIC) (AA-/A3)(d) |
|
| | 1,775,000 | | | | 0.000 | | | | 12/01/26 | | | | 974,298 | |
| Chicago Illinois Board of Education GO Bonds Refunding
Series 2015 A (BB/NR)(b) |
|
| | 5,000,000 | | | | 4.020 | | | | 03/01/17 | | | | 4,919,550 | |
| | |
Principal
Amount | | | Interest
Rate | | | Maturity
Date | | | Value | |
| | State-Specific Municipal Debt Obligations – (continued) | |
| | Illinois – (continued) | |
| Chicago Illinois Board of Education GO Bonds Series 2015 C
(BB/NR) |
|
| $ | 2,500,000 | | | | 6.000 | % | | | 12/01/35 | | | $ | 2,365,775 | |
| Chicago Illinois GO Bonds Project and Refunding RMKT
06/08/15 Series 2005 D (BBB+/NR) |
|
| | 300,000 | | | | 5.500 | | | | 01/01/37 | | | | 295,905 | |
| | 2,720,000 | | | | 5.500 | | | | 01/01/40 | | | | 2,659,208 | |
| Chicago Illinois GO Bonds Project and Refunding Series 2014 A
(BBB+/Ba1) |
|
| | 1,500,000 | | | | 5.250 | | | | 01/01/33 | | | | 1,466,610 | |
| | 630,000 | | | | 5.000 | | | | 01/01/34 | | | | 602,349 | |
| | 450,000 | | | | 5.000 | | | | 01/01/36 | | | | 424,796 | |
| Chicago Illinois GO Bonds Project Series 2011 A (BBB+/Ba1) | |
| | 640,000 | | | | 5.000 | | | | 01/01/40 | | | | 594,957 | |
| Chicago Illinois GO Bonds Project Series 2012 A (BBB+/Ba1) | |
| | 150,000 | | | | 5.000 | | | | 01/01/34 | | | | 143,416 | |
| Chicago Illinois GO Bonds Series 2015 A (BBB+/NR) | |
| | 1,320,000 | | | | 5.500 | | | | 01/01/39 | | | | 1,294,432 | |
| Chicago Illinois Midway Airport RB Refunding Second Lien
Series 2013 A (AMT) (A-/A3) |
|
| | 2,000,000 | | | | 5.500 | | | | 01/01/29 | | | | 2,277,020 | |
| Chicago Illinois O’Hare International Airport RB Refunding
Third Lien Series 2003 A-1 (XLCA) (A/A2) |
|
| | 490,000 | | | | 5.250 | | | | 01/01/34 | | | | 491,700 | |
| Chicago Illinois GO Bonds Project and Refunding Series C
(BBB+/Ba1) |
|
| | 675,000 | | | | 5.000 | | | | 01/01/40 | | | | 627,493 | |
| Chicago Illinois Sales Tax Refunding Series 2002 (AAA/NR) | |
| | 1,000,000 | | | | 5.000 | | | | 01/01/25 | | | | 1,074,150 | |
| Chicago Illinois Tax Increment Allocation RB Refunding for
Pilsen Redevelopment Project Series 2014 A (A/NR) |
|
| | 1,135,000 | | | | 5.000 | | | | 06/01/20 | | | | 1,257,886 | |
| Illinois Finance Authority RB for Edward Hospital Obligated
Group RMKT 04/09/08 Series 2008 A (AMBAC) (A/A2) |
|
| | 350,000 | | | | 6.250 | | | | 02/01/33 | | | | 384,752 | |
| Illinois Finance Authority Solid Waste Disposal RB for Waste
Management, Inc. Project Series 2005 A (AMT) (A-/NR) |
|
| | 400,000 | | | | 5.050 | | | | 08/01/29 | | | | 405,172 | |
| Illinois GO Bonds Series 2003 (NATL-RE) (AA-/A2) | |
| | 975,000 | | | | 5.000 | | | | 06/01/19 | | | | 976,550 | |
| Illinois GO Bonds Series 2012 (A-/A3) | |
| | 2,445,000 | | | | 5.000 | | | | 03/01/19 | | | | 2,626,737 | |
| Illinois GO Bonds Series 2013 (A-/A3) | |
| | 5,500,000 | | | | 5.250 | | | | 07/01/28 | | | | 5,836,765 | |
| | 5,120,000 | | | | 5.500 | | | | 07/01/38 | | | | 5,403,136 | |
| Illinois Municipal Electric Agency RB Power Supply System
Series 2007 A (NATL-RE FGIC) (AA-/A1)(c) |
|
| | 1,520,000 | | | | 5.250 | | | | 02/01/17 | | | | 1,615,654 | |
| Illinois Sports Facilities Authority Refunding Bonds Series 2014
(AGM) (AA/NR) |
|
| | 4,160,000 | | | | 5.000 | | | | 06/15/27 | | | | 4,627,376 | |
| Lake County Illinois Community Consolidated School District
No. 41 GO Bonds Series 1999 A (AGM) (AA/Aa2) |
|
| | 2,725,000 | | | | 9.000 | | | | 11/01/16 | | | | 2,971,749 | |
| Metropolitan Pier & Exposition Authority Refunding Bonds for
McCormick Place Expansion Project Series 2012 B
(ST APPROP) (BBB+/NR) |
|
| | 1,000,000 | | | | 5.000 | | | | 12/15/28 | | | | 1,090,650 | |
| | |
| | |
| The accompanying notes are an integral part of these financial statements. | | 23 |
GOLDMAN SACHS DYNAMIC MUNICIPAL INCOME FUND
Schedule of Investments (continued)
September 30, 2015 (Unaudited)
| | | | | | | | | | | | | | |
Principal
Amount | | | Interest
Rate | | | Maturity
Date | | | Value | |
| | State-Specific Municipal Debt Obligations – (continued) | |
| | Illinois – (continued) | |
| Railsplitter Tobacco Settlement Authority Tobacco Settlement RB
Series 2010 (A-/NR) |
|
| $ | 1,125,000 | | | | 6.000 | % | | | 06/01/28 | | | $ | 1,307,565 | |
| Round Lake Illinois Lakewood Grove Special Service Area No. 1
Special Tax Refunding Series 2007 (ASSURED GTY)
(AA/NR) |
|
| | 2,320,000 | | | | 5.500 | | | | 03/01/32 | | | | 2,433,262 | |
| Southwestern Illinois Development Authority RB Capital
Appreciation for Local Government Program Series 2007
(AGM) (AA/NR)(d) |
|
| | 6,000,000 | | | | 0.000 | | | | 12/01/25 | | | | 4,122,420 | |
| | | | | | | | | | | | | | |
| | | | | | | | | | | | | 55,271,333 | |
| | |
| | Indiana – 0.2% | |
| Indianapolis Indiana Airport Authority RB Refunding Special
Facilities for Federal Express Corp. Project Series 2004 (AMT)
(BBB/Baa1) |
|
| | 640,000 | | | | 5.100 | | | | 01/15/17 | | | | 671,514 | |
| Jasper County PCRB Refunding for Northern Indiana Public
Service Co. Project RMKT 08/25/08 Series 1994 C
(NATL-RE) (AA-/A3) |
|
| | 650,000 | | | | 5.850 | | | | 04/01/19 | | | | 734,630 | |
| | | | | | | | | | | | | | |
| | | | | | | | | | | | | 1,406,144 | |
| | |
| | Iowa – 0.2% | |
| Coralville Iowa COPS Series 2006 D (NR/Ba1) | |
| | 1,325,000 | | | | 5.250 | | | | 06/01/22 | | | | 1,329,995 | |
| | |
| | Kentucky – 1.3% | |
| Louisville & Jefferson County Metropolitan Government RB for
Jewish Hospital St. Mary’s Healthcare Series 2008 (NR/Aaa)(c) |
|
| | 3,750,000 | | | | 6.125 | | | | 02/01/18 | | | | 4,219,613 | |
| University of Kentucky General Receipts Refunding Bonds
Series 2015 A (AA/Aa2) |
|
| | 3,260,000 | | | | 4.000 | | | | 04/01/26 | | | | 3,635,780 | |
| | | | | | | | | | | | | | |
| | | | | | | | | | | | | 7,855,393 | |
| | |
| | Louisiana – 1.3% | |
| East Baton Rouge Parish Louisiana Sales Tax RB for Road and
Street Improvement Series 2009 A (ASSURED GTY)
(AA/A2)(c) |
|
| | 1,230,000 | | | | 5.250 | | | | 08/01/19 | | | | 1,425,041 | |
| New Orleans Aviation Board GARBs Series 2015 B (AMT)
(A-/A3) |
|
| | 3,750,000 | | | | 5.000 | | | | 01/01/34 | | | | 4,134,525 | |
| New Orleans Louisiana Aviation Board RB Refunding for
Restructuring GARBs Series 2009 A-1 (ASSURED GTY)
(AA/A3) |
|
| | 1,350,000 | | | | 6.000 | | | | 01/01/23 | | | | 1,542,240 | |
| Port of New Orleans Board of Commissioners RB Refunding
Series 2013 B (AMT) (BBB+/A3) |
|
| | 500,000 | | | | 5.000 | | | | 04/01/30 | | | | 540,815 | |
| | | | | | | | | | | | | | |
| | | | | | | | | | | | | 7,642,621 | |
| | |
| | Maine – 0.3% | |
| Maine Turnpike Authority RB Refunding Series 2015 (AA-/Aa3) | |
| | 1,565,000 | | | | 5.000 | | | | 07/01/26 | | | | 1,899,769 | |
| | |
Principal
Amount | | | Interest
Rate | | | Maturity
Date | | | Value | |
| | State-Specific Municipal Debt Obligations – (continued) | |
| | Maryland – 1.4% | |
| City of Annapolis GO Bonds Refunding for Public Improvements
Series 2015 B (AA+/Aa2) |
|
| $ | 1,725,000 | | | | 4.000 | % | | | 08/01/27 | | | $ | 1,980,749 | |
| Frederick County Maryland Special Tax for Lake Linganore
Village Community Development Series 2001 A (ASSURED
GTY) (AA/NR) |
|
| | 185,000 | | | | 5.600 | | | | 07/01/20 | | | | 185,470 | |
| | 555,000 | | | | 5.700 | | | | 07/01/29 | | | | 555,893 | |
| Maryland State Department of Transportation Consolidated
Transportation RB Series 2015 (AAA/Aa1) |
|
| | 3,000,000 | | | | 5.000 | | | | 02/01/22 | | | | 3,598,950 | |
| Maryland State Industrial Development Financing Authority RB
Refunding for Synagro-Baltimore Series 2008 A (AMT)
(BBB+/NR) |
|
| | 500,000 | | | | 5.625 | | | | 12/01/16 | | | | 511,845 | |
| Maryland State Transportation Authority RB Refunding
Series 2007 (AAA/Aa1) |
|
| | 1,500,000 | | | | 5.000 | | | | 03/01/19 | | | | 1,592,670 | |
| | | | | | | | | | | | | | |
| | | | | | | | | | | | | 8,425,577 | |
| | |
| | Massachusetts – 1.7% | |
| Massachusetts Development Finance Agency RB for Harvard
University Series 2010 B-2 (AAA/Aaa) |
|
| | 5,000,000 | | | | 5.250 | | | | 02/01/34 | | | | 5,863,300 | |
| Massachusetts Educational Financing Authority RB Series 2008 H
(AMT) (ASSURED GTY) (AA/A1) |
|
| | 1,180,000 | | | | 6.350 | | | | 01/01/30 | | | | 1,241,360 | |
| Massachusetts State Health & Educational Facilities Authority RB
for Boston Medical Center Project Series 2008 B (BBB/Baa2) |
|
| | 2,685,000 | | | | 5.750 | | | | 07/01/31 | | | | 2,915,239 | |
| Massachusetts State Health & Educational Facilities Authority RB
for Boston Medical Center Project Series 2008 B (NR/NR)(c) |
|
| | 315,000 | | | | 5.750 | | | | 07/01/18 | | | | 356,879 | |
| | | | | | | | | | | | | | |
| | | | | | | | | | | | | 10,376,778 | |
| | |
| | Michigan – 1.0% | |
| Michigan Finance Authority Local Government Loan Program
RB for Detroit Financial Recovery Income Tax Revenue and
Refunding Local Project Bonds Series 2014 F (A/NR) |
|
| | 1,000,000 | | | | 3.875 | | | | 10/01/23 | | | | 1,030,860 | |
| Michigan Finance Authority Local Government Loan Program
RB Refunding for Detroit Water and Sewer Series 2014 D-1
(AGM) (AA/A2) |
|
| | 400,000 | | | | 5.000 | | | | 07/01/35 | | | | 433,528 | |
| Michigan Finance Authority Local Government Loan Program
RB Refunding for Detroit Water and Sewer Series 2014 D-1
(NATL-RE FGIC) (AA-/A3) |
|
| | 650,000 | | | | 5.000 | | | | 07/01/36 | | | | 697,502 | |
| Michigan Finance Authority RB Refunding for Detroit Water and
Sewer Senior Lien Series 2014 C-3 (AGM) (AA/A2) |
|
| | 325,000 | | | | 5.000 | | | | 07/01/32 | | | | 358,582 | |
| | 250,000 | | | | 5.000 | | | | 07/01/33 | | | | 274,848 | |
| Michigan Finance Authority State Aid RB for Detroit School
District Junior Subordinate Lien Series 2015 E (ST AID
WITHHLDG) (SP-3/NR)(g) |
|
| | 2,300,000 | | | | 5.750 | | | | 08/22/16 | | | | 2,299,816 | |
| | |
| | |
| 24 | | The accompanying notes are an integral part of these financial statements. |
GOLDMAN SACHS DYNAMIC MUNICIPAL INCOME FUND
| | | | | | | | | | | | | | |
Principal
Amount | | | Interest
Rate | | | Maturity
Date | | | Value | |
| | State-Specific Municipal Debt Obligations – (continued) | |
| | Michigan – (continued) | |
| Roseville Community School District GO Bonds Refunding
(Q-SBLF) (AA-/NR) |
|
| $ | 1,000,000 | | | | 5.000 | % | | | 05/01/20 | | | $ | 1,147,890 | |
| | | | | | | | | | | | | | |
| | | | | | | | | | | | | 6,243,026 | |
| | |
| | Minnesota – 0.3% | |
| Minneapolis Minnesota Health Care System RB for Fairview
Health Services Series 2008 A (A+/A2)(c) |
|
| | 1,500,000 | | | | 6.750 | | | | 11/15/18 | | | | 1,762,020 | |
| | |
| | Mississippi – 0.2% | |
| Mississippi Development Bank Special Obligation RB for Hinds
Community College District Capital Improvement Project
Series 2009 (ASSURED GTY) (NR/Aa2) |
|
| | 1,095,000 | | | | 5.375 | | | | 10/01/33 | | | | 1,247,293 | |
| | |
| | Nevada – 1.1% | |
| Clark County School District Limited Tax GO Bonds Refunding
Series 2015 B (AA-/A1) |
|
| | 4,250,000 | | | | 5.000 | | | | 06/15/18 | | | | 4,694,762 | |
| North Las Vegas Local Improvement District No. 60 Special
Assessment Refunding for Special Improvement
Subseries 2006 B (NR/NR) |
|
| | 555,000 | | | | 4.850 | | | | 12/01/15 | | | | 557,442 | |
| | 1,245,500 | | | | 5.100 | | | | 12/01/22 | | | | 1,258,329 | |
| | | | | | | | | | | | | | |
| | | | | | | | | | | | | 6,510,533 | |
| | |
| | New Hampshire – 0.2% | |
| New Hampshire State Business Finance Authority RB for Waste
Management, Inc. Project Series 2002 (AMT) (A-/NR) |
|
| | 1,250,000 | | | | 5.200 | | | | 05/01/27 | | | | 1,289,213 | |
| | |
| | New Jersey – 4.1% | |
| New Jersey Economic Development Authority RB for School
Facilities Construction Series 2009 (ASSURED GTY)
(AA/A3) |
|
| | 15,000 | | | | 6.000 | | | | 12/15/34 | | | | 16,778 | |
| New Jersey Economic Development Authority RB for School
Facilities Construction Series 2009 (ASSURED GTY)
(AA+/A2)(c) |
|
| | 985,000 | | | | 6.000 | | | | 12/15/18 | | | | 1,142,827 | |
| New Jersey Economic Development Authority RB for School
Facilities Construction Series 2009 BB (A-/A3)(c) |
|
| | 360,000 | | | | 5.000 | | | | 09/01/19 | | | | 412,632 | |
| New Jersey Economic Development Authority RB Refunding for
School Facilities Construction Series 2009 AA (A-/A3) |
|
| | 4,000,000 | | | | 5.500 | | | | 12/15/29 | | | | 4,338,320 | |
| New Jersey Health Care Facilities Financing Authority RB for St.
Joseph’s Healthcare System Series 2008 (BBB-/Baa3) |
|
| | 2,500,000 | | | | 6.625 | | | | 07/01/38 | | | | 2,767,725 | |
| New Jersey State Higher Education Assistance Authority RB for
Student Loan Series 2008 A (AMT) (ASSURED GTY)
(AA/A2) |
|
| | 2,455,000 | | | | 6.125 | | | | 06/01/30 | | | | 2,648,650 | |
| New Jersey State Housing and Mortgage Finance Agency RB for
Single Family Housing Series 2008 AA (AA/Aa3) |
|
| | 250,000 | | | | 6.150 | | | | 10/01/23 | | | | 257,620 | |
| | |
Principal
Amount | | | Interest
Rate | | | Maturity
Date | | | Value | |
| | State-Specific Municipal Debt Obligations – (continued) | |
| | New Jersey – (continued) | |
| New Jersey State Turnpike Authority RB Refunding Series 2000 B
(NATL-RE) (AA-/A3)(a) |
|
| $ | 6,300,000 | | | | 0.161 | % | | | 01/01/30 | | | $ | 5,777,266 | |
| New Jersey State Turnpike Authority RB Series 2009 G (A+/A3) | |
| | 1,900,000 | | | | 5.000 | | | | 01/01/18 | | | | 2,074,021 | |
| New Jersey Transportation Trust Fund Authority RB for
Transportation System Series 2011 A (ST APPROP) (A-/A3) |
|
| | 5,260,000 | | | | 5.500 | | | | 06/15/41 | | | | 5,580,913 | |
| | | | | | | | | | | | | | |
| | | | | | | | | | | | | 25,016,752 | |
| | |
| | New Mexico – 0.6% | |
| Farmington New Mexico PCRB Refunding for Public Service Co.
of New Mexico San Juan Project Series 2010 D (BBB/Baa2) |
|
| | 2,500,000 | | | | 5.900 | | | | 06/01/40 | | | | 2,740,950 | |
| Santa Fe County New Mexico RB for Gross Receipts Series 2008
(AGM) (AA+/Aa3) |
|
| | 1,000,000 | | | | 5.250 | | | | 06/01/31 | | | | 1,102,210 | |
| | | | | | | | | | | | | | |
| | | | | | | | | | | | | 3,843,160 | |
| | |
| | New York – 4.6% | |
| City of New Rochelle Corp. for Local Development RB for Iona
College Project Series 2015 A (BBB/Baa2) |
|
| | 325,000 | | | | 5.000 | | | | 07/01/25 | | | | 384,043 | |
| | 335,000 | | | | 5.000 | | | | 07/01/26 | | | | 391,514 | |
| | 425,000 | | | | 5.000 | | | | 07/01/27 | | | | 492,800 | |
| Erie County New York Industrial Development Agency RB for
the City of Buffalo School District Series 2008 A (AGM) (ST
AID WITHHLDG) (AA/Aa2)(c) |
|
| | 11,000,000 | | | | 5.750 | | | | 05/01/18 | | | | 12,413,610 | |
| New York City GO Bonds Series 2006 A (AA/Aa2) | |
| | 395,000 | | | | 5.000 | | | | 08/01/18 | | | | 410,938 | |
| New York City GO Bonds Series 2006 A (NR/NR)(c) | |
| | 5,000 | | | | 5.000 | | | | 08/01/16 | | | | 5,194 | |
| New York City Industrial Development Agency Special Facility
RB for American Airlines, Inc. John F. Kennedy International
Airport Project RMKT 08/03/15 Series 2002 B (AMT)
(NR/NR)(b) |
|
| | 1,000,000 | | | | 2.000 | | | | 08/01/16 | | | | 1,001,450 | |
| New York Housing Development Corp. Multi-Family Mortgage
RB for 8 Spruce Street Series 2014 Class E (BBB-/NR) |
|
| | 1,000,000 | | | | 3.500 | | | | 02/15/48 | | | | 986,790 | |
| New York State Thruway Authority Junior Indebtedness RB
Series 2013 A (A-/A3) |
|
| | 1,000,000 | | | | 5.000 | | | | 05/01/19 | | | | 1,128,360 | |
| New York State Urban Development Corp. General Purpose
Personal Income Tax RB Series 2014 A (AAA/Aa1) |
|
| | 5,000,000 | | | | 5.000 | | | | 03/15/31 | | | | 5,773,250 | |
| TSASC, Inc. RB Series 2006 1 (BB-/NR) | |
| | 5,000,000 | | | | 5.000 | | | | 06/01/26 | | | | 5,070,450 | |
| | | | | | | | | | | | | | |
| | | | | | | | | | | | | 28,058,399 | |
| | |
| | North Carolina – 1.3% | |
| Charlotte North Carolina Water and Sewer System RB
Series 2009 B (AAA/Aaa) |
|
| | 2,000,000 | | | | 5.000 | | | | 07/01/38 | | | | 2,281,600 | |
| | |
| | |
| The accompanying notes are an integral part of these financial statements. | | 25 |
GOLDMAN SACHS DYNAMIC MUNICIPAL INCOME FUND
Schedule of Investments (continued)
September 30, 2015 (Unaudited)
| | | | | | | | | | | | | | |
Principal
Amount | | | Interest
Rate | | | Maturity
Date | | | Value | |
| | State-Specific Municipal Debt Obligations – (continued) | |
| | North Carolina – (continued) | |
| North Carolina Eastern Municipal Power Agency Power System
RB Series 2008 C (ETM) (ASSURED GTY) (AA/A3) |
|
| $ | 355,000 | | | | 6.000 | % | | | 01/01/19 | | | $ | 386,080 | |
| North Carolina Medical Care Commission Health Care Facilities
RB Refunding First Mortgage for Pennybyrn at Maryfield
Series 2015 (NR/NR) |
|
| | 675,000 | | | | 2.000 | | | | 10/01/15 | | | | 675,000 | |
| | 1,225,000 | | | | 3.000 | | | | 10/01/16 | | | | 1,240,190 | |
| | 1,500,000 | | | | 4.000 | | | | 10/01/17 | | | | 1,551,375 | |
| | 885,000 | | | | 5.000 | | | | 10/01/18 | | | | 948,340 | |
| North Carolina Medical Care Commission Retirement Facilities
RB Refunding First Mortgage for United Church Homes and
Services Series 2015 A (NR/NR) |
|
| | 620,000 | | | | 4.000 | | | | 09/01/25 | | | | 602,181 | |
| | | | | | | | | | | | | | |
| | | | | | | | | | | | | 7,684,766 | |
| | |
| | Ohio – 1.1% | |
| Buckeye Ohio Tobacco Settlement Financing Authority RB
Senior Turbo Asset-Backed Bonds Series 2007 A-2 (B-/Caa1) |
|
| | 7,940,000 | | | | 5.125 | | | | 06/01/24 | | | | 6,795,052 | |
| | |
| | Oklahoma – 0.3% | |
| Oklahoma Development Finance Authority RB for Great Plains
Regional Medical Center Project Series 2007 (BB/NR) |
|
| | 240,000 | | | | 5.000 | | | | 12/01/27 | | | | 244,569 | |
| | 140,000 | | | | 5.125 | | | | 12/01/36 | | | | 138,830 | |
| Tulsa Municipal Airport Trust RB Refunding for American
Airlines, Inc. Series 2015 (AMT) (BB-/NR)(b) |
|
| | 1,500,000 | | | | 5.000 | | | | 06/01/25 | | | | 1,625,340 | |
| | | | | | | | | | | | | | |
| | | | | | | | | | | | | 2,008,739 | |
| | |
| | Oregon – 1.3% | |
| Deschutes County Oregon Hospital Facilities Authority RB
Refunding for Cascade Healthcare Series 2008 (NR/A2)(c) |
|
| | 1,500,000 | | | | 8.250 | | | | 01/01/19 | | | | 1,847,865 | |
| Oregon State Department of Transportation Highway User Tax
RB Refunding Series 2015 A (AAA/Aa1) |
|
| | 3,140,000 | | | | 5.000 | | | | 11/15/25 | | | | 3,879,753 | |
| Portland Oregon Community College District GO Bonds
Refunding Series 2013 (AA/Aa1) |
|
| | 2,000,000 | | | | 5.000 | | | | 06/15/26 | | | | 2,383,420 | |
| | | | | | | | | | | | | | |
| | | | | | | | | | | | | 8,111,038 | |
| | |
| | Pennsylvania – 2.0% | |
| Luzerne County Pennsylvania GO Bonds Refunding Series 2015 A
(AGM) (AA/NR) |
|
| | 750,000 | | | | 5.000 | | | | 11/15/29 | | | | 835,612 | |
| Mifflin County Pennsylvania School District GO Bonds
Series 2007 (NATL-RE-IBC) (XLCA) (ST AID WITHHLDG)
(AA-/A3) |
|
| | 2,000,000 | | | | 7.500 | | | | 09/01/26 | | | | 2,229,780 | |
| Montgomery County IDA RB for Whitemarsh Continuing Care
Retirement Community Project Series 2015 (NR/NR) |
|
| | 500,000 | | | | 3.000 | | | | 01/01/16 | | | | 501,505 | |
| | 650,000 | | | | 3.000 | | | | 01/01/17 | | | | 655,753 | |
| | 800,000 | | | | 3.000 | | | | 01/01/18 | | | | 806,376 | |
| | |
Principal
Amount | | | Interest
Rate | | | Maturity
Date | | | Value | |
| | State-Specific Municipal Debt Obligations – (continued) | |
| | Pennsylvania – (continued) | |
| Pennsylvania Economic Development Financing Authority PCRB
Refunding for PPL Electric Utilities Corp. Project RMKT
10/01/10 Series 2008 (A/A1) |
|
| $ | 2,500,000 | | | | 4.000 | % | | | 10/01/23 | | | $ | 2,682,150 | |
| Pennsylvania Economic Development Financing Authority Solid
Waste Disposal RB for Waste Management, Inc. Project
Series 2004 A (A-/NR)(b) |
|
| | 1,000,000 | | | | 1.500 | | | | 05/01/18 | | | | 995,980 | |
| Pennsylvania State Higher Educational Facilities Authority RB
for Foundation for Indiana University of Pennsylvania
Series 2007 A (XLCA) (BBB+/WR)(a) |
|
| | 1,685,000 | | | | 0.790 | | | | 07/01/27 | | | | 1,549,661 | |
| Pennsylvania Turnpike Commission RB Series 2013 C (A+/A1) | |
| | 1,720,000 | | | | 5.500 | | | | 12/01/29 | | | | 2,053,680 | |
| | | | | | | | | | | | | | |
| | | | | | | | | | | | | 12,310,497 | |
| | |
| | Puerto Rico – 5.0% | |
| Puerto Rico Commonwealth Aqueduct & Sewer Authority RB
Senior Lien Series 2008 A (CCC-/Caa3) |
|
| | 3,635,000 | | | | 6.125 | | | | 07/01/24 | | | | 2,591,064 | |
| | 2,000,000 | | | | 6.000 | | | | 07/01/38 | | | | 1,392,520 | |
| | 2,500,000 | | | | 6.000 | | | | 07/01/44 | | | | 1,731,275 | |
| Puerto Rico Commonwealth Aqueduct & Sewer Authority RB
Senior Lien Series 2012 A (CCC-/Caa3) |
|
| | 1,060,000 | | | | 5.750 | | | | 07/01/37 | | | | 727,436 | |
| Puerto Rico Commonwealth GO Bonds Refunding for Public
Improvement Series 2009 B (CC/Caa3) |
|
| | 3,000,000 | | | | 6.500 | | | | 07/01/37 | | | | 1,987,500 | |
| Puerto Rico Commonwealth GO Bonds Refunding
Subseries 2003 C-7 (NATL-RE) (AA-/A3) |
|
| | 2,000,000 | | | | 6.000 | | | | 07/01/27 | | | | 2,009,780 | |
| Puerto Rico Commonwealth GO Bonds Series 2014 A (CC/Caa3) | |
| | 4,175,000 | | | | 8.000 | | | | 07/01/35 | | | | 3,131,250 | |
| Puerto Rico Commonwealth Highway & Transportation Authority
RB Refunding Series 2007 N (NATL-RE) (AA-/A3) |
|
| | 1,600,000 | | | | 5.250 | | | | 07/01/33 | | | | 1,461,008 | |
| Puerto Rico Electric Power Authority RB Refunding Series 2007
UU (AGM) (AA/A2)(a) |
|
| | 2,700,000 | | | | 0.710 | | | | 07/01/29 | | | | 1,954,125 | |
| Puerto Rico Electric Power Authority RB Series 2013 A
(CC/Caa3)(f) |
|
| | 3,000,000 | | | | 6.750 | | | | 07/01/36 | | | | 1,935,000 | |
| Puerto Rico Public Buildings Authority RB Refunding for
Government Facilities Series 2007 M-2 (AMBAC)
(COMWLTH GTD) (CC/Caa3)(b) |
|
| | 2,840,000 | | | | 5.500 | | | | 07/01/17 | | | | 2,829,520 | |
| Puerto Rico Sales Tax Financing Corp. RB for Capital
Appreciation First Subseries 2009 A (CC/Ca)(e) |
|
| | 13,000,000 | | | | 0.000 | | | | 08/01/32 | | | | 5,282,290 | |
| Puerto Rico Sales Tax Financing Corp. Sales Tax RB First
Subseries 2009 A (CC/Ca) |
|
| | 5,805,000 | | | | 5.000 | | | | 08/01/24 | | | | 2,554,258 | |
| | 2,750,000 | | | | 6.500 | | | | 08/01/44 | | | | 1,175,625 | |
| | | | | | | | | | | | | | |
| | | | | | | | | | | | | 30,762,651 | |
| | |
| | |
| 26 | | The accompanying notes are an integral part of these financial statements. |
GOLDMAN SACHS DYNAMIC MUNICIPAL INCOME FUND
| | | | | | | | | | | | | | |
Principal
Amount | | | Interest
Rate | | | Maturity
Date | | | Value | |
| | State-Specific Municipal Debt Obligations – (continued) | |
| | South Carolina – 1.0% | |
| Clemson University Athletic Facilities RB Series 2015 (NR/Aa3) | |
| $ | 1,385,000 | | | | 4.000 | % | | | 05/01/25 | | | $ | 1,568,429 | |
| | 1,570,000 | | | | 4.000 | | | | 05/01/26 | | | | 1,746,735 | |
| Georgetown County South Carolina Environmental RB for
International Paper Co. Project Series 2006 A (AMT)
(BBB/Baa2) |
|
| | 2,500,000 | | | | 5.000 | | | | 08/01/30 | | | | 2,504,975 | |
| | | | | | | | | | | | | | |
| | | | | | | | | | | | | 5,820,139 | |
| | |
| | South Dakota – 0.1% | |
| South Dakota Health & Educational Facilities Authority RB for
Avera Health Series 2008 B (AA-/A1) |
|
| | 500,000 | | | | 5.500 | | | | 07/01/35 | | | | 547,660 | |
| | 300,000 | | | | 5.250 | | | | 07/01/38 | | | | 323,019 | |
| | | | | | | | | | | | | | |
| | | | | | | | | | | | | 870,679 | |
| | |
| | Tennessee – 1.3% | |
| Johnson City Tennessee Health & Educational Facilities Board
Hospital RB for First Mortgage Mountain States Health
Series 2006 A (BBB+/Baa1) |
|
| | 1,775,000 | | | | 5.500 | | | | 07/01/36 | | | | 1,832,013 | |
| Knox County Tennessee Health, Educational & Housing Facilities
Board RB for University Health System, Inc. Series 2007
(BBB+/NR) |
|
| | 2,700,000 | | | | 5.250 | | | | 04/01/36 | | | | 2,788,614 | |
| Metropolitan Government Nashville & Davidson County Health
& Educational Facilities Board RB for Charter Village
Apartments Series 2007 (AMT) (FNMA) (NR/NR)(b) |
|
| | 1,000,000 | | | | 4.850 | | | | 06/01/25 | | | | 1,007,530 | |
| Sullivan County Tennessee Health, Educational & Housing
Facilities Board Hospital RB for Wellmont Health System
Project Series 2006 C (BBB+/NR) |
|
| | 2,100,000 | | | | 5.250 | | | | 09/01/36 | | | | 2,166,087 | |
| | | | | | | | | | | | | | |
| | | | | | | | | | | | | 7,794,244 | |
| | |
| | Texas – 12.5% | |
| City of Lewisville Texas Combination Contract & Special
Assessment RB Refunding for Lewisville Castle Hills Public
Improvement District No. 3 Project Series 2015 (AGM)
(AA/NR) |
|
| | 1,415,000 | | | | 4.000 | | | | 09/01/25 | | | | 1,508,772 | |
| Dallas Area Rapid Transit Sales Tax RB Refunding Senior Lien
Series 2014 A (AA+/Aa2) |
|
| | 5,000,000 | | | | 5.000 | | | | 12/01/26 | | | | 6,044,400 | |
| Dallas County Utility & Reclamation District GO Bonds
Refunding RMKT 06/25/08 Series 2005 B (AMBAC) (A-/A3) |
|
| | 2,675,000 | | | | 5.375 | | | | 02/15/29 | | | | 2,827,528 | |
| Dallas-Fort Worth International Airport Joint RB Refunding
Series 2014 A (AMT) (A+/NR) |
|
| | 2,500,000 | | | | 5.250 | | | | 11/01/30 | | | | 2,856,250 | |
| Hidalgo County Health Services RB for Mission Hospital, Inc.
Project Series 2005 (BBB-/Baa3) |
|
| | 700,000 | | | | 5.000 | | | | 08/15/19 | | | | 700,994 | |
| Houston Airport System RB Refunding for United Airlines, Inc.
Series 2015 B-2 (AMT) (BB-/NR) |
|
| | 2,500,000 | | | | 5.000 | | | | 07/15/20 | | | | 2,673,750 | |
| | |
Principal
Amount | | | Interest
Rate | | | Maturity
Date | | | Value | |
| | State-Specific Municipal Debt Obligations – (continued) | |
| | Texas – (continued) | |
| Houston Airport System RB Refunding Senior Lien Series 2009 A
(AA-/Aa3) |
|
| $ | 10,000,000 | | | | 5.500 | % | | | 07/01/34 | | | $ | 11,003,900 | |
| Houston Airport System RB Subordinate Lien Series 2002 D-2
(AMT) (XLCA) (A/A1)(a) |
|
| | 4,000,000 | | | | 0.389 | | | | 10/05/15 | | | | 3,703,423 | |
| Matagorda County Texas Navigation District No. 1 PCRB
Refunding for Central Power & Light Co. Project RMKT
07/01/09 Series 2001 A (BBB/Baa1) |
|
| | 1,300,000 | | | | 6.300 | | | | 11/01/29 | | | | 1,461,993 | |
| Matagorda County Texas Navigation District No. 1 PCRB
Refunding for Central Power & Light Co. Project Series 1996
(AMT) (NATL-RE) (AA-/A3)(a) |
|
| | 2,500,000 | | | | 5.200 | | | | 05/01/30 | | | | 2,625,675 | |
| Mesquite Texas Health Facilities Development Corp. RB for
Christian Care Retirement Facilities Series 2005 (BBB-/NR) |
|
| | 150,000 | | | | 5.500 | | | | 02/15/25 | | | | 150,709 | |
| | 235,000 | | | | 5.625 | | | | 02/15/35 | | | | 235,783 | |
| New Hope Cultural Education Facilities Finance Corp. Student
Housing RB for Tarleton State University Collegiate Housing
Project Series 2015 A (BBB-/Baa3) |
|
| | 250,000 | | | | 5.000 | | | | 04/01/30 | | | | 265,317 | |
| North Texas Tollway Authority RB Convertible Capital
Appreciation Special Project System Series 2011 (AA+/NR)(e) |
|
| | 1,000,000 | | | | 0.000 | | | | 09/01/43 | | | | 905,210 | |
| North Texas Tollway Authority RB First Tier Series 2009 A
(A/A1) |
|
| | 2,500,000 | | | | 6.250 | | | | 01/01/24 | | | | 2,898,975 | |
| | 1,100,000 | | | | 6.250 | | | | 01/01/39 | | | | 1,263,801 | |
| North Texas Tollway Authority RB Special Project System
Series 2011 A (AA+/NR) |
|
| | 1,000,000 | | | | 5.500 | | | | 09/01/41 | | | | 1,170,920 | |
| | 1,000,000 | | | | 6.000 | | | | 09/01/41 | | | | 1,212,430 | |
| North Texas Tollway Authority System RB Refunding for Capital
Appreciation First Tier Series 2008 I (A/A1) |
|
| | 6,000,000 | | | | 6.500 | | | | 01/01/43 | | | | 7,356,840 | |
| North Texas Tollway Authority System RB Refunding for First
Tier Series 2008 A (A/A1) |
|
| | 5,000,000 | | | | 5.750 | | | | 01/01/40 | | | | 5,439,400 | |
| Pharr-San Juan-Alamo Independent School District Unlimited
Tax GO Bonds for Hidalgo School Building Series 2007 (PSF-
GTD) (AAA/Aaa)(c) |
|
| | 2,670,000 | | | | 5.500 | | | | 02/01/17 | | | | 2,850,492 | |
| Port of Houston Authority Harris County Unlimited Tax GO
Bonds Refunding Series 2008 A (AMT) (AAA/Aaa) |
|
| | 3,000,000 | | | | 6.125 | | | | 10/01/33 | | | | 3,446,820 | |
| Round Rock Texas Independent School District Unlimited Tax
GO Bonds for School Building Series 2009 (AA/Aaa) |
|
| | 2,730,000 | | | | 5.250 | | | | 08/01/34 | | | | 3,036,661 | |
| Tarrant County Cultural Education Facilities Finance Corp. RB
for Air Force Village Obligated Group Series 2007 (BBB-/NR) |
|
| | 425,000 | | | | 5.125 | | | | 05/15/37 | | | | 434,235 | |
| Texas Municipal Gas Acquisition & Supply Corp. I RB Senior
Lien Series 2008 D (A-/Baa1) |
|
| | 3,000,000 | | | | 6.250 | | | | 12/15/26 | | | | 3,613,140 | |
| | |
| | |
| The accompanying notes are an integral part of these financial statements. | | 27 |
GOLDMAN SACHS DYNAMIC MUNICIPAL INCOME FUND
Schedule of Investments (continued)
September 30, 2015 (Unaudited)
| | | | | | | | | | | | | | |
Principal
Amount | | | Interest
Rate | | | Maturity
Date | | | Value | |
| | State-Specific Municipal Debt Obligations – (continued) | |
| | Texas – (continued) | |
| Texas Private Activity Bond Surface Transportation Corp. RB
Senior Lien for Mobility Partners LLC Series 2009
(BBB-/Baa2) |
|
| $ | 3,255,000 | | | | 6.875 | % | | | 12/31/39 | | | $ | 3,807,081 | |
| Texas State Water Financial Assistance GO Refunding Bonds
Series 2015 A-2 (AAA/Aaa)(b) |
|
| | 3,325,000 | | | | 2.000 | | | | 02/01/18 | | | | 3,335,208 | |
| | | | | | | | | | | | | | |
| | | | | | | | | | | | | 76,829,707 | |
| | |
| | U.S. Virgin Islands – 0.9% | |
| Virgin Islands Public Finance Authority RB Series 2014 A
(AGM) (AA/A2) |
|
| | 5,000,000 | | | | 5.000 | | | | 10/01/34 | | | | 5,508,850 | |
| | |
| | Utah – 0.1% | |
| Utah Housing Corp. Single Family Mortgage RB Series 2008 B-1
Class II (AMT) (AA/Aa2) |
|
| | 290,000 | | | | 5.900 | | | | 07/01/36 | | | | 293,866 | |
| | |
| | Virginia – 1.7% | |
| Amelia County IDA Solid Waste Disposal RB Refunding for
Waste Management, Inc. Project Series 2002 (AMT) (A-/NR)(b) |
|
| | 2,500,000 | | | | 2.125 | | | | 04/01/20 | | | | 2,475,650 | |
| Virginia Port Authority Port Facilities RB Refunding Series 2015 A
(AMT) (A+/Aa3) |
|
| | 2,750,000 | | | | 5.000 | | | | 07/01/30 | | | | 3,141,462 | |
| Virginia Public School Authority School Financing RB Refunding
Series 2015 A (ST AID WITHHLDG) (AA+/Aa1) |
|
| | 2,750,000 | | | | 4.000 | | | | 08/01/20 | | | | 3,078,158 | |
| Virginia Small Business Financing Authority Senior Lien RB for
Elizabeth River Crossings Opco, LLC Project Series 2012
(AMT) (BBB-/NR) |
|
| | 750,000 | | | | 5.500 | | | | 01/01/42 | | | | 811,687 | |
| Washington County IDA RB for Mountain States Health Alliance
Series 2009 C (BBB+/Baa1) |
|
| | 1,000,000 | | | | 7.750 | | | | 07/01/38 | | | | 1,146,500 | |
| | | | | | | | | | | | | | |
| | | | | | | | | | | | | 10,653,457 | |
| | |
| | Washington – 1.5% | |
| Puttable Floating Option Tax-Exempt Receipts (RITES) GO
Bonds Series 2009 A (NR/NR)(g)(h) |
|
| | 700,000 | | | | 16.565 | | | | 01/01/23 | | | | 1,057,658 | |
| Puttable Floating Option Tax-Exempt Receipts (RITES) GO
Bonds Series 2009 B (NR/NR)(g)(h) |
|
| | 730,000 | | | | 16.573 | | | | 01/01/24 | | | | 1,101,687 | |
| University of Washington RB Refunding Series 2012 A
(AA+/Aaa) |
|
| | 2,500,000 | | | | 5.000 | | | | 07/01/29 | | | | 2,910,575 | |
| Washington Health Care Facilities Authority RB for MultiCare
Health System RMKT 02/26/09 Series 2008 A (ASSURED
GTY) (AA/Aa3)(c) |
|
| | 250,000 | | | | 6.000 | | | | 08/15/19 | | | | 295,555 | |
| Washington Health Care Facilities Authority RB for MultiCare
Health System RMKT 02/26/09 Series 2008 B (ASSURED
GTY) (AA/Aa3)(c) |
|
| | 250,000 | | | | 6.000 | | | | 08/15/19 | | | | 295,555 | |
| Washington State GO Bonds Series 1992 B & AT-7 (AA+/Aa1) | |
| | 265,000 | | | | 6.400 | | | | 06/01/17 | | | | 282,082 | |
| | |
Principal
Amount | | | Interest
Rate | | | Maturity
Date | | | Value | |
| | State-Specific Municipal Debt Obligations – (continued) | |
| | Washington – (continued) | |
| Washington State Health Care Facilities Authority RB for
Virginia Mason Medical Center Series 2007 B (ACA)
(BBB/Baa2) |
|
| $ | 3,000,000 | | | | 6.000 | % | | | 08/15/37 | | | $ | 3,198,150 | |
| | | | | | | | | | | | | | |
| | | | | | | | | | | | | 9,141,262 | |
| | |
| | West Virginia – 0.2% | |
| West Virginia Hospital Finance Authority Hospital RB Refunding
and Improvement for West Virginia United Health System
Obligated Group Series 2009 C (A/A2) |
|
| | 1,000,000 | | | | 5.500 | | | | 06/01/39 | | | | 1,111,550 | |
| | |
| | Wisconsin – 1.0% | |
| Public Finance Authority Senior Airport Facilities RB Refunding
for Transportation Infrastructure Properties LLC Obligated
Group Series 2012 B (AMT) (BBB/NR) |
|
| | 2,000,000 | | | | 5.250 | | | | 07/01/28 | | | | 2,163,460 | |
| Wisconsin State Health & Educational Facilities Authority RB for
Upland Hills Health, Inc. Series 2006 A (BBB/NR) |
|
| | 375,000 | | | | 5.125 | | | | 05/15/29 | | | | 382,189 | |
| Wisconsin State Health & Educational Facilities Authority RB for
Upland Hills Health, Inc. Series 2006 B (BBB/NR) |
|
| | 100,000 | | | | 5.000 | | | | 05/15/36 | | | | 101,400 | |
| Wisconsin State Health & Educational Facilities Authority RB for
Wheaton Franciscan Healthcare Series 2006 (A-/Baa1) |
|
| | 1,750,000 | | | | 5.250 | | | | 08/15/31 | | | | 1,795,237 | |
| Wisconsin State Health & Educational Facilities Authority RB
Refunding for Fort Healthcare, Inc. Series 2014 (BBB/NR) |
|
| | 200,000 | | | | 4.000 | | | | 05/01/16 | | | | 203,576 | |
| | 350,000 | | | | 4.000 | | | | 05/01/17 | | | | 364,378 | |
| | 375,000 | | | | 4.000 | | | | 05/01/18 | | | | 395,351 | |
| | 285,000 | | | | 4.000 | | | | 05/01/19 | | | | 301,721 | |
| | 410,000 | | | | 5.000 | | | | 05/01/20 | | | | 451,410 | |
| | | | | | | | | | | | | | |
| | | | | | | | | | | | | 6,158,722 | |
| | |
| Total State-Specific Municipal
Debt Obligations |
| | | | |
| | (Cost $576,903,337) | | | $ | 597,410,821 | |
| | |
| | | | | | | | |
| Shares | | Distribution
Rate | | | Value | |
| Investment Company(i) – 0.7% | |
Goldman Sachs Financial Square Tax-Free Money Market Fund – FST Shares | |
| 4,544,566 | | | 0.006 | % | | $ | 4,544,566 | |
| (Cost $4,544,566) | |
| |
| TOTAL INVESTMENTS – 98.2% | |
| (Cost $581,447,903) | | | $ | 601,955,387 | |
| |
OTHER ASSETS IN EXCESS OF
LIABILITIES – 1.8% | | | | 11,332,321 | |
| |
| NET ASSETS – 100.0% | | | $ | 613,287,708 | |
| |
| | |
| 28 | | The accompanying notes are an integral part of these financial statements. |
GOLDMAN SACHS DYNAMIC MUNICIPAL INCOME FUND
| | |
| The percentage shown for each investment category reflects the value of investments in that category as a percentage of net assets. |
(a) | | Variable rate security. Except for floating rate notes (for which final maturity is disclosed), maturity date disclosed is the next interest reset date. Interest rate or distribution rate disclosed is that which is in effect on September 30, 2015. |
(b) | | Security with “Put” features and resetting interest rates. Maturity dates disclosed are the puttable dates. Interest rate disclosed is that which is in effect at September 30, 2015. |
(c) | | Pre-refunded security. Maturity date disclosed is pre-refunding date. |
(d) | | Issued with a zero coupon. Income is recognized through the accretion of discount. |
(e) | | Zero coupon bond until next reset date. |
(f) | | Security is currently in default. |
(g) | | Exempt from registration under Rule 144A of the Securities Act of 1933. Under procedures approved by the Board of Trustees, such securities have been determined to be liquid by the Investment Adviser and may be resold, normally to qualified institutional buyers in transactions exempt from registration. Total market value of Rule 144A securities amounts to $10,118,661, which represents approximately 1.6% of net assets as of September 30, 2015. |
(h) | | Inverse floating rate security. Interest rate disclosed is that which is in effect on September 30, 2015. |
(i) | | Represents an affiliated issuer. |
Security ratings disclosed, if any, are issued by either Standard & Poor’s, Moody’s Investor Service or Fitch and are unaudited. A brief description of the ratings is available in the Fund’s Statement of Additional Information.
| | |
|
Investment Abbreviations: |
ACA | | —Insured by American Capital Access |
AGM | | —Insured by Assured Guaranty Municipal Corp. |
AMBAC | | —Insured by American Municipal Bond Assurance Corp. |
AMT | | —Alternative Minimum Tax |
ASSURED GTY | | —Insured by Assured Guaranty |
CAL MTG INS | | —Insured by California Mortgage Insurance |
COMWLTH GTD | | —Commonwealth Guaranteed |
COPS | | —Certificates of Participation |
CRA | | —Community Reinvestment Act |
ETM | | —Escrowed to Maturity |
FNMA | | —Federal National Mortgage Association |
GARB | | —General Airport Revenue Bond |
GNMA | | —Government National Mortgage Association |
GO | | —General Obligation |
IDA | | —Industrial Development Authority |
LIBOR | | —London Interbank Offered Rate |
NATL-RE | | —Insured by National Public Finance Guarantee Corp. |
NATL-RE FGIC | | —Insured by National Public Finance Guarantee Corp., which reinsures Financial Guaranty Insurance Co. |
NATL-RE-IBC | | —Insured by National Public Finance Guarantee Corp. - Insured Bond Certificates |
NR | | —Not Rated |
PCRB | | —Pollution Control Revenue Bond |
PSF-GTD | | —Guaranteed by Permanent School Fund |
Q-SBLF | | —Qualified School Board Loan Fund |
RB | | —Revenue Bond |
RITES | | —Residual Interest Tax Exempt Securities |
RMKT | | —Remarketed |
ST AID WITHHLDG | | —State Aid Withholding |
ST APPROP | | —State Appropriation |
WR | | —Withdrawn Rating |
XLCA | | —Insured by XL Capital Assurance, Inc. |
|
| | |
| The accompanying notes are an integral part of these financial statements. | | 29 |
GOLDMAN SACHS DYNAMIC MUNICIPAL INCOME FUND
Schedule of Investments (continued)
September 30, 2015 (Unaudited)
|
| ADDITIONAL INVESTMENT INFORMATION |
SWAP CONTRACTS — At September 30, 2015, the Fund had the following swap contracts:
OVER THE COUNTER CREDIT DEFAULT SWAP CONTRACTS
| | | | | | | | | | | | | | | | | | | | | | | | | | |
| | | | | | | | | | | | | | | | | Market Value | |
| Counterparty | | Referenced
Obligation | | Notional
Amount
(000’s) | | | Rates Received
(Paid) | | | Termination
Date | | | Credit
Spread on
September 30,
2015(a) | | | Upfront
Payments
Made (Received) | | | Unrealized
Gain (Loss) | |
Protection Sold: | | | | | | | | | | | | | | | | | | | | | | | | | | |
Bank of America, N.A. | | California State Various Purpose GO Bonds Series 2003, 5.250%, 02/01/18 | | $ | 1,000 | | | | 1.000 | % | | | 03/20/23 | | | | 1.021 | % | | $ | (37,070 | ) | | $ | 36,325 | |
JPMorgan Chase Bank, N.A. | | California State Various Purpose GO Bonds Series 2003, 5.250%, 02/01/18 | | | 1,000 | | | | 1.000 | | | | 03/20/23 | | | | 1.021 | | | | (37,070 | ) | | | 36,326 | |
| TOTAL | | | | | | | | | | | | | | | | | | | | $ | (74,140 | ) | | $ | 72,651 | |
| | (a) | | Credit spread on the Referenced Obligation, together with the period of expiration, are indicators of payment/performance risk. The likelihood of a credit event occurring which would require a fund to make a payment or otherwise be required to perform under the swap contract is generally greater as the credit spread and term of the swap contract increase. |
CENTRALLY CLEARED INTEREST RATE SWAP CONTRACTS
| | | | | | | | | | | | | | | | | | |
| | | | | | Rates Exchanged | | Market Value | |
Notional
Amount
(000’s)(a) | | | Termination
Date | | Payments
Received | | | Payments
Made | | Upfront
Payments
Made (Received) | | | Unrealized
Gain (Loss) | |
| $ | 5,800 | | | 12/16/45 | | | 3 Month LIBOR | | | 2.750% | | $ | (15,220 | ) | | $ | (236,957 | ) |
| | 12,500 | | | 12/16/25 | | | 3 Month LIBOR | | | 2.500 | | | (234,605 | ) | | | (268,909 | ) |
| | 11,100 | | | 12/16/30 | | | 3 Month LIBOR | | | 2.500 | | | 74,055 | | | | (319,353 | ) |
| | TOTAL | | | | | | | | | | | $ | (175,770 | ) | | $ | (825,219 | ) |
| | (a) | | Represents forward starting interest rate swaps whose effective dates of commencement of accruals and cash flows occur subsequent to September 30, 2015. |
| | |
| 30 | | The accompanying notes are an integral part of these financial statements. |
GOLDMAN SACHS HIGH YIELD MUNICIPAL FUND
Schedule of Investments
September 30, 2015 (Unaudited)
| | | | | | | | | | | | | | |
Principal
Amount | | | Interest
Rate | | | Maturity
Date | | | Value | |
| | State-Specific Municipal Debt Obligations – 97.7% | |
| | Alabama – 4.3% | |
| Alexander City Special Care Facilities Financing Authority
Medical Facilities RB for Russell Hospital Corp. Series 2006 A
(BB-/NR) |
|
| $ | 1,470,000 | | | | 5.375 | % | | | 12/01/16 | | | $ | 1,490,139 | |
| | 4,425,000 | | | | 5.500 | | | | 12/01/21 | | | | 4,481,109 | |
| | 5,775,000 | | | | 5.625 | | | | 12/01/26 | | | | 5,845,570 | |
| | 16,695,000 | | | | 5.750 | | | | 12/01/36 | | | | 16,888,829 | |
| Jefferson County Senior Lien Sewer RB Warrants Series 2013 C
(AGM) (AA/A2)(a) |
|
| | 5,750,000 | | | | 0.000 | | | | 10/01/38 | | | | 4,123,555 | |
| | 5,000,000 | | | | 0.000 | | | | 10/01/42 | | | | 3,557,850 | |
| Jefferson County Subordinate Lien Sewer RB Warrants
Series 2013 D (BBB-/NR) |
|
| | 6,500,000 | | | | 6.000 | | | | 10/01/42 | | | | 7,258,225 | |
| | 19,850,000 | | | | 7.000 | | | | 10/01/51 | | | | 23,650,283 | |
| | 66,520,000 | | | | 6.500 | | | | 10/01/53 | | | | 76,033,690 | |
| | | | | | | | | | | | | | |
| | | | | | | | | | | | | 143,329,250 | |
| | |
| | Alaska – 0.4% | |
| Northern Tobacco Securitization Corp. RB Refunding
Asset-Backed Bonds Series 2006 A (B/B3) |
|
| | 16,240,000 | | | | 5.000 | | | | 06/01/46 | | | | 12,804,103 | |
| | |
| | Arizona – 1.8% | |
| Apache County IDA PCRB for Tucson Electric Power Company
Series 2012 A (BBB+/A3) |
|
| | 4,500,000 | | | | 4.500 | | | | 03/01/30 | | | | 4,812,075 | |
| Arizona Health Facilities Authority Hospital RB for Banner
Health Series 2007 B (AA-/NR)(b) |
|
| | 25,000,000 | | | | 1.000 | | | | 01/01/37 | | | | 21,715,250 | |
| City of Tempe IDA RB Refunding for Friendship Village
Series 2012 A (NR/NR) |
|
| | 1,250,000 | | | | 6.250 | | | | 12/01/42 | | | | 1,335,913 | |
| | 1,325,000 | | | | 6.250 | | | | 12/01/46 | | | | 1,413,894 | |
| Maricopa County Arizona Pollution Control Corp. PCRB
Refunding for El Paso Electric Co. Project Series 2009 A
(BBB/Baa1) |
|
| | 8,800,000 | | | | 7.250 | | | | 02/01/40 | | | | 10,003,576 | |
| Maricopa County Arizona Pollution Control Corp. PCRB
Refunding for Public Service Co. of New Mexico Palo Verde
Project Series 2003 A (BBB/Baa2) |
|
| | 5,000,000 | | | | 6.250 | | | | 01/01/38 | | | | 5,454,050 | |
| Pima County IDA RB Refunding for Tucson Electric Power Co.
Project Series 2012 A (BBB+/A3) |
|
| | 5,350,000 | | | | 4.500 | | | | 06/01/30 | | | | 5,733,916 | |
| Pima County IDA RB Refunding for Tucson Electric Power Co.
Project Series 2013 A (BBB+/A3) |
|
| | 3,390,000 | | | | 4.000 | | | | 09/01/29 | | | | 3,488,480 | |
| University Medical Center Corp. RB Series 2009 (NR/WR)(c) | |
| | 500,000 | | | | 6.250 | | | | 07/01/19 | | | | 593,855 | |
| | 1,360,000 | | | | 6.500 | | | | 07/01/19 | | | | 1,627,702 | |
| University Medical Center Corp. RB Series 2011 (GO OF CORP)
(NR/WR)(c) |
|
| | 3,500,000 | | | | 6.000 | | | | 07/01/21 | | | | 4,362,855 | |
| | | | | | | | | | | | | | |
| | | | | | | | | | | | | 60,541,566 | |
| | |
| | State-Specific Municipal Debt Obligations – (continued) | |
| | California – 14.1% | |
| ABC Unified School District GO Bonds Series 2001 C
(NATL-RE) (AA-/Aa3)(d) |
|
| $ | 1,600,000 | | | | 0.000 | % | | | 08/01/26 | | | $ | 1,138,400 | |
| Alameda County Oakland Unified School District GO Bonds
Election of 2012 Series 2015 A (NR/NR) |
|
| | 3,000,000 | | | | 5.000 | | | | 08/01/40 | | | | 3,287,490 | |
| Alvord Unified School District GO Bonds Capital Appreciation
for 2007 Election Series 2007 B (AGM) (AA/A1)(d) |
|
| | 1,210,000 | | | | 0.000 | | | | 08/01/36 | | | | 457,150 | |
| Calaveras Unified School District GO Bonds for Capital
Appreciation Series 2000 (AGM) (AA/A2)(d) |
|
| | 1,055,000 | | | | 0.000 | | | | 08/01/25 | | | | 767,164 | |
| California County Tobacco Securitization Agency RB
Asset-Backed Bonds for Los Angeles County Securitization
Corp. Series 2006 A (B/B3) |
|
| | 15,885,000 | | | | 5.450 | | | | 06/01/28 | | | | 15,712,171 | |
| California Municipal Finance Authority COPS for Community
Hospitals of Central California Obligated Group Series 2009
(A-/Baa1) |
|
| | 19,500,000 | | | | 5.500 | | | | 02/01/39 | | | | 21,425,040 | |
| California Pollution Control Financing Authority Water
Furnishing RB for Poseidon Resources Series 2012 (AMT)
(BBB-/Baa3)(e) |
|
| | 15,355,000 | | | | 5.000 | | | | 11/21/45 | | | | 16,169,890 | |
| California Statewide Communities Development Authority
Community Facilities District No. 2007-01 Special Tax
Refunding for Orinda Wilder Project Series 2015 (NR/NR) |
|
| | 2,000,000 | | | | 5.000 | | | | 09/01/30 | | | | 2,116,840 | |
| | 2,125,000 | | | | 5.000 | | | | 09/01/37 | | | | 2,197,059 | |
| California Statewide Communities Development Authority RB
for California Baptist University Series 2007 A (NR/NR) |
|
| | 2,000,000 | | | | 5.400 | | | | 11/01/27 | | | | 2,112,080 | |
| | 11,850,000 | | | | 5.500 | | | | 11/01/38 | | | | 11,930,936 | |
| California Statewide Communities Development Authority RB
for Lancer Plaza Project Series 2013 (NR/NR) |
|
| | 1,875,000 | | | | 5.875 | | | | 11/01/43 | | | | 1,938,750 | |
| California Statewide Communities Development Authority RB
for Methodist Hospital Project Series 2009 (FHA) (NR/Aa2) |
|
| | 5,340,000 | | | | 6.625 | | | | 08/01/29 | | | | 6,322,186 | |
| California Statewide Financing Authority Tobacco Settlement RB
Capital Appreciation for Turbo Pooled Program Series 2006 B
(B-/NR)(d) |
|
| | 35,000,000 | | | | 0.000 | | | | 06/01/46 | | | | 1,890,700 | |
| Capistrano Unified School District Special Tax for Capital
Appreciation Series 2005 (NATL-RE) (AA-/A3)(d) |
|
| | 7,000,000 | | | | 0.000 | | | | 09/01/33 | | | | 3,349,080 | |
| City of Davis Redevelopment Agency Tax Allocation for Davis
Redevelopment Project Series 2011 A (A+/NR) |
|
| | 750,000 | | | | 6.500 | | | | 12/01/26 | | | | 882,668 | |
| | 2,830,000 | | | | 7.000 | | | | 12/01/36 | | | | 3,528,472 | |
| City of Fremont Community Facilities District No. 1 Special Tax
for Pacific Commons Series 2015 (NR/NR) |
|
| | 3,000,000 | | | | 5.000 | | | | 09/01/45 | | | | 3,243,270 | |
| City of Goleta Redevelopment Agency Tax Allocation for Goleta
Old Town Redevelopment Project Series 2011 (NR/NR) |
|
| | 670,000 | | | | 7.750 | | | | 12/01/31 | | | | 695,654 | |
| | 5,000,000 | | | | 8.000 | | | | 06/01/44 | | | | 5,247,600 | |
| | |
| | |
| The accompanying notes are an integral part of these financial statements. | | 31 |
GOLDMAN SACHS HIGH YIELD MUNICIPAL FUND
Schedule of Investments (continued)
September 30, 2015 (Unaudited)
| | | | | | | | | | | | | | |
Principal
Amount | | | Interest
Rate | | | Maturity
Date | | | Value | |
| | State-Specific Municipal Debt Obligations – (continued) | |
| | California – (continued) | |
| City of Palo Alto Limited Obligation Refunding Improvement
Bonds for University Avenue Area Off-Street Parking
Assessment District Series 2012 (BBB/NR) |
|
| $ | 600,000 | | | | 5.000 | % | | | 09/02/30 | | | $ | 650,952 | |
| Coronado Community Development Agency Tax Allocation for
Coronado Community Development Project Series 2005
(AMBAC) (AA-/NR) |
|
| | 175,000 | | | | 5.000 | | | | 09/01/20 | | | | 175,586 | |
| Denair California Unified School District GO Bonds Capital
Appreciation Election 2001 Series 2003 B (NATL-RE)
(AA-/A3)(d) |
|
| | 1,305,000 | | | | 0.000 | | | | 08/01/27 | | | | 794,680 | |
| El Rancho California Unified School District GO Bonds Capital
Appreciation Election 2003 Series 2007 (NATL-RE) (A/A3)(d) |
|
| | 5,400,000 | | | | 0.000 | | | | 08/01/32 | | | | 2,635,470 | |
| Fairfield COPS Capital Appreciation for Water Financing
Series 2007 A (XLCA) (A+/WR)(d) |
|
| | 4,180,000 | | | | 0.000 | | | | 04/01/29 | | | | 2,339,253 | |
| Folsom Cordova Unified School District No. 4 GO for School
Facilities Improvement Capital Appreciation for Election of
2006 Series 2007 A (NATL-RE) (AA-/A1)(d) |
|
| | 3,360,000 | | | | 0.000 | | | | 10/01/32 | | | | 1,669,382 | |
| Foothill/Eastern Transportation Corridor Agency Toll Road RB
Refunding Capital Appreciation Senior Lien Series 2015 A
(AGM) (AA/A2)(d) |
|
| | 12,000,000 | | | | 0.000 | | | | 01/15/35 | | | | 5,324,400 | |
| Foothill/Eastern Transportation Corridor Agency Toll Road RB
Refunding Series 2013 A (BBB-/Ba1) |
|
| | 13,535,000 | | | | 6.000 | | | | 01/15/53 | | | | 15,611,269 | |
| Fullerton Public Financing Authority Tax Allocation Series 2005
(AMBAC) (A/WR) |
|
| | 200,000 | | | | 5.000 | | | | 09/01/27 | | | | 203,698 | |
| Golden State Tobacco Securitization Corp. California Tobacco
Settlement RB Asset-Backed Bonds for Capital Appreciation
Subseries 2007 B (CCC+/NR)(d) |
|
| | 125,785,000 | | | | 0.000 | | | | 06/01/47 | | | | 11,245,179 | |
| Golden State Tobacco Securitization Corp. California Tobacco
Settlement RB Asset-Backed Bonds for Capital Appreciation
Subseries 2007 C (CCC/NR)(d) |
|
| | 307,000,000 | | | | 0.000 | | | | 06/01/47 | | | | 11,570,830 | |
| Golden State Tobacco Securitization Corp. California Tobacco
Settlement RB Senior Asset-Backed Bonds Series 2007 A-1
(B-/B3) |
|
| | 25,855,000 | | | | 5.750 | | | | 06/01/47 | | | | 22,979,924 | |
| Golden State Tobacco Securitization Corp. California Tobacco
Settlement RB Senior Asset-Backed Bonds Series 2007 A-2
(B-/B3) |
|
| | 5,000,000 | | | | 5.300 | | | | 06/01/37 | | | | 4,323,100 | |
| Inland Empire Tobacco Securitization Authority RB Turbo
Asset-Backed Bonds for Capital Appreciation Series 2007 C-1
(B-/NR)(d) |
|
| | 101,195,000 | | | | 0.000 | | | | 06/01/36 | | | | 21,082,966 | |
| Inland Empire Tobacco Securitization Authority RB Turbo
Asset-Backed Bonds for Capital Appreciation Series 2007 C-2
(B-/NR)(d) |
|
| | 211,235,000 | | | | 0.000 | | | | 06/01/47 | | | | 9,592,181 | |
| | |
| | State-Specific Municipal Debt Obligations – (continued) | |
| | California – (continued) | |
| Inland Empire Tobacco Securitization Authority RB Turbo
Asset-Backed Bonds for Capital Appreciation Series 2007 D
(B-/NR)(d) |
|
| $ | 260,660,000 | | | | 0.000 | % | | | 06/01/57 | | | $ | 2,968,917 | |
| Lammersville Joint Unified School District Special Tax Bonds for
Community Facilities District No. 2007-1 Series 2013
(NR/NR) |
|
| | 2,750,000 | | | | 6.000 | | | | 09/01/43 | | | | 3,135,495 | |
| Lemoore Redevelopment Agency Tax Allocation for Lemoore
Redevelopment Project Series 2011 (A-/NR) |
|
| | 665,000 | | | | 6.625 | | | | 08/01/24 | | | | 686,991 | |
| | 1,000,000 | | | | 7.250 | | | | 08/01/31 | | | | 1,037,780 | |
| | 9,315,000 | | | | 7.375 | | | | 08/01/40 | | | | 9,675,584 | |
| Los Angeles County GO Bonds for Westside Union School
District Election Series 2008 B (AA-/Aa3)(d) |
|
| | 49,925,000 | | | | 0.000 | | | | 08/01/50 | | | | 9,864,182 | |
| Lynwood Redevelopment Agency Tax Allocation for Housing
Projects Series 2011 A (A-/NR) |
|
| | 1,625,000 | | | | 6.750 | | | | 09/01/26 | | | | 1,959,328 | |
| | 1,500,000 | | | | 7.000 | | | | 09/01/31 | | | | 1,806,240 | |
| | 875,000 | | | | 7.250 | | | | 09/01/38 | | | | 1,065,330 | |
| Merced-Union High School District Election of 2008 GO Bonds
Series 2011 C (NR/Aa3)(d) |
|
| | 3,750,000 | | | | 0.000 | | | | 08/01/35 | | | | 1,610,400 | |
| M-S-R Energy Authority Gas RB Series 2009 A (A-/NR) | |
| | 8,250,000 | | | | 6.500 | | | | 11/01/39 | | | | 10,865,250 | |
| M-S-R Energy Authority Gas RB Series 2009 B (A-/NR) | |
| | 2,000,000 | | | | 6.500 | | | | 11/01/39 | | | | 2,634,000 | |
| M-S-R Energy Authority Gas RB Series 2009 C (A-/NR) | |
| | 10,000,000 | | | | 6.125 | | | | 11/01/29 | | | | 12,590,900 | |
| | 13,500,000 | | | | 6.500 | | | | 11/01/39 | | | | 17,779,500 | |
| Mt. Diablo Unified School District GO Bonds Capital
Appreciation for Election of 2010 Series 2010 A (AGM)
(AA/Aa3)(a) |
|
| | 7,000,000 | | | | 0.000 | | | | 08/01/30 | | | | 5,847,660 | |
| New Haven Unified School District GO Bonds Refunding for
Capital Appreciation Series 2009 (ASSURED GTY)
(AA/Aa3)(d) |
|
| | 860,000 | | | | 0.000 | | | | 08/01/25 | | | | 627,792 | |
| | 1,105,000 | | | | 0.000 | | | | 08/01/26 | | | | 768,826 | |
| | 5,550,000 | | | | 0.000 | | | | 08/01/30 | | | | 3,162,834 | |
| | 7,830,000 | | | | 0.000 | | | | 08/01/32 | | | | 4,008,490 | |
| | 7,000,000 | | | | 0.000 | | | | 08/01/34 | | | | 3,236,940 | |
| Palomar Pomerado Health COPS Series 2009 (BB+/Ba1) | |
| | 16,000,000 | | | | 6.750 | | | | 11/01/39 | | | | 17,716,960 | |
| Palomar Pomerado Health COPS Series 2010 (BB+/Ba1) | |
| | 6,500,000 | | | | 6.000 | | | | 11/01/41 | | | | 6,865,170 | |
| Palomar Pomerado Health GO Bonds Capital Appreciation for
Election of 2004 Series 2009 A (ASSURED GTY) (AA/A2)(a) |
|
| | 10,750,000 | | | | 0.000 | | | | 08/01/38 | | | | 11,250,198 | |
| Placer Union High School District GO Bonds for Capital
Appreciation Series 2000 A (NATL-RE) (AA-/Aa2)(d) |
|
| | 1,805,000 | | | | 0.000 | | | | 08/01/25 | | | | 1,340,772 | |
| Poway Unified School District Community Facilities District
No. 6-4S Ranch Improvement Area C Special Tax Bonds
Series 2012 (NR/NR) |
|
| | 250,000 | | | | 4.600 | | | | 09/01/35 | | | | 246,780 | |
| | |
| | |
| 32 | | The accompanying notes are an integral part of these financial statements. |
GOLDMAN SACHS HIGH YIELD MUNICIPAL FUND
| | | | | | | | | | | | | | |
Principal
Amount | | | Interest
Rate | | | Maturity
Date | | | Value | |
| | State-Specific Municipal Debt Obligations – (continued) | |
| | California – (continued) | |
| River Islands Public Financing Authority Special Tax for
Community Facilities District No. 2003-1 Series 2015 B
(NR/NR) |
|
| $ | 22,500,000 | | | | 5.500 | % | | | 09/01/45 | | | $ | 23,299,425 | |
| River Islands Public Financing Authority Community Facilities
District No. 2003-1 Special Tax Refunding Bonds
Series 2015 A-1 (NR/NR) |
|
| | 325,000 | | | | 5.500 | | | | 09/01/45 | | | | 336,547 | |
| Riverside County Redevelopment Agency Tax Allocation for
Capital Appreciation Jurupa Valley Redevelopment Project
Area Series 2011 B (A/NR)(d) |
|
| | 2,220,000 | | | | 0.000 | | | | 10/01/33 | | | | 971,028 | |
| | 2,220,000 | | | | 0.000 | | | | 10/01/35 | | | | 868,597 | |
| | 1,840,000 | | | | 0.000 | | | | 10/01/37 | | | | 644,239 | |
| | 5,000,000 | | | | 0.000 | | | | 10/01/38 | | | | 1,654,150 | |
| | 8,425,000 | | | | 0.000 | | | | 10/01/39 | | | | 2,643,934 | |
| | 13,395,000 | | | | 0.000 | | | | 10/01/40 | | | | 3,985,816 | |
| | 7,275,000 | | | | 0.000 | | | | 10/01/41 | | | | 2,051,841 | |
| | 6,000,000 | | | | 0.000 | | | | 10/01/42 | | | | 1,603,320 | |
| Riverside County Redevelopment Agency Tax Allocation for
Jurupa Valley Redevelopment Project Area Series 2011 B
(A/NR) |
|
| | 1,225,000 | | | | 6.500 | | | | 10/01/25 | | | | 1,459,171 | |
| | 1,950,000 | | | | 6.750 | | | | 10/01/30 | | | | 2,343,393 | |
| Riverside County Transportation Commission Toll Revenue
Senior Lien Bonds Series 2013 A (BBB-/NR) |
|
| | 2,000,000 | | | | 5.750 | | | | 06/01/48 | | | | 2,220,380 | |
| San Bernardino City Unified School District GO Bonds Capital
Appreciation for Election of 1999 Series 2003 C (NATL-RE)
(AA-/A2)(d) |
|
| | 1,420,000 | | | | 0.000 | | | | 08/01/25 | | | | 991,558 | |
| San Diego Unified School District GO Bonds Refunding
Series 2012 R-1 (AA-/Aa3)(d) |
|
| | 10,000,000 | | | | 0.000 | | | | 07/01/30 | | | | 5,741,700 | |
| | 3,000,000 | | | | 0.000 | | | | 07/01/31 | | | | 1,635,990 | |
| San Francisco City & County Redevelopment Financing
Authority Tax Allocation for Mission Bay North
Redevelopment Series 2011 C (A-/NR) |
|
| | 500,000 | | | | 6.750 | | | | 08/01/33 | | | | 597,550 | |
| | 2,000,000 | | | | 6.750 | | | | 08/01/41 | | | | 2,388,000 | |
| San Francisco City & County Redevelopment Financing
Authority Tax Allocation for Mission Bay North
Redevelopment Series 2011 D (BBB+/NR) |
|
| | 435,000 | | | | 6.625 | | | | 08/01/27 | | | | 516,010 | |
| San Francisco City & County Redevelopment Financing
Authority Tax Allocation for Mission Bay South
Redevelopment Series 2009 D (BBB+/NR) |
|
| | 750,000 | | | | 6.250 | | | | 08/01/28 | | | | 841,688 | |
| | 555,000 | | | | 6.375 | | | | 08/01/29 | | | | 624,275 | |
| | 305,000 | | | | 6.500 | | | | 08/01/31 | | | | 343,262 | |
| | 1,000,000 | | | | 6.625 | | | | 08/01/39 | | | | 1,128,390 | |
| San Francisco City & County Redevelopment Financing
Authority Tax Allocation for Mission Bay South
Redevelopment Series 2011 D (BBB+/NR) |
|
| | 1,000,000 | | | | 7.000 | | | | 08/01/33 | | | | 1,193,730 | |
| | 1,500,000 | | | | 7.000 | | | | 08/01/41 | | | | 1,788,960 | |
| | |
| | State-Specific Municipal Debt Obligations – (continued) | |
| | California – (continued) | |
| San Joaquin Hills Transportation Corridor Agency RB Refunding
for Toll Road Senior Lien Series 2014 A (BBB-/NR) |
|
| $ | 3,000,000 | | | | 5.000 | % | | | 01/15/29 | | | $ | 3,303,750 | |
| San Juan Unified School District GO Bonds for Capital
Appreciation Series 2000 (NATL-RE) (AA-/Aa2)(d) |
|
| | 1,580,000 | | | | 0.000 | | | | 08/01/24 | | | | 1,226,649 | |
| | 1,595,000 | | | | 0.000 | | | | 08/01/25 | | | | 1,179,056 | |
| San Mateo Special Tax Bonds for Community Facilities District
No. 2008-1 Bay Meadows Series 2013 (NR/NR) |
|
| | 2,000,000 | | | | 5.000 | | | | 09/01/42 | | | | 2,118,320 | |
| San Mateo Special Tax Bonds for Community Facilities District
No. 2008-1 Bay Meadows Series 2014 (NR/NR) |
|
| | 2,000,000 | | | | 5.500 | | | | 09/01/44 | | | | 2,193,280 | |
| Santa Monica Redevelopment Agency Tax Allocation for
Earthquake Recovery Redevelopment Project Series 2011
(AA/NR) |
|
| | 2,000,000 | | | | 5.000 | | | | 07/01/42 | | | | 2,199,380 | |
| Santa Monica Redevelopment Agency Tax Allocation for
Earthquake Recovery Redevelopment RB Series 2011
(AA/NR) |
|
| | 2,000,000 | | | | 5.000 | | | | 07/01/32 | | | | 2,291,020 | |
| Santee Community Development Commission Tax Allocation for
Santee Community Redevelopment Project Series 2011 A
(A/NR) |
|
| | 1,000,000 | | | | 7.000 | | | | 08/01/31 | | | | 1,166,960 | |
| | 2,000,000 | | | | 7.000 | | | | 08/01/41 | | | | 2,333,920 | |
| Stockton Public Financing Authority Water RB for Delta Water
Supply Project Series 2010 A (A/A3) |
|
| | 2,000,000 | | | | 6.250 | | | | 10/01/40 | | | | 2,397,380 | |
| Tejon Ranch Public Facilities Financing Authority Special Tax
for Community Facilities District No. 2008-1 Industrial
Complex Public Improvements Series 2012 B (NR/NR) |
|
| | 4,000,000 | | | | 5.250 | | | | 09/01/42 | | | | 4,187,000 | |
| Temecula Redevelopment Agency Tax Allocation for Housing
Redevelopment Project No. 1 Series 2011 A (A/NR) |
|
| | 1,000,000 | | | | 6.750 | | | | 08/01/31 | | | | 1,228,900 | |
| | 2,100,000 | | | | 7.000 | | | | 08/01/39 | | | | 2,676,954 | |
| Tobacco Securitization Authority Southern California Tobacco
Settlement RB Senior Asset-Backed Bonds for San Diego
County Tobacco Asset Securitization Corp. Series 2006 A-1
(BB+/B2) |
|
| | 2,235,000 | | | | 5.000 | | | | 06/01/37 | | | | 1,953,636 | |
| Union City Community Redevelopment Agency Tax Allocation
for Community Redevelopment Project Sub Lien Series 2011
(A/NR) |
|
| | 1,500,000 | | | | 6.875 | | | | 12/01/33 | | | | 1,820,640 | |
| University of California Regents Medical Center Pooled RB
Refunding Series 2007 C-2 (NATL-RE) (AA-/Aa3)(b) |
|
| | 10,000,000 | | | | 0.955 | | | | 05/15/43 | | | | 8,789,700 | |
| West Hollywood Community Development Commission Tax
Allocation for East Side Redevelopment Project Series 2011 A
(A-/NR) |
|
| | 1,000,000 | | | | 7.250 | | | | 09/01/31 | | | | 1,243,720 | |
| | 5,000,000 | | | | 7.500 | | | | 09/01/42 | | | | 6,270,750 | |
| William S. Hart Union High School District GO Bonds Capital
Appreciation 2008 Election Series B (AGM) (AA/Aa2)(d) |
|
| | 8,360,000 | | | | 0.000 | | | | 08/01/34 | | | | 3,887,233 | |
| | |
| | |
| The accompanying notes are an integral part of these financial statements. | | 33 |
GOLDMAN SACHS HIGH YIELD MUNICIPAL FUND
Schedule of Investments (continued)
September 30, 2015 (Unaudited)
| | | | | | | | | | | | | | |
Principal
Amount | | | Interest
Rate | | | Maturity
Date | | | Value | |
| | State-Specific Municipal Debt Obligations – (continued) | |
| | California – (continued) | |
| Yosemite Community College District GO Bonds Election of
2004 Series 2010 D (AA-/Aa2)(a) |
|
| $ | 19,135,000 | | | | 0.000 | % | | | 08/01/42 | | | $ | 10,971,052 | |
| | | | | | | | | | | | | | |
| | | | | | | | | | | | | 472,676,043 | |
| | |
| | Colorado – 2.2% | |
| Colorado Health Facilities Authority RB for Covenant Retirement
Communities, Inc. Series 2012 A (BBB+/NR) |
|
| | 3,500,000 | | | | 4.500 | | | | 12/01/33 | | | | 3,518,270 | |
| | 3,500,000 | | | | 5.000 | | | | 12/01/33 | | | | 3,680,145 | |
| Colorado Health Facilities Authority RB for Covenant Retirement
Communities, Inc. Series 2013 A (BBB+/NR) |
|
| | 3,000,000 | | | | 5.750 | | | | 12/01/36 | | | | 3,279,120 | |
| Colorado Health Facilities Authority RB for The Evangelical
Lutheran Good Samaritan Society Project Series 2013
(BBB+/Baa1) |
|
| | 3,000,000 | | | | 5.625 | | | | 06/01/43 | | | | 3,308,190 | |
| Colorado Regional Transportation District Tax-Exempt Private
Activity RB for Denver Transit Partners Eagle P3 Project
Series 2010 (BBB-/Baa3) |
|
| | 12,860,000 | | | | 6.000 | | | | 01/15/41 | | | | 14,406,544 | |
| Cross Creek Metropolitan District No. 2 GO Bonds Refunding
Limited Tax Series 2006 (NR/NR)(b) |
|
| | 4,500,000 | | | | 3.500 | | | | 12/01/17 | | | | 3,719,880 | |
| Denver Colorado City & County Special Facilities Airport RB
Refunding for United Air Lines, Inc. Project Series 2007 A
(AMT) (BB-/B1) |
|
| | 925,000 | | | | 5.250 | | | | 10/01/32 | | | | 953,860 | |
| | 7,000,000 | | | | 5.750 | | | | 10/01/32 | | | | 7,316,470 | |
| Denver Colorado Health and Hospital Authority Healthcare RB
Series B (BBB/NR)(b) |
|
| | 11,750,000 | | | | 1.317 | | | | 12/01/33 | | | | 10,885,905 | |
| E-470 Public Highway Authority RB Refunding Capital
Appreciation Series 2006 B (NATL-RE) (AA-/A3)(d) |
|
| | 3,000,000 | | | | 0.000 | | | | 09/01/39 | | | | 976,380 | |
| E-470 Public Highway Authority RB Series 2004 A (NATL-RE)
(AA-/A3)(d) |
|
| | 15,000,000 | | | | 0.000 | | | | 09/01/28 | | | | 9,476,850 | |
| | 4,100,000 | | | | 0.000 | | | | 09/01/34 | | | | 1,949,919 | |
| E-470 Public Highway Authority RB Series 2004 B (NATL-RE)
(AA-/A3)(d) |
|
| | 1,715,000 | | | | 0.000 | | | | 09/01/28 | | | | 912,757 | |
| E-470 Public Highway Authority RB Series 2010 A
(BBB+/Baa1)(d) |
|
| | 20,000,000 | | | | 0.000 | | | | 09/01/40 | | | | 6,781,600 | |
| Park Meadows Business Improvement District RB Series 2007
(NR/NR) |
|
| | 475,000 | | | | 5.300 | | | | 12/01/27 | | | | 495,397 | |
| | 720,000 | | | | 5.350 | | | | 12/01/31 | | | | 751,658 | |
| Plaza Metropolitan District No. 1 RB Refunding Series 2013
(NR/NR)(e) |
|
| | 1,000,000 | | | | 5.000 | | | | 12/01/40 | | | | 1,002,920 | |
| Vista Ridge Metropolitan District GO Bonds Refunding Limited
Tax Subseries 2006 B (NR/NR)(a) |
|
| | 1,725,000 | | | | 0.000 | | | | 12/01/40 | | | | 1,039,243 | |
| | | | | | | | | | | | | | |
| | | | | | | | | | | | | 74,455,108 | |
| | |
| | State-Specific Municipal Debt Obligations – (continued) | |
| | Connecticut – 0.0% | |
| Town of Hamden Refunding GO Series 2013 (AGM) (AA/A2) | |
| $ | 500,000 | | | | 5.000 | % | | | 08/15/23 | | | $ | 585,580 | |
| | |
| | Delaware – 0.3% | |
| Bridgeville Delaware Special Obligation Special Tax for Heritage
Shores Special Development District Series 2005 A (NR/NR) |
|
| | 5,806,000 | | | | 5.450 | | | | 07/01/35 | | | | 5,805,826 | |
| Delaware Economic Development Authority Gas Facilities RB
Refunding for Delmarva Power & Light Co. Project
Series 2010 (BBB+/Baa1) |
|
| | 3,000,000 | | | | 5.400 | | | | 02/01/31 | | | | 3,323,730 | |
| Delaware Economic Development Authority RB for Indian River
Power LLC Project Series 2010 (NR/Baa3) |
|
| | 2,050,000 | | | | 5.375 | | | | 10/01/45 | | | | 2,121,012 | |
| | | | | | | | | | | | | | |
| | | | | | | | | | | | | 11,250,568 | |
| | |
| | District of Columbia – 2.0% | |
| Metropolitan Washington DC Airports Authority Dulles Toll
Road RB Second Senior Lien Capital Appreciation for Dulles
Metrorail and Capital Improvement Project Series 2009
(ASSURED GTY) (AA/A3)(a) |
|
| | 25,000,000 | | | | 0.000 | | | | 10/01/41 | | | | 29,761,000 | |
| Metropolitan Washington DC Airports Authority Dulles Toll
Road RB Second Senior Lien Capital Appreciation for Dulles
Metrorail and Capital Improvement Project Series 2010 B
(BBB+/Baa1)(a) |
|
| | 37,100,000 | | | | 0.000 | | | | 10/01/44 | | | | 38,786,566 | |
| | | | | | | | | | | | | | |
| | | | | | | | | | | | | 68,547,566 | |
| | |
| | Florida – 15.3% | |
| Amelia National Community Development District Special
Assessment for Capital Improvement Series 2004 A (NR/NR) |
|
| | 3,960,000 | | | | 6.300 | | | | 05/01/35 | | | | 3,963,128 | |
| Amelia National Community Development District Special
Assessment for Capital Improvement Series 2006 A (NR/NR) |
|
| | 1,495,000 | | | | 5.375 | | | | 05/01/37 | | | | 1,201,143 | |
| Arborwood Community Development District RB Capital
Improvement for Master Infrastructure Projects
Series 2005 A-2 (NR/NR) |
|
| | 14,765,000 | | | | 5.350 | | | | 05/01/36 | | | | 14,766,772 | |
| Arborwood Community Development District Special
Assessment Capital Improvement for Centex Homes Project
Series 2006 A-2 (NR/NR) |
|
| | 205,000 | | | | 5.250 | | | | 05/01/36 | | | | 205,123 | |
| Arborwood Community Development District Special
Assessment Capital Improvement for Centex Homes Project
Series 2006 A-3 (NR/NR) |
|
| | 3,085,000 | | | | 5.500 | | | | 05/01/36 | | | | 3,085,679 | |
| Arborwood Community Development District Special
Assessment Capital Improvement Refunding Series 2014 B
(NR/NR)(a) |
|
| | 9,040,000 | | | | 0.000 | | | | 05/01/25 | | | | 9,495,887 | |
| Arborwood Community Development District Special
Assessment Capital Improvement Refunding Series 2014 B A-1
(NR/NR)(a) |
|
| | 4,065,000 | | | | 0.000 | | | | 05/01/36 | | | | 4,461,500 | |
| | |
| | |
| 34 | | The accompanying notes are an integral part of these financial statements. |
GOLDMAN SACHS HIGH YIELD MUNICIPAL FUND
| | | | | | | | | | | | | | |
Principal
Amount | | | Interest
Rate | | | Maturity
Date | | | Value | |
| | State-Specific Municipal Debt Obligations – (continued) | |
| | Florida – (continued) | |
| Arborwood Community Development District Special
Assessment Capital Improvement Refunding Series 2014 B A-2
(NR/NR)(a) |
|
| $ | 1,035,000 | | | | 0.000 | % | | | 05/01/36 | | | $ | 1,135,954 | |
| Bartram Park Community Development District Special
Assessment RB Refunding for City of Jacksonville Senior Lien
Series 2015 A-1 (BBB/NR) |
|
| | 2,000,000 | | | | 4.250 | | | | 05/01/29 | | | | 1,985,680 | |
| Bartram Park Community Development District Special
Assessment RB Refunding for City of Jacksonville Subordinate
Lien Series 2015 A-2 (BBB/NR) |
|
| | 1,000,000 | | | | 5.000 | | | | 05/01/35 | | | | 995,020 | |
| Bellagio Community Development District Special Assessment
Bonds Series 2013 (NR/NR) |
|
| | 855,000 | | | | 6.000 | | | | 11/01/27 | | | | 905,701 | |
| | 3,000,000 | | | | 6.500 | | | | 11/01/43 | | | | 3,597,870 | |
| Belmont Community Development District Capital Improvement
Phase 1 Project Series 2013 A (NR/NR) |
|
| | 775,000 | | | | 6.125 | | | | 11/01/33 | | | | 806,527 | |
| | 1,000,000 | | | | 6.500 | | | | 11/01/43 | | | | 1,051,250 | |
| Brevard County Health Facilities Authority RB for Health First,
Inc. Project Series 2009 (A-/A3)(c) |
|
| | 4,750,000 | | | | 7.000 | | | | 04/01/19 | | | | 5,722,990 | |
| Bridgewater Community Development District Special
Assessment Refunding Bonds for Assessment Area Two
Series 2015 (NR/NR) |
|
| | 8,295,000 | | | | 5.750 | | | | 05/01/35 | | | | 8,246,391 | |
| Broward County Florida Airport Exempt Facility RB for Learjet,
Inc. Project RMKT 07/19/04 Series 2000 (AMT) (NR/B2) |
|
| | 2,000,000 | | | | 7.500 | | | | 11/01/20 | | | | 2,024,560 | |
| Century Parc Community Development District Special
Assessment Refunding Series 2012 (A-/NR) |
|
| | 200,000 | | | | 3.500 | | | | 11/01/20 | | | | 202,972 | |
| | 210,000 | | | | 3.750 | | | | 11/01/21 | | | | 209,769 | |
| | 215,000 | | | | 3.875 | | | | 11/01/22 | | | | 215,677 | |
| | 25,000 | | | | 4.000 | | | | 11/01/23 | | | | 25,259 | |
| | 1,705,000 | | | | 4.500 | | | | 11/01/31 | | | | 1,728,188 | |
| City of Cape Coral Water & Sewer RB Refunding Series 2015
(A/A1) |
|
| | 1,750,000 | | | | 4.000 | | | | 10/01/34 | | | | 1,792,035 | |
| CityPlace Community Development District Special Assessment
RB Refunding Series 2012 (A/NR) |
|
| | 2,250,000 | | | | 5.000 | | | | 05/01/26 | | | | 2,521,012 | |
| Concorde Estates Community Development District Special
Assessment for Capital Improvement Series 2004 A (NR/NR)(f) |
|
| | 3,305,000 | | | | 5.850 | | | | 05/01/35 | | | | 33 | |
| Concorde Estates Community Development District Special
Assessment for Capital Improvement Series 2004 B (NR/NR)(f) |
|
| | 3,980,000 | | | | 5.000 | | | | 05/01/11 | | | | 40 | |
| Concorde Estates Community Development District Special
Assessment for Capital Improvement Series 2011 A-1 (NR/NR) |
|
| | 3,795,000 | | | | 5.850 | | | | 05/01/35 | | | | 3,805,284 | |
| Concorde Estates Community Development District Special
Assessment for Capital Improvement Series 2011 A-2 (NR/NR) |
|
| | 2,425,000 | | | | 5.850 | | | | 05/01/35 | | | | 2,161,985 | |
| | |
| | State-Specific Municipal Debt Obligations – (continued) | |
| | Florida – (continued) | |
| Concorde Estates Community Development District Special
Assessment for Capital Improvement Series 2011 B (NR/NR)(d) |
|
| $ | 5,775,000 | | | | 0.000 | % | | | 05/01/17 | | | $ | 5,160,020 | |
| Cory Lakes Community Development District Special
Assessment Series 2001 A (NR/NR) |
|
| | 115,000 | | | | 8.375 | | | | 05/01/17 | | | | 116,810 | |
| Cory Lakes Community Development District Special
Assessment Series 2001 B (NR/NR) |
|
| | 215,000 | | | | 8.375 | | | | 05/01/17 | | | | 220,564 | |
| Country Walk Community Development District Special
Assessment RB Refunding Senior Lien Series 2015 A-1
(BBB+/NR) |
|
| | 1,060,000 | | | | 3.750 | | | | 05/01/29 | | | | 1,042,245 | |
| | 1,910,000 | | | | 4.125 | | | | 05/01/35 | | | | 1,870,979 | |
| Durbin Crossing Community Development District Special
Assessment Series 2005 A (NR/NR) |
|
| | 38,420,000 | | | | 5.500 | | | | 05/01/37 | | | | 38,394,259 | |
| Escambia County Health Facilities Authority Health Care
Facilities RB for Baptist Hospital, Inc. Project Series 2010 A
(A-/A3) |
|
| | 27,000,000 | | | | 6.000 | | | | 08/15/36 | | | | 31,205,790 | |
| Estancia at Wiregrass Community Development District Capital
Improvement RB Series 2013 (NR/NR) |
|
| | 1,270,000 | | | | 6.375 | | | | 11/01/26 | | | | 1,397,737 | |
| | 3,250,000 | | | | 7.000 | | | | 11/01/45 | | | | 3,722,322 | |
| Estancia at Wiregrass Community Development District Capital
Improvements RB Series 2015 (NR/NR) |
|
| | 1,000,000 | | | | 5.250 | | | | 11/01/35 | | | | 993,820 | |
| | 1,500,000 | | | | 5.375 | | | | 11/01/46 | | | | 1,494,315 | |
| Fishhawk Community Development District II Special
Assessment RB Refunding Series 2013 A (A-/NR) |
|
| | 1,480,000 | | | | 4.375 | | | | 05/01/34 | | | | 1,505,264 | |
| Florida Higher Educational Facilities Financing Authority RB
Refunding for Nova Southeastern University Project
Series 2012 A (BBB+/NR) |
|
| | 600,000 | | | | 5.000 | | | | 04/01/32 | | | | 647,862 | |
| | 5,820,000 | | | | 5.250 | | | | 04/01/42 | | | | 6,301,256 | |
| Greater Orlando Aviation Authority Airport Facilities RB
Refunding for Jetblue Airways Corp. Project Series 2013
(AMT) (NR/NR) |
|
| | 3,165,000 | | | | 5.000 | | | | 11/15/26 | | | | 3,351,608 | |
| | 5,000,000 | | | | 5.000 | | | | 11/15/36 | | | | 5,098,000 | |
| Greeneway Improvement District Special Assessment RB
Series 2013 (NR/NR) |
|
| | 11,755,000 | | | | 5.125 | | | | 05/01/43 | | | | 11,942,492 | |
| Heritage Harbour Market Place Community Development District
Special Assessment for Capital Improvement Series 2005
(NR/NR) |
|
| | 7,555,000 | | | | 5.600 | | | | 05/01/36 | | | | 4,534,964 | |
| Heritage Harbour North Community Development District
Special Assessment Series 2014 (NR/NR) |
|
| | 1,200,000 | | | | 5.000 | | | | 05/01/34 | | | | 1,192,776 | |
| | 2,170,000 | | | | 5.125 | | | | 05/01/45 | | | | 2,148,712 | |
| Heritage Harbour South Community Development District RB
Refunding for Senior Lien Capital Improvement
Series 2013 A-1 (A/NR) |
|
| | 500,000 | | | | 5.050 | | | | 05/01/31 | | | | 525,650 | |
| | 500,000 | | | | 5.150 | | | | 05/01/34 | | | | 519,665 | |
| | |
| | |
| The accompanying notes are an integral part of these financial statements. | | 35 |
GOLDMAN SACHS HIGH YIELD MUNICIPAL FUND
Schedule of Investments (continued)
September 30, 2015 (Unaudited)
| | | | | | | | | | | | | | |
Principal
Amount | | | Interest
Rate | | | Maturity
Date | | | Value | |
| | State-Specific Municipal Debt Obligations – (continued) | |
| | Florida – (continued) | |
| Heritage Isle At Viera Community Development District Special
Assessment Series 2005 (NR/NR) |
|
| $ | 5,770,000 | | | | 5.550 | % | | | 05/01/37 | | | $ | 5,771,096 | |
| Heritage Lake Park Community Development District Special
Assessment Series 2005 (NR/NR) |
|
| | 2,265,000 | | | | 5.700 | | | | 05/01/36 | | | | 2,264,796 | |
| Heritage Landing Community Development District Special
Assessment Refunding Series 2015 (BBB/NR) |
|
| | 2,205,000 | | | | 4.200 | | | | 05/01/31 | | | | 2,143,481 | |
| | 2,000,000 | | | | 4.350 | | | | 05/01/36 | | | | 1,989,980 | |
| Islands At Doral III Community Development District Special
Assessment Refunding Series 2013 (A-/NR) |
|
| | 2,500,000 | | | | 4.125 | | | | 05/01/35 | | | | 2,500,050 | |
| Lakewood Ranch Stewardship District Special Assessment for
Lake Club Project Series 2005 (NR/NR) |
|
| | 2,895,000 | | | | 7.210 | | | | 11/01/20 | | | | 3,110,041 | |
| Lakewood Ranch Stewardship District Special Assessment for
Lake Club Project Series 2006 B (NR/NR) |
|
| | 6,855,000 | | | | 6.770 | | | | 11/01/20 | | | | 7,232,299 | |
| Lakewood Ranch Stewardship District Special Assessment RB for
Country Club East Project Series 2013 A (NR/NR) |
|
| | 2,485,000 | | | | 6.700 | | | | 05/01/33 | | | | 2,834,143 | |
| | 4,830,000 | | | | 7.000 | | | | 05/01/43 | | | | 5,600,771 | |
| Lakewood Ranch Stewardship District Special Assessment RB for
Country Club East Project Series 2014 (NR/NR) |
|
| | 4,140,000 | | | | 5.350 | | | | 05/01/34 | | | | 4,125,344 | |
| | 6,340,000 | | | | 5.600 | | | | 05/01/44 | | | | 6,312,802 | |
| Lakewood Ranch Stewardship District Special Assessment RB for
Lakewood Centre & NW Sector Project Series 2011 (NR/NR) |
|
| | 19,735,000 | | | | 8.000 | | | | 05/01/40 | | | | 24,295,956 | |
| Lakewood Ranch Stewardship District Special Assessment RB for
Lakewood Centre North Project Series 2015 (NR/NR) |
|
| | 3,000,000 | | | | 4.875 | | | | 05/01/45 | | | | 3,006,900 | |
| Lee County IDA Health Care Facilities RB for Shell Point/
Alliance Obligation Group Series 2006 (BBB-/NR) |
|
| | 17,960,000 | | | | 5.125 | | | | 11/15/36 | | | | 18,502,931 | |
| Lee County IDA Health Care Facilities RB Refunding for Shell
Point Project Series 2011 B (BBB-/NR) |
|
| | 2,600,000 | | | | 6.500 | | | | 11/15/31 | | | | 3,014,830 | |
| Lee County IDA Health Care Facilities RB Refunding for Shell
Point/Alliance Community Project Series 2007 (BBB-/NR) |
|
| | 9,000,000 | | | | 5.000 | | | | 11/15/29 | | | | 9,319,590 | |
| Longleaf Community Development District Special Assessment
Refunding Series 2005 (NR/NR) |
|
| | 4,660,000 | | | | 5.400 | | | | 05/01/30 | | | | 4,139,385 | |
| Longleaf Community Development District Special Assessment
Refunding Series 2006 (NR/NR)(f) |
|
| | 2,635,000 | | | | 5.375 | | | | 05/01/30 | | | | 1,791,800 | |
| Marshall Creek Community Development District Special
Assessment Refunding Series 2015 A (NR/NR) |
|
| | 1,940,000 | | | | 5.000 | | | | 05/01/32 | | | | 1,939,864 | |
| Meadow Pointe IV Community Development District RB for
Capital Improvement Series 2005 (NR/NR)(f) |
|
| | 880,000 | | | | 5.250 | | | | 05/01/15 | | | | 9 | |
| Meadow Pointe IV Community Development District RB for
Capital Improvement Series 2007 B (NR/NR)(f) |
|
| | 1,380,000 | | | | 6.150 | | | | 11/01/14 | | | | 14 | |
| | |
| | State-Specific Municipal Debt Obligations – (continued) | |
| | Florida – (continued) | |
| Meadow Pointe IV Community Development District RB for
Capital Improvement Series 2012 A-1 (NR/NR) |
|
| $ | 435,000 | | | | 6.000 | % | | | 05/01/36 | | | $ | 422,481 | |
| Meadow Pointe IV Community Development District RB for
Capital Improvement Series 2012 A-2 (NR/NR) |
|
| | 835,000 | | | | 6.250 | | | | 05/01/38 | | | | 810,409 | |
| Meadow Pointe IV Community Development District RB for
Capital Improvement Series 2012 B (NR/NR) |
|
| | 815,000 | | | | 6.810 | | | | 05/01/20 | | | | 824,152 | |
| Meadow Pointe IV Community Development District RB for
Capital Improvement Series 2014 A (NR/NR)(a) |
|
| | 645,000 | | | | 0.000 | | | | 05/01/35 | | | | 607,551 | |
| Meadow Pointe IV Community Development District RB for
Capital Improvement Series 2014 B (NR/NR)(a) |
|
| | 575,000 | | | | 0.000 | | | | 05/01/22 | | | | 540,264 | |
| Meadow Pointe IV Community Development District Special
Assessment for Capital Improvement Series 2005 (NR/NR)(f) |
|
| | 1,075,000 | | | | 5.250 | | | | 05/01/15 | | | | 11 | |
| Miami Beach Health Facilities Authority Hospital RB Refunding
for Mount Sinai Medical Center of Florida Series 2014
(BBB+/Baa1) |
|
| | 1,500,000 | | | | 5.000 | | | | 11/15/39 | | | | 1,588,845 | |
| Miami Special Obligation RB Refunding for Port of Miami
Tunnel Project Series 2012 (A/A2)(e) |
|
| | 11,760,000 | | | | 5.000 | | | | 03/01/30 | | | | 13,311,144 | |
| Midtown Miami Community Development District Special
Assessment RB Refunding for Parking Garage Project
Series 2014 A (NR/NR) |
|
| | 3,465,000 | | | | 5.000 | | | | 05/01/29 | | | | 3,645,388 | |
| | 3,275,000 | | | | 5.000 | | | | 05/01/37 | | | | 3,413,139 | |
| Miromar Lakes Community Development District RB Refunding
for Capital Improvement Series 2015 (NR/NR) |
|
| | 3,265,000 | | | | 5.000 | | | | 05/01/28 | | | | 3,340,617 | |
| | 2,000,000 | | | | 5.000 | | | | 05/01/35 | | | | 1,925,020 | |
| Monterra Community Development District Special Assessment
Refunding Bonds Series 2015 (AGM) (AA/NR) |
|
| | 1,820,000 | | | | 3.500 | | | | 05/01/36 | | | | 1,722,557 | |
| Naples Reserve Community Development District Special
Assessment Bonds Series 2014 (NR/NR) |
|
| | 750,000 | | | | 5.250 | | | | 11/01/35 | | | | 769,567 | |
| | 1,250,000 | | | | 5.625 | | | | 11/01/45 | | | | 1,289,813 | |
| New River Community Development District Special Assessment
RB for Capital Improvement Series 2010 A-1 (NR/NR) |
|
| | 2,000,000 | | | | 5.750 | | | | 05/01/38 | | | | 2,010,060 | |
| New River Community Development District Special Assessment
RB for Capital Improvement Series 2010 B-1 (NR/NR) |
|
| | 1,105,000 | | | | 5.000 | | | | 05/01/19 | | | | 1,106,392 | |
| New River Community Development District Special Assessment
Series 2006 B (NR/NR)(f) |
|
| | 3,260,000 | | | | 5.000 | | | | 05/01/13 | | | | 33 | |
| Orlando Florida Community Redevelopment Agency Tax
Increment RB Refunding for Conroy Road District Series 2012
(A-/NR) |
|
| | 1,680,000 | | | | 5.000 | | | | 04/01/24 | | | | 1,893,662 | |
| | 1,765,000 | | | | 5.000 | | | | 04/01/25 | | | | 1,978,371 | |
| | 1,005,000 | | | | 5.000 | | | | 04/01/26 | | | | 1,117,078 | |
| | |
| | |
| 36 | | The accompanying notes are an integral part of these financial statements. |
GOLDMAN SACHS HIGH YIELD MUNICIPAL FUND
| | | | | | | | | | | | | | |
Principal
Amount | | | Interest
Rate | | | Maturity
Date | | | Value | |
| | State-Specific Municipal Debt Obligations – (continued) | |
| | Florida – (continued) | |
| Overoaks Community Development District RB for Capital
Improvement Series 2010 A-1 (NR/NR) |
|
| $ | 1,000,000 | | | | 6.125 | % | | | 05/01/35 | | | $ | 1,000,960 | |
| Overoaks Community Development District RB for Capital
Improvement Series 2010 A-2 (NR/NR) |
|
| | 1,380,000 | | | | 6.125 | | | | 05/01/35 | | | | 1,381,063 | |
| Overoaks Community Development District RB for Capital
Improvement Series 2010 B (NR/NR) |
|
| | 1,760,000 | | | | 5.125 | | | | 05/01/17 | | | | 1,770,912 | |
| Overoaks Community Development District Special Assessment
for Capital Improvement Series 2004 A (NR/NR)(f) |
|
| | 1,200,000 | | | | 5.125 | | | | 05/01/09 | | | | 600,000 | |
| | 210,000 | | | | 6.125 | | | | 05/01/35 | | | | 105,000 | |
| Panther Trace II Community Development District Special
Assessment RB Refunding Series 2014 (AGM) (AA/NR) |
|
| | 530,000 | | | | 4.125 | | | | 05/01/35 | | | | 526,115 | |
| Paseo Community Development District Capital Improvement
Revenue Bonds Capital Appreciation Series 2011 A-2
(NR/NR)(a) |
|
| | 20,900,000 | | | | 0.000 | | | | 05/01/36 | | | | 9,556,943 | |
| Paseo Community Development District Capital Improvement
Revenue Bonds Special Assessment Series 2011 A-1 (NR/NR) |
|
| | 2,045,000 | | | | 5.400 | | | | 05/01/36 | | | | 2,069,683 | |
| Paseo Community Development District RB for Capital
Improvement Series 2005 A (NR/NR)(f) |
|
| | 6,355,000 | | | | 5.400 | | | | 05/01/36 | | | | 64 | |
| Paseo Community Development District RB for Capital
Improvement Series 2005 B (NR/NR)(f) |
|
| | 3,670,000 | | | | 4.875 | | | | 05/01/10 | | | | 37 | |
| Paseo Community Development District RB for Capital
Improvement Series 2006 (NR/NR)(f) |
|
| | 2,600,000 | | | | 5.000 | | | | 02/01/11 | | | | 26 | |
| Portofino Isles Community Development District Special
Assessment RB Refunding Series 2013 (BBB-/NR) |
|
| | 2,805,000 | | | | 4.750 | | | | 05/01/33 | | | | 2,847,692 | |
| Reunion East Community Development District Special
Assessment Refunding Bonds Series 2015 1 (NR/NR) |
|
| | 2,500,000 | | | | 6.600 | | | | 05/01/33 | | | | 2,377,825 | |
| Reunion East Community Development District Special
Assessment Refunding Bonds Series 2015 A (NR/NR) |
|
| | 3,070,000 | | | | 5.000 | | | | 05/01/25 | | | | 3,180,551 | |
| | 6,750,000 | | | | 5.000 | | | | 05/01/33 | | | | 6,718,477 | |
| Reunion East Community Development District Special
Assessment Series 2002 A-2 (NR/NR)(f) |
|
| | 2,170,000 | | | | 7.200 | | | | 05/01/22 | | | | 22 | |
| River Hall Community Development District Special Assessment
for Capital Improvement Series 2011 A (NR/NR) |
|
| | 5,110,000 | | | | 5.450 | | | | 05/01/36 | | | | 5,110,204 | |
| Sandy Creek Community Development District Special
Assessment Refunding Series 2007 B (NR/NR) |
|
| | 1,670,000 | | | | 5.500 | | | | 05/01/20 | | | | 1,663,270 | |
| Sarasota County Public Hospital District RB for Sarasota
Memorial Hospital Project Series 2009 A (AA-/A1) |
|
| | 1,500,000 | | | | 5.625 | | | | 07/01/39 | | | | 1,686,240 | |
| Seven Oaks Community Development District II Special
Assessment Series 2004 B (NR/NR) |
|
| | 225,000 | | | | 7.500 | | | | 05/01/16 | | | | 226,818 | |
| | |
| | State-Specific Municipal Debt Obligations – (continued) | |
| | Florida – (continued) | |
| South Kendall Community Development District Special
Assessment Series 2010 A (NR/NR) |
|
| $ | 1,890,000 | | | | 6.200 | % | | | 11/01/40 | | | $ | 2,025,173 | |
| South-Dade Venture Community Development District Special
Assessment RB Refunding Series 2013 (NR/NR) |
|
| | 2,015,000 | | | | 5.250 | | | | 05/01/34 | | | | 2,197,156 | |
| Southern Hills Plantation I Community Development District
Special Assessment for Capital Improvement Series 2011 A-1
(NR/NR) |
|
| | 4,230,000 | | | | 5.800 | | | | 05/01/35 | | | | 4,109,403 | |
| Southern Hills Plantation I Community Development District
Special Assessment for Capital Improvement Series 2011 A-2
(NR/NR) |
|
| | 3,180,000 | | | | 5.800 | | | | 05/01/35 | | | | 2,821,232 | |
| Southern Hills Plantation II Community Development District
Special Assessment for Capital Improvement Series 2004
(NR/NR)(f) |
|
| | 3,265,000 | | | | 5.850 | | | | 05/01/34 | | | | 1,371,300 | |
| Spring Ridge Community Development District Special
Assessment RB Series A-1 (NR/NR) |
|
| | 1,375,000 | | | | 4.800 | | | | 05/01/35 | | | | 1,364,715 | |
| St. Petersburg Health Facilities Authority RB Refunding for All
Children’s Hospital Series 2009 A (AA-/Aa3)(c) |
|
| | 5,835,000 | | | | 6.500 | | | | 11/15/19 | | | | 7,121,734 | |
| Sterling Hill Community Development District RB for Capital
Improvement Series 2003 B (NR/NR)(f) |
|
| | 455,000 | | | | 5.500 | | | | 11/01/10 | | | | 323,050 | |
| Stonegate Community Development District Special Assessment
Refunding Bonds Series 2013 (NR/NR) |
|
| | 2,160,000 | | | | 5.000 | | | | 05/01/34 | | | | 2,301,307 | |
| Stoneybrook South Community Development District Special
Assessment Bonds Refunding for Assessment Area Two-A
Project Series 2014 (NR/NR) |
|
| | 1,500,000 | | | | 5.125 | | | | 11/01/34 | | | | 1,505,175 | |
| | 3,500,000 | | | | 5.500 | | | | 11/01/44 | | | | 3,558,240 | |
| Stoneybrook South Community Development District Special
Assessment RB Refunding for Assessment Area One Project
Series 2013 (NR/NR) |
|
| | 2,500,000 | | | | 6.500 | | | | 05/01/39 | | | | 2,866,075 | |
| Sumter Landing Community Development District Recreational
RB Series 2005 A (NATL-RE) (AA-/A3) |
|
| | 2,500,000 | | | | 5.125 | | | | 10/01/38 | | | | 2,502,775 | |
| Sumter Landing Community Development District Recreational
RB Subseries 2005 B (NR/NR) |
|
| | 7,355,000 | | | | 5.700 | | | | 10/01/38 | | | | 7,354,706 | |
| Talis Park Community Development District Capital
Improvement RB Series 2013 (NR/NR) |
|
| | 1,370,000 | | | | 5.250 | | | | 11/01/34 | | | | 1,412,648 | |
| | 2,365,000 | | | | 6.000 | | | | 11/01/44 | | | | 2,601,122 | |
| Toscana Isles Community Development District Special
Assessment RB Series 2014 (NR/NR) |
|
| | 500,000 | | | | 5.750 | | | | 11/01/27 | | | | 499,975 | |
| | 2,000,000 | | | | 6.250 | | | | 11/01/44 | | | | 1,991,900 | |
| Turnbull Creek Community Development District Senior Special
Assessment Refunding Series 2015 A-1 (BBB/NR) |
|
| | 2,000,000 | | | | 4.375 | | | | 05/01/35 | | | | 1,952,360 | |
| | |
| | |
| The accompanying notes are an integral part of these financial statements. | | 37 |
GOLDMAN SACHS HIGH YIELD MUNICIPAL FUND
Schedule of Investments (continued)
September 30, 2015 (Unaudited)
| | | | | | | | | | | | | | |
Principal
Amount | | | Interest
Rate | | | Maturity
Date | | | Value | |
| | State-Specific Municipal Debt Obligations – (continued) | |
| | Florida – (continued) | |
| Venetian Community Development District Capital Improvement
RB Refunding Series 2012 A-1 (NR/NR) |
|
| $ | 500,000 | | | | 5.500 | % | | | 05/01/34 | | | $ | 509,075 | |
| | 750,000 | | | | 6.125 | | | | 05/01/42 | | | | 780,975 | |
| Venetian Parc Community Development District Special
Assessment Area One Project Series 2013 (NR/NR) |
|
| | 650,000 | | | | 6.000 | | | | 11/01/27 | | | | 714,142 | |
| | 2,050,000 | | | | 6.500 | | | | 11/01/43 | | | | 2,348,808 | |
| Venetian Parc Community Development District Special
Assessment Area Two Project Series 2013 (NR/NR) |
|
| | 925,000 | | | | 6.375 | | | | 11/01/27 | | | | 1,000,295 | |
| | 2,300,000 | | | | 7.125 | | | | 11/01/44 | | | | 2,526,113 | |
| Verano #1 Community Development District Special Assessment
Bonds for District #1 Project Series 2015 (NR/NR) |
|
| | 750,000 | | | | 5.125 | | | | 11/01/35 | | | | 744,863 | |
| | 2,000,000 | | | | 5.250 | | | | 11/01/46 | | | | 1,987,780 | |
| Village Community Development District No. 10 Special
Assessment RB Series 2012 (NR/NR) |
|
| | 2,800,000 | | | | 5.000 | | | | 05/01/32 | | | | 3,091,284 | |
| | 6,475,000 | | | | 5.125 | | | | 05/01/43 | | | | 7,184,077 | |
| Village Community Development District No. 10 Special
Assessment RB Series 2014 (NR/NR) |
|
| | 5,000,000 | | | | 6.000 | | | | 05/01/44 | | | | 5,731,950 | |
| Village Community Development District No. 5 Special
Assessment RB Refunding Phase I Series 2013 (A/NR) |
|
| | 1,685,000 | | | | 4.000 | | | | 05/01/33 | | | | 1,661,916 | |
| Village Community Development District No. 5 Special
Assessment RB Refunding Phase II Series 2013 (A/NR) |
|
| | 2,365,000 | | | | 4.000 | | | | 05/01/34 | | | | 2,316,328 | |
| Village Community Development District No. 8 Special
Assessment RB Series 2008 (NR/NR) |
|
| | 8,095,000 | | | | 6.375 | | | | 05/01/38 | | | | 8,766,237 | |
| Village Community Development District No. 8 Special
Assessment Refunding Phase II Series 2010 (NR/NR) |
|
| | 8,170,000 | | | | 6.125 | | | | 05/01/39 | | | | 9,396,154 | |
| Village Community Development District No. 9 Special
Assessment RB Series 2011 (NR/NR) |
|
| | 5,090,000 | | | | 7.000 | | | | 05/01/41 | | | | 6,209,240 | |
| Village Community Development District No. 9 Special
Assessment Refunding Series 2012 (NR/NR) |
|
| | 2,035,000 | | | | 5.500 | | | | 05/01/42 | | | | 2,316,848 | |
| Villasol Community Development District RB Series 2003 A
(NR/NR) |
|
| | 2,260,000 | | | | 6.600 | | | | 05/01/34 | | | | 2,261,266 | |
| Waters Edge Community Development District Capital
Improvement RB Refunding Series 2012 A-1 (NR/NR) |
|
| | 14,000 | | | | 5.350 | | | | 05/01/39 | | | | 13,652 | |
| Waters Edge Community Development District Capital
Improvement RB Refunding Series 2012 A-2 (NR/NR)(a) |
|
| | 775,000 | | | | 0.000 | | | | 05/01/39 | | | | 629,424 | |
| Waters Edge Community Development District Pasco County
Capital Improvement RB Refunding Senior Lien
Series 2015 A-1 (BBB+/NR) |
|
| | 3,240,000 | | | | 4.200 | | | | 05/01/36 | | | | 3,152,779 | |
| | |
| | State-Specific Municipal Debt Obligations – (continued) | |
| | Florida – (continued) | |
| Waterset North Community Development District Special
Assessment RB Series 2014 (NR/NR) |
|
| $ | 1,240,000 | | | | 5.125 | % | | | 11/01/35 | | | $ | 1,214,828 | |
| | 2,000,000 | | | | 5.500 | | | | 11/01/45 | | | | 1,968,120 | |
| Wiregrass Community Development District Capital
Improvement RB Series 2014 (NR/NR) |
|
| | 500,000 | | | | 5.375 | | | | 05/01/35 | | | | 499,680 | |
| | 3,060,000 | | | | 5.625 | | | | 05/01/45 | | | | 3,060,979 | |
| | | | | | | | | | | | | | |
| | | | | | | | | | | | | 512,701,936 | |
| | |
| | Georgia – 2.4% | |
| Altlanta Development Authority RB for New Downtown Atlanta
Stadium Project Senior Lien Series 2015 A-1 (A+/Aa3) |
|
| | 1,500,000 | | | | 5.250 | | | | 07/01/40 | | | | 1,714,965 | |
| | 5,500,000 | | | | 5.250 | | | | 07/01/44 | | | | 6,263,895 | |
| Altlanta Development Authority RB for New Downtown Atlanta
Stadium Project Senior Lien Series 2015 B (A/A1) |
|
| | 1,000,000 | | | | 4.000 | | | | 07/01/40 | | | | 1,001,550 | |
| Atlanta Tax Allocation for Beltline Project RMKT 12/15/09
Series 2009 A (NR/A2) |
|
| | 7,685,000 | | | | 7.500 | | | | 01/01/31 | | | | 8,835,444 | |
| Clayton County Development Authority Special Facilities RB for
Delta Airlines, Inc. Series 2009 A (BB/Ba3) |
|
| | 11,700,000 | | | | 8.750 | | | | 06/01/29 | | | | 14,288,742 | |
| Fulton County Development Authority RB for Tuff Caub LLC
Project Series 2007 A (NR/NR) |
|
| | 2,100,000 | | | | 5.250 | | | | 11/01/28 | | | | 2,049,516 | |
| Marietta Development Authority University Facilities RB
Refunding for Life University, Inc. Project Series 2008
(NR/Ba3) |
|
| | 2,500,000 | | | | 7.000 | | | | 06/15/39 | | | | 2,622,400 | |
| Milledgeville & Baldwin County Development Authority Student
Housing RB Refunding for Georgia College & State University
Foundation Property V, LLC Project Series 2007 (AMBAC)
(A+/WR)(b) |
|
| | 49,820,000 | | | | 0.840 | | | | 10/01/33 | | | | 44,535,593 | |
| | | | | | | | | | | | | | |
| | | | | | | | | | | | | 81,312,105 | |
| | |
| | Guam – 1.9% | |
| Guam Government Department of Education COPS for John F.
Kennedy High School Project Series 2010 A (B+/NR) |
|
| | 2,500,000 | | | | 6.625 | | | | 12/01/30 | | | | 2,753,925 | |
| | 3,355,000 | | | | 6.875 | | | | 12/01/40 | | | | 3,685,333 | |
| Guam Government Limited Obligation GO Bonds Section 30
Series 2009 A (BBB+/NR) |
|
| | 3,000,000 | | | | 5.625 | | | | 12/01/29 | | | | 3,368,430 | |
| | 2,750,000 | | | | 5.750 | | | | 12/01/34 | | | | 3,078,680 | |
| Guam International Airport Authority RB Refunding for
Series 2013 C (AMT) (AGM) (AA/A2) |
|
| | 7,300,000 | | | | 6.125 | | | | 10/01/43 | | | | 8,444,494 | |
| Guam International Airport Authority RB Refunding for
Series 2013 C (AMT) (BBB/Baa2) |
|
| | 2,000,000 | | | | 6.375 | | | | 10/01/43 | | | | 2,343,540 | |
| Guam Power Authority RB 2014 Series A (AGM) (AA/A2) | |
| | 2,760,000 | | | | 5.000 | | | | 10/01/39 | | | | 3,117,779 | |
| Guam Power Authority RB Series 2010 A (BBB/Baa2) | |
| | 10,000,000 | | | | 5.500 | | | | 10/01/40 | | | | 10,967,300 | |
| | |
| | |
| 38 | | The accompanying notes are an integral part of these financial statements. |
GOLDMAN SACHS HIGH YIELD MUNICIPAL FUND
| | | | | | | | | | | | | | |
Principal
Amount | | | Interest
Rate | | | Maturity
Date | | | Value | |
| | State-Specific Municipal Debt Obligations – (continued) | |
| | Guam – (continued) | |
| Guam Waterworks Authority RB for Water & Wastewater System
Series 2010 (A-/Baa2) |
|
| $ | 9,785,000 | | | | 5.625 | % | | | 07/01/40 | | | $ | 10,820,644 | |
| Guam Waterworks Authority RB for Water & Wastewater System
Series 2013 (A-/Baa2) |
|
| | 13,705,000 | | | | 5.500 | | | | 07/01/43 | | | | 15,277,649 | |
| | | | | | | | | | | | | | |
| | | | | | | | | | | | | 63,857,774 | |
| | |
| | Idaho – 0.5% | |
| Madison County Hospital Revenue COPS Series 2006 (BB+/NR) | |
| | 15,285,000 | | | | 5.250 | | | | 09/01/37 | | | | 15,455,428 | |
| | |
| | Illinois – 8.7% | |
| Chicago Illinois Board of Education GO Bonds Capital
Appreciation Refunding for School Reform Series 1999 A
(NATL-RE) (AA-/A3)(d) |
|
| | 15,000,000 | | | | 0.000 | | | | 12/01/31 | | | | 5,872,200 | |
| Chicago Illinois Board of Education GO Bonds Refunding for
School Reform Series 1999 A (NATL-RE) (AA-/A3) |
|
| | 9,535,000 | | | | 5.500 | | | | 12/01/26 | | | | 10,194,250 | |
| Chicago Illinois Board of Education GO Bonds Refunding
Series 2005 A (AMBAC) (BB/Ba3) |
|
| | 8,965,000 | | | | 5.500 | | | | 12/01/29 | | | | 8,598,421 | |
| Chicago Illinois Board of Education GO Bonds Series 2011 A
(BB/Ba3) |
|
| | 2,380,000 | | | | 5.000 | | | | 12/01/41 | | | | 1,985,658 | |
| Chicago Illinois Board of Education GO Bonds Series 2012 A
(BB/Ba3) |
|
| | 10,000,000 | | | | 5.000 | | | | 12/01/42 | | | | 8,318,600 | |
| Chicago Illinois Board of Education Unlimited Tax GO Bonds for
Dedicated Alternate Revenues Series 2015 C (BB/NR) |
|
| | 15,805,000 | | | | 5.250 | | | | 12/01/35 | | | | 13,956,763 | |
| | 12,500,000 | | | | 5.250 | | | | 12/01/39 | | | | 10,839,500 | |
| Chicago Illinois Board of Education Unlimited Tax GO Bonds
Refunding for Dedicated Revenues Series 2005 A (AMBAC)
(BB/Ba3) |
|
| | 2,000,000 | | | | 5.500 | | | | 12/01/30 | | | | 1,905,020 | |
| Chicago Illinois GO Bonds Refunding RMKT 06/08/15
Series 2005 D (BBB+/NR) |
|
| | 1,700,000 | | | | 5.500 | | | | 01/01/37 | | | | 1,676,795 | |
| Chicago Illinois GO Bonds Refunding Series 2014 A
(BBB+/Ba1) |
|
| | 8,375,000 | | | | 5.250 | | | | 01/01/33 | | | | 8,188,573 | |
| | 3,465,000 | | | | 5.000 | | | | 01/01/34 | | | | 3,312,921 | |
| | 2,500,000 | | | | 5.000 | | | | 01/01/36 | | | | 2,359,975 | |
| Chicago Illinois GO Bonds Series 2011 A (BBB+/Ba1) | |
| | 1,500,000 | | | | 5.250 | | | | 01/01/35 | | | | 1,450,515 | |
| | 3,000,000 | | | | 5.000 | | | | 01/01/40 | | | | 2,788,860 | |
| Chicago Illinois GO Bonds Series 2012 A (BBB+/Ba1) | |
| | 15,000,000 | | | | 5.000 | | | | 01/01/33 | | | | 14,412,450 | |
| | 850,000 | | | | 5.000 | | | | 01/01/34 | | | | 812,693 | |
| Chicago Illinois GO Bonds Refunding RMKT 06/08/15
Series 2007 F (BBB+/NR) |
|
| | 2,500,000 | | | | 5.500 | | | | 01/01/42 | | | | 2,425,500 | |
| Chicago Illinois GO Bonds Series 2015 A (BBB+/NR) | |
| | 4,180,000 | | | | 5.500 | | | | 01/01/39 | | | | 4,099,033 | |
| | |
| | State-Specific Municipal Debt Obligations – (continued) | |
| | Illinois – (continued) | |
| Chicago Illinois GO Bonds Refunding Series C (BBB+/Ba1) | |
| $ | 3,825,000 | | | | 5.000 | % | | | 01/01/40 | | | $ | 3,555,796 | |
| Du Page County Special Service Area No. 31 Special Tax for
Monarch Landing Project Series 2006 (NR/NR) |
|
| | 30,000 | | | | 5.400 | | | | 03/01/16 | | | | 30,230 | |
| | 1,450,000 | | | | 5.625 | | | | 03/01/36 | | | | 1,452,596 | |
| Illinois Finance Authority RB for Christian Homes, Inc.
Series 2007 A (BBB-/NR) |
|
| | 2,780,000 | | | | 5.750 | | | | 05/15/31 | | | | 2,918,110 | |
| Illinois Finance Authority RB for Christian Homes, Inc.
Series 2007 A (NR/NR)(c) |
|
| | 1,720,000 | | | | 5.750 | | | | 05/15/17 | | | | 1,865,581 | |
| Illinois Finance Authority RB for Christian Homes, Inc.
Series 2010 (BBB-/NR) |
|
| | 805,000 | | | | 6.125 | | | | 05/15/27 | | | | 875,985 | |
| Illinois Finance Authority RB for Christian Homes, Inc.
Series 2010 (NR/NR)(c) |
|
| | 445,000 | | | | 6.125 | | | | 05/15/20 | | | | 543,243 | |
| Illinois Finance Authority RB for Midwest Regional Medical
Center Series 2006 A (NR/NR) |
|
| | 33,995,000 | | | | 6.750 | | | | 10/01/46 | | | | 34,017,097 | |
| Illinois Finance Authority RB Refunding for Franciscan
Communities, Inc. Series 2013 A (BBB-/NR) |
|
| | 4,500,000 | | | | 5.250 | | | | 05/15/47 | | | | 4,558,860 | |
| Illinois Finance Authority RB Refunding for OSF Healthcare
System Series 2010 A (A/A2) |
|
| | 17,000,000 | | | | 6.000 | | | | 05/15/39 | | | | 19,559,690 | |
| Illinois Finance Authority Recovery Zone Facility RB for
Navistar International Corp. Project Series 2010 (CCC-/Caa1) |
|
| | 14,000,000 | | | | 6.500 | | | | 10/15/40 | | | | 14,483,280 | |
| Illinois Finance Authority Student Housing RB for MJH
Educational Assistance IV Series 2004 B (NR/C)(f) |
|
| | 15,000 | | | | 4.500 | | | | 06/01/14 | | | | 5,250 | |
| | 3,225,000 | | | | 5.000 | | | | 06/01/24 | | | | 1,128,750 | |
| | 8,000,000 | | | | 5.375 | | | | 06/01/35 | | | | 2,800,000 | |
| Illinois GO Bonds Series 2012 (A-/A3) | |
| | 750,000 | | | | 5.000 | | | | 03/01/37 | | | | 758,153 | |
| Illinois GO Bonds Series 2013 (A-/A3) | |
| | 5,050,000 | | | | 5.500 | | | | 07/01/38 | | | | 5,329,265 | |
| Illinois GO Bonds Series 2014 (AGM) (AA/A3) | |
| | 20,000,000 | | | | 5.000 | | | | 02/01/39 | | | | 20,339,000 | |
| Lincolnshire Special Service Area No. 1 Special Tax for
Sedgebrook Project Series 2004 A (NR/NR) |
|
| | 2,245,000 | | | | 6.250 | | | | 03/01/34 | | | | 2,271,558 | |
| Metropolitan Pier & Exposition Authority RB for McCormick
Place Expansion Project Residual Series 2010 A-3219
(AAA/NR)(e)(g) |
|
| | 20,000,000 | | | | 10.924 | | | | 06/15/50 | | | | 20,376,200 | |
| Plano Special Service Area No. 5 Special Tax for Lakewood
Springs Club Unit 6 Series 2006 (NR/NR)(f) |
|
| | 4,567,000 | | | | 6.000 | | | | 03/01/36 | | | | 2,740,200 | |
| Quad Cities Regional Economic Development Authority RB for
Augustana College Series 2012 (NR/Baa1) |
|
| | 840,000 | | | | 4.750 | | | | 10/01/29 | | | | 877,036 | |
| | 1,010,000 | | | | 4.750 | | | | 10/01/32 | | | | 1,042,108 | |
| | |
| | |
| The accompanying notes are an integral part of these financial statements. | | 39 |
GOLDMAN SACHS HIGH YIELD MUNICIPAL FUND
Schedule of Investments (continued)
September 30, 2015 (Unaudited)
| | | | | | | | | | | | | | |
Principal
Amount | | | Interest
Rate | | | Maturity
Date | | | Value | |
| | State-Specific Municipal Debt Obligations – (continued) | |
| | Illinois – (continued) | |
| Southwestern Illinois Development Authority Health Facility RB
for Memorial Group, Inc. Series 2013 (BB+/NR) |
|
| $ | 19,200,000 | | | | 7.125 | % | | | 11/01/43 | | | $ | 23,904,000 | |
| | 5,000,000 | | | | 7.625 | | | | 11/01/48 | | | | 6,386,650 | |
| Southwestern Illinois Development Authority RB Capital
Appreciation for United States Steel Corporation Project
Series 2012 (AMT) (BB-/B1) |
|
| | 12,505,000 | | | | 5.750 | | | | 08/01/42 | | | | 11,349,663 | |
| Volo Village Special Service Area No. 6 Special Tax for
Lancaster Falls Project Series 2006 (NR/NR) |
|
| | 3,928,000 | | | | 5.750 | | | | 03/01/36 | | | | 4,031,267 | |
| | | | | | | | | | | | | | |
| | | | | | | | | | | | | 290,397,295 | |
| | |
| | Indiana – 0.8% | |
| Anderson Indiana Economic Development RB Refunding &
Improvement for Anderson University Project Series 2007
(BB+/NR) |
|
| | 1,355,000 | | | | 5.000 | | | | 10/01/24 | | | | 1,362,710 | |
| | 1,500,000 | | | | 5.000 | | | | 10/01/32 | | | | 1,413,135 | |
| Delaware County Hospital Authority RB for Cardinal Health
System Obligated Group Series 2006 (NR/WR)(c) |
|
| | 2,000,000 | | | | 5.250 | | | | 08/01/16 | | | | 2,082,080 | |
| Gary/Chicago International Airport Authority Airport
Development Zone RB Series 2014 (AMT) (BBB+/NR) |
|
| | 1,300,000 | | | | 5.000 | | | | 02/01/29 | | | | 1,363,024 | |
| | 1,250,000 | | | | 5.250 | | | | 02/01/34 | | | | 1,313,512 | |
| | 1,500,000 | | | | 5.000 | | | | 02/01/39 | | | | 1,522,335 | |
| Indiana Finance Authority Environmental Improvement RB for
United States Steel Corp. Project Series 2012 (AMT) (BB-/B1) |
|
| | 795,000 | | | | 5.750 | | | | 08/01/42 | | | | 721,550 | |
| Indiana Finance Authority Hospital RB for Indiana University
Health Obligated Group Series 2011 N (AA-/Aa3) |
|
| | 2,000,000 | | | | 5.125 | | | | 03/01/38 | | | | 2,220,040 | |
| Indiana Finance Authority Midwestern Disaster Relief RB for
Ohio Valley Electric Co. Project Series 2012 A (BBB-/Baa3) |
|
| | 5,000,000 | | | | 5.000 | | | | 06/01/39 | | | | 5,188,700 | |
| Indiana Finance Authority RB for Private Activity for Ohio River
Bridges East End Crossing Project Series 2013 A (AMT)
(BBB/NR) |
|
| | 6,250,000 | | | | 5.000 | | | | 07/01/48 | | | | 6,439,500 | |
| Indianapolis Airport Authority Special Facilities RB for United
Air Lines, Inc. Project Series 1995 A (AMT) (NR/WR)(f) |
|
| | 7,520,823 | | | | 6.500 | | | | 11/15/31 | | | | 45,125 | |
| Vigo County Hospital Authority RB for Vigo Union Hospital, Inc.
Series 2007 (NR/NR)(e) |
|
| | 2,000,000 | | | | 5.500 | | | | 09/01/27 | | | | 2,084,700 | |
| | | | | | | | | | | | | | |
| | | | | | | | | | | | | 25,756,411 | |
| | |
| | Iowa – 0.1% | |
| Coralville Iowa COPS Series 2006 D (NR/Ba1) | |
| | 2,550,000 | | | | 5.250 | | | | 06/01/26 | | | | 2,554,871 | |
| Pottawattamie County RB Refunding for Christian Homes, Inc.
Series 2007 E (BBB-/NR) |
|
| | 1,355,000 | | | | 5.750 | | | | 05/15/31 | | | | 1,422,316 | |
| | | | | | | | | | | | | | |
| | | | | | | | | | | | | 3,977,187 | |
| | |
| | State-Specific Municipal Debt Obligations – (continued) | |
| | Kentucky – 0.9% | |
| Kentucky Economic Development Finance Authority Hospital RB
for Owensboro Medical Health System, Inc. Series 2010 A
(BBB+/Baa3) |
|
| $ | 8,000,000 | | | | 6.375 | % | | | 06/01/40 | | | $ | 9,001,680 | |
| | 8,250,000 | | | | 6.500 | | | | 03/01/45 | | | | 9,304,267 | |
| Louisville & Jefferson County Metro Government Health System
RB for Norton Healthcare, Inc. Series 2006 (A-/NR) |
|
| | 6,815,000 | | | | 5.000 | | | | 10/01/30 | | | | 7,063,339 | |
| Louisville & Jefferson County Metro Government Health System
RB for Norton Healthcare, Inc. Series 2013 A (A-/NR) |
|
| | 5,000,000 | | | | 5.750 | | | | 10/01/42 | | | | 5,740,600 | |
| | | | | | | | | | | | | | |
| | | | | | | | | | | | | 31,109,886 | |
| | |
| | Louisiana – 1.8% | |
| Louisiana Local Government Environmental Facilities and
Community Development Authority RB for Westlake Chemical
Corp. Projects Series 2010 A-2 (BBB+/Baa3) |
|
| | 5,000,000 | | | | 6.500 | | | | 11/01/35 | | | | 5,892,300 | |
| Louisiana Local Government Environmental Facilities and
Community Development Authority RB for Women’s Hospital
Foundation Project Series 2010 A (A/A3) |
|
| | 19,265,000 | | | | 6.000 | | | | 10/01/44 | | | | 22,438,523 | |
| New Orleans Aviation Board General Airport RB for North
Terminal Project Series 2015 B (AMT) (A-/A3) |
|
| | 12,000,000 | | | | 5.000 | | | | 01/01/40 | | | | 13,015,080 | |
| | 10,000,000 | | | | 5.000 | | | | 01/01/45 | | | | 10,789,500 | |
| New Orleans Aviation Board Gulf Opportunity Zone RB for
Consolidated Rental Car Project Series 2009 A (A-/Baa1) |
|
| | 7,470,000 | | | | 6.500 | | | | 01/01/40 | | | | 8,371,405 | |
| | | | | | | | | | | | | | |
| | | | | | | | | | | | | 60,506,808 | |
| | |
| | Maryland – 1.1% | |
| Baltimore Maryland Convention Center Hotel RB
Subseries 2006 B (BB-/Ba2) |
|
| | 200,000 | | | | 5.000 | | | | 09/01/16 | | | | 205,628 | |
| Frederick County Maryland Educational Facilities RB for Mount
St. Mary’s University Series 2007 (BB+/Ba2) |
|
| | 2,590,000 | | | | 5.000 | | | | 09/01/30 | | | | 2,523,515 | |
| Frederick County Maryland Special Tax Limited Obligations
Bonds for Jefferson Technology Park Series 2013 A (NR/NR) |
|
| | 3,000,000 | | | | 7.250 | | | | 07/01/43 | | | | 3,219,480 | |
| Frederick County Maryland Tax Incremental & Special Tax
Limited Obligations Bonds for Jefferson Technology Park
Series 2013 B (NR/NR) |
|
| | 8,860,000 | | | | 7.125 | | | | 07/01/43 | | | | 9,886,519 | |
| Maryland State Health & Higher Educational Facilities Authority
RB for Doctors Community Hospital Series 2010 (BB+/Baa3) |
|
| | 9,500,000 | | | | 5.750 | | | | 07/01/38 | | | | 10,063,350 | |
| Maryland State Health & Higher Educational Facilities Authority
RB for Mercy Medical Center Series 2007 A (BBB/Baa2) |
|
| | 7,000,000 | | | | 5.500 | | | | 07/01/42 | | | | 7,332,920 | |
| Maryland State Health & Higher Educational Facilities Authority
RB for Mercy Medical Center Series 2012 (BBB/Baa2) |
|
| | 2,100,000 | | | | 5.000 | | | | 07/01/31 | | | | 2,227,953 | |
| | | | | | | | | | | | | | |
| | | | | | | | | | | | | 35,459,365 | |
| | |
| | |
| 40 | | The accompanying notes are an integral part of these financial statements. |
GOLDMAN SACHS HIGH YIELD MUNICIPAL FUND
| | | | | | | | | | | | | | |
Principal
Amount | | | Interest
Rate | | | Maturity
Date | | | Value | |
| | State-Specific Municipal Debt Obligations – (continued) | |
| | Massachusetts – 0.5% | |
| Massachusetts Development Finance Agency RB Series 2013 A
(NR/NR)(e) |
|
| $ | 2,250,000 | | | | 6.500 | % | | | 11/15/43 | | | $ | 2,422,913 | |
| Massachusetts Development Finance Agency RB Simmons
College Issue Series 2015 K (BBB+/Baa1) |
|
| | 1,950,000 | | | | 5.000 | | | | 10/01/36 | | | | 2,087,709 | |
| Massachusetts State Health & Educational Facilities Authority RB
for Suffolk University Series 2009 A (BBB/Baa2) |
|
| | 12,500,000 | | | | 5.750 | | | | 07/01/39 | | | | 13,912,625 | |
| | | | | | | | | | | | | | |
| | | | | | | | | | | | | 18,423,247 | |
| | |
| | Michigan – 2.5% | |
| Allen Park City Brownfield Redevelopment Authority
Series 2007 (AMBAC) (CCC+/WR) |
|
| | 7,095,000 | | | | 5.000 | | | | 05/01/32 | | | | 6,685,690 | |
| Detroit Michigan School District GO Bonds for School Building
and Site Improvement Series 2002 A (FGIC-Q-SBLF)
(AA-/Aa1) |
|
| | 3,500,000 | | | | 6.000 | | | | 05/01/20 | | | | 4,128,880 | |
| | 3,000,000 | | | | 6.000 | | | | 05/01/21 | | | | 3,613,920 | |
| Detroit Michigan Sewage Disposal System RB Refunding
Series 2006 D (AGM) (AA/A2)(b) |
|
| | 4,675,000 | | | | 0.790 | | | | 07/01/32 | | | | 4,126,903 | |
| Michigan Finance Authority Local Government Loan Program
RB Refunding for Detroit Financial Recovery Income Tax
Local Project Series 2014 F (A/NR) |
|
| | 2,000,000 | | | | 4.500 | | | | 10/01/29 | | | | 2,068,760 | |
| Michigan Finance Authority Local Government Loan Program
RB Refunding for Detroit Water and Sewer Series 2014 D-1
(AGM) (AA/A2) |
|
| | 2,600,000 | | | | 5.000 | | | | 07/01/35 | | | | 2,817,932 | |
| Michigan Finance Authority RB Refunding for Detroit Water and
Sewer Senior Lien Series 2014 C-3 (AGM) (AA/A2) |
|
| | 2,175,000 | | | | 5.000 | | | | 07/01/32 | | | | 2,399,743 | |
| | 1,750,000 | | | | 5.000 | | | | 07/01/33 | | | | 1,923,932 | |
| Michigan Finance Authority State Aid RB for Detroit School
District Junior Subordinate Lien Series 2015 E (ST AID
WITHHLDG) (SP-3/NR)(e) |
|
| | 7,600,000 | | | | 5.750 | | | | 08/22/16 | | | | 7,599,392 | |
| Michigan Tobacco Settlement Finance Authority RB for Capital
Appreciation Series 2007 B (CCC+/NR)(d) |
|
| | 196,775,000 | | | | 0.000 | | | | 06/01/52 | | | | 3,154,303 | |
| Michigan Tobacco Settlement Finance Authority RB for Capital
Appreciation Series 2007 C (CCC/NR)(d) |
|
| | 70,100,000 | | | | 0.000 | | | | 06/01/52 | | | | 1,048,696 | |
| Monroe County Hospital Finance Authority RB Refunding for
Mercy Memorial Hospital Corp. Obligation Series 2006
(AA-/Baa2) |
|
| | 4,000,000 | | | | 5.375 | | | | 06/01/26 | | | | 4,114,280 | |
| | 9,835,000 | | | | 5.500 | | | | 06/01/35 | | | | 10,089,825 | |
| Royal Oak Hospital Finance Authority RB for William Beaumont
Hospital Series 2009 (NR/Aaa)(c) |
|
| | 25,000,000 | | | | 8.250 | | | | 09/01/18 | | | | 30,273,750 | |
| | | | | | | | | | | | | | |
| | | | | | | | | | | | | 84,046,006 | |
| | |
| | State-Specific Municipal Debt Obligations – (continued) | |
| | Minnesota – 0.2% | |
| Duluth Economic Development Authority Health Care Facilities
RB for St. Luke’s Hospital Series 2012 (NR/NR) |
|
| $ | 2,500,000 | | | | 5.750 | % | | | 06/15/32 | | | $ | 2,745,325 | |
| | 3,750,000 | | | | 6.000 | | | | 06/15/39 | | | | 4,117,162 | |
| | | | | | | | | | | | | | |
| | | | | | | | | | | | | 6,862,487 | |
| | |
| | Mississippi – 0.1% | |
| Mississippi Hospital Equipment & Facilities Authority RB
Refunding & Improvement for South Central Hospital
Series 2006 (BBB/NR) |
|
| | 1,825,000 | | | | 5.250 | | | | 12/01/26 | | | | 1,871,227 | |
| | |
| | Missouri – 0.0% | |
| Branson Regional Airport Transportation Development District
RB for Branson Regional Airport Series 2007 A (NR/NR)(f) |
|
| | 1,535,000 | | | | 6.000 | | | | 07/01/37 | | | | 107,450 | |
| Branson Regional Airport Transportation Development District
RB for Branson Regional Airport Series 2007 B (AMT)
(NR/NR)(f) |
|
| | 7,750,000 | | | | 6.000 | | | | 07/01/25 | | | | 542,500 | |
| Stone Canyon Community Improvement District RB for Public
Infrastructure Improvement Project Series 2007 (NR/NR)(f) |
|
| | 1,250,000 | | | | 5.750 | | | | 04/01/27 | | | | 275,000 | |
| Strother Interchange Transportation Development District-Lees
Summit RB Series 2006 (NR/NR) |
|
| | 675,000 | | | | 5.000 | | | | 05/01/24 | | | | 675,351 | |
| | | | | | | | | | | | | | |
| | | | | | | | | | | | | 1,600,301 | |
| | |
| | Nevada – 0.5% | |
| City of Las Vegas Special Improvement District No. 607 for
Local Improvement Refunding Series 2013 (NR/NR) |
|
| | 470,000 | | | | 3.000 | | | | 06/01/16 | | | | 473,008 | |
| | 730,000 | | | | 3.000 | | | | 06/01/17 | | | | 738,359 | |
| | 720,000 | | | | 4.000 | | | | 06/01/18 | | | | 741,571 | |
| | 790,000 | | | | 4.000 | | | | 06/01/19 | | | | 809,418 | |
| | 670,000 | | | | 4.000 | | | | 06/01/20 | | | | 686,857 | |
| | 865,000 | | | | 4.000 | | | | 06/01/21 | | | | 878,987 | |
| | 465,000 | | | | 5.000 | | | | 06/01/22 | | | | 495,267 | |
| | 415,000 | | | | 5.000 | | | | 06/01/23 | | | | 442,677 | |
| | 200,000 | | | | 4.250 | | | | 06/01/24 | | | | 203,120 | |
| | 295,000 | | | | 5.000 | | | | 06/01/24 | | | | 315,629 | |
| Henderson Local Improvement District No. T-16 Special
Assessment Limited Obligation Series 2005 (NR/NR) |
|
| | 1,960,000 | | | | 4.900 | | | | 03/01/17 | | | | 1,948,005 | |
| | 2,420,000 | | | | 5.000 | | | | 03/01/20 | | | | 2,367,099 | |
| | 2,440,000 | | | | 5.100 | | | | 03/01/21 | | | | 2,379,756 | |
| | 1,265,000 | | | | 5.100 | | | | 03/01/22 | | | | 1,221,712 | |
| | 3,440,000 | | | | 5.125 | | | | 03/01/25 | | | | 3,167,689 | |
| Henderson Local Improvement District No. T-17 Special
Assessment Limited Obligation Series 2005 (NR/NR) |
|
| | 1,275,000 | | | | 5.000 | | | | 09/01/25 | | | | 1,310,394 | |
| North Las Vegas Local Improvement District No. 60 Special
Assessment Refunding for Special Improvement
Subseries 2006 B (NR/NR) |
|
| | 55,000 | | | | 5.100 | | | | 12/01/22 | | | | 55,566 | |
| | | | | | | | | | | | | | |
| | | | | | | | | | | | | 18,235,114 | |
| | |
| | |
| The accompanying notes are an integral part of these financial statements. | | 41 |
GOLDMAN SACHS HIGH YIELD MUNICIPAL FUND
Schedule of Investments (continued)
September 30, 2015 (Unaudited)
| | | | | | | | | | | | | | |
Principal
Amount | | | Interest
Rate | | | Maturity
Date | | | Value | |
| | State-Specific Municipal Debt Obligations – (continued) | |
| | New Hampshire – 0.2% | |
| New Hampshire Health & Education Facilities Authority RB for
The Memorial Hospital Series 2006 (BBB/Baa3) |
|
| $ | 1,050,000 | | | | 5.250 | % | | | 06/01/26 | | | $ | 1,073,688 | |
| | 4,185,000 | | | | 5.250 | | | | 06/01/36 | | | | 4,260,581 | |
| | | | | | | | | | | | | | |
| | | | | | | | | | | | | 5,334,269 | |
| | |
| | New Jersey – 3.3% | |
| New Jersey Economic Development Authority Cigarette Tax RB
Refunding Series 2012 (BBB+/Baa1) |
|
| | 2,500,000 | | | | 5.000 | | | | 06/15/26 | | | | 2,642,400 | |
| | 1,000,000 | | | | 5.000 | | | | 06/15/28 | | | | 1,037,340 | |
| New Jersey Economic Development Authority Energy Facilities
RB for UMM Energy Partners, LLC Project Series 2012 A
(AMT) (NR/Baa3) |
|
| | 1,000,000 | | | | 4.750 | | | | 06/15/32 | | | | 1,036,480 | |
| | 1,000,000 | | | | 5.000 | | | | 06/15/37 | | | | 1,039,100 | |
| | 1,000,000 | | | | 5.125 | | | | 06/15/43 | | | | 1,042,760 | |
| New Jersey Economic Development Authority Private Activity
RB for Goethals Bridge Replacement Project Series 2013
(AMT) (BBB-/NR) |
|
| | 1,000,000 | | | | 5.375 | | | | 01/01/43 | | | | 1,073,850 | |
| New Jersey Economic Development Authority RB for School
Facilities Construction Series 2009 BB (A-/A3)(c) |
|
| | 1,640,000 | | | | 5.000 | | | | 09/01/19 | | | | 1,879,768 | |
| New Jersey Economic Development Authority RB Refunding for
School Facilities Construction Series 2005 N-1 (NATL-RE)
(AA-/A3) |
|
| | 7,705,000 | | | | 5.500 | | | | 09/01/27 | | | | 8,627,905 | |
| New Jersey Economic Development Authority Special Facilities
RB for Continental Airlines, Inc. Project Series 1998 (AMT)
(BB-/B1) |
|
| | 7,500,000 | | | | 5.500 | | | | 04/01/28 | | | | 7,522,650 | |
| New Jersey Economic Development Authority Special Facilities
RB for Continental Airlines, Inc. Project Series 1999 (AMT)
(BB-/B1) |
|
| | 8,500,000 | | | | 5.250 | | | | 09/15/29 | | | | 9,165,550 | |
| New Jersey Economic Development Authority Special Facilities
RB for Continental Airlines, Inc. Project Series 2000 A (AMT)
(BB-/B1) |
|
| | 5,000,000 | | | | 5.625 | | | | 11/15/30 | | | | 5,600,000 | |
| New Jersey Economic Development Authority Special Facilities
RB for Continental Airlines, Inc. Project Series 2000 B (AMT)
(BB-/B1) |
|
| | 5,000,000 | | | | 5.625 | | | | 11/15/30 | | | | 5,600,000 | |
| New Jersey Health Care Facilities Financing Authority RB for
St. Joseph’s Healthcare System Series 2008 (BBB-/Baa3) |
|
| | 31,880,000 | | | | 6.625 | | | | 07/01/38 | | | | 35,294,029 | |
| New Jersey Health Care Facilities Financing Authority RB for
Trinitas Hospital Obligated Group Series 2007 A (BBB/Baa2) |
|
| | 8,980,000 | | | | 5.250 | | | | 07/01/30 | | | | 9,359,854 | |
| New Jersey Transportation Trust Fund Authority for
Transportation System Bonds Series 2011 B (A-/A3) |
|
| | 14,250,000 | | | | 5.000 | | | | 06/15/42 | | | | 14,354,168 | |
| Newark New Jersey Housing Authority RB for South Ward
Police Facility Series 2009 A (ASSURED GTY) (NR/A3) |
|
| | 2,000,000 | | | | 6.750 | | | | 12/01/38 | | | | 2,310,340 | |
| | |
| | State-Specific Municipal Debt Obligations – (continued) | |
| | New Jersey – (continued) | |
�� | Tobacco Settlement Financing Corp. RB Senior Asset-Backed
Bonds for Capital Appreciation Series 2007 1-A (B-/B3) |
|
| $ | 3,000,000 | | | | 4.750 | % | | | 06/01/34 | | | $ | 2,318,190 | |
| | | | | | | | | | | | | | |
| | | | | | | | | | | | | 109,904,384 | |
| | |
| | New Mexico – 0.7% | |
| Farmington New Mexico PCRB Refunding for Public Service Co.
of New Mexico San Juan and Four Corners Projects RMKT
04/01/06 Series 2003 B (BBB/Baa2) |
|
| | 6,925,000 | | | | 4.875 | | | | 04/01/33 | | | | 7,038,778 | |
| Farmington New Mexico PCRB Refunding for Public Service Co.
of New Mexico San Juan Project Series 2010 D (BBB/Baa2) |
|
| | 14,000,000 | | | | 5.900 | | | | 06/01/40 | | | | 15,349,320 | |
| | | | | | | | | | | | | | |
| | | | | | | | | | | | | 22,388,098 | |
| | |
| | New York – 0.7% | |
| Chautauqua County Industrial Development Agency Exempt
Facility RB for Dunkirk NRG Power Project Series 2009
(BB+/Baa3) |
|
| | 1,500,000 | | | | 5.875 | | | | 04/01/42 | | | | 1,580,685 | |
| Nassau County Tobacco Settlement Corp. RB Refunding for
Asset-Backed Bonds Series 2006 A-3 (B-/NR) |
|
| | 1,890,000 | | | | 5.125 | | | | 06/01/46 | | | | 1,605,725 | |
| New York City Housing Development Corp. Multi-Family
Mortgage RB for 8 Spruce Street Series 2014 F (NR/NR) |
|
| | 2,000,000 | | | | 4.500 | | | | 02/15/48 | | | | 2,052,640 | |
| New York City Industrial Development Agency PILOT RB for
Queens Baseball Stadium Project Series 2009 (ASSURED
GTY) (AA/A3) |
|
| | 1,000,000 | | | | 6.125 | | | | 01/01/29 | | | | 1,126,030 | |
| | 3,000,000 | | | | 6.375 | | | | 01/01/39 | | | | 3,420,690 | |
| | 5,000,000 | | | | 6.500 | | | | 01/01/46 | | | | 5,710,500 | |
| Newburgh New York GO Serial Bonds Series 2012 A (NR/Baa3) | |
| | 1,565,000 | | | | 5.750 | | | | 06/15/35 | | | | 1,695,677 | |
| Onondaga Civic Development Corp. RB for St. Joseph’s Hospital
Health Center Project Series 2014 A (BB/Ba2) |
|
| | 1,750,000 | | | | 5.125 | | | | 07/01/31 | | | | 1,837,483 | |
| Troy City Capital Resource Corp. RB for Rensselaer Polytechnic
Institute Project Series 2010 A (A-/A3) |
|
| | 5,000,000 | | | | 5.125 | | | | 09/01/40 | | | | 5,551,050 | |
| | | | | | | | | | | | | | |
| | | | | | | | | | | | | 24,580,480 | |
| | |
| | North Carolina – 0.4% | |
| Columbus County Industrial Facilities and Pollution Control
Financing Authority Recovery Zone Facility RB Series 2010 A
(BBB/Baa2) |
|
| | 1,000,000 | | | | 5.700 | | | | 05/01/34 | | | | 1,105,530 | |
| North Carolina Medical Care Commission Health Care Facilities
RB Refunding First Mortgage for Lutheran Services for the
Aging Series 2012 A (NR/NR) |
|
| | 3,800,000 | | | | 4.750 | | | | 03/01/32 | | | | 3,886,184 | |
| | 1,000,000 | | | | 5.000 | | | | 03/01/37 | | | | 1,027,520 | |
| | 1,000,000 | | | | 5.000 | | | | 03/01/42 | | | | 1,020,260 | |
| North Carolina Medical Care Commission Retirement Facilities
RB Refunding First Mortgage for United Church Homes and
Services Series 2015 A (NR/NR) |
|
| | 1,000,000 | | | | 4.500 | | | | 09/01/30 | | | | 962,090 | |
| | 2,000,000 | | | | 5.000 | | | | 09/01/37 | | | | 1,994,620 | |
| | |
| | |
| 42 | | The accompanying notes are an integral part of these financial statements. |
GOLDMAN SACHS HIGH YIELD MUNICIPAL FUND
| | | | | | | | | | | | | | |
Principal
Amount | | | Interest
Rate | | | Maturity
Date | | | Value | |
| | State-Specific Municipal Debt Obligations – (continued) | |
| | North Carolina – (continued) | |
| North Carolina Medical Care Commission Retirement Facilities
RB Refunding First Mortgage for United Methodist Church
Project Series 2005 A (NR/NR) |
|
| $ | 430,000 | | | | 5.250 | % | | | 09/01/21 | | | $ | 430,430 | |
| North Carolina Medical Care Commission Retirement Facilities
RB Refunding First Mortgage for United Methodist Church
Project Series 2005 C (NR/NR) |
|
| | 1,500,000 | | | | 5.250 | | | | 10/01/24 | | | | 1,501,305 | |
| | | | | | | | | | | | | | |
| | | | | | | | | | | | | 11,927,939 | |
| | |
| | Ohio – 6.1% | |
| Bowling Green City Student Housing RB for CFP I LLC –
Bowling Green State University Project Series 2010
(BBB-/NR) |
|
| | 7,000,000 | | | | 6.000 | | | | 06/01/45 | | | | 7,451,220 | |
| Buckeye Ohio Tobacco Settlement Financing Authority RB
Senior Turbo Asset-Backed Bonds Series 2007 A-2 (B-/B3) |
|
| | 45,250,000 | | | | 6.500 | | | | 06/01/47 | | | | 40,392,865 | |
| Buckeye Ohio Tobacco Settlement Financing Authority RB
Senior Turbo Asset-Backed Bonds Series 2007 A-2 (B-/Caa1) |
|
| | 29,050,000 | | | | 5.125 | | | | 06/01/24 | | | | 24,860,990 | |
| | 48,070,000 | | | | 5.875 | | | | 06/01/30 | | | | 41,075,334 | |
| Buckeye Ohio Tobacco Settlement Financing Authority RB
Senior Turbo Asset-Backed Bonds Series 2007 A-3 (B-/Caa1) |
|
| | 16,600,000 | | | | 6.250 | | | | 06/01/37 | | | | 14,393,030 | |
| Cleveland Airport Special RB for Continental Airlines, Inc.
Project Series 1998 (AMT) (BB-/B1) |
|
| | 22,320,000 | | | | 5.375 | | | | 09/15/27 | | | | 22,415,976 | |
| Hamilton County Health Care RB Refunding for Life Enriching
Community Project Series 2006 A (BBB/NR) |
|
| | 10,540,000 | | | | 5.000 | | | | 01/01/27 | | | | 10,864,316 | |
| | 14,250,000 | | | | 5.000 | | | | 01/01/37 | | | | 14,433,540 | |
| Hamilton County Health Care RB Refunding for Life Enriching
Community Project Series 2012 (BBB/NR) |
|
| | 2,000,000 | | | | 5.000 | | | | 01/01/42 | | | | 2,054,840 | |
| | 1,610,000 | | | | 5.000 | | | | 01/01/46 | | | | 1,647,159 | |
| Lorain County Port Authority Recovery Zone Facility RB for
United States Steel Corp. Project Series 2010 (BB-/B1) |
|
| | 8,730,000 | | | | 6.750 | | | | 12/01/40 | | | | 9,086,271 | |
| Muskingum County Hospital Facilities RB Refunding for Genesis
Healthcare System Project Series 2013 (BB+/Ba2) |
|
| | 8,000,000 | | | | 5.000 | | | | 02/15/48 | | | | 8,147,440 | |
| Ohio State Solid Waste Disposal RB for USG Corp. Project
Series 1998 (AMT) (B-/B3) |
|
| | 7,250,000 | | | | 5.650 | | | | 03/01/33 | | | | 7,256,960 | |
| | | | | | | | | | | | | | |
| | | | | | | | | | | | | 204,079,941 | |
| | |
| | Oklahoma – 1.6% | |
| Oklahoma Development Finance Authority RB for Great Plains
Regional Medical Center Project Series 2007 (BB/NR) |
|
| | 4,725,000 | | | | 5.000 | | | | 12/01/27 | | | | 4,814,964 | |
| Tulsa Municipal Airport Trust RB Refunding for American
Airlines, Inc. Series 2000 B (AMT) (NR/NR) |
|
| | 12,500,000 | | | | 5.500 | | | | 06/01/35 | | | | 13,284,500 | |
| Tulsa Municipal Airport Trust RB Refunding for American
Airlines, Inc. Series 2001 A (AMT) (NR/NR) |
|
| | 2,680,000 | | | | 5.500 | | | | 12/01/35 | | | | 2,848,197 | |
| | |
| | State-Specific Municipal Debt Obligations – (continued) | |
| | Oklahoma – (continued) | |
| Tulsa Municipal Airport Trust RB Refunding for American
Airlines, Inc. Series 2001 B (AMT) (NR/NR) |
|
| $ | 24,300,000 | | | | 5.500 | % | | | 12/01/35 | | | $ | 25,825,068 | |
| Tulsa Municipal Airport Trust RB Refunding for American
Airlines, Inc. Series 2015 (AMT) (BB-/NR)(h) |
|
| | 3,500,000 | | | | 5.000 | | | | 06/01/25 | | | | 3,792,460 | |
| Weatherford Hospital Authority RB Series 2006 (NR/NR) | |
| | 2,200,000 | | | | 6.000 | | | | 05/01/25 | | | | 2,245,122 | |
| | 865,000 | | | | 6.000 | | | | 05/01/31 | | | | 875,743 | |
| | | | | | | | | | | | | | |
| | | | | | | | | | | | | 53,686,054 | |
| | |
| | Oregon – 0.1% | |
| Forest Grove Oregon Student Housing RB for Oak Tree
Foundation Project Series 2007 (NR/NR) |
|
| | 4,665,000 | | | | 5.500 | | | | 03/01/37 | | | | 4,773,648 | |
| | |
| | Pennsylvania – 3.8% | |
| Allegheny County Higher Education Building Authority RB for
Chatham University Series 2012 A (BBB/NR) |
|
| | 1,500,000 | | | | 5.000 | | | | 09/01/30 | | | | 1,611,210 | |
| | 1,000,000 | | | | 5.000 | | | | 09/01/35 | | | | 1,058,550 | |
| Allentown Neighborhood Improvement Zone Development
Authority Tax RB Series 2012 A (NR/Baa2) |
|
| | 18,000,000 | | | | 5.000 | | | | 05/01/42 | | | | 18,414,000 | |
| Chester County IDA Student Housing RB for University Student
Housing, LLC Project West Chester University Series 2013 A
(NR/Baa3) |
|
| | 500,000 | | | | 5.000 | | | | 08/01/35 | | | | 523,010 | |
| | 1,000,000 | | | | 5.000 | | | | 08/01/45 | | | | 1,025,970 | |
| City of Philadelphia GO Bonds Series 2011 (A+/A2) | |
| | 4,000,000 | | | | 6.000 | | | | 08/01/36 | | | | 4,689,680 | |
| Clairton Municipal Authority Sewer RB Series 2012 B (BBB/NR) | |
| | 1,000,000 | | | | 5.000 | | | | 12/01/42 | | | | 1,050,210 | |
| Cumberland County Municipal Authority RB for Diakon
Lutheran Social Ministries Project Series 2015 (BBB+/NR) |
|
| | 1,500,000 | | | | 5.000 | | | | 01/01/38 | | | | 1,569,945 | |
| Geisinger Authority Health System RB for Geisinger Health
System Series 2007 (AA/Aa2)(b) |
|
| | 49,750,000 | | | | 0.971 | | | | 05/01/37 | | | | 42,162,627 | |
| Lancaster County Hospital Authority Health Facilities RB for St.
Anne’s Retirement Community, Inc. Project Series 2012
(BB+/NR) |
|
| | 1,400,000 | | | | 5.000 | | | | 04/01/27 | | | | 1,445,374 | |
| | 1,500,000 | | | | 5.000 | | | | 04/01/33 | | | | 1,514,880 | |
| Luzerne County Pennsylvania GO Bonds Refunding
Series 2015 A (AGM) (AA/NR) |
|
| | 4,250,000 | | | | 5.000 | | | | 11/15/29 | | | | 4,735,137 | |
| Pennsylvania Economic Development Financing Authority RB
for The Pennsylvania Rapid Bridge Replacement Project
Series 2015 (AMT) (BBB/NR) |
|
| | 4,500,000 | | | | 5.000 | | | | 06/30/42 | | | | 4,728,780 | |
| Pennsylvania Economic Development Financing Authority
Sewage Sludge Disposal RB for Philadelphia Biosolids Facility
Project Series 2009 (BBB/Baa3) |
|
| | 7,400,000 | | | | 6.250 | | | | 01/01/32 | | | | 8,157,982 | |
| | |
| | |
| The accompanying notes are an integral part of these financial statements. | | 43 |
GOLDMAN SACHS HIGH YIELD MUNICIPAL FUND
Schedule of Investments (continued)
September 30, 2015 (Unaudited)
| | | | | | | | | | | | | | |
Principal
Amount | | | Interest
Rate | | | Maturity
Date | | | Value | |
| | State-Specific Municipal Debt Obligations – (continued) | |
| | Pennsylvania – (continued) | |
| Pennsylvania Economic Development Financing Authority
Special Facilities RB for US Airways Group, Inc. Project
Series 2010 B (B+/NR) |
|
| $ | 2,460,000 | | | | 8.000 | % | | | 05/01/29 | | | $ | 2,889,787 | |
| Pennsylvania State Higher Educational Facilities Authority RB
for Foundation for Indiana University of Pennsylvania
Series 2007 A (XLCA) (BBB+/WR)(b) |
|
| | 13,095,000 | | | | 0.790 | | | | 07/01/27 | | | | 12,043,210 | |
| | 10,750,000 | | | | 0.840 | | | | 07/01/39 | | | | 8,930,885 | |
| Pennsylvania State Higher Educational Facilities Authority RB
for La Salle University Series 2012 (BBB/NR) |
|
| | 4,000,000 | | | | 5.000 | | | | 05/01/42 | | | | 4,159,160 | |
| Philadelphia Authority Industrial Development RB for Please
Touch Museum Project Series 2006 (NR/NR)(f) |
|
| | 3,000,000 | | | | 5.250 | | | | 09/01/26 | | | | 450,000 | |
| | 3,000,000 | | | | 5.250 | | | | 09/01/31 | | | | 450,000 | |
| Philadelphia Hospitals & Higher Education Facilities Authority
RB Refunding for Temple University Health System Obligated
Group Series 2012 B (BB+/Ba2) |
|
| | 5,000,000 | | | | 6.250 | | | | 07/01/23 | | | | 5,280,900 | |
| | | | | | | | | | | | | | |
| | | | | | | | | | | | | 126,891,297 | |
| | |
| | Puerto Rico – 7.3% | |
| Puerto Rico Commonwealth Aqueduct & Sewer Authority RB
Senior Lien Series 2008 A (CCC-/Caa3) |
|
| | 56,440,000 | | | | 6.000 | | | | 07/01/38 | | | | 39,296,914 | |
| | 38,845,000 | | | | 6.000 | | | | 07/01/44 | | | | 26,900,551 | |
| Puerto Rico Commonwealth Aqueduct & Sewer Authority RB
Senior Lien Series 2012 A (CCC-/Caa3) |
|
| | 115,000 | | | | 4.500 | | | | 07/01/27 | | | | 79,781 | |
| | 370,000 | | | | 5.000 | | | | 07/01/30 | | | | 251,138 | |
| | 5,115,000 | | | | 5.125 | | | | 07/01/37 | | | | 3,465,464 | |
| | 36,835,000 | | | | 5.250 | | | | 07/01/42 | | | | 24,955,712 | |
| | 3,470,000 | | | | 6.000 | | | | 07/01/47 | | | | 2,394,300 | |
| Puerto Rico Commonwealth GO Bonds Series 2014 A (CC/Caa3) | |
| | 31,460,000 | | | | 8.000 | | | | 07/01/35 | | | | 23,595,000 | |
| Puerto Rico Commonwealth Highway & Transportation Authority
RB (CC/Ca) |
|
| | 215,000 | | | | 5.000 | | | | 07/01/28 | | | | 81,700 | |
| Puerto Rico Commonwealth Highway & Transportation Authority
RB Refunding Series 2005 L (AMBAC) (CC/Ca) |
|
| | 23,230,000 | | | | 5.250 | | | | 07/01/38 | | | | 18,410,007 | |
| Puerto Rico Commonwealth Infrastructure Financing Authority
Special Tax RB Series 2005 C (AMBAC) (CC/Ca) |
|
| | 1,500,000 | | | | 5.500 | | | | 07/01/23 | | | | 1,395,615 | |
| | 1,000,000 | | | | 5.500 | | | | 07/01/27 | | | | 885,990 | |
| Puerto Rico Commonwealth Public Improvement GO Bonds
Refunding Series 2009 B (CC/Caa3) |
|
| | 645,000 | | | | 5.875 | | | | 07/01/36 | | | | 420,056 | |
| Puerto Rico Commonwealth Public Improvement GO Bonds
Refunding Series 2011 A (CC/Caa3) |
|
| | 1,260,000 | | | | 5.750 | | | | 07/01/41 | | | | 819,000 | |
| Puerto Rico Commonwealth Public Improvement GO Bonds
Refunding Series 2011 C (CC/Caa3) |
|
| | 205,000 | | | | 6.500 | | | | 07/01/40 | | | | 135,812 | |
| | |
| | State-Specific Municipal Debt Obligations – (continued) | |
| | Puerto Rico – (continued) | |
| Puerto Rico Commonwealth Public Improvement GO Bonds
Series 2007 A (CC/Caa3) |
|
| $ | 4,000,000 | | | | 5.250 | % | | | 07/01/32 | | | $ | 2,595,040 | |
| | 4,000,000 | | | | 5.250 | | | | 07/01/37 | | | | 2,580,000 | |
| Puerto Rico Electric Power Authority RB Refunding
Series 2007 UU (AGM) (AA/A2)(b) |
|
| | 30,590,000 | | | | 0.710 | | | | 07/01/29 | | | | 22,139,513 | |
| Puerto Rico Electric Power Authority RB Refunding
Series 2010 ZZ (CC/Caa3)(f) |
|
| | 9,700,000 | | | | 5.250 | | | | 07/01/26 | | | | 6,256,597 | |
| Puerto Rico Electric Power Authority RB Refunding
Series 2012 A (CC/Caa3)(f) |
|
| | 19,720,000 | | | | 5.000 | | | | 07/01/42 | | | | 12,719,400 | |
| Puerto Rico Electric Power Authority RB Series 2008 WW
(CC/Caa3)(f) |
|
| | 2,000,000 | | | | 5.500 | | | | 07/01/20 | | | | 1,290,000 | |
| | 3,275,000 | | | | 5.000 | | | | 07/01/28 | | | | 2,112,408 | |
| | 825,000 | | | | 5.250 | | | | 07/01/33 | | | | 532,125 | |
| Puerto Rico Electric Power Authority RB Series 2010 XX
(CC/Caa3)(f) |
|
| | 7,590,000 | | | | 5.250 | | | | 07/01/40 | | | | 4,895,550 | |
| Puerto Rico Electric Power Authority RB Series 2013 A
(CC/Caa3)(f) |
|
| | 5,210,000 | | | | 7.000 | | | | 07/01/33 | | | | 3,360,450 | |
| | 5,205,000 | | | | 6.750 | | | | 07/01/36 | | | | 3,357,225 | |
| | 5,440,000 | | | | 7.000 | | | | 07/01/40 | | | | 3,508,800 | |
| Puerto Rico Infrastructure Financing Authority Special Tax RB
Series 2005 A (AMBAC) (CC/Ca)(d) |
|
| | 4,750,000 | | | | 0.000 | | | | 07/01/34 | | | | 1,171,540 | |
| | 3,750,000 | | | | 0.000 | | | | 07/01/35 | | | | 859,013 | |
| Puerto Rico Public Buildings Authority RB Refunding for
Government Facilities Series 2009 P (COMWLTH GTD)
(CC/Caa3) |
|
| | 1,000,000 | | | | 6.125 | | | | 07/01/23 | | | | 626,260 | |
| Puerto Rico Sales Tax Financing Corp. RB First Subseries 2009 A
(CC/Ca) |
|
| | 2,000,000 | | | | 6.375 | | | | 08/01/39 | | | | 852,500 | |
| | 6,800,000 | | | | 6.000 | | | | 08/01/42 | | | | 2,873,000 | |
| Puerto Rico Sales Tax Financing Corp. RB First Subseries 2010 A
(CC/Ca) |
|
| | 2,500,000 | | | | 5.375 | | | | 08/01/39 | | | | 1,053,125 | |
| | 4,455,000 | | | | 5.500 | | | | 08/01/42 | | | | 1,876,669 | |
| Puerto Rico Sales Tax Financing Corp. RB First Subseries 2010 C
(CC/Ca)(d) |
|
| | 25,000,000 | | | | 0.000 | | | | 08/01/39 | | | | 2,192,750 | |
| Puerto Rico Sales Tax Financing Corp. RB First Subseries 2010 C
(CC/Ca) |
|
| | 26,000,000 | | | | 5.250 | | | | 08/01/41 | | | | 10,952,500 | |
| Puerto Rico Sales Tax Financing Corp. RB First
Subseries 2011 A-1 (CC/Ca) |
|
| | 1,500,000 | | | | 5.000 | | | | 08/01/43 | | | | 631,875 | |
| Puerto Rico Sales Tax Financing Corp. RB for Capital
Appreciation First Subseries 2009 A (CC/Ca)(a) |
|
| | 23,300,000 | | | | 0.000 | | | | 08/01/32 | | | | 9,467,489 | |
| Puerto Rico Sales Tax Financing Corp. RB for Capital
Appreciation Series 2010 A (CC/Ca)(d) |
|
| | 10,000,000 | | | | 0.000 | | | | 08/01/33 | | | | 1,147,500 | |
| | |
| | |
| 44 | | The accompanying notes are an integral part of these financial statements. |
GOLDMAN SACHS HIGH YIELD MUNICIPAL FUND
| | | | | | | | | | | | | | |
Principal
Amount | | | Interest
Rate | | | Maturity
Date | | | Value | |
| | State-Specific Municipal Debt Obligations – (continued) | |
| | Puerto Rico – (continued) | |
| Puerto Rico Sales Tax Financing Corp. RB for Capital
Appreciation Series 2010 A (CC/Ca)(a) |
|
| $ | 10,130,000 | | | | 0.000 | % | | | 08/01/33 | | | $ | 3,115,380 | |
| Puerto Rico Sales Tax Financing Corp. Sales Tax RB Refunding
Series 2011 A-1 (CC/Ca) |
|
| | 500,000 | | | | 5.250 | | | | 08/01/43 | | | | 210,625 | |
| Puerto Rico Sales Tax Financing Corp. Sales Tax RB Refunding
Series 2011 C (CC/Caa3) |
|
| | 500,000 | | | | 5.000 | | | | 08/01/40 | | | | 310,625 | |
| | | | | | | | | | | | | | |
| | | | | | | | | | | | | 245,774,999 | |
| | |
| | Rhode Island – 0.3% | |
| Rhode Island Health and Educational Building Corp. RB
Refunding for Care New England Series 2013 A (BBB-/NR) |
|
| | 2,500,000 | | | | 6.000 | | | | 09/01/33 | | | | 2,727,925 | |
| Tobacco Settlement Financing Corp. RB Asset-Backed Bonds
Series 2007 B (CCC/NR)(d) |
|
| | 46,215,000 | | | | 0.000 | | | | 06/01/52 | | | | 1,872,632 | |
| Tobacco Settlement Financing Corp. RB Asset-Backed Bonds
Series 2015 A (BBB/NR) |
|
| | 5,000,000 | | | | 5.000 | | | | 06/01/40 | | | | 5,080,100 | |
| | | | | | | | | | | | | | |
| | | | | | | | | | | | | 9,680,657 | |
| | |
| | South Carolina – 0.2% | |
| Lancaster County Assessment RB for Edgewater Improvement
District Series 2003 A (NR/NR) |
|
| | 3,688,000 | | | | 6.875 | | | | 11/01/35 | | | | 3,624,198 | |
| South Carolina Jobs – Economic Development Authority Hospital
RB Refunding for Palmetto Health Series 2011 A (AGM)
(AA/A2) |
|
| | 4,000,000 | | | | 6.500 | | | | 08/01/39 | | | | 4,856,920 | |
| | | | | | | | | | | | | | |
| | | | | | | | | | | | | 8,481,118 | |
| | |
| | South Dakota – 0.1% | |
| South Dakota State Health & Educational Facilities Authority RB
for Sanford Health Series 2007 (A+/A1) |
|
| | 5,000,000 | | | | 5.000 | | | | 11/01/40 | | | | 5,208,000 | |
| | |
| | Tennessee – 0.8% | |
| Blount County Health & Educational Facilities Board RB
Refunding for Asbury, Inc. Series 2007 A (NR/NR) |
|
| | 1,345,000 | | | | 5.125 | | | | 04/01/23 | | | | 1,361,987 | |
| Chattanooga Health Educational & Housing Facility Board RB
Refunding for CDFI Phase I LLC Project Series 2005 A
(BBB/NR) |
|
| | 125,000 | | | | 5.000 | | | | 10/01/15 | | | | 125,000 | |
| | 7,500,000 | | | | 5.125 | | | | 10/01/35 | | | | 7,501,350 | |
| Johnson City Health & Educational Board Retirement Facilities
RB for Mountain States Health Alliance Series 2012 A
(BBB+/Baa1) |
|
| | 1,500,000 | | | | 5.000 | | | | 08/15/42 | | | | 1,583,625 | |
| Johnson City Health & Educational Facilities Board RB for
Mountain States Health Alliance Series 2010 A (BBB+/Baa1) |
|
| | 5,500,000 | | | | 6.500 | | | | 07/01/38 | | | | 6,312,735 | |
| Knox County Tennessee Health, Educational & Housing Facilities
Board RB for University Health System, Inc. Series 2007
(BBB+/NR) |
|
| | 2,000,000 | | | | 5.250 | | | | 04/01/36 | | | | 2,065,640 | |
| | |
| | State-Specific Municipal Debt Obligations – (continued) | |
| | Tennessee – (continued) | |
| Memphis Health Educational & Housing Facility Board RB for
Memphis Multi-Family Housing Apartment Projects
Series 2007 A (NR/NR)(f)(h) |
|
| $ | 8,680,000 | | | | 5.750 | % | | | 04/01/25 | | | $ | 3,385,200 | |
| Shelby County Health Educational & Housing Facilities Board
RB for Trezevant Manor Project Series 2006 A (NR/NR) |
|
| | 2,000,000 | | | | 5.625 | | | | 09/01/26 | | | | 2,062,860 | |
| Shelby County Health Educational & Housing Facilities Board
RB Refunding for The Village at Germantown Residential Care
Facility Mortgage Series 2012 (NR/NR) |
|
| | 2,000,000 | | | | 5.375 | | | | 12/01/47 | | | | 2,032,480 | |
| | | | | | | | | | | | | | |
| | | | | | | | | | | | | 26,430,877 | |
| | |
| | Texas – 5.3% | |
| Austin Texas Convention Center Enterprises, Inc. RB Third Tier
Series 2001 C-1 (NR/NR) |
|
| | 15,000 | | | | 9.750 | | | | 01/01/26 | | | | 15,237 | |
| Austin Texas Convention Center Enterprises, Inc. RB Third Tier
Series 2001 C-2 (NR/NR) |
|
| | 1,815,000 | | | | 9.750 | | | | 01/01/26 | | | | 1,843,514 | |
| Bexar County Texas Health Facilities Development Corp. RB for
Army Retirement Residence Foundation Project Series 2010
(BBB/NR) |
|
| | 3,250,000 | | | | 6.200 | | | | 07/01/45 | | | | 3,514,843 | |
| Brazos River Authority PCRB for TXU Energy Co. LLC Project
Series 2006 (AMT) (NR/NR)(f) |
|
| | 4,740,000 | | | | 5.000 | | | | 03/01/41 | | | | 272,550 | |
| Brazos River Authority PCRB Refunding for TXU Energy Co.
LLC Project Series 2003 C (AMT) (NR/NR)(f) |
|
| | 9,275,000 | | | | 6.750 | | | | 10/01/38 | | | | 533,313 | |
| Dallas County Flood Control District No.1 GO Bonds Refunding
Series 2002 (NR/NR) |
|
| | 6,000,000 | | | | 7.250 | | | | 04/01/32 | | | | 6,011,160 | |
| Fort Bend County Industrial Development Corp. RB for NRG
Energy, Inc. Project Series 2012 A (NR/Baa3) |
|
| | 1,145,000 | | | | 4.750 | | | | 05/01/38 | | | | 1,137,122 | |
| Fort Bend County Industrial Development Corp. RB for NRG
Energy, Inc. Project Series 2012 B (NR/Baa3) |
|
| | 5,250,000 | | | | 4.750 | | | | 11/01/42 | | | | 5,194,560 | |
| Grand Parkway Transportation Corp. System Toll RB First Tier
Series 2013 A (BBB/NR) |
|
| | 11,815,000 | | | | 5.500 | | | | 04/01/53 | | | | 12,873,388 | |
| Harris County Cultural Education Facilities Finance Corp. RB
First Mortgage for Brazos Presbyterian Homes, Inc. Project
Series 2013 B (BB+/NR) |
|
| | 3,030,000 | | | | 7.000 | | | | 01/01/48 | | | | 3,548,403 | |
| Houston Airport System Special Facilities RB for Continental
Airlines, Inc. Terminal Improvement Projects Series 2011 A
(AMT) (BB-/B1) |
|
| | 9,000,000 | | | | 6.625 | | | | 07/15/38 | | | | 10,423,440 | |
| Houston Airport System Special Facilities RB Refunding for
United Airlines, Inc. Terminal E Project Series 2014 A (AMT)
(BB-/B1) |
|
| | 9,250,000 | | | | 5.000 | | | | 07/01/29 | | | | 9,751,443 | |
| Houston Airport System Special Facilities RB Refunding for
United Airlines, Inc. Terminal Improvement Projects
Series 2015 B-1 (AMT) (BB-/NR) |
|
| | 7,500,000 | | | | 5.000 | | | | 07/15/35 | | | | 7,823,700 | |
| | |
| | |
| The accompanying notes are an integral part of these financial statements. | | 45 |
GOLDMAN SACHS HIGH YIELD MUNICIPAL FUND
Schedule of Investments (continued)
September 30, 2015 (Unaudited)
| | | | | | | | | | | | | | |
Principal
Amount | | | Interest
Rate | | | Maturity
Date | | | Value | |
| | State-Specific Municipal Debt Obligations – (continued) | |
| | Texas – (continued) | |
| Matagorda County Texas Navigation District No. 1 PCRB
Refunding for Central Power & Light Co. Project RMKT
07/01/09 Series 2001 A (BBB/Baa1) |
|
| $ | 5,200,000 | | | | 6.300 | % | | | 11/01/29 | | | $ | 5,847,972 | |
| Mesquite Texas Health Facilities Development Corp. RB for
Christian Care Retirement Facilities Series 2005 (BBB-/NR) |
|
| | 5,165,000 | | | | 5.625 | | | | 02/15/35 | | | | 5,182,199 | |
| New Hope Cultural Education Facilities Finance Corporation
Student Housing RB for Tarleton State University Collegiate
Housing Project Series 2015 A (BBB-/Baa3) |
|
| | 1,000,000 | | | | 5.000 | | | | 04/01/47 | | | | 1,023,520 | |
| New Hope Cultural Education Facilities Finance Corporation
Student Housing RB for Texas A&M University at Galveston
Collegiate Housing Project Series 2014 A (NR/Baa3) |
|
| | 1,385,000 | | | | 4.750 | | | | 04/01/46 | | | | 1,386,911 | |
| North Texas Tollway Authority RB First Tier Series 2009 A
(A/A1) |
|
| | 25,585,000 | | | | 6.250 | | | | 01/01/39 | | | | 29,394,862 | |
| North Texas Tollway Authority RB Refunding Toll Second Tier
Series 2008 F (A-/A2)(c) |
|
| | 32,000,000 | | | | 5.750 | | | | 01/01/18 | | | | 35,560,320 | |
| Sabine River Authority Texas PCRB Refunding for TXU Electric
Co. Project RMKT 11/29/05 Series 2001 C (NR/NR)(f) |
|
| | 5,950,000 | | | | 5.200 | | | | 05/01/28 | | | | 342,125 | |
| Tarrant County Cultural Education Facilities Finance Corp. RB
for Air Force Village Obligated Group Series 2007 (BBB-/NR) |
|
| | 4,180,000 | | | | 5.125 | | | | 05/15/37 | | | | 4,270,831 | |
| Texas Municipal Gas Acquisition & Supply Corp. I RB Senior
Lien Series 2006 B (A-/Baa1)(b) |
|
| | 7,825,000 | | | | 0.926 | | | | 12/15/26 | | | | 7,062,297 | |
| Texas Municipal Gas Acquisition & Supply Corp. I RB Senior
Lien Series 2008 D (A-/Baa1) |
|
| | 7,485,000 | | | | 6.250 | | | | 12/15/26 | | | | 9,014,784 | |
| Texas Private Activity Bond Surface Transportation Corp. RB
Senior Lien for Mobility Partners LLC Series 2009
(BBB-/Baa2) |
|
| | 7,500,000 | | | | 6.875 | | | | 12/31/39 | | | | 8,772,075 | |
| Texas Private Activity Bond Surface Transportation Corp. RB
Senior Lien for Mobility Partners LLC Series 2013 (AMT)
(BBB-/Baa3) |
|
| | 5,000,000 | | | | 6.750 | | | | 06/30/43 | | | | 6,048,250 | |
| | | | | | | | | | | | | | |
| | | | | | | | | | | | | 176,848,819 | |
| | |
| | U.S. Virgin Islands – 0.2% | |
| Virgin Islands Public Finance Authority RB Refunding
Series 2014 C (AGM) (AA/NR) |
|
| | 3,515,000 | | | | 5.000 | | | | 10/01/39 | | | | 3,843,055 | |
| Virgin Islands Public Finance Authority RB Senior Lien
Matching Fund Loan Notes Refunding for Cruzan Project
Series 2009 A (NR/Baa3) |
|
| | 2,000,000 | | | | 6.000 | | | | 10/01/39 | | | | 2,216,040 | |
| | | | | | | | | | | | | | |
| | | | | | | | | | | | | 6,059,095 | |
| | |
| | Utah – 0.7% | |
| Carbon County Solid Waste Disposal RB Refunding for
Sunnyside Cogeneration Series 1999 A (AMT) (NR/NR) |
|
| | 20,325,000 | | | | 7.100 | | | | 08/15/23 | | | | 22,412,784 | |
| | |
| | State-Specific Municipal Debt Obligations – (continued) | |
| | Vermont – 0.1% | |
| Vermont Educational & Health Buildings Financing Agency RB
for St. Michael’s College Project Series 2012 (A-/Baa1) |
|
| $ | 2,250,000 | | | | 5.000 | % | | | 10/01/42 | | | $ | 2,345,580 | |
| | |
| | Virginia – 0.8% | |
| Albemarle County IDA RB Refunding Westminster-Canterbury
Series 2007 (NR/NR) |
|
| | 1,000,000 | | | | 5.000 | | | | 01/01/31 | | | | 1,006,250 | |
| Alexandria City IDA for Residential Care Facilities Mortgagae
RB for Goodwin House, Inc. Series 2015 (BBB/NR) |
|
| | 2,700,000 | | | | 5.000 | | | | 10/01/45 | | | | 2,838,726 | |
| Mosaic District Community Development Authority RB
Series 2011 A (NR/NR) |
|
| | 3,580,000 | | | | 6.250 | | | | 03/01/21 | | | | 4,066,558 | |
| | 2,000,000 | | | | 6.625 | | | | 03/01/26 | | | | 2,258,020 | |
| | 7,000,000 | | | | 6.875 | | | | 03/01/36 | | | | 7,962,010 | |
| Suffolk IDA Retirement Facilities RB Refunding First Mortgage
for Lake Prince Center Series 2006 (NR/NR) |
|
| | 725,000 | | | | 5.150 | | | | 09/01/24 | | | | 732,765 | |
| | 1,000,000 | | | | 5.300 | | | | 09/01/31 | | | | 1,005,300 | |
| Tobacco Settlement Financing Corp. Senior Asset-Backed Bonds
Series 2007 B-1 (B-/B3) |
|
| | 1,355,000 | | | | 5.000 | | | | 06/01/47 | | | | 984,963 | |
| Virginia Beach Development Authority Residential Care Facilities
Mortgage RB Refunding for Westminster-Canterbury
Series 2005 (NR/NR) |
|
| | 500,000 | | | | 5.000 | | | | 11/01/22 | | | | 500,745 | |
| Washington County IDA RB for Mountain States Health Alliance
Series 2009 C (BBB+/Baa1) |
|
| | 4,000,000 | | | | 7.750 | | | | 07/01/38 | | | | 4,586,000 | |
| | | | | | | | | | | | | | |
| | | | | | | | | | | | | 25,941,337 | |
| | |
| | Washington – 0.7% | |
| Puttable Floating Option Tax-Exempt Receipts (RITES) GO
Bonds Series 2009 A (NR/NR)(e)(g) |
|
| | 3,955,000 | | | | 16.565 | | | | 01/01/23 | | | | 5,975,768 | |
| Puttable Floating Option Tax-Exempt Receipts (RITES) GO
Bonds Series 2009 B (NR/NR)(e)(g) |
|
| | 4,150,000 | | | | 16.573 | | | | 01/01/24 | | | | 6,263,014 | |
| Skagit County Public Hospital District No. 1 RB for Skagit Valley
Hospital Series 2010 (NR/Baa2) |
|
| | 4,000,000 | | | | 5.750 | | | | 12/01/35 | | | | 4,377,520 | |
| Washington Health Care Facilities Authority RB for Kadlec
Regional Medical Center Series 2012 (NR/Baa3)(c) |
|
| | 3,000,000 | | | | 5.000 | | | | 12/01/21 | | | | 3,595,620 | |
| Washington Health Care Facilities Authority RB for MultiCare
Health System RMKT 02/26/09 Series 2008 A (ASSURED
GTY) (AA/Aa3)(c) |
|
| | 750,000 | | | | 6.000 | | | | 08/15/19 | | | | 886,665 | |
| Washington Health Care Facilities Authority RB for MultiCare
Health System RMKT 02/26/09 Series 2008 B (ASSURED
GTY) (AA/Aa3)(c) |
|
| | 1,750,000 | | | | 6.000 | | | | 08/15/19 | | | | 2,068,885 | |
| | | | | | | | | | | | | | |
| | | | | | | | | | | | | 23,167,472 | |
| | |
| | |
| 46 | | The accompanying notes are an integral part of these financial statements. |
GOLDMAN SACHS HIGH YIELD MUNICIPAL FUND
| | | | | | | | | | | | | | |
Principal
Amount | | | Interest
Rate | | | Maturity
Date | | | Value | |
| | State-Specific Municipal Debt Obligations – (continued) | |
| | West Virginia – 0.1% | |
| West Virginia Economic Development Authority Solid Waste
Disposal Facilities RB Refunding for Appalachian Power Co. –
Amos Project Series 2010 A (BBB/Baa1)(b) |
|
| $ | 4,000,000 | | | | 5.375 | % | | | 12/01/38 | | | $ | 4,434,360 | |
| | |
| | Wisconsin – 1.8% | |
| Public Finance Authority Senior Airport Facilities RB Refunding
for Transportation Improvements Obligated Group
Series 2012 B (AMT) (BBB/NR) |
|
| | 15,810,000 | | | | 5.000 | | | | 07/01/42 | | | | 16,329,042 | |
| Public Finance Authority Student Housing RB for CHF-
Cullowhee, LLC-Western Carolina University Project
Series 2015 A (BBB-/NR) |
|
| | 3,250,000 | | | | 5.250 | | | | 07/01/47 | | | | 3,306,778 | |
| Wisconsin State Health & Educational Facilities Authority RB for
Upland Hills Health, Inc. Series 2006 B (BBB/NR) |
|
| | 3,180,000 | | | | 5.000 | | | | 05/15/36 | | | | 3,224,520 | |
| Wisconsin State Health & Educational Facilities Authority RB for
Wheaton Franciscan Healthcare Series 2006 (A-/Baa1) |
|
| | 2,000,000 | | | | 5.250 | | | | 08/15/31 | | | | 2,051,700 | |
| | 23,380,000 | | | | 5.250 | | | | 08/15/34 | | | | 23,951,875 | |
| Wisconsin State Health & Educational Facilities Authority RB
Refunding for Wheaton Healthcare Series 2006 B (A-/Baa1) |
|
| | 10,620,000 | | | | 5.125 | | | | 08/15/30 | | | | 10,891,553 | |
| | | | | | | | | | | | | | |
| | | | | | | | | | | | | 59,755,468 | |
| | |
| TOTAL STATE-SPECIFIC MUNICIPAL
DEBT OBLIGATIONS |
| | | | |
| | (Cost $3,193,715,642) | | | $ | 3,275,869,037 | |
| | |
| | | | | | | | | | | | | | |
| | Corporate Obligations – 0.2% | |
| | Materials – 0.2% | |
| AK Steel Corp. | |
| $ | 5,200,000 | | | | 7.625 | % | | | 10/01/21 | | | $ | 2,769,000 | |
| | 6,800,000 | | | | 8.375 | | | | 04/01/22 | | | | 3,425,500 | |
| | |
| | TOTAL CORPORATE OBLIGATIONS | | | | | |
| | (Cost $6,729,208) | | | $ | 6,194,500 | |
| | |
| | TOTAL INVESTMENTS – 97.9% | | | | | |
| | (Cost $3,200,444,850) | | | $ | 3,282,063,537 | |
| | |
| OTHER ASSETS IN EXCESS OF
LIABILITIES – 2.1% |
| | | 70,469,188 | |
| | |
| | NET ASSETS – 100.0% | | | $ | 3,352,532,725 | |
| | |
| | |
| The percentage shown for each investment category reflects the value of investments in that category as a percentage of net assets. |
(a) | | Zero coupon bond until next reset date. |
(b) | | Variable rate security. Except for floating rate notes (for which final maturity is disclosed), maturity date disclosed is the next interest reset date. Interest rate or distribution rate disclosed is that which is in effect on September 30, 2015. |
(c) | | Pre-refunded security. Maturity date disclosed is pre-refunding date. |
(d) | | Issued with a zero coupon. Income is recognized through the accretion of discount. |
(e) | | Exempt from registration under Rule 144A of the Securities Act of 1933. Under procedures approved by the Board of Trustees, such securities have been determined to be liquid by the Investment Adviser and may be resold, normally to qualified institutional buyers in transactions exempt from registration. Total market value of Rule 144A securities amounts to $75,205,941, which represents approximately 2.2% of net assets as of September 30, 2015. |
(f) | | Security is currently in default. |
(g) | | Inverse floating rate security. Interest rate disclosed is that which is in effect on September 30, 2015. |
(h) | | Security with “Put” features and resetting interest rates. Maturity dates disclosed are the puttable dates. Interest rate disclosed is that which is in effect at September 30, 2015. |
Security ratings disclosed, if any, are issued by either Standard & Poor’s Ratings, Moody’s Investor Service or Fitch Ratings and are unaudited. A brief description of the ratings is available in the Fund’s Statement of Additional Information.
| | |
|
Investment Abbreviations: |
AGM | | —Insured by Assured Guaranty Municipal Corp. |
AMBAC | | —Insured by American Municipal Bond Assurance Corp. |
AMT | | —Alternative Minimum Tax |
ASSURED GTY | | —Insured by Assured Guaranty |
COMWLTH GTD | | —Commonwealth Guaranteed |
COPS | | —Certificates of Participation |
FGIC | | —Insured by Financial Guaranty Insurance Co. |
FHA | | —Federal Housing Administration |
GO | | —General Obligation |
GO OF CORP | | —General Obligation of Corporation |
IDA | | —Industrial Development Authority |
LIBOR | | —London Interbank Offered Rate |
NATL-RE | | —Insured by National Public Finance Guarantee Corp. |
NR | | —Not Rated |
PCRB | | —Pollution Control Revenue Bond |
PILOT | | —Payment in Lieu of Taxes |
Q-SBLF | | —Qualified School Board Loan Fund |
RB | | —Revenue Bond |
RITES | | —Residual Interest Tax Exempt Securities |
RMKT | | —Remarketed |
WR | | —Withdrawn Rating |
XLCA | | —Insured by XL Capital Assurance, Inc. |
|
| | |
| The accompanying notes are an integral part of these financial statements. | | 47 |
GOLDMAN SACHS HIGH YIELD MUNICIPAL FUND
Schedule of Investments (continued)
September 30, 2015 (Unaudited)
|
| ADDITIONAL INVESTMENT INFORMATION |
SWAP CONTRACTS — At September 30, 2015, the Fund had the following swap contracts:
OVER THE COUNTER CREDIT DEFAULT SWAP CONTRACTS
| | | | | | | | | | | | | | | | | | | | | | | | | | |
| | | | | | | | | | | | | | | | | Market Value | |
| Counterparty | | Referenced
Obligation | | Notional
Amount
(000’s) | | | Rates Received
(Paid) | | | Termination
Date | | | Credit
Spread on
September 30,
2015(a) | | | Upfront
Payments
Made (Received) | | | Unrealized
Gain (Loss) | |
Protection Sold: | | | | | | | | | | | | | | | | | |
Bank of America, N.A. | | California State Various Purpose GO Bonds, Series 2003, 5.250%, 02/01/2018 | | $ | 4,000 | | | | 1.000 | % | | | 03/20/23 | | | | 1.021 | % | | $ | (148,280 | ) | | $ | 145,302 | |
JPMorgan Chase Bank, N.A. | | California State Various Purpose GO Bonds, Series 2003, 5.250%, 02/01/2018 | | | 10,000 | | | | 1.700 | | | | 06/20/21 | | | | 0.819 | | | | — | | | | 468,235 | |
| | California State Various Purpose GO Bonds, Series 2003, 5.250%, 02/01/2018 | | | 9,000 | | | | 1.000 | | | | 03/20/23 | | | | 1.021 | | | | (333,629 | ) | | | 326,929 | |
| | California State Various Purpose GO Bonds, Series 2003, 5.250%, 02/01/2018 | | | 15,000 | | | | 1.000 | | | | 09/20/23 | | | | 1.070 | | | | (556,835 | ) | | | 494,334 | |
| | Illinois State GO Bonds, Series A, 5.000%, 06/01/2029 | | | 10,000 | | | | 1.830 | | | | 06/20/21 | | | | 2.423 | | | | — | | | | (338,868 | ) |
Morgan Stanley Co., Inc. | | California State Various Purpose GO Bonds, Series 2003, 5.250%, 02/01/2018 | | | 10,000 | | | | 1.000 | | | | 12/20/23 | | | | 1.092 | | | | (233,058 | ) | | | 175,168 | |
| | | Illinois State GO Bonds, Series A, 5.000%, 06/01/2029 | | | 10,000 | | | | 1.000 | | | | 12/20/23 | | | | 2.563 | | | | (630,853 | ) | | | (387,584 | ) |
| TOTAL | | | | | | | | | | | | | | | | | | | | $ | (1,902,655 | ) | | $ | 883,516 | |
| | (a) | | Credit spread on the Referenced Obligation, together with the period of expiration, are indicators of payment/performance risk. The likelihood of a credit event occurring which would require a fund to make a payment or otherwise be required to perform under the swap contract is generally greater as the credit spread and term of the swap contract increase. |
CENTRALLY CLEARED INTEREST RATE SWAP CONTRACT
| | | | | | | | | | | | | | | | | | |
| | | | | | Rates Exchanged | | Market Value | |
Notional
Amount
(000’s)(a) | | | Termination
Date | | Payments
Received | | | Payments
Made | | Upfront
Payments
Made (Received) | | | Unrealized
Gain (Loss) | |
| $ | 140,500 | | | 12/16/45 | | | 3 Month LIBOR | | | 2.750% | | $ | (363,743 | ) | | $ | (5,745,029 | ) |
| | (a) | | Represents forward starting interest rate swaps whose effective dates of commencement of accruals and cash flows occur subsequent to September 30, 2015. |
| | |
| 48 | | The accompanying notes are an integral part of these financial statements. |
GOLDMAN SACHS SHORT DURATION TAX-FREE FUND
Schedule of Investments
September 30, 2015 (Unaudited)
| | | | | | | | | | | | | | |
Principal
Amount | | | Interest
Rate | | | Maturity
Date | | | Value | |
| | State-Specific Municipal Debt Obligations – 98.9% | |
| | Alabama – 0.8% | |
| Alabama 21st Century Authority Tobacco Settlement RB
Series 2012 A (A/NR) |
|
| $ | 2,435,000 | | | | 5.000 | % | | | 06/01/17 | | | $ | 2,597,414 | |
| | 1,500,000 | | | | 5.000 | | | | 06/01/18 | | | | 1,643,550 | |
| Alabama Federal Aid Highway Finance Authority Refunding for
Grant Anticipation Bonds Series 2011 (AA/A1) |
|
| | 11,400,000 | | | | 4.000 | | | | 03/01/17 | | | | 11,958,144 | |
| Alabama State GO Bonds Series 2007 A (AGM) (AA/Aa1) | |
| | 5,020,000 | | | | 5.000 | | | | 08/01/17 | | | | 5,425,415 | |
| Jefferson County Subordinate Lien Sewer RB Warrants
Series 2013 D (BBB-/NR) |
|
| | 1,000,000 | | | | 5.000 | | | | 10/01/16 | | | | 1,031,220 | |
| | 1,750,000 | | | | 5.000 | | | | 10/01/17 | | | | 1,852,217 | |
| | 1,875,000 | | | | 5.000 | | | | 10/01/18 | | | | 2,020,425 | |
| | 1,300,000 | | | | 5.000 | | | | 10/01/21 | | | | 1,422,902 | |
| | 1,745,000 | | | | 5.000 | | | | 10/01/22 | | | | 1,907,163 | |
| Tuscaloosa Alabama Public Educational Building Authority RB
Refunding Series 2009 B (AA-/NR) |
|
| | 3,850,000 | | | | 3.000 | | | | 08/15/16 | | | | 3,938,666 | |
| | | | | | | | | | | | | | |
| | | | | | | | | | | | | 33,797,116 | |
| | |
| | Alaska – 0.2% | |
| North Slope Borough Alaska GO Bonds
Series 2012 A (AA-/Aa2) |
|
| | 1,465,000 | | | | 3.000 | | | | 06/30/16 | | | | 1,494,608 | |
| | 340,000 | | | | 4.000 | | | | 06/30/17 | | | | 360,175 | |
| Northern Tobacco Securitization Corp. RB Asset-Backed Bonds
Series 2006 A (BB/Ba1) |
|
| | 4,740,000 | | | | 4.625 | | | | 06/01/23 | | | | 4,758,060 | |
| | | | | | | | | | | | | | |
| | | | | | | | | | | | | 6,612,843 | |
| | |
| | Arizona – 4.3% | |
| Arizona Health Facilities Authority Hospital RB for Banner
Health Series 2007 B (AA-/NR)(a) |
|
| | 30,300,000 | | | | 1.000 | | | | 01/01/37 | | | | 26,318,883 | |
| Arizona Health Facilities Authority Hospital RB Refunding for
Phoenix Children’s Hospital Series 2013 A (BBB+/NR)(b) |
|
| | 5,000,000 | | | | 1.870 | | | | 02/05/20 | | | | 5,140,800 | |
| Arizona School Facilities Board COPS Refunding
Series 2015 A (AA-/Aa3) |
|
| | 8,000,000 | | | | 5.000 | | | | 09/01/20 | | | | 9,278,240 | |
| Arizona Transportation Board Excise Tax RB Refunding for
Regional Area Road Series 2014 (AA+/Aa1) |
|
| | 4,150,000 | | | | 5.000 | | | | 07/01/19 | | | | 4,741,209 | |
| Arizona Transportation Board Highway RB
Series 2008 A (AAA/Aa1)(c) |
|
| | 7,000,000 | | | | 5.000 | | | | 07/01/18 | | | | 7,798,840 | |
| Arizona Transportation Board Refunding for Grant Anticipation
Notes Series 2012 (AA/Aa2) |
|
| | 7,235,000 | | | | 4.000 | | | | 07/01/16 | | | | 7,433,529 | |
| Glendale City GO Bonds Refunding Series 2015 (AGM) (AA/A2) | |
| | 2,880,000 | | | | 2.000 | | | | 07/01/16 | | | | 2,911,392 | |
| | 365,000 | | | | 4.000 | | | | 07/01/18 | | | | 391,324 | |
| | 1,600,000 | | | | 4.000 | | | | 07/01/19 | | | | 1,741,232 | |
| | 3,000,000 | | | | 4.000 | | | | 07/01/20 | | | | 3,291,300 | |
| | 3,400,000 | | | | 4.000 | | | | 07/01/21 | | | | 3,761,046 | |
| | 1,665,000 | | | | 5.000 | | | | 07/01/22 | | | | 1,952,029 | |
| | |
| | State-Specific Municipal Debt Obligations – (continued) | |
| | Arizona – (continued) | |
| Glendale City Senior Lien Water & Sewer RB Refunding
Obligations Series 2012 (AA/A1) |
|
| $ | 1,000,000 | | | | 4.000 | % | | | 07/01/16 | | | $ | 1,026,450 | |
| | 1,500,000 | | | | 5.000 | | | | 07/01/17 | | | | 1,611,000 | |
| Glendale City Senior Lien Water & Sewer RB Refunding
Obligations Series 2015 (AA/A1) |
|
| | 4,635,000 | | | | 4.000 | | | | 07/01/18 | | | | 5,016,229 | |
| | 10,830,000 | | | | 5.000 | | | | 07/01/19 | | | | 12,334,395 | |
| Maricopa County Arizona COPS Series 2015 (AA+/Aa1) | |
| | 9,000,000 | | | | 3.000 | | | | 07/01/18 | | | | 9,477,540 | |
| Maricopa County Arizona Paradise Valley Unified School District
No. 69 GO Bonds Refunding for School Improvement Project
of 2011 Series 2015 E (AA/Aa2) |
|
| | 2,860,000 | | | | 4.000 | | | | 07/01/18 | | | | 3,093,633 | |
| | 12,115,000 | | | | 3.000 | | | | 07/01/19 | | | | 12,914,469 | |
| Maricopa County Arizona Pollution Control Corp. PCRB
Refunding for Arizona Public Service Co. Palo Verde Project
RMKT 05/30/13 Series 2009 C (A-/A2)(b) |
|
| | 6,500,000 | | | | 1.750 | | | | 05/30/18 | | | | 6,572,605 | |
| Maricopa County Arizona School Improvement Refunding for
Peoria Unified School District No. 11
Series 2015 (AGM) (AA/A2) |
|
| | 3,000,000 | | | | 4.000 | | | | 07/01/19 | | | | 3,270,510 | |
| Maricopa County Community College District GO Bonds
Series 2013 (AAA/Aaa) |
|
| | 9,920,000 | | | | 2.000 | | | | 07/01/17 | | | | 10,166,810 | |
| | 10,010,000 | | | | 3.000 | | | | 07/01/19 | | | | 10,716,105 | |
| Maricopa County Phoenix High School District No. 210 School
Improvement GO Bonds Series 2006 C (NATL-RE)
(AA/Aa2)(c) |
|
| | 3,800,000 | | | | 5.000 | | | | 07/01/16 | | | | 3,933,152 | |
| Maricopa County Phoenix High School District No. 210 School
Improvement GO Refunding Bonds Series 2014 (AA/Aa2) |
|
| | 8,140,000 | | | | 3.000 | | | | 07/01/17 | | | | 8,473,089 | |
| | 1,000,000 | | | | 4.000 | | | | 07/01/18 | | | | 1,083,100 | |
| | 1,000,000 | | | | 3.000 | | | | 07/01/19 | | | | 1,067,500 | |
| Pima County GO Bonds Series 2013 A (AA-/NR) | |
| | 2,280,000 | | | | 1.750 | | | | 07/01/16 | | | | 2,304,214 | |
| | 1,405,000 | | | | 1.750 | | | | 07/01/17 | | | | 1,432,664 | |
| Yavapai County IDA Solid Waste Disposal RB for Waste
Management, Inc. Project Series 2002 (AMT) (A-/NR)(b) |
|
| | 5,000,000 | | | | 2.125 | | | | 06/01/18 | | | | 5,010,850 | |
| | | | | | | | | | | | | | |
| | | | | | | | | | | | | 174,264,139 | |
| | |
| | Arkansas – 0.6% | |
| Arkansas Development Finance Authority State Park Facilities
RB Refunding for Mt. Magazine Project
Series 2012 (AGM) (AA/NR) |
|
| | 1,720,000 | | | | 2.000 | | | | 01/01/16 | | | | 1,727,637 | |
| | 2,065,000 | | | | 2.000 | | | | 01/01/17 | | | | 2,105,020 | |
| | 1,885,000 | | | | 3.000 | | | | 01/01/18 | | | | 1,941,512 | |
| Arkansas Federal Highway Grant Anticipation GO Bonds RB
Series 2014 (AA/Aa1) |
|
| | 5,000,000 | | | | 5.000 | | | | 04/01/18 | | | | 5,525,600 | |
| Jefferson County Pollution Control RB Refunding for Entergy
Arkansas, Inc. Project Series 2013 (A-/A3) |
|
| | 3,000,000 | | | | 1.550 | | | | 10/01/17 | | | | 3,011,160 | |
| | |
| | |
| The accompanying notes are an integral part of these financial statements. | | 49 |
GOLDMAN SACHS SHORT DURATION TAX-FREE FUND
Schedule of Investments (continued)
September 30, 2015 (Unaudited)
| | | | | | | | | | | | | | |
Principal
Amount | | | Interest
Rate | | | Maturity
Date | | | Value | |
| | State-Specific Municipal Debt Obligations – (continued) | |
| | Arkansas – (continued) | |
| Little Rock Arkansas Sewer RB Refunding Series 2015 (NR/Aa3) | |
| $ | 1,240,000 | | | | 3.000 | % | | | 04/01/20 | | | $ | 1,322,125 | |
| | 1,075,000 | | | | 3.000 | | | | 10/01/20 | | | | 1,147,950 | |
| North Little Rock School District No. 1 Construction GO Bonds
Series 2013 B (ST AID WITHHLDG) (NR/Aa2) |
|
| | 1,440,000 | | | | 5.000 | | | | 02/01/17 | | | | 1,521,533 | |
| Springdale Arkansas Sales and Use Tax RB Series 2012
(AA-/NR) |
|
| | 845,000 | | | | 2.000 | | | | 11/01/16 | | | | 859,542 | |
| | 1,915,000 | | | | 2.000 | | | | 11/01/17 | | | | 1,947,842 | |
| | 1,465,000 | | | | 2.000 | | | | 11/01/18 | | | | 1,495,780 | |
| | 720,000 | | | | 2.000 | | | | 11/01/19 | | | | 731,023 | |
| | | | | | | | | | | | | | |
| | | | | | | | | | | | | 23,336,724 | |
| | |
| | California – 9.2% | |
| Abag Finance Authority RB for Sharp Health Care Series 2011 A
(AA-/Aa3) |
|
| | 3,000,000 | | | | 5.000 | | | | 08/01/16 | | | | 3,116,460 | |
| Alameda Corridor Transportation Authority RB Refunding for
Capital Appreciation Subordinate Lien Series A (AMBAC)
(BBB+/Baa2)(d) |
|
| | 10,165,000 | | | | 0.000 | | | | 10/01/19 | | | | 9,209,591 | |
| | 12,555,000 | | | | 0.000 | | | | 10/01/20 | | | | 10,907,282 | |
| Anaheim Public Financing Authority Lease RB for Convention
Center Expansion Project Series 2014 A (AA-/NR) |
|
| | 1,320,000 | | | | 5.000 | | | | 05/01/16 | | | | 1,355,600 | |
| | 1,250,000 | | | | 5.000 | | | | 05/01/17 | | | | 1,336,550 | |
| Anaheim Redevelopment Agency Tax Allocation Refunding for
Merged Redevelopment Project Area Series 2007 A (AGM)
(AA/A2) |
|
| | 50,000 | | | | 5.000 | | | | 02/01/24 | | | | 54,434 | |
| Bay Area Toll Authority Toll Bridge Authority RB for San
Francisco Bay Area RMKT 05/01/13 Series 2006 C-1
(AA/Aa3)(b) |
|
| | 10,000,000 | | | | 0.920 | | | | 05/01/23 | | | | 9,785,400 | |
| Bay Area Toll Authority Toll Bridge Authority RB for San
Francisco Bay Area RMKT 06/03/13 Series 2006 C-1
(AA/Aa1)(b) |
|
| | 7,000,000 | | | | 0.920 | | | | 05/01/23 | | | | 6,849,780 | |
| Bay Area Toll Authority Toll Bridge Authority RB for San
Francisco Bay Area Series 2001 A (AA/NR)(b) |
|
| | 15,000,000 | | | | 1.270 | | | | 04/01/27 | | | | 14,806,050 | |
| Bay Area Toll Authority Toll Bridge Authority RB for San
Francisco Bay Area Series 2006 C-2 (AA/Aa3)(b) |
|
| | 26,050,000 | | | | 1.450 | | | | 08/01/17 | | | | 26,317,012 | |
| Bay Area Toll Authority Toll Bridge Authority RB for San
Francisco Bay Area Series 2014 (AA/Aa3)(b) |
|
| | 2,000,000 | | | | 1.500 | | | | 04/02/18 | | | | 2,020,820 | |
| Benicia Unified School District GO Bonds Refunding
Series 1997 A (NATL-RE FGIC) (AA-/Aa3)(d) |
|
| | 1,735,000 | | | | 0.000 | | | | 08/01/17 | | | | 1,692,059 | |
| | 1,510,000 | | | | 0.000 | | | | 08/01/18 | | | | 1,437,943 | |
| Bonita Canyon Public Facilities Financing Authority Special Tax
for Community Facilities District No. 98-1 Series 2012
(NR/NR) |
|
| | 650,000 | | | | 3.000 | | | | 09/01/16 | | | | 657,728 | |
| | 735,000 | | | | 3.000 | | | | 09/01/17 | | | | 748,664 | |
| | 1,000,000 | | | | 3.250 | | | | 09/01/18 | | | | 1,029,380 | |
| | |
| | State-Specific Municipal Debt Obligations – (continued) | |
| | California – (continued) | |
| Buena Park Community Redevelopment Agency Tax Allocation
for Consolidated Redevelopment Project Series 2008 A (A/A3) |
|
| $ | 25,000 | | | | 4.300 | % | | | 09/01/16 | | | $ | 25,581 | |
| California Health Facilities Financing Authority RB for Catholic
Healthcare West Series 1996 G (AMBAC) (A/A3)(a) |
|
| | 6,900,000 | | | | 0.172 | | | | 07/01/23 | | | | 6,489,499 | |
| California Health Facilities Financing Authority RB for
Children’s Hospital Los Angeles Series 2012 B (BBB+/Baa2)(b) |
|
| | 8,000,000 | | | | 1.820 | | | | 07/01/17 | | | | 8,079,280 | |
| California Health Facilities Financing Authority RB Refunding
for Lucile Salter Packard Children’s Hospital at Stanford
Series 2008 B (AA-/Aa3)(b) |
|
| | 5,000,000 | | | | 1.450 | | | | 03/15/17 | | | | 5,057,400 | |
| California Municipal Finance Authority RB for NorthBay
Healthcare Group Series 2013 A (BBB-/NR)(b) |
|
| | 5,000,000 | | | | 2.120 | | | | 11/01/16 | | | | 5,000,150 | |
| California Municipal Finance Authority RB Refunding for
NorthBay Healthcare Group Series 2013 B (BBB-/NR) |
|
| | 1,700,000 | | | | 5.000 | | | | 11/01/16 | | | | 1,768,595 | |
| | 3,480,000 | | | | 5.000 | | | | 11/01/17 | | | | 3,720,920 | |
| California Municipal Finance Authority Student Housing RB for
Bowles Hall Foundation Series 2015 A (NR/Baa3) |
|
| | 150,000 | | | | 3.000 | | | | 06/01/20 | | | | 153,075 | |
| | 100,000 | | | | 4.000 | | | | 06/01/22 | | | | 105,680 | |
| California Pollution Control Financing Authority PCRB
Refunding for U.S.A. Waste Services, Inc. Series 1998 A
(AMT) (A-/NR) |
|
| | 1,900,000 | | | | 1.500 | | | | 06/01/18 | | | | 1,910,374 | |
| California State Department of Water Resources Power Supply
RB Series 2010 M (AA/Aa2) |
|
| | 15,585,000 | | | | 4.000 | | | | 05/01/16 | | | | 15,927,091 | |
| California State Various Purpose GO Bonds Refunding
Series 2012 (AA-/Aa3) |
|
| | 1,150,000 | | | | 2.000 | | | | 09/01/16 | | | | 1,168,503 | |
| | 2,055,000 | | | | 5.000 | | | | 09/01/19 | | | | 2,363,949 | |
| Carlsbad Improvement Bonds Refunding Reassessment District
No. 2012-1 Series 2013 (NR/NR) |
|
| | 400,000 | | | | 3.000 | | | | 09/02/17 | | | | 407,600 | |
| Carson Redevelopment Agency Project Area No. 1 Tax
Allocation Refunding Series 2001 (NATL-RE) (AA-/A3) |
|
| | 275,000 | | | | 5.500 | | | | 10/01/15 | | | | 275,000 | |
| Corona-Norco Unified School District Public Financing Authority
Special Tax Refunding Senior Lien Series 2013 A (A-/NR) |
|
| | 500,000 | | | | 3.000 | | | | 09/01/16 | | | | 509,720 | |
| | 275,000 | | | | 4.000 | | | | 09/01/18 | | | | 294,880 | |
| Del Mar Race Track Authority RB Series 2015 (BBB-/NR)(e) | |
| | 220,000 | | | | 2.000 | | | | 10/01/16 | | | | 222,420 | |
| | 295,000 | | | | 3.000 | | | | 10/01/17 | | | | 304,520 | |
| | 1,275,000 | | | | 4.000 | | | | 10/01/19 | | | | 1,370,778 | |
| Fontana Redevelopment Agency Tax Allocation Refunding for
Jurupa Hills Redevelopment Project Series 1999 A (A-/NR) |
|
| | 680,000 | | | | 5.500 | | | | 10/01/17 | | | | 680,585 | |
| Golden State Tobacco Securitization Corp. California Tobacco
Settlement RB Asset-Backed Bonds for Capital Appreciation
Subseries 2007 A-1 (BBB+/Aaa) |
|
| | 4,900,000 | | | | 5.000 | | | | 06/01/17 | | | | 5,218,451 | |
| | |
| | |
| 50 | | The accompanying notes are an integral part of these financial statements. |
GOLDMAN SACHS SHORT DURATION TAX-FREE FUND
| | | | | | | | | | | | | | |
Principal
Amount | | | Interest
Rate | | | Maturity
Date | | | Value | |
| | State-Specific Municipal Debt Obligations – (continued) | |
| | California – (continued) | |
| Golden State Tobacco Securitization Corp. California Tobacco
Settlement RB Asset-Backed Bonds Series 2007 A-1 (B/B3) |
|
| $ | 15,225,000 | | | | 4.500 | % | | | 06/01/27 | | | $ | 14,596,816 | |
| Golden State Tobacco Securitization Corp. California Tobacco
Settlement RB Enhanced Asset-Backed Bonds Series 2013 A
(A+/A1) |
|
| | 4,225,000 | | | | 3.000 | | | | 06/01/17 | | | | 4,382,508 | |
| Irvine City Limited Obligation Improvement Bond Reassessment
District No. 12-1 Series 2012 Act 1915 (BBB+/NR) |
|
| | 1,215,000 | | | | 4.000 | | | | 09/02/17 | | | | 1,275,677 | |
| | 1,250,000 | | | | 4.000 | | | | 09/02/18 | | | | 1,332,325 | |
| | 1,895,000 | | | | 4.000 | | | | 09/02/19 | | | | 2,037,523 | |
| Irvine City Limited Obligation Improvement Bond Reassessment
District No. 13-1 Series 2013 (BBB-/NR) |
|
| | 625,000 | | | | 2.000 | | | | 09/02/17 | | | | 633,337 | |
| Irvine City Limited Obligation Improvement Bond Reassessment
District No. 15-2 Series 2015 (NR/NR) |
|
| | 300,000 | | | | 2.000 | | | | 09/02/16 | | | | 303,087 | |
| | 400,000 | | | | 3.000 | | | | 09/02/17 | | | | 413,388 | |
| | 500,000 | | | | 4.000 | | | | 09/02/18 | | | | 534,255 | |
| | 1,000,000 | | | | 4.000 | | | | 09/02/19 | | | | 1,078,730 | |
| | 725,000 | | | | 4.000 | | | | 09/02/20 | | | | 785,740 | |
| | 775,000 | | | | 5.000 | | | | 09/02/21 | | | | 883,531 | |
| Lake Elsinore Public Financing Authority Local Agency RB
Refunding for Community Facilities District No. 88-3
Series 2015 B (AGM) (AA/NR) |
|
| | 1,235,000 | | | | 5.000 | | | | 09/01/20 | | | | 1,418,484 | |
| Lake Elsinore Public Financing Authority Local Agency RB
Refunding Series 2015 (NR/NR) |
|
| | 355,000 | | | | 3.000 | | | | 09/01/17 | | | | 364,085 | |
| | 1,495,000 | | | | 4.000 | | | | 09/01/18 | | | | 1,565,145 | |
| | 1,000,000 | | | | 4.000 | | | | 09/01/19 | | | | 1,051,660 | |
| | 840,000 | | | | 5.000 | | | | 09/01/21 | | | | 935,567 | |
| Long Beach California Harbor Revenue Short-Term Notes
Series 2014 C (AA/NR) |
|
| | 20,000,000 | | | | 5.000 | | | | 11/15/18 | | | | 22,602,200 | |
| Los Alamitos Unified School District GO Bonds for School
Facilities Improvement District No.1 Series 2011 (ETM)
(SP-1+/Aa2)(c)(d) |
|
| | 1,750,000 | | | | 0.000 | | | | 09/01/16 | | | | 1,744,943 | |
| Los Angeles California Department of Water and Power System
RB Series 2012 C (AA-/Aa3) |
|
| | 1,300,000 | | | | 3.000 | | | | 01/01/16 | | | | 1,300,000 | |
| Los Angeles Community Redevelopment Agency Tax Allocation
for Hollywood Redevelopment Project Series 1998 C
(NATL-RE) (AA-/A3) |
|
| | 540,000 | | | | 5.500 | | | | 07/01/17 | | | | 578,567 | |
| Los Angeles County Metropolitan Transportation Authority Sales
Tax RB Refunding First Tier Senior Series 2011 A (AAA/Aa2) |
|
| | 10,000,000 | | | | 5.000 | | | | 07/01/17 | | | | 10,772,600 | |
| Los Angeles County Public Works Financing Authority Lease RB
for Multiple Capital Projects II Series 2012 (AA/A1) |
|
| | 1,500,000 | | | | 5.000 | | | | 08/01/18 | | | | 1,670,985 | |
| Los Angeles Unified School District Series 2004 F (FGIC)
(AA-/Aa2) |
|
| | 455,000 | | | | 5.000 | | | | 07/01/17 | | | | 471,221 | |
| | |
| | State-Specific Municipal Debt Obligations – (continued) | |
| | California – (continued) | |
| Los Angeles Unified School District Series 2004 F (FGIC)
(NR/Aa2)(c) |
|
| $ | 1,350,000 | | | | 5.000 | % | | | 07/01/16 | | | $ | 1,397,615 | |
| Manteca Unified School District Special Tax Community
Facilities District No. 1989-2 Series 2013 B (AGM) (AA/A2) |
|
| | 410,000 | | | | 3.000 | | | | 09/01/16 | | | | 419,512 | |
| | 275,000 | | | | 4.000 | | | | 09/01/17 | | | | 291,607 | |
| Miramar Ranch North California Special Tax Refunding for
Community Facilities District No.1 Series 2012 (A/NR) |
|
| | 1,000,000 | | | | 3.000 | | | | 09/01/16 | | | | 1,023,200 | |
| | 1,895,000 | | | | 4.000 | | | | 09/01/17 | | | | 2,009,439 | |
| | 3,080,000 | | | | 4.000 | | | | 09/01/19 | | | | 3,358,740 | |
| Modesto Irrigation District RB for Electric System Series 2011 A
(A+/A2) |
|
| | 1,000,000 | | | | 5.000 | | | | 07/01/17 | | | | 1,074,000 | |
| Monterey Peninsula Unified School District GO BANS
Series 2012 (NR/MIG1) |
|
| | 4,250,000 | | | | 2.500 | | | | 11/01/15 | | | | 4,257,183 | |
| Mountain View California Shoreline Regional Park Community
Tax Allocation Series 2011 A (A/NR) |
|
| | 300,000 | | | | 4.000 | | | | 08/01/16 | | | | 308,805 | |
| | 225,000 | | | | 4.000 | | | | 08/01/17 | | | | 238,293 | |
| | 350,000 | | | | 5.000 | | | | 08/01/18 | | | | 386,586 | |
| Murrieta Public Financing Authority Special Tax RB Refunding
Series 2012 (BBB-/NR) |
|
| | 1,965,000 | | | | 5.000 | | | | 09/01/18 | | | | 2,125,344 | |
| | 1,000,000 | | | | 5.000 | | | | 09/01/19 | | | | 1,103,430 | |
| Natomas Unified School District GO Bonds Refunding
Series 2012 (AGM) (AA/A2) |
|
| | 890,000 | | | | 3.000 | | | | 09/01/16 | | | | 910,648 | |
| Natomas Unified School District GO Bonds Refunding
Series 2013 (BAM) (AA/A1) |
|
| | 410,000 | | | | 3.000 | | | | 09/01/18 | | | | 435,121 | |
| | 730,000 | | | | 4.000 | | | | 09/01/20 | | | | 820,410 | |
| | 650,000 | | | | 4.000 | | | | 09/01/21 | | | | 738,745 | |
| Oxnard Community Development Commission Tax Allocation
for HERO Project Area Series 2008 (AGM) (AA/A2) |
|
| | 120,000 | | | | 5.000 | | | | 09/01/16 | | | | 124,951 | |
| Palm Desert Financing Authority RB Tax Allocation for Project
Area No. 1 As Amended Series 2006 A (NATL-RE) (AA-/A3) |
|
| | 700,000 | | | | 5.250 | | | | 04/01/20 | | | | 712,355 | |
| Palm Desert Financing Authority RB Tax Allocation for Project
Area No. 1 As Amended Series 2007 A (NATL-RE) (AA-/A3) |
|
| | 100,000 | | | | 5.000 | | | | 04/01/16 | | | | 101,236 | |
| Palm Desert Financing Authority Tax Allocation RB Refunding
for Housing Set-Aside Series 2007 (NATL-RE) (NR/A3) |
|
| | 100,000 | | | | 5.000 | | | | 10/01/20 | | | | 106,285 | |
| Palo Alto Limited Obligation Refunding & Improvement for
University Avenue Area Off-Street Parking Assessment
District Series 2012 (BBB/NR) |
|
| | 385,000 | | | | 3.000 | | | | 09/02/18 | | | | 392,862 | |
| Port of Oakland RB Refunding Intermediate Lien Series 2007 B
(NATL-RE) (AA-/A3) |
|
| | 400,000 | | | | 5.000 | | | | 11/01/15 | | | | 401,604 | |
| | |
| | |
| The accompanying notes are an integral part of these financial statements. | | 51 |
GOLDMAN SACHS SHORT DURATION TAX-FREE FUND
Schedule of Investments (continued)
September 30, 2015 (Unaudited)
| | | | | | | | | | | | | | |
Principal
Amount | | | Interest
Rate | | | Maturity
Date | | | Value | |
| | State-Specific Municipal Debt Obligations – (continued) | |
| | California – (continued) | |
| Rancho Cucamonga Redevelopment Agency Set Aside Allocation
for Rancho Redevelopment Housing Series 2007 A
(NATL-RE) (AA-/A3) |
|
| $ | 150,000 | | | | 5.500 | % | | | 09/01/17 | | | $ | 162,381 | |
| Roseville Finance Authority Special Tax Revenue Refunding
Bonds Series 2012 (A/NR) |
|
| | 1,855,000 | | | | 3.000 | | | | 09/01/17 | | | | 1,924,488 | |
| Sacramento City Schools Joint Powers Financing Authority Lease
RB Refunding Series 2014 A (BAM) (AA/NR) |
|
| | 1,065,000 | | | | 4.000 | | | | 03/01/17 | | | | 1,118,069 | |
| | 1,000,000 | | | | 4.000 | | | | 03/01/18 | | | | 1,072,610 | |
| Sacramento County Regional Transit District Farebox RB
Series 2012 (A-/A3) |
|
| | 500,000 | | | | 4.000 | | | | 03/01/16 | | | | 507,325 | |
| | 530,000 | | | | 4.000 | | | | 03/01/17 | | | | 554,645 | |
| | 250,000 | | | | 5.000 | | | | 03/01/18 | | | | 273,208 | |
| | 730,000 | | | | 5.000 | | | | 03/01/19 | | | | 817,607 | |
| Sacramento County Sanitation District Financing Authority RB
Refunding for Sacramento County Regional Series 2007 B
(NATL-RE FGIC) (AA/Aa3)(a) |
|
| | 43,220,000 | | | | 0.747 | | | | 12/01/35 | | | | 38,582,926 | |
| Salida Area Public Facilities Financing Agency Community
Facilities District No. 1988-1 Special Tax Bonds Series 2011
(AGM) (AA/NR) |
|
| | 1,470,000 | | | | 3.000 | | | | 09/01/16 | | | | 1,506,544 | |
| | 1,515,000 | | | | 3.000 | | | | 09/01/17 | | | | 1,583,190 | |
| | 1,310,000 | | | | 3.000 | | | | 09/01/18 | | | | 1,375,592 | |
| San Bernardino City Unified School District GO Bonds
Refunding Series 2013 A (A/A2) |
|
| | 800,000 | | | | 5.000 | | | | 08/01/18 | | | | 890,712 | |
| San Bernardino City Unified School District GO Bonds
Refunding Series 2013 A (AGM) (AA/A2) |
|
| | 150,000 | | | | 5.000 | | | | 08/01/19 | | | | 171,351 | |
| San Diego Redevelopment Agency Tax Allocation for Centre
City Redevelopment Series 2006 A (AMBAC) (AA-/A2) |
|
| | 1,450,000 | | | | 5.250 | | | | 09/01/21 | | | | 1,507,420 | |
| | 665,000 | | | | 5.250 | | | | 09/01/23 | | | | 691,148 | |
| San Diego Redevelopment Agency Tax Allocation for Centre
City Series 2004 A (XLCA) (A/A2) |
|
| | 150,000 | | | | 5.250 | | | | 09/01/16 | | | | 150,359 | |
| | 300,000 | | | | 5.000 | | | | 09/01/17 | | | | 300,687 | |
| San Francisco City & County Airport Commission San Francisco
International Airport RB Refunding Second Series 2010 D
(AGM) (AA/A1) |
|
| | 4,455,000 | | | | 5.000 | | | | 05/01/17 | | | | 4,765,647 | |
| San Francisco City & County GO Bonds for Clean & Safe
Neighborhood Parks Series 2012 B (AA+/Aa1) |
|
| | 2,750,000 | | | | 4.000 | | | | 06/15/19 | | | | 3,056,928 | |
| San Francisco City & County Redevelopment Financing
Authority Tax Allocation for San Francisco Redevelopment
Project Series 2003 B (NATL-RE FGIC) (AA-/A2) |
|
| | 250,000 | | | | 5.250 | | | | 08/01/17 | | | | 250,235 | |
| San Jacinto Redevelopment Agency Tax Allocation for
Redevelopment Project Area Series 2005 (XLCA) (A-/WR) |
|
| | 160,000 | | | | 3.900 | | | | 08/01/17 | | | | 160,115 | |
| | |
| | State-Specific Municipal Debt Obligations – (continued) | |
| | California – (continued) | |
| San Juan Unified School District Election of 2012 GO Bonds
Series 2014 B (NR/Aa2) |
|
| $ | 11,105,000 | | | | 2.000 | % | | | 08/01/17 | | | $ | 11,396,506 | |
| | 2,000,000 | | | | 3.000 | | | | 08/01/19 | | | | 2,141,060 | |
| San Marcos Public Financing Authority Special Tax RB
Refunding Series 2012 (A-/NR) |
|
| | 620,000 | | | | 2.000 | | | | 09/01/16 | | | | 628,506 | |
| | 1,260,000 | | | | 2.250 | | | | 09/01/17 | | | | 1,293,264 | |
| | 1,000,000 | | | | 4.000 | | | | 09/01/19 | | | | 1,092,090 | |
| San Ramon Valley Unified School District GO Bonds
Series 1998 A (NATL-RE FGIC) (AA/Aa1)(d) |
|
| | 2,000,000 | | | | 0.000 | | | | 07/01/18 | | | | 1,945,040 | |
| Simi Valley Community Development Agency Tax Allocation
Refunding for Tapo Canyon and West End Project Series 2003
(NATL-RE FGIC) (AA-/A3) |
|
| | 600,000 | | | | 5.250 | | | | 09/01/18 | | | | 601,470 | |
| Stockton Unified School District GO Bonds Refunding
Series 2012 (AGM) (AA/A2) |
|
| | 400,000 | | | | 4.000 | | | | 07/01/17 | | | | 422,700 | |
| | 1,090,000 | | | | 5.000 | | | | 07/01/19 | | | | 1,229,880 | |
| Temecula Public Financing Authority for Wolf Creek Community
Facilities District 03-03 Series 2012 Special Tax Refunding
Bonds (NR/NR) |
|
| | 825,000 | | | | 3.000 | | | | 09/01/16 | | | | 833,027 | |
| | 600,000 | | | | 3.000 | | | | 09/01/17 | | | | 611,496 | |
| Tobacco Securitization Authority Northern California Tobacco
Settlement RB Asset-Backed Bonds Series 2005 A-1 (B+/B3) |
|
| | 1,185,000 | | | | 4.750 | | | | 06/01/23 | | | | 1,184,929 | |
| Transmission Agency of Northern California RB Refunding for
California-Oregon Transmission Project Series B (NATL-RE)
(AA-/Aa3) |
|
| | 20,525,000 | | | | 0.437 | | | | 05/01/24 | | | | 19,834,114 | |
| Ukiah Unified School District GO Bonds Series 1997
(NATL-RE FGIC) (AA-/A1)(d) |
|
| | 2,000,000 | | | | 0.000 | | | | 08/01/16 | | | | 1,987,080 | |
| University of California Regents Medical Center Pooled RB
Refunding Series 2007 C-2 (NATL-RE) (AA-/Aa3)(a) |
|
| | 3,500,000 | | | | 0.825 | | | | 05/15/30 | | | | 3,269,665 | |
| | 15,000,000 | | | | 0.955 | | | | 05/15/43 | | | | 13,184,550 | |
| Ventura County Capital Appreciation GO Bonds for Conejo
Valley Unified School District for Election of 2014 Series A
(AGM) (AA/A1)(d) |
|
| | 1,775,000 | | | | 0.000 | | | | 08/01/20 | | | | 1,623,397 | |
| Western Riverside Water and Wastewater Financing Authority
Local Agency RB Refunding Series 2013 A-1 (BBB+/NR) |
|
| | 265,000 | | | | 4.000 | | | | 09/01/16 | | | | 272,709 | |
| | 525,000 | | | | 4.000 | | | | 09/01/17 | | | | 553,014 | |
| | | | | | | | | | | | | | |
| | | | | | | | | | | | | 373,376,833 | |
| | |
| | Colorado – 0.6% | |
| Colorado E-470 Public Highway Authority Senior RB Refunding
Series 2015 A (BBB+/Baa1) |
|
| | 1,000,000 | | | | 5.000 | | | | 09/01/20 | | | | 1,123,070 | |
| Colorado Health Facilities Authority RB Refunding for Covenant
Retirement Communities, Inc. Series 2015 A (BBB+/NR) |
|
| | 400,000 | | | | 1.000 | | | | 12/01/15 | | | | 400,164 | |
| | 500,000 | | | | 4.000 | | | | 12/01/18 | | | | 529,950 | |
| | 1,000,000 | | | | 5.000 | | | | 12/01/20 | | | | 1,116,090 | |
| | |
| | |
| 52 | | The accompanying notes are an integral part of these financial statements. |
GOLDMAN SACHS SHORT DURATION TAX-FREE FUND
| | | | | | | | | | | | | | |
Principal
Amount | | | Interest
Rate | | | Maturity
Date | | | Value | |
| | State-Specific Municipal Debt Obligations – (continued) | |
| | Colorado – (continued) | |
| Denver Colorado City & County School District No. 1 Tax
Exempt GO Bonds Series 2012 B (ST AID WITHHLDG)
(AA-/Aa2) |
|
| $ | 4,030,000 | | | | 4.000 | % | | | 12/01/16 | | | $ | 4,199,945 | |
| Denver Colorado Health and Hospital Authority Healthcare RB
Series B (BBB/NR)(a) |
|
| | 13,250,000 | | | | 1.317 | | | | 12/01/33 | | | | 12,275,595 | |
| Jefferson County School District No. R-1 GO Bonds Series 2012
(ST AID WITHHLDG) (AA-/Aa2) |
|
| | 1,750,000 | | | | 3.000 | | | | 12/15/16 | | | | 1,804,163 | |
| Larimer County School District No. R-1 GO Refunding and
Improvement Bonds Series 2012 (ST AID WITHHLDG)
(NR/Aa2) |
|
| | 1,000,000 | | | | 2.000 | | | | 12/15/17 | | | | 1,025,170 | |
| Plaza Metropolitan District No. 1 Tax Allocation Refunding
Series 2013 (NR/NR)(e) |
|
| | 1,935,000 | | | | 4.000 | | | | 12/01/15 | | | | 1,942,082 | |
| | 1,000,000 | | | | 4.000 | | | | 12/01/16 | | | | 1,022,600 | |
| | | | | | | | | | | | | | |
| | | | | | | | | | | | | 25,438,829 | |
| | |
| | Connecticut – 1.2% | |
| Connecticut State GO Bonds Refunding Series 2006 E (AA/Aa3) | |
| | 5,250,000 | | | | 5.000 | | | | 12/15/17 | | | | 5,537,438 | |
| Connecticut State GO Bonds Series 2013 A (AA/Aa3)(a) | |
| | 3,000,000 | | | | 0.360 | | | | 03/01/17 | | | | 2,994,930 | |
| | 2,000,000 | | | | 0.440 | | | | 03/01/18 | | | | 1,984,580 | |
| Connecticut State GO Bonds Series 2013 C (AA/Aa3) | |
| | 7,555,000 | | | | 5.000 | | | | 07/15/19 | | | | 8,597,061 | |
| Connecticut State GO Bonds Series 2015 C (AA/Aa3)(a) | |
| | 10,000,000 | | | | 0.820 | | | | 06/15/20 | | | | 9,851,300 | |
| Connecticut State Health & Educational Facilities Authority RB
for Sacred Heart University Series 2012 H (AGM) (AA/A2) |
|
| | 1,830,000 | | | | 4.000 | | | | 07/01/16 | | | | 1,871,523 | |
| | 1,000,000 | | | | 2.000 | | | | 07/01/17 | | | | 1,006,310 | |
| | 1,260,000 | | | | 4.000 | | | | 07/01/18 | | | | 1,332,336 | |
| New Haven GO Bonds Refunding Series 2012 A (A-/A3) | |
| | 4,090,000 | | | | 5.000 | | | | 11/01/16 | | | | 4,279,326 | |
| Town of Hamden GO Refunding Bonds Series 2013 (A+/Baa1) | |
| | 1,685,000 | | | | 5.000 | | | | 08/15/18 | | | | 1,857,510 | |
| | 2,000,000 | | | | 5.000 | | | | 08/15/19 | | | | 2,245,600 | |
| University of Connecticut GO Bonds Refunding Series 2011 A
(GO OF UNIV) (AA/Aa3) |
|
| | 4,730,000 | | | | 4.000 | | | | 02/15/16 | | | | 4,795,700 | |
| West Haven GO Refunding Bonds Series 2012 (AGM) (AA/A2) | |
| | 2,000,000 | | | | 4.000 | | | | 08/01/17 | | | | 2,093,580 | |
| | 2,100,000 | | | | 4.000 | | | | 08/01/18 | | | | 2,230,116 | |
| | | | | | | | | | | | | | |
| | | | | | | | | | | | | 50,677,310 | |
| | |
| | Delaware – 0.3% | |
| Delaware Transportation Authority Transportation System Senior
RB Refunding Series 2010 A (AA+/Aa2) |
|
| | 1,900,000 | | | | 5.000 | | | | 07/01/19 | | | | 2,163,169 | |
| New Castle County GO Bonds Refunding Series 2015
(AAA/Aaa) |
|
| | 1,000,000 | | | | 5.000 | | | | 10/01/20 | | | | 1,178,170 | |
| | |
| | State-Specific Municipal Debt Obligations – (continued) | |
| | Delaware – (continued) | |
| Sussex County Delaware GO Bonds Refunding Series 2012 A
(AA+/Aa1) |
|
| $ | 865,000 | | | | 3.000 | % | | | 09/15/17 | | | $ | 905,759 | |
| Sussex County Delaware GO Bonds Refunding Series 2012 B
(AA+/Aa1) |
|
| | 1,435,000 | | | | 4.000 | | | | 09/15/17 | | | | 1,530,327 | |
| University of Delaware RB Series 2013 A (AA+/Aa1) | |
| | 3,025,000 | | | | 3.000 | | | | 11/01/16 | | | | 3,112,029 | |
| | 4,265,000 | | | | 3.000 | | | | 11/01/17 | | | | 4,463,749 | |
| | | | | | | | | | | | | | |
| | | | | | | | | | | | | 13,353,203 | |
| | |
| | Florida – 4.3% | |
| Atlantic Beach Health Care Facilities RB Refunding for Fleet
Landing Project Series 2013 A (BBB/NR) |
|
| | 350,000 | | | | 3.000 | | | | 11/15/15 | | | | 350,255 | |
| | 300,000 | | | | 3.000 | | | | 11/15/16 | | | | 301,071 | |
| | 970,000 | | | | 4.000 | | | | 11/15/18 | | | | 1,005,599 | |
| Bartram Park Community Development District Special
Assessment RB Refunding for City of Jacksonville Florida
Senior Lien Series 2015 A-1 (BBB/NR) |
|
| | 555,000 | | | | 1.000 | | | | 05/01/16 | | | | 555,000 | |
| | 560,000 | | | | 1.500 | | | | 05/01/17 | | | | 560,174 | |
| | 570,000 | | | | 2.000 | | | | 05/01/18 | | | | 569,994 | |
| | 580,000 | | | | 2.300 | | | | 05/01/19 | | | | 579,994 | |
| | 600,000 | | | | 2.600 | | | | 05/01/20 | | | | 600,510 | |
| | 615,000 | | | | 3.000 | | | | 05/01/21 | | | | 616,562 | |
| | 500,000 | | | | 3.125 | | | | 05/01/22 | | | | 499,255 | |
| | 500,000 | | | | 3.250 | | | | 05/01/23 | | | | 496,670 | |
| Century Parc Community Development District Special
Assessment Refunding Series 2012 (A-/NR) |
|
| | 175,000 | | | | 2.250 | | | | 11/01/15 | | | | 175,019 | |
| | 180,000 | | | | 2.500 | | | | 11/01/16 | | | | 180,112 | |
| | 185,000 | | | | 2.750 | | | | 11/01/17 | | | | 186,038 | |
| | 190,000 | | | | 3.000 | | | | 11/01/18 | | | | 191,499 | |
| | 195,000 | | | | 3.250 | | | | 11/01/19 | | | | 198,352 | |
| Citizens Property Insurance Corp. Senior Secured RB for High
Risk Account Series 2007 A (ETM) (NATL-RE) (AA-/A1)(c) |
|
| | 6,235,000 | | | | 5.000 | | | | 03/01/17 | | | | 6,630,174 | |
| Citizens Property Insurance Corp. Senior Secured RB for High
Risk Account Series 2011 A-1 (A+/A1) |
|
| | 27,000,000 | | | | 5.000 | | | | 06/01/16 | | | | 27,810,270 | |
| CityPlace Community Development District Special Assessment
RB Refunding Series 2012 (A/NR) |
|
| | 615,000 | | | | 5.000 | | | | 05/01/17 | | | | 641,654 | |
| | 1,375,000 | | | | 5.000 | | | | 05/01/18 | | | | 1,462,931 | |
| | 1,890,000 | | | | 5.000 | | | | 05/01/19 | | | | 2,043,752 | |
| Country Walk Community Development District Special
Assessment Senior Lien RB Refunding Series 2015 A-1
(BBB+/NR) |
|
| | 195,000 | | | | 1.000 | | | | 05/01/16 | | | | 194,834 | |
| | 195,000 | | | | 1.500 | | | | 05/01/17 | | | | 194,727 | |
| | 200,000 | | | | 2.250 | | | | 05/01/18 | | | | 199,452 | |
| | 205,000 | | | | 2.500 | | | | 05/01/19 | | | | 203,957 | |
| | 210,000 | | | | 2.750 | | | | 05/01/20 | | | | 208,746 | |
| | |
| | |
| The accompanying notes are an integral part of these financial statements. | | 53 |
GOLDMAN SACHS SHORT DURATION TAX-FREE FUND
Schedule of Investments (continued)
September 30, 2015 (Unaudited)
| | | | | | | | | | | | | | |
Principal
Amount | | | Interest
Rate | | | Maturity
Date | | | Value | |
| | State-Specific Municipal Debt Obligations – (continued) | |
| | Florida – (continued) | |
| Double Branch Community Development District Special
Assessment Refunding Senior Lien Series 2013 A-1 (A-/NR) |
|
| $ | 250,000 | | | | 1.875 | % | | | 05/01/16 | | | $ | 248,932 | |
| | 500,000 | | | | 2.125 | | | | 05/01/17 | | | | 495,750 | |
| | 250,000 | | | | 2.400 | | | | 05/01/18 | | | | 245,762 | |
| | 250,000 | | | | 2.700 | | | | 05/01/19 | | | | 246,473 | |
| | 250,000 | | | | 3.000 | | | | 05/01/20 | | | | 243,828 | |
| Fishhawk Community Development District II Special
Assessment Refunding Series 2013 A (A-/NR) |
|
| | 355,000 | | | | 1.800 | | | | 05/01/16 | | | | 354,255 | |
| | 360,000 | | | | 2.100 | | | | 05/01/17 | | | | 358,891 | |
| Florida Higher Educational Facilities Financing Authority RB for
Nova Southeastern University Project Series 2012 A
(BBB/Baa1) |
|
| | 825,000 | | | | 3.000 | | | | 04/01/17 | | | | 850,938 | |
| | 500,000 | | | | 5.000 | | | | 04/01/18 | | | | 542,085 | |
| | 500,000 | | | | 5.000 | | | | 04/01/19 | | | | 551,550 | |
| Florida State Full Faith and Credit State Board of Education
Public Education Capital Outlay Tax-Exempt Bonds
Series 2008 C (AAA/Aa1) |
|
| | 2,990,000 | | | | 5.000 | | | | 06/01/20 | | | | 3,405,490 | |
| Florida State Municipal Power Agency RB Refunding for St.
Lucie Project Series 2002-1 (AMBAC) (A/A2)(b) |
|
| | 1,500,000 | | | | 0.184 | | | | 10/01/21 | | | | 1,422,518 | |
| Florida State Municipal Power Agency RB Refunding for St.
Lucie Project Series 2002-2 (AMBAC) (A/A2)(a) |
|
| | 5,400,000 | | | | 0.161 | | | | 10/07/15 | | | | 5,121,074 | |
| Florida State Municipal Power Agency RB Refunding for St.
Lucie Project Series 2002-3 (AMBAC) (A/A2)(a) |
|
| | 375,000 | | | | 0.138 | | | | 10/01/15 | | | | 355,633 | |
| Heritage Landing Community Development District Special
Assessment Refunding Series 2015 (BBB/NR) |
|
| | 490,000 | | | | 2.250 | | | | 05/01/16 | | | | 492,783 | |
| | 500,000 | | | | 2.250 | | | | 05/01/17 | | | | 504,710 | |
| | 415,000 | | | | 2.000 | | | | 05/01/18 | | | | 413,344 | |
| | 425,000 | | | | 2.250 | | | | 05/01/19 | | | | 420,954 | |
| | 535,000 | | | | 2.500 | | | | 05/01/20 | | | | 528,152 | |
| Highlands County Florida Health Facilities Authority RB
Refunding for Adventist Health System/Sunbelt Obligated
Group Series 2009 E (AA-/Aa2) |
|
| | 1,000,000 | | | | 5.000 | | | | 11/15/15 | | | | 1,005,890 | |
| Lakeland Hospital RB for Lakeland Regional Health System
Series 2011 (NR/A2) |
|
| | 5,020,000 | | | | 5.000 | | | | 11/15/16 | | | | 5,267,084 | |
| | 6,315,000 | | | | 5.000 | | | | 11/15/17 | | | | 6,809,528 | |
| | 6,250,000 | | | | 5.000 | | | | 11/15/18 | | | | 6,910,375 | |
| Manatee County Florida Public Utilities RB Refunding
Series 2011 (AA+/Aa2) |
|
| | 1,180,000 | | | | 4.000 | | | | 10/01/16 | | | | 1,223,436 | |
| Mediterra South Community Development District Capital
Improvement RB Refunding Series 2012 (BBB+/NR) |
|
| | 265,000 | | | | 3.400 | | | | 05/01/16 | | | | 265,429 | |
| | 275,000 | | | | 3.600 | | | | 05/01/17 | | | | 276,458 | |
| | 285,000 | | | | 3.800 | | | | 05/01/18 | | | | 287,710 | |
| | |
| | State-Specific Municipal Debt Obligations – (continued) | |
| | Florida – (continued) | |
| Miami Beach Health Facilities Authority Hospital RB Refunding
for Mount Sinai Medical Center Series 2012 (BBB+/Baa1) |
|
| $ | 1,750,000 | | | | 4.000 | % | | | 11/15/17 | | | $ | 1,855,227 | |
| | 2,220,000 | | | | 4.000 | | | | 11/15/18 | | | | 2,385,945 | |
| Miami Special Obligation Non-Ad Valorem RB for Port of Miami
Tunnel Project Series 2012 (A/A2)(e) |
|
| | 2,150,000 | | | | 3.000 | | | | 03/01/16 | | | | 2,173,327 | |
| | 2,210,000 | | | | 4.000 | | | | 03/01/17 | | | | 2,314,356 | |
| | 2,300,000 | | | | 4.000 | | | | 03/01/18 | | | | 2,460,172 | |
| | 2,390,000 | | | | 5.000 | | | | 03/01/19 | | | | 2,673,430 | |
| | 2,510,000 | | | | 5.000 | | | | 03/01/20 | | | | 2,860,120 | |
| | 2,635,000 | | | | 5.000 | | | | 03/01/21 | | | | 3,048,300 | |
| | 2,770,000 | | | | 5.000 | | | | 03/01/22 | | | | 3,225,582 | |
| Miami Special Obligation Refunding Series 2011 A (AGM)
(AA/A2) |
|
| | 830,000 | | | | 5.000 | | | | 02/01/17 | | | | 878,132 | |
| Miami-Dade County IDA Solid Waste Disposal RB for Waste
Management Inc. Project Series 2006 (A-/NR) |
|
| | 2,000,000 | | | | 1.500 | | | | 10/01/18 | | | | 2,006,420 | |
| Miami-Dade County School Board COPS Series 2007 B
(NATL-RE FGIC) (AA-/A1)(c) |
|
| | 2,500,000 | | | | 5.000 | | | | 05/01/17 | | | | 2,666,975 | |
| Miami-Dade County School Board COPS Series 2011 B (A/A1)(b) | |
| | 3,000,000 | | | | 5.000 | | | | 05/01/16 | | | | 3,078,270 | |
| Miami-Dade County School Board COPS Series 2012 A (A/A1)(b) | |
| | 7,595,000 | | | | 5.000 | | | | 08/01/16 | | | | 7,891,129 | |
| Miami-Dade County Special Obligation RB Refunding
Series 2012 A (A+/A2) |
|
| | 500,000 | | | | 4.000 | | | | 10/01/15 | | | | 500,000 | |
| Orlando Florida Community Redevelopment Agency Tax
Increment RB Refunding for Conroy Road District Series 2012
(A-/NR) |
|
| | 1,130,000 | | | | 4.000 | | | | 04/01/16 | | | | 1,142,046 | |
| | 1,180,000 | | | | 5.000 | | | | 04/01/17 | | | | 1,234,516 | |
| | 1,245,000 | | | | 5.000 | | | | 04/01/18 | | | | 1,331,166 | |
| | 1,305,000 | | | | 5.000 | | | | 04/01/19 | | | | 1,420,192 | |
| | 1,375,000 | | | | 5.000 | | | | 04/01/20 | | | | 1,521,328 | |
| Osceola County School Board COPS Series 2013 A (A/Aa3) | |
| | 1,000,000 | | | | 4.000 | | | | 06/01/16 | | | | 1,024,550 | |
| | 500,000 | | | | 4.000 | | | | 06/01/17 | | | | 528,130 | |
| Palm Beach County Health Facilities Authority Hospital RB
Refunding for Jupiter Medical Center, Inc. Project
Series 2013 A (BBB+/Baa2) |
|
| | 400,000 | | | | 4.000 | | | | 11/01/15 | | | | 400,876 | |
| | 370,000 | | | | 4.000 | | | | 11/01/16 | | | | 382,654 | |
| | 720,000 | | | | 4.000 | | | | 11/01/17 | | | | 759,312 | |
| | 630,000 | | | | 4.000 | | | | 11/01/18 | | | | 673,974 | |
| Palm Beach County School Board COPS Refunding
Series 2011 A (AA-/Aa3)(b) |
|
| | 3,650,000 | | | | 5.000 | | | | 08/01/16 | | | | 3,781,509 | |
| Parklands Lee Community Development District Special
Assessment Refunding Senior Lien Series 2013 A-1 (A-/NR) |
|
| | 135,000 | | | | 2.000 | | | | 05/01/16 | | | | 134,907 | |
| | 130,000 | | | | 2.125 | | | | 05/01/17 | | | | 129,849 | |
| | 135,000 | | | | 2.250 | | | | 05/01/18 | | | | 134,363 | |
| | 140,000 | | | | 2.875 | | | | 05/01/19 | | | | 137,313 | |
| | |
| | |
| 54 | | The accompanying notes are an integral part of these financial statements. |
GOLDMAN SACHS SHORT DURATION TAX-FREE FUND
| | | | | | | | | | | | | | |
Principal
Amount | | | Interest
Rate | | | Maturity
Date | | | Value | |
| | State-Specific Municipal Debt Obligations – (continued) | |
| | Florida – (continued) | |
| Polk County Florida RB Refunding for Capital Improvement
Series 2010 (AA/Aa3) |
|
| $ | 1,000,000 | | | | 3.000 | % | | | 12/01/15 | | | $ | 1,004,380 | |
| Portofino Isles Community Development District Special
Assessment Refunding Series 2013 (BBB-/NR) |
|
| | 215,000 | | | | 2.000 | | | | 05/01/16 | | | | 214,645 | |
| | 220,000 | | | | 2.250 | | | | 05/01/17 | | | | 219,560 | |
| | 225,000 | | | | 2.625 | | | | 05/01/18 | | | | 224,636 | |
| | 230,000 | | | | 3.000 | | | | 05/01/19 | | | | 231,394 | |
| Reunion East Community Development District Special
Assessment Refunding Series 2015 A (NR/NR) |
|
| | 3,090,000 | | | | 4.000 | | | | 05/01/20 | | | | 3,091,421 | |
| Sausalito Bay Community Development District Special
Assessment Refunding Series 2013 (A-/NR) |
|
| | 90,000 | | | | 1.875 | | | | 05/01/16 | | | | 89,839 | |
| | 90,000 | | | | 2.125 | | | | 05/01/17 | | | | 89,785 | |
| | 95,000 | | | | 2.500 | | | | 05/01/18 | | | | 94,764 | |
| | 90,000 | | | | 2.750 | | | | 05/01/19 | | | | 90,030 | |
| | 100,000 | | | | 3.000 | | | | 05/01/20 | | | | 99,702 | |
| South Florida Water Management District Leasing Corp. COPS
Series 2006 (AMBAC) (AA/Aa3) |
|
| | 12,375,000 | | | | 5.000 | | | | 10/01/17 | | | | 12,909,848 | |
| South-Dade Venture Community Development District Special
Assessment RB Refunding Series 2012 (BBB-/NR) |
|
| | 305,000 | | | | 3.500 | | | | 05/01/16 | | | | 305,631 | |
| | 320,000 | | | | 3.750 | | | | 05/01/17 | | | | 323,066 | |
| | 330,000 | | | | 4.000 | | | | 05/01/18 | | | | 336,382 | |
| | 345,000 | | | | 4.125 | | | | 05/01/19 | | | | 354,512 | |
| | 375,000 | | | | 4.375 | | | | 05/01/21 | | | | 386,107 | |
| | 390,000 | | | | 4.500 | | | | 05/01/22 | | | | 403,900 | |
| Spicewood Community Development District Special Assessment
Refunding Series 2013 (BBB/NR) |
|
| | 105,000 | | | | 2.125 | | | | 05/01/16 | | | | 104,776 | |
| | 110,000 | | | | 2.250 | | | | 05/01/17 | | | | 109,594 | |
| | 110,000 | | | | 2.500 | | | | 05/01/18 | | | | 109,510 | |
| | 115,000 | | | | 2.875 | | | | 05/01/19 | | | | 115,523 | |
| Tampa Tax Allocation RB Refunding Cigarette – H. Lee Moffitt
Cancer Center Series 2012 A (A+/A1) |
|
| | 560,000 | | | | 3.000 | | | | 09/01/16 | | | | 573,043 | |
| | 425,000 | | | | 4.000 | | | | 09/01/17 | | | | 451,082 | |
| Trails at Monterey Community Development District Special
Assessment Refunding Series 2012 (A-/NR) |
|
| | 105,000 | | | | 2.500 | | | | 05/01/16 | | | | 105,227 | |
| | 105,000 | | | | 2.750 | | | | 05/01/17 | | | | 105,256 | |
| | 110,000 | | | | 3.000 | | | | 05/01/18 | | | | 110,460 | |
| | 110,000 | | | | 3.250 | | | | 05/01/19 | | | | 111,221 | |
| | 115,000 | | | | 3.500 | | | | 05/01/20 | | | | 115,967 | |
| | 115,000 | | | | 3.750 | | | | 05/01/21 | | | | 114,940 | |
| | 125,000 | | | | 3.875 | | | | 05/01/22 | | | | 125,249 | |
| | 125,000 | | | | 4.000 | | | | 05/01/23 | | | | 125,729 | |
| | 135,000 | | | | 4.125 | | | | 05/01/24 | | | | 136,431 | |
| | 140,000 | | | | 4.150 | | | | 05/01/25 | | | | 141,119 | |
| | 145,000 | | | | 4.250 | | | | 05/01/26 | | | | 146,989 | |
| Turnbull Creek Community Development District Senior Special
Assessment Refunding Series 2015 A-1 (BBB/NR) |
|
| | 415,000 | | | | 2.300 | | | | 05/01/19 | | | | 413,726 | |
| | 125,000 | | | | 2.600 | | | | 05/01/20 | | | | 124,571 | |
| | |
| | State-Specific Municipal Debt Obligations – (continued) | |
| | Florida – (continued) | |
| Venetian Isles Community Development District Special
Assessment RB Refunding Series 2013 (A+/NR) |
|
| $ | 220,000 | | | | 2.000 | % | | | 05/01/16 | | | $ | 222,112 | |
| | 225,000 | | | | 2.125 | | | | 05/01/17 | | | | 230,112 | |
| | 230,000 | | | | 2.500 | | | | 05/01/18 | | | | 234,027 | |
| | 235,000 | | | | 2.875 | | | | 05/01/19 | | | | 241,890 | |
| | 240,000 | | | | 3.000 | | | | 05/01/20 | | | | 247,882 | |
| Village Community Development District No. 10 Special
Assessment RB Series 2012 (NR/NR) |
|
| | 1,265,000 | | | | 4.500 | | | | 05/01/23 | | | | 1,370,324 | |
| Village Community Development District No. 5 Special
Assessment Refunding Phase I Series 2013 (A/NR) |
|
| | 540,000 | | | | 3.000 | | | | 05/01/16 | | | | 542,684 | |
| Village Community Development District No. 7 Special
Assessment RB Refunding Series 2015 (A/NR) |
|
| | 1,215,000 | | | | 3.000 | | | | 05/01/17 | | | | 1,247,805 | |
| | 1,500,000 | | | | 3.000 | | | | 05/01/19 | | | | 1,546,215 | |
| Waters Edge Community Development District Capital
Improvement RB Refunding Senior Lien Series 2015 A-1
(BBB+/NR) |
|
| | 355,000 | | | | 2.500 | | | | 05/01/16 | | | | 357,623 | |
| | 365,000 | | | | 2.500 | | | | 05/01/17 | | | | 370,420 | |
| | 375,000 | | | | 2.500 | | | | 05/01/18 | | | | 379,958 | |
| | 385,000 | | | | 2.000 | | | | 05/01/19 | | | | 380,665 | |
| | 390,000 | | | | 2.375 | | | | 05/01/20 | | | | 386,237 | |
| | 400,000 | | | | 2.625 | | | | 05/01/21 | | | | 394,980 | |
| Wyndam Park Community Development District Special
Assessment Refunding Series 2013 (A-/NR) |
|
| | 90,000 | | | | 2.000 | | | | 05/01/16 | | | | 89,821 | |
| | 90,000 | | | | 2.125 | | | | 05/01/17 | | | | 89,744 | |
| | 95,000 | | | | 2.250 | | | | 05/01/18 | | | | 94,693 | |
| | 95,000 | | | | 2.875 | | | | 05/01/19 | | | | 95,015 | |
| | | | | | | | | | | | | | |
| | | | | | | | | | | | | 172,591,925 | |
| | |
| | Georgia – 2.4% | |
| Carroll City-County Hospital Authority Revenue Anticipation
Certificates for Tanner Medical Center, Inc. Project Series 2010
(CNTY GTD) (AA/Aa2) |
|
| | 1,530,000 | | | | 4.000 | | | | 07/01/16 | | | | 1,570,591 | |
| Cobb County Kennestone Hospital Authority RB Refunding
Anticipation Certificates Series 2012 (AA-/Aa3) |
|
| | 1,045,000 | | | | 4.000 | | | | 04/01/16 | | | | 1,063,350 | |
| | 790,000 | | | | 4.000 | | | | 04/01/17 | | | | 828,671 | |
| Colquitt County School District Sales Tax GO Bonds Series 2013
(ST AID WITHHLDG) (NR/Aa1) |
|
| | 1,650,000 | | | | 4.000 | | | | 01/01/17 | | | | 1,719,762 | |
| DeKalb County Water and Sewerage RB Second Resolution
Series 2011 A (A+/Aa3) |
|
| | 1,500,000 | | | | 5.000 | | | | 10/01/16 | | | | 1,569,405 | |
| Dougherty County School District Sales Tax GO Bonds for
Georgia State Aid Intercept Program Series 2013 (ST AID
WITHHLDG) (NR/Aa1) |
|
| | 2,055,000 | | | | 5.000 | | | | 12/01/17 | | | | 2,242,313 | |
| Douglas County School District GO Bonds Refunding
Series 2012 (ST AID WITHHLDG) (AA+/Aa1) |
|
| | 2,985,000 | | | | 4.000 | | | | 04/01/17 | | | | 3,142,071 | |
| | |
| | |
| The accompanying notes are an integral part of these financial statements. | | 55 |
GOLDMAN SACHS SHORT DURATION TAX-FREE FUND
Schedule of Investments (continued)
September 30, 2015 (Unaudited)
| | | | | | | | | | | | | | |
Principal
Amount | | | Interest
Rate | | | Maturity
Date | | | Value | |
| | State-Specific Municipal Debt Obligations – (continued) | |
| | Georgia – (continued) | |
| Fulton County Development Authority RB Refunding for
Spelman College Series 2012 (NR/A1) |
|
| $ | 1,010,000 | | | | 4.000 | % | | | 06/01/18 | | | $ | 1,082,861 | |
| Gainesville Georgia School District GO Bonds Series 2011
(ST AID WITHHLDG) (AA+/NR) |
|
| | 2,500,000 | | | | 4.000 | | | | 12/01/15 | | | | 2,515,400 | |
| Georgia State GO Bonds Refunding Series 2011 E-2 (AAA/Aaa) | |
| | 9,325,000 | | | | 4.000 | | | | 09/01/16 | | | | 9,642,796 | |
| | 11,495,000 | | | | 4.000 | | | | 09/01/17 | | | | 12,234,358 | |
| Gwinnett County School District Sales Tax GO Bonds
Series 2012 A (AAA/Aaa) |
|
| | 15,765,000 | | | | 4.500 | | | | 10/01/17 | | | | 17,001,607 | |
| Jackson County School District GO Bonds Refunding Series 2012
(ST AID WITHHLDG) (AA+/WR) |
|
| | 3,030,000 | | | | 5.000 | | | | 03/01/17 | | | | 3,223,829 | |
| | 4,215,000 | | | | 5.000 | | | | 03/01/18 | | | | 4,628,492 | |
| Metropolitan Atlanta Rapid Transit Authority RB Series 2000 A
(AAA/Aa2)(b) |
|
| | 7,700,000 | | | | 0.320 | | | | 07/01/17 | | | | 7,700,000 | |
| Milledgeville & Baldwin County Development Authority Student
Housing RB Refunding for Georgia College & State University
Foundation Property V, LLC Project Series 2007 (AMBAC)
(A+/WR)(a) |
|
| | 14,000,000 | | | | 0.790 | | | | 10/01/24 | | | | 13,509,580 | |
| Public Gas Partners, Inc. RB Series 2009 A (A+/A3) | |
| | 6,130,000 | | | | 5.000 | | | | 10/01/15 | | | | 6,130,000 | |
| Richmond County Board of Education GO Bonds for Sales Tax
Series 2012 (ST AID WITHHLDG) (AA+/Aa1) |
|
| | 2,500,000 | | | | 5.000 | | | | 10/01/16 | | | | 2,615,425 | |
| | 2,000,000 | | | | 3.000 | | | | 10/01/17 | | | | 2,085,440 | |
| Thomas County School District Sales Tax GO Bonds Series 2012
(ST AID WITHHLDG) (AA+/NR) |
|
| | 2,655,000 | | | | 4.000 | | | | 03/01/17 | | | | 2,787,670 | |
| | | | | | | | | | | | | | |
| | | | | | | | | | | | | 97,293,621 | |
| | |
| | Guam – 0.0% | |
| Guam Government Privilege Special Tax Refunding Bonds
Series 2015 D (A/NR) |
|
| | 265,000 | | | | 4.000 | | | | 11/15/18 | | | | 284,766 | |
| | 1,525,000 | | | | 5.000 | | | | 11/15/21 | | | | 1,742,938 | |
| | | | | | | | | | | | | | |
| | | | | | | | | | | | | 2,027,704 | |
| | |
| | Hawaii – 0.3% | |
| Honolulu City and County GO Bonds Series C (AA+/Aa1) | |
| | 10,220,000 | | | | 4.000 | | | | 10/01/19 | | | | 11,352,376 | |
| Honolulu City and County Wastewater System RB Senior First
Bond Resolution Series 2012 A (AA/Aa2) |
|
| | 2,400,000 | | | | 2.000 | | | | 07/01/17 | | | | 2,460,552 | |
| | | | | | | | | | | | | | |
| | | | | | | | | | | | | 13,812,928 | |
| | |
| | Idaho – 0.1% | |
| Boise City Independent School District GO Bonds Refunding
Series 2012 B (AA/Aa1) |
|
| | 1,000,000 | | | | 3.000 | | | | 08/01/17 | | | | 1,044,540 | |
| | 2,095,000 | | | | 4.000 | | | | 08/01/18 | | | | 2,275,568 | |
| | |
| | State-Specific Municipal Debt Obligations – (continued) | |
| | Idaho – (continued) | |
| Kootenai County School District No. 271 GO Bonds
Series 2012 A (SCH BD GTY) (NR/Aa1) |
|
| $ | 1,960,000 | | | | 2.000 | % | | | 09/15/16 | | | $ | 1,992,144 | |
| | | | | | | | | | | | | | |
| | | | | | | | | | | | | 5,312,252 | |
| | |
| | Illinois – 8.7% | |
| Chicago Illinois Board of Education GO Bonds Capital
Appreciation for School Reform Series 1998 B-1 (NATL-RE
FGIC) (AA-/A3)(d) |
|
| | 8,990,000 | | | | 0.000 | | | | 12/01/16 | | | | 8,669,147 | |
| Chicago Illinois Board of Education GO Bonds Refunding Capital
Appreciation for School Reform Series 1999 A (NATL-RE
FGIC) (AA-/A3)(d) |
|
| | 2,500,000 | | | | 0.000 | | | | 12/01/15 | | | | 2,488,425 | |
| | 11,185,000 | | | | 0.000 | | | | 12/01/16 | | | | 10,785,807 | |
| Chicago Illinois Board of Education GO Bonds Refunding
Series 1999 A (NATL-RE FGIC) (AA-/A3)(d) |
|
| | 1,070,000 | | | | 0.000 | | | | 12/01/17 | | | | 991,419 | |
| | 6,595,000 | | | | 0.000 | | | | 12/01/19 | | | | 5,569,214 | |
| Chicago Illinois Board of Education GO Bonds Refunding
Series 2015 A (BB/NR)(b) |
|
| | 30,000,000 | | | | 4.020 | | | | 03/01/17 | | | | 29,517,300 | |
| Chicago Illinois Capital Appreciation GO Bonds Refunding and
Project Series C (BBB+/Ba1)(d) |
|
| | 4,645,000 | | | | 0.000 | | | | 01/01/23 | | | | 3,062,077 | |
| Chicago Illinois GO Bonds Project and Refunding RMKT
05/29/15 Series 2003 B (BBB+/NR) |
|
| | 2,000,000 | | | | 5.000 | | | | 01/01/23 | | | | 1,996,240 | |
| Chicago Illinois GO Bonds Project and Refunding Series 2014 A
(BBB+/Ba1) |
|
| | 2,075,000 | | | | 5.000 | | | | 01/01/22 | | | | 2,082,553 | |
| Chicago Illinois GO Bonds Refunding Series 2012 C (BBB+/Ba1) | |
| | 14,345,000 | | | | 5.000 | | | | 01/01/22 | | | | 14,397,216 | |
| Chicago Illinois Midway Airport Second Lien RB Refunding
Series 2014 B (A-/A3) |
|
| | 400,000 | | | | 5.000 | | | | 01/01/19 | | | | 447,052 | |
| Chicago Illinois Modern Schools Across Chicago Program GO
Bonds Series 2010 A (BBB+/Ba1) |
|
| | 2,500,000 | | | | 5.000 | | | | 12/01/16 | | | | 2,567,500 | |
| | 5,950,000 | | | | 4.000 | | | | 12/01/17 | | | | 6,012,237 | |
| Chicago Illinois Sales Tax Refunding RMKT 06/09/15
Series 2002 (AAA/NR) |
|
| | 1,250,000 | | | | 5.000 | | | | 01/01/21 | | | | 1,368,400 | |
| Chicago Illinois Refunding Series 2009 A (BBB+/Ba1) | |
| | 5,400,000 | | | | 5.000 | | | | 01/01/22 | | | | 5,413,878 | |
| Chicago Illinois Water RB Refunding Second Lien Project
Series 2012 (A-/Baa2) |
|
| | 550,000 | | | | 4.000 | | | | 11/01/16 | | | | 562,017 | |
| Cook County Illinois GO Refunding Bonds Series 2012 C
(AA/A2) |
|
| | 1,500,000 | | | | 5.000 | | | | 11/15/19 | | | | 1,626,660 | |
| | 1,000,000 | | | | 4.000 | | | | 11/15/20 | | | | 1,045,100 | |
| Glenview GO Refunding Bonds Series 2012 B (NR/Aaa) | |
| | 1,245,000 | | | | 4.000 | | | | 12/01/16 | | | | 1,293,953 | |
| | 1,295,000 | | | | 4.000 | | | | 12/01/17 | | | | 1,376,766 | |
| | 1,365,000 | | | | 4.000 | | | | 12/01/18 | | | | 1,478,118 | |
| | |
| | |
| 56 | | The accompanying notes are an integral part of these financial statements. |
GOLDMAN SACHS SHORT DURATION TAX-FREE FUND
| | | | | | | | | | | | | | |
Principal
Amount | | | Interest
Rate | | | Maturity
Date | | | Value | |
| | State-Specific Municipal Debt Obligations – (continued) | |
| | Illinois – (continued) | |
| Glenview GO Refunding Bonds Series 2012 C (NR/Aaa) | |
| $ | 1,650,000 | | | | 3.000 | % | | | 12/01/17 | | | $ | 1,719,102 | |
| Illinois Educational Facilities Authority RB for University of
Chicago Series 2001 B-2 (AA/Aa2)(b) |
|
| | 6,000,000 | | | | 1.550 | | | | 02/13/20 | | | | 5,977,380 | |
| Illinois GO Bonds Series 2005 (AGM) (AA/A2) | |
| | 1,095,000 | | | | 4.250 | | | | 09/01/18 | | | | 1,095,569 | |
| Illinois GO Bonds Series 2014 (A-/A3) | |
| | 3,730,000 | | | | 5.000 | | | | 02/01/19 | | | | 4,003,185 | |
| Illinois State Build Illinois Sales Tax RB Series 2011 (AAA/NR) | |
| | 2,385,000 | | | | 4.000 | | | | 06/15/17 | | | | 2,511,500 | |
| Illinois State GO Bonds First Series 2001 (NATL-RE) (AA-/A3) | |
| | 3,000,000 | | | | 5.500 | | | | 08/01/17 | | | | 3,211,470 | |
| Illinois State GO Bonds Refunding Series 2007 B (A-/A3) | |
| | 1,000,000 | | | | 5.000 | | | | 01/01/16 | | | | 1,009,960 | |
| Illinois State GO Bonds Refunding Series 2009 A (A-/A3) | |
| | 16,000,000 | | | | 4.000 | | | | 09/01/20 | | | | 16,636,320 | |
| Illinois State GO Bonds Refunding Series 2010 (A-/A3) | |
| | 7,455,000 | | | | 5.000 | | | | 01/01/17 | | | | 7,783,318 | |
| | 12,775,000 | | | | 5.000 | | | | 01/01/18 | | | | 13,534,602 | |
| | 16,490,000 | | | | 5.000 | | | | 01/01/20 | | | | 17,827,009 | |
| Illinois State GO Bonds Refunding Series 2010 (AGM) (AA/A2) | |
| | 3,550,000 | | | | 5.000 | | | | 01/01/16 | | | | 3,585,820 | |
| Illinois State GO Bonds Refunding Series 2012 (A-/A3) | |
| | 6,250,000 | | | | 5.000 | | | | 08/01/16 | | | | 6,456,750 | |
| | 7,295,000 | | | | 5.000 | | | | 08/01/19 | | | | 7,872,618 | |
| | 10,925,000 | | | | 5.000 | | | | 08/01/20 | | | | 11,842,591 | |
| Illinois State GO Bonds Series 2003 A (A-/A3) | |
| | 7,525,000 | | | | 5.000 | | | | 10/01/16 | | | | 7,550,284 | |
| Illinois State GO Bonds Series 2012 (A-/A3) | |
| | 14,360,000 | | | | 4.000 | | | | 01/01/19 | | | | 14,907,547 | |
| Illinois State GO Bonds Series 2012 A (A-/A3) | |
| | 10,085,000 | | | | 3.000 | | | | 01/01/18 | | | | 10,246,864 | |
| Illinois State GO Bonds Series 2013 (A-/A3) | |
| | 9,070,000 | | | | 5.000 | | | | 07/01/17 | | | | 9,606,218 | |
| Illinois State GO Bonds Series 2013 A (A-/A3) | |
| | 2,250,000 | | | | 5.000 | | | | 04/01/17 | | | | 2,366,550 | |
| Illinois State GO Bonds Series 2014 (A-/A3) | |
| | 4,490,000 | | | | 5.000 | | | | 04/01/17 | | | | 4,722,582 | |
| Illinois Unemployment Insurance Fund Building Receipts RB
Series 2012 A (AA/NR) |
|
| | 6,500,000 | | | | 5.000 | | | | 06/15/16 | | | | 6,715,020 | |
| Illinois Unemployment Insurance Fund Building Receipts RB
Series 2012 B (AA/NR) |
|
| | 7,500,000 | | | | 5.000 | | | | 12/15/17 | | | | 7,900,425 | |
| | 11,980,000 | �� | | | 5.000 | | | | 06/15/18 | | | | 12,622,607 | |
| McHenry and Lake County Community Highschool No. 156 GO
Bonds Refunding Series 2013 (NR/Aa2) |
|
| | 2,245,000 | | | | 3.000 | | | | 02/01/17 | | | | 2,314,034 | |
| | 2,690,000 | | | | 3.000 | | | | 02/01/18 | | | | 2,787,351 | |
| Quad Cities Regional Economic Development Authority RB for
Augustana College Series 2012 (NR/Baa1) |
|
| | 840,000 | | | | 3.000 | | | | 10/01/17 | | | | 855,305 | |
| Railsplitter Tobacco Settlement Authority Tobacco Settlement RB
Series 2010 (A/NR) |
|
| | 11,350,000 | | | | 4.125 | | | | 06/01/16 | | | | 11,572,801 | |
| | 4,000,000 | | | | 5.000 | | | | 06/01/16 | | | | 4,101,280 | |
| | 10,000,000 | | | | 5.000 | | | | 06/01/17 | | | | 10,609,000 | |
| | |
| | State-Specific Municipal Debt Obligations – (continued) | |
| | Illinois – (continued) | |
| Regional Transportation Authority Illinois Refunding
Series 2011 A (AGM) (GO OF AUTH) (AA/Aa3) |
|
| $ | 13,420,000 | | | | 5.000 | % | | | 06/01/16 | | | $ | 13,828,236 | |
| | 13,545,000 | | | | 5.000 | | | | 06/01/17 | | | | 14,480,960 | |
| Springfield Electric RB Senior Lien Series 2007 (NATL-RE)
(AA-/A3) |
|
| | 7,500,000 | | | | 5.000 | | | | 03/01/19 | | | | 7,948,050 | |
| | | | | | | | | | | | | | |
| | | | | | | | | | | | | 352,953,387 | |
| | |
| | Indiana – 0.8% | |
| City of Whiting Environmental Facilities RB for BP Products
North America, Inc. Project Series 2008 (A/A2)(b) |
|
| | 15,000,000 | | | | 1.850 | | | | 10/01/19 | | | | 15,000,000 | |
| Delaware County Indiana Hospital Authority RB Refunding for
Ball Memorial Hospital, Inc. Obligated Group Series 2009 A
(ETM) (NR/A3)(c) |
|
| | 1,085,000 | | | | 5.500 | | | | 08/01/17 | | | | 1,182,444 | |
| | 4,535,000 | | | | 5.625 | | | | 08/01/18 | | | | 5,147,089 | |
| Indiana Finance Authority Hospital RB for Indiana University
Health Obligated Group Series 2012 A (A/A2) |
|
| | 520,000 | | | | 5.000 | | | | 05/01/17 | | | | 553,883 | |
| | 855,000 | | | | 5.000 | | | | 05/01/20 | | | | 975,769 | |
| Indiana Health Facility Financing Authority RB for Ascension
Health Credit Group Series 2001 A-2 (AA+/Aa2)(b) |
|
| | 4,590,000 | | | | 1.600 | | | | 02/01/17 | | | | 4,645,493 | |
| Indiana State Finance Authority RB for Community Foundation
of Northwest Indiana Obligated Group Series 2012 (A/NR) |
|
| | 800,000 | | | | 5.000 | | | | 03/01/18 | | | | 867,088 | |
| | 500,000 | | | | 5.000 | | | | 03/01/19 | | | | 553,490 | |
| | 650,000 | | | | 5.000 | | | | 03/01/20 | | | | 728,910 | |
| Indianapolis Thermal Energy System First Lien RB Refunding
Series 2010 B (AGM) (AA/A2) |
|
| | 3,905,000 | | | | 5.000 | | | | 10/01/15 | | | | 3,905,000 | |
| | | | | | | | | | | | | | |
| | | | | | | | | | | | | 33,559,166 | |
| | |
| | Iowa – 0.1% | |
| Iowa Finance Authority Health Facilities RB for Mercy Medical
Center Projects Series 2012 (A/A2) |
|
| | 440,000 | | | | 4.000 | | | | 08/15/16 | | | | 451,863 | |
| | 1,400,000 | | | | 4.000 | | | | 08/15/17 | | | | 1,472,982 | |
| Iowa Finance Authority State Revolving Fund RB Series 2013
(AAA/Aaa) |
|
| | 1,000,000 | | | | 5.000 | | | | 08/01/18 | | | | 1,117,560 | |
| Iowa State University of Science and Technology RB Refunding
for Memorial Union Series 2013 (AA/Aa2) |
|
| | 1,040,000 | | | | 1.500 | | | | 07/01/16 | | | | 1,048,975 | |
| | 1,055,000 | | | | 1.500 | | | | 07/01/17 | | | | 1,070,846 | |
| | | | | | | | | | | | | | |
| | | | | | | | | | | | | 5,162,226 | |
| | |
| | Kansas – 1.0% | |
| Johnson County Unified School DistrictNo. 229 GO Bonds for
Kansas Blue Valley Series 2015 B (AA+/Aaa)(f) |
|
| | 8,125,000 | | | | 5.000 | | | | 10/01/19 | | | | 9,348,056 | |
| Johnson County Unified School DistrictNo. 512 GO Bonds for
Kansas Shawnee Mission Series 2012 A (NR/Aaa) |
|
| | 6,085,000 | | | | 4.000 | | | | 10/01/18 | | | | 6,636,301 | |
| | |
| | |
| The accompanying notes are an integral part of these financial statements. | | 57 |
GOLDMAN SACHS SHORT DURATION TAX-FREE FUND
Schedule of Investments (continued)
September 30, 2015 (Unaudited)
| | | | | | | | | | | | | | |
Principal
Amount | | | Interest
Rate | | | Maturity
Date | | | Value | |
| | State-Specific Municipal Debt Obligations – (continued) | |
| | Kansas – (continued) | |
| Olathe Health Facilities RB for Medical Center Series 2012 B
(A+/NR)(b) |
|
| $ | 3,000,000 | | | | 2.000 | % | | | 03/01/17 | | | $ | 3,017,100 | |
| Wichita GO Refunding Bonds Series 811 (AA+/Aa1) | |
| | 5,405,000 | | | | 5.000 | | | | 06/01/18 | | | | 5,998,739 | |
| Wichita GO Refunding Bonds Series 2012 A (AA+/Aa1) | |
| | 2,550,000 | | | | 4.000 | | | | 09/01/17 | | | | 2,713,506 | |
| | 2,640,000 | | | | 3.000 | | | | 09/01/18 | | | | 2,799,403 | |
| | 2,585,000 | | | | 4.000 | | | | 09/01/19 | | | | 2,868,704 | |
| Wichita GO Sales Tax Bonds Series 2012 D (AA+/Aa1) | |
| | 1,075,000 | | | | 3.000 | | | | 10/01/17 | | | | 1,125,278 | |
| | 1,130,000 | | | | 3.000 | | | | 10/01/19 | | | | 1,211,733 | |
| Wyandotte County/Kansas City Unified Government RB for
Utility System Improvement Series 2011 A (A+/NR) |
|
| | 2,340,000 | | | | 3.500 | | | | 09/01/16 | | | | 2,401,402 | |
| Wyandotte County/Kansas City Unified Government RB
Refunding Sales Tax Special Obligation for Redevelopment
Project Area B Sub Lien Series 2012 (AA-/NR) |
|
| | 1,400,000 | | | | 5.000 | | | | 12/01/16 | | | | 1,470,658 | |
| | | | | | | | | | | | | | |
| | | | | | | | | | | | | 39,590,880 | |
| | |
| | Kentucky – 1.5% | |
| Kentucky Public Transportation Infrastructure Authority
Subordinate Toll Revenue BANS for Downtown Crossing
Project Series 2013 A (BBB-/Baa3) |
|
| | 15,000,000 | | | | 5.000 | | | | 07/01/17 | | | | 16,018,050 | |
| Kentucky State Property and Buildings Commission for Project
100 RB Refunding Series 2011 A (A/Aa3) |
|
| | 1,350,000 | | | | 5.000 | | | | 08/01/16 | | | | 1,400,341 | |
| | 5,040,000 | | | | 4.000 | | | | 08/01/17 | | | | 5,335,848 | |
| Kentucky State Property and Buildings Commission for Project
99 RB Refunding Series 2010 A (A/Aa3) |
|
| | 4,480,000 | | | | 5.000 | | | | 11/01/18 | | | | 4,984,762 | |
| Louisville Regional Airport Authority Airport System RB
Refunding Series 2014 A (AMT) (A+/NR) |
|
| | 250,000 | | | | 3.000 | | | | 07/01/16 | | | | 254,303 | |
| Louisville/Jefferson County Metro Government Environmental
Facilities RB Refunding for Louisville Gas and Electric
Company Project Series 2003 A (A/A1)(b) |
|
| | 10,000,000 | | | | 1.150 | | | | 06/01/17 | | | | 10,022,900 | |
| Louisville/Jefferson County PCRB for Louisville Gas & Electric
Company Project Series 2003 A (A/A1)(b) |
|
| | 10,500,000 | | | | 1.650 | | | | 04/03/17 | | | | 10,607,205 | |
| Trimble County Kentucky Pollution Control RB for Gas and
Electric Company Project Series 2001 A (A/A1)(b) |
|
| | 6,000,000 | | | | 1.050 | | | | 03/01/18 | | | | 5,995,680 | |
| University of Kentucky General Receipts RB Refunding
Series 2015 B (AA/Aa2) |
|
| | 3,730,000 | | | | 5.000 | | | | 10/01/18 | | | | 4,177,637 | |
| University of Kentucky General Receipts RB Refunding
Series 2015 C (AA/Aa2) |
|
| | 1,705,000 | | | | 4.000 | | | | 10/01/18 | | | | 1,859,473 | |
| | | | | | | | | | | | | | |
| | | | | | | | | | | | | 60,656,199 | |
| | |
| | Louisiana – 1.2% | |
| City of Shreveport Louisiana Water and Sewer RB Refunding
Series 2014 A (BAM) (AA/A3) |
|
| | 3,000,000 | | | | 5.000 | | | | 12/01/19 | | | | 3,399,390 | |
| | |
| | State-Specific Municipal Debt Obligations – (continued) | |
| | Louisiana – (continued) | |
| Ernest N. Morial New Orleans Exhibition Hall Authority Special
Tax Refunding Bonds Series 2012 (A+/A1) |
|
| $ | 350,000 | | | | 2.000 | % | | | 07/15/16 | | | $ | 354,316 | |
| | 1,830,000 | | | | 3.000 | | | | 07/15/16 | | | | 1,866,765 | |
| | 375,000 | | | | 2.000 | | | | 07/15/17 | | | | 382,189 | |
| | 1,740,000 | | | | 4.000 | | | | 07/15/17 | | | | 1,834,586 | |
| | 680,000 | | | | 2.000 | | | | 07/15/18 | | | | 696,884 | |
| | 1,040,000 | | | | 4.000 | | | | 07/15/18 | | | | 1,122,576 | |
| | 1,000,000 | | | | 5.000 | | | | 07/15/19 | | | | 1,134,760 | |
| Jefferson Parish Sales Tax RB Refunding School Series 2012
(AA/NR) |
|
| | 1,570,000 | | | | 3.000 | | | | 02/01/16 | | | | 1,584,303 | |
| | 1,015,000 | | | | 3.000 | | | | 02/01/17 | | | | 1,048,942 | |
| | 1,565,000 | | | | 3.000 | | | | 02/01/18 | | | | 1,635,190 | |
| Louisiana Citizens Property Insurance Corp. RB Series 2006 B
(ETM) (AMBAC) (A/A1)(c) |
|
| | 2,955,000 | | | | 5.000 | | | | 06/01/16 | | | | 3,046,871 | |
| Louisiana Local Government Environmental Facilities &
Community Development Authority RB for BRCC Facilities
Corp. Project Series 2011 (AGM) (AA/A1) |
|
| | 1,250,000 | | | | 3.000 | | | | 12/01/16 | | | | 1,285,512 | |
| Louisiana Local Government Environmental Facilities &
Community Development Authority RB for LCTCS Facilities
Corp. Project Series 2011 (AA-/A1)(d) |
|
| | 1,500,000 | | | | 0.000 | | | | 10/01/15 | | | | 1,500,000 | |
| Louisiana Public Facilities Authority RB for Hurricane Recovery
Program Series 2007 (AGC-ICC) (AMBAC) (AA/Aa3)(c) |
|
| | 8,250,000 | | | | 5.000 | | | | 06/01/17 | | | | 8,862,728 | |
| Louisiana State Offshore Terminal Authority Deepwater Port RB
for LOOP LLC Project Series 2007 B-1A1 (BBB/A3)(b) |
|
| | 3,000,000 | | | | 1.375 | | | | 10/01/16 | | | | 3,006,630 | |
| New Orleans Audubon Commission for Aquarium Tax Bonds
Series 2011 (A/NR) |
|
| | 500,000 | | | | 5.000 | | | | 10/01/16 | | | | 522,115 | |
| | 2,825,000 | | | | 5.000 | | | | 10/01/17 | | | | 3,026,677 | |
| New Orleans GO Bonds Refunding Series 2012 (A-/A3) | |
| | 1,805,000 | | | | 4.000 | | | | 12/01/15 | | | | 1,814,963 | |
| | 4,145,000 | | | | 4.000 | | | | 12/01/16 | | | | 4,297,702 | |
| | 4,030,000 | | | | 4.000 | | | | 12/01/17 | | | | 4,278,248 | |
| New Orleans Regional Transit Authority Sales Tax RB
Series 2010 (AGM) (AA/Aa3) |
|
| | 610,000 | | | | 4.000 | | | | 12/01/16 | | | | 634,278 | |
| Terrebonne Parish Louisiana Hospital Service District No. 1 RB
Refunding for Terrebonne General Medical Center Project
Series 2010 (A+/A2) |
|
| | 420,000 | | | | 4.000 | | | | 04/01/16 | | | | 427,274 | |
| | | | | | | | | | | | | | |
| | | | | | | | | | | | | 47,762,899 | |
| | |
| | Maine – 0.1% | |
| Finance Authority of Maine Solid Waste Disposal RB for Waste
Management, Inc. Project RMKT 11/10/04 Series 2004
(A-/NR)(b) |
|
| | 3,125,000 | | | | 3.800 | | | | 11/01/15 | | | | 3,134,281 | |
| Maine State Housing Authority Mortgage Purchase Bonds
Series 2011 E (AA+/Aa1) |
|
| | 2,455,000 | | | | 1.700 | | | | 11/15/15 | | | | 2,457,210 | |
| | | | | | | | | | | | | | |
| | | | | | | | | | | | | 5,591,491 | |
| | |
| | |
| 58 | | The accompanying notes are an integral part of these financial statements. |
GOLDMAN SACHS SHORT DURATION TAX-FREE FUND
| | | | | | | | | | | | | | |
Principal
Amount | | | Interest
Rate | | | Maturity
Date | | | Value | |
| | State-Specific Municipal Debt Obligations – (continued) | |
| | Maryland – 2.0% | |
| Baltimore County Maryland GO Bonds 74th Issue for
Metropolitan District Public Improvement Series 2011
(AAA/Aaa) |
|
| $ | 2,500,000 | | | | 4.000 | % | | | 02/01/16 | | | $ | 2,531,400 | |
| | 9,000,000 | | | | 5.000 | | | | 02/01/17 | | | | 9,542,880 | |
| Carroll County Maryland Consolidated Public Improvement and
Refunding Bonds Series 2011 (AAA/Aa1) |
|
| | 2,075,000 | | | | 5.000 | | | | 11/01/17 | | | | 2,261,833 | |
| | 3,055,000 | | | | 4.000 | | | | 11/01/18 | | | | 3,349,135 | |
| Charles County Maryland GO Bonds Refunding Series 2011
(AAA/Aa1) |
|
| | 1,115,000 | | | | 4.000 | | | | 11/01/16 | | | | 1,158,151 | |
| | 5,405,000 | | | | 4.000 | | | | 11/01/17 | | | | 5,775,891 | |
| City of Baltimore Revenue Bonds for Water Projects Series 2002
Subseries C (AA-/Aa3)(a) |
|
| | 7,025,000 | | | | 0.195 | | | | 10/07/15 | | | | 5,734,846 | |
| City of Baltimore Revenue Bonds for Water Projects Series 2002
Subseries C (NATL-RE FGIC) (AA/NR)(a) |
|
| | 11,350,000 | | | | 0.150 | | | | 10/06/15 | | | | 9,614,834 | |
| Harford County Maryland GO Bonds for Consolidated Public
Improvement Series 2009 (AAA/Aaa) |
|
| | 1,170,000 | | | | 2.250 | | | | 07/01/16 | | | | 1,187,608 | |
| Maryland State Department of Transportation Consolidated RB
Series 2015 (AAA/Aa1) |
|
| | 8,220,000 | | | | 5.000 | | | | 02/01/18 | | | | 9,026,711 | |
| | 15,995,000 | | | | 5.000 | | | | 02/01/19 | | | | 18,085,866 | |
| Maryland State Health & Higher Educational Facilities Authority
RB for MedStar Health Issue Series 2011 (A-/A2) |
|
| | 3,445,000 | | | | 4.000 | | | | 08/15/16 | | | | 3,549,384 | |
| Montgomery County Maryland GO Bonds Refunding for
Consolidated Public Improvement Series 2012 B (AAA/Aaa) |
|
| | 5,350,000 | | | | 5.000 | | | | 11/01/16 | | | | 5,618,945 | |
| University of Maryland RB Refunding Revolving Loan
Series 2003 A (AA+/Aa1)(b) |
|
| | 2,010,000 | | | | 1.250 | | | | 06/01/18 | | | | 2,019,447 | |
| | | | | | | | | | | | | | |
| | | | | | | | | | | | | 79,456,931 | |
| | |
| | Massachusetts – 2.7% | |
| Massachusetts Development Finance Agency RB for Boston
University Series 2008 U-1 (A/A1)(b) |
|
| | 7,000,000 | | | | 0.600 | | | | 03/30/17 | | | | 6,986,700 | |
| Massachusetts Development Finance Agency RB for Partners
HealthCare System Series 2014 M-5 (AA/Aa3)(b) |
|
| | 19,700,000 | | | | 0.570 | | | | 01/30/18 | | | | 19,634,202 | |
| Massachusetts State Development Finance Agency RB for
Partners HealthCare System Issue Series 2012 L (AA/Aa3) |
|
| | 300,000 | | | | 5.000 | | | | 07/01/16 | | | | 310,419 | |
| Massachusetts State Development Finance Agency RB Refunding
for Boston University Issue Series Z-1 (A/A1) |
|
| | 10,000,000 | | | | 1.500 | | | | 08/01/19 | | | | 10,126,700 | |
| Massachusetts State GO Bonds Consolidated Loan Series 2007 A
(NATL-RE FGIC) (AA+/Aa1)(a) |
|
| | 15,000,000 | | | | 0.771 | | | | 05/01/37 | | | | 13,755,900 | |
| Massachusetts State GO Bonds Consolidated Loan Series 2012 A
(BHAC-CR) (AA+/Aa1)(a) |
|
| | 26,250,000 | | | | 0.771 | | | | 05/01/37 | | | | 24,600,975 | |
| | |
| | State-Specific Municipal Debt Obligations – (continued) | |
| | Massachusetts – (continued) | |
| Massachusetts State GO Bonds Consolidated Loan Series 2012 D
(AA+/Aa1)(a) |
|
| $ | 7,000,000 | | | | 0.450 | % | | | 01/01/18 | | | $ | 6,997,760 | |
| Massachusetts State GO Bonds Refunding Series 2013 A
(AA+/Aa1)(a) |
|
| | 6,000,000 | | | | 0.380 | | | | 02/01/17 | | | | 6,004,380 | |
| Massachusetts State GO Refunding Bonds Series 2007 A
(AA+/Aa1)(a) |
|
| | 8,000,000 | | | | 0.751 | | | | 11/01/25 | | | | 7,797,760 | |
| Massachusetts State Health & Educational Facilities Authority RB
for Amherst College Series 2009 K-2 (AA+/Aaa)(b) |
|
| | 2,750,000 | | | | 1.700 | | | | 11/01/16 | | | | 2,770,185 | |
| Massachusetts State Health & Educational Facilities Authority RB
for Massachusetts Institute of Technology Series 2008 O
(AAA/Aaa)(c) |
|
| | 8,750,000 | | | | 5.000 | | | | 07/01/18 | | | | 9,761,237 | |
| | | | | | | | | | | | | | |
| | | | | | | | | | | | | 108,746,218 | |
| | |
| | Michigan – 4.3% | |
| Detroit Michigan Sewage Disposal System RB Refunding Senior
Lien Series 2004 A (AGM) (AA/A2) |
|
| | 2,990,000 | | | | 5.250 | | | | 07/01/20 | | | | 3,421,337 | |
| Detroit Michigan Water Supply System RB Senior Lien
Series 2005 C (NATL-RE FGIC) (AA-/A3) |
|
| | 3,000,000 | | | | 5.000 | | | | 07/01/16 | | | | 3,008,670 | |
| Detroit Michigan Water Supply System RB Senior Lien
Series 2011 A (BBB+/Baa3) |
|
| | 500,000 | | | | 5.000 | | | | 07/01/16 | | | | 514,565 | |
| | 1,295,000 | | | | 5.000 | | | | 07/01/17 | | | | 1,372,247 | |
| Macomb County Michigan L’anse Creuse Public Schools
Unlimited Tax GO Bonds Refunding Series 2015 (Q-SBLF)
(AA-/NR) |
|
| | 1,250,000 | | | | 5.000 | | | | 05/01/20 | | | | 1,439,625 | |
| Macomb County Michigan Roseville Community Schools
Unlimited Tax GO Bonds Refunding Series 2014 (Q-SBLF)
(AA-/NR) |
|
| | 250,000 | | | | 5.000 | | | | 05/01/17 | | | | 265,680 | |
| | 365,000 | | | | 5.000 | | | | 05/01/18 | | | | 400,708 | |
| | 900,000 | | | | 5.000 | | | | 05/01/19 | | | | 1,013,841 | |
| Michigan Finance Authority Hospital RB Refunding for
Beaumont Health Credit Group Series 2015 A (A/A1) |
|
| | 2,300,000 | | | | 4.000 | | | | 08/01/20 | | | | 2,528,206 | |
| | 3,500,000 | | | | 5.000 | | | | 08/01/21 | | | | 4,065,915 | |
| Michigan Finance Authority Local Government Loan Program
RB for Detroit Financial Recovery Income Tax Revenue and
Refunding Local Project Bonds Series 2014 F (A/NR) |
|
| | 500,000 | | | | 3.400 | | | | 10/01/20 | | | | 509,435 | |
| | 500,000 | | | | 3.600 | | | | 10/01/21 | | | | 511,370 | |
| | 500,000 | | | | 3.800 | | | | 10/01/22 | | | | 513,285 | |
| Michigan Finance Authority Local Government Loan Program
RB for Detroit Water and Sewerage Department Sewage
Disposal System RB Refunding Local Project Bonds Senior
Lien Series 2014 C-3 (AGM) (AA/A2) |
|
| | 5,125,000 | | | | 5.000 | | | | 07/01/21 | | | | 5,876,684 | |
| | |
| | |
| The accompanying notes are an integral part of these financial statements. | | 59 |
GOLDMAN SACHS SHORT DURATION TAX-FREE FUND
Schedule of Investments (continued)
September 30, 2015 (Unaudited)
| | | | | | | | | | | | | | |
Principal
Amount | | | Interest
Rate | | | Maturity
Date | | | Value | |
| | State-Specific Municipal Debt Obligations – (continued) | |
| | Michigan – (continued) | |
| Michigan Finance Authority Local Government Loan Program
RB for Detroit Water and Sewerage Department Sewage
Disposal System RB Refunding Local Project Bonds Senior
Lien Series 2014 C-5 (NATL-RE FGIC) (AA-/A3) |
|
| $ | 5,570,000 | | | | 5.000 | % | | | 07/01/17 | | | $ | 5,912,165 | |
| | 1,500,000 | | | | 5.000 | | | | 07/01/18 | | | | 1,630,200 | |
| Michigan Finance Authority Local Government Loan Program
RB for Detroit Water and Sewerage Department Water Supply
System RB Refunding Local Project Bonds Senior Lien
Series 2014 D-1 (AGM) (AA/A2) |
|
| | 3,165,000 | | | | 5.000 | | | | 07/01/20 | | | | 3,586,040 | |
| | 10,000,000 | | | | 5.000 | | | | 07/01/21 | | | | 11,455,100 | |
| | 9,225,000 | | | | 5.000 | | | | 07/01/22 | | | | 10,622,126 | |
| | 5,000,000 | | | | 5.000 | | | | 07/01/23 | | | | 5,779,200 | |
| Michigan Finance Authority Local Government Loan Program
RB for Detroit Water and Sewerage Department Water Supply
System RB Refunding Local Project Bonds Senior Lien
Series 2014 D-3 (NATL-RE FGIC) (AA-/A3) |
|
| | 7,410,000 | | | | 5.000 | | | | 07/01/18 | | | | 8,069,786 | |
| | 5,000,000 | | | | 5.000 | | | | 07/01/19 | | | | 5,537,650 | |
| | 1,390,000 | | | | 5.000 | | | | 07/01/20 | | | | 1,564,862 | |
| Michigan Finance Authority Local Government Loan Program
RB for Public Lighting Authority Local Project Bonds
Series 2014 B (A-/NR) |
|
| | 1,530,000 | | | | 3.000 | | | | 07/01/16 | | | | 1,555,872 | |
| | 1,400,000 | | | | 4.000 | | | | 07/01/18 | | | | 1,465,072 | |
| | 1,125,000 | | | | 5.000 | | | | 07/01/19 | | | | 1,223,910 | |
| | 1,200,000 | | | | 5.000 | | | | 07/01/20 | | | | 1,324,764 | |
| Michigan Finance Authority Local Government Loan Program
RB Refunding for Regional Convention Facility Local Project
Series 2014 H-1 (AA-/NR) |
|
| | 1,255,000 | | | | 4.000 | | | | 10/01/17 | | | | 1,328,706 | |
| | 1,135,000 | | | | 5.000 | | | | 10/01/18 | | | | 1,258,068 | |
| | 825,000 | | | | 5.000 | | | | 10/01/19 | | | | 933,315 | |
| | 1,140,000 | | | | 5.000 | | | | 10/01/20 | | | | 1,302,963 | |
| Michigan Finance Authority RB for Detroit School District
Series 2011 (A/NR) |
|
| | 7,500,000 | | | | 5.250 | | | | 06/01/17 | | | | 7,937,700 | |
| Michigan Finance Authority RB for Detroit School District
Series 2015 B (SP-2/NR)(e) |
|
| | 2,900,000 | | | | 4.750 | | | | 06/01/16 | | | | 2,929,870 | |
| Michigan Finance Authority RB Refunding for Detroit School
District Series 2012 (ST AID WITHHLDG) (A-/NR) |
|
| | 1,375,000 | | | | 4.000 | | | | 06/01/17 | | | | 1,426,164 | |
| Michigan Finance Authority RB Refunding for Unemployment
Obligation Assessment Series 2012 A (AAA/Aaa) |
|
| | 9,000,000 | | | | 5.000 | | | | 01/01/18 | | | | 9,864,450 | |
| Michigan Finance Authority RB Refunding for Unemployment
Obligation Assessment Series 2012 B (AAA/Aaa) |
|
| | 4,085,000 | | | | 5.000 | | | | 01/01/20 | | | | 4,662,088 | |
| Michigan Finance Authority State Aid RB for Detroit School
District Junior Subordinate Lien Obligations Series 2015 E
(ST AID WITHHLDG) (SP-3/NR)(e) |
|
| | 15,100,000 | | | | 5.750 | | | | 08/22/16 | | | | 15,098,792 | |
| | |
| | State-Specific Municipal Debt Obligations – (continued) | |
| | Michigan – (continued) | |
| Michigan Flushing Community Schools Unlimited Tax GO
Bonds Refunding Series 2015 (Q-SBLF) (NR/Aa1) |
|
| $ | 1,040,000 | | | | 4.000 | % | | | 05/01/19 | | | $ | 1,133,891 | |
| | 500,000 | | | | 4.000 | | | | 05/01/20 | | | | 551,540 | |
| Michigan State Environmental RB Refunding for Facilities
Program Series 2005 B (NATL-RE) (AA-/Aa1) |
|
| | 2,180,000 | | | | 5.000 | | | | 11/01/19 | | | | 2,187,695 | |
| Michigan State Hospital Finance Authority RB Refunding for
Ascension Health Credit Group Series 2010 F-1 (AA+/Aa2)(b) |
|
| | 3,050,000 | | | | 2.000 | | | | 05/30/18 | | | | 3,123,963 | |
| Michigan State Strategic Fund Tax-Exempt Adjustable Mode
Facilities RB for Waste Management, Inc. Project Series 2001
(AMT) (A-/NR)(b) |
|
| | 10,800,000 | | | | 1.500 | | | | 08/01/17 | | | | 10,836,720 | |
| Pinckney Community Schools Livingston and Washtenaw County
GO Refunding Bonds Series 2014 (Q-SBLF) (AA-/NR) |
|
| | 475,000 | | | | 4.000 | | | | 05/01/16 | | | | 484,153 | |
| | 645,000 | | | | 4.000 | | | | 05/01/17 | | | | 675,109 | |
| | 1,000,000 | | | | 5.000 | | | | 05/01/18 | | | | 1,091,160 | |
| | 2,475,000 | | | | 5.000 | | | | 05/01/20 | | | | 2,805,957 | |
| Rochester Community School District GO Refunding Bonds
Series 2012 (Q-SBLF) (AA-/NR) |
|
| | 875,000 | | | | 4.000 | | | | 05/01/18 | | | | 939,873 | |
| | 700,000 | | | | 4.000 | | | | 05/01/19 | | | | 764,218 | |
| Royal Oak Hospital Finance Authority RB for William Beaumont
Hospital Series 2014 D (A/A1) |
|
| | 1,500,000 | | | | 5.000 | | | | 09/01/19 | | | | 1,694,145 | |
| St. Clair County Michigan East China School District 2015
School Bus GO Bonds Refunding Series I (Q-SBLF) (AA-/NR) |
|
| | 3,170,000 | | | | 3.000 | | | | 05/01/19 | | | | 3,356,364 | |
| Wayne County Airport Authority RB Refunding for Detroit
Metropolitan Wayne County Airport Series 2010 C (A/A2) |
|
| | 10,000,000 | | | | 5.000 | | | | 12/01/15 | | | | 10,069,900 | |
| Wayne County Airport Authority RB Refunding for Detroit
Metropolitan Wayne County Airport Series 2012 A (A/A2) |
|
| | 1,270,000 | | | | 5.000 | | | | 12/01/18 | | | | 1,413,548 | |
| | 1,385,000 | | | | 5.000 | | | | 12/01/19 | | | | 1,572,972 | |
| Western Township Utilities Authority Sewage Disposal System
Limited Tax RB for Series 2012 (MUN GOVT GTD) (AA/NR) |
|
| | 1,000,000 | | | | 4.000 | | | | 01/01/19 | | | | 1,084,020 | |
| | | | | | | | | | | | | | |
| | | | | | | | | | | | | 175,695,659 | |
| | |
| | Minnesota – 1.9% | |
| Circle Pines Minnesota Independent School District No. 012 GO
Bonds Series 2015 A (SD CRED PROG) (AA+/NR)(d) |
|
| | 675,000 | | | | 0.000 | | | | 02/01/21 | | | | 612,630 | |
| Circle Pines Minnesota Independent School District No. 012 GO
Refunding Bonds Series 2012 A (SD CRED PROG) (AA+/NR) |
|
| | 3,575,000 | | | | 4.000 | | | | 02/01/17 | | | | 3,742,096 | |
| Farmington Minnesota Independent School District No. 192 GO
School Building Refunding Bonds Series 2012 D (SD CRED
PROG) (NR/Aa2) |
|
| | 3,110,000 | | | | 2.000 | | | | 06/01/16 | | | | 3,145,609 | |
| | 2,595,000 | | | | 1.500 | | | | 06/01/17 | | | | 2,635,145 | |
| | 3,190,000 | | | | 1.500 | | | | 06/01/18 | | | | 3,237,563 | |
| | |
| | |
| 60 | | The accompanying notes are an integral part of these financial statements. |
GOLDMAN SACHS SHORT DURATION TAX-FREE FUND
| | | | | | | | | | | | | | |
Principal
Amount | | | Interest
Rate | | | Maturity
Date | | | Value | |
| | State-Specific Municipal Debt Obligations – (continued) | |
| | Minnesota – (continued) | |
| Metropolitan Council Minneapolis St. Paul Metropolitan Area GO
Bonds for Grant Anticipation Notes Series 2012 G (SP-1+/Aaa) |
|
| $ | 30,000,000 | | | | 1.000 | % | | | 03/01/16 | | | $ | 30,021,600 | |
| Minneapolis Minnesota Convention Center GO Bonds Refunding
Series 2011 A (AAA/Aa1) |
|
| | 7,980,000 | | | | 2.000 | | | | 12/01/17 | | | | 8,198,093 | |
| Minnesota Higher Education Facilities Authority RB for
University of St. Thomas Series 2013 7-U (NR/A2) |
|
| | 500,000 | | | | 5.000 | | | | 04/01/18 | | | | 549,430 | |
| Minnesota State Trunk Highway GO Bonds Refunding
Series 2014 E (AA+/Aa1) |
|
| | 12,220,000 | | | | 2.000 | | | | 08/01/18 | | | | 12,617,883 | |
| Minnesota State Trunk Highway GO Bonds Series 2012 B
(AA+/Aa1) |
|
| | 11,700,000 | | | | 5.000 | | | | 08/01/17 | | | | 12,633,660 | |
| Watertown Independent School District No. 111 GO Refunding
Bonds for School Building Series 2012 B (SD CRED PROG)
(AA+/NR) |
|
| | 1,000,000 | | | | 3.000 | | | | 02/01/17 | | | | 1,033,580 | |
| | | | | | | | | | | | | | |
| | | | | | | | | | | | | 78,427,289 | |
| | |
| | Mississippi – 0.2% | |
| Mississippi Development Bank Special Obligation RB for
Marshall County IDA Mississippi Highway Construction
Project Series 2012 (AA-/Aa3) |
|
| | 3,845,000 | | | | 1.000 | | | | 01/01/17 | | | | 3,867,762 | |
| Mississippi State GO Bonds for Capital Improvement
Series 2006 D (NATL-RE) (AA/Aa2)(c) |
|
| | 3,855,000 | | | | 5.000 | | | | 11/01/17 | | | | 4,200,447 | |
| | | | | | | | | | | | | | |
| | | | | | | | | | | | | 8,068,209 | |
| | |
| | Missouri – 2.2% | |
| City of Columbia Electric Utility Special Obligation RB for
Annual Appropriation Series 2012 E (AA/NR) |
|
| | 1,995,000 | | | | 4.000 | | | | 09/01/18 | | | | 2,166,550 | |
| | 2,075,000 | | | | 4.000 | | | | 09/01/19 | | | | 2,293,497 | |
| Curators University of Missouri System Facilities RB for System
Facilities Series 2006 A (AA+/Aa1) |
|
| | 5,070,000 | | | | 5.000 | | | | 11/01/17 | | | | 5,087,644 | |
| Kansas City GO Bonds Refunding & Improvement Series 2012 A
(AA/Aa2) |
|
| | 7,600,000 | | | | 2.000 | | | | 02/01/16 | | | | 7,645,980 | |
| Missouri State Development Finance Board Infrastructure
Facilities Leasehold Improvement and RB Refunding for City
of Independence Electric System Projects Series 2012 F
(A/NR) |
|
| | 500,000 | | | | 4.000 | | | | 06/01/16 | | | | 511,770 | |
| | 1,180,000 | | | | 4.000 | | | | 06/01/18 | | | | 1,251,426 | |
| | 960,000 | | | | 4.000 | | | | 06/01/19 | | | | 1,033,670 | |
| | 1,000,000 | | | | 4.000 | | | | 06/01/20 | | | | 1,082,900 | |
| Missouri State Highways and Transportation Commission Second
Lien GO Refunding State Road Bonds Series 2014 B
(AAA/Aa1) |
|
| | 34,540,000 | | | | 5.000 | | | | 05/01/18 | | | | 38,272,738 | |
| | 24,275,000 | | | | 5.000 | | | | 05/01/19 | | | | 27,719,865 | |
| | |
| | State-Specific Municipal Debt Obligations – (continued) | |
| | Missouri – (continued) | |
| St. Louis Airport RB Refunding for Lambert St. Louis
International Airport Series 2013 (A-/A3) |
|
| $ | 765,000 | | | | 5.000 | % | | | 07/01/18 | | | $ | 842,426 | |
| | | | | | | | | | | | | | |
| | | | | | | | | | | | | 87,908,466 | |
| | |
| | Montana – 0.2% | |
| Montana State Department of Transportation Refunding Grant
Anticipation Notes for Highway 93 Advance Construction
Project-Garvees Series 2012 (AA/A2) |
|
| | 1,600,000 | | | | 2.000 | | | | 06/01/17 | | | | 1,633,104 | |
| | 2,000,000 | | | | 3.000 | | | | 06/01/17 | | | | 2,074,220 | |
| | 1,750,000 | | | | 3.000 | | | | 06/01/18 | | | | 1,842,890 | |
| | 800,000 | | | | 4.000 | | | | 06/01/18 | | | | 863,392 | |
| | | | | | | | | | | | | | |
| | | | | | | | | | | | | 6,413,606 | |
| | |
| | Nebraska – 0.7% | |
| Gas Supply RB Refunding for Central Plains Energy Project
Series 2014 (NR/Aa3)(b) |
|
| | 20,000,000 | | | | 5.000 | | | | 12/01/19 | | | | 22,731,600 | |
| Lincoln County Hospital Authority No. 1 RB Refunding for Great
Plains Regional Medical Center Project Series 2012 (A-/NR) |
|
| | 775,000 | | | | 4.000 | | | | 11/01/16 | | | | 799,141 | |
| | 435,000 | | | | 4.000 | | | | 11/01/17 | | | | 458,381 | |
| | 750,000 | | | | 4.000 | | | | 11/01/19 | | | | 813,270 | |
| | 690,000 | | | | 4.000 | | | | 11/01/20 | | | | 752,756 | |
| Omaha Nebraska Special Tax RB Refunding for Performing Arts
Project Series 2012 (AA+/Aa3) |
|
| | 1,215,000 | | | | 2.000 | | | | 10/15/16 | | | | 1,232,022 | |
| | 1,765,000 | | | | 3.000 | | | | 10/15/17 | | | | 1,844,407 | |
| | 1,785,000 | | | | 3.000 | | | | 10/15/18 | | | | 1,892,850 | |
| | | | | | | | | | | | | | |
| | | | | | | | | | | | | 30,524,427 | |
| | |
| | Nevada – 1.6% | |
| Clark County Department of Aviation RB Refunding for Airport
System Junior Subordinate Lien Series 2015 B (AMT) (A+/A2) |
|
| | 18,285,000 | | | | 3.000 | | | | 07/01/17 | | | | 18,936,129 | |
| Clark County GO Refunding Bonds Series 2006 (AGM)
(AA/Aa1) |
|
| | 5,115,000 | | | | 4.625 | | | | 06/01/19 | | | | 5,256,686 | |
| Clark County Improvement District Refunding for Special
Improvement District No. 142 Mountain Edge Local
Improvement Series 2012 (BBB-/NR) |
|
| | 3,280,000 | | | | 3.000 | | | | 08/01/16 | | | | 3,293,448 | |
| | 3,580,000 | | | | 4.000 | | | | 08/01/17 | | | | 3,666,600 | |
| Clark County McCarran International Airport RB Refunding for
Passenger Facility Charge Series 2010 F-1 (A+/A1) |
|
| | 3,000,000 | | | | 5.000 | | | | 07/01/16 | | | | 3,102,600 | |
| Clark County School District Limited Tax GO Bonds
Refunding Series 2015 B (AA-/A1) |
|
| | 11,900,000 | | | | 5.000 | | | | 06/15/18 | | | | 13,145,335 | |
| | 10,300,000 | | | | 5.000 | | | | 06/15/19 | | | | 11,690,088 | |
| Las Vegas City Limited Tax GO Bonds Medium-Term Various
Purpose Series 2011 A (AA/Aa2) |
|
| | 1,000,000 | | | | 2.000 | | | | 12/01/15 | | | | 1,003,000 | |
| | 2,700,000 | | | | 4.000 | | | | 12/01/16 | | | | 2,813,535 | |
| | 2,810,000 | | | | 4.000 | | | | 12/01/17 | | | | 2,922,512 | |
| | | | | | | | | | | | | | |
| | | | | | | | | | | | | 65,829,933 | |
| | |
| | |
| The accompanying notes are an integral part of these financial statements. | | 61 |
GOLDMAN SACHS SHORT DURATION TAX-FREE FUND
Schedule of Investments (continued)
September 30, 2015 (Unaudited)
| | | | | | | | | | | | | | |
Principal
Amount | | | Interest
Rate | | | Maturity
Date | | | Value | |
| | State-Specific Municipal Debt Obligations – (continued) | |
| | New Hampshire – 1.3% | |
| New Hampshire Business Finance Authority RB for Pollution
Control Project Series 2001 A (AMT) (NATL-RE) (AA-/A2)(a) |
|
| $ | 50,475,000 | | | | 0.228 | % | | | 05/01/21 | | | $ | 46,166,652 | |
| New Hampshire State Business Finance Authority RB for Waste
Management, Inc. Series 2003 (AMT) (A-/NR)(b) |
|
| | 1,200,000 | | | | 2.125 | | | | 06/01/18 | | | | 1,207,260 | |
| New Hampshire State Capital Improvement GO Bonds
Series 2012 B (AA/Aa1) |
|
| | 5,400,000 | | | | 5.000 | | | | 11/01/16 | | | | 5,670,864 | |
| | | | | | | | | | | | | | |
| | | | | | | | | | | | | 53,044,776 | |
| | |
| | New Jersey – 5.8% | |
| Atlantic County College GO Bonds Series 2013 (ST AID
WITHHLDG) (AA/Aa2) |
|
| | 1,845,000 | | | | 1.000 | | | | 03/01/16 | | | | 1,850,978 | |
| | 2,025,000 | | | | 1.000 | | | | 03/01/17 | | | | 2,039,438 | |
| Bergen County New Jersey GO Refunding Bonds for General
Improvement Series 2011 A (ST AID WITHHLDG) (NR/Aaa) |
|
| | 1,725,000 | | | | 2.000 | | | | 12/01/16 | | | | 1,757,188 | |
| | 2,355,000 | | | | 2.000 | | | | 12/01/17 | | | | 2,424,991 | |
| Brick Township GO Bonds for General Improvements
Series 2012 (NR/Aa2) |
|
| | 2,140,000 | | | | 2.000 | | | | 08/15/16 | | | | 2,171,437 | |
| Burlington County New Jersey GO Bonds Series 2015 A
(AA/Aa2) |
|
| | 1,080,000 | | | | 2.000 | | | | 05/01/18 | | | | 1,107,907 | |
| | 1,275,000 | | | | 2.000 | | | | 05/01/19 | | | | 1,308,749 | |
| Casino Reinvestment Development Authority Luxury Tax RB
Series 2014 (BBB+/Baa2) |
|
| | 785,000 | | | | 4.000 | | | | 11/01/16 | | | | 797,372 | |
| | 1,000,000 | | | | 4.000 | | | | 11/01/17 | | | | 1,027,640 | |
| East Brunswick Township Board of Education Refunding Bonds
Series 2012 (SCH BD RES FD) (NR/Aa2) |
|
| | 1,130,000 | | | | 4.000 | | | | 11/01/18 | | | | 1,231,225 | |
| | 1,300,000 | | | | 5.000 | | | | 11/01/19 | | | | 1,491,841 | |
| Gloucester County Improvement Authority RB Refunding for
Solid Waste Management, Inc. Project Series 1999 A
(A-/NR)(b) |
|
| | 2,950,000 | | | | 2.125 | | | | 12/01/17 | | | | 2,995,872 | |
| Gloucester County New Jersey GO Bonds Refunding Series 2011
(AA/NR) |
|
| | 660,000 | | | | 2.000 | | | | 10/01/15 | | | | 660,000 | |
| | 1,245,000 | | | | 3.000 | | | | 10/01/17 | | | | 1,297,925 | |
| Mercer County New Jersey GO Bonds Series 2015 (AA+/NR) | |
| | 1,000,000 | | | | 0.050 | | | | 02/01/17 | | | | 992,240 | |
| | 2,155,000 | | | | 0.050 | | | | 02/01/18 | | | | 2,109,099 | |
| | 2,355,000 | | | | 0.050 | | | | 02/01/19 | | | | 2,267,794 | |
| Middlesex County New Jersey GO Bonds for General
Improvements Series 2013 (AAA/NR) |
|
| | 2,845,000 | | | | 2.000 | | | | 01/15/17 | | | | 2,902,213 | |
| Monmouth County GO Bonds Refunding Series 2010 C
(AAA/Aaa) |
|
| | 5,425,000 | | | | 4.000 | | | | 03/01/16 | | | | 5,508,979 | |
| Montgomery Township GO Bonds Refunding Series 2012
(NR/Aa1) |
|
| | 2,320,000 | | | | 3.000 | | | | 08/01/16 | | | | 2,371,782 | |
| | |
| | State-Specific Municipal Debt Obligations – (continued) | |
| | New Jersey – (continued) | |
| New Jersey Economic Development Authority RB for School
Facilities Construction Bonds Series 2010 DD-1 (A-/A3) |
|
| $ | 2,845,000 | | | | 5.000 | % | | | 12/15/16 | | | $ | 2,971,034 | |
| New Jersey Economic Development Authority RB for School
Facilities Construction Bonds Series 2010 DD-1 (ETM)
(NR/NR)(c) |
|
| | 4,655,000 | | | | 5.000 | | | | 12/15/16 | | | | 4,908,139 | |
| New Jersey Educational Facilities Authority RB for Rider
University Series 2012 A (BBB/Baa2) |
|
| | 1,240,000 | | | | 5.000 | | | | 07/01/17 | | | | 1,309,787 | |
| | 1,265,000 | | | | 4.000 | | | | 07/01/18 | | | | 1,327,921 | |
| New Jersey Health Care Facilities Financing Authority RB for
Meridian Health System Obligated Group Issue Series 2011
(A/NR) |
|
| | 2,000,000 | | | | 5.000 | | | | 07/01/16 | | | | 2,066,440 | |
| New Jersey Health Care Facilities Financing Authority RB
Refunding for Barnabas Health Series 2012 A (A-/A3) |
|
| | 350,000 | | | | 5.000 | | | | 07/01/17 | | | | 374,952 | |
| | 400,000 | | | | 5.000 | | | | 07/01/18 | | | | 436,968 | |
| New Jersey Health Care Facilities Financing Authority RB
Refunding for Hackensack University Medical Center Issue
Series 2010 B (A-/A3) |
|
| | 4,680,000 | | | | 3.500 | | | | 01/01/16 | | | | 4,712,994 | |
| New Jersey State GO Bonds Refunding Series 2010 Q (A/A2) | |
| | 5,000,000 | | | | 5.000 | | | | 08/15/16 | | | | 5,181,150 | |
| New Jersey State Transit Corp. Refunding Grant Anticipation
Notes Series 2014 A (A/A3) |
|
| | 7,500,000 | | | | 5.000 | | | | 09/15/18 | | | | 8,205,525 | |
| New Jersey State Turnpike Authority RB Refunding
Series 2014 C (A+/A3) |
|
| | 22,000,000 | | | | 5.000 | | | | 01/01/20 | | | | 25,277,340 | |
| New Jersey State Turnpike Authority RB Series 2000 C
(NATL-RE) (AA-/A3)(a) |
|
| | 21,625,000 | | | | 0.138 | | | | 01/01/30 | | | | 19,830,858 | |
| New Jersey State Turnpike Authority RB Series 2000 D
(NATL-RE) (AA-/A3)(a) |
|
| | 21,500,000 | | | | 0.184 | | | | 01/01/30 | | | | 19,715,995 | |
| New Jersey State Turnpike Authority RB Series 2012 B (A+/A3) | |
| | 10,000,000 | | | | 5.000 | | | | 01/01/19 | | | | 11,244,200 | |
| New Jersey Transportation Trust Fund Authority RB for
Transportation Program Bonds Series 2014 AA (A-/A3) |
|
| | 10,000,000 | | | | 5.000 | | | | 06/15/21 | | | | 10,709,200 | |
| New Jersey Transportation Trust Fund Authority RB for
Transportation System Bonds Series 2010 D (A-/A3) |
|
| | 3,005,000 | | | | 5.000 | | | | 12/15/23 | | | | 3,202,218 | |
| New Jersey Transportation Trust Fund Authority RB for
Transportation System Bonds Series 2013 A (A-/A3) |
|
| | 1,485,000 | | | | 5.000 | | | | 06/15/20 | | | | 1,592,544 | |
| New Jersey Transportation Trust Fund Authority RB for
Transportation System Bonds Series 2006 A (A-/A3) |
|
| | 15,550,000 | | | | 5.250 | | | | 12/15/20 | | | | 16,846,870 | |
| New Jersey Transportation Trust Fund Authority Program RB
Series 2014 AA (A-/A3) |
|
| | 1,900,000 | | | | 5.000 | | | | 06/15/17 | | | | 2,015,425 | |
| New Jersey Transportation Trust Fund Authority RB for
Transportation System Series 2004 B (NATL-RE) (AA-/A3) |
|
| | 6,800,000 | | | | 5.500 | | | | 12/15/16 | | | | 7,159,788 | |
| | |
| | |
| 62 | | The accompanying notes are an integral part of these financial statements. |
GOLDMAN SACHS SHORT DURATION TAX-FREE FUND
| | | | | | | | | | | | | | |
Principal
Amount | | | Interest
Rate | | | Maturity
Date | | | Value | |
| | State-Specific Municipal Debt Obligations – (continued) | |
| | New Jersey – (continued) | |
| New Jersey Transportation Trust Fund Authority RB for
Transportation System Series 2011 B (A-/A3) |
|
| $ | 1,075,000 | | | | 5.000 | % | | | 06/15/16 | | | $ | 1,105,433 | |
| New Jersey Transportation Trust Fund Authority RB for
Transportation System Series 2013 A (A-/A3) |
|
| | 22,280,000 | | | | 5.000 | | | | 12/15/19 | | | | 23,868,564 | |
| New Jersey Transportation Trust Fund Authority RB Refunding
for Transportation Systems Series 2010 D (A-/A3) |
|
| | 10,000,000 | | | | 5.250 | | | | 12/15/23 | | | | 10,821,900 | |
| New Jersey Turnpike Authority Turnpike RB Series 2014 B-3
(A+/A3)(b) |
|
| | 2,750,000 | | | | 0.702 | | | | 01/01/18 | | | | 2,756,655 | |
| Toms River Township Board of Education School District GO
Refunding Bonds Series 2012 (SCH BD RES FD) (AA-/NR) |
|
| | 820,000 | | | | 3.000 | | | | 07/15/16 | | | | 836,794 | |
| | 855,000 | | | | 3.000 | | | | 07/15/17 | | | | 889,525 | |
| Toms River Township General Improvement Bonds Series 2010
(AA/NR) |
|
| | 3,260,000 | | | | 3.000 | | | | 06/15/18 | | | | 3,423,065 | |
| Union County New Jersey GO Bonds Refunding Series B (ETM)
(NR/NR)(c) |
|
| | 25,000 | | | | 3.000 | | | | 03/01/19 | | | | 26,705 | |
| Union County New Jersey GO Bonds Series B (AA+/Aa1) | |
| | 1,240,000 | | | | 3.000 | | | | 03/01/19 | | | | 1,312,118 | |
| Wayne Township School District GO Refunding Bonds
Series 2012 (SCH BD RES FD) (AA-/NR) |
|
| | 1,000,000 | | | | 4.000 | | | | 07/15/16 | | | | 1,028,240 | |
| | | | | | | | | | | | | | |
| | | | | | | | | | | | | 233,473,017 | |
| | |
| | New Mexico – 0.5% | |
| New Mexico State Capital Projects GO Bonds Series 2013
(AA+/Aaa) |
|
| | 6,030,000 | | | | 2.000 | | | | 03/01/17 | | | | 6,157,353 | |
| New Mexico State Severance Tax RB Refunding Series 2011 A-2
(AA/Aa1) |
|
| | 5,000,000 | | | | 5.000 | | | | 07/01/16 | | | | 5,176,350 | |
| New Mexico State Severance Tax RB Series 2010 A (AA/Aa1) | |
| | 2,000,000 | | | | 5.000 | | | | 07/01/17 | | | | 2,152,340 | |
| New Mexico State Severance Tax RB Series 2011 A-1 (AA/Aa1) | |
| | 5,475,000 | | | | 5.000 | | | | 07/01/17 | | | | 5,892,031 | |
| | | | | | | | | | | | | | |
| | | | | | | | | | | | | 19,378,074 | |
| | |
| | New York – 12.9% | |
| Albany County Airport Authority RB Refunding Series 2010 A
(AGM) (AA/A2) |
|
| | 1,625,000 | | | | 5.000 | | | | 12/15/15 | | | | 1,640,064 | |
| Albany County GO Serial Bonds Series 2010 (AA/Aa3) | |
| | 1,385,000 | | | | 3.000 | | | | 06/01/16 | | | | 1,409,750 | |
| City of Yonkers New York School GO Bonds Refunding
Series 2014 A (AGM) (AA/A2) |
|
| | 2,890,000 | | | | 5.000 | | | | 09/01/18 | | | | 3,206,137 | |
| | 3,135,000 | | | | 5.000 | | | | 09/01/19 | | | | 3,553,491 | |
| Marlboro Central School District GO Serial Bonds Series 2010
(AGM) (ST AID WITHHLDG) (AA/NR) |
|
| | 990,000 | | | | 4.000 | | | | 10/15/15 | | | | 991,416 | |
| | |
| | State-Specific Municipal Debt Obligations – (continued) | |
| | New York – (continued) | |
| Metropolitan Transportation Authority New York RB Refunding
for Transportation Series 2012 C (AA-/A1) |
|
| $ | 1,000,000 | | | | 5.000 | % | | | 11/15/15 | | | $ | 1,005,950 | |
| | 730,000 | | | | 4.000 | | | | 11/15/16 | | | | 759,273 | |
| Metropolitan Transportation Authority RB Refunding
Series 2008 B-4 (AA-/A1)(b) |
|
| | 20,000,000 | | | | 5.000 | | | | 11/15/19 | | | | 22,806,200 | |
| Metropolitan Transportation Authority RB Series 2011 B
(AA-/A1)(b) |
|
| | 50,000,000 | | | | 0.482 | | | | 11/01/17 | | | | 49,498,000 | |
| Metropolitan Transportation Authority RB Series 2011 D
(AA-/A1) |
|
| | 1,100,000 | | | | 4.000 | | | | 11/15/15 | | | | 1,105,203 | |
| Monroe County GO Bonds Refunding Series 2012 (A/Baa1) | |
| | 3,000,000 | | | | 5.000 | | | | 03/01/16 | | | | 3,050,640 | |
| New York City GO Bonds Refunding RMKT 03/19/13
Subseries 2008 J-4 (AA/Aa2)(a) |
|
| | 6,250,000 | | | | 0.570 | | | | 08/01/25 | | | | 6,155,625 | |
| New York City GO Bonds Series 2010 A (AA/Aa2) | |
| | 1,200,000 | | | | 3.000 | | | | 08/01/16 | | | | 1,226,988 | |
| New York City GO Bonds Series 2014 J (AA/Aa2) | |
| | 52,045,000 | | | | 5.000 | | | | 08/01/18 | | | | 57,977,610 | |
| New York City Transitional Finance Authority RB Future Tax
Subordinate Fiscal 2013 Series B (AAA/Aa1) |
|
| | 8,620,000 | | | | 5.000 | | | | 11/01/17 | | | | 9,384,939 | |
| New York City Transitional Finance Authority RB Future Tax
Subordinate Fiscal 2013 Series B (ETM) (NR/NR)(c) |
|
| | 2,030,000 | | | | 5.000 | | | | 11/01/17 | | | | 2,211,015 | |
| New York City Transitional Finance Authority RB Future Tax
Subordinate Fiscal 2013 Series D (AAA/NR) |
|
| | 5,240,000 | | | | 5.000 | | | | 11/01/17 | | | | 5,704,998 | |
| New York City Transitional Finance Authority RB Future Tax
Subordinate Fiscal 2013 Series D (ETM) (NR/NR)(c) |
|
| | 6,890,000 | | | | 5.000 | | | | 11/01/17 | | | | 7,504,381 | |
| New York City Transitional Finance Authority RB Refunding for
Future Tax Fiscal 2013 Series 2012 E (AAA/Aa1) |
|
| | 13,310,000 | | | | 5.000 | | | | 11/01/17 | | | | 14,491,129 | |
| New York State Dormitory Authority North Shore-Long Island
Jewish Obligated Group RB Series 2011 A (A-/A3) |
|
| | 1,725,000 | | | | 4.000 | | | | 05/01/16 | | | | 1,759,448 | |
| | 2,215,000 | | | | 4.000 | | | | 05/01/17 | | | | 2,325,507 | |
| New York State Dormitory Authority RB Refunding for Long
Island University Series 2012 A (BBB-/Baa3) |
|
| | 3,325,000 | | | | 4.000 | | | | 09/01/16 | | | | 3,397,319 | |
| | 3,000,000 | | | | 4.000 | | | | 09/01/17 | | | | 3,121,890 | |
| | 3,665,000 | | | | 5.000 | | | | 09/01/18 | | | | 3,954,388 | |
| New York State Dormitory Authority State Sales Tax RB
Series 2015 A (AAA/Aa1) |
|
| | 23,960,000 | | | | 5.000 | | | | 03/15/19 | | | | 27,240,603 | |
| New York State Dormitory Authority Tax Exempt General
Purpose Personal Income Tax RB Series 2011 E (AAA/Aa1) |
|
| | 8,475,000 | | | | 5.000 | | | | 08/15/17 | | | | 9,164,017 | |
| New York State Energy Research & Development Authority
Facilities RB Refunding for Consolidated Edison Co. Subseries
1999 A-2 (AMT) (AMBAC) (A-/A2)(a) |
|
| | 70,150,000 | | | | 0.182 | | | | 05/01/34 | | | | 63,466,692 | |
| | |
| | |
| The accompanying notes are an integral part of these financial statements. | | 63 |
GOLDMAN SACHS SHORT DURATION TAX-FREE FUND
Schedule of Investments (continued)
September 30, 2015 (Unaudited)
| | | | | | | | | | | | | | |
Principal
Amount | | | Interest
Rate | | | Maturity
Date | | | Value | |
| | State-Specific Municipal Debt Obligations – (continued) | |
| | New York – (continued) | |
| New York State Energy Research & Development Authority
PCRB for New York State Electric & Gas Corp. Project
Series 2011 B (BBB+/A3) |
|
| $ | 5,000,000 | | | | 2.250 | % | | | 10/15/15 | | | $ | 5,003,600 | |
| New York State Energy Research & Development Authority
PCRB for New York State Electric & Gas Corp. Project
Series 2011 C (BBB+/A3) |
|
| | 8,000,000 | | | | 2.250 | | | | 12/01/15 | | | | 8,022,960 | |
| New York State Energy Research & Development Authority RB
Refunding for Central Hudson Gas & Electric Corp. Projects
Series 1999 B (AMT) (AMBAC) (A/A2)(a) |
|
| | 27,750,000 | | | | 0.149 | | | | 07/01/34 | | | | 24,861,130 | |
| New York State Tax Exempt GO Bonds Series 2011 E
(AA+/Aa1) |
|
| | 6,950,000 | | | | 5.000 | | | | 12/15/17 | | | | 7,610,806 | |
| New York State Tax Exempt GO Bonds Subseries 2012 A-1
(AA/Aa2) |
|
| | 3,000,000 | | | | 5.000 | | | | 10/01/17 | | | | 3,255,600 | |
| New York State Tax Exempt GO Refunding Bonds Series 2012 C
(AA/Aa2) |
|
| | 7,555,000 | | | | 4.000 | | | | 08/01/16 | | | | 7,786,938 | |
| New York State Thruway Authority Junior Indebtedness RB
Series 2013 A (A-/A3) |
|
| | 29,525,000 | | | | 5.000 | | | | 05/01/19 | | | | 33,314,829 | |
| New York State Thruway Authority RB for General Highway and
Bridge Trust Series 2011 A-1 (AA/NR) |
|
| | 6,440,000 | | | | 5.000 | | | | 04/01/17 | | | | 6,872,317 | |
| New York State Urban Development Corp. General Purpose
Personal Income Tax RB Refunding Series 2014 A (AAA/Aa1) |
|
| | 20,000,000 | | | | 5.000 | | | | 03/15/20 | | | | 23,204,200 | |
| New York State Urban Development Corp. RB for State Personal
Income Tax Series 2013 E (AAA/Aa1) |
|
| | 26,365,000 | | | | 5.000 | | | | 03/15/18 | | | | 29,067,149 | |
| Niagara Frontier Transportation Authority RB Refunding for
Buffalo International Airport Series 2014 B (BBB+/Baa1) |
|
| | 750,000 | | | | 4.000 | | | | 04/01/16 | | | | 762,578 | |
| | 700,000 | | | | 5.000 | | | | 04/01/17 | | | | 738,598 | |
| | 670,000 | | | | 4.000 | | | | 04/01/18 | | | | 708,404 | |
| | 300,000 | | | | 5.000 | | | | 04/01/19 | | | | 332,430 | |
| Rockland County GO Bonds Series 2014 A (AGM) (AA/A2) | |
| | 1,825,000 | | | | 5.000 | | | | 03/01/18 | | | | 1,990,309 | |
| | 2,250,000 | | | | 5.000 | | | | 03/01/19 | | | | 2,516,040 | |
| | 3,000,000 | | | | 5.000 | | | | 03/01/20 | | | | 3,415,710 | |
| Rockland County New York GO Bonds Refunding Series 2014
(BAM) (AA/Baa2) |
|
| | 1,500,000 | | | | 2.000 | | | | 02/15/16 | | | | 1,508,655 | |
| | 1,500,000 | | | | 3.000 | | | | 02/15/19 | | | | 1,576,995 | |
| | 635,000 | | | | 3.000 | | | | 02/15/20 | | | | 668,452 | |
| Suffolk County New York GO Bonds for Public Improvement
Series 2012 B (AGM) (AA/A2) |
|
| | 2,590,000 | | | | 2.000 | | | | 10/15/16 | | | | 2,630,300 | |
| Suffolk County New York Refunding Serial Bonds Series 2012 B
(A+/A3) |
|
| | 2,000,000 | | | | 4.000 | | | | 10/01/16 | | | | 2,069,360 | |
| | 1,000,000 | | | | 4.000 | | | | 10/01/17 | | | | 1,062,810 | |
| | |
| | State-Specific Municipal Debt Obligations – (continued) | |
| | New York – (continued) | |
| Suffolk Tobacco Asset Securitization Corp. RB Tobacco
Settlement Asset-Backed Bonds Series 2012 B (A/NR) |
|
| $ | 370,000 | | | | 4.000 | % | | | 06/01/17 | | | $ | 390,501 | |
| | 490,000 | | | | 4.000 | | | | 06/01/18 | | | | 527,353 | |
| | 575,000 | | | | 5.000 | | | | 06/01/19 | | | | 648,284 | |
| | 620,000 | | | | 5.000 | | | | 06/01/20 | | | | 706,422 | |
| Tobacco Settlement Financing Corp. RB Asset-Backed Bonds for
State Contingency Contract Secured Series 2011 B (AA/NR) |
|
| | 30,000,000 | | | | 5.000 | | | | 06/01/17 | | | | 32,160,600 | |
| Triborough Bridge & Tunnel Authority RB General RMKT
06/28/12 Subseries 2005 B-4 (AA-/Aa3)(b) |
|
| | 7,500,000 | | | | 0.652 | | | | 01/03/17 | | | | 7,485,300 | |
| Yonkers New York GO Bonds Series 2011 A (AGM) (A/A3) | |
| | 2,000,000 | | | | 5.000 | | | | 10/01/15 | | | | 2,000,000 | |
| | 2,000,000 | | | | 5.000 | | | | 10/01/16 | | | | 2,086,840 | |
| | | | | | | | | | | | | | |
| | | | | | | | | | | | | 523,098,143 | |
| | |
| | North Carolina – 2.0% | |
| Durham North Carolina Utility System RB Refunding Series 2011
(AAA/Aa1) |
|
| | 300,000 | | | | 4.000 | | | | 06/01/16 | | | | 307,443 | |
| North Carolina Eastern Municipal Power Agency Power System
RB Refunding Series 2010 A (ETM) (A-/Baa1)(c) |
|
| | 5,500,000 | | | | 5.000 | | | | 01/01/16 | | | | 5,563,965 | |
| North Carolina Eastern Municipal Power Agency Power System
RB Refunding Series 2012 B (ETM) (A-/Baa1)(c) |
|
| | 1,500,000 | | | | 5.000 | | | | 01/01/16 | | | | 1,517,445 | |
| | 4,535,000 | | | | 5.000 | | | | 01/01/17 | | | | 4,791,364 | |
| | 3,000,000 | | | | 5.000 | | | | 01/01/19 | | | | 3,380,430 | |
| North Carolina Eastern Municipal Power Agency Power System
RB Series 2012 A (ETM) (A-/Baa1)(c) |
|
| | 1,815,000 | | | | 3.000 | | | | 01/01/16 | | | | 1,827,433 | |
| | 2,000,000 | | | | 3.000 | | | | 01/01/18 | | | | 2,102,920 | |
| | 1,275,000 | | | | 5.000 | | | | 01/01/18 | | | | 1,397,170 | |
| | 2,000,000 | | | | 3.000 | | | | 01/01/19 | | | | 2,126,480 | |
| | 1,000,000 | | | | 5.000 | | | | 01/01/19 | | | | 1,126,810 | |
| North Carolina GO Bonds Refunding Series 2005 B (AAA/Aaa) | |
| | 16,925,000 | | | | 5.000 | | | | 04/01/17 | | | | 18,069,130 | |
| North Carolina GO Bonds Refunding Series 2013 D (AAA/Aaa) | |
| | 27,685,000 | | | | 3.000 | | | | 06/01/17 | | | | 28,829,221 | |
| North Carolina Grant and Revenue Anticipation Vehicle Bonds
Series 2011 (AA/A2)(b) |
|
| | 6,010,000 | | | | 4.000 | | | | 03/01/18 | | | | 6,327,208 | |
| North Carolina Medical Care Commission Health Care Facilities
RB Refunding for Wake Forest Baptist Obligated Group
Series 2012 B (A/A2) |
|
| | 1,065,000 | | | | 4.000 | | | | 12/01/16 | | | | 1,106,876 | |
| | 1,375,000 | | | | 5.000 | | | | 12/01/18 | | | | 1,532,671 | |
| | | | | | | | | | | | | | |
| | | | | | | | | | | | | 80,006,566 | |
| | |
| | Ohio – 0.8% | |
| Akron City Ohio Jedd RB Refunding Series 2011 (AA-/NR) | |
| | 1,000,000 | | | | 4.000 | | | | 12/01/15 | | | | 1,006,160 | |
| | 1,425,000 | | | | 5.000 | | | | 12/01/16 | | | | 1,496,920 | |
| | 1,740,000 | | | | 5.000 | | | | 12/01/17 | | | | 1,886,090 | |
| | |
| | |
| 64 | | The accompanying notes are an integral part of these financial statements. |
GOLDMAN SACHS SHORT DURATION TAX-FREE FUND
| | | | | | | | | | | | | | |
Principal
Amount | | | Interest
Rate | | | Maturity
Date | | | Value | |
| | State-Specific Municipal Debt Obligations – (continued) | |
| | Ohio – (continued) | |
| Bowling Green Ohio City Student Housing RB for CFP I LLC
Bowling Green State University Project Series 2010
(BBB-/NR) |
|
| $ | 825,000 | | | | 4.000 | % | | | 06/01/16 | | | $ | 835,783 | |
| Buckeye Ohio Tobacco Settlement Financing Authority RB
Senior Turbo Asset-Backed Bonds Series 2007 A-2 (B-/Caa1) |
|
| | 13,740,000 | | | | 5.125 | | | | 06/01/24 | | | | 11,758,692 | |
| | 3,415,000 | | | | 5.375 | | | | 06/01/24 | | | | 2,948,818 | |
| Cleveland Airport Various Purpose GO Refunding Bonds
Series 2015 (AA/A1) |
|
| | 1,455,000 | | | | 5.000 | | | | 12/01/20 | | | | 1,687,116 | |
| Dublin City School District GO Refunding Bonds Unlimited Tax
Series 2012 (AAA/Aa1) |
|
| | 500,000 | | | | 4.000 | | | | 12/01/16 | | | | 520,490 | |
| | 1,180,000 | | | | 4.000 | | | | 12/01/17 | | | | 1,261,573 | |
| Hamilton County Health Care RB Refunding for Life Enriching
Community Project Series 2012 (BBB/NR) |
|
| | 250,000 | | | | 2.000 | | | | 01/01/16 | | | | 250,370 | |
| | 315,000 | | | | 2.250 | | | | 01/01/17 | | | | 316,610 | |
| | 400,000 | | | | 4.000 | | | | 01/01/18 | | | | 415,368 | |
| | 415,000 | | | | 4.000 | | | | 01/01/19 | | | | 434,766 | |
| | 435,000 | | | | 4.000 | | | | 01/01/20 | | | | 455,715 | |
| New Albany Community Authority RB Refunding Series 2012 C
(NR/A1) |
|
| | 1,100,000 | | | | 4.000 | | | | 10/01/17 | | | | 1,159,235 | |
| | 800,000 | | | | 4.000 | | | | 10/01/18 | | | | 858,240 | |
| Ohio State Air Quality Development Authority PCRB Refunding
for FirstEnergy Series 2009 D (BBB-/Baa3)(b) |
|
| | 3,000,000 | | | | 2.250 | | | | 09/15/16 | | | | 3,009,480 | |
| Ohio State Higher Educational Facility Commission RB for
Cleveland Clinic Health System Obligations Series 2013 A-2
(AA-/Aa2)(a) |
|
| | 2,250,000 | | | | 0.490 | | | | 01/01/18 | | | | 2,244,128 | |
| University of Akron General Receipts GO Bonds Series 2015 A
(AA-/A1) |
|
| | 1,100,000 | | | | 4.000 | | | | 01/01/19 | | | | 1,202,322 | |
| | | | | | | | | | | | | | |
| | | | | | | | | | | | | 33,747,876 | |
| | |
| | Oklahoma – 1.3% | |
| Cleveland Educational Facilities Authority RB for Norman Public
Schools Project Series 2014 (A+/NR) |
|
| | 1,520,000 | | | | 5.000 | | | | 07/01/17 | | | | 1,625,898 | |
| Oklahoma County Independent School District No. 12 Combined
Purpose GO Bonds for Edmond School District Series 2012
(AA/NR) |
|
| | 3,765,000 | | | | 2.000 | | | | 03/01/16 | | | | 3,792,447 | |
| | 5,470,000 | | | | 2.000 | | | | 03/01/17 | | | | 5,577,814 | |
| Oklahoma County Independent School District No. 12 Combined
Purpose GO Bonds Series 2015 (AA/NR) |
|
| | 5,000,000 | | | | 2.000 | | | | 03/01/17 | | | | 5,102,050 | |
| Oklahoma County Independent School District No. 52 GO Bonds
for Midwest City-Del City School District Series 2012
(NR/Aa3) |
|
| | 2,160,000 | | | | 2.000 | | | | 01/01/17 | | | | 2,198,081 | |
| Oklahoma County Independent School District No. 52 GO Bonds
for Series 2013 (NR/Aa3) |
|
| | 2,795,000 | | | | 2.000 | | | | 01/01/16 | | | | 2,807,130 | |
| | 2,445,000 | | | | 2.000 | | | | 01/01/17 | | | | 2,488,106 | |
| | |
| | State-Specific Municipal Debt Obligations – (continued) | |
| | Oklahoma – (continued) | |
| Oklahoma County Independent School District No. 89 GO Bonds
Series 2015 (AA/Aa2) |
|
| $ | 6,200,000 | | | | 3.000 | % | | | 07/01/19 | | | $ | 6,588,058 | |
| Oklahoma County Independent School District No. 89 GO Bonds
Series 2013 (AA/Aa2) |
|
| | 8,750,000 | | | | 1.000 | | | | 07/01/16 | | | | 8,796,462 | |
| Tulsa County Industrial Authority RB for Capital Improvement
RMKT 08/17/09 Series 2003 A (AA-/NR) |
|
| | 10,965,000 | | | | 4.000 | | | | 05/15/16 | | | | 11,201,515 | |
| Tulsa Oklahoma GO Bonds Series 2013 (AA/Aa1) | |
| | 3,400,000 | | | | 4.000 | | | | 03/01/16 | | | | 3,452,496 | |
| | | | | | | | | | | | | | |
| | | | | | | | | | | | | 53,630,057 | |
| | |
| | Oregon – 0.7% | |
| Lane County Oregon Springfield School District No. 19 GO
Bonds Refunding Series 2015 (SCH BD GTY) (AA+/Aa1)(d) |
|
| | 3,740,000 | | | | 0.000 | | | | 06/15/20 | | | | 3,401,680 | |
| | 3,780,000 | | | | 0.000 | | | | 06/15/21 | | | | 3,316,572 | |
| Oregon Coast Community College District GO Bonds Refunding
Series 2012 (SCH BD GTY) (NR/Aa1) |
|
| | 1,120,000 | | | | 2.000 | | | | 06/15/16 | | | | 1,133,899 | |
| | 790,000 | | | | 2.000 | | | | 06/15/17 | | | | 809,963 | |
| | 1,165,000 | | | | 2.000 | | | | 06/15/18 | | | | 1,181,858 | |
| | 1,445,000 | | | | 3.000 | | | | 06/15/19 | | | | 1,513,551 | |
| Oregon State Facilities Authority RB Refunding for Legacy
Health System Series 2011 A (AA-/A1) |
|
| | 2,000,000 | | | | 5.000 | | | | 05/01/16 | | | | 2,052,760 | |
| Oregon State GO Bonds Refunding for Oregon University System
Series 2012 B (AA+/Aa1) |
|
| | 1,175,000 | | | | 3.000 | | | | 08/01/17 | | | | 1,227,334 | |
| | 1,120,000 | | | | 3.000 | | | | 08/01/18 | | | | 1,187,648 | |
| Portland Oregon Community College District GO Bonds
Refunding Series 2015 (AA/Aa1) |
|
| | 10,000,000 | | | | 5.000 | | | | 06/15/18 | | | | 11,114,400 | |
| | | | | | | | | | | | | | |
| | | | | | | | | | | | | 26,939,665 | |
| | |
| | Pennsylvania – 2.0% | |
| Allegheny County Higher Education Building Authority RB for
Chatham University Series 2012 A (BBB/NR) |
|
| | 750,000 | | | | 5.000 | | | | 09/01/18 | | | | 809,880 | |
| Allegheny County Redevelopment Authority Tax Increment
Refunding for Waterfront Project Series 2007 A (A/NR) |
|
| | 1,050,000 | | | | 4.250 | | | | 12/15/15 | | | | 1,055,439 | |
| | 645,000 | | | | 4.250 | | | | 12/15/17 | | | | 674,573 | |
| Butler County Hospital Authority RB for Health System Project
Series 2015 A (A-/Baa1) |
|
| | 735,000 | | | | 2.000 | | | | 07/01/16 | | | | 740,939 | |
| | 500,000 | | | | 3.000 | | | | 07/01/17 | | | | 513,865 | |
| | 1,265,000 | | | | 3.000 | | | | 07/01/18 | | | | 1,309,149 | |
| | 300,000 | | | | 3.000 | | | | 07/01/19 | | | | 311,190 | |
| | 265,000 | | | | 4.000 | | | | 07/01/20 | | | | 286,099 | |
| | 1,000,000 | | | | 4.000 | | | | 07/01/21 | | | | 1,079,140 | |
| Chester County IDA RB for University Student Housing, LLC
Project at West Chester University Series 2013 A (NR/Baa3) |
|
| | 295,000 | | | | 3.000 | | | | 08/01/16 | | | | 297,823 | |
| | 515,000 | | | | 3.000 | | | | 08/01/17 | | | | 523,420 | |
| | 530,000 | | | | 3.000 | | | | 08/01/18 | | | | 537,892 | |
| | |
| | |
| The accompanying notes are an integral part of these financial statements. | | 65 |
GOLDMAN SACHS SHORT DURATION TAX-FREE FUND
Schedule of Investments (continued)
September 30, 2015 (Unaudited)
| | | | | | | | | | | | | | |
Principal
Amount | | | Interest
Rate | | | Maturity
Date | | | Value | |
| | State-Specific Municipal Debt Obligations – (continued) | |
| | Pennsylvania – (continued) | |
| Cumberland County Municipal Authority RB Refunding for
Diakon Lutheran Social Ministries Project Series 2015
(BBB+/NR) |
|
| $ | 535,000 | | | | 4.000 | % | | | 01/01/19 | | | $ | 561,846 | |
| | 1,000,000 | | | | 4.000 | | | | 01/01/20 | | | | 1,052,120 | |
| Derry Township School District GO Bonds Refunding
Series 2015 (ST AID WITHHLDG) (AAA/NR) |
|
| | 1,505,000 | | | | 3.000 | | | | 05/15/17 | | | | 1,561,092 | |
| Montgomery County Higher Education and Health Authority RB
Refunding for Holy Redeemer Health System Series 2014 A
(BBB+/Baa3) |
|
| | 1,000,000 | | | | 4.000 | | | | 10/01/18 | | | | 1,064,340 | |
| | 1,000,000 | | | | 4.000 | | | | 10/01/19 | | | | 1,069,960 | |
| Montgomery County IDA Pollution Control RB Refunding for
PECO Energy Company Project Series 1999 B (BBB/Baa2)(b) |
|
| | 5,000,000 | | | | 2.500 | | | | 04/01/20 | | | | 4,966,350 | |
| Pennsylvania Economic Development Financing Authority RB
Refunding for Unemployment Compensation Series 2012 B
(AA+/Aaa) |
|
| | 9,545,000 | | | | 5.000 | | | | 07/01/22 | | | | 9,882,320 | |
| | 7,000,000 | | | | 5.000 | | | | 01/01/23 | | | | 7,080,010 | |
| Pennsylvania Economic Development Financing Authority Solid
Waste Disposal RB for Waste Management, Inc. Project
Series 2004 A (A-/NR)(b) |
|
| | 1,400,000 | | | | 1.250 | | | | 05/01/17 | | | | 1,400,994 | |
| Pennsylvania Economic Development Financing Authority Solid
Waste Disposal RB for Waste Management, Inc. Project
Series 2004 A (A-/NR)(b) |
|
| | 1,750,000 | | | | 1.500 | | | | 05/01/18 | | | | 1,742,965 | |
| Pennsylvania Economic Development Financing Authority Solid
Waste Disposal RB for Waste Management, Inc. Project
Series 2009 (A-/NR)(b) |
|
| | 5,250,000 | | | | 1.750 | | | | 12/01/15 | | | | 5,259,450 | |
| Pennsylvania Economic Development Financing Authority
Unemployment Compensation RB Series 2012 B (AA+/Aaa) |
|
| | 16,335,000 | | | | 5.000 | | | | 07/01/20 | | | | 18,559,010 | |
| Pennsylvania Higher Educational Facilities Authority RB for La
Salle University Series 2012 (BBB/NR) |
|
| | 390,000 | | | | 3.000 | | | | 05/01/16 | | | | 392,871 | |
| | 440,000 | | | | 3.000 | | | | 05/01/17 | | | | 447,528 | |
| | 1,165,000 | | | | 5.000 | | | | 05/01/18 | | | | 1,248,239 | |
| | 1,000,000 | | | | 5.000 | | | | 05/01/19 | | | | 1,090,270 | |
| Pennsylvania State Commonwealth GO Bonds for City of
Pittsburgh Series 2012 A (A+/A1) |
|
| | 600,000 | | | | 4.000 | | | | 09/01/16 | | | | 619,614 | |
| | 500,000 | | | | 3.000 | | | | 09/01/17 | | | | 521,245 | |
| | 550,000 | | | | 4.000 | | | | 09/01/17 | | | | 583,754 | |
| Pennsylvania State Commonwealth RB for Harrisburg Area
Community College Project Series 2011 (AGM) (AA/NR) |
|
| | 1,305,000 | | | | 4.000 | | | | 10/01/15 | | | | 1,305,000 | |
| Pennsylvania Turnpike Commission RB Series 2014 B-1
(A+/A1)(a) |
|
| | 7,000,000 | | | | 0.900 | | | | 12/01/20 | | | | 6,901,580 | |
| Philadelphia GO Bonds Series 2011 (AGM) (AA/A2) | |
| | 1,460,000 | | | | 5.000 | | | | 08/01/16 | | | | 1,514,823 | |
| | |
| | State-Specific Municipal Debt Obligations – (continued) | |
| | Pennsylvania – (continued) | |
| Philadelphia Hospitals & Higher Education Facilities Authority
Hospital RB Refunding for Temple University Health System
Series 2012 B (BB+/Ba2) |
|
| $ | 1,500,000 | | | | 5.000 | % | | | 07/01/16 | | | $ | 1,535,925 | |
| | 2,000,000 | | | | 5.000 | | | | 07/01/17 | | | | 2,105,500 | |
| | | | | | | | | | | | | | |
| | | | | | | | | | | | | 80,606,215 | |
| | |
| | Puerto Rico – 2.5% | |
| Government Development Bank for Puerto Rico Senior Notes RB
Series 2006 B (CC/Ca) |
|
| | 2,645,000 | | | | 5.000 | | | | 12/01/15 | | | | 1,428,459 | |
| Puerto Rico Commonwealth Aqueduct & Sewer Authority RB
Senior Lien Series 2012 A (CCC-/Caa3) |
|
| | 14,595,000 | | | | 5.000 | | | | 07/01/17 | | | | 11,676,730 | |
| | 7,285,000 | | | | 5.000 | | | | 07/01/19 | | | | 5,445,974 | |
| Puerto Rico Commonwealth Public Improvement GO Bonds
Refunding Series 2002 A (FGIC) (CC/Caa3) |
|
| | 1,030,000 | | | | 5.500 | | | | 07/01/17 | | | | 885,831 | |
| Puerto Rico Electric Power Authority RB Refunding
Series 2007 UU (AGM) (AA/A2)(a) |
|
| | 36,100,000 | | | | 0.710 | | | | 07/01/29 | | | | 26,127,375 | |
| Puerto Rico Electric Power Authority RB Refunding
Series 2007 UU (CC/Caa3)(a) |
|
| | 25,850,000 | | | | 0.890 | | | | 07/01/31 | | | | 15,510,000 | |
| Puerto Rico Electric Power Authority RB Refunding Series 2010
(CC/Caa3)(g) |
|
| | 3,250,000 | | | | 4.000 | | | | 07/01/16 | | | | 2,103,660 | |
| Puerto Rico Electric Power Authority RB Refunding Series 2012
(CC/Caa3)(g) |
|
| | 1,500,000 | | | | 5.000 | | | | 07/01/16 | | | | 970,935 | |
| Puerto Rico Electric Power Authority RB Series 2008
(CC/Caa3)(g) |
|
| | 8,175,000 | | | | 5.500 | | | | 07/01/16 | | | | 5,291,596 | |
| Puerto Rico Municipal Finance Agency GO Bonds Series 2002 A
(AGM) (AA/A2) |
|
| | 1,125,000 | | | | 5.250 | | | | 08/01/16 | | | | 1,127,149 | |
| Puerto Rico Public Buildings Authority RB Refunding for
Government Facilities Series 2002 C (COMWLTH GTD)
(CC/Caa3) |
|
| | 2,250,000 | | | | 5.500 | | | | 07/01/16 | | | | 1,789,132 | |
| Puerto Rico Public Buildings Authority RB Refunding for
Government Facilities Series 2007 M-2 (AMBAC)
(COMWLTH GTD) (CC/Caa3)(b) |
|
| | 1,000,000 | | | | 5.500 | | | | 07/01/17 | | | | 996,310 | |
| Puerto Rico Public Buildings Authority RB Refunding for
Government Facilities Series 2013 M-2 (COMWLTH GTD)
(CC/Caa3)(b) |
|
| | 10,850,000 | | | | 5.750 | | | | 07/01/17 | | | | 7,948,276 | |
| Puerto Rico Sales Tax Financing Corp. RB First
Subseries 2009 A (CC/Ca) |
|
| | 5,000,000 | | | | 5.500 | | | | 08/01/28 | | | | 2,156,250 | |
| Puerto Rico Sales Tax Financing Corp. Sales Tax RB First
Subseries 2009 A (CC/Ca) |
|
| | 8,000,000 | | | | 5.500 | | | | 08/01/21 | | | | 3,660,000 | |
| | 10,000,000 | | | | 5.500 | | | | 08/01/22 | | | | 4,550,000 | |
| | 19,315,000 | | | | 5.500 | | | | 08/01/23 | | | | 8,740,037 | |
| | | | | | | | | | | | | | |
| | | | | | | | | | | | | 100,407,714 | |
| | |
| | |
| 66 | | The accompanying notes are an integral part of these financial statements. |
GOLDMAN SACHS SHORT DURATION TAX-FREE FUND
| | | | | | | | | | | | | | |
Principal
Amount | | | Interest
Rate | | | Maturity
Date | | | Value | |
| | State-Specific Municipal Debt Obligations – (continued) | |
| | Rhode Island – 0.4% | |
| Providence GO Bonds Series 2013 A (BBB/Baa1) | |
| $ | 665,000 | | | | 3.000 | % | | | 01/15/16 | | | $ | 669,229 | |
| | 315,000 | | | | 4.000 | | | | 01/15/18 | | | | 332,782 | |
| | 1,545,000 | | | | 5.000 | | | | 01/15/19 | | | | 1,701,122 | |
| Rhode Island Health and Educational Building Corp. Higher
Education Facility RB Refunding for University of Rhode
Island Auxiliary Enterprise Series 2013 C (A+/A1) |
|
| | 600,000 | | | | 5.000 | | | | 09/15/17 | | | | 648,036 | |
| | 500,000 | | | | 4.000 | | | | 09/15/18 | | | | 536,770 | |
| Rhode Island Health and Educational Building Corp. RB for
Newport Public School Financing Program Series 2013 C
(AA+/NR) |
|
| | 515,000 | | | | 3.000 | | | | 05/15/16 | | | | 522,370 | |
| | 385,000 | | | | 3.000 | | | | 05/15/17 | | | | 399,919 | |
| | 280,000 | | | | 4.000 | | | | 05/15/18 | | | | 299,793 | |
| Tobacco Settlement Financing Corp. RB Asset-Backed Bonds
Series 2015 B (BBB+/NR) |
|
| | 9,920,000 | | | | 2.250 | | | | 06/01/41 | | | | 9,919,901 | |
| | | | | | | | | | | | | | |
| | | | | | | | | | | | | 15,029,922 | |
| | |
| | South Carolina – 1.4% | |
| Berkeley County School District GO Bonds Series 2014 A
(SCSDE) (AA/Aa1) |
|
| | 1,380,000 | | | | 5.000 | | | | 03/01/19 | | | | 1,564,354 | |
| Clemson University RB Refunding Series 2012 (AA-/Aa2) | |
| | 5,770,000 | | | | 2.000 | | | | 05/01/16 | | | | 5,829,373 | |
| | 4,440,000 | | | | 2.000 | | | | 05/01/17 | | | | 4,541,321 | |
| | 5,000,000 | | | | 2.000 | | | | 05/01/18 | | | | 5,129,200 | |
| Colleton County South Carolina GO Bonds for Capital Project
Sales Series 2015 (AA-/Aa3) |
|
| | 725,000 | | | | 1.500 | | | | 07/01/18 | | | | 734,962 | |
| | 2,985,000 | | | | 2.000 | | | | 07/01/19 | | | | 3,068,729 | |
| Columbia City South Carolina Waterworks and Sewer System RB
Series 2011 A (AA/Aa1) |
|
| | 1,025,000 | | | | 3.000 | | | | 02/01/16 | | | | 1,034,543 | |
| Florence County South Carolina Hospital RB for McLeod
Regional Medical Center Project Series 2010 A (AA-/NR) |
|
| | 1,905,000 | | | | 4.000 | | | | 11/01/16 | | | | 1,978,305 | |
| Georgetown County South Carolina School District GO Bonds
Refunding Series 2011 B (SCSDE) (AA/Aa1) |
|
| | 4,330,000 | | | | 5.000 | | | | 03/01/16 | | | | 4,415,301 | |
| | 5,895,000 | | | | 5.000 | | | | 03/01/17 | | | | 6,267,800 | |
| Oconee County PCRB Refunding for Duke Power Co. Project
Series 2009 (A/Aa2) |
|
| | 6,000,000 | | | | 3.600 | | | | 02/01/17 | | | | 6,222,120 | |
| Richland County South Carolina GO Bonds Series 2012 A
(ST AID WITHHLDG) (AAA/Aa1) |
|
| | 2,000,000 | | | | 4.000 | | | | 03/01/17 | | | | 2,098,500 | |
| Richland County South Carolina School District No. 1 GO Bonds
Refunding Series 2014 B (SCSDE) (AA/Aa1) |
|
| | 2,755,000 | | | | 5.000 | | | | 03/01/18 | | | | 3,032,208 | |
| | 2,920,000 | | | | 5.000 | | | | 03/01/19 | | | | 3,309,031 | |
| | 3,165,000 | | | | 5.000 | | | | 03/01/20 | | | | 3,672,160 | |
| South Carolina Jobs-Economic Development Authority RB for
Waste Management of South Carolina, Inc. Project Series 2001
(AMT) (A-/NR) |
|
| | 2,500,000 | | | | 1.875 | | | | 11/01/16 | | | | 2,525,400 | |
| | |
| | State-Specific Municipal Debt Obligations – (continued) | |
| | South Carolina – (continued) | |
| Spartanburg County South Carolina School District No. 1 GO
Bonds Refunding Series 2014 D (SCSDE) (AA/Aa1) |
|
| $ | 1,310,000 | | | | 5.000 | % | | | 03/01/18 | | | $ | 1,436,860 | |
| | | | | | | | | | | | | | |
| | | | | | | | | | | | | 56,860,167 | |
| | |
| | Tennessee – 0.0% | |
| Harpeth Valley Utilities District of Davidson and Williamson
Counties RB Utilities Improvement Series 1998 (NATL-RE)
(AA-/Aa3) |
|
| | 1,710,000 | | | | 5.250 | | | | 09/01/17 | | | | 1,813,660 | |
| | |
| | Texas – 8.3% | |
| Austin Texas Water and Wastewater System RB Refunding
Series 2014 (AA/Aa2) |
|
| | 1,675,000 | | | | 5.000 | | | | 11/15/19 | | | | 1,929,550 | |
| Central Texas Regional Mobility Authority RB Refunding Senior
Lien Series 2013 B (BBB/Baa2)(b) |
|
| | 4,000,000 | | | | 3.000 | | | | 01/04/16 | | | | 4,006,280 | |
| City of Arlington for Permanent Improvement Bonds
Series 2015 A (AAA/Aa1) |
|
| | 1,075,000 | | | | 2.500 | | | | 08/15/18 | | | | 1,122,848 | |
| | 725,000 | | | | 3.000 | | | | 08/15/19 | | | | 774,373 | |
| City of Carrollton Texas GO Refunding Bonds Series 2012
(AAA/Aa1) |
|
| | 2,005,000 | | | | 4.000 | | | | 08/15/19 | | | | 2,215,385 | |
| City of El Paso Water and Sewer RB Refunding for Improvement
Series 2012 A (AA+/NR) |
|
| | 1,750,000 | | | | 2.000 | | | | 03/01/18 | | | | 1,800,348 | |
| | 845,000 | | | | 4.000 | | | | 03/01/19 | | | | 927,869 | |
| City of Lewisville Texas Combination Contract & Special
Assessment RB Refunding for Lewisville Castle Hills Public
Improvement District No. 3 Project Series 2015 (AGM)
(AA/NR) |
|
| | 1,125,000 | | | | 2.000 | | | | 09/01/16 | | | | 1,138,792 | |
| | 300,000 | | | | 3.000 | | | | 09/01/17 | | | | 311,064 | |
| | 250,000 | | | | 3.000 | | | | 09/01/18 | | | | 261,058 | |
| | 375,000 | | | | 3.000 | | | | 09/01/19 | | | | 393,199 | |
| Collin & Denton County Texas GO Bonds Refunding Series 2011
(AA+/Aa1) |
|
| | 3,335,000 | | | | 5.000 | | | | 02/15/16 | | | | 3,393,863 | |
| Cypress-Fairbanks Independent School District Unlimited Tax
GO Bonds Refunding for School Building Series 2014 C
(PSF-GTD) (AAA/Aaa) |
|
| | 5,455,000 | | | | 4.000 | | | | 02/15/19 | | | | 5,992,645 | |
| Dallas County Limited Tax GO Notes Series 2011 (AAA/Aaa) | |
| | 3,855,000 | | | | 5.000 | | | | 02/15/18 | | | | 4,235,758 | |
| Dallas-Fort Worth International Airport Joint RB Refunding
Series 2011 D (A+/A2) |
|
| | 750,000 | | | | 4.000 | | | | 11/01/16 | | | | 778,035 | |
| | 250,000 | | | | 4.000 | | | | 11/01/17 | | | | 266,620 | |
| Dallas-Fort Worth International Airport Joint RB Refunding
Series 2012 B (A+/A2) |
|
| | 1,750,000 | | | | 5.000 | | | | 11/01/18 | | | | 1,958,985 | |
| Fort Worth Texas GO Bonds Refunding and Improvement
Series 2012 (AA+/Aa1) |
|
| | 2,000,000 | | | | 4.000 | | | | 03/01/19 | | | | 2,194,040 | |
| | |
| | |
| The accompanying notes are an integral part of these financial statements. | | 67 |
GOLDMAN SACHS SHORT DURATION TAX-FREE FUND
Schedule of Investments (continued)
September 30, 2015 (Unaudited)
| | | | | | | | | | | | | | |
Principal
Amount | | | Interest
Rate | | | Maturity
Date | | | Value | |
| | State-Specific Municipal Debt Obligations – (continued) | |
| | Texas – (continued) | |
| Garland Independent School District Unlimited Tax Refunding
Bonds Series 2011 A (PSF-GTD) (AAA/Aaa)(d) |
|
| $ | 1,930,000 | | | | 0.000 | % | | | 02/15/17 | | | $ | 1,913,035 | |
| Garland Independent School District Unlimited Tax Refunding
Bonds Series 2015 A (PSF-GTD) (AAA/Aaa) |
|
| | 6,640,000 | | | | 2.000 | | | | 02/15/18 | | | | 6,821,272 | |
| | 4,710,000 | | | | 3.000 | | | | 02/15/19 | | | | 5,009,273 | |
| Harris County Texas Spring Independent School District
Unlimited Tax Refunding Bonds Series 2011 (PSF-GTD)
(AAA/Aaa) |
|
| | 3,040,000 | | | | 3.000 | | | | 08/15/16 | | | | 3,112,656 | |
| | 2,250,000 | | | | 4.000 | | | | 08/15/17 | | | | 2,390,490 | |
| Houston Airport System RB Subordinate Lien Series 2002 C
(AMT) (XLCA) (A/A1)(a) |
|
| | 16,775,000 | | | | 0.388 | | | | 10/01/15 | | | | 15,488,794 | |
| Houston Airport System RB Subordinate Lien Series 2002 D-2
(AMT) (XLCA) (A/A1)(a) |
|
| | 20,325,000 | | | | 0.389 | | | | 10/05/15 | | | | 18,818,016 | |
| Houston Independent School District GO Bonds Refunding
Series 2012 (PSF-GTD) (AAA/Aaa)(b) |
|
| | 16,000,000 | | | | 0.875 | | | | 06/01/16 | | | | 16,035,040 | |
| Houston Independent School District Limited Tax GO Bonds
Refunding Series 2014 B (PSF-GTD) (AAA/Aaa) |
|
| | 10,000,000 | | | | 5.000 | | | | 02/15/18 | | | | 10,982,800 | |
| | 12,000,000 | | | | 5.000 | | | | 02/15/19 | | | | 13,573,920 | |
| Houston Utilities System RB Refunding First Lien Series 2012 C
(AA/NR)(b) |
|
| | 8,000,000 | | | | 0.620 | | | | 08/01/16 | | | | 8,000,240 | |
| Leander Independent School District Unlimited Tax GO Bonds
Refunding Series 2015 A (PSF-GTD) (AAA/NR)(d) |
|
| | 2,000,000 | | | | 0.000 | | | | 08/15/19 | | | | 1,905,320 | |
| | 1,500,000 | | | | 0.000 | | | | 08/15/20 | | | | 1,388,850 | |
| Lubbock Health Facilities Development Corp. RB for St. Joseph
Health System Series 2008 B (AA-/A1) |
|
| | 3,300,000 | | | | 5.000 | | | | 07/01/17 | | | | 3,541,197 | |
| Mansfield Independent School District GO Bonds Series 2012
(PSF-GTD) (AAA/Aaa)(b) |
|
| | 7,315,000 | | | | 1.750 | | | | 08/01/17 | | | | 7,432,406 | |
| Mission Economic Development Corp. Solid Waste Disposal RB
for Waste Management, Inc. Project RMKT 06/01/15
Series 2006 (A-/NR) |
|
| | 5,000,000 | | | | 1.800 | | | | 12/01/18 | | | | 5,016,800 | |
| New Hope Cultural Education Facilities Finance Corp. Student
Housing RB for Station I, LLC – Texas A&M University
Collegiate Housing Project Series 2014 A (AGM) (AA/A2) |
|
| | 200,000 | | | | 4.000 | | | | 04/01/17 | | | | 208,330 | |
| | 170,000 | | | | 4.000 | | | | 04/01/20 | | | | 183,615 | |
| | 400,000 | | | | 4.000 | | | | 04/01/21 | | | | 432,300 | |
| North Texas Tollway Authority RB Refunding for First Tier
Series 2008 A (NATL-RE-IBC) (AA-/A1) |
|
| | 4,470,000 | | | | 6.000 | | | | 01/01/19 | | | | 4,939,350 | |
| North Texas Tollway Authority RB Refunding for First Tier
Series 2012 C (A/A1)(b) |
|
| | 18,000,000 | | | | 1.950 | | | | 01/01/19 | | | | 18,232,020 | |
| | |
| | State-Specific Municipal Debt Obligations – (continued) | |
| | Texas – (continued) | |
| North Texas Tollway Authority System RB Refunding First Tier
Series 2008 E-3 (A/A1)(b) |
|
| $ | 5,445,000 | | | | 5.750 | % | | | 01/01/16 | | | $ | 5,518,725 | |
| North Texas Tollway Authority System RB Refunding First Tier
Series 2011 B (A/A1) |
|
| | 3,000,000 | | | | 5.000 | | | | 01/01/19 | | | | 3,370,200 | |
| North Texas Tollway Authority System RB Refunding First Tier
Series 2014 A (A/A1) |
|
| | 2,000,000 | | | | 5.000 | | | | 01/01/20 | | | | 2,291,720 | |
| North Texas Tollway Authority System RB Refunding First Tier
Series 2014 C (A/A1)(b) |
|
| | 5,000,000 | | | | 0.690 | | | | 01/01/20 | | | | 4,941,900 | |
| North Texas Tollway Authority System RB Refunding for Second
Tier Series 2015 A (A-/A2) |
|
| | 1,070,000 | | | | 4.000 | | | | 01/01/18 | | | | 1,140,877 | |
| | 1,000,000 | | | | 5.000 | | | | 01/01/19 | | | | 1,116,280 | |
| Northside Texas Independent School District GO Bonds for
School Building Series 2010 (PSF-GTD) (AAA/Aaa)(b) |
|
| | 5,760,000 | | | | 1.200 | | | | 08/01/17 | | | | 5,795,309 | |
| Northside Texas Independent School District GO Bonds for
School Building Series 2012 (PSF-GTD) (AAA/Aaa)(b) |
|
| | 8,000,000 | | | | 1.000 | | | | 05/31/16 | | | | 8,025,600 | |
| Sam Rayburn Municipal Power Agency RB Refunding
Series 2012 (BBB+/NR) |
|
| | 1,755,000 | | | | 5.000 | | | | 10/01/15 | | | | 1,755,000 | |
| | 2,315,000 | | | | 5.000 | | | | 10/01/19 | | | | 2,610,325 | |
| San Antonio Electric and Gas Systems Junior Lien RB Refunding
Series 2012 A (AA-/NR)(b) |
|
| | 5,000,000 | | | | 2.000 | | | | 12/01/18 | | | | 5,114,100 | |
| San Antonio Electric and Gas Systems Junior Lien RB Refunding
Series 2012 C (AA-/Aa2)(b) |
|
| | 7,000,000 | | | | 2.000 | | | | 12/01/16 | | | | 7,108,570 | |
| San Antonio Independent School District Unlimited Tax
Refunding Bonds Series 2014 A (PSF-GTD) (AAA/Aaa)(b) |
|
| | 8,865,000 | | | | 2.000 | | | | 08/01/17 | | | | 9,047,264 | |
| San Antonio Independent School District Unlimited Tax
Refunding Bonds Series 2014 B (PSF-GTD) (AAA/Aaa)(b) |
|
| | 9,850,000 | | | | 2.000 | | | | 08/01/18 | | | | 10,056,948 | |
| Texas A&M University Financing System RB Refunding for
Board of Regents Series 2015 A (AA+/Aaa) |
|
| | 2,250,000 | | | | 5.000 | | | | 05/15/18 | | | | 2,494,935 | |
| Texas A&M University Financing System RB Refunding for
Board of Regents Series 2015 B (AA+/Aaa) |
|
| | 2,650,000 | | | | 5.000 | | | | 05/15/18 | | | | 2,938,479 | |
| Texas Municipal Gas Acquisition & Supply Corp. III RB
Series 2012 D (BBB/A3) |
|
| | 2,200,000 | | | | 5.000 | | | | 12/15/15 | | | | 2,218,656 | |
| | 3,000,000 | | | | 5.000 | | | | 12/15/16 | | | | 3,146,880 | |
| | 5,000,000 | | | | 5.000 | | | | 12/15/17 | | | | 5,400,000 | |
| | 4,500,000 | | | | 5.000 | | | | 12/15/18 | | | | 4,962,690 | |
| Texas Municipal Gas Acquisition & Supply Corp. RB for Senior
Lien Series 2008 D (A-/Baa1) |
|
| | 8,845,000 | | | | 5.625 | | | | 12/15/17 | | | | 9,300,075 | |
| Texas Private Activity Bond Surface Transportation Corp. RB
Senior Lien for Mobility Partners LLC Series 2009
(BBB-/Baa2) |
|
| | 7,800,000 | | | | 6.875 | | | | 12/31/39 | | | | 9,122,958 | |
| | |
| | |
| 68 | | The accompanying notes are an integral part of these financial statements. |
GOLDMAN SACHS SHORT DURATION TAX-FREE FUND
| | | | | | | | | | | | | | |
Principal
Amount | | | Interest
Rate | | | Maturity
Date | | | Value | |
| | State-Specific Municipal Debt Obligations – (continued) | |
| | Texas – (continued) | |
| Texas State Public Finance Authority Unemployment
Compensation Obligation Assessment RB Series 2010 A
(AAA/Aaa)(c) |
|
| $ | 7,355,000 | | | | 5.000 | % | | | 01/01/16 | | | $ | 7,441,421 | |
| Texas Transportation Commission Central Turnpike System RB
Refunding Series 2015 A (A-/A3)(b) |
|
| | 5,000,000 | | | | 5.000 | | | | 04/01/20 | | | | 5,691,650 | |
| Texas Transportation Commission Highway Improvement GO
Bonds Series 2014 (AAA/Aaa) |
|
| | 20,000,000 | | | | 5.000 | | | | 04/01/19 | | | | 22,714,200 | |
| Texas Transportation Commission State Highway Fund First Tier
RB Refunding Series 2014 A (AAA/Aaa) |
|
| | 14,625,000 | | | | 5.000 | | | | 04/01/18 | | | | 16,139,565 | |
| | | | | | | | | | | | | | |
| | | | | | | | | | | | | 338,590,763 | |
| | |
| | U.S. Virgin Islands – 0.3% | |
| Virgin Islands Public Finance Authority RB Refunding for Virgin
Islands Gross Receipts Taxes Loan Note Series 2012 A
(BBB+/NR) |
|
| | 12,515,000 | | | | 2.250 | | | | 10/01/17 | | | | 12,571,693 | |
| | |
| | Utah – 0.4% | |
| Board of Education of Alpine School District GO Refunding
Bonds for Utah SCH BD GTY Program Series 2015 (SCH BD
GTY) (NR/Aaa) |
|
| | 11,550,000 | | | | 5.000 | | | | 03/15/19 | | | | 13,144,015 | |
| Utah Associated Municipal Power Systems RB for Horse Butte
Wind Project Series 2012 A (A-/NR) |
|
| | 750,000 | | | | 5.000 | | | | 09/01/16 | | | | 780,450 | |
| | 500,000 | | | | 5.000 | | | | 09/01/17 | | | | 539,430 | |
| | 500,000 | | | | 5.000 | | | | 09/01/18 | | | | 553,785 | |
| | 500,000 | | | | 5.000 | | | | 09/01/19 | | | | 567,155 | |
| | | | | | | | | | | | | | |
| | | | | | | | | | | | | 15,584,835 | |
| | |
| | Vermont – 0.1% | |
| Vermont Educational & Health Buildings Financing Agency RB
Refunding for St. Michael’s College Project Series 2012
(A-/Baa1) |
|
| | 1,250,000 | | | | 3.000 | | | | 10/01/15 | | | | 1,250,000 | |
| | 1,420,000 | | | | 4.000 | | | | 10/01/16 | | | | 1,452,319 | |
| | 1,680,000 | | | | 4.000 | | | | 10/01/17 | | | | 1,751,215 | |
| | | | | | | | | | | | | | |
| | | | | | | | | | | | | 4,453,534 | |
| | |
| | Virginia – 2.4% | |
| Virginia Commonwealth Transportation Board RB Refunding for
Northern Virginia Transportation District Program
Series 2014 A (AA+/Aa1) |
|
| | 8,375,000 | | | | 5.000 | | | | 05/15/19 | | | | 9,534,519 | |
| Virginia Commonwealth Transportation Board RB Refunding for
U.S. Route 58 Corridor Development Program Series 2014 B
(AA+/Aa1) |
|
| | 20,650,000 | | | | 5.000 | | | | 05/15/19 | | | | 23,508,992 | |
| | 11,680,000 | | | | 5.000 | | | | 05/15/20 | | | | 13,590,848 | |
| Virginia Electric and Power Company Industrial Development
Authority of Wise County RB for Solid Waste and Sewage
Disposal RMKT 08/13/15 Series 2009 A (A-/A2)(b) |
|
| | 6,000,000 | | | | 2.150 | | | | 09/01/20 | | | | 6,069,900 | |
| | |
| | State-Specific Municipal Debt Obligations – (continued) | |
| | Virginia – (continued) | |
| Virginia State Housing Development Authority Homeownership
Mortgage RB Series 2011 B (GO OF AUTH) (AA+/Aa1) |
|
| $ | 1,900,000 | | | | 2.200 | % | | | 03/01/17 | | | $ | 1,937,107 | |
| Virginia State Public Building Authority RB Refunding for Public
Facilities Series 2014 C (AA+/Aa1) |
|
| | 5,325,000 | | | | 5.000 | | | | 08/01/18 | | | | 5,931,997 | |
| Virginia State Public School Authority RB Refunding for School
Financing Series 2015 A (ST AID WITHHLDG) (AA+/Aa1) |
|
| | 26,140,000 | | | | 4.000 | | | | 08/01/19 | | | | 28,886,791 | |
| Wise County Virginia IDA Solid Waste and Sewage Disposal RB
for Virginia Electric and Power Company Project
Series 2010 A (A-/A2)(b) |
|
| | 5,000,000 | | | | 2.375 | | | | 11/01/15 | | | | 5,007,500 | |
| York County Economic Development Authority Electricity and
Power RB Refunding Series 2009 A (A-/A2)(b) |
|
| | 2,000,000 | | | | 1.875 | | | | 05/16/19 | | | | 2,025,560 | |
| | | | | | | | | | | | | | |
| | | | | | | | | | | | | 96,493,214 | |
| | |
| | Washington – 1.7% | |
| City of Spokane Washington Water and Wastewater System RB
Series 2014 (AA/Aa2) |
|
| | 2,805,000 | | | | 5.000 | | | | 12/01/18 | | | | 3,155,429 | |
| Washington State COPS for State and Local Agency Real and
Personal Property Series 2014 B (NR/Aa2) |
|
| | 3,020,000 | | | | 5.000 | | | | 07/01/19 | | | | 3,431,173 | |
| Washington State COPS for State and Local Agency Real and
Personal Property Series 2015 B (NR/Aa2) |
|
| | 5,745,000 | | | | 5.000 | | | | 01/01/20 | | | | 6,603,418 | |
| Washington State Motor Vehicle Fuel Tax GO Bonds Refunding
Series 2015 R-F (AA+/Aa1) |
|
| | 6,770,000 | | | | 5.000 | | | | 07/01/19 | | | | 7,737,094 | |
| Washington State Various Purpose GO Bonds Refunding
Series 2013 R-C (AA+/Aa1) |
|
| | 27,125,000 | | | | 3.000 | | | | 07/01/16 | | | | 27,681,334 | |
| Washington State Various Purpose GO Bonds Series 2008 C
(AA+/Aa1)(c) |
|
| | 18,795,000 | | | | 5.000 | | | | 01/01/18 | | | | 20,617,927 | |
| | | | | | | | | | | | | | |
| | | | | | | | | | | | | 69,226,375 | |
| | |
| | West Virginia – 0.5% | |
| Kanawha Putnam County Huntington Compound RB for Single
Family Mortgage Series 1984 A (ETM) (NR/Aaa)(c)(d) |
|
| | 10,125,000 | | | | 0.000 | | | | 12/01/16 | | | | 10,069,110 | |
| Mason County Pollution Control RB for Appalachian Power Co.
Project Series 2003 L (BBB/Baa1)(b) |
|
| | 3,000,000 | | | | 1.625 | | | | 10/01/18 | | | | 2,987,400 | |
| Monongalia County Board of Education Public School RB
Refunding Bonds Series 2012 (AA/NR) |
|
| | 1,520,000 | | | | 5.000 | | | | 05/01/18 | | | | 1,672,365 | |
| Princeton West Virginia Hospitals RB Refunding Princeton
Community Hospital Project Series 2012 A (BBB+/NR) |
|
| | 500,000 | | | | 5.000 | | | | 05/01/17 | | | | 528,935 | |
| | 1,445,000 | | | | 5.000 | | | | 05/01/18 | | | | 1,569,067 | |
| | 1,565,000 | | | | 5.000 | | | | 05/01/19 | | | | 1,730,624 | |
| | | | | | | | | | | | | | |
| | | | | | | | | | | | | 18,557,501 | |
| | |
| | |
| The accompanying notes are an integral part of these financial statements. | | 69 |
GOLDMAN SACHS SHORT DURATION TAX-FREE FUND
Schedule of Investments (continued)
September 30, 2015 (Unaudited)
| | | | | | | | | | | | | | |
Principal
Amount | | | Interest
Rate | | | Maturity
Date | | | Value | |
| | State-Specific Municipal Debt Obligations – (continued) | |
| | Wisconsin – 0.1% | |
| Milwaukee Wisconsin GO Bonds Series 2010 N-1 (AA/Aa3) | |
| $ | 4,050,000 | | | | 5.000 | % | | | 02/01/16 | | | $ | 4,112,856 | |
| | |
| | TOTAL INVESTMENTS – 98.9% | | | | | |
| | (Cost $4,031,440,728) | | | $ | 4,015,869,036 | |
| | |
| OTHER ASSETS IN EXCESS OF
LIABILITIES – 1.1% |
| | | 42,696,506 | |
| | |
| | NET ASSETS – 100.0% | | | $ | 4,058,565,542 | |
| | |
| | |
| The percentage shown for each investment category reflects the value of investments in that category as a percentage of net assets. |
(a) | | Variable rate security. Except for floating rate notes (for which final maturity is disclosed), maturity date disclosed is the next interest reset date. Interest rate or distribution rate disclosed is that which is in effect on September 30, 2015. |
(b) | | Security with “Put” features and resetting interest rates. Maturity dates disclosed are the puttable dates. Interest rate disclosed is that which is in effect on September 30, 2015. |
(c) | | Pre-refunded security. Maturity date disclosed is pre-refunding date. |
(d) | | Issued with a zero coupon. Income is recognized through the accretion of discount. |
(e) | | Exempt from registration under Rule 144A of the Securities Act of 1933. Under procedures approved by the Board of Trustees, such securities have been determined to be liquid by the Investment Adviser and may be resold, normally to qualified institutional buyers in transactions exempt from registration. Total market value of Rule 144A securities amounts to $41,646,349, which represents approximately 1.0% of net assets as of September 30, 2015. |
(f) | | When-issued security. |
(g) | | Security is currently in default. |
Security ratings disclosed, if any, are issued by either Standard & Poor’s, Moody’s Investor Service or Fitch and are unaudited. A brief description of the ratings is available in the Fund’s Statement of Additional Information.
| | |
|
Investment Abbreviations: |
AGC-ICC | | — Agency Insured Custody Certificate |
AGM | | — Insured by Assured Guaranty Municipal Corp. |
AMBAC | | — Insured by American Municipal Bond Assurance Corp. |
AMT | | — Alternative Minimum Tax |
BANS | | — Bond Anticipation Notes |
BHAC-CR | | — Insured by Berkshire Hathaway Assurance Corp. – Insured Custodial Receipts |
CNTY GTD | | — County Guaranteed |
COMWLTH GTD | | — Commonwealth Guaranteed |
COPS | | — Certificates of Participation |
ETM | | — Escrowed to Maturity |
FGIC | | — Insured by Financial Guaranty Insurance Co. |
GO | | — General Obligation |
GO OF AUTH | | — General Obligation of Authority |
GO OF UNIV | | — General Obligation of University |
IDA | | — Industrial Development Authority |
MUN GOVT GTD | | — Municipal Government Guaranteed |
NATL-RE | | — Insured by National Public Finance Guarantee Corp. |
NATL-RE FGIC | | — Insured by National Public Finance Guarantee Corp., which reinsures Financial Guaranty Insurance Co. |
NATL-RE-IBC | | — Insured by National Public Finance Guarantee Corp. – Insured Bond Certificates |
NR | | — Not Rated |
PCRB | | — Pollution Control Revenue Bond |
PSF-GTD | | — Guaranteed by Permanent School Fund |
Q-SBLF | | — Qualified School Board Loan Fund |
RB | | — Revenue Bond |
RMKT | | — Remarketed |
SCH BD GTY | | — School Bond Guaranty |
SCH BD RES FD | | — School Bond Reserve Fund |
SCSDE | | — South Carolina State Department of Education |
SD CRED PROG | | — School District Credit Program |
ST AID WITHHLDG | | — State Aid Withholding |
WR | | — Withdrawn Rating |
XLCA | | — Insured by XL Capital Assurance, Inc. |
|
| | |
| 70 | | The accompanying notes are an integral part of these financial statements. |
GOLDMAN SACHS SHORT DURATION TAX-FREE FUND
|
| ADDITIONAL INVESTMENT INFORMATION |
SWAP CONTRACTS — At September 30, 2015, the Fund had the following swap contracts:
OVER THE COUNTER CREDIT DEFAULT SWAP CONTRACTS
| | | | | | | | | | | | | | | | | | | | | | | | | | |
| | | | | | | | | | | | | | | | | Market Value | |
| Counterparty | | Referenced
Obligation | | Notional
Amount
(000’s) | | | Rates Received
(Paid) | | | Termination
Date | | | Credit
Spread on
September 30,
2015(a) | | | Upfront
Payments
Made (Received) | | | Unrealized
Gain (Loss) | |
Protection Sold: | | | | | | | | | | | | | | | | | | | | | | | | | | |
Bank of America, N.A. | | California State Various Purpose GO Bonds Series 2003, 5.250%, 02/01/18 | | $ | 5,000 | | | | 1.000 | % | | | 03/20/23 | | | | 1.021 | % | | $ | (5 | ) | | $ | (3,718 | ) |
JPMorgan Chase Bank, N.A. | | California State Various Purpose GO Bonds Series 2003, 5.250%, 02/01/18 | | | 10,000 | | | | 1.000 | | | | 03/20/23 | | | | 1.021 | | | | (370,700 | ) | | | 363,255 | |
| TOTAL | | | | | | | | | | | | | | | | | | | | $ | (370,705 | ) | | $ | 359,537 | |
| | (a) | | Credit spread on the Referenced Obligation, together with the period of expiration, are indicators of payment/performance risk. The likelihood of a credit event occurring which would require a fund to make a payment or otherwise be required to perform under the swap contract is generally greater as the credit spread and term of the swap contract increase. |
| | |
| The accompanying notes are an integral part of these financial statements. | | 71 |
GOLDMAN SACHS MUNICIPAL FIXED INCOME FUNDS
Statements of Assets and Liabilities
September 30, 2015 (Unaudited)
| | | | | | | | | | | | | | |
| | | | | Dynamic Municipal Income Fund | | | High Yield Municipal Fund | | | Short Duration Tax-Free Fund | |
| | Assets: | | | | | | | | | | | | |
| | Investments in unaffiliated issuers, at value (cost $576,903,337, $3,200,444,850 and $4,031,440,728) | | $ | 597,410,821 | | | $ | 3,282,063,537 | | | $ | 4,015,869,036 | |
| | Investments in affiliated issuers, at value (cost $4,544,566, $0 and $0) | | | 4,544,566 | | | | — | | | | — | |
| | Cash | | | — | | | | 5,828,403 | | | | 18,356,856 | |
| | Receivables: | | | | | | | | | | | | |
| | Interest and dividends | | | 7,849,095 | | | | 48,749,674 | | | | 35,390,369 | |
| | Fund shares sold | | | 3,123,254 | | | | 6,483,391 | | | | 7,603,801 | |
| | Collateral on certain derivative contracts(a) | | | 2,493,378 | | | | 20,719,036 | | | | — | |
| | Reimbursement from investment adviser | | | 22,105 | | | | 27,217 | | | | 64,979 | |
| | Investments sold | | | — | | | | 6,772,750 | | | | 9,317,348 | |
| | Due from custodian | | | — | | | | 4,089,586 | | | | — | |
| | Unrealized gain on swap contracts | | | 72,651 | | | | 1,609,968 | | | | 363,255 | |
| | Variation margin on certain derivative contracts | | | 33,060 | | | | 403,421 | | | | — | |
| | Other assets | | | 600 | | | | 3,696 | | | | 5,044 | |
| | Total assets | | | 615,549,530 | | | | 3,376,750,679 | | | | 4,086,970,688 | |
| | | | | | | | | | | | | | |
| | Liabilities: | | | | | | | | | | | | |
| | Unrealized loss on swap contracts | | | — | | | | 726,452 | | | | 3,718 | |
| | Payables: | | | | | | | | | | | | |
| | Fund shares redeemed | | | 1,477,671 | | | | 11,855,207 | | | | 17,075,136 | |
| | Management fees | | | 199,499 | | | | 1,456,790 | | | | 1,157,401 | |
| | Income distribution | | | 197,802 | | | | 375,211 | | | | 148,225 | |
| | Due to custodian | | | 122,650 | | | | — | | | | — | |
| | Distribution and Service fees and Transfer Agency fees | | | 84,006 | | | | 232,797 | | | | 199,660 | |
| | Upfront payments received on swap contracts | | | 74,140 | | | | 1,902,655 | | | | 370,705 | |
| | Investments purchased | | | — | | | | 7,508,164 | | | | — | |
| | Investments purchased on an extended-settlement basis | | | — | | | | — | | | | 9,299,875 | |
| | Collateral on certain derivative contracts | | | — | | | | — | | | | 20,000 | |
| | Accrued expenses | | | 106,054 | | | | 160,678 | | | | 130,426 | |
| | Total liabilities | | | 2,261,822 | | | | 24,217,954 | | | | 28,405,146 | |
| | | | | | | | | | | | | | |
| | Net Assets: | | | | | | | | | | | | |
| | Paid-in capital | | | 620,378,990 | | | | 4,654,164,149 | | | | 4,062,762,749 | |
| | Undistributed net investment income | | | 8,067,799 | | | | 100,246,539 | | | | 10,691,752 | |
| | Accumulated net realized gain (loss) | | | (34,913,997 | ) | | | (1,478,635,137 | ) | | | 323,196 | |
| | Net unrealized gain (loss) | | | 19,754,916 | | | | 76,757,174 | | | | (15,212,155 | ) |
| | | NET ASSETS | | $ | 613,287,708 | | | $ | 3,352,532,725 | | | $ | 4,058,565,542 | |
| | | Net Assets: | | | | | | | | | | | | |
| | | Class A | | $ | 152,672,471 | | | $ | 254,058,344 | | | $ | 158,772,022 | |
| | | Class C | | | 24,358,318 | | | | 72,303,162 | | | | 31,072,574 | |
| | | Institutional | | | 428,881,078 | | | | 3,008,734,332 | | | | 3,865,188,662 | |
| | | Service | | | 38,481 | | | | — | | | | 160,570 | |
| | | Class IR | | | 7,337,360 | | | | 17,436,887 | | | | 3,371,714 | |
| | | Total Net Assets | | $ | 613,287,708 | | | $ | 3,352,532,725 | | | $ | 4,058,565,542 | |
| | | Shares outstanding $0.001 par value (unlimited shares authorized): | | | | | | | | | | | | |
| | | Class A | | | 9,850,585 | | | | 27,787,818 | | | | 15,071,471 | |
| | | Class C | | | 1,571,110 | | | | 7,908,417 | | | | 2,952,514 | |
| | | Institutional | | | 27,679,365 | | | | 329,038,136 | | | | 367,402,110 | |
| | | Service | | | 2,471 | | | | — | | | | 15,264 | |
| | | Class IR | | | 474,093 | | | | 1,905,767 | | | | 320,426 | |
| | | Net asset value, offering and redemption price per share:(b) | | | | | | | | | | | | |
| | | Class A | | | $15.50 | | | | $9.14 | | | | $10.53 | |
| | | Class C | | | 15.50 | | | | 9.14 | | | | 10.52 | |
| | | Institutional | | | 15.49 | | | | 9.14 | | | | 10.52 | |
| | | Service | | | 15.58 | | | | — | | | | 10.52 | |
| | | Class IR | | | 15.48 | | | | 9.15 | | | | 10.52 | |
| | (a) | | Includes amounts segregated for initial margin on swap transactions of $2,493,378 & $20,679,036 for Dynamic Municipal Income and High Yield Municipal Funds respectively. |
| | (b) | | Maximum public offering price per share for Class A Shares of the Dynamic Municipal Income, High Yield Municipal and Short Duration Tax-Free Funds is $16.10, $9.57 and $10.69, respectively. At redemption, Class C Shares may be subject to a contingent deferred sales charge assessed on the amount equal to the lesser of the current net asset value (“NAV”) or the original purchase price of the shares. |
| | |
| 72 | | The accompanying notes are an integral part of these financial statements. |
GOLDMAN SACHS MUNICIPAL FIXED INCOME FUNDS
Statements of Operations
For the Six Months Ended September 30, 2015 (Unaudited)
| | | | | | | | | | | | | | |
| | | | | Dynamic Municipal Income Fund | | | High Yield
Municipal Fund | | | Short Duration
Tax-Free Fund | |
| | Investment income: | |
| | Interest | | $ | 13,531,953 | | | $ | 97,909,414 | | | $ | 34,417,442 | |
| | Dividends — affiliated issuers | | | 313 | | | | — | | | | — | |
| | Total investment income | | | 13,532,266 | | | | 97,909,414 | | | | 34,417,442 | |
| | | | | | | | | | | | | | |
| | Expenses: | |
| | Management fees | | | 1,672,357 | | | | 8,917,794 | | | | 7,546,359 | |
| | Distribution and Service fees(a) | | | 327,683 | | | | 703,691 | | | | 379,855 | |
| | Transfer Agency fees(a) | | | 211,033 | | | | 831,705 | | | | 934,064 | |
| | Professional fees | | | 96,646 | | | | 75,712 | | | | 67,926 | |
| | Custody, accounting and administrative services | | | 34,839 | | | | 105,144 | | | | 121,258 | |
| | Printing and mailing costs | | | 26,336 | | | | 35,033 | | | | 29,328 | |
| | Registration fees | | | 8,273 | | | | 38,591 | | | | 40,033 | |
| | Trustee fees | | | 7,628 | | | | 10,137 | | | | 11,225 | |
| | Service share fees — Service Plan | | | 48 | | | | — | | | | 173 | |
| | Service share fees — Shareholder Administration Plan | | | 48 | | | | — | | | | 173 | |
| | Other | | | 21,094 | | | | 13,785 | | | | 69,564 | |
| | Total expenses | | | 2,405,985 | | | | 10,731,592 | | | | 9,199,958 | |
| | Less — expense reductions | | | (645,210 | ) | | | (311,821 | ) | | | (635,371 | ) |
| | Net expenses | | | 1,760,775 | | | | 10,419,771 | | | | 8,564,587 | |
| | NET INVESTMENT INCOME | | | 11,771,491 | | | | 87,489,643 | | | | 25,852,855 | |
| | | | | | | | | | | | | | |
| | Realized and unrealized gain (loss): | |
| | Net realized gain from: | | | | | | | | | | | | |
| | Investments | | | 1,432,020 | | | | 576,797 | | | | 1,750,068 | |
| | Swap contracts | | | 9,720 | | | | 2,084,593 | | | | 101,959 | |
| | Net change in unrealized gain (loss) on: | | | | | | | | | | | | |
| | Investments | | | (14,237,781 | ) | | | (80,035,028 | ) | | | (27,010,690 | ) |
| | Swap contracts | | | (196,832 | ) | | | 649,794 | | | | (91,036 | ) |
| | Net realized and unrealized loss | | | (12,992,873 | ) | | | (76,723,844 | ) | | | (25,249,699 | ) |
| | NET INCREASE (DECREASE) IN NET ASSETS RESULTING FROM OPERATIONS | | $ | (1,221,382 | ) | | $ | 10,765,799 | | | $ | 603,156 | |
| | (a) | | Class specific Distribution and Service, and Transfer Agency fees were as follows: |
| | | | | | | | | | | | | | | | | | | | | | | | | | | | |
| | | Distributions and Services Fees | | | Transfer Agency Fees | |
Fund | | Class A | | | Class C | | | Class A | | | Class C | | | Institutional | | | Service | | | Class IR | |
Dynamic Municipal Income | | $ | 210,926 | | | $ | 116,757 | | | $ | 109,680 | | | $ | 15,178 | | | $ | 81,882 | | | $ | 7 | | | $ | 4,286 | |
High Yield Municipal | | | 323,054 | | | | 380,637 | | | | 167,986 | | | | 49,482 | | | | 602,925 | | | | — | | | | 11,312 | |
Short Duration Tax-Free | | | 213,553 | | | | 166,302 | | | | 111,046 | | | | 21,619 | | | | 799,069 | | | | 29 | | | | 2,301 | |
| | |
| The accompanying notes are an integral part of these financial statements. | | 73 |
GOLDMAN SACHS MUNICIPAL FIXED INCOME FUNDS
Statements of Changes in Net Assets
| | | | | | | | | | |
| | | | | Dynamic Municipal Income Fund | |
| | | | | For the
Six Months Ended
September 30, 2015
(Unaudited) | | | For the Fiscal
Year Ended
March 31, 2015 | |
| | From operations: | |
| | Net investment income | | $ | 11,771,491 | | | $ | 20,376,294 | |
| | Net realized gain (loss) | | | 1,441,740 | | | | (2,209,143 | ) |
| | Net change in unrealized gain (loss) | | | (14,434,613 | ) | | | 11,899,680 | |
| | Net increase (decrease) in net assets resulting from operations | | | (1,221,382 | ) | | | 30,066,831 | |
| | | | | | | | | | |
| | Distributions to shareholders: | |
| | From net investment income | | | | | | | | |
| | Class A Shares | | | (2,874,508 | ) | | | (5,709,508 | ) |
| | Class B Shares | | | — | | | | (41,506 | )(a) |
| | Class C Shares | | | (309,612 | ) | | | (580,237 | ) |
| | Institutional Shares | | | (7,672,802 | ) | | | (12,596,543 | ) |
| | Service Shares | | | (626 | ) | | | (1,301 | ) |
| | Class IR Shares | | | (120,084 | ) | | | (128,371 | ) |
| | From net realized gains | | | | | | | | |
| | Class A Shares | | | — | | | | — | |
| | Class C Shares | | | — | | | | — | |
| | Institutional Shares | | | — | | | | — | |
| | Service Shares | | | — | | | | — | |
| | Class IR Shares | | | — | | | | — | |
| | Total distributions to shareholders | | | (10,977,632 | ) | | | (19,057,466 | ) |
| | | | | | | | | | |
| | From share transactions: | |
| | Proceeds from sales of shares | | | 133,428,280 | | | | 177,656,602 | |
| | Reinvestment of distributions | | | 9,686,099 | | | | 16,350,582 | |
| | Cost of shares redeemed | | | (110,917,326 | ) | | | (102,818,626 | ) |
| | Net increase (decrease) in net assets resulting from share transactions | | | 32,197,053 | | | | 91,188,558 | |
| | TOTAL INCREASE (DECREASE) | | | 19,998,039 | | | | 102,197,923 | |
| | | | | | | | | | |
| | Net assets: | |
| | Beginning of period | | | 593,289,669 | | | | 491,091,746 | |
| | End of period | | $ | 613,287,708 | | | $ | 593,289,669 | |
| | Undistributed net investment income | | $ | 8,067,799 | | | $ | 7,273,940 | |
| | (a) | | Class B Shares were converted into Class A Shares at the closed of business on November 14, 2014. |
| | (b) | | Net of $165,129 of redemption fees. |
| | (c) | | Net of $84,427 of redemption fees. |
| | |
| 74 | | The accompanying notes are an integral part of these financial statements. |
GOLDMAN SACHS MUNICIPAL FIXED INCOME FUNDS
| | | | | | | | | | | | | | | | | | | | | | |
| | | High Yield Municipal Fund | | | | | Short Duration Tax-Free Fund | |
| | | For the
Six Months Ended
September 30, 2015
(Unaudited) | | | | | For the Fiscal
Year Ended
March 31, 2015 | | | | | For the
Six Months Ended
September 30, 2015
(Unaudited) | | | | | For the Fiscal
Year Ended
March 31, 2015 | |
| | | | | | | | | | | | | | | | | | | | | | |
| | $ | 87,489,643 | | | | | $ | 162,460,389 | | | | | $ | 25,852,855 | | | | | $ | 51,268,771 | |
| | | 2,661,390 | | | | | | (77,493,586 | ) | | | | | 1,852,027 | | | | | | (1,158,836 | ) |
| | | (79,385,234 | ) | | | | | 203,800,536 | | | | | | (27,101,726 | ) | | | | | 8,941,824 | |
| | | 10,765,799 | | | | | | 288,767,339 | | | | | | 603,156 | | | | | | 59,051,759 | |
| | | | | | | | | | | | | | | | | | | | | | |
| | | | | | | | | | | | | | | | | | | | | | |
| | | | | | | | | | | | | | | | | | | | | | |
| | | (5,999,080 | ) | | | | | (12,086,945 | ) | | | | | (738,047 | ) | | | | | (1,693,417 | ) |
| | | — | | | | | | (101,742 | )(a) | | | | | — | | | | | | — | |
| | | (1,484,371 | ) | | | | | (3,071,346 | ) | | | | | (77,012 | ) | | | | | (157,720 | ) |
| | | (74,288,182 | ) | | | | | (136,519,998 | ) | | | | | (24,015,258 | ) | | | | | (45,580,747 | ) |
| | | — | | | | | | — | | | | | | (489 | ) | | | | | (796 | ) |
| | | (425,084 | ) | | | | | (749,027 | ) | | | | | (19,700 | ) | | | | | (72,853 | ) |
| | | | | | | | | | | | | | | | | | | | | | |
| | | — | | | | | | — | | | | | | — | | | | | | (22,622 | ) |
| | | — | | | | | | — | | | | | | — | | | | | | (4,151 | ) |
| | | — | | | | | | — | | | | | | — | | | | | | (461,964 | ) |
| | | — | | | | | | — | | | | | | — | | | | | | (7 | ) |
| | | — | | | | | | — | | | | | | — | | | | | | (531 | ) |
| | | (82,196,717 | ) | | | | | (152,529,058 | ) | | | | | (24,850,506 | ) | | | | | (47,994,808 | ) |
| | | | | | | | | | | | | | | | | | | | | | |
| | | | | | | | | | | | | | | | | | | | | | |
| | | 317,886,030 | | | | | | 766,858,970 | | | | | | 849,657,653 | | | | | | 2,277,136,118 | |
| | | 79,413,889 | | | | | | 144,776,116 | | | | | | 23,863,977 | | | | | | 44,938,648 | |
| | | (335,174,136 | )(b) | | | | | (618,906,689 | )(c) | | | | | (1,120,194,456 | ) | | | | | (2,033,940,062 | ) |
| | | 62,125,783 | | | | | | 292,728,397 | | | | | | (246,672,826 | ) | | | | | 288,134,704 | |
| | | (9,305,135 | ) | | | | | 428,966,678 | | | | | | (270,920,176 | ) | | | | | 299,191,655 | |
| | | | | | | | | | | | | | | | | | | | | | |
| | | | | | | | | | | | | | | | | | | | | | |
| | | 3,361,837,860 | | | | | | 2,932,871,182 | | | | | | 4,329,485,718 | | | | | | 4,030,294,063 | |
| | $ | 3,352,532,725 | | | | | $ | 3,361,837,860 | | | | | $ | 4,058,565,542 | | | | | $ | 4,329,485,718 | |
| | $ | 100,246,539 | | | | | $ | 94,953,613 | | | | | $ | 10,691,752 | | | | | $ | 9,689,403 | |
| | |
| The accompanying notes are an integral part of these financial statements. | | 75 |
GOLDMAN SACHS DYNAMIC MUNICIPAL INCOME FUND
Financial Highlights
Selected Data for a Share Outstanding Throughout Each Period
| | | | | | | | | | | | | | | | | | | | | | |
| | | | | | | | Income (loss) from
investment operations | | | | |
| | | Year - Share Class | | Net asset
value,
beginning
of period | | | Net
investment
income(a) | | | Net realized
and unrealized
gain (loss) | | | Total from
investment
operations | | | Distributions
to shareholders
from net
investment
income | |
| | FOR THE SIX MONTHS ENDED SEPTEMBER 30, (UNAUDITED) | |
| | 2015 - A | | $ | 15.81 | | | $ | 0.29 | | | $ | (0.33 | ) | | $ | (0.04 | ) | | $ | (0.27 | ) |
| | 2015 - C | | | 15.82 | | | | 0.23 | | | | (0.34 | ) | | | (0.11 | ) | | | (0.21 | ) |
| | 2015 - Institutional | | | 15.81 | | | | 0.31 | | | | (0.34 | ) | | | (0.03 | ) | | | (0.29 | ) |
| | 2015 - Service | | | 15.89 | | | | 0.28 | | | | (0.34 | ) | | | (0.06 | ) | | | (0.25 | ) |
| | 2015 - IR | | | 15.79 | | | | 0.30 | | | | (0.33 | ) | | | (0.03 | ) | | | (0.28 | ) |
| | | | | | | | | | | | | | | | | | | | | | |
| | FOR THE FISCAL YEARS ENDED MARCH 31, | |
| | 2015 - A | | | 15.45 | | | | 0.60 | | | | 0.32 | | | | 0.92 | | | | (0.56 | ) |
| | 2015 - C | | | 15.46 | | | | 0.48 | | | | 0.32 | | | | 0.80 | | | | (0.44 | ) |
| | 2015 - Institutional | | | 15.45 | | | | 0.65 | | | | 0.32 | | | | 0.97 | | | | (0.61 | ) |
| | 2015 - Service | | | 15.53 | | | | 0.58 | | | | 0.32 | | | | 0.90 | | | | (0.54 | ) |
| | 2015 - IR | | | 15.43 | | | | 0.63 | | | | 0.33 | | | | 0.96 | | | | (0.60 | ) |
| | 2014 - A | | | 16.16 | | | | 0.61 | | | | (0.76 | ) | | | (0.15 | ) | | | (0.56 | ) |
| | 2014 - C | | | 16.16 | | | | 0.50 | | | | (0.75 | ) | | | (0.25 | ) | | | (0.45 | ) |
| | 2014 - Institutional | | | 16.16 | | | | 0.67 | | | | (0.76 | ) | | | (0.09 | ) | | | (0.62 | ) |
| | 2014 - Service | | | 16.24 | | | | 0.59 | | | | (0.76 | ) | | | (0.17 | ) | | | (0.54 | ) |
| | 2014 - IR | | | 16.14 | | | | 0.65 | | | | (0.76 | ) | | | (0.11 | ) | | | (0.60 | ) |
| | 2013 - A | | | 15.73 | | | | 0.61 | | | | 0.41 | | | | 1.02 | | | | (0.59 | ) |
| | 2013 - C | | | 15.73 | | | | 0.49 | | | | 0.40 | | | | 0.89 | | | | (0.46 | ) |
| | 2013 - Institutional | | | 15.72 | | | | 0.66 | | | | 0.42 | | | | 1.08 | | | | (0.64 | ) |
| | 2013 - Service | | | 15.80 | | | | 0.59 | | | | 0.41 | | | | 1.00 | | | | (0.56 | ) |
| | 2013 - IR | | | 15.71 | | | | 0.64 | | | | 0.41 | | | | 1.05 | | | | (0.62 | ) |
| | 2012 - A | | | 14.25 | | | | 0.65 | | | | 1.47 | | | | 2.12 | | | | (0.64 | ) |
| | 2012 - C | | | 14.25 | | | | 0.54 | | | | 1.46 | | | | 2.00 | | | | (0.52 | ) |
| | 2012 - Institutional | | | 14.25 | | | | 0.70 | | | | 1.46 | | | | 2.16 | | | | (0.69 | ) |
| | 2012 - Service | | | 14.32 | | | | 0.63 | | | | 1.47 | | | | 2.10 | | | | (0.62 | ) |
| | 2012 - IR | | | 14.26 | | | | 0.68 | | | | 1.44 | | | | 2.12 | | | | (0.67 | ) |
| | 2011 - A | | | 14.83 | | | | 0.63 | | | | (0.59 | ) | | | 0.04 | | | | (0.62 | ) |
| | 2011 - C | | | 14.84 | | | | 0.52 | | | | (0.60 | ) | | | (0.08 | ) | | | (0.51 | ) |
| | 2011 - Institutional | | | 14.83 | | | | 0.68 | | | | (0.59 | ) | | | 0.09 | | | | (0.67 | ) |
| | 2011 - Service | | | 14.91 | | | | 0.61 | | | | (0.60 | ) | | | 0.01 | | | | (0.60 | ) |
| | 2011 - IR (Commenced July 30, 2010) | | | 15.06 | | | | 0.45 | | | | (0.80 | ) | | | (0.35 | ) | | | (0.45 | ) |
| | (a) | | Calculated based on the average shares outstanding methodology. |
| | (b) | | Assumes investment at the net asset value at the beginning of the period, reinvestment of all distributions, a complete redemption of the investment at the net asset value at the end of the period and no sales or redemption charges. Total returns would be reduced if a sales or redemption charge was taken into account. Returns do not reflect the deduction of taxes that a shareholder would pay on Fund distributions or the redemption of Fund shares. Total returns for periods less than one full year are not annualized. |
| | (c) | | The Fund’s portfolio turnover rate is calculated in accordance with regulatory requirements, without regard to transactions involving short term investments and certain derivatives. If such transactions were included, the Fund’s portfolio turnover rate may be higher. |
| | |
| 76 | | The accompanying notes are an integral part of these financial statements. |
GOLDMAN SACHS DYNAMIC MUNICIPAL INCOME FUND
| | | | | | | | | | | | | | | | | | | | | | | | | | | | | | | | | | | | | | | | |
| | | | | | | | | | | | | | | | | | | | | | | | | | | | | | | | | | |
| | | Net asset
value, end
of period | | | | | Total
return(b) | | | | | Net assets,
end of
period
(in 000s) | | | | | Ratio of
net expenses
to average
net assets | | | | | Ratio of
total expenses
to average
net assets | | | | | Ratio of
net investment
income
to average
net assets | | | | | Portfolio
turnover
rate(c) | |
| | | | | | | | | | | | | | | | | | | | | | | | | | | | | | | | | | | | | | | | |
| | $ | 15.50 | | | | | | (0.27 | )% | | | | $ | 152,672 | | | | | | 0.78 | %(d) | | | | | 1.00 | %(d) | | | | | 3.68 | %(d) | | | | | 9 | % |
| | | 15.50 | | | | | | (0.71 | ) | | | | | 24,358 | | | | | | 1.54 | (d) | | | | | 1.75 | (d) | | | | | 2.92 | (d) | | | | | 9 | |
| | | 15.49 | | | | | | (0.16 | ) | | | | | 428,881 | | | | | | 0.44 | (d) | | | | | 0.66 | (d) | | | | | 4.02 | (d) | | | | | 9 | |
| | | 15.58 | | | | | | (0.34 | ) | | | | | 38 | | | | | | 0.94 | (d) | | | | | 1.16 | (d) | | | | | 3.52 | (d) | | | | | 9 | |
| | | 15.48 | | | | | | (0.15 | ) | | | | | 7,337 | | | | | | 0.53 | (d) | | | | | 0.74 | (d) | | | | | 3.91 | (d) | | | | | 9 | |
| | | | | | | | | | | | | | | | | | | | | | | | | | | | | | | | | | | | | | | | |
| | | | | | | | | | | | | | | | | | | | | | | | | | | | | | | | | | | | | | | | |
| | | 15.81 | | | | | | 6.00 | | | | | | 172,221 | | | | | | 0.78 | | | | | | 1.01 | | | | | | 3.79 | | | | | | 14 | |
| | | 15.82 | | | | | | 5.21 | | | | | | 22,182 | | | | | | 1.53 | | | | | | 1.76 | | | | | | 3.04 | | | | | | 14 | |
| | | 15.81 | | | | | | 6.36 | | | | | | 393,120 | | | | | | 0.44 | | | | | | 0.67 | | | | | | 4.12 | | | | | | 14 | |
| | | 15.89 | | | | | | 5.79 | | | | | | 39 | | | | | | 0.94 | | | | | | 1.16 | | | | | | 3.62 | | | | | | 14 | |
| | | 15.79 | | | | | | 6.27 | | | | | | 5,728 | | | | | | 0.53 | | | | | | 0.76 | | | | | | 4.00 | | | | | | 14 | |
| | | 15.45 | | | | | | (0.83 | ) | | | | | 160,259 | | | | | | 0.79 | | | | | | 1.00 | | | | | | 3.99 | | | | | | 15 | |
| | | 15.46 | | | | | | (1.50 | ) | | | | | 20,131 | | | | | | 1.54 | | | | | | 1.75 | | | | | | 3.24 | | | | | | 15 | |
| | | 15.45 | | | | | | (0.49 | ) | | | | | 305,706 | | | | | | 0.45 | | | | | | 0.66 | | | | | | 4.33 | | | | | | 15 | |
| | | 15.53 | | | | | | (0.98 | ) | | | | | 37 | | | | | | 0.94 | | | | | | 1.16 | | | | | | 3.83 | | | | | | 15 | |
| | | 15.43 | | | | | | (0.58 | ) | | | | | 2,357 | | | | | | 0.54 | | | | | | 0.75 | | | | | | 4.23 | | | | | | 15 | |
| | | 16.16 | | | | | | 6.51 | | | | | | 204,892 | | | | | | 0.78 | | | | | | 0.98 | | | | | | 3.78 | | | | | | 16 | |
| | | 16.16 | | | | | | 5.72 | | | | | | 27,047 | | | | | | 1.53 | | | | | | 1.73 | | | | | | 3.03 | | | | | | 16 | |
| | | 16.16 | | | | | | 6.93 | | | | | | 385,480 | | | | | | 0.44 | | | | | | 0.64 | | | | | | 4.10 | | | | | | 16 | |
| | | 16.24 | | | | | | 6.31 | | | | | | 42 | | | | | | 0.94 | | | | | | 1.15 | | | | | | 3.63 | | | | | | 16 | |
| | | 16.14 | | | | | | 6.77 | | | | | | 3,544 | | | | | | 0.53 | | | | | | 0.73 | | | | | | 3.97 | | | | | | 16 | |
| | | 15.73 | | | | | | 15.09 | | | | | | 348,890 | | | | | | 0.81 | | | | | | 0.99 | | | | | | 4.32 | | | | | | 9 | |
| | | 15.73 | | | | | | 14.24 | | | | | | 26,448 | | | | | | 1.56 | | | | | | 1.74 | | | | | | 3.56 | | | | | | 9 | |
| | | 15.72 | | | | | | 15.41 | | | | | | 221,617 | | | | | | 0.47 | | | | | | 0.65 | | | | | | 4.66 | | | | | | 9 | |
| | | 15.80 | | | | | | 14.86 | | | | | | 84 | | | | | | 0.97 | | | | | | 1.15 | | | | | | 4.15 | | | | | | 9 | |
| | | 15.71 | | | | | | 15.15 | | | | | | 1,527 | | | | | | 0.56 | | | | | | 0.74 | | | | | | 4.43 | | | | | | 9 | |
| | | 14.25 | | | | | | 0.20 | | | | | | 326,083 | | | | | | 0.88 | | | | | | 0.98 | | | | | | 4.26 | | | | | | 14 | |
| | | 14.25 | | | | | | (0.61 | ) | | | | | 23,443 | | | | | | 1.63 | | | | | | 1.73 | | | | | | 3.52 | | | | | | 14 | |
| | | 14.25 | | | | | | 0.55 | | | | | | 222,650 | | | | | | 0.54 | | | | | | 0.64 | | | | | | 4.62 | | | | | | 14 | |
| | | 14.32 | | | | | | (0.03 | ) | | | | | 75 | | | | | | 1.04 | | | | | | 1.14 | | | | | | 4.05 | | | | | | 14 | |
| | | 14.26 | | | | | | (2.40 | ) | | | | | 123 | | | | | | 0.63 | (d) | | | | | 0.73 | (d) | | | | | 4.74 | (d) | | | | | 14 | |
| | |
| The accompanying notes are an integral part of these financial statements. | | 77 |
GOLDMAN SACHS HIGH YIELD MUNICIPAL FUND
Financial Highlights
Selected Data for a Share Outstanding Throughout Each Period
| | | | | | | | | | | | | | | | | | | | | | |
| | | | | | | | Income (loss) from
investment operations | | | | |
| | | Year - Share Class | | Net asset
value,
beginning
of period | | | Net
investment
income(a) | | | Net realized
and unrealized
gain (loss) | | | Total from
investment
operations | | | Distributions
to shareholders
form net
investment
income | |
| | FOR THE SIX MONTHS ENDED SEPTEMBER 30, (UNAUDITED) | |
| | 2015 - A | | $ | 9.34 | | | $ | 0.23 | | | $ | (0.22 | ) | | $ | 0.01 | | | $ | (0.21 | ) |
| | 2015 - C | | | 9.34 | | | | 0.19 | | | | (0.21 | ) | | | (0.02 | ) | | | (0.18 | ) |
| | 2015 - Institutional | | | 9.34 | | | | 0.24 | | | | (0.21 | ) | | | 0.03 | | | | (0.23 | ) |
| | 2015 - IR | | | 9.35 | | | | 0.24 | | | | (0.21 | ) | | | 0.03 | | | | (0.23 | ) |
| | | | | | | | | | | | | | | | | | | | | | |
| | FOR THE FISCAL YEARS ENDED MARCH 31, | |
| | 2015 - A | | | 8.93 | | | | 0.45 | | | | 0.38 | | | | 0.83 | | | | (0.42 | ) |
| | 2015 - C | | | 8.93 | | | | 0.38 | | | | 0.39 | | | | 0.77 | | | | (0.36 | ) |
| | 2015 - Institutional | | | 8.93 | | | | 0.48 | | | | 0.38 | | | | 0.86 | | | | (0.45 | ) |
| | 2015 - IR | | | 8.93 | | | | 0.48 | | | | 0.39 | | | | 0.87 | | | | (0.45 | ) |
| | 2014 - A | | | 9.51 | | | | 0.44 | | | | (0.60 | ) | | | (0.16 | ) | | | (0.42 | ) |
| | 2014 - C | | | 9.51 | | | | 0.37 | | | | (0.59 | ) | | | (0.22 | ) | | | (0.36 | ) |
| | 2014 - Institutional | | | 9.52 | | | | 0.47 | | | | (0.61 | ) | | | (0.14 | ) | | | (0.45 | ) |
| | 2014 - IR | | | 9.51 | | | | 0.47 | | | | (0.61 | ) | | | (0.14 | ) | | | (0.44 | ) |
| | 2013 - A | | | 8.90 | | | | 0.43 | | | | 0.59 | | | | 1.02 | | | | (0.41 | ) |
| | 2013 - C | | | 8.90 | | | | 0.36 | | | | 0.59 | | | | 0.95 | | | | (0.34 | ) |
| | 2013 - Institutional | | | 8.91 | | | | 0.46 | | | | 0.59 | | | | 1.05 | | | | (0.44 | ) |
| | 2013 - IR | | | 8.91 | | | | 0.45 | | | | 0.58 | | | | 1.03 | | | | (0.43 | ) |
| | 2012 - A | | | 8.00 | | | | 0.46 | | | | 0.88 | | | | 1.34 | | | | (0.44 | ) |
| | 2012 - C | | | 8.00 | | | | 0.40 | | | | 0.88 | | | | 1.28 | | | | (0.38 | ) |
| | 2012 - Institutional | | | 8.00 | | | | 0.49 | | | | 0.88 | | | | 1.37 | | | | (0.46 | ) |
| | 2012 - IR | | | 8.00 | | | | 0.47 | | | | 0.90 | | | | 1.37 | | | | (0.46 | ) |
| | 2011 - A | | | 8.45 | | | | 0.46 | | | | (0.47 | ) | | | (0.01 | ) | | | (0.44 | ) |
| | 2011 - C | | | 8.45 | | | | 0.40 | | | | (0.47 | ) | | | (0.07 | ) | | | (0.38 | ) |
| | 2011 - Institutional | | | 8.45 | | | | 0.49 | | | | (0.47 | ) | | | 0.02 | | | | (0.47 | ) |
| | 2011 - IR (Commenced July 30, 2010) | | | 8.57 | | | | 0.33 | | | | (0.58 | ) | | | (0.25 | ) | | | (0.32 | ) |
| | (a) | | Calculated based on the average shares outstanding methodology. |
| | (b) | | Assumes investment at the net asset value at the beginning of the period, reinvestment of all distributions, a complete redemption of the investment at the net asset value at the end of the period and no sales or redemption charges. Total returns would be reduced if a sales or redemption charge was taken into account. Returns do not reflect the deduction of taxes that a shareholder would pay on Fund distributions or the redemption of Fund shares. Total returns for periods less than one full year are not annualized. |
| | (c) | | The Fund’s portfolio turnover rate is calculated in accordance with regulatory requirements, without regard to transactions involving short term investments and certain derivatives. If such transactions were included, the Fund’s portfolio turnover rate may be higher. |
| | |
| 78 | | The accompanying notes are an integral part of these financial statements. |
GOLDMAN SACHS HIGH YIELD MUNICIPAL FUND
| | | | | | | | | | | | | | | | | | | | | | | | | | | | | | | | | | | | | | | | |
| | | | | | | | | | | | | | | | | | | | | | | | | | | | | | | | | | |
| | | Net asset
value, end
of period | | | | | Total
return(b) | | | | | Net assets,
end of
period
(in 000s) | | | | | Ratio of
net expenses
to average
net assets | | | | | Ratio of
total expenses
to average
net assets | | | | | Ratio of
net investment
income
to average
net assets | | | | | Portfolio
turnover
rate(c) | |
| | | | | | | | | | | | | | | | | | | | | | | | | | | | | | | | | | | | | | | | |
| | $ | 9.14 | | | | | | 0.17 | % | | | | $ | 254,058 | | | | | | 0.87 | %(d) | | | | | 0.93 | %(d) | | | | | 4.97 | %(d) | | | | | 6 | % |
| | | 9.14 | | | | | | (0.21 | ) | | | | | 72,303 | | | | | | 1.62 | (d) | | | | | 1.68 | (d) | | | | | 4.23 | (d) | | | | | 6 | |
| | | 9.14 | | | | | | 0.31 | | | | | | 3,008,734 | | | | | | 0.57 | (d) | | | | | 0.59 | (d) | | | | | 5.26 | (d) | | | | | 6 | |
| | | 9.15 | | | | | | 0.29 | | | | | | 17,437 | | | | | | 0.61 | (d) | | | | | 0.68 | (d) | | | | | 5.21 | (d) | | | | | 6 | |
| | | | | | | | | | | | | | | | | | | | | | | | | | | | | | | | | | | | | | | | |
| | | | | | | | | | | | | | | | | | | | | | | | | | | | | | | | | | | | | | | | |
| | | 9.34 | | | | | | 9.47 | | | | | | 257,803 | | | | | | 0.86 | | | | | | 0.93 | | | | | | 4.89 | | | | | | 14 | |
| | | 9.34 | | | | | | 8.66 | | | | | | 81,018 | | | | | | 1.61 | | | | | | 1.68 | | | | | | 4.14 | | | | | | 14 | |
| | | 9.34 | | | | | | 9.79 | | | | | | 3,005,752 | | | | | | 0.57 | | | | | | 0.59 | | | | | | 5.18 | | | | | | 14 | |
| | | 9.35 | | | | | | 9.86 | | | | | | 17,265 | | | | | | 0.61 | | | | | | 0.68 | | | | | | 5.13 | | | | | | 14 | |
| | | 8.93 | | | | | | (1.52 | ) | | | | | 255,002 | | | | | | 0.87 | | | | | | 0.93 | | | | | | 4.94 | | | | | | 25 | |
| | | 8.93 | | | | | | (2.25 | ) | | | | | 75,433 | | | | | | 1.62 | | | | | | 1.68 | | | | | | 4.19 | | | | | | 25 | |
| | | 8.93 | | | | | | (1.34 | ) | | | | | 2,584,691 | | | | | | 0.58 | | | | | | 0.59 | | | | | | 5.23 | | | | | | 25 | |
| | | 8.93 | | | | | | (1.28 | ) | | | | | 12,703 | | | | | | 0.62 | | | | | | 0.69 | | | | | | 5.31 | | | | | | 25 | |
| | | 9.51 | | | | | | 11.64 | | | | | | 347,693 | | | | | | 0.86 | | | | | | 0.92 | | | | | | 4.62 | | | | | | 19 | |
| | | 9.51 | | | | | | 10.82 | | | | | | 108,291 | | | | | | 1.61 | | | | | | 1.67 | | | | | | 3.87 | | | | | | 19 | |
| | | 9.52 | | | | | | 11.95 | | | | | | 3,425,590 | | | | | | 0.57 | | | | | | 0.58 | | | | | | 4.90 | | | | | | 19 | |
| | | 9.51 | | | | | | 11.79 | | | | | | 7,134 | | | | | | 0.61 | | | | | | 0.67 | | | | | | 4.82 | | | | | | 19 | |
| | | 8.90 | | | | | | 17.08 | | | | | | 348,577 | | | | | | 0.88 | | | | | | 0.94 | | | | | | 5.42 | | | | | | 27 | |
| | | 8.90 | | | | | | 16.21 | | | | | | 99,817 | | | | | | 1.63 | | | | | | 1.69 | | | | | | 4.67 | | | | | | 27 | |
| | | 8.91 | | | | | | 17.55 | | | | | | 2,957,868 | | | | | | 0.58 | | | | | | 0.60 | | | | | | 5.72 | | | | | | 27 | |
| | | 8.91 | | | | | | 17.50 | | | | | | 3,054 | | | | | | 0.63 | | | | | | 0.69 | | | | | | 5.49 | | | | | | 27 | |
| | | 8.00 | | | | | | (0.24 | ) | | | | | 326,886 | | | | | | 0.91 | | | | | | 0.93 | | | | | | 5.46 | | | | | | 28 | |
| | | 8.00 | | | | | | (0.87 | ) | | | | | 96,011 | | | | | | 1.66 | | | | | | 1.68 | | | | | | 4.71 | | | | | | 28 | |
| | | 8.00 | | | | | | 0.09 | | | | | | 2,650,808 | | | | | | 0.57 | | | | | | 0.59 | | | | | | 5.80 | | | | | | 28 | |
| | | 8.00 | | | | | | (3.06 | ) | | | | | 451 | | | | | | 0.66 | (d) | | | | | 0.68 | (d) | | | | | 6.08 | (d) | | | | | 28 | |
| | |
| The accompanying notes are an integral part of these financial statements. | | 79 |
GOLDMAN SACHS SHORT DURATION TAX-FREE FUND
Financial Highlights
Selected Data for a Share Outstanding Throughout Each Period
| | | | | | | | | | | | | | | | | | | | | | | | | | | | | | |
| | | | | | | | Income (loss) from
investment operations | | | Distributions
to shareholders | |
| | | Year - Share Class | | Net asset
value,
beginning
of period | | | Net
investment
income(a) | | | Net realized
and unrealized
gain (loss) | | | Total from
investment
operations | | | From net
investment
income | | | From net
realized
gains | | | Total
distributions | |
| | FOR THE SIX MONTHS ENDED SEPTEMBER 30, (UNAUDITED) | |
| | 2015 - A | | $ | 10.59 | | | $ | 0.05 | | | $ | (0.06 | ) | | $ | (0.01 | ) | | $ | (0.05 | ) | | $ | — | | | $ | (0.05 | ) |
| | 2015 - C | | | 10.58 | | | | 0.03 | | | | (0.07 | ) | | | (0.04 | ) | | | (0.02 | ) | | | — | | | | (0.02 | ) |
| | 2015 - Institutional | | | 10.58 | | | | 0.07 | | | | (0.07 | ) | | | — | (e) | | | (0.06 | ) | | | — | | | | (0.06 | ) |
| | 2015 - Service | | | 10.58 | | | | 0.04 | | | | (0.06 | ) | | | (0.02 | ) | | | (0.04 | ) | | | — | | | | (0.04 | ) |
| | 2015 - IR | | | 10.58 | | | | 0.06 | | | | (0.06 | ) | | | — | (e) | | | (0.06 | ) | | | — | | | | (0.06 | ) |
| | | | | | | | | | | | | | | | | | | | | | | | | | | | | | |
| | FOR THE FISCAL YEARS ENDED MARCH 31, | |
| | 2015 - A | | | 10.57 | | | | 0.10 | | | | 0.01 | | | | 0.11 | | | | (0.09 | ) | | | — | (e) | | | (0.09 | ) |
| | 2015 - C | | | 10.55 | | | | 0.05 | | | | 0.02 | | | | 0.07 | | | | (0.04 | ) | | | — | (e) | | | (0.04 | ) |
| | 2015 - Institutional | | | 10.55 | | | | 0.13 | | | | 0.02 | | | | 0.15 | | | | (0.12 | ) | | | — | (e) | | | (0.12 | ) |
| | 2015 - Service | | | 10.55 | | | | 0.08 | | | | 0.02 | | | | 0.10 | | | | (0.07 | ) | | | — | (e) | | | (0.07 | ) |
| | 2015 - IR | | | 10.55 | | | | 0.12 | | | | 0.02 | | | | 0.14 | | | | (0.11 | ) | | | — | (e) | | | (0.11 | ) |
| | 2014 - A | | | 10.69 | | | | 0.10 | | | | (0.12 | ) | | | (0.02 | ) | | | (0.09 | ) | | | (0.01 | ) | | | (0.10 | ) |
| | 2014 - C | | | 10.68 | | | | 0.06 | | | | (0.13 | ) | | | (0.07 | ) | | | (0.05 | ) | | | (0.01 | ) | | | (0.06 | ) |
| | 2014 - Institutional | | | 10.68 | | | | 0.13 | | | | (0.13 | ) | | | — | (e) | | | (0.12 | ) | | | (0.01 | ) | | | (0.13 | ) |
| | 2014 - Service | | | 10.67 | | | | 0.08 | | | | (0.12 | ) | | | (0.04 | ) | | | (0.07 | ) | | | (0.01 | ) | | | (0.08 | ) |
| | 2014 - IR | | | 10.68 | | | | 0.13 | | | | (0.14 | ) | | | (0.01 | ) | | | (0.11 | ) | | | (0.01 | ) | | | (0.12 | ) |
| | 2013 - A | | | 10.62 | | | | 0.13 | | | | 0.07 | | | | 0.20 | | | | (0.13 | ) | | | — | | | | (0.13 | ) |
| | 2013 - C | | | 10.62 | | | | 0.08 | | | | 0.06 | | | | 0.14 | | | | (0.08 | ) | | | — | | | | (0.08 | ) |
| | 2013 - Institutional | | | 10.61 | | | | 0.16 | | | | 0.07 | | | | 0.23 | | | | (0.16 | ) | | | — | | | | (0.16 | ) |
| | 2013 - Service | | | 10.61 | | | | 0.12 | | | | 0.05 | | | | 0.17 | | | | (0.11 | ) | | | — | | | | (0.11 | ) |
| | 2013 - IR | | | 10.61 | | | | 0.15 | | | | 0.07 | | | | 0.22 | | | | (0.15 | ) | | | — | | | | (0.15 | ) |
| | 2012 - A | | | 10.44 | | | | 0.18 | | | | 0.18 | | | | 0.36 | | | | (0.18 | ) | | | — | | | | (0.18 | ) |
| | 2012 - C | | | 10.44 | | | | 0.14 | | | | 0.18 | | | | 0.32 | | | | (0.14 | ) | | | — | | | | (0.14 | ) |
| | 2012 - Institutional | | | 10.44 | | | | 0.22 | | | | 0.17 | | | | 0.39 | | | | (0.22 | ) | | | — | | | | (0.22 | ) |
| | 2012 - Service | | | 10.43 | | | | 0.17 | | | | 0.17 | | | | 0.34 | | | | (0.16 | ) | | | — | | | | (0.16 | ) |
| | 2012 - IR | | | 10.44 | | | | 0.19 | | | | 0.19 | | | | 0.38 | | | | (0.21 | ) | | | — | | | | (0.21 | ) |
| | 2011 - A | | | 10.46 | | | | 0.18 | | | | (0.02 | ) | | | 0.16 | | | | (0.18 | ) | | | — | | | | (0.18 | ) |
| | 2011 - C | | | 10.46 | | | | 0.12 | | | | (0.02 | ) | | | 0.10 | | | | (0.12 | ) | | | — | | | | (0.12 | ) |
| | 2011 - Institutional | | | 10.46 | | | | 0.22 | | | | (0.03 | ) | | | 0.19 | | | | (0.21 | ) | | | — | | | | (0.21 | ) |
| | 2011 - Service | | | 10.46 | | | | 0.17 | | | | (0.04 | ) | | | 0.13 | | | | (0.16 | ) | | | — | | | | (0.16 | ) |
| | 2011 - IR (Commenced July 30, 2010) | | | 10.56 | | | | 0.14 | | | | (0.12 | ) | | | 0.02 | | | | (0.14 | ) | | | — | | | | (0.14 | ) |
| | (a) | | Calculated based on the average shares outstanding methodology. |
| | (b) | | Assumes investment at the net asset value at the beginning of the period, reinvestment of all distributions, a complete redemption of the investment at the net asset value at the end of the period and no sales or redemption charges. Total returns would be reduced if a sales or redemption charge was taken into account. Returns do not reflect the deduction of taxes that a shareholder would pay on Fund distributions or the redemption of Fund shares. Total returns for periods less than one full year are not annualized. |
| | (c) | | The Fund’s portfolio turnover rate is calculated in accordance with regulatory requirements, without regard to transactions involving short term investments and certain derivatives. If such transactions were included, the Fund’s portfolio turnover rate may be higher. |
| | (e) | | Amount is less than $0.005 per share. |
| | |
| 80 | | The accompanying notes are an integral part of these financial statements. |
GOLDMAN SACHS SHORT DURATION TAX-FREE FUND
| | | | | | | | | | | | | | | | | | | | | | | | | | | | | | | | | | | | | | | | |
| | | | | | | | | | | | | | | | | | | | | | | | | | | | | | | | | | |
| | | Net asset
value, end
of period | | | | | Total
return(b) | | | | | Net assets,
end of
period
(in 000s) | | | | | Ratio of
net expenses
to average
net assets | | | | | Ratio of
total expenses
to average
net assets | | | | | Ratio of
net investment
income
to average
net assets | | | | | Portfolio
turnover
rate(c) | |
| | | | | | | | | | | | | | | | | | | | | | | | | | | | | | | | | | | | | | | | |
| | $ | 10.53 | | | | | | (0.14 | )% | | | | $ | 158,772 | | | | | | 0.73 | %(d) | | | | | 0.76 | %(d) | | | | | 0.91 | %(d) | | | | | 8 | % |
| | | 10.52 | | | | | | (0.34 | ) | | | | | 31,073 | | | | | | 1.13 | (d) | | | | | 1.51 | (d) | | | | | 0.51 | (d) | | | | | 8 | |
| | | 10.52 | | | | | | 0.03 | | | | | | 3,865,189 | | | | | | 0.39 | (d) | | | | | 0.42 | (d) | | | | | 1.25 | (d) | | | | | 8 | |
| | | 10.52 | | | | | | (0.22 | ) | | | | | 161 | | | | | | 0.89 | (d) | | | | | 0.91 | (d) | | | | | 0.75 | (d) | | | | | 8 | |
| | | 10.52 | | | | | | (0.01 | ) | | | | | 3,372 | | | | | | 0.48 | (d) | | | | | 0.51 | (d) | | | | | 1.16 | (d) | | | | | 8 | |
| | | | | | | | | | | | | | | | | | | | | | | | | | | | | | | | | | | | | | | | |
| | | | | | | | | | | | | | | | | | | | | | | | | | | | | | | | | | | | | | | | |
| | | 10.59 | | | | | | 1.01 | | | | | | 189,890 | | | | | | 0.73 | | | | | | 0.76 | | | | | | 0.90 | | | | | | 24 | |
| | | 10.58 | | | | | | 0.71 | | | | | | 35,443 | | | | | | 1.13 | | | | | | 1.51 | | | | | | 0.50 | | | | | | 24 | |
| | | 10.58 | | | | | | 1.45 | | | | | | 4,100,431 | | | | | | 0.39 | | | | | | 0.41 | | | | | | 1.23 | | | | | | 24 | |
| | | 10.58 | | | | | | 0.96 | | | | | | 60 | | | | | | 0.89 | | | | | | 0.92 | | | | | | 0.76 | | | | | | 24 | |
| | | 10.58 | | | | | | 1.36 | | | | | | 3,661 | | | | | | 0.48 | | | | | | 0.51 | | | | | | 1.16 | | | | | | 24 | |
| | | 10.57 | | | | | | (0.24 | ) | | | | | 231,329 | | | | | | 0.73 | | | | | | 0.76 | | | | | | 0.93 | | | | | | 17 | |
| | | 10.55 | | | | | | (0.73 | ) | | | | | 43,189 | | | | | | 1.13 | | | | | | 1.51 | | | | | | 0.53 | | | | | | 17 | |
| | | 10.55 | | | | | | 0.01 | | | | | | 3,745,916 | | | | | | 0.39 | | | | | | 0.42 | | | | | | 1.27 | | | | | | 17 | |
| | | 10.55 | | | | | | (0.40 | ) | | | | | 306 | | | | | | 0.89 | | | | | | 0.92 | | | | | | 0.79 | | | | | | 17 | |
| | | 10.55 | | | | | | (0.08 | ) | | | | | 9,554 | | | | | | 0.48 | | | | | | 0.51 | | | | | | 1.19 | | | | | | 17 | |
| | | 10.69 | | | | | | 1.85 | | | | | | 327,845 | | | | | | 0.73 | | | | | | 0.76 | | | | | | 1.26 | | | | | | 28 | |
| | | 10.68 | | | | | | 1.35 | | | | | | 57,257 | | | | | | 1.13 | | | | | | 1.50 | | | | | | 0.79 | | | | | | 28 | |
| | | 10.68 | | | | | | 2.20 | | | | | | 4,266,884 | | | | | | 0.39 | | | | | | 0.42 | | | | | | 1.48 | | | | | | 28 | |
| | | 10.67 | | | | | | 1.60 | | | | | | 1,320 | | | | | | 0.89 | | | | | | 0.92 | | | | | | 1.15 | | | | | | 28 | |
| | | 10.68 | | | | | | 2.11 | | | | | | 18,362 | | | | | | 0.48 | | | | | | 0.50 | | | | | | 1.41 | | | | | | 28 | |
| | | 10.62 | | | | | | 3.46 | | | | | | 945,940 | | | | | | 0.73 | | | | | | 0.77 | | | | | | 1.72 | | | | | | 24 | |
| | | 10.62 | | | | | | 3.05 | | | | | | 48,865 | | | | | | 1.13 | | | | | | 1.52 | | | | | | 1.32 | | | | | | 24 | |
| | | 10.61 | | | | | | 3.72 | | | | | | 2,195,766 | | | | | | 0.39 | | | | | | 0.43 | | | | | | 2.05 | | | | | | 24 | |
| | | 10.61 | | | | | | 3.31 | | | | | | 6,362 | | | | | | 0.89 | | | | | | 0.93 | | | | | | 1.63 | | | | | | 24 | |
| | | 10.61 | | | | | | 3.62 | | | | | | 10,568 | | | | | | 0.48 | | | | | | 0.52 | | | | | | 1.83 | | | | | | 24 | |
| | | 10.44 | | | | | | 1.52 | | | | | | 775,171 | | | | | | 0.73 | | | | | | 0.77 | | | | | | 1.71 | | | | | | 34 | |
| | | 10.44 | | | | | | 0.94 | | | | | | 41,115 | | | | | | 1.31 | | | | | | 1.53 | | | | | | 1.14 | | | | | | 34 | |
| | | 10.44 | | | | | | 1.86 | | | | | | 1,576,602 | | | | | | 0.39 | | | | | | 0.43 | | | | | | 2.05 | | | | | | 34 | |
| | | 10.43 | | | | | | 1.26 | | | | | | 17,730 | | | | | | 0.89 | | | | | | 0.93 | | | | | | 1.57 | | | | | | 34 | |
| | | 10.44 | | | | | | 0.17 | | | | | | 77 | | | | | | 0.48 | (d) | | | | | 0.52 | (d) | | | | | 1.97 | (d) | | | | | 34 | |
| | |
| The accompanying notes are an integral part of these financial statements. | | 81 |
GOLDMAN SACHS MUNICIPAL FIXED INCOME FUNDS
Notes to Financial Statements
September 30, 2015
Goldman Sachs Trust (the “Trust”) is a Delaware statutory trust registered under the Investment Company Act of 1940, as amended (the “Act”), as an open-end management investment company. The following table lists those series of the Trust that are included in this report (collectively, the “Funds” or individually a “Fund”), along with their corresponding share classes and respective diversification status under the Act:
| | | | |
| Fund | | Share Classes Offered | | Diversified/
Non-diversified |
Dynamic Municipal Income, Short Duration Tax-Free | | A, C, Institutional, Service and IR | | Diversified |
High Yield Municipal | | A, C, Institutional and IR | | Non-diversified |
Class A Shares of the Dynamic Municipal Income, High Yield Municipal and Short Duration Tax-Free Funds are sold with a front-end sales charge of up to 3.75%, 4.50% and 1.50%, respectively. Class C Shares of Dynamic Municipal Income, High Yield Municipal and Short Duration Tax-Free Funds are sold with a contingent deferred sales charge (“CDSC’) of 1.00%, 1.00% and 0.65%, respectively, which is imposed on redemptions made within 12 months of purchase. Institutional, Service and Class IR Shares are not subject to a sales charge.
Goldman Sachs Asset Management, L.P. (“GSAM”), an affiliate of Goldman, Sachs & Co. (“Goldman Sachs”), serves as investment adviser to the Funds pursuant to management agreements (the “Agreements”) with the Trust.
|
| 2. SIGNIFICANT ACCOUNTING POLICIES |
The financial statements have been prepared in accordance with accounting principles generally accepted in the United States of America (“GAAP”) and require management to make estimates and assumptions that may affect the reported amounts and disclosures. Actual results may differ from those estimates and assumptions.
A. Investment Valuation — The Funds’ valuation policy is to value investments at fair value.
B. Investment Income and Investments — Investment income includes interest income and dividend income, net of any foreign withholding taxes, less any amounts reclaimable. Interest income is accrued daily and adjusted for amortization of premiums and accretion of discounts. Dividend income is recognized on ex-dividend date or, for certain foreign securities, as soon as such information is obtained subsequent to the ex-dividend date. Investment transactions are reflected on trade date. Realized gains and losses are calculated using identified cost. Investment transactions are recorded on the following business day for daily net asset value (“NAV”) calculations. Any foreign capital gains tax is accrued daily based upon net unrealized gains, and is payable upon sale of such investments.
For derivative contracts, realized gains and losses are recorded upon settlement of the contract. Upfront payments are made or received upon entering into a swap agreement and are reflected in the Statement of Assets and Liabilities. Upfront payments are recognized over the contract’s term/event as realized gains or losses, with the exception of forward starting interest rate swaps whose realized gains or losses are recognized from the effective start date. For securities with paydown provisions, principal payments received are treated as a proportionate reduction to the cost basis of the securities, and excess or shortfall amounts are recorded as income. For treasury inflation protected securities (“TIPS”), adjustments to principal due to inflation/deflation are reflected as increases/decreases to interest income with a corresponding adjustment to cost.
C. Class Allocations and Expenses — Investment income, realized and unrealized gain (loss), and non-class specific expenses of each Fund are allocated daily based upon the proportion of net assets of each class. Class specific expenses, where applicable, are borne by the respective share classes and include Distribution and Service, Transfer Agency and Service and Shareholder Administration fees. Non-class specific expenses directly incurred by a Fund are charged to that Fund, while such expenses incurred by the Trust are allocated across the applicable Funds on a straight-line and/or pro-rata basis depending upon the nature of the expenses.
82
GOLDMAN SACHS MUNICIPAL FIXED INCOME FUNDS
|
| 2. SIGNIFICANT ACCOUNTING POLICIES (continued) |
D. Redemption Fees — A 2% redemption fee is imposed on the redemption of shares (including by exchange) of the High Yield Municipal Fund held for 60 calendar days or less. For this purpose, the High Yield Municipal Fund uses a first-in first-out method so that shares held longest will be treated as being redeemed first and shares held shortest will be treated as being redeemed last. Redemption fees are reimbursed to the Fund and are reflected as a reduction in share redemptions. Redemption fees are credited to Paid-in Capital and are allocated to each share class of the Fund on a pro-rata basis.
E. Federal Taxes and Distributions to Shareholders — It is each Fund’s policy to comply with the requirements of the Internal Revenue Code of 1986, as amended (the “Code”), applicable to regulated investment companies (mutual funds) and to distribute each year substantially all of its investment company taxable income and capital gains to its shareholders. Accordingly, the Funds are not required to make any provisions for the payment of federal income tax. Distributions to shareholders are recorded on the ex-dividend date. Income distributions, if any, are declared daily and paid monthly, and capital gains distributions, if any, are declared and paid annually.
Net capital losses are carried forward to future fiscal years and may be used to the extent allowed by the Code to offset any future capital gains. Utilization of capital loss carryforwards will reduce the requirement of future capital gains distributions.
Under the Regulated Investment Company Modernization Act of 2010, the Funds are permitted to carry forward capital losses incurred in taxable years beginning after December 22, 2010 for an unlimited period. However, any losses incurred during those future taxable years will be required to be utilized prior to the losses incurred in pre-enactment taxable years. As a result of this ordering rule, pre-enactment capital loss carryforwards may be more likely to expire unused. Additionally, post-enactment capital losses that are carried forward will retain their character as either short-term or long-term capital losses rather than being considered all short-term as under previous law.
The characterization of distributions to shareholders for financial reporting purposes is determined in accordance with federal income tax rules, which may differ from GAAP. The source of each Fund’s distributions may be shown in the accompanying financial statements as either from net investment income, net realized gain or capital. Certain components of the Funds’ net assets on the Statements of Assets and Liabilities reflect permanent GAAP/tax differences based on the appropriate tax character.
| | |
| 3. INVESTMENTS AND FAIR VALUE MEASUREMENTS | | |
The fair value of a financial instrument is the amount that would be received to sell an asset or paid to transfer a liability in an orderly transaction between market participants at the measurement date (i.e., the exit price). GAAP establishes a fair value hierarchy that prioritizes the inputs to valuation techniques used to measure fair value. The hierarchy gives the highest priority to unadjusted quoted prices in active markets for identical assets or liabilities (Level 1 measurements) and the lowest priority to unobservable inputs (Level 3 measurements). The levels used for classifying investments are not necessarily an indication of the risk associated with investing in these investments. The three levels of the fair value hierarchy are described below:
Level 1 — Unadjusted quoted prices in active markets that are accessible at the measurement date for identical, unrestricted assets or liabilities;
Level 2 — Quoted prices in markets that are not active or financial instruments for which significant inputs are observable (including, but not limited to, quoted prices for similar investments, interest rates, foreign exchange rates, volatility and credit spreads), either directly or indirectly;
Level 3 — Prices or valuations that require significant unobservable inputs (including GSAM’s assumptions in determining fair value measurement).
Changes in valuation techniques may result in transfers into or out of an assigned level within the hierarchy. In accordance with the Funds’ policy, transfers between different levels of the fair value hierarchy resulting from such changes are deemed to have occurred as of the beginning of the reporting period.
The Board of Trustees (“Trustees”) has approved Valuation Procedures that govern the valuation of the portfolio investments held by the Funds, including investments for which market quotations are not readily available. The Trustees have delegated to GSAM day-to-day responsibility for implementing and maintaining internal controls and procedures related to the valuation of the
83
GOLDMAN SACHS MUNICIPAL FIXED INCOME FUNDS
Notes to Financial Statements (continued)
September 30, 2015
|
| 3. INVESTMENTS AND FAIR VALUE MEASUREMENTS (continued) |
Funds’ portfolio investments. To assess the continuing appropriateness of pricing sources and methodologies, GSAM regularly performs price verification procedures and issues challenges as necessary to third party pricing vendors or brokers, and any differences are reviewed in accordance with the Valuation Procedures.
A. Level 1 and Level 2 Fair Value Investments — The valuation techniques and significant inputs used in determining the fair values for investments classified as Level 1 and Level 2 are as follows:
Money Market Funds — Investments in the Goldman Sachs Financial Square Tax-Free Money Market Fund (“Underlying Fund”) are valued at the NAV of the FST Share class on the day of valuation. These investments are generally classified as Level 1 of the fair value hierarchy.
The Underlying Fund may invest in debt securities which are valued daily on the basis of quotations supplied by dealers, if market quotations are readily available, or an independent pricing service approved by the Trustees. The pricing services may use valuation models or matrix pricing, which consider: (i) yield or price with respect to bonds that are considered comparable in characteristics such as rating, interest rate and maturity date or (ii) quotations from securities dealers to determine current value.
Debt Securities — Debt securities for which market quotations are readily available are valued daily on the basis of quotations supplied by dealers or an independent pricing service approved by the Trustees. The pricing services may use valuation models or matrix pricing, which consider: (i) yield or price with respect to bonds that are considered comparable in characteristics such as rating, interest rate and maturity date or (ii) quotations from securities dealers to determine current value. Short-term debt obligations that mature in sixty days or less and that do not exhibit signs of credit deterioration are valued at amortized cost, which approximates fair value. With the exception of treasury securities of G8 countries (not held in money market funds), which are generally classified as Level 1, these investments are generally classified as Level 2 of the fair value hierarchy.
i. Inverse Floaters — The interest rate on inverse floating rate securities (“inverse floaters”) resets in the opposite direction from the market rate of interest to which the inverse floaters are indexed. An inverse floater may be considered to be leveraged to the extent that its interest rate varies by a magnitude that exceeds the magnitude of the change in the index rate of interest. The higher the degree of leverage of an inverse floater, the greater the volatility of its market value.
ii. When-Issued Securities and Forward Commitments — When-issued securities, including TBA (“To Be Announced”) securities, are securities that are authorized but not yet issued in the market and purchased in order to secure what is considered to be an advantageous price or yield to a Fund. A forward commitment involves entering into a contract to purchase or sell securities, typically on an extended settlement basis, for a fixed price at a future date. The purchase of securities on a when-issued or forward commitment basis involves a risk of loss if the value of the security to be purchased declines before the settlement date. Conversely, the sale of securities on a forward commitment basis involves the risk that the value of the securities sold may increase before the settlement date. Although a Fund will generally purchase securities on a when-issued or forward commitment basis with the intention of acquiring the securities for its portfolio, the Fund may dispose of when-issued securities or forward commitments prior to settlement which may result in a realized gain or loss.
Derivative Contracts — A derivative is an instrument whose value is derived from underlying assets, indices, reference rates or a combination of these factors. The Funds enter into derivative transactions to hedge against changes in interest rates, securities prices, and/or currency exchange rates, to increase total return, or to gain access to certain markets or attain exposure to other underliers.
Exchange-traded derivatives, including futures and options contracts, are valued at the last sale or settlement price and typically fall within Level 1 of the fair value hierarchy. Over-the-counter (“OTC”) and centrally cleared derivatives are valued using market transactions and other market evidence, including market-based inputs to models, calibration to market-clearing transactions, broker or dealer quotations, or other alternative pricing sources. Where models are used, the selection of a particular model to value OTC and centrally cleared derivatives depends upon the contractual terms of, and specific risks inherent in, the instrument, as well as the availability of pricing information in the market. Valuation models require a variety of inputs, including contractual terms, market prices, yield curves, credit curves, measures of volatility, voluntary and involuntary prepayment rates, loss severity rates and correlations of such inputs. For OTC and centrally cleared derivatives that trade in liquid markets, model
84
GOLDMAN SACHS MUNICIPAL FIXED INCOME FUNDS
|
| 3. INVESTMENTS AND FAIR VALUE MEASUREMENTS (continued) |
inputs can generally be verified and model selection does not involve significant management judgment. OTC and centrally cleared derivatives are classified within Level 2 of the fair value hierarchy when significant inputs are corroborated by market evidence.
i. Swap Contracts — Bilateral swap contracts are agreements in which a Fund and a counterparty agree to exchange periodic payments on a specified notional amount or make a net payment upon termination. Bilateral swap transactions are privately negotiated in the OTC market and payments are settled through direct payments between a Fund and the counterparty. By contrast, certain swap transactions are subject to mandatory central clearing. These swaps are executed through a derivatives clearing member (“DCM”), acting in an agency capacity, and submitted to a central counterparty (“CCP”)(“centrally cleared swaps”), in which case all payments are settled with the CCP through the DCM. Swaps are marked-to-market daily using pricing vendor quotations, counterparty or clearinghouse prices or model prices, and the change in value, if any, is recorded as an unrealized gain or loss. Upon entering into a swap contract, a Fund is required to satisfy an initial margin requirement by delivering cash or securities to the counterparty (or in some cases, segregated in a triparty account on behalf of the counterparty), which can be adjusted by any mark-to-market gains or losses pursuant to bilateral or centrally cleared arrangements. For centrally cleared swaps the daily change in valuation, if any, is recorded as a receivable or payable for variation margin.
An interest rate swap is an agreement that obligates two parties to exchange a series of cash flows at specified intervals, based upon or calculated by reference to changes in interest rates on a specified notional principal amount. The payment flows are usually netted against each other, with the difference being paid by one party to the other.
A credit default swap is an agreement that involves one party (the buyer of protection) making a stream of payments to another party (the seller of protection) in exchange for the right to receive protection on a reference security or obligation, including a group of assets or exposure to the performance of an index. A Fund’s investment in credit default swaps may involve greater risks than if the Fund had invested in the referenced obligation directly. Credit events are contract specific but may include bankruptcy, failure to pay, restructuring and obligation acceleration. If a Fund buys protection through a credit default swap and no credit event occurs, its payments are limited to the periodic payments previously made to the counterparty. Upon the occurrence of a specified credit event, a Fund, as a buyer of credit protection, is entitled to receive an amount equal to the notional amount of the swap and deliver to the seller the defaulted reference obligation in a physically settled trade. A Fund may also receive a net settlement amount in the form of cash or securities equal to the notional amount of the swap reduced by the recovery value of the reference obligation in a cash settled trade.
As a seller of protection, a Fund generally receives a payment stream throughout the term of the swap, provided that there is no credit event. In addition, if a Fund sells protection through a credit default swap, a Fund could suffer a loss because the value of the referenced obligation and the premium payments received may be less than the notional amount of the swap paid to the buyer of protection. Upon the occurrence of a specified credit event, a Fund, as a seller of credit protection, may be required to take possession of the defaulted reference obligation and pay the buyer an amount equal to the notional amount of the swap in a physically settled trade. A Fund may also pay a net settlement amount in the form of cash or securities equal to the notional amount of the swap reduced by the recovery value of the reference obligation in cash settled trade. Recovery values are at times established through the credit event auction process in which market participants are ensured that a transparent price has been set for the defaulted security or obligation. In addition, a Fund is entitled to a return of any assets, which have been pledged as collateral to the counterparty.
The maximum potential amount of future payments (undiscounted) that a Fund as seller of protection could be required to make under a credit default swap would be an amount equal to the notional amount of the agreement. These potential amounts would be partially offset by any recovery values of the respective referenced obligations or net amounts received from a settlement of a credit default swap for the same reference security or obligation where a Fund bought credit protection.
Short Term Investments — Short-term investments having a maturity of 60 days or less are generally valued at amortized cost which approximates fair market value. These investments are classified as Level 2 of the fair value hierarchy.
B. Level 3 Fair Value Investments — To the extent that significant inputs to valuation models and other alternative pricing sources are unobservable, or if quotations are not readily available, or if GSAM believes that such quotations do not accurately
85
GOLDMAN SACHS MUNICIPAL FIXED INCOME FUNDS
Notes to Financial Statements (continued)
September 30, 2015
|
| 3. INVESTMENTS AND FAIR VALUE MEASUREMENTS (continued) |
reflect fair value, the fair value of the Funds’ investments may be determined under Valuation Procedures approved by the Trustees. GSAM, consistent with its procedures and applicable regulatory guidance, may make an adjustment to the most recent valuation prices of either domestic or foreign securities in light of significant events to reflect what it believes to be the fair value of the securities at the time of determining a Fund’s NAV. Significant events which could affect a large number of securities in a particular market may include, but are not limited to: significant fluctuations in U.S. or foreign markets; market dislocations; market disruptions; or unscheduled market closings. Significant events which could also affect a single issuer may include, but are not limited to: corporate actions such as reorganizations, mergers and buy-outs; ratings downgrades; and bankruptcies.
C. Fair Value Hierarchy — The following is a summary of the Funds’ investments and derivatives classified in the fair value hierarchy as of September 30, 2015:
| | | | | | | | | | | | |
| | | |
| DYNAMIC MUNICIPAL INCOME | | | | | | | | | | | | |
| | | |
| Investment Type | | Level 1 | | | Level 2 | | | Level 3 | |
| Assets | | | | | | | | | | | | |
Municipal Debt Obligations | | $ | — | | | $ | 597,410,821 | | | $ | — | |
Investment Company | | | 4,544,566 | | | | — | | | | — | |
| Total | | $ | 4,544,566 | | | $ | 597,410,821 | | | $ | — | |
| | | |
| Derivative Type | | | | | | | | | |
| Assets(a) | | | | | | | | | | | | |
Credit Default Swap Contracts | | $ | — | | | $ | 72,651 | | | $ | — | |
| Liabilities(a) | | | | | | | | | | | | |
Interest Rate Swap Contracts | | $ | — | | | $ | (825,219 | ) | | $ | — | |
| | | |
| HIGH YIELD MUNICIPAL | | | | | | | | | | | | |
| | | |
| Investment Type | | Level 1 | | | Level 2 | | | Level 3 | |
| Assets | | | | | | | | | | | | |
Fixed Income | | | | | | | | | | | | |
Municipal Debt Obligations | | $ | — | | | $ | 3,275,869,037 | | | $ | — | |
Corporate Obligation | | | — | | | | 6,194,500 | | | | — | |
| Total | | $ | — | | | $ | 3,282,063,537 | | | $ | — | |
| | | |
| Derivative Type | | | | | | | | | |
| Assets(a) | | | | | | | | | | | | |
Credit Default Swap Contracts | | $ | — | | | $ | 1,609,968 | | | $ | — | |
| Liabilities(a) | | | | | | | | | | | | |
Credit Default Swap Contracts | | $ | — | | | $ | (726,452 | ) | | $ | — | |
Interest Rate Swap Contracts | | | — | | | | (5,745,029 | ) | | | — | |
| Total | | $ | — | | | $ | (6,471,481 | ) | | $ | — | |
86
GOLDMAN SACHS MUNICIPAL FIXED INCOME FUNDS
|
| 3. INVESTMENTS AND FAIR VALUE MEASUREMENTS (continued) |
| | | | | | | | | | | | |
| | | |
| SHORT DURATION TAX-FREE | | | | | | | | | | | | |
| | | |
| Investment Type | | Level 1 | | | Level 2 | | | Level 3 | |
| Assets | | | | | | | | | | | | |
Municipal Debt Obligations | | $ | — | | | $ | 4,015,869,036 | | | $ | — | |
| | | |
| Derivative Type | | | | | | | | | |
| Assets(a) | | | | | | | | | | | | |
Credit Default Swap Contracts | | $ | — | | | $ | 363,255 | | | $ | — | |
| Liabilities(a) | | | | | | | | | | | | |
Credit Default Swap Contracts | | $ | — | | | $ | (3,718 | ) | | $ | — | |
| (a) | | Amount shown represents unrealized gain (loss) at period end. |
For further information regarding security characteristics, see the Schedules of Investments.
| | |
| 4. INVESTMENTS IN DERIVATIVES | | |
The following tables set forth, by certain risk types, the gross value of derivative contracts as of September 30, 2015. These instruments were used to meet the Funds’ investment objectives and to obtain and/or manage exposure related to the risks below. The values in the tables below exclude the effects of cash collateral received or posted pursuant to these derivative contracts, and therefore are not representative of the Funds’ net exposure.
| | | | | | | | | | | | |
| | | |
| DYNAMIC MUNICIPAL INCOME | | | | | | | | | | |
| Risk | | Statements of Assets
and Liabilities | | Assets(a) | | | Statements of Assets
and Liabilities | | Liabilities(a) | |
Credit | | Receivable for unrealized gain on swap contracts | | $ | 72,651 | | | — | | $ | — | |
Interest Rate | | — | | | — | | | Variation margin on centain derivative contracts | | | (825,219) | |
| Total | | | | $ | 72,651 | | | | | $ | (825,219) | |
| | | |
| HIGH YIELD MUNICIPAL | | | | | | | | | | |
| Risk | | Statements of Assets
and Liabilities | | Assets(a) | | | Statements of Assets
and Liabilities | | Liabilities | |
Credit | | Receivable for unrealized gain on swap contracts | | $ | 1,609,968 | | | Payable for unrealized loss on swap contracts | | $ | (726,452) | (b) |
Interest Rate | | — | | | — | | | Variation margin on centain derivative contracts | | | (5,745,029) | (a) |
| Total | | | | $ | 1,609,968 | | | | | $ | (6,471,481) | |
87
GOLDMAN SACHS MUNICIPAL FIXED INCOME FUNDS
Notes to Financial Statements (continued)
September 30, 2015
|
| 4. INVESTMENTS IN DERIVATIVES (continued) |
| | | | | | | | | | | | |
| | | |
| SHORT DURATION TAX-FREE | | | | | | | | | | |
| Risk | | Statements of Assets
and Liabilities | | Assets(a) | | | Statements of Assets
and Liabilities | | Liabilities | |
Credit | | Receivable for unrealized gain on swap contracts | | $ | 363,255 | | | Payable for unrealized loss on swap contracts | | $ | (3,718) | (b) |
| (a) | | Includes unrealized gain (loss) on centrally cleared swap contracts described in the Additional Investment Information sections of the Schedules of Investments. Only current day’s variation margin is reported within the Statements of Assets and Liabilities. |
| (b) | | Aggregate of amounts represents the payments to be made pursuant to bilateral agreements should counterparties exercise their “right to terminate” provisions based on, among others, the Fund’s performance, its failure to pay on its obligations or failure to pledge collateral. The amounts do not include incremental charges directly associated with the close-out of the agreements. They also do not reflect the fair value of any assets pledged as collateral which, through the daily margining process, substantially offsets the aforementioned amounts and for which the Funds are entitled to a full return. |
The following tables set forth, by certain risk types, the Funds’ gains (losses) related to these derivatives and their indicative volumes for the six months ended September 30, 2015. These gains (losses) should be considered in the context that these derivative contracts may have been executed to create investment opportunities and/or economically hedge certain investments, and accordingly, certain gains (losses) on such derivative contracts may offset certain (losses) gains attributable to investments. These gains (losses) are included in “Net realized gain (loss)” or “Net change in unrealized gain (loss)” on the Statements of Operations:
| | | | | | | | | | | | | | |
| | | |
| DYNAMIC MUNICIPAL INCOME | | | | | | | | | | | | |
| Risk | | Statements of Operations | | Net Realized
Gain (Loss) | | | Net Change in
Unrealized
Gain (Loss) | | | Average
Number of
Contracts(a) | |
| Credit | | Net realized gain (loss) from swap contracts/Net change in unrealized gain (loss) on swap contracts | | $ | 15,253 | | | $ | (13,796 | ) | | | 2 | |
| Interest Rate | | Net realized gain (loss) from swap contracts/Net change in unrealized gain (loss) on swap contracts | | | (5,533 | ) | | | (183,036 | ) | | | 3 | |
| Total | | | | $ | 9,720 | | | $ | (196,832 | ) | | | 5 | |
| | | |
| HIGH YIELD MUNICIPAL | | | | | | | | | | | | |
| Risk | | Statements of Operations | | Net Realized
Gain (Loss) | | | Net Change in
Unrealized
Gain (Loss) | | | Average
Number of
Contracts(a) | |
| Credit | | Net realized gain (loss) from swap contracts/Net change in unrealized gain (loss) on swap contracts | | $ | 547,681 | | | $ | (864,579 | ) | | | 7 | |
| Interest Rate | | Net realized gain (loss) from swap contracts/Net change in unrealized gain (loss) on swap contracts | | | 1,536,912 | | | | 1,514,373 | | | | 1 | |
| Total | | | | $ | 2,084,593 | | | $ | 649,794 | | | | 8 | |
| | | |
| SHORT DURATION TAX-FREE | | | | | | | | | | | | |
| Risk | | Statements of Operations | | Net Realized
Gain (Loss) | | | Net Change in
Unrealized
Gain (Loss) | | | Average
Number of
Contracts(a) | |
| Credit | | Net realized gain (loss) from swap contracts/Net change in unrealized gain (loss) on swap contracts | | $ | 101,959 | | | $ | (91,036 | ) | | | 2 | |
| (a) | | Average number of contracts is based on the average of month end balances for the six months ended September 30, 2015. |
88
GOLDMAN SACHS MUNICIPAL FIXED INCOME FUNDS
|
| 4. INVESTMENTS IN DERIVATIVES (continued) |
In order to better define its contractual rights and to secure rights that will help a Fund mitigate its counterparty risk, a Fund may enter into an International Swaps and Derivatives Association, Inc. Master Agreement (“ISDA Master Agreement”) or similar agreement with its derivatives counterparties. An ISDA Master Agreement is a bilateral agreement between a Fund and a counterparty that governs OTC derivatives (including forward foreign currency exchange contracts, and certain options and swaps), and typically contains, among other things, collateral posting terms and netting provisions in the event of a default and/or termination event. The provisions of the ISDA Master Agreement typically permit a single net payment in the event of a default (close-out netting) or similar event, including the bankruptcy or insolvency of the counterparty.
Collateral and margin requirements differ between exchange traded derivatives and OTC derivatives. Margin requirements are established by the broker or clearing house for exchange-traded and centrally cleared derivatives (financial futures contracts, options and centrally cleared swaps) pursuant to governing agreements for those instrument types. Brokers can ask for margin in excess of the minimum in certain circumstances. Collateral terms are contract-specific for OTC derivatives. For derivatives traded under an ISDA Master Agreement, the collateral requirements are typically calculated by netting the marked to market amount for each transaction under such agreement and comparing that amount to the value of any collateral currently pledged by a Fund and the counterparty. Additionally, a Fund may be required to post initial margin to the counterparty, the terms of which would be outlined in the confirmation of the OTC transaction.
For financial reporting purposes, cash collateral that has been pledged to cover obligations of a Fund and cash collateral received from the counterparty, if any, is reported separately on the Statements of Assets and Liabilities as receivables/payables for collateral on certain derivative contracts. Non-cash collateral pledged by a Fund, if any, is noted in the Schedules of Investments. Generally, the amount of collateral due from or to a counterparty must exceed a minimum transfer amount threshold before a transfer is required to be made. To the extent amounts due to a Fund from its counterparties are not fully collateralized, contractually or otherwise, the Fund bears the risk of loss from counterparty nonperformance. A Fund attempts to mitigate counterparty risk by only entering into agreements with counterparties that it believes to be of good standing and by monitoring the financial stability of those counterparties.
Additionally, the netting of assets and liabilities and the offsetting of collateral pledged or received are based on contractual netting/set-off provisions in the ISDA Master Agreement or similar agreements. However, in the event of a default or insolvency of a counterparty, a court could determine that such rights are not enforceable due the restrictions or prohibitions against the right of setoff that may be imposed due to a particular jurisdiction’s bankruptcy or insolvency laws.
|
| 5. AGREEMENTS AND AFFILIATED TRANSACTIONS |
A. Management Agreement — Under the Agreement, GSAM manages the Funds, subject to the general supervision of the Trustees.
As compensation for the services rendered pursuant to the Agreement, the assumption of the expenses related thereto and administration of the Funds’ business affairs, including providing facilities, GSAM is entitled to a management fee, accrued daily and paid monthly, equal to an annual percentage rate of each Fund’s average daily net assets.
For the six months ended September 30, 2015, contractual and effective net management fees with GSAM were at the following rates:
| | | | | | | | | | | | | | | | | | | | | | | | | | | | | | |
| | | | | Contractual Management Rate | | | Effective Net
Management
Rate^ | |
| Fund | | | | First
$1 billion | | | Next
$1 billion | | | Next
$3 billion | | | Next
$3 billion | | | Over
$8 billion | | | Effective
Rate | | |
Dynamic Municipal Income | | | | | 0.55 | % | | | 0.50 | % | | | 0.48 | % | | | 0.47 | % | | | 0.46 | % | | | 0.55 | % | | | 0.40 | %(1)(2) |
High Yield Municipal | | | | | 0.55 | | | | 0.55 | | | | 0.50 | | | | 0.48 | | | | 0.47 | | | | 0.53 | | | | 0.53 | |
Short Duration Tax-Free | | | | | 0.40 | | | | 0.36 | | | | 0.34 | | | | 0.33 | | | | 0.32 | | | | 0.36 | | | | 0.35 | (2) |
| ^ | | Effective Net Management Rate includes the impact of management fee waivers of affiliated underlying funds, if any. |
89
GOLDMAN SACHS MUNICIPAL FIXED INCOME FUNDS
Notes to Financial Statements (continued)
September 30, 2015
|
| 5. AGREEMENTS AND AFFILIATED TRANSACTIONS (continued) |
| (1) | | GSAM has agreed to waive a portion of its management fee payable by the Fund in an amount equal to any management fees it earns as an investment adviser to any of the affiliated funds in which the Fund invest through at least July 29, 2016. Prior to such date GSAM may not terminate the arrangement without the approval of the Trustees. |
| (2) | | GSAM has agreed to waive a portion of its management fee in order to achieve net management rates, as defined in the Funds’ most recent prospectuses. These waivers will be effective through at least July 29, 2016, and prior to such date GSAM may not terminate the arrangement without approval of the Trustees. The Effective Net Management Rates above are calculated based on management rates before and after the waivers had been adjusted, if applicable. |
The Dynamic Municipal Income Fund invests in the FST Shares of Goldman Sachs Financial Square Tax-Free Money Market Fund, which is an affiliated Underlying Fund. GSAM has agreed to waive a portion of its management fee payable by the Fund in an amount equal to the management fee it earns as an investment adviser to any of the affiliated Underlying Funds in which the Fund invests. For the six months ended September 30, 2015, GSAM waived $3,920 of the Fund’s management fees.
B. Distribution and Service Plans — The Trust, on behalf of each Fund, has adopted Distribution and Service Plans (the “Plans”). Under the Plans, Goldman Sachs, which serves as distributor (the “Distributor”), is entitled to a fee accrued daily and paid monthly, for distribution services and personal and account maintenance services, which may then be paid by Goldman Sachs to authorized dealers, at the following annual rates calculated on a Fund’s average daily net assets of each respective share class:
| | | | | | | | |
| | | Distribution and Service Plan Rates | |
| | | Class A* | | | Class C | |
Distribution Plan | | | 0.25 | % | | | 0.75 | % |
Service Plan | | | — | | | | 0.25 | |
| * | | With respect to Class A Shares, the Distributor at its discretion may use compensation for distribution services paid under the Distribution Plan to compensate service organizations for personal and account maintenance services and expenses as long as such total compensation does not exceed the maximum cap on “service fees” imposed by the Financial Industry Regulatory Authority. |
For the six months ended September 30, 2015, Goldman Sachs agreed to waive a portion of the distribution and service fees equal to 0.35% as an annual percentage rate of the average daily net assets attributable to Class C Shares of the Short Duration Tax-Free Fund. This arrangement will remain in place through at least July 29, 2016. Prior to such date, Goldman Sachs may not terminate this arrangement without the approval of the Trustees.
C. Distribution Agreement — Goldman Sachs, as Distributor of the shares of the Funds pursuant to a Distribution Agreement, may retain a portion of the Class A Shares front end sales charge and Class C Shares’ CDSC. During the six months ended September 30, 2015, Goldman Sachs advised that it retained front end sales charges of $12,529, $18,220 and $567 for the Dynamic Municipal Income, High Yield Municipal and Short Duration Tax-Free Funds, respectively. Goldman Sachs retained no contingent deferred sales charges.
D. Service Plan and Shareholder Administration Plan — The Trust, on behalf of each Fund that offers Service Shares, has adopted a Service Plan and a Shareholder Administration Plan. These plans allow for service organizations to provide varying levels of personal and account maintenance and shareholder administration services to their customers who are beneficial owners of such shares. The Service Plan and Shareholder Administration Plan each provide for compensation to the service organizations which is accrued daily and paid monthly at an annual rate of 0.25% (0.50% in aggregate) of the average daily net assets of the Service Shares.
E. Transfer Agency Agreement — Goldman Sachs also serves as the transfer agent of the Funds for a fee pursuant to the Transfer Agency Agreement. The fees charged for such transfer agency services are accrued daily and paid monthly at annual rates as follows: 0.13% of the average daily net assets of Class A, Class C and Class IR Shares; and 0.04% of the average daily net assets of Institutional and Service Shares. Goldman Sachs agreed to waive a portion of the transfer agency fee equal to 0.05% as an annual percentage rate of the average daily net assets attributable to Class A, Class C and Class IR Shares of the High Yield Municipal Fund. This arrangement will remain in effect through at least July 29, 2016. Prior to such date, Goldman Sachs may not terminate the arrangement without the approval of the trustees.
F. Other Expense Agreements and Affiliated Transactions — GSAM has agreed to limit certain “Other Expenses” of the Funds (excluding acquired fund fees and expenses, transfer agency fees and expenses, service fees and shareholder administration
90
GOLDMAN SACHS MUNICIPAL FIXED INCOME FUNDS
|
| 5. AGREEMENTS AND AFFILIATED TRANSACTIONS (continued) |
fees (as applicable), taxes, interest, brokerage fees, shareholder meetings, litigation, indemnification and extraordinary expenses) to the extent such expenses exceed, on an annual basis, a percentage rate of the average daily net assets of each Fund. Such Other Expense reimbursements, if any, are accrued daily and paid monthly. In addition, the Funds are not obligated to reimburse GSAM for prior fiscal year expense reimbursements, if any. The Other Expense limitations as an annual percentage rate of average daily net assets for each Fund is 0.004%. These Other Expense limitations will remain in place through at least July 29, 2016, and prior to such date GSAM may not terminate the arrangements without the approval of the Trustees. In addition, the Funds have entered into certain offset arrangements with the custodian and the transfer agent, which may result in a reduction of the Funds’ expenses and are received irrespective of the application of the “Other Expense” limitations described above.
For the six months ended September 30, 2015, these expense reductions, including any fee waivers and Other Expense reimbursements, were as follows:
| | | | | | | | | | | | | | | | | | | | | | | | | | | | |
| | | | | | | Fee Waivers | | | | | | | | | | |
| Fund | | | | | | Management
Fee | | | Class C
Distribution and
Service Fee | | | Transfer
Agency Fee(a) | | | Other
Expense
Reimbursement | | | Custody
Fee
Credits | | | Total
Expense
Reductions | |
Dynamic Municipal Income | | | | | | $ | 460,019 | | | $ | — | | | $ | — | | | $ | 182,687 | | | $ | 2,504 | | | $ | 645,210 | |
High Yield Municipal | | | | | | | — | | | | — | | | | 87,996 | | | | 211,264 | | | | 12,561 | | | | 311,821 | |
Short Duration Tax-Free | | | | | | | 300,834 | | | | 58,205 | | | | — | | | | 255,505 | | | | 20,827 | | | | 635,371 | |
| (a) | | Applicable to Class A, C and IR Shares. |
G. Line of Credit Facility — As of September 30, 2015, the Funds participated in a $1,205,000,000 committed, unsecured revolving line of credit facility (the “facility”) together with other funds of the Trust and registered investment companies having management agreements with GSAM or its affiliates (“Other Borrowers”). Pursuant to the terms of the facility, the Funds and Other Borrowers could increase the credit amount by up to an additional $115,000,000, for a total of up to $1,320,000,000. This facility is to be used for temporary emergency purposes, or to allow for an orderly liquidation of securities to meet redemption requests. The interest rate on borrowings is based on the federal funds rate. The facility also requires a fee to be paid by the Funds based on the amount of the commitment that has not been utilized. For the six months ended September 30, 2015, the Funds did not have any borrowings under the facility.
H. Other Transactions with Affiliates — As of September 30, 2015, the Goldman Sachs Group, Inc. was the beneficial owner of approximately 8% of the Service Class Shares of the Dynamic Municipal Income Fund.
The Funds may purchase securities from, or sell securities to, an affiliated fund provided the affiliation is solely due to having a common investment adviser, common officers, or common trustees. For the six months ended September 30, 2015, there were no purchase and sale transactions for the Funds with an affiliated fund in compliance with Rule 17a-7 under the Act.
The following table provides information about the Funds’ investment in the Goldman Sachs Financial Square Tax-Free Money Market Fund as of and for the six months ended September 30, 2015:
| | | | | | | | | | | | | | | | | | | | |
| | | | | |
| Dynamic Municipal Income Fund | | | | | | | | | | | | | | | | | | | | |
| Underlying Fund | | Market
Value
03/31/15 | | | Purchases
at Cost | | | Proceeds
from Sales | | | Market
Value
09/30/15 | | | Dividend
Income | |
Goldman Sachs Financial Square Tax-Free Money Market Fund | | $ | — | | | $ | 95,858,628 | | | $ | (91,314,062 | ) | | $ | 4,544,566 | | | $ | 313 | |
91
GOLDMAN SACHS MUNICIPAL FIXED INCOME FUNDS
Notes to Financial Statements (continued)
September 30, 2015
|
| 6. PORTFOLIO SECURITIES TRANSACTIONS |
The cost of purchases and proceeds from sales and maturities of long-term securities for the six months ended September 30, 2015, were as follows:
| | | | | | | | | | |
| Fund | | | | Purchases | | | Sales and Maturities | |
Dynamic Municipal Income | | | | $ | 77,154,457 | | | $ | 55,537,141 | |
High Yield Municipal | | | | | 245,641,189 | | | | 196,877,148 | |
Short Duration Tax-Free | | | | | 329,288,323 | | | | 530,647,264 | |
As of the Funds’ most recent fiscal year end, March 31, 2015, The Funds’ capital loss carryforwards and certain timing differences, on a tax-basis were as follows:
| | | | | | | | | | | | |
| | | Dynamic Municipal
Income | | | High Yield
Municipal | | | Short Duration
Tax-Free | |
Capital loss carryforwards:(1) | | | | | | | | | | | | |
Expiring 2016 | | $ | (5,753,929 | ) | | $ | (220,731,177 | ) | | $ | — | |
Expiring 2017 | | | (13,220,467 | ) | | | (553,071,659 | ) | | | — | |
Expiring 2018 | | | (11,494,807 | ) | | | (431,157,569 | ) | | | — | |
Expiring 2019 | | | (704,599 | ) | | | (11,866,582 | ) | | | — | |
Perpetual Short-term | | | (3,837,647 | ) | | | (36,931,546 | ) | | | (312,808 | ) |
Perpetual Long-term | | | (1,055,965 | ) | | | (149,587,978 | ) | | | (759,631 | ) |
Total capital loss carryforwards | | $ | (36,067,414 | ) | | $ | (1,403,346,511 | ) | | $ | (1,072,439 | ) |
Timing differences (Qualified Late Year Loss Deferral, Defaulted Bond Income and Distribution Payable) | | | (587,051 | ) | | | (67,827,297 | ) | | | (640,214 | ) |
| (1) | | With the exception of perpetual capital loss carryforwards, expiration occurs on March 31 of the year indicated. |
As of September 30, 2015, the Funds’ aggregate security unrealized gains and losses based on cost for U.S. federal income tax purposes were as follows:
| | | | | | | | | | | | |
| | | Dynamic Municipal
Income | | | High Yield
Municipal | | | Short Duration
Tax-Free | |
Tax cost | | $ | 581,351,556 | | | $ | 3,187,588,903 | | | $ | 4,022,925,903 | |
Gross unrealized gain | | | 42,351,482 | | | | 365,400,578 | | | | 44,735,842 | |
Gross unrealized loss | | | (21,747,651 | ) | | | (270,925,944 | ) | | | (51,792,709 | ) |
Net unrealized security gain (loss) | | $ | 20,603,831 | | | $ | 94,474,634 | | | $ | (7,056,867 | ) |
The difference between GAAP-basis and tax-basis unrealized gains (losses), as of the most recent fiscal year end, is attributable primarily to wash sales, differences in the tax treatment of swap transactions, and market discount, accretion and premium amortization.
GSAM has reviewed the Funds’ tax positions for all open tax years (the current and prior three years, as applicable) and has concluded that no provision for income tax is required in the Funds’ financial statements. Such open tax years remain subject to examination and adjustment by tax authorities.
92
GOLDMAN SACHS MUNICIPAL FIXED INCOME FUNDS
The Funds’ risks include, but are not limited to, the following:
Interest Rate Risk — When interest rates increase, fixed income securities or instruments held by the Fund will generally decline in value. Long-term fixed income securities or instruments will normally have more price volatility because of this risk than short-term fixed income securities or instruments.
Large Shareholder Transactions Risk — A Fund may experience adverse effects when certain large shareholders, such as other funds, institutional investors (including those trading by use of non-discretionary mathematical formulas), financial intermediaries (who may make investment decisions on behalf of underlying clients and/or include a Fund in their investment model), individuals, accounts and Goldman Sachs affiliates, purchase or redeem large amounts of shares of a Fund. Such large shareholder redemptions may cause the Fund to sell portfolio securities at times when it would not otherwise do so, which may negatively impact a Fund’s NAV and liquidity. These transactions may also accelerate the realization of taxable income to shareholders if such sales of investments resulted in gains, and may also increase transaction costs. In addition, a large redemption could result in a Fund’s current expenses being allocated over a smaller asset base, leading to an increase in the Fund’s expense ratio. Similarly, large Fund share purchases may adversely affect a Fund’s performance to the extent that a Fund is delayed in investing new cash and is required to maintain a larger cash position than it ordinarily would.
Liquidity Risk — The Fund may make investments that are illiquid or that may become less liquid in response to market developments or adverse investor perceptions. Illiquid investments may be more difficult to value. Liquidity risk may also refer to the risk that a Fund will not be able to pay redemption proceeds within the allowable time period because of unusual market conditions, an unusually high volume of redemption requests, or other reasons. To meet redemption requests, a Fund may be forced to sell investments at an unfavorable time and/or under unfavorable conditions. Liquidity risk may be the result of, among other things, the reduced number and capacity of traditional market participants to make a market in fixed income securities or the lack of an active market. The potential for liquidity risk may be magnified by a rising interest rate environment or other circumstances where investor redemptions from fixed income mutual funds may be higher than normal, potentially causing increased supply in the market due to selling activity.
Market and Credit Risks — In the normal course of business, the Funds trade financial instruments and enter into financial transactions where risk of potential loss exists due to changes in the market (market risk). Additionally, the Funds may also be exposed to credit risk in the event that an issuer or guarantor fails to perform or that an institution or entity with which the Funds have unsettled or open transactions defaults.
Non-Diversification Risk — The High Yield Municipal Fund is non-diversified, meaning that it is permitted to invest a larger percentage of its assets in fewer issuers than diversified mutual funds. Thus, the Fund may be more susceptible to adverse developments affecting any single issuer held in its portfolio, and may be more susceptible to greater losses because of these developments.
Portfolio Concentration Risk — As a result of the Funds’ ability to invest a large percentage of their assets in obligations of issuers within the same country, state, region, currency or economic sector, an adverse economic, business or political development may affect the value of the Funds’ investments more than if their investments were not so concentrated.
Under the Trust’s organizational documents, its Trustees, officers, employees and agents are indemnified, to the extent permitted by the Act and state law, against certain liabilities that may arise out of performance of their duties to the Funds. Additionally, in the course of business, the Funds enter into contracts that contain a variety of indemnification clauses. The Funds’ maximum exposure under these arrangements is unknown, as this would involve future claims that may be made against the Funds that have not yet occurred. However, GSAM believes the risk of loss under these arrangements to be remote.
93
GOLDMAN SACHS MUNICIPAL FIXED INCOME FUNDS
Notes to Financial Statements (continued)
September 30, 2015
Subsequent events after the Statement of Assets and Liabilities date have been evaluated through the date the financial statements were issued. GSAM has concluded that there is no impact requiring adjustment or disclosure in the financial statements.
94
GOLDMAN SACHS MUNICIPAL FIXED INCOME FUNDS
|
| 11. SUMMARY OF SHARE TRANSACTIONS |
Share activity is as follows:
| | | | | | | | | | | | | | | | |
| | | Dynamic Municipal Income Fund | |
| | | | |
| | | For the Six Months Ended
September 30, 2015
(Unaudited) | | | For the Fiscal Year Ended
March 31, 2015 | |
| | | | |
| | | Shares | | | Dollars | | | Shares | | | Dollars | |
| | | | |
| Class A Shares | | | | | | | | | | | | | | | | |
Shares sold | | | 1,116,071 | | | $ | 17,397,499 | | | | 2,192,730 | | | $ | 34,781,146 | |
Shares converted from Class B(a) | | | — | | | | — | | | | 5,567 | | | | 88,292 | |
Reinvestment of distributions | | | 173,376 | | | | 2,692,132 | | | | 343,027 | | | | 5,427,228 | |
Shares redeemed | | | (2,328,965 | ) | | | (36,067,253 | ) | | | (2,023,687 | ) | | | (31,928,312 | ) |
| | | | (1,039,518 | ) | | | (15,977,622 | ) | | | 517,637 | | | | 8,368,354 | |
| Class B Shares(a) | | | | | | | | | | | | | | | | |
Shares sold | | | — | | | | — | | | | 198 | | | | 3,514 | |
Shares converted to Class A | | | — | | | | — | | | | (5,567 | ) | | | (88,292 | ) |
Reinvestment of distributions | | | — | | | | — | | | | 2,144 | | | | 33,803 | |
Shares redeemed | | | — | | | | — | | | | (165,084 | ) | | | (2,615,275 | ) |
| | | | — | | | | — | | | | (168,309 | ) | | | (2,666,250 | ) |
| Class C Shares | | | | | | | | | | | | | | | | |
Shares sold | | | 287,505 | | | | 4,480,154 | | | | 306,368 | | | | 4,851,890 | |
Reinvestment of distributions | | | 16,603 | | | | 257,878 | | | | 29,167 | | | | 461,555 | |
Shares redeemed | | | (135,159 | ) | | | (2,103,870 | ) | | | (235,876 | ) | | | (3,727,274 | ) |
| | | | 168,949 | | | | 2,634,162 | | | | 99,659 | | | | 1,586,171 | |
| Institutional Shares | | | | | | | | | | | | | | | | |
Shares sold | | | 6,977,145 | | | | 108,475,443 | | | | 8,459,272 | | | | 134,040,755 | |
Reinvestment of distributions | | | 426,240 | | | | 6,615,707 | | | | 650,973 | | | | 10,299,012 | |
Shares redeemed | | | (4,587,788 | ) | | | (71,287,132 | ) | | | (4,036,725 | ) | | | (63,764,306 | ) |
| | | | 2,815,597 | | | | 43,804,018 | | | | 5,073,520 | | | | 80,575,461 | |
| Service Shares | | | | | | | | | | | | | | | | |
Reinvestment of distributions | | | 20 | | | | 299 | | | | 38 | | | | 613 | |
| | | | 20 | | | | 299 | | | | 38 | | | | 613 | |
| Class IR Shares | | | | | | | | | | | | | | | | |
Shares sold | | | 197,576 | | | | 3,075,184 | | | | 251,546 | | | | 3,979,297 | |
Reinvestment of distributions | | | 7,746 | | | | 120,083 | | | | 8,119 | | | | 128,371 | |
Shares redeemed | | | (93,916 | ) | | | (1,459,071 | ) | | | (49,681 | ) | | | (783,459 | ) |
| | | | 111,406 | | | | 1,736,196 | | | | 209,984 | | | | 3,324,209 | |
NET INCREASE | | | 2,056,454 | | | $ | 32,197,053 | | | | 5,732,529 | | | $ | 91,188,558 | |
| (a) | | Class B Shares were converted into Class A Shares at the close of business on November 14, 2014. |
95
GOLDMAN SACHS MUNICIPAL FIXED INCOME FUNDS
Notes to Financial Statements (continued)
September 30, 2015
|
| 11. SUMMARY OF SHARE TRANSACTIONS (continued) |
Share activity is as follows:
| | | | | | | | | | | | | | | | |
| | | High Yield Municipal Fund | |
| | | | |
| | | For the Six Months Ended
September 30, 2015
(Unaudited) | | | For the Fiscal Year Ended
March 31, 2015 | |
| | | | |
| | | Shares | | | Dollars | | | Shares | | | Dollars | |
| | | | |
| Class A Shares | | | | | | | | | | | | | | | | |
Shares sold | | | 2,484,764 | | | $ | 22,932,707 | | | | 7,969,366 | | | $ | 74,119,450 | |
Shares converted from Class B(a) | | | — | | | | — | | | | 6,258 | | | | 58,391 | |
Reinvestment of distributions | | | 586,600 | | | | 5,380,603 | | | | 1,166,093 | | | | 10,837,012 | |
Shares redeemed | | | (2,890,912 | ) | | | (26,554,096 | ) | | | (10,101,477 | ) | | | (93,738,421 | ) |
| | | | 180,452 | | | | 1,759,214 | | | | (959,760 | ) | | | (8,723,568 | ) |
| Class B Shares(a) | | | | | | | | | | | | | | | | |
Shares sold | | | — | | | | — | | | | 1,118 | | | | 10,304 | |
Shares converted to Class A | | | — | | | | — | | | | (6,258 | ) | | | (58,391 | ) |
Reinvestment of distributions | | | — | | | | — | | | | 9,341 | | | | 86,392 | |
Shares redeemed | | | — | | | | — | | | | (569,001 | ) | | | (5,300,770 | ) |
| | | | — | | | | — | | | | (564,800 | ) | | | (5,262,465 | ) |
| Class C Shares | | | | | | | | | | | | | | | | |
Shares sold | | | 284,298 | | | | 2,614,189 | | | | 1,392,292 | | | | 12,897,227 | |
Reinvestment of distributions | | | 125,860 | | | | 1,154,721 | | | | 257,193 | | | | 2,390,572 | |
Shares redeemed | | | (1,177,690 | ) | | | (10,835,007 | ) | | | (1,424,473 | ) | | | (13,228,420 | ) |
| | | | (767,532 | ) | | | (7,066,097 | ) | | | 225,012 | | | | 2,059,379 | |
| Institutional Shares | | | | | | | | | | | | | | | | |
Shares sold | | | 31,499,142 | | | | 290,221,894 | | | | 72,628,331 | | | | 674,242,071 | |
Reinvestment of distributions | | | 7,897,882 | | | | 72,454,161 | | | | 14,058,074 | | | | 130,713,841 | |
Shares redeemed | | | (32,186,181 | ) | | | (295,784,267 | ) | | | (54,381,772 | ) | | | (504,213,128 | ) |
| | | | 7,210,843 | | | | 66,891,788 | | | | 32,304,633 | | | | 300,742,784 | |
| Class IR Shares | | | | | | | | | | | | | | | | |
Shares sold | | | 229,964 | | | | 2,117,240 | | | | 606,116 | | | | 5,589,918 | |
Reinvestment of distributions | | | 46,234 | | | | 424,404 | | | | 80,427 | | | | 748,299 | |
Shares redeemed | | | (217,880 | ) | | | (2,000,766 | ) | | | (261,181 | ) | | | (2,425,950 | ) |
| | | | 58,318 | | | | 540,878 | | | | 425,362 | | | | 3,912,267 | |
NET INCREASE | | | 6,682,081 | | | $ | 62,125,783 | | | | 31,430,447 | | | $ | 292,728,397 | |
| (a) | | Class B Shares were converted into Class A Shares at the close of business on November 14, 2014. |
96
GOLDMAN SACHS MUNICIPAL FIXED INCOME FUNDS
|
| 11. SUMMARY OF SHARE TRANSACTIONS (continued) |
Share activity is as follows:
| | | | | | | | | | | | | | | | |
| | | Short Duration Tax- Free Fund | |
| | | | |
| | | For the Six Months Ended
September 30, 2015
(Unaudited) | | | For the Fiscal Year Ended
March 31, 2015 | |
| | | | |
| | | Shares | | | Dollars | | | Shares | | | Dollars | |
| | | | |
| Class A Shares | | | | | | | | | | | | | | | | |
Shares sold | | | 891,720 | | | $ | 9,399,454 | | | | 4,572,749 | | | $ | 48,477,544 | |
Reinvestment of distributions | | | 59,399 | | | | 625,698 | | | | 134,781 | | | | 1,429,040 | |
Shares redeemed | | | (3,803,468 | ) | | | (40,088,343 | ) | | | (8,679,098 | ) | | | (91,991,539 | ) |
| | | | (2,852,349 | ) | | | (30,063,191 | ) | | | (3,971,568 | ) | | | (42,084,955 | ) |
| Class C Shares | | | | | | | | | | | | | | | | |
Shares sold | | | 200,034 | | | | 2,105,431 | | | | 607,828 | | | | 6,439,292 | |
Reinvestment of distributions | | | 5,053 | | | | 53,165 | | | | 10,323 | | | | 109,352 | |
Shares redeemed | | | (601,485 | ) | | | (6,330,749 | ) | | | (1,361,291 | ) | | | (14,422,337 | ) |
| | | | (396,398 | ) | | | (4,172,153 | ) | | | (743,140 | ) | | | (7,873,693 | ) |
| Institutional Shares | | | | | | | | | | | | | | | | |
Shares sold | | | 79,524,761 | | | | 837,305,090 | | | | 209,728,744 | | | | 2,221,068,131 | |
Reinvestment of distributions | | | 2,202,434 | | | | 23,165,254 | | | | 4,091,001 | | | | 43,326,069 | |
Shares redeemed | | | (101,891,819 | ) | | | (1,072,739,346 | ) | | | (181,286,450 | ) | | | (1,920,125,989 | ) |
| | | | (20,164,624 | ) | | | (212,269,002 | ) | | | 32,533,295 | | | | 344,268,211 | |
| Service Shares | | | | | | | | | | | | | | | | |
Shares sold | | | 9,555 | | | | 100,816 | | | | — | | | | — | |
Reinvestment of distributions | | | 20 | | | | 211 | | | | 76 | | | | 803 | |
Shares redeemed | | | (3 | ) | | | (33 | ) | | | (23,364 | ) | | | (246,761 | ) |
| | | | 9,572 | | | | 100,994 | | | | (23,288 | ) | | | (245,958 | ) |
| Class IR Shares | | | | | | | | | | | | | | | | |
Shares sold | | | 70,947 | | | | 746,862 | | | | 108,762 | | | | 1,151,151 | |
Reinvestment of distributions | | | 1,868 | | | | 19,649 | | | | 6,930 | | | | 73,384 | |
Shares redeemed | | | (98,336 | ) | | | (1,035,985 | ) | | | (675,144 | ) | | | (7,153,436 | ) |
| | | | (25,521 | ) | | | (269,474 | ) | | | (559,452 | ) | | | (5,928,901 | ) |
NET INCREASE | | | (23,429,320 | ) | | $ | (246,672,826 | ) | | | 27,235,847 | | | $ | 288,134,704 | |
97
GOLDMAN SACHS MUNICIPAL FIXED INCOME FUNDS
Fund Expenses — Six Month Period Ended September 30, 2015 (Unaudited)
As a shareholder of Class A, Class C, Institutional, Service or Class IR Shares of a Fund you incur two types of costs: (1) transaction costs, including sales charges on purchase payments (with respect to Class A Shares) and contingent deferred sales charges on redemptions (with respect to Class C Shares); and redemption fees (with respect to Class A, Class C, Institutional, Service and Class IR Shares, if any); and (2) ongoing costs, including management fees; distribution and service (12b-1) fees (with respect to Class A and Class C Shares); and other Fund expenses. This example is intended to help you understand your ongoing costs (in dollars) of investing in Class A, Class C, Institutional, Service and Class IR Shares of the Funds and to compare these costs with the ongoing costs of investing in other mutual funds.
The example is based on an investment of $1,000 invested at the beginning of the period and held for the entire period from April 1, 2015 through September 30, 2015, which represents a period of 183 days of a 366 day year.
Actual Expenses — The first line under each share class in the table below provides information about actual account values and actual expenses. You may use the information in this line, together with the amount you invested, to estimate the expenses that you paid over the period. Simply divide your account value by $1,000 (for example, an $8,600 account value divided by $1,000=8.6), then multiply the result by the number in the first line under the heading entitled “Expenses Paid” to estimate the expenses you paid on your account during this period.
Hypothetical Example for Comparison Purposes — The second line under each share class in the table below provides information about hypothetical account values and hypothetical expenses based on the Funds’ actual net expense ratio and an assumed rate of return of 5% per year before expenses, which is not the Funds’ actual return. The hypothetical account values and expenses may not be used to estimate the actual ending account balance or expenses you paid for the period. You may use this information to compare the ongoing costs of investing in the Funds and other funds. To do so, compare this 5% hypothetical example with the 5% hypothetical examples that appear in the shareholder reports of the other funds.
Please note that the expenses shown in the table are meant to highlight your ongoing costs only and do not reflect any transactional costs, such as sales charges, redemption fees, or exchange fees. Therefore, the second line of the table is useful in comparing ongoing costs only, and will not help you determine the relative total costs of owning different funds. In addition, if these transactional costs were included, your costs would have been higher.
| | | | | | | | | | | | | | | | | | | | | | | | | | | | | | | | | | | | |
| | | Dynamic Municipal Income Fund | | | High Yield Municipal Fund | | | Short Duration Tax-Free Fund | |
| Share Class | | Beginning
Account
Value
4/01/15 | | | Ending
Account
Value
9/30/15 | | | Expenses
Paid for the
6 Months Ended
9/30/15* | | | Beginning
Account
Value
4/01/15 | | | Ending
Account
Value
9/30/15 | | | Expenses
Paid for the
6 Months Ended
9/30/15* | | | Beginning
Account
Value
4/01/15 | | | Ending
Account
Value
9/30/15 | | | Expenses
Paid for the
6 Months Ended
9/30/15* | |
| Class A | | | | | | | | | | | | | | | | | | | | | | | | | | | | | | | | | | | | |
Actual | | $ | 1,000 | | | $ | 997.30 | | | $ | 3.89 | | | $ | 1,000 | | | $ | 1,001.70 | | | $ | 4.35 | | | $ | 1,000 | | | $ | 998.60 | | | $ | 3.65 | |
Hypothetical 5% return | | | 1,000 | | | | 1,021.10 | + | | | 3.94 | | | | 1,000 | | | | 1,020.65 | + | | | 4.39 | | | | 1,000 | | | | 1,021.35 | + | | | 3.69 | |
| Class C | | | | | | | | | | | | | | | | | | | | | | | | | | | | | | | | | | | | |
Actual | | | 1,000 | | | | 992.90 | | | | 7.67 | | | | 1,000 | | | | 997.90 | | | | 8.09 | | | | 1,000 | | | | 996.60 | | | | 5.64 | |
Hypothetical 5% return | | | 1,000 | | | | 1,017.30 | + | | | 7.77 | | | | 1,000 | | | | 1,016.90 | + | | | 8.17 | | | | 1,000 | | | | 1,019.35 | + | | | 5.70 | |
| Institutional | | | | | | | | | | | | | | | | | | | | | | | | | | | | | | | | | | | | |
Actual | | | 1,000 | | | | 998.40 | | | | 2.20 | | | | 1,000 | | | | 1,003.10 | | | | 2.85 | | | | 1,000 | | | | 1,000.30 | | | | 1.95 | |
Hypothetical 5% return | | | 1,000 | | | | 1,022.80 | + | | | 2.23 | | | | 1,000 | | | | 1,022.15 | + | | | 2.88 | | | | 1,000 | | | | 1,023.05 | + | | | 1.97 | |
| Service | | | | | | | | | | | | | | | | | | | | | | | | | | | | | | | | | | | | |
Actual | | | 1,000 | | | | 996.60 | | | | 4.69 | | | | N/A | | | | N/A | | | | N/A | | | | 1,000 | | | | 997.80 | | | | 4.45 | |
Hypothetical 5% return | | | 1,000 | | | | 1,020.30 | + | | | 4.75 | | | | N/A | | | | N/A | | | | N/A | | | | 1,000 | | | | 1,020.55 | + | | | 4.50 | |
| Class IR | | | | | | | | | | | | | | | | | | | | | | | | | | | | | | | | | | | | |
Actual | | | 1,000 | | | | 998.50 | | | | 2.65 | | | | 1,000 | | | | 1,002.90 | | | | 3.05 | | | | 1,000 | | | | 999.90 | | | | 2.40 | |
Hypothetical 5% return | | | 1,000 | | | | 1,022.35 | + | | | 2.68 | | | | 1,000 | | | | 1,021.95 | + | | | 3.08 | | | | 1,000 | | | | 1,022.60 | + | | | 2.43 | |
| * | | Expenses are calculated using each Fund’s annualized net expense ratio for each class, which represents the ongoing expenses as a percentage of net assets for the six months ended September 30, 2015. Expenses are calculated by multiplying the annualized net expense ratio by the average account value for the period; then multiplying the result by the number of days in the most recent fiscal half year; and then dividing that result by the number of days in the fiscal year. The annualized net expense ratios for the period were as follows: |
| | | | | | | | | | | | | | | | | | | | |
| Fund | | Class A | | | Class C | | | Institutional | | | Service | | | Class IR | |
Dynamic Municipal Income | | | 0.78 | % | | | 1.54 | % | | | 0.44 | % | | | 94 | % | | | 0.53 | % |
High Yield Municipal | | | 0.87 | | | | 1.62 | | | | 0.57 | | | | N/A | | | | 0.61 | |
Short Duration Tax-Free | | | 0.73 | | | | 1.13 | | | | 0.39 | | | | 0.89 | | | | 0.48 | |
| + | | Hypothetical expenses are based on each Fund’s actual annualized net expense ratios and an assumed rate of return of 5% per year before expenses. |
98
GOLDMAN SACHS MUNICIPAL FIXED INCOME FUNDS
Statement Regarding Basis for Approval of Management Agreements (Unaudited)
Background
The Goldman Sachs Dynamic Municipal Income Fund, Goldman Sachs High Yield Municipal Fund, and Goldman Sachs Short Duration Tax-Free Fund (the “Funds”) are investment portfolios of Goldman Sachs Trust (the “Trust”). The Board of Trustees oversees the management of the Trust and reviews the investment performance and expenses of the Funds at regularly scheduled meetings held throughout the year. In addition, the Board of Trustees determines annually whether to approve the continuance of the Trust’s investment management agreements (the “Management Agreements”) with Goldman Sachs Asset Management, L.P. (the “Investment Adviser”) on behalf of the Funds.
The Management Agreements were most recently approved for continuation until June 30, 2016 by the Board of Trustees, including those Trustees who are not parties to the Management Agreements or “interested persons” (as defined in the Investment Company Act of 1940, as amended) of any party thereto (the “Independent Trustees”), at a meeting held on June 10-11, 2015 (the “Annual Meeting”).
The review process undertaken by the Trustees spans the course of the year and culminates with the Annual Meeting. To assist the Trustees in their deliberations, the Trustees have established a Contract Review Committee (the “Committee”), comprised of the Independent Trustees. The Committee held three meetings over the course of the year since the Management Agreements were last approved. At those Committee meetings, regularly scheduled Board or other committee meetings, and/or the Annual Meeting, matters relevant to the renewal of the Management Agreements were considered by the Board, or the Independent Trustees, as applicable. Such matters included:
| | (a) | | the nature and quality of the advisory, administrative, and other services provided to the Funds by the Investment Adviser and its affiliates, including information about: |
| | (i) | | the structure, staff, and capabilities of the Investment Adviser and its portfolio management teams; |
| | (ii) | | the groups within the Investment Adviser and its affiliates that support the portfolio management teams or provide other types of necessary services, including fund services groups (e.g., accounting and financial reporting, tax, shareholder services and operations); controls and risk management groups (e.g., legal, compliance, valuation oversight, credit risk management, internal audit, compliance testing, market risk analysis, finance and strategy and central funding); sales and distribution support groups and others (e.g., information technology and training); |
| | (iii) | | trends in employee headcount; |
| | (iv) | | the Investment Adviser’s financial resources and ability to hire and retain talented personnel and strengthen its operations; and |
| | (v) | | the parent company’s support of the Investment Adviser and its mutual fund business, as expressed by the firm’s senior management; |
| | (b) | | information on the investment performance of each Fund, including comparisons to the performance of similar mutual funds, as provided by a third-party mutual fund data provider engaged as part of the contract review process (the “Outside Data Provider”), benchmark performance indices, and composites of accounts with comparable investment strategies managed by the Investment Adviser (in the case of the Dynamic Municipal Income Fund), and general investment outlooks in the markets in which the Funds invest; |
| | (c) | | information provided by the Investment Adviser indicating the Investment Adviser’s views on whether a Fund’s peer group and/or benchmark index had high, medium, or low relevance given the Fund’s particular investment strategy; |
| | (d) | | the terms of the Management Agreements and other agreements with affiliated service providers entered into by the Trust on behalf of the Funds; |
99
GOLDMAN SACHS MUNICIPAL FIXED INCOME FUNDS
Statement Regarding Basis for Approval of Management Agreements (Unaudited) (continued)
| | (e) | | fee and expense information for the Funds, including: |
| | (i) | | the relative management fee and expense levels of each Fund as compared to those of comparable funds managed by other advisers, as provided by the Outside Data Provider; |
| | (ii) | | the expense trends over time of each Fund; and |
| | (iii) | | to the extent the Investment Adviser manages other types of accounts (such as bank collective trusts, private wealth management accounts, institutional separate accounts, sub-advised mutual funds, and non-U.S. funds) having investment objectives and policies similar to those of the Funds, comparative information on the advisory fees charged and services provided to those accounts by the Investment Adviser; |
| | (f) | | with respect to the extensive investment performance and expense comparison data provided by the Outside Data Provider, its processes in producing that data for the Funds; |
| | (g) | | the undertakings of the Investment Adviser and its affiliates to waive certain fees and to limit certain expenses of each Fund that exceed specified levels, and a summary of contractual fee reductions made by the Investment Adviser and/or its affiliates over the past several years with respect to the Funds; |
| | (h) | | information relating to the profitability of the Management Agreements and the transfer agency and distribution and service arrangements of each Fund and the Trust as a whole to the Investment Adviser and its affiliates; |
| | (i) | | whether each Fund’s existing management fee schedule adequately addressed any economies of scale; |
| | (j) | | a summary of the “fall-out” benefits derived by the Investment Adviser and its affiliates from their relationships with the Funds, including the fees received by the Investment Adviser’s affiliates from the Funds for transfer agency, portfolio trading, distribution and other services; |
| | (k) | | a summary of potential benefits derived by the Funds as a result of their relationship with the Investment Adviser; |
| | (l) | | information regarding portfolio trading and how the Investment Adviser carries out its duty to seek best execution; |
| | (m) | | portfolio manager ownership of Fund shares; the manner in which portfolio manager compensation is determined; and the number and types of accounts managed by the portfolio managers; |
| | (n) | | the nature and quality of the services provided to the Funds by their unaffiliated service providers, and the Investment Adviser’s general oversight and evaluation (including reports on due diligence) of those service providers as part of the administration services provided under the Management Agreements; and |
| | (o) | | the Investment Adviser’s processes and policies addressing various types of potential conflicts of interest; its approach to risk management; the annual review of the effectiveness of the Funds’ compliance program; and periodic compliance reports. |
The Trustees also received an overview of the Funds’ distribution arrangements. They received information regarding the Funds’ assets, share purchase and redemption activity and the payment of Rule 12b-1 distribution and service fees and non-Rule 12b-1 shareholder service and/or administration fees with respect to the Funds. Information was also provided to the Trustees relating to revenue sharing payments made by and services provided by the Investment Adviser and its affiliates to intermediaries that promote the sale, distribution, and/or servicing of Fund shares.
100
GOLDMAN SACHS MUNICIPAL FIXED INCOME FUNDS
Statement Regarding Basis for Approval of Management Agreements (Unaudited) (continued)
The presentations made at the Board and Committee meetings and at the Annual Meeting encompassed the Funds and other mutual fund portfolios for which the Board of Trustees has responsibility. In evaluating the Management Agreements at the Annual Meeting, the Trustees relied upon their knowledge, resulting from their meetings and other interactions throughout the year, of the Investment Adviser and its affiliates, their services, and the Funds. In conjunction with these meetings, the Trustees received written materials and oral presentations on the topics covered, and were advised by their independent legal counsel regarding their responsibilities and other regulatory requirements related to the approval and continuation of mutual fund investment management agreements under applicable law. In addition, the Investment Adviser and its affiliates provided the Independent Trustees with a written response to a formal request for information sent on behalf of the Independent Trustees by their independent legal counsel. During the course of their deliberations, the Independent Trustees met in executive sessions with their independent legal counsel, without representatives of the Investment Adviser or its affiliates present. The Independent Trustees also discussed the broad range of other investment choices that are available to Fund investors, including the availability of comparable funds managed by other advisers.
Nature, Extent, and Quality of the Services Provided Under the Management Agreements
As part of their review, the Trustees considered the nature, extent, and quality of the services provided to the Funds by the Investment Adviser. In this regard, the Trustees considered both the investment advisory services and non-advisory services that are provided by the Investment Adviser and its affiliates. The Trustees noted the transition in the leadership and changes in personnel of various of the Investment Adviser’s portfolio management teams that had occurred in recent periods, and the ongoing recruitment efforts aimed at bringing high quality investment talent to the Investment Adviser. They also noted the Investment Adviser’s commitment to maintaining high quality systems. The Trustees concluded that the Investment Adviser continued to commit substantial financial and operational resources to the Funds and expressed confidence that the Investment Adviser would continue to do so in the future. The Trustees also recognized that the Investment Adviser had made significant commitments to address regulatory compliance requirements applicable to the Funds and the Investment Adviser.
Investment Performance
The Trustees also considered the investment performance of the Funds. In this regard, they compared the investment performance of each Fund to its peers using rankings and ratings compiled by the Outside Data Provider as of December 31, 2014, and updated performance information prepared by the Investment Adviser using the peer groups identified by the Outside Data Provider as of March 31, 2015. The information on each Fund’s investment performance was provided for the one-, three-, five-, and ten-year periods ending on the applicable dates. The Trustees also reviewed each Fund’s investment performance over time (including on a year-by-year basis) relative to its performance benchmark. As part of this review, they considered the investment performance trends of the Funds over time, and reviewed the investment performance of each Fund in light of its investment objective and policies and market conditions. The Trustees also received information comparing the Dynamic Municipal Income Fund’s performance to that of a composite of accounts with comparable investment strategies managed by the Investment Adviser.
In addition, the Trustees considered materials prepared and presentations made by the Investment Adviser’s senior management and portfolio management personnel, in which Fund performance was assessed. The Trustees also considered the Investment Adviser’s periodic reports with respect to the Funds’ risk profiles, and how the Investment Adviser’s approach to risk monitoring and management influences portfolio management.
101
GOLDMAN SACHS MUNICIPAL FIXED INCOME FUNDS
Statement Regarding Basis for Approval of Management Agreements (Unaudited) (continued)
The Trustees noted that the Dynamic Municipal Income Fund’s Institutional Shares had placed in the first quartile of the Fund’s peer group and had outperformed the Fund’s benchmark index for the one-, three-, five-, and ten-year periods ended March 31, 2015. They considered that the Fund had been repositioned from the Goldman Sachs Municipal Income Fund in December 2014, which involved changes to the Fund’s investment objective, investment strategy, and benchmark. The Trustees noted that the High Yield Municipal Fund’s Institutional Shares had placed in the first quartile of the Fund’s peer group for the three- and five-year periods and in the third quartile for the one- and ten-year periods, and had outperformed the Fund’s benchmark index for the one-, three-, and five-year periods and underperformed for the ten-year period ended March 31, 2015. They noted that the Short Duration Tax-Free Fund’s Institutional Shares had placed in the second quartile of the Fund’s peer group for the one-, three-, five-, and ten-year periods, and had outperformed the Fund’s benchmark index for the one-, three-, and five-year periods and underperformed for the ten-year period ended March 31, 2015.
Costs of Services Provided and Competitive Information
The Trustees considered the contractual terms of the Management Agreements and the fee rates payable by each Fund under its respective Management Agreement. In this regard, the Trustees considered information on the services rendered by the Investment Adviser to the Funds, which included both advisory and administrative services that were directed to the needs and operations of the Funds as registered mutual funds.
In particular, the Trustees reviewed analyses prepared by the Outside Data Provider regarding the expense rankings of the Funds. The analyses provided a comparison of the Funds’ management fees and breakpoints to those of relevant peer groups and category universes; an expense analysis which compared each Fund’s overall net and gross expenses to a peer group and a category universe; and a five-year history comparing each Fund’s net expenses to the peer and category medians. The analyses also compared each Fund’s transfer agency, custody, and distribution fees, other expenses and fee waivers/reimbursements to those of the peer group and category medians. The Trustees concluded that the comparisons provided by the Outside Data Provider were useful in evaluating the reasonableness of the management fees and total expenses paid by the Funds.
In addition, the Trustees considered the Investment Adviser’s undertakings to waive a portion of its management fees (with respect to the Dynamic Municipal Income and Short Duration Tax-Free Funds) and to limit certain expenses of each Fund that exceed specified levels, as well as the undertakings of Goldman, Sachs & Co. (“Goldman Sachs”), the Funds’ distributor and transfer agent, to waive a portion of the distribution and service fees paid by the Short Duration Tax-Free Fund’s Class C Shares and a portion of the transfer agency fees paid by the High Yield Municipal Fund’s Class A, Class C, and Class IR Shares. They also considered, to the extent that the Investment Adviser manages other types of accounts having investment objectives and policies similar to those of the Funds, comparative fee information for services provided by the Investment Adviser to those accounts, and information that indicated that services provided to the Funds differed in various significant respects from the services provided to other types of accounts which, in many cases, operated under less stringent legal and regulatory structures, required fewer services from the Investment Adviser to a smaller number of client contact points, and were less time-intensive.
In addition, the Trustees noted that shareholders are able to redeem their Fund shares at any time if shareholders believe that the Fund fees and expenses are too high or if they are dissatisfied with the performance of the Fund.
102
GOLDMAN SACHS MUNICIPAL FIXED INCOME FUNDS
Statement Regarding Basis for Approval of Management Agreements (Unaudited) (continued)
Profitability
The Trustees reviewed the Investment Adviser’s revenues and pre-tax profit margins with respect to the Trust and each of the Funds. In this regard the Trustees noted that they had received, among other things, profitability analyses and summaries, revenue and expense schedules by Fund and by function (i.e., investment management, transfer agency and distribution and service), and information on the Investment Adviser’s expense allocation methodology. They observed that the profitability and expense figures are substantially similar to those used by the Investment Adviser for many internal purposes, including compensation decisions among various business groups, and are thus subject to a vigorous internal debate about how certain revenue and expenses should be allocated. The Trustees also noted that the internal audit group within the Goldman Sachs organization had audited the expense allocation methodology and was satisfied with the reasonableness, consistency, and accuracy of the Investment Adviser’s expense allocation methodology and profitability analysis calculations. Profitability data for the Trust and each Fund were provided for 2014 and 2013, and the Trustees considered this information in relation to the Investment Adviser’s overall profitability. The Trustees considered the Investment Adviser’s revenues and pre-tax profit margins both in absolute terms and in comparison to information on the reported pre-tax profit margins earned by certain other asset management firms.
Economies of Scale
The Trustees considered the information that had been provided regarding the Investment Adviser’s profitability. The Trustees also considered the breakpoints in the fee rate payable under the Management Agreements for each of the Funds at the following annual percentage rates of the average daily net assets of the Funds:
| | | | | | | | | | | | |
Average Daily
Net Assets | | High Yield
Municipal
Fund | | | Dynamic
Municipal
Income Fund | | | Short Duration
Tax-Free Fund | |
| First $1 billion | | | 0.55 | % | | | 0.55 | % | | | 0.40 | % |
| Next $1 billion | | | 0.55 | | | | 0.50 | | | | 0.36 | |
| Next $3 billion | | | 0.50 | | | | 0.48 | | | | 0.34 | |
| Next $3 billion | | | 0.48 | | | | 0.47 | | | | 0.33 | |
| Over $8 billion | | | 0.47 | | | | 0.46 | | | | 0.32 | |
The Trustees noted that the breakpoints were designed to share potential economies of scale, if any, with the Funds and their shareholders as assets under management reach those asset levels. The Trustees considered the amounts of assets in the Funds; the Funds’ recent share purchase and redemption activity; the information provided by the Investment Adviser relating to the costs of the services provided by the Investment Adviser and its affiliates and their realized profits; information comparing fee rates charged by the Investment Adviser with fee rates charged to other funds in the peer groups; and the Investment Adviser’s undertakings to waive a portion of its management fees (with respect to the Dynamic Municipal Income and Short Duration Tax-Free Funds) and to limit certain expenses of each Fund that exceed specified levels, as well as Goldman Sachs’ undertakings to waive a portion of the distribution and service fees paid by the Short Duration Tax-Free Fund’s Class C Shares and a portion of the transfer agency fees paid by the High Yield Municipal Fund’s Class A, Class C, and Class IR Shares. Upon reviewing these matters at the Annual Meeting, the Trustees concluded that the fee breakpoints represented a means of assuring that benefits of scalability, if any, would be passed along to shareholders at the specified asset levels. They also noted that the Investment Adviser had passed along savings to shareholders of the High Yield Municipal and Short Duration Tax-Free Funds, which each had asset levels above at least the first breakpoint during the prior fiscal year.
103
GOLDMAN SACHS MUNICIPAL FIXED INCOME FUNDS
Statement Regarding Basis for Approval of Management Agreements (Unaudited) (continued)
Other Benefits to the Investment Adviser and Its Affiliates
The Trustees also considered the other benefits derived by the Investment Adviser and its affiliates from their relationships with the Funds as stated above, including: (a) transfer agency fees received by Goldman Sachs; (b) futures commissions earned by Goldman Sachs for executing futures transactions on behalf of the Funds; (c) trading efficiencies resulting from aggregation of orders of the Funds with those for other funds or accounts managed by the Investment Adviser; (d) the Investment Adviser’s ability to leverage the infrastructure designed to service the Funds on behalf of its other clients; (e) the Investment Adviser’s ability to cross-market other products and services to Fund shareholders; (f) Goldman Sachs’ retention of certain fees as Fund Distributor; (g) the Investment Adviser’s ability to negotiate better pricing with custodians on behalf of its other clients, as a result of the relationship with the Funds; and (h) the possibility that the working relationship between the Investment Adviser and the Funds’ third-party service providers may cause those service providers to be more likely to do business with other areas of Goldman Sachs. In the course of considering the foregoing, the Independent Trustees requested and received further information quantifying certain of these fall-out benefits.
Other Benefits to the Funds and Their Shareholders
The Trustees also noted that the Funds receive certain potential benefits as a result of their relationship with the Investment Adviser, including: (a) trading efficiencies resulting from aggregation of orders of the Funds with those of other funds or accounts managed by the Investment Adviser; (b) enhanced servicing from vendors because of the volume of business generated by the Investment Adviser and its affiliates; (c) enhanced servicing from broker-dealers because of the volume of business generated by the Investment Adviser and its affiliates; (d) the Investment Adviser’s ability to negotiate favorable terms with derivatives counterparties on behalf of the Funds as a result of the size and reputation of the Goldman Sachs organization; (e) the Investment Adviser’s knowledge and experience gained from managing other accounts and products; (f) the Investment Adviser’s ability to hire and retain qualified personnel to provide services to the Funds because of the reputation of the Goldman Sachs organization; (g) the Funds’ access, through the Investment Adviser, to certain firmwide resources (e.g., proprietary risk management systems and databases), subject to certain restrictions; and (h) the Funds’ access to certain affiliated distribution channels. In addition, the Trustees noted the competitive nature of the mutual fund marketplace, and considered that many of the Funds’ shareholders invested in the Funds in part because of the Funds’ relationship with the Investment Adviser and that those shareholders have a general expectation that the relationship will continue.
Conclusion
In connection with their consideration of the Management Agreements, the Trustees gave weight to each of the factors described above, but did not identify any particular factor as controlling their decision. After deliberation and consideration of all of the information provided, including the factors described above, the Trustees concluded, in the exercise of their business judgment, that the management fees paid by each of the Funds were reasonable in light of the services provided to it by the Investment Adviser, the Investment Adviser’s costs and each Fund’s current and reasonably foreseeable asset levels. The Trustees unanimously concluded that the Investment Adviser’s continued management likely would benefit each Fund and its shareholders and that the Management Agreements should be approved and continued with respect to each applicable Fund until June 30, 2016.
104
FUNDS PROFILE
Goldman Sachs Funds

Goldman Sachs is a premier financial services firm, known since 1869 for creating thoughtful and customized investment solutions in complex global markets.
Today, the Investment Management Division of Goldman Sachs serves a diverse set of clients worldwide, including private institutions, public entities and individuals. With approximately $1.02 trillion in assets under supervision as of September 30, 2015, Goldman Sachs Asset Management (“GSAM”) has portfolio management teams located around the world and our investment professionals bring firsthand knowledge of local markets to every investment decision. Assets under supervision includes assets under management and other client assets for which Goldman Sachs does not have full discretion. GSAM leverages the resources of Goldman, Sachs & Co. subject to legal, internal and regulatory restrictions.

Money Market1
Financial Square FundsSM
| n | | Financial Square Tax-Exempt Funds |
| n | | Financial Square Treasury Solutions Fund2 |
| n | | Financial Square Government Fund |
| n | | Financial Square Money Market Fund |
| n | | Financial Square Prime Obligations Fund |
| n | | Financial Square Treasury Instruments Fund |
| n | | Financial Square Treasury Obligations Fund |
| n | | Financial Square Federal Instruments Fund |
Fixed Income
Short Duration and Government
| n | | High Quality Floating Rate Fund |
| n | | Limited Maturity Obligations Fund |
| n | | Short Duration Government Fund |
| n | | Short Duration Income Fund |
| n | | Inflation Protected Securities Fund |
Multi-Sector
Municipal and Tax-Free
| n | | High Yield Municipal Fund |
| n | | Dynamic Municipal Income Fund3 |
| n | | Short Duration Tax-Free Fund |
Single Sector
| n | | Investment Grade Credit Fund |
| n | | High Yield Floating Rate Fund |
| n | | Emerging Markets Debt Fund |
| n | | Local Emerging Markets Debt Fund |
| n | | Dynamic Emerging Markets Debt Fund |
Fixed Income Alternatives
| n | | Long Short Credit Strategies Fund |
| n | | Fixed Income Macro Strategies Fund |
Fundamental Equity
| n | | Small/Mid Cap Value Fund |
| n | | Small/Mid Cap Growth Fund |
| n | | Flexible Cap Growth Fund |
| n | | Concentrated Growth Fund |
| n | | Technology Opportunities Fund4 |
| n | | Growth Opportunities Fund |
| n | | Rising Dividend Growth Fund |
| n | | Dynamic U.S. Equity Fund5 |
Tax-Advantaged Equity
| n | | U.S. Tax-Managed Equity Fund |
| n | | International Tax-Managed Equity Fund |
| n | | U.S. Equity Dividend and Premium Fund |
| n | | International Equity Dividend and Premium Fund |
Equity Insights
| n | | Small Cap Equity Insights Fund |
| n | | U.S. Equity Insights Fund |
| n | | Small Cap Growth Insights Fund |
| n | | Large Cap Growth Insights Fund |
| n | | Large Cap Value Insights Fund |
| n | | Small Cap Value Insights Fund |
| n | | International Small Cap Insights Fund |
| n | | International Equity Insights Fund |
| n | | Emerging Markets Equity Insights Fund |
Fundamental Equity International
| n | | Strategic International Equity Fund |
| n | | Focused International Equity Fund |
| n | | International Small Cap Fund |
| n | | Emerging Markets Equity Fund6 |
Select Satellite7
| n | | Real Estate Securities Fund |
| n | | International Real Estate Securities Fund |
| n | | Global Real Estate Securities Fund |
| n | | Commodity Strategy Fund |
| n | | Dynamic Commodity Strategy Fund |
| n | | Dynamic Allocation Fund |
| n | | Absolute Return Tracker Fund |
| n | | Managed Futures Strategy Fund |
| n | | MLP Energy Infrastructure Fund |
| n | | Multi-Manager Alternatives Fund |
| n | | Multi-Asset Real Return Fund |
| n | | Retirement Portfolio Completion Fund |
| n | | Absolute Return Multi-Asset Fund |
Total Portfolio Solutions7
| n | | Global Managed Beta Fund |
| n | | Multi-Manager Non-Core Fixed Income Fund |
| n | | Multi-Manager U.S. Dynamic Equity Fund |
| n | | Multi-Manager Global Equity Fund |
| n | | Multi-Manager International Equity Fund |
| n | | Tactical Tilt Implementation Fund |
| n | | Balanced Strategy Portfolio |
| n | | Multi-Manager Real Assets Strategy Fund |
| n | | Growth and Income Strategy Portfolio |
| n | | Growth Strategy Portfolio |
| n | | Equity Growth Strategy Portfolio |
| n | | Satellite Strategies Portfolio |
| n | | Enhanced Dividend Global Equity Portfolio |
| n | | Tax Advantaged Global Equity Portfolio |
| 1 | | An investment in a money market fund is neither insured nor guaranteed by the Federal Deposit Insurance Corporation (“FDIC”) or any other government agency. Although the Funds seek to preserve the value of your investment at $1.00 per share, it is possible to lose money by investing in the Funds. |
| 2 | | Effective on September 30, 2015, the Goldman Sachs Financial Square Federal Fund was renamed the Goldman Sachs Financial Square Treasury Solutions Fund. |
| 3 | | Effective on December 18, 2014, the Goldman Sachs Municipal Income Fund was renamed the Goldman Sachs Dynamic Municipal Income Fund. |
| 4 | | Effective on July 31, 2015, the Goldman Sachs Technology Tollkeeper Fund was renamed the Goldman Sachs Technology Opportunities Fund. |
| 5 | | Effective on April 30, 2015, the Goldman Sachs U.S. Equity Fund was renamed the Goldman Sachs Dynamic U.S. Equity Fund. |
| 6 | | Effective at the close of business on October 23, 2015, the Goldman Sachs BRIC Fund (Brazil, Russia, India, China) was reorganized with and into the Goldman Sachs Emerging Markets Equity Fund. |
| 7 | | Individual Funds within the Total Portfolio Solutions and Select Satellite categories will have various placement on the risk/return spectrum and may have greater or lesser risk than that indicated by the placement of the general Total Portfolio Solutions or Select Satellite category. |
Financial Square FundsSM is a registered service mark of Goldman, Sachs & Co.
*This list covers open-end funds only. Please visit our website at www.GSAMFUNDS.com to learn about our closed-end funds and exchange-traded funds.
| | |
TRUSTEES Ashok N. Bakhru, Chairman Kathryn A. Cassidy John P. Coblentz, Jr. Diana M. Daniels Joseph P. LoRusso Herbert J. Markley James A. McNamara Jessica Palmer Alan A. Shuch Richard P. Strubel Roy W. Templin Gregory G. Weaver | | OFFICERS James A. McNamara, President Scott M. McHugh, Principal Financial Officer and Treasurer Caroline Kraus, Secretary |
| |
GOLDMAN, SACHS & CO. Distributor and Transfer Agent | | GOLDMAN SACHS ASSET MANAGEMENT, L.P. Investment Adviser |
Visit our Web site at www.GSAMFUNDS.com to obtain the most recent month-end returns.
Goldman Sachs Asset Management, L.P. 200 West Street, New York, New York 10282
The reports concerning the Funds included in this shareholder report may contain certain forward-looking statements about the factors that may affect the performance of the Funds in the future. These statements are based on Fund management’s predictions and expectations concerning certain future events and their expected impact on the Funds, such as performance of the economy as a whole and of specific industry sectors, changes in the levels of interest rates, the impact of developing world events, and other factors that may influence the future performance of the Funds. Management believes these forward-looking statements to be reasonable, although they are inherently uncertain and difficult to predict. Actual events may cause adjustments in portfolio management strategies from those currently expected to be employed.
A description of the policies and procedures that the Funds use to determine how to vote proxies relating to portfolio securities and information regarding how a Fund voted proxies relating to portfolio securities during the most recent 12-month period ended June 30 is available (I) without charge, upon request by calling 1-800-526-7384 (for Retail Shareholders) or 1-800-621-2550 (for Institutional Shareholders); and (II) on the Securities and Exchange Commission (“SEC”) Web site at http://www.sec.gov.
The Funds file their complete schedule of portfolio holdings with the SEC for the first and third quarters of each fiscal year on Form N-Q. The Funds’ Form N-Qs are available on the SEC’s Web site at http://www.sec.gov within 60 days after the Funds’ first and third fiscal quarters. The Funds’ Form N-Qs may be reviewed and copied at the SEC’s Public Reference Room in Washington, D.C. and information on the operation of the Public Reference Room may also be obtained by calling 1-800-SEC-0330. Form N-Qs may be obtained upon request and without charge by calling 1-800-526-7384 (for Retail Shareholders) or 1-800-621-2550 (for Institutional Shareholders).
Goldman, Sachs & Co. (“Goldman Sachs”) does not provide legal, tax or accounting advice. Any statement contained in this communication (including any attachments) concerning U.S. tax matters was not intended or written to be used, and cannot be used, for the purpose of avoiding penalties under the Internal Revenue Code, and was written to support the promotion or marketing of the transaction(s) or matter(s) addressed. Clients of Goldman Sachs should obtain their own independent tax advice based on their particular circumstances.
The website links provided are for your convenience only and are not an endorsement or recommendation by GSAM of any of these websites or the products or services offered. GSAM is not responsible for the accuracy and validity of the content of these websites.
Economic and market forecasts presented herein reflect our judgment as of the date of this presentation and are subject to change without notice. These forecasts do not take into account the specific investment objectives, restrictions, tax and financial situation or other needs of any specific client. Actual data will vary and may not be reflected here. These forecasts are subject to high levels of uncertainty that may affect actual performance. Accordingly, these forecasts should be viewed as merely representative of a broad range of possible outcomes. These forecasts are estimated, based on assumptions, and are subject to significant revision and may change materially as economic and market conditions change. Goldman Sachs has no obligation to provide updates or changes to these forecasts. Case studies and examples are for illustrative purposes only.
Fund holdings and allocations shown are as of September 30, 2015 and may not be representative of future investments. Fund holdings should not be relied on in making investment decisions and should not be construed as research or investment advice regarding particular securities. Current and future holdings are subject to risk.
This material is not authorized for distribution to prospective investors unless preceded or accompanied by a current Prospectus or summary prospectus, if applicable. Investors should consider a Fund’s objective, risks, and charges and expenses, and read the summary prospectus, if available, and/or the Prospectus carefully before investing or sending money. The summary prospectus, if available, and the Prospectus contain this and other information about a Fund and may be obtained from your authorized dealer or from Goldman, Sachs & Co. by calling (retail – 1-800-526-7384) (institutional – 1-800-621-2550).
© 2015 Goldman Sachs. All rights reserved. 172515.MF.MED.TMPL/11/2015 TFFISAR-15/16K
(a) As of the end of the period covered by this report, the registrant has adopted a code of ethics that applies to the registrant’s principal executive officer, principal financial officer, principal accounting officer or controller, or persons performing similar functions, regardless of whether these individuals are employed by the registrant or a third party (the “Code of Ethics”).
(b) During the period covered by this report, no amendments were made to the provisions of the Code of Ethics.
(c) During the period covered by this report, the registrant did not grant any waivers, including an implicit waiver, from any provision of the Code of Ethics.
(d) A copy of the Code of Ethics is available as provided in Item 12(a)(1) of this report.
| ITEM 3. | AUDIT COMMITTEE FINANCIAL EXPERT. |
The registrant’s board of trustees has determined that the registrant has at least one “audit committee financial expert” (as defined in Item 3 of Form N-CSR) serving on its audit committee. John P. Coblentz, Jr. is the “audit committee financial expert” and is “independent” (as each term is defined in Item 3 of Form N-CSR).
| ITEM 4. | PRINCIPAL ACCOUNTANT FEES AND SERVICES. |
Table 1 — Items 4(a) - 4(d). The accountant fees below reflect the aggregate fees billed by all of the Funds of the Goldman Sachs Trust and includes the Goldman Sachs Funds to which this certified shareholder report relates.
| | | | | | | | | | | | |
| | | 2015 | | 2014 | | Description of Services Rendered |
| | | |
| | | | | | | | | | | | |
| | | |
Audit Fees: | | | | | | | | | | | | |
| | | |
• PricewaterhouseCoopers LLP
(“PwC”) | | | $ | 3,570,472 | | | | $ | 2,208,710 | | | Financial Statement audits. |
| | | |
Audit-Related Fees: | | | | | | | | | | | | |
| | | |
• PwC | | | $ | 0 | | | | $ | 0 | | | Other attest services. |
| | | |
Tax Fees: | | | | | | | | | | | | |
| | | |
• PwC | | | $ | 659,410 | | | | $ | 723,485 | | | Tax compliance services provided in connection with the preparation and review of registrant’s tax returns. |
Table 2 — Items 4(b)(c) & (d). Non-Audit Services to the Goldman Sachs Trust’s service affiliates * that were pre-approved by the Audit Committee of the Goldman Sachs Trust pursuant to Rule 2-01(c)(7)(ii) of Regulation S-X.
| | | | | | | | | | | | |
| | | 2015 | | 2014 | | Description of Services Rendered |
| | | |
| | | | | | | | | | | | |
| | | |
Audit-Related Fees: | | | | | | | | | | | | |
| | | |
• PwC | | | $ | 1,568,616 | | | | $ | 1,486,420 | | | Internal control review performed in accordance with Statement on Standards for Attestation Engagements No. 16. These fees are borne by the Funds’ Adviser. |
| * | These include the advisor (excluding sub-advisors) and any entity controlling, controlled by or under common control with the advisor that provides ongoing services to the registrant (hereinafter referred to as “service affiliates”). |
Item 4(e)(1) — Audit Committee Pre-Approval Policies and Procedures
Pre-Approval of Audit and Non-Audit Services Provided to the Funds of the Goldman Sachs Trust. The Audit and Non-Audit Services Pre-Approval Policy (the “Policy”) adopted by the Audit Committee of Goldman Sachs Trust (“GST”) sets forth the procedures and the conditions pursuant to which services performed by an independent auditor for GST may be pre-approved. Services may be pre-approved specifically by the Audit Committee as a whole or, in certain circumstances, by the Audit Committee Chairman or the person designated as the Audit Committee Financial Expert. In addition, subject to specified cost limitations, certain services may be pre-approved under the provisions of the Policy. The Policy provides that the Audit Committee will consider whether the services provided by an independent auditor are consistent with the Securities and Exchange Commission’s rules on auditor independence. The Policy provides for periodic review and pre-approval by the Audit Committee of the services that may be provided by the independent auditor.
De Minimis Waiver. The pre-approval requirements of the Policy may be waived with respect to the provision of non-audit services that are permissible for an independent auditor to perform, provided (1) the aggregate amount of all such services provided constitutes no more than five percent of the total amount of revenues subject to pre-approval that was paid to the independent auditors during the fiscal year in which the services are provided; (2) such services were not recognized by GST at the time of the engagement to be non-audit services; and (3) such services are promptly brought to the attention of the Audit Committee and approved prior to the completion of the audit by the Audit Committee or by one or more members of the Audit Committee to whom authority to grant such approvals has been delegated by the Audit Committee, pursuant to the pre-approval provisions of the Policy.
Pre-Approval of Non-Audit Services Provided to GST’s Investment Advisers. The Policy provides that, in addition to requiring pre-approval of audit and non-audit services provided to GST, the Audit Committee will pre-approve those non-audit services provided to GST’s investment advisers (and entities controlling, controlled by or under common control with the investment advisers that provide ongoing services to GST) where the engagement relates directly to the operations or financial reporting of GST.
Item 4(e)(2) – 0% of the audit-related fees, tax fees and other fees listed in Table 1 were approved by GST’s Audit Committee pursuant to the “de minimis” exception of Rule 2-01(c)(7)(i)(C) of Regulation S-X. In addition, 0% of the non-audit services to the GST’s service affiliates listed in Table 2 were approved by GST’s Audit Committee pursuant to the “de minimis” exception of Rule 2-01(c)(7)(i)(C) of Regulation S-X.
Item 4(f) – Not applicable.
Item 4(g) Aggregate Non-Audit Fees Disclosure
The aggregate non-audit fees billed to GST by PwC for the twelve months ended March 31, 2015 and March 31, 2014 were approximately $659,410 and $723,485 respectively. The aggregate non-audit fees billed to GST’s adviser and service affiliates by PwC for non-audit services for the twelve months ended December 31, 2014 and December 31, 2013 were approximately $10.2 million and $9.8 million respectively. With regard to the aggregate non-audit fees billed to GST’s adviser and service affiliates, the 2014 and 2013 amounts include fees for non-audit services required to be pre-approved [see Table 2] and fees for non-audit services that did not require pre-approval since they did not directly relate to GST’s operations or financial reporting.
Item 4(h) — GST’s Audit Committee has considered whether the provision of non-audit services to GST’s investment adviser and service affiliates that did not require pre-approval pursuant to paragraph (c)(7)(ii) of Rule 2-01 of Regulation S-X is compatible with maintaining the auditors’ independence.
| ITEM 5. | AUDIT COMMITTEE OF LISTED REGISTRANTS. |
| ITEM 6. | SCHEDULE OF INVESTMENTS. |
| | Schedule of Investments is included as part of the Report to Stockholders filed under Item 1. |
| ITEM 7. | DISCLOSURE OF PROXY VOTING POLICIES AND PROCEDURES FOR CLOSED-END MANAGEMENT INVESTMENT COMPANIES. |
| ITEM 8. | PORTFOLIO MANAGERS OF CLOSED-END MANAGEMENT INVESTMENT COMPANIES. |
| ITEM 9. | PURCHASES OF EQUITY SECURITIES BY CLOSED-END MANAGEMENT INVESTMENT COMPANY AND AFFILIATED PURCHASERS. |
| ITEM 10. | SUBMISSION OF MATTERS TO A VOTE OF SECURITY HOLDERS. |
| | There have been no material changes to the procedures by which shareholders may recommend nominees to the registrant’s board of trustees. |
| ITEM 11. | CONTROLS AND PROCEDURES. |
| | (a) | The registrant’s principal executive and principal financial officers, or persons performing similar functions have concluded that the registrant’s disclosure controls and procedures (as defined in Rule 30a-3(c) under the Investment Company Act of 1940, as amended (the “1940 Act”)) are effective as of a date within 90 days of the filing of this report that includes the disclosure required by this paragraph, based on the evaluation of these controls and procedures required by Rule 30a-3(b) under the 1940 Act and 15d-15(b) under the Securities Exchange Act of 1934, as amended. |
| | (b) | There were no changes in the registrant’s internal control over financial reporting (as defined in Rule 30a-3(d) under the 1940 Act) that occurred during the registrant’s second fiscal quarter of the period covered by this report that have materially affected, or are reasonably likely to materially affect, the registrant’s internal control over financial reporting. |
| | | | |
| (a)(1) | | Goldman Sachs Trust’s Code of Ethics for Principal Executive and Senior Financial Officers is incorporated by reference to Exhibit 12(a)(1) of the registrant’s Form N-CSR filed on July 8, 2015 for its International Equity Insights Funds. |
| | |
| (a)(2) | | Exhibit 99.CERT | | Certifications pursuant to Section 302 of the Sarbanes-Oxley Act of 2002 filed herewith. |
| | |
| (b) | | Exhibit 99.906CERT | | Certifications pursuant to Section 906 of the Sarbanes-Oxley Act of 2002 filed herewith. |
SIGNATURES
Pursuant to the requirements of the Securities Exchange Act of 1934 and the Investment Company Act of 1940, the registrant has duly caused this report to be signed on its behalf by the undersigned, thereunto duly authorized.
| | |
| | | Goldman Sachs Trust |
| |
| By: | | /s/ James A. McNamara |
| |
| | |
| | James A. McNamara |
| | President/Chief Executive Officer |
| | Goldman Sachs Trust |
| |
| Date: | | December 7, 2015 |
Pursuant to the requirements of the Securities Exchange Act of 1934 and the Investment Company Act of 1940, this report has been signed below by the following persons on behalf of the registrant and in the capacities and on the dates indicated.
| | |
| By: | | /s/ James A. McNamara |
| |
| | |
| | James A. McNamara |
| | President/Chief Executive Officer |
| | Goldman Sachs Trust |
| |
| Date: | | December 7, 2015 |
| |
| By: | | /s/ Scott McHugh |
| |
| | |
| | Scott McHugh |
| | Principal Financial Officer |
| | Goldman Sachs Trust |
| |
| Date: | | December 7, 2015 |