UNITED STATES
SECURITIES AND EXCHANGE COMMISSION
Washington, D.C. 20549
FORM N-CSR
CERTIFIED SHAREHOLDER REPORT OF REGISTERED
MANAGEMENT INVESTMENT COMPANIES
Investment Company Act file number 811-05349
Goldman Sachs Trust
(Exact name of registrant as specified in charter)
71 South Wacker Drive, Chicago, Illinois 60606
(Address of principal executive offices) (Zip code)
| Caroline Kraus, Esq. | Copies to: | |
| Goldman, Sachs & Co. | Geoffrey R.T. Kenyon, Esq. | |
| 200 West Street | Dechert LLP | |
| New York, New York 10282 | 100 Oliver Street | |
| 40th Floor | ||
| Boston, MA 02110-2605 |
(Name and address of agents for service)
Registrant’s telephone number, including area code: (312) 655-4400
Date of fiscal year end: August 31
Date of reporting period: February 29, 2016
| ITEM 1. | REPORTS TO STOCKHOLDERS. |
| The Semi-Annual Report to Shareholders is filed herewith. |
Goldman Sachs Funds

| Semi-Annual Report | February 29, 2016 | |||
Financial Square Funds | ||||
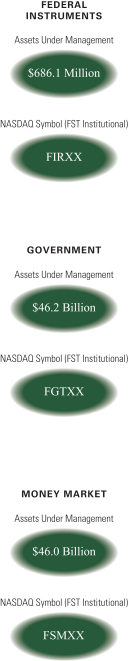
Federal Instruments* | ||||
Government | ||||
Money Market | ||||
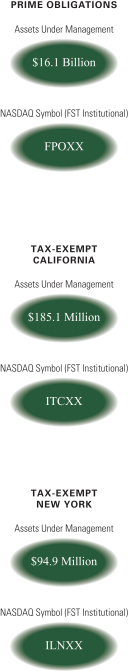
Prime Obligations | ||||
Tax-Exempt California | ||||
Tax-Exempt New York | ||||
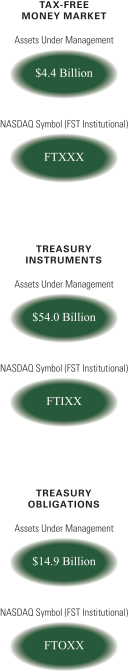
Tax-Free Money Market** | ||||
Treasury Instruments | ||||
Treasury Obligations | ||||
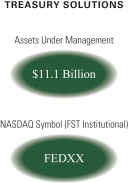
Treasury Solutions*** | ||||
* The Goldman Sachs Financial Square Federal Instruments Fund commenced operations on October 30, 2015.
** Effective after the close of business on March 31, 2016, the name of the Goldman Sachs Financial Square Tax-Free Money Market Fund was changed to the Goldman Sachs Investor Tax-Exempt Money Market Fund.
***Effective after the close of business on September 30, 2015, the name of the Goldman Sachs Financial Square Federal Fund was changed to the Goldman Sachs Financial Square Treasury Solutions Fund (the “Fund”).

Goldman Sachs Financial Square Funds
| n | FEDERAL INSTRUMENTS FUND |
| n | GOVERNMENT FUND |
| n | MONEY MARKET FUND |
| n | PRIME OBLIGATIONS FUND |
| n | TAX-EXEMPT CALIFORNIA FUND |
| n | TAX-EXEMPT NEW YORK FUND |
| n | TAX-FREE MONEY MARKET FUND |
| n | TREASURY INSTRUMENTS FUND |
| n | TREASURY OBLIGATIONS FUND |
| n | TREASURY SOLUTIONS FUND |
TABLE OF CONTENTS | ||||
Portfolio Results | 1 | |||
Fund Basics | 5 | |||
Yield Summary | 7 | |||
Sector Allocations | 8 | |||
Schedules of Investments | 11 | |||
Financial Statements | 52 | |||
Financial Highlights | 60 | |||
Notes to Financial Statements | 80 | |||
Other Information | 102 | |||
| NOT FDIC-INSURED | May Lose Value | No Bank Guarantee | ||
PORTFOLIO RESULTS
Goldman Sachs Financial Square Funds
Portfolio Management Discussion and Analysis
Below, the Goldman Sachs Money Market Portfolio Management Team discusses the Goldman Sachs Financial Square Funds’ (the “Funds”) performance and positioning for the six-month period ended February 29, 2016 (the “Reporting Period”).
| Q | What economic and market factors most influenced the money markets as a whole during the Reporting Period? |
| A | When the Reporting Period began in September 2015, the Federal Reserve (the “Fed”) remained on hold, keeping the targeted federal funds (“fed funds”) rate near zero and sending a dovish message to the financial markets. (Dovish messaging tends to suggest lower interest rates.) As a result, participant projections for the fed funds rate and the timing of Fed action shifted down and extended out, respectively. Inflation projections for the next few years also came down as did the expected unemployment rate. However, we believe Fed messaging increasingly indicated a desire to raise rates in 2015. As for economic data, U.S. non-farm payrolls were disappointing, with 142,000 new jobs added in August 2015, below market expectations of approximately 200,000. The unemployment rate remained at 5.1%. The U.S. Institute for Supply Management Manufacturing Purchasing Managers’ Index declined to 50.2 in September 2015 from 51.1 in August 2015. Core inflation was flat at 1.8% year over year in September 2015. The end of September 2015 also saw the biggest use of the Fed’s reverse repurchase agreement program (“RRP”) facility since it was instituted, with $475 billion in total bids across the two term auctions and the overnight facility and $450 billion in total take-up or purchases. (Through the RRP, the Fed lends U.S. Treasury securities to counterparties, such as dealers, money market funds and government-sponsored entities, in exchange for cash. The RRP is intended to help set a floor under short-term interest rates after years of near-zero Fed policy rates and quantitative easing.) The total bids across all three auctions slightly exceeded year-end 2014. Sharp bill pay-downs as a result of debt ceiling constraints, quarter-end balance sheet pressures and a contingent of front-end investors caught off-guard by the Fed remaining on hold all contributed. Short bills were offered at negative levels into 2016, and liquidity was challenged across the board as the U.S. Treasury cut bill supply. |
| In the fourth quarter of 2015, the Fed delivered its first interest rate hike since 2006. More specifically, the Fed raised the targeted fed funds rate by 25 basis points during December 2015. (A basis point is 1/100th of a percentage point.) The U.S. economy continued to display a positive growth trend. U.S. non-farm payrolls indicated 292,000 new jobs in December 2015, above market expectations of approximately 200,000, and the data for October and November 2015 were also revised upward by 50,000 new jobs. The December 2015 unemployment rate remained at 5.0% despite a 0.1% increase in the labor participation rate. In contrast, economic growth in other developed countries softened, and emerging market economies broadly weakened, due largely to falling commodity prices and concerns around a slowdown in China’s economy. Outside the U.S., the global monetary policy environment remained highly accommodative. Despite accommodative monetary policies by many global central banks, inflation remained subdued in the world’s major economies during the fourth calendar quarter. |
During January 2016, the financial markets were volatile amid continued global economic growth concerns. The Fed left interest rates unchanged during the month, with its subsequent policy statement slightly dovish. In the statement, the Fed downgraded its near-term inflation outlook, expressed concern about global economic conditions and noted slowing housing and inventory investment. These comments were balanced by a reiteration of the Fed’s medium-term inflation outlook and an upgrade in language around the labor market. In addition, in her semi-annual monetary policy report to Congress (sometimes called “Humphrey-Hawkins testimony”), Fed Chair Janet Yellen reiterated her previous statements about the Fed’s focus on labor market improvement and on inflation returning to the central bank’s target levels. She also commented on the headwinds of tightening U.S. financial conditions and the Fed’s global economic concerns. Meanwhile, New York Fed President William Dudley made a speech during January 2016 in which he indicated a high level of concern about |
1
PORTFOLIO RESULTS
tightening financial conditions and suggested that recent financial market turmoil might lead the Fed to alter its growth outlook. The money markets, which already had lowered expectations for Fed monetary action, priced out the possibility of a rate hike in March 2016. U.S. economic data was mixed, with headline job creation at 151,000 in January 2016, below consensus estimates of 190,000. Although the labor force participation rate remained low by historical standards, it ticked up 0.1% to 62.7%. The unemployment rate fell 0.1% to 4.9%. Core inflation rose 2.2% year-over-year in January 2016. Also during the month, the U.S. Commerce Department revised fourth-quarter 2015 U.S. Gross Domestic Product down from 2.0% to 0.7%. |
| During February 2016, the Fed focused primarily on the labor market, inflation expectations and financial conditions. Overall, U.S. financial conditions improved during the month and by the end of the Reporting Period were nearly back to levels seen at the close of 2015. U.S. economic data also improved during February 2016. Non-farm payrolls were better than expected, with 242,000 new jobs created versus consensus estimates of 195,000. The labor force participation rate increased 0.2% to 62.9%, while unemployment held steady at 4.9%. |
| Q | What key factors were responsible for the performance of the Funds during the Reporting Period? |
| A | The taxable Funds’ yields, which were low at the beginning of the Reporting Period, rose modestly primarily as a result of the market factors discussed above. In short, taxable money market yields rose modestly as investors priced in the potential, and then the reality, of the Fed’s interest rate hike in December 2015. The taxable money market yield curve, or spectrum of maturities, shifted upward but remained extremely flat. |
| The tax-exempt Funds’ yields remained low during the Reporting Period. The long-term segment of the tax-exempt money market yield curve steepened, as one-year yields rose and shorter-term yields stayed low. |
| We positioned the Funds to seek to take advantage of changes in the interest rate environment and, throughout the Reporting Period, found pockets of opportunity to generate additional yield. That said, we seek to manage the Funds consistently regardless of interest rate conditions. Our investment approach has always been tri-fold — to seek preservation of capital, daily liquidity and maximization of yield potential. We manage interest and credit risk daily. Whether interest rates are historically low, high or in- between, we intend to continue to use our actively managed approach to seek to provide the best possible return within the framework of the Funds’ guidelines and objectives. |
| Q | How did you manage the taxable Funds during the Reporting Period? |
| A | Collectively, the taxable Funds had investments in commercial paper, asset-backed commercial paper, U.S. Treasury securities, government agency securities, repurchase agreements (“repos”), government guaranteed paper and certificates of deposit during the Reporting Period. |
| From the start of the Reporting Period through the end of 2015, we maintained positions at the longer end of our targeted weighted average maturity range within the taxable government repo strategies (i.e., the Goldman Sachs Financial Square Government Fund, the Goldman Sachs Financial Square Treasury Obligations Fund and the Goldman Sachs Financial Square Treasury Solutions Fund) and the taxable government non-repo strategies (i.e., the Goldman Sachs Financial Square Federal Instruments Fund1 and the Goldman Sachs Financial Square Treasury Instruments Fund). This positioning was in anticipation of the Fed’s December 2015 policy meeting and because we continued to find pockets of value in the longer-term segment of the taxable money market yield curve. In addition, we sought to take advantage of the taxable money market’s expectations for aggressive Fed rate hikes, as well as a favorable technical (supply and demand) environment, to purchase what we considered to be attractive securities at relatively cheap levels. Within our taxable commercial paper strategies (i.e., the Goldman Sachs Financial Square Money Market Fund and the Goldman Sachs Financial Square Prime Obligations Fund), we focused on maintaining high levels of liquidity in addition to holding positions at the shorter end of our targeted weighted average maturity range ahead of what we expected to be a rotation of cash from commercial to government strategies before the implementation of money market fund reform. Toward the end of 2015, we opportunistically extended the weighted average maturity of our commercial paper strategies as we found what we believed to be attractive values. Overall, during the first four months of the Reporting Period, we targeted a weighted average maturity of between 30 days and 50 days in our taxable commercial paper strategies, between 40 days and 60 days in our taxable government repo strategies and |
| 1 | The Goldman Sachs Financial Square Federal Instruments Fund was launched on October 30, 2015. |
2
PORTFOLIO RESULTS
| between 50 days and 60 days in our government non-repo strategies. The weighted average maturity of a money market fund is a measure of its price sensitivity to changes in interest rates. |
| In the final two months of the Reporting Period, we continued to maintain positions at the longer end of our targeted weighted average maturity range within the taxable government repo and taxable government non-repo strategies, extending on an opportunistic basis as we found value in the longer-term segment of the taxable money market yield curve. In general, taxable money markets continued to price in more aggressive Fed rate hikes than we anticipated, creating what we viewed as attractive investment opportunities. Within our taxable commercial paper strategies, we focused on maintaining high levels of liquidity and continued to hold positions at the shorter end of our weighted average maturity range because we expected cash to rotate out of commercial strategies and into government strategies in advance of the implementation of money market fund reform. Overall, during the last two months of the Reporting Period, we targeted a weighted average maturity of between 35 days and 55 days in our taxable commercial paper strategies, between 40 days and 60 days in our taxable government repo strategies and between 40 days and 60 days in our taxable government non-repo strategies. |
| Q | How did you manage the tax-exempt Funds during the Reporting Period? |
| A | Collectively, the tax-exempt Funds had investments during the Reporting Period in variable rate demand notes (“VRDNs”), tax-exempt commercial paper, tax anticipation notes, general obligation bonds, revenue bonds and municipal put bonds. |
| During the first four months of the Reporting Period, the Securities Industry and Financial Markets Association (“SIFMA”) 7-day VRDN Index remained near record lows, as high demand and strained supply put pressure on VRDN prices. In December 2015 alone, tax-exempt money market funds received more than $5 billion in investment inflows. Meanwhile, at the end of 2015, dealers held inventory of just over $1 billion of VRDNs, compared to the two-year average of more than $3.7 billion. Because of these supply and demand conditions, the SIFMA 7-day VRDN Index remained at an all-time low of 0.01% in spite of the Fed rate hike in December 2015. At the same time, most tax-exempt money market funds sought to maintain shorter maturity positions ahead of the implementation of money market fund reform. As a result of tight supply, many of these funds focused their purchases on securities with lower interest rates that were set to mature in early 2016, rather than on full one-year maturities. |
| In the last two months of the Reporting Period, the SIFMA 7-day Index rose to 0.02%, as VRDN inventory steadily grew to slightly less than $4 billion. In addition, tax-exempt money market funds lost approximately $17 billion in assets during January and February 2016, as short-term maturities remained relatively expensive compared to other maturities. |
| During the Reporting Period, we shortened the weighted average maturity of all the tax-exempt Funds in response to upcoming money market fund reform, the likelihood of rising interest rates in 2016 and our focus on maintaining high liquidity. The Goldman Sachs Financial Square Tax-Free Money Market Fund began the Reporting Period with a targeted weighted average maturity of between 20 days and 40 days, which we narrowed to a range of between 20 days and 30 days by the close of 2015. We further shortened the weighted average maturity of the Goldman Sachs Financial Square Tax-Free Money Market Fund to a target range of between 10 days and 20 days by the end of the Reporting Period. At the beginning of the Reporting Period, we targeted a weighted average maturity of between 10 days and 20 days in the Goldman Sachs Financial Square Tax-Exempt California Fund and the Goldman Sachs Financial Square Tax-Exempt New York Fund. In the fourth quarter of 2015, we targeted a weighted average maturity of between five days and 15 days in both strategies. By the end of the Reporting Period, we were targeting a weighted average maturity of between five days and 20 days in the Goldman Sachs Financial Square Tax-Exempt California Fund and the Goldman Sachs Financial Square Tax-Exempt New York Fund. |
| Q | How did you manage the taxable and tax-exempt Funds’ weighted average life during the Reporting Period? |
| A | During the Reporting Period, we managed the weighted average life of all the taxable and tax-exempt Funds below 120 days. The weighted average life of a money market fund is a measure of a money market fund’s price sensitivity to changes in liquidity and/or credit risk. |
| Q | Did you make any changes to the Funds’ portfolios during the Reporting Period? |
| A | As mentioned previously, we made adjustments to the Funds’ weighted average maturity based on then-current |
3
PORTFOLIO RESULTS
market conditions, our near-term view and anticipated and actual Fed monetary policy statements. |
| In addition, during the Reporting Period overall, we continued to manage the taxable and tax-exempt Funds to meet the implementation deadlines for money market fund regulatory reforms. Broadly speaking, these changes will have little impact on Goldman Sachs Asset Management’s general investment strategy with respect to money market funds, which adopts a conservative risk-managed approach to seek to provide liquidity solutions that fit clients’ needs, no matter what the market environment or constraints. That said, within our taxable commercial paper strategies and our tax-exempt strategies, we focused during the Reporting Period on maintaining high levels of liquidity, holding positions at the shorter-end of our targeted weighted average maturity range. Also, we maintained a significantly shorter weighted average life in our taxable commercial paper strategies and our tax-exempt strategies relative to that of our taxable government repo and non-repo strategies. |
| Q | What is the Funds’ tactical view and strategy for the months ahead? |
| A | Given the Fed’s cautious statements in the final months of the Reporting Period, we expect the Fed to shift its path toward policy normalization. In our opinion, the Fed will not hike interest rates as aggressively as the taxable and tax-exempt money markets were pricing in at the end of the Reporting Period. In our taxable commercial strategies, we plan to focus on maintaining high levels of liquidity and positions at the shorter end of the weighted average maturity range amid uncertainty surrounding Fed rate hikes and upcoming money market fund regulatory reform. We plan to opportunistically extend the weighted average maturity of our taxable government repo and government non-repo strategies and believe that technical factors have created value at the longer end of the taxable money market yield curve. Within our tax-exempt strategies, we plan on maintaining positions at the shorter end of the weighted average maturity range, despite strained supply, because of uncertainty surrounding Fed rate hikes and upcoming money market fund regulatory reform. In addition, in advance of money market fund regulatory reform, we expect the weighted average life of our taxable commercial paper strategies and our tax-exempt strategies to remain shorter relative to those of our taxable government repo and taxable government non-repo strategies. |
| Overall, we expect to keep the Funds conservatively positioned as we continue to focus on preservation of capital and daily liquidity. We do not believe there is value in sacrificing liquidity in exchange for opportunities that only modestly increase yield potential. We will continue to use our actively managed approach to seek the best possible return within the framework of our Funds’ investment guidelines and objectives. In addition, we will continue to manage interest, liquidity and credit risk daily. We will also continue to closely monitor economic data, Fed policy and any shifts in the taxable and tax-exempt money market yield curves, as we strive to navigate the interest rate environment. |
The U.S. Securities and Exchange Commission (“SEC”) adopted changes to the rules that govern money market funds. These changes will: (1) permit money market funds to impose a “liquidity fee” (up to 2%) or “redemption gate” that temporarily restricts redemptions from the funds, if weekly liquidity levels fall below the required regulatory threshold, and (2) require “institutional” money market funds to operate with a floating net asset value (“NAV”) rounded to the fourth decimal place.
For additional information reported as of April 15, 2016, refer to the prospectus supplemental at www.gsamfunds.com |
4
FUND BASICS
Financial Square Funds
as of February 29, 2016
| PERFORMANCE REVIEW1 | ||||||||||
| September 1, 2015–February 29, 2016 | Fund Total Return (based on NAV)2 FST Institutional Shares | iMoneynet Institutional Average3 | ||||||||
| Government | 0.06 | % | 0.04 | %4 | ||||||
| Money Market | 0.12 | 0.12 | 5 | |||||||
| Prime Obligations | 0.10 | 0.12 | 5 | |||||||
| Tax-Exempt California | 0.01 | 0.04 | 6 | |||||||
| Tax-Exempt New York | 0.02 | 0.04 | 6 | |||||||
| Tax-Free Money Market | 0.01 | 0.02 | 7 | |||||||
| Treasury Instruments | 0.03 | 0.02 | 8 | |||||||
| Treasury Obligations | 0.04 | 0.03 | 9 | |||||||
| Treasury Solutions | 0.04 | 0.03 | 9 | |||||||
| October 30, 2015–February 29, 2016 | ||||||||||
| Federal Instruments | 0.04 | 0.04 | 4 | |||||||
| The returns represent past performance. Past performance does not guarantee future results. The Funds’ investment returns will fluctuate. Current performance may be lower or higher than the performance quoted above. Please visit our Web site at www.GSAMFUNDS.com to obtain the most recent month-end returns. Performance reflects applicable fee waivers and/or expense limitations in effect during the periods shown. In their absence, performance would be reduced. Returns do not reflect the deduction of taxes that a shareholder would pay on Fund distributions or the redemption of Fund shares. |
| 1 | Each of the Treasury Obligations, Money Market, Treasury Instruments, Treasury Solutions and Tax-Free Money Market Funds offers nine separate classes of shares (FST Institutional, Select, Preferred, Capital, Administration, Service, Cash Management, Premier and Resource), each of the Tax-Exempt California and Tax-Exempt New York Funds offers four separate classes of shares (FST Institutional, Administration, Service and Cash Management), the Federal Instruments Fund offers eight separate classes of shares (FST Institutional, Select, Preferred, Capital, Administration, Service, Cash Management and Premier), the Prime Obligations Fund offers ten separate classes of shares (FST Institutional, Select, Preferred, Capital, Administration, Service, Cash Management, Premier, Resource, and Class C), and the Government Fund offers twelve separate classes of shares (FST Institutional, Select, Preferred, Capital, Administration, Service, Cash Management, Premier, Resource, Class R6, Class A and Class C), each of which is subject to different fees and expenses that affect performance and entitles shareholders to different services. The FST Institutional and Class R6 Shares do not have distribution (12b-1), administration or shareholder service fees. The Select, Preferred, Capital, Administration, Service, Cash Management, Premier, Resource, Class A and Class C Shares offer financial institutions the opportunity to receive fees for providing certain distribution (12b-1), administrative support and/or shareholder services (as applicable). As an annualized percentage of average daily net assets, these share classes pay combined distribution (12b-1), administration and/or shareholder service fees (as applicable) at the following contractual rates: the Select Shares pay 0.03%, Preferred Shares pay 0.10%, Capital Shares pay 0.15%, Administration Shares (for Tax-Exempt California and Tax-Exempt New York Funds) pay 0.15%, Administration Shares (for all other Funds) pay 0.25%, Service Shares (for Tax-Exempt California and Tax-Exempt New York Funds) pay 0.40%, Service Shares (for all other Funds) pay 0.50%, Cash Management Shares (for Tax-Exempt California and Tax-Exempt New York Funds) pay 1.00%, Cash Management Shares (for all other Funds) pay 0.80%, Premier Shares pay 0.35%, Resource Shares pay 0.65%, Class A Shares pay 0.25% and Class C Shares pay 1.00%. If these fees were reflected in the above performance, performance would have been reduced. |
| 2 | The net asset value (NAV) represents the net assets of the class of the Fund (ex-dividend) divided by the total number of shares of the class outstanding. A Fund’s performance reflects the reinvestment of dividends and other distributions. A Fund’s performance does not reflect the deduction of any applicable sales charges. |
| 3 | Source: iMoneyNet, Inc. February 2016 |
| 4 | Government & Agencies Institutional — Category includes the most broadly based of the government institutional funds. These funds may invest in U.S. treasuries, U.S. agencies, repurchase agreements, or government-backed floating rate notes. |
| 5 | First Tier Institutional — Category includes only non-government institutional funds that also are not holding any second tier securities. Portfolio holdings of First Tier funds include U.S. Treasury, U.S. other, repurchase agreements, time deposits, domestic bank obligations, foreign bank obligations, first tier commercial paper, floating rate notes, and asset-backed commercial paper. |
5
FUND BASICS
| 6 | Tax-Free State-Specific — Category includes all retail and institutional State-Specific money funds. Portfolio holdings of tax-free funds include rated and unrated demand notes, rated and unrated general market notes, commercial paper, put bonds — 6 months & less, put bonds — over 6 months, AMT paper, and other tax-free holdings. |
| 7 | Tax-Free National — Category includes all retail and institutional national tax-free and municipal money funds. Portfolio holdings of tax-free funds include rated and unrated demand notes, rated and unrated general market notes, commercial paper, put bonds — 6 months & less, put bonds — over 6 months, AMT paper, and other tax-free holdings. |
| 8 | Treasury Institutional — Category includes only institutional government funds that hold 100 percent in U.S. Treasuries. |
| 9 | Treasury & Repo Institutional — Category includes only institutional government funds that hold U.S. Treasuries and repurchase agreements backed by the U.S. Treasury. |
| STANDARDIZED TOTAL RETURNS1,10 | ||||||||||||||||||||||||
For the period ended December 31, 2015 | SEC 7-Day Current Yield11 | One Year | Five Years | Ten Years | Since Inception | Inception Date | ||||||||||||||||||
| Federal Instruments | 0.17 | % | N/A | N/A | N/A | 0.01 | % | 10/30/15 | ||||||||||||||||
| Government | 0.18 | 0.02 | % | 0.02 | % | 1.29 | % | 2.81 | 4/6/93 | |||||||||||||||
| Money Market | 0.30 | 0.12 | 0.12 | 1.39 | 2.88 | 5/18/94 | ||||||||||||||||||
| Prime Obligations | 0.24 | 0.07 | 0.07 | 1.35 | 3.21 | 3/8/90 | ||||||||||||||||||
| Tax-Exempt California | 0.01 | 0.01 | 0.01 | 0.79 | 2.06 | 10/4/88 | ||||||||||||||||||
| Tax-Exempt New York | 0.01 | 0.02 | 0.01 | 0.81 | 1.80 | 2/15/91 | ||||||||||||||||||
| Tax-Free Money Market | 0.01 | 0.01 | 0.02 | 0.94 | 1.87 | 7/19/94 | ||||||||||||||||||
| Treasury Instruments | 0.12 | 0.01 | 0.00 | 1.07 | 2.15 | 3/3/97 | ||||||||||||||||||
| Treasury Obligations | 0.13 | 0.01 | 0.01 | 1.14 | 3.02 | 4/25/90 | ||||||||||||||||||
| Treasury Solutions | 0.11 | 0.01 | 0.01 | 1.25 | 2.36 | 2/28/97 | ||||||||||||||||||
| 10 | The Standardized Total Returns are average annual or cumulative total returns (only if the performance period is one year or less) of FST Institutional Shares as of the most recent calendar quarter-end. They assume reinvestment of all distributions at NAV. |
| Because FST Institutional Shares do not involve a sales charge, such a charge is not applied to their Standardized Total Returns. |
| The yields returns represent past performance. Past performance does not guarantee future results. The Funds’ investment yield and return will fluctuate as market conditions change. Current performance may be lower or higher than the performance quoted above. Please visit our Web site at www.GSAMFUNDS.com to obtain the most recent month-end returns. Performance reflects applicable fee waivers and/or expense limitations in effect during the periods shown. In their absence, performance would be reduced. Returns do not reflect the deduction of taxes that a shareholder would pay on Fund distributions or the redemption of Fund shares. |
| 11 | The SEC 7-Day Current Yield figures are as of 12/31/15 and are calculated in accordance with securities industry regulations and do not include net capital gains. SEC 7-Day Current Yield may differ slightly from the actual distribution rate of a given Fund because of the exclusion of distributed capital gains, which are non-recurring. The SEC 7-Day Current Yield more closely reflects a Fund’s current earnings than do the Standardized Total Return figures. |
6
YIELD SUMMARY
| SUMMARY OF THE FST INSTITUTIONAL SHARES1 AS OF 2/29/16 | ||||||||||||||||||||||
| Funds | 7-Day Dist. Yield12 | SEC 7-Day Effective Yield13 | 30-Day Average | Weighted Maturity | Weighted Avg. Life (days)16 | |||||||||||||||||
| Federal Instruments | 0.21 | % | 0.21 | % | 0.19 | % | 48 | 119 | ||||||||||||||
| Government | 0.24 | 0.23 | 0.25 | 43 | 103 | |||||||||||||||||
| Money Market | 0.42 | 0.41 | 0.40 | 39 | 52 | |||||||||||||||||
| Prime Obligations | 0.40 | 0.40 | 0.39 | 47 | 57 | |||||||||||||||||
| Tax-Exempt California | 0.01 | 0.01 | 0.01 | 6 | 6 | |||||||||||||||||
| Tax-Exempt New York | 0.01 | 0.01 | 0.01 | 7 | 7 | |||||||||||||||||
| Tax-Free Money Market | 0.01 | 0.01 | 0.01 | 10 | 11 | |||||||||||||||||
| Treasury Instruments | 0.19 | 0.19 | 0.18 | 57 | 113 | |||||||||||||||||
| Treasury Obligations | 0.21 | 0.21 | 0.21 | 57 | 111 | |||||||||||||||||
| Treasury Solutions | 0.21 | 0.18 | 0.19 | 56 | 114 | |||||||||||||||||
| The Yields represent past performance. Past performance does not guarantee future results. Current performance may be lower or higher than the performance quoted above. |
| Yields reflect fee waivers and expense limitations in effect and will fluctuate as market conditions change. The yield quotations more closely reflect the current earnings of the Fund. Please visit our Web site at www.GSAMFUNDS.com to obtain the most recent month-end performance. |
| 12 | The 7-Day Distribution yield is the average total return over the previous seven days. It is a Fund’s total income net of expenses, divided by the total number of outstanding shares. This yield can include capital gain/loss distribution, if any. This is not a SEC Yield. |
| 13 | The SEC 7-Day Effective Yield of a Fund is calculated in accordance with securities industry regulations and do not include net capital gains. The SEC 7-Day Effective Yield assumes reinvestment of dividends for one year. |
| 14 | The 30-Day Average Yield is a net annualized yield of 30 days back from the current date listed. This yield includes capital gain/loss distribution. |
| 15 | A Fund’s weighted average maturity (WAM) is an average of the effective maturities of all securities held in the portfolio, weighted by each security’s percentage of net assets. This must not exceed 60 days as calculated under SEC Rule 2a-7. |
| 16 | A Fund’s weighted average life (WAL) is an average of the final maturities of all securities held in the portfolio, weighted by each security’s percentage of net assets. This must not exceed 120 days as calculated under SEC Rule 2a-7. |
7
SECTOR ALLOCATIONS
| TAXABLE FUNDS17 | ||||||||||||||||||||||||||||||
| as of February 29, 2016 | ||||||||||||||||||||||||||||||
| Security Type (Percentage of Net Assets) | Federal Instruments | Government | Money Market | Prime Obligations | Treasury Instruments | Treasury Obligations | Treasury Solutions | |||||||||||||||||||||||
| Certificates of Deposit | — | — | 0.3 | % | 0.3 | % | — | — | — | |||||||||||||||||||||
| Certificates of Deposit — Eurodollar | — | — | 2.2 | — | — | — | — | |||||||||||||||||||||||
| Certificates of Deposit — Yankeedollar | — | — | 17.2 | 21.8 | — | — | — | |||||||||||||||||||||||
| Commercial Paper & Corporate Obligations | — | — | 15.4 | 25.4 | — | — | — | |||||||||||||||||||||||
| Fixed Rate Municipal Debt Obligations | — | — | 0.7 | 2.6 | — | — | — | |||||||||||||||||||||||
| Repurchase Agreements | — | 49.0 | % | 20.5 | 16.8 | — | 47.8 | % | 36.2 | % | ||||||||||||||||||||
| Time Deposits | — | — | 18.8 | 14.9 | — | — | — | |||||||||||||||||||||||
| U.S. Government Agency Obligations | 60.1 | % | 41.5 | 1.5 | 4.0 | — | — | — | ||||||||||||||||||||||
| U.S. Treasury Obligations | 39.9 | 11.8 | 1.4 | 1.2 | 101.5 | % | 53.7 | 64.2 | ||||||||||||||||||||||
| Variable Rate Municipal Debt Obligations | — | — | 0.4 | 1.4 | — | — | — | |||||||||||||||||||||||
| Variable Rate Obligations | — | — | 22.3 | 12.1 | — | — | — | |||||||||||||||||||||||
| 17 | Each Fund is actively managed and, as such, its portfolio composition may differ over time. The percentage shown for each investment category reflects the value (based on amortized cost) of investments in that category as a percentage of net assets. Figures in the above table may not sum to 100% due to the exclusion of other assets and liabilities. |
8
SECTOR ALLOCATIONS
| TAXABLE FUNDS17 | ||||||||||||||||||||||||||||||
| as of August 31, 2015 | ||||||||||||||||||||||||||||||
| Security Type (Percentage of Net Assets) | Federal Instruments | Government | Money Market | Prime Obligations | Treasury Instruments | Treasury Obligations | Treasury Solutions | |||||||||||||||||||||||
| Certificates of Deposit — Eurodollar | — | — | 1.7 | % | — | — | — | — | ||||||||||||||||||||||
| Certificates of Deposit — Yankeedollar | — | — | 16.9 | — | — | — | — | |||||||||||||||||||||||
| Commercial Paper & Corporate Obligations | — | — | 14.5 | 31.6 | % | — | — | — | ||||||||||||||||||||||
| Fixed Rate Municipal Debt Obligation | — | — | 0.5 | 2.1 | — | — | — | |||||||||||||||||||||||
| Repurchase Agreements | — | 54.4 | % | 21.3 | 43.9 | — | 58.1 | % | 37.8 | % | ||||||||||||||||||||
| Time Deposits | — | — | 16.7 | — | — | — | — | |||||||||||||||||||||||
| U.S. Government Agency Obligations | — | 43.6 | 2.0 | 7.7 | — | — | 37.1 | |||||||||||||||||||||||
| U.S. Treasury Obligations | — | — | — | 2.0 | 99.2 | % | 57.4 | 58.8 | ||||||||||||||||||||||
| Variable Rate Municipal Debt Obligations | — | — | 0.6 | 2.5 | — | — | — | |||||||||||||||||||||||
| Variable Rate Obligations | — | — | 26.4 | 11.0 | — | — | — | |||||||||||||||||||||||
| 17 | Each Fund is actively managed and, as such, its portfolio composition may differ over time. The percentage shown for each investment category reflects the value (based on amortized cost) of investments in that category as a percentage of net assets. Figures in the above table may not sum to 100% due to the exclusion of other assets and liabilities. |
9
SECTOR ALLOCATIONS
| TAX-EXEMPT FUNDS18 | ||||||||||||||
| as of February 29, 2016 | ||||||||||||||
Security Type (Percentage of Net Assets) | Tax-Exempt California | Tax-Exempt New York | Tax-Free Money Market | |||||||||||
| Bond Anticipation Notes | — | — | 0.4 | % | ||||||||||
| Commercial Paper | 0.5 | % | 6.5 | % | 10.0 | |||||||||
| General Obligation Bonds | — | — | 4.2 | |||||||||||
| Pre-Refunded Bonds | — | — | 0.5 | |||||||||||
| Put Bonds | — | — | 0.1 | |||||||||||
| Repurchase Agreements | 1.4 | 1.4 | — | |||||||||||
| Revenue Anticipation Notes | — | 1.8 | 0.6 | |||||||||||
| Revenue Bonds | — | — | 0.6 | |||||||||||
| Tax and Revenue Anticipation Notes | — | — | 0.3 | |||||||||||
| Variable Rate Obligations | 98.0 | 90.2 | 85.0 | |||||||||||
| as of August 31, 2015 | ||||||||||||||
| Bond Anticipation Notes | — | 5.0 | % | 1.7 | % | |||||||||
| Commercial Paper | 6.3 | % | 3.5 | 11.8 | ||||||||||
| General Obligation Bonds | 0.2 | — | 6.9 | |||||||||||
| Pre-Refunded Bonds | — | — | 0.5 | |||||||||||
| Put Bonds | — | — | 0.9 | |||||||||||
| Repurchase Agreements | — | — | 0.6 | |||||||||||
| Revenue Anticipation Notes | — | — | 0.3 | |||||||||||
| Revenue Bonds | 2.2 | 1.5 | 1.9 | |||||||||||
| Tax and Revenue Anticipation Notes | — | — | 1.4 | |||||||||||
| Tax Anticipation Notes | — | 2.7 | 0.2 | |||||||||||
| U.S. Government Agency Obligations | 0.8 | — | 0.9 | |||||||||||
| Variable Rate Obligations | 90.4 | 86.1 | 73.5 | |||||||||||
| 18 | Each Fund is actively managed and, as such, its portfolio composition may differ over time. The percentage shown for each investment category reflects the value (based on amortized cost) of investments in that category as a percentage of net assets. Figures in the above table may not sum to 100% due to the exclusion of other assets and liabilities. |
10
FINANCIAL SQUARE FEDERAL INSTRUMENTS FUND
Schedule of Investments
February 29, 2016 (Unaudited)
| Principal Amount | Interest Rate | Maturity Date | Amortized Cost | |||||||||||
| U.S. Government Agency Obligations – 60.1% | ||||||||||||||
| Federal Farm Credit Bank |
| ||||||||||||
| $ | 25,000,000 | 0.410 | %(a) | 04/04/16 | $ | 25,001,176 | ||||||||
| 4,500,000 | 0.510 | (a) | 04/11/16 | 4,499,794 | ||||||||||
| 23,000,000 | 0.630 | (a) | 04/11/16 | 23,007,062 | ||||||||||
| 1,400,000 | 0.412 | (a) | 05/20/16 | 1,400,006 | ||||||||||
| 5,500,000 | 0.483 | (a) | 06/30/16 | 5,500,621 | ||||||||||
| 18,500,000 | 0.420 | (a) | 07/01/16 | 18,492,149 | ||||||||||
| 1,000,000 | 0.737 | 08/18/16 | 996,600 | |||||||||||
| 1,000,000 | 0.507 | (a) | 09/14/16 | 1,000,000 | ||||||||||
| 3,500,000 | 0.469 | (a) | 09/29/16 | 3,499,951 | ||||||||||
| 100,000 | 5.875 | 10/03/16 | 103,142 | |||||||||||
| 380,000 | 0.415 | (a) | 12/19/16 | 379,833 | ||||||||||
| 3,500,000 | 0.498 | (a) | 12/29/16 | 3,499,712 | ||||||||||
| 2,500,000 | 0.517 | (a) | 01/20/17 | 2,500,000 | ||||||||||
| 1,000,000 | 0.377 | (a) | 02/15/17 | 998,211 | ||||||||||
| 1,000,000 | 0.536 | (a) | 04/25/17 | 1,000,000 | ||||||||||
| 1,250,000 | 0.616 | (a) | 08/01/17 | 1,249,128 | ||||||||||
| Federal Home Loan Bank |
| ||||||||||||
| 35,720,000 | 0.300 | 03/02/16 | 35,719,707 | |||||||||||
| 20,000,000 | 0.305 | 03/02/16 | 19,999,833 | |||||||||||
| 7,700,000 | 0.315 | 03/02/16 | 7,699,934 | |||||||||||
| 70,000,000 | 0.173 | 03/08/16 | 69,997,686 | |||||||||||
| 20,000,000 | 0.489 | 03/09/16 | 19,997,866 | |||||||||||
| 5,250,000 | 3.125 | 03/11/16 | 5,254,483 | |||||||||||
| 2,500,000 | 0.449 | 03/18/16 | 2,499,481 | |||||||||||
| 3,500,000 | 0.449 | 03/23/16 | 3,499,059 | |||||||||||
| 9,500,000 | 0.290 | 03/24/16 | 9,498,240 | |||||||||||
| 5,000,000 | 0.382 | 04/08/16 | 4,998,021 | |||||||||||
| 860,000 | 0.250 | 05/11/16 | 859,824 | |||||||||||
| 345,000 | 5.375 | 05/18/16 | 348,686 | |||||||||||
| 950,000 | 0.561 | 05/27/16 | 948,737 | |||||||||||
| 1,250,000 | 0.425 | (a) | 06/02/16 | 1,249,831 | ||||||||||
| 5,000,000 | 0.587 | 07/08/16 | 4,989,698 | |||||||||||
| 1,500,000 | 0.610 | 07/08/16 | 1,500,000 | |||||||||||
| 3,500,000 | 0.500 | 07/26/16 | 3,500,000 | |||||||||||
| 430,000 | 5.500 | 08/15/16 | 439,827 | |||||||||||
| 5,500,000 | 0.500 | 08/19/16 | 5,487,199 | |||||||||||
| 2,000,000 | 0.517 | (a) | 09/22/16 | 1,999,996 | ||||||||||
| 2,500,000 | 0.541 | (a) | 10/12/16 | 2,499,753 | ||||||||||
| 2,500,000 | 0.536 | (a) | 11/01/16 | 2,500,000 | ||||||||||
| 30,000,000 | 0.487 | (a) | 11/03/16 | 30,000,000 | ||||||||||
| 15,000,000 | 0.539 | (a) | 11/03/16 | 15,000,000 | ||||||||||
| 35,000,000 | 0.540 | (a) | 11/08/16 | 34,999,991 | ||||||||||
| 1,270,000 | 0.506 | (a) | 12/23/16 | 1,269,155 | ||||||||||
| 2,500,000 | 0.531 | (a) | 01/17/17 | 2,497,949 | ||||||||||
| 1,500,000 | 0.559 | (a) | 02/07/17 | 1,499,835 | ||||||||||
| 15,000,000 | 0.558 | (a) | 02/17/17 | 15,000,000 | ||||||||||
| 4,000,000 | 0.558 | (a) | 03/13/17 | 4,000,000 | ||||||||||
| 4,000,000 | 0.558 | (a) | 03/16/17 | 4,000,000 | ||||||||||
| 4,000,000 | 0.605 | (a) | 08/28/17 | 3,999,398 | ||||||||||
| 1,500,000 | 0.615 | (a)(b) | 09/01/17 | 1,500,000 | ||||||||||
|
| |||||||||||||
|
| TOTAL U.S. GOVERNMENT AGENCY OBLIGATIONS |
| $ | 412,381,574 | ||||||||||
|
| |||||||||||||
| U.S. Treasury Obligations – 39.9% | ||||||||||||||
| United States Treasury Bill |
| ||||||||||||
| $ | 15,000,000 | 0.464 | % | 08/25/16 | $ | 14,966,444 | ||||||||
| United States Treasury Floating Rate Notes |
| ||||||||||||
| 78,150,000 | 0.389 | (a) | 04/30/16 | 78,157,084 | ||||||||||
| 11,000,000 | 0.390 | (a) | 07/31/16 | 11,001,866 | ||||||||||
| 20,000,000 | 0.373 | (a) | 10/31/16 | 20,001,758 | ||||||||||
| United States Treasury Notes |
| ||||||||||||
| 45,064,000 | 0.375 | 04/30/16 | 45,067,001 | |||||||||||
| 35,282,000 | 2.625 | 04/30/16 | 35,414,985 | |||||||||||
| 1,000,000 | 0.500 | 07/31/16 | 1,000,113 | |||||||||||
| 1,000,000 | 3.250 | 07/31/16 | 1,010,908 | |||||||||||
| 12,900,000 | 4.875 | 08/15/16 | 13,143,642 | |||||||||||
| 1,550,000 | 1.000 | 08/31/16 | 1,553,634 | |||||||||||
| 2,510,000 | 3.000 | 08/31/16 | 2,538,753 | |||||||||||
| 8,500,000 | 0.875 | 09/15/16 | 8,515,061 | |||||||||||
| 5,000,000 | 1.000 | 09/30/16 | 5,013,110 | |||||||||||
| 22,000,000 | 3.000 | 09/30/16 | 22,299,513 | |||||||||||
| 7,000,000 | 0.625 | 10/15/16 | 7,004,007 | |||||||||||
| 6,000,000 | 3.125 | 10/31/16 | 6,102,619 | |||||||||||
| 800,000 | 4.625 | 11/15/16 | 821,920 | |||||||||||
|
| |||||||||||||
| | TOTAL U.S. TREASURY OBLIGATIONS | | $ | 273,612,418 | ||||||||||
|
| |||||||||||||
| TOTAL INVESTMENTS – 100.0% | $ | 685,993,992 | ||||||||||||
|
| |||||||||||||
| | OTHER ASSETS IN EXCESS OF LIABILITIES – 0.0% | | 90,919 | |||||||||||
|
| |||||||||||||
| NET ASSETS – 100.0% | $ | 686,084,911 | ||||||||||||
|
| |||||||||||||
| The percentage shown for each investment category reflects the value of investments in that category as a percentage of net assets. | ||
(a) | Variable or floating rate security. Interest rate disclosed is that which is in effect at February 29, 2016. | |
(b) | All or a portion represents a forward commitment. | |
Interest rates represent either the stated coupon rate, or for floating rate securities, the current reset rate, which is based upon current interest rate indices.
Maturity dates represent either the final legal maturity date on the security, the demand date for puttable securities, or the prerefunded date for those types of securities. | ||
| The accompanying notes are an integral part of these financial statements. | 11 |
FINANCIAL SQUARE GOVERNMENT FUND
Schedule of Investments
February 29, 2016 (Unaudited)
Principal Amount | Interest Rate | Maturity Date | Amortized Cost | |||||||||||
| U.S. Government Agency Obligations – 41.5% | ||||||||||||||
| Federal Farm Credit Bank |
| ||||||||||||
| $ | 50,000,000 | 0.380 | %(a) | 03/28/16 | $ | 49,998,873 | ||||||||
| 100,000,000 | 0.409 | (a) | 03/29/16 | 99,999,209 | ||||||||||
| 25,000,000 | 0.492 | (a) | 03/31/16 | 25,000,577 | ||||||||||
| 100,000,000 | 0.426 | (a) | 04/04/16 | 99,999,294 | ||||||||||
| 48,500,000 | 0.510 | (a) | 04/11/16 | 48,504,130 | ||||||||||
| 100,000,000 | 0.397 | (a) | 04/15/16 | 99,998,185 | ||||||||||
| 20,000,000 | 0.410 | (a) | 05/06/16 | 19,999,267 | ||||||||||
| 50,000,000 | 0.530 | (a) | 06/09/16 | 50,012,444 | ||||||||||
| 35,000,000 | 0.502 | (a) | 07/15/16 | 34,998,637 | ||||||||||
| 28,000,000 | 0.530 | (a) | 07/27/16 | 27,998,269 | ||||||||||
| 50,000,000 | 0.420 | (a) | 07/29/16 | 50,000,000 | ||||||||||
| 40,000,000 | 0.500 | (a) | 07/29/16 | 40,009,998 | ||||||||||
| 275,000,000 | 0.702 | (a) | 08/09/16 | 275,006,902 | ||||||||||
| 49,000,000 | 0.737 | 08/18/16 | 48,833,400 | |||||||||||
| 29,590,000 | 0.447 | (a) | 09/14/16 | 29,579,832 | ||||||||||
| 98,000,000 | 0.507 | (a) | 09/14/16 | 98,000,000 | ||||||||||
| 34,457,000 | 0.530 | (a) | 09/19/16 | 34,474,327 | ||||||||||
| 200,000,000 | 0.371 | (a) | 09/23/16 | 200,026,925 | ||||||||||
| 200,000,000 | 0.519 | (a) | 11/04/16 | 200,044,160 | ||||||||||
| 95,000,000 | 0.498 | (a) | 12/29/16 | 94,992,178 | ||||||||||
| 195,000,000 | 0.517 | (a) | 01/20/17 | 195,000,000 | ||||||||||
| 99,000,000 | 0.377 | (a) | 02/15/17 | 98,822,871 | ||||||||||
| 12,510,000 | 0.493 | (a) | 02/27/17 | 12,500,393 | ||||||||||
| 131,300,000 | 0.536 | (a) | 04/25/17 | 131,300,000 | ||||||||||
| 150,000,000 | 0.347 | (a) | 04/27/17 | 149,997,818 | ||||||||||
| 200,000,000 | 0.416 | (a) | 05/15/17 | 199,995,612 | ||||||||||
| 490,000,000 | 0.494 | (a) | 05/23/17 | 490,000,000 | ||||||||||
| 275,000,000 | 0.642 | (a) | 06/26/17 | 274,994,747 | ||||||||||
| 65,000,000 | 0.577 | (a) | 07/21/17 | 64,999,860 | ||||||||||
| 6,500,000 | 0.616 | (a) | 08/01/17 | 6,495,465 | ||||||||||
| Federal Home Loan Bank |
| ||||||||||||
| 169,200,000 | 0.260 | 03/07/16 | 169,199,607 | |||||||||||
| 79,000,000 | 0.340 | 03/08/16 | 78,999,798 | |||||||||||
| 18,500,000 | 0.479 | 03/08/16 | 18,498,309 | |||||||||||
| 157,000,000 | 0.330 | 03/09/16 | 156,999,200 | |||||||||||
| 137,300,000 | 0.340 | 03/09/16 | 137,300,539 | |||||||||||
| 590,000,000 | 0.385 | (a) | 03/11/16 | 589,997,952 | ||||||||||
| 10,820,000 | 1.000 | 03/11/16 | 10,821,872 | |||||||||||
| 995,000,000 | 0.449 | 03/18/16 | 994,793,261 | |||||||||||
| 495,500,000 | 0.449 | 03/23/16 | 495,366,766 | |||||||||||
| 500,000,000 | 0.369 | (a) | 03/24/16 | 500,000,000 | ||||||||||
| 90,000,000 | 0.330 | 04/01/16 | 89,997,249 | |||||||||||
| 250,000,000 | 0.220 | 04/07/16 | 249,993,942 | |||||||||||
| 555,000,000 | 0.340 | 04/08/16 | 554,973,306 | |||||||||||
| 500,000,000 | 0.363 | (a) | 04/08/16 | 500,000,000 | ||||||||||
| 7,760,000 | 5.375 | 04/12/16 | 7,805,069 | |||||||||||
| 500,000,000 | 0.220 | 04/15/16 | 499,979,119 | |||||||||||
| 750,000,000 | 0.240 | 04/15/16 | 749,963,550 | |||||||||||
| 139,000,000 | 0.260 | 04/20/16 | 138,999,496 | |||||||||||
| 144,000,000 | 0.270 | 04/22/16 | 143,999,006 | |||||||||||
| 67,000,000 | 0.250 | 04/27/16 | 66,995,318 | |||||||||||
| 81,000,000 | 0.250 | 04/29/16 | 80,994,148 | |||||||||||
| 300,000,000 | 0.280 | 04/29/16 | 299,987,761 | |||||||||||
| 225,000,000 | 0.290 | 05/03/16 | 224,994,465 | |||||||||||
| 19,000,000 | 0.250 | 05/06/16 | 18,997,772 | |||||||||||
| 250,000,000 | 0.300 | 05/10/16 | 249,997,949 | |||||||||||
|
| |||||||||||||
| U.S. Government Agency Obligations – (continued) | ||||||||||||||
| Federal Home Loan Bank – (continued) |
| ||||||||||||
| $ | 75,000,000 | 0.250 | % | 05/11/16 | $ | 74,991,297 | ||||||||
| 200,000,000 | 0.502 | (a) | 05/13/16 | 199,993,764 | ||||||||||
| 90,610,000 | 5.375 | 05/18/16 | 91,583,166 | |||||||||||
| 250,000,000 | 0.394 | (a) | 05/24/16 | 250,000,000 | ||||||||||
| 140,000,000 | 0.561 | 05/27/16 | 139,813,917 | |||||||||||
| 132,500,000 | 0.425 | (a) | 06/02/16 | 132,482,139 | ||||||||||
| 28,000,000 | 0.664 | 06/08/16 | 27,949,950 | |||||||||||
| 250,000,000 | 0.664 | 06/10/16 | 249,544,097 | |||||||||||
| 50,000,000 | 0.603 | 06/22/16 | 49,907,403 | |||||||||||
| 60,600,000 | 0.375 | 06/29/16 | 60,593,809 | |||||||||||
| 495,500,000 | 0.610 | 07/08/16 | 495,500,000 | |||||||||||
| 493,000,000 | 0.500 | 07/26/16 | 493,000,000 | |||||||||||
| 193,000,000 | 0.500 | 08/19/16 | 192,550,793 | |||||||||||
| 245,000,000 | 0.541 | (a) | 10/12/16 | 244,975,805 | ||||||||||
| 170,000,000 | 0.536 | (a) | 11/01/16 | 170,000,000 | ||||||||||
| 554,000,000 | 0.487 | (a) | 11/03/16 | 554,000,000 | ||||||||||
| 232,500,000 | 0.539 | (a) | 11/03/16 | 232,500,000 | ||||||||||
| 459,500,000 | 0.540 | (a) | 11/08/16 | 459,499,896 | ||||||||||
| 250,000,000 | 0.481 | (a) | 01/30/17 | 249,965,245 | ||||||||||
| 50,000,000 | 0.484 | (a) | 02/03/17 | 49,992,682 | ||||||||||
| 125,000,000 | 0.485 | (a) | 02/07/17 | 124,981,394 | ||||||||||
| 43,000,000 | 0.559 | (a) | 02/07/17 | 42,995,260 | ||||||||||
| 50,000,000 | 0.482 | (a) | 02/13/17 | 49,989,552 | ||||||||||
| 40,000,000 | 0.482 | (a) | 02/14/17 | 39,993,897 | ||||||||||
| 480,000,000 | 0.558 | (a) | 02/17/17 | 480,000,000 | ||||||||||
| 244,500,000 | 0.558 | (a) | 03/13/17 | 244,500,000 | ||||||||||
| 244,500,000 | 0.558 | (a) | 03/16/17 | 244,500,000 | ||||||||||
| 250,000,000 | 0.533 | (a) | 05/02/17 | 249,970,727 | ||||||||||
| 152,500,000 | 0.605 | (a) | 08/28/17 | 152,477,054 | ||||||||||
| 98,500,000 | 0.615 | (a)(b) | 09/01/17 | 98,500,000 | ||||||||||
| Federal Home Loan Mortgage Corporation |
| ||||||||||||
| 200,000,000 | 0.507 | (a) | 11/14/16 | 199,978,156 | ||||||||||
| 300,000,000 | 0.437 | (a) | 04/20/17 | 299,947,812 | ||||||||||
| 755,000,000 | 0.328 | (a) | 04/26/17 | 754,912,822 | ||||||||||
| 500,000,000 | 0.562 | (a) | 07/21/17 | 499,928,552 | ||||||||||
| Federal National Mortgage Association |
| ||||||||||||
| 837,500,000 | 0.514 | (a) | 10/21/16 | 837,463,790 | ||||||||||
| 143,175,000 | 0.452 | (a) | 07/20/17 | 143,055,018 | ||||||||||
|
| |||||||||||||
| | TOTAL U.S. GOVERNMENT AGENCY OBLIGATIONS | | $ | 19,163,276,824 | ||||||||||
|
| |||||||||||||
| U.S. Treasury Obligations – 11.8% | ||||||||||||||
| United States Treasury Bills |
| ||||||||||||
| $ | 301,000,000 | 0.464 | % | 08/25/16 | $ | 300,326,638 | ||||||||
| 949,000,000 | 0.481 | (b) | 09/01/16 | 946,697,091 | ||||||||||
| United States Treasury Floating Rate Note |
| ||||||||||||
| 350,050,000 | 0.389 | (a) | 04/30/16 | 350,078,326 | ||||||||||
| United States Treasury Notes |
| ||||||||||||
| 441,000,000 | 3.250 | 06/30/16 | 444,811,821 | |||||||||||
| 6,000,000 | 0.625 | 07/15/16 | 6,002,013 | |||||||||||
| 118,000,000 | 0.500 | 07/31/16 | 118,013,355 | |||||||||||
| 590,000,000 | 3.250 | 07/31/16 | 596,201,663 | |||||||||||
| 1,132,200,000 | 4.875 | 08/15/16 | 1,153,588,662 | |||||||||||
| 307,450,000 | 1.000 | 08/31/16 | 308,202,586 | |||||||||||
|
| |||||||||||||
| 12 | The accompanying notes are an integral part of these financial statements. |
FINANCIAL SQUARE GOVERNMENT FUND
Principal Amount | Interest Rate | Maturity Date | Amortized Cost | |||||||||||
| U.S. Treasury Obligations – (continued) | ||||||||||||||
| United States Treasury Notes – (continued) |
| ||||||||||||
| $ | 109,000,000 | 3.000 | % | 08/31/16 | $ | 110,333,862 | ||||||||
| 383,000,000 | 0.875 | 09/15/16 | 383,679,988 | |||||||||||
| 297,500,000 | 1.000 | 09/30/16 | 298,280,029 | |||||||||||
| 277,000,000 | 3.000 | 09/30/16 | 280,918,092 | |||||||||||
| 138,000,000 | 4.625 | 11/15/16 | 141,781,277 | |||||||||||
|
| |||||||||||||
| | TOTAL U.S. TREASURY OBLIGATIONS | | $ | 5,438,915,403 | ||||||||||
|
| |||||||||||||
| | TOTAL INVESTMENTS BEFORE REPURCHASE AGREEMENTS | | $ | 24,602,192,227 | ||||||||||
|
| |||||||||||||
| Repurchase Agreements(c) – 49.0% | ||||||||||||||
| Bank of Montreal |
| ||||||||||||
| $ | 300,000,000 | 0.360 | %(a)(d) | 03/07/16 | $ | 300,000,000 | ||||||||
| Maturity Value: $300,186,000 |
| ||||||||||||
| Settlement Date: 02/11/16 |
| ||||||||||||
| Collateralized by Federal Home Loan Mortgage Corp., 2.500% to | | ||||||||||||
|
| |||||||||||||
| Bank of Nova Scotia (The) |
| ||||||||||||
| 500,000,000 | 0.330 | (a)(d) | 03/07/16 | 500,000,000 | ||||||||||
| Maturity Value: $500,206,251 |
| ||||||||||||
| Settlement Date: 02/01/16 |
| ||||||||||||
| Collateralized by Federal Home Loan Mortgage Corp., 1.050%, | | ||||||||||||
| 850,000,000 | 0.360 | (a)(d) | 03/07/16 | 850,000,000 | ||||||||||
| Maturity Value: $850,586,500 |
| ||||||||||||
| Settlement Date: 01/07/16 |
| ||||||||||||
| Collateralized by Federal Home Loan Mortgage Corp., 3.000% to | | ||||||||||||
| 250,000,000 | 0.380 | (a)(d) | 03/07/16 | 250,000,000 | ||||||||||
| Maturity Value: $250,720,420 |
| ||||||||||||
| Settlement Date: 10/07/15 |
| ||||||||||||
| Collateralized by Federal Home Loan Mortgage Corp., 2.500% to | | ||||||||||||
|
| |||||||||||||
| Repurchase Agreements(c) – (continued) | ||||||||||||||
| Bank of Nova Scotia (The) – (continued) |
| ||||||||||||
| $ | 250,000,000 | 0.400 | %(a)(d) | 03/07/16 | $ | 250,000,000 | ||||||||
| Maturity Value: $250,758,333 |
| ||||||||||||
| Settlement Date: 02/11/16 |
| ||||||||||||
| Collateralized by Federal Home Loan Mortgage Corp., 3.000% to | | ||||||||||||
| 250,000,000 | 0.470 | (a)(d) | 03/07/16 | 250,000,000 | ||||||||||
| Maturity Value: $251,214,171 |
| ||||||||||||
| Settlement Date: 10/07/15 |
| ||||||||||||
| Collateralized by Federal Home Loan Mortgage Corp., 2.500% to | | ||||||||||||
|
| |||||||||||||
| BNP Paribas |
| ||||||||||||
| 2,000,000,000 | 0.300 | 03/01/16 | 2,000,000,000 | |||||||||||
| Maturity Value: $2,000,016,667 |
| ||||||||||||
| Collateralized by U.S. Treasury Bond, 5.000%, due 05/15/37, | | ||||||||||||
| 500,000,000 | 0.330 | (a)(d) | 03/01/16 | 500,000,000 | ||||||||||
| Maturity Value: $500,123,750 |
| ||||||||||||
| Settlement Date: 02/23/16 |
| ||||||||||||
| Collateralized by Federal Home Loan Mortgage Corp., 3.500% to | | ||||||||||||
|
| |||||||||||||
| The accompanying notes are an integral part of these financial statements. | 13 |
FINANCIAL SQUARE GOVERNMENT FUND
Schedule of Investments (continued)
February 29, 2016 (Unaudited)
Principal Amount | Interest Rate | Maturity Date | Amortized Cost | |||||||||||
| Repurchase Agreements(c) – (continued) | ||||||||||||||
| BNP Paribas – (continued) |
| ||||||||||||
| $ | 550,000,000 | 0.330 | %(a)(d) | 03/01/16 | $ | 550,000,000 | ||||||||
| Maturity Value: $550,100,834 |
| ||||||||||||
| Settlement Date: 02/23/16 |
| ||||||||||||
| Collateralized by Federal Home Loan Mortgage Corp., 3.500% to | | ||||||||||||
| 1,000,000,000 | 0.390 | (a)(d) | 03/07/16 | 1,000,000,000 | ||||||||||
| Maturity Value: $1,001,584,937 |
| ||||||||||||
| Settlement Date: 02/24/16 |
| ||||||||||||
| Collateralized by Federal Home Loan Mortgage Corp., 2.500% to | | ||||||||||||
|
| |||||||||||||
| BNP Paribas Securities Corp. |
| ||||||||||||
| 500,000,000 | 0.250 | (a)(d) | 03/01/16 | 500,000,000 | ||||||||||
| Maturity Value: $501,267,353 |
| ||||||||||||
| Settlement Date: 03/02/15 |
| ||||||||||||
| Collateralized by Federal Home Loan Bank, 3.300%, due | | ||||||||||||
| 48,500,000 | 0.310 | 03/01/16 | 48,500,000 | |||||||||||
| Maturity Value: $48,500,418 |
| ||||||||||||
| Collateralized by Federal Home Loan Mortgage Corp., 4.000% to | | ||||||||||||
|
| |||||||||||||
| Repurchase Agreements(c) – (continued) | ||||||||||||||
| Citibank N.A. |
| ||||||||||||
| $ | 400,000,000 | 0.320 | % | 03/02/16 | $ | 400,000,000 | ||||||||
| Maturity Value: $400,024,889 |
| ||||||||||||
| Settlement Date: 02/24/16 |
| ||||||||||||
| Collateralized by U.S. Treasury Bill, 0.000%, due 03/03/16, U.S. | | ||||||||||||
|
| |||||||||||||
| Citigroup Global Markets Inc. |
| ||||||||||||
| 600,000 | 0.300 | 03/01/16 | 600,000 | |||||||||||
| Maturity Value: $600,005 |
| ||||||||||||
| Collateralized by U.S. Treasury Note, 0.375%, due 03/15/16. The | | ||||||||||||
| 1,000,000 | 0.320 | 03/01/16 | 1,000,000 | |||||||||||
| Maturity Value: $1,000,009 |
| ||||||||||||
| Collateralized by U.S. Treasury Interest-Only Stripped Security, | | ||||||||||||
|
| |||||||||||||
| Credit Agricole Corporate and Investment Bank |
| ||||||||||||
| 250,000,000 | 0.340 | 03/02/16 | 250,000,000 | |||||||||||
| Maturity Value: $250,016,528 |
| ||||||||||||
| Settlement Date: 02/24/16 |
| ||||||||||||
| Collateralized by Federal Home Loan Mortgage Corp., 4.000%, | | ||||||||||||
| 250,000,000 | 0.340 | (e)(f) | 03/08/16 | 250,000,000 | ||||||||||
| Maturity Value: $250,016,528 |
| ||||||||||||
|
| |||||||||||||
| Federal Reserve Bank of New York |
| ||||||||||||
| 600,000,000 | 0.250 | 03/01/16 | 600,000,000 | |||||||||||
| Maturity Value: $600,004,167 |
| ||||||||||||
| Collateralized by U.S. Treasury Notes, 2.000%, due 11/30/20 to | | ||||||||||||
|
| |||||||||||||
| ING Financial Markets LLC |
| ||||||||||||
| 100,000,000 | 0.310 | 03/01/16 | 100,000,000 | |||||||||||
| Maturity Value: $100,000,861 |
| ||||||||||||
| Collateralized by Federal National Mortgage Association, 3.000% | | ||||||||||||
| 250,000,000 | 0.310 | 03/01/16 | 250,000,000 | |||||||||||
| Maturity Value: $250,002,153 |
| ||||||||||||
| Collateralized by Federal National Mortgage Association, 2.500% | | ||||||||||||
|
| |||||||||||||
| 14 | The accompanying notes are an integral part of these financial statements. |
FINANCIAL SQUARE GOVERNMENT FUND
Principal Amount | Interest Rate | Maturity Date | Amortized Cost | |||||||||||
| Repurchase Agreements(c) – (continued) | ||||||||||||||
| ING Financial Markets LLC – (continued) |
| ||||||||||||
| $ | 300,000,000 | 0.310 | % | 03/01/16 | $ | 300,000,000 | ||||||||
| Maturity Value: $300,002,583 |
| ||||||||||||
| Collateralized by Federal National Mortgage Association, 2.500% | | ||||||||||||
| 100,000,000 | 0.430 | (a)(e) | 04/08/16 | 100,000,000 | ||||||||||
| Maturity Value: $100,247,809 |
| ||||||||||||
| Settlement Date: 10/08/15 |
| ||||||||||||
| Collateralized by Federal National Mortgage Association, 3.000% | | ||||||||||||
| 500,000,000 | 0.430 | (a)(e) | 04/08/16 | 500,000,000 | ||||||||||
| Maturity Value: $501,980,480 |
| ||||||||||||
| Settlement Date: 05/26/15 |
| ||||||||||||
| Collateralized by Federal Home Loan Mortgage Corp., 7.000%, | | ||||||||||||
| 100,000,000 | 0.430 | (a)(e) | 04/15/16 | 100,000,000 | ||||||||||
| Maturity Value: $100,336,028 |
| ||||||||||||
| Settlement Date: 07/09/15 |
| ||||||||||||
| Collateralized by Federal National Mortgage Association, 3.000% | | ||||||||||||
|
| |||||||||||||
| Joint Repurchase Agreement Account I |
| ||||||||||||
| 3,094,300,000 | 0.300 | 03/01/16 | 3,094,300,000 | |||||||||||
| Maturity Value: $3,094,325,786 |
| ||||||||||||
|
| |||||||||||||
| Joint Repurchase Agreement Account III |
| ||||||||||||
| 2,831,400,000 | 0.320 | 03/01/16 | 2,831,400,000 | |||||||||||
| Maturity Value: $2,831,425,209 |
| ||||||||||||
|
| |||||||||||||
| JPMorgan Securities LLC |
| ||||||||||||
| 500,000,000 | 0.380 | 04/11/16 | 500,000,000 | |||||||||||
| Maturity Value: $500,480,278 |
| ||||||||||||
| Settlement Date: 01/11/16 |
| ||||||||||||
| Collateralized by Government National Mortgage Association, | | ||||||||||||
|
| |||||||||||||
| Merrill Lynch, Pierce, Fenner & Smith, Inc. |
| ||||||||||||
| 93,100,000 | 0.320 | 03/01/16 | 93,100,000 | |||||||||||
| Maturity Value: $93,100,828 |
| ||||||||||||
| Collateralized by Federal Home Loan Mortgage Corp., 3.500% to | | ||||||||||||
| 118,600,000 | 0.320 | 03/01/16 | 118,600,000 | |||||||||||
| Maturity Value: $118,601,054 |
| ||||||||||||
| Collateralized by Federal Home Loan Mortgage Corp., 2.500% to | | ||||||||||||
|
| |||||||||||||
| Repurchase Agreements(c) – (continued) | ||||||||||||||
| RBC Capital Markets LLC |
| ||||||||||||
| $ | 250,000,000 | 0.330 | %(a)(d) | 03/07/16 | $ | 250,000,000 | ||||||||
| Maturity Value: $250,412,502 |
| ||||||||||||
| Settlement Date: 09/09/15 |
| ||||||||||||
| Collateralized by Federal Home Loan Mortgage Corp., 3.500% to | | ||||||||||||
| 250,000,000 | 0.340 | (a)(d) | 03/07/16 | 250,000,000 | ||||||||||
| Maturity Value: $250,151,110 |
| ||||||||||||
| Settlement Date: 01/13/16 |
| ||||||||||||
| Collateralized by Federal Home Loan Mortgage Corp., 2.500% to | | ||||||||||||
| 250,000,000 | 0.340 | (a)(d) | 03/07/16 | 250,000,000 | ||||||||||
| Maturity Value: $250,424,998 |
| ||||||||||||
| Settlement Date: 09/17/15 |
| ||||||||||||
| Collateralized by Federal Home Loan Mortgage Corp., 3.000% to | | ||||||||||||
| 50,000,000 | 0.370 | (a)(d) | 03/07/16 | 50,000,000 | ||||||||||
| Maturity Value: $50,046,250 |
| ||||||||||||
| Settlement Date: 01/15/16 |
| ||||||||||||
| Collateralized by Federal Home Loan Mortgage Corp., 3.500% to | | ||||||||||||
| 200,000,000 | 0.370 | (a)(d) | 03/07/16 | 200,000,000 | ||||||||||
| Maturity Value: $200,789,335 |
| ||||||||||||
| Settlement Date: 03/27/15 |
| ||||||||||||
| Collateralized by Federal Home Loan Mortgage Corp., 3.000% to | | ||||||||||||
| 1,000,000,000 | 0.374 | (a)(d) | 03/07/16 | 1,000,000,000 | ||||||||||
| Maturity Value: $1,003,696,455 |
| ||||||||||||
| Settlement Date: 05/05/15 |
| ||||||||||||
| Collateralized by Federal Home Loan Mortgage Corp., 1.750% to | | ||||||||||||
|
| |||||||||||||
| The accompanying notes are an integral part of these financial statements. | 15 |
FINANCIAL SQUARE GOVERNMENT FUND
Schedule of Investments (continued)
February 29, 2016 (Unaudited)
Principal Amount | Interest Rate | Maturity Date | Amortized Cost | |||||||||||
| Repurchase Agreements(c) – (continued) | ||||||||||||||
| RBC Capital Markets LLC – (continued) |
| ||||||||||||
| $ | 350,000,000 | 0.390 | %(a)(d) | 03/07/16 | $ | 350,000,000 | ||||||||
| Maturity Value: $350,682,498 |
| ||||||||||||
| Settlement Date: 02/10/16 |
| ||||||||||||
| Collateralized by Federal Home Loan Mortgage Corp., 3.000% to | | ||||||||||||
|
| |||||||||||||
| Societe Generale |
| ||||||||||||
| 720,000,000 | 0.320 | 03/01/16 | 720,000,000 | |||||||||||
| Maturity Value: $720,006,400 |
| ||||||||||||
| Collateralized by U.S. Treasury Bonds, 7.250% to 8.125%, due | | ||||||||||||
| 335,000,000 | 0.340 | 03/01/16 | 335,000,000 | |||||||||||
| Maturity Value: $335,003,164 |
| ||||||||||||
| Collateralized by Government National Mortgage Association, | | ||||||||||||
|
| |||||||||||||
| TD Securities (USA) LLC |
| ||||||||||||
| 100,000,000 | 0.320 | 03/02/16 | 100,000,000 | |||||||||||
| Maturity Value: $100,006,222 |
| ||||||||||||
| Settlement Date: 02/24/16 |
| ||||||||||||
| Collateralized by Federal Home Loan Mortgage Corp., 3.000%, | | ||||||||||||
|
| |||||||||||||
| Wells Fargo Bank N.A. |
| ||||||||||||
| 350,000,000 | 0.330 | 03/01/16 | 350,000,000 | |||||||||||
| Maturity Value: $350,003,208 |
| ||||||||||||
| Collateralized by Federal Home Loan Mortgage Corp., 3.500%, | | ||||||||||||
|
| |||||||||||||
| Wells Fargo Securities LLC |
| ||||||||||||
| 250,000,000 | 0.310 | 03/01/16 | 250,000,000 | |||||||||||
| Maturity Value: $250,002,153 |
| ||||||||||||
| 250,000,000 | 0.310 | 03/01/16 | 250,000,000 | |||||||||||
| Maturity Value: $250,002,153 |
| ||||||||||||
| Shared collateral consisting of U.S. Treasury Inflation-Indexed | | ||||||||||||
|
| |||||||||||||
| Repurchase Agreements(c) – (continued) | ||||||||||||||
| Wells Fargo Securities LLC – (continued) |
| ||||||||||||
| $ | 750,000,000 | 0.310 | % | 03/01/16 | $ | 750,000,000 | ||||||||
| Maturity Value: $750,045,208 |
| ||||||||||||
| Settlement Date: 02/23/16 |
| ||||||||||||
| Collateralized by Federal Home Loan Mortgage Corp., 3.500% to | | ||||||||||||
| 200,000,000 | 0.330 | 03/01/16 | 200,000,000 | |||||||||||
| Maturity Value: $200,001,833 |
| ||||||||||||
| Collateralized by Federal Home Loan Mortgage Corp., 3.000% to | | ||||||||||||
| 300,000,000 | 0.330 | 03/01/16 | 300,000,000 | |||||||||||
| Maturity Value: $300,002,750 |
| ||||||||||||
| Collateralized by Federal National Mortgage Association, | | ||||||||||||
| 325,000,000 | 0.440 | (e) | 04/12/16 | 325,000,000 | ||||||||||
| Maturity Value: $325,357,500 |
| ||||||||||||
| Settlement Date: 01/13/16 |
| ||||||||||||
| Collateralized by Federal Home Loan Mortgage Corp., 2.500% to | | ||||||||||||
| 200,000,000 | 0.440 | (e) | 04/27/16 | 200,000,000 | ||||||||||
| Maturity Value: $200,222,444 |
| ||||||||||||
| Settlement Date: 01/27/16 |
| ||||||||||||
| Collateralized by Federal Home Loan Mortgage Corp., 3.500%, | | ||||||||||||
|
| |||||||||||||
| TOTAL REPURCHASE AGREEMENTS | $ | 22,617,500,000 | ||||||||||||
|
| |||||||||||||
| TOTAL INVESTMENTS – 102.3% | $ | 47,219,692,227 | ||||||||||||
|
| |||||||||||||
| | LIABILITIES IN EXCESS OF OTHER ASSETS – (2.3)% | | (1,065,127,422 | ) | ||||||||||
|
| |||||||||||||
| NET ASSETS – 100.0% | $ | 46,154,564,805 | ||||||||||||
|
| |||||||||||||
| 16 | The accompanying notes are an integral part of these financial statements. |
FINANCIAL SQUARE GOVERNMENT FUND
| The percentage shown for each investment category reflects the value of investments in that category as a percentage of net assets. | ||
(a) | Variable or floating rate security. Interest rate disclosed is that which is in effect at February 29, 2016. | |
(b) | All or a portion represents a forward commitment. | |
(c) | Unless noted, all repurchase agreements were entered into on February 29, 2016. Additional information on Joint Repurchase Agreement Accounts I and III appear on pages 50-51. | |
(d) | The instrument is subject to a demand feature. | |
(e) | Security has been determined to be illiquid by the Investment Adviser. At February 29, 2016, these securities amounted to $1,475,000,000 or approximately 3.2% of net assets. | |
(f) | All or a portion represents a forward commitment. Forward settling repurchase agreements will be collateralized at settlement. | |
Interest rates represent either the stated coupon rate, annualized yield on date of purchase for discounted securities, or, for floating rate securities, the current reset rate, which is based upon current interest rate indices.
Maturity dates represent either the final legal maturity date on the security, the demand date for puttable securities, or the prerefunded date for those types of securities.
| The accompanying notes are an integral part of these financial statements. | 17 |
FINANCIAL SQUARE MONEY MARKET FUND
Schedule of Investments
February 29, 2016 (Unaudited)
Principal Amount | Interest Rate | Maturity Date | Amortized Cost | |||||||||||
| Commercial Paper and Corporate Obligations – 15.4% | ||||||||||||||
| Adventis Health System |
| ||||||||||||
| $ | 150,000,000 | 0.417 | % | 03/08/16 | $ | 149,988,042 | ||||||||
| Albion Capital LLC |
| ||||||||||||
| 79,756,000 | 0.571 | 03/16/16 | 79,737,390 | |||||||||||
| 100,000,000 | 0.510 | 03/21/16 | 99,972,222 | |||||||||||
| 55,134,000 | 0.499 | 03/22/16 | 55,118,241 | |||||||||||
| Ascension Health Alliance |
| ||||||||||||
| 40,000,000 | 0.458 | 04/07/16 | 39,981,500 | |||||||||||
| 30,000,000 | 0.560 | 05/03/16 | 29,971,125 | |||||||||||
| 40,411,000 | 0.560 | 05/05/16 | 40,370,870 | |||||||||||
| Atlantic Asset Securitization LLC |
| ||||||||||||
| 305,000,000 | 0.336 | 03/01/16 | 305,000,000 | |||||||||||
| Bedford Row Funding Corp. |
| ||||||||||||
| 41,000,000 | 0.859 | 08/01/16 | 40,853,630 | |||||||||||
| 30,000,000 | 0.829 | 08/15/16 | 29,887,275 | |||||||||||
| BNZ International Funding Ltd. |
| ||||||||||||
| 24,750,000 | 0.849 | 08/16/16 | 24,654,135 | |||||||||||
| CAFCO LLC |
| ||||||||||||
| 60,000,000 | 0.818 | 08/08/16 | 59,786,667 | |||||||||||
| 30,000,000 | 0.818 | 08/10/16 | 29,892,000 | |||||||||||
| Chariot Funding LLC |
| ||||||||||||
| 75,000,000 | 0.870 | 07/19/16 | 74,752,083 | |||||||||||
| Charta LLC |
| ||||||||||||
| 50,000,000 | 0.459 | 03/29/16 | 49,982,500 | |||||||||||
| 65,000,000 | 0.746 | 06/27/16 | 64,844,469 | |||||||||||
| 60,000,000 | 0.818 | 08/08/16 | 59,786,667 | |||||||||||
| 150,000,000 | 0.818 | 08/10/16 | 149,460,000 | |||||||||||
| Ciesco LLC |
| ||||||||||||
| 60,000,000 | 0.818 | 08/08/16 | 59,786,667 | |||||||||||
| Commonwealth Bank of Australia |
| ||||||||||||
| 100,000,000 | 0.829 | 08/24/16 | 99,604,000 | |||||||||||
| CRC Funding LLC |
| ||||||||||||
| 74,750,000 | 0.818 | 08/01/16 | 74,495,850 | |||||||||||
| Erste Abwicklungsanstalt |
| ||||||||||||
| 200,000,000 | 0.377 | 03/03/16 | 199,995,889 | |||||||||||
| 35,000,000 | 0.664 | 06/08/16 | 34,937,437 | |||||||||||
| Fairway Finance Co., LLC |
| ||||||||||||
| 25,000,000 | 0.479 | 04/04/16 | 24,988,903 | |||||||||||
| Gotham Funding Corp. |
| ||||||||||||
| 60,000,000 | 0.541 | 03/24/16 | 59,979,683 | |||||||||||
| 75,332,000 | 0.541 | 03/29/16 | 75,300,947 | |||||||||||
| 95,000,000 | 0.529 | 04/19/16 | 94,932,761 | |||||||||||
| 125,000,000 | 0.529 | 04/25/16 | 124,900,694 | |||||||||||
| JPMorgan Securities LLC |
| ||||||||||||
| 200,000,000 | 0.531 | 03/23/16 | 199,936,444 | |||||||||||
| Jupiter Securitization Co. LLC |
| ||||||||||||
| 25,000,000 | 0.870 | 07/20/16 | 24,916,771 | |||||||||||
| Kaiser Foundation Hospitals |
| ||||||||||||
| 32,023,000 | 0.520 | 03/21/16 | 32,013,935 | |||||||||||
| 29,800,000 | 0.539 | 04/26/16 | 29,775,431 | |||||||||||
| 30,000,000 | 0.612 | 05/02/16 | 29,969,000 | |||||||||||
| 30,078,000 | 0.582 | 05/17/16 | 30,041,330 | |||||||||||
| 50,000,000 | 0.612 | 05/25/16 | 49,929,167 | |||||||||||
| 60,276,000 | 0.715 | 07/05/16 | 60,128,324 | |||||||||||
| 30,000,000 | 0.736 | 07/21/16 | 29,914,800 | |||||||||||
| 30,275,000 | 0.766 | 08/11/16 | 30,172,191 | |||||||||||
|
| |||||||||||||
| Commercial Paper and Corporate Obligations – (continued) | ||||||||||||||
| Kells Funding LLC |
| ||||||||||||
| $ | 125,000,000 | 0.326 | % | 03/07/16 | $ | 124,993,333 | ||||||||
| 168,000,000 | 0.612 | 05/12/16 | 167,798,400 | |||||||||||
| 200,000,000 | 0.622 | (a) | 06/07/16 | 199,667,889 | ||||||||||
| 99,000,000 | 0.623 | (a) | 06/10/16 | 98,835,605 | ||||||||||
| Liberty Street Funding LLC |
| ||||||||||||
| 90,000,000 | 0.612 | 03/14/16 | 89,980,500 | |||||||||||
| 65,000,000 | 0.664 | 03/17/16 | 64,981,222 | |||||||||||
| 250,000,000 | 0.469 | 04/25/16 | 249,824,306 | |||||||||||
| LMA Americas LLC |
| ||||||||||||
| 49,100,000 | 0.408 | 03/07/16 | 49,096,727 | |||||||||||
| Matchpoint Finance PLC |
| ||||||||||||
| 65,000,000 | 0.510 | 03/02/16 | 64,999,097 | |||||||||||
| Mizuho Bank Ltd. |
| ||||||||||||
| 43,700,000 | 0.695 | 06/17/16 | 43,610,852 | |||||||||||
| National Australia Bank Ltd. |
| ||||||||||||
| 460,000,000 | 0.664 | 03/21/16 | 459,833,889 | |||||||||||
| Nederlandse Waterschapsbank NV |
| ||||||||||||
| 250,000,000 | 0.602 | 03/21/16 | 250,000,000 | |||||||||||
| Nordea Bank AB |
| ||||||||||||
| 500,000,000 | 0.834 | 08/11/16 | 498,154,931 | |||||||||||
| Old Line Funding Corp. |
| ||||||||||||
| 140,000,000 | 0.797 | 04/14/16 | 139,866,533 | |||||||||||
| 75,000,000 | 0.766 | 04/18/16 | 74,925,000 | |||||||||||
| 143,000,000 | 0.797 | 04/20/16 | 142,845,083 | |||||||||||
| 100,000,000 | 0.890 | 07/14/16 | 99,673,787 | |||||||||||
| 88,168,000 | 0.765 | 07/21/16 | 87,907,170 | |||||||||||
| Regency Markets No. 1 LLC |
| ||||||||||||
| 195,000,000 | 0.438 | 03/15/16 | 194,967,392 | |||||||||||
| 130,000,000 | 0.438 | 03/21/16 | 129,968,944 | |||||||||||
| Skandinaviska Enskilda Banken AB |
| ||||||||||||
| 50,000,000 | 0.725 | 06/28/16 | 49,882,653 | |||||||||||
| SSM Health Care Corp. |
| ||||||||||||
| 60,000,000 | 0.510 | 03/22/16 | 59,982,500 | |||||||||||
| 30,000,000 | 0.510 | 04/13/16 | 29,982,083 | |||||||||||
| 30,000,000 | 0.582 | 05/17/16 | 29,963,425 | |||||||||||
| 30,000,000 | 0.580 | 05/25/16 | 29,959,625 | |||||||||||
| Standard Chartered Bank |
| ||||||||||||
| 255,000,000 | 0.828 | 06/30/16 | 254,305,762 | |||||||||||
| Svenska Handelsbanken AB |
| ||||||||||||
| 120,000,000 | 0.818 | 08/09/16 | 119,570,667 | |||||||||||
| Thunder Bay Funding, Inc. |
| ||||||||||||
| 50,000,000 | 0.715 | 04/11/16 | 49,960,139 | |||||||||||
| Victory Receivables Corp. |
| ||||||||||||
| 80,000,000 | 0.541 | 03/22/16 | 79,975,267 | |||||||||||
| 165,000,000 | 0.479 | 03/24/16 | 164,950,454 | |||||||||||
| 65,000,000 | 0.541 | 03/28/16 | 64,974,162 | |||||||||||
| 75,000,000 | 0.541 | 04/01/16 | 74,965,771 | |||||||||||
| 100,000,000 | 0.550 | 04/25/16 | 99,917,500 | |||||||||||
|
| |||||||||||||
| | TOTAL COMMERCIAL PAPER AND CORPORATE OBLIGATIONS | | $ | 7,090,079,708 | ||||||||||
|
| |||||||||||||
| Certificate of Deposit – 0.3% | ||||||||||||||
| Wells Fargo Bank N.A. |
| ||||||||||||
| $ | 145,000,000 | 0.840 | % | 08/18/16 | $ | 145,000,000 | ||||||||
|
| |||||||||||||
| 18 | The accompanying notes are an integral part of these financial statements. |
FINANCIAL SQUARE MONEY MARKET FUND
Principal Amount | Interest Rate | Maturity Date | Amortized Cost | |||||||||||
| Certificates of Deposit-Eurodollar – 2.2% | ||||||||||||||
| HSBC Bank PLC |
| ||||||||||||
| $ | 150,000,000 | 0.850 | % | 08/10/16 | $ | 150,003,360 | ||||||||
| 175,000,000 | 0.860 | 08/25/16 | 175,004,284 | |||||||||||
| Mitsubishi UFJ Trust & Banking Corp. |
| ||||||||||||
| 140,000,000 | 0.760 | 06/02/16 | 140,001,804 | |||||||||||
| Sumitomo Mitsui Trust Bank Ltd. |
| ||||||||||||
| 250,000,000 | 0.830 | 06/24/16 | 250,003,982 | |||||||||||
| 150,000,000 | 0.890 | 07/18/16 | 150,002,885 | |||||||||||
| 150,000,000 | 0.900 | 07/26/16 | 150,003,051 | |||||||||||
|
| |||||||||||||
| | TOTAL CERTIFICATES OF DEPOSIT-EURODOLLAR | | $ | 1,015,019,366 | ||||||||||
|
| |||||||||||||
| Certificates of Deposit-Yankeedollar – 17.2% | ||||||||||||||
| Banco Del Estado De Chile |
| ||||||||||||
| $ | 50,000,000 | 0.800 | % | 08/01/16 | $ | 50,000,000 | ||||||||
| Bank of Nova Scotia (The) |
| ||||||||||||
| 450,000,000 | 0.480 | 04/06/16 | 450,000,000 | |||||||||||
| Credit Industriel et Commercial |
| ||||||||||||
| 220,000,000 | 0.650 | 03/16/16 | 220,000,000 | |||||||||||
| 100,000,000 | 0.700 | 05/06/16 | 100,000,000 | |||||||||||
| 150,000,000 | 0.710 | 05/09/16 | 150,000,000 | |||||||||||
| Credit Suisse AG |
| ||||||||||||
| 150,000,000 | 0.830 | 06/13/16 | 150,000,000 | |||||||||||
| DZ Bank AG |
| ||||||||||||
| 150,000,000 | 0.350 | 03/07/16 | 150,000,000 | |||||||||||
| 230,000,000 | 0.710 | 06/30/16 | 230,000,000 | |||||||||||
| 200,000,000 | 0.750 | 07/18/16 | 200,000,000 | |||||||||||
| 140,000,000 | 0.750 | 07/29/16 | 140,000,000 | |||||||||||
| HSBC Bank PLC |
| ||||||||||||
| 50,000,000 | 0.660 | 06/09/16 | 50,000,000 | |||||||||||
| Mitsubishi UFJ Trust & Banking Corp. |
| ||||||||||||
| 200,000,000 | 0.700 | 06/21/16 | 200,000,000 | |||||||||||
| 250,000,000 | 0.750 | 07/13/16 | 250,000,000 | |||||||||||
| 60,000,000 | 0.870 | 07/14/16 | 60,020,103 | |||||||||||
| 85,000,000 | 0.850 | 07/19/16 | 85,022,836 | |||||||||||
| Mizuho Bank Ltd. |
| ||||||||||||
| 145,000,000 | 0.680 | 06/02/16 | 145,000,000 | |||||||||||
| 138,000,000 | 0.700 | 06/15/16 | 138,000,000 | |||||||||||
| 225,000,000 | 0.700 | 06/22/16 | 225,000,000 | |||||||||||
| 140,000,000 | 0.760 | 07/05/16 | 140,000,000 | |||||||||||
| 150,000,000 | 0.750 | 07/15/16 | 150,000,000 | |||||||||||
| 100,000,000 | 0.830 | 08/03/16 | 100,000,000 | |||||||||||
| National Bank of Kuwait |
| ||||||||||||
| 87,500,000 | 0.800 | 04/13/16 | 87,500,000 | |||||||||||
| 100,000,000 | 0.800 | 05/23/16 | 100,000,000 | |||||||||||
| 50,000,000 | 0.800 | 05/27/16 | 50,000,000 | |||||||||||
| 50,000,000 | 0.800 | 06/03/16 | 50,000,000 | |||||||||||
| 100,000,000 | 0.800 | 06/08/16 | 100,000,000 | |||||||||||
| 100,000,000 | 0.800 | 06/20/16 | 100,000,000 | |||||||||||
| 150,000,000 | 0.800 | 06/22/16 | 150,000,000 | |||||||||||
| Norinchukin Bank (The) |
| ||||||||||||
| 215,000,000 | 0.680 | 06/01/16 | 215,000,000 | |||||||||||
| 225,000,000 | 0.700 | 06/22/16 | 225,000,000 | |||||||||||
| 215,000,000 | 0.770 | 07/01/16 | 215,000,000 | |||||||||||
|
| |||||||||||||
| Certificates of Deposit-Yankeedollar – (continued) | ||||||||||||||
| Standard Chartered Bank |
| ||||||||||||
| $ | 202,500,000 | 0.650 | % | 03/23/16 | $ | 202,500,000 | ||||||||
| 185,000,000 | 0.800 | 06/06/16 | 185,000,000 | |||||||||||
| 115,000,000 | 0.910 | 07/29/16 | 115,000,000 | |||||||||||
| State Street Bank & Trust Co. |
| ||||||||||||
| 350,000,000 | 0.830 | 08/25/16 | 350,000,000 | |||||||||||
| Sumitomo Mitsui Banking Corp. |
| ||||||||||||
| 175,000,000 | 0.500 | 03/18/16 | 175,000,000 | |||||||||||
| 250,000,000 | 0.500 | 03/21/16 | 250,000,000 | |||||||||||
| 119,750,000 | 0.850 | 06/09/16 | 119,786,192 | |||||||||||
| 72,000,000 | 0.870 | 07/14/16 | 72,024,009 | |||||||||||
| 45,000,000 | 0.850 | 07/26/16 | 45,012,716 | |||||||||||
| 120,000,000 | 0.760 | 08/01/16 | 120,000,000 | |||||||||||
| 76,000,000 | 0.850 | 08/01/16 | 76,022,385 | |||||||||||
| Sumitomo Mitsui Trust Bank Ltd. |
| ||||||||||||
| 225,000,000 | 0.700 | 06/13/16 | 225,000,000 | |||||||||||
| Svenska Handelsbanken AB |
| ||||||||||||
| 200,000,000 | 0.820 | 07/29/16 | 200,000,000 | |||||||||||
| Toronto-Dominion Bank (The) |
| ||||||||||||
| 250,000,000 | 0.550 | 04/15/16 | 250,000,000 | |||||||||||
| 550,000,000 | 0.850 | 07/07/16 | 550,000,000 | |||||||||||
| UBS AG |
| ||||||||||||
| 140,000,000 | 0.670 | 06/03/16 | 140,000,000 | |||||||||||
| 140,000,000 | 0.850 | 08/03/16 | 140,000,000 | |||||||||||
|
| |||||||||||||
| | TOTAL CERTIFICATES OF DEPOSIT-YANKEEDOLLAR | | $ | 7,890,888,241 | ||||||||||
|
| |||||||||||||
| Fixed Rate Municipal Debt Obligations – 0.7% | ||||||||||||||
| Australia & New Zealand Banking Group Ltd. |
| ||||||||||||
| $ | 171,150,000 | 3.250 | %(b) | 03/01/16 | $ | 171,150,000 | ||||||||
| GE Capital International Funding Co. |
| ||||||||||||
| 103,734,000 | 0.964 | (b) | 04/15/16 | 103,773,119 | ||||||||||
| ING Bank NV |
| ||||||||||||
| 41,950,000 | 4.000 | (b) | 03/15/16 | 42,005,769 | ||||||||||
| National Australia Bank Ltd. |
| ||||||||||||
| 3,200,000 | 3.000 | (a)(b) | 07/27/16 | 3,228,873 | ||||||||||
|
| |||||||||||||
| | TOTAL FIXED RATE MUNICIPAL DEBT OBLIGATIONS | | $ | 320,157,761 | ||||||||||
|
| |||||||||||||
| Time Deposits – 18.8% | ||||||||||||||
| BNYMellon, National Association |
| ||||||||||||
| $ | 1,000,000,000 | 0.270 | % | 03/01/16 | $ | 1,000,000,000 | ||||||||
| Credit Agricole Corporate and Investment Bank |
| ||||||||||||
| 2,275,000,000 | 0.310 | 03/01/16 | 2,275,000,000 | |||||||||||
| Credit Industriel et Commercial |
| ||||||||||||
| 400,000,000 | 0.300 | 03/01/16 | 400,000,000 | |||||||||||
| DNB Bank ASA/New York |
| ||||||||||||
| 500,000,000 | 0.290 | 03/01/16 | 500,000,000 | |||||||||||
| 800,000,000 | 0.370 | 03/02/16 | 800,000,000 | |||||||||||
| National Bank of Kuwait |
| ||||||||||||
| 500,000,000 | 0.320 | 03/01/16 | 500,000,000 | |||||||||||
| Natixis |
| ||||||||||||
| 1,300,000,000 | 0.310 | 03/01/16 | 1,300,000,000 | |||||||||||
|
| |||||||||||||
| The accompanying notes are an integral part of these financial statements. | 19 |
FINANCIAL SQUARE MONEY MARKET FUND
Schedule of Investments (continued)
February 29, 2016 (Unaudited)
Principal Amount | Interest Rate | Maturity Date | Amortized Cost | |||||||||||
| Time Deposits – (continued) | ||||||||||||||
| Skandinaviska Enskilda Banken AB |
| ||||||||||||
| $ | 700,000,000 | 0.290 | % | 03/01/16 | $ | 700,000,000 | ||||||||
| 400,000,000 | 0.350 | 03/01/16 | 400,000,000 | |||||||||||
| Swedbank AB |
| ||||||||||||
| 800,000,000 | 0.290 | 03/01/16 | 800,000,000 | |||||||||||
|
| |||||||||||||
| TOTAL TIME DEPOSITS | $ | 8,675,000,000 | ||||||||||||
|
| |||||||||||||
| U.S. Government Agency Obligations – 1.5% | ||||||||||||||
| Federal Home Loan Bank |
| ||||||||||||
| $ | 300,000,000 | 0.300 | % | 03/07/16 | $ | 299,999,364 | ||||||||
| 74,000,000 | 0.340 | 03/08/16 | 73,999,811 | |||||||||||
| 148,000,000 | 0.330 | 03/09/16 | 147,999,246 | |||||||||||
| 89,000,000 | 0.340 | 03/09/16 | 88,999,740 | |||||||||||
| Overseas Private Investment Corp. (USA) |
| ||||||||||||
| 92,100,000 | 0.400 | (c) | 03/07/16 | 92,100,000 | ||||||||||
|
| |||||||||||||
| | TOTAL U.S. GOVERNMENT AGENCY OBLIGATIONS | | $ | 703,098,161 | ||||||||||
|
| |||||||||||||
| U.S. Treasury Obligations – 1.4% | ||||||||||||||
| United States Treasury Notes |
| ||||||||||||
| $ | 309,000,000 | 1.500 | % | 06/30/16 | $ | 310,066,820 | ||||||||
| 330,500,000 | 3.250 | 06/30/16 | 333,373,312 | |||||||||||
|
| |||||||||||||
| | TOTAL U.S. TREASURY OBLIGATIONS | | $ | 643,440,132 | ||||||||||
|
| |||||||||||||
| Variable Rate Municipal Debt Obligations(c) – 0.4% | ||||||||||||||
| BlackRock Municipal Bond Trust VRDN RB Putters Series 2012-T0014 (JPMorgan | | ||||||||||||
| $ | 19,375,000 | 0.370 | % | 03/01/16 | $ | 19,375,000 | ||||||||
| BlackRock MuniVest Fund VRDN RB Putters Series 2012-T0005 (JPMorgan | | ||||||||||||
| 13,950,000 | 0.370 | 03/01/16 | 13,950,000 | |||||||||||
| BlackRock MuniVest Fund, Inc. VRDN RB Putters Series 2012-T0007 (JPMorgan | | ||||||||||||
| 29,110,000 | 0.370 | 03/01/16 | 29,110,000 | |||||||||||
| City of Portland, Maine GO VRDN for Taxable Pension Boards Series 2001 RMKT | | ||||||||||||
| 60,000,000 | 0.420 | 03/07/16 | 60,000,000 | |||||||||||
| Montgomery County, Tennessee Industrial Development Board VRDN RB for | | ||||||||||||
| 40,000,000 | 0.550 | 03/07/16 | 40,000,000 | |||||||||||
|
| |||||||||||||
| | TOTAL VARIABLE RATE MUNICIPAL DEBT OBLIGATIONS | | $ | 162,435,000 | ||||||||||
|
| |||||||||||||
| Variable Rate Obligations(c) – 22.3% | ||||||||||||||
| Australia & New Zealand Banking Group Ltd. |
| ||||||||||||
| $ | 260,000,000 | 0.790 | %(b) | 05/16/16 | $ | 260,000,000 | ||||||||
|
| |||||||||||||
| Variable Rate Obligations(c) – (continued) | ||||||||||||||
| Banco Del Estado De Chile |
| ||||||||||||
| $ | 75,000,000 | 0.781 | % | 06/15/16 | $ | 75,000,000 | ||||||||
| 50,000,000 | 0.776 | 08/12/16 | 50,000,000 | |||||||||||
| Bank Nederlandse Gemeenten NV |
| ||||||||||||
| 300,000,000 | 0.608 | (b) | 05/09/16 | 300,000,000 | ||||||||||
| 250,000,000 | 0.607 | (b) | 05/16/16 | 250,000,000 | ||||||||||
| Bank of Montreal |
| ||||||||||||
| 500,000,000 | 0.599 | 04/11/16 | 500,000,000 | |||||||||||
| 250,000,000 | 0.609 | 05/17/16 | 250,000,000 | |||||||||||
| Bank of Nova Scotia (The) |
| ||||||||||||
| 350,000,000 | 0.788 | 05/23/16 | 350,000,000 | |||||||||||
| 150,000,000 | 0.638 | 06/06/16 | 150,000,000 | |||||||||||
| BNZ International Funding Ltd. |
| ||||||||||||
| 100,000,000 | 0.574 | (b) | 03/24/16 | 100,000,000 | ||||||||||
| Collateralized Commercial Paper Co. LLC |
| ||||||||||||
| 520,000,000 | 0.808 | 07/06/16 | 520,000,000 | |||||||||||
| Commonwealth Bank of Australia |
| ||||||||||||
| 200,000,000 | 0.599 | (b) | 03/10/16 | 200,000,000 | ||||||||||
| 115,500,000 | 0.543 | (b) | 03/24/16 | 115,499,661 | ||||||||||
| 250,000,000 | 0.609 | (b) | 06/10/16 | 250,000,000 | ||||||||||
| 75,000,000 | 0.610 | (b) | 06/14/16 | 75,000,000 | ||||||||||
| Cooperatieve Centrale Raiffeisen-Boerenleenbank BA-NY |
| ||||||||||||
| 750,000,000 | 0.630 | 04/18/16 | 750,000,000 | |||||||||||
| Cooperatieve Rabobank UA |
| ||||||||||||
| 500,000,000 | 0.759 | 06/17/16 | 500,000,000 | |||||||||||
| Credit Suisse AG |
| ||||||||||||
| 145,000,000 | 0.856 | 08/02/16 | 145,000,000 | |||||||||||
| Dexia Credit Local SA/New York |
| ||||||||||||
| 500,000,000 | 0.610 | 04/18/16 | 500,000,000 | |||||||||||
| 100,000,000 | 0.609 | 05/10/16 | 100,000,000 | |||||||||||
| 100,000,000 | 0.680 | 05/19/16 | 99,995,537 | |||||||||||
| DNB Bank ASA/New York |
| ||||||||||||
| 550,000,000 | 0.591 | 04/15/16 | 550,000,000 | |||||||||||
| Erste Abwicklungsanstalt |
| ||||||||||||
| 200,000,000 | 0.586 | (b) | 03/01/16 | 200,000,000 | ||||||||||
| Fairway Finance Co., LLC |
| ||||||||||||
| 64,750,000 | 0.766 | (b) | 08/01/16 | 64,750,000 | ||||||||||
| General Electric Co. |
| ||||||||||||
| 30,000,000 | 1.271 | (a) | 07/12/16 | 30,070,081 | ||||||||||
| HSBC Bank PLC |
| ||||||||||||
| 250,000,000 | 0.669 | (b) | 06/17/16 | 250,000,000 | ||||||||||
| JPMorgan Chase Bank N.A. |
| ||||||||||||
| 222,000,000 | 0.612 | 04/07/16 | 222,000,000 | |||||||||||
| Oversea-Chinese Banking Corp., Ltd. |
| ||||||||||||
| 200,000,000 | 0.666 | 05/25/16 | 200,000,000 | |||||||||||
| Royal Bank of Canada |
| ||||||||||||
| 187,096,000 | 0.832 | 03/08/16 | 187,108,580 | |||||||||||
| 300,000,000 | 0.732 | 03/31/16 | 300,000,000 | |||||||||||
| 400,000,000 | 0.609 | 06/06/16 | 400,000,000 | |||||||||||
| State Street Bank & Trust Co. |
| ||||||||||||
| 350,000,000 | 0.631 | 03/14/16 | 350,000,000 | |||||||||||
| 175,000,000 | 0.599 | 04/04/16 | 175,000,000 | |||||||||||
| Sumitomo Mitsui Banking Corp. |
| ||||||||||||
| 300,000,000 | 0.595 | 03/02/16 | 300,000,000 | |||||||||||
| Sumitomo Mitsui Trust Bank Ltd. |
| ||||||||||||
| 95,000,000 | 0.829 | 07/29/16 | 95,000,000 | |||||||||||
|
| |||||||||||||
| 20 | The accompanying notes are an integral part of these financial statements. |
FINANCIAL SQUARE MONEY MARKET FUND
Principal Amount | Interest Rate | Maturity Date | Amortized Cost | |||||||||||
| Variable Rate Obligations(c) – (continued) | ||||||||||||||
| Svenska Handelsbanken AB |
| ||||||||||||
| $ | 195,000,000 | 0.872 | %(b) | 05/04/16 | $ | 195,000,000 | ||||||||
| 200,000,000 | 0.758 | 07/27/16 | 200,000,000 | |||||||||||
| Toronto-Dominion Bank (The) |
| ||||||||||||
| 7,800,000 | 0.792 | (a) | 07/13/16 | 7,802,254 | ||||||||||
| Wells Fargo Bank N.A. |
| ||||||||||||
| 150,000,000 | 0.740 | 05/19/16 | 150,000,000 | |||||||||||
| 400,000,000 | 0.664 | 06/10/16 | 400,000,000 | |||||||||||
| Westpac Banking Corp. |
| ||||||||||||
| 200,000,000 | 0.600 | (b) | 05/19/16 | 200,000,000 | ||||||||||
| 246,000,000 | 0.674 | (b) | 05/31/16 | 246,000,000 | ||||||||||
|
| |||||||||||||
| | TOTAL VARIABLE RATE OBLIGATIONS | | $ | 10,263,226,113 | ||||||||||
|
| |||||||||||||
| | TOTAL INVESTMENTS BEFORE REPURCHASE AGREEMENTS | | $ | 36,908,344,482 | ||||||||||
|
| |||||||||||||
| Repurchase Agreements(d) – 20.5% | ||||||||||||||
| BNP Paribas Securities Corp. |
| ||||||||||||
| $ | 285,000,000 | 0.520 | % | 03/01/16 | $ | 285,000,000 | ||||||||
| Maturity Value: $285,004,117 |
| ||||||||||||
| Collateralized by various corporate security issuers, 3.300% to | | ||||||||||||
| 190,000,000 | 0.700 | (c) | 03/07/16 | 190,000,000 | ||||||||||
| Maturity Value: $191,259,803 |
| ||||||||||||
| Settlement Date: 04/08/15 |
| ||||||||||||
| Collateralized by various asset-backed obligations, 0.686% to | | ||||||||||||
| 500,000,000 | 1.087 | (c)(e) | 05/16/16 | 500,000,000 | ||||||||||
| Maturity Value: $510,237,800 |
| ||||||||||||
| Settlement Date: 07/08/14 |
| ||||||||||||
| Collateralized by various asset-backed obligations, 0.000% to | | ||||||||||||
|
| |||||||||||||
| Repurchase Agreements(d) – (continued) | ||||||||||||||
| Citibank, N.A. |
| ||||||||||||
| $ | 500,000,000 | 0.320 | % | 03/02/16 | $ | 500,000,000 | ||||||||
| Maturity Value: $500,031,111 |
| ||||||||||||
| Settlement Date: 02/24/16 |
| ||||||||||||
| Collateralized by Federal Home Loan Mortgage Corp., 0.000% to | | ||||||||||||
|
| |||||||||||||
| Credit Suisse Securities (USA) LLC |
| ||||||||||||
| 370,000,000 | 0.630 | 03/03/16 | 370,000,000 | |||||||||||
| Maturity Value: $370,045,325 |
| ||||||||||||
| Settlement Date: 02/25/16 |
| ||||||||||||
| Collateralized by various asset-backed obligations, 0.000% to | | ||||||||||||
| 200,000,000 | 0.793 | (c)(e) | 06/03/16 | 200,000,000 | ||||||||||
| Maturity Value: $200,497,892 |
| ||||||||||||
| Settlement Date: 02/18/16 |
| ||||||||||||
| Collateralized by various asset-backed obligations, 0.000% to | | ||||||||||||
| 400,000,000 | 1.133 | (c)(e) | 06/03/16 | 400,000,000 | ||||||||||
| Maturity Value: $404,368,730 |
| ||||||||||||
| Settlement Date: 06/29/15 |
| ||||||||||||
| Collateralized by various asset-backed obligations, 0.000% to | | ||||||||||||
|
| |||||||||||||
| Federal Reserve Bank of New York |
| ||||||||||||
| 1,800,000,000 | 0.250 | 03/01/16 | 1,800,000,000 | |||||||||||
| Maturity Value: $1,800,012,500 |
| ||||||||||||
| Collateralized by U.S. Treasury Bond, 3.625%, due 08/15/43. The | | ||||||||||||
|
| |||||||||||||
| HSBC Bank PLC |
| ||||||||||||
| 1,250,000,000 | 0.430 | 03/01/16 | 1,250,000,000 | |||||||||||
| Maturity Value: $1,250,014,931 |
| ||||||||||||
| Collateralized by various equity securities, various Exchange- | | ||||||||||||
|
| |||||||||||||
| ING Financial Markets LLC |
| ||||||||||||
| 80,000,000 | 0.380 | 03/01/16 | 80,000,000 | |||||||||||
| Maturity Value: $80,000,844 |
| ||||||||||||
| Collateralized by various corporate security issuers, 1.300% to | | ||||||||||||
|
| |||||||||||||
| The accompanying notes are an integral part of these financial statements. | 21 |
FINANCIAL SQUARE MONEY MARKET FUND
Schedule of Investments (continued)
February 29, 2016 (Unaudited)
Principal Amount | Interest Rate | Maturity Date | Amortized Cost | |||||||||||
| Repurchase Agreements(d) – (continued) | ||||||||||||||
| Joint Repurchase Agreement Account I |
| ||||||||||||
| $ | 966,100,000 | 0.300 | % | 03/01/16 | $ | 966,100,000 | ||||||||
| Maturity Value: $966,108,051 |
| ||||||||||||
|
| |||||||||||||
| Joint Repurchase Agreement Account III |
| ||||||||||||
| 1,000,000,000 | 0.321 | 03/01/16 | 1,000,000,000 | |||||||||||
| Maturity Value: $1,000,008,903 |
| ||||||||||||
|
| |||||||||||||
| Merrill Lynch, Pierce, Fenner and Smith, Inc. |
| ||||||||||||
| 99,550,000 | 0.650 | 03/01/16 | 99,550,000 | |||||||||||
| Maturity Value: $99,551,797 |
| ||||||||||||
| Collateralized by a mortgage-backed obligation, 4.436%, due | | ||||||||||||
| 103,000,000 | 0.680 | 03/01/16 | 103,000,000 | |||||||||||
| Maturity Value: $103,001,946 |
| ||||||||||||
| Collateralized by various auction rate preferred securities, 0.000% | | ||||||||||||
|
| |||||||||||||
| RBC Capital Markets LLC |
| ||||||||||||
| 300,000,000 | 1.100 | (c)(e) | 04/07/16 | 300,000,000 | ||||||||||
| Maturity Value: $301,338,335 |
| ||||||||||||
| Settlement Date: 11/13/15 |
| ||||||||||||
| Collateralized by various corporate security issuers, 0.000% to | | ||||||||||||
|
| |||||||||||||
| Societe Generale |
| ||||||||||||
| 260,000,000 | 0.420 | 03/01/16 | 260,000,000 | |||||||||||
| Maturity Value: $260,003,033 |
| ||||||||||||
| Collateralized by various corporate security issuers, 1.400% to | | ||||||||||||
| 300,000,000 | 0.530 | 03/01/16 | 300,000,000 | |||||||||||
| Maturity Value: $300,004,417 |
| ||||||||||||
| Collateralized by various corporate security issuers, 1.036% to | | ||||||||||||
|
| |||||||||||||
| Wells Fargo Securities LLC |
| ||||||||||||
| 250,000,000 | 0.310 | 03/01/16 | 250,000,000 | |||||||||||
| Maturity Value: $250,002,153 |
| ||||||||||||
| Collateralized by U.S. Treasury Bonds, 2.500% to 6.875%, due | | ||||||||||||
| 200,000,000 | 0.380 | 03/01/16 | 200,000,000 | |||||||||||
| Maturity Value: $200,002,111 |
| ||||||||||||
| Collateralized by various corporate security issuers, 1.002% to | | ||||||||||||
|
| |||||||||||||
| Repurchase Agreements(d) – (continued) | ||||||||||||||
| Wells Fargo Securities LLC – (continued) |
| ||||||||||||
| $ | 100,000,000 | 0.530 | % | 03/01/16 | $ | 100,000,000 | ||||||||
| Maturity Value: $100,010,306 |
| ||||||||||||
| Settlement Date: 02/23/16 |
| ||||||||||||
| Collateralized by various corporate security issuers, 1.250% to | | ||||||||||||
| 300,000,000 | 1.010 | (e) | 05/03/16 | 300,000,000 | ||||||||||
| Maturity Value: $301,010,000 |
| ||||||||||||
| Settlement Date: 01/04/16 |
| ||||||||||||
| Collateralized by various corporate security issuers, 1.500% to | | ||||||||||||
|
| |||||||||||||
| TOTAL REPURCHASE AGREEMENTS | $ | 9,453,650,000 | ||||||||||||
|
| |||||||||||||
| TOTAL INVESTMENTS – 100.7% | $ | 46,361,994,482 | ||||||||||||
|
| |||||||||||||
|
| LIABILITIES IN EXCESS OF OTHER ASSETS – (0.7)% |
| (324,137,372 | ) | ||||||||||
|
| |||||||||||||
| NET ASSETS – 100.0% | $ | 46,037,857,110 | ||||||||||||
|
| |||||||||||||
| The percentage shown for each investment category reflects the value of investments in that category as a percentage of net assets. | ||
(a) | All or a portion represents a forward commitment. | |
(b) | Security not registered under the Securities Act of 1933, as amended. Such securities may be deemed liquid by the Investment Adviser. At February 29, 2016, these securities amounted to $3,059,732,422 or approximately 6.6% of net assets. | |
(c) | Variable or floating rate security. Interest rate disclosed is that which is in effect at February 29, 2016. | |
(d) | Unless noted, all repurchase agreements were entered into on February 29, 2016. Additional information on Joint Repurchase Agreement Accounts I and III appear on pages 50-51. | |
(e) | Security has been determined to be illiquid by the Investment Adviser. At February 29, 2016, these securities amounted to $1,700,000,000 or approximately 3.7% of net assets. | |
Interest rates represent either the stated coupon rate, annualized yield on date of purchase for discounted securities, or, for floating rate securities, the current reset rate, which is based upon current interest rate indices.
Maturity dates represent either the final legal maturity date on the security, the demand date for puttable securities, or the prerefunded date for those types of securities.
| ||
Investment Abbreviations: | ||
GO | —General Obligation | |
LIQ | —Liquidity Agreement | |
LOC | —Letter of Credit | |
LP | —Limited Partnership | |
RB | —Revenue Bond | |
RMKT | —Remarketed | |
SPA | —Stand-by Purchase Agreement | |
VRDN | —Variable Rate Demand Notes | |
| ||
| 22 | The accompanying notes are an integral part of these financial statements. |
FINANCIAL SQUARE PRIME OBLIGATIONS FUND
Schedule of Investments
February 29, 2016 (Unaudited)
Principal Amount | Interest Rate | Maturity Date | Amortized Cost | |||||||||||
| Commercial Paper and Corporate Obligations – 25.4% | ||||||||||||||
| Adventis Health System |
| ||||||||||||
| $ | 49,750,000 | 0.417 | % | 03/08/16 | $ | 49,746,034 | ||||||||
| Albion Capital LLC |
| ||||||||||||
| 44,750,000 | 0.510 | 03/21/16 | 44,737,569 | |||||||||||
| Ascension Health Alliance |
| ||||||||||||
| 25,109,000 | 0.459 | 04/05/16 | 25,098,015 | |||||||||||
| 20,000,000 | 0.458 | 04/07/16 | 19,990,750 | |||||||||||
| 20,000,000 | 0.560 | 05/03/16 | 19,980,750 | |||||||||||
| 24,000,000 | 0.560 | 05/05/16 | 23,976,166 | |||||||||||
| Bedford Row Funding Corp. |
| ||||||||||||
| 146,000,000 | 0.870 | 07/12/16 | 145,541,520 | |||||||||||
| 50,000,000 | 0.859 | 07/27/16 | 49,827,333 | |||||||||||
| 75,838,000 | 0.859 | 08/01/16 | 75,567,258 | |||||||||||
| 25,000,000 | 0.870 | 08/09/16 | 24,904,965 | |||||||||||
| 70,000,000 | 0.829 | 08/15/16 | 69,736,975 | |||||||||||
| BNZ International Funding Ltd. |
| ||||||||||||
| 20,000,000 | 0.849 | 08/16/16 | 19,922,533 | |||||||||||
| CAFCO LLC |
| ||||||||||||
| 55,000,000 | 0.521 | 03/01/16 | 55,000,000 | |||||||||||
| 50,000,000 | 0.818 | 08/10/16 | 49,820,000 | |||||||||||
| Chariot Funding LLC |
| ||||||||||||
| 148,250,000 | 0.531 | 05/03/16 | 148,115,093 | |||||||||||
| Charlotte-Mecklenburg Hospital Authority |
| ||||||||||||
| 30,000,000 | 0.408 | 03/22/16 | 29,993,000 | |||||||||||
| Charta LLC |
| ||||||||||||
| 25,000,000 | 0.521 | 03/02/16 | 24,999,646 | |||||||||||
| 35,000,000 | 0.746 | 06/27/16 | 34,916,253 | |||||||||||
| Ciesco LLC |
| ||||||||||||
| 50,000,000 | 0.469 | 03/29/16 | 49,982,111 | |||||||||||
| 50,000,000 | 0.459 | 04/04/16 | 49,978,750 | |||||||||||
| Commonwealth Bank of Australia |
| ||||||||||||
| 50,000,000 | 0.829 | 08/24/16 | 49,802,000 | |||||||||||
| CRC Funding LLC |
| ||||||||||||
| 25,000,000 | 0.818 | 08/01/16 | 24,915,000 | |||||||||||
| DNB Bank ASA |
| ||||||||||||
| 8,700,000 | 0.643 | 06/21/16 | 8,682,948 | |||||||||||
| 70,950,000 | 0.700 | 07/11/16 | 70,771,797 | |||||||||||
| Erste Abwicklungsanstalt |
| ||||||||||||
| 20,000,000 | 0.664 | 06/08/16 | 19,964,250 | |||||||||||
| Fairway Finance Co., LLC |
| ||||||||||||
| 25,000,000 | 0.479 | 04/04/16 | 24,988,903 | |||||||||||
| Gotham Funding Corp. |
| ||||||||||||
| 50,000,000 | 0.541 | 03/24/16 | 49,983,069 | |||||||||||
| 35,000,000 | 0.529 | 04/19/16 | 34,975,228 | |||||||||||
| 75,000,000 | 0.529 | 04/25/16 | 74,940,417 | |||||||||||
| JPMorgan Securities LLC |
| ||||||||||||
| 100,000,000 | 0.531 | 03/23/16 | 99,968,222 | |||||||||||
| Jupiter Securitization Co. LLC |
| ||||||||||||
| 100,000,000 | 0.531 | 05/05/16 | 99,906,111 | |||||||||||
| Kaiser Foundation Hospitals |
| ||||||||||||
| 30,017,000 | 0.459 | 03/01/16 | 30,017,000 | |||||||||||
| 65,092,000 | 0.520 | 03/21/16 | 65,073,573 | |||||||||||
| 20,000,000 | 0.539 | 04/26/16 | 19,983,511 | |||||||||||
| 20,082,000 | 0.612 | 05/02/16 | 20,061,249 | |||||||||||
| 20,000,000 | 0.582 | 05/17/16 | 19,975,617 | |||||||||||
| 25,123,000 | 0.612 | 05/25/16 | 25,087,409 | |||||||||||
| 25,121,000 | 0.684 | 06/08/16 | 25,074,715 | |||||||||||
|
| |||||||||||||
| Commercial Paper and Corporate Obligations – (continued) | ||||||||||||||
| Kaiser Foundation Hospitals – (continued) |
| ||||||||||||
| $ | 30,000,000 | 0.715 | % | 07/05/16 | $ | 29,926,500 | ||||||||
| 20,000,000 | 0.736 | 07/21/16 | 19,943,200 | |||||||||||
| 15,000,000 | 0.766 | 08/11/16 | 14,949,062 | |||||||||||
| Kells Funding LLC |
| ||||||||||||
| 200,000,000 | 0.346 | 03/04/16 | 199,994,334 | |||||||||||
| 60,000,000 | 0.612 | 05/12/16 | 59,928,000 | |||||||||||
| 50,000,000 | 0.623 | (a) | 06/09/16 | 49,916,125 | ||||||||||
| 35,000,000 | 0.623 | (a) | 06/10/16 | 34,941,880 | ||||||||||
| Liberty Street Funding LLC |
| ||||||||||||
| 100,000,000 | 0.592 | 03/07/16 | 99,990,334 | |||||||||||
| 100,000,000 | 0.612 | 03/14/16 | 99,978,333 | |||||||||||
| 50,000,000 | 0.664 | 03/16/16 | 49,986,458 | |||||||||||
| 150,000,000 | 0.469 | 04/18/16 | 149,908,000 | |||||||||||
| Nieuw Amsterdam Receivables Corp. |
| ||||||||||||
| 119,000,000 | 0.521 | 03/03/16 | 118,996,628 | |||||||||||
| Nordea Bank AB |
| ||||||||||||
| 8,700,000 | 0.623 | 06/17/16 | 8,684,079 | |||||||||||
| 150,000,000 | 0.834 | 08/12/16 | 149,443,083 | |||||||||||
| Old Line Funding Corp. |
| ||||||||||||
| 70,000,000 | 0.715 | 04/11/16 | 69,944,195 | |||||||||||
| 44,000,000 | 0.797 | 04/14/16 | 43,958,053 | |||||||||||
| 44,000,000 | 0.797 | 04/20/16 | 43,952,333 | |||||||||||
| 25,000,000 | 0.480 | 04/25/16 | 24,982,049 | |||||||||||
| Regency Markets No. 1 LLC |
| ||||||||||||
| 172,340,000 | 0.387 | 03/07/16 | 172,329,085 | |||||||||||
| 65,000,000 | 0.438 | 03/15/16 | 64,989,130 | |||||||||||
| 50,000,000 | 0.438 | 03/21/16 | 49,988,056 | |||||||||||
| Skandinaviska Enskilda Banken AB |
| ||||||||||||
| 50,000,000 | 0.725 | 06/28/16 | 49,882,653 | |||||||||||
| SSM Health Care Corp. |
| ||||||||||||
| 40,000,000 | 0.510 | 03/22/16 | 39,988,333 | |||||||||||
| 20,000,000 | 0.510 | 04/13/16 | 19,988,056 | |||||||||||
| 20,000,000 | 0.582 | 05/17/16 | 19,975,617 | |||||||||||
| 20,000,000 | 0.580 | 05/25/16 | 19,973,083 | |||||||||||
| Standard Chartered Bank |
| ||||||||||||
| 85,000,000 | 0.828 | 06/30/16 | 84,768,588 | |||||||||||
| Svenska Handelsbanken AB |
| ||||||||||||
| 40,000,000 | 0.818 | 08/09/16 | 39,856,889 | |||||||||||
| Thunder Bay Funding, Inc. |
| ||||||||||||
| 62,017,000 | 0.469 | 04/01/16 | 61,992,434 | |||||||||||
| 55,000,000 | 0.469 | 04/25/16 | 54,961,347 | |||||||||||
| 51,000,000 | 0.684 | 06/20/16 | 50,894,643 | |||||||||||
| University of California |
| ||||||||||||
| 13,000,000 | 0.418 | 03/02/16 | 12,999,852 | |||||||||||
| 18,100,000 | 0.561 | 03/14/16 | 18,096,405 | |||||||||||
| Victory Receivables Corp. |
| ||||||||||||
| 60,009,000 | 0.479 | 03/22/16 | 59,992,548 | |||||||||||
| 75,000,000 | 0.541 | 03/28/16 | 74,970,188 | |||||||||||
| 40,000,000 | 0.541 | 04/01/16 | 39,981,744 | |||||||||||
| 52,246,000 | 0.550 | 04/25/16 | 52,202,897 | |||||||||||
| Westpac Banking Corp. |
| ||||||||||||
| 50,000,000 | 0.829 | 08/23/16 | 49,803,125 | |||||||||||
|
| |||||||||||||
| | TOTAL COMMERCIAL PAPER AND CORPORATE OBLIGATIONS | | $ | 4,083,063,059 | ||||||||||
|
| |||||||||||||
| The accompanying notes are an integral part of these financial statements. | 23 |
FINANCIAL SQUARE PRIME OBLIGATIONS FUND
Schedule of Investments (continued)
February 29, 2016 (Unaudited)
Principal Amount | Interest Rate | Maturity Date | Amortized Cost | |||||||||||
| Certificate of Deposit – 0.3% | ||||||||||||||
| Wells Fargo Bank N.A. |
| ||||||||||||
| $ | 50,000,000 | 0.840 | % | 08/18/16 | $ | 50,000,000 | ||||||||
|
| |||||||||||||
| Certificates of Deposit-Yankeedollar – 21.8% | ||||||||||||||
| Banco Del Estado De Chile |
| ||||||||||||
| $ | 50,000,000 | 0.800 | % | 08/01/16 | $ | 50,000,000 | ||||||||
| Cooperatieve Rabobank UA |
| ||||||||||||
| 250,000,000 | 0.850 | 07/14/16 | 250,000,000 | |||||||||||
| Credit Industriel et Commercial |
| ||||||||||||
| 200,000,000 | 0.700 | 05/06/16 | 200,000,000 | |||||||||||
| 60,000,000 | 0.710 | 05/09/16 | 60,000,000 | |||||||||||
| Credit Suisse AG |
| ||||||||||||
| 200,000,000 | 0.830 | 06/13/16 | 200,000,000 | |||||||||||
| DZ Bank AG |
| ||||||||||||
| 80,000,000 | 0.710 | 06/30/16 | 80,000,000 | |||||||||||
| 100,000,000 | 0.750 | 07/18/16 | 100,000,000 | |||||||||||
| 50,000,000 | 0.750 | 07/29/16 | 50,000,000 | |||||||||||
| HSBC Bank PLC |
| ||||||||||||
| 20,000,000 | 0.660 | 06/09/16 | 20,000,000 | |||||||||||
| Mitsubishi UFJ Trust & Banking Corp. |
| ||||||||||||
| 100,000,000 | 0.700 | 06/21/16 | 100,000,000 | |||||||||||
| 101,750,000 | 0.870 | 07/14/16 | 101,784,091 | |||||||||||
| 50,000,000 | 0.750 | 07/15/16 | 50,000,000 | |||||||||||
| 30,000,000 | 0.850 | 07/19/16 | 30,008,060 | |||||||||||
| Mizuho Bank Ltd. |
| ||||||||||||
| 50,000,000 | 0.680 | 06/02/16 | 50,000,000 | |||||||||||
| 50,000,000 | 0.700 | 06/15/16 | 50,000,000 | |||||||||||
| 100,000,000 | 0.700 | 06/22/16 | 100,000,000 | |||||||||||
| 50,000,000 | 0.760 | 07/05/16 | 50,000,000 | |||||||||||
| 100,000,000 | 0.830 | 08/03/16 | 100,000,000 | |||||||||||
| National Bank of Kuwait |
| ||||||||||||
| 200,000,000 | 0.800 | 05/16/16 | 200,000,000 | |||||||||||
| 50,000,000 | 0.800 | 05/23/16 | 50,000,000 | |||||||||||
| 25,000,000 | 0.800 | 06/03/16 | 25,000,000 | |||||||||||
| 35,000,000 | 0.800 | 06/08/16 | 35,000,000 | |||||||||||
| Norinchukin Bank (The) |
| ||||||||||||
| 75,000,000 | 0.680 | 06/01/16 | 75,000,000 | |||||||||||
| 100,000,000 | 0.700 | 06/22/16 | 100,000,000 | |||||||||||
| 75,000,000 | 0.770 | 07/01/16 | 75,000,000 | |||||||||||
| Standard Chartered Bank |
| ||||||||||||
| 140,000,000 | 0.800 | 06/06/16 | 140,000,000 | |||||||||||
| 40,000,000 | 0.910 | 07/29/16 | 40,000,000 | |||||||||||
| State Street Bank & Trust Co. |
| ||||||||||||
| 150,000,000 | 0.830 | 08/25/16 | 150,000,000 | |||||||||||
| Sumitomo Mitsui Banking Corp. |
| ||||||||||||
| 300,000,000 | 0.700 | 04/19/16 | 300,000,000 | |||||||||||
| 40,000,000 | 0.850 | 06/09/16 | 40,012,089 | |||||||||||
| 25,000,000 | 0.870 | 07/14/16 | 25,008,336 | |||||||||||
| 23,000,000 | 0.850 | 07/26/16 | 23,006,499 | |||||||||||
| 40,000,000 | 0.760 | 08/01/16 | 40,000,000 | |||||||||||
| 25,000,000 | 0.850 | 08/01/16 | 25,007,364 | |||||||||||
| Sumitomo Mitsui Trust Bank Ltd. |
| ||||||||||||
| 75,000,000 | 0.700 | 06/13/16 | 75,000,000 | |||||||||||
| Svenska Handelsbanken AB |
| ||||||||||||
| 100,000,000 | 0.820 | 07/29/16 | 100,000,000 | |||||||||||
|
| |||||||||||||
| Certificates of Deposit-Yankeedollar – (continued) | ||||||||||||||
| Toronto-Dominion Bank (The) |
| ||||||||||||
| $ | 250,000,000 | 0.850 | % | 07/07/16 | $ | 250,000,000 | ||||||||
| UBS AG |
| ||||||||||||
| 50,000,000 | 0.670 | 06/03/16 | 50,000,000 | |||||||||||
| 50,000,000 | 0.850 | 08/03/16 | 50,000,000 | |||||||||||
|
| |||||||||||||
| | TOTAL CERTIFICATES OF DEPOSIT-YANKEEDOLLAR | | $ | 3,509,826,439 | ||||||||||
|
| |||||||||||||
| Fixed Rate Municipal Debt Obligations – 2.6% | ||||||||||||||
| Banner Health |
| ||||||||||||
| $ | 15,000,000 | 0.370 | % | 03/09/16 | $ | 15,000,000 | ||||||||
| 15,000,000 | 0.420 | 03/16/16 | 15,000,000 | |||||||||||
| 12,500,000 | 0.420 | 03/23/16 | 12,500,000 | |||||||||||
| 25,000,000 | 0.420 | 03/30/16 | 25,000,000 | |||||||||||
| City & County of San Francisco, California |
| ||||||||||||
| 30,000,000 | 0.490 | 03/30/16 | 30,000,000 | |||||||||||
| 27,500,000 | 0.500 | 03/30/16 | 27,500,000 | |||||||||||
| Commonwealth Bank of Australia |
| ||||||||||||
| 10,000,000 | 3.250 | (b) | 03/17/16 | 10,012,880 | ||||||||||
| District of Columbia Water & Sewer Authority |
| ||||||||||||
| 29,200,000 | 0.570 | 03/10/16 | 29,200,000 | |||||||||||
| Emory University |
| ||||||||||||
| 8,690,000 | 0.530 | 05/10/16 | 8,690,000 | |||||||||||
| GE Capital International Funding Co. |
| ||||||||||||
| 22,451,000 | 0.964 | (b) | 04/15/16 | 22,460,418 | ||||||||||
| National Australia Bank Ltd. |
| ||||||||||||
| 17,000,000 | 1.300 | 07/25/16 | 17,025,200 | |||||||||||
| Nordea Bank AB |
| ||||||||||||
| 22,874,000 | 0.875 | (a)(b) | 05/13/16 | 22,884,719 | ||||||||||
| Providence Health & Services Obligated Group |
| ||||||||||||
| 12,000,000 | 0.420 | 03/09/16 | 12,000,000 | |||||||||||
| Rutgers The State University of New Jersey |
| ||||||||||||
| 33,030,000 | 0.420 | 03/21/16 | 33,030,000 | |||||||||||
| South Carolina State Public Service Authority |
| ||||||||||||
| 25,675,000 | 0.420 | 03/03/16 | 25,675,000 | |||||||||||
| 30,000,000 | 0.500 | 03/22/16 | 30,000,000 | |||||||||||
| 22,300,000 | 0.430 | 04/04/16 | 22,300,000 | |||||||||||
| 35,000,000 | 0.570 | 05/04/16 | 35,000,000 | |||||||||||
| 20,000,000 | 0.570 | 05/05/16 | 20,000,000 | |||||||||||
|
| |||||||||||||
| | TOTAL FIXED RATE MUNICIPAL DEBT OBLIGATIONS | | $ | 413,278,217 | ||||||||||
|
| |||||||||||||
| Time Deposits – 14.9% | ||||||||||||||
| BNY Mellon, National Association |
| ||||||||||||
| $ | 500,000,000 | 0.270 | % | 03/01/16 | $ | 500,000,000 | ||||||||
| Credit Agricole Corporate and Investment Bank |
| ||||||||||||
| 500,000,000 | 0.310 | 03/01/16 | 500,000,000 | |||||||||||
| DNB Bank ASA |
| ||||||||||||
| 300,000,000 | 0.370 | 03/02/16 | 300,000,000 | |||||||||||
| National Bank of Kuwait |
| ||||||||||||
| 200,000,000 | 0.320 | 03/01/16 | 200,000,000 | |||||||||||
| Natixis |
| ||||||||||||
| 500,000,000 | 0.310 | 03/01/16 | 500,000,000 | |||||||||||
|
| |||||||||||||
| 24 | The accompanying notes are an integral part of these financial statements. |
FINANCIAL SQUARE PRIME OBLIGATIONS FUND
Principal Amount | Interest Rate | Maturity Date | Amortized Cost | |||||||||||
| Time Deposits – (continued) | ||||||||||||||
| Skandinaviska Enskilda Banken AB |
| ||||||||||||
| $ | 400,000,000 | 0.290 | % | 03/01/16 | $ | 400,000,000 | ||||||||
|
| |||||||||||||
| TOTAL TIME DEPOSITS | $ | 2,400,000,000 | ||||||||||||
|
| |||||||||||||
| U.S. Government Agency Obligations – 4.0% | ||||||||||||||
| Federal Home Loan Bank |
| ||||||||||||
| $ | 150,000,000 | 0.300 | % | 03/07/16 | $ | 149,999,682 | ||||||||
| Overseas Private Investment Corp. (USA) |
| ||||||||||||
| 131,249,678 | 0.400 | (c) | 03/07/16 | 131,249,678 | ||||||||||
| 365,752,459 | 0.420 | (c) | 03/07/16 | 365,752,459 | ||||||||||
|
| |||||||||||||
| | TOTAL U.S. GOVERNMENT AGENCY OBLIGATIONS | | $ | 647,001,819 | ||||||||||
|
| |||||||||||||
| U.S. Treasury Obligations – 1.2% | ||||||||||||||
| United States Treasury Notes |
| ||||||||||||
| $ | 95,000,000 | 1.500 | % | 06/30/16 | $ | 95,327,987 | ||||||||
| 94,500,000 | 3.250 | 06/30/16 | 95,321,853 | |||||||||||
|
| |||||||||||||
| | TOTAL U.S. TREASURY OBLIGATIONS | | $ | 190,649,840 | ||||||||||
|
| |||||||||||||
| Variable Rate Municipal Debt Obligations(c) – 1.4% | ||||||||||||||
| BlackRock Municipal Income Trust VRDN RB Putters Series 2012-T0008 | | ||||||||||||
| $ | 35,500,000 | 0.370 | % | 03/01/16 | $ | 35,500,000 | ||||||||
| BlackRock MuniVest Fund, Inc. VRDN RB Putters Series 2012-T0007 | | ||||||||||||
| 30,000,000 | 0.370 | 03/01/16 | 30,000,000 | |||||||||||
| City of Omaha, Nebraska Parking Facilities Corp. VRDN RB Putters | | ||||||||||||
| 19,455,000 | 0.400 | 03/01/16 | 19,455,000 | |||||||||||
| City of Portland, Maine GO VRDN for Taxable Pension Boards Series 2001 RMKT | | ||||||||||||
| 20,000,000 | 0.420 | 03/07/16 | 20,000,000 | |||||||||||
| Providence Health & Services Obligated Group VRDN RB (U.S. Bank N.A., SBPA) |
| ||||||||||||
| 46,100,000 | 0.450 | 03/07/16 | 46,100,000 | |||||||||||
| Triborough Bridge & Tunnel Authority VRDN Refunding Floating RB | | ||||||||||||
| 25,510,000 | 0.400 | 03/07/16 | 25,510,000 | |||||||||||
| Triborough Bridge & Tunnel Authority VRDN Refunding Floating RB | | ||||||||||||
| 24,250,000 | 0.400 | 03/07/16 | 24,250,000 | |||||||||||
| World Wildlife Fund, Inc. VRDN RB Series 2015 (JPMorgan Chase Bank, N.A., | | ||||||||||||
| 11,560,000 | 0.400 | 03/07/16 | 11,560,000 | |||||||||||
|
| |||||||||||||
| | TOTAL VARIABLE RATE MUNICIPAL DEBT OBLIGATIONS | | $ | 212,375,000 | ||||||||||
|
| |||||||||||||
| Variable Rate Obligations(c) – 12.1% | ||||||||||||||
| Banco Del Estado De Chile |
| ||||||||||||
| $ | 10,000,000 | 0.776 | % | 08/12/16 | $ | 10,000,000 | ||||||||
| Bank of Montreal |
| ||||||||||||
| 2,175,000 | 1.142 | 07/15/16 | 2,178,006 | |||||||||||
| Bank of Nova Scotia (The) |
| ||||||||||||
| 13,100,000 | 1.142 | 07/15/16 | 13,119,501 | |||||||||||
| BNZ International Funding Ltd. |
| ||||||||||||
| 125,000,000 | 0.792 | (b) | 07/21/16 | 125,000,000 | ||||||||||
| Canadian Imperial Bank of Commerce |
| ||||||||||||
| 8,500,000 | 1.140 | 07/18/16 | 8,512,447 | |||||||||||
| Credit Suisse AG |
| ||||||||||||
| 76,000,000 | 0.792 | 03/11/16 | 76,005,303 | |||||||||||
| 50,000,000 | 0.856 | 08/02/16 | 50,000,000 | |||||||||||
| Fairway Finance Co., LLC |
| ||||||||||||
| 100,000,000 | 0.597 | (b) | 03/03/16 | 100,000,000 | ||||||||||
| 40,000,000 | 0.727 | (b) | 05/16/16 | 40,000,000 | ||||||||||
| 35,000,000 | 0.766 | (b) | 08/01/16 | 35,000,000 | ||||||||||
| General Electric Co. |
| ||||||||||||
| 15,000,000 | 1.271 | (a) | 07/12/16 | 15,035,040 | ||||||||||
| HSBC Bank PLC |
| ||||||||||||
| 100,000,000 | 0.807 | (b) | 08/12/16 | 100,000,000 | ||||||||||
| JPMorgan Chase Bank N.A. |
| ||||||||||||
| 275,000,000 | 0.612 | 04/07/16 | 275,000,000 | |||||||||||
| National Australia Bank Ltd. |
| ||||||||||||
| 22,440,000 | 1.169 | 07/25/16 | 22,476,790 | |||||||||||
| Nordea Bank AB |
| ||||||||||||
| 2,075,000 | 1.078 | (b) | 05/13/16 | 2,076,534 | ||||||||||
| Old Line Funding Corp. |
| ||||||||||||
| 100,000,000 | 0.609 | (b) | 05/05/16 | 100,000,000 | ||||||||||
| 40,000,000 | 0.676 | (b) | 06/01/16 | 40,000,000 | ||||||||||
| State Street Bank & Trust Co. |
| ||||||||||||
| 300,000,000 | 0.631 | 03/14/16 | 300,000,000 | |||||||||||
| Sumitomo Mitsui Trust Bank Ltd. |
| ||||||||||||
| 140,000,000 | 0.828 | 07/05/16 | 140,000,000 | |||||||||||
| 75,000,000 | 0.829 | 07/29/16 | 75,000,000 | |||||||||||
| Svenska Handelsbanken AB |
| ||||||||||||
| 100,000,000 | 0.758 | 07/27/16 | 100,000,000 | |||||||||||
| Wells Fargo Bank N.A. |
| ||||||||||||
| 125,000,000 | 0.740 | 05/19/16 | 125,000,000 | |||||||||||
| 205,000,000 | 0.766 | 05/20/16 | 205,000,000 | |||||||||||
| 2,950,000 | 0.566 | 06/02/16 | 2,949,783 | |||||||||||
|
| |||||||||||||
| | TOTAL VARIABLE RATE OBLIGATIONS | | $ | 1,962,353,404 | ||||||||||
|
| |||||||||||||
| | TOTAL INVESTMENTS BEFORE REPURCHASE AGREEMENTS | | $ | 13,468,547,778 | ||||||||||
|
| |||||||||||||
| The accompanying notes are an integral part of these financial statements. | 25 |
FINANCIAL SQUARE PRIME OBLIGATIONS FUND
Schedule of Investments (continued)
February 29, 2016 (Unaudited)
Principal Amount | Interest Rate | Maturity Date | Amortized Cost | |||||||||||
| Repurchase Agreements(d) – 16.8% | ||||||||||||||
| Citibank, N.A. |
| ||||||||||||
| $ | 100,000,000 | 0.320 | % | 03/02/16 | $ | 100,000,000 | ||||||||
| Maturity Value: $100,006,222 |
| ||||||||||||
| Settlement Date: 02/24/16 |
| ||||||||||||
| Collateralized by Federal Home Loan Mortgage Corp., 1.750%, | | ||||||||||||
|
| |||||||||||||
| Credit Suisse Securities (USA) LLC |
| ||||||||||||
| 130,000,000 | 0.630 | 03/03/16 | 130,000,000 | |||||||||||
| Maturity Value: $130,015,925 |
| ||||||||||||
| Settlement Date: 02/25/16 |
| ||||||||||||
| Collateralized by various asset-backed obligations, 3.000% to | | ||||||||||||
| 200,000,000 | 0.793 | (c)(e) | 06/03/16 | 200,000,000 | ||||||||||
| Maturity Value: $200,497,892 |
| ||||||||||||
| Settlement Date: 02/18/16 |
| ||||||||||||
| Collateralized by various asset-backed obligations, 0.000% to | | ||||||||||||
|
| |||||||||||||
| Joint Repurchase Agreement Account I |
| ||||||||||||
| 510,100,000 | 0.300 | 03/01/16 | 510,100,000 | |||||||||||
| Maturity Value: $510,104,251 |
| ||||||||||||
|
| |||||||||||||
| Joint Repurchase Agreement Account III |
| ||||||||||||
| 750,000,000 | 0.321 | 03/01/16 | 750,000,000 | |||||||||||
| Maturity Value: $750,006,678 |
| ||||||||||||
|
| |||||||||||||
| Merrill Lynch, Pierce, Fenner & Smith, Inc. |
| ||||||||||||
| 100,000,000 | 0.650 | 03/01/16 | 100,000,000 | |||||||||||
| Maturity Value: $100,001,806 |
| ||||||||||||
| Collateralized by various mortgage-backed obligations, 4.436% to | | ||||||||||||
| 100,000,000 | 0.680 | 03/01/16 | 100,000,000 | |||||||||||
| Maturity Value: $100,001,889 |
| ||||||||||||
| Collateralized by various auction rate preferred securities, 0.000% | | ||||||||||||
| 230,000,000 | 0.730 | (c)(e) | 04/04/16 | 230,000,000 | ||||||||||
| Maturity Value: $232,984,892 |
| ||||||||||||
| Settlement Date: 07/11/14 |
| ||||||||||||
| Collateralized by an various auction rate preferred security, | | ||||||||||||
|
| |||||||||||||
| Repurchase Agreements(d) – (continued) | ||||||||||||||
| Mitsubishi UFJ Securities (USA), Inc. |
| ||||||||||||
| $ | 200,000,000 | 0.320 | % | 03/01/16 | $ | 200,000,000 | ||||||||
| Maturity Value: $200,001,778 |
| ||||||||||||
| Collateralized by Federal Home Loan Mortgage Corp., 2.500% to | | ||||||||||||
|
| |||||||||||||
| TD Securities (USA) LLC |
| ||||||||||||
| 100,000,000 | 0.320 | 03/02/16 | 100,000,000 | |||||||||||
| Maturity Value: $100,006,222 |
| ||||||||||||
| Settlement Date: 02/24/16 |
| ||||||||||||
| Collateralized by Federal Home Loan Mortgage Corp., 3.000%, | | ||||||||||||
|
| |||||||||||||
| Wells Fargo Bank, N.A. |
| ||||||||||||
| 150,000,000 | 0.330 | 03/01/16 | 150,000,000 | |||||||||||
| Maturity Value: $150,001,375 |
| ||||||||||||
| Collateralized by Federal Home Loan Mortgage Corp., 3.500%, | | ||||||||||||
|
| |||||||||||||
| Wells Fargo Securities LLC |
| ||||||||||||
| 125,000,000 | 1.010 | (e) | 05/03/16 | 125,000,000 | ||||||||||
| Maturity Value: $125,420,833 |
| ||||||||||||
| Settlement Date: 01/04/16 |
| ||||||||||||
| Collateralized by various corporate security issuers, 0.000% to | | ||||||||||||
|
| |||||||||||||
| TOTAL REPURCHASE AGREEMENTS | $ | 2,695,100,000 | ||||||||||||
|
| |||||||||||||
| TOTAL INVESTMENTS – 100.5% | $ | 16,163,647,778 | ||||||||||||
|
| |||||||||||||
|
| LIABILITIES IN EXCESS OF OTHER ASSETS – (0.5)% |
| (78,190,246 | ) | ||||||||||
|
| |||||||||||||
| NET ASSETS – 100.0% | $ | 16,085,457,532 | ||||||||||||
|
| |||||||||||||
| The percentage shown for each investment category reflects the value of investments in that category as a percentage of net assets. | ||
(a) | All or a portion represents a forward commitment. | |
(b) | Security not registered under the Securities Act of 1933, as amended. Such securities may be deemed liquid by the Investment Adviser. At February 29, 2016, these securities amounted to $652,389,551 or approximately 4.1% of net assets. | |
(c) | Variable or floating rate security. Interest rate disclosed is that which is in effect at February 29, 2016. | |
(d) | Unless noted, all repurchase agreements were entered into on February 29, 2016. Additional information on Joint Repurchase Agreement Accounts I and III appear on pages 50-51. | |
| 26 | The accompanying notes are an integral part of these financial statements. |
FINANCIAL SQUARE PRIME OBLIGATIONS FUND
(e) | Security has been determined to be illiquid by the Investment Adviser. At February 29, 2016, these securities amounted to $555,000,000 or approximately 3.5% of net assets. | |
| Interest rates represent either the stated coupon rate, annualized yield on date of purchase for discounted securities, or, for floating rate securities, the current reset rate, which is based upon current interest rate indices. | ||
| Maturity dates represent either the final legal maturity date on the security, the demand date for puttable securities, or the prerefunded date for those types of securities. | ||
| ||
Investment Abbreviations: | ||
GO | —General Obligation | |
LIQ | —Liquidity Agreement | |
LOC | —Letter of Credit | |
RB | —Revenue Bond | |
RMKT | —Remarketed | |
SBPA | —Standby Bond Purchase Agreement | |
SPA | —Stand-by Purchase Agreement | |
VRDN | —Variable Rate Demand Notes | |
| ||
| The accompanying notes are an integral part of these financial statements. | 27 |
FINANCIAL SQUARE TAX-EXEMPT CALIFORNIA FUND
Schedule of Investments
February 29, 2016 (Unaudited)
Principal Amount | Interest Rate | Maturity Date | Amortized Cost | |||||||||||
| Municipal Debt Obligations – 98.5% | ||||||||||||||
| California – 98.5% | ||||||||||||||
| ABAG Finance Authority for Non-Profit Corporation VRDN RB for Sharp | | ||||||||||||
| $ | 1,000,000 | 0.010 | % | 03/07/16 | $ | 1,000,000 | ||||||||
| ABAG Finance Authority for Non-Profit Corporations VRDN RB Refunding for | | ||||||||||||
| 450,000 | 0.010 | 03/07/16 | 450,000 | |||||||||||
| Bay Area Toll Authority California Toll Bridge VRDN RB Refunding for San | | ||||||||||||
| 6,100,000 | 0.200 | 03/07/16 | 6,100,000 | |||||||||||
| California Educational Facilities Authority VRDN RB Austin Trust Certificates for | | ||||||||||||
| 2,000,000 | 0.250 | 03/07/16 | 2,000,000 | |||||||||||
| California Educational Facilities Authority VRDN RB for University of Southern | | ||||||||||||
| 1,976,640 | 0.020 | 03/07/16 | 1,976,640 | |||||||||||
| California Educational Facilities Authority VRDN RB for University of Southern | | ||||||||||||
| 2,690,000 | 0.020 | 03/07/16 | 2,690,000 | |||||||||||
| California Educational Facilities Authority VRDN RB Refunding for California | | ||||||||||||
| 2,000,000 | 0.010 | 03/07/16 | 2,000,000 | |||||||||||
| California Educational Facilities Authority VRDN RB Refunding for Stanford | | ||||||||||||
| 2,300,000 | 0.010 | 03/07/16 | 2,300,000 | |||||||||||
| California Educational Facilities Authority VRDN RB Refunding for Stanford | | ||||||||||||
| 3,393,000 | 0.010 | 03/07/16 | 3,393,000 | |||||||||||
| California Educational Facilities Authority VRDN RB Refunding for University of | | ||||||||||||
| 2,300,000 | 0.020 | 03/07/16 | 2,300,000 | |||||||||||
| California Health Facilities Financing Authority CP for Kaiser Permanente | | ||||||||||||
| 1,000,000 | 0.260 | 03/01/16 | 1,000,000 | |||||||||||
| California Health Facilities Financing Authority VRDN RB for Adventist Health | | ||||||||||||
| 1,620,000 | 0.180 | 03/07/16 | 1,620,000 | |||||||||||
| California Health Facilities Financing Authority VRDN RB for City of Hope | | ||||||||||||
| 8,430,000 | 0.010 | 03/07/16 | 8,430,000 | |||||||||||
| California Health Facilities Financing Authority VRDN RB for Lucile Packard | | ||||||||||||
| 2,000,000 | 0.010 | 03/07/16 | 2,000,000 | |||||||||||
| California Health Facilities Financing Authority VRDN RB for Lucile Packard | | ||||||||||||
| 2,580,000 | 0.040 | 03/07/16 | 2,580,000 | |||||||||||
| California Health Facilities Financing Authority VRDN RB for Providence Health | | ||||||||||||
| 2,440,000 | 0.020 | 03/07/16 | 2,440,000 | |||||||||||
| California Health Facilities Financing Authority VRDN RB for Sutter Health | | ||||||||||||
| 2,935,000 | 0.020 | 03/07/16 | 2,935,000 | |||||||||||
|
| |||||||||||||
| Municipal Debt Obligations – (continued) | ||||||||||||||
| California – (continued) | ||||||||||||||
| California Health Facilities Financing Authority VRDN RB for Sutter Health ROCS | | ||||||||||||
| $ | 1,600,000 | 0.020 | % | 03/07/16 | $ | 1,600,000 | ||||||||
| California Health Facilities Financing Authority VRDN RB Refunding for Dignity | | ||||||||||||
| 1,900,000 | 0.100 | 03/07/16 | 1,900,000 | |||||||||||
| California Health Facilities Financing Authority VRDN RB Refunding for Scripps | | ||||||||||||
| 300,000 | 0.010 | 03/07/16 | 299,986 | |||||||||||
| California Municipal Finance Authority VRDN RB for Chevron USA, Inc. Recovery | | ||||||||||||
| 4,300,000 | 0.010 | 03/01/16 | 4,300,000 | |||||||||||
| California State University VRDN RB Floater Trust Series 2008-K37W Reg D | | ||||||||||||
| 5,475,000 | 0.160 | 03/07/16 | 5,475,000 | |||||||||||
| California State University VRDN RB ROCS RR-II R-11568 Series 2008 (BHAC-CR | | ||||||||||||
| 3,000,000 | 0.020 | 03/07/16 | 3,000,000 | |||||||||||
| California Statewide Communities Development Authority VRDN RB for Kaiser | | ||||||||||||
| 200,000 | 0.010 | 03/07/16 | 200,000 | |||||||||||
| California Statewide Communities Development Authority VRDN RB Refunding | | ||||||||||||
| 600,000 | 0.020 | 03/07/16 | 600,000 | |||||||||||
| California Statewide Communities Development Authority VRDN RB Refunding | | ||||||||||||
| 5,000,000 | 0.010 | 03/07/16 | 5,000,000 | |||||||||||
| Central Basin Municipal Water District VRDN COPS Refunding for 2007 Project | | ||||||||||||
| 5,600,000 | 0.010 | 03/07/16 | 5,600,000 | |||||||||||
| City of Santa Clara Electric VRDN RB Refunding Series 2008 Subseries B (Bank | | ||||||||||||
| 3,855,000 | 0.010 | 03/07/16 | 3,855,000 | |||||||||||
| East Bay Municipal Utility District VRDN RB Water System Eagle Series 2013- | | ||||||||||||
| 1,900,000 | 0.020 | 03/07/16 | 1,900,000 | |||||||||||
| East Bay Municipal Utility District VRDN RB Water System Refunding | | ||||||||||||
| 3,800,000 | 0.010 | 03/07/16 | 3,800,000 | |||||||||||
| Eastern Municipal Water District VRDN RB Refunding for Wastewater System | | ||||||||||||
| 1,645,000 | 0.010 | 03/07/16 | 1,645,000 | |||||||||||
| Eastern Municipal Water District VRDN RB Refunding for Wastewater System | | ||||||||||||
| 3,000,000 | 0.010 | 03/01/16 | 3,000,000 | |||||||||||
| Irvine Ranch Water District GO VRDN Special Assessment District Nos.140-240- | | ||||||||||||
| 4,800,000 | 0.010 | 03/01/16 | 4,800,000 | |||||||||||
| Los Angeles Community College District GO VRDN Series 2011 O-4 Floaters | | ||||||||||||
| 2,100,000 | 0.010 | 03/07/16 | 2,100,000 | |||||||||||
| Los Angeles Community Redevelopment Agency MF Hsg VRDN RB for | | ||||||||||||
| 7,800,000 | 0.010 | 03/07/16 | 7,800,000 | |||||||||||
|
| |||||||||||||
| 28 | The accompanying notes are an integral part of these financial statements. |
FINANCIAL SQUARE TAX-EXEMPT CALIFORNIA FUND
Principal Amount | Interest Rate | Maturity Date | Amortized Cost | |||||||||||
| Municipal Debt Obligations – (continued) | ||||||||||||||
| California – (continued) | ||||||||||||||
| Los Angeles County Housing Authority MF Hsg VRDN RB Refunding for Malibu | | ||||||||||||
| $ | 1,200,000 | 0.010 | % | 03/07/16 | $ | 1,200,000 | ||||||||
| Los Angeles County Housing Authority MF Hsg VRDN RB Refunding for Malibu | | ||||||||||||
| 1,836,000 | 0.010 | 03/07/16 | 1,836,000 | |||||||||||
| Los Angeles Department of Airports VRDN RB for Los Angeles International | | ||||||||||||
| 3,800,000 | 0.020 | 03/07/16 | 3,800,000 | |||||||||||
| Los Angeles Department of Airports VRDN RB Refunding for Los Angeles | | ||||||||||||
| 1,545,000 | 0.020 | 03/07/16 | 1,545,000 | |||||||||||
| Los Angeles Department of Airports VRDN RB Refunding for Los Angeles | | ||||||||||||
| 3,500,000 | 0.020 | 03/07/16 | 3,500,000 | |||||||||||
| Los Angeles Department of Water & Power VRDN RB Refunding for Power | | ||||||||||||
| 250,000 | 0.010 | 03/07/16 | 250,000 | |||||||||||
| Los Angeles Department of Water & Power VRDN RB Refunding for Power | | ||||||||||||
| 1,000,000 | 0.010 | 03/01/16 | 1,000,000 | |||||||||||
| Los Angeles Department of Water & Power VRDN RB Refunding for Power | | ||||||||||||
| 4,500,000 | 0.010 | 03/01/16 | 4,500,000 | |||||||||||
| Los Angeles Department of Water & Power VRDN RB Refunding Series 2001 | | ||||||||||||
| 3,000,000 | 0.010 | 03/07/16 | 3,000,000 | |||||||||||
| Los Angeles Department of Water & Power Waterworks VRDN RB Floaters | | ||||||||||||
| 1,140,000 | 0.010 | 03/07/16 | 1,140,000 | |||||||||||
| Los Angeles Department of Water & Power Waterworks VRDN RB Refunding | | ||||||||||||
| 2,800,000 | 0.010 | 03/07/16 | 2,800,000 | |||||||||||
| Metropolitan Water District of Southern California VRDN RB Refunding Floater | | ||||||||||||
| 2,500,000 | 0.020 | 03/07/16 | 2,500,000 | |||||||||||
| Metropolitan Water District of Southern California VRDN RB Refunding | | ||||||||||||
| 5,900,000 | 0.010 | 03/07/16 | 5,900,000 | |||||||||||
| Orange County Apartment Development VRDN RB Refunding for Park Ridge | | ||||||||||||
| 1,400,000 | 0.010 | 03/07/16 | 1,400,000 | |||||||||||
| Riverside County Transportation Commission Sales Tax VRDN RB Putters | | ||||||||||||
| 1,875,000 | 0.020 | 03/07/16 | 1,875,000 | |||||||||||
| Sacramento County Housing Authority VRDN RB Refunding for River Terrace | | ||||||||||||
| 5,190,000 | 0.020 | 03/07/16 | 5,190,000 | |||||||||||
| Sacramento Municipal Utility District VRDN RB Refunding Series 2008 J (Bank of | | ||||||||||||
| 3,600,000 | 0.010 | 03/07/16 | 3,600,000 | |||||||||||
| Sacramento Municipal Utility District VRDN RB Series 2012 L (U.S. Bank N.A., | | ||||||||||||
| 600,000 | 0.010 | 03/07/16 | 600,000 | |||||||||||
|
| |||||||||||||
| Municipal Debt Obligations – (continued) | ||||||||||||||
| California – (continued) | ||||||||||||||
| Sacramento Suburban Water District VRDN COPS Refunding Series 2009 A | | ||||||||||||
| $ | 2,000,000 | 0.010 | % | 03/07/16 | $ | 2,000,000 | ||||||||
| San Diego Community College District GO VRDN Floater Series 2011-O-8 (Royal | | ||||||||||||
| 1,000,000 | 0.010 | 03/07/16 | 1,000,000 | |||||||||||
| San Diego Community College District GO VRDN Putters Series 2009-3415 | | ||||||||||||
| 570,000 | 0.030 | 03/07/16 | 570,000 | |||||||||||
| San Diego County Regional Transportation Commission VRDN RB Refunding for | | ||||||||||||
| 5,450,000 | 0.010 | 03/07/16 | 5,450,000 | |||||||||||
| Santa Clara County Financing Authority VRDN RB Refunding for Multiple | | ||||||||||||
| 385,000 | 0.010 | 03/07/16 | 385,000 | |||||||||||
| Santa Clara Valley Transportation Authority Sales Tax VRDN RB Refunding for | | ||||||||||||
| 750,000 | 0.010 | 03/07/16 | 750,000 | |||||||||||
| Santa Clara Valley Transportation Authority Sales Tax VRDN RB Refunding for | | ||||||||||||
| 6,700,000 | 0.010 | 03/07/16 | 6,700,000 | |||||||||||
| Southern California Public Power Authority VRDN RB Refunding for Magnolia | | ||||||||||||
| 2,000,000 | 0.010 | 03/07/16 | 2,000,000 | |||||||||||
| State of California GO VRDN Refunding for Kindergarten-University Public | | ||||||||||||
| 2,500,000 | 0.010 | 03/01/16 | 2,500,000 | |||||||||||
| State of California GO VRDN Various Purpose Floaters Series 2015-XF1039 | | ||||||||||||
| 6,300,000 | 0.090 | 03/07/16 | 6,300,000 | |||||||||||
| The Regents of the University of California Medical Center Pooled VRDN RB | | ||||||||||||
| 2,000,000 | 0.010 | 03/07/16 | 2,000,000 | |||||||||||
| The Regents of the University of California VRDN RB Refunding General | | ||||||||||||
| 5,100,000 | 0.010 | 03/07/16 | 5,100,000 | |||||||||||
|
| |||||||||||||
| | TOTAL INVESTMENTS BEFORE REPURCHASE AGREEMENTS | | $ | 182,480,626 | ||||||||||
|
| |||||||||||||
| Repurchase Agreements(b) – 1.4% | ||||||||||||||
| Joint Repurchase Agreement Account I |
| ||||||||||||
| $ | 2,500,000 | 0.300 | % | 03/01/16 | $ | 2,500,000 | ||||||||
| Maturity Value: $2,500,021 |
| ||||||||||||
|
| |||||||||||||
| TOTAL INVESTMENTS – 99.9% | $ | 184,980,626 | ||||||||||||
|
| |||||||||||||
|
| OTHER ASSETS IN EXCESS OF LIABILITIES – 0.1% |
| 137,839 | |||||||||||
|
| |||||||||||||
| NET ASSETS – 100.0% | $ | 185,118,465 | ||||||||||||
|
| |||||||||||||
| The accompanying notes are an integral part of these financial statements. | 29 |
FINANCIAL SQUARE TAX-EXEMPT CALIFORNIA FUND
Schedule of Investments (continued)
February 29, 2016 (Unaudited)
| The percentage shown for each investment category reflects the value of investments in that category as a percentage of net assets. | ||
(a) | Security not registered under the Securities Act of 1933, as amended. Such securities may be deemed liquid by the Investment Adviser. At February 29, 2016, these securities amounted to $58,071,640 or approximately 31.4% of net assets. | |
(b) | Unless noted, all repurchase agreements were entered into on February 29, 2016. Additional information on Joint Repurchase Agreement Account I appears on page 50. | |
Interest rates represent either the stated coupon rate, or for floating rate securities, the current reset rate, which is based upon current interest rate indices.
Maturity dates represent either the final legal maturity date on the security, the demand date for puttable securities, or the prerefunded date for those types of securities.
| ||
Investment Abbreviations: | ||
AGM | —Insured by Assured Guaranty Municipal Corp. | |
BHAC | —Berkshire Hathaway Assurance Corp. | |
COPS | —Certificates of Participation | |
CP | —Commercial Paper | |
CR | —Custodial Receipts | |
FNMA | —Insured by Federal National Mortgage Association | |
FSA | —Insured by Financial Security Assurance Co. | |
GO | —General Obligation | |
GTY AGMT | —Guaranty Agreement | |
LIQ | —Liquidity Agreement | |
LOC | —Letter of Credit | |
MF Hsg | —Multi-Family Housing | |
NATL-RE | —National Reinsurance Corp. | |
RB | —Revenue Bond | |
RMKT | —Remarketed | |
ROCS | —Reset Option Certificates | |
RR | —Revenue Refunding | |
SPA | —Stand-by Purchase Agreement | |
VRDN | —Variable Rate Demand Notes | |
| ||
| 30 | The accompanying notes are an integral part of these financial statements. |
FINANCIAL SQUARE TAX-EXEMPT NEW YORK FUND
Schedule of Investments
February 29, 2016 (Unaudited)
Principal Amount | Interest Rate | Maturity Date | Amortized Cost | |||||||||||
| Municipal Debt Obligations – 98.5% | ||||||||||||||
| Multi-State – 3.2% | ||||||||||||||
| New York City Trust for Cultural Resources VRDN RB Refunding for Museum of | | ||||||||||||
| $ | 3,000,000 | 0.060 | % | 03/07/16 | $ | 3,000,000 | ||||||||
|
| |||||||||||||
| New York – 95.3% | ||||||||||||||
| City of New York GO VRDN Refunding Series 2008 Subseries J-5 (Bank of | | ||||||||||||
| 600,000 | 0.010 | 03/01/16 | 600,000 | |||||||||||
| City of New York GO VRDN Series 2005-E Subseries E-3 (Bank of America | | ||||||||||||
| 1,800,000 | 0.010 | 03/07/16 | 1,800,000 | |||||||||||
| City of New York GO VRDN Series 2008 Subseries L-4 (U.S. Bank N.A., LOC) |
| ||||||||||||
| 300,000 | 0.010 | 03/01/16 | 300,000 | |||||||||||
| City of New York GO VRDN Series 2008 Subseries L-5 RMKT (Bank of America | | ||||||||||||
| 1,100,000 | 0.010 | 03/01/16 | 1,100,000 | |||||||||||
| County of Nassau GO RANS Series 2015 A |
| ||||||||||||
| 1,670,000 | 2.000 | 03/15/16 | 1,670,990 | |||||||||||
| County of Nassau IDA Civic Facility Refunding & Improvement VRDN RB | | ||||||||||||
| 3,570,000 | 0.010 | 03/01/16 | 3,570,000 | |||||||||||
| County of Nassau Interim Finance Authority VRDN RB Refunding | | ||||||||||||
| 2,100,000 | 0.010 | 03/07/16 | 2,100,000 | |||||||||||
| County of Onondaga Trust for Cultural Resources VRDN RB Refunding for | | ||||||||||||
| 4,500,000 | 0.010 | 03/07/16 | 4,500,000 | |||||||||||
| Metropolitan Transportation Authority VRDN RB for Dedicated Tax Series 2002 | | ||||||||||||
| 1,150,000 | 0.010 | 03/07/16 | 1,150,000 | |||||||||||
| Metropolitan Transportation Authority VRDN RB Refunding for Dedicated Tax | | ||||||||||||
| 2,285,000 | 0.010 | 03/01/16 | 2,285,000 | |||||||||||
| Metropolitan Transportation Authority VRDN RB Series 2005 Subseries E-1 | | ||||||||||||
| 1,000,000 | 0.010 | 03/01/16 | 1,000,000 | |||||||||||
| New York City GO VRDN Refunding Series 2008 Subseries J-6 (Landesbank | | ||||||||||||
| 600,000 | 0.010 | 03/01/16 | 600,000 | |||||||||||
| New York City Health & Hospital Corp. VRDN RB Refunding for Health System | | ||||||||||||
| 2,400,000 | 0.010 | 03/07/16 | 2,400,000 | |||||||||||
| New York City Health & Hospital Corp. VRDN RB Refunding for Health System | | ||||||||||||
| 1,000,000 | 0.010 | 03/07/16 | 1,000,000 | |||||||||||
| New York City Housing Development Corp. MF Hsg. VRDN RB for Bruckner by | | ||||||||||||
| 2,000,000 | 0.010 | 03/07/16 | 2,000,000 | |||||||||||
| New York City Housing Development Corp. MF Hsg. VRDN RB for Elliot Chelsea | | ||||||||||||
| 2,000,000 | 0.010 | 03/07/16 | 2,000,000 | |||||||||||
| New York City Municipal Water Finance Authority Water & Sewer System CP | | ||||||||||||
| 2,000,000 | 0.020 | 03/03/16 | 2,000,000 | |||||||||||
|
| |||||||||||||
| Municipal Debt Obligations – (continued) | ||||||||||||||
| New York – (continued) | ||||||||||||||
| New York City Municipal Water Finance Authority Water & Sewer System VRDN | | ||||||||||||
| $ | 1,000,000 | 0.010 | % | 03/07/16 | $ | 1,000,000 | ||||||||
| New York City Municipal Water Finance Authority Water & Sewer System VRDN | | ||||||||||||
| 1,000,000 | 0.010 | 03/01/16 | 1,000,000 | |||||||||||
| New York City Municipal Water Finance Authority Water & Sewer System VRDN | | ||||||||||||
| 2,000,000 | 0.010 | 03/01/16 | 2,000,000 | |||||||||||
| New York City Municipal Water Finance Authority Water & Sewer System VRDN | | ||||||||||||
| 400,000 | 0.010 | 03/07/16 | 400,000 | |||||||||||
| New York City Transitional Finance Authority VRDN RB for Future Tax Secured | | ||||||||||||
| 1,000,000 | 0.010 | 03/07/16 | 1,000,000 | |||||||||||
| New York City Transitional Finance Authority VRDN RB for Future Tax Secured | | ||||||||||||
| 90,000 | 0.010 | 03/07/16 | 90,000 | |||||||||||
| New York City Transitional Finance Authority VRDN RB for Future Tax Secured | | ||||||||||||
| 1,400,000 | 0.010 | 03/01/16 | 1,400,000 | |||||||||||
| New York City Transitional Finance Authority VRDN RB for Future Tax Secured | | ||||||||||||
| 1,100,000 | 0.010 | 03/01/16 | 1,100,000 | |||||||||||
| New York City Transitional Finance Authority VRDN RB Refunding for Future Tax | | ||||||||||||
| 800,000 | 0.010 | 03/07/16 | 800,000 | |||||||||||
| New York City Trust for Cultural Resources VRDN RB for Metropolitan Museum | | ||||||||||||
| 650,000 | 0.010 | 03/07/16 | 650,000 | |||||||||||
| New York City Trust for Cultural Resources VRDN RB for Metropolitan Museum | | ||||||||||||
| 600,000 | 0.010 | 03/07/16 | 600,000 | |||||||||||
| New York City Trust for Cultural Resources VRDN RB for The Juilliard School | | ||||||||||||
| 2,400,000 | 0.020 | 03/07/16 | 2,400,000 | |||||||||||
| New York City Trust for Cultural Resources VRDN RB Refunding for The New | | ||||||||||||
| 1,800,000 | 0.010 | 03/07/16 | 1,800,000 | |||||||||||
| New York State Dormitory Authority Non-State Supported Debt VRDN RB for | | ||||||||||||
| 4,400,000 | 0.010 | 03/07/16 | 4,400,000 | |||||||||||
| New York State Dormitory Authority Non-State Supported Debt VRDN RB for | | ||||||||||||
| 2,000,000 | 0.010 | 03/07/16 | 2,000,000 | |||||||||||
| New York State Dormitory Authority Non-State Supported Debt VRDN RB for | | ||||||||||||
| 3,900,000 | 0.010 | 03/07/16 | 3,900,000 | |||||||||||
| New York State Dormitory Authority Non-State Supported Debt VRDN RB for | | ||||||||||||
| 3,110,000 | 0.010 | 03/01/16 | 3,110,000 | |||||||||||
|
| |||||||||||||
| The accompanying notes are an integral part of these financial statements. | 31 |
FINANCIAL SQUARE TAX-EXEMPT NEW YORK FUND
Schedule of Investments (continued)
February 29, 2016 (Unaudited)
Principal Amount | Interest Rate | Maturity Date | Amortized Cost | |||||||||||
| Municipal Debt Obligations – (continued) | ||||||||||||||
| New York – (continued) | ||||||||||||||
| New York State Dormitory Authority Non-State Supported Debt VRDN RB | | ||||||||||||
| $ | 1,055,000 | 0.020 | % | 03/07/16 | $ | 1,055,000 | ||||||||
| New York State Dormitory Authority Non-State Supported Debt VRDN RB | | ||||||||||||
| 1,745,000 | 0.010 | 03/07/16 | 1,745,000 | |||||||||||
| New York State Dormitory Authority Non-State Supported Debt VRDN RB | | ||||||||||||
| 1,500,000 | 0.020 | 03/07/16 | 1,500,000 | |||||||||||
| New York State Dormitory Authority State Personal Income Tax VRDN RB | | ||||||||||||
| 1,000,000 | 0.020 | 03/07/16 | 1,000,000 | |||||||||||
| New York State Housing Finance Agency VRDN RB for 10 Barclay Street | | ||||||||||||
| 600,000 | 0.010 | 03/07/16 | 600,000 | |||||||||||
| New York State Housing Finance Agency VRDN RB for 20 River Terrace Housing | | ||||||||||||
| 1,000,000 | 0.010 | 03/07/16 | 1,000,000 | |||||||||||
| New York State Housing Finance Agency VRDN RB for Clinton Park Housing | | ||||||||||||
| 300,000 | 0.010 | 03/07/16 | 300,000 | |||||||||||
| New York State Housing Finance Agency VRDN RB for North End | | ||||||||||||
| 1,000,000 | 0.010 | 03/07/16 | 1,000,000 | |||||||||||
| New York State Housing Finance Agency VRDN RB for West 37th Street Housing | | ||||||||||||
| 1,500,000 | 0.020 | 03/07/16 | 1,500,000 | |||||||||||
| New York State Housing Finance Agency VRDN RB Refunding for 11th Avenue | | ||||||||||||
| 500,000 | 0.010 | 03/07/16 | 500,000 | |||||||||||
| New York State Liberty Development Corp. VRDN RB Refunding for 7 World | | ||||||||||||
| 1,000,000 | 0.160 | 03/07/16 | 1,000,000 | |||||||||||
| New York State Liberty Development Corp. VRDN RB Refunding for 7 World | | ||||||||||||
| 2,795,000 | 0.090 | 03/07/16 | 2,795,000 | |||||||||||
| New York State Local Government Assistance Corp. VRDN RB Refunding for | | ||||||||||||
| 2,100,000 | 0.010 | 03/07/16 | 2,100,000 | |||||||||||
| New York State Local Government Assistance Corp. VRDN RB Refunding | | ||||||||||||
| 1,065,000 | 0.130 | 03/07/16 | 1,065,000 | |||||||||||
| New York State Power Authority CP Series 2016-2 (JP Morgan Chase Bank N.A., | | ||||||||||||
| 4,150,000 | 0.030 | 04/07/16 | 4,150,000 | |||||||||||
| New York State Thruway Authority VRDN RB Floater Refunding | | ||||||||||||
| 1,000,000 | 0.020 | 03/07/16 | 1,000,000 | |||||||||||
|
| |||||||||||||
| New York – (continued) | ||||||||||||||
| Port Authority of New York & New Jersey VRDN RB ROCS-RR-II-R-664 | | ||||||||||||
| $ | 2,030,000 | 0.020 | % | 03/07/16 | $ | 2,030,000 | ||||||||
| Triborough Bridge & Tunnel Authority VRDN RB Refunding General | | ||||||||||||
| 900,000 | 0.010 | 03/07/16 | 900,000 | |||||||||||
| Triborough Bridge & Tunnel Authority VRDN RB Refunding General | | ||||||||||||
| 3,100,000 | 0.010 | 03/01/16 | 3,100,000 | |||||||||||
| Triborough Bridge & Tunnel Authority VRDN RB Refunding General | | ||||||||||||
| 900,000 | 0.010 | 03/07/16 | 900,000 | |||||||||||
| Utility Debt Securization Authority of New York VRDN RB Floaters Refunding | | ||||||||||||
| 2,000,000 | 0.020 | 03/07/16 | 2,000,000 | |||||||||||
| Utility Debt Securization Authority of New York VRDN RB Floaters Refunding | | ||||||||||||
| 1,500,000 | 0.020 | 03/07/16 | 1,500,000 | |||||||||||
|
| |||||||||||||
| 90,465,990 | ||||||||||||||
|
| |||||||||||||
| | TOTAL INVESTMENTS BEFORE REPURCHASE AGREEMENTS | | $ | 93,465,990 | ||||||||||
|
| |||||||||||||
| Repurchase Agreements(b) – 1.4% | ||||||||||||||
| Joint Repurchase Agreement Account I |
| ||||||||||||
| $ | 1,300,000 | 0.300 | % | 03/01/16 | $ | 1,300,000 | ||||||||
| Maturity Value: $1,300,011 |
| ||||||||||||
|
| |||||||||||||
| TOTAL INVESTMENTS – 99.9% | $ | 94,765,990 | ||||||||||||
|
| |||||||||||||
|
| OTHER ASSETS IN EXCESS OF LIABILITIES – 0.1% |
| 131,425 | |||||||||||
|
| |||||||||||||
| NET ASSETS – 100.0% | $ | 94,897,415 | ||||||||||||
|
| |||||||||||||
| The percentage shown for each investment category reflects the value of investments in that category as a percentage of net assets. | ||
(a) | Security not registered under the Securities Act of 1933, as amended. Such securities may be deemed liquid by the Investment Adviser. At February 29, 2016, these securities amounted to $18,280,000 or approximately 19.3% of net assets. | |
(b) | Unless noted, all repurchase agreements were entered into on February 29, 2016. Additional information on Joint Repurchase Agreement Account I appears on page 50. | |
Interest rates represent either the stated coupon rate, or for floating rate securities, the current reset rate, which is based upon current interest rate indices.
Maturity dates represent either the final legal maturity date on the security, the demand date for puttable securities, or the prerefunded date for those types of securities.
| 32 | The accompanying notes are an integral part of these financial statements. |
FINANCIAL SQUARE TAX-EXEMPT NEW YORK FUND
| ||
Investment Abbreviations: | ||
CP | —Commercial Paper | |
FHLMC | —Insured by Federal Home Loan Mortgage Corp. | |
FNMA | —Insured by Federal National Mortgage Association | |
GO | —General Obligation | |
IBC | —Insured Bond Certificate | |
IDA | —Industrial Development Agency | |
LIQ | —Liquidity Agreement | |
LOC | —Letter of Credit | |
MF Hsg | —Multi-Family Housing | |
NATL-RE | —National Reinsurance Corp. | |
RANS | —Revenue Anticipation Notes | |
RB | —Revenue Bond | |
RMKT | —Remarketed | |
ROCS | —Reset Option Certificates | |
RR | —Revenue Refunding | |
SPA | —Stand-by Purchase Agreement | |
SPEARS | —Short Puttable Exempt Adjustable Receipts | |
VRDN | —Variable Rate Demand Notes | |
| ||
| The accompanying notes are an integral part of these financial statements. | 33 |
FINANCIAL SQUARE TAX-FREE MONEY MARKET FUND
Schedule of Investments
February 29, 2016 (Unaudited)
| Principal Amount | Interest Rate | Maturity Date | Amortized Cost | |||||||||||
| Municipal Debt Obligations – 101.7% | ||||||||||||||
| Alabama – 3.5% | ||||||||||||||
| Alabama Special Care Facilities Financing Authority VRDN RB Refunding for | | ||||||||||||
| $ | 16,380,000 | 0.010 | % | 03/07/16 | $ | 16,380,000 | ||||||||
| Columbia IDB VRDN PCRB Refunding for Alabama Power Co. Project | | ||||||||||||
| 50,000,000 | 0.030 | 03/01/16 | 50,000,000 | |||||||||||
| East Alabama Health Care Authority VRDN RB Refunding | | ||||||||||||
| 15,000,000 | 0.020 | 03/07/16 | 15,000,000 | |||||||||||
| Huntsville Health Care Authority CP Series 2016 |
| ||||||||||||
| 20,000,000 | 0.060 | 03/07/16 | 20,000,000 | |||||||||||
| Mobile IDB VRDN PCRB for Alabama Power Co. Barry Plant Project | | ||||||||||||
| 11,500,000 | 0.060 | 03/07/16 | 11,500,000 | |||||||||||
| West Jefferson IDB VRDN PCRB Refunding for Alabama Power Co. Project | | ||||||||||||
| 37,290,000 | 0.060 | 03/07/16 | 37,290,000 | |||||||||||
|
| |||||||||||||
| 150,170,000 | ||||||||||||||
|
| |||||||||||||
| Alaska – 1.6% | ||||||||||||||
| Alaska Housing Finance Corp. Home Mortgage VRDN RB Refunding | | ||||||||||||
| 10,000,000 | 0.010 | 03/07/16 | 10,000,000 | |||||||||||
| Alaska Housing Finance Corp. Home Mortgage VRDN RB Refunding | | ||||||||||||
| 54,950,000 | 0.010 | 03/07/16 | 54,950,000 | |||||||||||
| Alaska Housing Finance Corp. Home Mortgage VRDN RB Refunding | | ||||||||||||
| 5,015,000 | 0.010 | 03/07/16 | 5,015,000 | |||||||||||
|
| |||||||||||||
| 69,965,000 | ||||||||||||||
|
| |||||||||||||
| Arizona – 1.4% | ||||||||||||||
| Arizona Health Facilities Authority VRDN RB for Banner Health Series 2015 B | | ||||||||||||
| 9,000,000 | 0.010 | 03/07/16 | 9,000,000 | |||||||||||
| Arizona Health Facilities Authority VRDN RB for Banner Health Series 2015 C | | ||||||||||||
| 9,000,000 | 0.010 | 03/07/16 | 9,000,000 | |||||||||||
| Arizona Health Facilities Authority VRDN RB Refunding for Banner Health | | ||||||||||||
| 10,500,000 | 0.060 | 03/07/16 | 10,500,000 | |||||||||||
| Arizona Health Facilities Authority VRDN RB Refunding for Banner Health | | ||||||||||||
| 5,000,000 | 0.010 | 03/07/16 | 5,000,000 | |||||||||||
| Arizona State Transportation Board Highway VRDN RB Putters Series 2008-3151 | | ||||||||||||
| 6,605,000 | 0.020 | 03/07/16 | 6,605,000 | |||||||||||
| Arizona State Transportation Board Highway VRDN RB Putters Series 2009-3466 | | ||||||||||||
| 4,065,000 | 0.020 | 03/07/16 | 4,065,000 | |||||||||||
| City of Phoenix Civic Improvement Corp. Water System VRDN RB Putters | | ||||||||||||
| 7,140,000 | 0.020 | 03/07/16 | 7,140,000 | |||||||||||
|
| |||||||||||||
| Municipal Debt Obligations – (continued) | ||||||||||||||
| Arizona – (continued) | ||||||||||||||
| County of Maricopa IDA Senior Living Facilities VRDN RB Refunding for | | ||||||||||||
| $ | 9,985,000 | 0.020 | % | 03/07/16 | $ | 9,985,000 | ||||||||
|
| |||||||||||||
| 61,295,000 | ||||||||||||||
|
| |||||||||||||
| California – 12.2% | ||||||||||||||
| ABAG Finance Authority for Non-Profit Corporations VRDN RB for Lakeside | | ||||||||||||
| 16,600,000 | 0.010 | 03/07/16 | 16,600,000 | |||||||||||
| Bay Area Toll Authority California Toll Bridge VRDN RB Refunding for San | | ||||||||||||
| 8,745,000 | 0.100 | 03/07/16 | 8,745,000 | |||||||||||
| California Educational Facilities Authority VRDN RB Austin Trust Certificates for | | ||||||||||||
| 2,000,000 | 0.250 | 03/07/16 | 2,000,000 | |||||||||||
| California Educational Facilities Authority VRDN RB Refunding for Claremont | | ||||||||||||
| 6,380,000 | 0.020 | 03/07/16 | 6,380,000 | |||||||||||
| California Health Facilities Financing Authority CP for Kaiser Permanente | | ||||||||||||
| 27,000,000 | 0.260 | 03/01/16 | 27,000,000 | |||||||||||
| California Health Facilities Financing Authority VRDN RB for Adventist Health | | ||||||||||||
| 17,990,000 | 0.180 | 03/07/16 | 17,990,000 | |||||||||||
| California Health Facilities Financing Authority VRDN RB for City of Hope | | ||||||||||||
| 2,200,000 | 0.010 | 03/07/16 | 2,200,000 | |||||||||||
| California Health Facilities Financing Authority VRDN RB for Sutter Health ROCS | | ||||||||||||
| 7,230,000 | 0.020 | 03/07/16 | 7,230,000 | |||||||||||
| California State University VRDN RB Floater Trust Series 2008-K37W Reg D | | ||||||||||||
| 15,000,000 | 0.160 | 03/07/16 | 15,000,000 | |||||||||||
| California Statewide Communities Development Authority CP for Kaiser | | ||||||||||||
| 2,000,000 | 0.050 | 04/01/16 | 2,000,000 | |||||||||||
| California Statewide Communities Development Authority CP for Kaiser | | ||||||||||||
| 13,000,000 | 0.240 | 03/02/16 | 13,000,000 | |||||||||||
| California Statewide Communities Development Authority CP for Kaiser | | ||||||||||||
| 1,500,000 | 0.060 | 03/02/16 | 1,500,000 | |||||||||||
| 9,500,000 | 0.240 | 03/02/16 | 9,500,000 | |||||||||||
| California Statewide Communities Development Authority CP for Kaiser | | ||||||||||||
| 10,000,000 | 0.220 | 03/07/16 | 10,000,000 | |||||||||||
| California Statewide Communities Development Authority CP Series 2015 K |
| ||||||||||||
| 2,000,000 | 0.260 | 06/01/16 | 2,000,000 | |||||||||||
| California Statewide Communities Development Authority VRDN RB for Kaiser | | ||||||||||||
| 10,035,000 | 0.020 | 03/07/16 | 10,035,000 | |||||||||||
| California Statewide Communities Development Authority VRDN RB for Kaiser | | ||||||||||||
| 7,100,000 | 0.010 | 03/07/16 | 7,100,000 | |||||||||||
|
| |||||||||||||
| 34 | The accompanying notes are an integral part of these financial statements. |
FINANCIAL SQUARE TAX-FREE MONEY MARKET FUND
| Principal Amount | Interest Rate | Maturity Date | Amortized Cost | |||||||||||
| Municipal Debt Obligations – (continued) | ||||||||||||||
| California – (continued) | ||||||||||||||
| California Statewide Communities Development Authority VRDN RB Refunding | | ||||||||||||
| $ | 9,200,000 | 0.020 | % | 03/07/16 | $ | 9,200,000 | ||||||||
| California Statewide Communities Development Authority VRDN RB Refunding | | ||||||||||||
| 4,200,000 | 0.010 | 03/07/16 | 4,200,000 | |||||||||||
| East Bay Municipal Utility District VRDN RB Water System Eagle | | ||||||||||||
| 10,000,000 | 0.020 | 03/07/16 | 10,000,000 | |||||||||||
| East Bay Municipal Utility District VRDN RB Water System Eagle | | ||||||||||||
| 4,700,000 | 0.020 | 03/07/16 | 4,700,000 | |||||||||||
| East Bay Municipal Utility District VRDN RB Water System Refunding | | ||||||||||||
| 3,870,000 | 0.010 | 03/07/16 | 3,870,000 | |||||||||||
| Los Angeles Community Redevelopment Agency MF Hsg VRDN RB for | | ||||||||||||
| 8,035,000 | 0.010 | 03/07/16 | 8,035,000 | |||||||||||
| Los Angeles County Housing Authority MF Hsg VRDN RB Refunding for Malibu | | ||||||||||||
| 600,000 | 0.010 | 03/07/16 | 600,000 | |||||||||||
| Los Angeles Department of Water & Power VRDN RB for Power System Putters | | ||||||||||||
| 8,795,000 | 0.020 | 03/07/16 | 8,795,000 | |||||||||||
| Los Angeles Department of Water & Power Waterworks VRDN RB Refunding | | ||||||||||||
| 72,850,000 | 0.010 | 03/07/16 | 72,850,000 | |||||||||||
| Orange County Apartment Development VRDN RB Refunding for Park Ridge | | ||||||||||||
| 2,600,000 | 0.010 | 03/07/16 | 2,600,000 | |||||||||||
| Riverside County Transportation Commission Sales Tax VRDN RB Putters | | ||||||||||||
| 6,365,000 | 0.020 | 03/07/16 | 6,365,000 | |||||||||||
| Sacramento County Housing Authority VRDN RB Refunding for River Terrace | | ||||||||||||
| 6,110,000 | 0.020 | 03/07/16 | 6,110,000 | |||||||||||
| San Diego Community College District GO VRDN Putters Series 2009-3415 | | ||||||||||||
| 5,470,000 | 0.030 | 03/07/16 | 5,470,000 | |||||||||||
| San Diego County Regional Transportation Commission VRDN RB Refunding for | | ||||||||||||
| 400,000 | 0.010 | 03/07/16 | 400,000 | |||||||||||
| Santa Clara Valley Transportation Authority Sales Tax VRDN RB Refunding for | | ||||||||||||
| 3,100,000 | 0.010 | 03/07/16 | 3,100,000 | |||||||||||
| State of California GO CP Series 2011A-5 (U.S. Bank N.A., LOC) |
| ||||||||||||
| 4,000,000 | 0.030 | 04/01/16 | 4,000,000 | |||||||||||
| State of California GO CP Series 2011B-5 (U.S. Bank N.A., LOC) |
| ||||||||||||
| 27,193,000 | 0.400 | 03/17/16 | 27,193,000 | |||||||||||
| State of California GO Refunding Series 2015 |
| ||||||||||||
| 50,000,000 | 3.000 | 03/01/16 | 50,000,000 | |||||||||||
| 49,545,000 | 5.000 | 03/01/16 | 49,545,000 | |||||||||||
| State of California GO VRDN Refunding Floaters Series 2015-XF-2171 (Citibank | | ||||||||||||
| 3,000,000 | 0.010 | 03/07/16 | 3,000,000 | |||||||||||
|
| |||||||||||||
| Municipal Debt Obligations – (continued) | ||||||||||||||
| California – (continued) | ||||||||||||||
| State of California GO VRDN Refunding Series 2005 B Subseries B-1 RMKT | | ||||||||||||
| $ | 10,000,000 | 0.010 | % | 03/07/16 | $ | 10,000,000 | ||||||||
| State of California GO VRDN Refunding Series 2005 Subseries A-1-1 RMKT | | ||||||||||||
| 24,550,000 | 0.010 | 03/07/16 | 24,550,000 | |||||||||||
| State of California GO VRDN Refunding Series 2005 Subseries A-1-2 RMKT | | ||||||||||||
| 11,250,000 | 0.010 | 03/07/16 | 11,250,000 | |||||||||||
| State of California GO VRDN Refunding Series B 2005 Subseries B-3 RMKT | | ||||||||||||
| 6,135,000 | 0.010 | 03/07/16 | 6,135,000 | |||||||||||
| The Regents of the University of California VRDN RB Refunding General | | ||||||||||||
| 36,900,000 | 0.010 | 03/07/16 | 36,900,000 | |||||||||||
| The Regents of the University of California VRDN RB Refunding General | | ||||||||||||
| 4,000,000 | 0.010 | 03/07/16 | 4,000,000 | |||||||||||
|
| |||||||||||||
| 531,148,000 | ||||||||||||||
|
| |||||||||||||
| Colorado – 1.7% | ||||||||||||||
| City & County of Denver GO VRDN Floaters Series 2015-XM-0062 (Bank of | | ||||||||||||
| 7,500,000 | 0.060 | 03/07/16 | 7,500,000 | |||||||||||
| City of Colorado Springs Utilities System VRDN RB for Subordinate Lien | | ||||||||||||
| 14,075,000 | 0.010 | 03/07/16 | 14,075,000 | |||||||||||
| City of Colorado Springs Utilities System VRDN RB for Subordinate Lien | | ||||||||||||
| 40,000,000 | 0.020 | 03/07/16 | 40,000,000 | |||||||||||
| Colorado Health Facilities Authority VRDN RB for Catholic Health Initiatives | | ||||||||||||
| 5,625,000 | 0.150 | 03/07/16 | 5,625,000 | |||||||||||
| Colorado Health Facilities Authority VRDN RB Refunding for Sisters of | | ||||||||||||
| 5,670,000 | 0.020 | 03/07/16 | 5,670,000 | |||||||||||
|
| |||||||||||||
| 72,870,000 | ||||||||||||||
|
| |||||||||||||
| Connecticut – 2.7% | ||||||||||||||
| Connecticut Housing Finance Authority VRDN RB Housing Mortgage Finance | | ||||||||||||
| 25,850,000 | 0.010 | 03/07/16 | 25,850,000 | |||||||||||
| Connecticut Housing Finance Authority VRDN RB Housing Mortgage Finance | | ||||||||||||
| 10,000,000 | 0.010 | 03/07/16 | 10,000,000 | |||||||||||
| Connecticut Housing Finance Authority VRDN RB Housing Mortgage Finance | | ||||||||||||
| 5,500,000 | 0.010 | 03/07/16 | 5,500,000 | |||||||||||
| Connecticut State Health & Educational Facilities Authority VRDN RB for Yale | | ||||||||||||
| 16,820,000 | 0.010 | 03/01/16 | 16,820,000 | |||||||||||
|
| |||||||||||||
| The accompanying notes are an integral part of these financial statements. | 35 |
FINANCIAL SQUARE TAX-FREE MONEY MARKET FUND
Schedule of Investments (continued)
February 29, 2016 (Unaudited)
| Principal Amount | Interest Rate | Maturity Date | Amortized Cost | |||||||||||
| Municipal Debt Obligations – (continued) | ||||||||||||||
| Connecticut – (continued) | ||||||||||||||
| Connecticut State Health & Educational Facilities Authority VRDN RB for Yale | | ||||||||||||
| $ | 21,405,000 | 0.010 | % | 03/01/16 | $ | 21,405,000 | ||||||||
| Connecticut State Health & Educational Facilities Authority VRDN RB for Yale | | ||||||||||||
| 11,995,000 | 0.020 | 03/07/16 | 11,995,000 | |||||||||||
| State of Connecticut GO VRDN for Economic Recovery SIFMA Index Series 2012 A |
| ||||||||||||
| 5,000,000 | 0.540 | 04/15/16 | 5,002,333 | |||||||||||
| State of Connecticut GO VRDN for Economic Recovery SIFMA Index Series 2013 A |
| ||||||||||||
| 4,500,000 | 0.240 | 03/01/16 | 4,500,000 | |||||||||||
| State of Connecticut GO VRDN Refunding for Economic Recovery SIFMA Index | | ||||||||||||
| 14,350,000 | 0.660 | 05/15/16 | 14,363,817 | |||||||||||
|
| |||||||||||||
| 115,436,150 | ||||||||||||||
|
| |||||||||||||
| Delaware – 0.7% | ||||||||||||||
| County of New Castle GO VRDN Floaters Refunding Series 2015-ZF-2088 | | ||||||||||||
| 6,665,000 | 0.140 | 03/07/16 | 6,665,000 | |||||||||||
| Delaware State Health Facilities Authority VRDN RB Refunding for Christiana | | ||||||||||||
| 16,475,000 | 0.010 | 03/07/16 | 16,475,000 | |||||||||||
| University of Delaware VRDN RB Putters Refunding Series 2013-4359 | | ||||||||||||
| 9,170,000 | 0.020 | 03/07/16 | 9,170,000 | |||||||||||
|
| |||||||||||||
| 32,310,000 | ||||||||||||||
|
| |||||||||||||
| District of Columbia – 0.6% | ||||||||||||||
| District of Columbia Income Tax Secured VRDN RB Putters Series 2009-3354 | | ||||||||||||
| 7,080,000 | 0.020 | 03/07/16 | 7,080,000 | |||||||||||
| District of Columbia Water & Sewer Authority Public Utility Systems VRDN RB | | ||||||||||||
| 6,200,000 | 0.020 | 03/07/16 | 6,200,000 | |||||||||||
| District of Columbia Water & Sewer Authority Public Utility Systems VRDN RB | | ||||||||||||
| 6,670,000 | 0.020 | 03/07/16 | 6,670,000 | |||||||||||
| District of Columbia Water & Sewer Authority Public Utility Systems VRDN RB | | ||||||||||||
| 5,000,000 | 0.010 | 03/07/16 | 5,000,000 | |||||||||||
|
| |||||||||||||
| 24,950,000 | ||||||||||||||
|
| |||||||||||||
| Florida – 2.0% | ||||||||||||||
| City of Gainesville Utilities System VRDN RB Refunding Series 2012 B RMKT | | ||||||||||||
| 24,470,000 | 0.010 | 03/07/16 | 24,470,000 | |||||||||||
| Pinellas County Health Facilities Authority VRDN RB for BayCare Health System | | ||||||||||||
| 13,750,000 | 0.010 | 03/07/16 | 13,750,000 | |||||||||||
| State of Florida VRDN RB Refunding for Department of Transportation Putters | | ||||||||||||
| 27,105,000 | 0.030 | 03/07/16 | 27,105,000 | |||||||||||
|
| |||||||||||||
| Municipal Debt Obligations – (continued) | ||||||||||||||
| Florida – (continued) | ||||||||||||||
| State of Florida VRDN RB Refunding for Department of Transportation Putters | | ||||||||||||
| $ | 21,330,000 | 0.030 | % | 03/07/16 | $ | 21,330,000 | ||||||||
|
| |||||||||||||
| 86,655,000 | ||||||||||||||
|
| |||||||||||||
| Georgia – 1.0% | ||||||||||||||
| County of DeKalb Water & Sewerage VRDN RB ROCS RR-II-R-11900 Refunding | | ||||||||||||
| 9,600,000 | 0.030 | 03/07/16 | 9,600,000 | |||||||||||
| Municipal Electric Authority of Georgia VRDN RB Refunding Series 1985 Sub | | ||||||||||||
| 34,475,000 | 0.010 | 03/07/16 | 34,475,000 | |||||||||||
| Private Colleges & Universities Authority CP for Emory University Series 2016 |
| ||||||||||||
| 1,417,000 | 0.070 | 04/04/16 | 1,417,000 | |||||||||||
|
| |||||||||||||
| 45,492,000 | ||||||||||||||
|
| |||||||||||||
| Hawaii – 0.2% | ||||||||||||||
| State of Hawaii GO VRDN P-Floats Series 2011 PT-4718 (Bank of America N.A., | | ||||||||||||
| 3,000,000 | 0.060 | 03/07/16 | 3,000,000 | |||||||||||
| State of Hawaii GO VRDN P-Floats Series 2013 PT-4739 (Bank of America N.A., | | ||||||||||||
| 6,000,000 | 0.040 | 03/07/16 | 6,000,000 | |||||||||||
|
| |||||||||||||
| 9,000,000 | ||||||||||||||
|
| |||||||||||||
| Illinois – 2.5% | ||||||||||||||
| County of Peoria GO VRDN ROCS-RR-II-14004 Series 2012 (Citibank N.A., LIQ)(a) |
| ||||||||||||
| 8,130,000 | 0.110 | 03/07/16 | 8,130,000 | |||||||||||
| Illinois Educational Facilities Authority VRDN RB for University of Chicago | | ||||||||||||
| 7,554,000 | 0.010 | 03/07/16 | 7,554,000 | |||||||||||
| Illinois Finance Authority VRDN RB for Northwestern University Series 2004 | | ||||||||||||
| 65,300,000 | 0.010 | 03/07/16 | 65,300,000 | |||||||||||
| Illinois Finance Authority VRDN RB for Northwestern University Series 2008 | | ||||||||||||
| 8,000,000 | 0.010 | 03/07/16 | 8,000,000 | |||||||||||
| Illinois Toll Highway Authority VRDN RB Floater Series 2015-ZM-0120 (Royal | | ||||||||||||
| 3,130,000 | 0.030 | 03/07/16 | 3,130,000 | |||||||||||
| Metropolitan Water Reclamation District of Greater Chicago Floaters | | ||||||||||||
| 18,000,000 | 0.120 | 03/07/16 | 18,000,000 | |||||||||||
|
| |||||||||||||
| 110,114,000 | ||||||||||||||
|
| |||||||||||||
| Indiana – 2.3% | ||||||||||||||
| Indiana Finance Authority Hospital VRDN RB for Indiana University Health | | ||||||||||||
| 11,000,000 | 0.020 | 03/07/16 | 11,000,000 | |||||||||||
| Indiana Finance Authority Hospital VRDN RB Refunding for Indiana University | | ||||||||||||
| 6,000,000 | 0.030 | 03/07/16 | 6,000,000 | |||||||||||
| Indiana Finance Authority Hospital VRDN RB Refunding for Indiana University | | ||||||||||||
| 2,800,000 | 0.010 | 03/07/16 | 2,800,000 | |||||||||||
|
| |||||||||||||
| 36 | The accompanying notes are an integral part of these financial statements. |
FINANCIAL SQUARE TAX-FREE MONEY MARKET FUND
| Principal Amount | Interest Rate | Maturity Date | Amortized Cost | |||||||||||
| Municipal Debt Obligations – (continued) | ||||||||||||||
| Indiana – (continued) | ||||||||||||||
| Indiana Finance Authority Hospital VRDN RB Refunding for Indiana University | | ||||||||||||
| $ | 4,550,000 | 0.010 | % | 03/07/16 | $ | 4,550,000 | ||||||||
| Indiana Finance Authority Hospital VRDN RB Refunding for Indiana University | | ||||||||||||
| 4,000,000 | 0.010 | 03/07/16 | 4,000,000 | |||||||||||
| Indiana Finance Authority VRDN RB Refunding for Trinity Health Corp. Floaters | | ||||||||||||
| 17,180,000 | 0.040 | 03/07/16 | 17,180,000 | |||||||||||
| Indiana Health Facility Financing Authority VRDN RB for Ascension Health | | ||||||||||||
| 13,585,000 | 0.010 | 03/07/16 | 13,585,000 | |||||||||||
| Indiana Health Facility Financing Authority VRDN RB Refunding for Ascension | | ||||||||||||
| 14,910,000 | 0.040 | 03/07/16 | 14,910,000 | |||||||||||
| Indiana Health Facility Financing Authority VRDN RB Refunding for Sisters of | | ||||||||||||
| 4,925,000 | 0.040 | 03/07/16 | 4,925,000 | |||||||||||
| University of Purdue VRDN RB for Student Facilities System Series 2004 A |
| ||||||||||||
| 10,325,000 | 0.010 | 03/07/16 | 10,325,000 | |||||||||||
| University of Purdue VRDN RB for Student Facilities System Series 2007 C |
| ||||||||||||
| 12,335,000 | 0.010 | 03/07/16 | 12,335,000 | |||||||||||
|
| |||||||||||||
| 101,610,000 | ||||||||||||||
|
| |||||||||||||
| Louisiana – 0.3% | ||||||||||||||
| State of Louisiana Gasoline & Fuels Tax RB Series 2006 A (BHAC-CR AGM) |
| ||||||||||||
| 15,000,000 | 4.750 | 05/01/16 | 15,110,993 | |||||||||||
|
| |||||||||||||
| Maine – 0.2% | ||||||||||||||
| Maine Health & Higher Educational Facilities Authority VRDN RB Refunding for | | ||||||||||||
| 6,955,000 | 0.020 | 03/07/16 | 6,955,000 | |||||||||||
|
| |||||||||||||
| Maryland – 0.3% | ||||||||||||||
| Maryland State Health & Higher Educational Facilities Authority VRDN RB for | | ||||||||||||
| 5,650,000 | 0.020 | 03/07/16 | 5,650,000 | |||||||||||
| Maryland State Transportation Authority VRDN RB Austin Trust Certificates | | ||||||||||||
| 5,000,000 | 0.060 | 03/07/16 | 5,000,000 | |||||||||||
| State of Maryland Department of Transportation RB Refunding Series 2011 |
| ||||||||||||
| 3,000,000 | 5.000 | 05/01/16 | 3,023,601 | |||||||||||
| State of Maryland GO for State and Local Facilities Loan First Series 2009 C |
| ||||||||||||
| 1,400,000 | 5.000 | 03/01/16 | 1,400,000 | |||||||||||
|
| |||||||||||||
| 15,073,601 | ||||||||||||||
|
| |||||||||||||
| Massachusetts – 1.4% | ||||||||||||||
| Commonwealth of Massachusetts (The) GO VRDN Austin Trust Certificates | | ||||||||||||
| 9,500,000 | 0.060 | 03/07/16 | 9,500,000 | |||||||||||
| Massachusetts Bay Transportation Authority Sales Tax VRDN RB Austin Trust | | ||||||||||||
| 5,000,000 | 0.060 | 03/07/16 | 5,000,000 | |||||||||||
|
| |||||||||||||
| Municipal Debt Obligations – (continued) | ||||||||||||||
| Massachusetts – (continued) | ||||||||||||||
| Massachusetts Bay Transportation Authority VRDN RB Refunding for General | | ||||||||||||
| $ | 10,200,000 | 0.010 | % | 03/07/16 | $ | 10,200,000 | ||||||||
| Massachusetts Development Finance Agency VRDN RB for Partners Healthcare | | ||||||||||||
| 28,500,000 | 0.020 | 03/07/16 | 28,500,000 | |||||||||||
| Massachusetts Health & Educational Facilities Authority VRDN RB for Harvard | | ||||||||||||
| 5,750,000 | 0.010 | 03/07/16 | 5,750,000 | |||||||||||
|
| |||||||||||||
| 58,950,000 | ||||||||||||||
|
| |||||||||||||
| Michigan – 0.9% | ||||||||||||||
| Michigan Finance Authority RB Refunding for Unemployment Obligation | | ||||||||||||
| 425,000 | 5.000 | 07/01/16 | 431,468 | |||||||||||
| Michigan Finance Authority VRDN RB Refunding for Trinity Health Credit Group | | ||||||||||||
| 10,740,000 | 0.020 | 03/07/16 | 10,740,000 | |||||||||||
| Michigan State Hospital Finance Authority VRDN RB Refunding for Trinity | | ||||||||||||
| 6,855,000 | 0.010 | 03/07/16 | 6,855,000 | |||||||||||
| Michigan State University VRDN RB Series 2005 (Royal Bank of Canada, SPA) |
| ||||||||||||
| 3,700,000 | 0.010 | 03/07/16 | 3,700,000 | |||||||||||
| Regents of the University of Michigan VRDN RB Series 2012 D-2 |
| ||||||||||||
| 19,065,000 | 0.010 | 03/07/16 | 19,065,000 | |||||||||||
|
| |||||||||||||
| 40,791,468 | ||||||||||||||
|
| |||||||||||||
| Minnesota – 0.2% | ||||||||||||||
| City of Minneapolis VRDN RB for University Gateway Project Series 1997 B | | ||||||||||||
| 1,800,000 | 0.020 | 03/07/16 | 1,800,000 | |||||||||||
| City of Minneapolis VRDN RB for University Gateway Project Series 2009 (Wells | | ||||||||||||
| 3,000,000 | 0.010 | 03/07/16 | 3,000,000 | |||||||||||
| Minnesota Higher Education Facilities Authority VRDN RB Refunding for | | ||||||||||||
| 5,245,000 | 0.040 | 03/07/16 | 5,245,000 | |||||||||||
|
| |||||||||||||
| 10,045,000 | ||||||||||||||
|
| |||||||||||||
| Mississippi – 2.9% | ||||||||||||||
| Mississippi Business Finance Commission Gulf Opportunity Zone VRDN RB for | | ||||||||||||
| 24,450,000 | 0.010 | 03/01/16 | 24,450,000 | |||||||||||
| Mississippi Business Finance Commission Gulf Opportunity Zone VRDN RB for | | ||||||||||||
| 15,500,000 | 0.010 | 03/01/16 | 15,500,000 | |||||||||||
| Mississippi Business Finance Commission Gulf Opportunity Zone VRDN RB for | | ||||||||||||
| 4,150,000 | 0.010 | 03/01/16 | 4,150,000 | |||||||||||
| Mississippi Business Finance Commission Gulf Opportunity Zone VRDN RB for | | ||||||||||||
| 10,150,000 | 0.010 | 03/01/16 | 10,150,000 | |||||||||||
| Mississippi Business Finance Commission Gulf Opportunity Zone VRDN RB for | | ||||||||||||
| 10,000,000 | 0.010 | 03/07/16 | 10,000,000 | |||||||||||
|
| |||||||||||||
| The accompanying notes are an integral part of these financial statements. | 37 |
FINANCIAL SQUARE TAX-FREE MONEY MARKET FUND
Schedule of Investments (continued)
February 29, 2016 (Unaudited)
| Principal Amount | Interest Rate | Maturity Date | Amortized Cost | |||||||||||
| Municipal Debt Obligations – (continued) | ||||||||||||||
| Mississippi – (continued) | ||||||||||||||
| Mississippi Business Finance Commission Gulf Opportunity Zone VRDN RB for | | ||||||||||||
| $ | 12,990,000 | 0.010 | % | 03/01/16 | $ | 12,990,000 | ||||||||
| Mississippi Business Finance Commission Gulf Opportunity Zone VRDN RB for | | ||||||||||||
| 20,480,000 | 0.010 | 03/01/16 | 20,480,000 | |||||||||||
| Mississippi Business Finance Commission Gulf Opportunity Zone VRDN RB for | | ||||||||||||
| 24,900,000 | 0.010 | 03/01/16 | 24,900,000 | |||||||||||
| Mississippi Business Finance Commission Gulf Opportunity Zone VRDN RB for | | ||||||||||||
| 3,100,000 | 0.010 | 03/01/16 | 3,100,000 | |||||||||||
|
| |||||||||||||
| 125,720,000 | ||||||||||||||
|
| |||||||||||||
| Missouri – 1.5% | ||||||||||||||
| Curators of the University of Missouri System Facilities (The) VRDN RB | | ||||||||||||
| 5,435,000 | 0.010 | 03/07/16 | 5,435,000 | |||||||||||
| Missouri Health & Educational Facilities Authority VRDN RB for Ascension | | ||||||||||||
| 21,500,000 | 0.010 | 03/07/16 | 21,500,000 | |||||||||||
| Missouri Health & Educational Facilities Authority VRDN RB Refunding for BJC | | ||||||||||||
| 18,400,000 | 0.010 | 03/07/16 | 18,400,000 | |||||||||||
| Missouri Health & Educational Facilities Authority VRDN RB Refunding for BJC | | ||||||||||||
| 19,900,000 | 0.010 | 03/07/16 | 19,900,000 | |||||||||||
|
| |||||||||||||
| 65,235,000 | ||||||||||||||
|
| |||||||||||||
| Multi-State – 2.4% | ||||||||||||||
| Federal Home Loan Mortgage Corporation VRDN RB for Multi-Family Variable | | ||||||||||||
| 15,780,000 | 0.020 | 03/07/16 | 15,780,000 | |||||||||||
| Federal Home Loan Mortgage Corporation VRDN RB for Multi-Family Variable | | ||||||||||||
| 22,890,000 | 0.020 | 03/07/16 | 22,890,000 | |||||||||||
| Federal Home Loan Mortgage Corporation VRDN RB for Multi-Family Variable | | ||||||||||||
| 10,515,000 | 0.020 | 03/07/16 | 10,515,000 | |||||||||||
| New York City Trust for Cultural Resources VRDN RB Refunding for Museum of | | ||||||||||||
| 5,995,000 | 0.060 | 03/07/16 | 5,995,000 | |||||||||||
| Nuveen AMT-Free Municipal Income Fund VRDP Series 2013-1-2190 (Deutsche | | ||||||||||||
| 43,800,000 | 0.110 | 03/07/16 | 43,800,000 | |||||||||||
| Nuveen AMT-Free Municipal Income Fund VRDP Series 2013-2-1309 (Citibank | | ||||||||||||
| 4,500,000 | 0.090 | 03/07/16 | 4,500,000 | |||||||||||
|
| |||||||||||||
| 103,480,000 | ||||||||||||||
|
| |||||||||||||
| Nevada – 1.3% | ||||||||||||||
| City of Las Vegas NV GO Refunding for Limited Tax Series 2014 A |
| ||||||||||||
| 4,470,000 | 5.000 | 05/01/16 | 4,505,481 | |||||||||||
| Clark County GO VRDN Refunding for Flood Control Floaters | | ||||||||||||
| 7,615,000 | 0.020 | 03/07/16 | 7,615,000 | |||||||||||
|
| |||||||||||||
| Municipal Debt Obligations – (continued) | ||||||||||||||
| Nevada – (continued) | ||||||||||||||
| Clark County Water Reclamation District GO VRDN Putters Series 2009-3366Z | | ||||||||||||
| $ | 6,000,000 | 0.020 | % | 03/07/16 | $ | 6,000,000 | ||||||||
| Clark County Water Reclamation District GO VRDN Putters Series 2009-3488Z | | ||||||||||||
| 6,305,000 | 0.020 | 03/07/16 | 6,305,000 | |||||||||||
| Clark County Water Reclamation District GO VRDN Putters Series 2009-3489Z | | ||||||||||||
| 7,000,000 | 0.020 | 03/07/16 | 7,000,000 | |||||||||||
| Las Vegas Valley Water District GO VRDN Floaters Refunding | | ||||||||||||
| 7,185,000 | 0.030 | 03/07/16 | 7,185,000 | |||||||||||
| State of Nevada GO VRDN Putters Series 2009-3421 (JPMorgan Chase Bank | | ||||||||||||
| 8,450,000 | 0.020 | 03/07/16 | 8,450,000 | |||||||||||
| State of Nevada Unemployment Compensation Fund RB Refunding Series 2013 |
| ||||||||||||
| 9,390,000 | 5.000 | 06/01/16 | 9,502,729 | |||||||||||
|
| |||||||||||||
| 56,563,210 | ||||||||||||||
|
| |||||||||||||
| New Hampshire – 0.5% | ||||||||||||||
| New Hampshire Health & Education Facilities Authority VRDN RB Refunding for | | ||||||||||||
| 21,115,000 | 0.010 | 03/07/16 | 21,115,000 | |||||||||||
| State of New Hampshire GO for Capital Improvements Series 2009 B |
| ||||||||||||
| 1,700,000 | 5.000 | 03/01/16 | 1,700,000 | |||||||||||
|
| |||||||||||||
| 22,815,000 | ||||||||||||||
|
| |||||||||||||
| New Jersey – 0.4% | ||||||||||||||
| New Jersey Housing & Mortgage Finance Agency Multi-Family Conduit VRDN | | ||||||||||||
| 7,000,000 | 0.480 | 09/01/16 | 7,000,000 | |||||||||||
| Rutgers The State University of New Jersey CP Series 2016 A (Wells Fargo Bank | | ||||||||||||
| 5,000,000 | 0.100 | 03/01/16 | 5,000,000 | |||||||||||
| 7,400,000 | 0.090 | 04/18/16 | 7,400,000 | |||||||||||
|
| |||||||||||||
| 19,400,000 | ||||||||||||||
|
| |||||||||||||
| New Mexico – 1.3% | ||||||||||||||
| Regents of the University of New Mexico (The) VRDN RB Refunding Subordinate | | ||||||||||||
| 18,160,000 | 0.010 | 03/07/16 | 18,160,000 | |||||||||||
| Regents of the University of New Mexico (The) VRDN RB Subordinate Lien | | ||||||||||||
| 31,020,000 | 0.010 | 03/07/16 | 31,020,000 | |||||||||||
| State of New Mexico Capital Projects GO Series 2015 |
| ||||||||||||
| 5,300,000 | 5.000 | 03/01/16 | 5,300,000 | |||||||||||
|
| |||||||||||||
| 54,480,000 | ||||||||||||||
|
| |||||||||||||
| New York – 21.2% | ||||||||||||||
| City of Binghamton GO BANS Series 2015 B |
| ||||||||||||
| 17,588,150 | 1.250 | 04/22/16 | 17,611,052 | |||||||||||
| County of Nassau GO RANS Series 2015 A |
| ||||||||||||
| 24,970,000 | 2.000 | 03/15/16 | 24,983,818 | |||||||||||
|
| |||||||||||||
| 38 | The accompanying notes are an integral part of these financial statements. |
FINANCIAL SQUARE TAX-FREE MONEY MARKET FUND
| Principal Amount | Interest Rate | Maturity Date | Amortized Cost | |||||||||||
| Municipal Debt Obligations – (continued) | ||||||||||||||
| New York – (continued) | ||||||||||||||
| County of Nassau IDA Civic Facility Refunding & Improvement VRDN RB | | ||||||||||||
| $ | 700,000 | 0.010 | % | 03/01/16 | $ | 700,000 | ||||||||
| County of Nassau Interim Finance Authority VRDN RB Refunding Series 2008 | | ||||||||||||
| 25,575,000 | 0.010 | 03/07/16 | 25,575,000 | |||||||||||
| County of Onondaga Trust for Cultural Resources VRDN RB Refunding for | | ||||||||||||
| 3,295,000 | 0.010 | 03/07/16 | 3,295,000 | |||||||||||
| Metropolitan Transportation Authority VRDN RB Refunding Series 2015 | | ||||||||||||
| 5,500,000 | 0.010 | 03/01/16 | 5,500,000 | |||||||||||
| Metropolitan Transportation Authority VRDN RB Refunding Series 2015 | | ||||||||||||
| 28,000,000 | 0.010 | 03/07/16 | 28,000,000 | |||||||||||
| Metropolitan Transportation Authority VRDN RB Refunding Series 2015 | | ||||||||||||
| 18,000,000 | 0.010 | 03/07/16 | 18,000,000 | |||||||||||
| Metropolitan Transportation Authority VRDN RB Series 2005 Subseries E-1 | | ||||||||||||
| 7,500,000 | 0.010 | 03/01/16 | 7,500,000 | |||||||||||
| Metropolitan Transportation Authority VRDN RB Series 2015 Subseries E-5 (U.S. | | ||||||||||||
| 3,000,000 | 0.010 | 03/01/16 | 3,000,000 | |||||||||||
| New York City GO VRDN Refunding Series 2008 Subseries J-6 (Landesbank | | ||||||||||||
| 31,580,000 | 0.010 | 03/01/16 | 31,580,000 | |||||||||||
| New York City GO VRDN Series 2005 Subseries F-3 (Sumitomo Mitsui Banking | | ||||||||||||
| 11,600,000 | 0.010 | 03/07/16 | 11,600,000 | |||||||||||
| New York City GO VRDN Series 2006-I Subseries I-3 (Bank of America N.A., | | ||||||||||||
| 11,600,000 | 0.010 | 03/01/16 | 11,600,000 | |||||||||||
| New York City GO VRDN Series 2011 Subseries A-4 (Bank of Tokyo-Mitsubishi | | ||||||||||||
| 10,400,000 | 0.010 | 03/07/16 | 10,400,000 | |||||||||||
| New York City Housing Development Corp. MF Hsg. VRDN RB for 245 East | | ||||||||||||
| 16,100,000 | 0.010 | 03/07/16 | 16,100,000 | |||||||||||
| New York City Housing Development Corp. MF Hsg. VRDN RB for 90 West | | ||||||||||||
| 11,800,000 | 0.010 | 03/07/16 | 11,800,000 | |||||||||||
| New York City Housing Development Corp. MF Hsg. VRDN RB for Bruckner by | | ||||||||||||
| 22,900,000 | 0.010 | 03/07/16 | 22,900,000 | |||||||||||
| New York City Housing Development Corp. MF Hsg. VRDN RB for Elliot Chelsea | | ||||||||||||
| 23,825,000 | 0.010 | 03/07/16 | 23,825,000 | |||||||||||
| New York City Housing Development Corp. MF Hsg. VRDN RB for Lexington | | ||||||||||||
| 8,200,000 | 0.010 | 03/07/16 | 8,200,000 | |||||||||||
| New York City Housing Development Corp. MF Hsg. VRDN RB for The Balton | | ||||||||||||
| 11,700,000 | 0.010 | 03/07/16 | 11,700,000 | |||||||||||
|
| |||||||||||||
| Municipal Debt Obligations – (continued) | ||||||||||||||
| New York – (continued) | ||||||||||||||
| New York City Housing Development Corp. MF Hsg. VRDN RB for W 26th Street | | ||||||||||||
| $ | 4,200,000 | 0.010 | % | 03/07/16 | $ | 4,200,000 | ||||||||
| New York City Municipal Water Finance Authority Water & Sewer System VRDN | | ||||||||||||
| 34,000,000 | 0.010 | 03/07/16 | 34,000,000 | |||||||||||
| New York City Municipal Water Finance Authority Water & Sewer System VRDN | | ||||||||||||
| 43,805,000 | 0.010 | 03/07/16 | 43,805,000 | |||||||||||
| New York City Municipal Water Finance Authority Water & Sewer System VRDN | | ||||||||||||
| 2,100,000 | 0.010 | 03/01/16 | 2,100,000 | |||||||||||
| New York City Municipal Water Finance Authority Water & Sewer System VRDN | | ||||||||||||
| 7,980,000 | 0.010 | 03/07/16 | 7,980,000 | |||||||||||
| New York City Municipal Water Finance Authority Water & Sewer System VRDN | | ||||||||||||
| 6,000,000 | 0.010 | 03/01/16 | 6,000,000 | |||||||||||
| New York City Municipal Water Finance Authority Water & Sewer System VRDN | | ||||||||||||
| 9,000,000 | 0.010 | 03/01/16 | 9,000,000 | |||||||||||
| New York City Municipal Water Finance Authority Water & Sewer System VRDN | | ||||||||||||
| 12,300,000 | 0.010 | 03/01/16 | 12,300,000 | |||||||||||
| New York City Municipal Water Finance Authority Water & Sewer System VRDN | | ||||||||||||
| 6,000,000 | 0.010 | 03/01/16 | 6,000,000 | |||||||||||
| New York City Municipal Water Finance Authority Water & Sewer System VRDN | | ||||||||||||
| 24,700,000 | 0.010 | 03/01/16 | 24,700,000 | |||||||||||
| New York City Municipal Water Finance Authority Water & Sewer System VRDN | | ||||||||||||
| 3,100,000 | 0.010 | 03/07/16 | 3,100,000 | |||||||||||
| New York City Transitional Finance Authority VRDN RB for Future Tax Secured | | ||||||||||||
| 6,300,000 | 0.020 | 03/07/16 | 6,300,000 | |||||||||||
| New York City Transitional Finance Authority VRDN RB for Future Tax Secured | | ||||||||||||
| 90,000 | 0.010 | 03/07/16 | 90,000 | |||||||||||
| New York City Transitional Finance Authority VRDN RB for Future Tax Secured | | ||||||||||||
| 600,000 | 0.010 | 03/01/16 | 600,000 | |||||||||||
| New York City Transitional Finance Authority VRDN RB for Future Tax Secured | | ||||||||||||
| 30,300,000 | 0.010 | 03/01/16 | 30,300,000 | |||||||||||
| New York City Transitional Finance Authority VRDN RB for Future Tax Secured | | ||||||||||||
| 5,000,000 | 0.010 | 03/01/16 | 5,000,000 | |||||||||||
|
| |||||||||||||
| The accompanying notes are an integral part of these financial statements. | 39 |
FINANCIAL SQUARE TAX-FREE MONEY MARKET FUND
Schedule of Investments (continued)
February 29, 2016 (Unaudited)
| Principal Amount | Interest Rate | Maturity Date | Amortized Cost | |||||||||||
| Municipal Debt Obligations – (continued) | ||||||||||||||
| New York – (continued) | ||||||||||||||
| New York City Transitional Finance Authority VRDN RB Refunding for Future Tax | | ||||||||||||
| $ | 10,000,000 | 0.010 | % | 03/07/16 | $ | 10,000,000 | ||||||||
| New York City Transitional Finance Authority VRDN RB Refunding for Future Tax | | ||||||||||||
| 1,500,000 | 0.010 | 03/01/16 | 1,500,000 | |||||||||||
| New York City Trust for Cultural Resources VRDN RB Refunding for The New | | ||||||||||||
| 8,000,000 | 0.010 | 03/07/16 | 8,000,000 | |||||||||||
| New York State Dormitory Authority Non-State Supported Debt VRDN RB for New | | ||||||||||||
| 8,770,000 | 0.020 | 03/07/16 | 8,770,000 | |||||||||||
| New York State Dormitory Authority State Personal Income Tax VRDN RB for | | ||||||||||||
| 11,060,000 | 0.020 | 03/07/16 | 11,060,000 | |||||||||||
| New York State Dormitory Authority State Personal Income Tax VRDN RB for | | ||||||||||||
| 6,660,000 | 0.020 | 03/07/16 | 6,660,000 | |||||||||||
| New York State Dormitory Authority State Personal Income Tax VRDN RB for | | ||||||||||||
| 6,360,000 | 0.020 | 03/07/16 | 6,360,000 | |||||||||||
| New York State Dormitory Authority State Personal Income Tax VRDN RB for | | ||||||||||||
| 4,130,000 | 0.020 | 03/07/16 | 4,130,000 | |||||||||||
| New York State Environmental Facilities Corp. VRDN RB Refunding for State | | ||||||||||||
| 7,245,000 | 0.020 | 03/07/16 | 7,245,000 | |||||||||||
| New York State Housing Finance Agency VRDN RB for 10 Barclay Street | | ||||||||||||
| 24,800,000 | 0.010 | 03/07/16 | 24,800,000 | |||||||||||
| New York State Housing Finance Agency VRDN RB for 100 Maiden Lane | | ||||||||||||
| 9,000,000 | 0.010 | 03/07/16 | 9,000,000 | |||||||||||
| New York State Housing Finance Agency VRDN RB for 20 River Terrace Housing | | ||||||||||||
| 5,000,000 | 0.010 | 03/07/16 | 5,000,000 | |||||||||||
| New York State Housing Finance Agency VRDN RB for 600 West 42nd Street | | ||||||||||||
| 53,775,000 | 0.010 | 03/07/16 | 53,775,000 | |||||||||||
| New York State Housing Finance Agency VRDN RB for Shore Hill Housing | | ||||||||||||
| 19,500,000 | 0.010 | 03/07/16 | 19,500,000 | |||||||||||
| New York State Housing Finance Agency VRDN RB for West 37th Street Housing | | ||||||||||||
| 25,200,000 | 0.020 | 03/07/16 | 25,200,000 | |||||||||||
| New York State Housing Finance Agency VRDN RB for West 37th Street Housing | | ||||||||||||
| 21,900,000 | 0.020 | 03/07/16 | 21,900,000 | |||||||||||
| New York State Housing Finance Agency VRDN RB Refunding for 11th Avenue | | ||||||||||||
| 8,760,000 | 0.010 | 03/07/16 | 8,760,000 | |||||||||||
| New York State Housing Finance Agency VRDN RB Refunding for Bowery Place | | ||||||||||||
| 10,000,000 | 0.010 | 03/07/16 | 10,000,000 | |||||||||||
|
| |||||||||||||
| Municipal Debt Obligations – (continued) | ||||||||||||||
| New York – (continued) | ||||||||||||||
| New York State Housing Finance Agency VRDN RB Refunding for Taconic | | ||||||||||||
| $ | 19,000,000 | 0.010 | % | 03/07/16 | $ | 19,000,000 | ||||||||
| New York State Liberty Development Corp. VRDN RB Refunding for 7 World | | ||||||||||||
| 7,000,000 | 0.160 | 03/07/16 | 7,000,000 | |||||||||||
| New York State Local Government Assistance Corp. VRDN RB Refunding for | | ||||||||||||
| 3,000,000 | 0.010 | 03/07/16 | 3,000,000 | |||||||||||
| New York State Local Government Assistance Corp. VRDN RB Refunding for | | ||||||||||||
| 20,785,000 | 0.010 | 03/07/16 | 20,785,000 | |||||||||||
| New York State Local Government Assistance Corp. VRDN RB Refunding | | ||||||||||||
| 2,100,000 | 0.130 | 03/07/16 | 2,100,000 | |||||||||||
| New York State Urban Development Corp. RB for State Personal Income Tax | | ||||||||||||
| 450,000 | 5.000 | 03/15/16 | 450,793 | |||||||||||
| New York State Urban Development Corp. VRDN RB Refunding for State | | ||||||||||||
| 18,200,000 | 0.010 | 03/07/16 | 18,200,000 | |||||||||||
| Northport-East Northport Union Free School District GO TANS Series 2015 (State | | ||||||||||||
| 32,500,000 | 2.000 | 06/27/16 | 32,672,773 | |||||||||||
| Port Authority of New York & New Jersey VRDN RB ROCS-RR-II-R-664 | | ||||||||||||
| 100,000 | 0.020 | 03/07/16 | 100,000 | |||||||||||
| Triborough Bridge & Tunnel Authority VRDN RB Refunding General Series 2001 | | ||||||||||||
| 11,700,000 | 0.010 | 03/07/16 | 11,700,000 | |||||||||||
| Triborough Bridge & Tunnel Authority VRDN RB Refunding General Series 2002 | | ||||||||||||
| 39,100,000 | 0.010 | 03/01/16 | 39,100,000 | |||||||||||
| Triborough Bridge & Tunnel Authority VRDN RB Refunding General | | ||||||||||||
| 36,425,000 | 0.010 | 03/07/16 | 36,425,000 | |||||||||||
|
| |||||||||||||
| 921,538,436 | ||||||||||||||
|
| |||||||||||||
| North Carolina – 3.4% | ||||||||||||||
| City of Raleigh Combined Enterprise System VRDN RB Series 2008 A RMKT | | ||||||||||||
| 8,610,000 | 0.010 | 03/07/16 | 8,610,000 | |||||||||||
| City of Raleigh Combined Enterprise System VRDN RB Series 2008 B RMKT | | ||||||||||||
| 5,575,000 | 0.010 | 03/07/16 | 5,575,000 | |||||||||||
| County of Guilford GO VRDN Series 2005 B (Wells Fargo Bank N.A., SPA) |
| ||||||||||||
| 6,880,000 | 0.020 | 03/07/16 | 6,880,000 | |||||||||||
| County of Mecklenburg GO Refunding Series 2009 C |
| ||||||||||||
| 3,285,000 | 5.000 | 03/01/16 | 3,285,000 | |||||||||||
| County of Union Enterprise System VRDN RB Series 2009 (U.S. Bank N.A., LOC) |
| ||||||||||||
| 16,985,000 | 0.010 | 03/07/16 | 16,985,000 | |||||||||||
| North Carolina Capital Facilities Finance Agency VRDN RB Refunding for Duke | | ||||||||||||
| 8,000,000 | 0.020 | 03/07/16 | 8,000,000 | |||||||||||
|
| |||||||||||||
| 40 | The accompanying notes are an integral part of these financial statements. |
FINANCIAL SQUARE TAX-FREE MONEY MARKET FUND
| Principal Amount | Interest Rate | Maturity Date | Amortized Cost | |||||||||||
| Municipal Debt Obligations – (continued) | ||||||||||||||
| North Carolina – (continued) | ||||||||||||||
| North Carolina Capital Facilities Finance Agency VRDN RB Refunding for Duke | | ||||||||||||
| $ | 11,000,000 | 0.020 | % | 03/07/16 | $ | 11,000,000 | ||||||||
| North Carolina Capital Facilities Finance Agency VRDN RB Refunding for Wake | | ||||||||||||
| 19,020,000 | 0.020 | 03/07/16 | 19,020,000 | |||||||||||
| North Carolina State University Raleigh VRDN RB Refunding Series 2003 B | | ||||||||||||
| 6,385,000 | 0.020 | 03/07/16 | 6,385,000 | |||||||||||
| Raleigh Durham Airport Authority VRDN RB Refunding Series 2008 C RMKT | | ||||||||||||
| 19,100,000 | 0.010 | 03/07/16 | 19,100,000 | |||||||||||
| University of North Carolina Hospital at Chapel Hill VRDN RB Series 2001 B | | ||||||||||||
| 45,100,000 | 0.010 | 03/01/16 | 45,100,000 | |||||||||||
|
| |||||||||||||
| 149,940,000 | ||||||||||||||
|
| |||||||||||||
| North Dakota – 1.5% | ||||||||||||||
| County of Mercer Pollution Control Refunding for Basin Electric Power | | ||||||||||||
| 64,925,000 | 0.060 | 04/01/16 | 64,925,000 | |||||||||||
|
| |||||||||||||
| Ohio – 3.9% | ||||||||||||||
| Franklin County Hospital VRDN RB Refunding for Nationwide Children’s | | ||||||||||||
| 18,120,000 | 0.010 | 03/07/16 | 18,120,000 | |||||||||||
| Franklin County Hospital VRDN RB Refunding for Nationwide Children’s | | ||||||||||||
| 24,200,000 | 0.010 | 03/07/16 | 24,200,000 | |||||||||||
| Ohio Higher Educational Facility Commission CP for Case Western Reserve | | ||||||||||||
| 38,500,000 | 0.070 | 04/19/16 | 38,500,000 | |||||||||||
| Ohio State Hospital Facility VRDN RB for Cleveland Clinic Health System Putters | | ||||||||||||
| 6,245,000 | 0.020 | 03/07/16 | 6,245,000 | |||||||||||
| Ohio State Hospital Facility VRDN RB Refunding for Cleveland Clinic Health | | ||||||||||||
| 7,100,000 | 0.020 | 03/07/16 | 7,100,000 | |||||||||||
| Ohio State University VRDN RB Series 2001 |
| ||||||||||||
| 17,700,000 | 0.010 | 03/07/16 | 17,700,000 | |||||||||||
| Ohio State University VRDN RB Series 2005 B |
| ||||||||||||
| 7,000,000 | 0.010 | 03/07/16 | 7,000,000 | |||||||||||
| Ohio State University VRDN RB Series 2014 B-2 |
| ||||||||||||
| 25,000,000 | 0.010 | 03/07/16 | 25,000,000 | |||||||||||
| State of Ohio GO for Common Schools Series 2015 B |
| ||||||||||||
| 5,000,000 | 2.000 | 06/15/16 | 5,025,712 | |||||||||||
| State of Ohio GO VRDN for Common Schools Series 2006 C |
| ||||||||||||
| 4,585,000 | 0.010 | 03/07/16 | 4,585,000 | |||||||||||
| State of Ohio GO VRDN Refunding for Infrastructure Improvement Series 2004 A |
| ||||||||||||
| 14,800,000 | 0.010 | 03/07/16 | 14,800,000 | |||||||||||
|
| |||||||||||||
| 168,275,712 | ||||||||||||||
|
| |||||||||||||
| Oklahoma – 0.2% | ||||||||||||||
| Oklahoma State Turnpike Authority VRDN RB Floater Certificates Refunding | | ||||||||||||
| 9,345,000 | 0.020 | 03/07/16 | 9,345,000 | |||||||||||
|
| |||||||||||||
| Municipal Debt Obligations – (continued) | ||||||||||||||
| Oregon – 0.8% | ||||||||||||||
| Metro GO Refunding Series 2014 |
| ||||||||||||
| $ | 9,965,000 | 2.000 | % | 06/01/16 | $ | 10,008,220 | ||||||||
| State of Oregon GO VRDN for Veterans’ Welfare Series 2005-84 RMKT (Bank of | | ||||||||||||
| 19,355,000 | 0.010 | 03/07/16 | 19,355,000 | |||||||||||
| State of Oregon GO VRDN for Veterans’ Welfare Series 2006-86-RMKT (U.S. | | ||||||||||||
| 5,030,000 | 0.010 | 03/01/16 | 5,030,000 | |||||||||||
|
| |||||||||||||
| 34,393,220 | ||||||||||||||
|
| |||||||||||||
| Pennsylvania – 2.4% | ||||||||||||||
| Allegheny County Hospital Development Authority VRDN RB for University of | | ||||||||||||
| 60,000,000 | 0.110 | 03/01/16 | 60,000,000 | |||||||||||
| Allegheny County Hospital Development Authority VRDN RB Refunding for | | ||||||||||||
| 7,000,000 | 0.020 | 03/07/16 | 7,000,000 | |||||||||||
| Allegheny County Hospital Development Authority VRDN RB Refunding for | | ||||||||||||
| 20,000,000 | 0.020 | 03/07/16 | 20,000,000 | |||||||||||
| Butler County General Authority VRDN RB Refunding for Allegheny School | | ||||||||||||
| 7,000,000 | 0.010 | 03/07/16 | 7,000,000 | |||||||||||
| Delaware County Industrial Development Authority VRDN RB Refunding for | | ||||||||||||
| 10,000,000 | 0.010 | 03/01/16 | 10,000,000 | |||||||||||
|
| |||||||||||||
| 104,000,000 | ||||||||||||||
|
| |||||||||||||
| South Carolina – 1.1% | ||||||||||||||
| Columbia Waterworks & Sewer System VRDN RB Series 2009 RMKT (Sumitomo | | ||||||||||||
| 20,000,000 | 0.010 | 03/07/16 | 20,000,000 | |||||||||||
| South Carolina Public Service Authority CP Series 2016 CC (U.S. Bank N.A., LOC) |
| ||||||||||||
| 23,791,000 | 0.410 | 03/09/16 | 23,791,000 | |||||||||||
| State of South Carolina GO Refunding for State Capital Improvements | | ||||||||||||
| 2,700,000 | 5.000 | 03/01/16 | 2,700,000 | |||||||||||
| State of South Carolina GO Refunding for State School Facilities Series 2011 | | ||||||||||||
| 3,430,000 | 5.000 | 03/01/16 | 3,430,000 | |||||||||||
|
| |||||||||||||
| 49,921,000 | ||||||||||||||
|
| |||||||||||||
| Tennessee – 1.3% | ||||||||||||||
| State of Tennessee GO CP Series 2016 A (Tennessee Consolidated Retirement | | ||||||||||||
| 35,000,000 | 0.080 | 03/02/16 | 35,000,000 | |||||||||||
| 20,000,000 | 0.080 | 03/16/16 | 20,000,000 | |||||||||||
|
| |||||||||||||
| 55,000,000 | ||||||||||||||
|
| |||||||||||||
| The accompanying notes are an integral part of these financial statements. | 41 |
FINANCIAL SQUARE TAX-FREE MONEY MARKET FUND
Schedule of Investments (continued)
February 29, 2016 (Unaudited)
| Principal Amount | Interest Rate | Maturity Date | Amortized Cost | |||||||||||
| Municipal Debt Obligations – (continued) | ||||||||||||||
| Texas – 9.8% | ||||||||||||||
| Austin Independent School District CP Series 2016 A (Mizuho Corporate Bank, | | ||||||||||||
| $ | 15,000,000 | 0.060 | % | 03/01/16 | $ | 15,000,000 | ||||||||
| Board of Regents of the Texas State University System RB Refunding | | ||||||||||||
| 5,815,000 | 2.500 | 03/15/16 | 5,820,062 | |||||||||||
| City of Austin Hotel Occupancy Tax VRDN RB Refunding Subordinate Lien | | ||||||||||||
| 35,075,000 | 0.010 | 03/07/16 | 35,075,000 | |||||||||||
| City of Houston Airport System VRDN RB Floater Certificates Refunding | | ||||||||||||
| 8,330,000 | 0.020 | 03/07/16 | 8,330,000 | |||||||||||
| City of Houston GO Refunding for Public Improvements Series 2013 A |
| ||||||||||||
| 1,345,000 | 4.000 | 03/01/16 | 1,345,000 | |||||||||||
| County of Fort Bend GO Refunding Series 2015 A |
| ||||||||||||
| 1,170,000 | 2.000 | 03/01/16 | 1,170,000 | |||||||||||
| Dallastown Area School District GO VRDN Refunding Series 2015 (State Aid | | ||||||||||||
| 10,000,000 | 1.251 | 04/15/16 | 10,011,379 | |||||||||||
| Dickinson ISD GO VRDN Municipal Trust Receipts Refunding Series 2000-SGA94 | | ||||||||||||
| 13,350,000 | 0.040 | 03/01/16 | 13,350,000 | |||||||||||
| El Paso Waterworks & Sewer System CP Series 2016 A (JPMorgan Chase Bank | | ||||||||||||
| 5,000,000 | 0.060 | 03/01/16 | 5,000,000 | |||||||||||
| Grand Prairie ISD Eclipse Funding Trust GO VRDN Series 2007-0067 (PSF-GTD) | | ||||||||||||
| 10,065,000 | 0.020 | 03/07/16 | 10,065,000 | |||||||||||
| Harris County Cultural Education Facilities Finance Corp. CP Refunding for | | ||||||||||||
| 25,000,000 | 0.220 | 04/05/16 | 25,000,000 | |||||||||||
| Harris County Cultural Education Facilities Finance Corp. CP Refunding for | | ||||||||||||
| 10,000,000 | 0.220 | 04/05/16 | 10,000,000 | |||||||||||
| Harris County Cultural Education Facilities Finance Corp. VRDN RB for Memorial | | ||||||||||||
| 10,000,000 | 0.010 | 03/07/16 | 10,000,000 | |||||||||||
| Harris County Cultural Education Facilities Finance Corp. VRDN RB Refunding | | ||||||||||||
| 4,275,000 | 0.410 | 06/01/16 | 4,277,358 | |||||||||||
| Harris County Cultural Education Facilities Finance Corp. VRDN RB Refunding | | ||||||||||||
| 11,050,000 | 0.010 | 03/07/16 | 11,050,000 | |||||||||||
| Harris County Toll Road Authority VRDN RB Putters Series 2009-3425 | | ||||||||||||
| 6,845,000 | 0.020 | 03/07/16 | 6,845,000 | |||||||||||
| Mesquite ISD GO VRDN for School Building Series 2003 A (PSF-GTD) (JPMorgan | | ||||||||||||
| 18,745,000 | 0.020 | 03/07/16 | 18,745,000 | |||||||||||
| North Central Texas Health Facilities Development Corp. Hospital for Children’s | | ||||||||||||
| 20,000,000 | 0.020 | 03/07/16 | 20,000,000 | |||||||||||
| San Antonio Water System CP Series 2016 A (Bank of Tokyo Mitsubishi, LOC) |
| ||||||||||||
| 18,000,000 | 0.040 | 04/01/16 | 18,000,000 | |||||||||||
|
| |||||||||||||
| Municipal Debt Obligations – (continued) | ||||||||||||||
| Texas – (continued) | ||||||||||||||
| State of Texas GO VRDN for Transportation Commission Mobility Fund Floaters | | ||||||||||||
| $ | 6,074,000 | 0.030 | % | 03/07/16 | $ | 6,074,000 | ||||||||
| State of Texas GO VRDN for Veterans Series 2014 D (State Street Bank & | | ||||||||||||
| 4,000,000 | 0.010 | 03/07/16 | 4,000,000 | |||||||||||
| State of Texas GO VRDN for Veterans Series 2015 B (Mizuho Bank, Ltd., SPA) |
| ||||||||||||
| 19,870,000 | 0.010 | 03/07/16 | 19,870,000 | |||||||||||
| State of Texas GO VRDN for Veterans Series 2016 (Landesbank Hessen- | | ||||||||||||
| 62,500,000 | 0.020 | 03/07/16 | 62,500,000 | |||||||||||
| Tarrant County Cultural Education Facilities Finance Corp. VRDN RB for Texas | | ||||||||||||
| 31,500,000 | 0.010 | 03/07/16 | 31,500,000 | |||||||||||
| Tarrant County Cultural Education Facilities Finance Corp. VRDN RB Refunding | | ||||||||||||
| 6,250,000 | 0.010 | 03/07/16 | 6,250,000 | |||||||||||
| Tarrant County Cultural Education Facilities Finance Corp. VRDN RB Refunding | | ||||||||||||
| 24,070,000 | 0.010 | 03/07/16 | 24,070,000 | |||||||||||
| Texas State GO VRDN Refunding for Veterans Series 2011 C (Landesbank | | ||||||||||||
| 36,215,000 | 0.020 | 03/07/16 | 36,215,000 | |||||||||||
| Texas State Transportation Commission VRDN RB Putters Series 2008-2563 | | ||||||||||||
| 6,665,000 | 0.020 | 03/07/16 | 6,665,000 | |||||||||||
|
| |||||||||||||
| 426,227,799 | ||||||||||||||
|
| |||||||||||||
| Utah – 2.2% | ||||||||||||||
| University of Utah CP Series 2013-B |
| ||||||||||||
| 50,000,000 | 0.390 | 03/03/16 | 50,000,000 | |||||||||||
| University of Utah VRDN RB Floaters Series 2015-XM-0056 (Citibank N.A., | | ||||||||||||
| 9,490,000 | 0.020 | 03/07/16 | 9,490,000 | |||||||||||
| Utah County Hospital VRDN RB for IHC Health Services, Inc. Series 2002 B | | ||||||||||||
| 21,600,000 | 0.010 | 03/07/16 | 21,600,000 | |||||||||||
| Utah County Hospital VRDN RB for IHC Health Services, Inc. Series 2002 C | | ||||||||||||
| 15,000,000 | 0.010 | 03/07/16 | 15,000,000 | |||||||||||
|
| |||||||||||||
| 96,090,000 | ||||||||||||||
|
| |||||||||||||
| Virginia – 3.3% | ||||||||||||||
| Commonwealth of Virginia GO Refunding Series 2014 B |
| ||||||||||||
| 9,685,000 | 4.000 | 06/01/16 | 9,776,890 | |||||||||||
| Fairfax County IDA VRDN RB for Fairfax Hospital Series 1988 A (Northern | | ||||||||||||
| 2,900,000 | 0.030 | 03/07/16 | 2,900,000 | |||||||||||
| Fairfax County IDA VRDN RB for Fairfax Hospital Series 1988 B (Northern | | ||||||||||||
| 2,800,000 | 0.030 | 03/07/16 | 2,800,000 | |||||||||||
| Fairfax County IDA VRDN RB for Inova Health System Series 2000 (Branch | | ||||||||||||
| 5,900,000 | 0.020 | 03/07/16 | 5,900,000 | |||||||||||
|
| |||||||||||||
| 42 | The accompanying notes are an integral part of these financial statements. |
FINANCIAL SQUARE TAX-FREE MONEY MARKET FUND
| Principal Amount | Interest Rate | Maturity Date | Amortized Cost | |||||||||||
| Municipal Debt Obligations – (continued) | ||||||||||||||
| Virginia – (continued) | ||||||||||||||
| Fairfax County IDA VRDN RB Refunding for Inova Health System Series 2005 | | ||||||||||||
| $ | 9,305,000 | 0.030 | % | 03/07/16 | $ | 9,305,000 | ||||||||
| Fairfax County IDA VRDN RB Refunding for Inova Health System Series 2005 | | ||||||||||||
| 3,600,000 | 0.030 | 03/07/16 | 3,600,000 | |||||||||||
| Loudoun County IDA VRDN RB for Howard Hughes Medical Institute | | ||||||||||||
| 23,100,000 | 0.010 | 03/07/16 | 23,100,000 | |||||||||||
| Loudoun County IDA VRDN RB for Howard Hughes Medical Institute | | ||||||||||||
| 14,840,000 | 0.010 | 03/07/16 | 14,840,000 | |||||||||||
| Loudoun County IDA VRDN RB for Howard Hughes Medical Institute | | ||||||||||||
| 32,950,000 | 0.010 | 03/07/16 | 32,950,000 | |||||||||||
| University of Virginia VRDN RB Putters Refunding Series 2008-3188Z (JPMorgan | | ||||||||||||
| 15,010,000 | 0.010 | 03/01/16 | 15,010,000 | |||||||||||
| Virginia College Building Authority Educational Facilities VRDN RB Refunding | | ||||||||||||
| 15,000,000 | 0.010 | 03/07/16 | 15,000,000 | |||||||||||
| Virginia Commonwealth Transportation Board VRDN RB Floater Certificates | | ||||||||||||
| 6,775,000 | 0.020 | 03/07/16 | 6,775,000 | |||||||||||
|
| |||||||||||||
| 141,956,890 | ||||||||||||||
|
| |||||||||||||
| Washington – 3.3% | ||||||||||||||
| Central Puget Sound Regional Transportation Authority Sales Tax VRDN RB | | ||||||||||||
| 8,380,000 | 0.010 | 03/01/16 | 8,380,000 | |||||||||||
| County of King Multi-Modal Limited Tax GO VRDN Series 2010 B (State Street | | ||||||||||||
| 13,735,000 | 0.010 | 03/07/16 | 13,735,000 | |||||||||||
| County of King Sewer Revenue VRDN RB Eagle Series 2014-0047 Class A (AGM) | | ||||||||||||
| 14,850,000 | 0.020 | 03/07/16 | 14,850,000 | |||||||||||
| County of King Sewer Revenue VRDN RB Junior Lien Series 2001 A (Landesbank | | ||||||||||||
| 20,000,000 | 0.010 | 03/07/16 | 20,000,000 | |||||||||||
| County of King Sewer Revenue VRDN RB Junior Lien Series 2001 B (Landesbank | | ||||||||||||
| 12,000,000 | 0.010 | 03/07/16 | 12,000,000 | |||||||||||
| Energy Northwest RB Refunding for Project 1 Series 2007 C |
| ||||||||||||
| 1,050,000 | 5.000 | 07/01/16 | 1,066,573 | |||||||||||
| Energy Northwest RB Refunding for Project 1 Series 2008 A |
| ||||||||||||
| 2,490,000 | 5.250 | 07/01/16 | 2,530,743 | |||||||||||
| Energy Northwest RB Refunding for Project 3 Series 2007 C |
| ||||||||||||
| 2,255,000 | 5.000 | 07/01/16 | 2,290,736 | |||||||||||
| Snohomish County School District No. 15 Edmonds GO Series 2006 (NATL SCH | | ||||||||||||
| 6,250,000 | 5.000 | 06/01/16 | 6,322,336 | |||||||||||
| State of Washington GO VRDN Floaters Series 2015-XF-2114 (Citibank N.A., | | ||||||||||||
| 4,700,000 | 0.020 | 03/07/16 | 4,700,000 | |||||||||||
|
| |||||||||||||
| Municipal Debt Obligations – (continued) | ||||||||||||||
| Washington – (continued) | ||||||||||||||
| State of Washington GO VRDN Putters Series 2008-2640 (JPMorgan Chase Bank | | ||||||||||||
| $ | 9,995,000 | 0.020 | % | 03/07/16 | $ | 9,995,000 | ||||||||
| State of Washington GO VRDN Putters Series 2009-3538 (JPMorgan Chase Bank | | ||||||||||||
| 10,000,000 | 0.020 | 03/07/16 | 10,000,000 | |||||||||||
| State of Washington GO VRDN ROCS RR-II R-11889 Series 2010 (Citibank N.A., | | ||||||||||||
| 2,250,000 | 0.010 | 03/07/16 | 2,250,000 | |||||||||||
| Washington Health Care Facilities Authority VRDN RB Refunding for Providence | | ||||||||||||
| 16,060,000 | 0.040 | 03/07/16 | 16,060,000 | |||||||||||
| Washington State Housing Finance Commission VRDN RB for Discovery Heights | | ||||||||||||
| 20,205,000 | 0.020 | 03/07/16 | 20,205,000 | |||||||||||
|
| |||||||||||||
| 144,385,388 | ||||||||||||||
|
| |||||||||||||
| Wisconsin – 0.8% | ||||||||||||||
| Kenosha Unified School District NO. 1 TRANS Series 2015 |
| ||||||||||||
| 15,000,000 | 1.500 | 09/22/16 | 15,087,780 | |||||||||||
| State of Wisconsin GO Series 2011 A |
| ||||||||||||
| 220,000 | 5.000 | 05/01/16 | 221,643 | |||||||||||
| State of Wisconsin GO VRDN Floaters Series 2008-2927 (Credit Suisse, LIQ)(a) |
| ||||||||||||
| 7,200,000 | 0.010 | 03/07/16 | 7,200,000 | |||||||||||
| Wisconsin Health & Educational Facilities Authority VRDN RB Refunding for | | ||||||||||||
| 5,275,000 | 0.040 | 03/07/16 | 5,275,000 | |||||||||||
| Wisconsin Health & Educational Facilities Authority VRDN RB Refunding for | | ||||||||||||
| 6,665,000 | 0.020 | 03/07/16 | 6,665,000 | |||||||||||
|
| |||||||||||||
| 34,449,423 | ||||||||||||||
|
| |||||||||||||
| Wyoming – 0.5% | ||||||||||||||
| County of Lincoln PCRB Refunding Exxon Mobil Project Series 2014 (GTY | | ||||||||||||
| 20,900,000 | 0.010 | 03/01/16 | 20,900,000 | |||||||||||
|
| |||||||||||||
| TOTAL INVESTMENTS – 101.7% | $ | 4,426,982,290 | ||||||||||||
|
| |||||||||||||
|
| LIABILITIES IN EXCESS OF OTHER ASSETS – (1.7)% |
| (75,848,653 | ) | ||||||||||
|
| |||||||||||||
| NET ASSETS – 100.0% | $ | 4,351,133,637 | ||||||||||||
|
| |||||||||||||
| The percentage shown for each investment category reflects the value of investments in that category as a percentage of net assets. | ||
(a) | Security not registered under the Securities Act of 1933, as amended. Such securities may be deemed liquid by the Investment Adviser. At February 29, 2016, these securities amounted to $864,969,000 or approximately 19.9% of net assets. | |
(b) | All or a portion represents a forward commitment. | |
| Interest rates represent either the stated coupon rate, or for floating rate securities, the current reset rate, which is based upon current interest rate indices. | ||
| The accompanying notes are an integral part of these financial statements. | 43 |
FINANCIAL SQUARE TAX-FREE MONEY MARKET FUND
Schedule of Investments (continued)
February 29, 2016 (Unaudited)
| Maturity dates represent either the final legal maturity date on the security, the demand date for puttable securities, or the prerefunded date for those types of securities. | ||
| ||
Investment Abbreviations: | ||
AGM | —Insured by Assured Guaranty Municipal Corp. | |
AMT | —Alternative Minimum Tax (subject to) | |
BANS | —Bond Anticipation Notes | |
BHAC | —Berkshire Hathaway Assurance Corp. | |
CP | —Commercial Paper | |
CR | —Custodial Receipts | |
FGIC | —Insured by Financial Guaranty Insurance Co. | |
FHLMC | —Insured by Federal Home Loan Mortgage Corp. | |
FNMA | —Insured by Federal National Mortgage Association | |
GO | —General Obligation | |
GTD | —Guaranteed | |
GTY AGMT | —Guaranty Agreement | |
IDA | —Industrial Development Agency | |
IDB | —Industrial Development Board | |
IHC | —Intermountain Health Care | |
ISD | —Independent School District | |
LIQ | —Liquidity Agreement | |
LOC | —Letter of Credit | |
MF Hsg | —Multi-Family Housing | |
NATL-RE | —National Reinsurance Corp. | |
PCRB | —Pollution Control Revenue Bond | |
PSF-GTD | —Guaranteed by Permanent School Fund | |
RANS | —Revenue Anticipation Notes | |
RB | —Revenue Bond | |
RMKT | —Remarketed | |
ROCS | —Reset Option Certificates | |
RR | —Revenue Refunding | |
SCH BD | ||
GTY | —School Bond Guaranty | |
SIFMA | —Securities Industry and Financial Market Association | |
SLOC | —Stand-by Letter of Credit | |
SPA | —Stand-by Purchase Agreement | |
SPEARS | —Short Puttable Exempt Adjustable Receipts | |
TANS | —Tax Anticipation Notes | |
TRANS | —Tax Revenue Anticipation Notes | |
VRDN | —Variable Rate Demand Notes | |
VRDP | —Variable Rate Demand Preferred Shares | |
| ||
| 44 | The accompanying notes are an integral part of these financial statements. |
FINANCIAL SQUARE TREASURY INSTRUMENTS FUND
Schedule of Investments
February 29, 2016 (Unaudited)
Principal Amount | Interest Rate | Maturity Date | Amortized Cost | |||||||||||
| U.S. Treasury Obligations – 101.5% | ||||||||||||||
| United States Treasury Bills |
| ||||||||||||
| $ | 125,000,000 | 0.142 | % | 03/03/16 | $ | 124,999,028 | ||||||||
| 213,000,000 | 0.173 | 03/03/16 | 212,997,988 | |||||||||||
| 4,061,800,000 | 0.275 | 03/03/16 | 4,061,739,073 | |||||||||||
| 97,500,000 | 0.285 | 03/03/16 | 97,498,483 | |||||||||||
| 5,500,000,000 | 0.270 | 03/10/16 | 5,499,635,627 | |||||||||||
| 20,000,000 | 0.269 | 03/17/16 | 19,997,645 | |||||||||||
| 4,000,000,000 | 0.275 | 03/17/16 | 3,999,520,000 | |||||||||||
| 2,905,000,000 | 0.290 | 03/24/16 | 2,904,471,048 | |||||||||||
| 29,000,000 | 0.564 | 06/09/16 | 28,955,292 | |||||||||||
| 20,000,000 | 0.579 | 06/09/16 | 19,968,333 | |||||||||||
| 29,000,000 | 0.434 | 08/18/16 | 28,941,799 | |||||||||||
| 1,768,500,000 | 0.464 | 08/25/16 | 1,764,543,718 | |||||||||||
| 1,231,500,000 | 0.481 | (a) | 09/01/16 | 1,228,511,557 | ||||||||||
| United States Treasury Bond |
| ||||||||||||
| 700,000,000 | 7.250 | 05/15/16 | 709,868,120 | |||||||||||
| United States Treasury Floating Rate Notes |
| ||||||||||||
| 6,900,600,000 | 0.389 | (b) | 04/30/16 | 6,901,069,551 | ||||||||||
| 6,345,420,000 | 0.390 | (b) | 07/31/16 | 6,346,098,881 | ||||||||||
| 3,409,000,000 | 0.373 | (b) | 10/31/16 | 3,408,702,428 | ||||||||||
| 480,000,000 | 0.404 | (b) | 01/31/17 | 479,995,522 | ||||||||||
| 995,000,000 | 0.394 | (b) | 04/30/17 | 994,632,921 | ||||||||||
| 300,000,000 | 0.397 | (b) | 07/31/17 | 299,750,982 | ||||||||||
| 125,000,000 | 0.488 | (b) | 10/31/17 | 124,999,999 | ||||||||||
| United States Treasury Notes |
| ||||||||||||
| 2,514,700,000 | 0.375 | 03/15/16 | 2,514,804,954 | |||||||||||
| 114,000,000 | 0.375 | 03/31/16 | 114,000,490 | |||||||||||
| 287,500,000 | 2.250 | 03/31/16 | 287,962,016 | |||||||||||
| 95,000,000 | 2.375 | (a) | 03/31/16 | 95,159,570 | ||||||||||
| 11,000,000 | 0.375 | 04/30/16 | 11,000,939 | |||||||||||
| 91,000,000 | 2.000 | 04/30/16 | 91,239,582 | |||||||||||
| 100,000,000 | 2.625 | 04/30/16 | 100,375,000 | |||||||||||
| 384,400,000 | 5.125 | 05/15/16 | 388,161,701 | |||||||||||
| 21,000,000 | 3.250 | 05/31/16 | 21,143,150 | |||||||||||
| 133,000,000 | 0.500 | 06/15/16 | 133,054,734 | |||||||||||
| 269,000,000 | 3.250 | 06/30/16 | 271,311,536 | |||||||||||
| 800,100,000 | 0.625 | 07/15/16 | 800,559,167 | |||||||||||
| 171,500,000 | 0.500 | 07/31/16 | 171,482,476 | |||||||||||
| 515,000,000 | 1.500 | 07/31/16 | 517,162,031 | |||||||||||
| 1,730,540,000 | 3.250 | 07/31/16 | 1,749,508,012 | |||||||||||
| 660,000,000 | 0.625 | 08/15/16 | 660,366,612 | |||||||||||
| 1,596,000,000 | 4.875 | 08/15/16 | 1,626,750,930 | |||||||||||
| 102,000,000 | 0.500 | 08/31/16 | 101,907,536 | |||||||||||
| 496,000,000 | 1.000 | 08/31/16 | 497,003,452 | |||||||||||
| 1,792,990,000 | 3.000 | 08/31/16 | 1,814,635,362 | |||||||||||
| 1,021,300,000 | 0.875 | 09/15/16 | 1,023,125,421 | |||||||||||
| 660,000,000 | 0.500 | 09/30/16 | 659,935,776 | |||||||||||
| 211,000,000 | 1.000 | 09/30/16 | 211,612,588 | |||||||||||
| 645,000,000 | 3.000 | 09/30/16 | 654,178,307 | |||||||||||
| 565,000,000 | 1.000 | 10/31/16 | 566,755,825 | |||||||||||
| 250,000,000 | 3.125 | 10/31/16 | 254,317,096 | |||||||||||
| 181,500,000 | 4.625 | 11/15/16 | 186,457,382 | |||||||||||
|
| |||||||||||||
| TOTAL INVESTMENTS – 101.5% | $ | 54,780,869,640 | ||||||||||||
|
| |||||||||||||
| | LIABILITIES IN EXCESS OF OTHER ASSETS – (1.5)% | | (798,910,022 | ) | ||||||||||
|
| |||||||||||||
| NET ASSETS – 100.0% | $ | 53,981,959,618 | ||||||||||||
|
| |||||||||||||
The percentage shown for each investment category reflects the value of investments in that category as a percentage of net assets. | ||
(a) | All or a portion represents a forward commitment. | |
(b) | Variable or floating rate security. Interest rate disclosed is that which is in effect at February 29, 2016. | |
Interest rates represent either the stated coupon rate, annualized yield on date of purchase for discounted securities, or, for floating rate securities, the current reset rate, which is based upon interest rate indices.
Maturity dates represent either the final legal maturity date on the security, the demand date for puttable securities, or the prerefunded date for those types of securities.
| The accompanying notes are an integral part of these financial statements. | 45 |
FINANCIAL SQUARE TREASURY OBLIGATIONS FUND
Schedule of Investments
February 29, 2016 (Unaudited)
Principal Amount | Interest Rate | Maturity Date | Amortized Cost | |||||||||||
| U.S. Treasury Obligations – 53.7% | ||||||||||||||
| United States Treasury Bills |
| ||||||||||||
| $ | 38,000,000 | 0.564 | % | 06/09/16 | $ | 37,941,417 | ||||||||
| 40,000,000 | 0.580 | 06/09/16 | 39,936,667 | |||||||||||
| 237,500,000 | 0.464 | 08/25/16 | 236,968,693 | |||||||||||
| 312,500,000 | 0.481 | (a) | 09/01/16 | 311,741,666 | ||||||||||
| United States Treasury Bond |
| ||||||||||||
| 296,500,000 | 7.250 | 05/15/16 | 300,630,231 | |||||||||||
| United States Treasury Floating Rate Notes |
| ||||||||||||
| 561,700,000 | 0.389 | (b) | 04/30/16 | 561,746,381 | ||||||||||
| 299,550,000 | 0.390 | (b) | 07/31/16 | 299,602,986 | ||||||||||
| 1,005,000,000 | 0.404 | (b) | 01/31/17 | 1,005,060,434 | ||||||||||
| 445,000,000 | 0.394 | (b) | 04/30/17 | 444,692,872 | ||||||||||
| 200,000,000 | 0.397 | (b) | 07/31/17 | 199,876,654 | ||||||||||
| 170,000,000 | 0.488 | (b) | 10/31/17 | 169,809,316 | ||||||||||
| United States Treasury Notes |
| ||||||||||||
| 28,000,000 | 0.375 | 03/31/16 | 27,999,832 | |||||||||||
| 109,500,000 | 2.250 | 03/31/16 | 109,675,374 | |||||||||||
| 27,000,000 | 0.375 | 04/30/16 | 26,999,249 | |||||||||||
| 70,500,000 | 2.000 | 04/30/16 | 70,683,171 | |||||||||||
| 145,000,000 | 0.250 | 05/15/16 | 144,951,909 | |||||||||||
| 315,700,000 | 5.125 | 05/15/16 | 318,825,451 | |||||||||||
| 51,500,000 | 3.250 | 05/31/16 | 51,857,338 | |||||||||||
| 218,500,000 | 0.500 | 06/15/16 | 218,590,150 | |||||||||||
| 338,500,000 | 0.625 | 07/15/16 | 338,667,651 | |||||||||||
| 43,500,000 | 0.500 | 07/31/16 | 43,497,677 | |||||||||||
| 88,000,000 | 1.500 | 07/31/16 | 88,357,232 | |||||||||||
| 631,540,000 | 3.250 | 07/31/16 | 638,490,091 | |||||||||||
| 131,000,000 | 0.625 | 08/15/16 | 131,054,339 | |||||||||||
| 685,500,000 | 4.875 | 08/15/16 | 698,730,103 | |||||||||||
| 42,000,000 | 0.500 | 08/31/16 | 41,961,927 | |||||||||||
| 155,000,000 | 1.000 | 08/31/16 | 155,308,340 | |||||||||||
| 725,500,000 | 3.000 | 08/31/16 | 734,205,747 | |||||||||||
| 386,000,000 | 0.875 | 09/15/16 | 386,691,326 | |||||||||||
| 71,000,000 | 1.000 | 09/30/16 | 71,219,381 | |||||||||||
| 13,000,000 | 3.000 | 09/30/16 | 13,176,202 | |||||||||||
| 107,500,000 | 4.625 | 11/15/16 | 110,425,523 | |||||||||||
|
| |||||||||||||
| | TOTAL INVESTMENTS BEFORE REPURCHASE AGREEMENTS | | $ | 8,029,375,330 | ||||||||||
|
| |||||||||||||
| Repurchase Agreements(c) – 47.8% | ||||||||||||||
| Bank of Montreal |
| ||||||||||||
| $ | 300,000,000 | 0.320 | %(b)(d) | 03/07/16 | $ | 300,000,000 | ||||||||
| Maturity Value: $300,117,333 |
| ||||||||||||
| Settlement Date: 02/02/16 |
| ||||||||||||
| Collateralized by U.S. Treasury Bonds, 2.500% to 8.750%, due | | ||||||||||||
|
| |||||||||||||
| Repurchase Agreements(c) – (continued) | ||||||||||||||
| Bank of Montreal – (continued) |
| ||||||||||||
| $ | 250,000,000 | 0.350 | %(b)(d) | 03/07/16 | $ | 250,000,000 | ||||||||
| Maturity Value: $250,218,750 |
| ||||||||||||
| Settlement Date: 02/17/16 |
| ||||||||||||
| Collateralized by U.S. Treasury Bonds, 3.875% to 4.750%, due | | ||||||||||||
| 250,000,000 | 0.350 | (b)(d) | 03/07/16 | 250,000,000 | ||||||||||
| Maturity Value: $250,221,180 |
| ||||||||||||
| Settlement Date: 02/18/16 |
| ||||||||||||
| Collateralized by U.S. Treasury Bonds, 2.500% to 3.625%, due | | ||||||||||||
|
| |||||||||||||
| Bank of Nova Scotia (The) |
| ||||||||||||
| 750,000,000 | 0.330 | (b)(d) | 03/07/16 | 750,000,000 | ||||||||||
| Maturity Value: $750,474,377 |
| ||||||||||||
| Settlement Date: 01/07/16 |
| ||||||||||||
| Collateralized by U.S. Treasury Bills, 0.000%, due 05/26/16 to | | ||||||||||||
| 500,000,000 | 0.400 | (b)(d) | 03/07/16 | 500,000,000 | ||||||||||
| Maturity Value: $501,481,476 |
| ||||||||||||
| Settlement Date: 12/14/15 |
| ||||||||||||
| Collateralized by U.S. Treasury Bills, 0.000%, due 03/31/16 to | | ||||||||||||
|
| |||||||||||||
| BNP Paribas |
| ||||||||||||
| 1,000,000,000 | 0.300 | 03/01/16 | 1,000,000,000 | |||||||||||
| Maturity Value: $1,000,008,333 |
| ||||||||||||
| Collateralized by U.S. Treasury Bill, 0.000%, due 03/31/16, U.S. | | ||||||||||||
|
| |||||||||||||
| 46 | The accompanying notes are an integral part of these financial statements. |
FINANCIAL SQUARE TREASURY OBLIGATIONS FUND
Principal Amount | Interest Rate | Maturity Date | Amortized Cost | |||||||||||
| Repurchase Agreements(c) – (continued) | ||||||||||||||
| BNP Paribas – (continued) |
| ||||||||||||
| $ | 700,000,000 | 0.320 | %(b)(d) | 03/01/16 | $ | 700,000,000 | ||||||||
| Maturity Value: $700,149,334 |
| ||||||||||||
| Settlement Date: 02/23/16 |
| ||||||||||||
| Collateralized by U.S. Treasury Bonds, 4.500% to 8.125%, due | | ||||||||||||
|
| |||||||||||||
| Joint Repurchase Agreement Account I |
| ||||||||||||
| 1,038,500,000 | 0.300 | 03/01/16 | 1,038,500,000 | |||||||||||
| Maturity Value: $1,038,508,654 |
| ||||||||||||
|
| |||||||||||||
| JPMorgan Securities LLC |
| ||||||||||||
| 38,600,000 | 0.300 | 03/01/16 | 38,600,000 | |||||||||||
| Maturity Value: $38,600,322 |
| ||||||||||||
| Collateralized by U.S. Treasury Notes, 2.000%, due 07/31/20 to | | ||||||||||||
| 500,000,000 | 0.280 | (b)(d) | 03/07/16 | 500,000,000 | ||||||||||
| Maturity Value: $501,458,338 |
| ||||||||||||
| Settlement Date: 03/02/15 |
| ||||||||||||
| Collateralized by U.S. Treasury Interest-Only Stripped Securities, | | ||||||||||||
|
| |||||||||||||
| Merrill Lynch, Pierce, Fenner & Smith, Inc. |
| ||||||||||||
| 106,800,000 | 0.300 | 03/01/16 | 106,800,000 | |||||||||||
| Maturity Value: $106,800,890 |
| ||||||||||||
| Collateralized by U.S. Treasury Inflation-Indexed Note, 0.125%, | | ||||||||||||
|
| |||||||||||||
| Societe Generale |
| ||||||||||||
| 127,300,000 | 0.320 | 03/01/16 | 127,300,000 | |||||||||||
| Maturity Value: $127,301,132 |
| ||||||||||||
| Collateralized by U.S. Treasury Inflation-Indexed Note, 0.125%, | | ||||||||||||
|
| |||||||||||||
| Repurchase Agreements(c) – (continued) | ||||||||||||||
| Societe Generale – (continued) |
| ||||||||||||
| $ | 250,000,000 | 0.340 | %(b)(d) | 03/07/16 | $ | 250,000,000 | ||||||||
| Maturity Value: $250,082,639 |
| ||||||||||||
| Settlement Date: 02/12/16 |
| ||||||||||||
| Collateralized by U.S. Treasury Bonds, 3.625% to 3.750%, due | | ||||||||||||
| 250,000,000 | 0.350 | (b)(d) | 03/07/16 | 250,000,000 | ||||||||||
| Maturity Value: $250,085,069 |
| ||||||||||||
| Settlement Date: 02/04/16 |
| ||||||||||||
| Collateralized by U.S. Treasury Bill, 0.000%, due 05/26/16, U.S. | | ||||||||||||
| 500,000,000 | 0.350 | (b)(d) | 03/07/16 | 500,000,000 | ||||||||||
| Maturity Value: $500,160,416 |
| ||||||||||||
| Settlement Date: 02/03/16 |
| ||||||||||||
| Collateralized by U.S. Treasury Bonds, 3.625% to 6.250, due | | ||||||||||||
| 250,000,000 | 0.370 | (b)(d) | 03/07/16 | 250,000,000 | ||||||||||
| Maturity Value: $250,154,167 |
| ||||||||||||
| Settlement Date: 02/12/16 |
| ||||||||||||
| Collateralized by U.S. Treasury Bond, 8.750%, due 08/15/20, | | ||||||||||||
|
| |||||||||||||
| Wells Fargo Securities LLC |
| ||||||||||||
| 325,000,000 | 0.390 | (e) | 04/12/16 | 325,000,000 | ||||||||||
| Maturity Value: $325,316,875 |
| ||||||||||||
| Settlement Date: 01/13/16 |
| ||||||||||||
| Collateralized by U.S. Treasury Notes, 1.000% to 1.750%, due | | ||||||||||||
|
| |||||||||||||
| TOTAL REPURCHASE AGREEMENTS | $ | 7,136,200,000 | ||||||||||||
|
| |||||||||||||
| TOTAL INVESTMENTS – 101.5% | $ | 15,165,575,330 | ||||||||||||
|
| |||||||||||||
|
| LIABILITIES IN EXCESS OF OTHER ASSETS – (1.5)% |
| (227,315,289 | ) | ||||||||||
|
| |||||||||||||
| NET ASSETS – 100.0% | $ | 14,938,260,041 | ||||||||||||
|
| |||||||||||||
| The accompanying notes are an integral part of these financial statements. | 47 |
FINANCIAL SQUARE TREASURY OBLIGATIONS FUND
Schedule of Investments (continued)
February 29, 2016 (Unaudited)
| The percentage shown for each investment category reflects the value of investments in that category as a percentage of net assets. | ||
(a) | All or a portion represents a forward commitment. | |
(b) | Variable or floating rate security. Interest rate disclosed is that which is in effect at February 29, 2016. | |
(c) | Unless noted, all repurchase agreements were entered into on February 29, 2016. Additional information on Joint Repurchase Agreement Account I appears on page 50. | |
(d) | The instrument is subject to a demand feature. | |
(e) | Securities have been determined to be illiquid by the Investment Adviser. At February 29, 2016, these securities amounted to $325,000,000 or approximately 2.2% of net assets. | |
Interest rates represent either the stated coupon rate, or for floating rate securities, the current reset rate, which is based upon current interest rate indices.
Maturity dates represent either the final legal maturity date on the security, the demand date for puttable securities, or the prerefunded date for those types of securities.
| 48 | The accompanying notes are an integral part of these financial statements. |
FINANCIAL SQUARE TREASURY SOLUTIONS FUND
Schedule of Investments
February 29, 2016 (Unaudited)
| Principal Amount | Interest Rate | Maturity Date | Amortized Cost | |||||||||||
| U.S. Treasury Obligations – 64.2% | ||||||||||||||
| United States Treasury Bills |
| ||||||||||||
| $ | 621,500,000 | 0.290 | % | 03/24/16 | $ | 621,386,835 | ||||||||
| 202,500,000 | 0.464 | 08/25/16 | 202,046,991 | |||||||||||
| 247,500,000 | 0.481 | (a) | 09/01/16 | 246,899,399 | ||||||||||
| United States Treasury Bond |
| ||||||||||||
| 354,500,000 | 7.250 | 05/15/16 | 359,514,533 | |||||||||||
| United States Treasury Floating Rate Notes |
| ||||||||||||
| 436,000,000 | 0.389 | (b) | 04/30/16 | 436,032,807 | ||||||||||
| 313,000,000 | 0.390 | (b) | 07/31/16 | 313,055,029 | ||||||||||
| 335,000,000 | 0.373 | (b) | 10/31/16 | 335,029,447 | ||||||||||
| 750,000,000 | 0.397 | (b) | 07/31/17 | 749,537,449 | ||||||||||
| 148,500,000 | 0.488 | (b) | 10/31/17 | 148,367,883 | ||||||||||
| United States Treasury Notes |
| ||||||||||||
| 312,000,000 | 0.375 | 03/15/16 | 312,009,997 | |||||||||||
| 27,500,000 | 0.375 | 03/31/16 | 27,499,813 | |||||||||||
| 383,000,000 | 2.250 | 03/31/16 | 383,622,413 | |||||||||||
| 20,000,000 | 2.375 | (a) | 03/31/16 | 20,033,594 | ||||||||||
| 11,000,000 | 0.375 | 04/30/16 | 10,998,366 | |||||||||||
| 37,000,000 | 2.000 | 04/30/16 | 37,095,595 | |||||||||||
| 92,900,000 | 0.250 | 05/15/16 | 92,862,111 | |||||||||||
| 182,600,000 | 5.125 | 05/15/16 | 184,363,000 | |||||||||||
| 3,000,000 | 3.250 | 05/31/16 | 3,020,051 | |||||||||||
| 193,500,000 | 0.500 | 06/15/16 | 193,579,933 | |||||||||||
| 187,400,000 | 0.625 | 07/15/16 | 187,502,616 | |||||||||||
| 22,500,000 | 0.500 | 07/31/16 | 22,495,301 | |||||||||||
| 102,000,000 | 1.500 | 07/31/16 | 102,436,170 | |||||||||||
| 429,920,000 | 3.250 | 07/31/16 | 434,672,754 | |||||||||||
| 168,500,000 | 0.625 | 08/15/16 | 168,591,483 | |||||||||||
| 320,600,000 | 4.875 | 08/15/16 | 326,837,956 | |||||||||||
| 30,000,000 | 0.500 | 08/31/16 | 29,972,805 | |||||||||||
| 231,500,000 | 1.000 | 08/31/16 | 231,942,558 | |||||||||||
| 415,500,000 | 3.000 | 08/31/16 | 420,423,510 | |||||||||||
| 271,000,000 | 0.875 | 09/15/16 | 271,489,946 | |||||||||||
| 54,000,000 | 1.000 | 09/30/16 | 54,166,853 | |||||||||||
| 99,750,000 | 3.000 | 09/30/16 | 101,164,392 | |||||||||||
| 79,500,000 | 4.625 | 11/15/16 | 81,663,580 | |||||||||||
|
| |||||||||||||
| | TOTAL INVESTMENTS BEFORE REPURCHASE AGREEMENTS | | $ | 7,110,315,170 | ||||||||||
|
| |||||||||||||
| Repurchase Agreements(c) – 36.2% | ||||||||||||||
| Federal Reserve Bank of New York |
| ||||||||||||
| $ | 4,000,000,000 | 0.250 | % | 03/01/16 | $ | 4,000,000,000 | ||||||||
| Maturity Value: $4,000,027,778 |
| ||||||||||||
| Collateralized by U.S. Treasury Bonds, 3.625% to 6.125%, due | | ||||||||||||
|
| |||||||||||||
| TOTAL INVESTMENTS – 100.4% | $ | 11,110,315,170 | ||||||||||||
|
| |||||||||||||
|
| LIABILITIES IN EXCESS OF OTHER ASSETS – (0.4)% |
| (48,917,407 | ) | ||||||||||
|
| |||||||||||||
| NET ASSETS – 100.0% | $ | 11,061,397,763 | ||||||||||||
|
| |||||||||||||
| The percentage shown for each investment category reflects the value of investments in that category as a percentage of net assets. | ||
(a) | All or a portion represents a forward commitment. | |
(b) | Variable or floating rate security. Interest rate disclosed is that which is in effect at February 29, 2016. | |
(c) | Unless noted, all repurchase agreements were entered into on February 29, 2016. | |
Interest rates represent either the stated coupon rate, annualized yield on date of purchase for discounted securities, or, for floating rate securities, the current reset rate, which is based upon current interest rate indices.
Maturity dates represent either the final legal maturity date on the security, the demand date for puttable securities, or the prerefunded date for those types of securities.
| The accompanying notes are an integral part of these financial statements. | 49 |
GOLDMAN SACHS FUNDS — FINANCIAL SQUARE FUNDS
Schedule of Investments
February 29, 2016 (Unaudited)
| ADDITIONAL INVESTMENT INFORMATION |
JOINT REPURCHASE AGREEMENT ACCOUNT I — At February 29, 2016, certain Funds had undivided interests in the Joint Repurchase Agreement Account I with a maturity date of March 1, 2016, as follows:
| Fund | Principal Amount | Maturity Value | Collateral Value Allocation | |||||||||
Government | $ | 3,094,300,000 | $ | 3,094,325,786 | $ | 3,156,188,795 | ||||||
Money Market | 966,100,000 | 966,108,051 | 985,422,873 | |||||||||
Prime Obligations | 510,100,000 | 510,104,251 | 520,302,461 | |||||||||
Tax-Exempt California | 2,500,000 | 2,500,021 | 2,550,002 | |||||||||
Tax-Exempt New York | 1,300,000 | 1,300,011 | 1,326,001 | |||||||||
Treasury Obligations | 1,038,500,000 | 1,038,508,654 | 1,059,270,938 | |||||||||
REPURCHASE AGREEMENTS — At February 29, 2016, the Principal Amounts of certain Funds’ interest in the Joint Repurchase Agreement Account I were as follows:
| Counterparty | Interest Rate | Government | Money Market | Prime Obligations | Tax-Exempt California | Tax-Exempt New York | Treasury Obligations | |||||||||||||||||||||
BNP Paribas Securities Corp. | 0.300 | % | $ | 1,378,233,680 | $ | 430,311,075 | $ | 227,203,891 | $ | 1,113,526 | $ | 579,034 | $ | 462,558,794 | ||||||||||||||
Citigroup Global Markets, Inc. | 0.300 | 357,127,911 | 111,502,205 | 58,873,072 | 288,537 | 150,039 | 119,858,235 | |||||||||||||||||||||
Credit Agricole Corporate and Investment Bank | 0.300 | 826,940,208 | 258,186,645 | 136,322,335 | 668,116 | 347,420 | 277,535,276 | |||||||||||||||||||||
Credit Suisse Securities (USA) LLC | 0.300 | 275,646,736 | 86,062,215 | 45,440,778 | 222,705 | 115,807 | 92,511,759 | |||||||||||||||||||||
Merrill Lynch, Pierce, Fenner & Smith, Inc. | 0.300 | 256,351,465 | 80,037,860 | 42,259,924 | 207,116 | 107,700 | 86,035,936 | |||||||||||||||||||||
| TOTAL | $ | 3,094,300,000 | $ | 966,100,000 | $ | 510,100,000 | $ | 2,500,000 | $ | 1,300,000 | $ | 1,038,500,000 | ||||||||||||||||
At February 29, 2016, the Joint Repurchase Agreement Account I was fully collateralized by:
| Issuer | Interest Rates | Maturity Dates | ||||||
U.S. Treasury Bonds | 2.500 to 9.125 | % | 05/15/17 to 05/15/45 | |||||
U.S. Treasury Floating Rate Notes | 0.394 to 0.493 | 04/30/16 to 10/31/17 | ||||||
U.S. Treasury Inflation-Indexed Bond | 2.375 | 01/15/27 | ||||||
U.S. Treasury Inflation-Indexed Notes | 0.125 to 2.500 | 07/15/16 to 01/15/25 | ||||||
U.S. Treasury Interest-Only Stripped Securities | 0.000 | 02/15/17 to 02/15/45 | ||||||
U.S. Treasury Notes | 0.375 to 4.875 | 03/31/16 to 11/15/25 | ||||||
U.S. Treasury Principal-Only Stripped Securities | 0.000 | 05/15/17 to 08/15/44 | ||||||
| 50 | The accompanying notes are an integral part of these financial statements. |
GOLDMAN SACHS FUNDS — FINANCIAL SQUARE FUNDS
| ADDITIONAL INVESTMENT INFORMATION (continued) |
JOINT REPURCHASE AGREEMENT ACCOUNT III — At February 29, 2016, certain Funds had undivided interests in the Joint Repurchase Agreement Account III with a maturity date of March 1, 2016, as follows:
| Fund | Principal Amount | Maturity Value | Collateral Value Allocation | |||||||||
Government | $ | 2,831,400,000 | $ | 2,831,425,209 | $ | 2,909,724,155 | ||||||
Money Market | 1,000,000,000 | 1,000,008,903 | 1,027,662,695 | |||||||||
Prime Obligations | 750,000,000 | 750,006,678 | 770,747,021 | |||||||||
REPURCHASE AGREEMENTS — At February 29, 2016, the Principal Amounts of certain Funds’ interest in the Joint Repurchase Agreement Account III were as follows:
| Counterparty | Interest Rate | Government | Money Market | Prime Obligations | ||||||||||||
ABN Amro Bank N.V. | 0.320 | % | $ | 303,798,283 | $ | 107,296,137 | $ | 80,472,103 | ||||||||
Bank of America, N.A. | 0.320 | 303,798,283 | 107,296,137 | 80,472,103 | ||||||||||||
BNP Paribas Securities Corp. | 0.310 | 461,773,390 | 163,090,129 | 122,317,597 | ||||||||||||
Citigroup Global Markets, Inc. | 0.320 | 121,519,313 | 42,918,455 | 32,188,841 | ||||||||||||
Credit Agricole Corporate and Investment Bank | 0.320 | 607,596,567 | 214,592,275 | 160,944,206 | ||||||||||||
TD Securities (USA) LLC | 0.320 | 425,317,597 | 150,214,592 | 112,660,944 | ||||||||||||
Wells Fargo Securities LLC | 0.330 | 607,596,567 | 214,592,275 | 160,944,206 | ||||||||||||
| TOTAL | $ | 2,831,400,000 | $ | 1,000,000,000 | $ | 750,000,000 | ||||||||||
At February 29, 2016, the Joint Repurchase Agreement Account III was fully collateralized by:
| Issuer | Interest Rates | Maturity Dates | ||||||
Federal Home Loan Mortgage Corp. | 1.000 to 9.500 | % | 07/28/17 to 02/01/46 | |||||
Federal National Mortgage Association | 1.125 to 8.000 | 06/01/16 to 03/01/46 | ||||||
Government National Mortgage Association | 2.000 to 8.500 | 01/15/22 to 01/20/46 | ||||||
Tennessee Valley Authority | 5.250 | 09/15/39 | ||||||
U.S. Treasury Inflation-Indexed Bonds | 0.750 to 2.000 | 01/15/26 to 02/15/45 | ||||||
U.S. Treasury Interest-Only Stripped Securities | 0.000 | 05/15/28 to 02/15/35 | ||||||
U.S. Treasury Notes | 0.625 to 4.750 | 08/31/16 to 08/15/25 | ||||||
| The accompanying notes are an integral part of these financial statements. | 51 |
GOLDMAN SACHS FUNDS — FINANCIAL SQUARE FUNDS
Statements of Assets and Liabilities
February 29, 2016 (Unaudited)
| Federal Instruments Fund | Government Fund | Money Market Fund | ||||||||||||
| Assets: | ||||||||||||||
Investments based on amortized cost | $ | 685,993,992 | $ | 24,602,192,227 | $ | 36,908,344,482 | ||||||||
Repurchase agreements based on amortized cost | — | 22,617,500,000 | 9,453,650,000 | |||||||||||
Cash | 5,852,634 | 8,762,464 | — | |||||||||||
Receivables: | ||||||||||||||
Interest | 1,040,854 | 31,153,764 | 21,569,893 | |||||||||||
Reimbursement from investment advisor | 36,903 | — | — | |||||||||||
Deferred offering cost | 180,095 | — | — | |||||||||||
Investments sold | — | 198,549,928 | — | |||||||||||
Fund shares sold | — | 963,101 | 7,824,591 | |||||||||||
Other assets | — | 121,304 | 17,273 | |||||||||||
| Total assets | 693,104,478 | 47,459,242,788 | 46,391,406,239 | |||||||||||
| Liabilities: | ||||||||||||||
Due to custodian | — | — | 669,293 | |||||||||||
Payables: | ||||||||||||||
Investments purchased | 6,831,494 | 1,295,197,091 | 337,651,456 | |||||||||||
Management fees | 101,145 | 5,240,597 | 5,603,411 | |||||||||||
Distribution and Service fees and Transfer Agency fees | 5,626 | 330,290 | 352,601 | |||||||||||
Accrued offering costs | 3,204 | — | — | |||||||||||
Dividend distribution | 979 | 2,825,910 | 5,665,366 | |||||||||||
Fund shares redeemed | — | 157,012 | 3,369,322 | |||||||||||
Accrued expenses | 77,119 | 927,083 | 237,680 | |||||||||||
| Total liabilities | 7,019,567 | 1,304,677,983 | 353,549,129 | |||||||||||
| Net Assets: | ||||||||||||||
Paid-in capital | 686,082,491 | 46,154,485,968 | 46,037,768,631 | |||||||||||
Undistributed (distributions in excess of) net investment income (loss) | — | (54,878 | ) | 53,525 | ||||||||||
Accumulated net realized gain (loss) from investments | 2,420 | 133,715 | 34,954 | |||||||||||
| NET ASSETS | $ | 686,084,911 | $ | 46,154,564,805 | $ | 46,037,857,110 | ||||||||
Net asset value, offering and redemption price per share | $1.00 | $1.00 | $1.00 | |||||||||||
Net Assets: | ||||||||||||||
FST Institutional Shares | $ | 630,087,346 | $ | 41,590,799,911 | $ | 42,909,776,571 | ||||||||
FST Select Shares | 50,017 | 182,830,673 | 2,349,107,173 | |||||||||||
FST Preferred Shares | 50,009 | 93,336,142 | 63,853,582 | |||||||||||
FST Capital Shares | 50,004 | 1,188,130,115 | 323,127,584 | |||||||||||
FST Administration Shares | 34,740,904 | 2,732,149,184 | 354,156,414 | |||||||||||
FST Premier Shares | 50,002 | 1,000 | 1,000 | |||||||||||
FST Service Shares | 21,006,628 | 344,376,765 | 25,953,150 | |||||||||||
Class A Shares | — | 10,000 | — | |||||||||||
Class C Shares | — | 10,000 | — | |||||||||||
FST Resource Shares | — | 22,906,059 | 1,000 | |||||||||||
FST Cash Management Shares | 50,001 | 4,947 | 11,880,636 | |||||||||||
Class R6 Shares | — | 10,009 | — | |||||||||||
Total Net Assets | $ | 686,084,911 | $ | 46,154,564,805 | $ | 46,037,857,110 | ||||||||
Shares outstanding $0.001 par value (unlimited number of shares authorized): | ||||||||||||||
FST Institutional Shares | 630,085,123 | 41,590,723,946 | 42,909,685,991 | |||||||||||
FST Select Shares | 50,017 | 182,830,339 | 2,349,102,214 | |||||||||||
FST Preferred Shares | 50,009 | 93,335,971 | 63,853,447 | |||||||||||
FST Capital Shares | 50,004 | 1,188,127,945 | 323,126,903 | |||||||||||
FST Administration Shares | 34,740,782 | 2,732,144,194 | 354,155,666 | |||||||||||
FST Premier Shares | 50,001 | 1,000 | 1,000 | |||||||||||
FST Service Shares | 21,006,554 | 344,376,136 | 25,953,094 | |||||||||||
Class A Shares | — | 10,000 | — | |||||||||||
Class C Shares | — | 10,000 | — | |||||||||||
FST Resource Shares | — | 22,906,017 | 1,000 | |||||||||||
FST Cash Management Shares | 50,001 | 4,947 | 11,880,611 | |||||||||||
Class R6 Shares | — | 10,009 | — | |||||||||||
| 52 | The accompanying notes are an integral part of these financial statements. |
GOLDMAN SACHS FUNDS — FINANCIAL SQUARE FUNDS
Prime Obligations Fund | Tax-Exempt Fund | Tax-Exempt New York Fund | Tax-Free Money Market | Treasury Fund | Treasury Fund | Treasury Solutions | ||||||||||||||||||||||||||||||||||
| $ | 13,468,547,778 | $ | 182,480,626 | $ | 93,465,990 | $ | 4,426,982,290 | $ | 54,780,869,640 | $ | 8,029,375,330 | $ | 7,110,315,170 | |||||||||||||||||||||||||||
| 2,695,100,000 | 2,500,000 | 1,300,000 | — | — | 7,136,200,000 | 4,000,000,000 | ||||||||||||||||||||||||||||||||||
| 23,448,718 | 83,864 | 61,421 | — | 131,908,759 | 2,197,750 | 25,894 | ||||||||||||||||||||||||||||||||||
| 6,370,630 | 17,041 | 30,076 | 4,648,250 | 69,115,885 | 22,528,032 | 21,748,165 | ||||||||||||||||||||||||||||||||||
| — | 81,136 | 81,407 | — | — | — | — | ||||||||||||||||||||||||||||||||||
| — | — | — | — | — | — | — | ||||||||||||||||||||||||||||||||||
| — | — | — | 231,919,693 | 325,962,768 | 62,358,646 | 198,626,661 | ||||||||||||||||||||||||||||||||||
| 1,344,384 | — | — | 180,529 | 11,241,652 | 838,824 | 12,478 | ||||||||||||||||||||||||||||||||||
| — | — | — | 340,606 | 6,143 | — | 25,467 | ||||||||||||||||||||||||||||||||||
| 16,194,811,510 | 185,162,667 | 94,938,894 | 4,664,071,368 | 55,319,104,847 | 15,253,498,582 | 11,330,753,835 | ||||||||||||||||||||||||||||||||||
| — | — | — | 1,145,061 | — | — | — | ||||||||||||||||||||||||||||||||||
| 103,319,998 | — | — | 311,392,589 | 1,324,614,314 | 311,741,666 | 267,131,559 | ||||||||||||||||||||||||||||||||||
| 1,916,054 | — | — | 273,201 | 6,976,109 | 2,059,398 | 1,559,527 | ||||||||||||||||||||||||||||||||||
| 134,243 | — | — | — | 387,529 | 114,401 | 109,177 | ||||||||||||||||||||||||||||||||||
| — | — | — | — | — | — | — | ||||||||||||||||||||||||||||||||||
| 2,735,435 | 53 | 28 | 6,001 | 2,958,769 | 871,697 | 499,801 | ||||||||||||||||||||||||||||||||||
| 574,275 | — | — | 61,687 | 1,739,063 | 878 | — | ||||||||||||||||||||||||||||||||||
| 673,973 | 44,149 | 41,451 | 59,192 | 469,445 | 450,501 | 56,008 | ||||||||||||||||||||||||||||||||||
| 109,353,978 | 44,202 | 41,479 | 312,937,731 | 1,337,145,229 | 315,238,541 | 269,356,072 | ||||||||||||||||||||||||||||||||||
| 16,085,550,566 | 185,108,957 | 94,897,083 | 4,350,671,153 | 53,980,974,951 | 14,938,360,556 | 11,061,031,426 | ||||||||||||||||||||||||||||||||||
| (50,056 | ) | — | 332 | (29 | ) | (44,020 | ) | (36,827 | ) | (60,193 | ) | |||||||||||||||||||||||||||||
| (42,978 | ) | 9,508 | — | 462,513 | 1,028,687 | (63,688 | ) | 426,530 | ||||||||||||||||||||||||||||||||
| $ | 16,085,457,532 | $ | 185,118,465 | $ | 94,897,415 | $ | 4,351,133,637 | $ | 53,981,959,618 | $ | 14,938,260,041 | $ | 11,061,397,763 | |||||||||||||||||||||||||||
| $1.00 | $1.00 | $1.00 | $1.00 | $1.00 | $1.00 | $1.00 | ||||||||||||||||||||||||||||||||||
| $ | 13,198,314,427 | $ | 185,115,661 | $ | 94,895,570 | $ | 3,934,719,406 | $ | 51,216,501,947 | $ | 11,691,239,536 | $ | 10,232,875,239 | |||||||||||||||||||||||||||
| 94,780,297 | — | — | 195,911,400 | 12,341,197 | 172,038,223 | 11,239,001 | ||||||||||||||||||||||||||||||||||
| 269,511,759 | — | — | 3,073,399 | 40,313,809 | 175,288,731 | 54,596,889 | ||||||||||||||||||||||||||||||||||
| 166,497,073 | — | — | 47,932,882 | 408,730,421 | 366,162,465 | 75,909,171 | ||||||||||||||||||||||||||||||||||
| 1,700,224,608 | 10 | 10 | 101,470,141 | 2,210,189,969 | 1,641,338,820 | 247,224,991 | ||||||||||||||||||||||||||||||||||
| 1,001 | — | — | 1,000 | 51,992 | 1,000 | 1,004 | ||||||||||||||||||||||||||||||||||
| 566,990,224 | 1,757 | 800 | 61,472,201 | 93,828,283 | 892,189,266 | 284,030,500 | ||||||||||||||||||||||||||||||||||
| — | — | — | — | — | — | — | ||||||||||||||||||||||||||||||||||
| 22,185,669 | — | — | — | — | — | — | ||||||||||||||||||||||||||||||||||
| 66,951,474 | — | — | 6,552,208 | 1,000 | 1,000 | 1,000 | ||||||||||||||||||||||||||||||||||
| 1,000 | 1,037 | 1,035 | 1,000 | 1,000 | 1,000 | 155,519,968 | ||||||||||||||||||||||||||||||||||
| — | — | — | — | — | — | — | ||||||||||||||||||||||||||||||||||
| $ | 16,085,457,532 | $ | 185,118,465 | $ | 94,897,415 | $ | 4,351,133,637 | $ | 53,981,959,618 | $ | 14,938,260,041 | $ | 11,061,397,763 | |||||||||||||||||||||||||||
| 13,198,553,382 | 185,060,567 | 94,889,707 | 3,934,255,107 | 51,215,570,135 | 11,691,318,202 | 10,232,536,344 | ||||||||||||||||||||||||||||||||||
| 94,782,010 | — | — | 195,888,282 | 12,340,973 | 172,039,381 | 11,238,629 | ||||||||||||||||||||||||||||||||||
| 269,516,630 | — | — | 3,073,036 | 40,313,075 | 175,289,911 | 54,595,081 | ||||||||||||||||||||||||||||||||||
| 166,500,082 | — | — | 47,927,225 | 408,722,983 | 366,164,929 | 75,906,656 | ||||||||||||||||||||||||||||||||||
| 1,700,255,336 | 10 | 10 | 101,458,167 | 2,210,149,746 | 1,641,349,865 | 247,216,803 | ||||||||||||||||||||||||||||||||||
| 1,001 | — | — | 1,000 | 51,990 | 1,000 | 1,004 | ||||||||||||||||||||||||||||||||||
| 567,000,471 | 1,756 | 799 | 61,464,948 | 93,826,576 | 892,195,270 | 284,021,092 | ||||||||||||||||||||||||||||||||||
| — | — | — | — | — | — | — | ||||||||||||||||||||||||||||||||||
| 22,186,070 | — | — | — | — | — | — | ||||||||||||||||||||||||||||||||||
| 66,952,684 | — | — | 6,551,434 | 1,000 | 1,000 | 1,000 | ||||||||||||||||||||||||||||||||||
| 1,000 | 1,036 | 1,035 | 1,000 | 1,000 | 1,000 | 155,514,817 | ||||||||||||||||||||||||||||||||||
| — | — | — | — | — | — | — | ||||||||||||||||||||||||||||||||||
| The accompanying notes are an integral part of these financial statements. | 53 |
GOLDMAN SACHS FUNDS — FINANCIAL SQUARE FUNDS
Statements of Operations
For the Six Months or Period Ended February 29, 2016 (Unaudited)
| Federal Instruments Fund* | Government Fund | Money Market Fund | ||||||||||||
| Investment income: | ||||||||||||||
Interest income | $ | 407,127 | $ | 50,897,948 | $ | 83,323,385 | ||||||||
| Total investment income | 407,127 | 50,897,948 | 83,323,385 | |||||||||||
| Expenses: | ||||||||||||||
Fund-Level Expenses: | ||||||||||||||
Management fees | 230,766 | 35,623,539 | 41,728,943 | |||||||||||
Transfer Agency fees | 11,257 | 1,737,734 | 2,035,558 | |||||||||||
Custody, accounting and administrative services | 20,510 | 513,837 | 622,266 | |||||||||||
Printing and mailing fees | 24,465 | 63,197 | 110,887 | |||||||||||
Registration fees | 842 | 93,505 | 87,563 | |||||||||||
Trustee fees | 7,212 | 53,613 | 55,769 | |||||||||||
Professional fees | 29,701 | 153,417 | 47,143 | |||||||||||
Amortization of offering costs | 92,638 | — | — | |||||||||||
Organization costs | 12,000 | — | — | |||||||||||
Other | 3,934 | 123,076 | 112,135 | |||||||||||
Subtotal | 433,325 | 38,361,918 | 44,800,264 | |||||||||||
Class Specific Expenses: | ||||||||||||||
FST Administration Share fees | 22,880 | 3,048,311 | 487,871 | |||||||||||
FST Select Share fees | 5 | 31,838 | 357,806 | |||||||||||
FST Capital Share fees | 25 | 976,690 | 226,103 | |||||||||||
FST Service Share fees | 42,183 | 996,918 | 75,912 | |||||||||||
FST Preferred Share fees | 17 | 89,401 | 51,775 | |||||||||||
FST Cash Management Share fees | 84 | 11 | 22,110 | |||||||||||
FST Premier Share fees | 59 | 2 | 2 | |||||||||||
FST Resource Share fees | — | 25,257 | 2 | |||||||||||
Class C Share fees | — | — | — | |||||||||||
Distribution fees — FST Cash Management Shares | 51 | 7 | 13,266 | |||||||||||
Distribution fees — FST Resource Share fees | — | 7,577 | 1 | |||||||||||
Distribution and Service fees — Class C Shares(a) | — | — | — | |||||||||||
| Total expenses | 498,629 | 43,537,930 | 46,035,112 | |||||||||||
Less — expense reductions | (245,158 | ) | (10,759,930 | ) | (9,360,757 | ) | ||||||||
| Net expenses | 253,471 | 32,778,000 | 36,674,355 | |||||||||||
| NET INVESTMENT INCOME | $ | 153,656 | $ | 18,119,948 | $ | 46,649,030 | ||||||||
| Net realized gain from investment transactions | 9,248 | 948,123 | 1,347,355 | |||||||||||
| NET INCREASE IN NET ASSETS RESULTING FROM OPERATIONS | $ | 162,904 | $ | 19,068,071 | $ | 47,996,385 | ||||||||
| * | Commenced operations on October 30, 2015. |
| (a) | Class C Shares of the Government Fund commenced operations on February 29, 2016. |
| 54 | The accompanying notes are an integral part of these financial statements. |
GOLDMAN SACHS FUNDS — FINANCIAL SQUARE FUNDS
| Prime Obligations Fund | Tax-Exempt California Fund | Tax-Exempt New York Fund | Tax-Free Fund | Treasury Instruments Fund | Treasury Obligations Fund | Treasury Solutions | ||||||||||||||||||||||||||||||||||
| $ | 24,810,477 | $ | 47,779 | $ | 26,927 | $ | 2,281,209 | $ | 45,487,212 | $ | 18,645,894 | $ | 12,268,243 | |||||||||||||||||||||||||||
| 24,810,477 | 47,779 | 26,927 | 2,281,209 | 45,487,212 | 18,645,894 | 12,268,243 | ||||||||||||||||||||||||||||||||||
| 13,503,077 | 378,460 | 162,654 | 5,387,182 | 38,580,343 | 15,378,873 | 11,415,741 | ||||||||||||||||||||||||||||||||||
| 658,687 | 10,813 | 4,648 | 262,789 | 1,881,968 | 750,189 | 556,865 | ||||||||||||||||||||||||||||||||||
| 221,352 | 62,865 | 48,257 | 85,022 | 559,236 | 221,154 | 176,676 | ||||||||||||||||||||||||||||||||||
| 75,099 | 13,642 | 12,851 | 45,021 | 150,963 | 32,243 | 67,750 | ||||||||||||||||||||||||||||||||||
| 107,849 | 14,920 | 15,629 | 70,469 | 103,959 | 75,084 | 83,980 | ||||||||||||||||||||||||||||||||||
| 49,819 | 11,581 | 11,417 | 19,747 | 59,116 | 38,893 | 19,704 | ||||||||||||||||||||||||||||||||||
| 52,673 | 61,323 | 64,737 | 47,046 | 44,630 | 41,558 | 43,864 | ||||||||||||||||||||||||||||||||||
| — | — | — | — | — | — | — | ||||||||||||||||||||||||||||||||||
| — | — | — | — | — | — | — | ||||||||||||||||||||||||||||||||||
| 81,245 | 3,093 | 4,160 | 31,103 | 102,650 | 76,906 | 57,324 | ||||||||||||||||||||||||||||||||||
| 14,749,801 | 556,697 | 324,353 | 5,948,379 | 41,482,865 | 16,614,900 | 12,421,904 | ||||||||||||||||||||||||||||||||||
| 2,311,042 | — | — | 135,210 | 2,826,329 | 1,936,522 | 381,589 | ||||||||||||||||||||||||||||||||||
| 13,057 | — | — | 29,825 | 4,165 | 26,751 | 1,507 | ||||||||||||||||||||||||||||||||||
| 108,203 | — | — | 28,053 | 302,206 | 351,246 | 61,656 | ||||||||||||||||||||||||||||||||||
| 1,959,897 | 3 | 2 | 151,931 | 481,554 | 2,292,884 | 788,358 | ||||||||||||||||||||||||||||||||||
| 147,537 | — | — | 2,682 | 19,120 | 73,302 | 25,072 | ||||||||||||||||||||||||||||||||||
| 2 | 2 | 2 | 2 | 3 | 3 | 393,493 | ||||||||||||||||||||||||||||||||||
| 2 | — | — | 2 | 94 | 2 | 2 | ||||||||||||||||||||||||||||||||||
| 166,121 | — | — | 19,822 | 2 | 2 | 2 | ||||||||||||||||||||||||||||||||||
| 26,013 | — | — | — | — | — | — | ||||||||||||||||||||||||||||||||||
| 2 | 3 | 3 | 1 | 1 | 1 | 236,096 | ||||||||||||||||||||||||||||||||||
| 49,836 | — | — | 5,947 | 1 | 1 | 1 | ||||||||||||||||||||||||||||||||||
| 78,039 | — | — | — | — | — | — | ||||||||||||||||||||||||||||||||||
| 19,609,552 | 556,705 | 324,360 | 6,321,854 | 45,116,340 | 21,295,614 | 14,309,680 | ||||||||||||||||||||||||||||||||||
| (5,357,055 | ) | (515,514 | ) | (300,268 | ) | (4,200,888 | ) | (12,807,548 | ) | (7,197,074 | ) | (4,801,310 | ) | |||||||||||||||||||||||||||
| 14,252,497 | 41,191 | 24,092 | 2,120,966 | 32,308,792 | 14,098,540 | 9,508,370 | ||||||||||||||||||||||||||||||||||
| $ | 10,557,980 | $ | 6,588 | $ | 2,835 | $ | 160,243 | $ | 13,178,420 | $ | 4,547,354 | $ | 2,759,873 | |||||||||||||||||||||||||||
| 561,010 | 9,508 | 5,348 | 612,863 | 1,662,546 | 335,557 | 1,001,731 | ||||||||||||||||||||||||||||||||||
| $ | 11,118,990 | $ | 16,096 | $ | 8,183 | $ | 773,106 | $ | 14,840,966 | $ | 4,882,911 | $ | 3,761,604 | |||||||||||||||||||||||||||
| The accompanying notes are an integral part of these financial statements. | 55 |
GOLDMAN SACHS FUNDS — FINANCIAL SQUARE FUNDS
Statements of Changes in Net Assets
| Federal Instruments Fund | Government Fund | |||||||||||||||
| For the Period Ended February 29, 2016* (Unaudited) | For the Six Months Ended February 29, 2016 (Unaudited) | For the Fiscal Year Ended August 31, 2015 | ||||||||||||||
| From operations: | ||||||||||||||||
Net investment income | $ | 153,656 | $ | 18,119,948 | $ | 1,853,229 | ||||||||||
Net realized gain from investment transactions | 9,248 | 948,123 | 213,860 | |||||||||||||
| Net increase in net assets resulting from operations | 162,904 | 19,068,071 | 2,067,089 | |||||||||||||
| Distributions to shareholders: | ||||||||||||||||
From net investment income: | ||||||||||||||||
FST Institutional Shares | (153,296 | ) | (17,820,447 | ) | (1,681,325 | ) | ||||||||||
FST Select Shares | (16 | ) | (83,335 | ) | (8,935 | ) | ||||||||||
FST Preferred Shares | (8 | ) | (25,087 | ) | (13,575 | ) | ||||||||||
FST Capital Shares | (4 | ) | (171,258 | ) | (65,269 | ) | ||||||||||
FST Administration Shares | (137 | ) | (17,070 | ) | (110,899 | ) | ||||||||||
FST Premier Shares | (1 | ) | (2 | ) | (4 | ) | ||||||||||
FST Service Shares | (193 | ) | (2,750 | ) | (22,618 | ) | ||||||||||
FST Class B Shares(a) | — | — | — | |||||||||||||
Class C Shares(b) | — | — | — | |||||||||||||
FST Resource Shares | — | — | (4 | ) | ||||||||||||
FST Cash Management Shares | (1 | ) | (2 | ) | (4 | ) | ||||||||||
Class R6 Shares(c) | — | (4 | ) | — | ||||||||||||
From net realized gains: | ||||||||||||||||
FST Institutional Shares | (6,079 | ) | (767,424 | ) | (198,474 | ) | ||||||||||
FST Select Shares | (1 | ) | (4,853 | ) | (1,078 | ) | ||||||||||
FST Preferred Shares | (1 | ) | (3,772 | ) | (1,703 | ) | ||||||||||
FST Capital Shares | (1 | ) | (30,759 | ) | (7,833 | ) | ||||||||||
FST Administration Shares | (422 | ) | (59,550 | ) | (13,609 | ) | ||||||||||
FST Premier Shares | (1 | ) | — | — | ||||||||||||
FST Service Shares | (322 | ) | (9,202 | ) | (2,925 | ) | ||||||||||
FST Class B Shares(a) | — | — | — | |||||||||||||
Class C Shares(b) | — | — | — | |||||||||||||
FST Resource Shares | — | (321 | ) | — | ||||||||||||
FST Cash Management Shares | (1 | ) | — | — | ||||||||||||
| Total distributions to shareholders | (160,484 | ) | (18,995,836 | ) | (2,128,255 | ) | ||||||||||
| From share transactions (at $1.00 per share): | ||||||||||||||||
Proceeds from sales of shares | 858,453,253 | 150,994,643,497 | 222,389,573,754 | |||||||||||||
Reinvestment of distributions | 157,549 | 11,397,664 | 1,134,005 | |||||||||||||
Cost of shares redeemed | (172,528,311 | ) | (138,619,747,402 | ) | (214,488,774,251 | ) | ||||||||||
| Net increase (decrease) in net assets resulting from share transactions | 686,082,491 | 12,386,293,759 | 7,901,933,508 | |||||||||||||
| NET INCREASE (DECREASE) | 686,084,911 | 12,386,365,994 | 7,901,872,342 | |||||||||||||
| Net assets: | ||||||||||||||||
Beginning of period | — | 33,768,198,811 | 25,866,326,469 | |||||||||||||
End of period | $ | 686,084,911 | $ | 46,154,564,805 | $ | 33,768,198,811 | ||||||||||
| Undistributed (distributions in excess of) net investment income | $ | — | $ | (54,878 | ) | $ | (54,871 | ) | ||||||||
| * | Commenced operations on October 30, 2015. |
| (a) | FST Class B Shares were converted to FST Service Shares at the close of business on November 14, 2014. |
| (b) | Class C Shares of the Government Fund commenced operations on February 29, 2016. |
| (c) | Class R6 Shares of the Government Fund commenced operations on December 29, 2015. |
| 56 | The accompanying notes are an integral part of these financial statements. |
GOLDMAN SACHS FUNDS — FINANCIAL SQUARE FUNDS
| Money Market Fund | Prime Obligations Fund | Tax-Exempt California Fund | ||||||||||||||||||||||||||||||||
| For the Six Months Ended February 29, 2016 (Unaudited) | For the Fiscal Year Ended August 31, 2015 | For the Six Months Ended February 29, 2016 (Unaudited) | For the Fiscal Year Ended August 31, 2015 | For the Six Months Ended February 29, 2016 (Unaudited) | For the Fiscal Year Ended August 31, 2015 | |||||||||||||||||||||||||||||
| $ | 46,649,030 | $ | 26,556,245 | $ | 10,557,980 | $ | 3,209,594 | $ | 6,588 | $ | 17,287 | |||||||||||||||||||||||
| 1,347,355 | 220,120 | 561,010 | 480,029 | 9,508 | 68,045 | |||||||||||||||||||||||||||||
| 47,996,385 | 26,776,365 | 11,118,990 | 3,689,623 | 16,096 | 85,332 | |||||||||||||||||||||||||||||
| (43,923,994 | ) | (25,863,072 | ) | (9,978,334 | ) | (3,005,896 | ) | (6,582 | ) | (17,244 | ) | |||||||||||||||||||||||
| (2,446,950 | ) | (672,879 | ) | (70,776 | ) | (10,291 | ) | — | — | |||||||||||||||||||||||||
| (58,468 | ) | (6,130 | ) | (130,811 | ) | (18,929 | ) | — | — | |||||||||||||||||||||||||
| (143,834 | ) | (3,247 | ) | (59,483 | ) | (5,821 | ) | — | — | |||||||||||||||||||||||||
| (76,160 | ) | (10,127 | ) | (314,702 | ) | (106,970 | ) | (2 | ) | (36 | ) | |||||||||||||||||||||||
| (2 | ) | (4 | ) | (2 | ) | (4 | ) | — | — | |||||||||||||||||||||||||
| — | (662 | ) | (3,320 | ) | (55,460 | ) | (2 | ) | (4 | ) | ||||||||||||||||||||||||
| — | — | — | (57 | ) | — | — | ||||||||||||||||||||||||||||
| — | — | (152 | ) | (1,269 | ) | — | — | |||||||||||||||||||||||||||
| (2 | ) | (4 | ) | (398 | ) | (4,894 | ) | — | — | |||||||||||||||||||||||||
| — | (120 | ) | (2 | ) | (3 | ) | (2 | ) | (3 | ) | ||||||||||||||||||||||||
| — | — | — | — | — | — | |||||||||||||||||||||||||||||
| (1,181,681 | ) | (178,573 | ) | (437,203 | ) | (359,963 | ) | (18,905 | ) | — | ||||||||||||||||||||||||
| (75,122 | ) | (7,341 | ) | (3,850 | ) | (4,013 | ) | — | — | |||||||||||||||||||||||||
| (3,390 | ) | (670 | ) | (12,789 | ) | (13,198 | ) | — | — | |||||||||||||||||||||||||
| (9,417 | ) | (761 | ) | (6,787 | ) | (3,383 | ) | — | — | |||||||||||||||||||||||||
| (12,662 | ) | (1,968 | ) | (86,566 | ) | (57,318 | ) | — | — | |||||||||||||||||||||||||
| — | — | — | — | — | — | |||||||||||||||||||||||||||||
| (675 | ) | (118 | ) | (37,432 | ) | (30,756 | ) | — | — | |||||||||||||||||||||||||
| — | — | — | (6 | ) | — | — | ||||||||||||||||||||||||||||
| — | — | (930 | ) | (697 | ) | — | — | |||||||||||||||||||||||||||
| — | — | (3,062 | ) | (2,617 | ) | — | — | |||||||||||||||||||||||||||
| (198 | ) | (30 | ) | — | — | — | — | |||||||||||||||||||||||||||
| (47,932,555 | ) | (26,745,706 | ) | (11,146,599 | ) | (3,681,545 | ) | (25,493 | ) | (17,287 | ) | |||||||||||||||||||||||
| 222,116,982,281 | 420,663,619,405 | 59,779,073,888 | 94,447,494,094 | 289,216,151 | 768,196,899 | |||||||||||||||||||||||||||||
| 27,270,342 | 13,420,300 | 3,382,407 | 1,206,891 | 25,203 | 17,094 | |||||||||||||||||||||||||||||
| (211,548,814,713 | ) | (412,692,587,409 | ) | (56,196,895,439 | ) | (95,868,232,603 | ) | (362,387,096 | ) | (766,011,976 | ) | |||||||||||||||||||||||
| 10,595,437,910 | 7,984,452,296 | 3,585,560,856 | (1,419,531,618 | ) | (73,145,742 | ) | 2,202,017 | |||||||||||||||||||||||||||
| 10,595,501,740 | 7,984,482,955 | 3,585,533,247 | (1,419,523,540 | ) | (73,155,139 | ) | 2,270,062 | |||||||||||||||||||||||||||
| 35,442,355,370 | 27,457,872,415 | 12,499,924,285 | 13,919,447,825 | 258,273,604 | 256,003,542 | |||||||||||||||||||||||||||||
| $ | 46,037,857,110 | $ | 35,442,355,370 | $ | 16,085,457,532 | $ | 12,499,924,285 | $ | 185,118,465 | $ | 258,273,604 | |||||||||||||||||||||||
| $ | 53,525 | $ | 53,905 | $ | (50,056 | ) | $ | (50,056 | ) | $ | — | $ | — | |||||||||||||||||||||
| The accompanying notes are an integral part of these financial statements. | 57 |
GOLDMAN SACHS FUNDS — FINANCIAL SQUARE FUNDS
Statements of Changes in Net Assets (continued)
| Tax-Exempt New York Fund | Tax-Free Money Market Fund | |||||||||||||||||||
| For the Six Months Ended February 29, 2016 (Unaudited) | For the Fiscal Year Ended August 31, 2015 | For the Six Months Ended February 29, 2016 (Unaudited) | For the Fiscal Year Ended August 31, 2015 | |||||||||||||||||
| From operations: | ||||||||||||||||||||
Net investment income (loss) | $ | 2,835 | $ | 6,813 | $ | 160,243 | $ | 354,873 | ||||||||||||
Net realized gain from investment transactions | 5,348 | 16,809 | 612,863 | 1,150,228 | ||||||||||||||||
| Net increase in net assets resulting from operations | 8,183 | 23,622 | 773,106 | 1,505,101 | ||||||||||||||||
| Distributions to shareholders: | ||||||||||||||||||||
From net investment income: | ||||||||||||||||||||
FST Institutional Shares | (2,830 | ) | (6,762 | ) | (147,481 | ) | (326,566 | ) | ||||||||||||
FST Select Shares | — | — | (6,062 | ) | (15,418 | ) | ||||||||||||||
FST Preferred Shares | — | — | (164 | ) | (690 | ) | ||||||||||||||
FST Capital Shares | — | — | (1,140 | ) | (707 | ) | ||||||||||||||
FST Administration Shares | (2 | ) | (44 | ) | (3,298 | ) | (7,007 | ) | ||||||||||||
FST Premier Shares | — | — | (2 | ) | (39 | ) | ||||||||||||||
FST Service Shares | (2 | ) | (4 | ) | (1,852 | ) | (3,737 | ) | ||||||||||||
FST Resource Shares | — | — | (242 | ) | (705 | ) | ||||||||||||||
FST Cash Management Shares | (1 | ) | (3 | ) | (2 | ) | (4 | ) | ||||||||||||
From net realized gains: | ||||||||||||||||||||
FST Institutional Shares | (15,761 | ) | (6,817 | ) | (198,426 | ) | — | |||||||||||||
FST Select Shares | ��� | — | (7,632 | ) | — | |||||||||||||||
FST Preferred Shares | — | — | (206 | ) | — | |||||||||||||||
FST Capital Shares | — | — | (1,525 | ) | — | |||||||||||||||
FST Administration Shares | — | (77 | ) | (4,514 | ) | — | ||||||||||||||
FST Premier Shares | — | — | — | — | ||||||||||||||||
FST Service Shares | — | — | (2,046 | ) | — | |||||||||||||||
FST Resource Shares | — | — | (320 | ) | — | |||||||||||||||
FST Cash Management Shares | — | — | — | — | ||||||||||||||||
| Total distributions to shareholders | (18,596 | ) | (13,707 | ) | (374,912 | ) | (354,873 | ) | ||||||||||||
| From share transactions (at $1.00 per share): | ||||||||||||||||||||
Proceeds from sales of shares | 131,231,185 | 339,711,990 | 8,528,712,726 | 16,926,979,995 | ||||||||||||||||
Reinvestment of distributions | 18,452 | 13,528 | 269,038 | 244,325 | ||||||||||||||||
Cost of shares redeemed | (127,204,468 | ) | (374,603,287 | ) | (9,545,288,143 | ) | (17,311,899,566 | ) | ||||||||||||
| Net increase (decrease) in net assets resulting from share transactions | 4,045,169 | (34,877,769 | ) | (1,016,306,379 | ) | (384,675,246 | ) | |||||||||||||
| NET INCREASE (DECREASE) | 4,034,756 | (34,867,854 | ) | (1,015,908,185 | ) | (383,525,018 | ) | |||||||||||||
| Net assets: | ||||||||||||||||||||
Beginning of period | 90,862,659 | 125,730,513 | 5,367,041,822 | 5,750,566,840 | ||||||||||||||||
End of period | $ | 94,897,415 | $ | 90,862,659 | $ | 4,351,133,637 | $ | 5,367,041,822 | ||||||||||||
| Undistributed (distributions in excess of) net investment income | $ | 332 | $ | 332 | $ | (29 | ) | $ | (29 | ) | ||||||||||
| 58 | The accompanying notes are an integral part of these financial statements. |
GOLDMAN SACHS FUNDS — FINANCIAL SQUARE FUNDS
| Treasury Instruments Fund | Treasury Obligations Fund | Treasury Solutions Fund | ||||||||||||||||||||||||||||||||
| For the Six Months Ended February 29, 2016 (Unaudited) | For the Fiscal Year Ended August 31, 2015 | For the Six Months Ended February 29, 2016 (Unaudited) | For the Fiscal Year Ended August 31, 2015 | For the Six Months Ended February 29, 2016 (Unaudited) | For the Fiscal Year Ended August 31, 2015 | |||||||||||||||||||||||||||||
| $ | 13,178,420 | $ | (125,222 | ) | $ | 4,547,354 | $ | 682,847 | $ | 2,759,873 | $ | 332,091 | ||||||||||||||||||||||
| 1,662,546 | 354,413 | 335,557 | 267,582 | 1,001,731 | 906,292 | |||||||||||||||||||||||||||||
| 14,840,966 | 229,191 | 4,882,911 | 950,429 | 3,761,604 | 1,238,383 | |||||||||||||||||||||||||||||
| (13,180,653 | ) | — | (4,423,549 | ) | (597,842 | ) | (2,816,613 | ) | (302,041 | ) | ||||||||||||||||||||||||
| (3,354 | ) | — | (52,985 | ) | (8,254 | ) | (2,096 | ) | (1,216 | ) | ||||||||||||||||||||||||
| (3,781 | ) | — | (19,305 | ) | (6,077 | ) | (2,804 | ) | (1,438 | ) | ||||||||||||||||||||||||
| (9,999 | ) | — | (34,203 | ) | (13,361 | ) | — | (1,551 | ) | |||||||||||||||||||||||||
| — | — | (11,030 | ) | (60,952 | ) | — | (11,934 | ) | ||||||||||||||||||||||||||
| (2 | ) | — | (2 | ) | (13 | ) | (2 | ) | (453 | ) | ||||||||||||||||||||||||
| — | — | (6,276 | ) | (35,362 | ) | — | (12,096 | ) | ||||||||||||||||||||||||||
| (2 | ) | — | (2 | ) | (4 | ) | (2 | ) | (4 | ) | ||||||||||||||||||||||||
| (2 | ) | — | (2 | ) | (4 | ) | — | (1,358 | ) | |||||||||||||||||||||||||
| (501,702 | ) | (377,134 | ) | (251,746 | ) | (328,383 | ) | (1,087,600 | ) | (326,157 | ) | |||||||||||||||||||||||
| (471 | ) | (1,201 | ) | (4,035 | ) | (4,408 | ) | (1,061 | ) | (873 | ) | |||||||||||||||||||||||
| (464 | ) | (516 | ) | (4,022 | ) | (3,649 | ) | (5,098 | ) | (1,496 | ) | |||||||||||||||||||||||
| (5,572 | ) | (2,767 | ) | (9,758 | ) | (6,761 | ) | (6,059 | ) | (2,850 | ) | |||||||||||||||||||||||
| (12,413 | ) | (16,492 | ) | (36,958 | ) | (33,459 | ) | (9,292 | ) | (12,074 | ) | |||||||||||||||||||||||
| (1 | ) | (16 | ) | — | (3 | ) | — | (20 | ) | |||||||||||||||||||||||||
| (1,058 | ) | (1,685 | ) | (21,809 | ) | (18,908 | ) | (9,599 | ) | (11,591 | ) | |||||||||||||||||||||||
| — | (4 | ) | — | — | — | — | ||||||||||||||||||||||||||||
| — | (4 | ) | — | — | (4,792 | ) | (2,512 | ) | ||||||||||||||||||||||||||
| (13,719,474 | ) | (399,819 | ) | (4,875,682 | ) | (1,117,440 | ) | (3,945,018 | ) | (689,664 | ) | |||||||||||||||||||||||
| 92,769,921,286 | 118,520,288,413 | 45,367,573,389 | 96,318,556,683 | 16,938,297,819 | 22,661,884,182 | |||||||||||||||||||||||||||||
| 8,369,381 | 274,114 | 2,537,585 | 549,258 | 2,701,666 | 502,101 | |||||||||||||||||||||||||||||
| (75,656,768,270 | ) | (114,605,231,015 | ) | (46,583,839,628 | ) | (96,892,376,337 | ) | (16,982,108,071 | ) | (21,807,387,853 | ) | |||||||||||||||||||||||
| 17,121,522,397 | 3,915,331,512 | (1,213,728,654 | ) | (573,270,396 | ) | (41,108,586 | ) | 854,998,430 | ||||||||||||||||||||||||||
| 17,122,643,889 | 3,915,160,884 | (1,213,721,425 | ) | (573,437,407 | ) | (41,292,000 | ) | 855,547,149 | ||||||||||||||||||||||||||
| 36,859,315,729 | 32,944,154,845 | 16,151,981,466 | 16,725,418,873 | 11,102,689,763 | 10,247,142,614 | |||||||||||||||||||||||||||||
| $ | 53,981,959,618 | $ | 36,859,315,729 | $ | 14,938,260,041 | $ | 16,151,981,466 | $ | 11,061,397,763 | $ | 11,102,689,763 | |||||||||||||||||||||||
| $ | (44,020 | ) | $ | (24,647 | ) | $ | (36,827 | ) | $ | (36,827 | ) | $ | (60,193 | ) | $ | 1,451 | ||||||||||||||||||
| The accompanying notes are an integral part of these financial statements. | 59 |
FINANCIAL SQUARE FEDERAL INSTRUMENTS FUND
Financial Highlights
Selected Data for a Share Outstanding Throughout the Period
| Year - Share Class | Net asset value, beginning of period | Net investment income (loss) | Distributions from net investment income(a) | |||||||||||
| FOR THE PERIOD ENDED FEBRUARY 29, (UNAUDITED)* | ||||||||||||||
2016 - FST Institutional Shares | $ | 1.00 | $ | — | (c) | $ | — | (c) | ||||||
2016 - FST Select Shares | 1.00 | — | (c) | — | (c) | |||||||||
2016 - FST Preferred Shares | 1.00 | — | (c) | — | (c) | |||||||||
2016 - FST Capital Shares | 1.00 | — | (c) | — | (c) | |||||||||
2016 - FST Administration Shares | 1.00 | — | (c) | — | (c) | |||||||||
2016 - FST Premier Shares | 1.00 | — | (c) | — | (c) | |||||||||
2016 - FST Service Shares | 1.00 | — | (c) | — | (c) | |||||||||
2016 - FST Cash Management Shares | 1.00 | — | (c) | — | (c) | |||||||||
| * | Commenced operations on October 30, 2015. |
| (a) | Distributions may not coincide with the current year net investment income or net realized gains as distributions may be paid from current or prior year earnings. |
| (b) | Assumes reinvestment of all distributions. Returns do not reflect the deduction of taxes that a shareholder would pay on Fund distributions. Total returns for periods less than one full year are not annualized. |
| (c) | Amount is less than $0.0005 per share. |
| (d) | Amount is less than 0.005%. |
| (e) | Annualized. |
| (f) | Amount is less than 0.005% of average net assets. |
| 60 | The accompanying notes are an integral part of these financial statements. |
FINANCIAL SQUARE FEDERAL INSTRUMENTS FUND
| Net asset value, end of period | Total return(b) | Net assets period | Ratio of net expenses to average net assets | Ratio of total expenses to average net assets | Ratio of net assets | |||||||||||||||||||||||||||||
| $ | 1.00 | 0.04 | % | $ | 630,087 | 0.20 | %(e) | 0.37 | %(e) | 0.16 | %(e) | |||||||||||||||||||||||
| 1.00 | 0.03 | 50 | 0.22 | (e) | 0.40 | (e) | 0.10 | (e) | ||||||||||||||||||||||||||
| 1.00 | 0.02 | 50 | 0.27 | (e) | 0.47 | (e) | 0.05 | (e) | ||||||||||||||||||||||||||
| 1.00 | 0.01 | 50 | 0.30 | (e) | 0.52 | (e) | 0.02 | (e) | ||||||||||||||||||||||||||
| 1.00 | — | (d) | 34,741 | 0.35 | (e) | 0.62 | (e) | — | (e)(f) | |||||||||||||||||||||||||
| 1.00 | — | (d) | 50 | 0.31 | (e) | 0.72 | (e) | 0.01 | (e) | |||||||||||||||||||||||||
| 1.00 | — | (d) | 21,007 | 0.35 | (e) | 0.87 | (e) | — | (e)(f) | |||||||||||||||||||||||||
| 1.00 | — | (d) | 50 | 0.31 | (e) | 1.17 | (e) | 0.01 | (e) | |||||||||||||||||||||||||
| The accompanying notes are an integral part of these financial statements. | 61 |
FINANCIAL SQUARE GOVERNMENT FUND
Financial Highlights
Selected Data for a Share Outstanding Throughout Each Period
| Year - Share Class | Net asset value, beginning of period | Net investment income (loss) | Distributions from net investment income(a) | |||||||||||
| FOR THE SIX MONTHS ENDED FEBRUARY 29, (UNAUDITED) | ||||||||||||||
2016 - FST Institutional Shares | $ | 1.00 | $ | 0.001 | $ | (0.001 | ) | |||||||
2016 - FST Select Shares | 1.00 | — | (c) | — | (c) | |||||||||
2016 - FST Preferred Shares | 1.00 | — | (c) | — | (c) | |||||||||
2016 - FST Capital Shares | 1.00 | — | (c) | — | (c) | |||||||||
2016 - FST Administration Shares | 1.00 | — | (c) | — | (c) | |||||||||
2016 - FST Premier Shares | 1.00 | — | (c) | — | (c) | |||||||||
2016 - FST Service Shares | 1.00 | — | (c) | — | (c) | |||||||||
2016 - FST Resource Shares | 1.00 | — | (c) | — | (c) | |||||||||
2016 - FST Cash Management Shares | 1.00 | — | (c) | — | (c) | |||||||||
2016 - Class R6 Shares (Commenced operations on December 29, 2015) | 1.00 | — | (c) | — | (c) | |||||||||
2016 - Class A Shares (Commenced operations on February 29, 2016) | 1.00 | — | (c) | — | (c) | |||||||||
2016 - Class C Shares (Commenced operations on February 29, 2016) | 1.00 | — | (c) | — | (c) | |||||||||
| ‘ | FOR THE FISCAL YEARS ENDED AUGUST 31, | |||||||||||||
2015 - FST Institutional Shares | 1.00 | — | (c) | — | (c) | |||||||||
2015 - FST Select Shares | 1.00 | — | (c) | — | (c) | |||||||||
2015 - FST Preferred Shares | 1.00 | — | (c) | — | (c) | |||||||||
2015 - FST Capital Shares | 1.00 | — | (c) | — | (c) | |||||||||
2015 - FST Administration Shares | 1.00 | — | (c) | — | (c) | |||||||||
2015 - FST Premier Shares | 1.00 | — | (c) | — | (c) | |||||||||
2015 - FST Service Shares | 1.00 | — | (c) | — | (c) | |||||||||
2015 - FST Resource Shares | 1.00 | — | (c) | — | (c) | |||||||||
2015 - FST Cash Management Shares | 1.00 | — | (c) | — | (c) | |||||||||
2014 - FST Institutional Shares | 1.00 | — | (c) | — | (c) | |||||||||
2014 - FST Select Shares | 1.00 | — | (c) | — | (c) | |||||||||
2014 - FST Preferred Shares | 1.00 | — | (c) | — | (c) | |||||||||
2014 - FST Capital Shares | 1.00 | — | (c) | — | (c) | |||||||||
2014 - FST Administration Shares | 1.00 | — | (c) | — | (c) | |||||||||
2014 - FST Premier Shares | 1.00 | — | (c) | — | (c) | |||||||||
2014 - FST Service Shares | 1.00 | — | (c) | — | (c) | |||||||||
2014 - FST Resource Shares | 1.00 | — | (c) | — | (c) | |||||||||
2014 - FST Cash Management Shares | 1.00 | — | (c) | — | (c) | |||||||||
2013 - FST Institutional Shares | 1.00 | — | (c) | — | (c) | |||||||||
2013 - FST Select Shares | 1.00 | — | (c) | — | (c) | |||||||||
2013 - FST Preferred Shares | 1.00 | — | (c) | — | (c) | |||||||||
2013 - FST Capital Shares | 1.00 | — | (c) | — | (c) | |||||||||
2013 - FST Administration Shares | 1.00 | — | (c) | — | (c) | |||||||||
2013 - FST Premier Shares | 1.00 | — | (c) | — | (c) | |||||||||
2013 - FST Service Shares | 1.00 | — | (c) | — | (c) | |||||||||
2013 - FST Resource Shares | 1.00 | — | (c) | — | (c) | |||||||||
2013 - FST Cash Management Shares | 1.00 | — | (c) | — | (c) | |||||||||
2012 - FST Institutional Shares | 1.00 | — | (c) | — | (c) | |||||||||
2012 - FST Select Shares | 1.00 | — | (c) | — | (c) | |||||||||
2012 - FST Preferred Shares | 1.00 | — | (c) | — | (c) | |||||||||
2012 - FST Capital Shares | 1.00 | — | (c) | — | (c) | |||||||||
2012 - FST Administration Shares | 1.00 | — | (c) | — | (c) | |||||||||
2012 - FST Premier Shares | 1.00 | — | (c) | — | (c) | |||||||||
2012 - FST Service Shares | 1.00 | — | (c) | — | (c) | |||||||||
2012 - FST Resource Shares | 1.00 | — | (c) | — | (c) | |||||||||
2012 - FST Cash Management Shares | 1.00 | — | (c) | — | (c) | |||||||||
2011 - FST Institutional Shares | 1.00 | — | (c) | — | (c) | |||||||||
2011 - FST Select Shares | 1.00 | — | (c) | — | (c) | |||||||||
2011 - FST Preferred Shares | 1.00 | — | (c) | — | (c) | |||||||||
2011 - FST Capital Shares | 1.00 | — | (c) | — | (c) | |||||||||
2011 - FST Administration Shares | 1.00 | — | (c) | — | (c) | |||||||||
2011 - FST Premier Shares | 1.00 | — | (c) | — | (c) | |||||||||
2011 - FST Service Shares | 1.00 | — | (c) | — | (c) | |||||||||
2011 - FST Resource Shares | 1.00 | — | (c) | — | (c) | |||||||||
2011 - FST Cash Management Shares | 1.00 | — | (c) | — | (c) | |||||||||
| (a) | Distributions may not coincide with the current year net investment income or net realized gains as distributions may be paid from current or prior year earnings. |
| (b) | Assumes reinvestment of all distributions. Returns do not reflect the deduction of taxes that a shareholder would pay on Fund distributions. Total returns for periods less than one full year are not annualized. |
| (c) | Amount is less than $0.0005 per share. |
| (d) | Amount is less than 0.005%. |
| (e) | Annualized. |
| (f) | Amount is less than 0.005% of average net assets. |
| 62 | The accompanying notes are an integral part of these financial statements. |
FINANCIAL SQUARE GOVERNMENT FUND
| Net asset value, end of period | Total return(b) | Net assets period | Ratio of net expenses to average net assets | Ratio of total expenses to average net assets | Ratio of net assets | |||||||||||||||||||||||||||||
| $ | 1.00 | 0.06 | % | $ | 41,590,800 | 0.18 | %(e) | 0.23 | %(e) | 0.12 | %(e) | |||||||||||||||||||||||
| 1.00 | 0.04 | 182,831 | 0.21 | (e) | 0.26 | (e) | 0.08 | (e) | ||||||||||||||||||||||||||
| 1.00 | 0.03 | 93,336 | 0.23 | (e) | 0.33 | (e) | 0.03 | (e) | ||||||||||||||||||||||||||
| 1.00 | 0.02 | 1,188,130 | 0.26 | (e) | 0.38 | (e) | 0.03 | (e) | ||||||||||||||||||||||||||
| 1.00 | — | (d) | 2,732,149 | 0.30 | (e) | 0.48 | (e) | — | (e)(f) | |||||||||||||||||||||||||
| 1.00 | — | (d) | 1 | 0.20 | (e) | 0.58 | (e) | 0.37 | (e) | |||||||||||||||||||||||||
| 1.00 | — | (d) | 344,377 | 0.28 | (e) | 0.73 | (e) | — | (e)(f) | |||||||||||||||||||||||||
| 1.00 | — | (d) | 22,906 | 0.39 | (e) | 0.88 | (e) | — | (e)(f) | |||||||||||||||||||||||||
| 1.00 | — | (d) | 5 | 0.25 | (e) | 1.03 | (e) | 0.08 | (e) | |||||||||||||||||||||||||
| 1.00 | 0.04 | 10 | 0.18 | (e) | 0.23 | (e) | 0.21 | (e) | ||||||||||||||||||||||||||
| 1.00 | — | (d) | 10 | 0.33 | (e) | 0.48 | (e) | 0.04 | (e) | |||||||||||||||||||||||||
| 1.00 | — | (d) | 10 | 0.33 | (e) | 1.23 | (e) | 0.04 | (e) | |||||||||||||||||||||||||
| 1.00 | 0.01 | 29,753,210 | 0.14 | 0.23 | 0.01 | |||||||||||||||||||||||||||||
| 1.00 | 0.01 | 203,098 | 0.14 | 0.26 | 0.01 | |||||||||||||||||||||||||||||
| 1.00 | 0.01 | 249,542 | 0.14 | 0.33 | 0.01 | |||||||||||||||||||||||||||||
| 1.00 | 0.01 | 1,174,099 | 0.14 | 0.38 | 0.01 | |||||||||||||||||||||||||||||
| 1.00 | 0.01 | 1,920,203 | 0.14 | 0.48 | 0.01 | |||||||||||||||||||||||||||||
| 1.00 | 0.01 | 1 | 0.14 | 0.58 | 0.40 | |||||||||||||||||||||||||||||
| 1.00 | 0.01 | 468,041 | 0.14 | 0.73 | 0.01 | |||||||||||||||||||||||||||||
| 1.00 | 0.01 | 1 | 0.14 | 0.88 | 0.40 | |||||||||||||||||||||||||||||
| 1.00 | 0.01 | 4 | 0.14 | 1.03 | 0.22 | |||||||||||||||||||||||||||||
| 1.00 | 0.01 | 22,069,515 | 0.12 | 0.23 | — | (f) | ||||||||||||||||||||||||||||
| 1.00 | 0.01 | 101,446 | 0.12 | 0.26 | — | (f) | ||||||||||||||||||||||||||||
| 1.00 | 0.01 | 266,881 | 0.12 | 0.33 | — | (f) | ||||||||||||||||||||||||||||
| 1.00 | 0.01 | 1,113,078 | 0.12 | 0.38 | — | (f) | ||||||||||||||||||||||||||||
| 1.00 | 0.01 | 1,939,309 | 0.12 | 0.48 | — | (f) | ||||||||||||||||||||||||||||
| 1.00 | 0.01 | 1 | 0.12 | 0.58 | — | (f) | ||||||||||||||||||||||||||||
| 1.00 | 0.01 | 376,094 | 0.12 | 0.73 | — | (f) | ||||||||||||||||||||||||||||
| 1.00 | 0.01 | 1 | 0.12 | 0.88 | 0.40 | |||||||||||||||||||||||||||||
| 1.00 | 0.01 | 1 | 0.12 | 1.03 | 0.40 | |||||||||||||||||||||||||||||
| 1.00 | 0.03 | 21,751,069 | 0.18 | 0.23 | 0.03 | |||||||||||||||||||||||||||||
| 1.00 | 0.01 | 145,992 | 0.20 | 0.26 | 0.02 | |||||||||||||||||||||||||||||
| 1.00 | 0.01 | 305,546 | 0.21 | 0.33 | — | (f) | ||||||||||||||||||||||||||||
| 1.00 | 0.01 | 411,426 | 0.20 | 0.38 | — | (f) | ||||||||||||||||||||||||||||
| 1.00 | 0.01 | 1,983,578 | 0.20 | 0.48 | — | (f) | ||||||||||||||||||||||||||||
| 1.00 | 0.01 | 5,416 | 0.20 | 0.58 | — | (f) | ||||||||||||||||||||||||||||
| 1.00 | 0.01 | 260,856 | 0.20 | 0.73 | — | (f) | ||||||||||||||||||||||||||||
| 1.00 | 0.01 | 1 | 0.18 | 0.88 | 0.40 | |||||||||||||||||||||||||||||
| 1.00 | 0.01 | 1 | 0.18 | 1.03 | 0.40 | |||||||||||||||||||||||||||||
| 1.00 | 0.03 | 28,326,048 | 0.18 | 0.23 | 0.03 | |||||||||||||||||||||||||||||
| 1.00 | 0.01 | 628,155 | 0.20 | 0.26 | 0.01 | |||||||||||||||||||||||||||||
| 1.00 | 0.01 | 546,452 | 0.20 | 0.33 | 0.01 | |||||||||||||||||||||||||||||
| 1.00 | 0.01 | 493,427 | 0.20 | 0.38 | 0.01 | |||||||||||||||||||||||||||||
| 1.00 | 0.01 | 2,382,900 | 0.20 | 0.48 | 0.01 | |||||||||||||||||||||||||||||
| 1.00 | 0.01 | 5,594 | 0.21 | 0.58 | 0.01 | |||||||||||||||||||||||||||||
| 1.00 | 0.01 | 374,051 | 0.20 | 0.73 | 0.01 | |||||||||||||||||||||||||||||
| 1.00 | 0.01 | 1 | 0.18 | 0.88 | 0.40 | |||||||||||||||||||||||||||||
| 1.00 | 0.01 | 1 | 0.18 | 1.03 | 0.40 | |||||||||||||||||||||||||||||
| 1.00 | 0.04 | 20,959,643 | 0.18 | 0.23 | 0.04 | |||||||||||||||||||||||||||||
| 1.00 | 0.02 | 474,953 | 0.20 | 0.26 | 0.03 | |||||||||||||||||||||||||||||
| 1.00 | 0.01 | 652,225 | 0.22 | 0.33 | — | (f) | ||||||||||||||||||||||||||||
| 1.00 | 0.01 | 815,275 | 0.22 | 0.38 | — | (f) | ||||||||||||||||||||||||||||
| 1.00 | 0.01 | 1,956,642 | 0.22 | 0.48 | — | (f) | ||||||||||||||||||||||||||||
| 1.00 | 0.01 | 1 | 0.22 | 0.58 | 0.28 | |||||||||||||||||||||||||||||
| 1.00 | 0.01 | 478,866 | 0.21 | 0.73 | — | (f) | ||||||||||||||||||||||||||||
| 1.00 | 0.01 | 1 | 0.22 | 0.88 | 0.28 | |||||||||||||||||||||||||||||
| 1.00 | 0.01 | 1 | 0.22 | 1.03 | — | (f) | ||||||||||||||||||||||||||||
| The accompanying notes are an integral part of these financial statements. | 63 |
FINANCIAL SQUARE MONEY MARKET FUND
Financial Highlights
Selected Data for a Share Outstanding Throughout Each Period
| Year - Share Class | Net asset value, beginning of period | Net investment income (loss) | Distributions | |||||||||||
| FOR THE SIX MONTHS ENDED FEBRUARY 29, (UNAUDITED) | ||||||||||||||
2016 - FST Institutional Shares | $ | 1.00 | $ | 0.001 | $ | (0.001 | ) | |||||||
2016 - FST Select Shares | 1.00 | 0.001 | (0.001 | ) | ||||||||||
2016 - FST Preferred Shares | 1.00 | 0.001 | (0.001 | ) | ||||||||||
2016 - FST Capital Shares | 1.00 | — | (c) | — | (c) | |||||||||
2016 - FST Administration Shares | 1.00 | — | (c) | — | (c) | |||||||||
2016 - FST Premier Shares | 1.00 | — | (c) | — | (c) | |||||||||
2016 - FST Service Shares | 1.00 | — | (c) | — | (c) | |||||||||
2016 - FST Resource Shares | 1.00 | — | (c) | — | (c) | |||||||||
2016 - FST Cash Management Shares | 1.00 | — | (c) | — | (c) | |||||||||
| FOR THE FISCAL YEARS ENDED AUGUST 31, | ||||||||||||||
2015 - FST Institutional Shares | 1.00 | 0.001 | (0.001 | ) | ||||||||||
2015 - FST Select Shares | 1.00 | 0.001 | (0.001 | ) | ||||||||||
2015 - FST Preferred Shares | 1.00 | — | (c) | — | (c) | |||||||||
2015 - FST Capital Shares | 1.00 | — | (c) | — | (c) | |||||||||
2015 - FST Administration Shares | 1.00 | — | (c) | — | (c) | |||||||||
2015 - FST Premier Shares | 1.00 | — | (c) | — | (c) | |||||||||
2015 - FST Service Shares | 1.00 | — | (c) | — | (c) | |||||||||
2015 - FST Resource Shares | 1.00 | — | (c) | — | (c) | |||||||||
2015 - FST Cash Management Shares | 1.00 | — | (c) | — | (c) | |||||||||
2014 - FST Institutional Shares | 1.00 | 0.001 | (0.001 | ) | ||||||||||
2014 - FST Select Shares | 1.00 | — | (c) | — | (c) | |||||||||
2014 - FST Preferred Shares | 1.00 | — | (c) | — | (c) | |||||||||
2014 - FST Capital Shares | 1.00 | — | (c) | — | (c) | |||||||||
2014 - FST Administration Shares | 1.00 | — | (c) | — | (c) | |||||||||
2014 - FST Premier Shares | 1.00 | — | (c) | — | (c) | |||||||||
2014 - FST Service Shares | 1.00 | — | (c) | — | (c) | |||||||||
2014 - FST Resource Shares | 1.00 | — | (c) | — | (c) | |||||||||
2014 - FST Cash Management Shares | 1.00 | — | (c) | — | (c) | |||||||||
2013 - FST Institutional Shares | 1.00 | 0.001 | (0.001 | ) | ||||||||||
2013 - FST Select Shares | 1.00 | 0.001 | (0.001 | ) | ||||||||||
2013 - FST Preferred Shares | 1.00 | — | (c) | — | (c) | |||||||||
2013 - FST Capital Shares | 1.00 | — | (c) | — | (c) | |||||||||
2013 - FST Administration Shares | 1.00 | — | (c) | — | (c) | |||||||||
2013 - FST Premier Shares | 1.00 | — | (c) | — | (c) | |||||||||
2013 - FST Service Shares | 1.00 | — | (c) | — | (c) | |||||||||
2013 - FST Resource Shares | 1.00 | — | (c) | — | (c) | |||||||||
2013 - FST Cash Management Shares | 1.00 | — | (c) | — | (c) | |||||||||
2012 - FST Institutional Shares | 1.00 | 0.002 | (0.002 | ) | ||||||||||
2012 - FST Select Shares | 1.00 | 0.001 | (0.001 | ) | ||||||||||
2012 - FST Preferred Shares | 1.00 | 0.001 | (0.001 | ) | ||||||||||
2012 - FST Capital Shares | 1.00 | — | (c) | — | (c) | |||||||||
2012 - FST Administration Shares | 1.00 | — | (c) | — | (c) | |||||||||
2012 - FST Premier Shares | 1.00 | — | (c) | — | (c) | |||||||||
2012 - FST Service Shares | 1.00 | — | (c) | — | (c) | |||||||||
2012 - FST Resource Shares | 1.00 | — | (c) | — | (c) | |||||||||
2012 - FST Cash Management Shares | 1.00 | — | (c) | — | (c) | |||||||||
2011 - FST Institutional Shares | 1.00 | 0.001 | (0.001 | ) | ||||||||||
2011 - FST Select Shares | 1.00 | 0.001 | (0.001 | ) | ||||||||||
2011 - FST Preferred Shares | 1.00 | — | (c) | — | (c) | |||||||||
2011 - FST Capital Shares | 1.00 | — | (c) | — | (c) | |||||||||
2011 - FST Administration Shares | 1.00 | — | (c) | — | (c) | |||||||||
2011 - FST Premier Shares | 1.00 | — | (c) | — | (c) | |||||||||
2011 - FST Service Shares | 1.00 | — | (c) | — | (c) | |||||||||
2011 - FST Resource Shares | 1.00 | — | (c) | — | (c) | |||||||||
2011 - FST Cash Management Shares | 1.00 | — | (c) | — | (c) | |||||||||
| (a) | Distributions may not coincide with the current year net investment income or net realized gains as distributions may be paid from current or prior year earnings. |
| (b) | Assumes reinvestment of all distributions. Returns do not reflect the deduction of taxes that a shareholder would pay on Fund distributions. Total returns for periods less than one full year are not annualized. |
| (c) | Amount is less than $0.0005 per share. |
| (d) | Amount is less than 0.005%. |
| (e) | Annualized. |
| (f) | Amount is less than 0.005% of average net assets. |
| 64 | The accompanying notes are an integral part of these financial statements. |
FINANCIAL SQUARE MONEY MARKET FUND
| Net asset value, end of period | Total return(b) | Net assets end of period | Ratio of net expenses to average net assets | Ratio of total expenses to average net assets | Ratio of net investment income (loss) to average net assets | |||||||||||||||||||||||||||||
| $ | 1.00 | 0.12 | % | $ | 42,909,776 | 0.18 | %(e) | 0.23 | %(e) | 0.23 | %(e) | |||||||||||||||||||||||
| 1.00 | 0.10 | 2,349,107 | 0.21 | (e) | 0.26 | (e) | 0.21 | (e) | ||||||||||||||||||||||||||
| 1.00 | 0.07 | 63,854 | 0.28 | (e) | 0.33 | (e) | 0.11 | (e) | ||||||||||||||||||||||||||
| 1.00 | 0.05 | 323,128 | 0.33 | (e) | 0.38 | (e) | 0.10 | (e) | ||||||||||||||||||||||||||
| 1.00 | 0.03 | 354,156 | 0.36 | (e) | 0.48 | (e) | 0.04 | (e) | ||||||||||||||||||||||||||
| 1.00 | 0.03 | 1 | 0.19 | (e) | 0.58 | (e) | 0.37 | (e) | ||||||||||||||||||||||||||
| 1.00 | — | (d) | 25,953 | 0.41 | (e) | 0.73 | (e) | — | (e)(f) | |||||||||||||||||||||||||
| 1.00 | 0.03 | 1 | 0.19 | (e) | 0.88 | (e) | 0.37 | (e) | ||||||||||||||||||||||||||
| 1.00 | — | (d) | 11,881 | 0.42 | (e) | 1.03 | (e) | — | (e)(f) | |||||||||||||||||||||||||
| 1.00 | 0.09 | 32,746,797 | 0.18 | 0.23 | 0.08 | |||||||||||||||||||||||||||||
| 1.00 | 0.06 | 1,917,216 | 0.21 | 0.26 | 0.06 | |||||||||||||||||||||||||||||
| 1.00 | 0.01 | 116,846 | 0.26 | 0.33 | 0.01 | |||||||||||||||||||||||||||||
| 1.00 | 0.01 | 201,440 | 0.27 | 0.38 | — | (f) | ||||||||||||||||||||||||||||
| 1.00 | 0.01 | 430,947 | 0.26 | 0.48 | — | (f) | ||||||||||||||||||||||||||||
| 1.00 | 0.01 | 1 | 0.18 | 0.58 | 0.40 | |||||||||||||||||||||||||||||
| 1.00 | 0.01 | 21,066 | 0.26 | 0.73 | — | (f) | ||||||||||||||||||||||||||||
| 1.00 | 0.01 | 1 | 0.18 | 0.88 | 0.40 | |||||||||||||||||||||||||||||
| 1.00 | 0.01 | 8,041 | 0.28 | 1.03 | — | (f) | ||||||||||||||||||||||||||||
| 1.00 | 0.06 | 26,529,130 | 0.18 | 0.23 | 0.06 | |||||||||||||||||||||||||||||
| 1.00 | 0.03 | 527,470 | 0.21 | 0.26 | 0.03 | |||||||||||||||||||||||||||||
| 1.00 | 0.01 | 66,193 | 0.24 | 0.33 | 0.01 | |||||||||||||||||||||||||||||
| 1.00 | 0.01 | 36,709 | 0.24 | 0.38 | 0.01 | |||||||||||||||||||||||||||||
| 1.00 | 0.01 | 277,404 | 0.24 | 0.48 | 0.01 | |||||||||||||||||||||||||||||
| 1.00 | 0.01 | 1 | 0.24 | 0.58 | 0.01 | |||||||||||||||||||||||||||||
| 1.00 | 0.01 | 20,963 | 0.24 | 0.73 | 0.01 | |||||||||||||||||||||||||||||
| 1.00 | 0.01 | 1 | 0.18 | 0.88 | 0.40 | |||||||||||||||||||||||||||||
| 1.00 | 0.01 | 1 | 0.18 | 1.03 | 0.40 | |||||||||||||||||||||||||||||
| 1.00 | 0.11 | 25,047,026 | 0.18 | 0.23 | 0.11 | |||||||||||||||||||||||||||||
| 1.00 | 0.08 | 178,080 | 0.21 | 0.26 | 0.08 | |||||||||||||||||||||||||||||
| 1.00 | 0.02 | 44,177 | 0.27 | 0.33 | 0.02 | |||||||||||||||||||||||||||||
| 1.00 | 0.01 | 44,542 | 0.28 | 0.38 | — | (f) | ||||||||||||||||||||||||||||
| 1.00 | 0.01 | 338,423 | 0.29 | 0.48 | — | (f) | ||||||||||||||||||||||||||||
| 1.00 | 0.01 | 30,335 | 0.28 | 0.58 | — | (f) | ||||||||||||||||||||||||||||
| 1.00 | 0.01 | 40,544 | 0.28 | 0.73 | — | (f) | ||||||||||||||||||||||||||||
| 1.00 | 0.01 | 1 | 0.18 | 0.88 | 0.40 | |||||||||||||||||||||||||||||
| 1.00 | 0.01 | 1 | 0.18 | 1.03 | 0.40 | |||||||||||||||||||||||||||||
| 1.00 | 0.17 | 20,278,527 | 0.18 | 0.23 | 0.17 | |||||||||||||||||||||||||||||
| 1.00 | 0.14 | 151,931 | 0.21 | 0.26 | 0.14 | |||||||||||||||||||||||||||||
| 1.00 | 0.07 | 34,142 | 0.28 | 0.33 | 0.07 | |||||||||||||||||||||||||||||
| 1.00 | 0.03 | 31,393 | 0.33 | 0.38 | 0.02 | |||||||||||||||||||||||||||||
| 1.00 | 0.01 | 400,478 | 0.35 | 0.48 | 0.01 | |||||||||||||||||||||||||||||
| 1.00 | 0.01 | 28,554 | 0.35 | 0.58 | 0.01 | |||||||||||||||||||||||||||||
| 1.00 | 0.01 | 24,931 | 0.34 | 0.73 | 0.01 | |||||||||||||||||||||||||||||
| 1.00 | 0.01 | 1 | 0.18 | 0.88 | 0.40 | |||||||||||||||||||||||||||||
| 1.00 | 0.01 | 1 | 0.18 | 1.03 | 0.40 | |||||||||||||||||||||||||||||
| 1.00 | 0.14 | 19,751,293 | 0.18 | 0.23 | 0.14 | |||||||||||||||||||||||||||||
| 1.00 | 0.11 | 212,150 | 0.21 | 0.26 | 0.10 | |||||||||||||||||||||||||||||
| 1.00 | 0.04 | 57,885 | 0.28 | 0.33 | 0.04 | |||||||||||||||||||||||||||||
| 1.00 | 0.02 | 47,555 | 0.31 | 0.38 | 0.01 | |||||||||||||||||||||||||||||
| 1.00 | 0.01 | 567,818 | 0.32 | 0.48 | — | (f) | ||||||||||||||||||||||||||||
| 1.00 | 0.01 | 10,572 | 0.29 | 0.58 | — | (f) | ||||||||||||||||||||||||||||
| 1.00 | 0.01 | 148,341 | 0.31 | 0.73 | — | (f) | ||||||||||||||||||||||||||||
| 1.00 | 0.01 | 1 | 0.28 | 0.88 | 0.32 | |||||||||||||||||||||||||||||
| 1.00 | 0.01 | 1 | 0.40 | 1.03 | (0.07 | ) | ||||||||||||||||||||||||||||
| The accompanying notes are an integral part of these financial statements. | 65 |
FINANCIAL SQUARE PRIME OBLIGATIONS FUND
Financial Highlights
Selected Data for a Share Outstanding Throughout Each Period
| Year - Share Class | Net asset value, beginning of period | Net investment income (loss) | Distributions from net investment income(a) | |||||||||||
| FOR THE SIX MONTHS ENDED FEBRUARY 29, (UNAUDITED) | ||||||||||||||
2016 - FST Institutional Shares | $ | 1.00 | $ | 0.001 | $ | (0.001 | ) | |||||||
2016 - FST Select Shares | 1.00 | 0.001 | (0.001 | ) | ||||||||||
2016 - FST Preferred Shares | 1.00 | 0.001 | (0.001 | ) | ||||||||||
2016 - FST Capital Shares | 1.00 | — | (c) | — | (c) | |||||||||
2016 - FST Administration Shares | 1.00 | — | (c) | — | (c) | |||||||||
2016 - FST Premier Shares | 1.00 | — | (c) | — | (c) | |||||||||
2016 - FST Service Shares | 1.00 | — | (c) | — | (c) | |||||||||
2016 - FST Resource Shares | 1.00 | — | (c) | — | (c) | |||||||||
2016 - FST Cash Management Shares | 1.00 | — | (c) | — | (c) | |||||||||
2016 - Class C Shares | 1.00 | — | (c) | — | (c) | |||||||||
| FOR THE FISCAL YEARS ENDED AUGUST 31 , | ||||||||||||||
2015 - FST Institutional Shares | 1.00 | — | (c) | — | (c) | |||||||||
2015 - FST Select Shares | 1.00 | — | (c) | — | (c) | |||||||||
2015 - FST Preferred Shares | 1.00 | — | (c) | — | (c) | |||||||||
2015 - FST Capital Shares | 1.00 | — | (c) | — | (c) | |||||||||
2015 - FST Administration Shares | 1.00 | — | (c) | — | (c) | |||||||||
2015 - FST Premier Shares | 1.00 | — | (c) | — | (c) | |||||||||
2015 - FST Service Shares | 1.00 | — | (c) | — | (c) | |||||||||
2015 - FST Resource Shares | 1.00 | — | (c) | — | (c) | |||||||||
2015 - FST Cash Management Shares | 1.00 | — | (c) | — | (c) | |||||||||
2015 - Class C Shares | 1.00 | — | (c) | — | (c) | |||||||||
2014 - FST Institutional Shares | 1.00 | — | (c) | — | (c) | |||||||||
2014 - FST Select Shares | 1.00 | — | (c) | — | (c) | |||||||||
2014 - FST Preferred Shares | 1.00 | — | (c) | — | (c) | |||||||||
2014 - FST Capital Shares | 1.00 | — | (c) | — | (c) | |||||||||
2014 - FST Administration Shares | 1.00 | — | (c) | — | (c) | |||||||||
2014 - FST Premier Shares | 1.00 | — | (c) | — | (c) | |||||||||
2014 - FST Service Shares | 1.00 | — | (c) | — | (c) | |||||||||
2014 - FST Resource Shares | 1.00 | — | (c) | — | (c) | |||||||||
2014 - FST Cash Management Shares | 1.00 | — | (c) | — | (c) | |||||||||
2014 - Class C Shares | 1.00 | — | (c) | — | (c) | |||||||||
2013 - FST Institutional Shares | 1.00 | 0.001 | (0.001 | ) | ||||||||||
2013 - FST Select Shares | 1.00 | — | (c) | — | (c) | |||||||||
2013 - FST Preferred Shares | 1.00 | — | (c) | — | (c) | |||||||||
2013 - FST Capital Shares | 1.00 | — | (c) | — | (c) | |||||||||
2013 - FST Administration Shares | 1.00 | — | (c) | — | (c) | |||||||||
2013 - FST Premier Shares | 1.00 | — | (c) | — | (c) | |||||||||
2013 - FST Service Shares | 1.00 | — | (c) | — | (c) | |||||||||
2013 - FST Resource Shares | 1.00 | — | (c) | — | (c) | |||||||||
2013 - FST Cash Management Shares | 1.00 | — | (c) | — | (c) | |||||||||
2013 - Class C Shares | 1.00 | — | (c) | — | (c) | |||||||||
2012 - FST Institutional Shares | 1.00 | 0.001 | (0.001 | ) | ||||||||||
2012 - FST Select Shares | 1.00 | 0.001 | (0.001 | ) | ||||||||||
2012 - FST Preferred Shares | 1.00 | — | (c) | — | (c) | |||||||||
2012 - FST Capital Shares | 1.00 | — | (c) | — | (c) | |||||||||
2012 - FST Administration Shares | 1.00 | — | (c) | — | (c) | |||||||||
2012 - FST Premier Shares | 1.00 | — | (c) | — | (c) | |||||||||
2012 - FST Service Shares | 1.00 | — | (c) | — | (c) | |||||||||
2012 - FST Resource Shares | 1.00 | — | (c) | — | (c) | |||||||||
2012 - FST Cash Management Shares | 1.00 | — | (c) | — | (c) | |||||||||
2012 - Class C Shares | 1.00 | — | (c) | — | (c) | |||||||||
2011 - FST Institutional Shares | 1.00 | 0.001 | (0.001 | ) | ||||||||||
2011 - FST Select Shares | 1.00 | 0.001 | (0.001 | ) | ||||||||||
2011 - FST Preferred Shares | 1.00 | — | (c) | — | (c) | |||||||||
2011 - FST Capital Shares | 1.00 | — | (c) | — | (c) | |||||||||
2011 - FST Administration Shares | 1.00 | — | (c) | — | (c) | |||||||||
2011 - FST Premier Shares | 1.00 | — | (c) | — | (c) | |||||||||
2011 - FST Service Shares | 1.00 | — | (c) | — | (c) | |||||||||
2011 - FST Resource Shares | 1.00 | — | (c) | — | (c) | |||||||||
2011 - FST Cash Management Shares | 1.00 | — | (c) | — | (c) | |||||||||
2011 - Class C Shares | 1.00 | — | (c) | — | (c) | |||||||||
| (a) | Distributions may not coincide with the current year net investment income or net realized gains as distributions may be paid from current or prior year earnings. |
| (b) | Assumes reinvestment of all distributions. Returns do not reflect the deduction of taxes that a shareholder would pay on Fund distributions. Total returns for periods less than one full year are not annualized. |
| (c) | Amount is less than $0.0005 per share. |
| (d) | Annualized. |
| (e) | Amount is less than 0.005% of average net assets. |
| 66 | The accompanying notes are an integral part of these financial statements. |
FINANCIAL SQUARE PRIME OBLIGATIONS FUND
| Net asset value, end of period | Total return(b) | Net assets end of period (in 000s) | Ratio of net expenses to average net assets | Ratio of total expenses to average net assets | Ratio of net assets | |||||||||||||||||||||||||||||
| $ | 1.00 | 0.10 | % | $ | 13,198,314 | 0.18 | %(d) | 0.23 | %(d) | 0.20 | %(d) | |||||||||||||||||||||||
| 1.00 | 0.08 | 94,780 | 0.21 | (d) | 0.26 | (d) | 0.16 | (d) | ||||||||||||||||||||||||||
| 1.00 | 0.05 | 269,512 | 0.27 | (d) | 0.33 | (d) | 0.09 | (d) | ||||||||||||||||||||||||||
| 1.00 | 0.04 | 166,497 | 0.30 | (d) | 0.38 | (d) | 0.08 | (d) | ||||||||||||||||||||||||||
| 1.00 | 0.02 | 1,700,225 | 0.34 | (d) | 0.48 | (d) | 0.03 | (d) | ||||||||||||||||||||||||||
| 1.00 | 0.02 | 1 | 0.18 | (d) | 0.58 | (d) | 0.36 | (d) | ||||||||||||||||||||||||||
| 1.00 | 0.01 | 566,990 | 0.36 | (d) | 0.73 | (d) | — | (d)(e) | ||||||||||||||||||||||||||
| 1.00 | 0.01 | 66,952 | 0.36 | (d) | 0.88 | (d) | — | (d)(e) | ||||||||||||||||||||||||||
| 1.00 | 0.02 | 1 | 0.18 | (d) | 1.03 | (d) | 0.37 | (d) | ||||||||||||||||||||||||||
| 1.00 | 0.01 | 22,186 | 0.37 | (d) | 1.23 | (d) | — | (d)(e) | ||||||||||||||||||||||||||
| 1.00 | 0.03 | 9,211,383 | 0.18 | 0.23 | 0.03 | |||||||||||||||||||||||||||||
| 1.00 | 0.01 | 88,996 | 0.20 | 0.26 | 0.01 | |||||||||||||||||||||||||||||
| 1.00 | 0.01 | 332,798 | 0.21 | 0.33 | 0.01 | |||||||||||||||||||||||||||||
| 1.00 | 0.01 | 103,978 | 0.21 | 0.38 | 0.01 | |||||||||||||||||||||||||||||
| 1.00 | 0.01 | 1,893,461 | 0.20 | 0.48 | 0.01 | |||||||||||||||||||||||||||||
| 1.00 | 0.01 | 1 | 0.18 | 0.58 | 0.40 | |||||||||||||||||||||||||||||
| 1.00 | 0.01 | 777,357 | 0.20 | 0.73 | 0.01 | |||||||||||||||||||||||||||||
| 1.00 | 0.01 | 72,031 | 0.20 | 0.88 | 0.01 | |||||||||||||||||||||||||||||
| 1.00 | 0.01 | 1 | 0.18 | 1.03 | 0.40 | |||||||||||||||||||||||||||||
| 1.00 | 0.01 | 19,918 | 0.20 | 1.23 | 0.01 | |||||||||||||||||||||||||||||
| 1.00 | 0.02 | 10,934,044 | 0.18 | 0.23 | 0.02 | |||||||||||||||||||||||||||||
| 1.00 | 0.01 | 118,994 | 0.19 | 0.26 | 0.01 | |||||||||||||||||||||||||||||
| 1.00 | 0.01 | 108,264 | 0.19 | 0.33 | 0.01 | |||||||||||||||||||||||||||||
| 1.00 | 0.01 | 72,327 | 0.19 | 0.38 | 0.01 | |||||||||||||||||||||||||||||
| 1.00 | 0.01 | 1,644,425 | 0.19 | 0.48 | 0.01 | |||||||||||||||||||||||||||||
| 1.00 | 0.01 | 1 | 0.18 | 0.58 | 0.40 | |||||||||||||||||||||||||||||
| 1.00 | 0.01 | 938,791 | 0.19 | 0.73 | 0.01 | |||||||||||||||||||||||||||||
| 1.00 | 0.01 | 78,532 | 0.19 | 0.88 | 0.01 | |||||||||||||||||||||||||||||
| 1.00 | 0.01 | 1 | 0.18 | 1.03 | 0.40 | |||||||||||||||||||||||||||||
| 1.00 | 0.01 | 20,870 | 0.19 | 1.23 | 0.01 | |||||||||||||||||||||||||||||
| 1.00 | 0.07 | 13,339,031 | 0.18 | 0.23 | 0.07 | |||||||||||||||||||||||||||||
| 1.00 | 0.05 | 212,468 | 0.21 | 0.26 | 0.04 | |||||||||||||||||||||||||||||
| 1.00 | 0.01 | 227,037 | 0.24 | 0.33 | — | (e) | ||||||||||||||||||||||||||||
| 1.00 | 0.01 | 102,509 | 0.26 | 0.38 | — | (e) | ||||||||||||||||||||||||||||
| 1.00 | 0.01 | 2,579,850 | 0.24 | 0.48 | — | (e) | ||||||||||||||||||||||||||||
| 1.00 | 0.01 | 1 | 0.18 | 0.58 | 0.40 | |||||||||||||||||||||||||||||
| 1.00 | 0.01 | 767,593 | 0.24 | 0.73 | — | (e) | ||||||||||||||||||||||||||||
| 1.00 | 0.01 | 91,805 | 0.25 | 0.88 | — | (e) | ||||||||||||||||||||||||||||
| 1.00 | 0.01 | 1 | 0.18 | 1.03 | 0.40 | |||||||||||||||||||||||||||||
| 1.00 | 0.01 | 23,106 | 0.25 | 1.23 | — | (e) | ||||||||||||||||||||||||||||
| 1.00 | 0.12 | 14,614,135 | 0.18 | 0.23 | 0.11 | |||||||||||||||||||||||||||||
| 1.00 | 0.09 | 325,596 | 0.21 | 0.26 | 0.09 | |||||||||||||||||||||||||||||
| 1.00 | 0.02 | 206,707 | 0.27 | 0.33 | 0.02 | |||||||||||||||||||||||||||||
| 1.00 | 0.01 | 187,844 | 0.29 | 0.38 | — | (e) | ||||||||||||||||||||||||||||
| 1.00 | 0.01 | 1,888,821 | 0.29 | 0.48 | — | (e) | ||||||||||||||||||||||||||||
| 1.00 | 0.01 | 1 | 0.18 | 0.58 | 0.40 | |||||||||||||||||||||||||||||
| 1.00 | 0.01 | 764,803 | 0.29 | 0.73 | — | (e) | ||||||||||||||||||||||||||||
| 1.00 | 0.01 | 139,778 | 0.29 | 0.88 | — | (e) | ||||||||||||||||||||||||||||
| 1.00 | 0.01 | 1 | 0.18 | 1.03 | 0.40 | |||||||||||||||||||||||||||||
| 1.00 | 0.01 | 26,300 | 0.29 | 1.23 | — | (e) | ||||||||||||||||||||||||||||
| 1.00 | 0.10 | 17,670,097 | 0.18 | 0.23 | 0.10 | |||||||||||||||||||||||||||||
| 1.00 | 0.07 | 151,663 | 0.21 | 0.26 | 0.07 | |||||||||||||||||||||||||||||
| 1.00 | 0.02 | 406,827 | 0.26 | 0.33 | 0.02 | |||||||||||||||||||||||||||||
| 1.00 | 0.01 | 179,018 | 0.28 | 0.38 | 0.01 | |||||||||||||||||||||||||||||
| 1.00 | 0.01 | 2,875,584 | 0.27 | 0.48 | 0.01 | |||||||||||||||||||||||||||||
| 1.00 | 0.01 | 1 | 0.23 | 0.58 | 0.30 | |||||||||||||||||||||||||||||
| 1.00 | 0.01 | 762,833 | 0.27 | 0.73 | 0.01 | |||||||||||||||||||||||||||||
| 1.00 | 0.01 | 147,232 | 0.27 | 0.88 | 0.01 | |||||||||||||||||||||||||||||
| 1.00 | 0.01 | 1 | 0.32 | 1.03 | 0.03 | |||||||||||||||||||||||||||||
| 1.00 | 0.01 | 32,646 | 0.27 | 1.23 | 0.01 | |||||||||||||||||||||||||||||
| The accompanying notes are an integral part of these financial statements. | 67 |
FINANCIAL SQUARE TAX-EXEMPT CALIFORNIA FUND
Financial Highlights
Selected Data for a Share Outstanding Throughout Each Period
| Year - Share Class | Net asset | Net investment income (loss) | Distributions from net investment income(a) | |||||||||||
| FOR THE SIX MONTHS ENDED FEBRUARY 29, (UNAUDITED) | ||||||||||||||
2016 - FST Institutional Shares | $ | 1.00 | $ | — | (c) | $ | — | (c) | ||||||
2016 - FST Administration Shares | 1.00 | — | (c) | — | (c) | |||||||||
2016 - FST Service Shares | 1.00 | — | (c) | — | (c) | |||||||||
2016 - FST Cash Management Shares | 1.00 | — | (c) | — | (c) | |||||||||
| FOR THE FISCAL YEARS ENDED AUGUST 31, | ||||||||||||||
2015 - FST Institutional Shares | 1.00 | — | (c) | — | (c) | |||||||||
2015 - FST Administration Shares | 1.00 | — | (c) | — | (c) | |||||||||
2015 - FST Service Shares | 1.00 | — | (c) | — | (c) | |||||||||
2015 - FST Cash Management Shares | 1.00 | — | (c) | — | (c) | |||||||||
2014 - FST Institutional Shares | 1.00 | — | (c) | — | (c) | |||||||||
2014 - FST Administration Shares | 1.00 | — | (c) | — | (c) | |||||||||
2014 - FST Service Shares | 1.00 | — | (c) | — | (c) | |||||||||
2014 - FST Cash Management Shares | 1.00 | — | (c) | — | (c) | |||||||||
2013 - FST Institutional Shares | 1.00 | — | (c) | — | (c) | |||||||||
2013 - FST Administration Shares | 1.00 | — | (c) | — | (c) | |||||||||
2013 - FST Service Shares | 1.00 | — | (c) | — | (c) | |||||||||
2013 - FST Cash Management Shares | 1.00 | — | (c) | — | (c) | |||||||||
2012 - FST Institutional Shares | 1.00 | — | (c) | — | (c) | |||||||||
2012 - FST Administration Shares | 1.00 | — | (c) | — | (c) | |||||||||
2012 - FST Service Shares | 1.00 | — | (c) | — | (c) | |||||||||
2012 - FST Cash Management Shares | 1.00 | — | (c) | — | (c) | |||||||||
2011 - FST Institutional Shares | 1.00 | — | (c) | — | (c) | |||||||||
2011 - FST Administration Shares | 1.00 | — | (c) | — | (c) | |||||||||
2011 - FST Service Shares | 1.00 | — | (c) | — | (c) | |||||||||
2011 - FST Cash Management Shares | 1.00 | — | (c) | — | (c) | |||||||||
| (a) | Distributions may not coincide with the current year net investment income or net realized gains as distributions may be paid from current or prior year earnings. |
| (b) | Assumes reinvestment of all distributions. Returns do not reflect the deduction of taxes that a shareholder would pay on Fund distributions. Total returns for periods less than one full year are not annualized. |
| (c) | Amount is less than $0.0005 per share. |
| (d) | Amount is less than $500. |
| (e) | Annualized. |
| 68 | The accompanying notes are an integral part of these financial statements. |
FINANCIAL SQUARE TAX-EXEMPT CALIFORNIA FUND
| Net asset value, end of period | Total return(b) | Net assets end of period (in 000s) | Ratio of net expenses to average net assets | Ratio of total expenses to average net assets | Ratio of net investment income (loss) to average net assets | |||||||||||||||||||||||||||||
| $ | 1.00 | 0.01 | % | $ | 185,115 | 0.04 | %(e) | 0.51 | %(e) | 0.01 | %(e) | |||||||||||||||||||||||
| 1.00 | 0.01 | — | (d) | 0.04 | (e) | 0.66 | (e) | 0.01 | %(e) | |||||||||||||||||||||||||
| 1.00 | 0.01 | 2 | 0.04 | (e) | 0.91 | (e) | 0.21 | (e) | ||||||||||||||||||||||||||
| 1.00 | 0.01 | 1 | 0.04 | (e) | 1.51 | (e) | 0.35 | (e) | ||||||||||||||||||||||||||
| 1.00 | 0.01 | 258,271 | 0.07 | 0.43 | 0.01 | |||||||||||||||||||||||||||||
| 1.00 | 0.01 | — | (d) | 0.07 | 0.58 | 0.01 | ||||||||||||||||||||||||||||
| 1.00 | 0.01 | 2 | 0.07 | 0.83 | 0.23 | |||||||||||||||||||||||||||||
| 1.00 | 0.01 | 1 | 0.07 | 1.43 | 0.39 | |||||||||||||||||||||||||||||
| 1.00 | 0.01 | 254,701 | 0.09 | 0.43 | 0.01 | |||||||||||||||||||||||||||||
| 1.00 | 0.01 | 1,300 | 0.09 | 0.58 | 0.01 | |||||||||||||||||||||||||||||
| 1.00 | 0.01 | 2 | 0.09 | 0.83 | 0.23 | |||||||||||||||||||||||||||||
| 1.00 | 0.01 | 1 | 0.09 | 1.43 | 0.39 | |||||||||||||||||||||||||||||
| 1.00 | 0.02 | 91,299 | 0.15 | 0.41 | 0.01 | |||||||||||||||||||||||||||||
| 1.00 | 0.02 | 224,999 | 0.15 | 0.56 | 0.01 | |||||||||||||||||||||||||||||
| 1.00 | 0.02 | 2 | 0.15 | 0.81 | 0.23 | |||||||||||||||||||||||||||||
| 1.00 | 0.02 | 1 | 0.15 | 1.41 | 0.39 | |||||||||||||||||||||||||||||
| 1.00 | 0.01 | 91,478 | 0.15 | 0.48 | 0.01 | |||||||||||||||||||||||||||||
| 1.00 | 0.01 | 151,848 | 0.15 | 0.63 | 0.01 | |||||||||||||||||||||||||||||
| 1.00 | 0.01 | 2 | 0.15 | 0.88 | 0.23 | |||||||||||||||||||||||||||||
| 1.00 | 0.01 | 1 | 0.15 | 1.48 | 0.29 | |||||||||||||||||||||||||||||
| 1.00 | 0.01 | 88,040 | 0.24 | 0.50 | 0.01 | |||||||||||||||||||||||||||||
| 1.00 | 0.01 | 145,131 | 0.24 | 0.65 | 0.01 | |||||||||||||||||||||||||||||
| 1.00 | 0.01 | 2 | 0.24 | 0.90 | 0.11 | |||||||||||||||||||||||||||||
| 1.00 | 0.01 | 1 | 0.24 | 1.50 | 0.09 | |||||||||||||||||||||||||||||
| The accompanying notes are an integral part of these financial statements. | 69 |
FINANCIAL SQUARE TAX-EXEMPT NEW YORK FUND
Financial Highlights
Selected Data for a Share Outstanding Throughout Each Period
| Year - Share Class | Net asset | Net investment income (loss) | Distributions from net investment income(a) | |||||||||||
| FOR THE SIX MONTHS ENDED FEBRUARY 29, (UNAUDITED) | ||||||||||||||
2016 - FST Institutional Shares | $ | 1.00 | $ | — | (c) | $ | — | (c) | ||||||
2016 - FST Administration Shares | 1.00 | — | (c) | — | (c) | |||||||||
2016 - FST Service Shares | 1.00 | — | (c) | — | (c) | |||||||||
2016 - FST Cash Management Shares | 1.00 | — | (c) | — | (c) | |||||||||
| FOR THE FISCAL YEARS ENDED AUGUST 31, | ||||||||||||||
2015 - FST Institutional Shares | 1.00 | — | (c) | — | (c) | |||||||||
2015 - FST Administration Shares | 1.00 | — | (c) | — | (c) | |||||||||
2015 - FST Service Shares | 1.00 | — | (c) | — | (c) | |||||||||
2015 - FST Cash Management Shares | 1.00 | — | (c) | — | (c) | |||||||||
2014 - FST Institutional Shares | 1.00 | — | (c) | — | (c) | |||||||||
2014 - FST Administration Shares | 1.00 | — | (c) | — | (c) | |||||||||
2014 - FST Service Shares | 1.00 | — | (c) | — | (c) | |||||||||
2014 - FST Cash Management Shares | 1.00 | — | (c) | — | (c) | |||||||||
2013 - FST Institutional Shares | 1.00 | — | (c) | — | (c) | |||||||||
2013 - FST Administration Shares | 1.00 | — | (c) | — | (c) | |||||||||
2013 - FST Service Shares | 1.00 | — | (c) | — | (c) | |||||||||
2013 - FST Cash Management Shares | 1.00 | — | (c) | — | (c) | |||||||||
2012 - FST Institutional Shares | 1.00 | — | (c) | — | (c) | |||||||||
2012 - FST Administration Shares | 1.00 | — | (c) | — | (c) | |||||||||
2012 - FST Service Shares | 1.00 | — | (c) | — | (c) | |||||||||
2012 - FST Cash Management Shares | 1.00 | — | (c) | — | (c) | |||||||||
2011 - FST Institutional Shares | 1.00 | — | (c) | — | (c) | |||||||||
2011 - FST Administration Shares | 1.00 | — | (c) | — | (c) | |||||||||
2011 - FST Service Shares | 1.00 | — | (c) | — | (c) | |||||||||
2011 - FST Cash Management Shares | 1.00 | — | (c) | — | (c) | |||||||||
| (a) | Distributions may not coincide with the current year net investment income or net realized gains as distributions may be paid from current or prior year earnings. |
| (b) | Assumes reinvestment of all distributions. Returns do not reflect the deduction of taxes that a shareholder would pay on Fund distributions. Total returns for periods less than one full year are not annualized. |
| (c) | Amount is less than $0.0005 per share. |
| (d) | Amount is less than $500. |
| (e) | Annualized. |
| 70 | The accompanying notes are an integral part of these financial statements. |
FINANCIAL SQUARE TAX-EXEMPT NEW YORK FUND
| Net asset value, end of period | Total return(b) | Net assets end of period (in 000s) | Ratio of net expenses to average net��assets | Ratio of total expenses to average net assets | Ratio of net investment income (loss) to average net assets | |||||||||||||||||||||||||||||
| $ | 1.00 | 0.02 | % | $ | 94,895 | 0.06 | %(e) | 0.70 | %(e) | 0.01 | %(e) | |||||||||||||||||||||||
| 1.00 | 0.02 | — | (d) | 0.06 | (e) | 0.85 | (e) | 0.01 | %(e) | |||||||||||||||||||||||||
| 1.00 | 0.02 | 1 | 0.06 | (e) | 1.10 | (e) | 0.46 | (e) | ||||||||||||||||||||||||||
| 1.00 | 0.02 | 1 | 0.06 | (e) | 1.70 | (e) | 0.35 | (e) | ||||||||||||||||||||||||||
| 1.00 | 0.01 | 90,861 | 0.08 | 0.53 | 0.01 | |||||||||||||||||||||||||||||
| 1.00 | 0.01 | — | (d) | 0.08 | 0.68 | 0.01 | ||||||||||||||||||||||||||||
| 1.00 | 0.01 | 1 | 0.08 | 0.93 | 0.50 | |||||||||||||||||||||||||||||
| 1.00 | 0.01 | 1 | 0.08 | 1.53 | 0.39 | |||||||||||||||||||||||||||||
| 1.00 | 0.01 | 123,516 | 0.09 | 0.45 | 0.01 | |||||||||||||||||||||||||||||
| 1.00 | 0.01 | 2,213 | 0.09 | 0.60 | 0.01 | |||||||||||||||||||||||||||||
| 1.00 | 0.01 | 1 | 0.09 | 0.85 | 0.50 | |||||||||||||||||||||||||||||
| 1.00 | 0.01 | 1 | 0.09 | 1.45 | 0.39 | |||||||||||||||||||||||||||||
| 1.00 | 0.01 | 18,880 | 0.14 | 0.42 | 0.01 | |||||||||||||||||||||||||||||
| 1.00 | 0.01 | 127,838 | 0.14 | 0.57 | 0.01 | |||||||||||||||||||||||||||||
| 1.00 | 0.01 | 1 | 0.14 | 0.82 | 0.50 | |||||||||||||||||||||||||||||
| 1.00 | 0.01 | 1 | 0.14 | 1.42 | 0.39 | |||||||||||||||||||||||||||||
| 1.00 | 0.01 | 21,067 | 0.16 | 0.52 | 0.01 | |||||||||||||||||||||||||||||
| 1.00 | 0.01 | 180,419 | 0.16 | 0.67 | 0.01 | |||||||||||||||||||||||||||||
| 1.00 | 0.01 | 1 | 0.16 | 0.92 | 0.50 | |||||||||||||||||||||||||||||
| 1.00 | 0.01 | 1 | 0.16 | 1.52 | 0.39 | |||||||||||||||||||||||||||||
| 1.00 | 0.03 | 20,954 | 0.22 | 0.55 | 0.01 | |||||||||||||||||||||||||||||
| 1.00 | 0.03 | 140,452 | 0.22 | 0.70 | 0.01 | |||||||||||||||||||||||||||||
| 1.00 | 0.03 | 1 | 0.22 | 0.95 | 0.28 | |||||||||||||||||||||||||||||
| 1.00 | 0.03 | 1 | 0.22 | 1.55 | 0.08 | |||||||||||||||||||||||||||||
| The accompanying notes are an integral part of these financial statements. | 71 |
FINANCIAL SQUARE TAX-FREE MONEY MARKET FUND
Financial Highlights
Selected Data for a Share Outstanding Throughout Each Period
| Year - Share Class | Net asset | Net investment income (loss) | Distributions from net investment income(a) | |||||||||||
| FOR THE SIX MONTHS ENDED FEBRUARY 29, (UNAUDITED) | ||||||||||||||
2016 - FST Institutional Shares | $ | 1.00 | $ | — | (c) | $ | — | (c) | ||||||
2016 - FST Select Shares | 1.00 | — | (c) | — | (c) | |||||||||
2016 - FST Preferred Shares | 1.00 | — | (c) | — | (c) | |||||||||
2016 - FST Capital Shares | 1.00 | — | (c) | — | (c) | |||||||||
2016 - FST Administration Shares | 1.00 | — | (c) | — | (c) | |||||||||
2016 - FST Premier Shares | 1.00 | — | (c) | — | (c) | |||||||||
2016 - FST Service Shares | 1.00 | — | (c) | — | (c) | |||||||||
2016 - FST Resource Shares | 1.00 | — | (c) | — | (c) | |||||||||
2016 - FST Cash Management Shares | 1.00 | — | (c) | — | (c) | |||||||||
| FOR THE FISCAL YEARS ENDED AUGUST 31, | ||||||||||||||
2015 - FST Institutional Shares | 1.00 | — | (c) | — | (c) | |||||||||
2015 - FST Select Shares | 1.00 | — | (c) | — | (c) | |||||||||
2015 - FST Preferred Shares | 1.00 | — | (c) | — | (c) | |||||||||
2015 - FST Capital Shares | 1.00 | — | (c) | — | (c) | |||||||||
2015 - FST Administration Shares | 1.00 | — | (c) | — | (c) | |||||||||
2015 - FST Premier Shares | 1.00 | — | (c) | — | (c) | |||||||||
2015 - FST Service Shares | 1.00 | — | (c) | — | (c) | |||||||||
2015 - FST Resource Shares | 1.00 | — | (c) | — | (c) | |||||||||
2015 - FST Cash Management Shares | 1.00 | — | (c) | — | (c) | |||||||||
2014 - FST Institutional Shares | 1.00 | — | (c) | — | (c) | |||||||||
2014 - FST Select Shares | 1.00 | — | (c) | — | (c) | |||||||||
2014 - FST Preferred Shares | 1.00 | — | (c) | — | (c) | |||||||||
2014 - FST Capital Shares | 1.00 | — | (c) | — | (c) | |||||||||
2014 - FST Administration Shares | 1.00 | — | (c) | — | (c) | |||||||||
2014 - FST Premier Shares | 1.00 | — | (c) | — | (c) | |||||||||
2014 - FST Service Shares | 1.00 | — | (c) | — | (c) | |||||||||
2014 - FST Resource Shares | 1.00 | — | (c) | — | (c) | |||||||||
2014 - FST Cash Management Shares | 1.00 | — | (c) | — | (c) | |||||||||
2013 - FST Institutional Shares | 1.00 | — | (c) | — | (c) | |||||||||
2013 - FST Select Shares | 1.00 | — | (c) | — | (c) | |||||||||
2013 - FST Preferred Shares | 1.00 | — | (c) | — | (c) | |||||||||
2013 - FST Capital Shares | 1.00 | — | (c) | — | (c) | |||||||||
2013 - FST Administration Shares | 1.00 | — | (c) | — | (c) | |||||||||
2013 - FST Premier Shares | 1.00 | — | (c) | — | (c) | |||||||||
2013 - FST Service Shares | 1.00 | — | (c) | — | (c) | |||||||||
2013 - FST Resource Shares | 1.00 | — | (c) | — | (c) | |||||||||
2013 - FST Cash Management Shares | 1.00 | — | (c) | — | (c) | |||||||||
2012 - FST Institutional Shares | 1.00 | — | (c) | — | (c) | |||||||||
2012 - FST Select Shares | 1.00 | — | (c) | — | (c) | |||||||||
2012 - FST Preferred Shares | 1.00 | — | (c) | — | (c) | |||||||||
2012 - FST Capital Shares | 1.00 | — | (c) | — | (c) | |||||||||
2012 - FST Administration Shares | 1.00 | — | (c) | — | (c) | |||||||||
2012 - FST Premier Shares | 1.00 | — | (c) | — | (c) | |||||||||
2012 - FST Service Shares | 1.00 | — | (c) | — | (c) | |||||||||
2012 - FST Resource Shares | 1.00 | — | (c) | — | (c) | |||||||||
2012 - FST Cash Management Shares | 1.00 | — | (c) | — | (c) | |||||||||
2011 - FST Institutional Shares | 1.00 | 0.001 | (0.001 | ) | ||||||||||
2011 - FST Select Shares | 1.00 | 0.001 | (0.001 | ) | ||||||||||
2011 - FST Preferred Shares | 1.00 | — | (c) | — | (c) | |||||||||
2011 - FST Capital Shares | 1.00 | — | (c) | — | (c) | |||||||||
2011 - FST Administration Shares | 1.00 | — | (c) | — | (c) | |||||||||
2011 - FST Premier Shares | 1.00 | — | (c) | — | (c) | |||||||||
2011 - FST Service Shares | 1.00 | — | (c) | — | (c) | |||||||||
2011 - FST Resource Shares | 1.00 | — | (c) | — | (c) | |||||||||
2011 - FST Cash Management Shares | 1.00 | — | (c) | — | (c) | |||||||||
| (a) | Distributions may not coincide with the current year net investment income or net realized gains as distributions may be paid from current or prior year earnings. |
| (b) | Assumes reinvestment of all distributions. Returns do not reflect the deduction of taxes that a shareholder would pay on Fund distributions. Total returns for periods less than one full year are not annualized. |
| (c) | Amount is less than $0.0005 per share. |
| (d) | Annualized. |
| 72 | The accompanying notes are an integral part of these financial statements. |
FINANCIAL SQUARE TAX-FREE MONEY MARKET FUND
| Net asset value, end of period | Total return(b) | Net assets end of period (in 000s) | Ratio of net expenses to average net assets | Ratio of total expenses to average net assets | Ratio of net investment income (loss) to average net assets | |||||||||||||||||||||||||||||
| $ | 1.00 | 0.01 | % | $ | 3,934,720 | 0.08 | %(d) | 0.23 | %(d) | 0.01 | %(d) | |||||||||||||||||||||||
| 1.00 | 0.01 | 195,912 | 0.08 | (d) | 0.26 | (d) | 0.01 | (d) | ||||||||||||||||||||||||||
| 1.00 | 0.01 | 3,073 | 0.08 | (d) | 0.33 | (d) | 0.01 | (d) | ||||||||||||||||||||||||||
| 1.00 | 0.01 | 47,933 | 0.08 | (d) | 0.38 | (d) | 0.01 | (d) | ||||||||||||||||||||||||||
| 1.00 | 0.01 | 101,470 | 0.08 | (d) | 0.48 | (d) | 0.01 | (d) | ||||||||||||||||||||||||||
| 1.00 | 0.01 | 1 | 0.08 | (d) | 0.58 | (d) | 0.37 | (d) | ||||||||||||||||||||||||||
| 1.00 | 0.01 | 61,472 | 0.08 | (d) | 0.73 | (d) | 0.01 | (d) | ||||||||||||||||||||||||||
| 1.00 | 0.01 | 6,552 | 0.08 | (d) | 0.88 | (d) | 0.01 | (d) | ||||||||||||||||||||||||||
| 1.00 | 0.01 | 1 | 0.08 | (d) | 1.03 | (d) | 0.37 | (d) | ||||||||||||||||||||||||||
| 1.00 | 0.01 | 4,955,885 | 0.08 | 0.23 | 0.01 | |||||||||||||||||||||||||||||
| 1.00 | 0.01 | 193,506 | 0.08 | 0.26 | 0.01 | |||||||||||||||||||||||||||||
| 1.00 | 0.01 | 6,914 | 0.08 | 0.33 | 0.01 | |||||||||||||||||||||||||||||
| 1.00 | 0.01 | 22,788 | 0.08 | 0.38 | 0.01 | |||||||||||||||||||||||||||||
| 1.00 | 0.01 | 107,676 | 0.08 | 0.48 | 0.01 | |||||||||||||||||||||||||||||
| 1.00 | 0.01 | 1 | 0.08 | 0.58 | 0.01 | |||||||||||||||||||||||||||||
| 1.00 | 0.01 | 72,003 | 0.08 | 0.73 | 0.01 | |||||||||||||||||||||||||||||
| 1.00 | 0.01 | 8,268 | 0.08 | 0.88 | 0.01 | |||||||||||||||||||||||||||||
| 1.00 | 0.01 | 1 | 0.08 | 1.03 | 0.40 | |||||||||||||||||||||||||||||
| 1.00 | 0.01 | 5,225,304 | 0.10 | 0.23 | 0.01 | |||||||||||||||||||||||||||||
| 1.00 | 0.01 | 267,104 | 0.10 | 0.26 | 0.01 | |||||||||||||||||||||||||||||
| 1.00 | 0.01 | 15,635 | 0.10 | 0.33 | 0.01 | |||||||||||||||||||||||||||||
| 1.00 | 0.01 | 5,728 | 0.10 | 0.38 | 0.01 | |||||||||||||||||||||||||||||
| 1.00 | 0.01 | 155,732 | 0.10 | 0.48 | 0.01 | |||||||||||||||||||||||||||||
| 1.00 | 0.01 | 1,858 | 0.10 | 0.58 | 0.01 | |||||||||||||||||||||||||||||
| 1.00 | 0.01 | 66,226 | 0.10 | 0.73 | 0.01 | |||||||||||||||||||||||||||||
| 1.00 | 0.01 | 12,979 | 0.10 | 0.88 | 0.01 | |||||||||||||||||||||||||||||
| 1.00 | 0.01 | 1 | 0.10 | 1.03 | 0.40 | |||||||||||||||||||||||||||||
| 1.00 | 0.02 | 4,762,419 | 0.15 | 0.23 | 0.02 | |||||||||||||||||||||||||||||
| 1.00 | 0.02 | 197,985 | 0.16 | 0.26 | 0.01 | |||||||||||||||||||||||||||||
| 1.00 | 0.01 | 19,349 | 0.16 | 0.33 | 0.01 | |||||||||||||||||||||||||||||
| 1.00 | 0.01 | 3,511 | 0.16 | 0.38 | 0.01 | |||||||||||||||||||||||||||||
| 1.00 | 0.01 | 134,037 | 0.16 | 0.48 | 0.01 | |||||||||||||||||||||||||||||
| 1.00 | 0.01 | 572,262 | 0.16 | 0.58 | 0.01 | |||||||||||||||||||||||||||||
| 1.00 | 0.01 | 16,214 | 0.16 | 0.73 | 0.01 | |||||||||||||||||||||||||||||
| 1.00 | 0.01 | 26,818 | 0.16 | 0.88 | 0.01 | |||||||||||||||||||||||||||||
| 1.00 | 0.01 | 1 | 0.15 | 1.03 | 0.40 | |||||||||||||||||||||||||||||
| 1.00 | 0.02 | 5,462,807 | 0.17 | 0.23 | 0.02 | |||||||||||||||||||||||||||||
| 1.00 | 0.02 | 102,994 | 0.18 | 0.26 | 0.01 | |||||||||||||||||||||||||||||
| 1.00 | 0.01 | 22,477 | 0.18 | 0.33 | 0.01 | |||||||||||||||||||||||||||||
| 1.00 | 0.01 | 11,793 | 0.18 | 0.38 | 0.01 | |||||||||||||||||||||||||||||
| 1.00 | 0.01 | 217,010 | 0.18 | 0.48 | 0.01 | |||||||||||||||||||||||||||||
| 1.00 | 0.01 | 565,678 | 0.18 | 0.58 | 0.01 | |||||||||||||||||||||||||||||
| 1.00 | 0.01 | 29,450 | 0.18 | 0.73 | 0.01 | |||||||||||||||||||||||||||||
| 1.00 | 0.01 | 27,615 | 0.18 | 0.88 | 0.01 | |||||||||||||||||||||||||||||
| 1.00 | 0.01 | 1 | 0.17 | 1.03 | 0.40 | |||||||||||||||||||||||||||||
| 1.00 | 0.10 | 6,489,440 | 0.18 | 0.23 | 0.09 | |||||||||||||||||||||||||||||
| 1.00 | 0.07 | 44,349 | 0.21 | 0.26 | 0.07 | |||||||||||||||||||||||||||||
| 1.00 | 0.03 | 24,222 | 0.25 | 0.33 | 0.02 | |||||||||||||||||||||||||||||
| 1.00 | 0.02 | 4,945 | 0.26 | 0.38 | 0.01 | |||||||||||||||||||||||||||||
| 1.00 | 0.02 | 379,465 | 0.26 | 0.48 | 0.01 | |||||||||||||||||||||||||||||
| 1.00 | 0.02 | 564,168 | 0.26 | 0.58 | 0.01 | |||||||||||||||||||||||||||||
| 1.00 | 0.02 | 30,063 | 0.27 | 0.73 | 0.01 | |||||||||||||||||||||||||||||
| 1.00 | 0.02 | 22,464 | 0.25 | 0.88 | 0.01 | |||||||||||||||||||||||||||||
| 1.00 | 0.02 | 1 | 0.31 | 1.03 | 0.11 | |||||||||||||||||||||||||||||
| The accompanying notes are an integral part of these financial statements. | 73 |
FINANCIAL SQUARE TREASURY INSTRUMENTS FUND
Financial Highlights
Selected Data for a Share Outstanding Throughout Each Period
| Year - Share Class | Net asset | Net investment income (loss) | Distributions from net investment income(a) | |||||||||||
| FOR THE SIX MONTHS ENDED FEBRUARY 29, (UNAUDITED) | ||||||||||||||
2016 - FST Institutional Shares | $ | 1.00 | $ | — | (c) | $ | — | (c) | ||||||
2016 - FST Select Shares | 1.00 | — | (c) | — | (c) | |||||||||
2016 - FST Preferred Shares | 1.00 | — | (c) | — | (c) | |||||||||
2016 - FST Capital Shares | 1.00 | — | (c) | — | (c) | |||||||||
2016 - FST Administration Shares | 1.00 | — | (c) | — | (c) | |||||||||
2016 - FST Premier Shares | 1.00 | — | (c) | — | (c) | |||||||||
2016 - FST Service Shares | 1.00 | — | (c) | — | (c) | |||||||||
2016 - FST Resource Shares | 1.00 | — | (c) | — | (c) | |||||||||
2016 - FST Cash Management Shares | 1.00 | — | (c) | — | (c) | |||||||||
| FOR THE FISCAL YEARS ENDED AUGUST 31, | ||||||||||||||
2015 - FST Institutional Shares | 1.00 | — | (c) | — | (c) | |||||||||
2015 - FST Select Shares | 1.00 | — | (c) | — | (c) | |||||||||
2015 - FST Preferred Shares | 1.00 | — | (c) | — | (c) | |||||||||
2015 - FST Capital Shares | 1.00 | — | (c) | — | (c) | |||||||||
2015 - FST Administration Shares | 1.00 | — | (c) | — | (c) | |||||||||
2015 - FST Premier Shares | 1.00 | — | (c) | — | (c) | |||||||||
2015 - FST Service Shares | 1.00 | — | (c) | — | (c) | |||||||||
2015 - FST Resource Shares | 1.00 | — | (c) | — | (c) | |||||||||
2015 - FST Cash Management Shares | 1.00 | — | (c) | — | (c) | |||||||||
2014 - FST Institutional Shares | 1.00 | — | (c) | — | (c) | |||||||||
2014 - FST Select Shares | 1.00 | — | (c) | — | (c) | |||||||||
2014 - FST Preferred Shares | 1.00 | — | (c) | — | (c) | |||||||||
2014 - FST Capital Shares | 1.00 | — | (c) | — | (c) | |||||||||
2014 - FST Administration Shares | 1.00 | — | (c) | — | (c) | |||||||||
2014 - FST Premier Shares | 1.00 | — | (c) | — | (c) | |||||||||
2014 - FST Service Shares | 1.00 | — | (c) | — | (c) | |||||||||
2014 - FST Resource Shares | 1.00 | — | (c) | — | (c) | |||||||||
2014 - FST Cash Management Shares | 1.00 | — | (c) | — | (c) | |||||||||
2013 - FST Institutional Shares | 1.00 | — | (c) | — | (c) | |||||||||
2013 - FST Select Shares | 1.00 | — | (c) | — | (c) | |||||||||
2013 - FST Preferred Shares | 1.00 | — | (c) | — | (c) | |||||||||
2013 - FST Capital Shares | 1.00 | — | (c) | — | (c) | |||||||||
2013 - FST Administration Shares | 1.00 | — | (c) | — | (c) | |||||||||
2013 - FST Premier Shares | 1.00 | — | (c) | — | (c) | |||||||||
2013 - FST Service Shares | 1.00 | — | (c) | — | (c) | |||||||||
2013 - FST Resource Shares | 1.00 | — | (c) | — | (c) | |||||||||
2013 - FST Cash Management Shares | 1.00 | — | (c) | — | (c) | |||||||||
2012 - FST Institutional Shares | 1.00 | — | (c) | — | (c) | |||||||||
2012 - FST Select Shares | 1.00 | — | (c) | — | (c) | |||||||||
2012 - FST Preferred Shares | 1.00 | — | (c) | — | (c) | |||||||||
2012 - FST Capital Shares | 1.00 | — | (c) | — | (c) | |||||||||
2012 - FST Administration Shares | 1.00 | — | (c) | — | (c) | |||||||||
2012 - FST Premier Shares | 1.00 | — | (c) | — | (c) | |||||||||
2012 - FST Service Shares | 1.00 | — | (c) | — | (c) | |||||||||
2012 - FST Resource Shares | 1.00 | — | (c) | — | (c) | |||||||||
2012 - FST Cash Management Shares | 1.00 | — | (c) | — | (c) | |||||||||
2011 - FST Institutional Shares | 1.00 | — | (c) | — | (c) | |||||||||
2011 - FST Select Shares | 1.00 | — | (c) | — | (c) | |||||||||
2011 - FST Preferred Shares | 1.00 | — | (c) | — | (c) | |||||||||
2011 - FST Capital Shares | 1.00 | — | (c) | — | (c) | |||||||||
2011 - FST Administration Shares | 1.00 | — | (c) | — | (c) | |||||||||
2011 - FST Premier Shares | 1.00 | — | (c) | — | (c) | |||||||||
2011 - FST Service Shares | 1.00 | — | (c) | — | (c) | |||||||||
2011 - FST Resource Shares | 1.00 | — | (c) | — | (c) | |||||||||
2011 - FST Cash Management Shares | 1.00 | — | (c) | — | (c) | |||||||||
| (a) | Distributions may not coincide with the current year net investment income or net realized gains as distributions may be paid from current or prior year earnings. |
| (b) | Assumes reinvestment of all distributions. Returns do not reflect the deduction of taxes that a shareholder would pay on Fund distributions. Total returns for periods less than one full year are not annualized. |
| (c) | Amount is less than $0.0005 per share. |
| (d) | Amount is less than 0.005%. |
| (e) | Annualized. |
| (f) | Amount is less than 0.005% of average net assets. |
| 74 | The accompanying notes are an integral part of these financial statements. |
FINANCIAL SQUARE TREASURY INSTRUMENTS FUND
| Net asset value, end of period | Total return(b) | Net assets end of period (in 000s) | Ratio of net expenses to average net assets | Ratio of total expenses to average net assets | Ratio of income (loss) | |||||||||||||||||||||||||||||
| $ | 1.00 | 0.03 | % | $ | 51,216,502 | 0.18 | %(e) | 0.23 | %(e) | 0.08 | %(e) | |||||||||||||||||||||||
| 1.00 | 0.03 | 12,341 | 0.19 | (e) | 0.26 | (e) | 0.02 | (e) | ||||||||||||||||||||||||||
| 1.00 | 0.01 | 40,314 | 0.23 | (e) | 0.33 | (e) | 0.02 | (e) | ||||||||||||||||||||||||||
| 1.00 | — | (d) | 408,731 | 0.24 | (e) | 0.38 | (e) | — | (e)(f) | |||||||||||||||||||||||||
| 1.00 | — | (d) | 2,210,190 | 0.25 | (e) | 0.48 | (e) | — | (e)(f) | |||||||||||||||||||||||||
| 1.00 | — | (d) | 52 | 0.23 | (e) | 0.58 | (e) | 0.01 | (e) | |||||||||||||||||||||||||
| 1.00 | — | (d) | 93,828 | 0.23 | (e) | 0.73 | (e) | — | (e)(f) | |||||||||||||||||||||||||
| 1.00 | — | (d) | 1 | 0.18 | (e) | 0.88 | (e) | 0.37 | (e) | |||||||||||||||||||||||||
| 1.00 | — | (d) | 1 | 0.18 | (e) | 1.03 | (e) | 0.37 | (e) | |||||||||||||||||||||||||
| 1.00 | — | (d) | 34,094,054 | 0.06 | 0.23 | — | (f) | |||||||||||||||||||||||||||
| 1.00 | — | (d) | 80,008 | 0.06 | 0.26 | — | (f) | |||||||||||||||||||||||||||
| 1.00 | — | (d) | 33,032 | 0.06 | 0.33 | — | (f) | |||||||||||||||||||||||||||
| 1.00 | — | (d) | 353,326 | 0.06 | 0.38 | — | (f) | |||||||||||||||||||||||||||
| 1.00 | — | (d) | 2,101,757 | 0.06 | 0.48 | — | (f) | |||||||||||||||||||||||||||
| 1.00 | — | (d) | 54 | 0.06 | 0.58 | — | (f) | |||||||||||||||||||||||||||
| 1.00 | — | (d) | 197,083 | 0.06 | 0.73 | — | (f) | |||||||||||||||||||||||||||
| 1.00 | — | (d) | 1 | 0.06 | 0.88 | 0.40 | ||||||||||||||||||||||||||||
| 1.00 | — | (d) | 1 | 0.06 | 1.03 | 0.40 | ||||||||||||||||||||||||||||
| 1.00 | — | (d) | 31,170,061 | 0.07 | 0.23 | — | (f) | |||||||||||||||||||||||||||
| 1.00 | — | (d) | 192,930 | 0.07 | 0.26 | — | (f) | |||||||||||||||||||||||||||
| 1.00 | — | (d) | 43,335 | 0.07 | 0.33 | — | (f) | |||||||||||||||||||||||||||
| 1.00 | — | (d) | 163,450 | 0.07 | 0.38 | — | (f) | |||||||||||||||||||||||||||
| 1.00 | — | (d) | 1,231,641 | 0.07 | 0.48 | — | (f) | |||||||||||||||||||||||||||
| 1.00 | — | (d) | 2,720 | 0.07 | 0.58 | — | (f) | |||||||||||||||||||||||||||
| 1.00 | — | (d) | 140,016 | 0.07 | 0.73 | — | (f) | |||||||||||||||||||||||||||
| 1.00 | — | (d) | 1 | 0.07 | 0.88 | 0.40 | ||||||||||||||||||||||||||||
| 1.00 | — | (d) | 1 | 0.07 | 1.03 | 0.40 | ||||||||||||||||||||||||||||
| 1.00 | — | (d) | 25,382,266 | 0.10 | 0.23 | — | (f) | |||||||||||||||||||||||||||
| 1.00 | — | (d) | 224,452 | 0.10 | 0.26 | — | (f) | |||||||||||||||||||||||||||
| 1.00 | — | (d) | 110,400 | 0.10 | 0.33 | — | (f) | |||||||||||||||||||||||||||
| 1.00 | — | (d) | 165,250 | 0.10 | 0.38 | — | (f) | |||||||||||||||||||||||||||
| 1.00 | — | (d) | 1,352,128 | 0.10 | 0.48 | — | (f) | |||||||||||||||||||||||||||
| 1.00 | — | (d) | 360,992 | 0.10 | 0.58 | — | (f) | |||||||||||||||||||||||||||
| 1.00 | — | (d) | 185,658 | 0.10 | 0.73 | — | (f) | |||||||||||||||||||||||||||
| 1.00 | — | (d) | 1 | 0.10 | 0.88 | — | (f) | |||||||||||||||||||||||||||
| 1.00 | — | (d) | 1 | 0.10 | 1.03 | — | (f) | |||||||||||||||||||||||||||
| 1.00 | — | (d) | 23,364,396 | 0.07 | 0.23 | — | (f) | |||||||||||||||||||||||||||
| 1.00 | — | (d) | 110,090 | 0.07 | 0.26 | — | (f) | |||||||||||||||||||||||||||
| 1.00 | — | (d) | 156,016 | 0.07 | 0.33 | — | (f) | |||||||||||||||||||||||||||
| 1.00 | — | (d) | 157,629 | 0.07 | 0.38 | — | (f) | |||||||||||||||||||||||||||
| 1.00 | — | (d) | 1,319,295 | 0.07 | 0.48 | — | (f) | |||||||||||||||||||||||||||
| 1.00 | — | (d) | 401,333 | 0.07 | 0.58 | — | (f) | |||||||||||||||||||||||||||
| 1.00 | — | (d) | 298,413 | 0.07 | 0.73 | — | (f) | |||||||||||||||||||||||||||
| 1.00 | — | (d) | 1 | 0.07 | 0.88 | 0.40 | ||||||||||||||||||||||||||||
| 1.00 | — | (d) | 1 | 0.07 | 1.03 | 0.40 | ||||||||||||||||||||||||||||
| 1.00 | 0.01 | 20,395,424 | 0.11 | 0.23 | — | (f) | ||||||||||||||||||||||||||||
| 1.00 | 0.01 | 139,086 | 0.11 | 0.26 | — | (f) | ||||||||||||||||||||||||||||
| 1.00 | 0.01 | 193,741 | 0.11 | 0.33 | — | (f) | ||||||||||||||||||||||||||||
| 1.00 | 0.01 | 170,654 | 0.11 | 0.38 | — | (f) | ||||||||||||||||||||||||||||
| 1.00 | 0.01 | 1,279,893 | 0.11 | 0.48 | — | (f) | ||||||||||||||||||||||||||||
| 1.00 | 0.01 | 429,876 | 0.11 | 0.58 | — | (f) | ||||||||||||||||||||||||||||
| 1.00 | 0.01 | 298,809 | 0.11 | 0.73 | — | (f) | ||||||||||||||||||||||||||||
| 1.00 | 0.01 | 1 | 0.11 | 0.88 | 0.19 | |||||||||||||||||||||||||||||
| 1.00 | 0.01 | 1 | 0.11 | 1.03 | 0.23 | |||||||||||||||||||||||||||||
| The accompanying notes are an integral part of these financial statements. | 75 |
FINANCIAL SQUARE TREASURY OBLIGATIONS FUND
Financial Highlights
Selected Data for a Share Outstanding Throughout Each Period
| Year - Share Class | Net asset | Net investment income (loss) | Distributions from net investment income(a) | |||||||||||
| FOR THE SIX MONTHS ENDED FEBRUARY 29, (UNAUDITED) | ||||||||||||||
2016 - FST Institutional Shares | $ | 1.00 | $ | — | (c) | $ | — | (c) | ||||||
2016 - FST Select Shares | 1.00 | — | (c) | — | (c) | |||||||||
2016 - FST Preferred Shares | 1.00 | — | (c) | — | (c) | |||||||||
2016 - FST Capital Shares | 1.00 | — | (c) | — | (c) | |||||||||
2016 - FST Administration Shares | 1.00 | — | (c) | — | (c) | |||||||||
2016 - FST Premier Shares | 1.00 | — | (c) | — | (c) | |||||||||
2016 - FST Service Shares | 1.00 | — | (c) | — | (c) | |||||||||
2016 - FST Resource Shares | 1.00 | — | (c) | — | (c) | |||||||||
2016 - FST Cash Management Shares | 1.00 | — | (c) | — | (c) | |||||||||
| FOR THE FISCAL YEARS ENDED AUGUST 31, | ||||||||||||||
2015 - FST Institutional Shares | 1.00 | — | (c) | — | (c) | |||||||||
2015 - FST Select Shares | 1.00 | — | (c) | — | (c) | |||||||||
2015 - FST Preferred Shares | 1.00 | — | (c) | — | (c) | |||||||||
2015 - FST Capital Shares | 1.00 | — | (c) | — | (c) | |||||||||
2015 - FST Administration Shares | 1.00 | — | (c) | — | (c) | |||||||||
2015 - FST Premier Shares | 1.00 | — | (c) | — | (c) | |||||||||
2015 - FST Service Shares | 1.00 | — | (c) | — | (c) | |||||||||
2015 - FST Resource Shares | 1.00 | — | (c) | — | (c) | |||||||||
2015 - FST Cash Management Shares | 1.00 | — | (c) | — | (c) | |||||||||
2014 - FST Institutional Shares | 1.00 | — | (c) | — | (c) | |||||||||
2014 - FST Select Shares | 1.00 | — | (c) | — | (c) | |||||||||
2014 - FST Preferred Shares | 1.00 | — | (c) | — | (c) | |||||||||
2014 - FST Capital Shares | 1.00 | — | (c) | — | (c) | |||||||||
2014 - FST Administration Shares | 1.00 | — | (c) | — | (c) | |||||||||
2014 - FST Premier Shares | 1.00 | — | (c) | — | (c) | |||||||||
2014 - FST Service Shares | 1.00 | — | (c) | — | (c) | |||||||||
2014 - FST Resource Shares | 1.00 | — | (c) | — | (c) | |||||||||
2014 - FST Cash Management Shares | 1.00 | — | (c) | — | (c) | |||||||||
2013 - FST Institutional Shares | 1.00 | — | (c) | — | (c) | |||||||||
2013 - FST Select Shares | 1.00 | — | (c) | — | (c) | |||||||||
2013 - FST Preferred Shares | 1.00 | — | (c) | — | (c) | |||||||||
2013 - FST Capital Shares | 1.00 | — | (c) | — | (c) | |||||||||
2013 - FST Administration Shares | 1.00 | — | (c) | — | (c) | |||||||||
2013 - FST Premier Shares | 1.00 | — | (c) | — | (c) | |||||||||
2013 - FST Service Shares | 1.00 | — | (c) | — | (c) | |||||||||
2013 - FST Resource Shares | 1.00 | — | (c) | — | (c) | |||||||||
2013 - FST Cash Management Shares | 1.00 | — | (c) | — | (c) | |||||||||
2012 - FST Institutional Shares | 1.00 | — | (c) | — | (c) | |||||||||
2012 - FST Select Shares | 1.00 | — | (c) | — | (c) | |||||||||
2012 - FST Preferred Shares | 1.00 | — | (c) | — | (c) | |||||||||
2012 - FST Capital Shares | 1.00 | — | (c) | — | (c) | |||||||||
2012 - FST Administration Shares | 1.00 | — | (c) | — | (c) | |||||||||
2012 - FST Premier Shares | 1.00 | — | (c) | — | (c) | |||||||||
2012 - FST Service Shares | 1.00 | — | (c) | — | (c) | |||||||||
2012 - FST Resource Shares | 1.00 | — | (c) | — | (c) | |||||||||
2012 - FST Cash Management Shares | 1.00 | — | (c) | — | (c) | |||||||||
2011 - FST Institutional Shares | 1.00 | — | (c) | — | (c) | |||||||||
2011 - FST Select Shares | 1.00 | — | (c) | — | (c) | |||||||||
2011 - FST Preferred Shares | 1.00 | — | (c) | — | (c) | |||||||||
2011 - FST Capital Shares | 1.00 | — | (c) | — | (c) | |||||||||
2011 - FST Administration Shares | 1.00 | — | (c) | — | (c) | |||||||||
2011 - FST Premier Shares | 1.00 | — | (c) | — | (c) | |||||||||
2011 - FST Service Shares | 1.00 | — | (c) | — | (c) | |||||||||
2011 - FST Resource Shares | 1.00 | — | (c) | — | (c) | |||||||||
2011 - FST Cash Management Shares | 1.00 | — | (c) | — | (c) | |||||||||
| (a) | Distributions may not coincide with the current year net investment income or net realized gains as distributions may be paid from current or prior year earnings. |
| (b) | Assumes reinvestment of all distributions. Returns do not reflect the deduction of taxes that a shareholder would pay on Fund distributions. Total returns for periods less than one full year are not annualized. |
| (c) | Amount is less than $0.0005 per share. |
| (d) | Amount is less than 0.005%. |
| (e) | Annualized. |
| (f) | Amount is less than 0.005% of average net assets. |
| 76 | The accompanying notes are an integral part of these financial statements. |
FINANCIAL SQUARE TREASURY OBLIGATIONS FUND
| Net asset value, end of period | Total return(b) | Net assets end of period (in 000s) | Ratio of net expenses to average net assets | Ratio of total expenses to average net assets | Ratio of net investment income (loss) to average net assets | |||||||||||||||||||||||||||||
| $ | 1.00 | 0.04 | % | $ | 11,691,240 | 0.17 | %(e) | 0.23 | %(e) | 0.08 | %(e) | |||||||||||||||||||||||
| 1.00 | 0.03 | 172,038 | 0.18 | (e) | 0.26 | (e) | 0.06 | (e) | ||||||||||||||||||||||||||
| 1.00 | 0.02 | 175,289 | 0.21 | (e) | 0.33 | (e) | 0.02 | (e) | ||||||||||||||||||||||||||
| 1.00 | 0.01 | 366,162 | 0.23 | (e) | 0.38 | (e) | 0.01 | (e) | ||||||||||||||||||||||||||
| 1.00 | — | (d) | 1,641,339 | 0.24 | (e) | 0.48 | (e) | — | (e)(f) | |||||||||||||||||||||||||
| 1.00 | — | (d) | 1 | 0.17 | (e) | 0.58 | (e) | 0.37 | (e) | |||||||||||||||||||||||||
| 1.00 | — | (d) | 892,189 | 0.24 | (e) | 0.73 | (e) | — | (e)(f) | |||||||||||||||||||||||||
| 1.00 | — | (d) | 1 | 0.17 | (e) | 0.88 | (e) | 0.37 | (e) | |||||||||||||||||||||||||
| 1.00 | — | (d) | 1 | 0.17 | (e) | 1.03 | (e) | 0.37 | (e) | |||||||||||||||||||||||||
| 1.00 | 0.01 | 12,758,713 | 0.10 | 0.23 | — | (f) | ||||||||||||||||||||||||||||
| 1.00 | 0.01 | 169,026 | 0.10 | 0.26 | — | (f) | ||||||||||||||||||||||||||||
| 1.00 | 0.01 | 220,426 | 0.10 | 0.33 | — | (f) | ||||||||||||||||||||||||||||
| 1.00 | 0.01 | 442,625 | 0.10 | 0.38 | 0.01 | |||||||||||||||||||||||||||||
| 1.00 | 0.01 | 1,620,517 | 0.10 | 0.48 | — | (f) | ||||||||||||||||||||||||||||
| 1.00 | 0.01 | 1 | 0.10 | 0.58 | (0.02 | ) | ||||||||||||||||||||||||||||
| 1.00 | 0.01 | 940,671 | 0.10 | 0.73 | — | (f) | ||||||||||||||||||||||||||||
| 1.00 | 0.01 | 1 | 0.10 | 0.88 | 0.40 | |||||||||||||||||||||||||||||
| 1.00 | 0.01 | 1 | 0.10 | 1.03 | 0.40 | |||||||||||||||||||||||||||||
| 1.00 | 0.01 | 12,822,354 | 0.08 | 0.23 | 0.01 | |||||||||||||||||||||||||||||
| 1.00 | 0.01 | 279,848 | 0.08 | 0.26 | — | (f) | ||||||||||||||||||||||||||||
| 1.00 | 0.01 | 205,386 | 0.08 | 0.33 | — | (f) | ||||||||||||||||||||||||||||
| 1.00 | 0.01 | 356,753 | 0.08 | 0.38 | — | (f) | ||||||||||||||||||||||||||||
| 1.00 | 0.01 | 2,144,601 | 0.08 | 0.48 | — | (f) | ||||||||||||||||||||||||||||
| 1.00 | 0.01 | 948 | 0.08 | 0.58 | (0.01 | ) | ||||||||||||||||||||||||||||
| 1.00 | 0.01 | 915,527 | 0.08 | 0.73 | — | (f) | ||||||||||||||||||||||||||||
| 1.00 | 0.01 | 1 | 0.08 | 0.88 | 0.40 | |||||||||||||||||||||||||||||
| 1.00 | 0.01 | 1 | 0.08 | 1.03 | 0.40 | |||||||||||||||||||||||||||||
| 1.00 | 0.01 | 6,998,695 | 0.14 | 0.23 | 0.01 | |||||||||||||||||||||||||||||
| 1.00 | 0.01 | 189,482 | 0.14 | 0.26 | 0.01 | |||||||||||||||||||||||||||||
| 1.00 | 0.01 | 146,636 | 0.14 | 0.33 | 0.01 | |||||||||||||||||||||||||||||
| 1.00 | 0.01 | 317,742 | 0.14 | 0.38 | 0.01 | |||||||||||||||||||||||||||||
| 1.00 | 0.01 | 1,577,830 | 0.14 | 0.48 | 0.01 | |||||||||||||||||||||||||||||
| 1.00 | 0.01 | 97,655 | 0.14 | 0.58 | — | (f) | ||||||||||||||||||||||||||||
| 1.00 | 0.01 | 1,061,790 | 0.14 | 0.73 | 0.01 | |||||||||||||||||||||||||||||
| 1.00 | 0.01 | 1 | 0.14 | 0.88 | 0.40 | |||||||||||||||||||||||||||||
| 1.00 | 0.01 | 1 | 0.14 | 1.03 | 0.40 | |||||||||||||||||||||||||||||
| 1.00 | 0.01 | 8,084,641 | 0.12 | 0.23 | 0.01 | |||||||||||||||||||||||||||||
| 1.00 | 0.01 | 152,228 | 0.12 | 0.26 | — | (f) | ||||||||||||||||||||||||||||
| 1.00 | 0.01 | 95,065 | 0.12 | 0.33 | — | (f) | ||||||||||||||||||||||||||||
| 1.00 | 0.01 | 216,015 | 0.12 | 0.38 | 0.01 | |||||||||||||||||||||||||||||
| 1.00 | 0.01 | 1,525,805 | 0.12 | 0.48 | 0.01 | |||||||||||||||||||||||||||||
| 1.00 | 0.01 | 124,439 | 0.12 | 0.58 | 0.01 | |||||||||||||||||||||||||||||
| 1.00 | 0.01 | 1,025,286 | 0.12 | 0.73 | — | (f) | ||||||||||||||||||||||||||||
| 1.00 | 0.01 | 1 | 0.12 | 0.88 | 0.40 | |||||||||||||||||||||||||||||
| 1.00 | 0.01 | 1 | 0.12 | 1.03 | 0.40 | |||||||||||||||||||||||||||||
| 1.00 | 0.01 | 7,991,142 | 0.15 | 0.23 | 0.01 | |||||||||||||||||||||||||||||
| 1.00 | 0.01 | 197,349 | 0.15 | 0.26 | 0.01 | |||||||||||||||||||||||||||||
| 1.00 | 0.01 | 141,554 | 0.15 | 0.33 | 0.01 | |||||||||||||||||||||||||||||
| 1.00 | 0.01 | 142,775 | 0.15 | 0.38 | 0.01 | |||||||||||||||||||||||||||||
| 1.00 | 0.01 | 1,676,083 | 0.15 | 0.48 | 0.01 | |||||||||||||||||||||||||||||
| 1.00 | 0.01 | 121,171 | 0.15 | 0.58 | 0.01 | |||||||||||||||||||||||||||||
| 1.00 | 0.01 | 1,318,792 | 0.15 | 0.73 | 0.01 | |||||||||||||||||||||||||||||
| 1.00 | 0.01 | 1 | 0.15 | 0.88 | 0.23 | |||||||||||||||||||||||||||||
| 1.00 | 0.01 | 1 | 0.15 | 1.03 | 0.10 | |||||||||||||||||||||||||||||
| The accompanying notes are an integral part of these financial statements. | 77 |
FINANCIAL SQUARE TREASURY SOLUTIONS FUND
Financial Highlights
Selected Data for a Share Outstanding Throughout Each Period
| Year - Share Class | Net asset | Net investment income (loss) | Distributions from net investment income(a) | |||||||||||
| FOR THE SIX MONTHS ENDED FEBRUARY 29, (UNAUDITED) | ||||||||||||||
2016 - FST Institutional Shares | $ | 1.00 | $ | — | (c) | $ | — | (c) | ||||||
2016 - FST Select Shares | 1.00 | — | (c) | — | (c) | |||||||||
2016 - FST Preferred Shares | 1.00 | — | (c) | — | (c) | |||||||||
2016 - FST Capital Shares | 1.00 | — | (c) | — | (c) | |||||||||
2016 - FST Administration Shares | 1.00 | — | (c) | — | (c) | |||||||||
2016 - FST Premier Shares | 1.00 | — | (c) | — | (c) | |||||||||
2016 - FST Service Shares | 1.00 | — | (c) | — | (c) | |||||||||
2016 - FST Resource Shares | 1.00 | — | (c) | — | (c) | |||||||||
2016 - FST Cash Management Shares | 1.00 | — | (c) | — | (c) | |||||||||
| FOR THE FISCAL YEARS ENDED AUGUST 31, | ||||||||||||||
2015 - FST Institutional Shares | 1.00 | — | (c) | — | (c) | |||||||||
2015 - FST Select Shares | 1.00 | — | (c) | — | (c) | |||||||||
2015 - FST Preferred Shares | 1.00 | — | (c) | — | (c) | |||||||||
2015 - FST Capital Shares | 1.00 | — | (c) | — | (c) | |||||||||
2015 - FST Administration Shares | 1.00 | — | (c) | — | (c) | |||||||||
2015 - FST Premier Shares | 1.00 | — | (c) | — | (c) | |||||||||
2015 - FST Service Shares | 1.00 | — | (c) | — | (c) | |||||||||
2015 - FST Resource Shares | 1.00 | — | (c) | — | (c) | |||||||||
2015 - FST Cash Management Shares | 1.00 | — | (c) | — | (c) | |||||||||
2014 - FST Institutional Shares | 1.00 | — | (c) | — | (c) | |||||||||
2014 - FST Select Shares | 1.00 | — | (c) | — | (c) | |||||||||
2014 - FST Preferred Shares | 1.00 | — | (c) | — | (c) | |||||||||
2014 - FST Capital Shares | 1.00 | — | (c) | — | (c) | |||||||||
2014 - FST Administration Shares | 1.00 | — | (c) | — | (c) | |||||||||
2014 - FST Premier Shares | 1.00 | — | (c) | — | (c) | |||||||||
2014 - FST Service Shares | 1.00 | — | (c) | — | (c) | |||||||||
2014 - FST Resource Shares | 1.00 | — | (c) | — | (c) | |||||||||
2014 - FST Cash Management Shares | 1.00 | — | (c) | — | (c) | |||||||||
2013 - FST Institutional Shares | 1.00 | — | (c) | — | (c) | |||||||||
2013 - FST Select Shares | 1.00 | — | (c) | — | (c) | |||||||||
2013 - FST Preferred Shares | 1.00 | — | (c) | — | (c) | |||||||||
2013 - FST Capital Shares | 1.00 | — | (c) | — | (c) | |||||||||
2013 - FST Administration Shares | 1.00 | — | (c) | — | (c) | |||||||||
2013 - FST Premier Shares | 1.00 | — | (c) | — | (c) | |||||||||
2013 - FST Service Shares | 1.00 | — | (c) | — | (c) | |||||||||
2013 - FST Resource Shares | 1.00 | — | (c) | — | (c) | |||||||||
2013 - FST Cash Management Shares | 1.00 | — | (c) | — | (c) | |||||||||
2012 - FST Institutional Shares | 1.00 | — | (c) | — | (c) | |||||||||
2012 - FST Select Shares | 1.00 | — | (c) | — | (c) | |||||||||
2012 - FST Preferred Shares | 1.00 | — | (c) | — | (c) | |||||||||
2012 - FST Capital Shares | 1.00 | — | (c) | — | (c) | |||||||||
2012 - FST Administration Shares | 1.00 | — | (c) | — | (c) | |||||||||
2012 - FST Premier Shares | 1.00 | — | (c) | — | (c) | |||||||||
2012 - FST Service Shares | 1.00 | — | (c) | — | (c) | |||||||||
2012 - FST Resource Shares | 1.00 | — | (c) | — | (c) | |||||||||
2012 - FST Cash Management Shares | 1.00 | — | (c) | — | (c) | |||||||||
2011 - FST Institutional Shares | 1.00 | — | (c) | — | (c) | |||||||||
2011 - FST Select Shares | 1.00 | — | (c) | — | (c) | |||||||||
2011 - FST Preferred Shares | 1.00 | — | (c) | — | (c) | |||||||||
2011 - FST Capital Shares | 1.00 | — | (c) | — | (c) | |||||||||
2011 - FST Administration Shares | 1.00 | — | (c) | — | (c) | |||||||||
2011 - FST Premier Shares | 1.00 | — | (c) | — | (c) | |||||||||
2011 - FST Service Shares | 1.00 | — | (c) | — | (c) | |||||||||
2011 - FST Resource Shares | 1.00 | — | (c) | — | (c) | |||||||||
2011 - FST Cash Management Shares | 1.00 | — | (c) | — | (c) | |||||||||
| (a) | Distributions may not coincide with the current year net investment income or net realized gains as distributions may be paid from current or prior year earnings. |
| (b) | Assumes reinvestment of all distributions. Returns do not reflect the deduction of taxes that a shareholder would pay on Fund distributions. Total returns for periods less than one full year are not annualized. |
| (c) | Amount is less than $0.0005 per share. |
| (d) | Amount is less than 0.005%. |
| (e) | Annualized. |
| (f) | Amount is less than 0.005% of average net assets. |
| 78 | The accompanying notes are an integral part of these financial statements. |
FINANCIAL SQUARE TREASURY SOLUTIONS FUND
| Net asset value, end of period | Total return(b) | Net assets end of period (in 000s) | Ratio of net expenses to average net assets | Ratio of total expenses to average net assets | Ratio of net investment income (loss) to average net assets | |||||||||||||||||||||||||||||
| $ | 1.00 | 0.04 | % | $ | 10,232,875 | 0.16 | %(e) | 0.23 | %(e) | 0.06 | %(e) | |||||||||||||||||||||||
| 1.00 | 0.03 | 11,239 | 0.17 | (e) | 0.26 | (e) | 0.04 | (e) | ||||||||||||||||||||||||||
| 1.00 | 0.02 | 54,597 | 0.20 | (e) | 0.33 | (e) | 0.01 | (e) | ||||||||||||||||||||||||||
| 1.00 | 0.01 | 75,909 | 0.22 | (e) | 0.38 | (e) | (0.01 | )(e) | ||||||||||||||||||||||||||
| 1.00 | — | (d) | 247,225 | 0.22 | (e) | 0.48 | (e) | (0.02 | )(e) | |||||||||||||||||||||||||
| 1.00 | — | (d) | 1 | 0.16 | (e) | 0.58 | (e) | 0.36 | (e) | |||||||||||||||||||||||||
| 1.00 | — | (d) | 284,031 | 0.22 | (e) | 0.73 | (e) | (0.02 | )(e) | |||||||||||||||||||||||||
| 1.00 | — | (d) | 1 | 0.16 | (e) | 0.88 | (e) | 0.37 | (e) | |||||||||||||||||||||||||
| 1.00 | — | (d) | 155,520 | 0.23 | (e) | 1.03 | (e) | (0.02 | )(e) | |||||||||||||||||||||||||
| 1.00 | 0.01 | 10,053,367 | 0.10 | 0.23 | — | (f) | ||||||||||||||||||||||||||||
| 1.00 | 0.01 | 12,266 | 0.10 | 0.26 | — | (f) | ||||||||||||||||||||||||||||
| 1.00 | 0.01 | 40,923 | 0.10 | 0.33 | — | (f) | ||||||||||||||||||||||||||||
| 1.00 | 0.01 | 103,108 | 0.10 | 0.38 | — | (f) | ||||||||||||||||||||||||||||
| 1.00 | 0.01 | 390,266 | 0.10 | 0.48 | — | (f) | ||||||||||||||||||||||||||||
| 1.00 | 0.01 | 1 | 0.10 | 0.58 | 0.01 | |||||||||||||||||||||||||||||
| 1.00 | 0.01 | 355,272 | 0.10 | 0.73 | — | (f) | ||||||||||||||||||||||||||||
| 1.00 | 0.01 | 1 | 0.10 | 0.88 | 0.40 | |||||||||||||||||||||||||||||
| 1.00 | 0.01 | 147,486 | 0.10 | 1.03 | — | (f) | ||||||||||||||||||||||||||||
| 1.00 | 0.01 | 9,153,246 | 0.09 | 0.23 | 0.01 | |||||||||||||||||||||||||||||
| 1.00 | 0.01 | 38,054 | 0.09 | 0.26 | 0.01 | |||||||||||||||||||||||||||||
| 1.00 | 0.01 | 52,417 | 0.09 | 0.33 | 0.01 | |||||||||||||||||||||||||||||
| 1.00 | 0.01 | 55,729 | 0.09 | 0.38 | 0.01 | |||||||||||||||||||||||||||||
| 1.00 | 0.01 | 403,438 | 0.09 | 0.48 | 0.01 | |||||||||||||||||||||||||||||
| 1.00 | 0.01 | 17,834 | 0.09 | 0.58 | 0.01 | |||||||||||||||||||||||||||||
| 1.00 | 0.01 | 435,856 | 0.09 | 0.73 | 0.01 | |||||||||||||||||||||||||||||
| 1.00 | 0.01 | 1 | 0.09 | 0.88 | 0.40 | |||||||||||||||||||||||||||||
| 1.00 | 0.01 | 90,568 | 0.09 | 1.03 | 0.01 | |||||||||||||||||||||||||||||
| 1.00 | 0.01 | 8,211,951 | 0.14 | 0.23 | — | (f) | ||||||||||||||||||||||||||||
| 1.00 | 0.01 | 127,241 | 0.14 | 0.26 | — | (f) | ||||||||||||||||||||||||||||
| 1.00 | 0.01 | 53,020 | 0.14 | 0.33 | — | (f) | ||||||||||||||||||||||||||||
| 1.00 | 0.01 | 62,058 | 0.14 | 0.38 | — | (f) | ||||||||||||||||||||||||||||
| 1.00 | 0.01 | 418,901 | 0.14 | 0.48 | — | (f) | ||||||||||||||||||||||||||||
| 1.00 | 0.01 | 1,137,540 | 0.14 | 0.58 | — | (f) | ||||||||||||||||||||||||||||
| 1.00 | 0.01 | 508,699 | 0.14 | 0.73 | — | (f) | ||||||||||||||||||||||||||||
| 1.00 | 0.01 | 1 | 0.14 | 0.88 | 0.40 | |||||||||||||||||||||||||||||
| 1.00 | 0.01 | 47,993 | 0.14 | 1.03 | — | (f) | ||||||||||||||||||||||||||||
| 1.00 | 0.01 | 9,044,336 | 0.12 | 0.23 | — | (f) | ||||||||||||||||||||||||||||
| 1.00 | 0.01 | 89,636 | 0.12 | 0.26 | 0.01 | |||||||||||||||||||||||||||||
| 1.00 | 0.01 | 60,660 | 0.12 | 0.33 | — | (f) | ||||||||||||||||||||||||||||
| 1.00 | 0.01 | 71,459 | 0.12 | 0.38 | — | (f) | ||||||||||||||||||||||||||||
| 1.00 | 0.01 | 480,896 | 0.12 | 0.48 | — | (f) | ||||||||||||||||||||||||||||
| 1.00 | 0.01 | 1,313,277 | 0.12 | 0.58 | — | (f) | ||||||||||||||||||||||||||||
| 1.00 | 0.01 | 603,587 | 0.12 | 0.73 | — | (f) | ||||||||||||||||||||||||||||
| 1.00 | 0.01 | 1 | 0.12 | 0.88 | 0.40 | |||||||||||||||||||||||||||||
| 1.00 | 0.01 | 175,249 | 0.12 | 1.03 | — | (f) | ||||||||||||||||||||||||||||
| 1.00 | 0.01 | 9,888,638 | 0.17 | 0.23 | 0.01 | |||||||||||||||||||||||||||||
| 1.00 | 0.01 | 74,182 | 0.18 | 0.26 | — | (f) | ||||||||||||||||||||||||||||
| 1.00 | 0.01 | 269,893 | 0.18 | 0.33 | — | (f) | ||||||||||||||||||||||||||||
| 1.00 | 0.01 | 80,713 | 0.18 | 0.38 | — | (f) | ||||||||||||||||||||||||||||
| 1.00 | 0.01 | 454,427 | 0.18 | 0.48 | — | (f) | ||||||||||||||||||||||||||||
| 1.00 | 0.01 | 1,298,287 | 0.18 | 0.58 | — | (f) | ||||||||||||||||||||||||||||
| 1.00 | 0.01 | 739,254 | 0.18 | 0.73 | — | (f) | ||||||||||||||||||||||||||||
| 1.00 | 0.01 | 1 | 0.17 | 0.88 | 0.19 | |||||||||||||||||||||||||||||
| 1.00 | 0.01 | 151,472 | 0.18 | 1.03 | — | (f) | ||||||||||||||||||||||||||||
| The accompanying notes are an integral part of these financial statements. | 79 |
GOLDMAN SACHS FUNDS — FINANCIAL SQUARE FUNDS
Notes to Financial Statements
February 29, 2016 (Unaudited)
| 1. ORGANIZATION |
Goldman Sachs Trust (the “Trust”) is a Delaware statutory trust registered under the Investment Company Act of 1940, as amended (the “Act”), as an open-end management investment company. The following table lists those series of the Trust that are included in this report (collectively, the “Funds” or individually a “Fund”), along with their corresponding share classes and respective diversification status under the Act:
| Fund | Share Classes Offered | Diversified/ Non-Diversified | ||||||
Federal Instruments* | FST Institutional, FST Select, FST Preferred, FST Capital, | Diversified | ||||||
Government** | FST Institutional, FST Select, FST Preferred, FST Capital, | Diversified | ||||||
Money Market, Tax-Free Money Market, Treasury Instruments, Treasury Obligations and Treasury Solutions (formerly the Federal Fund) | FST Institutional, FST Select, FST Preferred, FST Capital, | Diversified | ||||||
Prime Obligations | FST Institutional, FST Select, FST Preferred, FST Capital, | Diversified | ||||||
Tax-Exempt California and Tax-Exempt New York | FST Institutional, FST Administration, FST Service and | Non-Diversified |
| * | Commenced operations on October 30, 2015. |
| ** | Class R6 Shares commenced operations on December 29, 2015. Class A and Class C Shares commenced operations on February 29, 2016. |
Class C Shares are generally not available for purchase. Class C Shares may typically be acquired only in an exchange for Class C Shares of another Goldman Sachs Fund. Class C Shares are subject to a contingent deferred sales charge (“CDSC”) of 1% during the first 12 months, measured from the time the original shares subject to the CDSC were acquired. Previously, the ‘FST Institutional Shares’ were known as the ‘FST Shares’.
Goldman Sachs Asset Management, L.P. (“GSAM”), an affiliate of Goldman, Sachs & Co. (“Goldman Sachs”), serves as investment adviser to the Funds pursuant to management agreements (the “Agreements”) with the Trust.
| 2. SIGNIFICANT ACCOUNTING POLICIES |
The financial statements have been prepared in accordance with accounting principles generally accepted in the United States of America (“GAAP”) and require management to make estimates and assumptions that may affect the reported amounts and disclosures. Actual results may differ from those estimates and assumptions.
A. Investment Valuation — The investment valuation policy of the Funds is to use the amortized-cost method permitted by Rule 2a-7 under the Act, which approximates market value, for valuing portfolio securities. Under this method, all investments purchased at a discount or premium are valued by accreting or amortizing the difference between the original purchase price and maturity value of the issue, as an adjustment to interest income. Under procedures and tolerances approved by the Board of Trustees (“Trustees”), GSAM evaluates the difference between the Funds’ net asset value per share (“NAV”) based upon the amortized cost of the Funds’ securities and the NAV based upon available market quotations (or permitted substitutes) daily.
80
GOLDMAN SACHS FUNDS — FINANCIAL SQUARE FUNDS
| 2. SIGNIFICANT ACCOUNTING POLICIES (continued) |
B. Investment Income and Investments — Interest income is accrued daily and adjusted for amortization of premiums and accretion of discounts. Investment transactions are reflected on trade date. Realized gains and losses are calculated using identified cost.
C. Class Allocations and Expenses — Investment income, realized and unrealized gain (loss), and non-class specific expenses of each Fund are allocated daily based upon the proportion of net assets of each class. Class specific expenses, where applicable, are borne by the respective share classes and include Distribution and Service, Transfer Agency and Service and Shareholder Administration fees. Non-class specific expenses directly incurred by a Fund are charged to that Fund, while such expenses incurred by the Trust are allocated across the respective Funds on a straight-line and/or pro-rata basis depending upon the nature of the expenses.
D. Federal Taxes and Distributions to Shareholders — It is each Fund’s policy to comply with the requirements of the Internal Revenue Code of 1986, as amended (the “Code”), applicable to regulated investment companies (mutual funds) and to distribute each year substantially all of its investment company taxable and tax-exempt income and capital gains to its shareholders. Accordingly, the Funds are not required to make any provisions for the payment of federal income tax. Distributions to shareholders are declared and recorded daily and paid monthly by the Funds and may include short-term capital gains. Long-term capital gain distributions, if any, are declared and paid annually.
Net capital losses are carried forward to future fiscal years and may be used to the extent allowed by the Code to offset any future capital gains. Utilization of capital loss carryforwards will reduce the requirement of future capital gains distributions.
The Funds are permitted to carry forward capital losses incurred in taxable years beginning after December 22, 2010 for an unlimited period. Capital losses that are carried forward will retain their character as either short-term or long-term capital losses.
The characterization of distributions to shareholders for financial reporting purposes is determined in accordance with federal income tax rules, which may differ from GAAP. The source of each Fund’s distributions may be shown in the accompanying financial statements as either from net investment income, net realized gain or capital. Certain components of the Funds’ net assets on the Statements of Assets and Liabilities reflect permanent GAAP/tax differences based on the appropriate tax character.
E. Forward Commitments — A forward commitment involves entering into a contract to purchase or sell securities, typically on an extended settlement basis, for a fixed price at a future date. The purchase of securities on a forward commitment basis involves a risk of loss if the value of the security to be purchased declines before the settlement date. Conversely, the sale of securities on a forward commitment basis involves the risk that the value of the securities sold may increase before the settlement date. Although a Fund will generally purchase securities on a forward commitment basis with the intention of acquiring the securities for its portfolio, the Fund may dispose of forward commitments prior to settlement which may result in a realized gain or loss.
F. Offering and Organization Costs — Offering costs paid in connection with the initial offering of shares of the Goldman Sachs Financial Square Federal Instruments Fund are being amortized on a straight-line basis over 12 months from the date of commencement of operations. Organization costs paid in connection with the organization of the Goldman Sachs Financial Square Federal Instruments Fund were expensed on the first day of operations.
G. Repurchase Agreements — Repurchase agreements involve the purchase of securities subject to the seller’s agreement to repurchase the securities at a mutually agreed upon date and price, under the terms of a Master Repurchase Agreement (“MRA”). During the term of a repurchase agreement, the value of the underlying securities held as collateral on behalf of a Fund, including accrued interest, is required to exceed the value of the repurchase agreement, including accrued interest. The gross value of repurchase agreements is included in the Statements of Assets and Liabilities for financial reporting purposes. The underlying securities for all repurchase agreements are held at the Funds’ custodian or designated sub-custodians under tri-party repurchase agreements.
An MRA governs transactions between a Fund and select counterparties. An MRA contains provisions for, among other things, initiation of the transaction, income payments, events of default and maintenance of securities for repurchase agreements.
81
GOLDMAN SACHS FUNDS — FINANCIAL SQUARE FUNDS
Notes to Financial Statements (continued)
February 29, 2016 (Unaudited)
| 2. SIGNIFICANT ACCOUNTING POLICIES (continued) |
An MRA also permits offsetting with collateral to create one single net payment in the event of default or similar events, including the bankruptcy or insolvency of a counterparty.
If the seller defaults, a Fund could suffer a loss to the extent that the proceeds from the sale of the underlying securities and other collateral held by the Fund are less than the repurchase price and the Fund’s costs associated with delay and enforcement of the repurchase agreement. In addition, in the event of default or insolvency of the seller, a court could determine that a Fund’s interest in the collateral is not enforceable, resulting in additional losses to the Fund.
Pursuant to exemptive relief granted by the Securities and Exchange Commission (“SEC”) and terms and conditions contained therein, the Funds, together with other funds of the Trust and registered investment companies having management agreements with GSAM or its affiliates, may transfer uninvested cash into joint accounts, the daily aggregate balance of which is invested in one or more repurchase agreements. Under these joint accounts, the Funds maintain pro-rata credit exposure to the underlying repurchase agreements’ counterparties. With the exception of certain transaction fees, the Funds are not subject to any expenses in relation to these investments.
| 3. INVESTMENTS AND FAIR VALUE MEASUREMENTS |
The fair value of a financial instrument is the amount that would be received to sell an asset or paid to transfer a liability in an orderly transaction between market participants at the measurement date (i.e., the exit price). GAAP establishes a fair value hierarchy that prioritizes the inputs to valuation techniques used to measure fair value. The hierarchy gives the highest priority to unadjusted quoted prices in active markets for identical assets or liabilities (Level 1 measurements) and the lowest priority to unobservable inputs (Level 3 measurements). The levels used for classifying investments are not necessarily an indication of the risk associated with investing in these investments. The three levels of the fair value hierarchy are described below:
Level 1 — Unadjusted quoted prices in active markets that are accessible at the measurement date for identical, unrestricted assets or liabilities;
Level 2 — Quoted prices in markets that are not active or financial instruments for which significant inputs are observable (including, but not limited to, quoted prices for similar investments, interest rates, foreign exchange rates, volatility and credit spreads), either directly or indirectly;
Level 3 — Prices or valuations that require significant unobservable inputs (including GSAM’s assumptions in determining fair value measurement).
The Trustees have approved Rule 2a-7 Procedures (“Procedures”) that govern the valuation of the portfolio investments held by the Funds at amortized cost. The Trustees have delegated to GSAM day-to-day responsibility for implementing and maintaining internal controls and procedures related to the valuation (including both the amortized cost and market-based methods of valuation) of the Funds’ portfolio investments. To assess the continuing appropriateness of pricing sources and methodologies related to the market-based method of valuation, GSAM regularly performs price verification procedures and issues challenges as necessary to third party pricing vendors or brokers, and any differences are reviewed in accordance with the Procedures.
As of February 29, 2016, all investments are classified as Level 2. Please refer to the Schedules of Investments for further detail.
| 4. AGREEMENTS AND AFFILIATED TRANSACTIONS |
A. Management Agreements — Under the Agreements, GSAM manages the Funds, subject to the general supervision of the Trustees.
As compensation for the services rendered pursuant to the Agreements, the assumption of the expenses related thereto and administration of the Funds’ business affairs, including providing facilities, GSAM is entitled to a management fee, accrued daily and paid monthly, equal to an annual percentage rate of each Fund’s average daily net assets.
82
GOLDMAN SACHS FUNDS — FINANCIAL SQUARE FUNDS
| 4. AGREEMENTS AND AFFILIATED TRANSACTIONS (continued) |
B. Administration, Service and Shareholder Administration Plans — The Trust, on behalf of each applicable Fund, has adopted Administration, Service and Shareholder Administration Plans (the “Plans”) to allow FST Select, FST Preferred, FST Capital, FST Administration, FST Premier, FST Service, FST Resource and FST Cash Management Shares (“CMS”) to compensate service organizations for providing varying levels of account administration and/or personal and account maintenance services to their customers who are beneficial owners of such shares. The Plans provide for compensation to the service organizations equal to an annual percentage rate of the average daily net assets of such shares.
C. Distribution and Service Plans — The Trust, on behalf of the Prime Obligations Fund’s Class C Shares and the Government Fund’s Class A and Class C Shares, has adopted Distribution and Service Plans. Under the Distribution and Service Plans, Goldman Sachs, as Distributor, is entitled to a fee accrued daily and paid monthly from the Prime Obligations Fund’s Class C Shares and the Government Fund’s Class A and Class C Shares for distribution services and personal and account maintenance services, as applicable. These fees are equal to an annual percentage rate of the average daily net assets attributable to Class A Shares and Class C Shares, which may then be paid by Goldman Sachs to authorized dealers.
The Trust, on behalf of the FST Resource Shares and FST CMS of each applicable Fund, has adopted Distribution Plans. Under the Distribution Plans, Goldman Sachs is entitled to a monthly fee from the applicable Fund’s FST Resource Shares and FST CMS for distribution services equal to an annual percentage rate of the average daily net assets attributable to FST Resource Shares and FST CMS, which may then be paid by Goldman Sachs to authorized dealers.
D. Distribution Agreement — Goldman Sachs serves as Distributor of the shares of the Funds pursuant to a Distribution Agreement. Pursuant to the Distribution Agreement, the Distributor receives no additional compensation other than retained amounts related to the Distribution and Service Plans and the portion of the Prime Obligations Fund’s Class C Shares’ CDSCs that it retains. During the six months ended February 29, 2016, Goldman Sachs has advised that it retained $914 in CDSCs from Class C Shares.
E. Transfer Agency Agreement — Goldman Sachs also serves as the transfer agent of the Funds for a fee pursuant to a Transfer Agency Agreement. The fee charged for such transfer agency services is accrued daily and paid monthly and is equal to an annual percentage rate of each Fund’s average daily net assets.
F. Other Agreements — GSAM has agreed to limit certain “Other Expenses” of the Funds (except for the Tax-Exempt California and Tax-Exempt New York Funds) (excluding transfer agency fees and expenses, administration, service and/or shareholder administration fees (as applicable), taxes, interest, brokerage fees, shareholder meetings, litigation, indemnification and extraordinary expenses) to the extent that such expenses exceed, on an annual basis, 0.014% of the average daily net assets of each Fund. Such Other Expense reimbursements, if any, are accrued daily and paid monthly. These Other Expense limitations will remain in place through at least December 29, 2016, except that the “Other Expense” limitation for Class A and Class C Shares of the Government Fund will remain in place through at least February 28, 2017 and prior to such date GSAM may not terminate the arrangements without the approval of the Trustees.
GSAM has agreed to reduce or limit the “Total Annual Fund Operating Expenses” of the Tax-Exempt California and Tax-Exempt New York Funds (excluding administration, service and/or shareholder administration fees (as applicable), taxes, interest, brokerage fees, shareholder meetings, litigation, indemnification and extraordinary expenses) such that the “Total Annual Fund Operating Expenses” will not exceed 0.434% of each Fund’s average daily net assets. Such expense reimbursements, if any, are accrued daily and paid monthly. These expense limitations will remain in place through at least December 29, 2016, and prior to such date GSAM may not terminate the arrangements without the approval of the Trustees. In addition, the Funds have entered into certain offset arrangements with the custodian and the transfer agent, which may result in a reduction of the Funds’ expenses and are received irrespective of the application of the “Other Expense” limitations described above.
83
GOLDMAN SACHS FUNDS — FINANCIAL SQUARE FUNDS
Notes to Financial Statements (continued)
February 29, 2016 (Unaudited)
| 4. AGREEMENTS AND AFFILIATED TRANSACTIONS (continued) |
G. Total Fund Expenses
Fund Contractual Fees
The contractual annualized rates for each of the Funds (except Tax-Exempt California and Tax-Exempt New York Funds) are as follows:
| All Funds Except Tax-Exempt California and Tax-Exempt New York Funds | ||||||||||||||||||||||||||||||||||||||||||||||||
| FST Institutional Shares | FST Select Shares | FST Preferred Shares | FST Capital Shares | FST Administration Shares | FST Premier Shares | FST Service Shares | FST Resource Shares | FST CMS | Class R6 Shares(a) | Class A Shares(a) | Class C Shares(b) | |||||||||||||||||||||||||||||||||||||
Management Fee | 0.205 | % | 0.205 | % | 0.205 | % | 0.205 | % | 0.205 | % | 0.205 | % | 0.205 | % | 0.205 | % | 0.205 | % | 0.205 | % | 0.205 | % | 0.205 | % | ||||||||||||||||||||||||
Administration, Service | N/A | 0.03 | 0.10 | 0.15 | 0.25 | 0.35 | 0.25 | 0.50 | 0.50 | N/A | N/A | 0.25 | ||||||||||||||||||||||||||||||||||||
Distribution and/or | N/A | N/A | N/A | N/A | N/A | N/A | 0.25 | (c) | 0.15 | (d) | 0.30 | (d) | N/A | 0.25 | 0.75 | |||||||||||||||||||||||||||||||||
Transfer Agency Fee | 0.01 | 0.01 | 0.01 | 0.01 | 0.01 | 0.01 | 0.01 | 0.01 | 0.01 | 0.01 | 0.01 | 0.01 | ||||||||||||||||||||||||||||||||||||
N/A — Fees not applicable to respective share class
| (a) | Government Fund only. |
| (b) | Government Fund and Prime Obligations Fund. |
| (c) | Service (12b-1) fee only. |
| (d) | Distribution (12b-1) fee only. |
The contractual annualized rates for the Tax-Exempt California and Tax-Exempt New York Funds are as follows:
| FST Institutional Shares | FST Administration Shares | FST Service Shares | FST CMS | |||||||||||||
Management Fee | 0.35 | % | 0.35 | % | 0.35 | % | 0.35 | % | ||||||||
Administration, Service and/or Shareholder Administration Fees | N/A | 0.15 | 0.15 | 0.50 | ||||||||||||
Distribution or Service (12b-1) Fees | N/A | N/A | 0.25 | (a) | 0.50 | (b) | ||||||||||
Transfer Agency Fee | 0.01 | 0.01 | 0.01 | 0.01 | ||||||||||||
N/A — Fees not applicable to respective share class
| (a) | Service (12b-1) fee only. |
| (b) | Distribution (12b-1) fee only. |
Fund Effective Net Expenses (After Waivers and Reimbursements)
During the six months ended February 29, 2016, GSAM and Goldman Sachs (as applicable) voluntarily agreed to waive all or a portion of the management fees, respective class-specific fees (consisting of Distribution and/or Service, Administration, Service and/or Shareholder Administration Plan fees) and transfer agency fees attributable to the Funds. These waivers may be modified or terminated at any time at the option of GSAM or Goldman Sachs (as applicable), with the exception of (i) GSAM’s agreement not to impose a portion of the management fee equal annually to 0.025% of the Federal Instruments, Treasury Obligations, Treasury Instruments and Treasury Solutions Funds’ average daily net assets and 0.045% of the Prime Obligations, Money Market, Government and Tax-Free Money Market Funds’ average daily net assets, and (ii) Goldman Sachs’ agreement to limit the amount of annual distribution fees payable by Tax-Exempt California and Tax-Exempt New York Funds to 0.07% of each Fund’s average daily net assets attributable to FST CMS. The following tables outline such fees (net of any waivers) and Other Expenses (net of
84
GOLDMAN SACHS FUNDS — FINANCIAL SQUARE FUNDS
| 4. AGREEMENTS AND AFFILIATED TRANSACTIONS (continued) |
reimbursements and custodian fee credit reductions) in order to determine each Fund’s ratio of net expenses for the six months ended February 29, 2016. The Funds are not obligated to reimburse GSAM or Goldman Sachs for prior fiscal year fee waivers and/or expense reimbursements, if any.
| Ratio of Net Expenses to Average Net Assets for the Period Ended February 29, 2016 | ||||||||||||||||||||||||||||||||
| FST Institutional Shares | FST Select Shares | FST Preferred Shares | FST Capital Shares | FST Administration Shares | FST Premier Shares | FST Service Shares | FST CMS | |||||||||||||||||||||||||
| Federal Instruments* | ||||||||||||||||||||||||||||||||
Management Fee(a) | 0.18 | % | 0.18 | % | 0.18 | % | 0.18 | % | 0.18 | % | 0.18 | % | 0.18 | % | 0.18 | % | ||||||||||||||||
Administration Service and/or Shareholder | N/A | 0.02 | 0.07 | 0.10 | 0.15 | 0.11 | 0.15 | 0.00 | ||||||||||||||||||||||||
Distribution and/or Service (12b-1) Fees | N/A | N/A | N/A | N/A | N/A | N/A | N/A | 0.11 | ||||||||||||||||||||||||
Transfer Agency Fee | 0.01 | 0.01 | 0.01 | 0.01 | 0.01 | 0.01 | 0.01 | 0.01 | ||||||||||||||||||||||||
Other Expenses | 0.01 | 0.01 | 0.01 | 0.01 | 0.01 | 0.01 | 0.01 | 0.01 | ||||||||||||||||||||||||
| Net Expenses | 0.20 | 0.22 | 0.27 | 0.30 | 0.35 | 0.31 | 0.35 | 0.31 | ||||||||||||||||||||||||
| * | Commenced operations on October 30, 2015. |
N/A — Fees not applicable to respective share class.
| (a) | GSAM waived a portion of its management fee in order to achieve the effective net management rates above. |
| Ratio of Net Expenses to Average Net Assets for the Six Months or Period Ended February 29, 2016 | ||||||||||||||||||||||||||||||||||||||||||||||||
| FST Institutional Shares | FST Select Shares | FST Preferred Shares | FST Capital Shares | FST Administration Shares | FST Premier Shares | FST Service Shares | FST Resource Shares | FST CMS | Class R6 Shares(b) | Class A Shares(c) | Class C Shares(c) | |||||||||||||||||||||||||||||||||||||
| Government | ||||||||||||||||||||||||||||||||||||||||||||||||
Management Fee(a) | 0.16 | % | 0.16 | % | 0.16 | % | 0.16 | % | 0.16 | % | 0.16 | % | 0.16 | % | 0.16 | % | 0.16 | % | 0.16 | % | 0.16 | % | 0.16 | % | ||||||||||||||||||||||||
Administration Service | N/A | 0.03 | 0.05 | 0.08 | 0.12 | 0.02 | 0.10 | 0.06 | 0.00 | N/A | N/A | 0.00 | ||||||||||||||||||||||||||||||||||||
Distribution or Service | N/A | N/A | N/A | N/A | N/A | N/A | N/A | 0.15 | 0.07 | N/A | 0.15 | 0.15 | ||||||||||||||||||||||||||||||||||||
Transfer Agency Fee | 0.01 | 0.01 | 0.01 | 0.01 | 0.01 | 0.01 | 0.01 | 0.01 | 0.01 | 0.01 | 0.01 | 0.01 | ||||||||||||||||||||||||||||||||||||
Other Expenses | 0.01 | 0.01 | 0.01 | 0.01 | 0.01 | 0.01 | 0.01 | 0.01 | 0.01 | 0.01 | 0.01 | 0.01 | ||||||||||||||||||||||||||||||||||||
| Net Expenses | 0.18 | 0.21 | 0.23 | 0.26 | 0.30 | 0.20 | 0.28 | 0.39 | 0.25 | 0.18 | 0.33 | 0.33 | ||||||||||||||||||||||||||||||||||||
N/A — Fees not applicable to respective share class.
| (a) | GSAM waived a portion of its management fee in order to achieve the effective net management rates above. |
| (b) | Commenced operations on December 29, 2015. |
| (c) | Commenced operations on February 29, 2016. |
85
GOLDMAN SACHS FUNDS — FINANCIAL SQUARE FUNDS
Notes to Financial Statements (continued)
February 29, 2016 (Unaudited)
| 4. AGREEMENTS AND AFFILIATED TRANSACTIONS (continued) |
| Ratio of Net Expenses to Average Net Assets for the Six Months Ended February 29, 2016 | ||||||||||||||||||||||||||||||||||||||||
| FST Institutional Shares | FST Select Shares | FST Preferred Shares | FST Capital Shares | FST Administration Shares | FST Premier Shares | FST Service Shares | FST Resource Shares | FST CMS | Class C Shares | |||||||||||||||||||||||||||||||
| Prime Obligations | ||||||||||||||||||||||||||||||||||||||||
Management Fee(a) | 0.16 | % | 0.16 | % | 0.16 | % | 0.16 | % | 0.16 | % | 0.16 | % | 0.16 | % | 0.16 | % | 0.16 | % | 0.16 | % | ||||||||||||||||||||
Administration Service and/or Shareholder Administration Fees | N/A | 0.03 | 0.09 | 0.12 | 0.16 | 0.00 | 0.18 | 0.07 | 0.00 | 0.00 | ||||||||||||||||||||||||||||||
Distribution and/or Service (12b-1) Fees | N/A | N/A | N/A | N/A | N/A | N/A | N/A | 0.11 | 0.00 | 0.19 | ||||||||||||||||||||||||||||||
Transfer Agency Fee | 0.01 | 0.01 | 0.01 | 0.01 | 0.01 | 0.01 | 0.01 | 0.01 | 0.01 | 0.01 | ||||||||||||||||||||||||||||||
Other Expenses | 0.01 | 0.01 | 0.01 | 0.01 | 0.01 | 0.01 | 0.01 | 0.01 | 0.01 | 0.01 | ||||||||||||||||||||||||||||||
| Net Expenses | 0.18 | 0.21 | 0.27 | 0.30 | 0.34 | 0.18 | 0.36 | 0.36 | 0.18 | 0.37 | ||||||||||||||||||||||||||||||
N/A — Fees not applicable to respective share class.
| (a) | GSAM waived a portion of its management fee in order to achieve the effective net management rates above. |
| Ratio of Net Expenses to Average Net Assets for the Six Months Ended February 29, 2016 | ||||||||||||||||||||||||||||||||||||
| FST Institutional Shares | FST Select Shares | FST Preferred Shares | FST Capital Shares | FST Administration Shares | FST Premier Shares | FST Service Shares | FST Resource Shares | FST CMS | ||||||||||||||||||||||||||||
| Money Market | ||||||||||||||||||||||||||||||||||||
Management Fee(a) | 0.16 | % | 0.16 | % | 0.16 | % | 0.16 | % | 0.16 | % | 0.16 | % | 0.16 | % | 0.16 | % | 0.16 | % | ||||||||||||||||||
Administration Service and/or Shareholder Administration Fees | N/A | 0.03 | 0.10 | 0.15 | 0.18 | 0.01 | 0.23 | 0.01 | 0.03 | |||||||||||||||||||||||||||
Distribution or Service (12b-1) Fees | N/A | N/A | N/A | N/A | N/A | N/A | N/A | 0.00 | 0.21 | |||||||||||||||||||||||||||
Transfer Agency Fee | 0.01 | 0.01 | 0.01 | 0.01 | 0.01 | 0.01 | 0.01 | 0.01 | 0.01 | |||||||||||||||||||||||||||
Other Expenses | 0.01 | 0.01 | 0.01 | 0.01 | 0.01 | 0.01 | 0.01 | 0.01 | 0.01 | |||||||||||||||||||||||||||
| Net Expenses | 0.18 | 0.21 | 0.28 | 0.33 | 0.36 | 0.19 | 0.41 | 0.19 | 0.42 | |||||||||||||||||||||||||||
| Tax-Exempt California | ||||||||||||||||||||||||||||||||||||
Management Fee(a) | 0.00 | % | N/A | N/A | N/A | 0.00 | % | N/A | 0.00 | % | N/A | 0.00 | % | |||||||||||||||||||||||
Administration Service and/or Shareholder Administration Fees | N/A | N/A | N/A | N/A | 0.00 | N/A | 0.00 | N/A | 0.00 | |||||||||||||||||||||||||||
Distribution or Service (12b-1) Fees | N/A | N/A | N/A | N/A | N/A | N/A | N/A | N/A | 0.00 | |||||||||||||||||||||||||||
Transfer Agency Fee | 0.00 | N/A | N/A | N/A | 0.00 | N/A | 0.00 | N/A | 0.00 | |||||||||||||||||||||||||||
Other Expenses | 0.04 | N/A | N/A | N/A | 0.04 | N/A | 0.04 | N/A | 0.04 | |||||||||||||||||||||||||||
| Net Expenses | 0.04 | N/A | N/A | N/A | 0.04 | N/A | 0.04 | N/A | 0.04 | |||||||||||||||||||||||||||
N/A — Fees not applicable to respective share class.
| (a) | GSAM waived a portion of its management fee in order to achieve the effective net management rates above. |
86
GOLDMAN SACHS FUNDS — FINANCIAL SQUARE FUNDS
| 4. AGREEMENTS AND AFFILIATED TRANSACTIONS (continued) |
| Ratio of Net Expenses to Average Net Assets for the Six Months Ended February 29, 2016 | ||||||||||||||||||||||||||||||||||||
| FST Institutional Shares | FST Select Shares | FST Preferred Shares | FST Capital Shares | FST Administration Shares | FST Premier Shares | FST Service Shares | FST Resource Shares | FST CMS | ||||||||||||||||||||||||||||
| Tax-Exempt New York | ||||||||||||||||||||||||||||||||||||
Management Fee(a) | 0.01 | % | N/A | N/A | N/A | 0.01 | % | N/A | 0.01 | % | N/A | 0.01 | % | |||||||||||||||||||||||
Administration Service and/or Shareholder Administration Fees | N/A | N/A | N/A | N/A | 0.00 | N/A | 0.00 | N/A | 0.00 | |||||||||||||||||||||||||||
Distribution or Service (12b-1) Fees | N/A | N/A | N/A | N/A | N/A | N/A | N/A | N/A | 0.00 | |||||||||||||||||||||||||||
Transfer Agency Fee | 0.00 | N/A | N/A | N/A | 0.00 | N/A | 0.00 | N/A | 0.00 | |||||||||||||||||||||||||||
Other Expenses | 0.05 | N/A | N/A | N/A | 0.05 | N/A | 0.05 | N/A | 0.05 | |||||||||||||||||||||||||||
| Net Expenses | 0.06 | N/A | N/A | N/A | 0.06 | N/A | 0.06 | N/A | 0.06 | |||||||||||||||||||||||||||
| Tax-Free Money Market | ||||||||||||||||||||||||||||||||||||
Management Fee(a) | 0.07 | % | 0.07 | % | 0.07 | % | 0.07 | % | 0.07 | % | 0.07 | % | 0.07 | % | 0.07 | % | 0.07 | % | ||||||||||||||||||
Administration Service and/or Shareholder Administration Fees | N/A | 0.00 | 0.00 | 0.00 | 0.00 | 0.00 | 0.00 | 0.00 | 0.00 | |||||||||||||||||||||||||||
Distribution or Service (12b-1) Fees | N/A | N/A | N/A | N/A | N/A | N/A | N/A | 0.00 | 0.00 | |||||||||||||||||||||||||||
Transfer Agency Fee | 0.00 | 0.00 | 0.00 | 0.00 | 0.00 | 0.00 | 0.00 | 0.00 | 0.00 | |||||||||||||||||||||||||||
Other Expenses | 0.01 | 0.01 | 0.01 | 0.01 | 0.01 | 0.01 | 0.01 | 0.01 | 0.01 | |||||||||||||||||||||||||||
| Net Expenses | 0.08 | 0.08 | 0.08 | 0.08 | 0.08 | 0.08 | 0.08 | 0.08 | 0.08 | |||||||||||||||||||||||||||
| Treasury Instruments | ||||||||||||||||||||||||||||||||||||
Management Fee(a) | 0.16 | % | 0.16 | % | 0.16 | % | 0.16 | % | 0.16 | % | 0.16 | % | 0.16 | % | 0.16 | % | 0.16 | % | ||||||||||||||||||
Administration Service and/or Shareholder Administration Fees | N/A | 0.01 | 0.05 | 0.06 | 0.07 | 0.05 | 0.05 | 0.00 | 0.00 | |||||||||||||||||||||||||||
Distribution or Service (12b-1) Fees | N/A | N/A | N/A | N/A | N/A | N/A | N/A | 0.00 | 0.00 | |||||||||||||||||||||||||||
Transfer Agency Fee | 0.01 | 0.01 | 0.01 | 0.01 | 0.01 | 0.01 | 0.01 | 0.01 | 0.01 | |||||||||||||||||||||||||||
Other Expenses | 0.01 | 0.01 | 0.01 | 0.01 | 0.01 | 0.01 | 0.01 | 0.01 | 0.01 | |||||||||||||||||||||||||||
| Net Expenses | 0.18 | 0.19 | 0.23 | 0.24 | 0.25 | 0.23 | 0.23 | 0.18 | 0.18 | |||||||||||||||||||||||||||
N/A — Fees not applicable to respective share class.
| (a) | GSAM waived a portion of its management fee in order to achieve the effective net management rates above. |
87
GOLDMAN SACHS FUNDS — FINANCIAL SQUARE FUNDS
Notes to Financial Statements (continued)
February 29, 2016 (Unaudited)
| 4. AGREEMENTS AND AFFILIATED TRANSACTIONS (continued) |
| Ratio of Net Expenses to Average Net Assets for the Six Months Ended February 29, 2016 | ||||||||||||||||||||||||||||||||||||
| FST Institutional Shares | FST Select Shares | FST Preferred Shares | FST Capital Shares | FST Administration Shares | FST Premier Shares | FST Service Shares | FST Resource Shares | FST CMS | ||||||||||||||||||||||||||||
| Treasury Obligations | ||||||||||||||||||||||||||||||||||||
Management Fee(a) | 0.16 | % | 0.16 | % | 0.16 | % | 0.16 | % | 0.16 | % | 0.16 | % | 0.16 | % | 0.16 | % | 0.16 | % | ||||||||||||||||||
Administration Service and/or | N/A | 0.01 | 0.04 | 0.06 | 0.07 | 0.00 | 0.07 | 0.00 | 0.00 | |||||||||||||||||||||||||||
Distribution or Service (12b-1) Fees | N/A | N/A | N/A | N/A | N/A | N/A | N/A | 0.00 | 0.00 | |||||||||||||||||||||||||||
Transfer Agency Fee | 0.00 | 0.00 | 0.00 | 0.00 | 0.00 | 0.00 | 0.00 | 0.00 | 0.00 | |||||||||||||||||||||||||||
Other Expenses | 0.01 | 0.01 | 0.01 | 0.01 | 0.01 | 0.01 | 0.01 | 0.01 | 0.01 | |||||||||||||||||||||||||||
| Net Expenses | 0.17 | 0.18 | 0.21 | 0.23 | 0.24 | 0.17 | 0.24 | 0.17 | 0.17 | |||||||||||||||||||||||||||
| Treasury Solutions | ||||||||||||||||||||||||||||||||||||
Management Fee(a) | 0.15 | % | 0.15 | % | 0.15 | % | 0.15 | % | 0.15 | % | 0.15 | % | 0.15 | % | 0.15 | % | 0.15 | % | ||||||||||||||||||
Administration Service and/or | N/A | 0.01 | 0.04 | 0.06 | 0.06 | 0.00 | 0.06 | 0.00 | 0.00 | |||||||||||||||||||||||||||
Distribution or Service (12b-1) Fees | N/A | N/A | N/A | N/A | N/A | N/A | N/A | 0.00 | 0.07 | |||||||||||||||||||||||||||
Transfer Agency Fee | 0.00 | 0.00 | 0.00 | 0.00 | 0.00 | 0.00 | 0.00 | 0.00 | 0.00 | |||||||||||||||||||||||||||
Other Expenses | 0.01 | 0.01 | 0.01 | 0.01 | 0.01 | 0.01 | 0.01 | 0.01 | 0.01 | |||||||||||||||||||||||||||
| Net Expenses | 0.16 | 0.17 | 0.20 | 0.22 | 0.22 | 0.16 | 0.22 | 0.16 | 0.23 | |||||||||||||||||||||||||||
N/A — Fees not applicable to respective share class.
| (a) | GSAM waived a portion of its management fee in order to achieve the effective net management rates above. |
88
GOLDMAN SACHS FUNDS — FINANCIAL SQUARE FUNDS
| 4. AGREEMENTS AND AFFILIATED TRANSACTIONS (continued) |
For the six months and the period ended February 29, 2016, expense reductions including any fee waivers and Other Expense reimbursements were as follows (in thousands):
| Fund | Management Fee Waivers | Transfer Agent Fee Waivers | Distribution, Administration, Service and/or Shareholder, Administration Plans Fee Waivers | Other Expense | Total Expense Reductions | |||||||||||||||
Federal Instruments(a) | $ | 31 | $ | — | $ | 39 | $ | 175 | $ | 245 | ||||||||||
Government | 7,820 | — | 2,940 | — | 10,760 | |||||||||||||||
Money Market | 9,160 | — | 201 | — | 9,361 | |||||||||||||||
Prime Obligations | 2,964 | — | 2,393 | — | 5,357 | |||||||||||||||
Tax-Exempt California | 379 | 11 | — | 126 | 516 | |||||||||||||||
Tax-Exempt New York | 160 | 5 | — | 135 | 300 | |||||||||||||||
Tax-Free Money Market | 3,565 | 263 | 373 | — | 4,201 | |||||||||||||||
Treasury Instruments | 9,280 | 829 | 2,699 | — | 12,808 | |||||||||||||||
Treasury Obligations | 3,188 | 380 | 3,629 | — | 7,197 | |||||||||||||||
Treasury Solutions | 2,904 | 285 | 1,612 | — | 4,801 | |||||||||||||||
| (a) | Commenced operations on October 30, 2015. |
H. Other Transactions with Affiliates — A Fund may purchase securities from, or sell securities to, an affiliated fund provided the affiliation is solely due to having a common investment adviser, common officers, or common Trustees. For the six months or period ended February 29, 2016, the purchase and sale transactions for the Funds with affiliated funds in compliance with Rule 17a-7 under the Act were as follows:
| Federal Instruments Fund(a) | Government Fund | Money Market Fund | Prime Obligations Fund | Tax-Exempt California Fund | Tax-Exempt New York Fund | Tax-Free Money Market Fund | Treasury Instruments Fund | Treasury Obligations Fund | Treasury Solutions Fund | |||||||||||||||||||||||||||||||
Purchases | $ | 244,654,323 | $ | — | $ | 16,012,050 | $ | 238,208,479 | $ | 33,806,381 | $ | 19,000,618 | $ | 387,589,294 | $ | 588,281,226 | $ | — | $ | 4,390,349,974 | ||||||||||||||||||||
Sales | — | — | 22,008,129 | 292,005,926 | 67,237,443 | 21,545,903 | 291,819,422 | 4,390,349,974 | 199,999,083 | 632,936,465 | ||||||||||||||||||||||||||||||
| (a) | Commenced operations on October 30, 2015. |
I. Line of Credit Facility — As of February 29, 2016, the Funds participated in a $1,205,000,000 committed, unsecured revolving line of credit facility (the “facility”) together with other funds of the Trust and certain registered investment companies having management agreements with GSAM or its affiliates (“Other Borrowers”). Pursuant to the terms of the facility, the Funds and Other Borrowers could increase the credit amount by up to an additional $115,000,000, for a total of up to $1,320,000,000. This facility is to be used for temporary emergency purposes, or to allow for an orderly liquidation of securities to meet redemption requests. The interest rate on borrowings is based on the federal funds rate. The facility also requires a fee to be paid by the Funds based on the amount of the commitment that has not been utilized. For the six months ended February 29, 2016, the Funds did not have any borrowings under the facility.
89
GOLDMAN SACHS FUNDS — FINANCIAL SQUARE FUNDS
Notes to Financial Statements (continued)
February 29, 2016 (Unaudited)
| 5. TAX INFORMATION |
As of the Funds’ most recent fiscal year end, August 31, 2015, the Funds’ certain timing differences on a tax basis were as follows:
| Federal Instruments(a) | Government | Money Market | Prime Obligations | Tax- Exempt California | Tax- Exempt New York | Tax-Free Money Market | Treasury Instruments | Treasury Obligations | Treasury Solutions | |||||||||||||||||||||||||||||||
Timing differences | $ | — | $ | (185,129 | ) | $ | (1,602,446 | ) | $ | (453,083 | ) | $ | (20 | ) | $ | 8 | $ | (7,928 | ) | $ | (39,130 | ) | $ | (47,846 | ) | $ | (16,136 | ) | ||||||||||||
| (a) | Commenced operations on October 30, 2015. |
The amortized cost for each Fund stated in the accompanying Statements of Assets and Liabilities also represents aggregate cost for U.S. federal income tax purposes.
GSAM has reviewed the Funds’ tax positions for all open tax years (the current and prior three tax years, as applicable) and has concluded that no provision for income tax is required in the Funds’ financial statements. Such open tax years remain subject to examination and adjustment by tax authorities.
| 6. OTHER RISKS |
The Funds’ risks include, but are not limited to, the following:
Large Shareholder Transactions Risk — A Fund may experience adverse effects when certain large shareholders, such as other funds, institutional investors (including those trading by use of non-discretionary mathematical formulas), financial intermediaries (who may make investment decisions on behalf of underlying clients and/or include a Fund in their investment model), individuals, accounts and Goldman Sachs affiliates, purchase or redeem large amounts of shares of a Fund. Such large shareholder redemptions may cause the Fund to sell portfolio securities at times when it would not otherwise do so, which may negatively impact a Fund’s NAV and liquidity. These transactions may also accelerate the realization of taxable income to shareholders if such sales of investments resulted in gains, and may also increase transaction costs. In addition, a large redemption could result in a Fund’s current expenses being allocated over a smaller asset base, leading to an increase in the Fund’s expense ratio. Similarly, large Fund share purchases may adversely affect a Fund’s performance to the extent that a Fund is delayed in investing new cash and is required to maintain a larger cash position than it ordinarily would.
Interest Rate Risk — When interest rates increase, a Fund’s yield will tend to be lower than prevailing market rates, and the market value of its securities or instruments may also be adversely affected. A low interest rate environment poses additional risks to a Fund, because low yields on a Fund’s portfolio holdings may have an adverse impact on a Fund’s ability to provide a positive yield to its shareholders, pay expenses out of Fund assets, or, at times, maintain a stable $1.00 share price. The risks associated with increasing interest rates are heightened given that interest rates are near historic lows, but may be expected to increase in the future with unpredictable effects on the markets and a Fund’s investments.
Market and Credit Risks — In the normal course of business, the Funds trade financial instruments and enter into financial transactions where risk of potential loss exists due to changes in the market (market risk). Additionally, the Funds may also be exposed to credit risk in the event that an issuer or guarantor fails to perform or that an institution or entity with which the Funds have unsettled or open transactions defaults.
Geographic Risk — The Tax-Exempt California, Tax-Exempt New York and Tax-Free Money Market Funds have the ability to invest a significant portion of their assets in certain issuers within the same state, geographic region or sector subjecting them to possible risks associated with an adverse economic, business or political development affecting that state, region or sector. In particular, the Tax-Exempt California and Tax-Exempt New York Funds may be affected by the adverse events affecting these
90
GOLDMAN SACHS FUNDS — FINANCIAL SQUARE FUNDS
| 6. OTHER RISKS (continued) |
states’ economies. If California, New York or any of their local governmental entities are unable to meet their financial obligations, the corresponding Fund’s income, NAV and ability to preserve capital or liquidity could be adversely affected.
| 7. INDEMNIFICATIONS |
Under the Trust’s organizational documents, its Trustees, officers, employees and agents are indemnified, to the extent permitted by the Act and state law, against certain liabilities that may arise out of performance of their duties to the Funds. Additionally, in the course of business, the Funds enter into contracts that contain a variety of indemnification clauses. The Funds’ maximum exposure under these arrangements is unknown, as this would involve future claims that may be made against the Funds that have not yet occurred. However, GSAM believes the risk of loss under these arrangements to be remote.
| 8. OTHER MATTERS |
Exemptive Orders — Pursuant to SEC exemptive orders, the Funds may enter into certain principal transactions, including repurchase agreements, with Goldman Sachs.
| 9. SUBSEQUENT EVENTS |
At a meeting held on December 17, 2015, the Trustees approved the name change, effective March 31, 2016, of the Financial Square Tax-Free Money Market Fund to the “Goldman Sachs Investor Tax-Exempt Money Market Fund.” The Trustees also approved the designation of the Goldman Sachs Investor Tax-Exempt Money Market Fund as a “retail money market fund,” as such term is defined by Rule 2a-7.
On December 17, 2015, the Trustees approved a proposal to liquidate two series of the Trust, the Goldman Sachs Financial Square Tax-Exempt California Fund and the Goldman Sachs Financial Square Tax-Exempt New York Fund. The liquidation will occur on or before August 31, 2016 pursuant to Plans of Liquidation approved by the Board.
Subsequent events after the Statements of Assets and Liabilities date have been evaluated through the date the financial statements were issued. Other than items previously discussed, GSAM has concluded that there is no impact requiring adjustment or disclosure in the financial statements.
91
GOLDMAN SACHS FUNDS — FINANCIAL SQUARE FUNDS
Notes to Financial Statements (continued)
February 29, 2016 (Unaudited)
| 10. SUMMARY OF SHARE TRANSACTIONS (AT $1.00 PER SHARE) |
Share activity is as follows:
| Federal Instruments Fund | ||||
|
| |||
| For the Period Ended February 29, 2016* (Unaudited) | ||||
|
| |||
| FST Institutional Shares | ||||
Shares sold | 734,495,901 | |||
Reinvestment of distributions | 157,515 | |||
Shares redeemed | (104,568,293 | ) | ||
| 630,085,123 | ||||
| FST Select Shares | ||||
Shares sold | 50,010 | |||
Reinvestment of distributions | 17 | |||
Shares redeemed | (10 | ) | ||
| 50,017 | ||||
| FST Preferred Shares | ||||
Shares sold | 50,010 | |||
Reinvestment of distributions | 9 | |||
Shares redeemed | (10 | ) | ||
| 50,009 | ||||
| FST Capital Shares | ||||
Shares sold | 50,010 | |||
Reinvestment of distributions | 4 | |||
Shares redeemed | (10 | ) | ||
| 50,004 | ||||
| FST Administration Shares | ||||
Shares sold | 72,088,782 | |||
Reinvestment of distributions | 1 | |||
Shares redeemed | (37,348,001 | ) | ||
| 34,740,782 | ||||
| FST Premier Shares | ||||
Shares sold | 50,010 | |||
Reinvestment of distributions | 1 | |||
Shares redeemed | (10 | ) | ||
| 50,001 | ||||
| FST Service Shares | ||||
Shares sold | 51,618,520 | |||
Reinvestment of distributions | 1 | |||
Shares redeemed | (30,611,967 | ) | ||
| 21,006,554 | ||||
| FST Cash Management Shares | ||||
Shares sold | 50,010 | |||
Reinvestment of distributions | 1 | |||
Shares redeemed | (10 | ) | ||
| 50,001 | ||||
NET INCREASE IN SHARES | 686,082,491 | |||
| * | Commenced operations on October 30, 2015. |
92
GOLDMAN SACHS FUNDS — FINANCIAL SQUARE FUNDS
| 10. SUMMARY OF SHARE TRANSACTIONS (AT $1.00 PER SHARE) (continued) |
Share activity is as follows:
| Government Fund | ||||||||
|
| |||||||
| For the Six Months Ended February 29, 2016 (Unaudited) | For the Fiscal Year Ended August 31, 2015 | |||||||
|
| |||||||
| FST Institutional Shares | ||||||||
Shares sold | 142,088,718,634 | 205,637,903,177 | ||||||
Reinvestment of distributions | 11,117,554 | 1,044,634 | ||||||
Shares redeemed | (130,262,311,601 | ) | (197,955,201,301 | ) | ||||
| 11,837,524,587 | 7,683,746,510 | |||||||
| FST Select Shares | ||||||||
Shares sold | 277,809,680 | 1,681,253,719 | ||||||
Reinvestment of distributions | 87,779 | 9,981 | ||||||
Shares redeemed | (298,165,559 | ) | (1,579,610,687 | ) | ||||
| (20,268,100 | ) | 101,653,013 | ||||||
| FST Preferred Shares | ||||||||
Shares sold | 485,646,105 | 1,220,612,938 | ||||||
Reinvestment of distributions | 6,110 | 7,693 | ||||||
Shares redeemed | (641,857,893 | ) | (1,237,959,206 | ) | ||||
| (156,205,678 | ) | (17,338,575 | ) | |||||
| FST Capital Shares | ||||||||
Shares sold | 2,156,616,900 | 3,548,052,037 | ||||||
Reinvestment of distributions | 174,225 | 59,413 | ||||||
Shares redeemed | (2,142,762,027 | ) | (3,487,087,899 | ) | ||||
| 14,029,098 | 61,023,551 | |||||||
| FST Administration Shares | ||||||||
Shares sold | 5,332,182,430 | 8,574,864,084 | ||||||
Reinvestment of distributions | 9,552 | 7,416 | ||||||
Shares redeemed | (4,520,249,646 | ) | (8,593,973,378 | ) | ||||
| 811,942,336 | (19,101,878 | ) | ||||||
| FST Premier Shares | ||||||||
Shares sold | — | — | ||||||
Reinvestment of distributions | — | — | ||||||
Shares redeemed | — | — | ||||||
| — | — | |||||||
| FST Service Shares | ||||||||
Shares sold | 625,443,606 | 1,726,884,742 | ||||||
Reinvestment of distributions | 2,134 | 4,868 | ||||||
Shares redeemed | (749,110,149 | ) | (1,634,941,770 | ) | ||||
| (123,664,409 | ) | 91,947,840 | ||||||
| Class A Shares(a) | ||||||||
Shares sold | 10,000 | — | ||||||
Reinvestment of distributions | — | — | ||||||
Shares redeemed | — | — | ||||||
| 10,000 | — | |||||||
| Class C Shares(a) | ||||||||
Shares sold | 10,000 | — | ||||||
Reinvestment of distributions | — | — | ||||||
Shares redeemed | — | — | ||||||
| 10,000 | — | |||||||
| FST Resource Shares | ||||||||
Shares sold | 28,195,237 | — | ||||||
Reinvestment of distributions | 306 | — | ||||||
Shares redeemed | (5,290,527 | ) | — | |||||
| 22,905,016 | — | |||||||
| FST Cash Management Shares | ||||||||
Shares sold | 900 | 3,057 | ||||||
Reinvestment of distributions | — | — | ||||||
Shares redeemed | — | (10 | ) | |||||
| 900 | 3,047 | |||||||
| Class R6 Shares(b) | ||||||||
Shares sold | 10,005 | — | ||||||
Reinvestment of distributions | 4 | — | ||||||
Shares redeemed | — | — | ||||||
| 10,009 | — | |||||||
NET INCREASE IN SHARES | 12,386,293,759 | 7,901,933,508 | ||||||
| (a) | Commenced operations on February 29, 2016. |
| (b) | Commenced operations on December 29, 2015. |
93
GOLDMAN SACHS FUNDS — FINANCIAL SQUARE FUNDS
Notes to Financial Statements (continued)
February 29, 2016 (Unaudited)
| 10. SUMMARY OF SHARE TRANSACTIONS (AT $1.00 PER SHARE) (continued) |
Share activity is as follows:
| Money Market Fund | ||||||||
|
| |||||||
| | For the Six Months Ended February 29, 2016 (Unaudited) | | | For the Fiscal Year Ended August 31, 2015 | | |||
|
| |||||||
| FST Institutional Shares | ||||||||
Shares sold | 216,124,478,912 | 411,191,154,559 | ||||||
Reinvestment of distributions | 24,517,886 | 12,708,992 | ||||||
Shares redeemed | (205,986,077,152 | ) | (404,986,225,057 | ) | ||||
| 10,162,919,646 | 6,217,638,494 | |||||||
| FST Select Shares | ||||||||
Shares sold | 3,763,270,850 | 6,392,022,858 | ||||||
Reinvestment of distributions | 2,488,746 | 682,769 | ||||||
Shares redeemed | (3,333,871,498 | ) | (5,002,961,577 | ) | ||||
| 431,888,098 | 1,389,744,050 | |||||||
| FST Preferred Shares | ||||||||
Shares sold | 265,424,385 | 889,830,559 | ||||||
Reinvestment of distributions | 26,796 | 4,637 | ||||||
Shares redeemed | (318,443,454 | ) | (839,182,179 | ) | ||||
| (52,992,273 | ) | 50,653,017 | ||||||
| FST Capital Shares | ||||||||
Shares sold | 1,040,730,562 | 717,653,705 | ||||||
Reinvestment of distributions | 156,764 | 6,126 | ||||||
Shares redeemed | (919,199,845 | ) | (552,929,140 | ) | ||||
| 121,687,481 | 164,730,691 | |||||||
| FST Administration Shares | ||||||||
Shares sold | 767,559,758 | 1,283,121,797 | ||||||
Reinvestment of distributions | 79,185 | 16,469 | ||||||
Shares redeemed | (844,430,289 | ) | (1,129,595,021 | ) | ||||
| (76,791,346 | ) | 153,543,245 | ||||||
| FST Premier Shares | ||||||||
Shares sold | — | — | ||||||
Reinvestment of distributions | — | — | ||||||
Shares redeemed | — | — | ||||||
| — | — | |||||||
| FST Service Shares | ||||||||
Shares sold | 147,303,348 | 176,633,158 | ||||||
Reinvestment of distributions | 686 | 1,080 | ||||||
Shares redeemed | (142,417,170 | ) | (176,531,609 | ) | ||||
| 4,886,864 | 102,629 | |||||||
| FST Resource Shares | ||||||||
Shares sold | — | — | ||||||
Reinvestment of distributions | — | — | ||||||
Shares redeemed | — | — | ||||||
| — | — | |||||||
| FST Cash Management Shares | ||||||||
Shares sold | 8,214,466 | 13,202,769 | ||||||
Reinvestment of distributions | 279 | 227 | ||||||
Shares redeemed | (4,375,305 | ) | (5,162,826 | ) | ||||
| 3,839,440 | 8,040,170 | |||||||
NET INCREASE IN SHARES | 10,595,437,910 | 7,984,452,296 | ||||||
94
GOLDMAN SACHS FUNDS — FINANCIAL SQUARE FUNDS
| 10. SUMMARY OF SHARE TRANSACTIONS (AT $1.00 PER SHARE) (continued) |
Share activity is as follows:
| Prime Obligations Fund | ||||||||
|
| |||||||
| | For the Six Months Ended February 29, 2016 (Unaudited) | | | For the Fiscal Year Ended August 31, 2015 | | |||
|
| |||||||
| FST Institutional Shares | ||||||||
Shares sold | 48,826,615,505 | 69,161,619,441 | ||||||
Reinvestment of distributions | 3,091,205 | 1,073,818 | ||||||
Shares redeemed | (44,842,730,557 | ) | (70,885,373,477 | ) | ||||
| 3,986,976,153 | (1,722,680,218 | ) | ||||||
| FST Select Shares | ||||||||
Shares sold | 114,159,934 | 442,506,580 | ||||||
Reinvestment of distributions | 70,458 | 8,869 | ||||||
Shares redeemed | (108,446,773 | ) | (472,513,053 | ) | ||||
| 5,783,619 | (29,997,604 | ) | ||||||
| FST Preferred Shares | ||||||||
Shares sold | 1,718,697,831 | 3,694,122,718 | ||||||
Reinvestment of distributions | 105,567 | 26,507 | ||||||
Shares redeemed | (1,782,091,856 | ) | (3,469,610,401 | ) | ||||
| (63,288,458 | ) | 224,538,824 | ||||||
| FST Capital Shares | ||||||||
Shares sold | 307,706,271 | 409,646,264 | ||||||
Reinvestment of distributions | 42,479 | 4,613 | ||||||
Shares redeemed | (245,228,599 | ) | (377,999,128 | ) | ||||
| 62,520,151 | 31,651,749 | |||||||
| FST Administration Shares | ||||||||
Shares sold | 4,843,168,614 | 10,673,725,644 | ||||||
Reinvestment of distributions | 44,552 | 22,830 | ||||||
Shares redeemed | (5,036,458,738 | ) | (10,424,704,689 | ) | ||||
| (193,245,572 | ) | 249,043,785 | ||||||
| FST Premier Shares | ||||||||
Shares sold | — | 1 | ||||||
Reinvestment of distributions | — | — | ||||||
Shares redeemed | (4 | ) | — | |||||
| (4 | ) | 1 | ||||||
| FST Service Shares | ||||||||
Shares sold | 3,918,134,381 | 9,927,354,265 | ||||||
Shares converted from Class B Shares (a) | — | 2,125,755 | ||||||
Reinvestment of distributions | 23,840 | 60,764 | ||||||
Shares redeemed | (4,128,531,341 | ) | (10,090,976,848 | ) | ||||
| (210,373,120 | ) | (161,436,064 | ) | |||||
| FST Class B Shares(a) | ||||||||
Shares sold | — | 140,281 | ||||||
Shares converted to Service Shares | — | (2,125,755 | ) | |||||
Reinvestment of distributions | — | 27 | ||||||
Shares redeemed | — | (1,213,401 | ) | |||||
| — | (3,198,848 | ) | ||||||
| Class C Shares | ||||||||
Shares sold | 7,621,629 | 9,406,529 | ||||||
Reinvestment of distributions | 1,005 | 1,915 | ||||||
Shares redeemed | (5,354,508 | ) | (10,360,943 | ) | ||||
| 2,268,126 | (952,499 | ) | ||||||
| FST Resource Shares | ||||||||
Shares sold | 42,969,718 | 128,972,371 | ||||||
Reinvestment of distributions | 3,301 | 7,548 | ||||||
Shares redeemed | (48,053,058 | ) | (135,480,663 | ) | ||||
| (5,080,039 | ) | (6,500,744 | ) | |||||
| FST Cash Management Shares | ||||||||
Shares sold | 5 | — | ||||||
Reinvestment of distributions | — | — | ||||||
Shares redeemed | (5 | ) | — | |||||
| — | — | |||||||
NET INCREASE (DECREASE) IN SHARES | 3,585,560,856 | (1,419,531,618 | ) | |||||
| (a) | FST Class B Shares were converted to FST Service Shares at the close of business on November 14, 2014. |
95
GOLDMAN SACHS FUNDS — FINANCIAL SQUARE FUNDS
Notes to Financial Statements (continued)
February 29, 2016 (Unaudited)
| 10. SUMMARY OF SHARE TRANSACTIONS (AT $1.00 PER SHARE) (continued) |
Share activity is as follows:
| Tax-Exempt California Fund | ||||||||
|
| |||||||
| | For the Six Months Ended February 29, 2016 (Unaudited) | | | For the Fiscal Year Ended August 31, 2015 | | |||
|
| |||||||
| FST Institutional Shares | ||||||||
Shares sold | 289,216,031 | 767,440,757 | ||||||
Reinvestment of distributions | 25,203 | 17,060 | ||||||
Shares redeemed | (362,386,976 | ) | (763,955,972 | ) | ||||
| (73,145,742 | ) | 3,501,845 | ||||||
| FST Administration Shares | ||||||||
Shares sold | — | 755,852 | ||||||
Reinvestment of distributions | — | 34 | ||||||
Shares redeemed | — | (2,055,714 | ) | |||||
| — | (1,299,828 | ) | ||||||
| FST Service Shares | ||||||||
Shares sold | 120 | 290 | ||||||
Reinvestment of distributions | — | — | ||||||
Shares redeemed | (120 | ) | (290 | ) | ||||
| — | — | |||||||
| FST Cash Management Shares | ||||||||
Shares sold | — | — | ||||||
Reinvestment of distributions | — | — | ||||||
Shares redeemed | — | — | ||||||
| — | — | |||||||
NET INCREASE (DECREASE) IN SHARES | (73,145,742 | ) | 2,202,017 | |||||
96
GOLDMAN SACHS FUNDS — FINANCIAL SQUARE FUNDS
| 10. SUMMARY OF SHARE TRANSACTIONS (AT $1.00 PER SHARE) (continued) |
Share activity is as follows:
| Tax-Exempt New York Fund | ||||||||
|
| |||||||
| | For the Six Months Ended February 29, 2016 (Unaudited) | | | For the Fiscal Year Ended August 31, 2015 | | |||
|
| |||||||
| FST Institutional Shares | ||||||||
Shares sold | 131,231,185 | 339,711,990 | ||||||
Reinvestment of distributions | 18,452 | 13,410 | ||||||
Shares redeemed | (127,204,468 | ) | (372,389,994 | ) | ||||
| 4,045,169 | (32,664,594 | ) | ||||||
| FST Administration Shares | ||||||||
Shares sold | — | — | ||||||
Reinvestment of distributions | — | 118 | ||||||
Shares redeemed | — | (2,213,175 | ) | |||||
| — | (2,213,175 | ) | ||||||
| FST Service Shares | ||||||||
Shares sold | — | — | ||||||
Reinvestment of distributions | — | — | ||||||
Shares redeemed | — | — | ||||||
| — | — | |||||||
| FST Cash Management Shares | ||||||||
Shares sold | — | — | ||||||
Reinvestment of distributions | — | — | ||||||
Shares redeemed | — | — | ||||||
| — | — | |||||||
NET INCREASE (DECREASE) IN SHARES | 4,045,169 | (34,877,769 | ) | |||||
97
GOLDMAN SACHS FUNDS — FINANCIAL SQUARE FUNDS
Notes to Financial Statements (continued)
February 29, 2016 (Unaudited)
| 10. SUMMARY OF SHARE TRANSACTIONS (AT $1.00 PER SHARE) (continued) |
Share activity is as follows:
| Tax-Free Money Market Fund | ||||||||
|
| |||||||
| For the Six Months Ended February 29, 2016 (Unaudited) | For the Fiscal Year Ended August 31, 2015 | |||||||
|
| |||||||
| FST Institutional Shares | ||||||||
Shares sold | 7,863,658,456 | 15,916,643,332 | ||||||
Reinvestment of distributions | 248,887 | 224,319 | ||||||
Shares redeemed | (8,885,431,128 | ) | (16,187,333,138 | ) | ||||
| (1,021,523,785 | ) | (270,465,487 | ) | |||||
| FST Select Shares | ||||||||
Shares sold | 82,981,114 | 225,825,811 | ||||||
Reinvestment of distributions | 13,672 | 15,405 | ||||||
Shares redeemed | (80,608,263 | ) | (299,491,215 | ) | ||||
| 2,386,523 | (73,649,999 | ) | ||||||
| FST Preferred Shares | ||||||||
Shares sold | 6,342,809 | 34,907,030 | ||||||
Reinvestment of distributions | 310 | 509 | ||||||
Shares redeemed | (10,183,605 | ) | (43,631,447 | ) | ||||
| (3,840,486 | ) | (8,723,908 | ) | |||||
| FST Capital Shares | ||||||||
Shares sold | 143,453,243 | 95,151,129 | ||||||
Reinvestment of distributions | 1,704 | 298 | ||||||
Shares redeemed | (118,315,499 | ) | (78,092,794 | ) | ||||
| 25,139,448 | 17,058,633 | |||||||
| FST Administration Shares | ||||||||
Shares sold | 335,035,285 | 463,915,678 | ||||||
Reinvestment of distributions | 3,532 | 2,239 | ||||||
Shares redeemed | (341,254,325 | ) | (512,003,840 | ) | ||||
| (6,215,508 | ) | (48,085,923 | ) | |||||
| FST Premier Shares | ||||||||
Shares sold | — | — | ||||||
Reinvestment of distributions | — | 37 | ||||||
Shares redeemed | — | (1,857,274 | ) | |||||
| — | (1,857,237 | ) | ||||||
| FST Service Shares | ||||||||
Shares sold | 87,599,249 | 169,368,992 | ||||||
Reinvestment of distributions | 423 | 872 | ||||||
Shares redeemed | (98,135,870 | ) | (163,607,199 | ) | ||||
| (10,536,198 | ) | 5,762,665 | ||||||
| FST Resource Shares | ||||||||
Shares sold | 9,642,570 | 21,168,023 | ||||||
Reinvestment of distributions | 510 | 646 | ||||||
Shares redeemed | (11,359,453 | ) | (25,882,659 | ) | ||||
| (1,716,373 | ) | (4,713,990 | ) | |||||
| FST Cash Management Shares | ||||||||
Shares sold | — | — | ||||||
Reinvestment of distributions | — | — | ||||||
Shares redeemed | — | — | ||||||
| — | — | |||||||
NET DECREASE IN SHARES | (1,016,306,379 | ) | (384,675,246 | ) | ||||
98
GOLDMAN SACHS FUNDS — FINANCIAL SQUARE FUNDS
| 10. SUMMARY OF SHARE TRANSACTIONS (AT $1.00 PER SHARE) (continued) |
Share activity is as follows:
| Treasury Instruments Fund | ||||||||
|
| |||||||
| For the Six Months Ended February 29, 2016 (Unaudited) | For the Fiscal Year Ended August 31, 2015 | |||||||
|
| |||||||
| FST Institutional Shares | ||||||||
Shares sold | 86,348,618,083 | 110,075,364,816 | ||||||
Reinvestment of distributions | 8,340,984 | 260,516 | ||||||
Shares redeemed | (69,235,571,545 | ) | (107,151,473,696 | ) | ||||
| 17,121,387,522 | 2,924,151,636 | |||||||
| FST Select Shares | ||||||||
Shares sold | 6,816,375 | 341,563,593 | ||||||
Reinvestment of distributions | 3,658 | 1,190 | ||||||
Shares redeemed | (74,487,717 | ) | (454,486,171 | ) | ||||
| (67,667,684 | ) | (112,921,388 | ) | |||||
| FST Preferred Shares | ||||||||
Shares sold | 138,467,857 | 417,407,771 | ||||||
Reinvestment of distributions | 1,891 | 282 | ||||||
Shares redeemed | (131,189,112 | ) | (427,710,336 | ) | ||||
| 7,280,636 | (10,302,283 | ) | ||||||
| FST Capital Shares | ||||||||
Shares sold | 1,358,782,864 | 1,592,772,320 | ||||||
Reinvestment of distributions | 15,439 | 2,724 | ||||||
Shares redeemed | (1,303,402,399 | ) | (1,402,897,479 | ) | ||||
| 55,395,904 | 189,877,565 | |||||||
| FST Administration Shares | ||||||||
Shares sold | 4,674,879,378 | 5,528,070,349 | ||||||
Reinvestment of distributions | 7,152 | 8,853 | ||||||
Shares redeemed | (4,566,502,024 | ) | (4,657,953,847 | ) | ||||
| 108,384,506 | 870,125,355 | |||||||
| FST Premier Shares | ||||||||
Shares sold | 395,791 | 1,225,126 | ||||||
Reinvestment of distributions | — | 13 | ||||||
Shares redeemed | (397,201 | ) | (3,892,090 | ) | ||||
| (1,410 | ) | (2,666,951 | ) | |||||
| FST Service Shares | ||||||||
Shares sold | 241,960,938 | 563,884,438 | ||||||
Reinvestment of distributions | 257 | 536 | ||||||
Shares redeemed | (345,218,272 | ) | (506,817,396 | ) | ||||
| (103,257,077 | ) | 57,067,578 | ||||||
| FST Resource Shares | ||||||||
Shares sold | — | — | ||||||
Reinvestment of distributions | — | — | ||||||
Shares redeemed | — | — | ||||||
| — | — | |||||||
| FST Cash Management Shares | ||||||||
Shares sold | — | — | ||||||
Reinvestment of distributions | — | — | ||||||
Shares redeemed | — | — | ||||||
| — | — | |||||||
NET INCREASE IN SHARES | 17,121,522,397 | 3,915,331,512 | ||||||
99
GOLDMAN SACHS FUNDS — FINANCIAL SQUARE FUNDS
Notes to Financial Statements (continued)
February 29, 2016 (Unaudited)
| 10. SUMMARY OF SHARE TRANSACTIONS (AT $1.00 PER SHARE) (continued) |
Share activity is as follows:
| Treasury Obligations Fund | ||||||||
|
| |||||||
| For the Six Months Ended February 29, 2016 (Unaudited) | For the Fiscal Year Ended August 31, 2015 | |||||||
|
| |||||||
| FST Institutional Shares | ||||||||
Shares sold | 39,043,817,044 | 83,027,774,903 | ||||||
Reinvestment of distributions | 2,421,640 | 470,494 | ||||||
Shares redeemed | (40,113,719,297 | ) | (83,091,755,213 | ) | ||||
| (1,067,480,613 | ) | (63,509,816 | ) | |||||
| FST Select Shares | ||||||||
Shares sold | 248,023,049 | 485,570,090 | ||||||
Reinvestment of distributions | 42,594 | 11,267 | ||||||
Shares redeemed | (245,053,187 | ) | (596,401,590 | ) | ||||
| 3,012,456 | (110,820,233 | ) | ||||||
| FST Preferred Shares | ||||||||
Shares sold | 726,283,192 | 1,143,988,026 | ||||||
Reinvestment of distributions | 16,929 | 8,104 | ||||||
Shares redeemed | (771,437,625 | ) | (1,128,953,751 | ) | ||||
| (45,137,504 | ) | 15,042,379 | ||||||
| FST Capital Shares | ||||||||
Shares sold | 659,997,406 | 1,048,118,763 | ||||||
Reinvestment of distributions | 35,711 | 15,924 | ||||||
Shares redeemed | (736,496,263 | ) | (962,257,750 | ) | ||||
| (76,463,146 | ) | 85,876,937 | ||||||
| FST Administration Shares | ||||||||
Shares sold | 3,321,226,568 | 7,111,895,286 | ||||||
Reinvestment of distributions | 14,445 | 27,807 | ||||||
Shares redeemed | (3,300,418,640 | ) | (7,635,989,238 | ) | ||||
| 20,822,373 | (524,066,145 | ) | ||||||
| FST Premier Shares | ||||||||
Shares sold | — | — | ||||||
Reinvestment of distributions | — | 12 | ||||||
Shares redeemed | — | (947,116 | ) | |||||
| — | (947,104 | ) | ||||||
| FST Service Shares | ||||||||
Shares sold | 1,368,226,130 | 3,501,209,615 | ||||||
Reinvestment of distributions | 6,266 | 15,650 | ||||||
Shares redeemed | (1,416,714,616 | ) | (3,476,071,679 | ) | ||||
| (48,482,220 | ) | 25,153,586 | ||||||
| FST Resource Shares | ||||||||
Shares sold | — | — | ||||||
Reinvestment of distributions | — | — | ||||||
Shares redeemed | — | — | ||||||
| — | — | |||||||
| FST Cash Management Shares | ||||||||
Shares sold | — | — | ||||||
Reinvestment of distributions | — | — | ||||||
Shares redeemed | — | — | ||||||
| — | — | |||||||
NET DECREASE IN SHARES | (1,213,728,654 | ) | (573,270,396 | ) | ||||
100
GOLDMAN SACHS FUNDS — FINANCIAL SQUARE FUNDS
| 10. SUMMARY OF SHARE TRANSACTIONS (AT $1.00 PER SHARE) (continued) |
Share activity is as follows:
| Treasury Solutions Fund | ||||||||
|
| |||||||
| For the Six Months Ended February 29, 2016 (Unaudited) | For the Fiscal Year Ended August 31, 2015 | |||||||
|
| |||||||
| FST Institutional Shares | ||||||||
Shares sold | 15,128,643,358 | 18,861,857,769 | ||||||
Reinvestment of distributions | 2,681,127 | 475,267 | ||||||
Shares redeemed | (14,951,656,949 | ) | (17,962,709,303 | ) | ||||
| 179,667,536 | 899,623,733 | |||||||
| FST Select Shares | ||||||||
Shares sold | 3,000,006 | 76,131,751 | ||||||
Reinvestment of distributions | 3,156 | 2,087 | ||||||
Shares redeemed | (4,029,796 | ) | (101,922,099 | ) | ||||
| (1,026,634 | ) | (25,788,261 | ) | |||||
| FST Preferred Shares | ||||||||
Shares sold | 140,138,867 | 157,068,380 | ||||||
Reinvestment of distributions | 6,912 | 2,432 | ||||||
Shares redeemed | (126,472,004 | ) | (168,566,686 | ) | ||||
| 13,673,775 | (11,495,874 | ) | ||||||
| FST Capital Shares | ||||||||
Shares sold | 247,789,703 | 221,262,990 | ||||||
Reinvestment of distributions | 9 | 17 | ||||||
Shares redeemed | (274,985,969 | ) | (173,889,259 | ) | ||||
| (27,196,257 | ) | 47,373,748 | ||||||
| FST Administration Shares | ||||||||
Shares sold | 281,203,734 | 666,400,848 | ||||||
Reinvestment of distributions | 5,548 | 10,964 | ||||||
Shares redeemed | (424,239,092 | ) | (679,603,013 | ) | ||||
| (143,029,810 | ) | (13,191,201 | ) | |||||
| FST Premier Shares | ||||||||
Shares sold | 9 | — | ||||||
Reinvestment of distributions | — | 471 | ||||||
Shares redeemed | (5 | ) | (17,833,415 | ) | ||||
| 4 | (17,832,944 | ) | ||||||
| FST Service Shares | ||||||||
Shares sold | 1,017,458,535 | 2,344,631,092 | ||||||
Reinvestment of distributions | 4,914 | 10,863 | ||||||
Shares redeemed | (1,088,696,535 | ) | (2,425,243,543 | ) | ||||
| (71,233,086 | ) | (80,601,588 | ) | |||||
| FST Resource Shares | ||||||||
Shares sold | 5 | — | ||||||
Reinvestment of distributions | — | — | ||||||
Shares redeemed | (5 | ) | — | |||||
| — | — | |||||||
| FST Cash Management Shares | ||||||||
Shares sold | 120,063,602 | 334,531,352 | ||||||
Reinvestment of distributions | — | — | ||||||
Shares redeemed | (112,027,716 | ) | (277,620,535 | ) | ||||
| 8,035,886 | 56,910,817 | |||||||
NET INCREASE (DECREASE) IN SHARES | (41,108,586 | ) | 854,998,430 | |||||
101
GOLDMAN SACHS FUNDS — FINANCIAL SQUARE FUNDS
Fund Expenses — Six Month Period Ended February 29, 2016 (Unaudited)
As a shareholder of FST Institutional Shares, FST Select Shares, FST Preferred Shares, FST Capital Shares, FST Administration Shares, FST Premier, FST Service, Class A, Class C, FST Resource, FST Cash Management Shares or Class R6 Shares of a Fund you incur two types of cost: (1) transaction costs, including contingent deferred sales charges (with respect to Class C Shares); and (2) ongoing costs, including management fees and distribution, service and/or shareholder administration fees (with respect to all share classes except FST Institutional Shares and Class R6 Shares) and other Fund expenses. This Example is intended to help you understand your ongoing costs (in dollars) of investing in FST Institutional Shares, FST Select Shares, FST Preferred Shares, FST Capital Shares, FST Administration Shares, FST Premier, FST Service, Class A, Class C, FST Resource, FST Cash Management Shares or Class R6 Shares of the Funds and to compare these costs with the ongoing costs of investing in other mutual funds.
The Example is based on an investment of $1,000 invested at the beginning of the period and held for the entire period from September 1, 2015 through February 29, 2016, which represents a period of 182 days of a 366 day year.
Actual Expenses — The first line under each share class in the table below provides information about actual account values and actual expenses. You may use the information in this line, together with the amount you invested, to estimate the expenses that you paid over the period. Simply divide your account value by $1,000 (for example, an $8,600 account value divided by $1,000=8.6), then multiply the result by the number in the first line under the column heading entitled “Expenses Paid” to estimate the expenses you paid on your account for this period.
Hypothetical Example for Comparison Purposes — The second line under each share class in the table below provides information about hypothetical account values and hypothetical expenses based on the Funds’ actual net expense ratio and an assumed rate of return of 5% per year before expenses, which is not the Funds’ actual return. The hypothetical account values and expenses may not be used to estimate the actual ending account balance or expenses you paid for the period. You may use this information to compare the ongoing costs of investing in the Funds and other funds. To do so, compare this 5% hypothetical example with the 5% hypothetical examples that appear in the shareholder reports of the other funds.
Please note that the expenses shown in the table are meant to highlight your ongoing costs only and do not reflect any transactional costs, such as sales charges, redemption fees, or exchange fees. Therefore, the second line of the table is useful in comparing ongoing costs only, and will not help you determine the relative total costs of owning different funds. In addition, if these transactional costs were included, your costs would have been higher.
| Federal Instruments Fund* | Government Fund | Money Market Fund | ||||||||||||||||||||||||||||||||||
| Share Class | Beginning Account Value | Ending Account Value 2/29/16 | Expenses Paid for the period ended 2/29/16** | Beginning Account Value 9/1/15 | Ending Account Value 2/29/16 | Expenses Paid for the period ended 2/29/16** | Beginning Account Value 9/1/15 | Ending Account Value 2/29/16 | Expenses Paid for the 6 months ended 2/29/16** | |||||||||||||||||||||||||||
| FST Institutional Shares | ||||||||||||||||||||||||||||||||||||
Actual | $ | 1,000.00 | $ | 1,000.41 | $ | 0.67 | $ | 1,000.00 | $ | 1,000.56 | $ | 0.90 | $ | 1,000.00 | $ | 1,001.20 | $ | 0.90 | ||||||||||||||||||
Hypothetical (5% return before expenses) | 1,000.00 | 1,023.91 | + | 1.01 | 1,000.00 | 1,024.01 | + | 0.91 | 1,000.00 | 1,024.01 | + | 0.91 | ||||||||||||||||||||||||
| FST Select Shares | ||||||||||||||||||||||||||||||||||||
Actual | 1,000.00 | 1,000.34 | 0.74 | 1,000.00 | 1,000.43 | 1.05 | 1,000.00 | 1,001.05 | 1.05 | |||||||||||||||||||||||||||
Hypothetical (5% return before expenses) | 1,000.00 | 1,023.81 | + | 1.01 | 1,000.00 | 1,023.86 | + | 1.06 | 1,000.00 | 1,023.86 | + | 1.06 | ||||||||||||||||||||||||
| FST Preferred Shares | ||||||||||||||||||||||||||||||||||||
Actual | 1,000.00 | 1,000.18 | 0.91 | 1,000.00 | 1,000.26 | 1.15 | 1,000.00 | 1,000.70 | 1.40 | |||||||||||||||||||||||||||
Hypothetical (5% return before expenses) | 1,000.00 | 1,023.57 | + | 1.01 | 1,000.00 | 1,023.77 | + | 1.16 | 1,000.00 | 1,023.52 | + | 1.41 | ||||||||||||||||||||||||
| FST Capital Shares | ||||||||||||||||||||||||||||||||||||
Actual | 1,000.00 | 1,000.08 | 1.01 | 1,000.00 | 1,000.16 | 1.30 | 1,000.00 | 1,000.47 | 1.64 | |||||||||||||||||||||||||||
Hypothetical (5% return before expenses) | 1,000.00 | 1,023.42 | + | 1.01 | 1,000.00 | 1,023.62 | + | 1.31 | 1,000.00 | 1,023.27 | + | 1.66 | ||||||||||||||||||||||||
| FST Administration Shares | ||||||||||||||||||||||||||||||||||||
Actual | 1,000.00 | 1,000.02 | 1.18 | 1,000.00 | 1,000.03 | 1.49 | 1,000.00 | 1,000.25 | 1.79 | |||||||||||||||||||||||||||
Hypothetical (5% return before expenses) | 1,000.00 | 1,023.17 | + | 1.01 | 1,000.00 | 1,023.42 | + | 1.51 | 1,000.00 | 1,023.12 | + | 1.81 | ||||||||||||||||||||||||
| FST Premier Shares | ||||||||||||||||||||||||||||||||||||
Actual | 1,000.00 | 1,000.03 | 1.04 | 1,000.00 | 1,000.03 | 1.00 | 1,000.00 | 1,000.25 | 0.95 | |||||||||||||||||||||||||||
Hypothetical (5% return before expenses) | 1,000.00 | 1,023.37 | + | 1.01 | 1,000.00 | 1,023.91 | + | 1.01 | 1,000.00 | 1,023.96 | + | 0.96 | ||||||||||||||||||||||||
| FST Service Shares | ||||||||||||||||||||||||||||||||||||
Actual | 1,000.00 | 1,000.02 | 1.18 | 1,000.00 | 1,000.03 | 1.40 | 1,000.00 | 1,000.03 | 2.04 | |||||||||||||||||||||||||||
Hypothetical (5% return before expenses) | 1,000.00 | 1,023.17 | + | 1.01 | 1,000.00 | 1,023.52 | + | 1.41 | 1,000.00 | 1,022.87 | + | 2.07 | ||||||||||||||||||||||||
| Class A Shares(a) | ||||||||||||||||||||||||||||||||||||
Actual | N/A | N/A | N/A | 1,000.00 | 1,000.00 | 0.00 | N/A | N/A | N/A | |||||||||||||||||||||||||||
Hypothetical (5% return before expenses) | N/A | N/A | N/A | 1,000.00 | 1,024.01 | + | 0.91 | N/A | N/A | N/A | ||||||||||||||||||||||||||
| Class C Shares(a) | ||||||||||||||||||||||||||||||||||||
Actual | N/A | N/A | N/A | 1,000.00 | 1,000.00 | 0.00 | N/A | N/A | N/A | |||||||||||||||||||||||||||
Hypothetical (5% return before expenses) | N/A | N/A | N/A | 1,000.00 | 1,024.01 | + | 0.91 | N/A | N/A | N/A | ||||||||||||||||||||||||||
| FST Resource Shares | ||||||||||||||||||||||||||||||||||||
Actual | N/A | N/A | N/A | 1,000.00 | 1,000.03 | 1.94 | 1,000.00 | 1,000.25 | 0.95 | |||||||||||||||||||||||||||
Hypothetical (5% return before expenses) | N/A | N/A | N/A | 1,000.00 | 1,022.97 | + | 1.97 | 1,000.00 | 1,023.96 | + | 0.96 | |||||||||||||||||||||||||
| FST Cash Management Shares | ||||||||||||||||||||||||||||||||||||
Actual | 1,000.00 | 1,000.02 | 1.04 | 1,000.00 | 1,000.03 | 1.25 | 1,000.00 | 1,000.03 | 2.09 | |||||||||||||||||||||||||||
Hypothetical (5% return before expenses) | 1,000.00 | 1,023.37 | + | 1.01 | 1,000.00 | 1,023.67 | + | 1.26 | 1,000.00 | 1,022.82 | + | 2.12 | ||||||||||||||||||||||||
| Class R6 Shares(b) | ||||||||||||||||||||||||||||||||||||
Actual | N/A | N/A | N/A | 1,000.00 | 1,000.40 | 0.31 | N/A | N/A | N/A | |||||||||||||||||||||||||||
Hypothetical (5% return before expenses) | N/A | N/A | N/A | 1,000.00 | 1,024.01 | + | 0.91 | N/A | N/A | N/A | ||||||||||||||||||||||||||
102
GOLDMAN SACHS FUNDS — FINANCIAL SQUARE FUNDS
Fund Expenses — Six Month Period Ended February 29, 2016 (Unaudited) (continued)
| Prime Obligations | Tax-Exempt California | Tax-Exempt New York | ||||||||||||||||||||||||||||||||||
| Share Class | Beginning Account Value 9/1/15 | Ending Account Value 2/29/16 | Expenses Paid for the 6 months ended 2/29/16** | Beginning Account Value 9/1/15 | Ending Account Value 2/29/16 | Expenses Paid for the 6 months ended 2/29/16** | Beginning Account Value 9/1/15 | Ending Account Value 2/29/16 | Expenses Paid for the 6 months ended 2/29/16** | |||||||||||||||||||||||||||
| FST Institutional Shares | ||||||||||||||||||||||||||||||||||||
Actual | $ | 1,000.00 | $ | 1,000.98 | $ | 0.90 | $ | 1,000.00 | $ | 1,000.12 | $ | 0.20 | $ | 1,000.00 | $ | 1,000.20 | $ | 0.30 | ||||||||||||||||||
Hypothetical (5% return before expenses) | 1,000.00 | 1,024.01 | + | 0.91 | 1,000.00 | 1,024.71 | + | 0.20 | 1,000.00 | 1,024.61 | + | 0.30 | ||||||||||||||||||||||||
| FST Select Shares | ||||||||||||||||||||||||||||||||||||
Actual | 1,000.00 | 1,000.83 | 1.05 | N/A | N/A | N/A | N/A | N/A | N/A | |||||||||||||||||||||||||||
Hypothetical (5% return before expenses) | 1,000.00 | 1,023.86 | + | 1.06 | N/A | N/A | N/A | N/A | N/A | N/A | ||||||||||||||||||||||||||
| FST Preferred Shares | ||||||||||||||||||||||||||||||||||||
Actual | 1,000.00 | 1,000.52 | 1.35 | N/A | N/A | N/A | N/A | N/A | N/A | |||||||||||||||||||||||||||
Hypothetical (5% return before expenses) | 1,000.00 | 1,023.57 | + | 1.36 | N/A | N/A | N/A | N/A | N/A | N/A | ||||||||||||||||||||||||||
| FST Capital Shares | ||||||||||||||||||||||||||||||||||||
Actual | 1,000.00 | 1,000.41 | 1.49 | N/A | N/A | N/A | N/A | N/A | N/A | |||||||||||||||||||||||||||
Hypothetical (5% return before expenses) | 1,000.00 | 1,023.42 | + | 1.51 | N/A | N/A | N/A | N/A | N/A | N/A | ||||||||||||||||||||||||||
| FST Administration Shares | ||||||||||||||||||||||||||||||||||||
Actual | 1,000.00 | 1,000.21 | 1.69 | 1,000.00 | 1,000.12 | 0.20 | 1,000.00 | 1,000.20 | 0.30 | |||||||||||||||||||||||||||
Hypothetical (5% return before expenses) | 1,000.00 | 1,023.22 | + | 1.71 | 1,000.00 | 1,024.71 | + | 0.20 | 1,000.00 | 1,024.61 | + | 0.30 | ||||||||||||||||||||||||
| FST Premier Shares | ||||||||||||||||||||||||||||||||||||
Actual | 1,000.00 | 1,000.21 | 0.90 | N/A | N/A | N/A | N/A | N/A | N/A | |||||||||||||||||||||||||||
Hypothetical (5% return before expenses) | 1,000.00 | 1,024.01 | + | 0.91 | N/A | N/A | N/A | N/A | N/A | N/A | ||||||||||||||||||||||||||
| FST Service Shares | ||||||||||||||||||||||||||||||||||||
Actual | 1,000.00 | 1,000.05 | 1.79 | 1,000.00 | 1,000.12 | 0.20 | 1,000.00 | 1,000.20 | 0.30 | |||||||||||||||||||||||||||
Hypothetical (5% return before expenses) | 1,000.00 | 1,023.12 | + | 1.81 | 1,000.00 | 1,024.71 | + | 0.20 | 1,000.00 | 1,024.61 | + | 0.30 | ||||||||||||||||||||||||
| Class C Shares | ||||||||||||||||||||||||||||||||||||
Actual | 1,000.00 | 1,000.05 | 1.84 | N/A | N/A | N/A | N/A | N/A | N/A | |||||||||||||||||||||||||||
Hypothetical (5% return before expenses) | 1,000.00 | 1,023.07 | + | 1.86 | N/A | N/A | N/A | N/A | N/A | N/A | ||||||||||||||||||||||||||
| FST Resource Shares | ||||||||||||||||||||||||||||||||||||
Actual | 1,000.00 | 1,000.05 | 1.79 | N/A | N/A | N/A | N/A | N/A | N/A | |||||||||||||||||||||||||||
Hypothetical (5% return before expenses) | 1,000.00 | 1,023.12 | + | 1.81 | N/A | N/A | N/A | N/A | N/A | N/A | ||||||||||||||||||||||||||
| FST Cash Management Shares | ||||||||||||||||||||||||||||||||||||
Actual | 1,000.00 | 1,000.21 | 0.90 | 1,000.00 | 1,000.12 | 0.20 | 1,000.00 | 1,000.20 | 0.30 | |||||||||||||||||||||||||||
Hypothetical (5% return before expenses) | 1,000.00 | 1,024.01 | + | 0.91 | 1,000.00 | 1,024.71 | + | 0.20 | 1,000.00 | 1,024.61 | + | 0.30 | ||||||||||||||||||||||||
103
GOLDMAN SACHS FUNDS — FINANCIAL SQUARE FUNDS
Fund Expenses — Six Month Period Ended February 29, 2016 (Unaudited) (continued)
| Tax-Free Money Market Fund | Treasury Instruments Fund | Treasury Obligations Fund | ||||||||||||||||||||||||||||||||||
| Share Class | Beginning Account Value 9/1/15 | Ending Account Value 2/29/16 | Expenses Paid for the | Beginning Account Value 9/1/15 | Ending Account Value 2/29/16 | Expenses Paid for the 6 months ended 2/29/16** | Beginning Account Value 9/1/15 | Ending Account Value 2/29/16 | Expenses Paid for the | |||||||||||||||||||||||||||
| FST Institutional Shares | ||||||||||||||||||||||||||||||||||||
Actual | $ | 1,000.00 | $ | 1,000.07 | $ | 0.40 | $ | 1,000.00 | $ | 1,000.34 | $ | 0.90 | $ | 1,000.00 | $ | 1,000.39 | $ | 0.85 | ||||||||||||||||||
Hypothetical (5% return before expenses) | 1,000.00 | 1,024.51 | + | 0.40 | 1,000.00 | 1,024.01 | + | 0.91 | 1,000.00 | 1,024.06 | + | 0.86 | ||||||||||||||||||||||||
| FST Select Shares | ||||||||||||||||||||||||||||||||||||
Actual | 1,000.00 | 1,000.07 | 0.40 | 1,000.00 | 1,000.26 | 0.95 | 1,000.00 | 1,000.32 | 0.90 | |||||||||||||||||||||||||||
Hypothetical (5% return before expenses) | 1,000.00 | 1,024.51 | + | 0.40 | 1,000.00 | 1,023.96 | + | 0.96 | 1,000.00 | 1,024.01 | + | 0.91 | ||||||||||||||||||||||||
| FST Preferred Shares | ||||||||||||||||||||||||||||||||||||
Actual | 1,000.00 | 1,000.07 | 0.40 | 1,000.00 | 1,000.11 | 1.15 | 1,000.00 | 1,000.18 | 1.05 | |||||||||||||||||||||||||||
Hypothetical (5% return before expenses) | 1,000.00 | 1,024.51 | + | 0.40 | 1,000.00 | 1,023.77 | + | 1.16 | 1,000.00 | 1,023.86 | + | 1.06 | ||||||||||||||||||||||||
| FST Capital Shares | ||||||||||||||||||||||||||||||||||||
Actual | 1,000.00 | 1,000.07 | 0.40 | 1,000.00 | 1,000.04 | 1.20 | 1,000.00 | 1,000.09 | 1.15 | |||||||||||||||||||||||||||
Hypothetical (5% return before expenses) | 1,000.00 | 1,024.51 | + | 0.40 | 1,000.00 | 1,023.72 | + | 1.21 | 1,000.00 | 1,023.77 | + | 1.16 | ||||||||||||||||||||||||
| FST Administration Shares | ||||||||||||||||||||||||||||||||||||
Actual | 1,000.00 | 1,000.07 | 0.40 | 1,000.00 | 1,000.01 | 1.25 | 1,000.00 | 1,000.03 | 1.20 | |||||||||||||||||||||||||||
Hypothetical (5% return before expenses) | 1,000.00 | 1,024.51 | + | 0.40 | 1,000.00 | 1,023.67 | + | 1.26 | 1,000.00 | 1,023.72 | + | 1.21 | ||||||||||||||||||||||||
| FST Premier Shares | ||||||||||||||||||||||||||||||||||||
Actual | 1,000.00 | 1,000.07 | 0.40 | 1,000.00 | 1,000.01 | 1.15 | 1,000.00 | 1,000.03 | 0.85 | |||||||||||||||||||||||||||
Hypothetical (5% return before expenses) | 1,000.00 | 1,024.51 | + | 0.40 | 1,000.00 | 1,023.77 | + | 1.16 | 1,000.00 | 1,024.06 | + | 0.86 | ||||||||||||||||||||||||
| FST Service Shares | ||||||||||||||||||||||||||||||||||||
Actual | 1,000.00 | 1,000.07 | 0.40 | 1,000.00 | 1,000.01 | 1.15 | 1,000.00 | 1,000.03 | 1.20 | |||||||||||||||||||||||||||
Hypothetical (5% return before expenses) | 1,000.00 | 1,024.51 | + | 0.40 | 1,000.00 | 1,023.77 | + | 1.16 | 1,000.00 | 1,023.72 | + | 1.21 | ||||||||||||||||||||||||
| FST Resource Shares | ||||||||||||||||||||||||||||||||||||
Actual | 1,000.00 | 1,000.07 | 0.40 | 1,000.00 | 1,000.01 | 0.90 | 1,000.00 | 1,000.03 | 0.85 | |||||||||||||||||||||||||||
Hypothetical (5% return before expenses) | 1,000.00 | 1,024.51 | + | 0.40 | 1,000.00 | 1,024.01 | + | 0.91 | 1,000.00 | 1,024.06 | + | 0.86 | ||||||||||||||||||||||||
| FST Cash Management Shares | ||||||||||||||||||||||||||||||||||||
Actual | 1,000.00 | 1,000.07 | 0.40 | 1,000.00 | 1,000.01 | 0.90 | 1,000.00 | 1,000.03 | 0.85 | |||||||||||||||||||||||||||
Hypothetical (5% return before expenses) | 1,000.00 | 1,024.51 | + | 0.40 | 1,000.00 | 1,024.01 | + | 0.91 | 1,000.00 | 1,024.06 | + | 0.86 | ||||||||||||||||||||||||
104
GOLDMAN SACHS FUNDS — FINANCIAL SQUARE FUNDS
Fund Expenses — Six Month Period Ended February 29, 2016 (Unaudited) (continued)
| Treasury Solutions Fund | ||||||||||||
| Share Class | Beginning Account Value 9/1/15 | Ending Account Value 2/29/16 | Expenses Paid for the | |||||||||
| FST Institutional Shares | ||||||||||||
Actual | $ | 1,000.00 | $ | 1,000.38 | $ | 0.80 | ||||||
Hypothetical (5% return before expenses) | 1,000.00 | 1,024.11 | + | 0.81 | ||||||||
| FST Select Shares | ||||||||||||
Actual | 1,000.00 | 1,000.31 | 0.85 | |||||||||
Hypothetical (5% return before expenses) | 1,000.00 | 1,024.06 | + | 0.86 | ||||||||
| FST Preferred Shares | ||||||||||||
Actual | 1,000.00 | 1,000.16 | 1.00 | |||||||||
Hypothetical (5% return before expenses) | 1,000.00 | 1,023.91 | + | 1.01 | ||||||||
| FST Capital Shares | ||||||||||||
Actual | 1,000.00 | 1,000.08 | 1.10 | |||||||||
Hypothetical (5% return before expenses) | 1,000.00 | 1,023.81 | + | 1.11 | ||||||||
| FST Administration Shares | ||||||||||||
Actual | 1,000.00 | 1,000.03 | 1.10 | |||||||||
Hypothetical (5% return before expenses) | 1,000.00 | 1,023.81 | + | 1.11 | ||||||||
| FST Premier Shares | ||||||||||||
Actual | 1,000.00 | 1,000.03 | 0.80 | |||||||||
Hypothetical (5% return before expenses) | 1,000.00 | 1,024.11 | + | 0.81 | ||||||||
| FST Service Shares | ||||||||||||
Actual | 1,000.00 | 1,000.03 | 1.10 | |||||||||
Hypothetical (5% return before expenses) | 1,000.00 | 1,023.81 | + | 1.11 | ||||||||
| FST Resource Shares | ||||||||||||
Actual | 1,000.00 | 1,000.03 | 0.80 | |||||||||
Hypothetical (5% return before expenses) | 1,000.00 | 1,024.11 | + | 0.81 | ||||||||
| FST Cash Management Shares | ||||||||||||
Actual | 1,000.00 | 1,000.03 | 1.15 | |||||||||
Hypothetical (5% return before expenses) | 1,000.00 | 1,023.77 | + | 1.16 | ||||||||
105
GOLDMAN SACHS FUNDS — FINANCIAL SQUARE FUNDS
Fund Expenses — Six Month Period Ended February 29, 2016 (Unaudited) (continued)
| * | Commenced operations on October 30, 2015. |
| ** | Expenses for each share class are calculated using each Fund’s annualized net expense ratio for each class, which represents the ongoing expenses as a percentage of net assets for the six months ended February 29, 2016. Expenses are calculated by multiplying the annualized net expense ratio by the average account value for the period; then multiplying the result by the number of days in the most recent fiscal half year; and then dividing that result by the number of days in the fiscal year. The annualized net expense ratios for the period were as follows: |
| (a) | Class A and Class C Shares of the Government Fund commenced operations on February 29, 2016. |
| (b) | Class R6 Shares of the Government Fund commenced operations on December 29, 2015. |
| Fund | FST Shares | FST Select Shares | FST Preferred Shares | FST Capital Shares | FST Administration | FST Premier Shares | FST Service Shares | Class A Shares* | Class C Shares* | FST Resource Shares | FST Cash Management | Class R6 Shares** | ||||||||||||||||||||||||||||||||||||
Federal Instruments | 0.20 | % | 0.22 | % | 0.27 | % | 0.30 | % | 0.35 | % | 0.31 | % | 0.35 | % | N/A | N/A | N/A | 0.31 | % | N/A | ||||||||||||||||||||||||||||
Government | 0.18 | % | 0.21 | % | 0.23 | % | 0.26 | % | 0.30 | % | 0.20 | % | 0.28 | % | 0.33 | 0.33 | 0.39 | % | 0.25 | % | 0.18 | |||||||||||||||||||||||||||
Money Market | 0.18 | % | 0.21 | % | 0.28 | % | 0.33 | % | 0.36 | % | 0.19 | % | 0.41 | % | N/A | N/A | 0.19 | % | 0.42 | % | N/A | |||||||||||||||||||||||||||
Prime Obligations | 0.18 | % | 0.21 | % | 0.27 | % | 0.30 | % | 0.34 | % | 0.18 | % | 0.36 | % | N/A | 0.37 | 0.36 | % | 0.18 | % | N/A | |||||||||||||||||||||||||||
Tax-Exempt California | 0.04 | % | N/A | N/A | N/A | 0.04 | % | N/A | 0.04 | % | N/A | N/A | N/A | 0.04 | % | N/A | ||||||||||||||||||||||||||||||||
Tax-Exempt New York | 0.06 | % | N/A | N/A | N/A | 0.06 | % | N/A | 0.06 | % | N/A | N/A | N/A | 0.06 | % | N/A | ||||||||||||||||||||||||||||||||
Tax-Free Money Market | 0.08 | % | 0.08 | % | 0.08 | % | 0.08 | % | 0.08 | % | 0.08 | % | 0.08 | % | N/A | N/A | 0.08 | % | 0.08 | % | N/A | |||||||||||||||||||||||||||
Treasury Instruments | 0.18 | % | 0.19 | % | 0.23 | % | 0.24 | % | 0.25 | % | 0.23 | % | 0.23 | % | N/A | N/A | 0.18 | % | 0.18 | % | N/A | |||||||||||||||||||||||||||
Treasury Obligations | 0.17 | % | 0.18 | % | 0.21 | % | 0.23 | % | 0.24 | % | 0.17 | % | 0.24 | % | N/A | N/A | 0.17 | % | 0.17 | % | N/A | |||||||||||||||||||||||||||
Treasury Solutions | 0.16 | % | 0.17 | % | 0.20 | % | 0.22 | % | 0.22 | % | 0.16 | % | 0.22 | % | N/A | N/A | 0.16 | % | 0.23 | % | N/A | |||||||||||||||||||||||||||
| + | Hypothetical expenses are based on each Fund’s actual annualized net expense ratios and an assumed rate of return of 5% per year before expenses. |
| * | Class A and Class C Shares of the Government Fund commenced operations on February 29, 2016. |
| ** | Class R6 Shares of the Government Fund commenced operations on December 29, 2015. |
106
FEDERAL SQUARE FEDERAL INSTRUMENTS FUND
Statement Regarding Basis for Approval of Management Agreement (Unaudited)
Background
The Goldman Sachs Financial Square Federal Instruments Fund (the “Fund”) is a newly-organized investment portfolio of Goldman Sachs Trust (the “Trust”) that commenced investment operations on October 30, 2015. At a meeting held on August 12-13, 2015 (the “Meeting”) in connection with the Fund’s organization, the Trustees, including all of the Trustees present who are not parties to the Fund’s investment management agreement (the “Management Agreement”) or “interested persons” (as defined in the Investment Company Act of 1940, as amended (the “1940 Act”)) of any party thereto (the “Independent Trustees”) approved the Management Agreement with Goldman Sachs Asset Management, L.P. (the “Investment Adviser”).
At the Meeting, the Trustees reviewed the Management Agreement, including information regarding the terms of the Management Agreement; the nature, extent and quality of the Investment Adviser’s anticipated services; the fees and expenses to be paid by the Fund; a comparison of the Fund’s proposed management fees and anticipated expenses with those paid by other similar mutual funds; the Investment Adviser’s proposal to waive a portion of its management fee and to limit certain expenses of the Fund that exceed a specified level; and potential benefits to be derived by the Investment Adviser and its affiliates from their relationships with the Fund. Various information was also provided at prior meetings at which the Fund was discussed.
In connection with the Meeting, the Trustees received written materials and oral presentations on the topics covered, and were advised by their independent legal counsel regarding their responsibilities under applicable law. In evaluating the Management Agreement at the Meeting, the Trustees relied upon information included in a presentation made by the Investment Adviser at the Meeting and information received at prior Board meetings, as well as on their knowledge of the Investment Adviser resulting from their meetings and other interactions over time.
Nature, Extent, and Quality of the Services Provided Under the Management Agreement
As part of their review, the Trustees considered the nature, extent and quality of the services to be provided by the Investment Adviser. In this regard, the Trustees considered both the investment advisory services and non-advisory services that would be provided to the Fund by the Investment Adviser and its affiliates. The Trustees also considered information about the Fund’s structure, investment objective, strategies and other characteristics. The Trustees considered the experience and capabilities of the portfolio management team and noted that certain portfolio management personnel who would be managing the Fund were currently managing other series of the Trust. The Trustees concluded that the Investment Adviser would be able to commit substantial financial and other resources to the Fund. In this regard, the Trustees noted that, although the Fund was new (and therefore had no performance data to evaluate), the Investment Adviser had experience managing other “government money market funds,” as such term is defined in or interpreted under Rule 2a-7 under the 1940 Act. The Trustees concluded that the Investment Adviser’s management of the Fund likely would benefit the Fund and its shareholders.
Costs of Services to be Provided and Profitability
The Trustees considered the contractual terms of the Management Agreement and the fee rates payable by the Fund thereunder. In this regard, the Trustees considered information on the services to be rendered by the Investment Adviser to the Fund, which included both advisory and administrative services that were directed to the needs and operations of the Fund as a registered mutual fund.
In particular, the Trustees reviewed information on the proposed management fees and the Fund’s projected total operating expense ratios (both gross and net of expense limitations), and those were compared to similar information for comparable mutual funds advised by other, unaffiliated investment management firms, as well as the peer group and category medians. The comparisons of the Fund’s fee rates and total operating expense ratios were prepared by a third-party provider of mutual fund data. The Trustees believed that this information was useful in evaluating the reasonableness of the management fees and total expenses expected to be paid by the Fund.
The Trustees considered the Investment Adviser’s undertakings to waive a portion of its management fee and to limit certain expenses of the Fund that exceed a specified level. They also considered comparative fee information for services provided by the Investment Adviser to similarly managed funds and accounts. In addition, the Trustees recognized that there was not yet profitability data to evaluate for the Fund, but considered the Investment Adviser’s representations that (i) such data would be provided after the Fund commenced operations, and (ii) the Fund was not expected to be profitable to the Investment Adviser and its affiliates initially.
The Trustees noted the competitive nature of the fund marketplace, and that many of the Fund’s shareholders would be investing in the Fund in part because of the Fund’s relationship with the Investment Adviser. They also noted that shareholders would be able to redeem their Fund shares if they believe that the Fund fees and expenses are too high or if they are dissatisfied with the performance of the Fund.
107
FEDERAL SQUARE FEDERAL INSTRUMENTS FUND
Statement Regarding Basis for Approval of Management Agreement (Unaudited) (continued)
Economies of Scale
The Trustees considered the proposed management fee of 0.205% of the average daily net assets of the Fund. The Trustees noted that the Fund would not have management fee breakpoints. They considered the Fund’s projected asset levels and information comparing fee rates charged by the Investment Adviser with fee rates charged to other money market funds in the peer group, as well as the Investment Adviser’s undertakings to waive a portion of its management fee and to limit certain expenses of the Fund that exceed a specified level.
Other Benefits to the Investment Adviser and Its Affiliates
The Trustees also considered the other benefits expected to be derived by the Investment Adviser and its affiliates from their relationship with the Fund, including: (a) transfer agency fees received by Goldman, Sachs & Co. (“Goldman Sachs”); (b) trading efficiencies resulting from aggregation of orders of the Fund with those for other funds or accounts managed by the Investment Adviser; (c) the Investment Adviser’s ability to leverage the infrastructure designed to service the Fund on behalf of its other clients; (d) the Investment Adviser’s ability to cross-market other products and services to Fund shareholders; (e) Goldman Sachs’ retention of certain fees as Fund Distributor; (f) Goldman Sachs’ ability to engage in principal transactions with the Fund under exemptive orders from the U.S. Securities and Exchange Commission permitting such trades; (g) the Investment Adviser’s ability to negotiate better pricing with custodians on behalf of its other clients, as a result of the relationship with the Fund; and (h) the possibility that the working relationship between the Investment Adviser and the Fund’s third-party service providers may cause those service providers to be open to doing business with other areas of Goldman Sachs.
Conclusion
In connection with their consideration of the Management Agreement for the Fund at the Meeting, the Trustees gave weight to various factors, but did not identify any particular factor as controlling their decision. After deliberation and consideration of the information provided, including the factors described above, the Trustees concluded, in the exercise of their business judgment, that the management fee that would be payable by the Fund was reasonable in light of the services to be provided to it by the Investment Adviser, the Investment Adviser’s anticipated costs and the Fund’s reasonably anticipated asset levels. The Trustees concluded that the Investment Adviser’s management likely would benefit the Fund and its shareholders and that the Management Agreement should be approved with respect to the Fund.
108
FUNDS PROFILE
Goldman Sachs Funds

Goldman Sachs is a premier financial services firm, known since 1869 for creating thoughtful and customized investment solutions in complex global markets.
Today, the Investment Management Division of Goldman Sachs serves a diverse set of clients worldwide, including private institutions, public entities and individuals. With approximately $1.08 trillion in assets under supervision as of December 31, 2015, Goldman Sachs Asset Management (“GSAM”) has portfolio management teams located around the world and our investment professionals bring firsthand knowledge of local markets to every investment decision. Assets under supervision includes assets under management and other client assets for which Goldman Sachs does not have full discretion. GSAM leverages the resources of Goldman, Sachs & Co. subject to legal, internal and regulatory restrictions.

Money Market1
Financial Square FundsSM
| n | Financial Square Tax-Exempt Funds |
| n | Financial Square Treasury Solutions Fund2 |
| n | Financial Square Government Fund |
| n | Financial Square Money Market Fund |
| n | Financial Square Prime Obligations Fund |
| n | Financial Square Treasury Instruments Fund |
| n | Financial Square Treasury Obligations Fund |
| n | Financial Square Federal Instruments Fund |
| n | Financial Square Tax-Exempt Money Market Fund |
Investor FundsSM
| n | Investor Money Market Fund |
| n | Investor Tax-Exempt Money Market Fund3 |
Fixed Income
Short Duration and Government
| n | Enhanced Income Fund |
| n | High Quality Floating Rate Fund |
| n | Limited Maturity Obligations Fund |
| n | Short Duration Government Fund |
| n | Short Duration Income Fund |
| n | Government Income Fund |
| n | Inflation Protected Securities Fund |
Multi-Sector
| n | Bond Fund |
| n | Core Fixed Income Fund |
| n | Global Income Fund |
| n | Strategic Income Fund |
Municipal and Tax-Free
| n | High Yield Municipal Fund |
| n | Dynamic Municipal Income Fund |
| n | Short Duration Tax-Free Fund |
Single Sector
| n | Investment Grade Credit Fund |
| n | U.S. Mortgages Fund |
| n | High Yield Fund |
| n | High Yield Floating Rate Fund |
| n | Emerging Markets Debt Fund |
| n | Local Emerging Markets Debt Fund |
| n | Dynamic Emerging Markets Debt Fund |
Fixed Income Alternatives
| n | Long Short Credit Strategies Fund |
| n | Fixed Income Macro Strategies Fund |
Fundamental Equity
| n | Growth and Income Fund |
| n | Small Cap Value Fund |
| n | Small/Mid Cap Value Fund |
| n | Mid Cap Value Fund |
| n | Large Cap Value Fund |
| n | Capital Growth Fund |
| n | Strategic Growth Fund |
| n | Focused Growth Fund |
| n | Small/Mid Cap Growth Fund |
| n | Flexible Cap Growth Fund |
| n | Concentrated Growth Fund |
| n | Technology Opportunities Fund4 |
| n | Growth Opportunities Fund |
| n | Rising Dividend Growth Fund |
| n | Dynamic U.S. Equity Fund5 |
| n | Income Builder Fund |
Tax-Advantaged Equity
| n | U.S. Tax-Managed Equity Fund |
| n | International Tax-Managed Equity Fund |
| n | U.S. Equity Dividend and Premium Fund |
| n | International Equity Dividend and Premium Fund |
Equity Insights
| n | Small Cap Equity Insights Fund |
| n | U.S. Equity Insights Fund |
| n | Small Cap Growth Insights Fund |
| n | Large Cap Growth Insights Fund |
| n | Large Cap Value Insights Fund |
| n | Small Cap Value Insights Fund |
| n | International Small Cap Insights Fund6 |
| n | International Equity Insights Fund |
| n | Emerging Markets Equity Insights Fund |
Fundamental Equity International
| n | Strategic International Equity Fund |
| n | Focused International Equity Fund |
| n | Asia Equity Fund |
| n | Emerging Markets Equity Fund7 |
| n | N-11 Equity Fund |
Select Satellite8
| n | Real Estate Securities Fund |
| n | International Real Estate Securities Fund |
| n | Commodity Strategy Fund |
| n | Global Real Estate Securities Fund |
| n | Dynamic Commodity Strategy Fund |
| n | Dynamic Allocation Fund |
| n | Absolute Return Tracker Fund |
| n | Long Short Fund |
| n | Managed Futures Strategy Fund |
| n | MLP Energy Infrastructure Fund |
| n | Multi-Manager Alternatives Fund |
| n | Multi-Asset Real Return Fund |
| n | Absolute Return Multi-Asset Fund |
Total Portfolio Solutions8
| n | Global Managed Beta Fund |
| n | Multi-Manager Non-Core Fixed Income Fund |
| n | Multi-Manager U.S. Dynamic Equity Fund |
| n | Multi-Manager Global Equity Fund |
| n | Multi-Manager International Equity Fund |
| n | Tactical Tilt Implementation Fund |
| n | Balanced Strategy Portfolio |
| n | Multi-Manager Real Assets Strategy Fund |
| n | Growth and Income Strategy Portfolio |
| n | Growth Strategy Portfolio |
| n | Equity Growth Strategy Portfolio |
| n | Satellite Strategies Portfolio |
| n | Enhanced Dividend Global Equity Portfolio |
| n | Tax Advantaged Global Equity Portfolio |
| 1 | An investment in a money market fund is neither insured nor guaranteed by the Federal Deposit Insurance Corporation (“FDIC”) or any other government agency. Although the Funds seek to preserve the value of your investment at $1.00 per share, it is possible to lose money by investing in the Funds. |
| 2 | Effective on September 30, 2015, the Goldman Sachs Financial Square Federal Fund was renamed the Goldman Sachs Financial Square Treasury Solutions Fund. |
| 3 | Effective on March 31, 2016, the Goldman Sachs Financial Square Tax-Free Money Market Fund was renamed the Goldman Sachs Investor Tax-Exempt Money Market Fund. |
| 4 | Effective on July 31, 2015, the Goldman Sachs Technology Tollkeeper Fund was renamed the Goldman Sachs Technology Opportunities Fund. |
| 5 | Effective on April 30, 2015, the Goldman Sachs U.S. Equity Fund was renamed the Goldman Sachs Dynamic U.S. Equity Fund. |
| 6 | Effective at the close of business on February 5, 2016, the Goldman Sachs International Small Cap Fund was reorganized with and into the Goldman Sachs International Small Cap Insights Fund. |
| 7 | Effective at the close of business on October 23, 2015, the Goldman Sachs BRIC Fund (Brazil, Russia, India, China) was reorganized with and into the Goldman Sachs Emerging Markets Equity Fund. |
| 8 | Individual Funds within the Total Portfolio Solutions and Select Satellite categories will have various placement on the risk/return spectrum and may have greater or lesser risk than that indicated by the placement of the general Total Portfolio Solutions or Select Satellite category. |
| *This | list covers open-end funds only. Please visit our website at www.GSAMFUNDS.com to learn about our closed-end funds and exchange-traded funds. |
TRUSTEES Ashok N. Bakhru, Chairman Kathryn A. Cassidy Diana M. Daniels Herbert J. Markley James A. McNamara Jessica Palmer Alan A. Shuch Roy W. Templin Gregory G. Weaver | OFFICERS James A. McNamara, President Scott M. McHugh, Principal Financial Officer and Treasurer Caroline L. Kraus, Secretary | |
GOLDMAN, SACHS & CO. Distributor and Transfer Agent | GOLDMAN SACHS ASSET MANAGEMENT, L.P. Investment Adviser | |
Visit our web site at www.GSAMFUNDS.com to obtain the most recent month-end returns.
Goldman Sachs Asset Management, L.P., 200 West Street, New York, New York 10282
Economic and market forecasts presented herein reflect our judgment as of the date of this presentation and are subject to change without notice. These forecasts do not take into account the specific investment objectives, restrictions, tax and financial situation or other needs of any specific client. Actual data will vary and may not be reflected here. These forecasts are subject to high levels of uncertainty that may affect actual performance. Accordingly, these forecasts should be viewed as merely representative of a broad range of possible outcomes. These forecasts are estimated, based on assumptions, and are subject to significant revision and may change materially as economic and market conditions change. Goldman Sachs has no obligation to provide updates or changes to these forecasts. Case studies and examples are for illustrative purposes only.
The portfolio risk management process includes an effort to monitor and manage risk, but does not imply low risk The reports concerning the Funds included in this shareholder report may contain certain forward-looking statements about the factors that may affect the performance of the Funds in the future. These statements are based on Fund management’s predictions and expectations concerning certain future events and their expected impact on the Funds, such as performance of the economy as a whole and of specific industry sectors, changes in the levels of interest rates, the impact of developing world events, and other factors that may influence the future performance of the Funds. Management believes these forward-looking statements to be reasonable, although they are inherently uncertain and difficult to predict. Actual events may cause adjustments in portfolio management strategies from those currently expected to be employed.
A description of the policies and procedures that the Funds use to determine how to vote proxies relating to portfolio securities and information regarding how a Fund voted proxies relating to portfolio securities during the most recent 12-month period ended June 30 is available (i) without charge, upon request by calling 1-800-526-7384 (for Retail Shareholders) or 1-800-621-2550 (for Institutional Shareholders); and (ii) on the Securities and Exchange Commission (“SEC”) web site at http://www.sec.gov.
The Funds file their complete schedule of portfolio holdings with the SEC for the first and third quarters of each fiscal year on Form N-Qs. The Funds’ Form N-Qs are available on the SEC’s web site at http://www.sec.gov within 60 days after the Funds’ first and third fiscal quarters. The Funds’ Form N-Qs may be reviewed and copied at the SEC’s Public Reference Room in Washington, D.C. and information on the operation of the Public Reference Room may also be obtained by calling 1-800-SEC-0330. Form N-Qs may be obtained upon request and without charge by calling 1-800-526-7384 (for Retail Shareholders) or 1-800-621-2550 (for Institutional Shareholders).
Goldman, Sachs & Co. (‘‘Goldman Sachs’’) does not provide legal, tax or accounting advice. Any statement contained in this communication (including any attachments) concerning U.S. tax matters was not intended or written to be used, and cannot be used, for the purpose of avoiding penalties under the Internal Revenue Code, and was written to support the promotion or marketing of the transaction(s) or matter(s) addressed. Clients of Goldman Sachs should obtain their own independent tax advice based on their particular circumstances.
Fund holdings and allocations shown are as of February 29, 2016 and may not be representative of future investments. Fund holdings should not be relied on in making investment decisions and should not be construed as research or investment advice regarding particular securities. Current and future holdings are subject to risk.
Financial Square FundsSM is a registered service mark of Goldman, Sachs & Co.
This material is not authorized for distribution to prospective investors unless preceded or accompanied by a current Prospectus or summary prospectus, if applicable. Investors should consider a Fund’s objective, risks, and charges and expenses, and read the summary prospectus, if available, and/or the Prospectus carefully before investing or sending money. The summary prospectus, if available, and the Prospectus contain this and other information about a Fund and may be obtained from your Authorized Institution or from Goldman, Sachs & Co. by calling (retail – 1-800-526-7384) (institutional – 1-800-621-2550).
© 2016 Goldman Sachs. All rights reserved. 40163-TMPL-04/2016 FSQSAR-16/75K
| ITEM 2. | CODE OF ETHICS. |
(a) As of the end of the period covered by this report, the registrant has adopted a code of ethics that applies to the registrant’s principal executive officer, principal financial officer, principal accounting officer or controller, or persons performing similar functions, regardless of whether these individuals are employed by the registrant or a third party (the “Code of Ethics”).
(b) During the period covered by this report, no amendments were made to the provisions of the Code of Ethics.
(c) During the period covered by this report, the registrant did not grant any waivers, including an implicit waiver, from any provision of the Code of Ethics.
(d) A copy of the Code of Ethics is available as provided in Item 12(a)(1) of this report.
| ITEM 3. | AUDIT COMMITTEE FINANCIAL EXPERT. |
The registrant’s board of trustees has determined that the registrant has at least one “audit committee financial expert” (as defined in Item 3 of Form N-CSR) serving on its audit committee. Gregory G. Weaver is the “audit committee financial expert” and is “independent” (as each term is defined in Item 3 of Form N-CSR).
| ITEM 4. | PRINCIPAL ACCOUNTANT FEES AND SERVICES. |
Table 1 — Items 4(a) - 4(d). The accountant fees below reflect the aggregate fees billed by all of the Funds of the Goldman Sachs Trust and includes the Goldman Sachs Funds to which this certified shareholder report relates.
| 2015 | 2014 | Description of Services Rendered | ||||||||||
|
|
|
|
| ||||||||
Audit Fees: | ||||||||||||
| • PricewaterhouseCoopers LLP (“PwC”) | $ | 3,628,517 | $ | 4,269,524 | Financial Statement audits. | |||||||
Audit-Related Fees: | ||||||||||||
• PwC | $ | 113,000 | $ | 0 | Other attest services. | |||||||
Tax Fees: | ||||||||||||
• PwC | $ | 759,210 | $ | 939,217 | Tax compliance services provided in connection with the preparation and review of registrant’s tax returns. | |||||||
Table 2 — Items 4(b)(c) & (d). Non-Audit Services to the Goldman Sachs Trust’s service affiliates * that were pre-approved by the Audit Committee of the Goldman Sachs Trust pursuant to Rule 2-01(c)(7)(ii) of Regulation S-X.
| 2015 | 2014 | Description of Services Rendered | ||||||||||
|
|
|
|
| ||||||||
Audit-Related Fees: | ||||||||||||
• PwC | $ | 1,568,616 | $ | 1,486,420 | Internal control review performed in accordance with Statement on Standards for Attestation Engagements No. 16. These fees are borne by the Funds’ Adviser. | |||||||
| * | These include the advisor (excluding sub-advisors) and any entity controlling, controlled by or under common control with the advisor that provides ongoing services to the registrant (hereinafter referred to as “service affiliates”). |
Item 4(e)(1) — Audit Committee Pre-Approval Policies and Procedures
Pre-Approval of Audit and Non-Audit Services Provided to the Funds of the Goldman Sachs Trust. The Audit and Non-Audit Services Pre-Approval Policy (the “Policy”) adopted by the Audit Committee of Goldman Sachs Trust (“GST”) sets forth the procedures and the conditions pursuant to which services performed by an independent auditor for GST may be pre-approved. Services may be pre-approved specifically by the Audit Committee as a whole or, in certain circumstances, by the Audit Committee Chairman or the person designated as the Audit Committee Financial Expert. In addition, subject to specified cost limitations, certain services may be pre-approved under the provisions of the Policy. The Policy provides that the Audit Committee will consider whether the services provided by an independent auditor are consistent with the Securities and Exchange Commission’s rules on auditor independence. The Policy provides for periodic review and pre-approval by the Audit Committee of the services that may be provided by the independent auditor.
De Minimis Waiver. The pre-approval requirements of the Policy may be waived with respect to the provision of non-audit services that are permissible for an independent auditor to perform, provided (1) the aggregate amount of all such services provided constitutes no more than five percent of the total amount of revenues subject to pre-approval that was paid to the independent auditors during the fiscal year in which the services are provided; (2) such services were not recognized by GST at the time of the engagement to be non-audit services; and (3) such services are promptly brought to the attention of the Audit Committee and approved prior to the completion of the audit by the Audit Committee or by one or more members of the Audit Committee to whom authority to grant such approvals has been delegated by the Audit Committee, pursuant to the pre-approval provisions of the Policy.
Pre-Approval of Non-Audit Services Provided to GST’s Investment Advisers. The Policy provides that, in addition to requiring pre-approval of audit and non-audit services provided to GST, the Audit Committee will pre-approve those non-audit services provided to GST’s investment advisers (and entities controlling, controlled by or under common control with the investment advisers that provide ongoing services to GST) where the engagement relates directly to the operations or financial reporting of GST.
Item 4(e)(2) – 0% of the audit-related fees, tax fees and other fees listed in Table 1 were approved by GST’s Audit Committee pursuant to the “de minimis” exception of Rule 2-01(c)(7)(i)(C) of Regulation S-X. In addition, 0% of the non-audit services to the GST’s service affiliates listed in Table 2 were approved by GST’s Audit Committee pursuant to the “de minimis” exception of Rule 2-01(c)(7)(i)(C) of Regulation S-X.
Item 4(f) – Not applicable.
Item 4(g) Aggregate Non-Audit Fees Disclosure
The aggregate non-audit fees billed to GST by PwC for the twelve months ended August 31, 2015 and August 31, 2014 were approximately $872,210 and $939,217 respectively. The aggregate non-audit fees billed to GST’s adviser and service affiliates by PwC for non-audit services for the twelve months ended December 31, 2014 and December 31, 2013 were approximately $10.2 million and $9.8 million respectively. With regard to the aggregate non-audit fees billed to GST’s adviser and service affiliates, the 2014 and 2013 amounts include fees for non-audit services required to be pre-approved [see Table 2] and fees for non-audit services that did not require pre-approval since they did not directly relate to GST’s operations or financial reporting.
Item 4(h) — GST’s Audit Committee has considered whether the provision of non-audit services to GST’s investment adviser and service affiliates that did not require pre-approval pursuant to paragraph (c)(7)(ii) of Rule 2-01 of Regulation S-X is compatible with maintaining the auditors’ independence.
| ITEM 5. | AUDIT COMMITTEE OF LISTED REGISTRANTS. |
| Not applicable. |
| ITEM 6. | SCHEDULE OF INVESTMENTS. |
| Schedule of Investments is included as part of the Report to Shareholders filed under Item 1. |
| ITEM 7. | DISCLOSURE OF PROXY VOTING POLICIES AND PROCEDURES FOR CLOSED-END MANAGEMENT INVESTMENT COMPANIES. |
| Not applicable. |
| ITEM 8. | PORTFOLIO MANAGERS OF CLOSED-END MANAGEMENT INVESTMENT COMPANIES. |
| Not applicable. |
| ITEM 9. | PURCHASES OF EQUITY SECURITIES BY CLOSED-END MANAGEMENT INVESTMENT COMPANY AND AFFILIATED PURCHASERS. |
| Not applicable. |
| ITEM 10. | SUBMISSION OF MATTERS TO A VOTE OF SECURITY HOLDERS. |
| There have been no material changes to the procedures by which shareholders may recommend nominees to the registrant’s board of trustees. |
| ITEM 11. | CONTROLS AND PROCEDURES. |
| (a) | The registrant’s principal executive and principal financial officers, or persons performing similar functions have concluded that the registrant’s disclosure controls and procedures (as defined in Rule 30a-3(c) under the Investment Company Act of 1940, as amended (the “1940 Act”)) are effective as of a date within 90 days of the filing of this report that includes the disclosure required by this paragraph, based on the evaluation of these controls and procedures required by Rule 30a-3(b) under the 1940 Act and 15d-15(b) under the Securities Exchange Act of 1934, as amended. |
| (b) | There were no changes in the registrant’s internal control over financial reporting (as defined in Rule 30a-3(d) under the 1940 Act) that occurred during the registrant’s second fiscal quarter of the period covered by this report that have materially affected, or are reasonably likely to materially affect, the registrant’s internal control over financial reporting. |
| ITEM 12. | EXHIBITS. |
| (a)(1) | Goldman Sachs Trust’s Code of Ethics for Principal Executive and Senior Financial Officers is incorporated by reference to Exhibit 12(a)(1) of the registrant’s Form N-CSR filed on July 8, 2015 for its International Equity Insights Funds. | |||
| (a)(2) | Exhibit 99.CERT | Certifications pursuant to Section 302 of the Sarbanes-Oxley Act of 2002 filed herewith. | ||
| (b) | Exhibit 99.906CERT | Certifications pursuant to Section 906 of the Sarbanes-Oxley Act of 2002 filed herewith. | ||
SIGNATURES
Pursuant to the requirements of the Securities Exchange Act of 1934 and the Investment Company Act of 1940, the registrant has duly caused this report to be signed on its behalf by the undersigned, thereunto duly authorized.
| Goldman Sachs Trust | ||
| By: | /s/ James A. McNamara | |
| ||
James A. McNamara | ||
| President/Chief Executive Officer | ||
| Goldman Sachs Trust | ||
| Date: | May 9, 2016 | |
Pursuant to the requirements of the Securities Exchange Act of 1934 and the Investment Company Act of 1940, this report has been signed below by the following persons on behalf of the registrant and in the capacities and on the dates indicated.
| By: | /s/ James A. McNamara | |
| ||
James A. McNamara | ||
| President/Chief Executive Officer | ||
| Goldman Sachs Trust | ||
| Date: | May 9, 2016 | |
| By: | /s/ Scott McHugh | |
| ||
Scott McHugh | ||
| Principal Financial Officer | ||
| Goldman Sachs Trust | ||
| Date: | May 9, 2016 | |