UNITED STATES
SECURITIES AND EXCHANGE COMMISSION
Washington, D.C. 20549
FORM N-CSR
CERTIFIED SHAREHOLDER REPORT OF REGISTERED
MANAGEMENT INVESTMENT COMPANIES
Investment Company Act file number 811-05349
Goldman Sachs Trust
(Exact name of registrant as specified in charter)
71 South Wacker Drive,
Chicago, Illinois 60606
(Address of principal executive offices) (Zip code)
| | |
Copies to: |
Caroline Kraus, Esq. | | Geoffrey R.T. Kenyon, Esq. |
Goldman Sachs & Co. LLC | | Dechert LLP |
200 West Street | | One International Place, 40th Floor |
New York, New York 10282 | | 100 Oliver Street |
| | Boston, MA 02110 |
(Name and address of agents for service)
Registrant’s telephone number, including area code: (312) 655-4400
Date of fiscal year end: November 30
Date of reporting period: May 31, 2018
| ITEM 1. | REPORTS TO STOCKHOLDERS. |
| | The Semi-Annual Report to Shareholders is filed herewith. |
Goldman Sachs Funds

| | | | |
| | |
| Semi-Annual Report | | | | May 31, 2018 |
| | |
| | | | MLP Energy Infrastructure Fund |

Goldman Sachs MLP Energy Infrastructure Fund
| | | | |
| | | |
| NOT FDIC-INSURED | | May Lose Value | | No Bank Guarantee |
GOLDMAN SACHS MLP ENERGY INFRASTRUCTURE FUND
What Differentiates Goldman Sachs’ MLP Energy Infrastructure Fund Investment Process?
With a quality-oriented approach, the MLP Energy Infrastructure Fund seeks total return through current income and capital appreciation. We have an experienced investment team integrated within Goldman Sachs Asset Management, L.P. (“GSAM”), allowing us to leverage franchise expertise and risk framework across multiple asset classes. We invest primarily in Master Limited Partnerships (“MLPs”), or similar structures, that own energy infrastructure assets.

| ∎ | | To capture the full energy value chain, we analyze energy production and user trends that ultimately impact energy infrastructure. |
| ∎ | | We rigorously assess companies on both the asset and equity level. |

| ∎ | | Macro Trend Analysis First, we analyze overall energy trends through capital spending shifts and drilling trends, in addition to regional supply and demand imbalances. |
| ∎ | | Top-Down Sector Selection Secondly, we establish the impact of macro and regional trends on energy infrastructure. |
| ∎ | | Bottom-Up Security Selection Finally, we select investments by evaluating a company’s management, assets, expected returns and technicals. |

| ∎ | | Our team of MLP dedicated investment professionals includes lead portfolio managers averaging 14 years of investment experience. |
| ∎ | | Ability to leverage energy related resources across GSAM Equity, Fixed Income and Commodity groups, as well as utilize risk management resources. |
| ∎ | | Unique investment approach stemming from a more holistic view across the extremes of the energy value chain, corporate access, broader valuation understanding, and resource advantages. |
1
PORTFOLIO RESULTS
Goldman Sachs MLP Energy Infrastructure Fund
Investment Objective and Principal Strategy
The Fund seeks total return through current income and capital appreciation. The Fund invests, under normal circumstances, at least 80% of its net assets plus any borrowings for investment purposes (measured at the time of purchase) in energy infrastructure master limited partnership (“MLP”) investments. The Fund’s MLP investments may include, but are not limited to: MLPs structured as limited partnerships or limited liability companies; MLPs that are taxed as “C” corporations; institutional units issued by MLP affiliates; “C” corporations that hold significant interests in MLPs; private investments in public equities (“PIPEs”) issued by MLPs; and other U.S. and non-U.S. equity and fixed income securities and derivative instruments, including pooled investment vehicles and exchange-traded notes (“ETNs”), that provide exposure to MLPs. Energy infrastructure MLPs own and operate assets that are used in the energy sector, including assets used in exploring, developing, producing, generating, transporting (including marine), transmitting, terminal operation, storing, gathering, processing, refining, distributing, mining or marketing of natural gas, natural gas liquids, crude oil, refined products, coal or electricity, or that provide energy-related equipment or services. The Fund’s MLP investments may be of any capitalization size.
Portfolio Management Discussion and Analysis
Below, the Goldman Sachs Energy and Infrastructure Team discusses the Goldman Sachs MLP Energy Infrastructure Fund’s (the “Fund”) performance and positioning for the six-month period ended May 31, 2018 (the “Reporting Period”).
| Q | | How did the Fund perform during the Reporting Period? |
| A | | During the Reporting Period, the Fund’s Class A, Class C, Institutional, Investor and Class R Shares generated cumulative total returns, without sales charges, of 8.30%, 8.02%, 8.56%, 8.48% and 8.26%, respectively. These returns compare to the 5.71% cumulative total return of the Alerian MLP Index. The Alerian MLP Index is a leading measure of energy master limited partnerships (“MLPs”).1 |
| | From their inception on April 2, 2018 through the end of the Reporting Period, the Fund’s Class R6 Shares generated a cumulative total return, without sales charges, of 15.54% compared to the 14.48% cumulative total return of the Alerian MLP Index. |
| | From their inception on April 16, 2018 through the end of the Reporting Period, the Fund’s Class P Shares generated a cumulative total return, without sales charges, of 6.89% compared to the 5.63% cumulative total return of the Alerian MLP Index. |
| Q | | How did energy MLPs overall perform during the Reporting Period? |
| A | | Energy MLPs, as represented by the Alerian MLP Index, generated a return of 5.71% during the Reporting Period overall. The Alerian MLP Index underperformed the AMEX Energy Select Sector Index (“IXE”) (+11.52%) and outperformed the S&P 500® Index (+3.16%).2 In addition, the Alerian MLP Index outperformed utilities (-8.09%) and real estate investment trusts (“REITs”) (-3.09%), as represented by the Philadelphia Stock Exchange (PHLX) Utility Sector Index and the FTSE NAREIT (National Association of Real Estate Investment Trusts) U.S. Real Estate Index, respectively.3 (All index returns are presented on a total return basis.) |
| | In energy markets, West Texas Intermediate (“WTI”) crude oil prices rallied during the Reporting Period, rising 16.79%, amid modest volatility. They stabilized above $65 per barrel |
| | 1 | | Source: Alerian. The Alerian MLP Index is a float-adjusted, capitalization-weighted index, whose constituents represent approximately 85% of total float-adjusted market capitalization. It is disseminated real-time on a price-return basis (AMZ) and on a total-return basis (AMZX). |
| | 2 | | The AMEX Energy Select Sector Index (IXE) is a modified market capitalization-based index intended to track the movements of companies that are components of the S&P 500® Index and are involved in the development or production of energy products. The S&P 500® Index is a diverse index that includes 500 American companies that represent more than 70% of the total market capitalization of the U.S. stock market. |
| | 3 | | The PHLX Utility Sector Index is composed of geographically diverse public U.S. utility stocks. The FTSE NAREIT U.S. Real Estate Index Series is an index that spans the commercial real estate space across the U.S. economy, offering exposure to all investment and property sectors. |
2
PORTFOLIO RESULTS
| | near the end of the Reporting Period, as the global supply/demand story continued to strengthen due to worldwide supply constraints and robust demand expectations. Meanwhile, natural gas prices fell to a low of $2.56 per million British thermal units (“MMbtu”) in February 2018, down 29.55% from January 2018 highs, due to the mild winter and to oversupply concerns. The oversupply concerns were driven by elevated levels of natural gas associated with crude oil drilling throughout the U.S., specifically in the Permian Basin. After February, natural gas prices recovered somewhat, rising 15.67% to finish the Reporting Period at $2.95/MMbtu.4 |
| | The energy MLP market started the Reporting Period strongly, following two months of weak performance. In October and November 2017, before the Reporting Period began, heavy tax-loss harvesting in energy infrastructure assets had driven the market to the lowest level since February 2016. Investors returned to the energy MLP market in the opening weeks of the Reporting Period, likely to take advantage of depressed valuations amid continuing healthy fundamentals. The market experienced heavy investment inflows, helping the Alerian MLP Index post a gain of 17.62% between the start of the Reporting Period and January 23, 2018. Investor sentiment then reversed and continued to weigh on the energy MLP market through March. In our view, there were four reasons for the shift in sentiment. First, investor appetite for high-yielding assets diminished as the market adjusted for rising interest rates. Second, from January 26th through February 13th, crude oil prices dropped approximately 11%,4 as oversupply concerns mounted and the U.S. dollar strengthened, hindering the performance of energy-related securities broadly. Third, the sell-off in crude oil prices coincided with weak earnings from several large integrated energy companies, pushing the IXE down approximately 13% from January 26th through February 13th. Fourth, and what we consider the most impactful, the Federal Energy Regulatory Commission (“FERC”) announced a surprise policy revision on March 15th. The revised policy mandated that regulated interstate natural gas and liquids pipelines owned by energy MLPs could no longer claim an income tax allowance in their cost-of-service methodology (a method used to set rates for pipeline customers). The policy change also applied to liquids pipelines’ cost-of-service calculation on inflation-indexed pipelines, though active enforcement would be delayed until 2020. At first, we believed the scope of the policy revision was unclear to investors, driving a nearly 10% intra-day decline in the Alerian MLP Index, which then rebounded to end March 15th with a loss of 4.6%. Between March 15th and March 31st, the Alerian MLP Index recorded a decline of almost 8%. We believe investors overreacted to the FERC announcement, as the policy revision should affect only a subset of energy infrastructure companies. Between March 31st and the end of the Reporting Period, the energy MLP market recovered from its FERC-related lows, with the Alerian MLP Index climbing back above pre-announcement levels, as investors continued to digest and understand the impact of the policy revision. In addition, toward the end of the Reporting Period, investor sentiment grew more positive overall, which we attribute to the strong fundamental backdrop for U.S. energy infrastructure, continued earnings momentum, and management teams’ increased focus on investor concerns, such as complex corporate structures, balance sheet management and capital market reliance. |
| | In notable news during the Reporting Period, the President signed into law the Tax Cuts and Jobs Act on December 22, 2017. The law has implications for energy MLPs and pooled investment vehicles, such as the Fund, that are structured as “C” corporations. |
| | • | | Implications for Energy MLPs. The energy MLP structure remains intact and the asset class will also preserve its tax-advantageous position relative to entities structured as “C” corporations (albeit to a slightly lesser extent). While “C” corporation investors may benefit from a reduction in the corporate tax rate, a new income tax deduction for individuals generally applicable to income from energy MLPs may benefit energy MLP investors. |
| | • | | Implications for “C” corporation funds. Tax alterations that may impact “C” corporation funds include the reduction in the U.S. corporate tax rate and changes with respect to the utilization of net operating losses. |
| Q | | What key factors were responsible for the Fund’s performance during the Reporting Period? |
| A | | Security selection, the macro environment in the crude oil and natural gas markets, and the regulatory environment drove the Fund’s performance during the Reporting Period. Securities with the strongest relationship to crude oil prices were largely the Fund’s best performers, as they benefited from the rally in and subsequent stabilization of crude oil prices. On the other hand, securities with greater exposure to the FERC policy revision were generally the worst performers. |
| | 5 | | Sector and subsector allocations are defined by GSAM and may differ from sector allocations used by the Alerian MLP Index. |
3
PORTFOLIO RESULTS
| | In terms of its exposures, the Fund was positively impacted by positions in the gathering and processing and the petroleum pipeline transportation subsectors.5 These subsectors benefited from record U.S. natural gas and crude oil production, with the gathering and processing subsector seeing the most direct benefit as it is closest to the wellhead and, therefore, experienced the greatest fluctuation in volumes. On the negative side, the wholesale marketing subsector was the worst performer amid concerns about fuel demand given rising crude oil prices as well as questions around leverage and growth potential. |
| Q | | What individual holdings added to the Fund’s relative performance during the Reporting Period? |
| A | | During the Reporting Period, the Fund’s holdings of Enterprise Products Partners L.P.; Energy Transfer Partners, L.P.; and Plains All American Pipeline, L.P. contributed positively to returns. |
| | The Fund’s top contributor was Enterprise Products Partners L.P. (EPD), a provider of processing, transportation and fractionation6 services to producers and consumers of natural gas liquids. EPD benefited from increased crude oil and natural gas liquids exports as well as from stronger natural gas liquids prices and volumes. Additionally, EPD performed well after announcing it would add incremental capacity to its natural gas processing facility, which is under construction near Orla, Texas. The new facility is anticipated to allow EPD to expand its natural gas liquids extraction capabilities. EPD was also helped as FERC-related uncertainties eased and investors anticipated the company would not be affected by FERC’s policy revision. We increased the Fund’s position in EPD during the Reporting Period, as we believed it would benefit from increased U.S. crude oil and natural gas liquids exports as well as from the continued need for natural gas liquids infrastructure. |
| | Energy Transfer Partners (ETP), which offers natural gas, natural gas liquids, crude oil and refined products transportation and storage services, also added to the Fund’s performance. At the beginning of the Reporting Period, ETP benefited from improved investor sentiment about energy infrastructure companies. In addition, market sentiment was positive following ETP’s first quarter 2018 earnings announcement, which included stronger than market expected results for its interstate and intrastate transportation/storage segment. Tightening takeaway transportation volumes from the Permian Basin also seemed likely to benefit ETP as did the anticipated ramp up of natural gas liquids pipeline Mariner East 2 in the second half of 2018. We increased the Fund’s position in ETP during the Reporting Period because we believed the company had an attractive yield and valuation given its fundamentals. |
| | Another key contributor to the Fund’s performance was Plains All American Pipeline, L.P. (PAA), a partnership involved in intrastate crude oil pipeline transportation and terminalling storage activities in addition to the gathering and marketing of crude oil, refined products and natural gas liquids. PAA benefited from its leading position in the Permian Basin, where takeaway capacity constraints have driven widening price differentials and higher crude oil prices have led to volume growth. In our view, investors believed that widening Permian price differentials could create incremental opportunities for PAA’s marketing segment and that increased volumes could further drive cash flow growth on existing and new pipelines. During the Reporting Period, we added to the Fund’s position in PAA, as we expect robust commodity volumes and improving crude oil prices to drive strong cash flow growth. |
| Q | | What individual holdings detracted from the Fund’s relative performance during the Reporting Period? |
| A | | Investments in Buckeye Partners, L.P.; Shell Midstream Partners, L.P.; and EQT Midstream Partners, LP detracted from the Fund’s relative performance during the Reporting Period. |
| | Buckeye Partners, L.P. (BPL), an independent pipeline common carrier of refined petroleum products, was the Fund’s top detractor. BPL reported first quarter 2018 earnings that missed consensus estimates for a sixth consecutive quarter, citing challenging market conditions and contract expirations. At the end of the Reporting Period, the Fund continued to hold the position, as we believed BPL could benefit from its expansion projects given increased crude oil and condensate volumes. |
| | The Fund was also hampered by its position in Shell Midstream Partners LP (SHLX), which owns, operates, develops and acquires pipelines and other midstream7 assets. |
| | 6 | | Fractionation is the process used to separate the base components of natural gas liquids. |
| | 7 | | The midstream component of the energy industry is usually defined as those companies providing products or services that help link the supply side, i.e. energy producers, and the demand side, i.e. energy end-users, for any type of energy commodity. Such midstream businesses can include, but are not limited to, those that process, store, market and transport various energy commodities. |
4
PORTFOLIO RESULTS
| | SHLX’s share price declined after announcing an equity offering and due to increased investor concerns around the economics and viability of future drop-downs8 from its parent company, Royal Dutch Shell. At the end of the Reporting Period, the Fund maintained a position in SHLX, as we believed the company had high growth potential and was relatively inexpensive based on its underlying fundamentals. |
| | In addition, the Fund’s exposure to EQT Midstream Partners, LP (EQM) detracted from returns. EQM, which acquires, owns, develops and operates midstream natural gas assets in the Appalachian Basin, reported earnings that missed consensus expectations. Additionally, the unexpected resignation of its chief executive officer left investors unsettled, especially as the company is in the midst of separating ownership interest in its upstream9 and midstream businesses. The Fund continued to hold EQM at the end of the Reporting Period, as we believe the company has strong fundamentals and can benefit from synergies related to its acquisition of Rice Midstream Partners LP. |
| Q | | Were there any notable purchases or sales during the Reporting Period? |
| A | | During the Reporting Period, the Fund initiated a position in DCP Midstream, LP (DCP), one of the largest natural gas gatherers in North America and a top producer and primary marketer of natural gas liquids. We subsequently increased the Fund’s position because we believed DCP could benefit from increased commodity volumes and from its multi-year growth plan. Additionally, we believe the security offers good exposure to rising commodity prices. |
| | The Fund established a position in NuStar Energy L.P. (NS), a provider of transportation and storage services and an operator of pipelines, terminals and oil storage facilities. In our view, NS has strong fundamentals and offers an attractive yield, especially after the company announced a 45% cut to its quarterly distribution, which we believe has the potential to improve its distribution coverage ratio.10 |
| | A key sale during the Reporting Period was Enbridge (ENB), a provider of energy transportation, distribution and related services in North America and internationally. ENB operates a crude oil and liquids pipeline system and is involved in international energy projects as well as natural gas transmission and midstream businesses. We eliminated the position in February 2018 as we sought to manage the Fund’s idiosyncratic and active risk, especially its exposure to ENB’s approximately $6.5 billion Line 3 Pipeline replacement project, which we feel has lingering timeline uncertainty. |
| Q | | How did the Fund use derivatives and similar instruments during the Reporting Period? |
| A | | During the Reporting Period, the Fund did not use derivatives or similar instruments. |
| Q | | What is the Fund’s tactical view and strategy for the months ahead? |
| A | | U.S crude oil inventories fell below their five-year average during the Reporting Period, helping stabilize WTI and Brent crude oil prices and indicating a potential equilibrium between supply and demand in the near term. Regarding supply, U.S. crude oil and natural gas production hit peak levels in March 2018, according to the U.S. Energy Information Administration (“EIA”), and is expected by the EIA to grow at compound annual growth rates of 12.63% and 6.43%, respectively, through 2019. Meanwhile, the International Energy Agency (“IEA”) estimates that in the longer term, U.S. crude oil and natural gas production may account for nearly 60% of global supply growth through 2023. As for demand, the IEA expects it to continue at a historical pace and did not express concern about a peak in crude oil demand until 2040. This view is supported, we believe, by a robust global economy as well as by ongoing economic growth in the emerging markets, which continue to benefit from an expanding middle class. Also, growing global demand has been met by increased U.S. crude oil and natural gas production, which could cover 80% of the world’s demand growth through 2020, according to the IEA. |
| | At the end of the Reporting Period, we believed energy MLP fundamentals remained strong overall. These positive fundamentals have already translated into strong cash flows, in our view. We also think earnings momentum is building, as evidenced by positive earnings results in the fourth quarter of 2017 and the first quarter of 2018. We believe this trend is likely to continue going forward. Furthermore, we believe increased U.S. commodity volume growth should result in |
| | 8 | | Drop-down refers to the act of a parent company selling MLP-qualified assets to the associated MLP. |
| | 9 | | The upstream component of the energy industry is usually defined as those operations stages in the oil and gas industry that involve exploration and production. Upstream operations deal primarily with the exploration stages of the oil and gas industry, with upstream firms taking the first steps to first locate, test and drill for oil and gas. Later, once reserves are proven, upstream firms will extract any oil and gas from the reserve. |
| | 10 | | The distribution coverage ratio is an energy MLP’s distributable cash flow divided by the total amount of distributions it has paid out. It is an indication of an energy MLP’s ability to maintain its current cash distribution level. |
5
PORTFOLIO RESULTS
| | increased cash flow generation for energy infrastructure companies over the long term, as it has historically driven energy MLP cash flow growth. We expect U.S. crude oil and natural gas production trends to drive a 12.00% compound annual growth rate in energy MLP earnings before interest, taxes, depreciation and amortization (“EBITDA”) overall through 2019. Consensus EBITDA expectations are somewhat higher, as they call for 14.12% weighted average EBITDA growth for Alerian MLP Index constituents.11 |
| | At the company level during the Reporting Period, we saw what we believe is increased capital discipline, which has historically been a point of contention between management teams and investors. Many energy MLPs have either cut or reduced distribution growth rates in seeking to maintain higher distribution coverage, thus retaining more capital within their businesses. In many cases, this action was taken with the goal of moving to a more self-funding12 model in order to rely less on the equity and debt capital markets to fund growth. Also, many energy MLPs have become more selective about the capital projects they undertake and are choosing to invest only in what they consider their highest return opportunities. In our opinion, this shift could result in increased cash flows and ultimately stronger and potentially more sustainable returns for unitholders. On another front, energy MLPs’ management teams finally appear to be addressing complexities around their corporate structure, with consolidation becoming a common theme. Consolidation transactions can come in many forms, such as a buy-in of incentive distribution rights13 by the limited partner or a roll up14 of assets between the limited partner and the general partner. We believe these strategies could help address the cost of capital burden associated with the general partner/limited partner relationship. Corporate structures may also be affected by the FERC policy revision. Some energy MLPs are exploring ways to mitigate EBITDA degradation, such as a structural conversion to a “C” corporation. Between the FERC’s March 15th announcement and the end of the Reporting Period, there were already three prominent simplification transactions.15 We believe structural simplifications may boost investor sentiment and increase interest from institutional investors who have historically avoided energy infrastructure assets entirely. In our view, these trends may well continue going forward, lowering hurdle rates16 and potentially strengthening returns on invested capital. |
| 12 | | Self-funding means that organically generated cash flow in excess of distributions will be the source of funding for potential growth opportunities rather than reliance on the equity capital markets. |
| 13 | | Incentive distribution rights allow a general partner to receive incrementally larger percentages of an energy MLP’s total distributions as the energy MLP grows the distribution beyond established targets. |
| 14 | | A roll up is a process used by which assets are merged. The principal aim of a roll up is to reduce costs through economies of scale. |
| 15 | | A simplification transaction is when multiple entities controlled by the same corporate parent simplify their corporate structure through actions such as mergers, acquisitions or reduction of incentive distribution rights. |
| 16 | | A hurdle rate is the minimum rate of return on a project or investment required by an investor. The hurdle rate denotes appropriate compensation for the level of risk present; riskier projects generally have higher hurdle rates than those that are deemed to be less risky. |
6
FUND BASICS
Goldman Sachs MLP Energy Infrastructure Fund
as of May 31, 2018
| | | | | | | | | | |
| | PERFORMANCE REVIEW | |
| | | December 1, 2017–May 31, 2018 | | Fund Total Return
(based on NAV)1 | | | Alerian MLP Index2 | |
| | Class A | | | 8.30 | % | | | 5.71 | % |
| | Class C | | | 8.02 | | | | 5.71 | |
| | Institutional | | | 8.56 | | | | 5.71 | |
| | Investor | | | 8.48 | | | | 5.71 | |
| | | Class R | | | 8.26 | | | | 5.71 | |
| | | |
| | | | | | | | | |
| | | April 16, 2018–May 31, 2018 | | | | | | |
| | | Class P | | | 6.89 | % | | | 5.63 | % |
| | | |
| | | | | | | | | |
| | | April 2, 2018–May 31, 2018 | | | | | | |
| | | Class R6 | | | 15.54 | % | | | 14.48 | % |
| | 1 | | The net asset value (“NAV”) represents the net assets of the class of the Fund (ex-dividend) divided by the total number of shares of the class outstanding. The Fund’s performance assumes the reinvestment of dividends and other distributions. The Fund’s performance does not reflect the deduction of any applicable sales charges. |
| | 2 | | The Alerian MLP Index is a composite of the 50 most prominent energy master limited partnerships calculated by Standard & Poor’s using a float-adjusted market capitalization methodology. The Alerian MLP Index is disseminated by the New York Stock Exchange real-time on a price return basis (NYSE: AMZ). The corresponding total return index is calculated and disseminated daily through ticker AMZX. The Alerian MLP Index figures do not reflect any deduction for fees, expenses or taxes. It is not possible to invest directly in an index. |
| | | | | | | | | | | | | | | | |
| | STANDARDIZED TOTAL RETURNS3 |
| | | For the period ended 3/31/18 | | One Year | | | Five Years | | | Since Inception | | | Inception Date |
| | Class A | | | -24.16 | % | | | -4.76 | % | | | -4.75 | % | | 3/28/2013 |
| | Class C | | | -21.22 | | | | -4.40 | | | | -4.39 | | | 3/28/2013 |
| | Institutional | | | -19.52 | | | | -3.32 | | | | -3.31 | | | 3/28/2013 |
| | Investor | | | -19.63 | | | | -3.45 | | | | -3.44 | | | 3/28/2013 |
| | Class P | | | N/A | | | | N/A | | | | N/A | | | 4/16/2018 |
| | Class R | | | -20.10 | | | | -3.95 | | | | -3.94 | | | 3/28/2013 |
| | | Class R6 | | | N/A | | | | N/A | | | | N/A | | | 4/2/2018 |
| | 3 | | The Standardized Total Returns are average annual total returns or cumulative total returns (only if the performance period is one year or less) as of the most recent calendar quarter-end. They assume reinvestment of all distributions at net asset value. These returns reflect a maximum initial sales charge of 5.5% for Class A Shares and the contingent deferred sales charge for Class C Shares (1% if shares are redeemed within 12 months of purchase). Because Institutional, Investor, Class P, Class R and Class R6 Shares do not involve a sales charge, such a charge is not applied to their Standardized Total Returns. |
The returns set forth in the tables above represent past performance. Past performance does not guarantee future results. The Fund’s investment return and principal value will fluctuate so that an investor’s shares, when redeemed, may be worth more or less than their original cost. Current performance may be lower or higher than the performance quoted above. Please visit our web site at www.GSAMFUNDS.com to obtain the most recent month-end returns. Performance reflects applicable fee waivers and/or expense limitations in effect during the periods shown. In their absence, performance would be reduced. Returns do not reflect the deduction of taxes that a shareholder would pay on Fund distributions or the redemption of Fund shares.
7
FUND BASICS
| | | | | | |
| | EXPENSE RATIOS4 | | | | |
| | | | | Total Annual
Fund Operating
Expenses | |
| | Class A | | | 1.41 | % |
| | Class C | | | 2.16 | |
| | Institutional | | | 1.02 | |
| | Investor | | | 1.16 | |
| | Class P | | | 1.01 | |
| | Class R | | | 1.66 | |
| | | Class R6 | | | 1.01 | |
| | 4 | | The expense ratios of the Fund are as set forth above according to the most recent publicly available Prospectus and may differ from the expense ratios disclosed in the Financial Highlights in this report. |
| | | | | | | | |
| | TOP TEN HOLDINGS AS OF 5/31/185 |
| | | Holding | | % of Net Assets | | | Line of Business |
| | Enterprise Products Partners LP | | | 9.9 | % | | Pipeline Transportation | Natural Gas |
| | Magellan Midstream Partners LP | | | 9.1 | | | Pipeline Transportation | Petroleum |
| | Energy Transfer Partners LP | | | 8.3 | | | Pipeline Transportation | Natural Gas |
| | MPLX LP | | | 6.8 | | | Gathering + Processing |
| | Plains All American Pipeline LP | | | 6.5 | | | Pipeline Transportation | Petroleum |
| | Williams Partners LP | | | 6.0 | | | Gathering + Processing |
| | Targa Resources Corp. | | | 5.9 | | | Gathering + Processing |
| | Energy Transfer Equity LP | | | 4.0 | | | Pipeline Transportation | Natural Gas |
| | Antero Midstream Partners LP | | | 3.1 | | | Gathering + Processing |
| | | Western Gas Partners LP | | | 3.0 | | | Gathering + Processing |
| | 5 | | The top 10 holdings may not be representative of the Fund’s future investments. |
8
FUND BASICS
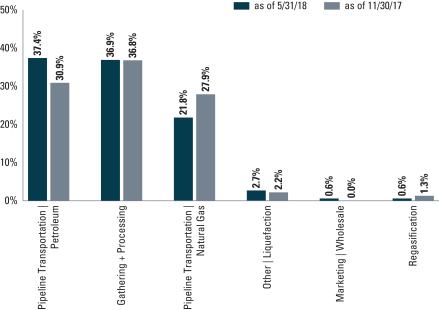
| | † | | The Fund is actively managed and, as such, its composition may differ over time. Consequently, the Fund’s current sector allocations may differ from the percentages contained in the graph above. The percentage shown for each investment category reflects the value of investments in that category as a percentage of total net assets. Figures in the graph may not sum to 100% due to exclusion of other assets and liabilities. Sector allocations are defined by GSAM and may differ from sector allocations used by the Alerian MLP Index. |
9
GOLDMAN SACHS MLP ENERGY INFRASTRUCTURE FUND
Schedule of Investments
May 31, 2018 (Unaudited)
| | | | | | | | |
| Shares | | | Description | |
Value | |
| Common Stocks – 100.0% | |
| Gathering + Processing – 36.9% | |
| | 2,100,000 | | | Antero Midstream GP LP | | $ | 40,425,000 | |
| | 2,650,000 | | | Antero Midstream Partners LP | | | 80,162,500 | |
| | 1,100,000 | | | DCP Midstream LP | | | 46,101,000 | |
| | 4,925,000 | | | MPLX LP | | | 176,856,750 | |
| | 1,021,700 | | | Noble Midstream Partners LP | | | 52,689,069 | |
| | 975,000 | | | ONEOK, Inc. | | | 66,456,000 | |
| | 1,760,000 | | | Rice Midstream Partners LP | | | 32,507,200 | |
| | 3,150,000 | | | Targa Resources Corp. | | | 153,184,500 | |
| | 2,900,000 | | | The Williams Cos., Inc. | | | 77,894,000 | |
| | 1,535,000 | | | Western Gas Partners LP | | | 79,313,450 | |
| | 3,910,000 | | | Williams Partners LP | | | 155,618,000 | |
| | | | | | | | |
| | | | | | | 961,207,469 | |
| | |
| Marketing | Wholesale – 0.6% | |
| | 550,000 | | | Sunoco LP | | | 14,630,000 | |
| | |
| Other | Liquefaction* – 2.7% | |
| | 1,070,000 | | | Cheniere Energy, Inc. | | | 71,283,400 | |
| | |
| Pipeline Transportation | Natural Gas – 21.8% | |
| | 820,000 | | | Boardwalk Pipeline Partners LP | | | 8,683,800 | |
| | 225,000 | | | Dominion Energy Midstream Partners LP | | | 2,880,000 | |
| | 6,050,000 | | | Energy Transfer Equity LP | | | 104,544,000 | |
| | 8,950,000 | | | Enterprise Products Partners LP | | | 258,655,000 | |
| | 2,220,000 | | | EQT GP Holdings LP | | | 55,011,600 | |
| | 1,055,000 | | | EQT Midstream Partners LP | | | 58,900,650 | |
| | 1,890,000 | | | TransCanada Corp. | | | 79,121,703 | |
| | | | | | | | |
| | | | | | | 567,796,753 | |
| | |
| Pipeline Transportation | Petroleum – 37.4% | |
| | 1,275,000 | | | Buckeye Partners LP | | | 45,963,750 | |
| | 875,000 | | | Enbridge Energy Partners LP | | | 8,618,750 | |
| | 11,375,000 | | | Energy Transfer Partners LP | | | 216,011,250 | |
| | 3,390,000 | | | Magellan Midstream Partners LP | | | 236,961,000 | |
| | 600,000 | | | NuStar Energy LP | | | 14,664,000 | |
| | 1,340,000 | | | Pembina Pipeline Corp. | | | 46,609,594 | |
| | 1,015,000 | | | Phillips 66 Partners LP | | | 53,084,500 | |
| | 7,200,000 | | | Plains All American Pipeline LP | | | 169,200,000 | |
| | 1,885,000 | | | Plains GP Holdings LP Class A | | | 46,314,450 | |
| | 520,000 | | | SemGroup Corp. Class A | | | 13,156,000 | |
| | 2,625,000 | | | Shell Midstream Partners LP | | | 58,773,750 | |
| | 1,597,500 | | | Valero Energy Partners LP | | | 65,481,525 | |
| | | | | | | | |
| | | | | | | 974,838,569 | |
| | |
| Regasification – 0.6% | |
| | 550,000 | | | Golar LNG Ltd. | | | 14,289,000 | |
| | |
| | TOTAL COMMON STOCKS | | | | |
| | (Cost $2,507,901,117) | | $ | 2,604,045,191 | |
| | |
| | | | | | | | |
| Shares | | | Distribution
Rate | | Value | |
| Investment Company(a) – 0.0% | |
| Goldman Sachs Financial Square Government Fund –
Institutional Shares |
|
| | 16,434 | | | 1.674% | | $ | 16,434 | |
| | (Cost $16,434) | | | | |
| | |
| | TOTAL INVESTMENTS – 100.0% | |
| | (Cost $2,507,917,551) | | $ | 2,604,061,625 | |
| | |
| OTHER ASSETS IN EXCESS OF
LIABILITIES – 0.0% | | | 1,077,150 | |
| | |
| | NET ASSETS – 100.0% | | $ | 2,605,138,775 | |
| | |
| | |
| The percentage shown for each investment category reflects the value of investments in that category as a percentage of net assets. |
* | | Non-income producing security. |
(a) | | Represents an affiliated fund. |
| | |
|
Investment Abbreviations: |
GP | | —General Partnership |
LP | | —Limited Partnership |
|
| | |
| 10 | | The accompanying notes are an integral part of these financial statements. |
GOLDMAN SACHS MLP ENERGY INFRASTRUCTURE FUND
Statement of Assets and Liabilities
May 31, 2018 (Unaudited)
| | | | | | |
| | | | | | |
| | Assets: | | | | |
| | Investments of unaffiliated issuers, at value (cost $2,507,901,117) | | $ | 2,604,045,191 | |
| | Investments of affiliated issuers, at value (cost $16,434) | | | 16,434 | |
| | Cash | | | 19,399,479 | |
| | Prepaid state and local franchise taxes | | | 49,356 | |
| | Receivables: | | | | |
| | Investments sold | | | 7,948,687 | |
| | Fund shares sold | | | 2,959,091 | |
| | Dividends | | | 176,177 | |
| | Foreign tax reclaims | | | 71,522 | |
| | Current taxes | | | 3,242,765 | |
| | Other assets | | | 104,631 | |
| | Total assets | | | 2,638,013,333 | |
| | | | | | |
| | Liabilities: | | | | |
| | Payables: | | | | |
| | Investments purchased | | | 18,495,943 | |
| | Management fees | | | 1,955,541 | |
| | Fund shares redeemed | | | 1,588,962 | |
| | Distribution and Service fees and Transfer Agency fees | | | 246,806 | |
| | Deferred taxes, net | | | 10,157,169 | |
| | Accrued expenses | | | 430,137 | |
| | Total liabilities | | | 32,874,558 | |
| | | | | | |
| | Net Assets: | | | | |
| | Paid-in capital | | | 3,196,607,771 | |
| | Distributions in excess of net investment loss, net of taxes | | | (72,530,396 | ) |
| | Accumulated net realized loss, net of taxes | | | (616,832,535 | ) |
| | Net unrealized gain, net of taxes | | | 97,893,935 | |
| | | NET ASSETS | | $ | 2,605,138,775 | |
| | | Net Assets: | | | | |
| | | Class A | | $ | 106,562,344 | |
| | | Class C | | | 114,246,947 | |
| | | Institutional | | | 2,146,814,389 | |
| | | Investor | | | 151,410,754 | |
| | | Class P | | | 42,478,673 | |
| | | Class R | | | 2,381,270 | |
| | | Class R6 | | | 41,244,398 | |
| | | Total Net Assets | | $ | 2,605,138,775 | |
| | | Shares Outstanding $0.001 par value (unlimited shares authorized): | | | | |
| | | Class A | | | 14,909,264 | |
| | | Class C | | | 16,711,780 | |
| | | Institutional | | | 293,230,438 | |
| | | Investor | | | 20,861,387 | |
| | | Class P | | | 5,795,282 | |
| | | Class R | | | 338,241 | |
| | | Class R6 | | | 5,637,004 | |
| | | Net asset value, offering and redemption price per share:(a) | | | | |
| | | Class A | | | $7.15 | |
| | | Class C | | | 6.84 | |
| | | Institutional | | | 7.32 | |
| | | Investor | | | 7.26 | |
| | | Class P | | | 7.33 | |
| | | Class R | | | 7.04 | |
| | | Class R6 | | | 7.32 | |
| | (a) | | Maximum public offering price per share for Class A Shares is $7.57. At redemption, Class C Shares may be subject to a contingent deferred sales charge, assessed on the amount equal to the lesser of the current net asset value or the original purchase price of the shares. |
| | |
| The accompanying notes are an integral part of these financial statements. | | 11 |
GOLDMAN SACHS MLP ENERGY INFRASTRUCTURE FUND
Statement of Operations
For the Six Months Ended May 31, 2018 (Unaudited)
| | | | | | |
| | | | | | |
| | Investment income: | | | | |
| | Dividends — unaffiliated issuers (net of tax withholding of $316,668) | | $ | 72,383,722 | |
| | Dividends — affiliated issuers | | | 20,049 | |
| | Less: Return of Capital on Dividends | | | (59,677,864 | ) |
| | Total investment income | | | 12,725,907 | |
| | | | | | |
| | Expenses: | |
| | Management fees | | | 10,700,202 | |
| | Distribution and Service fees(a) | | | 730,780 | |
| | Transfer Agency fees(a) | | | 724,114 | |
| | Printing and mailing costs | | | 127,546 | |
| | Professional fees | | | 126,949 | |
| | Custody, accounting and administrative services | | | 86,937 | |
| | Trustee fees | | | 11,197 | |
| | Other | | | 54,201 | |
| | Total operating expenses, before taxes | | | 12,561,926 | |
| | Less — expense reductions | | | (1,979 | ) |
| | Net operating expenses, before taxes | | | 12,559,947 | |
| | NET INVESTMENT INCOME, BEFORE TAXES | | | 165,960 | |
| | Deferred tax expense | | | (600,321 | ) |
| | NET INVESTMENT LOSS, NET OF TAXES | | | (434,361 | ) |
| | | | | | |
| | Realized and unrealized gain (loss): | |
| | Net realized gain from: | | | | |
| | Investments | | | 28,655,538 | |
| | Foreign currency transactions | | | 8,498 | |
| | Deferred tax expense | | | (8,852,120 | ) |
| | Net change in unrealized gain on: | | | | |
| | Investments | | | 163,049,307 | |
| | Foreign currency translation | | | 6,103 | |
| | Deferred tax benefit | | | 2,010,222 | |
| | Net realized and unrealized gain, net of taxes | | | 184,877,548 | |
| | NET INCREASE IN NET ASSETS RESULTING FROM OPERATIONS | | $ | 184,443,187 | |
| | (a) | | Class specific Distribution and Service and Transfer Agency fees were as follows: |
| | | | | | | | | | | | | | | | | | | | | | | | | | | | | | | | | | | | | | |
| Distribution and Service Fees | | | Transfer Agency Fees | |
Class A | | | Class C | | | Class R | | | Class A | | | Class C | | | Institutional | | | Investor | | | Class P(b) | | | Class R | | | Class R6(c) | |
| $ | 137,900 | | | $ | 587,144 | | | $ | 5,737 | | | $ | 99,288 | | | $ | 105,686 | | | $ | 376,522 | | | $ | 138,596 | | | $ | 579 | | | $ | 2,065 | | | $ | 1,377 | |
| | (b) | | Commenced operations on April 16, 2018. |
| | (c) | | Commenced operations on April 2, 2018. |
| | |
| 12 | | The accompanying notes are an integral part of these financial statements. |
GOLDMAN SACHS MLP ENERGY INFRASTRUCTURE FUND
Statements of Changes in Net Assets
| | | | | | | | | | |
| | | | | For the
Six Months Ended
May 31, 2018
(Unaudited) | | | For the Fiscal
Year Ended
November 30, 2017 | |
| | From operations: | | | | | | | | |
| | Net investment loss, net of taxes | | $ | (434,361 | ) | | $ | (13,600,223 | ) |
| | Net realized gain, net of taxes | | | 19,811,916 | | | | 126,105,421 | |
| | Net change in unrealized gain (loss), net of taxes | | | 165,065,632 | | | | (320,681,601 | ) |
| | Net increase (decrease) in net assets resulting from operations | | | 184,443,187 | | | | (208,176,403 | ) |
| | | | | | | | | | |
| | Distributions to shareholders: | | | | | | | | |
| | From net investment income | | | | | | | | |
| | Class A Shares | | | — | | | | (1,141,834 | ) |
| | Class C Shares | | | — | | | | (1,033,882 | ) |
| | Institutional Shares | | | — | | | | (12,138,098 | ) |
| | Investor Shares | | | — | | | | (1,110,454 | ) |
| | Class R Shares | | | — | | | | (12,530 | ) |
| | From return of capital | | | | | | | | |
| | Class A Shares | | | (3,331,957 | ) | | | (8,955,501 | ) |
| | Class C Shares | | | (3,698,947 | ) | | | (8,108,814 | ) |
| | Institutional Shares | | | (60,235,754 | ) | | | (95,200,104 | ) |
| | Investor Shares | | | (4,658,444 | ) | | | (8,709,384 | ) |
| | Class P Shares(a) | | | (600,483 | ) | | | — | |
| | Class R Shares | | | (71,961 | ) | | | (98,279 | ) |
| | Class R6 Shares(b) | | | (608,155 | ) | | | — | |
| | Total distributions to shareholders | | | (73,205,701 | ) | | | (136,508,880 | ) |
| | | | | | | | | | |
| | From share transactions: | | | | | | | | |
| | Proceeds from sales of shares | | | 826,323,616 | | | | 979,004,144 | |
| | Reinvestment of distributions | | | 69,244,545 | | | | 132,465,083 | |
| | Cost of shares redeemed | | | (512,236,879 | ) | | | (1,070,822,446 | ) |
| | Net increase in net assets resulting from share transactions | | | 383,331,282 | | | | 40,646,781 | |
| | TOTAL INCREASE (DECREASE) | | | 494,568,768 | | | | (304,038,502 | ) |
| | | | | | | | | | |
| | Net assets: | | | | | | | | |
| | Beginning of period | | | 2,110,570,007 | | | | 2,414,608,509 | |
| | End of period | | $ | 2,605,138,775 | | | $ | 2,110,570,007 | |
| | Distributions in excess of net investment loss, net of taxes | | $ | (72,530,396 | ) | | $ | (72,096,035 | ) |
| | (a) | | Commenced operations on April 16, 2018. |
| | (b) | | Commenced operations on April 2, 2018. |
| | |
| The accompanying notes are an integral part of these financial statements. | | 13 |
GOLDMAN SACHS MLP ENERGY INFRASTRUCTURE FUND
Financial Highlights
Selected Data for a Share Outstanding Throughout Each Period
| | | | | | | | | | | | | | | | | | | | | | | | | | | | | | |
| | | | | | From
investment operations | | | Distributions
to shareholders | |
| | | Year - Share Class | | Net asset
value,
beginning
of period | | | Net
investment
income (loss)(a) | | | Net realized
and unrealized
gain (loss) | | | Total from
investment
operations | | | From net
investment
income | | | From
capital | | | Total
distributions | |
| | FOR THE SIX MONTHS ENDED MAY 31, (UNAUDITED) | |
| | 2018 - A | | $ | 6.80 | | | $ | (0.01 | ) | | $ | 0.58 | | | $ | 0.57 | | | $ | — | | | $ | (0.22 | ) | | $ | (0.22 | ) |
| | 2018 - C | | | 6.54 | | | | (0.04 | ) | | | 0.56 | | | | 0.52 | | | | — | | | | (0.22 | ) | | | (0.22 | ) |
| | 2018 - Institutional | | | 6.95 | | | | — | (f) | | | 0.59 | | | | 0.59 | | | | — | | | | (0.22 | ) | | | (0.22 | ) |
| | 2018 - Investor | | | 6.90 | | | | — | (f) | | | 0.58 | | | | 0.58 | | | | — | | | | (0.22 | ) | | | (0.22 | ) |
| | 2018 - P(h) | | | 6.96 | | | | (0.01 | ) | | | 0.49 | | | | 0.48 | | | | — | | | | (0.11 | ) | | | (0.11 | ) |
| | 2018 - R | | | 6.71 | | | | (0.02 | ) | | | 0.57 | | | | 0.55 | | | | — | | | | (0.22 | ) | | | (0.22 | ) |
| | 2018 - R6(i) | | | 6.43 | | | | 0.01 | | | | 0.99 | | | | 1.00 | | | | — | | | | (0.11 | ) | | | (0.11 | ) |
| | | | | | | | | | | | | | | | | | | | | | | | | | | | | | |
| | FOR THE FISCAL YEARS ENDED NOVEMBER 30, | |
| | 2017 - A | | | 7.88 | | | | (0.07 | ) | | | (0.57 | ) | | | (0.64 | ) | | | (0.05 | ) | | | (0.39 | ) | | | (0.44 | ) |
| | 2017 - C | | | 7.65 | | | | (0.12 | ) | | | (0.55 | ) | | | (0.67 | ) | | | (0.05 | ) | | | (0.39 | ) | | | (0.44 | ) |
| | 2017 - Institutional | | | 8.02 | | | | (0.03 | ) | | | (0.60 | ) | | | (0.63 | ) | | | (0.05 | ) | | | (0.39 | ) | | | (0.44 | ) |
| | 2017 - Investor | | | 7.97 | | | | (0.05 | ) | | | (0.58 | ) | | | (0.63 | ) | | | (0.05 | ) | | | (0.39 | ) | | | (0.44 | ) |
| | 2017 - R | | | 7.81 | | | | (0.08 | ) | | | (0.58 | ) | | | (0.66 | ) | | | (0.05 | ) | | | (0.39 | ) | | | (0.44 | ) |
| | 2016 - A | | | 7.62 | | | | (0.06 | ) | | | 0.80 | | | | 0.74 | | | | — | | | | (0.48 | ) | | | (0.48 | ) |
| | 2016 - C | | | 7.46 | | | | (0.12 | ) | | | 0.79 | | | | 0.67 | | | | — | | | | (0.48 | ) | | | (0.48 | ) |
| | 2016 - Institutional | | | 7.70 | | | | (0.05 | ) | | | 0.85 | | | | 0.80 | | | | — | | | | (0.48 | ) | | | (0.48 | ) |
| | 2016 - Investor | | | 7.67 | | | | (0.04 | ) | | | 0.82 | | | | 0.78 | | | | — | | | | (0.48 | ) | | | (0.48 | ) |
| | 2016 - R | | | 7.56 | | | | (0.09 | ) | | | 0.82 | | | | 0.73 | | | | — | | | | (0.48 | ) | | | (0.48 | ) |
| | 2015 - A | | | 11.98 | | | | (0.05 | ) | | | (3.82 | ) | | | (3.87 | ) | | | — | | | | (0.49 | ) | | | (0.49 | ) |
| | 2015 - C | | | 11.83 | | | | (0.12 | ) | | | (3.76 | ) | | | (3.88 | ) | | | — | | | | (0.49 | ) | | | (0.49 | ) |
| | 2015 - Institutional | | | 12.06 | | | | (0.01 | ) | | | (3.86 | ) | | | (3.87 | ) | | | — | | | | (0.49 | ) | | | (0.49 | ) |
| | 2015 - Investor | | | 12.04 | | | | (0.03 | ) | | | (3.85 | ) | | | (3.88 | ) | | | — | | | | (0.49 | ) | | | (0.49 | ) |
| | 2015 - R | | | 11.93 | | | | 0.18 | | | | (4.06 | ) | | | (3.88 | ) | | | — | | | | (0.49 | ) | | | (0.49 | ) |
| | 2014 - A | | | 10.81 | | | | (0.08 | ) | | | 1.75 | | | | 1.67 | | | | (0.12 | ) | | | (0.38 | ) | | | (0.50 | ) |
| | 2014 - C | | | 10.76 | | | | (0.15 | ) | | | 1.72 | | | | 1.57 | | | | (0.12 | ) | | | (0.38 | ) | | | (0.50 | ) |
| | 2014 - Institutional | | | 10.84 | | | | (0.01 | ) | | | 1.73 | | | | 1.72 | | | | (0.12 | ) | | | (0.38 | ) | | | (0.50 | ) |
| | 2014 - Investor | | | 10.83 | | | | (0.02 | ) | | | 1.73 | | | | 1.71 | | | | (0.12 | ) | | | (0.38 | ) | | | (0.50 | ) |
| | 2014 - R | | | 10.79 | | | | (0.11 | ) | | | 1.75 | | | | 1.64 | | | | (0.12 | ) | | | (0.38 | ) | | | (0.50 | ) |
| | | | | | | | | | | | | | | | | | | | | | | | | | | | | | |
| | FOR THE PERIOD ENDED NOVEMBER 30, | |
| | 2013 - A(j) | | | 10.00 | | | | (0.07 | ) | | | 1.27 | | | | 1.20 | | | | — | | | | (0.39 | ) | | | (0.39 | ) |
| | 2013 - C(j) | | | 10.00 | | | | (0.06 | ) | | | 1.21 | | | | 1.15 | | | | — | | | | (0.39 | ) | | | (0.39 | ) |
| | 2013 - Institutional(j) | | | 10.00 | | | | (0.01 | ) | | | 1.24 | | | | 1.23 | | | | — | | | | (0.39 | ) | | | (0.39 | ) |
| | 2013 - Investor(j) | | | 10.00 | | | | (0.05 | ) | | | 1.27 | | | | 1.22 | | | | — | | | | (0.39 | ) | | | (0.39 | ) |
| | 2013 - R(j) | | | 10.00 | | | | (0.06 | ) | | | 1.24 | | | | 1.18 | | | | — | | | | (0.39 | ) | | | (0.39 | ) |
| | (a) | | Calculated based on the average shares outstanding methodology. |
| | (b) | | Assumes investment at the NAV at the beginning of the period, reinvestment of all dividends and distributions, a complete redemption of the investment at the net asset value at the end of the period and no sales or redemption charges. Total returns would be reduced if a sales or redemption charge was taken into account. Returns do not reflect the deduction of taxes to shareholders relating to Fund distributions or the redemption of Fund shares. Total returns for periods less than one full year are not annualized. |
| | (c) | | Current and deferred tax expense/ (benefit) for the ratio calculation is derived from net investment income (loss), and realized and unrealized gains (losses). |
| | (d) | | Current and deferred tax benefit for the ratio calculation is derived from net investment income (loss) only. |
| | (e) | | The Fund’s portfolio turnover rate is calculated in accordance with regulatory requirements, without regard to transactions involving short term investments and certain derivatives. If such transactions were included, the Fund’s portfolio turnover rate may be higher. |
| | (f) | | Amount is less than $0.005 per share. |
| | (g) | | Annualized with the exception of tax expenses. |
| | (h) | | Commenced operations on April 16, 2018. |
| | (i) | | Commenced operations on April 2, 2018. |
| | (j) | | Commenced operations on March 28, 2013. |
| | |
| 14 | | The accompanying notes are an integral part of these financial statements. |
GOLDMAN SACHS MLP ENERGY INFRASTRUCTURE FUND
| | | | | | | | | | | | | | | | | | | | | | | | | | | | | | | | | | | | | | | | | | | | | | | | | | | | | | | | | | | | | | | | | | |
| | | | | | | | | | | | | | | | Ratio of Expenses
to Average Net Assets | | | | | Ratio of Investment Income
(Loss) to Average Net Assets | | | |
| | | Net asset
value, end
of period | | | | | Total
return(b) | | | Net assets,
end of
period
(in 000s) | | | | | After expense
reimbursements
and tax
benefit/
(expense)(c) | | | | | Before expense
reimbursements
and after
tax benefit/
(expense)(c) | | | | | Net of expense
reimbursements
and before
tax benefit/
(expense) | | | | | Before expense
reimbursements
and tax benefit/
(expense) | | | | | | | | After expense
reimbursements
and
tax benefit/
(expense)(d) | | | | | Net of expense
reimbursements
and before tax
benefit/
(expense) | | | | | Before expense
reimbursements
and tax benefit/
(expenses) | | | | | Portfolio
turnover
rate(e) | |
| | | | | | | | | | | | | | | | | | | | | | | | | | | | | | | | | | | | | | | | | | | | | | | | | | | | | | | | | | | | | | | | | | |
| | $ | 7.15 | | | | | | 8.30 | % | | $ | 106,562 | | | | | | 1.74 | %(g) | | | | | 1.74 | %(g) | | | | | 1.41 | %(g) | | | | | 1.41 | %(g) | | | | | | | | | (0.33 | )%(g) | | | | | (0.30 | )%(g) | | | | | (0.30 | )%(g) | | | | | 18 | % |
| | | 6.84 | | | | | | 8.02 | | | | 114,247 | | | | | | 2.49 | (g) | | | | | 2.49 | (g) | | | | | 2.16 | (g) | | | | | 2.16 | (g) | | | | | | | | | (1.08 | )(g) | | | | | (1.05 | )(g) | | | | | (1.05 | )(g) | | | | | 18 | |
| | | 7.32 | | | | | | 8.56 | | | | 2,146,814 | | | | | | 1.34 | (g) | | | | | 1.34 | (g) | | | | | 1.01 | (g) | | | | | 1.01 | (g) | | | | | | | | | 0.07 | (g) | | | | | 0.10 | (g) | | | | | 0.10 | (g) | | | | | 18 | |
| | | 7.26 | | | | | | 8.48 | | | | 151,411 | | | | | | 1.49 | (g) | | | | | 1.49 | (g) | | | | | 1.16 | (g) | | | | | 1.16 | (g) | | | | | | | | | (0.07 | )(g) | | | | | (0.04 | )(g) | | | | | (0.04 | )(g) | | | | | 18 | |
| | | 7.33 | | | | | | 6.89 | | | | 42,479 | | | | | | 0.81 | (g) | | | | | 0.81 | (g) | | | | | 0.88 | (g) | | | | | 0.88 | (g) | | | | | | | | | (0.75 | )(g) | | | | | (0.74 | )(g) | | | | | (0.74 | )(g) | | | | | 18 | |
| | | 7.04 | | | | | | 8.26 | | | | 2,381 | | | | | | 1.98 | (g) | | | | | 1.98 | (g) | | | | | 1.65 | (g) | | | | | 1.65 | (g) | | | | | | | | | (0.57 | )(g) | | | | | (0.54 | )(g) | | | | | (0.54 | )(g) | | | | | 18 | |
| | | 7.32 | | | | | | 15.54 | | | | 41,244 | | | | | | 0.87 | (g) | | | | | 0.87 | (g) | | | | | 0.95 | (g) | | | | | 0.95 | (g) | | | | | | | | | 0.56 | (g) | | | | | 0.57 | (g) | | | | | 0.57 | (g) | | | | | 18 | |
| | | | | | | | | | | | | | | | | | | | | | | | | | | | | | | | | | | | | | | | | | | | | | | | | | | | | | | | | | | | | | | | | | |
| | | | | | | | | | | | | | | | | | | | | | | | | | | | | | | | | | | | | | | | | | | | | | | | | | | | | | | | | | | | | | | | | | |
| | | 6.80 | | | | | | (8.35 | ) | | | 115,467 | | | | | | 1.52 | | | | | | 1.52 | | | | | | 1.42 | | | | | | 1.42 | | | | | | | | | | (0.85 | ) | | | | | (0.85 | ) | | | | | (0.85 | ) | | | | | 42 | |
| | | 6.54 | | | | | | (9.15 | ) | | | 124,291 | | | | | | 2.28 | | | | | | 2.28 | | | | | | 2.17 | | | | | | 2.17 | | | | | | | | | | (1.60 | ) | | | | | (1.59 | ) | | | | | (1.59 | ) | | | | | 42 | |
| | | 6.95 | | | | | | (8.21 | ) | | | 1,711,829 | | | | | | 1.14 | | | | | | 1.14 | | | | | | 1.03 | | | | | | 1.03 | | | | | | | | | | (0.42 | ) | | | | | (0.41 | ) | | | | | (0.41 | ) | | | | | 42 | |
| | | 6.90 | | | | | | (8.26 | ) | | | 156,974 | | | | | | 1.29 | | | | | | 1.29 | | | | | | 1.17 | | | | | | 1.17 | | | | | | | | | | (0.63 | ) | | | | | (0.61 | ) | | | | | (0.61 | ) | | | | | 42 | |
| | | 6.71 | | | | | | (8.83 | ) | | | 2,009 | | | | | | 1.77 | | | | | | 1.77 | | | | | | 1.68 | | | | | | 1.68 | | | | | | | | | | (1.06 | ) | | | | | (1.07 | ) | | | | | (1.07 | ) | | | | | 42 | |
| | | 7.88 | | | | | | 10.23 | | | | 289,689 | | | | | | 1.45 | | | | | | 1.45 | | | | | | 1.45 | | | | | | 1.45 | | | | | | | | | | (0.87 | ) | | | | | (0.87 | ) | | | | | (0.88 | ) | | | | | 104 | |
| | | 7.65 | | | | | | 9.49 | | | | 170,575 | | | | | | 2.20 | | | | | | 2.21 | | | | | | 2.20 | | | | | | 2.21 | | | | | | | | | | (1.63 | ) | | | | | (1.63 | ) | | | | | (1.63 | ) | | | | | 104 | |
| | | 8.02 | | | | | | 10.92 | | | | 1,830,614 | | | | | | 1.05 | | | | | | 1.05 | | | | | | 1.05 | | | | | | 1.05 | | | | | | | | | | (0.69 | ) | | | | | (0.69 | ) | | | | | (0.69 | ) | | | | | 104 | |
| | | 7.97 | | | | | | 10.69 | | | | 121,705 | | | | | | 1.20 | | | | | | 1.20 | | | | | | 1.20 | | | | | | 1.20 | | | | | | | | | | (0.60 | ) | | | | | (0.60 | ) | | | | | (0.61 | ) | | | | | 104 | |
| | | 7.81 | | | | | | 10.18 | | | | 2,026 | | | | | | 1.70 | | | | | | 1.70 | | | | | | 1.70 | | | | | | 1.70 | | | | | | | | | | (1.23 | ) | | | | | (1.23 | ) | | | | | (1.24 | ) | | | | | 104 | |
| | | 7.62 | | | | | | (33.27 | ) | | | 292,686 | | | | | | (0.38 | ) | | | | | (0.38 | ) | | | | | 1.42 | | | | | | 1.42 | | | | | | | | | | (0.57 | ) | | | | | (0.53 | ) | | | | | (0.54 | ) | | | | | 96 | |
| | | 7.46 | | | | | | (33.79 | ) | | | 173,427 | | | | | | 0.37 | | | | | | 0.38 | | | | | | 2.17 | | | | | | 2.18 | | | | | | | | | | (1.27 | ) | | | | | (1.23 | ) | | | | | (1.23 | ) | | | | | 96 | |
| | | 7.70 | | | | | | (33.05 | ) | | | 1,225,024 | | | | | | (0.78 | ) | | | | | (0.78 | ) | | | | | 1.02 | | | | | | 1.02 | | | | | | | | | | (0.10 | ) | | | | | (0.06 | ) | | | | | (0.06 | ) | | | | | 96 | |
| | | 7.67 | | | | | | (33.13 | ) | | | 95,825 | | | | | | (0.63 | ) | | | | | (0.63 | ) | | | | | 1.17 | | | | | | 1.17 | | | | | | | | | | (0.32 | ) | | | | | (0.28 | ) | | | | | (0.28 | ) | | | | | 96 | |
| | | 7.56 | | | | | | (33.50 | ) | | | 1,376 | | | | | | (0.11 | ) | | | | | (0.11 | ) | | | | | 1.69 | | | | | | 1.69 | | | | | | | | | | 1.97 | | | | | | 2.01 | | | | | | 2.01 | | | | | | 96 | |
| | | 11.98 | | | | | | 15.59 | | | | 513,722 | | | | | | 3.57 | | | | | | 3.57 | | | | | | 1.46 | | | | | | 1.46 | | | | | | | | | | (0.56 | ) | | | | | (0.61 | ) | | | | | (0.61 | ) | | | | | 25 | |
| | | 11.83 | | | | | | 14.61 | | | | 241,841 | | | | | | 4.32 | | | | | | 4.32 | | | | | | 2.21 | | | | | | 2.21 | | | | | | | | | | (1.19 | ) | | | | | (1.24 | ) | | | | | (1.24 | ) | | | | | 25 | |
| | | 12.06 | | | | | | 15.91 | | | | 1,613,322 | | | | | | 3.17 | | | | | | 3.17 | | | | | | 1.06 | | | | | | 1.06 | | | | | | | | | | (0.06 | ) | | | | | (0.11 | ) | | | | | (0.11 | ) | | | | | 25 | |
| | | 12.04 | | | | | | 15.73 | | | | 178,966 | | | | | | 3.32 | | | | | | 3.32 | | | | | | 1.21 | | | | | | 1.21 | | | | | | | | | | (0.10 | ) | | | | | (0.15 | ) | | | | | (0.15 | ) | | | | | 25 | |
| | | 11.93 | | | | | | 15.23 | | | | 96 | | | | | | 3.82 | | | | | | 3.84 | | | | | | 1.71 | | | | | | 1.73 | | | | | | | | | | (0.89 | ) | | | | | (0.93 | ) | | | | | (0.95 | ) | | | | | 25 | |
| | | | | | | | | | | | | | | | | | | | | | | | | | | | | | | | | | | | | | | | | | | | | | | | | | | | | | | | | | | | | | | | | | |
| | | | | | | | | | | | | | | | | | | | | | | | | | | | | | | | | | | | | | | | | | | | | | | | | | | | | | | | | | | | | | | | | | |
| | | 10.81 | | | | | | 12.12 | | | | 51,363 | | | | | | 9.36 | (g) | | | | | 9.71 | (g) | | | | | 1.51 | (g) | | | | | 1.86 | (g) | | | | | | | | | (1.00 | )(g) | | | | | (1.23 | )(g) | | | | | (1.63 | )(g) | | | | | 96 | |
| | | 10.76 | | | | | | 11.71 | | | | 20,112 | | | | | | 10.11 | (g) | | | | | 10.45 | (g) | | | | | 2.26 | (g) | | | | | 2.60 | (g) | | | | | | | | | (0.90 | )(g) | | | | | (1.14 | )(g) | | | | | (1.54 | )(g) | | | | | 96 | |
| | | 10.84 | | | | | | 12.53 | | | | 206,886 | | | | | | 8.95 | (g) | | | | | 9.50 | (g) | | | | | 1.11 | (g) | | | | | 1.66 | (g) | | | | | | | | | (0.17 | )(g) | | | | | (0.40 | )(g) | | | | | (1.03 | )(g) | | | | | 96 | |
| | | 10.83 | | | | | | 12.42 | | | | 12,229 | | | | | | 9.11 | (g) | | | | | 9.49 | (g) | | | | | 1.26 | (g) | | | | | 1.64 | (g) | | | | | | | | | (0.72 | )(g) | | | | | (0.96 | )(g) | | | | | (1.39 | )(g) | | | | | 96 | |
| | | 10.79 | | | | | | 12.02 | | | | 32 | | | | | | 9.59 | (g) | | | | | 10.13 | (g) | | | | | 1.75 | (g) | | | | | 2.29 | (g) | | | | | | | | | (0.86 | )(g) | | | | | (1.09 | )(g) | | | | | (1.71 | )(g) | | | | | 96 | |
| | |
| The accompanying notes are an integral part of these financial statements. | | 15 |
GOLDMAN SACHS MLP ENERGY INFRASTRUCTURE FUND
Notes to Financial Statements
May 31, 2018 (Unaudited)
Goldman Sachs Trust (the “Trust”) is a Delaware statutory trust registered under the Investment Company Act of 1940, as amended (the “Act”), as an open-end management investment company. The Trust includes the Goldman Sachs MLP Energy Infrastructure Fund (the “Fund”). The Fund is a non-diversified portfolio under the Act offering seven classes of shares — Class A, Class C, Institutional, Investor, Class P (commenced operations on April 16, 2018), Class R and Class R6 (commenced operations on April 2, 2018) Shares.
Class A Shares are sold with a front-end sales charge of up to 5.50%. Class C Shares are sold with contingent deferred sales charge (“CDSC”) of 1.00%, which is imposed on redemptions made within 12 months of purchase. Institutional, Investor, Class P, Class R and Class R6 Shares are not subject to a sales charge.
Goldman Sachs Asset Management, L.P. (“GSAM”), an affiliate of Goldman Sachs & Co. LLC (“Goldman Sachs”), serves as investment adviser to the Fund pursuant to a management agreement (the “Agreement”) with the Trust.
|
| 2. SIGNIFICANT ACCOUNTING POLICIES |
The financial statements have been prepared in accordance with accounting principles generally accepted in the United States of America (“GAAP”) and require management to make estimates and assumptions that may affect the reported amounts and disclosures. Actual results may differ from those estimates and assumptions.
A. Investment Valuation — The Fund’s valuation policy is to value investments at fair value.
B. Investment Income and Investments — Investment income includes interest income and dividend income. Interest income is accrued daily and adjusted for amortization of premiums and accretion of discounts. Dividend income is recognized on ex-dividend date or, for certain foreign securities, as soon as such information is obtained subsequent to the ex-dividend date. Investment transactions are reflected on trade date. Realized gains and losses are calculated using identified cost. Investment transactions are recorded on the following business day for daily net asset value (“NAV”) calculations. Investment income is recorded net of any foreign withholding taxes, less any amounts reclaimable. Distributions from master limited partnerships (“MLPs”) are generally recorded based on the characterization reported on the Fund’s schedule K-1 received from the MLPs. The Fund records its pro-rata share of the income/loss and capital gains/losses, allocated from the underlying partnerships and adjusts the cost basis of the underlying partnerships accordingly.
C. Class Allocations and Expenses — Investment income, realized and unrealized gain (loss), if any, and non-class specific expenses of the Fund are allocated daily based upon the proportion of net assets of each class. Non-class specific expenses directly incurred by the Fund are charged to the Fund, while such expenses incurred by the Trust are allocated across the applicable Funds on a straight-line and/or pro-rata basis depending upon the nature of the expenses. Class specific expenses, where applicable, are borne by the respective share classes and include Distribution and Service, Transfer Agency and Service and Shareholder Administration fees.
D. Distributions to Shareholders — Over the long term, the Fund makes distributions to its shareholders each fiscal quarter at a rate that is approximately equal to the distributions the Fund receives from the MLPs and other securities in which it invests. To permit the Fund to maintain more stable quarterly distributions, the distribution for any particular quarterly period may be more or less than the amount of total investment income actually earned by the Fund. The Fund estimates that only a portion of the distributions paid to shareholders will be treated as income. The remaining portion of the Fund’s distribution, which may be significant, is expected to be a return of capital. These estimates are based on the Fund’s operating results during the period, and their final federal income tax characterization may differ.
The characterization of distributions to shareholders for financial reporting purposes is determined in accordance with federal income tax rules, which may differ from GAAP. Certain components of the Fund’s net assets on the Statement of Assets and Liabilities reflect permanent GAAP/Tax differences based on the appropriate tax character.
E. Income Taxes — The Fund does not intend to qualify as a regulated investment company pursuant to Subchapter M of the Internal Revenue Code of 1986, as amended, but will rather be taxed as a corporation. As a result, the Fund is obligated to pay
16
GOLDMAN SACHS MLP ENERGY INFRASTRUCTURE FUND
|
| 2. SIGNIFICANT ACCOUNTING POLICIES (continued) |
federal, state and local income tax on its taxable income. The Fund invests primarily in MLPs, which generally are treated as partnerships for federal income tax purposes. As a limited partner in the MLPs, the Fund must report its allocable share of the MLPs’ taxable income or loss in computing its own taxable income or loss. The Fund’s tax expense or benefit is included in the Statement of Operations based on the component of income or gains/losses to which such expense or benefit relates. Deferred income taxes reflect the net tax effects of temporary differences between the carrying amounts of assets and liabilities for financial reporting purposes and the amounts used for income tax purposes. Such temporary differences are principally: (i) taxes on unrealized gains/losses, which are attributable to the temporary difference between fair market value and tax basis, (ii) the net tax effects of temporary differences between the carrying amounts of assets and liabilities for financial reporting and income tax purposes, and (iii) the net tax benefit of accumulated net operating losses and capital loss carryforwards. The Fund will accrue a deferred income tax liability balance, at the currently effective statutory United States (“U.S.”) federal income tax rate plus an estimated state and local income tax rate, for its future tax liability associated with the capital appreciation of its investments and the distributions received by the Fund on interests of MLPs considered to be return of capital and for any net operating gains. The Fund may also record a deferred tax asset balance, which reflects an estimate of the Fund’s future tax benefit associated with net operating losses and/or unrealized losses.
To the extent the Fund has a deferred tax asset, consideration is given to whether or not a valuation allowance, which would offset the value of some or all of the deferred tax asset balance, is required. A valuation allowance is required if based on the evaluation criterion provided by Accounting Standards Codification (“ASC”) 740, Income Taxes (ASC 740) it is more likely than not that some portion, or all, of the deferred tax asset will not be realized. The factors considered in assessing the Fund’s valuation allowance include: the nature, frequency and severity of current and cumulative losses, the duration of the statutory carryforward periods and the associated risks that operating and capital loss carryforwards may expire unutilized. From time to time, as new information becomes available, the Fund will modify its estimates or assumptions regarding the deferred tax liability or asset. Unexpected significant decreases in cash distributions from the Fund’s MLP investments or significant declines in the fair value of its investments may change the Fund’s assessment regarding the recoverability of their deferred tax assets and may result in a valuation allowance. If a valuation allowance is required to reduce any deferred tax asset in the future, it could have a material impact on the Fund’s NAV and results of operations in the period it is recorded. The Fund will rely to some extent on information provided by the MLPs, which may not be provided to the Fund on a timely basis, to estimate operating income/loss and gains/losses and current taxes and deferred tax liabilities and/or asset balances for purposes of daily reporting of NAVs and financial statement reporting.
It is the Fund’s policy to classify interest and penalties associated with underpayment of federal and state income taxes, if any, as income tax expense on its Statement of Operations. The Fund anticipates filing income tax returns in the U.S. federal jurisdiction and various states, and such returns are subject to examination by the tax jurisdictions. The Fund has reviewed all major jurisdictions and concluded that there is no significant impact on its net assets and no tax liability resulting from unrecognized tax benefits or expenses relating to uncertain tax positions expected to be taken on its tax returns.
Return of Capital Estimates — Distributions received from the Fund’s investments in MLPs generally are comprised of income and return of capital. The Fund records investment income and return of capital based on estimates made at the time such distributions are received. Such estimates are based on historical information available from each MLP and other industry sources. These estimates may subsequently be revised based on information received from MLPs after their tax reporting periods are concluded.
F. Foreign Currency Translation — The accounting records and reporting currency of the Fund are maintained in U.S. dollars. Assets and liabilities denominated in foreign currencies are translated into U.S. dollars using the current exchange rates at the close of each business day. The effect of changes in foreign currency exchange rates on investments is included within net realized and unrealized gain (loss) on investments. Changes in the value of other assets and liabilities as a result of fluctuations in foreign exchange rates are included in the Statement of Operations within net change in unrealized gain (loss) on foreign currency translations. Transactions denominated in foreign currencies are translated into U.S. dollars on the date the transaction occurred, the effects of which are included within net realized gain (loss) on foreign currency transactions.
17
GOLDMAN SACHS MLP ENERGY INFRASTRUCTURE FUND
Notes to Financial Statements (continued)
May 31, 2018 (Unaudited)
|
| 3. INVESTMENTS AND FAIR VALUE MEASUREMENTS |
The fair value of a financial instrument is the amount that would be received to sell an asset or paid to transfer a liability in an orderly transaction between market participants at the measurement date (i.e., the exit price). GAAP establishes a fair value hierarchy that prioritizes the inputs to valuation techniques used to measure fair value. The hierarchy gives the highest priority to unadjusted quoted prices in active markets for identical assets or liabilities (Level 1 measurements) and the lowest priority to unobservable inputs (Level 3 measurements). The levels used for classifying investments are not necessarily an indication of the risk associated with investing in these investments. The three levels of the fair value hierarchy are described below:
Level 1 — Unadjusted quoted prices in active markets that are accessible at the measurement date for identical, unrestricted assets or liabilities;
Level 2 — Quoted prices in markets that are not active or financial instruments for which significant inputs are observable (including, but not limited to, quoted prices for similar investments, interest rates, foreign exchange rates, volatility and credit spreads), either directly or indirectly;
Level 3 — Prices or valuations that require significant unobservable inputs (including GSAM’s assumptions in determining fair value measurement).
Changes in valuation techniques may result in transfers into or out of an assigned level within the hierarchy. In accordance with the Fund’s policy, transfers between different levels of the fair value hierarchy resulting from such changes are deemed to have occurred as of the beginning of the reporting period.
The Board of Trustees (“Trustees”) has approved Valuation Procedures that govern the valuation of the portfolio investments held by the Fund, including investments for which market quotations are not readily available. The Trustees have delegated to GSAM day-to-day responsibility for implementing and maintaining internal controls and procedures related to the valuation of the Fund’s investments. To assess the continuing appropriateness of pricing sources and methodologies, GSAM regularly performs price verification procedures and issues challenges as necessary to third party pricing vendors or brokers, and any differences are reviewed in accordance with the Valuation Procedures.
A. Level 1 and Level 2 Fair Value Investments — The valuation techniques and significant inputs used in determining the fair values for investments classified as Level 1 and Level 2 are as follows:
Equity Securities — Equity securities traded on a United States (“U.S.”) securities exchange or the NASDAQ system, or those located on certain foreign exchanges, including but not limited to the Americas, are valued daily at their last sale price or official closing price on the principal exchange or system on which they are traded. If there is no sale or official closing price or such price is believed to not represent fair value, equity securities are valued at the last bid price for long positions and at the last ask price for short positions. To the extent these investments are actively traded, they are classified as Level 1 of the fair value hierarchy, otherwise they are generally classified as Level 2.
Unlisted equity securities for which market quotations are available are valued at the last sale price on the valuation date, or if no sale occurs, at the last bid price, and are generally classified as Level 2.
Money Market Funds — Investments in the Goldman Sachs Financial Square Government Fund (“Underlying Fund”) are valued at the NAV of the Institutional Share class on the day of valuation. These investments are generally classified as Level 1 of the fair value hierarchy. For information regarding an Underlying Fund’s accounting policies and investment holdings, please see the Underlying Fund’s shareholder report.
B. Level 3 Fair Value Investments — To the extent that significant inputs to valuation models and other alternative pricing sources are unobservable, or if quotations are not readily available, or if GSAM believes that such quotations do not accurately reflect fair value, the fair value of the Fund’s investments may be determined under Valuation Procedures approved by the Trustees. GSAM, consistent with its procedures and applicable regulatory guidance, may make an adjustment to the most recent valuation prices of either domestic or foreign securities in light of significant events to reflect what it believes to be the fair value of the securities at the time of determining the Fund’s NAV. Significant events which could affect a large number of securities in a particular market may include, but are not limited to: significant fluctuations in U.S. or foreign markets; market dislocations;
18
GOLDMAN SACHS MLP ENERGY INFRASTRUCTURE FUND
|
| 3. INVESTMENTS AND FAIR VALUE MEASUREMENTS (continued) |
market disruptions; or unscheduled market closings. Significant events which could also affect a single issuer may include, but are not limited to: corporate actions such as reorganizations, mergers and buy-outs; ratings downgrades; and bankruptcies.
C. Fair Value Hierarchy — The following is a summary of the Fund’s investments classified in the fair value hierarchy as of May 31, 2018:
| | | | | | | | | | | | |
| | | |
| Investment Type | | Level 1 | | | Level 2 | | | Level 3 | |
| Assets | |
Common Stocks(a) | | | | | | | | | | | | |
North America | | $ | 2,604,045,191 | | | $ | — | | | $ | — | |
Investment Company | | | 16,434 | | | | — | | | | — | |
| Total | | $ | 2,604,061,625 | | | $ | — | | | $ | — | |
| (a) | | Amounts are disclosed by continent to highlight the impact of time zone differences between local market close and the calculation of net asset value. Security valuations are based on the principal exchange or system on which they are traded, which may differ from country of domicile noted in the table. |
For further information regarding security characteristics, see the Schedule of Investments.
The Tax Cuts and Jobs Act (“TCJA”) was signed into law on December 22, 2017. The TCJA includes changes to the corporate income tax rate and alternative minimum tax (“AMT”) and modifications to the net operating loss (“NOL”) deduction. Prior to enactment, the highest marginal federal income tax rate was 35%. The TCJA reduced the corporate rate to a flat income tax rate of 21%. The change in the rate and in any related valuation allowance was reflected in the Fund’s NAV on December 22, 2017. The Fund may also be subject to a 20% AMT to the extent that the Fund’s alternative minimum tax exceeds the Fund’s regular federal income tax. For tax years beginning after December 31, 2017, the TCJA repealed the corporate AMT. The TCJA eliminated the NOL carryback ability and replaced the 20 year carryforward period with an indefinite carryforward period for any NOLs arising in tax years ending after December 31, 2017. The TCJA also established a limitation for any NOLs generated in tax years beginning after December 31, 2017 to the lesser of the aggregate of available NOLs or 80% of taxable income before any NOL utilization.
Total income taxes are computed by applying the federal statutory rate plus a blended state income tax rate. During the six months ended May 31, 2018, the Fund reevaluated its blended state income tax rate, increasing the rate from 1.83% to 2.29% due to anticipated change in state apportionment of income and gains and a reduction of the federal tax benefit associated with state tax expenses due to the new lower corporate tax rates. The reconciliation between the federal statutory income tax rate of 21% and the effective tax rate on net investment income/loss and realized and unrealized gain/loss is as follows:
| | | | | | | | |
Application of statutory income tax rate | | $ | 40,295,935 | | | | 21.00 | % |
State income taxes, net of federal benefit | | | 4,394,176 | | | | 2.29 | % |
Change in estimated deferred tax rate* | | | 103,893,163 | | | | 54.14 | % |
Effect of permanent differences | | | (2,036,183 | ) | | | (1.05 | )% |
Other Adjustments | | | (52,802 | ) | | | (0.03 | )% |
Valuation allowance | | | (139,052,070 | ) | | | (72.47 | )% |
Total current and deferred income tax expense/(benefit), net | | $ | 7,442,219 | | | | 3.88 | % |
| * | | The tax rate change listed in the table above is reflective of the change in deferred tax assets and liabilities due to the federal corporate tax rate change enacted by the TCJA as of December 22, 2017 (date of enactment). For tax years beginning after December 31, 2017, corporations will be taxed at a flat rate of 21%. The tax rate change also incorporates adjustments in state tax rates, net of federal tax benefit associated with change in tax rates. |
19
GOLDMAN SACHS MLP ENERGY INFRASTRUCTURE FUND
Notes to Financial Statements (continued)
May 31, 2018 (Unaudited)
At May 31, 2018, components of the Fund’s deferred tax assets and liabilities are as follows:
| | | | |
| Deferred tax assets: | | | | |
Net operating loss carryforward | | $ | 45,438,349 | |
Capital loss carryforward (tax basis) | | | 168,188,648 | |
Other tax assets | | | 204,298 | |
Valuation Allowance | | | (146,501,794 | ) |
Total Deferred Tax Assets | | $ | 67,329,501 | |
| Deferred tax liabilities: | | | | |
Net Unrealized gain on investment securities | | $ | (19,038,219 | ) |
Book vs tax partnership income to be recognized | | | (58,448,451 | ) |
Total Deferred Tax Liabilities | | $ | (77,486,670 | ) |
Net Deferred Tax Asset/(Liability) | | $ | (10,157,169 | ) |
At May 31, 2018, the Fund had net operating loss carryforwards, subject to expiration and limitation based on the fiscal year generated, as follows:
| | | | | | | | |
| For Fiscal Year Ended | | Amount | | | Expiration | |
November 30, 2016 | | $ | 4,592,083 | | | | November 30, 2036 | |
November 30, 2017 | | $ | 96,145,242 | | | | November 30, 2037 | |
November 30, 2018 | | $ | 94,360,781 | | | | Indefinite | |
At May 31, 2018, the Fund had capital loss carryforwards, subject to expiration and limitation based on the fiscal year generated, as follows:
| | | | | | | | |
| For Fiscal Year Ended | | Amount | | | Expiration | |
November 30, 2015 | | $ | 418,877,710 | | | | November 30, 2020 | |
November 30, 2016 | | $ | 288,032,916 | | | | November 30, 2021 | |
November 30, 2018 | | $ | 15,238,999 | | | | November 30, 2023 | |
The Fund reviews the recoverability of its deferred tax assets based upon the weight of the available evidence. When assessing, the Fund’s management considers available carrybacks, reversing temporary taxable differences, and tax planning, if any. As a result of its analysis of the recoverability of its deferred tax assets, the Fund recorded $146,501,794 of valuation allowances as of May 31, 2018.
For the six months ended May 31, 2018, components of the Fund’s current and deferred tax expense/(benefit) are as follows:
| | | | | | | | | | | | |
| | | Current | | | Deferred | | | Total | |
Federal | | $ | — | | | $ | 145,834,633 | | | $ | 145,834,633 | |
State | | | — | | | | 659,655 | | | | 659,655 | |
Valuation Allowance | | | — | | | | (139,052,069 | ) | | | (139,052,069 | ) |
| Total | | $ | — | | | $ | 7,442,219 | | | $ | 7,442,219 | |
20
GOLDMAN SACHS MLP ENERGY INFRASTRUCTURE FUND
For the six months ended May 31, 2018, the Fund paid $15,281 of penalties associated with the underpayment of income taxes. At May 31, 2018, gross unrealized appreciation and depreciation of investments, based on cost, for federal income tax purposes was as follows:
| | | | |
Tax Cost | | $ | 2,271,192,634 | |
Gross unrealized gain | | | 445,923,086 | |
Gross unrealized loss | | | (113,054,095 | ) |
Net unrealized security gain | | | 332,868,991 | |
For the six months ended May 31, 2018, the Fund distributions are estimated to be comprised of 100% return of capital. Shareholders will be informed of the final tax characterization of the distributions in February 2019. The Fund’s tax years ended November 30, 2014 through November 30, 2017 remain open for examination by U.S. and state tax authorities. Management of the Fund is not aware of any tax positions for which it is reasonably possible that the total amounts of unrecognized tax benefits or expenses will significantly change in the next 12 months.
|
| 5. AGREEMENTS AND AFFILIATED TRANSACTIONS |
A. Management Agreement — Under the Agreement, GSAM manages the Fund, subject to the general supervision of the Trustees.
As compensation for the services rendered pursuant to the Agreement, the assumption of the expenses related thereto and administration of the Fund’s business affairs, including providing facilities, GSAM is entitled to a management fee, accrued daily and paid monthly, equal to an annual percentage rate of the Fund’s average daily net assets. For the six months ended May 31, 2018, contractual and effective net management fees with GSAM were at the following rates:
| | | | | | | | | | | | | | | | | | | | | | |
| Contractual Management Rate | | | | |
First $1 billion | | | Next $1 billion | | | Next $3 billion | | | Next $3 billion | | | Over $8 billion | | | Effective Net Management Rate^ | |
| | 1.00% | | | | 0.90% | | | | 0.86% | | | | 0.84% | | | | 0.82% | | | | 0.94% | |
| ^ | | Effective Net Management Rate includes the impact of management fee waivers of affiliated Underlying Funds, if any. |
The Fund invests in Institutional Shares of the Goldman Sachs Financial Square Government Fund, which is an affiliated Underlying Fund. GSAM has agreed to waive a portion of its management fee payable by the Fund in an amount equal to the management fee it earns as an investment adviser to the affiliated Underlying Fund in which the Fund invests. For the six months ended May 31, 2018, GSAM waived $1,979 of the Fund’s management fee.
B. Distribution and/or Service (12b-1) Plans — The Trust, on behalf of Class A and Class R Shares of the Fund, has adopted Distribution and Service Plans subject to Rule 12b-1 under the Act. Under the Distribution and Service Plans, Goldman Sachs, which serves as distributor (the “Distributor”), is entitled to a fee accrued daily and paid monthly for distribution services and personal and account maintenance services, which may then be paid by Goldman Sachs to authorized dealers. These fees are equal to an annual percentage rate of the average daily net assets attributable to Class A or Class R Shares of the Fund, as set forth below.
The Trust, on behalf of Class C Shares of the Fund, has adopted a Distribution Plan subject to Rule 12b-1 under the Act. Under the Distribution Plan, Goldman Sachs as Distributor is entitled to a fee accrued daily and paid monthly for distribution services, which may then be paid by Goldman Sachs to authorized dealers. These fees are equal to an annual percentage rate of the average daily net assets attributable to Class C Shares of the Fund, as set forth below.
21
GOLDMAN SACHS MLP ENERGY INFRASTRUCTURE FUND
Notes to Financial Statements (continued)
May 31, 2018 (Unaudited)
|
| 5. AGREEMENTS AND AFFILIATED TRANSACTIONS (continued) |
| | | | | | | | | | | | |
| | | Distribution and/or Service Plan Rates | |
| | | Class A* | | | Class C | | | Class R* | |
Distribution and/or Service Plan | | | 0.25 | % | | | 0.75 | % | | | 0.50 | % |
| * | | With respect to Class A and Class R Shares, the Distributor at its discretion may use compensation for distribution services paid under the Distribution Plan to compensate service organizations for personal and account maintenance services and expenses as long as such total compensation does not exceed the maximum cap on “service fees” imposed by the Financial Industry Regulatory Authority. |
C. Distribution Agreement — Goldman Sachs, as Distributor of the shares of the Fund pursuant to a Distribution Agreement, may retain a portion of the Class A Shares’ front end sales charge and Class C Shares’ CDSC. For the six months ended May 31, 2018, Goldman Sachs advised that it retained $16,087 and $0 of the sales charges applicable to Class A and Class C Shares, respectively.
D. Service Plan — The Trust, on behalf of the Fund, has adopted a Service Plan to allow Class C Shares to compensate service organizations (including Goldman Sachs) for providing varying levels of personal and account maintenance services to their customers who are beneficial owners of such shares. The Service Plan provides for compensation to the service organizations equal to an annual percentage rate of 0.25% of the average daily net assets attributable to Class C Shares of the Fund.
E. Transfer Agency Agreement — Goldman Sachs also serves as the transfer agent of the Fund for a fee pursuant to the Transfer Agency Agreement. The fees charged for such transfer agency services are accrued daily and paid monthly at annual rates as follows: 0.18% of the average daily net assets of Class A, Class C, Investor and Class R Shares; 0.03% of the average daily net assets of Class P and Class R6 Shares; and 0.04% of the average daily net assets of Institutional Shares.
F. Other Expense Agreements and Affiliated Transactions — GSAM has agreed to limit certain “Other Expenses” of the Fund (excluding acquired fund fees and expenses, transfer agency fees and expenses, service fees and shareholder administration fees (as applicable), taxes, interest, brokerage fees, expenses of shareholder meetings, litigation and indemnification, and extraordinary expenses) to the extent such expenses exceed, on an annual basis, a percentage rate of the average daily net assets of the Fund. Such Other Expense reimbursements, if any, are accrued daily and paid monthly. In addition, the Fund is not obligated to reimburse GSAM for prior fiscal year expense reimbursements, if any. The Other Expense limitations as an annual percentage rate of average daily net assets for the Fund is 0.064%. These Other Expense limitations will remain in place through at least March 30, 2019 for Class A, Class C, Institutional, Investor, Class R and Class R6 Shares, and through at least April 16, 2019 for Class P Shares, and prior to such dates GSAM may not terminate the arrangements without the approval of the Trustees. In addition, the Fund has entered into certain offset arrangements with the transfer agent, which may result in a reduction of the Fund’s expenses and are received irrespective of the application of the “Other Expense” limitations described above. Such Other Expense reimbursements, if any, are accrued daily and paid monthly and are disclosed in the Statement of Operations for the six months ended May 31, 2018. For the six months ended May 31, 2018, these expense reductions, including any fee waivers and Other Expense reimbursements, were $0.
G. Line of Credit Facility — As of May 31, 2018, the Fund participated in a $770,000,000 committed, unsecured revolving line of credit facility (the “facility”) together with other funds of the Trust and registered investment companies having management agreements with GSAM or its affiliates (“Other Borrowers”). This facility is to be used for temporary or emergency purposes, or to allow for an orderly liquidation of securities to meet redemption requests. The interest rate on borrowings is based on the federal funds rate. The facility also requires a fee to be paid by the Fund based on the amount of the commitment that has not been utilized. For the six months ended May 31, 2018, the Fund did not have any borrowings under the facility. Prior to May 1, 2018, the facility was $1,100,000,000. The facility was decreased to $770,000,000 effective May 1, 2018.
H. Other Transactions with Affiliates — For the six months ended May 31, 2018, Goldman Sachs did not earn any brokerage commissions from portfolio transactions on behalf of the Fund.
22
GOLDMAN SACHS MLP ENERGY INFRASTRUCTURE FUND
|
| 5. AGREEMENTS AND AFFILIATED TRANSACTIONS (continued) |
The table below shows the transactions in and earnings from investments in all affiliated funds as of and for the six months ended May 31, 2018:
| | | | | | | | | | | | | | | | | | | | | | | | |
| Underlying Fund | | Beginning
Value as of
November 30, 2017 | | | Purchases
at Cost | | | Proceeds
from Sales | | | Ending
Value as of
May 31, 2018 | | | Shares as of
May 31, 2018 | | | Dividend
Income | |
Goldman Sachs Financial Square Government Fund —Institutional Shares | | $ | 146 | | | $ | 115,610,581 | | | $ | (115,594,293 | ) | | $ | 16,434 | | | | 16,434 | | | $ | 20,049 | |
|
| 6. PORTFOLIO SECURITIES TRANSACTIONS |
The cost of purchases and proceeds from sales and maturities of long-term securities for the six months ended May 31, 2018 were $795,217,968 and $414,524,291, respectively.
The Fund’s risks include, but are not limited to, the following:
Foreign Countries Risk — Investing in foreign markets may involve special risks and considerations not typically associated with investing in the United States. Foreign securities may be subject to risk of loss because of more or less foreign government regulation, less public information and less economic, political and social stability in the countries in which the Fund invests. The imposition of exchange controls (including repatriation restrictions), confiscations, trade restrictions (including tariffs) and other government restrictions by the United States or other governments, or from problems in share registration, settlement or custody, may also result in losses. Foreign risk also involves the risk of negative foreign currency rate fluctuations, which may cause the value of securities denominated in such foreign currency (or other instruments through which the Fund has exposure to foreign currencies) to decline in value. Currency exchange rates may fluctuate significantly over short periods of time.
Foreign Custody Risk — If the Fund invests in foreign securities may hold such securities and cash with foreign banks, agents, and securities depositories appointed by the Fund’s custodian (each a “Foreign Custodian”). Some foreign custodians may be recently organized or new to the foreign custody business. In some countries, Foreign Custodians may be subject to little or no regulatory oversight over, or independent evaluation of, their operations. Further, the laws of certain countries may place limitations on the Fund’s ability to recover its assets if a Foreign Custodian enters into bankruptcy.
Geographic and Sector Risk — The Fund focuses its investments in the energy sector, and will therefore be susceptible to adverse economic, environmental, business, regulatory or other occurrences affecting that sector. The energy sector has historically experienced substantial price volatility. MLPs and other companies operating in the energy sector are subject to specific risks, including, among others, fluctuations in commodity prices; reduced consumer demand for commodities such as oil, natural gas or petroleum products; reduced availability of natural gas or other commodities for transporting, processing, storing or delivering; slowdowns in new construction; extreme weather or other natural disasters; and threats of attack by terrorists on energy assets. Additionally, changes in the regulatory environment for energy companies may adversely impact their profitability. Over time, depletion of natural gas reserves and other energy reserves may also affect the profitability of energy companies.
Investments in Other Investment Companies — As a shareholder of another investment company, the Fund will indirectly bear its proportionate share of any net management fees and other expenses paid by such other investment companies, in addition to the fees and expenses regularly borne by the Fund.
Large Shareholder Transactions Risk — The Fund may experience adverse effects when certain large shareholders, such as other funds, institutional investors (including those trading by use of non-discretionary mathematical formulas), financial intermediaries (who may make investment decisions on behalf of underlying clients and/or include the Fund in their investment
23
GOLDMAN SACHS MLP ENERGY INFRASTRUCTURE FUND
Notes to Financial Statements (continued)
May 31, 2018 (Unaudited)
|
| 7. OTHER RISKS (continued) |
model), individuals, accounts and Goldman Sachs affiliates, purchase or redeem large amounts of shares of the Fund. Such large shareholder redemptions may cause the Fund to sell portfolio securities at times when it would not otherwise do so, which may negatively impact the Fund’s NAV and liquidity. These transactions may also accelerate the realization of taxable income to shareholders if such sales of investments resulted in gains, and may also increase transaction costs. In addition, a large redemption could result in the Fund’s current expenses being allocated over a smaller asset base, leading to an increase in the Fund’s expense ratio. Similarly, large Fund share purchases may adversely affect the Fund’s performance to the extent that the Fund is delayed in investing new cash and is required to maintain a larger cash position than it ordinarily would.
Liquidity Risk — The Fund may make investments that are illiquid or that may become less liquid in response to market developments or adverse investor perceptions. Illiquid investments may be more difficult to value. Liquidity risk may also refer to the risk that the Fund will not be able to pay redemption proceeds within the allowable time period because of unusual market conditions, an unusually high volume of redemption requests, or other reasons. To meet redemption requests, the Fund may be forced to sell investments at an unfavorable time and/or under unfavorable conditions.
Market and Credit Risks — In the normal course of business, the Fund trades financial instruments and enters into financial transactions where risk of potential loss exists due to changes in the market (market risk). Additionally, the Fund may also be exposed to credit risk in the event that an issuer or guarantor fails to perform or that an institution or entity with which the Fund has unsettled or open transactions defaults.
Master Limited Partnership Risk — Investments in securities of MLPs involve risks that differ from investments in common stocks, including risks related to limited control and limited rights to vote on matters affecting the MLP, risks related to potential conflicts of interest between the MLP and the MLP’s general partner, cash flow risks, dilution risks, limited liquidity and risks related to the general partner’s right to require unit-holders to sell their common units at an undesirable time or price.
Non-Diversification Risk — The Fund is non-diversified, meaning that it is permitted to invest a larger percentage of its assets in fewer issuers than diversified mutual funds. Thus, the Fund may be more susceptible to adverse developments affecting any single issuer held in its portfolio, and may be more susceptible to greater losses because of these developments.
Strategy Risk — The Fund’s strategy of investing primarily in MLPs, resulting in its being taxed as a corporation, or a “C” corporation, rather than as a regulated investment company for U.S. federal income tax purposes, is a relatively new investment strategy for funds. This strategy involves complicated accounting, tax and valuation issues. Volatility in the NAV may be experienced because of the use of estimates at various times during a given year that may result in unexpected and potentially significant consequences for the Fund and its shareholders.
Tax Risk — Tax risks associated with investments in the Fund include but are not limited to the following:
Fund Structure Risk. Unlike traditional mutual funds that are structured as regulated investment companies for U.S. federal income tax purposes, the Fund will be taxable as a regular corporation, or “C” corporation, for U.S. federal income tax purposes. This means the Fund generally will be subject to U.S. federal income tax on its taxable income at the rates applicable to corporations, and will also be subject to state and local income taxes.
MLP Tax Risk. MLPs are generally treated as partnerships for U.S. federal income tax purposes. Partnerships do not pay U.S. federal income tax at the partnership level. Rather, each partner is allocated a share of the partnership’s income, gains, losses, deductions and expenses. A change in current tax law or a change in the underlying business mix of a given MLP could result in an MLP being treated as a corporation for U.S. federal income tax purposes, which would result in the MLP being required to pay U.S. federal income tax (as well as state and local income taxes) on its taxable income. This would have the effect of reducing the amount of cash available for distribution by the MLP and could result in a reduction in the value of the Fund’s investment in the MLP and lower income to the Fund.
To the extent a distribution received by the Fund from an MLP is treated as a return of capital, the Fund’s adjusted tax basis in the interests of the MLP will be reduced, which may increase the Fund’s tax liability upon the sale of the interests in the MLP or upon subsequent distributions in respect of such interests.
24
GOLDMAN SACHS MLP ENERGY INFRASTRUCTURE FUND
|
| 7. OTHER RISKS (continued) |
Tax Estimation/NAV Risk. In calculating the Fund’s daily NAV, the Fund will, among other things, include its current taxes and deferred tax liability and/or asset balances and related valuation balances, if any. The Fund may accrue a deferred income tax liability balance, at the currently effective statutory U.S. federal income tax rate plus an estimated state and local income tax rate, for its future tax liability associated with the capital appreciation of its investments and the distributions received by the Fund on interests of MLPs considered to be return of capital and for any net operating gains. Any deferred tax liability balance will reduce the Fund’s NAV which could have an effect on the market price of the shares. The Fund may also record a deferred tax asset balance, which reflects an estimate of the Fund’s future tax benefit associated with net operating losses and/or unrealized losses. Any deferred tax asset balance will increase the Fund’s NAV to the extent it exceeds any valuation allowance which could have an effect on the market price of the shares. The Fund will rely to some extent on information provided by MLPs, which may not be provided to the Fund on a timely basis, to estimate current taxes and deferred tax liability and/or asset balances for purposes of financial statement reporting and determining its NAV. The daily estimate of the Fund’s current taxes and deferred tax liability and/or asset balances used to calculate the Fund’s NAV could vary significantly from the Fund’s actual tax liability or benefit, and, as a result, the determination of the Fund’s actual tax liability or benefit may have a material impact on the Fund’s NAV. From time to time, the Fund may modify its estimates or assumptions regarding its current taxes and deferred tax liability and/or asset balances as new information becomes available, which modifications in estimates or assumptions may have a material impact on the Fund’s NAV.
On December 22, 2017, the TCJA was signed into law. This U.S. federal tax legislation reduced the general statutory U.S. federal corporate income tax rate from 35% to 21%, made changes regarding the use of net operating losses, repealed the corporate alternative minimum tax, allowed for eventual refunding of certain alternative minimum tax credit balances, placed limitations on the deductibility of interest expense, reduced the dividends received deduction amount, allowed for immediate expensing of certain capital expenditures, and made other changes which may have effects on the Fund and on the MLPs in which the Fund invests. These changes may affect the Fund’s daily estimates of its current taxes and deferred tax liability and/or asset balances used in the calculation of its daily NAV. The Fund will continue to evaluate this tax legislation for its potential effects on these estimates and for its potential effects on the amounts of income taxes actually incurred. The tax legislation may also affect the information provided to the Fund by MLPs, information that may not be provided to the Funds on a timely basis. As disclosed above, the daily estimate of current taxes and deferred tax liability and/or asset balances used to calculate the Fund’s NAV could vary significantly from the Fund’s actual tax liability or benefit, which may have a material impact on the Fund’s NAV. The Fund may modify its estimates and assumptions regarding its current taxes and deferred tax liability and/or asset balances as this evaluation of the tax legislation continues and as new information regarding the legislation or other matters becomes available, and such modifications in estimates or assumptions may have a material impact on the Fund’s NAV.
Under the Trust’s organizational documents, its Trustees, officers, employees and agents are indemnified, to the extent permitted by the Act and state law, against certain liabilities that may arise out of performance of their duties to the Fund. Additionally, in the course of business, the Fund enters into contracts that contain a variety of indemnification clauses. The Fund’s maximum exposure under these arrangements is unknown, as this would involve future claims that may be made against the Fund that have not yet occurred. However, GSAM believes the risk of loss under these arrangements to be remote.
Subsequent events after the Statement of Assets and Liabilities date have been evaluated, and GSAM has concluded that there is no impact requiring adjustment or disclosure in the financial statements.
25
GOLDMAN SACHS MLP ENERGY INFRASTRUCTURE FUND
Notes to Financial Statements (continued)
May 31, 2018 (Unaudited)
|
| 10. SUMMARY OF SHARE TRANSACTIONS |
Share activity is as follows:
| | | | | | | | | | | | | | | | |
| | | MLP Energy Infrastructure Fund | |
| | | | |
| | | For the Six Months Ended
May 31, 2018
(Unaudited) | | | For the Fiscal Year Ended
November 30, 2017
| |
| | | | |
| | | Shares | | | Dollars | | | Shares | | | Dollars | |
| | | | |
| Class A Shares | | | | | | | | | | | | | | | | |
Shares sold | | | 2,537,869 | | | $ | 18,130,002 | | | | 6,435,902 | | | $ | 50,728,452 | |
Reinvestment of distributions | | | 470,720 | | | | 3,291,486 | | | | 1,287,672 | | | | 9,996,736 | |
Shares redeemed | | | (5,070,507 | ) | | | (36,094,357 | ) | | | (27,493,978 | ) | | | (223,929,805 | ) |
| | | | (2,061,918 | ) | | | (14,672,869 | ) | | | (19,770,404 | ) | | | (163,204,617 | ) |
| Class C Shares | | | | | | | | | | | | | | | | |
Shares sold | | | 976,653 | | | | 6,664,047 | | | | 2,857,145 | | | | 21,967,962 | |
Reinvestment of distributions | | | 550,368 | | | | 3,687,194 | | | | 1,241,290 | | | | 9,118,987 | |
Shares redeemed | | | (3,817,685 | ) | | | (25,813,183 | ) | | | (7,381,324 | ) | | | (54,368,267 | ) |
| | | | (2,290,664 | ) | | | (15,461,942 | ) | | | (3,282,889 | ) | | | (23,281,318 | ) |
| Institutional Shares | | | | | | | | | | | | | | | | |
Shares sold | | | 94,753,668 | | | | 687,228,476 | | | | 95,245,102 | | | | 750,496,006 | |
Reinvestment of distributions | | | 7,850,220 | | | | 56,332,726 | | | | 13,396,775 | | | | 103,420,517 | |
Shares redeemed | | | (55,658,892 | ) | | | (398,952,614 | ) | | | (90,734,671 | ) | | | (696,855,312 | ) |
| | | | 46,944,996 | | | | 344,608,588 | | | | 17,907,206 | | | | 157,061,211 | |
| Investor Shares | | | | | | | | | | | | | | | | |
Shares sold | | | 4,632,968 | | | | 33,371,329 | | | | 18,570,727 | | | | 154,756,938 | |
Reinvestment of distributions | | | 655,551 | | | | 4,652,539 | | | | 1,291,162 | | | | 9,818,361 | |
Shares redeemed | | | (7,185,494 | ) | | | (50,951,966 | ) | | | (12,372,308 | ) | | | (94,779,683 | ) |
| | | | (1,896,975 | ) | | | (12,928,098 | ) | | | 7,489,581 | | | | 69,795,616 | |
| Class P Shares(a) | | | | | | | | | | | | | | | | |
Shares sold | | | 5,731,732 | | | | 41,738,950 | | | | — | | | | — | |
Reinvestment of distributions | | | 81,810 | | | | 600,483 | | | | — | | | | — | |
Shares redeemed | | | (18,260 | ) | | | (132,631 | ) | | | — | | | | — | |
| | | | 5,795,282 | | | | 42,206,802 | | | | — | | | | — | |
| Class R Shares | | | | | | | | | | | | | | | | |
Shares sold | | | 69,900 | | | | 480,812 | | | | 136,670 | | | | 1,054,786 | |
Reinvestment of distributions | | | 10,423 | | | | 71,962 | | | | 14,880 | | | | 110,482 | |
Shares redeemed | | | (41,391 | ) | | | (292,128 | ) | | | (111,758 | ) | | | (889,379 | ) |
| | | | 38,932 | | | | 260,646 | | | | 39,792 | | | | 275,889 | |
26
GOLDMAN SACHS MLP ENERGY INFRASTRUCTURE FUND
|
| 10. SUMMARY OF SHARE TRANSACTIONS (continued) |
| | | | | | | | | | | | | | | | |
| | | MLP Energy Infrastructure Fund | |
| | | | |
| | | For the Six Months Ended
May 31, 2018
(Unaudited) | | | For the Fiscal Year Ended
November 30, 2017
| |
| | | | |
| | | Shares | | | Dollars | | | Shares | | | Dollars | |
| | | | |
| Class R6 Shares(b) | | | | | | | | | | | | | | | | |
Shares sold | | | 5,553,923 | | | $ | 38,710,000 | | | | — | | | $ | — | |
Reinvestment of distributions | | | 83,081 | | | | 608,155 | | | | — | | | | — | |
| | | | 5,637,004 | | | | 39,318,155 | | | | — | | | | — | |
NET INCREASE | | | 52,166,657 | | | $ | 383,331,282 | | | | 2,383,286 | | | $ | 40,646,781 | |
| (a) | | Commenced operations on April 16, 2018. |
| (b) | | Commenced operations on April 2, 2018. |
27
GOLDMAN SACHS MLP ENERGY INFRASTRUCTURE FUND
| | |
Fund Expenses — Six Month Period Ended May 31, 2018 (Unaudited) | | |
As a shareholder of Class A, Class C, Institutional, Investor, Class P, Class R and Class R6 Shares of the Fund, you incur two types of costs: (1) transaction costs, including sales charges on purchase payments (with respect to Class A Shares) and contingent deferred sales charges on redemptions (with respect to Class C Shares); and (2) ongoing costs, including management fees; distribution and/or service (12b-1) fees (with respect to Class A, Class C and Class R Shares); and other Fund expenses. This example is intended to help you understand your ongoing costs (in dollars) of investing in Class A, Class C, Institutional, Investor, Class P, Class R and Class R6 Shares of the Fund and to compare these costs with the ongoing costs of investing in other mutual funds.
The example is based on an investment of $1,000 invested at the beginning of the period and held for the entire period from December 1, 2017 through May 31, 2018, which represents a period of 182 days in a 365 day year. The Class P Shares example is based on the period from April 16, 2018 through May 31, 2018, which represents a period of 45 out of 365 days. The Class R6 Shares example is based on the period from April 2, 2018 through May 31, 2018, which represents a period of 60 out of 365 days. The Class P Shares example and the Class R6 Shares example for hypothetical expenses reflect projected activity for the period from December 1, 2017 through May 31, 2018 for purposes of comparability. This projection assumes that annualized expense ratios were in effect during the period.
Actual Expenses — The first line under each share class in the table below provides information about actual account values and actual expenses. You may use the information in this line, together with the amount you invested, to estimate the expenses that you paid over the period. Simply divide your account value by $1,000 (for example, an $8,600 account value divided by $1,000=8.6), then multiply the result by the number in the first line under the heading entitled “Expenses Paid” to estimate the expenses you paid on your account during this period.
Hypothetical Example for Comparison Purposes — The second line under each share class in the table below provides information about hypothetical account values and hypothetical expenses based on the Fund’s actual net expense ratios and an assumed rate of return of 5% per year before expenses, which is not the Fund’s actual return. The hypothetical account values and expenses may not be used to estimate the actual ending account balance or expenses you paid for the period. You may use this information to compare the ongoing costs of investing in the Fund and other funds. To do so, compare this 5% hypothetical example with the 5% hypothetical examples that appear in the shareholder reports of the other funds.
Please note that the expenses shown in the table are meant to highlight your ongoing costs only and do not reflect any transactional costs, such as sales charges, redemption fees, or exchange fees. Therefore, the second line of the table is useful in comparing ongoing costs only, and will not help you determine the relative total costs of owning different funds. In addition, if these transactional costs were included, your costs would have been higher.
| | | | | | | | | | | | |
| | | MLP Energy Infrastructure Fund | |
| Share Class | | Beginning
Account Value
12/1/17 | | | Ending
Account Value
5/31/18 | | | Expenses Paid for the
6 months ended
5/31/18* | |
| Class A | | | | | | | | | | | | |
Actual | | $ | 1,000.00 | | | $ | 1,083.00 | | | $ | 7.32 | |
Hypothetical 5% return | | | 1,000.00 | | | | 1,017.90 | + | | | 7.09 | |
| Class C | | | | | | | | | | | | |
Actual | | | 1,000.00 | | | | 1,080.20 | | | | 11.20 | |
Hypothetical 5% return | | | 1,000.00 | | | | 1,014.16 | + | | | 10.85 | |
| Institutional | | | | | | | | | | | | |
Actual | | | 1,000.00 | | | | 1,085.60 | | | | 5.25 | |
Hypothetical 5% return | | | 1,000.00 | | | | 1,019.90 | + | | | 5.09 | |
| Investor | | | | | | | | | | | | |
Actual | | | 1,000.00 | | | | 1,084.80 | | | | 6.03 | |
Hypothetical 5% return | | | 1,000.00 | | | | 1,019.15 | + | | | 5.84 | |
| Class P(a) | | | | | | | | | | | | |
Actual | | | 1,000.00 | | | | 1,068.90 | | | | 1.15 | |
Hypothetical 5% return | | | 1,000.00 | | | | 1,020.54 | + | | | 4.40 | |
| Class R | | | | | | | | | | | | |
Actual | | | 1,000.00 | | | | 1,082.60 | | | | 8.57 | |
Hypothetical 5% return | | | 1,000.00 | | | | 1,016.70 | + | | | 8.30 | |
| Class R6(b) | | | | | | | | | | | | |
Actual | | | 1,000.00 | | | | 1,155.40 | | | | 1.68 | |
Hypothetical 5% return | | | 1,000.00 | | | | 1,020.20 | + | | | 4.79 | |
| | + | | Hypothetical expenses are based on the Fund’s actual annualized net expense ratios and an assumed rate of return of 5% per year before expenses. | |
| | * | | Expenses for each share class are calculated using the Fund’s annualized net expense ratio for each class, which represents the ongoing expenses as a percentage of net assets for the six months ended May 31, 2018. Deferred tax benefit (expense) is not included in the ratio calculation. Expenses are calculated by multiplying the annualized net expense ratio by the average account value for the period; then multiplying the result by the number of days in the most recent fiscal half year; and then dividing that result by the number of days in the fiscal year. The annualized net expense ratios for the period were as follows: | |
| | | | | | | | | | | | | | | | | | | | | | | | | | | | |
| Fund | | Class A | | | Class C | | | Institutional | | | Investor | | | Class P(a) | | | Class R | | | Class R6(b) | |
MLP Energy Infrastructure | | | 1.41 | % | | | 2.16 | % | | | 1.01 | % | | | 1.16 | % | | | 0.88 | % | | | 1.65 | % | | | 0.95 | % |
| | (a) | | Commenced operations on April 16, 2018. | |
| | (b) | | Commenced operations on April 2, 2018. | |
28
FUNDS PROFILE
Goldman Sachs Funds
Goldman Sachs is a premier financial services firm, known since 1869 for creating thoughtful and customized investment solutions in complex global markets.
Today, the Investment Management Division of Goldman Sachs serves a diverse set of clients worldwide, including private institutions, public entities and individuals. With approximately $1.29 trillion in assets under supervision as of March 31, 2018, Goldman Sachs Asset Management (“GSAM”) has portfolio management teams located around the world and our investment professionals bring firsthand knowledge of local markets to every investment decision. Assets under supervision includes assets under management and other client assets for which Goldman Sachs does not have full discretion. GSAM leverages the resources of Goldman Sachs & Co. LLC subject to legal, internal and regulatory restrictions.
Money Market
Financial Square FundsSM
| ∎ | | Financial Square Treasury Solutions Fund1 |
| ∎ | | Financial Square Government Fund1 |
| ∎ | | Financial Square Money Market Fund2 |
| ∎ | | Financial Square Prime Obligations Fund2 |
| ∎ | | Financial Square Treasury Instruments Fund1 |
| ∎ | | Financial Square Treasury Obligations Fund1 |
| ∎ | | Financial Square Federal Instruments Fund1 |
| ∎ | | Financial Square Tax-Exempt Money Market Fund2 |
Investor FundsSM
| ∎ | | Investor Money Market Fund3 |
| ∎ | | Investor Tax-Exempt Money Market Fund3 |
Fixed Income
Short Duration and Government
| ∎ | | High Quality Floating Rate Fund |
| ∎ | | Short-Term Conservative Income Fund |
| ∎ | | Short Duration Government Fund |
| ∎ | | Short Duration Income Fund |
| ∎ | | Inflation Protected Securities Fund |
Multi-Sector
Municipal and Tax-Free
| ∎ | | High Yield Municipal Fund |
| ∎ | | Dynamic Municipal Income Fund |
| ∎ | | Short Duration Tax-Free Fund |
Single Sector
| ∎ | | Investment Grade Credit Fund |
| ∎ | | High Yield Floating Rate Fund |
| ∎ | | Emerging Markets Debt Fund |
| ∎ | | Local Emerging Markets Debt Fund |
| ∎ | | Total Emerging Markets Income Fund4 |
Fixed Income Alternatives
| ∎ | | Long Short Credit Strategies Fund |
Fundamental Equity
| ∎ | | Small/Mid Cap Value Fund |
| ∎ | | Small/Mid Cap Growth Fund |
| ∎ | | Concentrated Growth Fund |
| ∎ | | Technology Opportunities Fund |
| ∎ | | Growth Opportunities Fund |
| ∎ | | Rising Dividend Growth Fund |
Tax-Advantaged Equity
| ∎ | | U.S. Tax-Managed Equity Fund |
| ∎ | | International Tax-Managed Equity Fund |
| ∎ | | U.S. Equity Dividend and Premium Fund |
| ∎ | | International Equity Dividend and Premium Fund |
Equity Insights
| ∎ | | Small Cap Equity Insights Fund |
| ∎ | | U.S. Equity Insights Fund |
| ∎ | | Small Cap Growth Insights Fund |
| ∎ | | Large Cap Growth Insights Fund |
| ∎ | | Large Cap Value Insights Fund |
| ∎ | | Small Cap Value Insights Fund |
| ∎ | | International Small Cap Insights Fund |
| ∎ | | International Equity Insights Fund |
| ∎ | | Emerging Markets Equity Insights Fund |
Fundamental Equity International
| ∎ | | International Equity Income Fund7 |
| ∎ | | International Equity ESG Fund8 |
| ∎ | | Emerging Markets Equity Fund |
| ∎ | | ESG Emerging Markets Equity Fund |
Select Satellite
| ∎ | | Real Estate Securities Fund |
| ∎ | | International Real Estate Securities Fund |
| ∎ | | Commodity Strategy Fund |
| ∎ | | Global Real Estate Securities Fund |
| ∎ | | Alternative Premia Fund9 |
| ∎ | | Absolute Return Tracker Fund |
| ∎ | | Managed Futures Strategy Fund |
| ∎ | | MLP Energy Infrastructure Fund |
| ∎ | | Multi-Manager Alternatives Fund |
| ∎ | | Absolute Return Multi-Asset Fund |
| ∎ | | Global Infrastructure Fund |
Total Portfolio Solutions
| ∎ | | Global Managed Beta Fund |
| ∎ | | Multi-Manager Non-Core Fixed Income Fund |
| ∎ | | Multi-Manager U.S. Dynamic Equity Fund |
| ∎ | | Multi-Manager Global Equity Fund |
| ∎ | | Multi-Manager International Equity Fund |
| ∎ | | Tactical Tilt Overlay Fund |
| ∎ | | Balanced Strategy Portfolio |
| ∎ | | Multi-Manager U.S. Small Cap Equity Fund |
| ∎ | | Multi-Manager Real Assets Strategy Fund |
| ∎ | | Growth and Income Strategy Portfolio |
| ∎ | | Growth Strategy Portfolio |
| ∎ | | Equity Growth Strategy Portfolio |
| ∎ | | Satellite Strategies Portfolio |
| ∎ | | Enhanced Dividend Global Equity Portfolio |
| ∎ | | Tax-Advantaged Global Equity Portfolio |
| ∎ | | Strategic Factor Allocation Fund |
| ∎ | | Target Date 2020 Portfolio |
| ∎ | | Target Date 2025 Portfolio |
| ∎ | | Target Date 2030 Portfolio |
| ∎ | | Target Date 2035 Portfolio |
| ∎ | | Target Date 2040 Portfolio |
| ∎ | | Target Date 2045 Portfolio |
| ∎ | | Target Date 2050 Portfolio |
| ∎ | | Target Date 2055 Portfolio |
| ∎ | | Target Date 2060 Portfolio |
| ∎ | | GQG Partners International Opportunities Fund |
| 1 | | You could lose money by investing in the Fund. Although the Fund seeks to preserve the value of your investment at $1.00 per share, it cannot guarantee it will do so. An investment in the Fund is not a deposit of a bank and is not insured or guaranteed by the Federal Deposit Insurance Corporation or any other government agency. The Fund’s sponsor has no legal obligation to provide financial support to the Fund, and you should not expect that the sponsor will provide financial support to the Fund at any time. |
| 2 | | You could lose money by investing in the Fund. Because the share price of the Fund will fluctuate, when you sell your shares they may be worth more or less than what you originally paid for them. The Fund may impose a fee upon sale of your shares or may temporarily suspend your ability to sell shares if the Fund’s liquidity falls below required minimums because of market conditions or other factors. An investment in the Fund is not a deposit of a bank and is not insured or guaranteed by the Federal Deposit Insurance Corporation or any other government agency. The Fund’s sponsor has no legal obligation to provide financial support to the Fund, and you should not expect that the sponsor will provide financial support to the Fund at any time. |
| 3 | | You could lose money by investing in the Fund. Although the Fund seeks to preserve the value of your investment at $1.00 per share, it cannot guarantee it will do so. The Fund may impose a fee upon sale of your shares or may temporarily suspend your ability to sell shares if the Fund’s liquidity falls below required minimums because of market conditions or other factors. An investment in the Fund is not a deposit of a bank and is not insured or guaranteed by the Federal Deposit Insurance Corporation or any other government agency. The Fund’s sponsor has no legal obligation to provide financial support to the Fund, and you should not expect that the sponsor will provide financial support to the Fund at any time. |
| 4 | | Effective after the close of business on December 26, 2017, the Goldman Sachs Dynamic Emerging Markets Debt Fund was renamed the Goldman Sachs Total Emerging Markets Income Fund. |
| 5 | | Effective after the close of business on August 31, 2017, the Goldman Sachs Flexible Cap Growth Fund was renamed the Goldman Sachs Flexible Cap Fund. |
| 6 | | Effective after the close of business on October 31, 2017, the Goldman Sachs Dynamic U.S. Equity Fund was renamed the Goldman Sachs Blue Chip Fund. |
| 7 | | Effective after the close of business on February 27, 2018, the Goldman Sachs Strategic International Equity Fund was renamed the Goldman Sachs International Equity Income Fund. |
| 8 | | Effective after the close of business on February 27, 2018, the Goldman Sachs Focused International Equity Fund was renamed the Goldman Sachs International Equity ESG Fund. |
| 9 | | Effective after the close of business on October 30, 2017, the Goldman Sachs Dynamic Allocation Fund was renamed the Goldman Sachs Alternative Premia Fund. |
| | | Financial Square FundsSM and Investor FundsSM are registered service marks of Goldman Sachs & Co. LLC. |
| * | | This list covers open-end funds only. Please visit our website at www.GSAMFUNDS.com to learn about our closed-end funds and exchange-traded funds. |
| | |
TRUSTEES Jessica Palmer, Chair Kathryn A. Cassidy Diana M. Daniels Herbert J. Markley James A. McNamara Roy W. Templin Gregory G. Weaver | | OFFICERS James A. McNamara, President Scott M. McHugh, Treasurer, Senior Vice President
and Principal Financial Officer Joseph F. DiMaria, Assistant Treasurer
and Principal Accounting Officer Caroline L. Kraus, Secretary |
| |
GOLDMAN SACHS & CO. LLC Distributor and Transfer Agent | | GOLDMAN SACHS ASSET MANAGEMENT, L.P. Investment Adviser |
Visit our website at www.GSAMFUNDS.com to obtain the most recent month-end returns.
Goldman Sachs Asset Management, L.P., 200 West Street, New York, New York 10282
Goldman Sachs does not provide legal, tax or accounting advice, unless explicitly agreed between you and Goldman Sachs (generally through certain services offered only to clients of Private Wealth Management). Any statement contained in this presentation concerning U.S. tax matters is not intended or written to be used and cannot be used for the purpose of avoiding penalties imposed on the relevant taxpayer. Notwithstanding anything in this document to the contrary, and except as required to enable compliance with applicable securities law, you may disclose to any person the US federal and state income tax treatment and tax structure of the transaction and all materials of any kind (including tax opinions and other tax analyses) that are provided to you relating to such tax treatment and tax structure, without Goldman Sachs imposing any limitation of any kind. Investors should be aware that a determination of the tax consequences to them should take into account their specific circumstances and that the tax law is subject to change in the future or retroactively and investors are strongly urged to consult with their own tax advisor regarding any potential strategy, investment or transaction.
The reports concerning the Fund included in this shareholder report may contain certain forward-looking statements about the factors that may affect the performance of the Fund in the future. These statements are based on Fund management’s predictions and expectations concerning certain future events and their expected impact on the Fund, such as performance of the economy as a whole and of specific industry sectors, changes in the levels of interest rates, the impact of developing world events, and other factors that may influence the future performance of the Fund. Management believes these forward-looking statements to be reasonable, although they are inherently uncertain and difficult to predict. Actual events may cause adjustments in portfolio management strategies from those currently expected to be employed.
A description of the policies and procedures that the Fund uses to determine how to vote proxies relating to portfolio securities and information regarding how the Fund voted proxies relating to portfolio securities for the most recent 12-month period ended June 30, are available (I) without charge, upon request by calling 1-800-526-7384 (for Retail Shareholders) or 1-800-621-2550 (for Institutional Shareholders); and (II) on the Securities and Exchange Commission (“SEC’’) web site at http://www.sec.gov.
The Fund files its complete schedule of portfolio holdings with the Securities and Exchange Commission (“SEC”) for the first and third quarters of each fiscal year on Form N-Q. The Fund’s Forms N-Q are available on the SEC’s web site at http://www.sec.gov within 60 days after the Fund’s first and third fiscal quarters. The Fund’s Forms N-Q may be reviewed and copied at the SEC’s Public Reference Room in Washington, D.C., and information on the operation of the Public Reference Room may also be obtained by calling 1-800-SEC-0330. Form N-Q may be obtained upon request and without charge by calling 1-800-526-7384 (for Retail Shareholders) or 1-800-621-2550 (for Institutional Shareholders).
Fund holdings and allocations shown are as of May 31, 2018 and may not be representative of future investments. Fund holdings should not be relied on in making investment decisions and should not be construed as research or investment advice regarding particular securities. Current and future holdings are subject to risk.
Economic and market forecasts presented herein reflect our judgment as of the date of this presentation and are subject to change without notice. These forecasts do not take into account the specific investment objectives, restrictions, tax and financial situation or other needs of any specific client. Actual data will vary and may not be reflected here. These forecasts are subject to high levels of uncertainty that may affect actual performance. Accordingly, these forecasts should be viewed as merely representative of a broad range of possible outcomes. These forecasts are estimated, based on assumptions, and are subject to significant revision and may change materially as economic and market conditions change. Goldman Sachs has no obligation to provide updates or changes to these forecasts. Case studies and examples are for illustrative purposes only.
“Alerian MLP Index”, “Alerian MLP Total Return Index”, “AMZ” and “AMZX” are trademarks of Alerian and their use is granted under a license from Alerian.
The portfolio risk management process includes an effort to monitor and manage risk, but does not imply low risk.
This material is not authorized for distribution to prospective investors unless preceded or accompanied by a current Prospectus or summary prospectus, if applicable. Investors should consider the Fund’s objective, risks, and charges and expenses, and read the summary prospectus, if available, and/or the Prospectus carefully before investing or sending money. The summary prospectus, if available, and the Prospectus contain this and other information about the Fund and may be obtained from your authorized dealer or from Goldman Sachs & Co. LLC by calling (retail – 1-800-526-7384) (institutional – 1-800-621-2550).
© 2018 Goldman Sachs. All rights reserved. 135292-OTU-792712 MLPEISAR-18/22K
Goldman Sachs Funds

| | | | |
| | |
| Semi-Annual Report | | | | May 31, 2018 |
| | |
| | | | MLP & Energy Fund |

Goldman Sachs MLP & Energy Fund
| | | | |
| | | |
| NOT FDIC-INSURED | | May Lose Value | | No Bank Guarantee |
GOLDMAN SACHS MLP & ENERGY FUND
What Differentiates Goldman Sachs MLP & Energy Fund Investment Process?
With a quality-oriented approach, the MLP & Energy Fund seeks total return through current income and capital appreciation. We have an experienced investment team integrated within Goldman Sachs Asset Management, L.P. (“GSAM”), allowing us to leverage franchise expertise and risk framework across multiple asset classes. We invest primarily in securities of issuers structured as C-Corporations, or Master Limited Partnerships (“MLPs”), providing us exposure to energy infrastructure assets.

| ∎ | | To capture the full energy value chain, we analyze energy production and user trends that ultimately impact energy infrastructure. |
| ∎ | | We rigorously assess companies on both the asset and equity level. |

| ∎ | | Macro Trend Analysis First, we analyze overall energy trends through capital spending shifts and drilling trends, in addition to regional supply and demand imbalances. |
| ∎ | | Top-Down Sector Selection Secondly, we establish the impact of macro and regional trends on energy infrastructure. |
| ∎ | | Bottom-Up Security Selection Finally, we select investments by evaluating a company’s management, assets, expected returns and technicals. |

| ∎ | | Our team of MLP dedicated investment professionals includes lead portfolio managers averaging 14 years of investment experience. |
| ∎ | | Ability to leverage energy related resources across GSAM Equity, Fixed Income and Commodity groups, as well as utilize risk management resources. |
| ∎ | | Unique investment approach stemming from a more holistic view across the extremes of the energy value chain, corporate access, broader valuation understanding, and resource advantages. |
1
PORTFOLIO RESULTS
Goldman Sachs MLP & Energy Fund
Investment Objective and Principal Strategy
The Fund seeks total return through current income and capital appreciation. The Fund invests, under normal circumstances, at least 80% of its net assets plus any borrowings for investment purposes (measured at the time of purchase) (“Net Assets”) in U.S. and non-U.S. equity or fixed income securities issued by master limited partnerships (“MLPs”) and energy companies. The Fund’s MLP investments may include: MLPs structured as limited partnerships or limited liability companies; MLPs that are taxed as “C” corporations; institutional units issued by MLP affiliates; private investments in public equities (“PIPEs”) issued by MLPs; and other U.S. and non-U.S. equity and fixed income securities and derivative instruments, including pooled investment vehicles and exchange-traded notes (“ETNs”), that provide exposure to MLPs. The Fund may also invest up to 20% of its Net Assets in non-energy investments, including equity and fixed income securities of U.S. and non-U.S. companies.
Portfolio Management Discussion and Analysis
Below, the Goldman Sachs Energy and Infrastructure Team discusses the Goldman Sachs MLP & Energy Fund’s (the “Fund”) performance and positioning for the six-month period ended May 31, 2018 (the “Reporting Period”).
| Q | | How did the Fund perform during the Reporting Period? |
| A | | During the Reporting Period, the Fund’s Class A, Class C, Institutional, Investor, Class R and Class R6 Shares generated cumulative total returns, without sales charges, of 6.50%, 6.08%, 6.71%, 6.60%, 6.29% and 6.71%, respectively. These returns compare to the 5.71% cumulative total return of the Alerian MLP Index. The Alerian MLP Index is a leading measure of energy master limited partnerships (“MLPs”).1 |
| | From their inception on April 16, 2018 through the end of the Reporting Period, the Fund’s Class P Shares generated a cumulative total return, without sales charges, of 6.83% compared to the 5.63% cumulative total return of the Alerian MLP Index. |
| Q | | How did energy MLPs overall perform during the Reporting Period? |
| A | | Energy MLPs, as represented by the Alerian MLP Index, generated a return of 5.71% during the Reporting Period overall. The Alerian MLP Index underperformed the AMEX Energy Select Sector Index (“IXE”) (+11.52%) and outperformed the S&P 500® Index (+3.16%).2 In addition, the Alerian MLP Index outperformed utilities (-8.09%) and real estate investment trusts (“REITs”) (-3.09%), as represented by the Philadelphia Stock Exchange (PHLX) Utility Sector Index and the FTSE NAREIT (National Association of Real Estate Investment Trusts) U.S. Real Estate Index, respectively.3 (All index returns are presented on a total return basis.) |
| | In energy markets, West Texas Intermediate (“WTI”) crude oil prices rallied during the Reporting Period, rising 16.79%, amid modest volatility. They stabilized above $65 per barrel near the end of the Reporting Period, as the global supply/demand story continued to strengthen due to worldwide supply constraints and robust demand expectations. Meanwhile, natural gas prices fell to a low of $2.56 per million British thermal units (“MMbtu”) in February 2018, down 29.55% from January 2018 highs, due to the mild winter and to oversupply concerns. The oversupply concerns were driven by elevated levels of natural gas associated with crude oil drilling throughout the U.S., specifically in the Permian Basin. After February, natural gas prices recovered somewhat, rising 15.67% to finish the Reporting Period at $2.95/MMbtu.4 |
| | 1 | | Source: Alerian. The Alerian MLP Index is a float-adjusted, capitalization-weighted index, whose constituents represent approximately 85% of total float-adjusted market capitalization. It is disseminated real-time on a price-return basis (AMZ) and on a total-return basis (AMZX). |
| | 2 | | The AMEX Energy Select Sector Index (IXE) is a modified market capitalization-based index intended to track the movements of companies that are components of the S&P 500® Index and are involved in the development or production of energy products. The S&P 500® Index is a diverse index that includes 500 American companies that represent more than 70% of the total market capitalization of the U.S. stock market. |
| | 3 | | The PHLX Utility Sector Index is composed of geographically diverse public U.S. utility stocks. The FTSE NAREIT U.S. Real Estate Index Series is an index that spans the commercial real estate space across the U.S. economy, offering exposure to all investment and property sectors. |
2
PORTFOLIO RESULTS
| | The energy MLP market started the Reporting Period strongly, following two months of weak performance. In October and November 2017, before the Reporting Period began, heavy tax-loss harvesting in energy infrastructure assets had driven the market to the lowest level since February 2016. Investors returned to the energy MLP market in the opening weeks of the Reporting Period, likely to take advantage of depressed valuations amid continuing healthy fundamentals. The market experienced heavy investment inflows, helping the Alerian MLP Index post a gain of 17.62% between the start of the Reporting Period and January 23, 2018. Investor sentiment then reversed and continued to weigh on the energy MLP market through March. In our view, there were four reasons for the shift in sentiment. First, investor appetite for high-yielding assets diminished as the market adjusted for rising interest rates. Second, from January 26th through February 13th, crude oil prices dropped approximately 11%,4 as oversupply concerns mounted and the U.S. dollar strengthened, hindering the performance of energy-related securities broadly. Third, the sell-off in crude oil prices coincided with weak earnings from several large integrated energy companies, pushing the IXE down approximately 13% from January 26th through February 13th. Fourth, and what we consider the most impactful, the Federal Energy Regulatory Commission (“FERC”) announced a surprise policy revision on March 15th. The revised policy mandated that regulated interstate natural gas and liquids pipelines owned by energy MLPs could no longer claim an income tax allowance in their cost-of-service methodology (a method used to set rates for pipeline customers). The policy change also applied to liquids pipelines’ cost-of-service calculation on inflation-indexed pipelines, though active enforcement would be delayed until 2020. At first, we believed the scope of the policy revision was unclear to investors, driving a nearly 10% intra-day decline in the Alerian MLP Index, which then rebounded to end March 15th with a loss of 4.6%. Between March 15th and March 31st, the Alerian MLP Index recorded a decline of almost 8%. We believe investors overreacted to the FERC announcement, as the policy revision should affect only a subset of energy infrastructure companies. Between March 31st and the end of the Reporting Period, the energy MLP market recovered from its FERC-related lows, with the Alerian MLP Index climbing back above pre-announcement levels, as investors continued to digest and understand the impact of the policy revision. In addition, toward the end of the Reporting Period, investor sentiment grew more positive |
| | 5 | | Sector and subsector allocations are defined by GSAM and may differ from sector allocations used by the Alerian MLP Index. |
| | overall, which we attribute to the strong fundamental backdrop for U.S. energy infrastructure, continued earnings momentum, and management teams’ increased focus on investor concerns, such as complex corporate structures, balance sheet management and capital market reliance. |
| | In notable news during the Reporting Period, the President signed into law the Tax Cuts and Jobs Act on December 22, 2017. The law has implications for energy MLPs and pooled investment vehicles that are structured as “C” corporations. The Fund is not structured as a “C” corporation; it is structured as a regulated investment company. The energy MLP structure remains intact and the asset class will also preserve its tax-advantageous position relative to entities structured as “C” corporations (albeit to a slightly lesser extent). While “C” corporation investors may benefit from a reduction in the corporate tax rate, a new income tax deduction for individuals generally applicable to income from energy MLPs may benefit energy MLP investors. |
| Q | | What key factors were responsible for the Fund’s performance during the Reporting Period? |
| A | | Security selection, the macro environment in the crude oil and natural gas markets, and the regulatory environment drove the Fund’s performance during the Reporting Period. Securities with the strongest relationship to crude oil prices were largely the Fund’s best performers, as they benefited from the rally in and subsequent stabilization of crude oil prices. On the other hand, securities with greater exposure to the FERC policy revision were generally the worst performers. |
| | In terms of its exposures, the Fund was positively impacted by positions in the gathering and processing and the petroleum pipeline transportation subsectors.5 These subsectors benefited from record U.S. natural gas and crude oil production, with the gathering and processing subsector seeing the most direct benefit as it is closest to the wellhead and, therefore, experienced the greatest fluctuation in volumes. |
| Q | | What individual holdings added to the Fund’s relative performance during the Reporting Period? |
| A | | During the Reporting Period, the Fund’s holdings of Cheniere Energy, ONEOK and Plains GP Holdings LP contributed positively to relative returns. |
| | Cheniere Energy (LNG) was a top contributor to the Fund’s performance. LNG owns and operates liquefied natural gas receiving terminals and liquefied natural gas pipelines used |
3
PORTFOLIO RESULTS
| | for exports. LNG benefited from strong first quarter 2018 earnings, which were fueled by robust natural gas exports. Strong U.S. exports have been driven by increased natural gas demand from China and South Korea. Given that LNG’s Sabine Pass terminal is the largest liquified natural gas export facility in the U.S., the company has benefited from the increase in demand, with its revenues jumping 85% on an annualized basis during the first calendar quarter. We added to the Fund’s position during the Reporting Period because we believe LNG has upside potential based on our expectations for increased demand for U.S. natural gas, which could result in high return growth opportunities for the company. |
| | Another contributor during the Reporting Period was ONEOK (OKE), a diversified energy company involved in the natural gas gathering and natural gas liquids fractionation6 business across the U.S. OKE performed well due to growing supply tailwinds, a simplified corporate structure and no exposure to FERC’s policy revision. We decided to increase the Fund’s investment in OKE during the Reporting Period, as we believe the company could benefit from robust growth driven by increased natural gas production. |
| | Plains GP Holdings LP (PAGP) also added to the Fund’s performance during the Reporting Period. PAGP is a “C” corporation holding company, which owns units of Plains All American Pipeline, L.P. (PAA) and thus partially tracks PAA’s performance, but is taxed like a traditional corporation rather than like an energy MLP. PAA benefited from its leading position in the Permian Basin, where takeaway capacity constraints have driven widening price differentials and higher crude oil prices have led to volume growth. In our view, investors believed widening Permian price differentials could create incremental opportunities for PAA’s marketing segment and increased volumes could further drive cash flow growth on existing and new pipelines. We trimmed the Fund’s position in PAGP during the Reporting Period to reallocate the capital to securities we believed had a higher total return potential. |
| Q | | What individual holdings detracted from the Fund’s relative performance during the Reporting Period? |
| A | | During the Reporting Period, TransCanada, Enbridge Energy Management LLC and Williams Companies detracted from the Fund’s relative performance. |
| | TransCanada (TRP) was the Fund’s top detractor during the Reporting Period. TRP operates pipelines, storage facilities and power-generation plants in North America. During the Reporting Period, TRP experienced some headwinds regarding its Keystone XL Pipeline Project (“KXL”), which is expected to complement its existing pipeline network. In November 2017, the KXL was approved by the Nebraska Public Service Commission. However, the commission did not accept TRP’s preferred route for the pipeline and selected an alternative path. In December, TRP approached the commission, seeking to amend the alternative pipeline route. After the motion for amendment was denied, TRP’s stock price suffered as the KXL, which was initiated in 2008, still continues to face strong opposition from landowners and environmentalists. We decided to trim the Fund’s position in TRP and reallocate the capital to other names we considered to be attractively valued. |
| | Enbridge Energy Management LLC (EEQ) was another notable detractor from the Fund’s returns. EEQ manages and controls the business and affairs of Enbridge Energy Partners LP (EEP), and its performance is therefore correlated with EEP’s performance. EEP performed poorly following FERC’s policy revision, which prohibited some energy MLPs with FERC regulated, interstate pipelines from including an income tax allowance in their cost-of-service rate calculations. In response to the FERC announcement, Enbridge (ENB) acquired its four publicly traded subsidiaries, including EEP and EEQ, as the energy MLP structure became relatively less favorable than the “C” corporation structure. We trimmed the Fund’s position in EEQ during the Reporting Period to allocate capital to names we viewed as more attractively valued. |
| | Williams Companies (WMB), an energy infrastructure company focused on connecting North America’s natural gas and natural gas liquids markets, dampened Fund performance during the Reporting Period. WMB performed poorly, partly because of its underlying MLP, Williams Partners LP (WPZ). WPZ’s share price declined after FERC’s announced policy revision and as a result of increased investor concerns about a potential simplification transaction.7 Despite the volatility, we added to the Fund’s position in WMB because we believe the company can benefit from growing natural gas production in the Marcellus Shale and Utica Basin. |
| | 6 | | Fractionation is the process used to separate the base components of natural gas liquids. |
| | 7 | | A simplification transaction is when multiple entities controlled by the same corporate parent simplify their corporate structure through actions such as mergers, acquisitions or reduction of incentive distribution rights. |
4
PORTFOLIO RESULTS
| | Additionally, we think WMB’s plan to roll up8 WPZ into its “C” corporation structure, allowing it to retain an income tax allowance for its cost-of-service methodology, could lead to positive valuations for WMB in the long term. |
| Q | | Were there any notable purchases or sales during the Reporting Period? |
| A | | During the Reporting Period, the Fund initiated a position in Kayne Anderson MLP Investment Company, a closed-end fund that seeks to obtain a high after-tax total return by investing at least 85% of its total assets in energy MLPs. We added the position as we sought to increase the Fund’s yield and its overall exposure to energy MLPs. |
| | We similarly established a position in Tortoise Energy Infrastructure, a non-diversified, closed-end fund that invests primarily in publicly traded energy MLPs, as we sought to increase the Fund’s yield and its exposure to energy MLPs. |
| | During the Reporting Period, we exited the Fund’s position in Enbridge (ENB), a provider of energy transportation, distribution and related services in North America and internationally. ENB operates a crude oil and liquids pipeline system and is involved in international energy projects as well as natural gas transmission and midstream9 businesses. We eliminated the position in February 2018 as we sought to manage the Fund’s idiosyncratic and active risk, especially its exposure to ENB’s approximately $6.5 billion Line 3 Pipeline replacement project, which we feel has lingering timeline uncertainty. |
| | Another notable sale was NextEra Energy Partners, LP (NEP), which owns, operates and acquires contracted clean energy projects, including wind and solar; replaces aging or uneconomic projects; and targets projects under long-term and stable contracts. After NEP performed strongly throughout the fourth quarter of 2017, we decided to take profits and reallocate the capital to securities we believed had a higher total return potential. |
| Q | | How did the Fund use derivatives and similar instruments during the Reporting Period? |
| A | | During the Reporting Period, the Fund did not use derivatives or similar instruments. |
| Q | | What is the Fund’s tactical view and strategy for the months ahead? |
| A | U.S crude oil inventories fell below their five-year average during the Reporting Period, helping stabilize WTI and Brent crude oil prices and indicating a potential equilibrium between supply and demand in the near term. Regarding supply, U.S. crude oil and natural gas production hit peak levels in March 2018, according to the U.S. Energy Information Administration (“EIA”), and is expected by the EIA to grow at compound annual growth rates of 12.63% and 6.43%, respectively, through 2019. Meanwhile, the International Energy Agency (“IEA”) estimates that in the longer term, U.S. crude oil and natural gas production may account for nearly 60% of global supply growth through 2023. As for demand, the IEA expects it to continue at a historical pace and did not express concern about a peak in crude oil demand until 2040. This view is supported, we believe, by a robust global economy as well as by ongoing economic growth in the emerging markets, which continue to benefit from an expanding middle class. Also, growing global demand has been met by increased U.S. crude oil and natural gas production, which could cover 80% of the world’s demand growth through 2020, according to the IEA. |
| | At the end of the Reporting Period, we believed energy MLP fundamentals remained strong overall. These positive fundamentals have already translated into strong cash flows, in our view. We also think earnings momentum is building, as evidenced by positive earnings results in the fourth quarter of 2017 and the first quarter of 2018. We believe this trend is likely to continue going forward. Furthermore, we believe increased U.S. commodity volume growth should result in increased cash flow generation for energy infrastructure companies over the long term, as it has historically driven energy MLP cash flow growth. We expect U.S. crude oil and natural gas production trends to drive a 12.00% compound annual growth rate in energy MLP earnings before interest, taxes, depreciation and amortization (“EBITDA”) overall through 2019. Consensus EBITDA expectations are somewhat higher, as they call for 14.12% weighted average EBITDA growth for Alerian MLP Index constituents.10 |
| | At the company level during the Reporting Period, we saw what we believe is increased capital discipline, which has historically been a point of contention between management teams and investors. Many energy MLPs have either cut or reduced distribution growth rates in seeking to maintain |
| | 8 | | A roll up is a process used by which assets are merged. The principal aim of a roll up is to reduce costs through economies of scale. |
| | 9 | | The midstream component of the energy industry is usually defined as those companies providing products or services that help link the supply side, i.e. energy producers, and the demand side, i.e. energy end-users, for any type of energy commodity. Such midstream businesses can include, but are not limited to, those that process, store, market and transport various energy commodities. |
5
PORTFOLIO RESULTS
| | higher distribution coverage, thus retaining more capital within their businesses. In many cases, this action was taken with the goal of moving to a more self-funding11 model in order to rely less on the equity and debt capital markets to fund growth. Also, many energy MLPs have become more selective about the capital projects they undertake and are choosing to invest only in what they consider their highest return opportunities. In our opinion, this shift could result in increased cash flows and ultimately stronger and potentially more sustainable returns for unitholders. On another front, energy MLPs’ management teams finally appear to be addressing complexities around their corporate structure, with consolidation becoming a common theme. Consolidation transactions can come in many forms, such as a buy-in of incentive distribution rights12 by the limited partner or a roll up of assets between the limited partner and the general partner. We believe these strategies could help address the cost of capital burden associated with the general partner/limited partner relationship. Corporate structures may also be affected by the FERC policy revision. Some energy MLPs are exploring ways to mitigate EBITDA degradation, such as a structural conversion to a “C” corporation. Between the FERC’s March 15th announcement and the end of the Reporting Period, there were already three prominent simplification transactions7. We believe structural simplifications may boost investor sentiment and increase interest from institutional investors who have historically avoided energy infrastructure assets entirely. In our view, these trends may well continue going forward, lowering hurdle rates13 and potentially strengthening returns on invested capital. |
| 11 | | Self-funding means that organically generated cash flow in excess of distributions will be the source of funding for potential growth opportunities rather than reliance on the equity capital markets. |
| 12 | | Incentive distribution rights allow a general partner to receive incrementally larger percentages of an energy MLP’s total distributions as the energy MLP grows the distribution beyond established targets. |
| 13 | | A hurdle rate is the minimum rate of return on a project or investment required by an investor. The hurdle rate denotes appropriate compensation for the level of risk present; riskier projects generally have higher hurdle rates than those that are deemed to be less risky. |
6
FUND BASICS
Goldman Sachs MLP & Energy Fund
as of May 31, 2018
| | | | | | | | | | |
| | PERFORMANCE REVIEW | |
| | | December 1, 2017–May 31, 2018 | | Fund Total Return
(based on NAV)1 | | | Alerian MLP Index2 | |
| | Class A | | | 6.50 | % | | | 5.71 | % |
| | Class C | | | 6.08 | | | | 5.71 | |
| | Institutional | | | 6.71 | | | | 5.71 | |
| | Investor | | | 6.60 | | | | 5.71 | |
| | Class R | | | 6.29 | | | | 5.71 | |
| | | Class R6 | | | 6.71 | | | | 5.71 | |
| | | |
| | | | | | | | | |
| | | April 16, 2018–May 31, 2018 | | | | | | |
| | | Class P | | | 6.83 | % | | | 5.63 | % |
| | 1 | | The net asset value (“NAV”) represents the net assets of the class of the Fund (ex-dividend) divided by the total number of shares of the class outstanding. The Fund’s performance assumes the reinvestment of dividends and other distributions. The Fund’s performance does not reflect the deduction of any applicable sales charges. |
| | 2 | | The Alerian MLP Index is a composite of the 50 most prominent energy master limited partnerships calculated by Standard & Poor’s using a float-adjusted market capitalization methodology. The Alerian MLP Index is disseminated by the New York Stock Exchange real-time on a price return basis (NYSE: AMZ). The corresponding total return index is calculated and disseminated daily through ticker AMZX. The Alerian MLP Index figures do not reflect any deduction for fees, expenses or taxes. It is not possible to invest directly in an index. |
| | | | | | | | | | |
| | STANDARDIZED TOTAL RETURNS3 | |
| | | For the period ended 3/31/18 | | Since Inception | | | Inception Date | |
| | Class A | | | -15.00 | % | | | 9/29/2017 | |
| | Class C | | | -11.26 | | | | 9/29/2017 | |
| | Institutional | | | -9.92 | | | | 9/29/2017 | |
| | Investor | | | -9.94 | | | | 9/29/2017 | |
| | Class P | | | N/A | | | | 4/16/2018 | |
| | Class R | | | -10.21 | | | | 9/29/2017 | |
| | | Class R6 | | | -9.92 | | | | 9/29/2017 | |
| | 3 | | The Standardized Total Returns are average annual total returns or cumulative total returns (only if the performance period is one year or less) as of the most recent calendar quarter-end. They assume reinvestment of all distributions at NAV. These returns reflect a maximum initial sales charge of 5.5% for Class A Shares and the assumed contingent deferred sales charge for Class C Shares (1% if redeemed within 12 months of purchase). Because Institutional, Investor, Class P, Class R and Class R6 Shares do not involve a sales charge, such a charge is not applied to their Standardized Total Returns. |
The returns set forth in the tables above represent past performance. Past performance does not guarantee future results. The Fund’s investment return and principal value will fluctuate so that an investor’s shares, when redeemed, may be worth more or less than their original cost. Current performance may be lower or higher than the performance quoted above. Please visit our web site at www.GSAMFUNDS.com to obtain the most recent month-end returns. Performance reflects applicable fee waivers and/or expense limitations in effect during the periods shown. In their absence, performance would be reduced. Returns do not reflect the deduction of taxes that a shareholder would pay on Fund distributions or the redemption of Fund shares.
7
FUND BASICS
| | | | | | | | | | |
| | EXPENSE RATIOS4 | |
| | | | | Total Annual Fund
Operating Expenses After
Expense Limitation | | | Total Annual Fund
Operating Expenses | |
| | Class A | | | 1.49 | % | | | 22.77 | % |
| | Class C | | | 2.24 | | | | 23.52 | |
| | Institutional | | | 1.10 | | | | 22.38 | |
| | Investor | | | 1.24 | | | | 22.52 | |
| | Class P | | | 1.09 | | | | 22.37 | |
| | Class R | | | 1.74 | | | | 23.02 | |
| | | Class R6 | | | 1.09 | | | | 22.37 | |
| | 4 | | The expense ratios of the Fund, both current (net of applicable fee waivers and/or expense limitations) and before waivers (gross of applicable fee waivers and/or expense limitations) are as set forth above according to the most recent publicly available Prospectus, as supplemented, for the Fund and may differ from the expense ratios disclosed in the Financial Highlights in this report. Pursuant to contractual arrangements, the Fund’s waivers and/or expense limitations will remain in place through at least March 30, 2019, with respect to all share classes except Class P Shares, and through April 16, 2019 with respect to Class P Shares, and prior to such dates, the Investment Adviser may not terminate the arrangements without the approval of the Fund’s Board of Trustees. If these arrangements are discontinued in the future, the expense ratios may change without shareholder approval. |
| | | | | | | | |
| | TOP TEN HOLDINGS AS OF 5/31/185 |
| | | Holding | | % of Net Assets | | | Line of Business |
| | The Williams Cos., Inc. | | | 7.7 | % | | Gathering + Processing |
| | Targa Resources Corp. | | | 7.1 | | | Gathering + Processing |
| | Cheniere Energy, Inc. | | | 7.1 | | | Other | Liquefaction |
| | ONEOK, Inc. | | | 6.8 | | | Gathering + Processing |
| | Pembina Pipeline Corp. | | | 6.6 | | | Pipeline Transportation | Petroleum |
| | TransCanada Corp. | | | 5.1 | | | Pipeline Transportation | Natural Gas |
| | Plains GP Holdings LP Class A | | | 5.1 | | | Pipeline Transportation | Petroleum |
| | Magellan Midstream Partners LP | | | 4.9 | | | Pipeline Transportation | Petroleum |
| | Enterprise Products Partners LP | | | 4.9 | | | Pipeline Transportation | Natural Gas |
| | | Energy Transfer Partners LP | | | 4.9 | | | Pipeline Transportation | Natural Gas |
| | 5 | | The top 10 holdings may not be representative of the Fund’s future investments. |
8
FUND BASICS

| | 6 | | The Fund is actively managed and, as such, its composition may differ over time. Consequently, the Fund’s current sector allocations may differ from the percentages contained in the graph above. The percentage shown for each investment category reflects the value of investments in that category as a percentage of total net assets. Figures in the graph may not sum to 100% due to exclusion of other assets and liabilities. Sector allocations are defined by GSAM and may differ from sector allocations used by the Alerian MLP Index. |
9
GOLDMAN SACHS MLP & ENERGY FUND
Schedule of Investments
May 31, 2018 (Unaudited)
| | | | | | | | |
| Shares | | | Description | |
Value | |
| Common Stocks – 88.2% | |
| Gathering + Processing – 29.6% | | | |
| | 2,799 | | | Antero Midstream GP LP | | $ | 53,881 | |
| | 3,357 | | | Antero Midstream Partners LP | | | 101,549 | |
| | 2,581 | | | MPLX LP | | | 92,684 | |
| | 3,060 | | | ONEOK, Inc. | | | 208,570 | |
| | 4,499 | | | Targa Resources Corp. | | | 218,786 | |
| | 8,870 | | | The Williams Cos., Inc. | | | 238,248 | |
| | | | | | | | |
| | | | | | | 913,718 | |
| | |
| Other | Liquefaction* – 7.0% | | | |
| | 3,270 | | | Cheniere Energy, Inc. | | | 217,847 | |
| | |
| Pipeline Transportation | Natural Gas – 28.4% | | | |
| | 4,139 | | | Energy Transfer Equity LP | | | 71,522 | |
| | 7,898 | | | Energy Transfer Partners LP | | | 149,983 | |
| | 5,233 | | | Enterprise Products Partners LP | | | 151,233 | |
| | 4,522 | | | Inter Pipeline Ltd. | | | 85,411 | |
| | 4,728 | | | Keyera Corp. | | | 132,549 | |
| | 7,710 | | | Kinder Morgan, Inc. | | | 128,603 | |
| | 3,760 | | | TransCanada Corp. | | | 157,406 | |
| | | | | | | | |
| | | | | | | 876,707 | |
| | |
| Pipeline Transportation | Petroleum – 22.1% | | | |
| | 4,879 | | | Enbridge Energy Management LLC* | | | 46,351 | |
| | 2,179 | | | Magellan Midstream Partners LP | | | 152,312 | |
| | 5,901 | | | Pembina Pipeline Corp. | | | 205,256 | |
| | 6,379 | | | Plains GP Holdings LP Class A | | | 156,732 | |
| | 1,309 | | | SemGroup Corp. Class A | | | 33,118 | |
| | 1,651 | | | Tortoise Energy Infrastructure Corp. | | | 47,334 | |
| | 980 | | | Valero Energy Partners LP | | | 40,170 | |
| | | | | | | | |
| | | | | | | 681,273 | |
| | |
| Regasification – 1.1% | | | |
| | 1,277 | | | Golar LNG Ltd. | | | 33,177 | |
| | |
| | TOTAL COMMON STOCKS | | | | |
| | (Cost $2,608,700) | | $ | 2,722,722 | |
| | |
| | | | | | | | |
| Structured Notes – 1.6% | |
| | 1,857 | | | JPMorgan Alerian MLP Index ETN | | | 49,600 | |
| | (Cost $49,664) | | | | |
| | |
| Shares | | | Distribution
Rate | | Value | |
| Investment Companies – 7.8% | |
| | ClearBridge American Energy MLP Fund, Inc. | |
| | 3,817 | | | 10.349% | | $ | 29,506 | |
| | ClearBridge Energy MLP Fund, Inc. | |
| | 2,167 | | | 9.807 | | | 31,378 | |
| | ClearBridge Energy MLP Opportunity Fund, Inc. | | | | |
| | 2,862 | | | 11.589 | | | 31,611 | |
| | ClearBridge Energy MLP Total Return Fund, Inc. | |
| | 2,741 | | | 10.220 | | | 31,110 | |
| Goldman Sachs Financial Square Government Fund –
Institutional Shares(a) |
|
| | 28,237 | | | 1.674 | | | 28,237 | |
| | Kayne Anderson MLP Investment Co. | |
| | 2,725 | | | 9.585 | | | 51,175 | |
| | Neuberger Berman MLP Income Fund, Inc. | |
| | 4,179 | | | 7.301 | | | 37,778 | |
| | |
| | TOTAL INVESTMENT COMPANIES | |
| | (Cost $269,241) | | $ | 240,795 | |
| | |
| | TOTAL INVESTMENTS – 97.6% | |
| | (Cost $2,927,605) | | $ | 3,013,117 | |
| | |
| OTHER ASSETS IN EXCESS OF
LIABILITIES – 2.4% | | | 73,724 | |
| | |
| | NET ASSETS – 100.0% | | $ | 3,086,841 | |
| | |
| | |
| The percentage shown for each investment category reflects the value of investments in that category as a percentage of net assets. |
* | | Non-income producing security. |
(a) | | Represents an affiliated fund. |
| | | | |
|
Investment Abbreviations: |
ETN | | —Exchange Traded Note |
GP | | —General Partnership |
LLC | | —Limited Liability Company |
LP | | —Limited Partnership |
|
| | |
| 10 | | The accompanying notes are an integral part of these financial statements. |
GOLDMAN SACHS MLP & ENERGY FUND
Statement of Assets and Liabilities
May 31, 2018 (Unaudited)
| | | | | | |
| | | | | | |
| | Assets: | |
| | Investments of unaffiliated issuers, at value (cost $2,899,368) | | $ | 2,984,880 | |
| | Investments of affiliated issuers, at value (cost $28,237) | | | 28,237 | |
| | Cash | | | 51,046 | |
| | Foreign currencies, at value (cost $174) | | | 173 | |
| | Receivables: | | | | |
| | Deferred offering costs | | | 90,770 | |
| | Investments sold | | | 71,859 | |
| | Dividends | | | 1,613 | |
| | Fund shares sold | | | 156 | |
| | Other assets | | | 31,741 | |
| | Total assets | | | 3,260,475 | |
| | | | | | |
| | Liabilities: | | | | |
| | Payables: | | | | |
| | Investments purchased | | | 49,693 | |
| | Management fees | | | 2,478 | |
| | Payable to investment adviser | | | 1,196 | |
| | Distribution and Service fees and Transfer Agency fees | | | 194 | |
| | Accrued expenses | | | 120,073 | |
| | Total liabilities | | | 173,634 | |
| | | | | | |
| | Net Assets: | | | | |
| | Paid-in capital | | | 3,018,089 | |
| | Undistributed net investment income | | | 29,271 | |
| | Accumulated net realized loss | | | (46,015 | ) |
| | Net unrealized gain | | | 85,496 | |
| | | NET ASSETS | | $ | 3,086,841 | |
| | | Net Assets: | | | | |
| | | Class A | | $ | 51,140 | |
| | | Class C | | | 50,887 | |
| | | Institutional | | | 2,819,938 | |
| | | Investor | | | 51,224 | |
| | | Class P | | | 10,686 | |
| | | Class R | | | 51,691 | |
| | | Class R6 | | | 51,275 | |
| | | Total Net Assets | | $ | 3,086,841 | |
| | | Shares Outstanding $0.001 par value (unlimited number of shares authorized): | | | | |
| | | Class A | | | 5,035 | |
| | | Class C | | | 5,029 | |
| | | Institutional | | | 277,092 | |
| | | Investor | | | 5,037 | |
| | | Class P | | | 1,050 | |
| | | Class R | | | 5,096 | |
| | | Class R6 | | | 5,038 | |
| | | Net asset value, offering and redemption price per share:(a) | | | | |
| | | Class A | | | $10.16 | |
| | | Class C | | | 10.12 | |
| | | Institutional | | | 10.18 | |
| | | Investor | | | 10.17 | |
| | | Class P | | | 10.17 | |
| | | Class R | | | 10.14 | |
| | | Class R6 | | | 10.18 | |
| | (a) | | Maximum public offering price per share for Class A Shares is $10.75. At redemption, Class C Shares may be subject to a contingent deferred sales charge, assessed on the amount equal to the lesser of the current net asset value or the original purchase price of the shares. |
| | |
| The accompanying notes are an integral part of these financial statements. | | 11 |
GOLDMAN SACHS MLP & ENERGY FUND
Statement of Operations
For the Six Months Ended May 31, 2018 (Unaudited)
| | | | | | |
| | | | | | |
| | Investment income: | | | | |
| | Dividends — unaffiliated issuers (net of foreign withholding taxes of $2,150) | | $ | 45,955 | |
| | Dividends — affiliated issuers | | | 102 | |
| | Total investment income | | | 46,057 | |
| | | | | | |
| | Expenses: | | | | |
| | Amortization of offering costs | | | 129,145 | |
| | Printing and mailing costs | | | 60,666 | |
| | Custody, accounting and administrative services | | | 27,318 | |
| | Professional fees | | | 26,132 | |
| | Management fees | | | 14,632 | |
| | Trustee fees | | | 8,751 | |
| | Transfer Agency fees(a) | | | 719 | |
| | Distribution and Service fees(a) | | | 426 | |
| | Other | | | 17,112 | |
| | Total expenses | | | 284,901 | |
| | Less — expense reductions | | | (268,195 | ) |
| | Net expenses | | | 16,706 | |
| | NET INVESTMENT INCOME | | | 29,351 | |
| | | | | | |
| | Realized and unrealized gain (loss): | | | | |
| | Net realized gain (loss) from: | | | | |
| | Investments — unaffiliated issuers | | | (31,563 | ) |
| | Foreign currency transactions | | | (1,399 | ) |
| | Net change in unrealized gain on: | | | | |
| | Investments — unaffiliated issuers | | | 195,134 | |
| | Foreign currency translation | | | 25 | |
| | Net realized and unrealized gain | | | 162,197 | |
| | NET INCREASE IN NET ASSETS RESULTING FROM OPERATIONS | | $ | 191,548 | |
| | (a) | | Class specific Distribution and Service and Transfer Agency fees were as follows: |
| | | | | | | | | | | | | | | | | | | | | | | | | | | | | | | | | | | | | | |
| Distribution and Service Fees | | | Transfer Agency Fees | |
Class A | | | Class C | | | Class R | | | Class A | | | Class C | | | Institutional | | | Investor | | | Class P(b) | | | Class R | | | Class R6 | |
| $ | 61 | | | $ | 243 | | | $ | 122 | | | $ | 44 | | | $ | 44 | | | $ | 536 | | | $ | 44 | | | $ | — | | | $ | 44 | | | $ | 7 | |
| | (b) | | Class P Shares commenced operations on April 16, 2018. |
| | |
| 12 | | The accompanying notes are an integral part of these financial statements. |
GOLDMAN SACHS MLP & ENERGY FUND
Statements of Changes in Net Assets
| | | | | | | | | | |
| | | | | For the
Six Months Ended
May 31, 2018
(Unaudited) | | | For the
Period Ended
November 30, 2017(a) | |
| | From operations: | | | | | | | | |
| | Net investment income | | $ | 29,351 | | | $ | 4,730 | |
| | Net realized loss | | | (32,962 | ) | | | (10,384 | ) |
| | Net change in unrealized gain (loss) | | | 195,159 | | | | (109,663 | ) |
| | Net increase (decrease) in net assets resulting from operations | | | 191,548 | | | | (115,317 | ) |
| | | | | | | | | | |
| | Distributions to shareholders: | | | | | | | | |
| | From net investment income | | | | | | | | |
| | Class A Shares | | | — | | | | (120 | ) |
| | Class C Shares | | | — | | | | (100 | ) |
| | Institutional Shares | | | — | | | | (7,140 | ) |
| | Investor Shares | | | — | | | | (126 | ) |
| | Class R Shares | | | — | | | | (113 | ) |
| | Class R6 Shares | | | — | | | | (130 | ) |
| | From return of capital | | | | | | | | |
| | Class A Shares | | | — | | | | (205 | ) |
| | Class C Shares | | | — | | | | (172 | ) |
| | Institutional Shares | | | — | | | | (12,248 | ) |
| | Investor Shares | | | — | | | | (217 | ) |
| | Class R Shares | | | — | | | | (194 | ) |
| | Class R6 Shares | | | — | | | | (223 | ) |
| | Total distributions to shareholders | | | — | | | | (20,988 | ) |
| | | | | | | | | | |
| | From share transactions: | | | | | | | | |
| | Proceeds from sales of shares | | | 10,621 | | | | 3,000,089 | |
| | Reinvestment of distributions | | | — | | | | 20,988 | |
| | Cost of shares redeemed | | | (15 | ) | | | (85 | ) |
| | Net increase in net assets resulting from share transactions | | | 10,606 | | | | 3,020,992 | |
| | TOTAL INCREASE | | | 202,154 | | | | 2,884,687 | |
| | | | | | | | | | |
| | Net assets: | | | | | | | | |
| | Beginning of period | | | 2,884,687 | | | | — | |
| | End of period | | $ | 3,086,841 | | | $ | 2,884,687 | |
| | Undistributed (distributions in excess of) net investment income | | $ | 29,271 | | | $ | (80 | ) |
| | (a) | | The Fund commenced operations on September 29, 2017. |
| | |
| The accompanying notes are an integral part of these financial statements. | | 13 |
GOLDMAN SACHS MLP & ENERGY FUND
Financial Highlights
Selected Data for a Share Outstanding Throughout Each Period
| | | | | | | | | | | | | | | | | | | | | | | | | | | | | | |
| | | | | | | | From
Investment Operations | | | Distributions
to Shareholders | |
| | | Year - Share Class | |
Net asset
value,
beginning
of period | | | Net
investment
income(a) | | | Net realized
and unrealized
gain (loss) | | | Total from
investment
operations | | | From net
investment
income | | | From capital | | | Total Distributions | |
| | FOR THE SIX MONTHS ENDED MAY 31, (UNAUDITED) | | | | | | | | | |
| | 2018 - A | | $ | 9.54 | | | $ | 0.08 | | | $ | 0.54 | | | $ | 0.62 | | | $ | — | | | $ | — | | | $ | — | |
| | 2018 - C | | | 9.54 | | | | 0.04 | | | | 0.54 | | | | 0.58 | | | | — | | | | — | | | | — | |
| | 2018 - Institutional | | | 9.54 | | | | 0.10 | | | | 0.54 | | | | 0.64 | | | | — | | | | — | | | | — | |
| | 2018 - Investor | | | 9.54 | | | | 0.09 | | | | 0.54 | | | | 0.63 | | | | — | | | | — | | | | — | |
| | 2018 - P(e) | | | 9.52 | | | | 0.04 | | | | 0.61 | | | | 0.65 | | | | — | | | | — | | | | — | |
| | 2018 - R | | | 9.54 | | | | 0.07 | | | | 0.53 | | | | 0.60 | | | | — | | | | — | | | | — | |
| | 2018 - R6 | | | 9.54 | | | | 0.10 | | | | 0.54 | | | | 0.64 | | | | — | | | | — | | | | — | |
| | | | | | | | | | | | | | | | | | | | | | | | | | | | | | |
| | FOR THE PERIOD ENDED NOVEMBER 30, 2017 | | | | | | | | | |
| | 2017 - A(f) | | | 10.00 | | | | 0.01 | | | | (0.40 | ) | | | (0.39 | ) | | | (0.03 | ) | | | (0.04 | ) | | | (0.07 | ) |
| | 2017 - C(f) | | | 10.00 | | | | — | (g) | | | (0.41 | ) | | | (0.41 | ) | | | (0.02 | ) | | | (0.03 | ) | | | (0.05 | ) |
| | 2017 - Institutional(f) | | | 10.00 | | | | 0.02 | | | | (0.41 | ) | | | (0.39 | ) | | | (0.03 | ) | | | (0.04 | ) | | | (0.07 | ) |
| | 2017 - Investor(f) | | | 10.00 | | | | 0.01 | | | | (0.40 | ) | | | (0.39 | ) | | | (0.03 | ) | | | (0.04 | ) | | | (0.07 | ) |
| | 2017 - R(f) | | | 10.00 | | | | 0.01 | | | | (0.41 | ) | | | (0.40 | ) | | | (0.02 | ) | | | (0.04 | ) | | | (0.06 | ) |
| | 2017 - R6(f) | | | 10.00 | | | | 0.02 | | | | (0.41 | ) | | | (0.39 | ) | | | (0.03 | ) | | | (0.04 | ) | | | (0.07 | ) |
| | (a) | | Calculated based on the average shares outstanding methodology. |
| | (b) | | Assumes investment at the NAV at the beginning of the period, reinvestment of all dividends and distributions, a complete redemption of the investment at the NAV at the end of the period and no sales or redemption charges. Total returns would be reduced if a sales or redemption charge was taken into account. Returns do not reflect the impact of taxes to shareholders relating to Fund distributions or the redemption of Fund shares. Total returns for periods less than one full year are not annualized. |
| | (d) | | The Fund’s portfolio turnover rate is calculated in accordance with regulatory requirements, without regard to transactions involving short term investments. If such transactions were included, the Fund’s portfolio turnover rate may be higher. |
| | (e) | | Commenced operations on April 16, 2018. |
| | (f) | | Commenced operations on September 29, 2017. |
| | (g) | | Amount is less than $0.005 per share. |
| | |
| 14 | | The accompanying notes are an integral part of these financial statements. |
GOLDMAN SACHS MLP & ENERGY FUND
| | | | | | | | | | | | | | | | | | | | | | | | | | | | | | | | | | | | | | | | |
| | | | | | | | | | | | | | | | | | | | | | | | | | | | | | | | | | |
| | | Net asset
value, end
of period | | | | | Total
return(b) | | | | | Net assets,
end of
period
(in 000s) | | | | | Ratio of
net expenses
to average
net assets(c) | | | | | Ratio of
total expenses
to average
net assets(c) | | | | | Ratio of
net investment
income (loss)
to average
net assets(c) | | | | | Portfolio
turnover
rate(d) | |
| | | | | | | | | | | | | | | | | | | | | | | | | | | | | | | | | | | | | | | | |
| | $ | 10.16 | | | | | | 6.50 | % | | | | $ | 51 | | | | | | 1.48 | % | | | | | 15.32 | % | | | | | 1.64 | % | | | | | 43 | % |
| | | 10.12 | | | | | | 6.08 | | | | | | 51 | | | | | | 2.23 | | | | | | 16.07 | | | | | | 0.90 | | | | | | 43 | |
| | | 10.18 | | | | | | 6.71 | | | | | | 2,820 | | | | | | 1.10 | | | | | | 14.93 | | | | | | 2.03 | | | | | | 43 | |
| | | 10.17 | | | | | | 6.60 | | | | | | 51 | | | | | | 1.24 | | | | | | 15.07 | | | | | | 1.89 | | | | | | 43 | |
| | | 10.17 | | | | | | 6.83 | | | | | | 11 | | | | | | 1.08 | | | | | | 1.08 | | | | | | 3.46 | | | | | | 43 | |
| | | 10.14 | | | | | | 6.29 | | | | | | 52 | | | | | | 1.73 | | | | | | 15.55 | | | | | | 1.40 | | | | | | 43 | |
| | | 10.18 | | | | | | 6.71 | | | | | | 51 | | | | | | 1.09 | | | | | | 14.92 | | | | | | 2.04 | | | | | | 43 | |
| | | | | | | | | | | | | | | | | | | | | | | | | | | | | | | | | | | | | | | | |
| | | | | | | | | | | | | | | | | | | | | | | | | | | | | | | | | | | | | | | | |
| | | 9.54 | | | | | | (3.93 | ) | | | | | 48 | | | | | | 1.49 | | | | | | 20.57 | | | | | | 0.64 | | | | | | 11 | |
| | | 9.54 | | | | | | (4.04 | ) | | | | | 48 | | | | | | 2.24 | | | | | | 21.32 | | | | | | (0.11 | ) | | | | | 11 | |
| | | 9.54 | | | | | | (3.87 | ) | | | | | 2,644 | | | | | | 1.10 | | | | | | 20.18 | | | | | | 1.03 | | | | | | 11 | |
| | | 9.54 | | | | | | (3.90 | ) | | | | | 48 | | | | | | 1.24 | | | | | | 20.32 | | | | | | 0.89 | | | | | | 11 | |
| | | 9.54 | | | | | | (3.97 | ) | | | | | 48 | | | | | | 1.74 | | | | | | 20.82 | | | | | | 0.39 | | | | | | 11 | |
| | | 9.54 | | | | | | (3.87 | ) | | | | | 48 | | | | | | 1.09 | | | | | | 20.17 | | | | | | 1.04 | | | | | | 11 | |
| | |
| The accompanying notes are an integral part of these financial statements. | | 15 |
GOLDMAN SACHS MLP & ENERGY FUND
Notes to Financial Statements
May 31, 2018 (Unaudited)
Goldman Sachs Trust (the “Trust”) is a Delaware statutory trust registered under the Investment Company Act of 1940, as amended (the “Act”), as an open-end management investment company. The Trust includes the Goldman Sachs MLP & Energy Fund (the “Fund”). The Fund is a non-diversified portfolio under the Act offering seven classes of shares — Class A, Class C, Institutional, Investor, Class P (commenced operations on April 16, 2018), Class R and Class R6 Shares. The Fund commenced operations on September 29, 2017.
Class A Shares are sold with a front-end sales charge of up to 5.50%. Class C Shares are sold with a contingent deferred sales charge (“CDSC”) of 1.00%, which is imposed on redemptions made within 12 months of purchase. Institutional, Investor, Class P, Class R and Class R6 Shares are not subject to a sales charge.
Goldman Sachs Asset Management, L.P. (“GSAM”), an affiliate of Goldman Sachs & Co. LLC (“Goldman Sachs”), serves as investment adviser to the Fund pursuant to a management agreement (the “Agreement”) with the Trust.
|
| 2. SIGNIFICANT ACCOUNTING POLICIES |
The financial statements have been prepared in accordance with accounting principles generally accepted in the United States of America (“GAAP”) and require management to make estimates and assumptions that may affect the reported amounts and disclosures. Actual results may differ from those estimates and assumptions.
A. Investment Valuation — The Fund’s valuation policy is to value investments at fair value.
B. Investment Income and Investments — Investment income includes interest income, dividend income, and securities lending income, if any. Interest income is accrued daily and adjusted for amortization of premiums and accretion of discounts. Dividend income is recognized on ex-dividend date or, for certain foreign securities, as soon as such information is obtained subsequent to the ex-dividend date. Investment transactions are reflected on trade date. Realized gains and losses are calculated using identified cost. Investment transactions are recorded on the following business day for daily net asset value (“NAV”) calculations. Investment income is recorded net of any foreign withholding taxes, less any amounts reclaimable. The Fund may file withholding tax reclaims in certain jurisdictions to recover a portion of amounts previously withheld. Any foreign capital gains tax is accrued daily based upon net unrealized gains, and is payable upon sale of such investments. Distributions from master limited partnerships (“MLPs”) are generally recorded based on the characterization reported on the MLP’s tax return. The Fund records its pro-rata share of the income/loss and capital gains/losses, allocated from the underlying partnerships and adjusts the cost basis of the underlying partnerships accordingly.
C. Class Allocations and Expenses — Investment income, realized and unrealized gain (loss), if any, and non-class specific expenses of the Fund are allocated daily based upon the proportion of net assets of each class. Non-class specific expenses directly incurred by the Fund are charged to the Fund, while such expenses incurred by the Trust are allocated across the Fund on a straight-line and/or pro-rata basis depending upon the nature of the expenses. Class-specific expenses, where applicable, are borne by the respective share classes and include Distribution and Service, Transfer Agency and Service fees.
D. Offering Costs — Offering costs paid in connection with the initial offering of shares of the Fund are being amortized on a straight-line basis over 12 months from the date of commencement of operations.
E. Federal Taxes and Distributions to Shareholders — It is the Fund’s policy to comply with the requirements of the Internal Revenue Code of 1986, as amended (the “Code”), applicable to regulated investment companies (mutual funds) and to distribute each year substantially all of its investment company taxable income and capital gains to its shareholders. Accordingly, the Fund is not required to make any provisions for the payment of federal income tax. Distributions to shareholders are recorded on the ex-dividend date. Income distributions, if any, are declared and paid at least semi-annually, and capital gains are declared and paid annually.
Net capital losses, if any, are carried forward to future fiscal years and may be used to the extent allowed by the Code to offset any future capital gains. Losses that are carried forward will retain their character as either short-term or long-term capital losses. Utilization of capital loss carryforwards will reduce the requirement of future capital gains distributions.
16
GOLDMAN SACHS MLP & ENERGY FUND
|
| 2. SIGNIFICANT ACCOUNTING POLICIES (continued) |
The characterization of distributions to shareholders for financial reporting purposes is determined in accordance with federal income tax rules, which may differ from GAAP. The source of the Fund’s distributions may be shown in the accompanying financial statements as either from net investment income, net realized gain or capital. Certain components of the Fund’s net assets on the Statement of Assets and Liabilities reflect permanent GAAP/tax differences based on the appropriate tax character.
F. Foreign Currency Translation — The accounting records and reporting currency of the Fund are maintained in U.S. dollars. Assets and liabilities denominated in foreign currencies are translated into U.S. dollars using the current exchange rates at the close of each business day. The effect of changes in foreign currency exchange rates on investments is included within net realized and unrealized gain (loss) on investments. Changes in the value of other assets and liabilities as a result of fluctuations in foreign exchange rates are included in the Statement of Operations within net change in unrealized gain (loss) on foreign currency translation. Transactions denominated in foreign currencies are translated into U.S. dollars on the date the transaction occurred, the effects of which are included within net realized gain (loss) on foreign currency transactions.
|
| 3. INVESTMENTS AND FAIR VALUE MEASUREMENTS |
U.S. GAAP defines the fair value of a financial instrument as the amount that would be received to sell an asset or paid to transfer a liability in an orderly transaction between market participants at the measurement date (i.e., the exit price); the Fund’s policy is to use the market approach. GAAP establishes a fair value hierarchy that prioritizes the inputs to valuation techniques used to measure fair value. The hierarchy gives the highest priority to unadjusted quoted prices in active markets for identical assets or liabilities (Level 1 measurements) and the lowest priority to unobservable inputs (Level 3 measurements). The levels used for classifying investments are not necessarily an indication of the risk associated with investing in these investments. The three levels of the fair value hierarchy are described below:
Level 1 — Unadjusted quoted prices in active markets that are accessible at the measurement date for identical, unrestricted assets or liabilities;
Level 2 — Quoted prices in markets that are not active or financial instruments for which significant inputs are observable (including, but not limited to, quoted prices for similar investments, interest rates, foreign exchange rates, volatility and credit spreads), either directly or indirectly;
Level 3 — Prices or valuations that require significant unobservable inputs (including GSAM’s assumptions in determining fair value measurement).
Changes in valuation techniques may result in transfers into or out of an assigned level within the hierarchy. In accordance with the Fund’s policy, transfers between different levels of the fair value hierarchy resulting from such changes are deemed to have occurred as of the beginning of the reporting period.
The Board of Trustees (“Trustees”) has approved Valuation Procedures that govern the valuation of the portfolio investments held by the Fund, including investments for which market quotations are not readily available. The Trustees have delegated to GSAM day-to-day responsibility for implementing and maintaining internal controls and procedures related to the valuation of the Fund’s investments. To assess the continuing appropriateness of pricing sources and methodologies, GSAM regularly performs price verification procedures and issues challenges as necessary to third party pricing vendors or brokers, and any differences are reviewed in accordance with the Valuation Procedures.
A. Level 1 and Level 2 Fair Value Investments — The valuation techniques and significant inputs used in determining the fair values for investments classified as Level 1 and Level 2 are as follows:
Equity Securities — Equity securities traded on a United States (“U.S.”) securities exchange or the NASDAQ system, or those located on certain foreign exchanges, including but not limited to the Americas, are valued daily at their last sale price or official closing price on the principal exchange or system on which they are traded. If there is no sale or official closing price or such price is believed by GSAM to not represent fair value, equity securities are valued at the last bid price for long positions and at the last ask price for short positions. To the extent these investments are actively traded, they are classified as Level 1 of the fair value hierarchy, otherwise they are generally classified as Level 2.
17
GOLDMAN SACHS MLP & ENERGY FUND
Notes to Financial Statements (continued)
May 31, 2018 (Unaudited)
|
| 3. INVESTMENTS AND FAIR VALUE MEASUREMENTS (continued) |
Unlisted equity securities for which market quotations are available are valued at the last sale price on the valuation date, or if no sale occurs, at the last bid price, and are generally classified as Level 2. Securities traded on certain foreign securities exchanges are valued daily at fair value determined by an independent fair value service (if available) under Valuation Procedures approved by the Trustees and consistent with applicable regulatory guidance. The independent fair value service takes into account multiple factors including, but not limited to, movements in the securities markets, certain depositary receipts, futures contracts and foreign currency exchange rates that have occurred subsequent to the close of the foreign securities exchange. These investments are generally classified as Level 2 of the fair value hierarchy.
Underlying Funds (including Money Market Funds) — Underlying Funds (“Underlying Funds”) include other investment companies and exchange-traded funds (“ETFs”). Investments in the Underlying Funds (except ETFs) are valued at the NAV per share of the Institutional Share class on the day of valuation. ETFs are valued daily at the last sale price or official closing price on the principal exchange or system on which the investment is traded. Because the Fund invests in Underlying Funds that fluctuate in value, the Fund’s shares will correspondingly fluctuate in value. To the extent these investments are actively traded, they are classified as Level 1 of the fair value hierarchy, otherwise they are generally classified as Level 2. For information regarding an Underlying Fund’s accounting policies and investment holdings, please see the Underlying Fund’s shareholder report.
Debt Securities — Debt securities for which market quotations are readily available are valued daily on the basis of quotations supplied by dealers or an independent pricing service approved by the Trustees. The pricing services may use valuation models or matrix pricing, which consider: (i) yield or price with respect to bonds that are considered comparable in characteristics such as rating, interest rate and maturity date or (ii) quotations from securities dealers to determine current value. With the exception of treasury securities of G8 countries, which are generally classified as Level 1, these investments are generally classified as Level 2 of the fair value hierarchy.
i. Structured Notes — The values of structured notes are based on the price movements of a reference security or index. Upon termination, the Fund will receive a payment from the issuer based on the value of the referenced instrument (notional amount multiplied by price of the referenced instrument) and record a realized gain or loss. Structured notes that are exchange traded are generally classified as Level 1 of the fair value hierarchy.
B. Level 3 Fair Value Investments — To the extent that significant inputs to valuation models and other alternative pricing sources are unobservable, or if quotations are not readily available, or if GSAM believes that such quotations do not accurately reflect fair value, the fair value of the Fund’s investments may be determined under Valuation Procedures approved by the Trustees. GSAM, consistent with its procedures and applicable regulatory guidance, may make an adjustment to the most recent valuation prices of either domestic or foreign securities in light of significant events to reflect what it believes to be the fair value of the securities at the time of determining the Fund’s NAV. Significant events which could affect a large number of securities in a particular market may include, but are not limited to: significant fluctuations in U.S. or foreign markets; market dislocations; market disruptions; or unscheduled market closings. Significant events which could also affect a single issuer may include, but are not limited to: corporate actions such as reorganizations, mergers and buy-outs; ratings downgrades; and bankruptcies.
C. Fair Value Hierarchy — The following is a summary of the Fund’s investments classified in the fair value hierarchy as of May 31, 2018:
| | | | | | | | | | | | |
|
| MLP & ENERGY | |
| | | |
| Investment Type | | Level 1 | | | Level 2 | | | Level 3 | |
| Assets | | | | | | | | | | | | |
Common Stock(a) | | | | | | | | | | | | |
North America | | $ | 2,722,722 | | | $ | — | | | $ | — | |
Structured Notes | | | 49,600 | | | | — | | | | — | |
Investment Company | | | 240,795 | | | | — | | | | — | |
| Total | | $ | 3,013,117 | | | $ | — | | | $ | — | |
| (a) | | Amounts are disclosed by continent to highlight the impact of time zone differences between local market close and the calculation of net asset value. Security valuations are based on the principal exchange or system on which they are traded, which may differ from country of domicile noted in the table. |
18
GOLDMAN SACHS MLP & ENERGY FUND
|
| 3. INVESTMENTS AND FAIR VALUE MEASUREMENTS (continued) |
For further information regarding security characteristics, see the Schedule of Investments.
|
| 4. AGREEMENTS AND AFFILIATED TRANSACTIONS |
A. Management Agreement — Under the Agreement, GSAM manages the Fund, subject to the general supervision of the Trustees.
As compensation for the services rendered pursuant to the Agreement, the assumption of the expenses related thereto and administration of the Fund’s business affairs, including providing facilities, GSAM is entitled to a management fee, accrued daily and paid monthly, equal to an annual percentage rate of the Fund’s average daily net assets.
For the six months ended May 31, 2018, contractual and effective net management fees with GSAM were at the following rates:
| | | | | | | | | | | | | | | | | | | | | | |
| Contractual Management Rate | | | Effective Net Management Rate^ | |
First $1 billion | | | Next $1 billion | | | Next $3 billion | | | Next $3 billion | | | Over $8 billion | | |
| | 1.00% | | | | 0.90% | | | | 0.86% | | | | 0.84% | | | | 0.82% | | | | 1.00% | |
| ^ | | Effective Net Management Rate includes the impact of management fee waivers of affiliated Underlying Funds, if any. |
The Fund invests in Institutional Shares of the Goldman Sachs Financial Square Government Fund, which is an affiliated Underlying Fund. GSAM has agreed to waive a portion of its management fee payable by the Fund in an amount equal to the management fee it earns as an investment adviser to the affiliated Underlying Fund in which the Fund invests. For the six months ended May 31, 2018, GSAM waived $12 of the Fund’s management fee.
B. Distribution and/or Service (12b-1) Plans — The Trust, on behalf of Class A and Class R Shares of the Fund, has adopted Distribution and Service Plans subject to Rule 12b-1 under the Act. Under the Distribution and Service Plans, Goldman Sachs, which serves as distributor (the “Distributor”), is entitled to a fee accrued daily and paid monthly for distribution services and personal and account maintenance services, which may then be paid by Goldman Sachs to authorized dealers. These fees are equal to an annual percentage rate of the average daily net assets attributable to Class A or Class R Shares of the Fund, as set forth below.
The Trust, on behalf of Class C Shares of the Fund, has adopted a Distribution Plan subject to Rule 12b-1 under the Act. Under the Distribution Plan, Goldman Sachs as Distributor is entitled to a fee accrued daily and paid monthly for distribution services, which may then be paid by Goldman Sachs to authorized dealers. These fees are equal to an annual percentage rate of the average daily net assets attributable to Class C Shares of the Fund, as set forth below.
| | | | | | | | | | | | |
| | | Distribution and/or Service Plan Rates | |
| | | Class A* | | | Class C | | | Class R* | |
Distribution and/or Service Plan | | | 0.25 | % | | | 0.75 | % | | | 0.50 | % |
| * | | With respect to Class A and Class R Shares, the Distributor at its discretion may use compensation for distribution services paid under the Distribution Plan to compensate service organizations for personal and account maintenance services and expenses as long as such total compensation does not exceed the maximum cap on “service fees” imposed by the Financial Industry Regulatory Authority. |
C. Distribution Agreement — Goldman Sachs, as Distributor of the shares of the Fund pursuant to a Distribution Agreement, may retain a portion of the Class A Shares’ front end sales charge and Class C Shares’ CDSC. During the six months ended May 31, 2018, Goldman Sachs did not retain any portion of the sales charges or CDSC for this fund.
D. Service Plan — The Trust, on behalf of the Fund, has adopted a Service Plan to allow Class C Shares to compensate service organizations (including Goldman Sachs) for providing varying levels of personal and account maintenance services to their customers who are beneficial owners of such shares. The Service Plan provides for compensation to the service organizations equal to an annual percentage rate of 0.25% of the average daily net assets attributable to Class C Shares of the Fund.
E. Transfer Agency Agreement — Goldman Sachs also serves as the transfer agent of the Fund for a fee pursuant to the Transfer Agency Agreement. The fees charged for such transfer agency services are accrued daily and paid monthly at annual rates
19
GOLDMAN SACHS MLP & ENERGY FUND
Notes to Financial Statements (continued)
May 31, 2018 (Unaudited)
|
| 4. AGREEMENTS AND AFFILIATED TRANSACTIONS (continued) |
as follows: 0.18% of the average daily net assets of Class A, Class C, Investor and Class R Shares; 0.03% of the average daily net assets of Class P and Class R6 Shares; and 0.04% of the average daily net assets of Institutional Shares.
F. Other Expense Agreements and Affiliated Transactions — GSAM has agreed to limit certain “Other Expenses” of the Fund (excluding acquired fund fees and expenses, transfer agency fees and expenses, service fees and shareholder administration fees (as applicable), taxes, interest, brokerage fees, expenses of shareholder meetings, litigation and indemnification, and extraordinary expenses) to the extent such expenses exceed, on an annual basis, a percentage rate of the average daily net assets of the Fund. Such Other Expense reimbursements, if any, are accrued daily and paid monthly. In addition, the Fund is not obligated to reimburse GSAM for prior fiscal year expense reimbursements, if any. The Other Expense limitations as an annual percentage rate of average daily net assets for the Fund is 0.064%. These Other Expense limitations will remain in place through at least March 30, 2019 for Class A, Class C, Institutional, Investor, Class R and Class R6 Shares, and through at least April 16, 2019 for Class P Shares, and prior to such dates GSAM may not terminate the arrangements without the approval of the Trustees. In addition, the Fund has entered into certain offset arrangements with the transfer agent, which may result in a reduction of the Fund’s expenses and are received irrespective of the application of the “Other Expense” limitations described above. Such Other Expense reimbursements, if any, are accrued daily and paid monthly.
For the six months ended May 31, 2018, these expense reductions, including Other Expense reimbursements, were $268,183.
G. Line of Credit Facility — As of May 31, 2018, the Fund participated in a $770,000,000 committed, unsecured revolving line of credit facility (the “facility”) together with other funds of the Trust and certain registered investment companies having management agreements with GSAM or its affiliates. This facility is to be used for temporary emergency purposes, or to allow for an orderly liquidation of securities to meet redemption requests. The interest rate on borrowings is based on the federal funds rate. The facility also requires a fee to be paid by the Fund based on the amount of the commitment that has not been utilized. For the period ended May 31, 2018, the Fund did not have any borrowings under the facility.
H. Other Transactions with Affiliates — For the six months ended May 31, 2018, Goldman Sachs did not earn any brokerage commissions from portfolio transactions on behalf of the Fund.
As of May 31, 2018, The Goldman Sachs Group, Inc. was the beneficial owner of approximately 100% of Class A, Class C, Institutional, Investor, Class P and Class R6 Shares and 99% of Class R Shares of the Fund.
The table below shows the transactions in and earnings from investments in the Goldman Sachs Financial Square Government Fund for the six months ended May 31, 2017:
| | | | | | | | | | | | | | | | | | | | | | | | |
| Underlying Fund | | Beginning
Value 11/30/2017 | | | Purchases at Cost | | | Proceeds from Sales | | | Ending
Value 5/31/2018 | | | Shares as of 5/31/2018 | | | Dividend Income
from Affiliated Investment Companies | |
Goldman Sachs Financial Square Government Fund — Institutional Shares | | $ | 125,436 | | | $ | 460,810 | | | $ | (558,009 | ) | | $ | 28,237 | | | | 28,237 | | | $ | 102 | |
|
| 5. PORTFOLIO SECURITIES TRANSACTIONS |
The cost of purchases and proceeds from sales and maturities of long-term securities for the six months ended May 31, 2018, were $1,196,708 and $1,242,938, respectively.
20
GOLDMAN SACHS MLP & ENERGY FUND
As of the Fund’s most recent fiscal year end, November 30, 2017, the Fund’s capital loss carryforwards and other timing differences on a tax basis were as follows:
| | | | |
Capital loss carryforwards: | | | | |
Perpetual Short-Term | | $ | (2,165 | ) |
Timing differences (Post October Specified Loss Deferral/Post October Loss Deferral) | | $ | (3,102 | ) |
For the six months ended May 31, 2018, the Fund’s aggregate security unrealized gains and losses based on cost for U.S. federal income tax purposes were as follows:
| | | | |
Tax Cost | | $ | 2,935,471 | |
Gross unrealized gain | | | 210,255 | |
Gross unrealized loss | | | (132,609 | ) |
Net unrealized security loss | | $ | 77,646 | |
The difference between GAAP-basis and tax basis unrealized gains (losses) is attributable primarily to wash sales and differences in the tax treatment of partnership investments.
GSAM has reviewed the Fund’s tax positions for all open tax years (the current and prior year) and has concluded that no provision for income tax is required in the Fund’s financial statements. Such open tax years remain subject to examination and adjustment by tax authorities.
The Fund’s risks include, but are not limited to, the following:
Foreign Countries Risk — Investing in foreign markets may involve special risks and considerations not typically associated with investing in the United States. Foreign securities may be subject to risk of loss because of more or less foreign government regulation, less public information and less economic, political and social stability in the countries in which the Fund invests. The imposition of exchange controls (including repatriation restrictions), confiscations, trade restrictions (including tariffs) and other government restrictions by the United States or other governments, or from problems in share registration, settlement or custody, may also result in losses. Foreign risk also involves the risk of negative foreign currency rate fluctuations, which may cause the value of securities denominated in such foreign currency (or other instruments through which the Fund has exposure to foreign currencies) to decline in value. Currency exchange rates may fluctuate significantly over short periods of time.
Foreign Custody Risk — If the Fund invests in foreign securities, the Fund may hold such securities and cash with foreign banks, agents, and securities depositories appointed by the Fund’s custodian (each a “Foreign Custodian”). Some foreign custodians may be recently organized or new to the foreign custody business. In some countries, Foreign Custodians may be subject to little or no regulatory oversight over, or independent evaluation of, their operations. Further, the laws of certain countries may place limitations on the Fund’s ability to recover its assets if a Foreign Custodian enters into bankruptcy.
Geographic and Sector Risk — The Fund focuses its investments in the energy sector, and will therefore be susceptible to adverse economic, environmental, business, regulatory or other occurrences affecting that sector. The energy sector has historically experienced substantial price volatility. MLPs and other companies operating in the energy sector are subject to specific risks, including, among others, fluctuations in commodity prices; reduced consumer demand for commodities such as oil, natural gas or petroleum products; reduced availability of natural gas or other commodities for transporting, processing, storing or delivering; slowdowns in new construction; extreme weather or other natural disasters; and threats of attack by terrorists on energy assets. Additionally, changes in the regulatory environment for energy companies may adversely impact their profitability. Over time, depletion of natural gas reserves and other energy reserves may also affect the profitability of energy companies.
21
GOLDMAN SACHS MLP & ENERGY FUND
Notes to Financial Statements (continued)
May 31, 2018 (Unaudited)
|
| 7. OTHER RISKS (continued) |
Investments in Other Investment Companies — As a shareholder of another investment company, the Fund will indirectly bear its proportionate share of any net management fees and other expenses paid by such other investment companies, in addition to the fees and expenses regularly borne by the Fund.
Large Shareholder Transactions Risk — The Fund may experience adverse effects when certain large shareholders, such as other funds, institutional investors (including those trading by use of non-discretionary mathematical formulas), financial intermediaries (who may make investment decisions on behalf of underlying clients and/or include the Fund in their investment model), individuals, accounts and Goldman Sachs affiliates, purchase or redeem large amounts of shares of the Fund. Such large shareholder redemptions may cause the Fund to sell portfolio securities at times when it would not otherwise do so, which may negatively impact the Fund’s NAV and liquidity. These transactions may also accelerate the realization of taxable income to shareholders if such sales of investments resulted in gains, and may also increase transaction costs. In addition, a large redemption could result in the Fund’s current expenses being allocated over a smaller asset base, leading to an increase in the Fund’s expense ratio. Similarly, large Fund share purchases may adversely affect the Fund’s performance to the extent that the Fund is delayed in investing new cash and is required to maintain a larger cash position than it ordinarily would.
Liquidity Risk — The Fund may make investments that are illiquid or that may become less liquid in response to market developments or adverse investor perceptions. Illiquid investments may be more difficult to value. Liquidity risk may also refer to the risk that the Fund will not be able to pay redemption proceeds within the allowable time period because of unusual market conditions, an unusually high volume of redemption requests, or other reasons. To meet redemption requests, the Fund may be forced to sell investments at an unfavorable time and/or under unfavorable conditions.
Market and Credit Risks — In the normal course of business, the Fund trades financial instruments and enters into financial transactions where risk of potential loss exists due to changes in the market (market risk). Additionally, the Fund may also be exposed to credit risk in the event that an issuer or guarantor fails to perform or that an institution or entity with which the Fund has unsettled or open transactions defaults.
Master Limited Partnership Risk — Investments in securities of MLPs involve risks that differ from investments in common stocks, including risks related to limited control and limited rights to vote on matters affecting the MLP, risks related to potential conflicts of interest between the MLP and the MLP’s general partner, cash flow risks, dilution risks, limited liquidity and risks related to the general partner’s right to require unit-holders to sell their common units at an undesirable time or price.
Non-Diversification Risk — The Fund is non-diversified, meaning that it is permitted to invest a larger percentage of its assets in fewer issuers than diversified mutual funds. Thus, the Fund may be more susceptible to adverse developments affecting any single issuer held in its portfolio, and may be more susceptible to greater losses because of these developments.
Under the Trust’s organizational documents, its Trustees, officers, employees and agents are indemnified, to the extent permitted by the Act and state law, against certain liabilities that may arise out of performance of their duties to the Fund. Additionally, in the course of business, the Fund enters into contracts that contain a variety of indemnification clauses. The Fund’s maximum exposure under these arrangements is unknown, as this would involve future claims that may be made against the Fund that have not yet occurred. However, GSAM believes the risk of loss under these arrangements to be remote.
Subsequent events after the Statement of Assets and Liabilities date have been evaluated and GSAM has concluded that there is no impact requiring adjustment or disclosure in the financial statements.
22
GOLDMAN SACHS MLP & ENERGY FUND
|
| 10. SUMMARY OF SHARE TRANSACTIONS |
Share activity is as follows:
| | | | | | | | | | | | | | | | |
| | | MLP & ENERGY FUND | |
| | | | |
| | | For the Six Months Ended
May 31, 2018
(Unaudited) | | | For the Period Ended
November 30, 2017(a) | |
| | | | |
| | | Shares | | | Dollars | | | Shares | | | Dollars | |
| | | | |
| Class A Shares | | | | | | | | | | | | | | | | |
Shares sold | | | — | | | $ | — | | | | 5,001 | | | $ | 50,014 | |
Reinvestment of distributions | | | — | | | | — | | | | 35 | | | | 325 | |
Shares redeemed | | | — | | | | — | | | | (1 | ) | | | (15 | ) |
| | | | — | | | | — | | | | 5,035 | | | | 50,324 | |
| Class C Shares | | | | | | | | | | | | | | | | |
Shares sold | | | — | | | | — | | | | 5,001 | | | | 50,015 | |
Reinvestment of distributions | | | — | | | | — | | | | 29 | | | | 272 | |
Shares redeemed | | | — | | | | — | | | | (1 | ) | | | (15 | ) |
| | | | — | | | | — | | | | 5,029 | | | | 50,272 | |
| Institutional Shares | | | | | | | | | | | | | | | | |
Shares sold | | | 1 | | | | 10 | | | | 275,002 | | | | 2,750,015 | |
Reinvestment of distributions | | | — | | | | — | | | | 2,091 | | | | 19,388 | |
Shares redeemed | | | (1 | ) | | | (10 | ) | | | (1 | ) | | | (10 | ) |
| | | | — | | | | — | | | | 277,092 | | | | 2,769,393 | |
| Investor Shares | | | | | | | | | | | | | | | | |
Shares sold | | | — | | | | — | | | | 5,001 | | | | 50,015 | |
Reinvestment of distributions | | | — | | | | — | | | | 37 | | | | 343 | |
Shares redeemed | | | — | | | | — | | | | (1 | ) | | | (15 | ) |
| | | | — | | | | — | | | | 5,037 | | | | 50,343 | |
| Class P Shares(b) | | | | | | | | | | | | | | | | |
Shares sold | | | 1,051 | | | | 10,005 | | | | — | | | | — | |
Shares redeemed | | | (1 | ) | | | (5 | ) | | | — | | | | — | |
| | | | 1,050 | | | | 10,000 | | | | — | | | | — | |
| Class R Shares | | | | | | | | | | | | | | | | |
Shares sold | | | 63 | | | | 606 | | | | 5,001 | | | | 50,015 | |
Reinvestment of distributions | | | — | | | | — | | | | 33 | | | | 307 | |
Shares redeemed | | | — | | | | — | | | | (1 | ) | | | (15 | ) |
| | | | 63 | | | | 606 | | | | 5,033 | | | | 50,307 | |
| (a) | | The Fund commenced operations on September 29, 2017. |
| (b) | | Class P Shares commenced operations on April 16, 2018. |
23
GOLDMAN SACHS MLP & ENERGY FUND
Notes to Financial Statements (continued)
May 31, 2018 (Unaudited)
|
| 10. SUMMARY OF SHARE TRANSACTIONS (continued) |
| | | | | | | | | | | | | | | | |
| | | MLP & ENERGY FUND | |
| | | | |
| | | For the Six Months Ended
May 31, 2018
(Unaudited) | | | For the Period Ended
November 30, 2017(a) | |
| | | | |
| | | Shares | | | Dollars | | | Shares | | | Dollars | |
| | | | |
| Class R6 Shares | | | | | | | | | | | | | | | | |
Shares sold | | | — | | | $ | — | | | | 5,002 | | | $ | 50,015 | |
Reinvestment of distributions | | | — | | | | — | | | | 38 | | | | 353 | |
Shares redeemed | | | — | | | | — | | | | (2 | ) | | | (15 | ) |
| | | | — | | | | — | | | | 5,038 | | | | 50,353 | |
NET INCREASE | | | 1,113 | | | $ | 10,606 | | | | 302,264 | | | $ | 3,020,992 | |
| (a) | | The Fund commenced operations on September 29, 2017. |
24
GOLDMAN SACHS MLP & ENERGY FUND
| | |
Fund Expenses — Six Month Period Ended May 31, 2018 (Unaudited) | | |
As a shareholder of Class A, Class C, Institutional, Investor, Class P, Class R and Class R6 Shares of the Fund, you incur two types of costs: (1) transaction costs, including sales charges on purchase payments (with respect to Class A Shares) and contingent deferred sales charges on redemptions (with respect to Class C Shares); and (2) ongoing costs, including management fees; distribution and/or service (12b-1) fees (with respect to Class A, Class C and Class R Shares); and other Fund expenses. This example is intended to help you understand your ongoing costs (in dollars) of investing in Class A, Class C, Institutional, Investor, Class P, Class R and Class R6 Shares of the Fund and to compare these costs with the ongoing costs of investing in other mutual funds.
The example is based on an investment of $1,000 invested at the beginning of the period and held for the entire period from December 1, 2017 through May 31, 2018, which represents a period of 182 days in a 365 day year. The Class P Shares example is based on the period from April 17, 2018 through May 31, 2018, which represents a period of 45 out of 365 days. The Class P example for hypothetical expenses reflects projected activity for the period from December 1, 2017 through May 31, 2018 for purposes of comparability. This projection assumes that annualized expense ratios were in effect during the period.
Actual Expenses — The first line under each share class in the table below provides information about actual account values and actual expenses. You may use the information in this line, together with the amount you invested, to estimate the expenses that you paid over the period. Simply divide your account value by $1,000 (for example, an $8,600 account value divided by $1,000=8.6), then multiply the result by the number in the first line under the heading entitled “Expenses Paid” to estimate the expenses you paid on your account during this period.
Hypothetical Example for Comparison Purposes — The second line under each share class in the table below provides information about hypothetical account values and hypothetical expenses based on the Fund’s actual net expense ratios and an assumed rate of return of 5% per year before expenses, which is not the Fund’s actual return. The hypothetical account values and expenses may not be used to estimate the actual ending account balance or expenses you paid for the period. You may use this information to compare the ongoing costs of investing in the Fund and other funds. To do so, compare this 5% hypothetical example with the 5% hypothetical examples that appear in the shareholder reports of the other funds.
Please note that the expenses shown in the table are meant to highlight your ongoing costs only and do not reflect any transactional costs, such as sales charges, redemption fees, or exchange fees. Therefore, the second line of the table is useful in comparing ongoing costs only, and will not help you determine the relative total costs of owning different funds. In addition, if these transactional costs were included, your costs would have been higher.
| | | | | | | | | | | | |
| | | MLP & Energy Fund | |
| Share Class | | Beginning
Account Value
12/1/17 | | | Ending
Account Value
5/31/18 | | | Expenses Paid for the
6 months ended
5/31/18* | |
| Class A | | | | | | | | | | | | |
Actual | | $ | 1,000.00 | | | $ | 1,065.00 | | | $ | 7.62 | |
Hypothetical 5% return | | | 1,000.00 | | | | 1,017.55 | + | | | 7.44 | |
| Class C | | | | | | | | | | | | |
Actual | | | 1,000.00 | | | | 1,060.80 | | | | 11.46 | |
Hypothetical 5% return | | | 1,000.00 | | | | 1,013.81 | + | | | 11.20 | |
| Institutional | | | | | | | | | | | | |
Actual | | | 1,000.00 | | | | 1,067.10 | | | | 5.67 | |
Hypothetical 5% return | | | 1,000.00 | | | | 1,019.45 | + | | | 5.54 | |
| Investor | | | | | | | | | | | | |
Actual | | | 1,000.00 | | | | 1,066.00 | | | | 6.39 | |
Hypothetical 5% return | | | 1,000.00 | | | | 1,018.75 | + | | | 6.24 | |
| Class P(a) | | | | | | | | | | | | |
Actual | | | 1,000.00 | | | | 1,068.30 | | | | 1.38 | |
Hypothethical 5% return | | | 1,000.00 | | | | 1,019.43 | + | | | 5.36 | |
| Class R | | | | | | | | | | | | |
Actual | | | 1,000.00 | | | | 1,062.90 | | | | 8.90 | |
Hypothetical 5% return | | | 1,000.00 | | | | 1,016.31 | + | | | 8.70 | |
| Class R6 | | | | | | | | | | | | |
Actual | | | 1,000.00 | | | | 1,067.10 | | | | 5.62 | |
Hypothetical 5% return | | | 1,000.00 | | | | 1,019.50 | + | | | 5.49 | |
| | + | | Hypothetical expenses are based on the Fund’s actual annualized net expense ratios and an assumed rate of return of 5% per year before expenses. | |
| | * | | Expenses for each share class are calculated using the Fund’s annualized net expense ratio for each class, which represents the ongoing expenses as a percentage of net assets for the six months ended May 31, 2018. Expenses are calculated by multiplying the annualized net expense ratio by the average account value for the period; then multiplying the result by the number of days in the most recent fiscal half year; and then dividing that result by the number of days in the fiscal year. The annualized net expense ratios for the period were as follows: | |
| | | | | | | | | | | | | | | | | | | | | | | | | | | | |
| Fund | | Class A | | | Class C | | | Institutional | | | Investor | | | Class P(a) | | | Class R | | | Class R6 | |
MLP & Energy Fund | | | 1.48 | % | | | 2.23 | % | | | 1.10 | % | | | 1.24 | % | | | 1.08 | % | | | 1.73 | % | | | 1.09 | % |
| | (a) | | Class P Shares commenced operations on April 16, 2018. | |
25
FUNDS PROFILE
Goldman Sachs Funds
Goldman Sachs is a premier financial services firm, known since 1869 for creating thoughtful and customized investment solutions in complex global markets.
Today, the Investment Management Division of Goldman Sachs serves a diverse set of clients worldwide, including private institutions, public entities and individuals. With approximately $1.29 trillion in assets under supervision as of March 31, 2018, Goldman Sachs Asset Management (“GSAM”) has portfolio management teams located around the world and our investment professionals bring firsthand knowledge of local markets to every investment decision. Assets under supervision includes assets under management and other client assets for which Goldman Sachs does not have full discretion. GSAM leverages the resources of Goldman Sachs & Co. LLC subject to legal, internal and regulatory restrictions.
Money Market
Financial Square FundsSM
| ∎ | | Financial Square Treasury Solutions Fund1 |
| ∎ | | Financial Square Government Fund1 |
| ∎ | | Financial Square Money Market Fund2 |
| ∎ | | Financial Square Prime Obligations Fund2 |
| ∎ | | Financial Square Treasury Instruments Fund1 |
| ∎ | | Financial Square Treasury Obligations Fund1 |
| ∎ | | Financial Square Federal Instruments Fund1 |
| ∎ | | Financial Square Tax-Exempt Money Market Fund2 |
Investor FundsSM
| ∎ | | Investor Money Market Fund3 |
| ∎ | | Investor Tax-Exempt Money Market Fund3 |
Fixed Income
Short Duration and Government
| ∎ | | High Quality Floating Rate Fund |
| ∎ | | Short-Term Conservative Income Fund |
| ∎ | | Short Duration Government Fund |
| ∎ | | Short Duration Income Fund |
| ∎ | | Inflation Protected Securities Fund |
Multi-Sector
Municipal and Tax-Free
| ∎ | | High Yield Municipal Fund |
| ∎ | | Dynamic Municipal Income Fund |
| ∎ | | Short Duration Tax-Free Fund |
Single Sector
| ∎ | | Investment Grade Credit Fund |
| ∎ | | High Yield Floating Rate Fund |
| ∎ | | Emerging Markets Debt Fund |
| ∎ | | Local Emerging Markets Debt Fund |
| ∎ | | Total Emerging Markets Income Fund4 |
Fixed Income Alternatives
| ∎ | | Long Short Credit Strategies Fund |
Fundamental Equity
| ∎ | | Small/Mid Cap Value Fund |
| ∎ | | Small/Mid Cap Growth Fund |
| ∎ | | Concentrated Growth Fund |
| ∎ | | Technology Opportunities Fund |
| ∎ | | Growth Opportunities Fund |
| ∎ | | Rising Dividend Growth Fund |
Tax-Advantaged Equity
| ∎ | | U.S. Tax-Managed Equity Fund |
| ∎ | | International Tax-Managed Equity Fund |
| ∎ | | U.S. Equity Dividend and Premium Fund |
| ∎ | | International Equity Dividend and Premium Fund |
Equity Insights
| ∎ | | Small Cap Equity Insights Fund |
| ∎ | | U.S. Equity Insights Fund |
| ∎ | | Small Cap Growth Insights Fund |
| ∎ | | Large Cap Growth Insights Fund |
| ∎ | | Large Cap Value Insights Fund |
| ∎ | | Small Cap Value Insights Fund |
| ∎ | | International Small Cap Insights Fund |
| ∎ | | International Equity Insights Fund |
| ∎ | | Emerging Markets Equity Insights Fund |
Fundamental Equity International
| ∎ | | International Equity Income Fund7 |
| ∎ | | International Equity ESG Fund8 |
| ∎ | | Emerging Markets Equity Fund |
| ∎ | | ESG Emerging Markets Equity Fund |
Select Satellite
| ∎ | | Real Estate Securities Fund |
| ∎ | | International Real Estate Securities Fund |
| ∎ | | Commodity Strategy Fund |
| ∎ | | Global Real Estate Securities Fund |
| ∎ | | Alternative Premia Fund9 |
| ∎ | | Absolute Return Tracker Fund |
| ∎ | | Managed Futures Strategy Fund |
| ∎ | | MLP Energy Infrastructure Fund |
| ∎ | | Multi-Manager Alternatives Fund |
| ∎ | | Absolute Return Multi-Asset Fund |
| ∎ | | Global Infrastructure Fund |
Total Portfolio Solutions
| ∎ | | Global Managed Beta Fund |
| ∎ | | Multi-Manager Non-Core Fixed Income Fund |
| ∎ | | Multi-Manager U.S. Dynamic Equity Fund |
| ∎ | | Multi-Manager Global Equity Fund |
| ∎ | | Multi-Manager International Equity Fund |
| ∎ | | Tactical Tilt Overlay Fund |
| ∎ | | Balanced Strategy Portfolio |
| ∎ | | Multi-Manager U.S. Small Cap Equity Fund |
| ∎ | | Multi-Manager Real Assets Strategy Fund |
| ∎ | | Growth and Income Strategy Portfolio |
| ∎ | | Growth Strategy Portfolio |
| ∎ | | Equity Growth Strategy Portfolio |
| ∎ | | Satellite Strategies Portfolio |
| ∎ | | Enhanced Dividend Global Equity Portfolio |
| ∎ | | Tax-Advantaged Global Equity Portfolio |
| ∎ | | Strategic Factor Allocation Fund |
| ∎ | | Target Date 2020 Portfolio |
| ∎ | | Target Date 2025 Portfolio |
| ∎ | | Target Date 2030 Portfolio |
| ∎ | | Target Date 2035 Portfolio |
| ∎ | | Target Date 2040 Portfolio |
| ∎ | | Target Date 2045 Portfolio |
| ∎ | | Target Date 2050 Portfolio |
| ∎ | | Target Date 2055 Portfolio |
| ∎ | | Target Date 2060 Portfolio |
| ∎ | | GQG Partners International Opportunities Fund |
| 1 | | You could lose money by investing in the Fund. Although the Fund seeks to preserve the value of your investment at $1.00 per share, it cannot guarantee it will do so. An investment in the Fund is not a deposit of a bank and is not insured or guaranteed by the Federal Deposit Insurance Corporation or any other government agency. The Fund’s sponsor has no legal obligation to provide financial support to the Fund, and you should not expect that the sponsor will provide financial support to the Fund at any time. |
| 2 | | You could lose money by investing in the Fund. Because the share price of the Fund will fluctuate, when you sell your shares they may be worth more or less than what you originally paid for them. The Fund may impose a fee upon sale of your shares or may temporarily suspend your ability to sell shares if the Fund’s liquidity falls below required minimums because of market conditions or other factors. An investment in the Fund is not a deposit of a bank and is not insured or guaranteed by the Federal Deposit Insurance Corporation or any other government agency. The Fund’s sponsor has no legal obligation to provide financial support to the Fund, and you should not expect that the sponsor will provide financial support to the Fund at any time. |
| 3 | | You could lose money by investing in the Fund. Although the Fund seeks to preserve the value of your investment at $1.00 per share, it cannot guarantee it will do so. The Fund may impose a fee upon sale of your shares or may temporarily suspend your ability to sell shares if the Fund’s liquidity falls below required minimums because of market conditions or other factors. An investment in the Fund is not a deposit of a bank and is not insured or guaranteed by the Federal Deposit Insurance Corporation or any other government agency. The Fund’s sponsor has no legal obligation to provide financial support to the Fund, and you should not expect that the sponsor will provide financial support to the Fund at any time. |
| 4 | | Effective after the close of business on December 26, 2017, the Goldman Sachs Dynamic Emerging Markets Debt Fund was renamed the Goldman Sachs Total Emerging Markets Income Fund. |
| 5 | | Effective after the close of business on August 31, 2017, the Goldman Sachs Flexible Cap Growth Fund was renamed the Goldman Sachs Flexible Cap Fund. |
| 6 | | Effective after the close of business on October 31, 2017, the Goldman Sachs Dynamic U.S. Equity Fund was renamed the Goldman Sachs Blue Chip Fund. |
| 7 | | Effective after the close of business on February 27, 2018, the Goldman Sachs Strategic International Equity Fund was renamed the Goldman Sachs International Equity Income Fund. |
| 8 | | Effective after the close of business on February 27, 2018, the Goldman Sachs Focused International Equity Fund was renamed the Goldman Sachs International Equity ESG Fund. |
| 9 | | Effective after the close of business on October 30, 2017, the Goldman Sachs Dynamic Allocation Fund was renamed the Goldman Sachs Alternative Premia Fund. |
| | | Financial Square FundsSM and Investor FundsSM are registered service marks of Goldman Sachs & Co. LLC. |
| * | | This list covers open-end funds only. Please visit our website at www.GSAMFUNDS.com to learn about our closed-end funds and exchange-traded funds. |
| | |
TRUSTEES Jessica Palmer, Chair Kathryn A. Cassidy Diana M. Daniels Herbert J. Markley James A. McNamara Roy W. Templin Gregory G. Weaver | | OFFICERS James A. McNamara, President Scott M. McHugh, Treasurer, Senior Vice President
and Principal Financial Officer Joseph F. DiMaria, Assistant Treasurer
and Principal Accounting Officer Caroline L. Kraus, Secretary |
| |
GOLDMAN SACHS & CO. LLC Distributor and Transfer Agent | | GOLDMAN SACHS ASSET MANAGEMENT, L.P. Investment Adviser |
Visit our website at www.GSAMFUNDS.com to obtain the most recent month-end returns.
Goldman Sachs Asset Management, L.P., 200 West Street, New York, New York 10282
Goldman Sachs does not provide legal, tax or accounting advice, unless explicitly agreed between you and Goldman Sachs (generally through certain services offered only to clients of Private Wealth Management). Any statement contained in this presentation concerning U.S. tax matters is not intended or written to be used and cannot be used for the purpose of avoiding penalties imposed on the relevant taxpayer. Notwithstanding anything in this document to the contrary, and except as required to enable compliance with applicable securities law, you may disclose to any person the US federal and state income tax treatment and tax structure of the transaction and all materials of any kind (including tax opinions and other tax analyses) that are provided to you relating to such tax treatment and tax structure, without Goldman Sachs imposing any limitation of any kind. Investors should be aware that a determination of the tax consequences to them should take into account their specific circumstances and that the tax law is subject to change in the future or retroactively and investors are strongly urged to consult with their own tax advisor regarding any potential strategy, investment or transaction.
The reports concerning the Fund included in this shareholder report may contain certain forward-looking statements about the factors that may affect the performance of the Fund in the future. These statements are based on Fund management’s predictions and expectations concerning certain future events and their expected impact on the Fund, such as performance of the economy as a whole and of specific industry sectors, changes in the levels of interest rates, the impact of developing world events, and other factors that may influence the future performance of the Fund. Management believes these forward-looking statements to be reasonable, although they are inherently uncertain and difficult to predict. Actual events may cause adjustments in portfolio management strategies from those currently expected to be employed.
A description of the policies and procedures that the Fund uses to determine how to vote proxies relating to portfolio securities and information regarding how the Fund voted proxies relating to portfolio securities for the most recent 12-month period ended June 30, are available (I) without charge, upon request by calling 1-800-526-7384 (for Retail Shareholders) or 1-800-621-2550 (for Institutional Shareholders); and (II) on the Securities and Exchange Commission (“SEC’’) web site at http://www.sec.gov.
The Fund files its complete schedule of portfolio holdings with the Securities and Exchange Commission (“SEC”) for the first and third quarters of each fiscal year on Form N-Q. The Fund’s Forms N-Q are available on the SEC’s web site at http://www.sec.gov within 60 days after the Fund’s first and third fiscal quarters. The Fund’s Forms N-Q may be reviewed and copied at the SEC’s Public Reference Room in Washington, D.C., and information on the operation of the Public Reference Room may also be obtained by calling 1-800-SEC-0330. Form N-Q may be obtained upon request and without charge by calling 1-800-526-7384 (for Retail Shareholders) or 1-800-621-2550 (for Institutional Shareholders).
Fund holdings and allocations shown are as of May 31, 2018 and may not be representative of future investments. Fund holdings should not be relied on in making investment decisions and should not be construed as research or investment advice regarding particular securities. Current and future holdings are subject to risk.
Economic and market forecasts presented herein reflect our judgment as of the date of this presentation and are subject to change without notice. These forecasts do not take into account the specific investment objectives, restrictions, tax and financial situation or other needs of any specific client. Actual data will vary and may not be reflected here. These forecasts are subject to high levels of uncertainty that may affect actual performance. Accordingly, these forecasts should be viewed as merely representative of a broad range of possible outcomes. These forecasts are estimated, based on assumptions, and are subject to significant revision and may change materially as economic and market conditions change. Goldman Sachs has no obligation to provide updates or changes to these forecasts. Case studies and examples are for illustrative purposes only.
“Alerian MLP Index”, “Alerian MLP Total Return Index”, “AMZ” and “AMZX” are trademarks of Alerian and their use is granted under a license from Alerian.
The portfolio risk management process includes an effort to monitor and manage risk, but does not imply low risk.
This material is not authorized for distribution to prospective investors unless preceded or accompanied by a current Prospectus or summary prospectus, if applicable. Investors should consider the Fund’s objective, risks, and charges and expenses, and read the summary prospectus, if available, and/or the Prospectus carefully before investing or sending money. The summary prospectus, if available, and the Prospectus contain this and other information about the Fund and may be obtained from your authorized dealer or from Goldman Sachs & Co. LLC by calling (retail – 1-800-526-7384) (institutional – 1-800-621-2550).
© 2018 Goldman Sachs. All rights reserved. 135284-OTU-791651 MLPANDESAR-18/116
| (a) | As of the end of the period covered by this report, the registrant has adopted a code of ethics that applies to the registrant’s principal executive officer, principal financial officer, principal accounting officer or controller, or persons performing similar functions, regardless of whether these individuals are employed by the registrant or a third party (the “Code of Ethics”). |
| (b) | During the period covered by this report, no amendments were made to the provisions of the Code of Ethics. |
| (c) | During the period covered by this report, the registrant did not grant any waivers, including an implicit waiver, from any provision of the Code of Ethics. |
| (d) | A copy of the Code of Ethics is available as provided in Item 12(a)(1) of this report. |
| ITEM 3. | AUDIT COMMITTEE FINANCIAL EXPERT. |
| | The registrant’s board of trustees has determined that the registrant has at least one “audit committee financial expert” (as defined in Item 3 of Form N-CSR) serving on its audit committee. Gregory G. Weaver is the “audit committee financial expert” and is “independent” (as each term is defined in Item 3 of Form N-CSR). |
| ITEM 4. | PRINCIPAL ACCOUNTANT FEES AND SERVICES. |
| | The information required by this Item is only required in an annual report on this Form N-CSR. |
| ITEM 5. | AUDIT COMMITTEE OF LISTED REGISTRANTS. |
| ITEM 6. | SCHEDULE OF INVESTMENTS. |
| | Schedule of Investments is included as part of the Report to Shareholders filed under Item 1. |
| ITEM 7. | DISCLOSURE OF PROXY VOTING POLICIES AND PROCEDURES FOR CLOSED-END MANAGEMENT INVESTMENT COMPANIES. |
| ITEM 8. | PORTFOLIO MANAGERS OF CLOSED-END MANAGEMENT INVESTMENT COMPANIES. |
| ITEM 9. | PURCHASES OF EQUITY SECURITIES BY CLOSED-END MANAGEMENT INVESTMENT COMPANY AND AFFILIATED PURCHASERS. |
| ITEM 10. | SUBMISSION OF MATTERS TO A VOTE OF SECURITY HOLDERS. |
| | There have been no material changes to the procedures by which shareholders may recommend nominees to the registrant’s board of trustees. |
| ITEM 11. | CONTROLS AND PROCEDURES. |
| | (a) | The registrant’s principal executive and principal financial officers, or persons performing similar functions have concluded that the registrant’s disclosure controls and procedures (as defined in Rule 30a-3(c) under the Investment Company Act of 1940, as amended (the “1940 Act”)) are effective as of a date within 90 days of the filing of this report that includes the disclosure required by this paragraph, based on the evaluation of these controls and procedures required by Rule 30a-3(b) under the 1940 Act and 15d-15(b) under the Securities Exchange Act of 1934, as amended. |
| | (b) | There were no changes in the registrant’s internal control over financial reporting (as defined in Rule 30a-3(d) under the 1940 Act) that occurred during the registrant’s second fiscal quarter of the period covered by this report that have materially affected, or are reasonably likely to materially affect, the registrant’s internal control over financial reporting. |
| | | | |
| (a)(1) | | Goldman Sachs Trust’s Code of Ethics for Principal Executive and Senior Financial Officers is incorporated by reference to Exhibit 12(a)(1) of the registrant’s Form N-CSR filed on July 8, 2015 for its International Equity Insights Funds. |
| | |
| (a)(2) | | Exhibit 99.CERT | | Certifications pursuant to Section 302 of the Sarbanes-Oxley Act of 2002 filed herewith. |
| | |
| (b) | | Exhibit 99.906CERT | | Certifications pursuant to Section 906 of the Sarbanes-Oxley Act of 2002 filed herewith. |
SIGNATURES
Pursuant to the requirements of the Securities Exchange Act of 1934 and the Investment Company Act of 1940, the registrant has duly caused this report to be signed on its behalf by the undersigned, thereunto duly authorized.
| | | | |
| | | | Goldman Sachs Trust |
| | |
| By: | | | | /s/ James A. McNamara |
| | | | James A. McNamara |
| | | | President/Chief Executive Officer |
| | | | Goldman Sachs Trust |
| | |
| Date: | | | | July 24, 2018 |
Pursuant to the requirements of the Securities Exchange Act of 1934 and the Investment Company Act of 1940, this report has been signed below by the following persons on behalf of the registrant and in the capacities and on the dates indicated.
| | | | |
| By: | | | | /s/ James A. McNamara |
| | | | James A. McNamara |
| | | | President/Chief Executive Officer |
| | | | Goldman Sachs Trust |
| | |
| Date: | | | | July 24, 2018 |
| | |
| By: | | | | /s/ Scott McHugh |
| | | | Scott McHugh |
| | | | Principal Financial Officer |
| | | | Goldman Sachs Trust |
| | |
| Date: | | | | July 24, 2018 |